UNITED STATES
SECURITIES AND EXCHANGE COMMISSION
WASHINGTON, D.C. 20549
FORM N-CSR
CERTIFIED SHAREHOLDER REPORT OF REGISTERED
MANAGEMENT INVESTMENT COMPANIES
Investment Company Act file number 811-1512
Oppenheimer Capital Income Fund
(Exact name of registrant as specified in charter)
6803 South Tucson Way, Centennial, Colorado 80112-3924
(Address of principal executive offices) (Zip code)
Arthur S. Gabinet
OFI Global Asset Management, Inc.
225 Liberty Street, New York, New York 10281-1008
(Name and address of agent for service)
Registrant’s telephone number, including area code: (303) 768-3200
Date of fiscal year end: August 31
Date of reporting period: 8/29/2014
Item 1. Reports to Stockholders.
Table of Contents
Class A Shares
AVERAGE ANNUAL TOTAL RETURNS AT 8/29/14*
| | | | | | | | | | | | | | | | | | |
| | | Class A Shares of the Fund | | | | | | |
| | | Without Sales
Charge | | | | With Sales
Charge | | | | Barclays U.S.
Aggregate Bond Index | | | | Russell 3000
Index | | | | Reference Index |
1-Year | | 11.44% | | | | 5.03% | | | | 5.66% | | | | 24.74% | | | | 12.15% |
5-Year | | 9.70 | | | | 8.41 | | | | 4.48 | | | | 17.22 | | | | 9.20 |
10-Year | | 3.59 | | | | 2.98 | | | | 4.72 | | | | 8.83 | | | | 6.74 |
Performance data quoted represents past performance, which does not guarantee future results. The investment return and principal value of an investment in the Fund will fluctuate so that an investor’s shares, when redeemed, may be worth more or less than their original cost. Fund returns include changes in share price, reinvested distributions, and a 5.75% maximum applicable sales charge except where “without sales charge” is indicated. Current performance may be lower or higher than the performance quoted. Returns do not consider capital gains or income taxes on an individual’s investment. For performance data current to the most recent month-end, visit oppenheimerfunds.com or call 1.800.CALL OPP (225.5677).
* August 29, 2014 was the last business day of the Fund’s fiscal year. See Note 1 of the accompanying Notes to Financial Statements. Index returns are calculated through August 31, 2014.
2 OPPENHEIMER CAPITAL INCOME FUND
Fund Performance Discussion
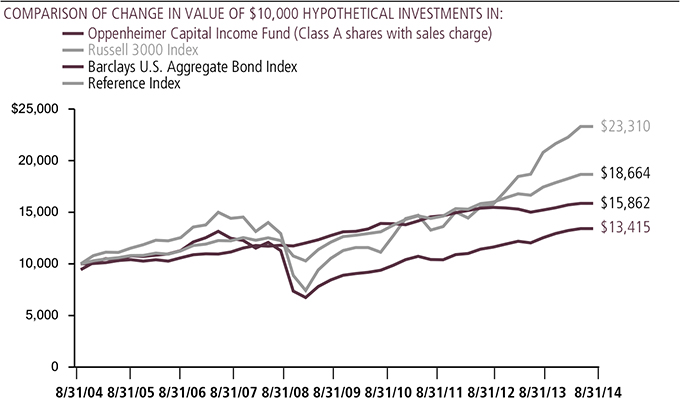
The Fund’s Class A shares (without sales charge) produced a total return of 11.44% during the reporting period. On a relative basis, the Fund underperformed its Reference Index, a customized weighted index comprised of 65% Barclays U.S. Aggregate Bond Index and 35% Russell 3000 Index, which returned 12.15%. Measured separately, the Barclays U.S. Aggregate Bond Index returned 5.66% and the Russell 3000 Index returned 24.74%. The Fund outperformed its peers in the Morningstar Conservative Allocation category, which produced an average return of 10.70% during the reporting period. The Fund’s performance during the period was primarily driven by its equity/equity-like and high grade fixed income strategies.
The Fund’s Class A shares paid four dividends during the period: $0.0617 per share in September 2013, $0.1221 per share in December 2013, $0.0615 per share in March 2014 and $0.0617 per share in June 2014. (The Fund’s Class A shares NAV on 8/29/14 was $10.03 per share.) Additionally, we believe that upside/downside capture ratios provide a good measure of the Fund’s downside protection. Upside capture is the
cumulative performance of the Fund in all up months divided by the cumulative return of its peers in the Morningstar Conservative Allocation category in those months. Downside capture is the opposite. For the three-year period ended August 29, 2014, the upside capture was 93.14% and the downside capture was 54.92%. This demonstrates that in up markets during the three-year period, the Fund captured 93% of
3 OPPENHEIMER CAPITAL INCOME FUND
the upside of its peers, and in down markets it lost roughly only half as much. We believe these distributions and our upside/downside capture ratios are a testament to the Fund’s intelligent blending of multiple asset classes as well as its primary goals of price appreciation, downside risk mitigation and income.
MARKET OVERVIEW
For the one-year period ending August 29, 2014, market movements continued to be driven by central bank policies. Over the first half of the period, central banks throughout the world maintained their accommodative policies that resulted in a rally among risk markets. In the U.S., the Federal Reserve (“Fed”) maintained its open-ended quantitative easing (“QE”) program involving monthly purchases of $85 billion of U.S. government Treasuries and mortgage-backed securities (“MBS”). In December 2013, the Fed announced for the first time that it would reduce its monthly purchases by $10 billion effective the following month. This set the stage for the Fed’s much anticipated tapering of the program. Indeed, the Fed has announced additional reductions of $10 billion in monthly purchases at each of its subsequent meetings through the end of the reporting period. The QE program was designed to help boost the U.S. economy by keeping mortgage rates and other long-term interest rates low, but a primary benefit to investors has turned out to be its contribution to asset price inflation. As the market gained clarity on when the Fed would eventually begin tapering, the yield on the 10-year
Treasury Note backed up sharply, rising 127 basis points in 2013 to end the year at 3.03%.
At the start of 2014, unusually cold weather in parts of the U.S. contributed to a 2.1% domestic economic contraction over the first quarter, economic data began to weaken and the Fed announced another $10 billion reduction in monthly purchases of Treasuries and MBS at its second consecutive meeting. Investors reacted strongly as volatility spiked and the S&P 500 Index fell 5.5% into early February. Equity markets in Europe and Japan also fell early in the year. However, interest rates reversed course with the 10-year Treasury yield rallying 45 basis points into early February. Equity markets in the U.S. then recovered and began grinding higher over the final months of the reporting period as investors came to the realize that an end to QE did not necessarily imply an imminent increase in short-term interest rates. In fact, interest rates in the U.S. continued to rally, with the 10-year Treasury yield falling to 2.34% by 8/29/14.
Turning to Europe, in an effort to address the sovereign debt crisis, persistently slow growth and the risk of deflation, the European Central Bank (“ECB”) adopted a number of policies designed to stimulate growth. However, while the U.S. embarked on what has become a series of successive QE programs, Europe has relied on a combination of austerity and stimulus in an effort to recover from the global financial crisis. Both strategies have resulted in
4 OPPENHEIMER CAPITAL INCOME FUND
disappointing economic growth, with U.S. GDP expanding at just 1.36% in the first half of 2014 while the Eurozone also grew at a paltry 1.39%. In Japan, which has been mired in economic weakness for years, the Abe administration has adopted even more aggressive economic policies with the Bank of Japan (the “BoJ”) executing a massive QE program. However, the results have not been particularly impressive, with that economy contracting 0.38% in the first half of 2014.
FUND REVIEW
Equity/equity-like strategy. The Fund’s equity and equity-like strategy may include common stocks, high delta convertible bonds, preferred stocks and structured notes. This strategy was a positive contributor, outperforming the Russell 3000 Index during the period. Although allocation effects were a modest negative during the period due to being underweight equities, this was more than offset by security selection which was quite positive. The strongest contributors for the strategy were AerCap Holdings, Starwood Property Trust and LyondellBasell Industries. Our position in AerCap Holdings, a global aircraft lessor based in the Netherlands, benefitted from a number of factors. For example, the company announced strong results for the second quarter, reflecting a positive operating environment for aircraft lessors. In addition, it benefitted from a solid start to integrating AIG’s aircraft leasing business into its own operations. The net result of this is that AerCap should be able to achieve its $1 billion plus (or roughly $5/share) earnings run-rate target later this
year instead of in 2015, which could enable the company to regain its investment grade rating sooner than expected. Investors recognized this possibility, sending the shares higher.
Starwood Property Trust, a mortgage real estate investment trust (“REIT”), also helped performance largely due to several favorable corporate transactions. For example, the company spun out Starwood Waypoint Residential Trust to its shareholders. Starwood Waypoint acquires, leases and manages single family rental homes, and the market reacted positively to the transaction. In addition, the company bought LNR Capital Corporation, which invests in real estate-related securities, loans and assets. This deal was announced in January and closed in April 2014. The deal outperformed expectations between the date when the price was agreed upon and the closing date, effectively reducing the purchase price of the acquisition. Finally, mortgage origination growth has been consistently strong, which has also helped drive the stock price higher.
LyondellBasell Industries, a U.S.-based ethylene chemical producer, was a positive contributor to performance as well. The company announced strong second quarter results in part because it cracks ethane, a natural gas liquid, to make the chemicals that it sells. In contrast, its European competitors crack more expensive oil to make the chemicals that they sell. This means that LyondellBasell enjoys a meaningful feedstock cost advantage at the same time that
5 OPPENHEIMER CAPITAL INCOME FUND
ethylene prices are near record highs on the back of industry outages that have reduced ethylene production capacity. In addition, the company’s European chemicals business showed improvement as it continues to run more efficiently. These two positives are expected to continue into year end. Finally, the company remains committed to buying back stock and has commenced its second 10% share repurchase program.
Detractors from performance during the period included Brinker International, Vodafone Group and Kinder Morgan, Inc. Brinker International, a U.S.-based restaurant operator, underperformed due to investor concerns about the secular backdrop for casual dining. The industry has suffered from lackluster demand due to macro pressures as well as incremental competition from fast casual restaurants like Chipotle. We are optimistic about the company’s outlook in part because management has done a good job of compressing the price gaps with fast casual restaurants. Additionally, management has recently improved menu offerings in the Fresh Mex category which helps drive traffic and is accretive to margins. The impact of these initiatives is starting to appear in Brinker’s sales metrics. Finally, the company has been an early adopter of technologies like table-top tablets which offer the potential to increase average guest tickets, increase customer satisfaction and ultimately reduce labor costs.
Vodafone Group, a wireless services provider, also detracted from performance. The
company underperformed in part based on disappointing guidance for 2014. Vodafone faces revenue and margin pressure in markets like Germany at the same time that it has to invest more aggressively in initiatives like its Project Spring investment program. In light of management’s comments that there was little hope conditions would improve meaningfully in the near-term, the share price came under pressure. Furthermore, earlier in the year the shares were supported by investor expectations that AT&T’s desire to enter the European market might translate into a bid for Vodafone. However, those expectations faded with AT&T’s announcement of a proposed deal with DirecTV. This led to additional selling pressure in part because there was no longer a private market backstop for the shares. In short, neither fundamental investors nor event-driven investors had an incentive to support the stock during the final months of the reporting period.
Kinder Morgan (“KMI”), an oil and natural gas pipeline operator, detracted from performance during the period as well. The stock underperformed primarily due to investors’ concerns about KMI’s ability to grow. The reduction in expected long-term dividend growth from 9%-10% to 8% increased those concerns. Furthermore, the lack of any mergers and acquisitions announcements during the reporting period, which historically have contributed to Kinder Morgan’s growth, disappointed the market. Finally, concerns about KMI’s accounting practices for maintenance capital
6 OPPENHEIMER CAPITAL INCOME FUND
expenditures (which later proved to be unfounded) weighed on the stock.
Opportunistic strategy. In this strategy we seek asymmetric risk/reward opportunities and investments where the return profile has a low correlation to traditional investment strategies. We also seek investments which can help achieve our broader investment objectives. At the end of the period, this strategy included investments in senior loans through Oppenheimer Master Loan Fund, LLC, asset-backed securities (“ABS”), convertible securities and small positions (measured by market value) in derivatives. This strategy produced a positive absolute return, although on a standalone basis it underperformed the Barclays U.S. Aggregate Bond Index during the reporting period. Allocation effects were a modest positive, while security selection was a marginal negative.
Among the top performers in the opportunistic strategy were our positions in senior bank loans, ABS backed by commercial jet aircraft and residential mortgage-backed securities (“RMBS”) backed by first-lien mortgages. Our position in the Oppenheimer Master Loan Fund, LLC, the largest single holding for the Fund at 10.4% as of 8/29/14, was the strongest contributor to performance. Senior loans, with their floating rates, short durations, senior and secured place in the capital structure and relatively high yields, performed well in the first half of the period as U.S. interest rates backed up sharply. In the second half of the period, a
combination of moderating loan issuance, strong credit performance, minimal defaults and solid demand for yielding assets created a supportive environment for senior loans.
The Airspeed Ltd. bond, AIRSP Series 2007-1A, Cl. G1, a bond backed by commercial jet aircraft, also helped performance during the period. Airspeed benefitted from favorable supply/demand conditions in the narrow body aircraft market, with the percentage of the narrow body fleet in storage declining year over year. Market dynamics for the specific kinds of aircraft that back this bond were even more favorable, with storage rates dipping below 4% for the primary aircraft types in Airspeed’s fleet.
RAMP Trust, Series 2006-EFC1, a second pay non-agency RMBS, also contributed to results. Performance of the bond was strong largely because performance of the underlying collateral was strong. The pace of loan liquidation slowed considerably for this bond during the reporting period while home price appreciation lowered the average loan-to-value ratio of the pool, which helped support the price of these securities.
In contrast, our positions in Italian sovereign futures, payer swaptions and ABS backed by aircraft engines detracted from performance. Our Euro-BTP futures position, which is effectively a short position in Italian sovereign debt and is a bet on higher interest rates in Italy, detracted from performance. Although deflation concerns in the Eurozone rose in early 2014, comments by the ECB suggested
7 OPPENHEIMER CAPITAL INCOME FUND
it was contemplating some form of QE. One of the forms QE could take was the purchase of sovereign bonds, which would drive prices up and yields down. These developments drove Italian interest rates lower, despite the significant challenges that economy faces (including its third recession in five years), and negatively impacted the performance of this position. We reduced the size of our exposure in this position during the first quarter of 2014.
Our payer swaptions, which are longer dated, multi-year options that benefit from higher U.S. interest rates, also detracted from performance. In the first half of the reporting period, as the 10-year Treasury yield backed up 127 basis points in 2013, these positions contributed to performance. However, as the 10-year Treasury yield reversed course and fell 68 basis points in 2014 (through 8/29/14), these payer swaptions detracted from results. We believe interest rates have declined in 2014 as a result of multiple factors, including subdued inflation pressures and an uneven U.S. economic recovery. We believe that rates will eventually rise over time as the U.S. economy improves, and we like the optionality these payer swaptions provide in the portfolio.
Blade Engine Securitization Ltd.: Series 2006-1A, Cl. B, a junior bond backed by aircraft engines, detracted from performance as well. Several of the engines backing this bond are now off-lease, and several more leases are expected to expire this year. If the engines are sold out of the
trust, the majority of the resulting cash flow will be redirected from these bonds to the senior bonds in the structure. Not surprisingly, the B bonds have sold off in anticipation of these sales.
High Grade Fixed Income strategy. The high grade fixed income strategy contributed to results and on a standalone basis outperformed the Barclays U.S. Aggregate Bond Index during the reporting period, despite the fact that rates rose sharply in the first half of the period, only to reverse course and fall in the second half. Allocation effects were neutral while security selection was a strong positive. The strategy maintained a significant underweight position in government bonds, and instead sourced its exposure through corporate bonds, mortgages and structured products. In the first half of the period, our positions in securitized products such as commercial mortgage backed securities (“CMBS”), ABS and non-agencies were accretive to returns as risk assets generally rallied and spreads compressed in these sectors. Agency mortgage backed securities detracted from performance in the fourth quarter of 2013 as speculation surrounding the Fed’s announcement of tapering swirled through the markets. Generally speaking, agency MBS are especially sensitive to upward moves in interest rates as the duration of these securities tends to extend in such an environment. We reduced our position in the sector in December as the Fed announced its plans to begin tapering its QE program. In the second half of the period, we generated positive performance from our positions in
8 OPPENHEIMER CAPITAL INCOME FUND
corporate bonds, structured credit and mortgages. In addition, CMBS helped performance as spreads tightened. The Fund also maintained exposure to high yield bonds in the form of high quality BB credits, which contributed to results throughout the period as well. Performance was neutral from a duration standpoint.
STRATEGY & OUTLOOK
The macro environment remains complex and we continue to see numerous cross currents. While equities look interesting versus bonds in the mid to longer term, we see a shorter-term disconnect between the strong performance in equities and some softness in earnings growth. In our view, valuations have risen to the point where U.S. equities are no longer inexpensive, which means security selection really matters. Extremely accommodative monetary policies around the world have impacted all asset classes, including equities, and have been an important driver of rising asset prices during the period. We believe that any normalization of rates could pressure prices of equities and other historically riskier asset classes significantly. We also believe that there is more risk lurking beneath the surface of the market than many investors recognize, but it has been masked by unusually low interest rates and volatility combined with adequate liquidity.
More broadly, Treasury rates seem range bound in the near term absent some exogenous shock, with yields oscillating
between 2.5% and 3.0%. In the longer run, however, we do not believe rates this low are sustainable. Although the economy expanded at just over 1% in the first half of 2014, that growth rate actually makes the U.S. look attractive compared to other geographic regions. Japan is becoming more desperate as consumption falls and evidence mounts that Abenomics is not working. Additionally, in our opinion, meaningful structural reform is the sticking point. The Japanese economy contracted 7.1% in the second quarter of 2014, despite the BoJ’s bold money printing experiment. At the same time, growth in Europe is stagnating with the three largest economies showing zero to negative GDP growth in the second quarter (Germany and Italy both contracted 0.2% while France grew 0%). It is precisely because growth is so slow in the Eurozone that the ECB is now considering administering its own form of QE six years after the U.S. first went down that path. While we believe that more stimulative monetary policy from the ECB could help inflate asset prices in the near term, the real impediment to growth is the lack of meaningful structural reform over the last six years. As central banks in these regions resort to more aggressive policy, the Fed is moving to end its latest QE program, which is sending the dollar sharply higher against other currencies. Partly as a result of this, we hold positions that are long the U.S. dollar and short other currencies. We believe this relative divergence in monetary policy could ultimately feed through to interest rates.
9 OPPENHEIMER CAPITAL INCOME FUND
At the same time, we believe the U.S. economy still has attractive growth potential in certain areas. For example, we believe the Energy Renaissance is real and can have significant positive ripple effects through other parts of the economy. Our positions in chemical producers are partly a play on the differentiated costs of feedstock that result from cheap and abundant natural gas in the U.S. versus more scarce and expensive oil in Europe. In addition, a variety of changes in the technology and pharmaceutical sectors could create a host of winners and losers, and could drive growth in a number of related areas. Against this backdrop, we are mindful that U.S. equity valuations are pushing up against the edge of bubble territory after several years when the S&P 500 Index ran well ahead of earnings growth, leading to significant multiple expansion. In addition, volatility has been artificially restrained by highly accommodative monetary policy, and could pick up again as the Fed completes the tapering process. In the past few years, whenever equities sold off, buyers typically
stepped in quickly because valuations were still relatively attractive. Because valuations are less attractive today, selloffs could be steeper and it could take longer for buyers to appear. Moreover, banking regulations are significantly stricter, the fixed income markets are a lot less liquid, and banks are taking on much less risk. Under these circumstances, we believe that any softness in the markets could lead to more volatility than we have seen in recent years.
Accordingly, we continue to pick our spots, selecting securities that we believe offer attractive risk-adjusted returns. We remain focused, as always, on controlling volatility and mitigating downside risk. We expect to be in a low return world for a while. We believe that the ability to generate attractive returns efficiently and without taking on undue risk will be of greater value to investors in a low return world, and that is where our Investment Team’s efforts are focused.
| | | | | | | | |
 | |  | | | |  | |  |
| | Michelle Borré, CFA Portfolio Manager | | | | | Krishna Memani Portfolio Manager |
10 OPPENHEIMER CAPITAL INCOME FUND
Portfolio Positioning*
PORTFOLIO POSITIONING BY STRATEGY
| | |
High-Grade Fixed Income Strategy | | 35.0% |
Opportunistic Strategy | | 33.5 |
Equity Strategy | | 31.5 |
Portfolio holdings and allocations are dollar-weighted based on assets and are subject to change. Percentages are as of August 29, 2014.
HIGH-GRADE FIXED INCOME ALLOCATION BY SECTOR
| | |
Corporate Bonds | | 16.0% |
Asset-Backed Securities | | 6.4 |
U.S. Agency Mortgage-Backed Securities | | 3.0 |
Commercial Mortgage-Backed Securities | | 2.5 |
U.S. Treasuries | | 2.3 |
Non-Agency Mortgage-Backed Securities | | 2.1 |
U.S. Agency | | 0.2 |
Sovereign Bonds | | 0.1 |
Cash | | 2.4 |
Portfolio holdings and allocations are dollar-weighted based on assets and are subject to change. Negative weightings may result from the use of leverage. Leverage involves the use of various financial instruments or borrowed capital in an attempt to increase investment return. Use of leverage exposes the Fund to a risk of loss that exceeds the amount invested. Leverage risks include potential for higher volatility, greater decline of the Fund’s net asset value and fluctuations of dividends and distributions paid by the Fund. Percentages are as of August 29, 2014.
OPPORTUNISTIC ALLOCATION
| | |
Senior Loans | | 15.0% |
Asset-Backed Securities | | 5.8 |
Corporate Bonds | | 4.3 |
Commodities | | 0.8 |
Low Delta Convertible Bonds | | 0.7 |
Municipal Bonds | | 0.4 |
Low Delta Preferred Stock | | 0.3 |
Derivatives | | 0.1 |
Opportunistic Cash Allocation | | 6.1 |
Portfolio holdings and allocations are dollar-weighted based on assets and are subject to change. Holdings exclude cash and cash equivalents. Totals may not equal individual weights due to rounding. Percentages are as of August 29, 2014.
11 OPPENHEIMER CAPITAL INCOME FUND
TOP TEN EQUITY HOLDINGS BY ISSUER
| | |
Starwood Property Trust, Inc. | | 1.2% |
PPL Corp. | | 1.2 |
Comcast Corp., Cl. A | | 1.0 |
Honeywell International, Inc. | | 1.0 |
LyondellBasell Industries NV, Cl. A | | 0.9 |
Quanta Services, Inc. | | 0.9 |
Cinemark Holdings, Inc. | | 0.8 |
UnitedHealth Group, Inc. | | 0.8 |
Merck & Co., Inc. | | 0.8 |
Apple, Inc. | | 0.8 |
Portfolio holdings and allocations are dollar-weighted based on assets and are subject to change. Holdings exclude cash and cash equivalents. Percentages are as of August 29, 2014. For more current Top 10 Fund holdings, please visit oppenheimerfunds.com.
* August 29, 2014 was the last business day of the Fund’s fiscal year. See Note 1 of the accompanying Notes to Consolidated Financial Statements.
12 OPPENHEIMER CAPITAL INCOME FUND
Share Class Performance
AVERAGE ANNUAL TOTAL RETURNS WITHOUT SALES CHARGE AS OF 8/29/14
| | | | | | | | | | |
| | | Inception Date | | 1-Year | | 5-Year | | 10-Year | | |
Class A (OPPEX) | | 12/1/70 | | 11.44% | | 9.70% | | 3.59% | | |
Class B (OPEBX) | | 8/17/93 | | 10.48% | | 8.68% | | 3.06% | | |
Class C (OPECX) | | 11/1/95 | | 10.66% | | 8.81% | | 2.74% | | |
Class I (OCIIX) | | 12/27/13 | | 6.01%* | | N/A | | N/A | | |
Class R (OCINX) | | 3/1/01 | | 11.15% | | 9.35% | | 3.22% | | |
Class Y (OCIYX) | | 1/28/11 | | 11.74% | | 8.27%* | | N/A | | |
AVERAGE ANNUAL TOTAL RETURNS WITH SALES CHARGE AS OF 8/29/14 |
| | | Inception Date | | 1-Year | | 5-Year | | 10-Year | | |
Class A (OPPEX) | | 12/1/70 | | 5.03% | | 8.41% | | 2.98% | | |
Class B (OPEBX) | | 8/17/93 | | 5.48% | | 8.39% | | 3.06% | | |
Class C (OPECX) | | 11/1/95 | | 9.66% | | 8.81% | | 2.74% | | |
Class I (OCIIX) | | 12/27/13 | | 6.01%* | | N/A | | N/A | | |
Class R (OCINX) | | 3/1/01 | | 10.15% | | 9.35% | | 3.22% | | |
Class Y (OCIYX) | | 1/28/11 | | 11.74% | | 8.27%* | | N/A | | |
|
| * Shows performance since inception. |
Performance data quoted represents past performance, which does not guarantee future results. The investment return and principal value of an investment in the Fund will fluctuate so that an investor’s shares, when redeemed, may be worth more or less than their original cost. Current performance may be lower or higher than the performance quoted. Returns do not consider capital gains or income taxes on an individual’s investment. For performance data current to the most recent month-end, visit oppenheimerfunds.com or call 1.800.CALL OPP (225.5677). Fund returns include changes in share price, reinvested distributions, and the applicable sales charge: for Class A shares, the current maximum initial sales charge of 5.75%; for Class B shares, the contingent deferred sales charge of 5% (1-year) and 2% (5-year); and for Class C shares, the contingent deferred sales charge (“CDSC”) of 1% for the 1-year period. Prior to 7/1/14, Class R shares were named Class N shares. Beginning 7/1/14, new purchases of Class R shares will no longer be subject to a CDSC upon redemption (any CDSC will remain in effect for purchases prior to 7/1/14). There is no sales charge for Class I and Class Y shares. Because Class B shares convert to Class A shares 72 months after purchase, the 10-year return for Class B shares uses Class A performance for the period after conversion. Returns for periods of less than one year are cumulative and not annualized.
The Fund’s performance is compared to the performance of the Russell 3000 Index, the Barclays U.S. Aggregate Bond Index and the Fund’s Reference Index. The Russell 3000 Index measures the performance of the largest 3,000 U.S. companies, representing approximately 98% of the investable U.S. equity market. The Barclays U.S. Aggregate Bond Index is an index of U.S dollar-denominated, investment-grade U.S. corporate government and mortgage-
13 OPPENHEIMER CAPITAL INCOME FUND
backed securities. The Fund’s Reference Index is a customized weighted index currently comprised of 65% of the Barclays U.S. Aggregate Bond Index and 35% of the Russell 3000 Index. The indices are unmanaged and cannot be purchased directly by investors. While index comparisons may be useful to provide a benchmark for the Fund’s performance, it must be noted that the Fund’s investments are not limited to the investments comprising the indices. Index performance includes reinvestment of income, but does not reflect transaction costs, fees, expenses or taxes. Index performance is shown for illustrative purposes only as a benchmark for the Fund’s performance, and does not predict or depict performance of the Fund. The Fund’s performance reflects the effects of the Fund’s business and operating expenses.
The Fund’s investment strategy and focus can change over time. The mention of specific fund holdings does not constitute a recommendation by OppenheimerFunds, Inc. or its affiliates.
Before investing in any of the Oppenheimer funds, investors should carefully consider a fund’s investment objectives, risks, charges and expenses. Fund prospectuses and summary prospectuses contain this and other information about the funds, and may be obtained by asking your financial advisor, visiting oppenheimerfunds.com, or calling 1.800.CALL OPP (225.5677). Read prospectuses and summary prospectuses carefully before investing.
Shares of Oppenheimer funds are not deposits or obligations of any bank, are not guaranteed by any bank, are not insured by the FDIC or any other agency, and involve investment risks, including the possible loss of the principal amount invested.
14 OPPENHEIMER CAPITAL INCOME FUND
Fund Expenses
Fund Expenses. As a shareholder of the Fund, you incur two types of costs: (1) transaction costs, which may include sales charges (loads) on purchase payments, contingent deferred sales charges on redemptions; and (2) ongoing costs, including management fees; distribution and service fees; and other Fund expenses. These examples are intended to help you understand your ongoing costs (in dollars) of investing in the Fund and to compare these costs with the ongoing costs of investing in other mutual funds.
The examples are based on an investment of $1,000.00 invested at the beginning of the period and held for the entire 6-month period ended August 29, 2014.
Actual Expenses. The first section of the table provides information about actual account values and actual expenses. You may use the information in this section for the class of shares you hold, together with the amount you invested, to estimate the expense that you paid over the period. Simply divide your account value by $1,000.00 (for example, an $8,600.00 account value divided by $1,000.00 = 8.60), then multiply the result by the number in the first section under the heading entitled “Expenses Paid During Period” to estimate the expenses you paid on your account during this period.
Hypothetical Example for Comparison Purposes. The second section of the table provides information about hypothetical account values and hypothetical expenses based on the Fund’s actual expense ratio for each class of shares, and an assumed rate of return of 5% per year for each class before expenses, which is not the actual return. The hypothetical account values and expenses may not be used to estimate the actual ending account balance or expenses you paid for the period. You may use this information to compare the ongoing costs of investing in the Fund and other funds. To do so, compare this 5% hypothetical example for the class of shares you hold with the 5% hypothetical examples that appear in the shareholder reports of the other funds.
Please note that the expenses shown in the table are meant to highlight your ongoing costs only and do not reflect any transactional costs, such as front-end or contingent deferred sales charges (loads). Therefore, the “hypothetical” section of the table is useful in comparing ongoing costs only, and will not help you determine the relative total costs of owning different funds. In addition, if these transactional costs were included, your costs would have been higher.
15 OPPENHEIMER CAPITAL INCOME FUND
| | | | | | | | | | | | | | | | | | |
| Actual | | Beginning Account Value March 1, 2014 | | Ending Account Value August 29, 2014 | | Expenses Paid During 6 Months Ended
August 29, 2014 |
Class A | | $ | 1,000.00 | | | | | $ | 1,036.30 | | | | | $ | 5.09 | | | |
Class B | | | 1,000.00 | | | | | | 1,032.30 | | | | | | 9.01 | | | |
Class C | | | 1,000.00 | | | | | | 1,033.00 | | | | | | 8.96 | | | |
Class I | | | 1,000.00 | | | | | | 1,038.40 | | | | | | 3.00 | | | |
Class R | | | 1,000.00 | | | | | | 1,035.60 | | | | | | 6.31 | | | |
Class Y | | | 1,000.00 | | | | | | 1,037.60 | | | | | | 3.92 | | | |
| | | | | | |
| Hypothetical | | | | | | | | | | | | | | | | | | |
(5% return before expenses) | | | | | | | | | | | | | | | | | | |
Class A | | | 1,000.00 | | | | | | 1,019.95 | | | | | | 5.05 | | | |
Class B | | | 1,000.00 | | | | | | 1,016.11 | | | | | | 8.94 | | | |
Class C | | | 1,000.00 | | | | | | 1,016.16 | | | | | | 8.89 | | | |
Class I | | | 1,000.00 | | | | | | 1,021.99 | | | | | | 2.98 | | | |
Class R | | | 1,000.00 | | | | | | 1,018.75 | | | | | | 6.26 | | | |
Class Y | | | 1,000.00 | | | | | | 1,021.09 | | | | | | 3.89 | | | |
Expenses are equal to the Fund’s annualized expense ratio for that class, multiplied by the average account value over the period, multiplied by 182/365 (to reflect the one-half year period). Those annualized expense ratios, excluding indirect expenses from affiliated funds, based on the 6-month period ended August 29, 2014 are as follows:
| | | | | | |
| Class | | Expense Ratios | | | |
Class A | | | 1.00 | % | | |
Class B | | | 1.77 | | | |
Class C | | | 1.76 | | | |
Class I | | | 0.59 | | | |
Class R | | | 1.24 | | | |
Class Y | | | 0.77 | | | |
The expense ratios reflect voluntary and/or contractual waivers and/or reimbursements of expenses by the Fund’s Manager and Transfer Agent. Some of these undertakings may be modified or terminated at any time, as indicated in the Fund’s prospectus. The “Financial Highlights” tables in the Fund’s consolidated financial statements, included in this report, also show the gross expense ratios, without such waivers or reimbursements and reduction to custodian expenses, if applicable.
16 OPPENHEIMER CAPITAL INCOME FUND
| | | | |
| |
| CONSOLIDATED STATEMENT OF INVESTMENTS August 29, 2014* | | |
| | | | | | | | |
| | | Shares | | | Value | |
| |
Common Stocks—30.6% | | | | | | | | |
| |
Consumer Discretionary—3.9% | | | | | | | | |
| |
Hotels, Restaurants & Leisure—0.9% | | | | | | | | |
| |
Brinker International, Inc. | | | 301,300 | | | $ | 14,733,570 | |
| |
McDonald’s Corp. | | | 75,400 | | | | 7,066,488 | |
| | | | | | | | |
| | | | | | | 21,800,058 | |
|
| |
Media—2.0% | | | | | | | | |
| |
Cinemark Holdings, Inc. | | | 591,430 | | | | 20,871,565 | |
| |
Comcast Corp., Cl. A | | | 486,500 | | | | 26,626,145 | |
| | | | | | | | |
| | | | | | | 47,497,710 | |
|
| |
Multiline Retail—1.0% | | | | | | | | |
| |
Dollar General Corp.1 | | | 110,000 | | | | 7,038,900 | |
| |
Macy’s, Inc. | | | 271,800 | | | | 16,930,422 | |
| | | | | | | | |
| | | | | | | 23,969,322 | |
|
| |
Consumer Staples—1.5% | | | | | | | | |
| |
Beverages—0.5% | | | | | | | | |
| |
Coca-Cola Co. (The) | | | 273,000 | | | | 11,389,560 | |
| |
| | | | | | | | |
Tobacco—1.0% | | | | | | | | |
| |
Altria Group, Inc. | | | 270,000 | | | | 11,631,600 | |
| |
Philip Morris International, Inc. | | | 159,000 | | | | 13,607,220 | |
| | | | | | | | |
| | | | | | | 25,238,820 | |
|
| |
Energy—4.9% | | | | | | | | |
| |
Energy Equipment & Services—0.6% | | | | | | | | |
| |
Baker Hughes, Inc. | | | 111,300 | | | | 7,695,282 | |
| |
Schlumberger Ltd. | | | 63,000 | | | | 6,907,320 | |
| | | | | | | | |
| | | | | | | 14,602,602 | |
|
| |
Oil, Gas & Consumable Fuels—4.3% | | | | | | | | |
| |
Canadian Natural Resources Ltd. | | | 180,000 | | | | 7,845,305 | |
| |
Chevron Corp. | | | 116,100 | | | | 15,029,145 | |
| |
ConocoPhillips | | | 225,000 | | | | 18,274,500 | |
| |
EOG Resources, Inc. | | | 110,000 | | | | 12,086,800 | |
| |
Exxon Mobil Corp. | | | 62,920 | | | | 6,258,023 | |
| |
HollyFrontier Corp. | | | 333,432 | | | | 16,681,603 | |
| |
Noble Energy, Inc. | | | 138,000 | | | | 9,955,320 | |
| |
Royal Dutch Shell plc, Cl. B | | | 113,953 | | | | 4,817,104 | |
| |
Valero Energy Corp. | | | 178,280 | | | | 9,652,079 | |
| | | | | | | | |
| | | | | | | 100,599,879 | |
|
| |
Financials—4.0% | | | | | | | | |
| |
Commercial Banks—1.1% | | | | | | | | |
| |
Citigroup, Inc. | | | 253,000 | | | | 13,067,450 | |
| |
JPMorgan Chase & Co. | | | 91,000 | | | | 5,409,950 | |
| |
M&T Bank Corp. | | | 66,000 | | | | 8,159,580 | |
| | | | | | | | |
| | | | | | | 26,636,980 | |
|
| |
Insurance—0.7% | | | | | | | | |
| |
ACE Ltd. | | | 141,000 | | | | 14,992,530 | |
17 OPPENHEIMER CAPITAL INCOME FUND
| | | | |
| |
| CONSOLIDATED STATEMENT OF INVESTMENTS Continued | | |
| | | | | | | | |
| | | Shares | | | Value | |
| |
Real Estate Investment Trusts (REITs)—2.2% | | | | | | | | |
| |
American Assets Trust, Inc. | | | 205,000 | | | $ | 7,185,250 | |
| |
Blackstone Mortgage Trust, Inc., Cl. A | | | 301,450 | | | | 8,757,123 | |
| |
Macerich Co. (The) | | | 100,000 | | | | 6,529,000 | |
| |
Starwood Property Trust, Inc. | | | 1,263,430 | | | | 30,132,805 | |
| | | | | | | | |
| | | | | | | 52,604,178 | |
|
| |
Health Care—4.6% | | | | | | | | |
| |
Health Care Equipment & Supplies—0.8% | | | | | | | | |
| |
Baxter International, Inc. | | | 182,000 | | | | 13,646,360 | |
| |
Covidien plc | | | 45,000 | | | | 3,907,350 | |
| | | | | | | | |
| | | | | | | 17,553,710 | |
|
| |
Health Care Providers & Services—1.4% | | | | | | | | |
| |
HCA Holdings, Inc.1 | | | 93,759 | | | | 6,546,253 | |
| |
UnitedHealth Group, Inc. | | | 231,300 | | | | 20,049,084 | |
| |
Universal Health Services, Inc., Cl. B | | | 59,670 | | | | 6,828,635 | |
| | | | | | | | |
| | | | | | | 33,423,972 | |
|
| |
Pharmaceuticals—2.4% | | | | | | | | |
| |
Actavis plc1 | | | 52,800 | | | | 11,984,544 | |
| |
Merck & Co., Inc. | | | 330,500 | | | | 19,866,355 | |
| |
Novartis AG, ADR | | | 144,000 | | | | 12,936,960 | |
| |
Roche Holding AG | | | 44,000 | | | | 12,843,248 | |
| | | | | | | | |
| | | | | | | 57,631,107 | |
|
| |
Industrials—3.2% | | | | | | | | |
| |
Aerospace & Defense—1.3% | | | | | | | | |
| |
Honeywell International, Inc. | | | 259,700 | | | | 24,731,231 | |
| |
Northrop Grumman Corp. | | | 50,000 | | | | 6,361,000 | |
| | | | | | | | |
| | | | | | | 31,092,231 | |
|
| |
Airlines—0.1% | | | | | | | | |
| |
United Continental Holdings, Inc.1 | | | 38,374 | | | | 1,826,986 | |
| | | | | | | | |
|
| |
Construction & Engineering—0.9% | | | | | | | | |
| |
Quanta Services, Inc.1 | | | 605,000 | | | | 21,985,700 | |
| | | | | | | | |
| |
Electrical Equipment—0.1% | | | | | | | | |
| |
Hubbell, Inc., Cl. B | | | 9,500 | | | | 1,148,550 | |
| | | | | | | | |
| |
Trading Companies & Distributors—0.8% | | | | | | | | |
| |
AerCap Holdings NV1 | | | 230,000 | | | | 10,913,500 | |
| |
WESCO International, Inc.1 | | | 101,956 | | | | 8,563,285 | |
| | | | | | | | |
| | | | | | | 19,476,785 | |
|
| |
Information Technology—3.1% | | | | | | | | |
| |
Communications Equipment—1.5% | | | | | | | | |
| |
Cisco Systems, Inc. | | | 165,222 | | | | 4,128,898 | |
| |
Juniper Networks, Inc. | | | 404,000 | | | | 9,368,760 | |
| |
QUALCOMM, Inc. | | | 168,300 | | | | 12,807,630 | |
| |
Telefonaktiebolaget LM Ericsson, Cl. B | | | 640,000 | | | | 7,990,901 | |
| | | | | | | | |
| | | | | | | 34,296,189 | |
18 OPPENHEIMER CAPITAL INCOME FUND
| | | | | | | | |
| | | Shares | | | Value | |
| |
IT Services—0.3% | | | | | | | | |
| |
Accenture plc, Cl. A | | | 100,000 | | | $ | 8,106,000 | |
| | | | | | | | |
|
| |
Semiconductors & Semiconductor Equipment—0.5% | | | | | | | | |
|
| |
Xilinx, Inc. | | | 285,000 | | | | 12,041,250 | |
| | | | | | | | |
|
| |
Technology Hardware, Storage & Peripherals—0.8% | | | | | | | | |
|
| |
Apple, Inc. | | | 191,453 | | | | 19,623,932 | |
| | | | | | | | |
|
| |
Materials—2.0% | | | | | | | | |
| |
Chemicals—2.0% | | | | | | | | |
| |
Celanese Corp., Series A | | | 116,000 | | | | 7,254,640 | |
| |
LyondellBasell Industries NV, Cl. A | | | 192,900 | | | | 22,058,115 | |
| |
Methanex Corp. | | | 168,000 | | | | 11,225,760 | |
| |
Scotts Miracle-Gro Co., Cl. A | | | 120,996 | | | | 6,985,099 | |
| | | | | | | | |
| | | | | | | 47,523,614 | |
|
| |
Telecommunication Services—1.2% | | | | | | | | |
| |
Diversified Telecommunication Services—1.2% | | | | | | | | |
| |
AT&T, Inc. | | | 167,750 | | | | 5,864,540 | |
| |
BCE, Inc. | | | 294,000 | | | | 13,235,880 | |
| |
Verizon Communications, Inc. | | | 194,500 | | | | 9,689,990 | |
| | | | | | | | |
| | | | | | | 28,790,410 | |
|
| |
Utilities—2.2% | | | | | | | | |
| |
Electric Utilities—1.5% | | | | | | | | |
| |
Cleco Corp. | | | 35,000 | | | | 1,974,700 | |
| |
Edison International | | | 75,000 | | | | 4,435,500 | |
| |
PPL Corp. | | | 869,051 | | | | 30,095,236 | |
| | | | | | | | |
| | | | | | | 36,505,436 | |
|
| |
Multi-Utilities—0.7% | | | | | | | | |
| |
CenterPoint Energy, Inc. | | | 281,000 | | | | 6,980,040 | |
| |
CMS Energy Corp. | | | 285,000 | | | | 8,703,900 | |
| | | | | | | | |
| | | | | | | 15,683,940 | |
| | | | | | | | |
Total Common Stocks (Cost $539,811,441) | | | | | | | 726,041,451 | |
| | | | | | | | |
| |
Preferred Stocks—0.3% | | | | | | | | |
| |
M&T Bank Corp., 6.375% Cum., Series A, Non-Vtg. | | | 1,833 | | | | 1,798,173 | |
| |
M&T Bank Corp., 6.375% Cum., Series C, Non-Vtg. | | | 4,500 | | | | 4,459,500 | |
| | | | | | | | |
Total Preferred Stocks (Cost $6,345,341) | | | | | | | 6,257,673 | |
| | | | | | | | |
| | | Principal
Amount | | | | |
| |
Asset-Backed Securities—11.7% | | | | | | | | |
| |
Auto Loan—5.1% | | | | | | | | |
| |
American Credit Acceptance Receivables Trust: | | | | | | | | |
Series 2012-2,Cl. A, 1.89%, 7/15/162 | | $ | 113,356 | | | $ | 113,511 | |
Series 2012-2,Cl. D, 5.91%, 7/15/192 | | | 1,435,000 | | | | 1,468,787 | |
Series 2012-3,Cl. C, 2.78%, 9/17/182 | | | 325,000 | | | | 327,904 | |
Series 2013-2,Cl. B, 2.84%, 5/15/192 | | | 1,663,000 | | | | 1,684,004 | |
Series 2014-1,Cl. B, 2.39%, 11/12/192 | | | 2,585,000 | | | | 2,601,012 | |
Series 2014-2,Cl. A, 0.99%, 10/10/172 | | | 1,920,167 | | | | 1,920,794 | |
Series 2014-2,Cl. B, 2.26%, 3/10/202 | | | 725,000 | | | | 724,753 | |
Series 2014-3,Cl. B, 2.43%, 6/10/202 | | | 1,615,000 | | | | 1,616,554 | |
19 OPPENHEIMER CAPITAL INCOME FUND
| | | | |
| |
| CONSOLIDATED STATEMENT OF INVESTMENTS Continued | | |
| | | | | | | | |
| | | Principal
Amount | | | Value | |
| |
Auto Loan (Continued) | | | | | | | | |
| |
AmeriCredit Automobile Receivables Trust: | | | | | | | | |
Series 2012-2,Cl. D, 3.38%, 4/9/18 | | $ | 2,600,000 | | | $ | 2,679,127 | |
Series 2012-4,Cl. D, 2.68%, 10/9/18 | | | 2,345,000 | | | | 2,378,803 | |
Series 2012-5,Cl. C, 1.69%, 11/8/18 | | | 940,000 | | | | 945,848 | |
Series 2012-5,Cl. D, 2.35%, 12/10/18 | | | 1,280,000 | | | | 1,286,176 | |
Series 2013-1,Cl. C, 1.57%, 1/8/19 | | | 1,610,000 | | | | 1,605,640 | |
Series 2013-1,Cl. E, 2.64%, 7/8/202 | | | 595,000 | | | | 597,571 | |
Series 2013-2,Cl. E, 3.41%, 10/8/202 | | | 1,735,000 | | | | 1,748,535 | |
Series 2013-4,Cl. D, 3.31%, 10/8/19 | | | 415,000 | | | | 423,264 | |
Series 2013-5,Cl. D, 2.86%, 12/8/19 | | | 3,125,000 | | | | 3,161,502 | |
Series 2014-2,Cl. D, 2.57%, 7/8/20 | | | 965,000 | | | | 954,151 | |
Series 2014-3,Cl. D, 3.13%, 10/8/20 | | | 890,000 | | | �� | 891,804 | |
| |
California Republic Auto Receivables Trust: | | | | | | | | |
Series 2013-2,Cl. C, 3.32%, 8/17/20 | | | 1,105,000 | | | | 1,115,764 | |
Series 2014-2,Cl. C, 3.29%, 3/15/21 | | | 415,000 | | | | 414,529 | |
| |
Capital Auto Receivables Asset Trust: | | | | | | | | |
Series 2013-1,Cl. D, 2.19%, 9/20/21 | | | 725,000 | | | | 725,025 | |
Series 2013-4,Cl. D, 3.22%, 5/20/19 | | | 505,000 | | | | 512,877 | |
Series 2014-1,Cl. D, 3.39%, 7/22/19 | | | 580,000 | | | | 591,191 | |
| |
Capital Auto Receivables Asset Trust/Ally Financial, Inc., Series 2014-3, Cl. D, 3.14%, 2/20/203 | | | 900,000 | | | | 901,580 | |
| |
CarFinance Capital Auto Trust: | | | | | | | | |
Series 2013-1A,Cl. A, 1.65%, 7/17/172 | | | 228,785 | | | | 229,404 | |
Series 2013-2A,Cl. B, 3.15%, 8/15/192 | | | 2,460,000 | | | | 2,507,078 | |
Series 2014-1A,Cl. A, 1.46%, 12/17/182 | | | 658,490 | | | | 660,094 | |
| |
CarMax Auto Owner Trust, Series 2014-2, Cl. D, 2.58%, 11/16/20 | | | 1,410,000 | | | | 1,405,920 | |
| |
Centre Point Funding LLC, Series 2010-1A, Cl. 1, 5.43%, 7/20/162 | | | 134,144 | | | | 136,554 | |
| |
CPS Auto Receivables Trust: | | | | | | | | |
Series 2012-B,Cl. A, 2.52%, 9/16/192 | | | 790,401 | | | | 801,305 | |
Series 2012-C,Cl. A, 1.82%, 12/16/192 | | | 284,803 | | | | 287,786 | |
Series 2014-A,Cl. A, 1.21%, 8/15/182 | | | 2,214,704 | | | | 2,215,698 | |
Series 2014-B,Cl. A, 1.11%, 11/15/182 | | | 1,172,583 | | | | 1,171,882 | |
| |
Credit Acceptance Auto Loan Trust: | | | | | | | | |
Series 2013-1A,Cl. B, 1.83%, 4/15/212 | | | 980,000 | | | | 986,681 | |
Series 2013-2A,Cl. B, 2.26%, 10/15/212 | | | 1,200,000 | | | | 1,213,680 | |
Series 2014-1A,Cl. B, 2.29%, 4/15/222 | | | 1,065,000 | | | | 1,072,502 | |
| |
DT Auto Owner Trust: | | | | | | | | |
Series 2012-1A,Cl. D, 4.94%, 7/16/182 | | | 1,099,136 | | | | 1,118,984 | |
Series 2013-1A,Cl. D, 3.74%, 5/15/202 | | | 750,000 | | | | 765,242 | |
Series 2013-2A,Cl. D, 4.18%, 6/15/202 | | | 2,390,000 | | | | 2,455,841 | |
Series 2014-1A,Cl. D, 3.98%, 1/15/212 | | | 1,785,000 | | | | 1,805,652 | |
Series 2014-2A,Cl. D, 3.68%, 4/15/212 | | | 2,745,000 | | | | 2,743,677 | |
| |
Exeter Automobile Receivables Trust: | | | | | | | | |
Series 2012-2A,Cl. B, 2.22%, 12/15/172 | | | 750,000 | | | | 757,930 | |
Series 2012-2A,Cl. C, 3.06%, 7/16/182 | | | 185,000 | | | | 188,600 | |
Series 2013-2A,Cl. B, 3.09%, 7/16/182 | | | 3,860,000 | | | | 3,942,185 | |
Series 2013-2A,Cl. C, 4.35%, 1/15/192 | | | 1,845,000 | | | | 1,913,405 | |
Series 2014-1A,Cl. B, 2.42%, 1/15/192 | | | 1,160,000 | | | | 1,168,248 | |
Series 2014-1A,Cl. C, 3.57%, 7/15/192 | | | 1,160,000 | | | | 1,179,792 | |
Series 2014-2A,Cl. A, 1.06%, 8/15/182 | | | 515,891 | | | | 516,229 | |
Series 2014-2A,Cl. B, 2.17%, 5/15/192 | | | 2,000,000 | | | | 1,994,748 | |
Series 2014-2A,Cl. C, 3.26%, 12/16/192 | | | 565,000 | | | | 567,247 | |
20 OPPENHEIMER CAPITAL INCOME FUND
| | | | | | | | |
| | | Principal
Amount | | | Value | |
| |
Auto Loan (Continued) | | | | | | | | |
| |
First Investors Auto Owner Trust: | | | | | | | | |
Series 2012-1A,Cl. C, 3.54%, 11/15/172 | | $ | 425,000 | | | $ | 435,135 | |
Series 2012-1A,Cl. D, 5.65%, 4/15/182 | | | 770,000 | | | | 806,662 | |
Series 2013-3A,Cl. B, 2.32%, 10/15/192 | | | 1,840,000 | | | | 1,861,787 | |
Series 2013-3A,Cl. C, 2.91%, 1/15/202 | | | 785,000 | | | | 797,914 | |
Series 2013-3A,Cl. D, 3.67%, 5/15/202 | | | 580,000 | | | | 589,554 | |
Series 2014-1A,Cl. D, 3.28%, 4/15/212 | | | 1,705,000 | | | | 1,704,546 | |
| |
Flagship Credit Auto Trust, Series 2014-1, Cl. A, 1.21%, 4/15/192 | | | 1,045,297 | | | | 1,044,828 | |
| |
Ford Credit Auto Owner Trust, Series 2013-A, Cl. D, 1.86%, 8/15/19 | | | 1,180,000 | | | | 1,191,598 | |
| |
Ford Credit Floorplan Master Owner Trust A, Series 2012-2, Cl. C, 2.86%, 1/15/19 | | | 1,490,000 | | | | 1,539,892 | |
| |
GM Financial Automobile Leasing Trust, Series 2014-1A, Cl. D, 2.51%, 3/20/192 | | | 3,835,000 | | | | 3,840,641 | |
| |
Navistar Financial Dealer Note Master Trust, Series 2013-2, Cl. D, 2.405%, 9/25/182,4 | | | 1,790,000 | | | | 1,792,467 | |
| |
Prestige Auto Receivables Trust, Series 2011-1A, Cl. D, 5.18%, 7/16/182 | | | 585,000 | | | | 590,532 | |
| |
Santander Drive Auto Receivables Trust: | | | | | | | | |
Series 2012-2,Cl. D, 3.87%, 2/15/18 | | | 1,875,000 | | | | 1,949,251 | |
Series 2012-4,Cl. D, 3.50%, 6/15/18 | | | 2,785,000 | | | | 2,863,588 | |
Series 2012-6,Cl. D, 2.52%, 9/17/18 | | | 3,340,000 | | | | 3,384,317 | |
Series 2012-AA,Cl. D, 2.46%, 12/17/182 | | | 3,565,000 | | | | 3,596,335 | |
Series 2013-1,Cl. C, 1.76%, 1/15/19 | | | 2,070,000 | | | | 2,087,675 | |
Series 2013-1,Cl. D, 2.27%, 1/15/19 | | | 895,000 | | | | 897,265 | |
Series 2013-2,Cl. D, 2.57%, 3/15/19 | | | 1,260,000 | | | | 1,279,558 | |
Series 2013-3,Cl. C, 1.81%, 4/15/19 | | | 3,650,000 | | | | 3,649,212 | |
Series 2013-3,Cl. D, 2.42%, 4/15/19 | | | 905,000 | | | | 902,155 | |
Series 2013-4,Cl. D, 3.92%, 1/15/20 | | | 495,000 | | | | 513,732 | |
Series 2013-5,Cl. D, 2.73%, 10/15/19 | | | 1,560,000 | | | | 1,561,146 | |
Series 2013-A,Cl. C, 3.12%, 10/15/192 | | | 3,535,000 | | | | 3,636,856 | |
Series 2014-1,Cl. C, 2.36%, 4/15/20 | | | 3,985,000 | | | | 4,025,225 | |
Series 2014-1,Cl. D, 2.91%, 4/15/20 | | | 1,025,000 | | | | 1,031,056 | |
| |
SNAAC Auto Receivables Trust: | | | | | | | | |
Series 2012-1A,Cl. C, 4.38%, 6/15/172 | | | 1,785,000 | | | | 1,804,794 | |
Series 2013-1A,Cl. C, 3.07%, 8/15/182 | | | 600,000 | | | | 611,937 | |
Series 2014-1A,Cl. A, 1.03%, 9/17/182 | | | 848,096 | | | | 848,178 | |
Series 2014-1A,Cl. D, 2.88%, 1/15/202 | | | 730,000 | | | | 733,183 | |
| |
TCF Auto Receivables Owner Trust, Series 2014-1A, Cl. C, 3.12%, 4/15/212 | | | 525,000 | | | | 525,763 | |
| |
United Auto Credit Securitization Trust: | | | | | | | | |
Series 2012-1,Cl. C, 2.52%, 3/15/162 | | | 584,016 | | | | 585,698 | |
Series 2013-1,Cl. B, 1.74%, 4/15/162 | | | 975,000 | | | | 978,413 | |
Series 2013-1,Cl. C, 2.22%, 12/15/172 | | | 620,000 | | | | 623,631 | |
Series 2013-1,Cl. D, 2.90%, 12/15/172 | | | 110,000 | | | | 111,413 | |
Series 2014-1,Cl. D, 2.38%, 10/15/182 | | | 870,000 | | | | 870,874 | |
| |
Westlake Automobile Receivables Trust, Series 2014-1A, Cl. D, 2.20%, 2/15/212 | | | 775,000 | | | | 773,643 | |
| | | | | | | | |
| | | | 121,237,524 | |
|
| |
Credit Card—0.8% | | | | | | | | |
| |
Capital One Multi-Asset Execution Trust: | | | | | | | | |
Series 2006-A11,Cl. A11, 0.245%, 6/17/194 | | | 2,255,000 | | | | 2,249,240 | |
Series 2006-A3,Cl. A3, 5.05%, 12/17/18 | | | 3,275,000 | | | | 3,483,306 | |
| |
Chase Issuance Trust, Series 2012-A3, Cl. A3, 0.79%, 6/15/17 | | | 3,130,000 | | | | 3,138,615 | |
21 OPPENHEIMER CAPITAL INCOME FUND
| | | | |
| |
| CONSOLIDATED STATEMENT OF INVESTMENTS Continued | | |
| | | | | | | | |
| | | Principal
Amount | | | Value | |
| |
Credit Card (Continued) | | | | | | | | |
| |
Citibank Credit Card Issuance Trust: | | | | | | | | |
Series 2013-A11,Cl. A11, 0.399%, 2/7/184 | | $ | 1,825,000 | | | $ | 1,827,114 | |
Series 2013-A6,Cl. A6, 1.32%, 9/7/18 | | | 2,300,000 | | | | 2,318,513 | |
| |
GE Capital Credit Card Master Note Trust: | | | | | | | | |
Series 2010-1,Cl. A, 3.69%, 3/15/18 | | | 2,885,000 | | | | 2,934,804 | |
Series 2012-1,Cl. A, 1.03%, 1/15/18 | | | 2,025,000 | | | | 2,029,395 | |
| | | | | | | | |
| | | | | | | 17,980,987 | |
|
| |
Equipment—0.2% | | | | | | | | |
| |
CLI Funding V LLC, Series 2014-1A, Cl. A, 3.29%, 6/18/292 | | | 3,840,291 | | | | 3,848,127 | |
| |
FRS I LLC, Series 2013-1A, Cl. A1, 1.80%, 4/15/432 | | | 374,202 | | | | 373,778 | |
| |
Trip Rail Master Funding LLC, Series 2014-1A, Cl. A1, 2.863%, 4/15/442 | | | 920,162 | | | | 924,223 | |
| | | | | | | | |
| | | | | | | 5,146,128 | |
|
| |
Home Equity Loan—2.4% | | | | | | | | |
| |
Element Rail Leasing I LLC, Series 2014-1A, Cl. A1, 2.299%, 4/19/442 | | | 1,834,639 | | | | 1,832,254 | |
| |
New Century Home Equity Loan Trust, Series 2005-2, Cl. M3, 0.645%, 6/25/354 | | | 5,500,000 | | | | 4,351,457 | |
| |
New Century Home Equity Loan Trust 2005-1, Series 2005-1, Cl. M2, 0.875%, 3/25/354 | | | 18,380,189 | | | | 16,533,421 | |
| |
New Residential Advance Receivables Trust: | | | | | | | | |
Series 2014-T1,Cl. A1, 1.274%, 3/15/452 | | | 2,120,000 | | | | 2,123,281 | |
Series 2014-T1,Cl. B1, 1.671%, 3/15/452 | | | 1,820,000 | | | | 1,821,349 | |
| |
RAMP Trust, Series 2006-EFC1, Cl. M2, 0.555%, 2/25/364 | | | 5,490,000 | | | | 4,494,712 | |
| |
Structured Asset Securities Corp. Mortgage Loan Trust, Series 2007-GEL2, Cl. A2, 0.475%, 5/25/372,4 | | | 24,155,040 | | | | 21,970,169 | |
| |
TAL Advantage V LLC: | | | | | | | | |
Series 2014-1A,Cl. A, 3.51%, 2/22/392 | | | 1,833,500 | | | | 1,864,962 | |
Series 2014-2A,Cl. A1, 1.70%, 5/20/392 | | | 617,885 | | | | 616,087 | |
| | | | | | | | |
| | | | | | | 55,607,692 | |
|
| |
Loans: Other—3.2% | | | | | | | | |
| |
Aircraft Lease Securitisation Ltd., Series 2007-1A, Cl. G3, 0.419%, 5/10/324,5 | | | 18,472,522 | | | | 18,241,616 | |
| |
Airspeed Ltd.: | | | | | | | | |
Series 2007-1A,Cl. G1, 0.425%, 6/15/324,5 | | | 29,881,052 | | | | 25,474,015 | |
Series 2007-1A,Cl. G2, 0.435%, 6/15/324,5 | | | 10,811,972 | | | | 9,405,086 | |
| |
Blade Engine Securitization Ltd.: | | | | | | | | |
Series 2006-1A,Cl. A1, 1.155%, 9/15/414 | | | 1,719,789 | | | | 1,322,343 | |
Series 2006-1A,Cl. B, 3.155%, 9/15/414,5 | | | 6,905,528 | | | | 2,969,377 | |
Series 2006-1AW,Cl. A1, 0.455%, 9/15/414,5 | | | 23,445,958 | | | | 18,529,916 | |
| |
Raspro Trust, Series 2005-1A, Cl. G, 0.631%, 3/23/244,5 | | | 617,263 | | | | 604,918 | |
| | | | | | | | |
| | | | | | | 76,547,271 | |
| | | | | | | | |
Total Asset-Backed Securities (Cost $272,750,560) | | | | | | | 276,519,602 | |
|
| |
Mortgage-Backed Obligations—17.0% | | | | | | | | |
| |
Government Agency—11.7% | | | | | | | | |
| |
FHLMC/FNMA/FHLB/Sponsored—11.6% | | | | | | | | |
| |
Federal Home Loan Mortgage Corp. Gold Pool: | | | | | | | | |
4.50%, 5/1/19 | | | 894,456 | | | | 943,885 | |
5.00%, 12/1/34 | | | 78,593 | | | | 86,843 | |
6.00%, 5/1/18 | | | 249,573 | | | | 261,055 | |
6.50%, 7/1/28-4/1/34 | | | 218,282 | | | | 250,288 | |
22 OPPENHEIMER CAPITAL INCOME FUND
| | | | | | | | |
| | | Principal
Amount | | | Value | |
| |
FHLMC/FNMA/FHLB/Sponsored (Continued) | | | | | | | | |
| |
Federal Home Loan Mortgage Corp. Gold Pool: (Continued) | | | | | | | | |
7.00%, 10/1/31 | | $ | 287,853 | | | $ | 337,983 | |
8.00%, 4/1/16 | | | 20,516 | | | | 20,989 | |
9.00%, 8/1/22-5/1/25 | | | 19,192 | | | | 21,138 | |
| |
Federal Home Loan Mortgage Corp., Interest-Only Stripped Mtg.-Backed Security: | | | | | | | | |
Series 183,Cl. IO, 12.699%, 4/1/276 | | | 169,971 | | | | 29,465 | |
Series 192,Cl. IO, 8.241%, 2/1/286 | | | 51,412 | | | | 10,616 | |
Series 243,Cl. 6, 0.00%, 12/15/326,7 | | | 183,079 | | | | 35,475 | |
| |
Federal Home Loan Mortgage Corp., Mtg.-Linked Amortizing Global Debt Securities, Series 2012-1, Cl. A10, 2.06%, 1/15/22 | | | 2,407,889 | | | | 2,441,403 | |
| |
Federal Home Loan Mortgage Corp., Principal-Only Stripped Mtg.-Backed Security, Series 176, Cl. PO, 3.969%, 6/1/268 | | | 56,437 | | | | 53,561 | |
| |
Federal Home Loan Mortgage Corp., Real Estate Mtg. Investment Conduit Multiclass Pass-Through Certificates: | | | | | | | | |
Series 2034,Cl. Z, 6.50%, 2/15/28 | | | 116,359 | | | | 129,809 | |
Series 2043,Cl. ZP, 6.50%, 4/15/28 | | | 548,389 | | | | 617,732 | |
Series 2053,Cl. Z, 6.50%, 4/15/28 | | | 117,103 | | | | 130,688 | |
Series 2279,Cl. PK, 6.50%, 1/15/31 | | | 221,536 | | | | 246,331 | |
Series 2326,Cl. ZP, 6.50%, 6/15/31 | | | 96,860 | | | | 109,104 | |
Series 2426,Cl. BG, 6.00%, 3/15/17 | | | 354,490 | | | | 373,668 | |
Series 2427,Cl. ZM, 6.50%, 3/15/32 | | | 383,858 | | | | 433,402 | |
Series 2461,Cl. PZ, 6.50%, 6/15/32 | | | 540,954 | | | | 608,840 | |
Series 2500,Cl. FD, 0.655%, 3/15/324 | | | 67,313 | | | | 68,057 | |
Series 2526,Cl. FE, 0.555%, 6/15/294 | | | 75,313 | | | | 75,868 | |
Series 2538,Cl. F, 0.755%, 12/15/324 | | | 462,148 | | | | 467,768 | |
Series 2551,Cl. FD, 0.555%, 1/15/334 | | | 46,532 | | | | 46,830 | |
Series 2626,Cl. TB, 5.00%, 6/15/33 | | | 694,455 | | | | 753,173 | |
Series 2635,Cl. AG, 3.50%, 5/15/32 | | | 133,304 | | | | 139,574 | |
Series 2707,Cl. QE, 4.50%, 11/15/18 | | | 861,989 | | | | 912,686 | |
Series 2770,Cl. TW, 4.50%, 3/15/19 | | | 115,114 | | | | 122,373 | |
Series 3025,Cl. SJ, 24.182%, 8/15/354 | | | 69,379 | | | | 103,223 | |
Series 3030,Cl. FL, 0.555%, 9/15/354 | | | 897,489 | | | | 899,789 | |
Series 3645,Cl. EH, 3.00%, 12/15/20 | | | 57,970 | | | | 59,997 | |
Series 3741,Cl. PA, 2.15%, 2/15/35 | | | 3,177,488 | | | | 3,249,396 | |
Series 3815,Cl. BD, 3.00%, 10/15/20 | | | 106,885 | | | | 110,008 | |
Series 3822,Cl. JA, 5.00%, 6/15/40 | | | 444,796 | | | | 474,048 | |
Series 3840,Cl. CA, 2.00%, 9/15/18 | | | 80,984 | | | | 82,383 | |
Series 3848,Cl. WL, 4.00%, 4/15/40 | | | 1,294,323 | | | | 1,336,824 | |
Series 3857,Cl. GL, 3.00%, 5/15/40 | | | 101,536 | | | | 104,324 | |
Series 4221,Cl. HJ, 1.50%, 7/15/23 | | | 2,010,466 | | | | 2,018,360 | |
| |
Federal Home Loan Mortgage Corp., Real Estate Mtg. Investment Conduit Multiclass Pass-Through Certificates, Interest-Only Stripped Mtg.-Backed Security: | | | | | | | | |
Series 2130,Cl. SC, 50.899%, 3/15/296 | | | 158,063 | | | | 30,935 | |
Series 2639,Cl. SA, 0.00%, 7/15/226,7 | | | 25,256 | | | | 102 | |
Series 2796,Cl. SD, 50.961%, 7/15/266 | | | 216,569 | | | | 39,522 | |
Series 2815,Cl. PT, 0.00%, 11/15/326,7 | | | 2,632,120 | | | | 208,660 | |
Series 2920,Cl. S, 48.614%, 1/15/356 | | | 1,189,427 | | | | 210,879 | |
Series 2922,Cl. SE, 5.932%, 2/15/356 | | | 288,518 | | | | 57,155 | |
Series 2937,Cl. SY, 17.668%, 2/15/356 | | | 4,006,929 | | | | 666,492 | |
Series 3201,Cl. SG, 5.375%, 8/15/366 | | | 1,092,470 | | | | 180,442 | |
Series 3397,Cl. GS, 12.161%, 12/15/376 | | | 619,657 | | | | 107,892 | |
23 OPPENHEIMER CAPITAL INCOME FUND
| | | | |
| |
| CONSOLIDATED STATEMENT OF INVESTMENTS Continued | | |
| | | | | | | | |
| | | Principal
Amount | | | Value | |
| |
FHLMC/FNMA/FHLB/Sponsored (Continued) | | | | | | | | |
| |
Federal Home Loan Mortgage Corp., Real Estate Mtg. Investment Conduit | | | | | | | | |
Multiclass Pass-Through Certificates, Interest-Only Stripped Mtg.-Backed Security: (Continued) | | | | | | | | |
Series 3424,Cl. EI, 0.526%, 4/15/386 | | $ | 353,421 | | | $ | 41,795 | |
Series 3450,Cl. BI, 9.662%, 5/15/386 | | | 1,508,248 | | | | 208,716 | |
Series 3606,Cl. SN, 3.081%, 12/15/396 | | | 642,076 | | | | 98,739 | |
| |
Federal National Mortgage Assn.: | | | | | | | | |
2.50%, 9/1/293 | | | 12,645,000 | | | | 12,818,869 | |
3.00%, 4/25/263 | | | 9,410,000 | | | | 9,758,905 | |
4.00%, 9/1/443 | | | 89,385,000 | | | | 94,762,071 | |
4.50%, 9/25/29-9/25/443 | | | 53,540,000 | | | | 57,807,516 | |
5.00%, 9/1/443 | | | 21,120,000 | | | | 23,294,376 | |
6.00%, 9/1/393 | | | 6,075,000 | | | | 6,852,412 | |
| |
Federal National Mortgage Assn. Pool: | | | | | | | | |
3.50%, 12/1/20-2/1/22 | | | 3,013,141 | | | | 3,188,864 | |
5.00%, 3/1/21 | | | 205,309 | | | | 216,982 | |
5.50%, 2/1/35-4/1/39 | | | 2,551,401 | | | | 2,848,028 | |
6.50%, 5/1/17-11/1/31 | | | 1,110,507 | | | | 1,227,283 | |
7.00%, 11/1/17-7/1/35 | | | 102,540 | | | | 113,060 | |
7.50%, 1/1/33-3/1/33 | | | 2,773,608 | | | | 3,277,946 | |
8.50%, 7/1/32 | | | 10,081 | | | | 11,633 | |
| |
Federal National Mortgage Assn., Interest-Only Stripped Mtg.-Backed | | | | | | | | |
Security: | | | | | | | | |
Series 222,Cl. 2, 20.561%, 6/25/236 | | | 366,378 | | | | 79,244 | |
Series 252,Cl. 2, 40.741%, 11/25/236 | | | 348,226 | | | | 65,977 | |
Series 303,Cl. IO, 33.615%, 11/25/296 | | | 137,725 | | | | 28,495 | |
Series 308,Cl. 2, 26.951%, 9/25/306 | | | 340,673 | | | | 68,084 | |
Series 320,Cl. 2, 6.702%, 4/25/326 | | | 1,214,221 | | | | 259,355 | |
Series 321,Cl. 2, 0.00%, 4/25/326,7 | | | 925,970 | | | | 182,783 | |
Series 331,Cl. 9, 10.478%, 2/25/336 | | | 335,710 | | | | 79,899 | |
Series 334,Cl. 17, 11.314%, 2/25/336 | | | 196,370 | | | | 44,562 | |
Series 339,Cl. 12, 0.00%, 6/25/336,7 | | | 685,537 | | | | 143,468 | |
Series 339,Cl. 7, 0.00%, 11/25/336,7 | | | 836,235 | | | | 163,644 | |
Series 343,Cl. 13, 0.00%, 9/25/336,7 | | | 667,107 | | | | 131,851 | |
Series 343,Cl. 18, 0.00%, 5/25/346,7 | | | 198,149 | | | | 35,740 | |
Series 345,Cl. 9, 0.00%, 1/25/346,7 | | | 306,505 | | | | 62,911 | |
Series 351,Cl. 10, 0.00%, 4/25/346,7 | | | 232,511 | | | | 47,721 | |
Series 351,Cl. 8, 0.00%, 4/25/346,7 | | | 382,113 | | | | 67,945 | |
Series 356,Cl. 10, 0.00%, 6/25/356,7 | | | 287,029 | | | | 51,466 | |
Series 356,Cl. 12, 0.00%, 2/25/356,7 | | | 140,595 | | | | 25,427 | |
Series 362,Cl. 13, 0.00%, 8/25/356,7 | | | 477,851 | | | | 83,005 | |
Series 364,Cl. 16, 0.00%, 9/25/356,7 | | | 563,596 | | | | 98,338 | |
Series 365,Cl. 16, 0.00%, 3/25/366,7 | | | 1,461,924 | | | | 252,892 | |
| |
Federal National Mortgage Assn., Real Estate Mtg. Investment Conduit | | | | | | | | |
Multiclass Pass-Through Certificates: | | | | | | | | |
Series 1993-87,Cl. Z, 6.50%, 6/25/23 | | | 317,811 | | | | 354,718 | |
Series 1998-61,Cl. PL, 6.00%, 11/25/28 | | | 160,938 | | | | 177,676 | |
Series 1999-54,Cl. LH, 6.50%, 11/25/29 | | | 260,733 | | | | 288,955 | |
Series 2001-51,Cl. OD, 6.50%, 10/25/31 | | | 460,571 | | | | 507,724 | |
Series 2003-100,Cl. PA, 5.00%, 10/25/18 | | | 2,747,211 | | | | 2,919,816 | |
Series 2003-130,Cl. CS, 13.79%, 12/25/334 | | | 282,114 | | | | 332,006 | |
Series 2003-28,Cl. KG, 5.50%, 4/25/23 | | | 1,894,532 | | | | 2,064,488 | |
Series 2003-84,Cl. GE, 4.50%, 9/25/18 | | | 177,774 | | | | 186,874 | |
24 OPPENHEIMER CAPITAL INCOME FUND
| | | | | | | | |
| | | Principal
Amount | | | Value | |
| |
FHLMC/FNMA/FHLB/Sponsored (Continued) | | | | | | | | |
| |
Federal National Mortgage Assn., Real Estate Mtg. Investment Conduit | | | | | | | | |
Multiclass Pass-Through Certificates: (Continued) | | | | | | | | |
Series 2004-101,Cl. BG, 5.00%, 1/25/20 | | $ | 657,329 | | | $ | 683,475 | |
Series 2004-25,Cl. PC, 5.50%, 1/25/34 | | | 456,279 | | | | 485,822 | |
Series 2005-104,Cl. MC, 5.50%, 12/25/25 | | | 4,071,051 | | | | 4,474,646 | |
Series 2005-31,Cl. PB, 5.50%, 4/25/35 | | | 1,430,000 | | | | 1,634,502 | |
Series 2005-73,Cl. DF, 0.405%, 8/25/354 | | | 2,279,165 | | | | 2,282,739 | |
Series 2006-11,Cl. PS, 23.998%, 3/25/364 | | | 215,404 | | | | 319,776 | |
Series 2006-46,Cl. SW, 23.631%, 6/25/364 | | | 169,564 | | | | 235,830 | |
Series 2006-50,Cl. KS, 23.632%, 6/25/364 | | | 353,534 | | | | 530,994 | |
Series 2006-50,Cl. SK, 23.632%, 6/25/364 | | | 55,638 | | | | 81,739 | |
Series 2008-14,Cl. BA, 4.25%, 3/25/23 | | | 454,203 | | | | 476,109 | |
Series 2008-75,Cl. DB, 4.50%, 9/25/23 | | | 722,858 | | | | 760,829 | |
Series 2009-113,Cl. DB, 3.00%, 12/25/20 | | | 1,987,299 | | | | 2,051,021 | |
Series 2009-36,Cl. FA, 1.095%, 6/25/374 | | | 614,978 | | | | 628,478 | |
Series 2009-37,Cl. HA, 4.00%, 4/25/19 | | | 933,107 | | | | 973,871 | |
Series 2009-70,Cl. NT, 4.00%, 8/25/19 | | | 76,749 | | | | 79,974 | |
Series 2009-70,Cl. TL, 4.00%, 8/25/19 | | | 3,078,301 | | | | 3,207,653 | |
Series 2010-43,Cl. KG, 3.00%, 1/25/21 | | | 810,230 | | | | 838,857 | |
Series 2011-15,Cl. DA, 4.00%, 3/25/41 | | | 331,820 | | | | 347,438 | |
Series 2011-3,Cl. EL, 3.00%, 5/25/20 | | | 3,335,155 | | | | 3,442,244 | |
Series 2011-3,Cl. KA, 5.00%, 4/25/40 | | | 1,286,272 | | | | 1,388,905 | |
Series 2011-38,Cl. AH, 2.75%, 5/25/20 | | | 87,442 | | | | 89,936 | |
Series 2011-82,Cl. AD, 4.00%, 8/25/26 | | | 1,682,901 | | | | 1,761,520 | |
| |
Federal National Mortgage Assn., Real Estate Mtg. Investment Conduit | | | | | | | | |
Multiclass Pass-Through Certificates, Interest-Only Stripped Mtg.-Backed Security: | | | | | | | | |
Series 2001-15,Cl. SA, 38.266%, 3/17/316 | | | 140,604 | | | | 21,927 | |
Series 2001-65,Cl. S, 20.805%, 11/25/316 | | | 323,057 | | | | 74,634 | |
Series 2001-81,Cl. S, 20.354%, 1/25/326 | | | 83,719 | | | | 18,349 | |
Series 2002-47,Cl. NS, 27.81%, 4/25/326 | | | 201,405 | | | | 46,522 | |
Series 2002-51,Cl. S, 27.995%, 8/25/326 | | | 184,918 | | | | 42,717 | |
Series 2002-52,Cl. SD, 32.619%, 9/25/326 | | | 256,787 | | | | 63,704 | |
Series 2002-60,Cl. SM, 23.00%, 8/25/326 | | | 273,436 | | | | 50,815 | |
Series 2002-7,Cl. SK, 19.734%, 1/25/326 | | | 86,172 | | | | 17,308 | |
Series 2002-75,Cl. SA, 25.009%, 11/25/326 | | | 394,442 | | | | 87,171 | |
Series 2002-77,Cl. BS, 19.876%, 12/18/326 | | | 170,813 | | | | 37,460 | |
Series 2002-77,Cl. SH, 31.953%, 12/18/326 | | | 125,060 | | | | 28,843 | |
Series 2002-89,Cl. S, 45.104%, 1/25/336 | | | 623,732 | | | | 180,965 | |
Series 2002-9,Cl. MS, 22.665%, 3/25/326 | | | 113,421 | | | | 23,828 | |
Series 2002-90,Cl. SN, 23.903%, 8/25/326 | | | 140,802 | | | | 26,165 | |
Series 2002-90,Cl. SY, 29.979%, 9/25/326 | | | 67,271 | | | | 14,924 | |
Series 2003-33,Cl. SP, 22.151%, 5/25/336 | | | 370,119 | | | | 72,448 | |
Series 2003-46,Cl. IH, 0.00%, 6/25/236,7 | | | 735,176 | | | | 104,186 | |
Series 2004-54,Cl. DS, 36.856%, 11/25/306 | | | 242,241 | | | | 53,478 | |
Series 2004-56,Cl. SE, 8.296%, 10/25/336 | | | 507,953 | | | | 88,680 | |
Series 2005-12,Cl. SC, 8.014%, 3/25/356 | | | 145,358 | | | | 24,186 | |
Series 2005-19,Cl. SA, 44.999%, 3/25/356 | | | 2,826,550 | | | | 645,534 | |
Series 2005-40,Cl. SA, 46.274%, 5/25/356 | | | 645,763 | | | | 145,837 | |
Series 2005-52,Cl. JH, 5.069%, 5/25/356 | | | 1,448,398 | | | | 209,868 | |
Series 2005-6,Cl. SE, 54.823%, 2/25/356 | | | 1,074,522 | | | | 201,708 | |
Series 2005-93,Cl. SI, 12.622%, 10/25/356 | | | 817,925 | | | | 124,960 | |
Series 2008-55,Cl. SA, 0.00%, 7/25/386,7 | | | 519,445 | | | | 81,454 | |
Series 2009-8,Cl. BS, 0.00%, 2/25/246,7 | | | 679,970 | | | | 49,346 | |
25 OPPENHEIMER CAPITAL INCOME FUND
| | | | |
| |
| CONSOLIDATED STATEMENT OF INVESTMENTS Continued | | |
| | | | | | | | |
| | | Principal
Amount | | | Value | |
| |
FHLMC/FNMA/FHLB/Sponsored (Continued) | | | | | | | | |
| |
Federal National Mortgage Assn., Real Estate Mtg. Investment Conduit Multiclass Pass-Through Certificates, Interest-Only Stripped Mtg.-Backed Security: (Continued) | | | | | | | | |
Series 2012-40,Cl. PI, 1.637%, 4/25/416 | | $ | 4,715,502 | | | $ | 747,737 | |
| |
| Federal National Mortgage Assn., Real Estate Mtg. Investment Conduit Multiclass Pass-Through Certificates, Principal-Only Stripped Mtg.-Backed Security, Series 1993-184, Cl. M, 4.699%, 9/25/238 | | | 143,871 | | | | 128,429 | |
| | | | | | | | |
| | | | 275,190,835 | |
|
| |
GNMA/Guaranteed—0.1% | | | | | | | | |
Government National Mortgage Assn. I Pool, 8.50%, 8/15/17-12/15/17 | | | 22,245 | | | | 23,761 | |
| |
Government National Mortgage Assn., Interest-Only Stripped Mtg.-Backed Security: | | | | | | | | |
Series 2002-15,Cl. SM, 60.072%, 2/16/326 | | | 326,385 | | | | 61,644 | |
Series 2002-41,Cl. GS, 33.971%, 6/16/326 | | | 165,494 | | | | 29,059 | |
Series 2002-76,Cl. SY, 54.141%, 12/16/266 | | | 837,316 | | | | 188,569 | |
Series 2007-17,Cl. AI, 13.372%, 4/16/376 | | | 2,444,149 | | | | 475,329 | |
Series 2011-52,Cl. HS, 9.625%, 4/16/416 | | | 2,836,845 | | | | 581,908 | |
| | | | | | | | |
| | | | 1,360,270 | |
|
| |
Non-Agency—5.3% | | | | | | | | |
| |
Commercial—4.0% | | | | | | | | |
| |
Banc of America Commercial Mortgage Trust: | | | | | | | | |
Series 2006-5,Cl. AM, 5.448%, 9/10/47 | | | 1,890,000 | | | | 2,018,757 | |
Series 2006-6,Cl. AM, 5.39%, 10/10/45 | | | 3,460,000 | | | | 3,707,803 | |
| |
Banc of America Funding Trust, Series 2006-G, Cl. 2A4, 0.446%, 7/20/364 | | | 4,200,000 | | | | 3,949,352 | |
| |
BCAP LLC Trust, Series 2011-R11, Cl. 18A5, 2.256%, 9/26/352,4 | | | 1,583,709 | | | | 1,622,036 | |
| |
Bear Stearns Adjustable Rate Mortgage Trust, Series 2005-9, Cl. A1, 2.43%, 10/25/354 | | | 1,963,284 | | | | 1,951,253 | |
| |
Bear Stearns Asset Backed Securities I Trust, Series 2005-HE6, Cl. M2, 0.835%, 6/25/354 | | | 5,000,000 | | | | 4,591,130 | |
| |
Bear Stearns Commercial Mortgage Securities Trust, Series 2006-T24, Cl. AM, 5.568%, 10/12/414 | | | 1,780,000 | | | | 1,918,350 | |
| |
CD Commercial Mortgage Trust, Series 2006-CD2, Cl. AM, 5.527%, 1/15/464 | | | 2,170,000 | | | | 2,289,912 | |
| |
Citigroup Commercial Mortgage Trust: | | | | | | | | |
Series 2008-C7,Cl. AM, 6.339%, 12/10/494 | | | 1,860,000 | | | | 2,061,060 | |
Series 2013-GC11,Cl. D, 4.605%, 4/10/462,4 | | | 675,000 | | | | 643,952 | |
| |
Citigroup Mortgage Loan Trust, Inc., Series 2006-AR1, Cl. 1A1, 2.50%, 10/25/354 | | | 3,188,059 | | | | 3,141,263 | |
| |
COMM Mortgage Trust: | | | | | | | | |
Series 2006-C7,Cl. AM, 5.97%, 6/10/464 | | | 3,460,000 | | | | 3,704,525 | |
Series 2012-CR4,Cl. D, 4.728%, 10/15/452,4 | | | 180,000 | | | | 176,964 | |
Series 2012-CR5,Cl. E, 4.48%, 12/10/452,4 | | | 280,000 | | | | 268,672 | |
Series 2013-CR7,Cl. D, 4.496%, 3/10/462,4 | | | 735,000 | | | | 693,602 | |
| |
COMM Mortgage Trust, Interest-Only Stripped Mtg.-Backed Security, Series 2012-CR5, Cl. XA, 0.00%, 12/10/456,7 | | | 6,009,299 | | | | 605,049 | |
| |
Credit Suisse Commercial Mortgage Trust: | | | | | | | | |
Series 2006-6,Cl. 1A4, 6.00%, 7/25/36 | | | 1,904,876 | | | | 1,488,228 | |
Series 2006-C1,Cl. AJ, 5.642%, 2/15/394 | | | 1,000,000 | | | | 1,049,093 | |
Series 2006-C4,Cl. AM, 5.509%, 9/15/39 | | | 620,000 | | | | 666,617 | |
26 OPPENHEIMER CAPITAL INCOME FUND
| | | | | | | | |
| | | Principal
Amount | | | Value | |
| |
Commercial (Continued) | | | | | | | | |
| |
Credit Suisse First Boston Commercial Trust, Series 2005-C6, Cl. AJ, 5.23%, 12/15/404 | | $ | 1,600,000 | | | $ | 1,664,095 | |
| |
Credit Suisse Mortgage Trust, Series 2009-13R, Cl. 4A1, 2.619%, 9/26/362,4 | | | 673,385 | | | | 680,201 | |
| |
DBUBS Mortgage Trust, Series 2011-LC1A, Cl. E, 5.73%, 11/10/462,4 | | | 260,000 | | | | 280,979 | |
| |
First Horizon Alternative Mortgage Securities Trust, Series 2005-FA8, Cl. 1A6, 0.805%, 11/25/354 | | | 1,010,640 | | | | 766,119 | |
| |
FREMF Mortgage Trust: | | | | | | | | |
Series 2012-K501,Cl. C, 3.60%, 11/25/462,4 | | | 175,000 | | | | 179,319 | |
Series 2013-K25,Cl. C, 3.743%, 11/25/452,4 | | | 350,000 | | | | 336,853 | |
Series 2013-K26,Cl. C, 3.723%, 12/25/452,4 | | | 255,000 | | | | 244,803 | |
Series 2013-K27,Cl. C, 3.616%, 1/25/462,4 | | | 400,000 | | | | 385,147 | |
Series 2013-K28,Cl. C, 3.614%, 6/25/462,4 | | | 1,925,000 | | | | 1,848,823 | |
Series 2013-K502,Cl. C, 3.31%, 3/25/452,4 | | | 720,000 | | | | 723,919 | |
Series 2013-K712,Cl. C, 3.484%, 5/25/452,4 | | | 730,000 | | | | 723,624 | |
Series 2013-K713,Cl. C, 3.274%, 4/25/462,4 | | | 480,000 | | | | 469,404 | |
| |
GCCFC Commercial Mortgage Trust: | | | | | | | | |
Series 2006-GG7,Cl. AM, 6.014%, 7/10/384 | | | 200,000 | | | | 215,005 | |
Series 2007-GG11,Cl. AM, 5.867%, 12/10/494 | | | 2,785,000 | | | | 3,058,674 | |
| |
GE Capital Commercial Mortgage Corp., Series 2005-C4, Cl. AJ, 5.49%, 11/10/454 | | | 210,000 | | | | 212,462 | |
| |
GS Mortgage Securities Trust, Series 2006-GG6, Cl. AM, 5.622%, 4/10/384 | | | 895,000 | | | | 943,981 | |
| |
GSMSC Pass-Through Trust, Series 2009-3R, Cl. 1A2, 6%, 4/25/372,4 | | | 1,876,292 | | | | 1,776,434 | |
| |
GSR Mortgage Loan Trust, Series 2005-AR4, Cl. 6A1, 5.226%, 7/25/354 | | | 644,301 | | | | 646,225 | |
| |
JP Morgan Chase Commercial Mortgage Securities Corp., Series 2012-LC9, Cl. E, 4.573%, 12/15/472,4 | | | 975,000 | | | | 947,158 | |
| |
JP Morgan Chase Commercial Mortgage Securities Trust: | | | | | | | | |
Series 2006-CB16,Cl. AJ, 5.623%, 5/12/45 | | | 1,750,000 | | | | 1,769,229 | |
Series 2006-LDP8,Cl. AJ, 5.48%, 5/15/454 | | | 3,290,000 | | | | 3,465,173 | |
| |
JP Morgan Mortgage Trust, Series 2007-S3, Cl. 1A90, 7%, 8/25/37 | | | 1,535,124 | | | | 1,424,670 | |
| |
JP Morgan Resecuritization Trust: | | | | | | | | |
Series 2009-11,Cl. 5A1, 2.619%, 9/26/362,4 | | | 2,573,712 | | | | 2,581,394 | |
Series 2009-5,Cl. 1A2, 2.612%, 7/26/362,4 | | | 1,396,965 | | | | 1,197,701 | |
| |
LB-UBS Commercial Mortgage Trust, Series 2006-C4, Cl. AM, 6.049%, 6/15/384 | | | 1,085,000 | | | | 1,165,897 | |
| |
Merrill Lynch Mortgage Trust, Series 2006-C2, Cl. AM, 5.782%, 8/12/434 | | | 2,315,000 | | | | 2,495,769 | |
| |
Morgan Stanley Bank of America Merrill Lynch Trust: | | | | | | | | |
Series 2012-C6,Cl. E, 4.818%, 11/15/452,4 | | | 545,000 | | | | 532,368 | |
Series 2013-C7,Cl. D, 4.442%, 2/15/462,4 | | | 645,000 | | | | 607,404 | |
Series 2013-C8,Cl. D, 4.31%, 12/15/482,4 | | | 485,000 | | | | 455,390 | |
| |
Morgan Stanley Capital I Trust: | | | | | | | | |
Series 2007-IQ13,Cl. AM, 5.406%, 3/15/44 | | | 4,050,000 | | | | 4,383,149 | |
Series 2007-IQ15,Cl. AM, 6.105%, 6/11/494 | | | 1,700,000 | | | | 1,848,166 | |
| |
Morgan Stanley Re-Remic Trust, Series 2012-R3, Cl. 1B, 2.048%, 11/26/362,4 | | | 1,941,889 | | | | 1,398,967 | |
| |
Morgan Stanley Resecuritization Trust, Series 2013-R9, Cl. 3A, 2.375%, 6/26/462,4 | | | 2,841,306 | | | | 2,879,786 | |
| |
Structured Adjustable Rate Mortgage Loan Trust: | | | | | | | | |
Series 2004-10,Cl. 2A, 2.386%, 8/25/344 | | | 1,070,080 | | | | 1,062,628 | |
Series 2007-6,Cl. 3A1, 4.601%, 7/25/374 | | | 1,471,543 | | | | 1,156,940 | |
27 OPPENHEIMER CAPITAL INCOME FUND
| | | | |
| |
| CONSOLIDATED STATEMENT OF INVESTMENTS Continued | | |
| | | | | | | | |
| | | Principal
Amount | | | Value | |
| |
Commercial (Continued) | | | | | | | | |
| |
UBS-Barclays Commercial Mortgage Trust, Series 2012-C2, Cl. E, 4.89%, 5/10/632,4 | | $ | 240,000 | | | $ | 233,688 | |
| |
Wachovia Bank Commercial Mortgage Trust: | | | | | | | | |
Series 2005-C17,Cl. AJ, 5.224%, 3/15/424 | | | 910,000 | | | | 926,975 | |
Series 2005-C22,Cl. AM, 5.505%, 12/15/444 | | | 605,000 | | | | 633,918 | |
Series 2007-C30,Cl. AM, 5.383%, 12/15/43 | | | 350,000 | | | | 376,791 | |
| |
WaMu Mortgage Pass-Through Certificates Trust, Series 2005-AR14, Cl. 1A4, 2.372%, 12/25/354 | | | 1,046,868 | | | | 1,023,259 | |
| |
Wells Fargo Mortgage-Backed Securities Trust: | | | | | | | | |
Series 2005-AR10,Cl. 1A1, 2.614%, 6/25/354 | | | 3,354,998 | | | | 3,430,645 | |
Series 2005-AR15,Cl. 1A6, 2.613%, 9/25/354 | | | 1,218,616 | | | | 1,156,708 | |
Series 2006-AR7,Cl. 2A4, 2.613%, 5/25/364 | | | 141,637 | | | | 132,798 | |
Series 2006-AR8,Cl. 2A4, 2.619%, 4/25/364 | | | 735,995 | | | | 723,952 | |
Series 2007-16,Cl. 1A1, 6.00%, 12/28/37 | | | 866,374 | | | | 899,461 | |
Series 2007-AR3,Cl. A4, 5.674%, 4/25/374 | | | 48,952 | | | | 48,525 | |
Series 2007-AR8,Cl. A1, 5.472%, 11/25/374 | | | 1,038,956 | | | | 957,457 | |
| |
WF-RBS Commercial Mortgage Trust: | | | | | | | | |
Series 2012-C10,Cl. D, 4.607%, 12/15/452,4 | | | 280,000 | | | | 271,697 | |
Series 2012-C7,Cl. E, 5.001%, 6/15/452,4 | | | 500,000 | | | | 502,375 | |
Series 2012-C8,Cl. E, 5.039%, 8/15/452,4 | | | 230,000 | | | | 232,636 | |
Series 2013-C11,Cl. D, 4.322%, 3/15/452,4 | | | 278,000 | | | | 266,922 | |
Series 2013-C15,Cl. D, 4.634%, 8/15/462,4 | | | 625,000 | | | | 598,035 | |
| |
WF-RBS Commercial Mortgage Trust, Interest-Only Commercial Mtg. Pass-Through Certificates, Series 2011-C3, Cl. XA, 0.00%, 3/15/442,6,7 | | | 18,836,549 | | | | 1,122,103 | |
| | | | | | | | |
| | | | 94,613,419 | |
|
| |
Multi-Family—0.1% | | | | | | | | |
| |
Citigroup Mortgage Loan Trust, Inc., Series 2006-AR3, Cl. 1A2A, 5.344%, 6/25/364 | | | 816,346 | | | | 761,214 | |
| |
Wells Fargo Mortgage-Backed Securities Trust, Series 2006-AR2, Cl. 2A3, 2.615%, 3/25/364 | | | 543,563 | | | | 545,886 | |
| | | | | | | | |
| | | | 1,307,100 | |
|
| |
Residential—1.2% | | | | | | | | |
| |
Asset-Backed Funding Certificates Trust, Series 2005-HE2, Cl. M3, 0.935%, 6/25/354 | | | 4,000,000 | | | | 3,435,164 | |
| |
Banc of America Commercial Mortgage Trust, Series 2007-4, Cl. AM, 6.015%, 2/10/514 | | | 1,635,000 | | | | 1,812,601 | |
| |
Banc of America Funding Trust: | | | | | | | | |
Series 2007-1,Cl. 1A3, 6.00%, 1/25/37 | | | 367,176 | | | | 332,973 | |
Series 2007-C,Cl. 1A4, 5.405%, 5/20/364 | | | 343,962 | | | | 334,758 | |
| |
Banc of America Mortgage Securities Trust, Series 2007-1, Cl. 1A24, 6%, 3/25/37 | | | 1,149,682 | | | | 1,084,228 | |
| |
Bear Stearns Asset Backed Securities I Trust, Series 2004-HE9, Cl. M2, 1.955%, 11/25/344 | | | 2,709,115 | | | | 2,348,107 | |
| |
Carrington Mortgage Loan Trust, Series 2006-FRE1, Cl. A2, 0.265%, 7/25/364 | | | 668,044 | | | | 656,929 | |
| |
CD Commercial Mortgage Trust, Series 2007-CD4, Cl. AMFX, 5.366%, 12/11/494 | | | 3,375,000 | | | | 3,551,629 | |
| |
Countrywide Alternative Loan Trust: | | | | | | | | |
Series 2005-21CB,Cl. A7, 5.50%, 6/25/35 | | | 1,339,270 | | | | 1,280,302 | |
Series 2005-J10,Cl. 1A17, 5.50%, 10/25/35 | | | 5,321,675 | | | | 4,973,111 | |
28 OPPENHEIMER CAPITAL INCOME FUND
| | | | | | | | |
| | | Principal
Amount | | | Value | |
| |
Residential (Continued) | | | | | | | | |
| |
Countrywide Asset-Backed Certificates, Series 2004-6, Cl. M5, 2.06%, 8/25/344 | | | $1,143,349 | | | $ | 964,638 | |
| |
Countrywide Home Loans: | | | | | | | | |
Series 2005-26,Cl. 1A8, 5.50%, 11/25/35 | | | 1,252,008 | | | | 1,198,892 | |
Series 2006-6,Cl. A3, 6.00%, 4/25/36 | | | 538,438 | | | | 526,459 | |
| |
GMACM Home Equity Loan Trust, Series 2007-HE2, Cl. A2, 6.054%, 12/25/374 | | | 18,735 | | | | 18,014 | |
| |
GSR Mortgage Loan Trust, Series 2006-5F, Cl. 2A1, 6%, 6/25/36 | | | 442,232 | | | | 426,352 | |
| |
Home Equity Mortgage Trust: | | | | | | | | |
Series 2005-HF1,Cl. A2B, 0.855%, 2/25/364 | | | 495,608 | | | | 476,684 | |
Series 2005-HF1,Cl. A3B, 0.855%, 2/25/364 | | | 373,287 | | | | 359,035 | |
| |
RAMP Trust, Series 2005-RS2, Cl. M4, 0.875%, 2/25/354 | | | 4,469,000 | | | | 4,011,937 | |
| |
WaMu Mortgage Pass-Through Certificates Trust, Series 2003-AR10, Cl. A7, 2.421%, 10/25/334 | | | 851,836 | | | | 876,888 | |
| |
Wells Fargo Mortgage-Backed Securities Trust, Series 2006-AR14, Cl. 1A2, 5.689%, 10/25/364 | | | 776,251 | | | | 761,269 | |
| | | | | | | | |
| | | | 29,429,970 | |
| | | | | | | | |
Total Mortgage-Backed Obligations (Cost $393,431,621) | | | | | | | 401,901,594 | |
| | | | | | | | |
| |
U.S. Government Obligations—2.3% | | | | | | | | |
| |
Federal National Mortgage Assn. Nts., 1%, 9/27/17 | | | 2,429,000 | | | | 2,423,258 | |
| |
United States Treasury Nts.: | | | | | | | | |
0.75%, 6/30/17 | | | 38,370,000 | | | | 38,208,117 | |
0.875%, 8/15/17 | | | 10,479,000 | | | | 10,461,395 | |
1.625%, 4/30/19 | | | 4,530,000 | | | | 4,539,377 | |
| | | | | | | | |
Total U.S. Government Obligations (Cost $55,573,150) | | | | | | | 55,632,147 | |
| | | | | | | | |
| |
Non-Convertible Corporate Bonds and Notes—20.1% | | | | | | | | |
| |
Consumer Discretionary—2.5% | | | | | | | | |
| |
Auto Components—0.3% | | | | | | | | |
| |
Dana Holding Corp., 6.75% Sr. Unsec. Nts., 2/15/21 | | | 1,910,000 | | | | 2,048,475 | |
| |
Johnson Controls, Inc., 4.625% Sr. Unsec. Nts., 7/2/44 | | | 1,032,000 | | | | 1,058,441 | |
| |
TRW Automotive, Inc.: | | | | | | | | |
4.50% Sr. Unsec. Nts., 3/1/212 | | | 1,125,000 | | | | 1,158,750 | |
7.25% Sr. Unsec. Nts., 3/15/175 | | | 1,719,000 | | | | 1,933,875 | |
| | | | | | | | |
| | | | 6,199,541 | |
|
| |
Automobiles—0.6% | | | | | | | | |
| |
Daimler Finance North America LLC: | | | | | | | | |
1.30% Sr. Unsec. Nts., 7/31/152 | | | 1,775,000 | | | | 1,787,748 | |
8.50% Sr. Unsec. Unsub. Nts., 1/18/31 | | | 1,218,000 | | | | 1,882,028 | |
| |
Ford Motor Credit Co. LLC, 5.875% Sr. Unsec. Unsub. Nts., 8/2/21 | | | 4,731,000 | | | | 5,568,307 | |
| |
General Motors Co., 6.25% Sr. Unsec. Nts., 10/2/43 | | | 1,771,000 | | | | 2,085,352 | |
| |
Hyundai Capital America, 1.45% Sr. Unsec. Nts., 2/6/172 | | | 1,960,000 | | | | 1,962,816 | |
| |
Kia Motors Corp., 3.625% Sr. Unsec. Nts., 6/14/162 | | | 1,502,000 | | | | 1,565,670 | |
| | | | | | | | |
| | | | 14,851,921 | |
|
| |
Hotels, Restaurants & Leisure—0.3% | | | | | | | | |
| |
Brinker International, Inc., 2.60% Sr. Unsec. Nts., 5/15/18 | | | 560,000 | | | | 562,976 | |
29 OPPENHEIMER CAPITAL INCOME FUND
| | | | |
| |
| CONSOLIDATED STATEMENT OF INVESTMENTS Continued | | |
| | | | | | | | |
| | | Principal
Amount | | | Value | |
| |
Hotels, Restaurants & Leisure (Continued) | | | | | | | | |
| |
Carnival Corp., 1.20% Sr. Unsec. Nts., 2/5/16 | | $ | 1,860,000 | | | $ | 1,870,206 | |
| |
Hyatt Hotels Corp., 3.875% Sr. Unsec. Unsub. Nts., 8/15/16 | | | 336,000 | | | | 352,896 | |
| |
Starwood Hotels & Resorts Worldwide, Inc., 7.15% Sr. Unsec. Unsub. Nts., 12/1/19 | | | 944,000 | | | | 1,118,965 | |
| |
Wyndham Worldwide Corp., 6% Sr. Unsec. Nts., 12/1/16 | | | 1,797,000 | | | | 1,978,948 | |
| |
Yum! Brands, Inc., 4.25% Sr. Unsec. Nts., 9/15/15 | | | 1,886,000 | | | | 1,960,776 | |
| | | | | | | | |
| | | | | | | 7,844,767 | |
|
| |
Household Durables—0.2% | | | | | | | | |
| |
Jarden Corp., 6.125% Sr. Unsec. Nts., 11/15/22 | | | 1,782,000 | | | | 1,893,375 | |
| |
Toll Brothers Finance Corp., 4% Sr. Unsec. Nts., 12/31/18 | | | 1,845,000 | | | | 1,881,900 | |
| |
Whirlpool Corp., 1.35% Sr. Unsec. Nts., 3/1/17 | | | 521,000 | | | | 521,089 | |
| | | | | | | | |
| | | | | | | 4,296,364 | |
|
| |
Media—0.8% | | | | | | | | |
| |
21st Century Fox America, Inc., 6.15% Sr. Unsec. Nts., 2/15/41 | | | 786,000 | | | | 973,107 | |
| |
Comcast Cable Communications Holdings, Inc., 9.455% Sr. Unsec. Nts., 11/15/22 | | | 995,000 | | | | 1,449,713 | |
| |
Comcast Corp., 4.65% Sr. Unsec. Unsub. Nts., 7/15/42 | | | 1,832,000 | | | | 1,977,016 | |
| |
DIRECTV Holdings LLC/DIRECTV Financing Co., Inc., 5.15% Sr. Unsec. Nts., 3/15/42 | | | 1,245,000 | | | | 1,346,810 | |
| |
DISH DBS Corp., 5.875% Sr. Unsec. Nts., 7/15/22 | | | 1,696,000 | | | | 1,804,035 | |
| |
Historic TW, Inc.: | | | | | | | | |
8.05% Sr. Unsec. Nts., 1/15/16 | | | 311,000 | | | | 338,455 | |
9.15% Debs., 2/1/23 | | | 560,000 | | | | 783,330 | |
| |
Interpublic Group of Cos., Inc. (The), 4.20% Sr. Unsec. Nts., 4/15/24 | | | 1,000,000 | | | | 1,037,797 | |
| |
Lamar Media Corp., 5% Sr. Unsec. Sub. Nts., 5/1/23 | | | 1,887,000 | | | | 1,891,717 | |
| |
Numericable Group SA, 4.875% Sr. Sec. Nts., 5/15/192 | | | 2,018,000 | | | | 2,050,793 | |
| |
Pearson Funding Two plc, 4% Sr. Unsec. Nts., 5/17/162 | | | 433,000 | | | | 453,502 | |
| |
Time Warner Cable, Inc., 4.50% Sr. Unsec. Unsub. Nts., 9/15/42 | | | 2,038,000 | | | | 2,073,306 | |
| |
Time Warner, Inc., 4.875% Sr. Unsec. Nts., 3/15/20 | | | 1,409,000 | | | | 1,572,488 | |
| |
Viacom, Inc., 2.50% Sr. Unsec. Nts., 12/15/16 | | | 835,000 | | | | 860,479 | |
| | | | | | | | |
| | | | | | | 18,612,548 | |
|
| |
Specialty Retail—0.2% | | | | | | | | |
| |
Bed Bath & Beyond, Inc., 5.165% Sr. Unsec. Nts., 8/1/44 | | | 546,000 | | | | 569,517 | |
| |
Home Depot, Inc. (The), 4.875% Sr. Unsec. Nts., 2/15/44 | | | 649,000 | | | | 736,540 | |
| |
L Brands, Inc.: | | | | | | | | |
7.00% Sr. Unsec. Nts., 5/1/20 | | | 211,000 | | | | 240,013 | |
8.50% Sr. Unsec. Nts., 6/15/19 | | | 1,485,000 | | | | 1,796,850 | |
| |
Signet UK Finance plc, 4.70% Sr. Unsec. Nts., 6/15/24 | | | 960,000 | | | | 987,370 | |
| | | | | | | | |
| | | | | | | 4,330,290 | |
|
| |
Textiles, Apparel & Luxury Goods—0.1% | | | | | | | | |
| |
Levi Strauss & Co., 6.875% Sr. Unsec. Nts., 5/1/22 | | | 1,745,000 | | | | 1,906,412 | |
| |
PVH Corp., 4.50% Sr. Unsec. Unsub. Nts., 12/15/22 | | | 1,755,000 | | | | 1,750,613 | |
| | | | | | | | |
| | | | | | | 3,657,025 | |
30 OPPENHEIMER CAPITAL INCOME FUND
| | | | | | | | |
| | | Principal Amount | | | Value | |
| |
Consumer Staples—1.0% | | | | | | | | |
| |
Beverages—0.4% | | | | | | | | |
| |
Anheuser-Busch InBev Worldwide, Inc., 8.20% Sr. Unsec. Unsub. Nts., 1/15/39 | | $ | 1,646,000 | | | $ | 2,603,447 | |
| |
Constellation Brands, Inc., 3.75% Sr. Unsec. Nts., 5/1/21 | | | 1,996,000 | | | | 2,003,485 | |
| |
Foster’s Finance Corp., 4.875% Sr. Unsec. Nts., 10/1/142 | | | 1,522,000 | | | | 1,527,191 | |
| |
Pernod Ricard SA, 2.95% Sr. Unsec. Nts., 1/15/172 | | | 1,944,000 | | | | 2,013,381 | |
| |
SABMiller Holdings, Inc., 4.95% Sr. Unsec. Unsub. Nts., 1/15/422 | | | 1,050,000 | | | | 1,174,228 | |
| | | | | | | | |
| | | | 9,321,732 | |
|
| |
Food & Staples Retailing—0.1% | | | | | | | | |
| |
Delhaize Group SA, 5.70% Sr. Unsec. Nts., 10/1/40 | | | 1,033,000 | | | | 1,141,395 | |
| |
Kroger Co. (The), 6.40% Sr. Unsec. Nts., 8/15/17 | | | 1,230,000 | | | | 1,402,570 | |
| | | | | | | | |
| | | | 2,543,965 | |
|
| |
Food Products—0.3% | | | | | | | | |
| |
Bunge Ltd. Finance Corp.: | | | | | | | | |
5.10% Sr. Unsec. Unsub. Nts., 7/15/15 | | | 1,412,000 | | | | 1,465,018 | |
8.50% Sr. Unsec. Nts., 6/15/19 | | | 1,440,000 | | | | 1,806,739 | |
| |
ConAgra Foods, Inc., 1.35% Sr. Unsec. Nts., 9/10/15 | | | 881,000 | | | | 886,443 | |
| |
Tyson Foods, Inc.: | | | | | | | | |
4.875% Sr. Unsec. Nts., 8/15/34 | | | 642,000 | | | | 680,091 | |
6.60% Sr. Unsec. Nts., 4/1/16 | | | 1,728,000 | | | | 1,878,815 | |
| | | | | | | | |
| | | | 6,717,106 | |
|
| |
Tobacco—0.2% | | | | | | | | |
| |
Altria Group, Inc., 10.20% Sr. Unsec. Nts., 2/6/39 | | | 1,127,000 | | | | 1,958,444 | |
| |
Reynolds American, Inc., 6.75% Sr. Unsec. Nts., 6/15/17 | | | 1,732,000 | | | | 1,970,576 | |
| | | | | | | | |
| | | | 3,929,020 | |
|
| |
Energy—2.5% | | | | | | | | |
| |
Energy Equipment & Services—0.3% | | | | | | | | |
| |
Ensco plc, 4.70% Sr. Unsec. Nts., 3/15/21 | | | 507,000 | | | | 552,802 | |
| |
Nabors Industries, Inc.: | | | | | | | | |
2.35% Sr. Unsec. Nts., 9/15/16 | | | 1,532,000 | | | | 1,575,022 | |
4.625% Sr. Unsec. Nts., 9/15/21 | | | 1,028,000 | | | | 1,126,474 | |
5.00% Sr. Unsec. Nts., 9/15/20 | | | 611,000 | | | | 684,091 | |
| |
Rowan Cos., Inc., 4.875% Sr. Unsec. Unsub. Nts., 6/1/22 | | | 809,000 | | | | 869,701 | |
| |
Weatherford International Ltd., 5.95% Sr. Unsec. Nts., 4/15/42 | | | 1,588,000 | | | | 1,837,460 | |
| | | | | | | | |
| | | | 6,645,550 | |
|
| |
Oil, Gas & Consumable Fuels—2.2% | | | | | | | | |
| |
Anadarko Petroleum Corp.: | | | | | | | | |
4.50% Sr. Unsec. Nts., 7/15/44 | | | 896,000 | | | | 920,843 | |
6.20% Sr. Unsec. Nts., 3/15/40 | | | 820,000 | | | | 1,043,999 | |
| |
Canadian Oil Sands Ltd., 6% Sr. Unsec. Nts., 4/1/422 | | | 950,000 | | | | 1,138,599 | |
| |
Chesapeake Energy Corp., 6.625% Sr. Unsec. Nts., 8/15/20 | | | 1,746,000 | | | | 2,020,995 | |
| |
Cimarex Energy Co., 4.375% Sr. Unsec. Nts., 6/1/24 | | | 1,502,000 | | | | 1,567,713 | |
| |
CNOOC Finance 2013 Ltd., 4.25% Sr. Unsec. Unsub. Nts., 5/9/43 | | | 680,000 | | | | 662,694 | |
| |
CNOOC Nexen Finance 2014 ULC, 1.625% Sr. Unsec. Nts., 4/30/17 | | | 2,056,000 | | | | 2,064,055 | |
31 OPPENHEIMER CAPITAL INCOME FUND
| | | | |
| |
| CONSOLIDATED STATEMENT OF INVESTMENTS Continued | | |
| | | | | | | | |
| | | Principal Amount | | | Value | |
| |
Oil, Gas & Consumable Fuels (Continued) | | | | | | | | |
| |
Continental Resources, Inc., 4.50% Sr. Unsec. Nts., 4/15/23 | | $ | 1,892,000 | | | $ | 2,046,979 | |
| |
DCP Midstream LLC, 5.375% Sr. Unsec. Nts., 10/15/152 | | | 1,290,000 | | | | 1,341,769 | |
| |
DCP Midstream Operating LP, 3.875% Sr. Unsec. Nts., 3/15/23 | | | 579,000 | | | | 593,466 | |
| |
El Paso Pipeline Partners Operating Co. LLC, 4.10% Sr. Unsec. Nts., 11/15/15 | | | 790,000 | | | | 819,903 | |
| |
Enbridge Energy Partners LP, 5.35% Sr. Unsec. Nts., 12/15/14 | | | 1,201,000 | | | | 1,216,948 | |
| |
EnLink Midstream Partners LP: | | | | | | | | |
2.70% Sr. Unsec. Nts., 4/1/19 | | | 1,544,000 | | | | 1,566,362 | |
4.40% Sr. Unsec. Nts., 4/1/24 | | | 960,000 | | | | 1,017,411 | |
| |
Kinder Morgan Energy Partners LP, 4.15% Sr. Unsec. Nts., 2/1/24 | | | 905,000 | | | | 921,724 | |
| |
Kinder Morgan, Inc., 5% Sr. Unsec. Nts., 2/15/212 | | | 596,000 | | | | 640,700 | |
| |
Lukoil International Finance BV, 6.125% Sr. Unsec. Nts., 11/9/202 | | | 14,000,000 | | | | 14,072,240 | |
| |
Origin Energy Finance Ltd.: | |
3.50% Sr. Unsec. Nts., 10/9/182 | | | 2,066,000 | | | | 2,132,329 | |
5.45% Sr. Unsec. Nts., 10/14/212 | | | 1,326,000 | | | | 1,489,432 | |
| |
Pioneer Natural Resources Co., 6.65% Sr. Unsec. Nts., 3/15/17 | | | 1,331,000 | | | | 1,501,317 | |
| |
Range Resources Corp., 5.75% Sr. Unsec. Sub. Nts., 6/1/21 | | | 1,668,000 | | | | 1,788,930 | |
| |
Ras Laffan Liquefied Natural Gas Co. Ltd. III, 5.50% Sr. Sec. Nts., 9/30/142 | | | 1,466,000 | | | | 1,472,230 | |
| |
Rockies Express Pipeline LLC, 3.90% Sr. Unsec. Unsub. Nts., 4/15/155 | | | 1,907,000 | | | | 1,926,070 | |
| |
Spectra Energy Partners LP: | | | | | | | | |
4.60% Sr. Unsec. Nts., 6/15/21 | | | 1,078,000 | | | | 1,184,628 | |
4.75% Sr. Unsec. Nts., 3/15/24 | | | 888,000 | | | | 972,528 | |
| |
Targa Resources Partners LP/Targa Resources Partners Finance Corp., 5.25% Sr. Unsec. Nts., 5/1/23 | | | 1,945,000 | | | | 2,056,837 | |
| |
Whiting Petroleum Corp., 5.75% Sr. Unsec. Nts., 3/15/21 | | | 1,800,000 | | | | 1,980,000 | |
| |
Williams Partners LP, 4.50% Sr. Unsec. Nts., 11/15/23 | | | 1,026,000 | | | | 1,097,451 | |
| |
Woodside Finance Ltd., 4.60% Sr. Unsec. Unsub. Nts., 5/10/212 | | | 1,390,000 | | | | 1,529,199 | |
| | | | | | | | |
| | | | 52,787,351 | |
|
| |
Financials—7.3% | | | | | | | | |
| |
Capital Markets—1.6% | | | | | | | | |
| |
Apollo Management Holdings LP, 4% Sr. Unsec. Nts., 5/30/242 | | | 1,579,000 | | | | 1,608,619 | |
| |
Blackstone Holdings Finance Co. LLC, 5% Sr. Unsec. Nts., 6/15/442 | | | 2,017,000 | | | | 2,178,798 | |
| |
Carlyle Holdings II Finance LLC, 5.625% Sr. Sec. Nts., 3/30/432 | | | 1,057,000 | | | | 1,235,964 | |
| |
Goldman Sachs Capital II, 4% Jr. Sub. Perpetual Bonds4,9 | | | 5,993,000 | | | | 4,764,435 | |
| |
Goldman Sachs Group, Inc. (The): | | | | | | | | |
4.00% Sr. Unsec. Nts., 3/3/24 | | | 2,347,000 | | | | 2,424,226 | |
5.70% Jr. Sub. Perpetual Bonds, Series L4,9 | | | 2,019,000 | | | | 2,094,504 | |
| |
Lazard Group LLC, 4.25% Sr. Unsec. Nts., 11/14/20 | | | 1,678,000 | | | | 1,771,063 | |
| |
Macquarie Bank Ltd., 6.625% Unsec. Sub. Nts., 4/7/212 | | | 3,115,000 | | | | 3,624,106 | |
| |
Mellon Capital IV, 4% Jr. Sub. Perpetual Bonds4,9 | | | 6,000,000 | | | | 5,115,000 | |
| |
Morgan Stanley: | | | | | | | | |
5.00% Sub. Nts., 11/24/25 | | | 3,588,000 | | | | 3,858,155 | |
32 OPPENHEIMER CAPITAL INCOME FUND
| | | | | | | | |
| | | Principal Amount | | | Value | |
| |
Capital Markets (Continued) | | | | | | | | |
| |
Morgan Stanley: (Continued) | | | | | | | | |
6.25% Sr. Unsec. Nts., 8/28/17 | | $ | 1,000,000 | | | $ | 1,132,695 | |
| |
Nomura Holdings, Inc., 2% Sr. Unsec. Nts., 9/13/16 | | | 1,864,000 | | | | 1,892,605 | |
| |
Raymond James Financial, Inc., 5.625% Sr. Unsec. Unsub. Nts., 4/1/24 | | | 1,477,000 | | | | 1,677,913 | |
| |
UBS Preferred Funding Trust V, 6.243% Jr. Sub. Perpetual Bonds, Series 14,9 | | | 3,615,000 | | | | 3,829,641 | |
| | | | | | | | |
| | | | 37,207,724 | |
|
| |
Commercial Banks—3.4% | | | | | | | | |
| |
Amsouth Bank NA, 5.20% Sub. Nts., 4/1/15 | | | 1,582,000 | | | | 1,620,961 | |
| |
Bank of America Corp.: | | | | | | | | |
4.20% Sub. Nts., 8/26/24 | | | 1,575,000 | | | | 1,600,942 | |
7.75% Jr. Sub. Nts., 5/14/38 | | | 1,818,000 | | | | 2,556,639 | |
8.00% Jr. Sub. Perpetual Bonds, Series K4,9 | | | 1,768,000 | | | | 1,963,177 | |
| |
Barclays Bank plc, 5.14% Sub. Nts., 10/14/20 | | | 1,704,000 | | | | 1,862,545 | |
| |
Citigroup, Inc.: | | | | | | | | |
4.00% Sub. Nts., 8/5/24 | | | 502,000 | | | | 504,109 | |
6.675% Sub. Nts., 9/13/43 | | | 1,705,000 | | | | 2,178,368 | |
5.95% Jr. Sub. Perpetual Bonds, Series D4,9 | | | 1,960,000 | | | | 1,979,600 | |
| |
Commerzbank AG, 8.125% Sub. Nts., 9/19/232 | | | 1,775,000 | | | | 2,146,177 | |
| |
Credit Agricole SA, 6.637% Jr. Sub. Perpetual Bonds2,4,9 | | | 3,022,000 | | | | 3,212,764 | |
| |
HSBC Finance Capital Trust IX, 5.911% Unsec. Sub. Nts., 11/30/354 | | | 4,460,000 | | | | 4,632,825 | |
| |
Intesa Sanpaolo SpA, 5.017% Sub. Nts., 6/26/242 | | | 1,985,000 | | | | 2,007,702 | |
| |
JPMorgan Chase & Co.: | | | | | | | | |
7.90% Jr. Sub. Perpetual Bonds, Series 14,9 | | | 4,500,000 | | | | 5,000,625 | |
6.75% Jr. Sub. Perpetual Bonds, Series S4,9 | | | 1,648,000 | | | | 1,777,780 | |
| |
Lloyds Bank plc, 6.50% Sub. Nts., 9/14/202 | | | 1,687,000 | | | | 1,972,024 | |
| |
Lloyds Banking Group plc, 6.657% Jr. Sub. Perpetual Bonds2,4,9 | | | 1,763,000 | | | | 1,934,892 | |
| |
Rabobank Capital Funding Trust III, 5.254% Jr. Sub. Perpetual Bonds4,5,9 | | | 2,765,000 | | | | 2,917,075 | |
| |
Regions Bank, 7.50% Sub. Nts., 5/15/18 | | | 250,000 | | | | 294,999 | |
| |
Royal Bank of Scotland Group plc, 7.64% Jr. Sub. Perpetual Bonds, Series U4,9 | | | 1,900,000 | | | | 2,018,750 | |
| |
Societe Generale SA, 5.922% Jr. Sub. Perpetual Bonds2,4,9 | | | 1,705,000 | | | | 1,822,219 | |
| |
SunTrust Banks, Inc., 3.60% Sr. Unsec. Nts., 4/15/16 | | | 1,987,000 | | | | 2,073,560 | |
| |
Wachovia Capital Trust III, 5.57% Jr. Sub. Perpetual Bonds4,9 | | | 11,000,000 | | | | 10,835,000 | |
| |
Wells Fargo & Co.: | | | | | | | | |
7.98% Jr. Sub. Perpetual Bonds, Series K4,9 | | | 18,000,000 | | | | 20,430,000 | |
5.90% Jr. Sub. Perpetual Bonds, Series S4,9 | | | 2,010,000 | | | | 2,110,500 | |
| | | | | | | | |
| | | | 79,453,233 | |
|
| |
Consumer Finance—0.1% | | | | | | | | |
| |
Ally Financial, Inc., 4.75% Sr. Unsec. Nts., 9/10/18 | | | 1,757,000 | | | | 1,853,635 | |
|
| |
Diversified Financial Services—0.3% | | | | | | | | |
| |
Burlington Northern Santa Fe LLC, 3% Sr. Unsec. Nts., 3/15/23 | | | 1,655,000 | | | | 1,636,778 | |
| |
Leucadia National Corp., 5.50% Sr. Unsec. Nts., 10/18/23 | | | 2,538,000 | | | | 2,703,927 | |
33 OPPENHEIMER CAPITAL INCOME FUND
| | | | |
| |
| CONSOLIDATED STATEMENT OF INVESTMENTS Continued | | |
| | | | | | | | |
| | | Principal Amount | | | Value | |
| |
Diversified Financial Services (Continued) | | | | | | | | |
| |
Voya Financial, Inc., 5.65% Jr. Sub. Nts., 5/15/534 | | $ | 1,880,000 | | | $ | 1,922,300 | |
| | | | | | | | |
| | | | 6,263,005 | |
|
| |
Insurance—1.6% | | | | | | | | |
| |
AIA Group Ltd., 4.875% Sr. Unsec. Nts., 3/11/442 | | | 1,492,000 | | | | 1,633,862 | |
| |
AXIS Specialty Finance plc, 5.15% Sr. Unsec. Nts., 4/1/45 | | | 1,583,000 | | | | 1,693,345 | |
| |
Five Corners Funding Trust, 4.419% Unsec. Nts., 11/15/232 | | | 1,485,000 | | | | 1,588,075 | |
| |
Genworth Holdings, Inc., 4.80% Sr. Unsec. Nts., 2/15/24 | | | 2,951,000 | | | | 3,107,114 | |
| |
Liberty Mutual Group, Inc.: | | | | | | | | |
4.25% Sr. Unsec. Nts., 6/15/232 | | | 2,276,000 | | | | 2,372,846 | |
4.85% Sr. Unsec. Nts., 8/1/442 | | | 1,213,000 | | | | 1,232,881 | |
| |
Lincoln National Corp., 6.05% Jr. Unsec. Sub. Nts., 4/20/674 | | | 3,080,000 | | | | 3,176,250 | |
| |
MetLife, Inc., 10.75% Jr. Sub. Nts., 8/1/39 | | | 10,000,000 | | | | 16,250,000 | |
| |
Prudential Financial, Inc., 5.20% Jr. Sub. Nts., 3/15/444 | | | 1,281,000 | | | | 1,301,816 | |
| |
Swiss Re Capital I LP, 6.854% Jr. Sub. Perpetual Bonds4,5,9 | | | 2,955,000 | | | | 3,124,913 | |
| |
WR Berkley Corp., 4.75% Sr. Unsec. Nts., 8/1/44 | | | 1,004,000 | | | | 1,014,114 | |
| |
ZFS Finance USA Trust V, 6.50% Jr. Sub. Nts., 5/9/374,5 | | | 1,743,000 | | | | 1,882,440 | |
| | | | | | | | |
| | | | 38,377,656 | |
|
| |
Real Estate—0.0% | | | | | | | | |
| |
Ventas Realty LP, 1.25% Sr. Unsec. Nts., 4/17/17 | | | 800,000 | | | | 799,399 | |
| | | | | | | | |
|
| |
Real Estate Investment Trusts (REITs)—0.3% | | | | | | | | |
| |
American Tower Corp.: | | | | | | | | |
5.05% Sr. Unsec. Unsub. Nts., 9/1/20 | | | 861,000 | | | | 949,775 | |
5.90% Sr. Unsec. Nts., 11/1/21 | | | 983,000 | | | | 1,130,662 | |
| |
ARC Properties Operating Partnership LP/Clark Acquisition LLC, 2% Sr. Unsec. Nts., 2/6/172 | | | 1,908,000 | | | | 1,911,866 | |
| |
CC Holdings GS V LLC/Crown Castle GS III Corp., 3.849% Sr. Sec. Nts., 4/15/23 | | | 946,000 | | | | 962,015 | |
| |
Corrections Corp. of America, 4.125% Sr. Unsec. Nts., 4/1/20 | | | 1,907,000 | | | | 1,899,849 | |
| |
Hospitality Properties Trust, 4.65% Sr. Unsec. Nts., 3/15/24 | | | 963,000 | | | | 1,005,701 | |
| | | | | | | | |
| | | | 7,859,868 | |
|
| |
Health Care—0.8% | | | | | | | | |
| |
Biotechnology—0.1% | | | | | | | | |
| |
Gilead Sciences, Inc., 5.65% Sr. Unsec. Unsub. Nts., 12/1/41 | | | 1,154,000 | | | | 1,410,571 | |
| | | | | | | | |
|
| |
Health Care Equipment & Supplies—0.3% | | | | | | | | |
| |
Boston Scientific Corp., 4.125% Sr. Unsec. Nts., 10/1/23 | | | 1,751,000 | | | | 1,836,465 | |
| |
CareFusion Corp.: | | | | | | | | |
1.45% Sr. Unsec. Nts., 5/15/17 | | | 1,914,000 | | | | 1,912,015 | |
3.875% Sr. Unsec. Nts., 5/15/24 | | | 934,000 | | | | 952,303 | |
| |
DENTSPLY International, Inc., 2.75% Sr. Unsec. Nts., 8/15/16 | | | 1,715,000 | | | | 1,768,679 | |
| | | | | | | | |
| | | | 6,469,462 | |
|
| |
Health Care Providers & Services—0.1% | | | | | | | | |
| |
CHS/Community Health Systems, Inc., 5.125% Sr. Sec. Nts., 8/1/212 | | | 1,525,000 | | | | 1,570,750 | |
| |
Fresenius Medical Care US Finance II, Inc., 5.875% Sr. Unsec. Nts., 1/31/222 | | | 1,706,000 | | | | 1,885,130 | |
| | | | | | | | |
| | | | 3,455,880 | |
34 OPPENHEIMER CAPITAL INCOME FUND
| | | | | | | | |
| | | Principal Amount | | | Value | |
| |
Life Sciences Tools & Services—0.1% | | | | | | | | |
| |
Life Technologies Corp., 3.50% Sr. Unsec. Nts., 1/15/16 | | $ | 123,000 | | | $ | 127,341 | |
| |
Thermo Fisher Scientific, Inc.: | | | | | | | | |
4.15% Sr. Unsec. Nts., 2/1/24 | | | 605,000 | | | | 640,355 | |
5.00% Sr. Unsec. Nts., 6/1/15 | | | 881,000 | | | | 910,603 | |
5.30% Sr. Unsec. Nts., 2/1/44 | | | 717,000 | | | | 820,663 | |
| | | | | | | | |
| | | | | | | 2,498,962 | |
|
| |
Pharmaceuticals—0.2% | | | | | | | | |
| |
Actavis Funding SCS, 1.30% Sr. Unsec. Nts., 6/15/172 | | | 1,250,000 | | | | 1,247,749 | |
| |
Hospira, Inc., 5.20% Sr. Unsec. Nts., 8/12/20 | | | 1,756,000 | | | | 1,921,856 | |
| |
Mallinckrodt International Finance SA, 3.50% Sr. Unsec. Nts., 4/15/18 | | | 1,929,000 | | | | 1,904,887 | |
| |
Zoetis, Inc., 1.875% Sr. Unsec. Nts., 2/1/18 | | | 604,000 | | | | 604,614 | |
| | | | | | | | |
| | | | | | | 5,679,106 | |
|
| |
Industrials—1.5% | | | | | | | | |
| |
Aerospace & Defense—0.3% | | | | | | | | |
| |
B/E Aerospace, Inc., 5.25% Sr. Unsec. Nts., 4/1/22 | | | 1,897,000 | | | | 2,062,987 | |
| |
Huntington Ingalls Industries, Inc., 7.125% Sr. Unsec. Unsub. Nts., 3/15/21 | | | 1,722,000 | | | | 1,881,285 | |
| |
L-3 Communications Corp.: | | | | | | | | |
1.50% Sr. Unsec. Nts., 5/28/17 | | | 497,000 | | | | 494,891 | |
3.95% Sr. Unsec. Nts., 5/28/24 | | | 905,000 | | | | 908,004 | |
| |
Textron, Inc.: | |
4.30% Sr. Unsec. Nts., 3/1/24 | | | 957,000 | | | | 1,004,094 | |
6.20% Sr. Unsec. Nts., 3/15/15 | | | 142,000 | | | | 146,461 | |
| | | | | | | | |
| | | | | | | 6,497,722 | |
|
| |
Building Products—0.1% | | | | | | | | |
| |
Owens Corning, 4.20% Sr. Unsec. Nts., 12/15/22 | | | 1,974,000 | | | | 2,038,808 | |
| | | | | | | | |
| |
Commercial Services & Supplies—0.2% | | | | | | | | |
| |
Clean Harbors, Inc., 5.25% Sr. Unsec. Unsub. Nts., 8/1/20 | | | 1,786,000 | | | | 1,844,045 | |
| |
Pitney Bowes, Inc., 4.625% Sr. Unsec. Nts., 3/15/24 | | | 2,604,000 | | | | 2,713,194 | |
| | | | | | | | |
| | | | | | | 4,557,239 | |
|
| |
Electrical Equipment—0.0% | | | | | | | | |
| |
Sensata Technologies BV, 4.875% Sr. Unsec. Nts., 10/15/232 | | | 1,478,000 | | | | 1,470,610 | |
| | | | | | | | |
| |
Industrial Conglomerates—0.2% | | | | | | | | |
| |
General Electric Capital Corp., 6.25% Jr. Sub. Perpetual Bonds, Series B4,9 | | | 2,884,000 | | | | 3,224,540 | |
| |
Synchrony Financial: | | | | | | | | |
3.00% Sr. Unsec. Nts., 8/15/19 | | | 923,000 | | | | 936,881 | |
3.75% Sr. Unsec. Nts., 8/15/21 | | | 720,000 | | | | 735,476 | |
| | | | | | | | |
| | | | | | | 4,896,897 | |
|
| |
Machinery—0.2% | | | | | | | | |
| |
Crane Co., 4.45% Sr. Unsec. Nts., 12/15/23 | | | 938,000 | | | | 1,001,374 | |
| |
Ingersoll-Rand Global Holding Co. Ltd., 4.25% Sr. Unsec. Nts., 6/15/23 | | | 1,653,000 | | | | 1,766,189 | |
35 OPPENHEIMER CAPITAL INCOME FUND
| | | | |
| |
| CONSOLIDATED STATEMENT OF INVESTMENTS Continued | | |
| | | | | | | | |
| | | Principal Amount | | | Value | |
| |
Machinery (Continued) | | | | | | | | |
| |
Starwood Hotels & Resorts Worldwide, Inc., 7.375% Sr. Unsec. Nts., 11/15/15 | | $ | 1,748,000 | | | $ | 1,884,633 | |
| | | | | | | | |
| | | | | | | 4,652,196 | |
|
| |
| | | | | | | | |
Professional Services—0.1% | | | | | | | | |
| |
Experian Finance plc, 2.375% Sr. Unsec. Nts., 6/15/172 | | | 1,948,000 | | | | 1,993,330 | |
| |
Nielsen Finance LLC/Nielsen Finance Co., 4.50% Sr. Unsec. Nts., 10/1/20 | | | 1,900,000 | | | | 1,919,000 | |
| | | | | | | | |
| | | | | | | 3,912,330 | |
|
| |
Road & Rail—0.2% | | | | | | | | |
| |
Kansas City Southern de Mexico SA de CV, 3% Sr. Unsec. Nts., 5/15/23 | | | 1,687,000 | | | | 1,644,204 | |
| |
Penske Truck Leasing Co. LP/PTL Finance Corp.: | | | | | | | | |
2.50% Sr. Unsec. Nts., 3/15/162 | | | 1,862,000 | | | | 1,905,165 | |
4.25% Sr. Unsec. Nts., 1/17/232 | | | 865,000 | | | | 911,809 | |
| | | | | | | | |
| | | | | | | 4,461,178 | |
|
| |
Trading Companies & Distributors—0.2% | | | | | | | | |
| |
Air Lease Corp., 3.875% Sr. Unsec. Nts., 4/1/21 | | | 1,957,000 | | | | 1,986,355 | |
| |
International Lease Finance Corp., 5.875% Sr. Unsec. Unsub. Nts., 4/1/19 | | | 1,838,000 | | | | 2,014,907 | |
| | | | | | | | |
| | | | | | | 4,001,262 | |
|
| |
Information Technology—1.1% | | | | | | | | |
| |
Communications Equipment—0.0% | | | | | | | | |
| |
Motorola Solutions, Inc., 3.50% Sr. Unsec. Nts., 3/1/23 | | | 1,114,000 | | | | 1,090,893 | |
| |
| | | | | | | | |
Electronic Equipment, Instruments, & Components—0.2% | | | | | | | | |
| |
Amphenol Corp., 4.75% Sr. Unsec. Nts., 11/15/14 | | | 449,000 | | | | 452,763 | |
| |
Arrow Electronics, Inc., 5.125% Sr. Unsec. Unsub. Nts., 3/1/21 | | | 2,032,000 | | | | 2,213,901 | |
| |
Avnet, Inc., 4.875% Sr. Unsec. Unsub. Nts., 12/1/22 | | | 2,120,000 | | | | 2,267,783 | |
| | | | | | | | |
| | | | | | | 4,934,447 | |
|
| |
IT Services—0.6% | | | | | | | | |
| |
Ceridian LLC/Comdata, Inc., 8.125% Sr. Unsec. Nts., 11/15/175 | | | 9,350,000 | | | | 9,499,600 | |
| |
Fidelity National Information Services, Inc.: | | | | | | | | |
1.45% Sr. Unsec. Nts., 6/5/17 | | | 1,506,000 | | | | 1,506,024 | |
3.50% Sr. Unsec. Nts., 4/15/23 | | | 1,105,000 | | | | 1,105,127 | |
| |
Xerox Corp., 4.25% Sr. Unsec. Nts., 2/15/15 | | | 1,708,000 | | | | 1,736,568 | |
| | | | | | | | |
| | | | | | | 13,847,319 | |
|
| |
Software—0.1% | | | | | | | | |
| |
Oracle Corp., 3.40% Sr. Unsec. Nts., 7/8/24 | | | 1,425,000 | | | | 1,453,338 | |
| | | | | | | | |
| |
Technology Hardware, Storage & Peripherals—0.2% | | | | | | | | |
| |
Apple, Inc., 4.45% Sr. Unsec. Nts., 5/6/44 | | | 1,124,000 | | | | 1,189,748 | |
| |
Hewlett-Packard Co., 2.65% Sr. Unsec. Unsub. Nts., 6/1/16 | | | 1,789,000 | | | | 1,844,218 | |
| |
Seagate HDD Cayman, 3.75% Sr. Unsec. Nts., 11/15/182 | | | 1,660,000 | | | | 1,703,575 | |
| | | | | | | | |
| | | | | | | 4,737,541 | |
36 OPPENHEIMER CAPITAL INCOME FUND
| | | | | | | | |
| | | Principal Amount | | | Value | |
| |
Materials—1.7% | | | | | | | | |
| |
Chemicals—0.3% | | | | | | | | |
| |
Agrium, Inc., 3.50% Sr. Unsec. Nts., 6/1/23 | | $ | 1,180,000 | | | $ | 1,187,939 | |
| |
Eastman Chemical Co., 3% Sr. Unsec. Nts., 12/15/15 | | | 973,000 | | | | 1,001,280 | |
| |
LYB International Finance BV, 5.25% Sr. Unsec. Nts., 7/15/43 | | | 558,000 | | | | 631,418 | |
| |
Rockwood Specialties Group, Inc., 4.625% Sr. Unsec. Nts., 10/15/20 | | | 1,750,000 | | | | 1,826,563 | |
| |
RPM International, Inc., 3.45% Sr. Unsec. Unsub. Nts., 11/15/22 | | | 1,443,000 | | | | 1,423,859 | |
| | | | | | | | |
| | | | | | | 6,071,059 | |
|
| |
Construction Materials—0.1% | | | | | | | | |
| |
CRH America, Inc., 4.125% Sr. Unsec. Nts., 1/15/16 | | | 1,748,000 | | | | 1,823,005 | |
| | | | | | | | |
|
| |
Containers & Packaging—0.2% | | | | | | | | |
| |
Crown Americas LLC/Crown Americas Capital Corp. III, 6.25% Sr. Unsec. Nts., 2/1/21 | | | 670,000 | | | | 718,575 | |
| |
Packaging Corp. of America, 4.50% Sr. Unsec. Nts., 11/1/23 | | | 1,393,000 | | | | 1,505,674 | |
| |
Rock-Tenn Co., 3.50% Sr. Unsec. Unsub. Nts., 3/1/20 | | | 3,292,000 | | | | 3,408,840 | |
| | | | | | | | |
| | | | | | | 5,633,089 | |
|
| |
Metals & Mining—0.5% | | | | | | | | |
| |
Allegheny Technologies, Inc., 5.95% Sr. Unsec. Unsub. Nts., 1/15/21 | | | 1,091,000 | | | | 1,206,649 | |
| |
Barrick Gold Corp., 3.85% Sr. Unsec. Nts., 4/1/22 | | | 845,000 | | | | 858,987 | |
| |
Carpenter Technology Corp., 4.45% Sr. Unsec. Unsub. Nts., 3/1/23 | | | 595,000 | | | | 617,555 | |
|
| |
Freeport-McMoRan, Inc.: | | | | | | | | |
1.40% Sr. Unsec. Nts., 2/13/15 | | | 1,800,000 | | | | 1,805,621 | |
3.875% Sr. Unsec. Nts., 3/15/23 | | | 1,135,000 | | | | 1,154,103 | |
5.45% Sr. Unsec. Nts., 3/15/43 | | | 817,000 | | | | 886,808 | |
|
| |
Glencore Canada Corp.: | | | | | | | | |
5.375% Sr. Unsec. Unsub. Nts., 6/1/15 | | | 1,383,000 | | | | 1,428,152 | |
6.00% Sr. Unsec. Unsub. Nts., 10/15/15 | | | 1,687,000 | | | | 1,780,564 | |
|
| |
Glencore Funding LLC, 4.625% Sr. Unsec. Nts., 4/29/242 | | | 1,467,000 | | | | 1,543,284 | |
| |
Rio Tinto Finance USA plc, 4.125% Sr. Unsec. Nts., 8/21/42 | | | 547,000 | | | | 540,559 | |
| |
Yamana Gold, Inc., 4.95% Sr. Unsec. Nts., 7/15/242 | | | 561,000 | | | | 574,597 | |
| | | | | | | | |
| | | | | | | 12,396,879 | |
|
| |
Paper & Forest Products—0.6% | | | | | | | | |
| |
Appvion, Inc., 9% Sec. Nts., 6/1/202 | | | 15,000,000 | | | | 13,481,250 | |
| |
International Paper Co., 4.80% Sr. Unsec. Nts., 6/15/44 | | | 795,000 | | | | 827,995 | |
| | | | | | | | |
| | | | | | | 14,309,245 | |
|
| |
Telecommunication Services—0.9% | | | | | | | | |
| |
Diversified Telecommunication Services—0.8% | | | | | | | | |
| |
AT&T, Inc., 4.35% Sr. Unsec. Nts., 6/15/45 | | | 1,264,000 | | | | 1,237,277 | |
| |
British Telecommunications plc, 9.625% Sr. Unsec. Nts., 12/15/30 | | | 1,331,000 | | | | 2,155,216 | |
| |
Deutsche Telekom International Finance BV, 5.75% Sr. Unsec. Nts., 3/23/16 | | | 1,755,000 | | | | 1,885,937 | |
| |
Frontier Communications Corp., 8.50% Sr. Unsec. Nts., 4/15/20 | | | 1,551,000 | | | | 1,810,792 | |
37 OPPENHEIMER CAPITAL INCOME FUND
| | | | |
| |
| CONSOLIDATED STATEMENT OF INVESTMENTS Continued | | |
| | | | | | | | |
| | | Principal Amount | | | Value | |
| |
Diversified Telecommunication Services (Continued) | | | | | | | | |
| |
Telecom Italia Capital SA, 7.721% Sr. Unsec. Unsub. Nts., 6/4/38 | | $ | 1,100,000 | | | $ | 1,287,000 | |
| |
Telefonica Emisiones SAU, 7.045% Sr. Unsec. Unsub. Nts., 6/20/36 | | | 1,301,000 | | | | 1,714,829 | |
| |
T-Mobile USA, Inc., 6.25% Sr. Unsec. Nts., 4/1/21 | | | 1,730,000 | | | | 1,801,362 | |
|
| |
Verizon Communications, Inc.: | | | | | | | | |
4.50% Sr. Unsec. Nts., 9/15/20 | | | 4,749,000 | | | | 5,222,238 | |
6.40% Sr. Unsec. Nts., 2/15/38 | | | 859,000 | | | | 1,078,400 | |
| | | | | | | | |
| | | | | | | 18,193,051 | |
|
| |
Wireless Telecommunication Services—0.1% | | | | | | | | |
| |
America Movil SAB de CV, 4.375% Sr. Unsec. Unsub. Nts., 7/16/42 | | | 1,718,000 | | | | 1,683,767 | |
| |
Rogers Communications, Inc., 6.75% Sr. Unsec. Nts., 3/15/15 | | | 554,000 | | | | 572,225 | |
| |
Vodafone Group plc: | | | | | | | | |
4.375% Sr. Unsec. Unsub. Nts., 2/19/43 | | | 554,000 | | | | 542,341 | |
6.25% Sr. Unsec. Nts., 11/30/32 | | | 605,000 | | | | 750,832 | |
| | | | | | | | |
| | | | | | | 3,549,165 | |
|
| |
Utilities—0.8% | | | | | | | | |
| |
Electric Utilities—0.4% | |
EDP Finance BV, 6% Sr. Unsec. Nts., 2/2/182 | | | 1,850,000 | | | | 2,013,781 | |
| |
Exelon Generation Co. LLC, 4.25% Sr. Unsec. Unsub. Nts., 6/15/22 | | | 938,000 | | | | 981,080 | |
| |
ITC Holdings Corp.: | | | | | | | | |
3.65% Sr. Unsec. Nts., 6/15/24 | | | 1,670,000 | | | | 1,690,778 | |
5.30% Sr. Unsec. Nts., 7/1/43 | | | 402,000 | | | | 464,365 | |
| |
Jersey Central Power & Light Co., 4.70% Sr. Unsec. Nts., 4/1/242 | | | 888,000 | | | | 964,406 | |
| |
Pennsylvania Electric Co., 5.20% Sr. Unsec. Nts., 4/1/20 | | | 368,000 | | | | 411,308 | |
| |
PPL Capital Funding, Inc., 3.50% Sr. Unsec. Unsub. Nts., 12/1/22 | | | 1,293,000 | | | | 1,321,985 | |
| |
PPL WEM Holdings Ltd., 5.375% Sr. Unsec. Unsub. Nts., 5/1/212 | | | 2,185,000 | | | | 2,480,777 | |
| | | | | | | | |
| | | | | | | 10,328,480 | |
|
| |
Independent Power and Renewable Electricity Producers—0.1% | | | | | | | | |
| |
Dayton Power & Light Co., 1.875% Sec. Nts., 9/15/16 | | | 1,335,000 | | | | 1,358,412 | |
| |
| | | | | | | | |
Multi-Utilities—0.3% | | | | | | | | |
| |
CenterPoint Energy, Inc., 5.95% Sr. Unsec. Nts., 2/1/17 | | | 1,629,000 | | | | 1,807,366 | |
| |
CMS Energy Corp.: | | | | | | | | |
3.875% Sr. Unsec. Nts., 3/1/24 | | | 1,021,000 | | | | 1,076,352 | |
5.05% Sr. Unsec. Unsub. Nts., 3/15/22 | | | 661,000 | | | | 751,339 | |
| |
PG&E Corp., 2.40% Sr. Unsec. Nts., 3/1/19 | | | 1,233,000 | | | | 1,246,223 | |
| |
TECO Finance, Inc., 6.75% Sr. Unsec. Nts., 5/1/15 | | | 1,168,000 | | | | 1,214,412 | |
| | | | | | | | |
| | | | | | | 6,095,692 | |
| | | | | | | | |
Total Non-Convertible Corporate Bonds and Notes (Cost $453,541,438) | | | | | | | 475,375,538 | |
| | | | | | | | |
| |
Convertible Corporate Bonds and Notes—0.7% | | | | | | | | |
| |
Clearwire Communications LLC/Clearwire Finance, Inc., 8.25% Cv. Sr. Unsec. Nts., 12/1/405 | | | 13,500,000 | | | | 15,390,000 | |
38 OPPENHEIMER CAPITAL INCOME FUND
| | | | | | | | |
| | | Principal Amount | | | Value | |
| |
Convertible Corporate Bonds and Notes (Continued) | | | | | | | | |
| |
SEACOR Holdings, Inc.: | | | | | | | | |
2.50% Cv. Sr. Unsec. Nts., 12/15/27 | | $ | 1,000,000 | | | $ | 1,130,625 | |
3.00% Cv. Sr. Unsec. Nts., 11/15/282 | | | 666,000 | | | | 638,944 | |
| | | | | | | | |
Total Convertible Corporate Bonds and Notes (Cost $16,411,939) | | | | | | | 17,159,569 | |
| | | | | | | | |
| |
Corporate Loans—3.7% | | | | | | | | |
| |
Appvion, Inc., Sr. Sec. Credit Facilities 1st Lien Term Loan, 5.75%, 6/28/194 | | | 17,820,000 | | | | 17,831,138 | |
| |
AZ Chem US, Inc., Sr. Sec. Credit Facilities 1st Lien Term Loan, Tranche B, 4.50%, 6/10/214 | | | 14,773,973 | | | | 14,872,471 | |
| |
Celanese US Holdings LLC, Sr. Sec. Credit Facilities 1st Lien Term Loan, Tranche C2, 2.231%, 10/31/164 | | | 9,900,000 | | | | 9,946,411 | |
| |
Dynegy, Inc., Sr. Sec. Credit Facilities 1st Lien Term Loan, Tranche B2, 4.00%, 4/23/204 | | | 9,900,000 | | | | 9,900,000 | |
| |
Intelsat Jackson Holdings SA, Sr. Sec. Credit Facilities 1st Lien Term Loan, Tranche B2, 3.75%, 6/30/194 | | | 17,511,840 | | | | 17,435,225 | |
| |
International Lease Finance Corp., Sr. Sec. Credit Facilities Term Loan, Tranche B, 3.50%, 2/26/214 | | | 17,000,000 | | | | 16,949,000 | |
| | | | | | | | |
Total Corporate Loans (Cost $86,780,440) | | | | | | | 86,934,245 | |
| | | | | | | | |
| | | Shares | | | | |
| |
Structured Securities—0.7% | | | | | | | | |
| |
Goldman Sachs Group, Inc. (The), Actavis plc Equity Linked Nts., 9/30/141,2 | | | 45,000 | | | | 10,247,906 | |
| |
Goldman Sachs Group, Inc. (The), United Continental Holdings, Inc. Equity Linked Nts., 10/17/141,2 | | | 114,830 | | | | 5,414,523 | |
| | | | | | | | |
Total Structured Securities (Cost $15,000,622) | | | | | | | 15,662,429 | |
| | | | | | | | | | | | | | | | | | | | | | | | |
| | | | | | Exercise
Price | | | Expiration
Date | | | | | | Contracts | | | | |
| |
| Exchange-Traded Options Purchased—0.0% | |
| |
S&P 500 Index Call1 | | | USD | | | | 2,000.000 | | | | 11/22/14 | | | | USD | | | | 200 | | | | 830,000 | |
| |
United States Treasury Nts., 10 yr. Futures, 12/19/14 Call1 | | | USD | | | | 127.000 | | | | 11/21/14 | | | | USD | | | | 400 | | | | 250,000 | |
| |
United States Treasury Nts., 5 yr. Futures, 12/31/14 Call1 | | | USD | | | | 120.000 | | | | 11/21/14 | | | | USD | | | | 750 | | | | 158,203 | |
| |
| | | | | | | | | | | | | | | | | | | | | | | | |
Total Exchange-Traded Options Purchased (Cost $818,079) | | | | | | | | | | | | | | | | | | | | | | | 1,238,203 | |
| | | | | | | | | | | | | | | | | | | | | | | | |
| | | | | | | | | | | | | | | | | | | | | | | | | | | | | | | | |
| | | Counterparty | | | Buy/Sell
Protection | | | Reference
Asset | | | Fixed Rate | | | Expiration
Date | | | Notional Amount (000’s) | | | | |
| |
| Over-the-Counter Credit Default Swaptions Purchased—0.0% | |
| |
Credit Default Swap maturing 6/20/191 | | | JPM | | | | Buy | | |
| CDX.NA.IG.
22 |
| | | 1.000 | % | | | 12/17/14 | | | | USD | | | | 67,424 | | | | 36,847 | |
| |
Credit Default Swap maturing 6/20/191 | | | JPM | | | | Buy | | |
| CDX.NA.IG.
22 |
| | | 1.000 | | | | 12/17/14 | | | | USD | | | | 68,780 | | | | 37,588 | |
39 OPPENHEIMER CAPITAL INCOME FUND
| | | | |
| |
| CONSOLIDATED STATEMENT OF INVESTMENTS Continued | | |
| | | | | | | | | | | | | | | | | | | | | | | | | | | | | | | | |
Counterparty | | | Buy/Sell
Protection | | | Reference
Asset | | | Fixed Rate | | | Expiration
Date | | | Notional Amount (000’s) | | | Value | |
| |
| Over-the-Counter Credit Default Swaptions Purchased (Continued) | |
Credit Default Swap maturing 6/20/191 | | | DEU | | | | Buy | | |
| CDX.NA.IG.
22 |
| | | 1.000 | % | | | 10/15/14 | | | | USD | | | | 68,575 | | | $ | 4,389 | |
| |
Credit Default Swap maturing 6/20/191 | | | JPM | | | | Buy | | |
| CDX.NA.IG.
22 |
| | | 1.000 | | | | 10/15/14 | | | | USD | | | | 69,060 | | | | 4,420 | |
| | | | | | | | | | | | | | | | | | | | | | | | | | | | | | | | |
Total Over-the-Counter Credit Default Swaptions Purchased (Cost $478,671) | | | | | | | | 83,244 | |
Counterparty | | | Pay/Receive
Floating Rate | | | Floating
Rate | | | Fixed Rate | | | Expiration
Date | | | Notional Amount (000’s) | | | | |
| |
| Over-the-Counter Interest Rate Swaptions Purchased—0.1% | |
Interest Rate Swap maturing 1/25/26 Put1 | | | GSG | | | | Receive | | |
| Six-Month
JPY BBA
LIBOR |
| | | 1.870 | % | | | 1/21/16 | | | | JPY | | | | 5,406,000 | | | | 15,413 | |
| |
Interest Rate Swap maturing 2/28/27 Put1 | | | JPM | | | | Receive | | |
| Three-
Month USD
BBA LIBOR |
| | | 4.500 | | | | 2/24/17 | | | | USD | | | | 50,000 | | | | 757,508 | |
| |
Interest Rate Swap maturing 4/13/26 Call1 | | | JPM | | | | Receive | | |
| Three-
Month USD
BBA LIBOR |
| | | 3.410 | | | | 4/11/16 | | | | USD | | | | 33,000 | | | | 752,807 | |
| |
Interest Rate Swap maturing 4/13/26 Call1 | | | JPM | | | | Receive | | |
| Three-
Month USD
BBA LIBOR |
| | | 3.468 | | | | 4/11/16 | | | | USD | | | | 33,000 | | | | 705,744 | |
| |
Interest Rate Swap maturing 4/27/26 Call1 | | | JPM | | | | Receive | | |
| Three-
Month USD
BBA LIBOR |
| | | 3.373 | | | | 4/25/16 | | | | USD | | | | 30,000 | | | | 736,194 | |
| | | | | | | | | | | | | | | | | | | | | | | | | | | | | | | | |
Total Over-the-Counter Interest Rate Swaptions Purchased (Cost $6,804,593) | | | | | | | | 2,967,666 | |
40 OPPENHEIMER CAPITAL INCOME FUND
| | | | | | | | |
| | |
| | | Shares | | | Value | |
| |
Investment Companies—20.5% | | | | | | | | |
Oppenheimer Institutional Money Market Fund, Cl. E, 0.09%10,11 | | | 142,722,250 | | | $ | 142,722,250 | |
| |
Oppenheimer Master Loan Fund, LLC10 | | | 18,401,410 | | | | 268,421,086 | |
| |
Oppenheimer Ultra-Short Duration Fund, Cl. Y10 | | | 6,058,107 | | | | 60,702,229 | |
| |
SPDR Gold Trust Exchange Traded Fund1 | | | 121,000 | | | | 14,987,060 | |
| | | | | | | | |
Total Investment Companies (Cost $487,269,873) | | | | | | | 486,832,625 | |
| | |
| | | Principal Amount | | | | |
| |
Municipal Bonds and Notes—0.4% | | | | | | | | |
University of Puerto Rico, 5%, 6/1/16 | | $ | 295,000 | | | | 218,563 | |
| |
University of Puerto Rico, Series P: | | | | | | | | |
5.00%, 6/1/23 | | | 7,500,000 | | | | 4,769,025 | |
5.00%, 6/1/30 | | | 7,500,000 | | | | 4,377,525 | |
| | | | | | | | |
Total Municipal Bonds and Notes (Cost $9,719,561) | | | | | | | 9,365,113 | |
| | | | | | | | |
| |
Total Investments, at Value (Cost $2,344,737,329) | | | 108.1 | % | | | 2,561,971,099 | |
| |
Net Other Assets (Liabilities) | | | (8.1 | ) | | | (191,876,936 | ) |
| | | | |
Net Assets | | | 100.0 | % | | $ | 2,370,094,163 | |
| | | | |
Footnotes to Consolidated Statement of Investments
*August 29, 2014 represents the last business day of the Fund’s 2014 fiscal year. See Note 1 of the accompanying Consolidated Notes.
1. Non-income producing security.
2. Represents securities sold under Rule 144A, which are exempt from registration under the Securities Act of 1933, as amended. These securities have been determined to be liquid under guidelines established by the Board of Trustees. These securities amount to $252,666,197 or 10.66% of the Fund’s net assets as of August 29, 2014.
3. All or a portion of the security position is when-issued or delayed delivery to be delivered and settled after August 29, 2014. See Note 1 of the accompanying Notes.
4. Represents the current interest rate for a variable or increasing rate security.
5. Restricted security. The aggregate value of restricted securities as of August 29, 2014 was $111,898,901, which represents 4.72% of the Fund’s net assets. See Note 7 of the accompanying Notes. Information concerning restricted securities is as follows:
| | | | | | | | | | | | | | | | |
| Security | | Acquisition Dates | | | Cost | | | Value | | | Unrealized Appreciation/ (Depreciation) | |
| |
Aircraft Lease Securitisation Ltd., Series 2007-1A, Cl. G3, 0.419%, 5/10/32 | | | 5/14/13-7/19/13 | | | $ | 17,782,626 | | | $ | 18,241,616 | | | $ | 458,990 | |
Airspeed Ltd., Series 2007-1A, Cl. G1, 0.425%, 6/15/32 | | | 7/28/10-10/21/10 | | | | 23,863,908 | | | | 25,474,015 | | | | 1,610,107 | |
Airspeed Ltd., Series 2007-1A, Cl. G2, 0.435%, 6/15/32 | | | 4/8/11 | | | | 8,496,680 | | | | 9,405,086 | | | | 908,406 | |
Blade Engine Securitization Ltd., Series 2006-1A, Cl. B, 3.155%, 9/15/41 | | | 11/10/09 | | | | 4,569,522 | | | | 2,969,377 | | | | (1,600,145 | ) |
Blade Engine Securitization Ltd., Series 2006-1AW, Cl. A1, 0.455%, 9/15/41 | | | 4/19/13-5/29/13 | | | | 17,312,117 | | | | 18,529,916 | | | | 1,217,799 | |
Ceridian LLC/Comdata, Inc., 8.125% Sr. Unsec. Nts., 11/15/17 | | | 7/22/13-7/29/13 | | | | 9,418,323 | | | | 9,499,600 | | | | 81,277 | |
41 OPPENHEIMER CAPITAL INCOME FUND
| | | | |
| |
| CONSOLIDATED STATEMENT OF INVESTMENTS Continued | | |
Footnotes to Consolidated Statement of Investments (Continued)
| | | | | | | | | | | | | | | | |
| Security | | Acquisition Dates | | | Cost | | | Value | | | Unrealized Appreciation/ (Depreciation) | |
| |
| Clearwire Communications LLC/Clearwire Finance, Inc., 8.25% Cv. Sr. Unsec. Nts., 12/1/40 | | | 9/23/13-9/25/13 | | | $ | 14,745,939 | | | $ | 15,390,000 | | | $ | 644,061 | |
| Rabobank Capital Funding Trust III, 5.254% Jr. Sub. Perpetual Bonds | | | 5/1/13-5/8/13 | | | | 2,810,271 | | | | 2,917,075 | | | | 106,804 | |
| Raspro Trust, Series 2005-1A, Cl. G, 0.631%, 3/23/24 | | | 6/11/13 | | | | 570,348 | | | | 604,918 | | | | 34,570 | |
| Rockies Express Pipeline LLC, 3.90% Sr. Unsec. Unsub. Nts., 4/15/15 | | | 11/10/10-5/20/14 | | | | 1,912,950 | | | | 1,926,070 | | | | 13,120 | |
| Swiss Re Capital I LP, 6.854% Jr. Sub. Perpetual Bonds | | | 3/10/10-7/22/13 | | | | 2,728,633 | | | | 3,124,913 | | | | 396,280 | |
| TRW Automotive, Inc., 7.25% Sr. Unsec. Nts., 3/15/17 | | | 3/31/14-4/8/14 | | | | 1,942,532 | | | | 1,933,875 | | | | (8,657 | ) |
| ZFS Finance USA Trust V, 6.50% Jr. Sub. Nts., 5/9/37 | | | 11/20/13 | | | | 1,830,665 | | | | 1,882,440 | | | | 51,775 | |
| | | | | | | | |
| | | | | | $ | 107,984,514 | | | $ | 111,898,901 | | | $ | 3,914,387 | |
| | | | | | | | |
6. Interest-Only Strips represent the right to receive the monthly interest payments on an underlying pool of mortgage loans. These securities typically decline in price as interest rates decline. Most other fixed income securities increase in price when interest rates decline. The principal amount of the underlying pool represents the notional amount on which current interest is calculated. The price of these securities is typically more sensitive to changes in prepayment rates than traditional mortgage-backed securities (for example, GNMA pass-throughs). Interest rates disclosed represent current yields based upon the current cost basis and estimated timing and amount of future cash flows. These securities amount to $10,248,107 or 0.43% of the Fund’s net assets as of August 29, 2014.
7. Interest rate is less than 0.0005%.
8. Principal-Only Strips represent the right to receive the monthly principal payments on an underlying pool of mortgage loans. The value of these securities generally increases as interest rates decline and prepayment rates rise. The price of these securities is typically more volatile than that of coupon-bearing bonds of the same maturity. Interest rates disclosed represent current yields based upon the current cost basis and estimated timing of future cash flows. These securities amount to $181,990 or 0.01% of the Fund’s net assets as of August 29, 2014.
9. This bond has no contractual maturity date, is not redeemable and contractually pays an indefinite stream of interest. Rate reported represents the current interest rate for this variable rate security.
10. Is or was an affiliate, as defined in the Investment Company Act of 1940, at or during the period ended August 29, 2014, by virtue of the Fund owning at least 5% of the voting securities of the issuer or as a result of the Fund and the issuer having the same investment adviser. Transactions during the period in which the issuer was an affiliate are as follows:
| | | | | | | | | | | | | | | | |
| | | Shares
August 30, 2013a | | | Gross Additions | | | Gross Reductions | | | Shares August 29, 2014 | |
| |
Oppenheimer Institutional Money | | | | | | | | | | | | | | | | |
Market Fund, Cl. E | | | 220,971,754 | | | | 900,022,401 | | | | 978,271,905 | | | | 142,722,250 | |
Oppenheimer Master Loan Fund, LLC | | | 13,905,007 | | | | 4,496,403 | | | | — | | | | 18,401,410 | |
Oppenheimer Ultra-Short Duration Fund, Cl. Y (formerly Oppenheimer | | | | | | | | | | | | | | | | |
Short Duration Fund, Cl. Y) | | | 3,024,126 | | | | 3,033,981 | | | | — | | | | 6,058,107 | |
42 OPPENHEIMER CAPITAL INCOME FUND
Footnotes to Consolidated Statement of Investments (Continued)
| | | | | | | | | | | | |
| | | Value | | | Income | | | Realized Gain | |
| |
Oppenheimer Institutional Money Market Fund, Cl. E | | $ | 142,722,250 | | | $ | 166,728 | | | $ | — | |
Oppenheimer Master Loan Fund, LLC | | | 268,421,086 | | | | 12,177,998 | b | | | 405,013 | b |
| Oppenheimer Ultra-Short Duration Fund, Cl. Y (formerly Oppenheimer Short Duration Fund, Cl. Y) | | | 60,702,229 | | | | 151,274 | | | | 18,161 | |
| | | | |
Total | | $ | 471,845,565 | | | $ | 12,496,000 | | | $ | 423,174 | |
| | | | |
a. August 30, 2013 represents the last business day of the Fund’s 2013 fiscal year. See Note 1 of the accompanying Consolidated Notes.
b. Represents the amount allocated to the Fund from Oppenheimer Master Loan Fund, LLC.
11. Rate shown is the 7-day yield as of August 29, 2014.
| | | | | | | | | | | | | | | | | | | | | | | | | | | | |
| |
| Forward Currency Exchange Contracts as of August 29, 2014 | |
| Counterparty | | Settlement
Month(s) | | | Currency
Purchased
(000’s) | | | Currency Sold
(000’s) | | | Unrealized
Appreciation | | | Unrealized
Depreciation | |
| |
BOA | | | 10/2014 | | | | USD | | | | 29,797 | | | | JPY | | | | 3,040,000 | | | $ | 567,935 | | | $ | — | |
DEU | | | 01/2015 | | | | USD | | | | 9,227 | | | | AUD | | | | 10,600 | | | | — | | | | 573,080 | |
RBS | | | 10/2014 | | | | USD | | | | 9,935 | | | | EUR | | | | 7,300 | | | | 340,530 | | | | — | |
| | | | | | | | | | | | | | | | | | | | | | | | | | | | |
Total Unrealized Appreciation and Depreciation | | | | | | | | | | | | | | | | | | | | | | $ | 908,465 | | | $ | 573,080 | |
| | | | | | | | | | | | | | | | | | | | | | | | | | | | |
| | | | | | | | | | | | | | | | | | | | | | | | |
| |
| Futures Contracts as of August 29, 2014 | |
| Description | | Exchange | | | Buy/Sell | | | Expiration
Date | | | Number of
Contracts | | | Value | | | Unrealized
Appreciation
(Depreciation) | |
| |
Euro-BTP | | | EUX | | | | Sell | | | | 12/8/14 | | | | 50 | | | $ | 8,495,344 | | | $ | 11,769 | |
United States Treasury Long Bonds | | | CBT | | | | Buy | | | | 12/19/14 | | | | 245 | | | | 34,322,969 | | | | 305,532 | |
United States Treasury Nts., 2 yr. | | | CBT | | | | Sell | | | | 12/31/14 | | | | 710 | | | | 155,523,285 | | | | (21,478 | ) |
United States Treasury Nts., 5 yr. | | | CBT | | | | Sell | | | | 12/31/14 | | | | 9 | | | | 1,069,523 | | | | (2,534 | ) |
United States Treasury Nts., 10 yr. | | | CBT | | | | Buy | | | | 12/19/14 | | | | 29 | | | | 3,647,656 | | | | (431 | ) |
United States Treasury Ultra Bonds | | | CBT | | | | Buy | | | | 12/19/14 | | | | 158 | | | | 24,569,000 | | | | 465,029 | |
| | | | | | | | | | | | | | | | | | | | | | | | |
| | | | | | | | | | | | | | | | | | | | | | $ | 757,887 | |
| | | | | | | | | | | | | | | | | | | | | | | | |
| | | | | | | | | | | | | | | | | | | | | | | | | | | | |
| |
| Centrally Cleared Credit Default Swaps at August 29, 2014 | |
| Reference Asset | | Buy/Sell
Protection | | | Fixed
Rate | | | Maturity
Date | | | Notional
Amount (000’s) | | | Premiums
Received/(Paid) | | | Value | |
| |
CDX.NA.HY.22 | | | Buy | | | | 5.000 | | | | 6/20/19 | | | | USD | | | | 20,000 | | | $ | (1,717,122 | ) | | $ | (1,726,450 | ) |
| | | | | | | | | | | | | | | | | | | | | | | | | | | | | | | | |
| |
| Over-the-Counter Credit Default Swaps at August 29, 2014 | |
| Reference Asset | | Counterparty | | | Buy/Sell
Protection | | | Fixed
Rate | | | Maturity
Date | | | Notional
Amount
(000’s) | | | Premiums
Received/(Paid) | | | Value | |
| |
CDX.NA.IG.20 | | | JPM | | | | Sell | | | | 1.000 | | | | 6/20/18 | | | | USD | | | | 25,000 | | | $ | 118,805 | | | $ | 581,134 | |
43 OPPENHEIMER CAPITAL INCOME FUND
| | | | |
| |
| CONSOLIDATED STATEMENT OF INVESTMENTS Continued | | |
Footnotes to Consolidated Statement of Investments (Continued)
The table that follows shows the undiscounted maximum potential payment by the Fund related to selling credit protection in credit default swaps:
| | | | | | | | | | | | |
Type of Reference Asset on which the
Fund Sold Protection | | Total Maximum
Potential Payments
for Selling Credit
Protection
(Undiscounted) | | | Amount Recoverable* | | | Reference
Asset Rating
Range** | |
| |
| | | |
Investment Grade Corporate Debt Indexes | | $ | 25,000,000 | | | $ | — | | | | BBB+ | |
* The Fund has no amounts recoverable from related purchased protection. In addition, the Fund has no recourse provisions under the credit derivatives and holds no collateral which can offset or reduce potential payments under a triggering event.
** The period end reference asset security ratings, as rated by any rating organization, are included in the equivalent Standard & Poor’s rating category. The reference asset rating represents the likelihood of a potential credit event on the reference asset which would result in a related payment by the Fund.
| | | | | | | | | | | | | | | | | | | | | | | | |
| |
| Over-the-Counter Total Return Swaps at August 29, 2014 | |
| Reference Asset | | Counterparty | | | Pay/Receive
Total
Return | | | Floating Rate | | | Maturity
Date | | | Notional Amount
(000’s) | | | Value | |
| |
Blackstone Group LP (The) | | | GSG | | | | Receive | | |
| Six-Month USD
BBA LIBOR plus
58 basis points |
| | | 10/17/14 | | | | USD 10,054 | | | $ | 916,532 | |
Glossary:
Counterparty Abbreviations
| | |
BOA | | Bank of America NA |
DEU | | Deutsche Bank Securities Inc. |
GSG | | Goldman Sachs Group, Inc. (The) |
JPM | | JPMorgan Chase Bank NA |
RBS | | Royal Bank of Scotland plc (The) |
Currency abbreviations indicate amounts reporting in currencies
| | |
AUD | | Australian Dollar |
EUR | | Euro |
JPY | | Japanese Yen |
Definitions
| | |
BBA LIBOR | | British Bankers’ Association London - Interbank Offered Rate |
CDX.NA.HY.22 | | Markit CDX North American High Yield |
CDX.NA.IG20 | | CDX North America Investment Grade Index Series 20 |
Exchange Abbreviations
| | |
CBT | | Chicago Board of Trade |
EUX | | European Stock Exchanges |
See accompanying Notes to Consolidated Financial Statements.
44 OPPENHEIMER CAPITAL INCOME FUND
| | | | |
| |
CONSOLIDATED STATEMENT OF ASSETS AND LIABILITIES August 29, 20141 | | |
| | |
| | | | |
| | | | |
| |
Assets | | | | |
Investments, at value—see accompanying consolidated statement of investments: | | | | |
Unaffiliated companies (cost $1,872,307,787) | | $ | 2,090,125,534 | |
Affiliated companies (cost $472,429,542) | | | 471,845,565 | |
| | | | |
| | | 2,561,971,099 | |
| |
Cash | | | 5,279,664 | |
| |
Cash used for collateral on futures | | | 1,800,000 | |
| |
Cash used for collateral on OTC derivatives | | | 560,000 | |
| |
Cash used for collateral on centrally cleared swaps | | | 2,911,189 | |
| |
Unrealized appreciation on foreign currency exchange contracts | | | 908,465 | |
| |
Swaps, at value (premiums received $118,805) | | | 1,497,666 | |
| |
Receivables and other assets: | | | | |
Investments sold (including $16,261,002 sold on a when-issued or delayed delivery basis) | | | 16,455,526 | |
Interest, dividends and principal paydowns | | | 12,587,969 | |
Shares of beneficial interest sold | | | 4,923,152 | |
Variation margin receivable | | | 92 | |
Other | | | 212,100 | |
| | | | |
Total assets | | | 2,609,106,922 | |
|
| |
Liabilities | | | | |
Unrealized depreciation on foreign currency exchange contracts | | | 573,080 | |
| |
Centrally cleared swaps, at value (premiums paid $1,717,122) | | | 1,726,450 | |
| |
Payables and other liabilities: | | | | |
Investments purchased (including $221,521,597 purchased on a when-issued or delayed delivery basis) | | | 233,416,172 | |
Shares of beneficial interest redeemed | | | 2,442,378 | |
Distribution and service plan fees | | | 448,996 | |
Trustees’ compensation | | | 168,987 | |
Variation margin payable | | | 140,039 | |
Shareholder communications | | | 25,343 | |
Other | | | 71,314 | |
| | | | |
Total liabilities | | | 239,012,759 | |
|
| |
Net Assets | | $ | 2,370,094,163 | |
| | | | |
|
| |
Composition of Net Assets | | | | |
Par value of shares of beneficial interest | | $ | 237,189 | |
| |
Additional paid-in capital | | | 2,567,597,883 | |
| |
Accumulated net investment income | | | 29,327,913 | |
| |
Accumulated net realized loss on investments and foreign currency transactions | | | (446,728,959 | ) |
| |
Net unrealized appreciation on investments and translation of assets and liabilities denominated in foreign currencies | | | 219,660,137 | |
| | | | |
Net Assets | | $ | 2,370,094,163 | |
| | | | |
45 OPPENHEIMER CAPITAL INCOME FUND
| | | | |
| |
| CONSOLIDATED STATEMENT OF INVESTMENTS Continued | | |
| | | | |
| |
Net Asset Value Per Share | | | | |
| |
Class A Shares: | | | | |
| |
| Net asset value and redemption price per share (based on net assets of $1,730,244,979 and 172,424,305 shares of beneficial interest outstanding) | | $ | 10.03 | |
| |
| Maximum offering price per share (net asset value plus sales charge of 5.75% of offering price) | | $ | 10.64 | |
| |
| |
Class B Shares: | | | | |
| |
| Net asset value, redemption price (excludes applicable contingent deferred sales charge) and offering price per share (based on net assets of $29,021,396 and 2,957,366 shares of beneficial interest outstanding) | | $ | 9.81 | |
| |
| |
Class C Shares: | | | | |
| |
| Net asset value, redemption price (excludes applicable contingent deferred sales charge) and offering price per share (based on net assets of $296,135,835 and 30,411,863 shares of beneficial interest outstanding) | | $ | 9.74 | |
| |
| |
Class I Shares: | | | | |
| |
| Net asset value, redemption price and offering price per share (based on net assets of $10,893,699 and 1,085,843 shares of beneficial interest outstanding) | | $ | 10.03 | |
| |
| |
Class R Shares: | | | | |
| |
| Net asset value, redemption price (excludes applicable contingent deferred sales charge) and offering price per share (based on net assets of $23,798,597 and 2,401,636 shares of beneficial interest outstanding) | | $ | 9.91 | |
| |
| |
Class Y Shares: | | | | |
| |
| Net asset value, redemption price and offering price per share (based on net assets of $279,999,657 and 27,907,971 shares of beneficial interest outstanding) | | $ | 10.03 | |
1. August 29, 2014 represents the last business day of the Fund’s 2014 fiscal year. See Note 1 of the accompanying Consolidated Notes.
See accompanying Notes to Consolidated Financial Statements.
46 OPPENHEIMER CAPITAL INCOME FUND
| | | | |
| |
CONSOLIDATED STATEMENT OF OPERATIONS For the Year Ended August 29, 20141 | | |
| | | | |
| | | | |
| | | | |
Allocation of Income and Expenses from Master Fund2 | | | | |
Net investment income allocated from Oppenheimer Master Loan Fund, LLC: | | | | |
Interest | | $ | 11,670,910 | |
Dividends | | | 507,088 | |
Net expenses | | | (733,678 | ) |
Net investment income allocated from Oppenheimer Master Loan Fund, LLC | | | 11,444,320 | |
|
| |
Investment Income | | | | |
Interest (net of foreign withholding taxes of $3,874) | | | 40,359,363 | |
Dividends: | | | | |
Unaffiliated companies (net of foreign withholding taxes of $453,529) | | | 35,650,929 | |
Affiliated companies | | | 318,002 | |
Fee income on when-issued securities | | | 5,637,823 | |
Other income | | | 36,616 | |
Total investment income | | | 82,002,733 | |
|
| |
Expenses | | | | |
Management fees | | | 11,293,055 | |
Distribution and service plan fees: | | | | |
Class A | | | 3,800,785 | |
Class B | | | 309,654 | |
Class C | | | 2,307,594 | |
Class R3 | | | 106,857 | |
Transfer and shareholder servicing agent fees: | | | | |
Class A | | | 3,165,571 | |
Class B | | | 95,615 | |
Class C | | | 473,669 | |
Class I | | | 1,418 | |
Class R3 | | | 50,022 | |
Class Y | | | 320,408 | |
Shareholder communications: | | | | |
Class A | | | 176,130 | |
Class B | | | 9,345 | |
Class C | | | 25,050 | |
Class I | | | 1 | |
Class R3 | | | 2,692 | |
Class Y | | | 9,133 | |
Trustees’ compensation | | | 98,424 | |
Custodian fees and expenses | | | 17,872 | |
Other | | | 314,377 | |
Total expenses | | | 22,577,672 | |
Less waivers and reimbursements of expenses | | | (1,132,197 | ) |
Net expenses | | | 21,445,475 | |
|
| |
Net Investment Income | | | 72,001,578 | |
47 OPPENHEIMER CAPITAL INCOME FUND
| | | | |
| |
CONSOLIDATED STATEMENT OF OPERATIONS Continued | | |
| | | | |
| | | | |
| | | | |
Realized and Unrealized Gain (Loss) | | | | |
Net realized gain (loss) on: | | | | |
Investments from: | | | | |
Unaffiliated companies (includes premiums on options exercised) | | $ | 58,631,133 | |
Affiliated companies | | | 18,161 | |
Closing and expiration of futures contracts | | | (2,510,765 | ) |
Foreign currency transactions | | | 242,372 | |
Swap contracts | | | 4,341,204 | |
Net realized gain allocated from Oppenheimer Master Loan Fund, LLC | | | 405,013 | |
Net realized gain | | | 61,127,118 | |
Net change in unrealized appreciation/depreciation on: | | | | |
Investments | | | 86,723,103 | |
Translation of assets and liabilities denominated in foreign currencies | | | (93,241 | ) |
Futures contracts | | | 290,256 | |
Swap contracts | | | 705,974 | |
Net change in unrealized appreciation/depreciation allocated from: | | | | |
Oppenheimer Master Loan Fund, LLC | | | 28,992 | |
Net change in unrealized appreciation/depreciation | | | 87,655,084 | |
|
| |
Net Increase in Net Assets Resulting from Operations | | $ | 220,783,780 | |
| | | | |
| | | | |
1. August 29, 2014 represents the last business day of the Fund’s 2014 fiscal year. See Note 1 of the accompanying Consolidated Notes.
2. The Fund invests in an affiliated mutual fund that expects to be treated as a partnership for tax purposes. See
Note 1 of the accompanying Consolidated Notes.
3. Effective July 1, 2014, Class N shares were renamed Class R. See Note 1 of the accompanying Consolidated Notes.
See accompanying Notes to Consolidated Financial Statements.
48 OPPENHEIMER CAPITAL INCOME FUND
| | | | |
| |
| CONSOLIDATED STATEMENTS OF CHANGES IN NET ASSETS | | |
| | | | | | | | | | |
| | | Year Ended
August 29, 20141 | | | | | Year Ended
August 30, 20131 | |
Operations | | | | | | | | | | |
Net investment income | | $ | 72,001,578 | | | | | $ | 51,718,078 | |
Net realized gain | | | 61,127,118 | | | | | | 31,841,886 | |
Net change in unrealized appreciation/depreciation | | | 87,655,084 | | | | | | (89,748 | ) |
Net increase in net assets resulting from operations | | | 220,783,780 | | | | | | 83,470,216 | |
| |
Dividends and/or Distributions to Shareholders | | | | | | | | | | |
Dividends from net investment income: | | | | | | | | | | |
Class A | | | (51,014,563 | ) | | | | | (55,849,320 | ) |
Class B | | | (742,478 | ) | | | | | (1,165,599 | ) |
Class C | | | (5,616,817 | ) | | | | | (4,138,579 | ) |
Class I | | | (136,486 | ) | | | | | — | |
Class R2 | | | (644,299 | ) | | | | | (744,207 | ) |
Class Y | | | (4,983,131 | ) | | | | | (2,286,840 | ) |
| | | (63,137,774 | ) | | | | | (64,184,545 | ) |
| |
Beneficial Interest Transactions | | | | | | | | | | |
Net increase (decrease) in net assets resulting from beneficial interest transactions: | | | | | | | | | | |
Class A | | | 93,742,312 | | | | | | 72,138,437 | |
Class B | | | (7,075,925 | ) | | | | | (10,665,127 | ) |
Class C | | | 96,329,387 | | | | | | 69,885,468 | |
Class I | | | 10,640,476 | | | | | | — | |
Class R2 | | | 2,040,556 | | | | | | (1,175,498 | ) |
Class Y | | | 162,382,444 | | | | | | 82,564,617 | |
| | | 358,059,250 | | | | | | 212,747,897 | |
| |
Net Assets | | | | | | | | | | |
| Total increase | | | 515,705,256 | | | | | | 232,033,568 | |
| Beginning of period | | | 1,854,388,907 | | | | | | 1,622,355,339 | |
| | | |
| End of period (including accumulated net investment income of $29,327,913 and $14,141,993, respectively) | | $ | 2,370,094,163 | | | | | $ | 1,854,388,907 | |
| | | | | | | | | | |
| | | | | | | | | | |
1. August 29, 2014 and August 30, 2013 represent the last business days of the Fund’s respective reporting periods. See Note 1 of the accompanying Consolidated Notes.
2. Effective July 1, 2014, Class N shares were renamed Class R. See Note 1 of the accompanying Consolidated Notes.
See accompanying Notes to Consolidated Financial Statements.
49 OPPENHEIMER CAPITAL INCOME FUND
| | | | |
| |
| CONSOLIDATED FINANCIAL HIGHLIGHTS | | |
| | | | | | | | | | | | | | | | | | | | |
| Class A | | Year Ended
August 29,
20141 | | | Year Ended
August 30,
20131 | | | Year Ended
August 31,
2012 | | | Year Ended
August 31,
2011 | | | Year Ended
August 31,
2010 | |
| |
| Per Share Operating Data | | | | | | | | | | | | | | | | | | | | |
| Net asset value, beginning of period | | $ | 9.29 | | | $ | 9.17 | | | $ | 8.70 | | | $ | 8.18 | | | $ | 7.50 | |
| |
| Income (loss) from investment operations: | | | | | | | | | | | | | | | | | | | | |
| Net investment income2 | | | 0.34 | | | | 0.29 | | | | 0.28 | | | | 0.31 | | | | 0.30 | |
| Net realized and unrealized gain | | | 0.71 | | | | 0.19 | | | | 0.54 | | | | 0.58 | | | | 0.53 | |
| | | | |
| Total from investment operations | | | 1.05 | | | | 0.48 | | | | 0.82 | | | | 0.89 | | | | 0.83 | |
| |
| Dividends and/or distributions to shareholders: | | | | | | | | | | | | | | | | | | | | |
| Dividends from net investment income | | | (0.31 | ) | | | (0.36 | ) | | | (0.35 | ) | | | (0.37 | ) | | | (0.15 | ) |
| |
| Net asset value, end of period | | $ | 10.03 | | | $ | 9.29 | | | $ | 9.17 | | | $ | 8.70 | | | $ | 8.18 | |
| | | | |
| |
| Total Return, at Net Asset Value3 | | | 11.44% | | | | 5.30% | | | | 9.69% | | | | 11.06% | | | | 11.13% | |
| |
| Ratios/Supplemental Data | | | | | | | | | | | | | | | | | | | | |
| Net assets, end of period (in thousands) | | $ | 1,730,245 | | | $ | 1,512,076 | | | $ | 1,422,232 | | | $ | 1,423,082 | | | $ | 1,450,829 | |
| |
| Average net assets (in thousands) | | $ | 1,627,867 | | | $ | 1,468,782 | | | $ | 1,400,955 | | | $ | 1,486,145 | | | $ | 1,512,770 | |
| |
| Ratios to average net assets:4 | | | | | | | | | | | | | | | | | | | | |
| Net investment income | | | 3.55% | 5 | | | 3.07% | 5 | | | 3.18% | 5 | | | 3.55% | 5 | | | 3.75% | |
| Total expenses6 | | | 1.04% | 5 | | | 0.98% | 5 | | | 1.00% | 5 | | | 0.99% | 5 | | | 1.02% | |
| Expenses after payments, waivers and/or reimbursements and reduction to custodian expenses | | | 0.98% | 5 | | | 0.93% | 5 | | | 0.96% | 5 | | | 0.96% | 5 | | | 0.90% | |
| |
| Portfolio turnover rate7 | | | 93% | | | | 84% | | | | 80% | | | | 92% | | | | 77% | |
1. August 29, 2014 and August 30, 2013 represent the last business days of the Fund’s respective reporting periods. See Note 1 of the accompanying Consolidated Notes.
2. Per share amounts calculated based on the average shares outstanding during the period.
3. Assumes an initial investment on the business day before the first day of the fiscal period, with all dividends and distributions reinvested in additional shares on the reinvestment date, and redemption at the net asset value calculated on the last business day of the fiscal period. Sales charges are not reflected in the total returns. Total returns are not annualized for periods less than one full year. Returns do not reflect the deduction of taxes that a shareholder would pay on fund distributions or the redemption of fund shares.
4. Annualized for periods less than one full year.
5. Includes the Fund’s share of the allocated expenses and/or net investment income from Oppenheimer Master Loan Fund, LLC.
6. Total expenses including indirect expenses from affiliated funds were as follows:
| | | | | | |
| | Year Ended August 29, 2014 | | | 1.06 | % |
| | Year Ended August 30, 2013 | | | 1.00 | % |
| | Year Ended August 31, 2012 | | | 1.02 | % |
| | Year Ended August 31, 2011 | | | 1.01 | % |
| | Year Ended August 31, 2010 | | | 1.04 | % |
7. The portfolio turnover rate excludes purchase and sale transactions of To Be Announced (TBA) mortgage-related securities as follows:
| | | | | | | | | | |
| | | | | Purchase Transactions | | | Sale Transactions | |
| | | |
| | Year Ended August 29, 2014 | | | $2,958,051,509 | | | | $2,894,379,022 | |
| | Year Ended August 30, 2013 | | | $3,481,764,612 | | | | $3,521,818,336 | |
| | Year Ended August 31, 2012 | | | $3,053,290,246 | | | | $3,030,115,715 | |
| | Year Ended August 31, 2011 | | | $3,228,874,778 | | | | $3,180,407,334 | |
| | Year Ended August 31, 2010 | | | $3,224,346,084 | | | | $3,374,267,286 | |
See accompanying Notes to Consolidated Financial Statements.
50 OPPENHEIMER CAPITAL INCOME FUND
| | | | | | | | | | | | | | | | | | | | |
| Class B | | Year Ended
August 29,
20141 | | | Year Ended August 30,
20131 | | | Year Ended
August 31,
2012 | | | Year Ended
August 31,
2011 | | | Year Ended
August 31,
2010 | |
| |
| Per Share Operating Data | | | | | | | | | | | | | | | | | | | | |
| Net asset value, beginning of period | | $ | 9.09 | | | $ | 8.98 | | | $ | 8.51 | | | $ | 8.01 | | | $ | 7.36 | |
| |
| Income (loss) from investment operations: | | | | | | | | | | | | | | | | | | | | |
| Net investment income2 | | | 0.26 | | | | 0.19 | | | | 0.19 | | | | 0.22 | | | | 0.22 | |
| Net realized and unrealized gain | | | 0.68 | | | | 0.19 | | | | 0.54 | | | | 0.57 | | | | 0.52 | |
| | | | |
| Total from investment operations | | | 0.94 | | | | 0.38 | | | | 0.73 | | | | 0.79 | | | | 0.74 | |
| |
| Dividends and/or distributions to shareholders: | | | | | | | | | | | | | | | | | | | | |
| Dividends from net investment income | | | (0.22 | ) | | | (0.27 | ) | | | (0.26 | ) | | | (0.29 | ) | | | (0.09 | ) |
| |
| Net asset value, end of period | | $ | 9.81 | | | $ | 9.09 | | | $ | 8.98 | | | $ | 8.51 | | | $ | 8.01 | |
| | | | |
| |
| Total Return, at Net Asset Value3 | | | 10.48% | | | | 4.24% | | | | 8.80% | | | | 9.94% | | | | 10.05% | |
| |
| Ratios/Supplemental Data | | | | | | | | | | | | | | | | | | | | |
| Net assets, end of period (in thousands) | | $ | 29,021 | | | $ | 33,683 | | | $ | 43,790 | | | $ | 50,221 | | | $ | 65,079 | |
| |
| Average net assets (in thousands) | | $ | 30,985 | | | $ | 38,619 | | | $ | 45,562 | | | $ | 60,410 | | | $ | 75,369 | |
| |
| Ratios to average net assets:4 | | | | | | | | | | | | | | | | | | | | |
| Net investment income | | | 2.70% | 5 | | | 2.10% | 5 | | | 2.20% | 5 | | | 2.55% | 5 | | | 2.81% | |
| Total expenses6 | | | 1.94% | 5 | | | 2.07% | 5 | | | 2.12% | 5 | | | 2.12% | 5 | | | 2.14% | |
| Expenses after payments, waivers and/or reimbursements and reduction to custodian expenses | | | 1.83% | 5 | | | 1.94% | 5 | | | 1.94% | 5 | | | 1.97% | 5 | | | 1.85% | |
| |
| Portfolio turnover rate7 | | | 93% | | | | 84% | | | | 80% | | | | 92% | | | | 77% | |
1. August 29, 2014 and August 30, 2013 represent the last business days of the Fund’s respective reporting periods. See Note 1 of the accompanying Consolidated Notes.
2. Per share amounts calculated based on the average shares outstanding during the period.
3. Assumes an initial investment on the business day before the first day of the fiscal period, with all dividends and distributions reinvested in additional shares on the reinvestment date, and redemption at the net asset value calculated on the last business day of the fiscal period. Sales charges are not reflected in the total returns. Total returns are not annualized for periods less than one full year. Returns do not reflect the deduction of taxes that a shareholder would pay on fund distributions or the redemption of fund shares.
4. Annualized for periods less than one full year.
5. Includes the Fund’s share of the allocated expenses and/or net investment income from Oppenheimer Master Loan Fund, LLC.
6. Total expenses including indirect expenses from affiliated funds were as follows:
| | | | | | |
| | Year Ended August 29, 2014 | | | 1.96 | % |
| | Year Ended August 30, 2013 | | | 2.09 | % |
| | Year Ended August 31, 2012 | | | 2.14 | % |
| | Year Ended August 31, 2011 | | | 2.14 | % |
| | Year Ended August 31, 2010 | | | 2.16 | % |
7. The portfolio turnover rate excludes purchase and sale transactions of To Be Announced (TBA) mortgage-related securities as follows:
| | | | | | | | | | |
| | | | | Purchase Transactions | | | Sale Transactions | |
| | | |
| | Year Ended August 29, 2014 | | | $2,958,051,509 | | | | $2,894,379,022 | |
| | Year Ended August 30, 2013 | | | $3,481,764,612 | | | | $3,521,818,336 | |
| | Year Ended August 31, 2012 | | | $3,053,290,246 | | | | $3,030,115,715 | |
| | Year Ended August 31, 2011 | | | $3,228,874,778 | | | | $3,180,407,334 | |
| | Year Ended August 31, 2010 | | | $3,224,346,084 | | | | $3,374,267,286 | |
See accompanying Notes to Consolidated Financial Statements.
51 OPPENHEIMER CAPITAL INCOME FUND
| | | | |
| |
| CONSOLIDATED FINANCIAL HIGHLIGHTS Continued | | |
| | | | | | | | | | | | | | | | | | | | |
| Class C | | Year Ended
August 29,
20141 | | | Year Ended
August 30,
20131 | | | Year Ended
August 31,
2012 | | | Year Ended
August 31,
2011 | | | Year Ended
August 31,
2010 | |
| |
| Per Share Operating Data | | | | | | | | | | | | | | | | | | | | |
| Net asset value, beginning of period | | $ | 9.03 | | | $ | 8.93 | | | $ | 8.47 | | | $ | 7.98 | | | $ | 7.33 | |
| |
| Income (loss) from investment operations: | | | | | | | | | | | | | | | | | | | | |
| Net investment income2 | | | 0.26 | | | | 0.20 | | | | 0.20 | | | | 0.23 | | | | 0.23 | |
| Net realized and unrealized gain | | | 0.69 | | | | 0.19 | | | | 0.53 | | | | 0.56 | | | | 0.52 | |
| | | | |
| Total from investment operations | | | 0.95 | | | | 0.39 | | | | 0.73 | | | | 0.79 | | | | 0.75 | |
| |
| Dividends and/or distributions to shareholders: | | | | | | | | | | | | | | | | | | | | |
| Dividends from net investment income | | | (0.24 | ) | | | (0.29 | ) | | | (0.27 | ) | | | (0.30 | ) | | | (0.10 | ) |
| |
| Net asset value, end of period | | $ | 9.74 | | | $ | 9.03 | | | $ | 8.93 | | | $ | 8.47 | | | $ | 7.98 | |
| | | | |
| |
| Total Return, at Net Asset Value3 | | | 10.66% | | | | 4.41% | | | | 8.91% | | | | 10.00% | | | | 10.19% | |
| |
| Ratios/Supplemental Data | | | | | | | | | | | | | | | | | | | | |
| Net assets, end of period (in thousands) | | $ | 296,136 | | | $ | 182,920 | | | $ | 112,220 | | | $ | 98,566 | | | $ | 100,299 | |
| |
| Average net assets (in thousands) | | $ | 230,619 | | | $ | 140,184 | | | $ | 101,423 | | | $ | 102,156 | | | $ | 106,999 | |
| |
| Ratios to average net assets:4 | | | | | | | | | | | | | | | | | | | | |
| Net investment income | | | 2.76% | 5 | | | 2.24% | 5 | | | 2.32% | 5 | | | 2.67% | 5 | | | 2.88% | |
| Total expenses6 | | | 1.82% | 5 | | | 1.80% | 5 | | | 1.86% | 5 | | | 1.87% | 5 | | | 1.89% | |
| Expenses after payments, waivers and/or reimbursements and reduction to custodian expenses | | | 1.76% | 5 | | | 1.75% | 5 | | | 1.82% | 5 | | | 1.84% | 5 | | | 1.77% | |
| |
| Portfolio turnover rate7 | | | 93% | | | | 84% | | | | 80% | | | | 92% | | | | 77% | |
1. August 29, 2014 and August 30, 2013 represent the last business days of the Fund’s respective reporting periods. See Note 1 of the accompanying Consolidated Notes.
2. Per share amounts calculated based on the average shares outstanding during the period.
3. Assumes an initial investment on the business day before the first day of the fiscal period, with all dividends and distributions reinvested in additional shares on the reinvestment date, and redemption at the net asset value calculated on the last business day of the fiscal period. Sales charges are not reflected in the total returns. Total returns are not annualized for periods less than one full year. Returns do not reflect the deduction of taxes that a shareholder would pay on fund distributions or the redemption of fund shares.
4. Annualized for periods less than one full year.
5. Includes the Fund’s share of the allocated expenses and/or net investment income from Oppenheimer Master Loan Fund, LLC.
6. Total expenses including indirect expenses from affiliated funds were as follows:
| | | | | | |
| | Year Ended August 29, 2014 | | | 1.84 | % |
| | Year Ended August 30, 2013 | | | 1.82 | % |
| | Year Ended August 31, 2012 | | | 1.88 | % |
| | Year Ended August 31, 2011 | | | 1.89 | % |
| | Year Ended August 31, 2010 | | | 1.91 | % |
7. The portfolio turnover rate excludes purchase and sale transactions of To Be Announced (TBA) mortgage-related securities as follows:
| | | | | | | | | | |
| | | | | Purchase Transactions | | | Sale Transactions | |
| | | |
| | Year Ended August 29, 2014 | | | $2,958,051,509 | | | | $2,894,379,022 | |
| | Year Ended August 30, 2013 | | | $3,481,764,612 | | | | $3,521,818,336 | |
| | Year Ended August 31, 2012 | | | $3,053,290,246 | | | | $3,030,115,715 | |
| | Year Ended August 31, 2011 | | | $3,228,874,778 | | | | $3,180,407,334 | |
| | Year Ended August 31, 2010 | | | $3,224,346,084 | | | | $3,374,267,286 | |
See accompanying Notes to Consolidated Financial Statements.
52 OPPENHEIMER CAPITAL INCOME FUND
| | | | | | | | | | | | |
| Class I | | Period Ended
August 29,
20141,2 | | | | | | | | | |
| | | | | | |
Per Share Operating Data | | | | | | | | | | | | |
| Net asset value, beginning of period | | $ | 9.60 | | | | | | | | | |
| | | | | | |
| Income (loss) from investment operations: | | | | | | | | | | | | |
Net investment income3 | | | 0.26 | | | | | | | | | |
Net realized and unrealized gain | | | 0.31 | | | | | | | | | |
| | | | | | | | | |
Total from investment operations | | | 0.57 | | | | | | | | | |
| | | | | | |
Dividends and/or distributions to shareholders: | | | | | | | | | | | | |
Dividends from net investment income | | | (0.14 | ) | | | | | | | | |
| | | | | | |
Net asset value, end of period | | $ | 10.03 | | | | | | | | | |
| | | | | | | | | |
| | | | | | |
| Total Return, at Net Asset Value4 | | | 6.01% | | | | | | | | | |
| | | | | | |
| Ratios/Supplemental Data | | | | | | | | | | | | |
Net assets, end of period (in thousands) | | $ | 10,894 | | | | | | | | | |
| | | | | | |
| Average net assets (in thousands) | | $ | 7,047 | | | | | | | | | |
| | | | | | |
| Ratios to average net assets:5 | | | | | | | | | | | | |
| Net investment income | | | 3.87% | 6 | | | | | | | | |
| Total expenses7 | | | 0.64% | 6 | | | | | | | | |
| Expenses after payments, waivers and/or reimbursements and reduction to custodian expenses | | | 0.58% | 6 | | | | | | | | |
| | | | | | |
| Portfolio turnover rate8 | | | 93% | | | | | | | | | |
1. For the period from December 27, 2013 (inception of offering) to August 29, 2014.
2. August 29, 2014 represents the last business day of the Fund’s reporting period. See Note 1 of the accompanying Consolidated Notes.
3. Per share amounts calculated based on the average shares outstanding during the period.
4. Assumes an initial investment on the business day before the first day of the fiscal period, with all dividends and distributions reinvested in additional shares on the reinvestment date, and redemption at the net asset value calculated on the last business day of the fiscal period. Sales charges are not reflected in the total returns. Total returns are not annualized for periods less than one full year. Returns do not reflect the deduction of taxes that a shareholder would pay on fund distributions or the redemption of fund shares.
5. Annualized for periods less than one full year.
6. Includes the Fund’s share of the allocated expenses and/or net investment income from Oppenheimer Master Loan Fund, LLC.
7. Total expenses including indirect expenses from affiliated funds were as follows:
| | | | | | |
| | Period Ended August 29, 2014 | | | 0.66 | % |
8. The portfolio turnover rate excludes purchase and sale transactions of To Be Announced (TBA) mortgage-related securities as follows:
| | | | | | | | | | |
| | | | | Purchase Transactions | | | Sale Transactions | |
| | | |
| | Period Ended August 29, 2014 | | | $2,958,051,509 | | | | $2,894,379,022 | |
See accompanying Notes to Consolidated Financial Statements.
53 OPPENHEIMER CAPITAL INCOME FUND
| | |
| |
| CONSOLIDATED FINANCIAL HIGHLIGHTS Continued | | |
| | | | | | | | | | | | | | | | | | | | |
| Class R | | Year Ended
August 29,
20141 | | | Year Ended
August 30,
20131 | | | Year Ended
August 31, 2012 | | | Year Ended
August 31,
2011 | | | Year Ended
August 31,
2010 | |
| |
Per Share Operating Data | | | | | | | | | | | | | | | | | | | | |
Net asset value, beginning of period | | $ | 9.18 | | | $ | 9.07 | | | $ | 8.60 | | | $ | 8.09 | | | $ | 7.42 | |
| |
Income (loss) from investment operations: | | | | | | | | | | | | | | | | | | | | |
Net investment income2 | | | 0.31 | | | | 0.25 | | | | 0.25 | | | | 0.27 | | | | 0.27 | |
Net realized and unrealized gain | | | 0.70 | | | | 0.19 | | | | 0.54 | | | | 0.58 | | | | 0.52 | |
| | | | |
Total from investment operations | | | 1.01 | | | | 0.44 | | | | 0.79 | | | | 0.85 | | | | 0.79 | |
| |
Dividends and/or distributions to shareholders: | | | | | | | | | | | | | | | | | | | | |
Dividends from net investment income | | | (0.28 | ) | | | (0.33 | ) | | | (0.32 | ) | | | (0.34 | ) | | | (0.12 | ) |
| | | | |
Net asset value, end of period | | $ | 9.91 | | | $ | 9.18 | | | $ | 9.07 | | | $ | 8.60 | | | $ | 8.09 | |
| | | | |
|
| |
Total Return, at Net Asset Value3 | | | 11.15% | | | | 4.89% | | | | 9.44% | | | | 10.65% | | | | 10.74% | |
|
| |
Ratios/Supplemental Data | | | | | | | | | | | | | | | | | | | | |
Net assets, end of period (in thousands) | | $ | 23,798 | | | $ | 20,075 | | | $ | 20,994 | | | $ | 20,319 | | | $ | 22,533 | |
| |
Average net assets (in thousands) | | $ | 22,251 | | | $ | 20,943 | | | $ | 20,340 | | | $ | 22,331 | | | $ | 24,365 | |
| |
Ratios to average net assets:4 | | | | | | | | | | | | | | | | | | | | |
Net investment income | | | 3.27% | 5 | | | 2.73% | 5 | | | 2.84% | 5 | | | 3.18% | 5 | | | 3.37% | |
Total expenses6 | | | 1.32% | 5 | | | 1.33% | 5 | | | 1.34% | 5 | | | 1.35% | 5 | | | 1.42% | |
| Expenses after payments, waivers and/or reimbursements and reduction to custodian expenses | | | 1.26% | 5 | | | 1.28% | 5 | | | 1.30% | 5 | | | 1.32% | 5 | | | 1.28% | |
| |
Portfolio turnover rate7 | | | 93% | | | | 84% | | | | 80% | | | | 92% | | | | 77% | |
1. August 29, 2014 and August 30, 2013 represent the last business days of the Fund’s respective reporting periods. See Note 1 of the accompanying Consolidated Notes.
2. Per share amounts calculated based on the average shares outstanding during the period.
3. Assumes an initial investment on the business day before the first day of the fiscal period, with all dividends and distributions reinvested in additional shares on the reinvestment date, and redemption at the net asset value calculated on the last business day of the fiscal period. Sales charges are not reflected in the total returns. Total returns are not annualized for periods less than one full year. Returns do not reflect the deduction of taxes that a shareholder would pay on fund distributions or the redemption of fund shares.
4. Annualized for periods less than one full year.
5. Includes the Fund’s share of the allocated expenses and/or net investment income from Oppenheimer Master Loan Fund, LLC.
6. Total expenses including indirect expenses from affiliated funds were as follows:
| | | | | | |
| | Year Ended August 29, 2014 | | | 1.34 | % |
| | Year Ended August 30, 2013 | | | 1.35 | % |
| | Year Ended August 31, 2012 | | | 1.36 | % |
| | Year Ended August 31, 2011 | | | 1.37 | % |
| | Year Ended August 31, 2010 | | | 1.44 | % |
7. The portfolio turnover rate excludes purchase and sale transactions of To Be Announced (TBA) mortgage-related securities as follows:
| | | | | | | | | | |
| | | | | Purchase Transactions | | | Sale Transactions | |
| | | |
| | Year Ended August 29, 2014 | | | $2,958,051,509 | | | | $2,894,379,022 | |
| | Year Ended August 30, 2013 | | | $3,481,764,612 | | | | $3,521,818,336 | |
| | Year Ended August 31, 2012 | | | $3,053,290,246 | | | | $3,030,115,715 | |
| | Year Ended August 31, 2011 | | | $3,228,874,778 | | | | $3,180,407,334 | |
| | Year Ended August 31, 2010 | | | $3,224,346,084 | | | | $3,374,267,286 | |
See accompanying Notes to Consolidated Financial Statements.
54 OPPENHEIMER CAPITAL INCOME FUND
| | | | | | | | | | | | | | | | |
| Class Y | | Year Ended
August 29,
20141 | | | Year Ended
August 30,
20131 | | | Year Ended
August 31,
2012 | | | Period Ended
August 31,
20112 | |
| |
Per Share Operating Data | | | | | | | | | | | | | | | | |
Net asset value, beginning of period | | $ | 9.29 | | | $ | 9.18 | | | $ | 8.70 | | | $ | 8.63 | |
| |
Income (loss) from investment operations: | | | | | | | | | | | | | | | | |
Net investment income3 | | | 0.37 | | | | 0.30 | | | | 0.30 | | | | 0.21 | |
Net realized and unrealized gain | | | 0.70 | | | | 0.19 | | | | 0.55 | | | | 0.00 | 4 |
| | | | |
Total from investment operations | | | 1.07 | | | | 0.49 | | | | 0.85 | | | | 0.21 | |
| |
Dividends and/or distributions to shareholders: | | | | | | | | | | | | | | | | |
Dividends from net investment income | | | (0.33 | ) | | | (0.38 | ) | | | (0.37 | ) | | | (0.14 | ) |
| |
Net asset value, end of period | | $ | 10.03 | | | $ | 9.29 | | | $ | 9.18 | | | $ | 8.70 | |
| | | | |
|
| |
Total Return, at Net Asset Value5 | | | 11.74% | | | | 5.49% | | | | 10.17% | | | | 2.44% | |
|
| |
Ratios/Supplemental Data | | | | | | | | | | | | | | | | |
Net assets, end of period (in thousands) | | $ | 280,000 | | | $ | 105,635 | | | $ | 23,119 | | | $ | 4,890 | |
| |
Average net assets (in thousands) | | $ | 162,609 | | | $ | 63,500 | | | $ | 7,746 | | | $ | 3,287 | |
| |
Ratios to average net assets:6,7 | | | | | | | | | | | | | | | | |
Net investment income | | | 3.77% | | | | 3.27% | | | | 3.46% | | | | 4.04% | |
Total expenses8 | | | 0.81% | | | | 0.72% | | | | 0.69% | | | | 0.59% | |
| Expenses after payments, waivers and/or reimbursements and reduction to custodian expenses | | | 0.75% | | | | 0.67% | | | | 0.65% | | | | 0.56% | |
| |
Portfolio turnover rate9 | | | 93% | | | | 84% | | | | 80% | | | | 92% | |
1. August 29, 2014 and August 30, 2013 represent the last business days of the Fund’s respective reporting periods. See Note 1 of the accompanying Consolidated Notes.
2. For the period from January 28, 2011 (inception of offering) to August 31, 2011.
3. Per share amounts calculated based on the average shares outstanding during the period.
4. Less than $0.005 per share.
5. Assumes an initial investment on the business day before the first day of the fiscal period, with all dividends and distributions reinvested in additional shares on the reinvestment date, and redemption at the net asset value calculated on the last business day of the fiscal period. Sales charges are not reflected in the total returns. Total returns are not annualized for periods less than one full year. Returns do not reflect the deduction of taxes that a shareholder would pay on fund distributions or the redemption of fund shares.
6. Annualized for periods less than one full year.
7. Includes the Fund’s share of the allocated expenses and/or net investment income from Oppenheimer Master Loan Fund, LLC.
8. Total expenses including indirect expenses from affiliated funds were as follows:
| | | | | | |
| | Year Ended August 29, 2014 | | | 0.83 | % |
| | Year Ended August 30, 2013 | | | 0.74 | % |
| | Year Ended August 31, 2012 | | | 0.71 | % |
| | Period Ended August 31, 2011 | | | 0.61 | % |
9. The portfolio turnover rate excludes purchase and sale transactions of To Be Announced (TBA) mortgage-related securities as follows:
| | | | | | | | | | |
| | | | | Purchase Transactions | | | Sale Transactions | |
| | | |
| | Year Ended August 29, 2014 | | | $2,958,051,509 | | | | $2,894,379,022 | |
| | Year Ended August 30, 2013 | | | $3,481,764,612 | | | | $3,521,818,336 | |
| | Year Ended August 31, 2012 | | | $3,053,290,246 | | | | $3,030,115,715 | |
| | Period Ended August 31, 2011 | | | $3,228,874,778 | | | | $3,180,407,334 | |
See accompanying Notes to Consolidated Financial Statements.
55 OPPENHEIMER CAPITAL INCOME FUND
| | | | |
| |
NOTES TO CONSOLIDATED FINANCIAL STATEMENTS August 29, 2014 | | |
| | |
| 1. Significant Accounting Policies | | |
Oppenheimer Capital Income Fund (the “Fund”) is a diversified open-end management investment company registered under the Investment Company Act of 1940, as amended. The Fund’s investment objective is to seek total return. The Fund’s investment adviser is OFI Global Asset Management, Inc. (“OFI Global” or the “Manager”), a wholly-owned subsidiary of OppenheimerFunds, Inc. (“OFI” or the “Sub-Adviser”). The Manager has entered into a sub-advisory agreement with OFI.
The Fund offers Class A, Class C, Class I, Class R and Class Y shares, and previously offered Class B shares for new purchase through June 29, 2012. Subsequent to that date, no new purchases of Class B shares are permitted, however reinvestment of dividend and/or capital gain distributions and exchanges of Class B shares into and from other Oppenheimer funds will be allowed. As of July 1, 2014, Class N shares were renamed Class R shares. Class N shares subject to a contingent deferred sales charge (“CDSC”) on July 1, 2014, will continue to be subject to a CDSC after the shares are renamed. Purchases of Class R shares occurring on or after July 1, 2014, will not be subject to a CDSC upon redemption. Class A shares are sold at their offering price, which is normally net asset value plus a front-end sales charge. Class C and Class R shares are sold, and Class B shares were sold, without a front-end sales charge but may be subject to a CDSC. Class R shares are sold only through retirement plans. Retirement plans that offer Class R shares may impose charges on those accounts. Class I and Class Y shares are sold to certain institutional investors or intermediaries without either a front-end sales charge or a CDSC, however, the intermediaries may impose charges on their accountholders who beneficially own Class I and Class Y shares. All classes of shares have identical rights and voting privileges with respect to the Fund in general and exclusive voting rights on matters that affect that class alone. Earnings, net assets and net asset value per share may differ due to each class having its own expenses, such as transfer and shareholder servicing agent fees and shareholder communications, directly attributable to that class. Class A, B, C and R shares have separate distribution and/or service plans under which they pay fees. Class I and Class Y shares do not pay such fees. Class B shares will automatically convert to Class A shares 72 months after the date of purchase.
The following is a summary of significant accounting policies consistently followed by the Fund.
Annual Periods. The last day of the Fund’s fiscal years was the last day the New York Stock Exchange was open for trading. The Fund’s consolidated financial statements have been presented through that date to maintain consistency with the Fund’s net asset value calculations used for shareholder transactions.
Securities on a When-Issued or Delayed Delivery Basis. The Fund may purchase securities on a “when-issued” basis, and may purchase or sell securities on a “delayed delivery” basis. “When-issued” or “delayed delivery” refers to securities whose terms and indenture are available and for which a market exists, but which are not available for immediate delivery. Delivery and payment for securities that have been purchased by the Fund
56 OPPENHEIMER CAPITAL INCOME FUND
| | | | |
| | |
| | | | |
| | |
| 1. Significant Accounting Policies (Continued) | | |
on a when-issued basis normally takes place within six months and possibly as long as two years or more after the trade date. During this period, such securities do not earn interest, are subject to market fluctuation and may increase or decrease in value prior to their delivery. The purchase of securities on a when-issued basis may increase the volatility of the Fund’s net asset value to the extent the Fund executes such transactions while remaining substantially fully invested. When the Fund engages in when-issued or delayed delivery transactions, it relies on the buyer or seller, as the case may be, to complete the transaction. Their failure to do so may cause the Fund to lose the opportunity to obtain or dispose of the security at a price and yield it considers advantageous. The Fund may also sell securities that it purchased on a when-issued basis or forward commitment prior to settlement of the original purchase.
As of August 29, 2014, the Fund had purchased securities issued on a when-issued or delayed delivery basis and sold securities issued on a delayed delivery basis as follows:
| | |
| | | When-Issued or
Delayed Delivery
Basis Transactions |
Purchased securities | | $221,521,597 |
Sold securities | | 16,261,002 |
The Fund may enter into “forward roll” transactions with respect to mortgage-related securities. In this type of transaction, the Fund sells a mortgage-related security to a buyer and simultaneously agrees to repurchase a similar security (same type, coupon and maturity) at a later date at a set price. During the period between the sale and the repurchase, the Fund will not be entitled to receive interest and principal payments on the securities that have been sold. The Fund records the incremental difference between the forward purchase and sale of each forward roll as realized gain (loss) on investments or as fee income in the case of such transactions that have an associated fee in lieu of a difference in the forward purchase and sale price.
Forward roll transactions may be deemed to entail embedded leverage since the Fund purchases mortgage-related securities with extended settlement dates rather than paying for the securities under a normal settlement cycle. This embedded leverage increases the Fund’s market value of investments relative to its net assets which can incrementally increase the volatility of the Fund’s performance. Forward roll transactions can be replicated over multiple settlement periods.
Risks of entering into forward roll transactions include the potential inability of the counterparty to meet the terms of the agreement; the potential of the Fund to receive inferior securities at redelivery as compared to the securities sold to the counterparty; and counterparty credit risk.
Basis for Consolidation. The Fund has established a Cayman Islands exempted company, Oppenheimer Capital Income Fund (Cayman) Ltd. (the “Subsidiary”), which is wholly-owned and controlled by the Fund. The Fund and Subsidiary are both managed by the Manager. The Fund may invest up to 25% of its total assets in the Subsidiary. The Subsidiary invests
57 OPPENHEIMER CAPITAL INCOME FUND
| | | | |
| |
NOTES TO CONSOLIDATED FINANCIAL STATEMENTS Continued | | |
| | |
| 1. Significant Accounting Policies (Continued) | | |
primarily in commodity-linked derivatives (including commodity futures, financial futures, options and swap contracts) and exchange-traded funds related to gold or other special minerals. The Subsidiary may also invest in certain fixed-income securities and other investments that may serve as margin or collateral for its derivatives positions. Investments in the Subsidiary are expected to provide the Fund with exposure to commodities markets within the limitations of the federal tax requirements that apply to the Fund. The Subsidiary is subject to the same investment restrictions and guidelines, and follows the same compliance policies and procedures, as the Fund.
The consolidated financial statements have been consolidated and include accounts of the Fund and the Subsidiary. Accordingly, all inter-company transactions and balances have been eliminated. At August 29, 2014, the Fund owned 7,500 shares with a market value of $19,192,930.
Investment in Oppenheimer Institutional Money Market Fund. The Fund is permitted to invest daily available cash balances in an affiliated money market fund. The Fund may invest the available cash in Class E shares of Oppenheimer Institutional Money Market Fund (“IMMF”) to seek current income while preserving liquidity. IMMF is a registered open-end management investment company, regulated as a money market fund under the Investment Company Act of 1940, as amended. The Manager is the investment adviser of IMMF, and the Sub-Adviser provides investment and related advisory services to IMMF. When applicable, the Fund’s investment in IMMF is included in the Consolidated Statement of Investments. Shares of IMMF are valued at their net asset value per share. As a shareholder, the Fund is subject to its proportional share of IMMF’s Class E expenses, including its management fee. The Manager will waive fees and/or reimburse Fund expenses in an amount equal to the indirect management fees incurred through the Fund’s investment in IMMF.
Investment in Oppenheimer Master Fund. The Fund is permitted to invest in entities sponsored and/or advised by the Manager or an affiliate. Certain of these entities in which the Fund invests are mutual funds registered under the Investment Company Act of 1940 that expect to be treated as partnerships for tax purposes, specifically Oppenheimer Master Loan Fund, LLC (the “Master Fund”). The Master Fund has its own investment risks, and those risks can affect the value of the Fund’s investments and therefore the value of the Fund’s shares. To the extent that the Fund invests more of its assets in the Master Fund, the Fund will have greater exposure to the risks of the Master Fund.
The investment objective of the Master Fund is to seek income. The Fund’s investment in the Master Fund is included in the Consolidated Statement of Investments. The Fund recognizes income and gain/(loss) on its investment in the master fund according to its allocated pro-rata share, based on its relative proportion of total outstanding Master Fund shares held, of the total net income earned and the net gain/(loss) realized on investments sold by the Master Fund. As a shareholder, the Fund is subject to its proportional share of the Master Fund’s expenses, including its management fee. The Manager will waive fees and/or reimburse Fund expenses in an amount equal to the indirect management fees incurred through the Fund’s investment in the Master Fund.
58 OPPENHEIMER CAPITAL INCOME FUND
| | | | |
| | |
| | | | |
| | |
| 1. Significant Accounting Policies (Continued) | | |
Foreign Currency Translation. The Fund’s accounting records are maintained in U.S. dollars. The values of securities denominated in foreign currencies and amounts related to the purchase and sale of foreign securities and foreign investment income are translated into U.S. dollars as of the close of the New York Stock Exchange (the “Exchange”), normally 4:00 P.M. Eastern time, on each day the Exchange is open for trading. Foreign exchange rates may be valued primarily using a reliable bank, dealer or service authorized by the Board of Trustees.
Reported net realized gains and losses from foreign currency transactions arise from sales of portfolio securities, sales and maturities of short-term securities, sales of foreign currencies, exchange rate fluctuations between the trade and settlement dates on securities transactions, and the difference between the amounts of dividends, interest, and foreign withholding taxes recorded on the Fund’s books and the U.S. dollar equivalent of the amounts actually received or paid. Net unrealized appreciation and depreciation on the translation of assets and liabilities denominated in foreign currencies arise from changes in the values of assets and liabilities, including investments in securities at fiscal period end, resulting from changes in exchange rates.
The effect of changes in foreign currency exchange rates on investments is separately identified from the fluctuations arising from changes in market values of securities held and reported with all other foreign currency gains and losses in the Fund’s Consolidated Statement of Operations.
Allocation of Income, Expenses, Gains and Losses. Income, expenses (other than those attributable to a specific class), gains and losses are allocated on a daily basis to each class of shares based upon the relative proportion of net assets represented by such class. Operating expenses directly attributable to a specific class are charged against the operations of that class.
Federal Taxes. The Fund intends to comply with provisions of the Internal Revenue Code applicable to regulated investment companies and to distribute substantially all of its investment company taxable income, including any net realized gain on investments not offset by capital loss carryforwards, if any, to shareholders. Therefore, no federal income or excise tax provision is required. The Fund files income tax returns in U.S. federal and applicable state jurisdictions. The statute of limitations on the Fund’s tax return filings generally remain open for the three preceding fiscal reporting period ends.
Subchapter M requires, among other things, that at least 90% of the Fund’s gross income be derived from securities or derived with respect to its business of investing in securities (typically referred to as “qualifying income”). Income from commodity-linked derivatives may not be treated as “qualifying income” for purposes of the 90% gross income requirement. The Internal Revenue Service (IRS) has previously issued a number of private letter rulings which conclude that income derived from commodity index-linked notes and investments in a wholly-owned subsidiary will be “qualifying income.” As a result, the Fund will gain exposure to commodities through commodity-linked notes and its wholly-owned subsidiary.
59 OPPENHEIMER CAPITAL INCOME FUND
| | |
| |
NOTES TO CONSOLIDATED FINANCIAL STATEMENTS Continued | | |
| | |
| 1. Significant Accounting Policies (Continued) | | |
The IRS has suspended the granting of private letter rulings pending further review. As a result, there can be no assurance that the IRS will not change its position with respect to commodity-linked notes and wholly-owned subsidiaries. In addition, future legislation and guidance from Treasury and the IRS may adversely affect the fund’s ability to gain exposure to commodities through commodity-linked notes and its wholly-owned subsidiary.
The Fund is required to include in income for federal income tax purposes all of the subsidiary’s net income and gains whether or not such income is distributed by the subsidiary. Net income and gains from the subsidiary are generally treated as ordinary income by the Fund, regardless of the character of the subsidiary’s underlying income. Net losses from the subsidiary do not pass through to the Fund for federal income tax purposes.
The tax components of capital shown in the following table represent distribution requirements the Fund must satisfy under the income tax regulations, losses the Fund may be able to offset against income and gains realized in future years and unrealized appreciation or depreciation of securities and other investments for federal income tax purposes.
| | | | | | | | | | |
Undistributed
Net Investment
Income | | Undistributed
Long-Term
Gain | | | Accumulated
Loss
Carryforward1,2,3,4 | | | Net Unrealized
Appreciation
Based on cost of
Securities and
Other Investments
for Federal Income
Tax Purposes |
$18,138,400 | | | $— | | | | $438,746,868 | | | $224,851,824 |
1. As of August 29, 2014, the Fund had $438,676,020 of net capital loss carryforwards available to offset future realized capital gains, if any, and thereby reduce future taxable gain distributions. Details of the capital loss carryforwards are included in the table below. Capital loss carryovers with no expiration, if any, must be utilized prior to those with expiration dates.
| | | | |
| Expiring | | | |
2018 | | $ | 438,676,020 | |
2. The Fund had $70,848 of straddle losses which were deferred.
3. During the fiscal year ended August 29, 2014, the Fund utilized $57,614,761 of capital loss carryforward to offset capital gains realized in that fiscal year.
4. During the fiscal year ended August 30, 2013, the Fund utilized $26,467,500 of capital loss carryforward to offset capital gains realized in that fiscal year.
Net investment income (loss) and net realized gain (loss) may differ for financial statement and tax purposes. The character of dividends and distributions made during the fiscal year from net investment income or net realized gains may differ from their ultimate characterization for federal income tax purposes. Also, due to timing of dividends and distributions, the fiscal year in which amounts are distributed may differ from the fiscal year in which the income or net realized gain was recorded by the Fund.
Accordingly, the following amounts have been reclassified for August 29, 2014. Net assets of the Fund were unaffected by the reclassifications.
60 OPPENHEIMER CAPITAL INCOME FUND
| | | | |
| | |
| | | | |
| | |
| 1. Significant Accounting Policies (Continued) | | |
| | | | |
Increase
to Accumulated
Net Investment
Income | | Increase
to Accumulated Net
Realized Loss
on Investments | |
$6,322,116 | | $ | 6,322,116 | |
The tax character of distributions paid during the years ended August 31, 2014 and August 31, 2013 was as follows:
| | | | | | | | |
| | | Year Ended
August 31, 2014 | | | Year Ended
August 31, 2013 | |
Distributions paid from: | | | | | | | | |
Ordinary income | | $ | 63,137,774 | | | $ | 64,184,545 | |
The aggregate cost of securities and other investments and the composition of unrealized appreciation and depreciation of securities and other investments for federal income tax purposes as of August 29, 2014 are noted in the following table. The primary difference between book and tax appreciation or depreciation of securities and other investments, if applicable, is attributable to the tax deferral of losses or tax realization of financial statement unrealized gain or loss.
| | | | |
Federal tax cost of securities | | $ | 2,337,679,230 | |
Federal tax cost of other investments | | | 255,444 | |
| | | | |
Total federal tax cost | | $ | 2,337,934,674 | |
| | | | |
Gross unrealized appreciation | | $ | 273,248,109 | |
Gross unrealized depreciation | | | (48,396,285 | ) |
| | | | |
Net unrealized appreciation | | $ | 224,851,824 | |
| | | | |
Trustees’ Compensation. The Board of Trustees has adopted a compensation deferral plan for independent trustees that enables trustees to elect to defer receipt of all or a portion of the annual compensation they are entitled to receive from the Fund. For purposes of determining the amount owed to the Trustee under the plan, deferred amounts are treated as though equal dollar amounts had been invested in shares of the Fund or in other Oppenheimer funds selected by the Trustee. The Fund purchases shares of the funds selected for deferral by the Trustee in amounts equal to his or her deemed investment, resulting in a Fund asset equal to the deferred compensation liability. Such assets are included as a component of “Other” within the asset section of the Consolidated Statement of Assets and Liabilities. Deferral of trustees’ fees under the plan will not affect the net assets of the Fund, and will not materially affect the Fund’s assets, liabilities or net investment income per share. Amounts will be deferred until distributed in accordance with the compensation deferral plan.
Dividends and Distributions to Shareholders. Dividends and distributions to shareholders, which are determined in accordance with income tax regulations and may differ from U.S. generally accepted accounting principles, are recorded on the ex-dividend date. Income distributions, if any, are declared and paid quarterly. Capital gain distributions, if any, are declared and paid annually.
61 OPPENHEIMER CAPITAL INCOME FUND
| | | | |
| |
NOTES TO CONSOLIDATED FINANCIAL STATEMENTS Continued | | |
| | |
| 1. Significant Accounting Policies (Continued) | | |
Investment Income. Dividend income is recorded on the ex-dividend date or upon ex-dividend notification in the case of certain foreign dividends where the ex-dividend date may have passed. Non-cash dividends included in dividend income, if any, are recorded at the fair market value of the securities received. Interest income is recognized on an accrual basis. Discount and premium, which are included in interest income on the Consolidated Statement of Operations, are amortized or accreted daily.
Custodian Fees. “Custodian fees and expenses” in the Consolidated Statement of Operations may include interest expense incurred by the Fund on any cash overdrafts of its custodian account during the period. Such cash overdrafts may result from the effects of failed trades in portfolio securities and from cash outflows resulting from unanticipated shareholder redemption activity. The Fund pays interest to its custodian on such cash overdrafts, to the extent they are not offset by positive cash balances maintained by the Fund, at a rate equal to the Federal Funds Rate plus 0.50%. The “Reduction to custodian expenses” line item, if applicable, represents earnings on cash balances maintained by the Fund during the period. Such interest expense and other custodian fees may be paid with these earnings.
Security Transactions. Security transactions are recorded on the trade date. Realized gains and losses on securities sold are determined on the basis of identified cost.
Indemnifications. The Fund’s organizational documents provide current and former trustees and officers with a limited indemnification against liabilities arising in connection with the performance of their duties to the Fund. In the normal course of business, the Fund may also enter into contracts that provide general indemnifications. The Fund’s maximum exposure under these arrangements is unknown as this would be dependent on future claims that may be made against the Fund. The risk of material loss from such claims is considered remote.
Other. The preparation of consolidated financial statements in conformity with accounting principles generally accepted in the United States of America requires management to make estimates and assumptions that affect the reported amounts of assets and liabilities and disclosure of contingent assets and liabilities at the date of the consolidated financial statements and the reported amounts of increases and decreases in net assets from operations during the reporting period. Actual results could differ from those estimates.
2. Securities Valuation
The Fund calculates the net asset value of its shares as of the close of the New York Stock Exchange (the “Exchange”), normally 4:00 P.M. Eastern time, on each day the Exchange is open for trading.
The Fund’s Board has adopted procedures for the valuation of the Fund’s securities and has delegated the day-to-day responsibility for valuation determinations under those procedures to the Manager. The Manager has established a Valuation Committee which is responsible for determining a “fair valuation” for any security for which market quotations are not “readily
62 OPPENHEIMER CAPITAL INCOME FUND
| | | | |
| | |
| | | | |
| | |
| 2. Securities Valuation (Continued) | | |
available.” The Valuation Committee’s fair valuation determinations are subject to review, approval and ratification by the Fund’s Board at its next regularly scheduled meeting covering the calendar quarter in which the fair valuation was determined.
Valuation Methods and Inputs
Securities are valued using unadjusted quoted market prices, when available, as supplied primarily by third party pricing services or dealers.
The following methodologies are used to determine the market value or the fair value of the types of securities described below:
Securities traded on a registered U.S. securities exchange (including exchange-traded derivatives other than futures and futures options) are valued based on the last sale price of the security reported on the principal exchange on which it is traded, prior to the time when the Fund’s assets are valued. In the absence of a sale, the security is valued at the last sale price on the prior trading day, if it is within the spread of the current day’s closing “bid” and “asked” prices, and if not, at the current day’s closing bid price. A security of a foreign issuer traded on a foreign exchange, but not listed on a registered U.S. securities exchange, is valued based on the last sale price on the principal exchange on which the security is traded, as identified by the third party pricing service used by the Manager, prior to the time when the Fund’s assets are valued. If the last sale price is unavailable, the security is valued at the most recent official closing price on the principal exchange on which it is traded. If the last sales price or official closing price for a foreign security is not available, the security is valued at the mean between the bid and asked price per the exchange or, if not available from the exchange, obtained from two dealers. If bid and asked prices are not available from either the exchange or two dealers, the security is valued by using one of the following methodologies (listed in order of priority): (1) using a bid from the exchange, (2) the mean between the bid and asked price as provided by a single dealer, or (3) a bid from a single dealer.
Shares of a registered investment company that are not traded on an exchange are valued at that investment company’s net asset value per share.
Corporate and government debt securities (of U.S. or foreign issuers) and municipal debt securities, event-linked bonds, loans, mortgage-backed securities, collateralized mortgage obligations, and asset-backed securities are valued at the mean between the “bid” and “asked” prices utilizing evaluated prices obtained from third party pricing services or broker-dealers who may use matrix pricing methods to determine the evaluated prices.
Short-term money market type debt securities with a remaining maturity of sixty days or less are valued at cost adjusted by the amortization of discount or premium to maturity (amortized cost), which approximates market value. Short-term debt securities with a remaining maturity in excess of sixty days are valued at the mean between the “bid” and “asked” prices utilizing evaluated prices obtained from third party pricing services or broker-dealers.
Structured securities, swaps, swaptions, and other over-the-counter derivatives are valued utilizing evaluated prices obtained from third party pricing services or broker-dealers.
Forward foreign currency exchange contracts are valued utilizing current and forward currency rates obtained from third party pricing services. When the settlement date of a
63 OPPENHEIMER CAPITAL INCOME FUND
| | | | |
| |
NOTES TO CONSOLIDATED FINANCIAL STATEMENTS Continued | | |
| | |
| 2. Securities Valuation (Continued) | | |
contract is an interim date for which a quotation is not available, interpolated values are derived using the nearest dated forward currency rate.
Futures contracts and futures options traded on a commodities or futures exchange will be valued at the final settlement price or official closing price on the principal exchange as reported by such principal exchange at its trading session ending at, or most recently prior to, the time when the Fund’s assets are valued.
A description of the standard inputs that may generally be considered by the third party pricing vendors in determining their evaluated prices is provided below.
| | |
| Security Type | | Standard inputs generally considered by third-party pricing vendors |
| Corporate debt, government debt, municipal, mortgage-backed and asset-backed securities | | Reported trade data, broker-dealer price quotations, benchmark yields, issuer spreads on comparable securities, the credit quality, yield, maturity, and other appropriate factors. |
| Loans | | Information obtained from market participants regarding reported trade data and broker-dealer price quotations. |
| Event-linked bonds | | Information obtained from market participants regarding reported trade data and broker-dealer price quotations. |
| Structured securities | | Relevant market information such as the price of underlying financial instruments, stock market indices, foreign currencies, interest rate spreads, commodities, or the occurrence of other specific events. |
| Swaps | | Relevant market information, including underlying reference assets such as credit spreads, credit event probabilities, index values, individual security values, forward interest rates, variable interest rates, volatility measures, and forward currency rates. |
If a market value or price cannot be determined for a security using the methodologies described above, or if, in the “good faith” opinion of the Manager, the market value or price obtained does not constitute a “readily available market quotation,” or a significant event has occurred that would materially affect the value of the security the security is fair valued either (i) by a standardized fair valuation methodology applicable to the security type or the significant event as previously approved by the Valuation Committee and the Fund’s Board or (ii) as determined in good faith by the Manager’s Valuation Committee. The Valuation Committee considers all relevant facts that are reasonably available, through either public information or information available to the Manager, when determining the fair value of a security. Fair value determinations by the Manager are subject to review, approval and ratification by the Fund’s Board at its next regularly scheduled meeting covering the calendar quarter in which the fair valuation was determined. Those fair valuation standardized methodologies include, but are not limited to, valuing securities at the last sale price or initially at cost and subsequently adjusting the value based on: changes in company specific fundamentals, changes in an appropriate securities index, or changes in the value of similar securities which may be further adjusted for any discounts related to security-specific resale restrictions. When possible, such methodologies use observable market inputs such as unadjusted quoted prices of similar securities, observable interest rates, currency rates and
64 OPPENHEIMER CAPITAL INCOME FUND
| | | | |
| | |
| | | | |
| | |
| 2. Securities Valuation (Continued) | | |
yield curves. The methodologies used for valuing securities are not necessarily an indication of the risks associated with investing in those securities nor can it be assured that the Fund can obtain the fair value assigned to a security if it were to sell the security.
To assess the continuing appropriateness of security valuations, the Manager, or its third party service provider who is subject to oversight by the Manager, regularly compares prior day prices, prices on comparable securities, and sale prices to the current day prices and challenges those prices exceeding certain tolerance levels with the third party pricing service or broker source. For those securities valued by fair valuations, whether through a standardized fair valuation methodology or a fair valuation determination, the Valuation Committee reviews and affirms the reasonableness of the valuations based on such methodologies and fair valuation determinations on a regular basis after considering all relevant information that is reasonably available.
Classifications
Each investment asset or liability of the Fund is assigned a level at measurement date based on the significance and source of the inputs to its valuation. Various data inputs are used in determining the value of each of the Fund’s investments as of the reporting period end. These data inputs are categorized in the following hierarchy under applicable financial accounting standards:
1) Level 1-unadjusted quoted prices in active markets for identical assets or liabilities (including securities actively traded on a securities exchange)
2) Level 2-inputs other than unadjusted quoted prices that are observable for the asset or liability (such as unadjusted quoted prices for similar assets and market corroborated inputs such as interest rates, prepayment speeds, credit risks, etc.)
3) Level 3-significant unobservable inputs (including the Manager’s own judgments about assumptions that market participants would use in pricing the asset or liability).
The inputs used for valuing securities are not necessarily an indication of the risks associated with investing in those securities.
The table below categorizes amounts that are included in the Fund’s Consolidated Statement of Assets and Liabilities as of August 29, 2014 based on valuation input level:
| | | | | | | | | | | | | | | | |
| | | Level 1—
Unadjusted
Quoted Prices | | | Level 2—
Other Significant
Observable Inputs | | | Level 3—
Significant
Unobservable
Inputs | | | Value | |
Assets Table | | | | | | | | | | | | | | | | |
Investments, at Value: | | | | | | | | | | | | | | | | |
Common Stocks | | | | | | | | | | | | | | | | |
Consumer Discretionary | | $ | 93,267,090 | | | $ | — | | | $ | — | | | $ | 93,267,090 | |
Consumer Staples | | | 36,628,380 | | | | — | | | | — | | | | 36,628,380 | |
Energy | | | 110,385,377 | | | | 4,817,104 | | | | — | | | | 115,202,481 | |
Financials | | | 94,233,688 | | | | — | | | | — | | | | 94,233,688 | |
Health Care | | | 95,765,541 | | | | 12,843,248 | | | | — | | | | 108,608,789 | |
Industrials | | | 75,530,252 | | | | — | | | | — | | | | 75,530,252 | |
65 OPPENHEIMER CAPITAL INCOME FUND
| | | | |
| |
NOTES TO CONSOLIDATED FINANCIAL STATEMENTS Continued | | |
| | |
| 2. Securities Valuation (Continued) | | |
| | | | | | | | | | | | | | | | |
| | | Level 1—
Unadjusted
Quoted Prices | | | Level 2—
Other Significant
Observable Inputs | | | Level 3—
Significant
Unobservable
Inputs | | | Value | |
Common Stocks (Continued) | | | | | | | | | | | | | | | | |
Information Technology | | $ | 66,076,470 | | | $ | 7,990,901 | | | $ | — | | | $ | 74,067,371 | |
Materials | | | 47,523,614 | | | | — | | | | — | | | | 47,523,614 | |
Telecommunication Services | | | 28,790,410 | | | | — | | | | — | | | | 28,790,410 | |
Utilities | | | 52,189,376 | | | | — | | | | — | | | | 52,189,376 | |
Preferred Stocks | | | — | | | | 6,257,673 | | | | — | | | | 6,257,673 | |
Asset-Backed Securities | | | — | | | | 276,519,602 | | | | — | | | | 276,519,602 | |
Mortgage-Backed Obligations | | | — | | | | 401,901,594 | | | | — | | | | 401,901,594 | |
U.S. Government Obligations | | | — | | | | 55,632,147 | | | | — | | | | 55,632,147 | |
Non-Convertible Corporate Bonds and Notes | | | — | | | | 475,375,538 | | | | — | | | | 475,375,538 | |
Convertible Corporate Bonds and Notes | | | — | | | | 17,159,569 | | | | — | | | | 17,159,569 | |
Corporate Loans | | | — | | | | 86,934,245 | | | | — | | | | 86,934,245 | |
Structured Securities | | | — | | | | 15,662,429 | | | | — | | | | 15,662,429 | |
Exchange-Traded Options Purchased | | | 1,238,203 | | | | — | | | | — | | | | 1,238,203 | |
Over-the-Counter Credit Default Swaptions Purchased | | | — | | | | 83,244 | | | | — | | | | 83,244 | |
Over-the-Counter Interest Rate Swaptions Purchased | | | — | | | | 2,967,666 | | | | — | | | | 2,967,666 | |
Investment Companies | | | 218,411,539 | | | | 268,421,086 | | | | — | | | | 486,832,625 | |
Municipal Bonds and Notes | | | — | | | | 9,365,113 | | | | — | | | | 9,365,113 | |
Total Investments, at Value | | | 920,039,940 | | | | 1,641,931,159 | | | | — | | | | 2,561,971,099 | |
Other Financial Instruments: | | | | | | | | | | | | | | | | |
Swaps, at value | | | — | | | | 1,497,666 | | | | — | | | | 1,497,666 | |
Futures contracts | | | 782,330 | | | | — | | | | — | | | | 782,330 | |
Foreign currency exchange contracts | | | — | | | | 908,465 | | | | — | | | | 908,465 | |
Total Assets | | $ | 920,822,270 | | | $ | 1,644,337,290 | | | $ | — | | | $ | 2,565,159,560 | |
| | | | |
Liabilities Table | | | | | | | | | | | | | | | | |
Other Financial Instruments: | | | | | | | | | | | | | | | | |
Centrally cleared swaps, at value | | $ | — | | | $ | (1,726,450 | ) | | $ | — | | | $ | (1,726,450 | ) |
Futures contracts | | | (24,443 | ) | | | — | | | | — | | | | (24,443 | ) |
Foreign currency exchange contracts | | | — | | | | (573,080 | ) | | | — | | | | (573,080 | ) |
Total Liabilities | | $ | (24,443 | ) | | $ | (2,299,530 | ) | | $ | — | | | $ | (2,323,973 | ) |
Forward currency exchange contracts and futures contracts, if any, are reported at their unrealized appreciation/depreciation at measurement date, which represents the change in the contract’s value from trade date. All additional assets and liabilities included in the above table are reported at their market value at measurement date.
66 OPPENHEIMER CAPITAL INCOME FUND
| | | | |
| | |
| | | | |
| | |
| 2. Securities Valuation (Continued) | | |
The table below shows the transfers between Level 1, Level 2 and Level 3. The Fund’s policy is to recognize transfers in and transfers out as of the beginning of the reporting period.
| | | | | | | | | | | | |
| | | Transfers out of Level 1a | | | Transfers into Level 2 | | | Transfers out of Level 3b | |
Assets Table | | | | | | | | | | | | |
Investments, at Value: | | | | | | | | | | | | |
Preferred Stocks | | $ | (6,360,495 | ) | | $ | 6,360,495 | a | | $ | — | |
Asset-Backed Securities | | | — | | | | 52,617,590 | b | | | (52,617,590 | ) |
Total Assets | | $ | (6,360,495 | ) | | $ | 58,978,085 | | | $ | (52,617,590 | ) |
a. Transferred from Level 1 to Level 2 due to the absence of a readily available unadjusted quoted market price.
b. Transferred from Level 3 to Level 2 due to the availability of market data for this security.
3. Shares of Beneficial Interest
The Fund has authorized an unlimited number of $0.001 par value shares of beneficial interest of each class. Transactions in shares of beneficial interest were as follows:
| | | | | | | | | | | | | | | | |
| | | Year Ended August 29, 20141 | | | Year Ended August 30, 2013 | |
| | | Shares | | | Amount | | | Shares | | | Amount | |
Class A | | | | | | | | | | | | | | | | |
Sold | | | 30,612,663 | | | $ | 297,503,045 | | | | 23,642,395 | | | $ | 220,539,567 | |
Dividends and/or distributions reinvested | | | 4,998,073 | | | | 48,245,642 | | | | 5,748,038 | | | | 52,839,693 | |
Redeemed | | | (25,973,757 | ) | | | (252,006,375 | ) | | | (21,627,328 | ) | | | (201,240,823 | ) |
| | | | |
Net increase | | | 9,636,979 | | | $ | 93,742,312 | | | | 7,763,105 | | | $ | 72,138,437 | |
| | | | |
| | | | | | | | | | | | | | | | | |
Class B | | | | | | | | | | | | | | | | |
Sold | | | 493,290 | | | $ | 4,690,506 | | | | 477,637 | | | $ | 4,360,578 | |
Dividends and/or distributions reinvested | | | 77,285 | | | | 729,934 | | | | 126,915 | | | | 1,141,639 | |
Redeemed | | | (1,320,532 | ) | | | (12,496,365 | ) | | | (1,774,270 | ) | | | (16,167,344 | ) |
| | | | |
Net decrease | | | (749,957 | ) | | $ | (7,075,925 | ) | | | (1,169,718 | ) | | $ | (10,665,127 | ) |
| | | | |
| | | | | | | | | | | | | | | | | |
Class C | | | | | | | | | | | | | | | | |
Sold | | | 13,863,707 | | | $ | 131,347,607 | | | | 9,959,753 | | | $ | 90,454,935 | |
Dividends and/or distributions reinvested | | | 529,432 | | | | 4,973,417 | | | | 414,136 | | | | 3,704,982 | |
Redeemed | | | (4,240,827 | ) | | | (39,991,637 | ) | | | (2,678,566 | ) | | | (24,274,449 | ) |
| | | | |
Net increase | | | 10,152,312 | | | $ | 96,329,387 | | | | 7,695,323 | | | $ | 69,885,468 | |
| | | | |
| | | | | | | | | | | | | | | | | |
Class I | | | | | | | | | | | | | | | | |
Sold | | | 1,203,751 | | | $ | 11,790,222 | | | | — | | | $ | — | |
Dividends and/or distributions reinvested | | | 13,863 | | | | 136,337 | | | | — | | | | — | |
Redeemed | | | (131,771 | ) | | | (1,286,083 | ) | | | — | | | | — | |
| | | | |
Net increase | | | 1,085,843 | | | $ | 10,640,476 | | | | — | | | $ | — | |
| | | | |
67 OPPENHEIMER CAPITAL INCOME FUND
| | | | |
| |
NOTES TO CONSOLIDATED FINANCIAL STATEMENTS Continued | | |
| | |
| 3. Shares of Beneficial Interest (Continued) | | |
| | | | | | | | | | | | | | | | |
| | | Year Ended August 29, 20141 | | | Year Ended August 30, 2013 | |
| | | Shares | | | Amount | | | Shares | | | Amount | |
Class R2 | | | | | | | | | | | | | | | | |
Sold | | | 672,917 | | | $ | 6,462,401 | | | | 518,206 | | | $ | 4,770,142 | |
Dividends and/or distributions reinvested | | | 64,032 | | | | 610,875 | | | | 76,804 | | | | 697,434 | |
Redeemed | | | (523,132 | ) | | | (5,032,720 | ) | | | (722,639 | ) | | | (6,643,074 | ) |
| | | | |
Net increase (decrease) | | | 213,817 | | | $ | 2,040,556 | | | | (127,629 | ) | | $ | (1,175,498 | ) |
| | | | |
| | | | |
| | | | | | | | | | | | | | | | | |
Class Y | | | | | | | | | | | | | | | | |
Sold | | | 22,294,789 | | | $ | 218,353,652 | | | | 11,778,421 | | | $ | 109,885,511 | |
Dividends and/or distributions reinvested | | | 363,289 | | | | 3,511,939 | | | | 198,993 | | | | 1,830,047 | |
Redeemed | | | (6,122,066 | ) | | | (59,483,147 | ) | | | (3,124,651 | ) | | | (29,150,941 | ) |
| | | | |
Net increase | | | 16,536,012 | | | $ | 162,382,444 | | | | 8,852,763 | | | $ | 82,564,617 | |
| | | | |
1. For the year ended August 29, 2014, for Class A, Class B, Class C, Class R and Class Y shares, and for the period from December 27, 2013 (inception of offering) to August 29, 2014, for Class I shares.
2. Effective July 1, 2014, Class N shares were renamed Class R.
4. Purchases and Sales of Securities
The aggregate cost of purchases and proceeds from sales of securities, other than short-term obligations and investments in IMMF, for the year ended August 29, 2014 were as follows:
| | | | | | | | |
| | | Purchases | | | Sales | |
Investment securities | | $ | 2,026,559,235 | | | $ | 1,651,227,542 | |
U.S. government and government agency obligations | | | 116,717,131 | | | | 127,914,034 | |
To Be Announced (TBA) mortgage-related securities | | | 2,958,051,509 | | | | 2,894,379,022 | |
5. Fees and Other Transactions with Affiliates
Management Fees. Under the investment advisory agreement, the Fund pays the Manager a management fee based on the daily net assets of the Fund at an annual rate as shown in the following table:
| | | | |
| Fee Schedule | | | |
Up to $100 million | | | 0.75 | % |
Next $100 million | | | 0.70 | |
Next $100 million | | | 0.65 | |
Next $100 million | | | 0.60 | |
Next $100 million | | | 0.55 | |
Next $4.5 billion | | | 0.50 | |
Over $5 billion | | | 0.48 | |
The Manager also provides investment management related services to the Subsidiary. The Subsidiary pays the Manager a monthly management fee at an annual rate according to the above schedule. The Subsidiary also pays certain other expenses including custody and directors’ fees.
68 OPPENHEIMER CAPITAL INCOME FUND
| | |
| |
| | |
| | |
| 5. Fees and Other Transactions with Affiliates (Continued) | | |
Sub-Adviser Fees. The Manager has retained the Sub-Adviser to provide the day-to-day portfolio management of the Fund and the Subsidiary. Under the Sub-Advisory Agreement, the Manager pays the Sub-Adviser an annual fee in monthly installments, equal to a percentage of the investment management fee collected by the Manager from the Fund and the Subsidiary, which shall be calculated after any investment management fee waivers. The fee paid to the Sub-Adviser is paid by the Manager, not by the Fund.
Transfer Agent Fees. OFI Global (the “Transfer Agent”) serves as the transfer and shareholder servicing agent for the Fund. The Fund pays the Transfer Agent a fee based on annual net assets. Fees incurred and average net assets for each class with respect to these services are detailed in the Consolidated Statement of Operations and Consolidated Financial Highlights, respectively.
Sub-Transfer Agent Fees. The Transfer Agent has retained Shareholder Services, Inc., a wholly-owned subsidiary of OFI (the “Sub-Transfer Agent”), to provide the day-to-day transfer agent and shareholder servicing of the Fund. Under the Sub-Transfer Agency Agreement, the Transfer Agent pays the Sub-Transfer Agent an annual fee in monthly installments, equal to a percentage of the transfer agent fee collected by the Transfer Agent from the Fund, which shall be calculated after any applicable fee waivers. The fee paid to the Sub-Transfer Agent is paid by the Transfer Agent, not by the Fund.
Distribution and Service Plan (12b-1) Fees. Under its General Distributor’s Agreement with the Fund, OppenheimerFunds Distributor, Inc. (the “Distributor”) acts as the Fund’s principal underwriter in the continuous public offering of the Fund’s classes of shares.
Service Plan for Class A Shares. The Fund has adopted a Service Plan (the “Plan”) for Class A shares under Rule 12b-1 of the Investment Company Act of 1940. Under the Plan, the Fund reimburses the Distributor for a portion of its costs incurred for services provided to accounts that hold Class A shares. Reimbursement is made periodically at an annual rate of up to 0.25% of the daily net assets of Class A shares of the Fund. The Distributor currently uses all of those fees to pay dealers, brokers, banks and other financial institutions periodically for providing personal service and maintenance of accounts of their customers that hold Class A shares. Any unreimbursed expenses the Distributor incurs with respect to Class A shares in any fiscal year cannot be recovered in subsequent periods. Fees incurred by the Fund under the Plan are detailed in the Consolidated Statement of Operations.
Distribution and Service Plans for Class B, Class C and Class R Shares. The Fund has adopted Distribution and Service Plans (the “Plans”) for Class B, Class C and Class R shares under Rule 12b-1 of the Investment Company Act of 1940 to compensate the Distributor for distributing those share classes, maintaining accounts and providing shareholder services. Under the Plans, the Fund pays the Distributor an annual asset-based sales charge of
69 OPPENHEIMER CAPITAL INCOME FUND
| | |
| |
NOTES TO CONSOLIDATED FINANCIAL STATEMENTS Continued | | |
| | |
| 5. Fees and Other Transactions with Affiliates (Continued) | | |
0.75% on Class B and Class C shares daily net assets and 0.25% on Class R shares daily net assets. The Fund also pays a service fee under the Plans at an annual rate of 0.25% of daily net assets. The Plans continue in effect from year to year only if the Fund’s Board of Trustees vote annually to approve its continuance at an in person meeting called for that purpose. Fees incurred by the Fund under the Plans are detailed in the Consolidated Statement of Operations.
Sales Charges. Front-end sales charges and contingent deferred sales charges (“CDSC”) do not represent expenses of the Fund. They are deducted from the proceeds of sales of Fund shares prior to investment or from redemption proceeds prior to remittance, as applicable. The sales charges retained by the Distributor from the sale of shares and the CDSC retained by the Distributor on the redemption of shares is shown in the following table for the period indicated.
| | | | | | | | | | | | | | | | | | | | |
| Year Ended | | Class A Front-End Sales Charges Retained by Distributor | | | Class A Contingent Deferred Sales Charges Retained by Distributor | | | Class B Contingent Deferred Sales Charges Retained by Distributor | | | Class C Contingent Deferred Sales Charges Retained by Distributor | | | Class R Contingent Deferred Sales Charges Retained by Distributor | |
August 29, 2014 | | $ | 701,648 | | | $ | 7,412 | | | $ | 38,628 | | | $ | 31,626 | | | $ | 750 | |
Waivers and Reimbursements of Expenses. The Manager has contractually agreed to waive the management fee it receives from the Fund in an amount equal to the management fee it receives from the Subsidiary. During the year ended August 29, 2014, the Manager waived $122,707.
The Manager will waive fees and/or reimburse Fund expenses in an amount equal to the indirect management fees incurred through the Fund’s investment in IMMF, Oppenheimer Ultra-Short Duration Fund and the Master Fund. During the year ended August 29, 2014, the Manager waived fees and/or reimbursed the Fund $993,072 for management fees.
The Transfer Agent has contractually agreed to limit transfer and shareholder servicing agent fees for Classes B, C, R and Y shares to 0.35% of average annual net assets per class and for Class A shares to 0.30% of average annual net assets of the class. The limit was removed on December 27, 2013.
During the year ended August 29, 2014, the Transfer Agent waived transfer and shareholder servicing agent fees as follows:
| | | | |
Class A | | $ | 901 | |
Class B | | | 15,517 | |
These undertakings may be modified or terminated as set forth according to the terms in the prospectus.
70 OPPENHEIMER CAPITAL INCOME FUND
| | |
| |
| | |
| | |
| 6. Risk Exposures and the Use of Derivative Instruments | | |
The Fund’s investment objective not only permits the Fund to purchase investment securities, it also allows the Fund to enter into various types of derivatives contracts, including, but not limited to, futures contracts, forward currency exchange contracts, credit default swaps, interest rate swaps, total return swaps, variance swaps and purchased and written options. In doing so, the Fund will employ strategies in differing combinations to permit it to increase, decrease, or change the level or types of exposure to market risk factors. These instruments may allow the Fund to pursue its objectives more quickly and efficiently than if it were to make direct purchases or sales of securities capable of effecting a similar response to market factors. Such contracts may be entered into through a bilateral over-the-counter (“OTC”) transaction, or through a securities or futures exchange and cleared through a clearinghouse.
Market Risk Factors. In accordance with its investment objectives, the Fund may use derivatives to increase or decrease its exposure to one or more of the following market risk factors:
Commodity Risk. Commodity risk relates to the change in value of commodities or commodity indexes as they relate to increases or decreases in the commodities market. Commodities are physical assets that have tangible properties. Examples of these types of assets are crude oil, heating oil, metals, livestock, and agricultural products.
Credit Risk. Credit risk relates to the ability of the issuer to meet interest and principal payments, or both, as they come due. In general, lower-grade, higher-yield bonds are subject to credit risk to a greater extent than lower-yield, higher-quality bonds.
Equity Risk. Equity risk relates to the change in value of equity securities as they relate to increases or decreases in the general market.
Foreign Exchange Rate Risk. Foreign exchange rate risk relates to the change in the U.S. dollar value of a security held that is denominated in a foreign currency. The U.S. dollar value of a foreign currency denominated security will decrease as the dollar appreciates against the currency, while the U.S. dollar value will increase as the dollar depreciates against the currency.
Interest Rate Risk. Interest rate risk refers to the fluctuations in value of fixed-income securities resulting from the inverse relationship between price and yield. For example, an increase in general interest rates will tend to reduce the market value of already issued fixed-income investments, and a decline in general interest rates will tend to increase their value. In addition, debt securities with longer maturities, which tend to have higher yields, are subject to potentially greater fluctuations in value from changes in interest rates than obligations with shorter maturities.
Volatility Risk. Volatility risk refers to the magnitude of the movement, but not the direction of the movement, in a financial instrument’s price over a defined time period. Large increases or decreases in a financial instrument’s price over a relative time period typically indicate greater volatility risk, while small increases or decreases in its price typically indicate lower volatility risk.
71 OPPENHEIMER CAPITAL INCOME FUND
| | |
| |
NOTES TO CONSOLIDATED FINANCIAL STATEMENTS Continued | | |
| | |
| 6. Risk Exposures and the Use of Derivative Instruments (Continued) | | |
Derivatives may have little or no initial cash investment relative to their market value exposure and therefore can produce significant gains or losses in excess of their cost due to unanticipated changes in the market risk factors and the overall market. This use of embedded leverage allows the Fund to increase its market value exposure relative to its net assets and can substantially increase the volatility of the Fund’s performance. In instances where the Fund is using derivatives to decrease, or hedge, exposures to market risk factors for securities held by the Fund, there are also risks that those derivatives may not perform as expected resulting in losses for the combined or hedged positions. Some derivatives have the potential for unlimited loss, regardless of the size of the Fund’s initial investment.
Additional associated risks from investing in derivatives also exist and potentially could have significant effects on the valuation of the derivative and the Fund. Typically, the associated risks are not the risks that the Fund is attempting to increase or decrease exposure to, per its investment objectives, but are the additional risks from investing in derivatives. Examples of these associated risks are liquidity risk, which is the risk that the Fund will not be able to sell the derivative in the open market in a timely manner, and counterparty credit risk, which is the risk that the counterparty will not fulfill its obligation to the Fund.
The Fund’s actual exposures to these market risk factors and associated risks during the period are discussed in further detail, by derivative type, below.
Forward Currency Exchange Contracts
The Fund may enter into forward currency exchange contracts (“forward contracts”) for the purchase or sale of a foreign currency at a negotiated rate at a future date. Such contracts are traded in the OTC inter-bank currency dealer market.
Forward contracts are reported on a schedule following the Consolidated Statement of Investments. The unrealized appreciation (depreciation) is reported in the Consolidated Statement of Assets and Liabilities as a receivable (or payable) and in the Consolidated Statement of Operations within the change in unrealized appreciation (depreciation). At contract close, the difference between the original cost of the contract and the value at the close date is recorded as a realized gain (loss) in the Consolidated Statement of Operations.
The Fund has entered into forward contracts with the obligation to purchase specified foreign currencies in the future at a currently negotiated forward rate in order to take a positive investment perspective on the related currency. These forward contracts seek to increase exposure to foreign exchange rate risk.
The Fund has entered into forward contracts with the obligation to purchase specified foreign currencies in the future at a currently negotiated forward rate in order to decrease exposure to foreign exchange rate risk associated with foreign currency denominated securities held by the Fund.
The Fund has entered into forward contracts with the obligation to sell specified foreign currencies in the future at a currently negotiated forward rate in order to take a negative investment perspective on the related currency. These forward contracts seek to increase exposure to foreign exchange rate risk.
72 OPPENHEIMER CAPITAL INCOME FUND
| | |
| |
| | |
| | |
| 6. Risk Exposures and the Use of Derivative Instruments (Continued) | | |
The Fund has entered into forward contracts with the obligation to sell specified foreign currencies in the future at a currently negotiated forward rate in order to decrease exposure to foreign exchange rate risk associated with foreign currency denominated securities held by the Fund.
During the year ended August 29, 2014, the Fund had daily average contract amounts on forward contracts to buy and sell of $7,368,568 and $60,600,510, respectively.
Additional associated risk to the Fund includes counterparty credit risk. Counterparty credit risk arises from the possibility that the counterparty to a forward contract will default and fail to perform its obligations to the Fund.
Futures Contracts
A futures contract is a commitment to buy or sell a specific amount of a commodity, financial instrument or currency at a negotiated price on a stipulated future date. The Fund may buy and sell futures contracts and may also buy or write put or call options on these futures contracts. Futures contracts and options thereon are generally entered into on a regulated futures exchange and cleared through a clearinghouse associated with the exchange.
Upon entering into a futures contract, the Fund is required to deposit either cash or securities (initial margin) in an amount equal to a certain percentage of the contract value in an account registered in the futures commission merchant’s name. Subsequent payments (variation margin) are paid to or from the futures commission merchant each day equal to the daily changes in the contract value. Such payments are recorded as unrealized gains and losses. Should the Fund fail to make requested variation margin payments, the futures commission merchant can gain access to the initial margin to satisfy the Fund’s payment obligations.
Futures contracts are reported on a schedule following the Consolidated Statement of Investments. Securities held by a futures commission merchant to cover initial margin requirements on open futures contracts are noted in the Consolidated Statement of Investments. Cash held by a futures commission merchant to cover initial margin requirements on open futures contracts and the receivable and/or payable for the daily mark to market for the variation margin are noted in the Consolidated Statement of Assets and Liabilities. The net change in unrealized appreciation and depreciation is reported in the Consolidated Statement of Operations. Realized gains (losses) are reported in the Consolidated Statement of Operations at the closing or expiration of futures contracts.
The Fund has purchased futures contracts on various bonds and notes to increase exposure to interest rate risk.
The Fund has sold futures contracts on various bonds and notes to decrease exposure to interest rate risk.
The Fund has purchased futures contracts on various equity indexes to increase exposure to equity risk.
The Fund has sold futures contracts on various equity indexes to decrease exposure to equity risk.
73 OPPENHEIMER CAPITAL INCOME FUND
| | |
| |
NOTES TO CONSOLIDATED FINANCIAL STATEMENTS Continued | | |
| | |
| 6. Risk Exposures and the Use of Derivative Instruments (Continued) | | |
The Fund has purchased futures contracts, which have values that are linked to the price movement of the related commodities, in order to increase exposure to commodity risk.
During the year ended August 29, 2014, the Fund had an ending monthly average market value of $65,677,078 and $141,028,657 on futures contracts purchased and sold, respectively.
Additional associated risks of entering into futures contracts (and related options) include the possibility that there may be an illiquid market where the Fund is unable to liquidate the contract or enter into an offsetting position and, if used for hedging purposes, the risk that the price of the contract will correlate imperfectly with the prices of the Fund’s securities.
Option Activity
The Fund may buy and sell put and call options, or write put and call options. When an option is written, the Fund receives a premium and becomes obligated to sell or purchase the underlying security, currency or other underlying financial instrument at a fixed price, upon exercise of the option.
Options can be traded through an exchange or through a privately negotiated arrangement with a dealer in an OTC transaction. Options traded through an exchange are generally cleared through a clearinghouse (such as The Options Clearing Corporation). The difference between the premium received or paid, and market value of the option, is recorded as unrealized appreciation or depreciation. The net change in unrealized appreciation or depreciation is reported in the Consolidated Statement of Operations. When an option is exercised, the cost of the security purchased or the proceeds of the security sale are adjusted by the amount of premium received or paid. Upon the expiration or closing of the option transaction, a gain or loss is reported in the Consolidated Statement of Operations.
The Fund has purchased put options on currencies to decrease exposure to foreign exchange rate risk. A purchased put option becomes more valuable as the price of the underlying financial instrument depreciates relative to the strike price.
The Fund has purchased call options on treasury and/or euro futures to increase exposure to interest rate risk. A purchased call option becomes more valuable as the price of the underlying financial instrument appreciates relative to the strike price.
The Fund has purchased call options on individual equity securities and/or equity indexes to increase exposure to equity risk. A purchased call option becomes more valuable as the price of the underlying financial instrument appreciates relative to the strike price.
During the year ended August 29, 2014, the Fund had an ending monthly average market value of $1,526,680 and $343,932 on purchased call options and purchased put options, respectively.
Options written, if any, are reported in a schedule following the Consolidated Statement of Investments and as a liability in the Consolidated Statement of Assets and Liabilities. Securities held in collateral accounts to cover potential obligations with respect to outstanding written options are noted in the Consolidated Statement of Investments.
74 OPPENHEIMER CAPITAL INCOME FUND
| | |
| |
| | |
| | |
| 6. Risk Exposures and the Use of Derivative Instruments (Continued) | | |
The risk in writing a call option is that the market price of the security increases and if the option is exercised, the Fund must either purchase the security at a higher price for delivery or, if the Fund owns the underlying security, give up the opportunity for profit. The risk in writing a put option is that the Fund may incur a loss if the market price of the security decreases and the option is exercised. The risk in buying an option is that the Fund pays a premium whether or not the option is exercised. The Fund also has the additional risk that there may be an illiquid market where the Fund is unable to close the contract.
Additional associated risks to the Fund include counterparty credit risk and liquidity risk.
As of August 29, 2014, the Fund had no outstanding written options.
Swap Contracts
The Fund may enter into swap contract agreements with a counterparty to exchange a series of cash flows based on either specified reference rates, the price or volatility of asset or non-asset references, or the occurrence of a credit event, over a specified period. Swaps can be executed in a bi-lateral privately negotiated arrangement with a dealer in an OTC transaction (“OTC swaps”) or executed on a regulated market. Certain swaps, regardless of the venue of their execution, are required to be cleared through a clearinghouse (“centrally cleared swaps”). Swap contracts may include interest rate, equity, debt, index, total return, credit default, currency, and volatility swaps.
Swap contracts are reported on a schedule following the Consolidated Statement of Investments. The values of centrally cleared swap and OTC swap contracts are aggregated by positive and negative values and disclosed separately on the Consolidated Statement of Assets and Liabilities. The unrealized appreciation (depreciation) related to the change in the valuation of the notional amount of the swap is combined with the accrued interest due to (owed by) the Fund, if any, at termination or settlement. The net change in this amount during the period is included on the Consolidated Statement of Operations. The Fund also records any periodic payments received from (paid to) the counterparty, including at termination, under such contracts as realized gain (loss) on the Consolidated Statement of Operations.
Swap contract agreements are exposed to the market risk factor of the specific underlying reference rate or asset. Swap contracts are typically more attractively priced compared to similar investments in related cash securities because they isolate the risk to one market risk factor and eliminate the other market risk factors. Investments in cash securities (for instance bonds) have exposure to multiple risk factors (credit and interest rate risk). Because swaps have embedded leverage, they can expose the Fund to substantial risk in the isolated market risk factor.
Credit Default Swap Contracts. A credit default swap is a contract that enables an investor to buy or sell protection against a defined-issuer credit event, such as the issuer’s failure to make timely payments of interest or principal on a debt security, bankruptcy or restructuring. The Fund may enter into credit default swaps either by buying or selling protection on a corporate issuer, sovereign issuer, or a basket or index of issuers (the “reference asset”).
75 OPPENHEIMER CAPITAL INCOME FUND
| | |
| |
NOTES TO CONSOLIDATED FINANCIAL STATEMENTS Continued | | |
| | |
| 6. Risk Exposures and the Use of Derivative Instruments (Continued) | | |
The buyer of protection pays a periodic fee to the seller of protection based on the notional amount of the swap contract. The seller of protection agrees to compensate the buyer of protection for future potential losses as a result of a credit event on the reference asset. The contract effectively transfers the credit event risk of the reference asset from the buyer of protection to the seller of protection.
The ongoing value of the contract will fluctuate throughout the term of the contract based primarily on the credit risk of the reference asset. If the credit quality of the reference asset improves relative to the credit quality at contract initiation, the buyer of protection may have an unrealized loss greater than the anticipated periodic fee owed. This unrealized loss would be the result of current credit protection being cheaper than the cost of credit protection at contract initiation. If the buyer elects to terminate the contract prior to its maturity, and there has been no credit event, this unrealized loss will become realized. If the contract is held to maturity, and there has been no credit event, the realized loss will be equal to the periodic fee paid over the life of the contract.
If there is a credit event, the buyer of protection can exercise its rights under the contract and receive a payment from the seller of protection equal to the notional amount of the swap less the market value of specified debt securities issued by the reference asset. Upon exercise of the contract the difference between such value and the notional amount is recorded as realized gain (loss) and is included on the Consolidated Statement of Operations.
The Fund has sold credit protection through credit default swaps to increase exposure to the credit risk of individual issuers and/or indexes of issuers that are either unavailable or considered to be less attractive in the bond market.
The Fund has purchased credit protection through credit default swaps to decrease exposure to the credit risk of individual issuers and/or indexes of issuers.
For the year ended August 29, 2014, the Fund had ending monthly average notional amounts of $ 23,724,735 and $25,000,000 on credit default swaps to buy protection and credit default swaps to sell protection, respectively.
Additional associated risks to the Fund include counterparty credit risk and liquidity risk.
Total Return Swap Contracts. A total return swap is an agreement between counterparties to exchange periodic payments based on the value of asset or non-asset references. One cash flow is typically based on a non-asset reference (such as an interest rate) and the other on the total return of a reference asset (such as a security or a basket of securities or securities index). The total return of the reference asset typically includes appreciation or depreciation on the reference asset, plus any interest or dividend payments.
Total return swap contracts are exposed to the market risk factor of the specific underlying financial instrument or index. Total return swaps are less standard in structure than other types of swaps and can isolate and/or include multiple types of market risk factors including equity risk, credit risk, and interest rate risk.
The Fund has entered into total return swaps on various equity securities or indexes to increase exposure to equity risk. These equity risk related total return swaps require the Fund to pay a floating reference interest rate, and an amount equal to the negative price movement of securities or an index (expressed as a percentage) multiplied by the notional
76 OPPENHEIMER CAPITAL INCOME FUND
| | |
| |
| | |
| | |
| 6. Risk Exposures and the Use of Derivative Instruments (Continued) | | |
amount of the contract. The Fund will receive payments equal to the positive price movement of the same securities or index (expressed as a percentage) multiplied by the notional amount of the contract and, in some cases, dividends paid on the securities.
For the year ended August 29, 2014, the Fund had ending monthly average notional amounts of $ 9,367,546 on total return swaps which are long the reference asset.
Additional associated risks to the Fund include counterparty credit risk and liquidity risk.
Swaption Transactions
The Fund may enter into a swaption contract which grants the purchaser the right, but not the obligation, to enter into a swap transaction at preset terms detailed in the underlying agreement within a specified period of time. The purchaser pays a premium to the swaption writer who bears the risk of unfavorable changes in the preset terms on the underlying swap.
Purchased swaptions are reported as a component of investments in the Consolidated Statement of Investments and the Consolidated Statement of Assets and Liabilities. Written swaptions are reported on a schedule following the Consolidated Statement of Investments and their value is reported as a separate asset or liability line item in the Consolidated Statement of Assets and Liabilities. The net change in unrealized appreciation or depreciation on written swaptions is separately reported in the Consolidated Statement of Operations. When a swaption is exercised, the cost of the swap is adjusted by the amount of premium paid or received. Upon the expiration or closing of an unexercised swaption contract, a gain or loss is reported in the Consolidated Statement of Operations for the amount of the premium paid or received.
The Fund generally will incur a greater risk when it writes a swaption than when it purchases a swaption. When the Fund writes a swaption it will become obligated, upon exercise of the swaption, according to the terms of the underlying agreement. Swaption contracts written by the Fund do not give rise to counterparty credit risk prior to exercise as they obligate the Fund, not its counterparty, to perform. When the Fund purchases a swaption it only risks losing the amount of the premium it paid if the swaption expires unexercised. However, when the Fund exercises a purchased swaption there is a risk that the counterparty will fail to perform or otherwise default on its obligations under the swaption contract.
The Fund has purchased swaptions which gives it the option to enter into an interest rate swap in which it pays a fixed interest rate and receives a floating interest rate in order to decrease exposure to interest rate risk. A purchased swaption of this type becomes more valuable as the reference interest rate increases relative to the preset interest rate.
The Fund has purchased swaptions which gives it the option to buy credit protection through credit default swaps in order to decrease exposure to the credit risk of individual issuers and/or indexes of issuers. A purchased swaption of this type becomes more valuable as the likelihood of a credit event on the reference asset increases.
During the year ended August 29, 2014, the Fund had an ending monthly average market value of $ 7,083,522 on purchased swaptions.
As of August 29, 2014, the Fund had no outstanding written swaptions.
77 OPPENHEIMER CAPITAL INCOME FUND
| | | | |
| |
NOTES TO CONSOLIDATED FINANCIAL STATEMENTS Continued | | |
| | |
| 6. Risk Exposures and the Use of Derivative Instruments (Continued) | | |
Counterparty Credit Risk. Derivative positions are subject to the risk that the counterparty will not fulfill its obligation to the Fund. The Fund intends to enter into derivative transactions with counterparties that the Manager believes to be creditworthy at the time of the transaction.
The Fund’s risk of loss from counterparty credit risk on OTC derivatives is generally limited to the aggregate unrealized gain netted against any collateral held by the Fund. For OTC options purchased, the Fund bears the risk of loss of the amount of the premiums paid plus the positive change in market values net of any collateral held by the Fund should the counterparty fail to perform under the contracts. Options written by the Fund do not typically give rise to counterparty credit risk, as options written generally obligate the Fund and not the counterparty to perform.
To reduce counterparty risk with respect to OTC transactions, the Fund has entered into master netting arrangements, established within the Fund’s International Swap and Derivatives Association, Inc. (“ISDA”) master agreements, which allow the Fund to make (or to have an entitlement to receive) a single net payment in the event of default (close-out netting) for outstanding payables and receivables with respect to certain OTC positions in swaps, options, swaptions, and forward currency exchange contracts for each individual counterparty. In addition, the Fund may require that certain counterparties post cash and/or securities in collateral accounts to cover their net payment obligations for those derivative contracts subject to ISDA master agreements. If the counterparty fails to perform under these contracts and agreements, the cash and/or securities will be made available to the Fund.
As of August 29, 2014, the Fund has required certain counterparties to post collateral of $5,387,538.
ISDA master agreements include credit related contingent features which allow counterparties to OTC derivatives to terminate derivative contracts prior to maturity in the event that, for example, the Fund’s net assets decline by a stated percentage or the Fund fails to meet the terms of its ISDA master agreements, which would cause the Fund to accelerate payment of any net liability owed to the counterparty.
For financial reporting purposes, the Fund does not offset derivative assets and derivative liabilities that are subject to netting arrangements in the Consolidated Statement of Assets and Liabilities. Bankruptcy or insolvency laws of a particular jurisdiction may impose restrictions on or prohibitions against the right of offset in bankruptcy, insolvency or other events.
The Fund’s risk of loss from counterparty credit risk on exchange-traded derivatives cleared through a clearinghouse and for centrally cleared swaps is generally considered lower than as compared to OTC derivatives. However, counterparty credit risk exists with respect to initial and variation margin deposited/paid by the Fund that is held in futures commission merchant, broker and/or clearinghouse accounts for such exchange-traded derivatives and for centrally cleared swaps.
With respect to centrally cleared swaps, such transactions will be submitted for clearing, and if cleared, will be held in accounts at futures commission merchants or brokers that are members of clearinghouses. While brokers, futures commission merchants and clearinghouses are required to segregate customer margin from their own assets, in the event that a broker,
78 OPPENHEIMER CAPITAL INCOME FUND
| | |
| |
| | |
| | |
| 6. Risk Exposures and the Use of Derivative Instruments (Continued) | | |
futures commission merchant or clearinghouse becomes insolvent or goes into bankruptcy and at that time there is a shortfall in the aggregate amount of margin held by the broker, futures commission merchant or clearinghouse for all its customers, U.S. bankruptcy laws will typically allocate that shortfall on a pro-rata basis across all the broker’s, futures commission merchant’s or clearinghouse’s customers, potentially resulting in losses to the Fund.
There is the risk that a broker, futures commission merchant or clearinghouse will decline to clear a transaction on the Fund’s behalf, and the Fund may be required to pay a termination fee to the executing broker with whom the Fund initially enters into the transaction. Clearinghouses may also be permitted to terminate centrally cleared swaps at any time. The Fund is also subject to the risk that the broker or futures commission merchant will improperly use the Fund’s assets deposited/paid as initial or variation margin to satisfy payment obligations of another customer. In the event of a default by another customer of the broker or futures commission merchant, the Fund might not receive its variation margin payments from the clearinghouse, due to the manner in which variation margin payments are aggregated for all customers of the broker/futures commission merchant.
Collateral and margin requirements differ by type of derivative. Margin requirements are established by the broker, futures commission merchant or clearinghouse for exchange-traded and cleared derivatives, including centrally cleared swaps. Brokers, futures commission merchants and clearinghouses can ask for margin in excess of the regulatory minimum, or increase the margin amount, in certain circumstances.
Collateral terms are contract specific for OTC derivatives. For derivatives traded under an ISDA master agreement, the collateral requirements are typically calculated by netting the mark to market amount for each transaction under such agreement and comparing that amount to the value of any collateral currently pledged by the Fund or the counterparty.
For financial reporting purposes, cash collateral that has been pledged to cover obligations of the Fund, if any, is reported separately on the Consolidated Statement of Assets and Liabilities as cash pledged as collateral. Non-cash collateral pledged by the Fund, if any, is noted in the Consolidated Statement of Investments. Generally, the amount of collateral due from or to a party must exceed a minimum transfer amount threshold (e.g. $250,000) before a transfer has to be made. To the extent amounts due to the Fund from its counterparties are not fully collateralized, contractually or otherwise, the Fund bears the risk of loss from counterparty nonperformance.
The following table presents by counterparty the Fund’s OTC derivative assets net of the related collateral posted for the benefit of the Fund at August 29, 2014.
| | | | | | | | | | | | | | | | | | | | |
| | | | | | Gross Amounts Not Offset in the Consolidated
Statement of Assets & Liabilities | | | | |
| Counterparty | | Gross Amount of Assets in
the Consolidated
Statement of Assets &
Liabilities* | | | Financial
Instruments
Available for
Offset | | | Financial
Instruments
Collateral
Received** | | | Cash
Collateral
Received** | | | Net
Amount | |
Bank of America NA | | $ | 567,935 | | | $ | — | | | $ | (552,591 | ) | | $ | — | | | $ | 15,344 | |
Deutsche Bank AG | | | 4,389 | | | | (4,389 | ) | | | — | | | | — | | | | — | |
79 OPPENHEIMER CAPITAL INCOME FUND
| | | | |
| |
NOTES TO CONSOLIDATED FINANCIAL STATEMENTS Continued | | |
| | |
| 6. Risk Exposures and the Use of Derivative Instruments (Continued) | | |
| | | | | | | | | | | | | | | | | | | | |
| | | | | | Gross Amounts Not Offset in the Consolidated Statement of Assets & Liabilities | | | | |
| Counterparty | | Gross Amount of Assets in
the Consolidated
Statement of Assets &
Liabilities* | | | Financial
Instruments
Available
for Offset | | | Financial
Instruments
Collateral
Received** | | | Cash
Collateral
Received** | | | Net
Amount | |
Goldman Sachs Group, Inc. (The) | | $ | 931,945 | | | $ | — | | | $ | (931,945 | ) | | $ | — | | | $ | — | |
JPMorgan Chase Bank NA | | | 3,612,242 | | | | — | | | | (3,612,242 | ) | | | — | | | | — | |
Royal Bank of Scotland plc (The) | | | 340,530 | | | | — | | | | — | | | | — | | | | 340,530 | |
| | | | |
| | $ | 5,457,041 | | | $ | (4,389 | ) | | $ | (5,096,778 | ) | | $ | — | | | $ | 355,874 | |
| | | | |
* OTC derivatives are reported gross on the Consolidated Statement of Assets and Liabilities. Exchange traded options and margin related to centrally cleared swaps and futures are excluded from these reported amounts.
** Reported collateral posted for the benefit of the Fund within this table is limited to the net outstanding amount due from an individual counterparty. The collateral posted for the benefit of the Fund may exceed these amounts.
The following table presents by counterparty the Fund’s OTC derivative liabilities net of the related collateral pledged by the Fund at August 29, 2014.
| | | | | | | | | | | | | | | | | | | | |
| | | | | | Gross Amounts Not Offset in the Consolidated Statement of Assets & Liabilities | | | | |
| Counterparty | | Gross Amount of Liabilities in the Consolidated
Statement of
Assets &
Liabilities* | | | Financial
Instruments
Available for
Offset | | | Financial
Instruments
Collateral
Pledged** | | | Cash
Collateral
Pledged** | | | Net
Amount | |
Deutsche Bank AG | | $ | (573,080 | ) | | $ | 4,389 | | | $ | — | | | $ | 560,000 | | | $ | (8,691 | ) |
* OTC derivatives are reported gross on the Consolidated Statement of Assets and Liabilities. Exchange traded options and margin related to centrally cleared swaps and futures are excluded from these reported amounts.
** Reported collateral pledged within this table is limited to the net outstanding amount due from the Fund. The securities pledged as collateral by the Fund as reported on the Consolidated Statements of investments may exceed these amounts.
The following table presents the valuations of derivative instruments by risk exposure as reported within the Consolidated Statement of Assets and Liabilities as of August 29, 2014:
| | | | | | | | | | | | |
| | | Asset Derivatives | | | | | Liability Derivatives | | | |
Derivatives Not
Accounted for as
Hedging
Instruments | | Consolidated Statement
of Assets and Liabilities
Location | | Value | | | Consolidated Statement of
Assets and Liabilities Location | | Value | |
Credit contracts | | Swaps, at value | | $ | 581,134 | | | Centrally cleared swaps, at value | | $ | 1,726,450 | |
Equity contracts | | Swaps, at value | | | 916,532 | | | | | | | |
Interest rate contracts | | Variation margin receivable | | | 92 | * | | Variation margin payable | | | 140,039 | * |
80 OPPENHEIMER CAPITAL INCOME FUND
| | | | |
| | |
| | | | |
| | |
| 6. Risk Exposures and the Use of Derivative Instruments (Continued) | | |
| | | | | | | | | | | | |
| | | Asset Derivatives | | | | | Liability Derivatives | | | |
Derivatives Not
Accounted for as
Hedging
Instruments
(Continued) | | Consolidated Statement
of Assets and Liabilities
Location | | Value | | | Consolidated Statement
of Assets and Liabilities
Location | | Value | |
Foreign exchange contracts | | Unrealized appreciation on
foreign currency exchange
contracts | | $ | 908,465 | | | Unrealized depreciation on
foreign currency exchange
contracts | | $ | 573,080 | |
Credit contracts | | Investments, at value | | | 83,244 | ** | | | | | | |
Equity contracts | | Investments, at value | | | 830,000 | ** | | | | | | |
Interest rate contracts | | Investments, at value | | | 3,375,869 | ** | | | | | | |
| | | | | | | | | | | | |
Total | | | | $ | 6,695,336 | | | | | $ | 2,439,569 | |
| | | | | | | | | | | | |
*Includes only the current day’s variation margin. Prior variation margin movements have been reflected in cash on the Consolidated Statement of Assets and Liabilities upon receipt or payment.
**Amounts relate to purchased option contracts and purchased swaption contracts.
The effect of derivative instruments on the Consolidated Statement of Operations is as follows:
| | | | | | | | | | | | | | | | | | | | |
| Amount of Realized Gain or (Loss) Recognized on Derivatives | |
Derivatives Not
Accounted for as
Hedging Instruments | | Investment
from
unaffiliated
companies* | | | Closing and
expiration of
futures
contracts | | | Foreign
currency
transactions | | | Swap contracts | | | Total | |
Commodity contracts | | $ | — | | | $ | (601,958 | ) | | $ | — | | | $ | — | | | $ | (601,958 | ) |
Credit contracts | | | — | | | | — | | | | — | | | | 18,963 | | | | 18,963 | |
Equity contracts | | | 342,616 | | | | (2,807,008 | ) | | | — | | | | 4,322,241 | | | | 1,857,849 | |
Foreign exchange contracts | | | (390,000 | ) | | | — | | | | 659,314 | | | | — | | | | 269,314 | |
Interest rate contracts | | | (891,118 | ) | | | 898,201 | | | | — | | | | — | | | | 7,083 | |
| | | | |
Total | | $ | (938,502 | ) | | $ | (2,510,765 | ) | | $ | 659,314 | | | $ | 4,341,204 | | | $ | 1,551,251 | |
| | | | |
*Includes purchased option contracts, purchased swaption contracts, written option contracts exercised and written swaption contracts exercised if any.
| | | | | | | | | | | | | | | | | | | | |
| Amount of Change in Unrealized Gain or (Loss) Recognized on Derivatives | |
Derivatives Not
Accounted for as
Hedging Instruments | | Investments* | | | Futures
contracts | | | Translation of
assets and
liabilities
denominated in
foreign
currencies | | | Swap contracts | | | Total | |
Commodity contracts | | $ | — | | | $ | 287,291 | | | $ | — | | | $ | — | | | $ | 287,291 | |
Credit contracts | | | (395,427 | ) | | | — | | | | — | | | | 338,211 | | | | (57,216 | ) |
Equity contracts | | | 1,063,415 | | | | — | | | | — | | | | 367,763 | | | | 1,431,178 | |
Foreign exchange contracts | | | 305,940 | | | | — | | | | 502,756 | | | | — | | | | 808,696 | |
Interest rate contracts | | | (8,502,680 | ) | | | 2,965 | | | | — | | | | — | | | | (8,499,715 | ) |
| | | | |
Total | | $ | (7,528,752 | ) | | $ | 290,256 | | | $ | 502,756 | | | $ | 705,974 | | | $ | (6,029,766 | ) |
| | | | |
*Includes purchased option contracts and purchased swaption contracts, if any.
81 OPPENHEIMER CAPITAL INCOME FUND
| | | | |
| |
NOTES TO CONSOLIDATED FINANCIAL STATEMENTS (Continued) | | |
7. Restricted Securities
As of August 29, 2014, investments in securities included issues that are restricted. A restricted security may have a contractual restriction on its resale and is valued under methods approved by the Board of Trustees as reflecting fair value. Securities that are restricted are marked with an applicable footnote on the Consolidated Statement of Investments. Restricted securities are reported on a schedule following the Consolidated Statement of Investments.
8. Pending Litigation
In 2009, seven class action lawsuits were filed in the U.S. District Court for the District of Colorado against OppenheimerFunds, Inc. (“OFI”), OppenheimerFunds Distributor, Inc., the Fund’s principal underwriter and distributor (the “Distributor”), and certain funds (but not including the Fund) advised by OFI Global Asset Management, Inc. and distributed by the Distributor (the “Defendant Funds”). The lawsuits also named as defendants certain officers and current and former trustees of the respective Defendant Funds. The lawsuits raised claims under federal securities law and alleged, among other things, that the disclosure documents of the respective Defendant Funds contained misrepresentations and omissions and that the respective Defendant Funds’ investment policies were not followed. The plaintiffs in these actions sought unspecified damages, equitable relief and awards of attorneys’ fees and litigation expenses. The Defendant Funds’ Boards of Trustees also engaged counsel to represent the Funds and the present and former Independent Trustees named in those suits. On March 5, 2014, the parties in six of these lawsuits executed stipulations and agreements of settlement resolving those actions. On July 31, 2014, the court entered an order and final judgment approving the settlements as fair, reasonable and adequate. The settlements do not resolve a seventh outstanding lawsuit relating to Oppenheimer Rochester California Municipal Fund.
Other class action and individual lawsuits have been filed since 2008 in various state and federal courts against OFI and certain of its affiliates by investors seeking to recover investments they allegedly lost as a result of the “Ponzi” scheme run by Bernard L. Madoff and his firm, Bernard L. Madoff Investment Securities, LLC (“BLMIS”). Plaintiffs in these suits allege that they suffered losses as a result of their investments in several funds managed by an affiliate of OFI and assert a variety of claims, including breach of fiduciary duty, fraud, negligent misrepresentation, unjust enrichment, and violation of federal and state securities laws and regulations, among others. They seek unspecified damages, equitable relief and awards of attorneys’ fees and litigation expenses. Neither the Distributor, nor any of the Oppenheimer mutual funds, their independent trustees or directors are named as defendants in these lawsuits. None of the Oppenheimer mutual funds invested in any funds or accounts managed by Madoff or BLMIS. On February 28, 2011, a stipulation of partial settlement of three groups of consolidated putative class action lawsuits relating to these matters was filed in the U.S. District Court for the Southern District of New York. On August 19, 2011, the court entered an order and final judgment approving the settlement as fair, reasonable and adequate. In September 2011, certain parties filed notices of appeal from the court’s order approving the settlement. In June 2014, the appellate court affirmed the lower court’s order
82 OPPENHEIMER CAPITAL INCOME FUND
8. Pending Litigation (Continued)
approving the settlement. Certain parties subsequently filed a petition for certiorari before the U.S. Supreme Court further challenging the settlement approval order. The settlement does not resolve other outstanding lawsuits against OFI and its affiliates relating to BLMIS.
OFI believes the lawsuits and appeals described above are without legal merit and, with the exception of actions it has settled, is defending against them vigorously. While it is premature to render any opinion as to the outcome in these lawsuits, or whether any costs that the Defendant Funds may bear in defending the suits might not be reimbursed by insurance, OFI believes that these suits should not impair the ability of OFI or the Distributor to perform their respective duties to the Fund, and that the outcome of all of the suits together should not have any material effect on the operations of any of the Oppenheimer mutual funds.
83 OPPENHEIMER CAPITAL INCOME FUND
| | | | |
| |
REPORT OF INDEPENDENT REGISTERED PUBLIC ACCOUNTING FIRM | | |
| | |
| The Board of Trustees and Shareholders of Oppenheimer Capital Income Fund: | | |
We have audited the accompanying consolidated statement of assets and liabilities of Oppenheimer Capital Income Fund, including the consolidated statement of investments, as of August 29, 2014, and the related consolidated statement of operations for the year then ended, the consolidated statements of changes in net assets for each of the years in the two-year period then ended, and the consolidated financial highlights for each of the years or periods in the five-year period then ended. These consolidated financial statements and consolidated financial highlights are the responsibility of the Fund’s management. Our responsibility is to express an opinion on these consolidated financial statements and financial highlights based on our audits.
We conducted our audits in accordance with the standards of the Public Company Accounting Oversight Board (United States). Those standards require that we plan and perform the audit to obtain reasonable assurance about whether the financial statements and financial highlights are free of material misstatement. An audit includes examining, on a test basis, evidence supporting the amounts and disclosures in the financial statements. Our procedures included confirmation of securities owned as of August 29, 2014, by correspondence with the custodian, transfer agent and brokers, or by other appropriate auditing procedures where replies from brokers were not received. An audit also includes assessing the accounting principles used and significant estimates made by management, as well as evaluating the overall financial statement presentation. We believe that our audits provide a reasonable basis for our opinion.
In our opinion, the consolidated financial statements and financial highlights referred to above present fairly, in all material respects, the financial position of Oppenheimer Capital Income Fund as of August 29, 2014, the results of its operations for the year then ended, the changes in its net assets for each of the years in the two-year period then ended, and the financial highlights for each of the years or periods in the five-year period then ended, in conformity with U.S. generally accepted accounting principles.
KPMGLLP
Denver, Colorado
October 20, 2014
84 OPPENHEIMER CAPITAL INCOME FUND
| | | | |
| |
FEDERAL INCOME TAX INFORMATION Unaudited | | |
In early 2014, if applicable, shareholders of record received information regarding all dividends and distributions paid to them by the Fund during calendar year 2013.
Dividends, if any, paid by the Fund during the fiscal year ended August 29, 2014 which are not designated as capital gain distributions should be multiplied by the maximum amount allowable but not less than 15.79% to arrive at the amount eligible for the corporate dividend-received deduction.
A portion, if any, of the dividends paid by the Fund during the fiscal year ended August 29, 2014 which are not designated as capital gain distributions are eligible for lower individual income tax rates to the extent that the Fund has received qualified dividend income as stipulated by recent tax legislation. The maximum amount allowable but not less than $15,784,223 of the Fund’s fiscal year taxable income may be eligible for the lower individual income tax rates. In early 2014, shareholders of record received information regarding the percentage of distributions that are eligible for lower individual income tax rates.
Recent tax legislation allows a regulated investment company to designate distributions not designated as capital gain distributions, as either interest related dividends or short-term capital gain dividends, both of which are exempt from the U.S. withholding tax applicable to non U.S. taxpayers. For the fiscal year ended August 29, 2014, the maximum amount allowable but not less than $39,133,126 of the ordinary distributions to be paid by the Fund qualifies as an interest related dividend.
The foregoing information is presented to assist shareholders in reporting distributions received from the Fund to the Internal Revenue Service. Because of the complexity of the federal regulations which may affect your individual tax return and the many variations in state and local tax regulations, we recommend that you consult your tax advisor for specific guidance.
85 OPPENHEIMER CAPITAL INCOME FUND
| | | | |
| |
BOARD APPROVAL OF THE FUND’S INVESTMENT ADVISORY AND SUB-ADVISORY AGREEMENTS Unaudited | | |
The Fund has entered into an investment advisory agreement with OFI Global Asset Management, Inc. (“OFI Global” or the “Adviser”), a wholly-owned subsidiary of OppenheimerFunds, Inc. (“OFI” or the “Sub-Adviser”) (“OFI Global” and “OFI” together the “Managers”) and OFI Global has entered into a sub-advisory agreement with OFI whereby OFI provides investment sub-advisory services to the Fund (collectively, the “Agreements”). Each year, the Board of Trustees (the “Board”), including a majority of the independent Trustees, is required to determine whether to renew the Agreements. The Investment Company Act of 1940, as amended, requires that the Board request and evaluate, and that the Managers provide, such information as may be reasonably necessary to evaluate the terms of the Agreements. The Board employs an independent consultant to prepare a report that provides information, including comparative information that the Board requests for that purpose. In addition to in-person meetings focused on this evaluation, the Board receives information throughout the year regarding Fund services, fees, expenses and performance.
The Adviser, Sub-Adviser and the independent consultant provided information to the Board on the following factors: (i) the nature, quality and extent of the Managers’ services, (ii) the investment performance of the Fund and the Managers, (iii) the fees and expenses of the Fund, including comparative expense information, (iv) the profitability of the Managers and their affiliates, including an analysis of the cost of providing services, (v) whether economies of scale are realized as the Fund grows and whether fee levels reflect these economies of scale for Fund investors and (vi) other benefits to the Managers from their relationship with the Fund. The Board was aware that there are alternatives to retaining the Managers.
Outlined below is a summary of the principal information considered by the Board as well as the Board’s conclusions.
Nature, Quality and Extent of Services. The Board considered information about the nature, quality and extent of the services provided to the Fund and information regarding the Managers’ key personnel who provide such services. The Sub-Adviser’s duties include providing the Fund with the services of the portfolio managers and the Sub-Adviser’s investment team, who provide research, analysis and other advisory services in regard to the Fund’s investments; securities trading services; oversight of third-party service providers; monitoring compliance with applicable Fund policies and procedures and adherence to the Fund’s investment restrictions; and risk management. The Managers are responsible for providing certain administrative services to the Fund as well. Those services include providing and supervising all administrative and clerical personnel who are necessary in order to provide effective corporate administration for the Fund; compiling and maintaining records with respect to the Fund’s operations; preparing and filing reports required by the Securities and Exchange Commission; preparing periodic reports regarding the operations of the Fund for its shareholders; preparing proxy materials for shareholder meetings; and preparing the registration statements required by Federal and state securities laws for the sale of the Fund’s shares. The Managers also provide the Fund with office space, facilities and equipment.
The Board also considered the quality of the services provided and the quality of the Managers’ resources that are available to the Fund. The Board took account of the fact that the Sub-Adviser has had over fifty years of experience as an investment adviser and that its assets under management rank it among the top mutual fund managers in the United States.
86 OPPENHEIMER CAPITAL INCOME FUND
The Board evaluated the Sub-Adviser’s advisory, administrative, accounting, legal, compliance services and risk management, and information the Board has received regarding the experience and professional qualifications of the Managers’ key personnel and the size and functions of its staff. In its evaluation of the quality of the portfolio management services provided, the Board considered the experience of Michelle Borré and Krishna Memani, the portfolio managers for the Fund, and the Sub-Adviser’s investment team and analysts. The Board members also considered the totality of their experiences with the Managers as directors or trustees of the Fund and other funds advised by the Managers. The Board considered information regarding the quality of services provided by affiliates of the Managers, which its members have become knowledgeable about in connection with the renewal of the Fund’s service agreements. The Board concluded, in light of the Managers’ experience, reputation, personnel, operations and resources that the Fund benefits from the services provided under the Agreements.
Investment Performance of the Manager, the Sub-Adviser and the Fund. Throughout the year, the Manager and the Sub-Adviser provided information on the investment performance of the Fund, the Adviser and the Sub-Adviser, including comparative performance information. The Board also reviewed information, prepared by the Manager, the Sub-Adviser and the independent consultant, comparing the Fund’s historical performance to its benchmarks and to the performance of other retail conservative allocation funds. The Board considered that the Fund outperformed its performance category median for the one-year, three-year and five-year periods, although it underperformed its performance category median for the ten-year period. The Board also considered that the Fund’s performance for the one- and three-year periods was in the second quintile of its performance category. The Board also noted that the Fund had changed portfolio managers effective April 15, 2009 and that the Fund’s one-, three- and five-year rankings are evidence of the strong performance the portfolio managers have delivered for the Fund.
Costs of Services by the Manager. The Board reviewed the fees paid to the Manager and the other expenses borne by the Fund. The Board noted that the Manager, not the Fund, pays the Sub-Adviser’s fee under the sub-advisory agreement. The independent consultant provided comparative data in regard to the fees and expenses of the Fund and other retail front-end load conservative allocation funds with comparable asset levels and distribution features. The Board noted that the Fund’s contractual management fees and total expenses were lower than its peer group median and category median. Within the average net asset range of $1 billion to $2 billion, the Fund’s effective management fee rate was lower than its peer group median and category median.
Economies of Scale and Profits Realized by the Manager and Sub-Adviser. The Board considered information regarding the Managers’ costs in serving as the Fund’s investment adviser and sub-adviser, including the costs associated with the personnel and systems necessary to manage the Fund, and information regarding the Managers’ profitability from their relationship with the Fund. The Board reviewed whether the Managers may realize economies of scale in managing and supporting the Fund. The Board noted that the Fund currently has management fee breakpoints, which are intended to share with Fund shareholders economies of scale that may exist as the Fund’s assets grow.
87 OPPENHEIMER CAPITAL INCOME FUND
| | | | |
| |
BOARD APPROVAL OF THE FUND’S INVESTMENT ADVISORY AND SUB-ADVISORY AGREEMENTS Unaudited / Continued | | |
Other Benefits to the Managers. In addition to considering the profits realized by the Managers, the Board considered information that was provided regarding the direct and indirect benefits the Managers receive as a result of their relationship with the Fund, including compensation paid to the Managers’ affiliates and research provided to the Adviser in connection with permissible brokerage arrangements (soft dollar arrangements).The Board also considered that the Managers must be able to pay and retain experienced professional personnel at competitive rates to provide quality services to the Fund.
Conclusions. These factors were also considered by the independent Trustees meeting separately from the full Board, assisted by experienced counsel to the Fund and to the independent Trustees. Fund counsel and the independent Trustees’ counsel are independent of the Managers within the meaning and intent of the Securities and Exchange Commission Rules.
Based on its review of the information it received and its evaluations described above, the Board, including a majority of the independent Trustees, decided to continue the Agreements through August 31, 2015. In arriving at its decision, the Board did not identify any factor or factors as being more important than others, but considered all of the above information, and considered the terms and conditions of the Agreements, including the management fees, in light of all the surrounding circumstances.
88 OPPENHEIMER CAPITAL INCOME FUND
| | | | |
| |
PORTFOLIO PROXY VOTING POLICIES AND PROCEDURES; UPDATES TO STATEMENTS OF INVESTMENTS Unaudited | | |
| | |
| | |
The Fund has adopted Portfolio Proxy Voting Policies and Procedures under which the Fund votes proxies relating to securities (“portfolio proxies”) held by the Fund. A description of the Fund’s Portfolio Proxy Voting Policies and Procedures is available (i) without charge, upon request, by calling the Fund toll-free at 1.800.CALL OPP (225.5677), (ii) on the Fund’s website at oppenheimerfunds.com, and (iii) on the SEC’s website at www.sec.gov. In addition, the Fund is required to file Form N-PX, with its complete proxy voting record for the 12 months ended June 30th, no later than August 31st of each year. The Fund’s voting record is available (i) without charge, upon request, by calling the Fund toll-free at 1.800.CALL OPP (225.5677), and (ii) in the Form N-PX filing on the SEC’s website at www.sec.gov.
The Fund files its complete schedule of portfolio holdings with the SEC for the first quarter and the third quarter of each fiscal year on Form N-Q. The Fund’s Form N-Q filings are available on the SEC’s website at www.sec.gov. Those forms may be reviewed and copied at the SEC’s Public Reference Room in Washington, D.C. Information on the operation of the Public Reference Room may be obtained by calling 1-800-SEC-0330.
Householding—Delivery of Shareholder Documents
This is to inform you about OppenheimerFunds’ “householding” policy. If more than one member of your household maintains an account in a particular fund, OppenheimerFunds will mail only one copy of the fund’s prospectus (or, if available, the fund’s summary prospectus), annual and semiannual report and privacy policy. The consolidation of these mailings, called householding, benefits your fund through reduced mailing expense, and benefits you by reducing the volume of mail you receive from OppenheimerFunds. Householding does not affect the delivery of your account statements.
Please note that we will continue to household these mailings for as long as you remain an OppenheimerFunds shareholder, unless you request otherwise. If you prefer to receive multiple copies of these materials, please call us at 1.800.CALL-OPP (225-5677). You may also notify us in writing or via email. We will begin sending you individual copies of the prospectus (or, if available, the summary prospectus), reports and privacy policy within 30 days of receiving your request to stop householding.
89 OPPENHEIMER CAPITAL INCOME FUND
| | | | |
| |
| TRUSTEES AND OFFICERS (AS OF 9/30/14) Unaudited | | |
| | |
Name, Position(s) Held with the Fund,
Length of Service, Year of Birth | | Principal Occupation(s) During the Past 5 Years; Other Trusteeships/Directorships Held; Number of Portfolios in the Fund Complex Currently Overseen |
| |
| INDEPENDENT TRUSTEES | | The address of each Trustee in the chart below is 6803 S. Tucson Way, Centennial, Colorado 80112-3924. Each Trustee serves for an indefinite term, or until his or her resignation, retirement, death or removal. |
| |
Sam Freedman,
Chairman of the Board of Trustees (since
2012) and Trustee (since 1996)
Year of Birth: 1940 | | Director of Colorado UpLIFT (charitable organization) (since September 1984). Mr. Freedman held several positions with the Sub-Adviser and with subsidiary or affiliated companies of the Sub-Adviser (until October 1994). Oversees 39 portfolios in the OppenheimerFunds complex. Mr. Freedman has served on the Boards of certain Oppenheimer funds since 1996, during which time he has become familiar with the Fund’s (and other Oppenheimer funds’) financial, accounting, regulatory and investment matters and has contributed to the Boards’ deliberations. |
| |
Jon S. Fossel,
Trustee (since 1990)
Year of Birth: 1942 | | Chairman of the Board (2006-December 2011) and Director (June 2002-December 2011) of UNUMProvident (insurance company); Director of Northwestern Energy Corp. (public utility corporation) (November 2004-December 2009); Director of P.R. Pharmaceuticals (October 1999-October 2003); Director of Rocky Mountain Elk Foundation (non-profit organization) (February 1998-February 2003 and February 2005-February 2007); Chairman and Director (until October 1996) and President and Chief Executive Officer (until October 1995) of the Sub-Adviser; President, Chief Executive Officer and Director of the following: Oppenheimer Acquisition Corp. (“OAC”) (parent holding company of the Sub-Adviser), Shareholders Services, Inc. and Shareholder Financial Services, Inc. (until October 1995). Oversees 39 portfolios in the OppenheimerFunds complex. Mr. Fossel has served on the Boards of certain Oppenheimer funds since 1990, during which time he has become familiar with the Fund’s (and other Oppenheimer funds’) financial, accounting, regulatory and investment matters and has contributed to the Boards’ deliberations. |
| |
Richard F. Grabish,
Trustee (since 2012)
Year of Birth: 1948 | | Formerly Senior Vice President and Assistant Director of Sales and Marketing (March 1997-December 2007), Director (March 1987-December 2007) and Manager of Private Client Services (June 1985-June 2005) of A.G. Edwards & Sons, Inc. (broker/dealer and investment firm); Chairman and Chief Executive Officer of A.G. Edwards Trust Company, FSB (March 2001-December 2007); President and Vice Chairman of A.G. Edwards Trust Company, FSB (investment adviser) (April 1987-March 2001); President of A.G. Edwards Trust Company, FSB (investment adviser) (June 2005-December 2007). Oversees 39 portfolios in the OppenheimerFunds complex. Mr. Grabish has served on the Boards of certain Oppenheimer funds since 2001, during which time he has become familiar with the Fund’s (and other Oppenheimer funds’) financial, accounting, regulatory and investment matters and has contributed to the Boards’ deliberations. |
90 OPPENHEIMER CAPITAL INCOME FUND
| | |
Beverly L. Hamilton,
Trustee (since 2002)
Year of Birth: 1946 | | Trustee of Monterey Institute for International Studies (educational organization) (since February 2000); Board Member of Middlebury College (educational organization) (December 2005-June 2011); Chairman (since 2010) of American Funds’ Emerging Markets Growth Fund, Inc. (mutual fund); Director of The California Endowment (philanthropic organization) (April 2002-April 2008); Director (February 2002-2005) and Chairman of Trustees (2006-2007) of the Community Hospital of Monterey Peninsula; Director (October 1991-2005); Vice Chairman (2006-2009) of American Funds’ Emerging Markets Growth Fund, Inc. (mutual fund); President of ARCO Investment Management Company (February 1991-April 2000); Member of the investment committees of The Rockefeller Foundation (2001-2006) and The University of Michigan (since 2000); Advisor at Credit Suisse First Boston’s Sprout venture capital unit (venture capital fund) (1994-January 2005); Trustee of MassMutual Institutional Funds (investment company) (1996-June 2004); Trustee of MML Series Investment Fund (investment company) (April 1989-June 2004); Member of the investment committee of Hartford Hospital (2000-2003); and Advisor to Unilever (Holland) pension fund (2000-2003). Oversees 39 portfolios in the OppenheimerFunds complex. Ms. Hamilton has served on the Boards of certain Oppenheimer funds since 2002, during which time she has become familiar with the Fund’s (and other Oppenheimer funds’) financial, accounting, regulatory and investment matters and has contributed to the Boards’ deliberations. |
| |
Victoria J. Herget,
Trustee (since 2012)
Year of Birth:1951 | | Independent Director of the First American Funds (mutual fund family) (2003-2011); former Managing Director (1993-2001), Principal (1985-1993), Vice President (1978-1985) and Assistant Vice President (1973-1978) of Zurich Scudder Investments (and its predecessor firms); Board Chair (2008-Present) and Director (2004-Present), United Educators (insurance company); Trustee (1992-2007), Chair of the Board of Trustees (1999-2007), Investment Committee Chair (1994-1999) and Investment Committee member (2007-2010) of Wellesley College; Trustee (since 2000) and Chair (since 2010), Newberry Library; Trustee, Mather LifeWays (since 2001); Trustee, BoardSource (2006-2009) and Chicago City Day School (1994-2005). Oversees 39 portfolios in the OppenheimerFunds complex. Ms. Herget has served on the Boards of certain Oppenheimer funds since 2012, during which time she has become familiar with the Fund’s (and other Oppenheimer funds’) financial, accounting, regulatory and investment matters and has contributed to the Boards’ deliberations. |
| |
Robert J. Malone,
Trustee (since 2002)
Year of Birth: 1944 | | Chairman of the Board (since 2012) and Director (since August 2005) of Jones International University (educational organization) (since August 2005); Chairman, Chief Executive Officer and Director of Steele Street Bank Trust (commercial banking) (since August 2003); Trustee of the Gallagher Family Foundation (non-profit organization) (since 2000); Board of Directors of Opera Colorado Foundation (non-profit organization) (2008-2012); Director of Colorado UpLIFT (charitable organization) (1986-2010); Director of Jones Knowledge, Inc. (2006-2010); Former Chairman of U.S. Bank-Colorado (subsidiary of U.S. Bancorp and formerly Colorado National Bank) (July 1996-April 1999); Director of Commercial Assets, Inc. (real estate investment trust) |
91 OPPENHEIMER CAPITAL INCOME FUND
| | | | |
| |
| TRUSTEES AND OFFICERS Unaudited / Continued | | |
| | |
| | |
Robert J. Malone,
Continued | | (1993-2000); Director of U.S. Exploration, Inc. (oil and gas exploration) (1997-February 2004); Chairman of the Board (1991-1994) and Trustee (1985-1994) of Regis University; and Chairman of the Board (1990-1991 and Trustee (1984-1999) of Young Presidents Organization. Oversees 39 portfolios in the OppenheimerFunds complex. Mr. Malone has served on the Boards of certain Oppenheimer funds since 2002, during which time he has become familiar with the Fund’s (and other Oppenheimer funds’) financial, accounting, regulatory and investment matters and has contributed to the Boards’ deliberations. |
| |
F. William Marshall, Jr.,
Trustee (since 2000)
Year of Birth: 1942 | | Trustee Emeritus of Worcester Polytech Institute (WPI) (private university) (since 2009); Trustee of MassMutual Select Funds (formerly MassMutual Institutional Funds) (investment company) (since 1996), MML Series Investment Fund (investment company) (since 1996) and Mass Mutual Premier Funds (investment company) (since January 2012); President and Treasurer of the SIS Fund (private charitable fund) (January 1999 – March 2011); Former Trustee of WPI (1985-2008); Former Chairman of the Board (2004-2006) and Former Chairman of the Investment Committee of WPI (1994-2008); Chairman of SIS & Family Bank, F.S.B. (formerly SIS Bank) (commercial bank) (January 1999-July 1999); Executive Vice President of Peoples Heritage Financial Group, Inc. (commercial bank) (January 1999-July 1999); and Former President and Chief Executive Officer of SIS Bancorp. (1993-1999). Oversees 43 portfolios in the OppenheimerFunds complex. Mr. Marshall has served on the Boards of certain Oppenheimer funds since 2000, during which time he has become familiar with the Fund’s (and other Oppenheimer funds’) financial, accounting, regulatory and investment matters and has contributed to the Boards’ deliberations. |
| |
Karen L. Stuckey,
Trustee (since 2012)
Year of Birth: 1953 | | Partner (1990-2012) of PricewaterhouseCoopers LLP (held various positions 1975-1990); Emeritus Trustee (since 2006), Trustee (1992-2006) and member of Executive, Nominating and Audit Committees and Chair of Finance Committee of Lehigh University; and member, Women’s Investment Management Forum since inception. Oversees 39 portfolios in the OppenheimerFunds complex. Ms. Stuckey has served on the Boards of certain Oppenheimer funds since 2012, during which time she has become familiar with the Fund’s (and other Oppenheimer funds’) financial, accounting, regulatory and investment matters and has contributed to the Boards’ deliberations. |
| |
James D. Vaughn,
Trustee (since 2012)
Year of Birth:1945 | | Retired; former managing partner (1994-2001) of Denver office of Deloitte & Touche LLP, (held various positions 1969-1993); Trustee and Chairman of the Audit Committee of Schroder Funds (2003-2012); Board member and Chairman of Audit Committee of AMG National Trust Bank (since 2005); Trustee and Investment Committee member, University of South Dakota Foundation (since 1996); Board member, Audit Committee Member and past Board Chair, Junior Achievement (since 1993); former Board member, Mile High United Way, Boys and Girls Clubs, Boy Scouts, Colorado Business Committee for the Arts, Economic Club of Colorado and Metro Denver Network. |
92 OPPENHEIMER CAPITAL INCOME FUND
| | |
James D. Vaughn,
Continued | | Oversees 39 portfolios in the OppenheimerFunds complex. Mr. Vaughn has served on the Boards of certain Oppenheimer funds since 2012, during which time he has become familiar with the Fund’s (and other Oppenheimer funds’) financial, accounting, regulatory and investment matters and has contributed to the Boards’ deliberations. |
| | | |
| |
| INTERESTED TRUSTEE AND OFFICER | | Mr. Glavin is an “Interested Trustee” because he is affiliated with the Manager and the Sub-Adviser by virtue of his positions as director of the Sub-Adviser, and as a shareholder of the Sub-Adviser’s parent company. As a Trustee, he serves for an indefinite term, or until his resignation, retirement, death or removal. Mr. Glavin’s address is 225 Liberty Street, 11th Floor, New York, New York 10281-1008. |
| |
William F. Glavin, Jr.,
Trustee (since 2009)
Year of Birth: 1958 | | Chairman of the Sub-Adviser (since July 2014 and December 2009-December 2012) and Director of the Sub-Adviser (since January 2009); Chairman, Director and Chief Executive Officer (January 2013-June 2014) of the Manager; President of the Manager (January 2013-May 2013); Chief Executive Officer (January 2009-December 2012); President of the Sub-Adviser (May 2009-December 2012); Management Director (June 2009-June 2014), President (December 2009-June 2014) and Chief Executive Officer (January 2011-June 2014) of Oppenheimer Acquisition Corp. (“OAC”) (the Sub-Adviser’s parent holding company); Director of Oppenheimer Real Asset Management, Inc. (March 2010-June 2014); Executive Vice President (March 2006-February 2009) and Chief Operating Officer (July 2007-February 2009) of Massachusetts Mutual Life Insurance Company (OAC’s parent company); Director (May 2004-March 2006) and Chief Operating Officer and Chief Compliance Officer (May 2004-January 2005), President (January 2005-March 2006) and Chief Executive Officer (June 2005-March 2006) of Babson Capital Management LLC; Director (March 2005-March 2006), President (May 2003-March 2006) and Chief Compliance Officer (July 2005-March 2006) of Babson Capital Securities, Inc. (a brokerdealer); President (May 2003-March 2006) of Babson Investment Company, Inc.; Director (May 2004-August 2006) of Babson Capital Europe Limited; Director (May 2004-October 2006) of Babson Capital Guernsey Limited; Director (May 2004-March 2006) of Babson Capital Management LLC; Non-Executive Director (March 2005-March 2007) of Baring Asset Management Limited; Director (February 2005-June 2006) Baring Pension Trustees Limited; Director and Treasurer (December 2003-November 2006) of Charter Oak Capital Management, Inc.; Director (May 2006-September 2006) of C.M. Benefit Insurance Company; Director (May 2008-June 2009) and Executive Vice President (June 2007-July 2009) of C.M. Life Insurance Company; President (March 2006-May 2007) of MassMutual Assignment Company; Director (January 2005-December 2006), Deputy Chairman (March 2005-December 2006) and President (February 2005-March 2005) of MassMutual Holdings (Bermuda) Limited; Director (May 2008-June 2009) and Executive Vice President (June 2007-July 2009) of MML Bay State Life Insurance Company; Chief Executive Officer and President (April 2007-January 2009) of MML Distributors, LLC; and Chairman |
93 OPPENHEIMER CAPITAL INCOME FUND
| | | | |
| |
| TRUSTEES AND OFFICERS Unaudited / Continued | | |
| | | | |
| | |
William F. Glavin, Jr.,
Continued | | (March 2006-December 2008) and Chief Executive Officer (May 2007-December 2008) of MML Investors Services, Inc. An officer of 91 portfolios in the OppenheimerFunds complex. Mr. Glavin has served on the Boards of certain Oppenheimer funds since December 2009, during which time he has become familiar with the Fund’s (and other Oppenheimer funds’) financial, accounting, regulatory and investment matters and has contributed to the Boards’ deliberations. |
| | | |
| |
| OTHER OFFICERS OF THE FUND | | The addresses of the Officers in the chart below are as follows: for Messrs. Memani, Steinmetz, Gabinet, Mss. Borré, Sexton and Picciotto, 225 Liberty Street, New York, New York 10281-1008, for Mr. Wixted, 6803 S. Tucson Way, Centennial, Colorado 80112-3924. Each Officer serves for an indefinite term or until his or her resignation, retirement, death or removal. |
| |
Michelle Borré,
Vice President (since 2009)
Year of Birth: 1967 | | Vice President of the Sub-Adviser (since April 2003); Senior Portfolio Manager of the Sub-Adviser (since April 2009); Senior Research Analyst of the Sub-Adviser (February 2003-April 2009). Ms. Borre held various positions, including Managing Director and Partner, at J&W Seligman (July 1996 -January 2003). Adjunct Professor of Finance and Economics at Columbia Business School; Served on the Executive Advisory Board at the Heilbrunn Center for Graham and Dodd Investing at Columbia Business School (from 2004 to 2005). A portfolio manager and an officer of other portfolios in the OppenheimerFunds complex. |
| |
Krishna Memani,
Vice President (since 2009)
Year of Birth: 1960 | | President of the Sub-Adviser (since January 2013); Executive Vice President of the Manager (since January 2014) and Chief Investment Officer of the OppenheimerFunds advisory entities (since January 2014). Chief Investment Officer, Fixed Income of the Sub-Adviser (January 2013-December 2013); Head of the Investment Grade Fixed Income Team of the Sub-Adviser (March 2009-January 2014); Director of Fixed Income of the Sub-Adviser (October 2010-December 2012); Senior Vice President of the Sub-Adviser (March 2009-December 2012) and Senior Vice President of OFI Global Institutional, Inc. (April 2009-December 2012). Managing Director and Head of the U.S. and European Credit Analyst Team at Deutsche Bank Securities (June 2006-January 2009). Chief Credit Strategist at Credit Suisse Securities (August 2002-March 2006). Managing Director and Senior Portfolio Manager at Putnam Investments (September 1998-June 2002). A portfolio manager and an officer of other portfolios in the OppenheimerFunds complex. |
| |
Arthur P. Steinmetz,
President and Principal Executive Officer
(since 2014)
Year of Birth: 1958 | | CEO and Chairman of the Manager (since July 2014), President of the Manager (since May 2013), a Director of the Manager (since January 2013), Director of the Sub-Adviser (since July 2014), President, Management Director and CEO of Oppenheimer Acquisition Corp. (the Sub-Adviser’s parent holding company) (since July 2014), and President and Director of OFI SteelPath, Inc. (since January 2013). Chief Investment Officer of the OppenheimerFunds advisory entities from (January 2013-December 2013); Executive Vice President of the Manager (January 2013-May 2013); Chief Investment Officer of the Sub-Adviser (October 2010-December 2012); Chief Investment Officer, |
94 OPPENHEIMER CAPITAL INCOME FUND
| | |
| |
Arthur P. Steinmetz,
Continued | | Fixed-Income, of the Sub-Adviser (April 2009-October 2010); Executive Vice President of the Sub-Adviser (October 2009-December 2012); Director of Fixed Income of the Sub-Adviser (January 2009-April 2009); and a Senior Vice President of the Sub-Adviser (March 1993-September 2009). An officer of 91 portfolios in the OppenheimerFunds complex. |
| |
Arthur S. Gabinet,
Secretary and Chief Legal Officer
(since 2011)
Year of Birth: 1958 | | Executive Vice President, Secretary and General Counsel of the Manager (since January 2013); General Counsel OFI SteelPath, Inc. (since January 2013); Executive Vice President (May 2010-December 2012) and General Counsel (since January 2011) of the Sub-Adviser; General Counsel of the Distributor (since January 2011); General Counsel of Centennial Asset Management Corporation (January 2011-December 2012); Executive Vice President (January 2011-December 2012) and General Counsel of HarbourView Asset Management Corporation (since January 2011); Assistant Secretary (since January 2011) and Director (since January 2011) of OppenheimerFunds International Ltd. and OppenheimerFunds plc; Director of Oppenheimer Real Asset Management, Inc. (January 2011-December 2012) and General Counsel (since January 2011); Executive Vice President (January 2011-December 2011) and General Counsel of Shareholder Financial Services, Inc. and Shareholder Services, Inc. (since January 2011); Executive Vice President (January 2011-December 2012) and General Counsel of OFI Private Investments Inc. (since January 2011); Vice President of OppenheimerFunds Legacy Program (January 2011-December 2011); Executive Vice President (January 2011-December 2012) and General Counsel of OFI Institutional Asset Management, Inc. (since January 2011); General Counsel, Asset Management of the Sub-Adviser (May 2010-December 2010); Principal, The Vanguard Group (November 2005-April 2010); District Administrator, U.S. Securities and Exchange Commission (January 2003-October 2005). An officer of 91 portfolios in the OppenheimerFunds complex. |
| |
Jennifer Sexton,
Vice President and Chief Business Officer
(since 2014)
Year of Birth: 1969 | | Senior Vice President of OppenheimerFunds Distributor, Inc. (since June 2014); Vice President of OppenheimerFunds Distributor, Inc. (April 2006-June 2014); Vice President of the Sub-Adviser (January 1998-March 2006); Assistant Vice President of the Sub-Adviser (October 1991-December 1998). An officer of 91 portfolios in the OppenheimerFunds complex. |
| |
Mary Ann Picciotto,
Chief Compliance Officer and Chief Anti-
Money Laundering Officer (since 2014)
Year of Birth: 1973 | | Senior Vice President and Chief Compliance Officer of the Manager (since March 2014); Chief Compliance Officer of the Sub-Adviser, OFI SteelPath, Inc., OFI Global Trust Company, OFI Global Institutional, Inc., Oppenheimer Real Asset Management, Inc., OFI Private Investments, Inc., Harborview Asset Management Corporation, Trinity Investment Management Corporation, and Shareholder Services, Inc. (since March 2014); Managing Director of Morgan Stanley Investment Management Inc. and certain of its various affiliated entities; Chief Compliance Officer of various Morgan Stanley Funds (May 2010-January 2014); Chief Compliance Officer of Morgan Stanley Investment Management Inc. (April 2007-January 2014). An officer of 91 portfolios in the OppenheimerFunds complex. |
95 OPPENHEIMER CAPITAL INCOME FUND
| | | | |
| |
| TRUSTEES AND OFFICERS Unaudited / Continued | | |
| | | | |
| | |
Brian W. Wixted,
Treasurer and Principal Financial &
Accounting Officer (since 1999)
Year of Birth: 1959 | | Senior Vice President of the Manager (since January 2013); Treasurer of the Sub-Adviser, HarbourView Asset Management Corporation, Shareholder Financial Services, Inc., Shareholder Services, Inc., and Oppenheimer Real Asset Management, Inc. (March 1999-June 2008), OFI Private Investments, Inc. (March 2000-June 2008), OppenheimerFunds International Ltd. and OppenheimerFunds plc (since May 2000), OFI Institutional Asset Management, Inc. (November 2000-June 2008), and OppenheimerFunds Legacy Program (charitable trust program established by the Sub-Adviser) (June 2003-December 2011); Treasurer and Chief Financial Officer of OFI Trust Company (since May 2000); Assistant Treasurer of Oppenheimer Acquisition Corporation (March 1999-June 2008). An officer of 91 portfolios in the OppenheimerFunds complex. |
The Fund’s Statement of Additional Information contains additional information about the Fund’s Trustees and Officers and is available without charge upon request, by calling 1.800.CALL OPP (225.5677).
96 OPPENHEIMER CAPITAL INCOME FUND
| | | | |
| |
| OPPENHEIMER CAPITAL INCOME FUND | | |
| | |
| Manager | | OFI Global Asset Management, Inc. |
| |
| Sub-Adviser | | OppenheimerFunds, Inc. |
| |
| Distributor | | OppenheimerFunds Distributor, Inc. |
| |
| Transfer and Shareholder | | OFI Global Asset Management, Inc. |
| Servicing Agent | | |
| |
| Sub-Transfer Agent | | Shareholder Services, Inc. |
| | DBA OppenheimerFunds Services |
| |
| Independent Registered | | KPMG LLP |
| Public Accounting Firm | | |
| |
| Counsel | | K&L Gates LLP |
© 2014 OppenheimerFunds, Inc. All rights reserved.
97 OPPENHEIMER CAPITAL INCOME FUND
As an Oppenheimer fund shareholder, you are entitled to know how we protect your personal information and how we limit its disclosure.
Information Sources
We obtain nonpublic personal information about our shareholders from the following sources:
| — | | Applications or other forms |
| — | | When you create a user ID and password for online account access |
| — | | When you enroll in eDocs Direct, our electronic document delivery service |
| — | | Your transactions with us, our affiliates or others |
| — | | A software program on our website, often referred to as a “cookie,” which indicates which parts of our site you’ve visited |
| — | | When you set up challenge questions to reset your password online |
If you visit oppenheimerfunds.com and do not log on to the secure account information areas, we do not obtain any personal information about you. When you do log on to a secure area, we do obtain your user ID and password to identify you. We also use this information to provide you with products and services you have requested, to inform you about products and services that you may be interested in and assist you in other ways.
We do not collect personal information through our website unless you willingly provide it to us, either directly by email or in those areas of the website that request information. In order to update your personal information (including your mailing address, email address and phone number) you must first log on and visit your user profile.
If you have set your browser to warn you before accepting cookies, you will receive the warning message with each cookie. You can refuse cookies by turning them off in your browser. However, doing so may limit your access to certain sections of our website.
We use cookies to help us improve and manage our website. For example, cookies help us recognize new versus repeat visitors to the site, track the pages visited, and enable some special features on the website. This data helps us provide a better service for our website visitors.
Protection of Information
We do not disclose any non-public personal information (such as names on a customer list) about current or former customers to anyone, except as permitted by law.
Disclosure of Information
We send your financial advisor (as designated by you) copies of confirmations, account statements and other documents reporting activity in your fund accounts. We may also use details about you and your investments to help us, our financial service affiliates, or firms that jointly market their financial products and services with ours, to better serve your investment needs or suggest financial services or educational material that may be of interest to you. If this requires us to provide you with an opportunity to “opt in” or “opt out” of such information sharing with a firm not affiliated with us, you will receive notification on how to do so, before any such sharing takes place.
Right of Refusal
We will not disclose your personal information to unaffiliated third parties (except as permitted by law), unless we first offer you a reasonable opportunity to refuse or “opt out” of such disclosure.
98 OPPENHEIMER CAPITAL INCOME FUND
Internet Security and Encryption
In general, the email services provided by our website are encrypted and provide a secure and private means of communication with us. To protect your own privacy, confidential and/or personal information should only be communicated via email when you are advised that you are using a secure website.
As a security measure, we do not include personal or account information in non-secure emails, and we advise you not to send such information to us in non-secure emails. Instead, you may take advantage of the secure features of our website to encrypt your email correspondence. To do this, you will need to use a browser that supports Secure Sockets Layer (SSL) protocol.
We do not guarantee or warrant that any part of our website, including files available for download, are free of viruses or other harmful code. It is your responsibility to take appropriate precautions, such as use of an anti-virus software package, to protect your computer hardware and software.
| — | | All transactions, including redemptions, exchanges and purchases, are secured by SSL and 128-bit encryption. SSL is used to establish a secure connection between your PC and OppenheimerFunds’ server. It transmits information in an encrypted and scrambled format. |
| — | | Encryption is achieved through an electronic scrambling technology that uses a “key” to code and then decode the data. Encryption acts like the cable converter box you may have on your television set. It scrambles data with a secret code so that no one can make sense of it while it is being transmitted. When the data reaches its destination, the same software unscrambles the data. |
| — | | You can exit the secure area by either closing your browser, or for added security, you can use the Log Out button before you close your browser. |
Other Security Measures
We maintain physical, electronic and procedural safeguards to protect your personal account information. Our employees and agents have access to that information only so that they may offer you products or provide services, for example, when responding to your account questions.
How You Can Help
You can also do your part to keep your account information private and to prevent unauthorized transactions. If you obtain a user ID and password for your account, do not allow it to be used by anyone else. Also, take special precautions when accessing your account on a computer used by others.
Who We Are
This joint notice describes the privacy policies of the Oppenheimer funds, OppenheimerFunds, Inc., and each of its investment adviser subsidiaries, OppenheimerFunds Distributor, Inc. and OFI Global Trust Co. It applies to all Oppenheimer fund accounts you presently have, or may open in the future, using your Social Security number—whether or not you remain a shareholder of our funds. This notice was last updated November 2013. In the event it is updated or changed, we will post an updated notice on our website at oppenheimerfunds.com. If you have any questions about these privacy policies, write to us at P.O. Box 5270, Denver, CO 80217-5270, email us by clicking on the Contact Us section of our website at oppenheimerfunds.com or call us at 1.800.CALL OPP (225.5677).
99 OPPENHEIMER CAPITAL INCOME FUND
THIS PAGE INTENTIONALLY LEFT BLANK.
100 OPPENHEIMER CAPITAL INCOME FUND
THIS PAGE INTENTIONALLY LEFT BLANK.
101 OPPENHEIMER CAPITAL INCOME FUND
THIS PAGE INTENTIONALLY LEFT BLANK.
102 OPPENHEIMER CAPITAL INCOME FUND
THIS PAGE INTENTIONALLY LEFT BLANK.
103 OPPENHEIMER CAPITAL INCOME FUND

Item 2. Code of Ethics.
The registrant has adopted a code of ethics that applies to the registrant’s principal executive officer, principal financial officer, principal accounting officer or controller or persons performing similar functions.
Item 3. Audit Committee Financial Expert.
The Board of Trustees of the registrant has determined that F. William Marshall, Jr., the Chairman of the Board’s Audit Committee, is the audit committee financial expert and that Mr. Marshall is “independent” for purposes of this Item 3.
Item 4. Principal Accountant Fees and Services.
The principal accountant for the audit of the registrant’s annual financial statements billed $45,000 in fiscal 2014 and $44,100 in fiscal 2013.
The principal accountant for the audit of the registrant’s annual financial statements billed no such fees in fiscal 2014 and no such fees in fiscal 2013.
The principal accountant for the audit of the registrant’s annual financial statements billed $1,074,824 in fiscal 2014 and $566,580 in fiscal 2013 to the registrant’s investment adviser or any entity controlling, controlled by, or under common control with the adviser that provides ongoing services to the registrant.
Such services include: Internal control reviews, GIPS attestation procedures, system conversion testing, and corporate restructuring.
The principal accountant for the audit of the registrant’s annual financial statements billed no such fees in fiscal 2014 and no such fees in fiscal 2013.
The principal accountant for the audit of the registrant’s annual financial statements billed $336,709 in fiscal 2014 and $492,036 in fiscal 2013 to the registrant’s investment adviser or any entity controlling, controlled by, or under common control with the adviser that provides ongoing services to the registrant.
Such services include: tax compliance, tax planning and tax advice. Tax compliance generally involves preparation of original and amended tax returns, claims for a refund and tax payment-planning services. Tax planning and tax advice includes assistance with tax audits and appeals, tax advice related to mergers and acquisitions and requests for rulings or technical advice from taxing authorities.
The principal accountant for the audit of the registrant’s annual financial statements billed no such fees in fiscal 2014 and no such fees in fiscal 2013.
The principal accountant for the audit of the registrant’s annual financial statements billed no such fees in fiscal 2014 and no such fees in fiscal 2013 to the registrant’s investment adviser or any entity controlling, controlled by, or under common control with the adviser that provides ongoing services to the registrant.
Such fees would include the cost to the principal accountant of attending audit committee meetings and consultations regarding the registrant’s retirement plan with respect to its Trustees.
| (e) | (1) During its regularly scheduled periodic meetings, the registrant’s audit committee will pre-approve all audit, audit-related, tax and other services to be provided by the principal accountants of the registrant. |
The audit committee has delegated pre-approval authority to its Chairman for any subsequent new engagements that arise between regularly scheduled meeting dates provided that any fees such pre-approved are presented to the audit committee at its next regularly scheduled meeting.
Under applicable laws, pre-approval of non-audit services may be waived provided that: 1) the aggregate amount of all such services provided constitutes no more than five percent of the total amount of fees paid by the registrant to its principal accountant during the fiscal year in which services are provided 2) such services were not recognized by the registrant at the time of engagement as non-audit services and 3) such services are promptly brought to the attention of the audit committee of the registrant and approved prior to the completion of the audit.
(2) 0%
| (f) | Not applicable as less than 50%. |
| (g) | The principal accountant for the audit of the registrant’s annual financial statements billed $1,411,533 in fiscal 2014 and $1,058,616 in fiscal 2013 to the registrant and the registrant’s investment adviser or any entity controlling, controlled by, or under common control with the adviser that provides ongoing services to the registrant related to non-audit fees. Those billings did not include any prohibited non-audit services as defined by the Securities Exchange Act of 1934. |
| (h) | The registrant’s audit committee of the board of Trustees has considered whether the provision of non-audit services that were rendered to the registrant’s investment adviser, and any entity controlling, controlled by, or under common control with the investment adviser that provides ongoing services to the registrant that were not pre-approved pursuant to paragraph (c)(7)(ii) of Rule 2-01 of Regulation S-X is compatible with maintaining the principal accountant’s independence. No such services were rendered. |
Item 5. Audit Committee of Listed Registrants
Not applicable.
Item 6. Schedule of Investments.
a) Not applicable. The complete schedule of investments is included in Item 1 of this Form N-CSR.
b) Not applicable.
Item 7. Disclosure of Proxy Voting Policies and Procedures for Closed-End Management Investment Companies.
Not applicable.
Item 8. Portfolio Managers of Closed-End Management Investment Companies.
Not applicable.
Item 9. Purchases of Equity Securities by Closed-End Management Investment Company and Affiliated Purchasers.
Not applicable.
Item 10. Submission of Matters to a Vote of Security Holders.
The Fund’s Governance Committee Provisions with Respect to Nominations of Directors/Trustees to the Respective Boards
None
Item 11. Controls and Procedures.
Based on their evaluation of the registrant’s disclosure controls and procedures (as defined in rule 30a-3(c) under the Investment Company Act of 1940 (17 CFR 270.30a-3(c)) as of 8/29/2014, the registrant’s principal executive officer and principal financial officer found the registrant’s disclosure controls and procedures to provide reasonable assurances that information required to be disclosed by the registrant in the reports that it files under the Securities Exchange Act of 1934 (a) is accumulated and communicated to registrant’s management, including its principal executive officer and principal financial officer, to allow timely decisions regarding required disclosure, and (b) is recorded, processed, summarized and reported, within the time periods specified in the rules and forms adopted by the U.S. Securities and Exchange Commission.
There have been no changes in the registrant’s internal controls over financial reporting that occurred during the registrant’s second fiscal quarter of the period covered by this report that have materially affected, or are reasonably likely to materially affect, the registrant’s internal control over financial reporting.
Item 12. Exhibits.
| (a) | (1) Exhibit attached hereto. |
(2) Exhibits attached hereto.
(3) Not applicable.
| (b) | Exhibit attached hereto. |
SIGNATURES
Pursuant to the requirements of the Securities Exchange Act of 1934 and the Investment Company Act of 1940, the registrant has duly caused this report to be signed on its behalf by the undersigned, thereunto duly authorized.
Oppenheimer Capital Income Fund
| | |
By: | | /s/ Arthur P. Steinmetz |
| | Arthur P. Steinmetz |
| | Principal Executive Officer |
| |
Date: | | 10/9/2014 |
Pursuant to the requirements of the Securities Exchange Act of 1934 and the Investment Company Act of 1940, this report has been signed below by the following persons on behalf of the registrant and in the capacities and on the dates indicated.
| | |
By: | | /s/ Arthur P. Steinmetz |
| | Arthur P. Steinmetz |
| | Principal Executive Officer |
| |
Date: | | 10/9/2014 |
| | |
By: | | /s/ Brian W. Wixted |
| | Brian W. Wixted |
| | Principal Financial Officer |
| |
Date: | | 10/9/2014 |