UNITED STATES
SECURITIES AND EXCHANGE COMMISSION Washington, D.C. 20549
FORM N-CSR
CERTIFIED SHAREHOLDER REPORT OF REGISTERED MANAGEMENT INVESTMENT COMPANIES
Investment Company Act file number 811- 2402 John Hancock Sovereign Bond Fund (Exact name of registrant as specified in charter) 601 Congress Street, Boston, Massachusetts 02210
(Address of principal executive offices) (Zip code) Alfred P. Ouellette Senior Attorney and Assistant Secretary 601 Congress Street Boston, Massachusetts 02210
(Name and address of agent for service) Registrant's telephone number, including area code: 617-663-4324
| Date of fiscal year end: | May 31 |
| Date of reporting period: | November 30, 2005 |
| ITEM 1. REPORT TO SHAREHOLDERS. |

| Table of contents |
| Your fund at a glance |
| page 1 |
| Managers’ report |
| page 2 |
| A look at performance |
| page 6 |
| Growth of $10,000 |
| page 7 |
| Your expenses |
| page 8 |
| Fund’s investments |
| page 10 |
| Financial statements |
| page 25 |
| For more information |
| page 45 |
To Our Shareholders,
The mutual fund industry has seen enormous growth over the last several decades. A good half of all American households are now invested in at least one mutual fund and the industry has grown to more than $8 trillion invested in some 7,000-8,000 mutual funds. With this growth, investors and their financial professionals have had access to an increasing array of investment choices -- and greater challenges as they try to find the best-performing funds to fit their investment objectives.
Morningstar, Inc., a major independent analyst of the mutual fund industry, has provided investors and their advisors with an important evaluation tool since 1985, when it launched its “star” rating. Based on certain measurements, the Morningstar Rating for funds reflects each fund’s risk-adjusted return compared to a peer group, designating the results with a certain number of stars, from five stars for the best down to one star. The star ranking system has become the gold standard, with 4- and 5-star funds accounting for the bulk of fund sales.
As good, and important, as this ranking measurement has been, we have long taken issue with part of the process that adjusts performance on broker-sold Class A shares for “loads” -- or up-front commissions. We have argued that this often does not accurately reflect an A share investor’s experience, since they increasingly are purchasing A shares in retirement plans and fee-based platforms that waive the up-front fee.
We are pleased to report that Morningstar has acknowledged this trend and has added a new rating for Class A shares on a no-load basis, called the “Load-Waived A Share” rating, that captures the experience of an investor who is not paying a front-end load. This new rating will better assist our plan sponsors, 401(k) plan participants and clients of financial professionals who invest via fee-based platforms or commit to invest more than a certain dollar amount, in evaluating their choice of mutual funds.
Since being implemented in early December 2005, the impact on our funds has been terrific. Under the new load-waived rating, 11 of our 32 open-end retail mutual funds increased their ratings to either a 4- or 5-star rank. In total, 13 of our funds now have 4- or 5-star rankings on their load-waived A shares, as of November 30, 2005.
We commend Morningstar for its move and urge our shareholders to consider this another tool at your disposal as you and your financial professional are evaluating investment choices.
Sincerely,

| Keith F. Hartstein, President and Chief Executive Officer |
This commentary reflects the CEO’s views as of November 30, 2005.
They are subject to change at any time.
| YOUR FUND AT A GLANCE |
| The Fund seeks a high level of current income consistent with prudent invest- ment risk by investing at least 80% of its assets in a diversified portfolio of bonds and other debt securities, including corporate bonds and U.S. government and agency securities. |
- Over the last six months
■ Bonds declined modestly as high energy prices, solid economic
growth and additional interest rate hikes by the Federal Reserve weighed
on the market.
■ High-yield corporate bonds posted the best returns, while Treasury
and higher-quality corporate bonds lagged.
■ The Fund’s defensive positioning and strong individual security selec-
tion helped it perform in line with its peer group average and benchmark index.
| Total returns for the Fund are at net asset value with all distributions reinvested. These returns do not reflect the deduction of the maximum sales charge, which would reduce the performance shown above |
| Top 10 issuers | |
| 25.7% | Federal National Mortgage Assn. |
| 12.8% | U.S. Treasury |
| 10.5% | Federal Home Loan Mortgage Corp. |
| 1.5% | Federal Home Loan Bank |
| 0.9% | Countrywide Alternative Loan Trust |
| 0.9% | JP Morgan Mortgage Trust |
| 0.8% | Greenwich Capital Commercial Funding Corp. |
| 0.8% | Morgan Stanley Capital I |
| 0.7% | AT&T Corp. |
| 0.7% | BVPS II Funding Corp. |
| As a percentage of net assets on November 30, 2005. | |
1
| BY HOWARD C. GREENE, CFA, BARRY H. EVANS, CFA AND BENJAMIN A. MATTHEWS, PORTFOLIO MANAGERS, SOVEREIGN ASSET MANAGEMENT LLC |
| MANAGERS’ REPORT |
| JOHN HANCOCK Bond Fund |
U.S. bonds declined modestly during the six months ended November 30, 2005, as interest rates rose across the board, pushing bond prices lower. The Lehman Brothers U.S. Aggregate Index, a broad measure of U.S. bond market performance, returned -0.48% ..
Interest rates rose in part because of increasing inflation, driven largely by persistently high energy prices. The economy also remained on solid footing, growing at an annual rate of more than 3.5% in the first three quarters of 2005. As a result, the Federal Reserve continued its series of short-term interest rate increases over the past six months. The Fed’s four rate hikes during the period -- for a total of 12 in the last 17 months -- boosted the federal funds rate target to 4%, a level last seen in June 2001.
As interest rates moved higher, short-term and long-term rates continued to converge. The two-year Treasury note yield rose from 3.6% to 4.4%, while the 10-year Treasury yield climbed from 4.0% to 4.5% . The gap between these two yields, which was more than two percentage points in mid-2003, narrowed to less than one-tenth of a percentage point by the end of the period.
| “U.S. bonds declined modestly during the six months ended November 30, 2005, as interest rates rose across the board, pushing bond prices lower.” |
High-yield corporate bonds continued to out perform, posting positive returns overall for the six-month period while the rest of the bond market declined. Among the remaining fixed-income segments, mortgage-backed securities and government agency bonds held up the best, while Treasury and investment-grade corporate bonds lagged.
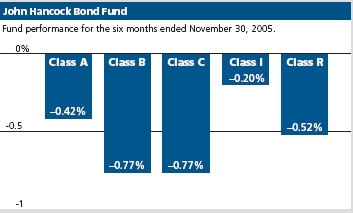
Fund performance
For the six months ended November 30, 2005, John Hancock Bond Fund’s Class A, Class B, Class C, Class I and Class R shares posted total returns of -0.42%, -0.77%, -0.77%, -0.20% and -0.52%, respectively, at net asset value. That compared with the
2

| Howard Greene Barry Evans Ben Matthews |
-0.58% return of the average A-rated corporate debt fund, according to Lipper, Inc.1, and the -0.66% return of the Lehman Brothers Government/Credit Bond Index. Keep in mind that your net asset value return will differ from the Fund’s performance if you were not invested in the Fund for the entire period and did not reinvest all distributions. See pages six and seven for historical performance information.
Defensive positioning
The Fund’s good relative performance was largely the result of playing good defense. The key components of our defensive approach -- which has been in place since early 2004 -- included reducing the portfolio’s interest rate sensitivity, upgrading the portfolio’s credit quality and modifying the maturity structure of the portfolio to benefit from the convergence of short- and long-term interest rates. Each of these strategies produced favorable results for the portfolio over the past six months.
More recently, however, we began unwinding some of our defensive positioning. Short- and long-term interest rates have converged sig-nificantly over the past two years and are nearly equal, so we are shifting to a more balanced maturity structure within the portfolio. Similarly, we have moved back toward a more neutral position with regard to the portfolio’s overall interest rate sensitivity.
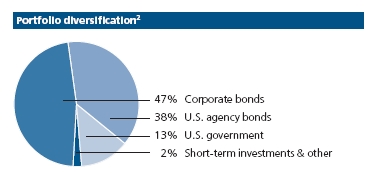
Sector allocation
Corporate bonds remained the largest sector weighting in the portfolio, but we continued to trim our corporate holdings. Corporate bonds have been the best performers in the bond market for more than three years, and consequently these bonds have become less attractive relative to other fixed-income segments. We increased our positions in government agency bonds and mortgage-backed securities, which offered better credit quality and relatively attractive yields versus corporate bonds.
| “The Fund’s good relative performance was largely the result of playing good defense.” |
Within the corporate sector, we further reduced our exposure to lower-rated bonds. By the end of the six-month period, below-investment-grade bonds (those rated BB or lower) made up
3
| Quality |
| distribution2 |
| AAA -- 61% |
| AA -- 3% |
| A -- 6% |
| BBB -- 15% |
| BB -- 11% |
| B -- 2% |
about 13% of the portfolio. However, we are still finding selected opportunities among lower-quality corporate issues.
One trend we observed -- and became wary of -- during the period is an increase in “shareholder activism.” Over the past few years, many corporations successfully cleaned up and strengthened their balance sheets, and as a result, corporate America currently has more cash on its books than ever before. Now, hedge funds and other institutional investors are putting pressure on these companies to use this cash to boost shareholder value -- by paying out more dividends, buying back shares and/or taking on more leverage. While these actions benefit stockholders, they are not generally favorable for bondholders because they weaken the company’s financial position and credit rating.
Consequently, we added more finance-oriented bonds, such as those issued by banks and insurance firms, to the portfolio because they cannot afford to undermine their credit ratings. We also shifted away from bonds issued by consumer companies, reflecting our concerns about slowdowns in retail spending and the housing market.
Winners and losers
Individual security selection added value to the Fund’s performance over the last six months. One of our better individual performers was secured airline bonds backed by Continental Airlines, Inc. jets. Continental’s success in improving cost management and reducing excess capacity helped boost these bonds. Another top performer was ASG Consolidated LLC, which operates fishing vessels primarily off the coast of Alaska. This small, off-the-beaten-path company
4
executed its business strategy successfully and benefited from increased demand for seafood.
| “We will continue to focus on higher- quality bonds while seeking out the best values in the bond market for our shareholders.” |
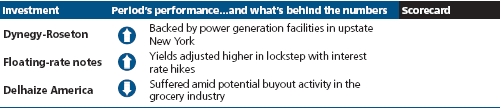
We tried to avoid companies that are under pressure to make stock-friendly moves that can harm their balance sheets (and bond values). For the most part, we were successful, but we were not completely immune. One of our holdings was Albertson’s, Inc., a grocery chain that became a likely target for a leveraged buyout that would increase its overall debt load substantially. Another disappointing performer was General Motors Acceptance Corp., (GMAC) the financing arm of General Motors, which was weighed down by troubles at the automaker.
| Sector distribution2 |
| Government - |
| U.S. agency -- 38% |
| Financials -- 24% |
| Government - |
| U.S. -- 13% |
| Utilities -- 8% |
| Consumer |
| discretionary -- 3% |
| Industrials -- 3% |
| Telecommunication |
| services -- 3% |
| Consumer |
| staples -- 2% |
| Health care -- 1% |
| Materials -- 1% |
| Information |
| technology -- 1% |
| Energy -- 1% |
Outlook
We believe the Fed is nearly done with its series of rate hikes, though that could change under new Fed chairman Ben Bernanke, who takes over in early 2006. In addition, oil prices have eased from record high levels and the economy is slowing to a more moderate rate of growth. These developments have led us to rein in our defensive positioning somewhat, but we still believe that caution is warranted. We will continue to focus on higher-quality bonds while seeking out the best values in the bond market for our shareholders.
| This commentary reflects the views of the portfolio managers through the end of the Fund’s period discussed in this report. The managers’ statements reflect their own opinions. As such, they are in no way guarantees of future events, and are not intended to be used as investment advice or a recommendation regarding any specific security. They are also subject to change at any time as market and other conditions warrant. 1 Figures from Lipper, Inc. include reinvested dividends and do not take into account sales charges. Actual load-adjusted performance is lower. 2 As a percentage of net assets on November 30, 2005. |
5
| A LOOK AT PERFORMANCE |
| For the period ended November 30, 2005 |
| Class A | Class B | Class C | Class I1 | Class R1 | |
| Inception date | 11-9-73 | 11-23-93 | 10-1-98 | 9-4-01 | 8-5-03 |
| Average annual returns with maximum sales charge (POP) | |||||
| One year | -2.20% | -3.17% | 0.73% | 2.83% | 2.27% |
| Five years | 5.05 | 4.96 | 5.29 | -- | -- |
| Ten years | 5.46 | 5.36 | -- | -- | -- |
| Since inception | -- | -- | 4.33 | 5.51 | 4.61 |
| Cumulative total returns with maximum sales charge (POP) | |||||
| Six months | -4.89 | -5.63 | -1.74 | -0.20 | -0.52 |
| One year | -2.20 | -3.17 | 0.73 | 2.83 | 2.27 |
| Five years | 27.95 | 27.41 | 29.39 | -- | -- |
| Ten years | 70.12 | 68.57 | -- | -- | -- |
| Since inception | -- | -- | 35.51 | 25.54 | 11.03 |
| SEC 30-day yield as of November 30, 2005 | |||||
| 4.18 | 3.68 | 3.68 | 4.84 | 3.88 | |
Performance figures assume all distributions are reinvested. Returns with maximum sales charge reflect a sales charge on Class A shares of 4.5%, and the applicable contingent deferred sales charge (CDSC) on Class B and Class C shares. The returns for Class C shares have been adjusted to reflect the elimination of the front-end sales charge effective July 15, 2004. The Class B shares’ CDSC declines annually between years 1-6 according to the following schedule: 5, 4, 3, 3, 2, 1%. No sales charge will be assessed after the sixth year. Class C shares held for less than one year are subject to a 1% CDSC. Sales charge is not applicable for Class I and Class R shares.
The returns reflect past results and should not be considered indicative of future performance. The return and principal value of an investment will fluctuate so that shares, when redeemed, may be worth more or less than their original cost. Due to market volatility, the Fund’s current performance may be higher or lower than the performance shown. For performance data current to the most recent month-end, please call 1-800-225-5291 or visit the Fund’s Web site at www.jhfunds.com.
The performance table above and the chart on the next page do not reflect the deduction of taxes that a shareholder would pay on fund distributions or the redemption of fund shares.
The Fund’s performance results reflect any applicable expense reductions, without which the expenses would increase and results would have been less favorable.
1For certain types of investors as described in the Fund’s Class I and Class R share prospectuses.
6
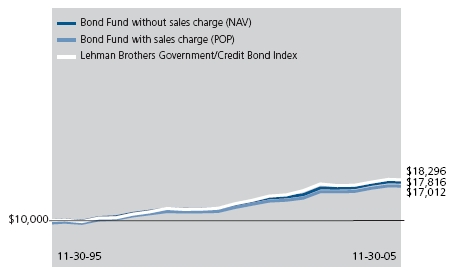
| GROWTH OF $10,000 |
This chart shows what happened to a hypothetical $10,000 investment in Class A shares for the period indicated. For comparison, we’ve shown the same investment in the Lehman Brothers Government/Credit Bond Index.
| Class B1 | Class C1 | Class I2 | Class R2 | |
| Period beginning | 11-30-95 | 10-1-98 | 9-4-01 | 8-5-03 |
| Bond Fund | $16,857 | $13,551 | $12,554 | $11,103 |
| Index | 18,296 | 14,511 | 12,508 | 10,973 |
Assuming all distributions were reinvested for the period indicated, the table above shows the value of a $10,000 investment in the Fund’s Class B, Class C, Class I and Class R shares, respectively, as of November 30, 2005. The Class C shares investment with maximum sales charge has been adjusted to reflect the elimination of the front-end sales charge effective July 15, 2004. Performance of the classes will vary based on the difference in sales charges paid by shareholders investing in the different classes and the fee structure of those classes.
Lehman Brothers Government/Credit Bond Index is an unmanaged index that measures the performance of U.S. government bonds, U.S. corporate bonds and Yankee bonds.
It is not possible to invest directly in an index. Index figures do not reflect sales charges and would be lower if they did.
1 No contingent deferred sales charge applicable.
2 For certain types of investors as described in the Fund’s Class I and Class R share prospectuses.
7
| YOUR EXPENSES |
These examples are intended to help you understand your ongoing operating expenses.
| Understanding fund expenses |
| As a shareholder of the Fund, you incur two types of costs: |
|
| purchases or redemptions (varies by share class), minimum |
| account fee charge, etc. |
■ Ongoing operating expenses including management |
| fees, distribution and service fees (if applicable) and other |
| fund expenses. |
We are going to present only your ongoing operating expenses here.
Actual expenses/actual returns
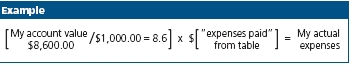
This example is intended to provide information about your fund’s actual ongoing operating expenses, and is based on your fund’s actual return. It assumes an account value of $1,000.00 on May 31, 2005, with the same investment held until November 30, 2005.
| Account value | Expenses paid | |
| $1,000.00 | Ending value | during period |
| on 5-31-05 | on 11-30-05 | ended 11-30-051 |
| Class A | $995.80 | $5.37 |
| Class B | 992.30 | 8.86 |
| Class C | 992.30 | 8.86 |
| Class I | 998.00 | 3.24 |
| Class R | 994.80 | 6.50 |
Together with the value of your account, you may use this information to estimate the operating expenses that you paid over the period. Simply divide your account value at November 30, 2005 by $1,000.00, then multiply it by the “expenses paid” for your share class from the table above. For example, for an account value of $8,600.00, the operating expenses should be calculated as follows:
8
Hypothetical example for comparison purposes
This table allows you to compare your fund’s ongoing operating expenses with those of any other fund. It provides an example of the Fund’s hypothetical account values and hypothetical expenses based on each class’s actual expense ratio and an assumed 5% annual return before expenses (which is not your fund’s actual return). It assumes an account value of $1,000.00 on May 31, 2005, with the same investment held until November 30, 2005. Look in any other fund shareholder report to find its hypothetical example and you will be able to compare these expenses.
| Account value | Expenses paid | |
| $1,000.00 | Ending value | during period |
| on 5-31-05 | on 11-30-05 | ended 11-30-051 |
| Class A | $1,019.68 | $5.44 |
| Class B | 1,016.17 | 8.97 |
| Class C | 1,016.17 | 8.97 |
| Class I | 1,021.82 | 3.28 |
| Class R | 1,018.55 | 6.58 |
Remember, these examples do not include any transaction costs, such as sales charges; therefore, these examples will not help you to determine the relative total costs of owning different funds. If transaction costs were included, your expenses would have been higher. See the prospectus for details regarding transaction costs.
1 Expenses are equal to the Fund’s annualized expense ratio of 1.07%, 1.77%, 1.77%, 0.65% and 1.30% for Class A, Class B, Class C, Class I and Class R, respectively, multiplied by the average account value over the period, multiplied by number of days in most recent fiscal half-year/365 or 366 (to reflect the one-half year period).
9
| F I N A N C I A L S TAT E M E N T S |
| FUND’S INVESTMENTS |
| Securities owned by the Fund on November 30, 2005 (unaudited) |
This schedule is divided into four main categories: bonds, preferred stocks, U.S. government and agencies securities and short-term investments. Bonds, preferred stocks and U.S. government and agencies securities are further broken down by industry group. Short-term investments, which represent the Fund’s cash position, are listed last.
| Interest | Maturity | Credit | Par value | ||
| Issuer, description | rate | date | rating (A) | (000) | Value |
| Bonds 47.10% | $518,181,018 | ||||
| (Cost $521,526,387) | |||||
| Agricultural Products 0.40% | 4,394,483 | ||||
| Corn Products International, Inc., | |||||
| Sr Note | 8.450% | 08-15-09 | BBB- | $3,985 | 4,394,483 |
| Airlines 0.48% | 5,307,629 | ||||
| Continental Airlines, Inc., | |||||
| Pass Thru Ctf Ser 1999-1A | 6.545 | 02-02-19 | A- | 1,634 | 1,623,294 |
| Pass Thru Ctf Ser 2000-2 Class A-1 (L) | 7.707 | 04-02-21 | BBB | 1,896 | 1,882,640 |
| Pass Thru Ctf Ser 2001-1 Class C | 7.033 | 06-15-11 | BB- | 1,985 | 1,801,115 |
| Jet Equipment Trust, | |||||
| Equip Trust Ctf Ser 1995-B2 (B)(H)(S) | 10.910 | 08-15-14 | D | 5,800 | 580 |
| Broadcasting & Cable TV 1.06% | 11,691,576 | ||||
| BSKYB Finance UK Plc, | |||||
| Gtd Sr Note (United Kingdom) (L)(S) | 6.500 | 10-15-35 | BBB | 2,375 | 2,364,823 |
| Innova S. de R.L., | |||||
| Note (Mexico) | 9.375 | 09-19-13 | BB- | 1,635 | 1,814,850 |
| Shaw Communications, Inc., | |||||
| Sr Note (Canada) | 8.250 | 04-11-10 | BB+ | 1,560 | 1,669,200 |
| TCI Communications, Inc., | |||||
| Deb | 9.800 | 02-01-12 | BBB | 1,990 | 2,399,486 |
| XM Satellite Radio, Inc., | |||||
| Sr Sec Disc Note (Zero to 12-31-05 | |||||
| then 14.000%) (O) | Zero | 12-31-09 | CCC+ | 1,895 | 2,004,342 |
| Sr Sec Note | 12.000 | 06-15-10 | CCC+ | 1,279 | 1,438,875 |
| Casinos & Gaming 1.09% | 12,005,659 | ||||
| Chuksani Economic Development Auth., | |||||
| Sr Note (S) | 8.000 | 11-15-13 | BB- | 570 | 572,850 |
| Harrah’s Operating Co., Inc., | |||||
| Sr Note | 7.125 | 06-01-07 | BBB- | 2,940 | 3,020,906 |
| Jacob’s Entertainment, Inc., | |||||
| Sr Sec Note (B) | 11.875 | 02-01-09 | B | 3,235 | 3,479,566 |
| See notes to financial statements. |
10
| F I N A N C I A L S TAT E M E N T S |
| Interest | Maturity | Credit | Par value | ||
| Issuer, description | rate | date | rating (A) | (000) | Value |
| Casinos & Gaming (continued) | |||||
| Mashantucket West Pequot, | |||||
| Note (S) | 5.912% | 09-01-21 | BBB- | $1,250 | $1,237,362 |
| Mohegan Tribal Gaming Auth., | |||||
| Sr Sub Note | 7.125 | 08-15-14 | B+ | 1,050 | 1,071,000 |
| MTR Gaming Group, Inc., | |||||
| Gtd Sr Note Ser B | 9.750 | 04-01-10 | B+ | 1,595 | 1,674,750 |
| Waterford Gaming LLC, | |||||
| Sr Note (S) | 8.625 | 09-15-12 | B+ | 883 | 949,225 |
| Commodity Chemicals 0.24% | 2,609,814 | ||||
| RPM International, Inc., | |||||
| Sr Note | 6.250 | 12-15-13 | BBB | 2,605 | 2,609,814 |
| Computer Hardware 0.16% | 1,767,948 | ||||
| Activant Solutions, Inc., | |||||
| Sr Floating Rate Note (P)(S) | 10.054 | 04-01-10 | B+ | 500 | 512,500 |
| Pioneer Standard Electronics, Inc., | |||||
| Sr Note | 9.500 | 08-01-06 | BB- | 1,235 | 1,255,448 |
| Construction Materials 0.14% | 1,547,875 | ||||
| Votorantim Overseas IV, | |||||
| Gtd Note (Cayman Islands) (S) | 7.750 | 06-24-20 | BBB- | 1,525 | 1,547,875 |
| Consumer Finance 2.14% | 23,491,509 | ||||
| American General Finance Corp., | |||||
| Med Term Note Ser I | 4.875 | 07-15-12 | A+ | 3,965 | 3,869,162 |
| Ford Motor Credit Co., | |||||
| Floating Rate Note (L)(P) | 5.290 | 11-16-06 | BB+ | 5,795 | 5,621,869 |
| General Motors Acceptance Corp., | |||||
| Note (L) | 6.750 | 12-01-14 | BB | 1,915 | 1,737,412 |
| Household Finance Corp., | |||||
| Note | 6.375 | 10-15-11 | A | 1,785 | 1,886,824 |
| HSBC Finance Capital Trust IX, | |||||
| Floating Rate Note (5.611% until | |||||
| 11-30-15 then variable) (P) | 5.911 | 11-30-35 | BBB+ | 2,600 | 2,621,938 |
| HSBC Finance Corp., | |||||
| Sr Note (L) | 6.750 | 05-15-11 | A | 4,140 | 4,447,946 |
| SLM Corp., | |||||
| Med Term Floating Rate Note Ser A (P) | 4.280 | 01-25-08 | A | 3,305 | 3,306,358 |
| Diversified Banks 2.03% | 22,373,642 | ||||
| Bank of New York, | |||||
| Cap Security (S) | 7.780 | 12-01-26 | A- | 4,420 | 4,694,509 |
| Chuo Mitsui Trust & Banking Co., Ltd., | |||||
| Perpetual Sub Note (5.506% to 04-15-15 | |||||
| then variable) (Japan) (S) | 5.506 | 12-29-49 | Baa2 | 2,780 | 2,673,518 |
| See notes to financial statements. |
11
| F I N A N C I A L S TAT E M E N T S |
| Interest | Maturity | Credit | Par value | ||
| Issuer, description | rate | date | rating (A) | (000) | Value |
| Diversified Banks (continued) | |||||
| Citigroup, Inc., | |||||
| Sub Note | 5.000% | 09-15-14 | A+ | $1,000 | $982,175 |
| Rabobank Capital Fund II, | |||||
| Perpetual Bond (5.260% to 12-31-13 | |||||
| then variable) (S) | 5.260 | 12-29-49 | AA | 4,230 | 4,206,101 |
| Royal Bank of Scotland Group Plc, | |||||
| Perpetual Bond (7.648% to 09-30-31 | |||||
| then variable) (United Kingdom) | 7.648 | 08-29-49 | A | 4,140 | 4,893,348 |
| St. George Funding Co., | |||||
| Perpetual Bond (8.485% to 06-30-17 | |||||
| then variable) (Australia) (S) | 8.485 | 12-31-49 | Baa1 | 4,555 | 4,923,991 |
| Diversified Chemicals 0.22% | 2,412,800 | ||||
| Lyondell Chemical Co., | |||||
| Gtd Sr Sub Note (L) | 10.875 | 05-01-09 | B | 2,320 | 2,412,800 |
| Diversified Commercial Services | 0.36% | 3,935,719 | |||
| Noble Group Ltd., | |||||
| Sr Note (Bermuda) (S) | 6.625 | 03-17-15 | BB+ | 2,295 | 2,100,719 |
| Sotheby’s Holdings, Inc., | |||||
| Note | 6.875 | 02-01-09 | BB- | 1,835 | 1,835,000 |
| Diversified Financial Services 0.27% | 2,961,032 | ||||
| Glencore Funding LLC, | |||||
| Gtd Note (S) | 6.000 | 04-15-14 | BBB- | 3,180 | 2,961,032 |
| Diversified Metals & Mining 0.31% | 3,365,000 | ||||
| Freeport-McMoRan Copper & Gold, Inc., | |||||
| Sr Note | 10.125 | 02-01-10 | B+ | 2,000 | 2,190,000 |
| Metallurg Holdings, Inc., | |||||
| Sr Sec Note (G)(S) | 10.500 | 10-01-10 | B- | 1,175 | 1,175,000 |
| Electric Utilities 6.34% | 69,713,610 | ||||
| AES Eastern Energy, L.P., | |||||
| Pass Thru Ctf Ser 1999-A (L) | 9.000 | 01-02-17 | BB+ | 3,742 | 4,247,154 |
| Beaver Valley Funding Corp., | |||||
| Sec Lease Obligation Bond | 9.000 | 06-01-17 | BB+ | 3,919 | 4,512,924 |
| BVPS II Funding Corp., | |||||
| Collateralized Lease Bond | 8.890 | 06-01-17 | BB+ | 6,387 | 7,511,687 |
| DTE Energy Co., | |||||
| Sr Note | 6.450 | 06-01-06 | BBB- | 2,005 | 2,021,070 |
| Duke Energy Corp., | |||||
| Note | 7.000 | 10-15-06 | BBB- | 1,225 | 1,238,547 |
| East Coast Power LLC, | |||||
| Sr Sec Note Ser B | 7.066 | 03-31-12 | BBB- | 3,062 | 3,169,409 |
| See notes to financial statements. |
12
| F I N A N C I A L S TAT E M E N T S |
| Interest | Maturity | Credit | Par value | ||
| Issuer, description | rate | date | rating (A) | (000) | Value |
| Electric Utilities (continued) | |||||
| Empresa Electrica Guacolda S.A., | |||||
| Sr Sec Note (Chile) (S) | 8.625% | 04-30-13 | BBB- | $1,920 | $2,096,410 |
| Entergy Gulf States, Inc., | |||||
| 1st Mtg Note | 5.700 | 06-01-15 | BBB+ | 1,355 | 1,311,174 |
| HQI Transelect Chile S.A., | |||||
| Sr Note (Chile) | 7.875 | 04-15-11 | A- | 2,895 | 3,214,744 |
| Indiantown Cogeneration, L.P., | |||||
| 1st Mtg Note Ser A-9 | 9.260 | 12-15-10 | BB+ | 1,576 | 1,697,847 |
| IPALCO Enterprises, Inc., | |||||
| Sr Sec Note | 8.625 | 11-14-11 | BB- | 3,000 | 3,277,500 |
| Kansas Gas & Electric Co., | |||||
| Bond | 5.647 | 03-29-21 | BB- | 1,910 | 1,875,754 |
| Midland Funding Corp. II, | |||||
| Lease Obligation Bond Ser B | 13.250 | 07-23-06 | BB- | 4,002 | 4,170,242 |
| Monterrey Power S.A. de C.V., | |||||
| Sr Sec Bond (Mexico) (S) | 9.625 | 11-15-09 | BBB | 2,445 | 2,781,512 |
| Pepco Holdings, Inc., | |||||
| Floating Rate Sr Note (P) | 4.495 | 06-01-10 | BBB | 1,135 | 1,139,995 |
| PNPP II Funding Corp., | |||||
| Deb | 9.120 | 05-30-16 | BB+ | 4,091 | 4,756,524 |
| PSE&G Energy Holdings LLC, | |||||
| Sr Note | 7.750 | 04-16-07 | BB- | 2,360 | 2,407,200 |
| System Energy Resources, Inc., | |||||
| Sec Bond (S) | 5.129 | 01-15-14 | BBB | 2,890 | 2,780,943 |
| Texas-New Mexico Power Co., | |||||
| Sr Note | 6.125 | 06-01-08 | BBB | 3,350 | 3,386,659 |
| TransAlta Corp., | |||||
| Note (Canada) | 5.750 | 12-15-13 | BBB- | 3,295 | 3,322,727 |
| TXU Australia Holdings, L.P., | |||||
| Sr Note (Australia) | 6.750 | 12-01-06 | A- | 1,650 | 1,676,524 |
| Waterford 3 Funding Corp., | |||||
| Sec Lease Obligation Bond | 8.090 | 01-02-17 | BBB- | 5,053 | 5,315,735 |
| Westar Energy, Inc., | |||||
| 1st Mtg Bond | 5.950 | 01-01-35 | BBB- | 1,915 | 1,801,329 |
| Electrical Components & Equipment | 0.32% | 3,575,111 | |||
| AMETEK, Inc., | |||||
| Sr Note | 7.200 | 07-15-08 | BBB | 3,425 | 3,575,111 |
| Food Retail 0.83% | 9,124,639 | ||||
| Ahold Finance USA, Inc., | |||||
| Gtd Pass Thru Ctf Ser 2001A-1 | 7.820 | 01-02-20 | BB | 4,035 | 4,337,323 |
| Albertson’s, Inc., | |||||
| Sr Deb | 7.450 | 08-01-29 | BBB- | 515 | 441,702 |
| See notes to financial statements. |
13
| F I N A N C I A L S TAT E M E N T S |
| Interest | Maturity | Credit | Par value | ||||
| Issuer, description | rate | date | rating (A) | (000) | Value | ||
| Food Retail (continued) | |||||||
| Delhaize America, Inc., | |||||||
| Gtd Note | 9.000% | 04-15-31 | BB+ | $1,575 | $1,791,444 | ||
| Food Lion, Inc., | |||||||
| Note | 8.730 | 08-30-06 | BB+ | 2,500 | 2,554,170 | ||
| Gas Utilities 0.72% | 7,917,781 | ||||||
| Dynegy-Roseton Danskamme, | |||||||
| Gtd Pass Thru Ctf Ser B | 7.670 | 11-08-16 | B | 2,600 | 2,606,500 | ||
| Energy Transfer Partners, | |||||||
| Sr Note (G)(S) | 5.650 | 08-01-12 | BBB- | 3,415 | 3,336,475 | ||
| NorAm Energy Corp., | |||||||
| Deb | 6.500 | 02-01-08 | BBB | 1,925 | 1,974,806 | ||
| Health Care Facilities 0.26% | 2,866,986 | ||||||
| HCA, Inc., | |||||||
| Note | 9.000 | 12-15-14 | BB+ | 822 | 951,643 | ||
| Manor Care, Inc., | |||||||
| Gtd Note | 6.250 | 05-01-13 | BBB | 1,855 | 1,915,343 | ||
| Health Care Services 0.20% | 2,252,604 | ||||||
| Caremark Rx, Inc., | |||||||
| Sr Note | 7.375 | 10-01-06 | BBB- | 2,210 | 2,252,604 | ||
| Hotels, Resorts & Cruise Lines 0.47% | 5,163,293 | ||||||
| Hyatt Equities LLC, | |||||||
| Note (S) | 6.875 | 06-15-07 | BBB | 3,130 | 3,196,412 | ||
| Meditrust, | |||||||
| Med Term Note | 7.300 | 01-16-06 | BB- | 1,945 | 1,966,881 | ||
| Industrial Conglomerates 0.56% | 6,165,218 | ||||||
| General Electric Co., | |||||||
| Note | 5.000 | 02-01-13 | AAA | 6,215 | 6,165,218 | ||
| Industrial Machinery 0.56% | 6,132,680 | ||||||
| Kennametal, Inc., | |||||||
| Sr Note | 7.200 | 06-15-12 | BBB | 2,960 | 3,197,966 | ||
| Trinity Industries, Inc., | |||||||
| Pass Thru Ctf (S) | 7.755 | 02-15-09 | Ba1 | 2,839 | 2,934,714 | ||
| Insurance Brokers 0.20% | 2,178,207 | ||||||
| Willis Group North America, | |||||||
| Gtd Note | 5.625 | 07-15-15 | BBB- | 1,250 | 1,235,760 | ||
| Gtd Note | 5.125 | 07-15-10 | BBB- | 950 | 942,447 | ||
| Integrated Oil & Gas 0.25% | 2,800,250 | ||||||
| Pemex Project Funding Master Trust, | |||||||
| Gtd Note | 9.125 | 10-13-10 | BBB | 2,435 | 2,800,250 | ||
| See notes to financial statements. |
14
| F I N A N C I A L S TAT E M E N T S |
| Interest | Maturity | Credit | Par value | ||
| Issuer, description | rate | date | rating (A) | (000) | Value |
| Investment Banking & Brokerage 0.53% | $5,838,931 | ||||
| Ameriprise Financial, Inc., | |||||
| Sr Note | 5.350% | 11-15-10 | A- | $2,055 | 2,062,431 |
| Mizuho Financial Group Cayman Ltd., | |||||
| Gtd Note (Cayman Islands) | 8.375 | 12-29-49 | A2 | 3,500 | 3,776,500 |
| Life & Health Insurance 0.38% | 4,146,059 | ||||
| Phoenix Cos., Inc. (The), | |||||
| Bond | 6.675 | 02-16-08 | BBB | 2,205 | 2,226,122 |
| Phoenix Life Insurance Co., | |||||
| Note (S) | 7.150 | 12-15-34 | BBB+ | 1,920 | 1,919,937 |
| Meat, Poultry & Fish 0.32% | 3,510,687 | ||||
| American Seafood Group LLC, | |||||
| Gtd Sr Sub Note | 10.125 | 04-15-10 | B- | 955 | 1,014,687 |
| ASG Consolidated LLC, | |||||
| Sr Disc Note (Zero to 11-1-08, | |||||
| then 11.500%) (O) | Zero | 11-01-11 | B- | 3,200 | 2,496,000 |
| Metal & Glass Containers 0.16% | 1,716,000 | ||||
| BWAY Corp., | |||||
| Gtd Sr Sub Note | 10.000 | 10-15-10 | B- | 1,650 | 1,716,000 |
| Metals & Mining 0.10% | 1,117,743 | ||||
| Vedanta Resources Plc, | |||||
| Sr Note (United Kingdom) (S) | 6.625 | 02-22-10 | BB+ | 1,140 | 1,117,743 |
| Multi-Line Insurance 1.12% | 12,368,986 | ||||
| American International Group, | |||||
| Note (S) | 5.050 | 10-01-15 | AA | 3,000 | 2,918,262 |
| Massachusetts Mutual Life Insurance Co., | |||||
| Surplus Note (S) | 7.625 | 11-15-23 | AA | 3,150 | 3,841,743 |
| New York Life Insurance Co., | |||||
| Note (S) | 5.875 | 05-15-33 | AA- | 3,685 | 3,766,737 |
| Zurich Capital Trust I, | |||||
| Gtd Cap Security (S) | 8.376 | 06-01-37 | A- | 1,705 | 1,842,244 |
| Multi-Media 0.53% | 5,813,206 | ||||
| News America Holdings, Inc., | |||||
| Gtd Sr Deb | 8.250 | 08-10-18 | BBB- | 3,000 | 3,600,528 |
| Time Warner, Inc., | |||||
| Deb | 9.125 | 01-15-13 | BBB+ | 1,851 | 2,212,678 |
| Multi-Utilities & Unregulated Power | 0.70% | 7,648,069 | |||
| East Coast Power LLC, | |||||
| Sr Sec Note | 6.737 | 03-31-08 | BBB- | 203 | 205,296 |
| Salton Sea Funding Corp., | |||||
| Gtd Sr Sec Note Ser E | 8.300 | 05-30-11 | BB+ | 653 | 700,192 |
| Sr Sec Note Ser C | 7.840 | 05-30-10 | BB+ | 6,476 | 6,742,581 |
| See notes to financial statements. |
15
| F I N A N C I A L S TAT E M E N T S |
| Interest | Maturity | Credit | Par value | ||
| Issuer, description | rate | date | rating (A) | (000) | Value |
| Oil & Gas Drilling 0.15% | $1,658,723 | ||||
| Delek & Avner-Yam Tethys Ltd., | |||||
| Sr Sec Note (Israel) (S) | 5.326% | 08-01-13 | BBB- | $1,695 | 1,658,723 |
| Oil & Gas Exploration & Production 0.57% | 6,290,759 | ||||
| Enterprise Products Partners, L.P., | |||||
| Sr Note | 4.950 | 06-01-10 | BB+ | 6,440 | 6,290,759 |
| Packaged Foods & Meats 0.10% | 1,139,889 | ||||
| General Foods Corp., | |||||
| Deb | 7.000 | 06-15-11 | A- | 1,145 | 1,139,889 |
| Paper Products 0.20% | 2,221,306 | ||||
| MDP Acquisitions Plc, | |||||
| Sr Note (Ireland) | 9.625 | 10-01-12 | B- | 655 | 648,450 |
| Plum Creek Timber Co., Inc., | |||||
| Gtd Note | 5.875 | 11-15-15 | BBB- | 1,570 | 1,572,856 |
| Pharmaceuticals 0.50% | 5,482,752 | ||||
| Medco Health Solutions, Inc., | |||||
| Sr Note | 7.250 | 08-15-13 | BBB | 2,380 | 2,604,284 |
| Wyeth, | |||||
| Note (S) | 5.500 | 02-15-16 | A | 2,865 | 2,878,468 |
| Property & Casualty Insurance | 0.54% | 5,967,991 | |||
| Markel Corp., | |||||
| Sr Note | 7.350 | 08-15-34 | BBB- | 2,380 | 2,512,088 |
| Ohio Casualty Corp., | |||||
| Note | 7.300 | 06-15-14 | BB | 1,700 | 1,805,041 |
| URC Holdings Corp., | |||||
| Sr Note (S) | 7.875 | 06-30-06 | AA- | 1,630 | 1,650,862 |
| Real Estate Investment Trusts | 1.36% | 14,971,525 | |||
| American Health Properties, Inc., | |||||
| Note | 7.500 | 01-15-07 | BBB+ | 2,380 | 2,441,397 |
| Healthcare Realty Trust, Inc., | |||||
| Sr Note | 8.125 | 05-01-11 | BBB- | 2,515 | 2,778,645 |
| Health Care REIT, Inc., | |||||
| Sr Note | 6.200 | 06-01-16 | BBB- | 1,525 | 1,515,699 |
| ProLogis Trust, | |||||
| Note | 7.050 | 07-15-06 | BBB+ | 1,745 | 1,762,377 |
| Simon Property Group, L.P., | |||||
| Note | 5.450 | 03-15-13 | BBB+ | 1,910 | 1,899,835 |
| Spieker Properties, Inc., | |||||
| Note | 7.125 | 12-01-06 | BBB+ | 4,490 | 4,573,572 |
| See notes to financial statements. |
16
| F I N A N C I A L S TAT E M E N T S |
| Interest | Maturity | Credit | Par value | ||
| Issuer, description | rate | date | rating (A) | (000) | Value |
| Real Estate Management & Development 0.20% | $2,234,907 | ||||
| Socgen Real Estate Co., LLC, | |||||
| Perpetual Bond Ser A (7.640% to | |||||
| 09-30-07 then variable) (S) | 7.640% | 12-29-49 | A | $2,140 | 2,234,907 |
| Regional Banks 1.28% | 14,124,752 | ||||
| BankAmerica Institutional Bank, | |||||
| Gtd Cap Security Ser B (S) | 7.700 | 12-31-26 | A | 1,060 | 1,123,101 |
| Colonial Bank, | |||||
| Sub Note | 9.375 | 06-01-11 | BBB- | 2,405 | 2,813,472 |
| Mainstreet Capital Trust I, | |||||
| Gtd Jr Sub Cap Security Ser B (G) | 8.900 | 12-01-27 | A3 | 2,380 | 2,599,415 |
| NB Capital Trust IV, | |||||
| Gtd Cap Security | 8.250 | 04-15-27 | A | 3,030 | 3,251,538 |
| State Street Institutional Capital Trust, | |||||
| Gtd Cap Security Ser A (S) | 7.940 | 12-30-26 | A | 1,325 | 1,408,653 |
| Wachovia Capital Trust II, | |||||
| Gtd Floating Rate Cap Security (P) | 4.650 | 01-15-27 | A- | 3,050 | 2,928,573 |
| Soft Drinks 0.15% | 1,633,837 | ||||
| Panamerican Beverages, Inc., | |||||
| Sr Note (Panama) | 7.250 | 07-01-09 | BBB | 1,545 | 1,633,837 |
| Specialized Finance 1.54% | 16,892,176 | ||||
| Astoria Depositor Corp., | |||||
| Pass Thru Ctf Ser B (G) | 8.144 | 05-01-21 | BB | 3,640 | 3,748,618 |
| Bosphorous Financial Services, | |||||
| Sec Floating Rate Note (P)(S) | 6.140 | 02-15-12 | Baa3 | 2,285 | 2,250,999 |
| ESI Tractebel Acquisition Corp., | |||||
| Gtd Sec Bond Ser B | 7.990 | 12-30-11 | BB | 3,924 | 4,113,239 |
| Global Signal Trust, | |||||
| Sub Bond Ser 2004-1A Class D (S) | 5.098 | 01-15-34 | BBB | 3,445 | 3,381,794 |
| Sub Bond Ser 2004-2A Class D (S) | 5.093 | 12-15-14 | Baa2 | 1,820 | 1,756,776 |
| Humpuss Funding Corp., | |||||
| Note (S) | 7.720 | 12-15-09 | B2 | 1,674 | 1,640,750 |
| Specialty Chemicals 0.14% | 1,514,100 | ||||
| NOVA Chemicals Ltd., | |||||
| Note (Canada) | 7.875 | 09-15-25 | BB+ | 1,545 | 1,514,100 |
| Telecommunication Services 1.92% | 21,079,651 | ||||
| AT&T Corp., | |||||
| Med Term Note | 8.350 | 05-15-25 | BB+ | 2,870 | 2,977,625 |
| Sr Note | 9.750 | 11-15-31 | A | 3,785 | 4,655,550 |
| Cox Communications, Inc., | |||||
| Floating Rate Note (P) | 4.407 | 12-14-07 | BBB- | 1,460 | 1,471,188 |
| See notes to financial statements. |
17
| F I N A N C I A L S TAT E M E N T S |
| Interest | Maturity | Credit | Par value | ||
| Issuer, description | rate | date | rating (A) | (000) | Value |
| Telecommunication Services (continued) | |||||
| Intelsat Bermuda Ltd., | |||||
| Floating Rate Sr Note (Bermuda) (L)(P)(S) | 8.695% | 01-15-12 | B+ | $1,000 | $1,015,000 |
| Telecom de Puerto Rico, | |||||
| Gtd Sr Sub Note (Puerto Rico) | 6.650 | 05-15-06 | BBB+ | 4,750 | 4,784,362 |
| Telecom Italia Capital, | |||||
| Gtd Note (Luxembourg) | 6.000 | 09-30-34 | BBB+ | 3,220 | 3,078,826 |
| Verizon Florida, Inc., | |||||
| Sr Deb Ser F | 6.125 | 01-15-13 | A+ | 3,075 | 3,097,100 |
| Telecommunications Equipment 0.53% | 5,881,897 | ||||
| Corning, Inc., | |||||
| Med Term Note | 8.300 | 04-04-25 | Ba2 | 4,230 | 4,392,144 |
| Note | 6.050 | 06-15-15 | BBB- | 1,515 | 1,489,753 |
| Thrifts & Mortgage Finance 11.71% | 128,829,966 | ||||
| American Home Mortgage | |||||
| Investment Trust, | |||||
| Asset Backed Ctf Ser 2005-2 | |||||
| Class 4A1 | 5.660 | 09-25-45 | AAA | 6,302 | 6,326,233 |
| Banc of America Commercial | |||||
| Mortgage, Inc., | |||||
| Mtg Pass Thru Ctf Ser 2005-4 | |||||
| Class A5A | 4.933 | 07-10-45 | AAA | 1,870 | 1,819,454 |
| Bear Stearns Adjustable Rate | |||||
| Mortgage Trust, | |||||
| Mtg Pass Thru Ser 2003-9 | |||||
| Class 3A2 (P) | 4.993 | 02-25-34 | AAA | 2,461 | 2,426,224 |
| Bear Stearns Alt-A Trust, | |||||
| Mtg Pass Thru Ctf Ser 2005-3 | |||||
| Class B2 (P) | 5.395 | 04-25-35 | AA+ | 1,888 | 1,858,817 |
| Bear Stearns Commercial Mortgage | |||||
| Securities, Inc., | |||||
| Mtg Pass Thru Ctf Ser 2005-T20 | |||||
| Class A4A | 5.303 | 10-12-42 | Aaa | 1,965 | 1,955,518 |
| Chaseflex Trust, | |||||
| Asset Backed Ctf Ser 2005-2 Class 4A1 | 5.000 | 05-25-20 | AAA | 5,513 | 5,411,841 |
| Citi/Deutsche Bank Commercial | |||||
| Mortgage Securities, | |||||
| Mtg Pass Thru Ctf Ser 2005-CD1 | |||||
| Class A4 | 5.225 | 07-15-44 | AAA | 2,795 | 2,797,188 |
| Mtg Pass Thru Ctf Ser 2005-CD1 | |||||
| Class C | 5.225 | 07-15-44 | AA | 1,335 | 1,320,540 |
| ContiMortgage Home Equity | |||||
| Loan Trust, | |||||
| Pass Thru Ctf Ser 1995-2 | |||||
| Class A-5 | 8.100 | 08-15-25 | AAA | 709 | 734,281 |
| See notes to financial statements. |
18
| F I N A N C I A L S TAT E M E N T S |
| Interest | Maturity | Credit | Par value | ||
| Issuer, description | rate | date | rating (A) | (000) | Value |
| Thrifts & Mortgage Finance (continued) | |||||
| Countrywide Alternative Loan Trust, | |||||
| Mtg Pass Thru Ctf Ser 2004-24CB | |||||
| Class 1A1 | 6.000% | 11-25-34 | AAA | $4,479 | $4,473,094 |
| Mtg Pass Thru Ctf Ser 2005-J1 | |||||
| Class 3A1 | 6.500 | 08-25-32 | AAA | 2,610 | 2,651,841 |
| Countrywide Home Loans | |||||
| Servicing, L.P., | |||||
| Mtg Pass Thru Ctf Ser 2005-6 | |||||
| Class 2A1 | 5.500 | 04-25-35 | Aaa | 3,213 | 3,185,451 |
| Doral Financial Corp., | |||||
| Floating Rate Note (Puerto Rico) (P) | 5.004 | 07-20-07 | BB- | 5,300 | 4,949,760 |
| First Horizon Alternative | |||||
| Mortgage Securities, | |||||
| Mtg Pass Thru Ctf Ser 2004-AA5 | |||||
| Class B1 (P) | 5.251 | 12-25-34 | AA | 1,442 | 1,421,654 |
| GMAC Commercial Mortgage | |||||
| Securities, Inc., | |||||
| Mtg Pass Thru Ctf Ser 2002-C1 | |||||
| Class A1 | 5.785 | 11-15-39 | AAA | 3,961 | 4,024,452 |
| Greenwich Capital Commercial | |||||
| Funding Corp., | |||||
| Mtg Pass Thru Ctf Ser 2003-C2 | |||||
| Class A-2 | 4.022 | 01-05-36 | AAA | 3,495 | 3,385,097 |
| Mtg Pass Thru Ctf Ser 2005-GG5 | |||||
| Class A2 | 5.117 | 04-10-37 | AAA | 5,650 | 5,638,662 |
| GSR Mortgage Loan Trust, | |||||
| Mtg Pass Thru Ctf Ser 2004-9 | |||||
| Class B1 (G)(P) | 4.441 | 08-25-34 | AA | 3,222 | 3,162,936 |
| Indymac Index Mortgage Loan Trust, | |||||
| Asset Backed Ctf Ser 2004-AR13 | |||||
| Class B1 | 5.296 | 01-25-35 | AA | 2,180 | 2,157,564 |
| Asset Backed Ctf Ser 2005-AR5 | |||||
| Class B1 (P) | 5.443 | 05-25-35 | AA | 2,357 | 2,340,996 |
| JP Morgan Chase Commercial Mortgage | |||||
| Securities Corp., | |||||
| Mtg Pass Thru Ctf Ser 2005-LDP3 | |||||
| Class A4B | 4.996 | 08-15-42 | AAA | 3,995 | 3,891,813 |
| Mtg Pass Thru Ctf Ser 2005-LDP4 | |||||
| Class B | 5.129 | 10-15-42 | Aa2 | 2,126 | 2,067,732 |
| JP Morgan Mortgage Trust, | |||||
| Mtg Pass Thru Ctf Ser 2005-A2 | |||||
| Class 1A1 (P) | 4.770 | 04-25-35 | AAA | 5,153 | 5,060,513 |
| Mtg Pass Thru Ctf Ser 2005-S2 | |||||
| Class 2A16 | 6.500 | 09-25-35 | AAA | 4,871 | 4,932,243 |
| See notes to financial statements. |
19
| F I N A N C I A L S TAT E M E N T S |
| Interest | Maturity | Credit | Par value | ||
| Issuer, description | rate | date | rating (A) | (000) | Value |
| Thrifts & Mortgage Finance (continued) | |||||
| MLCC Mortgage Investors, Inc., | |||||
| Asset Backed Ctf Ser 2004-1 | |||||
| Class 2A1 (P) | 4.746% | 12-25-34 | Aaa | $3,502 | $3,458,972 |
| Morgan Stanley Capital I, | |||||
| Commercial Mtg Pass Thru Ctf | |||||
| Ser 2005-HQ7 Class A4 | 5.205 | 11-14-42 | AAA | 3,765 | 3,780,391 |
| Commercial Mtg Pass Thru Ctf | |||||
| Ser 2005-IQ10 Class A4A | 5.230 | 09-15-42 | AAA | 5,270 | 5,239,615 |
| Provident Funding Mortgage | |||||
| Loan Trust, | |||||
| Mtg Pass Thru Ctf Ser 2005-1 | |||||
| Class B1 (P) | 4.375 | 05-25-35 | AAA | 1,460 | 1,414,468 |
| Renaissance Home Equity Loan Trust, | |||||
| Asset Backed Note Ser 2004-4 | |||||
| Class AF2 | 3.856 | 02-25-35 | AAA | 5,855 | 5,775,452 |
| Asset Backed Note Ser 2005-2 | |||||
| Class AF3 | 4.499 | 08-25-35 | AAA | 3,005 | 2,953,897 |
| Asset Backed Note Ser 2005-2 | |||||
| Class AF4 | 4.934 | 08-25-35 | AAA | 2,855 | 2,784,054 |
| Residential Asset Mortgage Products, Inc., | |||||
| Mtg Pass Thru Ctf | |||||
| Ser 2003-RS10 Class AI-5 | 4.910 | 01-25-31 | AAA | 4,595 | 4,570,047 |
| SBA CMBS Trust, | |||||
| Sub Bond Ser 2005-1A Class A (S) | 5.369 | 11-15-35 | Aaa | 1,310 | 1,317,113 |
| Sub Bond Ser 2005-1A Class B (S) | 5.565 | 11-15-35 | Aa2 | 1,300 | 1,307,566 |
| Sub Bond Ser 2005-1A Class D (S) | 6.219 | 11-15-35 | Baa2 | 500 | 503,086 |
| Sub Bond Ser 2005-1A Class E (S) | 6.706 | 11-15-35 | Baa3 | 600 | 603,680 |
| Sovereign Capital Trust I, | |||||
| Gtd Cap Sec | 9.000 | 04-01-27 | BB | 3,840 | 4,127,601 |
| Specialty Underwriting & Residential | |||||
| Finance Trust, | |||||
| Mtg Ln Asset Backed Ctf Ser 2003-BC4 | |||||
| Class A3B | 4.788 | 11-25-34 | AAA | 4,030 | 3,995,206 |
| Washington Mutual Alternative Loan Trust, | |||||
| Mtg Pass Thru Ctf Ser 2005-6 | |||||
| Class 1CB | 6.500 | 08-25-35 | AAA | 3,870 | 3,902,405 |
| Wells Fargo Mortgage Backed Securities Trust, | |||||
| Mtg Pass Thru Ctf Ser 2005-AR2 | |||||
| Class 3A1 (P) | 4.953 | 03-25-35 | Aaa | 5,187 | 5,102,509 |
| Tobacco 0.58% | 6,337,738 | ||||
| Commonwealth Brands, Inc., | |||||
| Sr Sec Sub Note (G)(S) | 10.625 | 09-01-08 | B | 1,355 | 1,546,394 |
| Phillip Morris Co., Inc., | |||||
| Note | 6.950 | 06-01-06 | BBB | 4,745 | 4,791,344 |
| See notes to financial statements. |
20
| F I N A N C I A L S TAT E M E N T S |
| Interest | Maturity | Credit | Par value | ||
| Issuer, description | rate | date | rating (A) | (000) | Value |
| Trucking 0.66% | $7,300,169 | ||||
| ERAC USA Finance Co., | |||||
| Bond (S) | 5.900% | 11-15-15 | BBB+ | $2,115 | 2,133,464 |
| Note (S) | 7.950 | 12-15-09 | BBB+ | 1,985 | 2,180,630 |
| Hertz Corp., | |||||
| Note | 4.700 | 10-02-06 | BBB- | 2,995 | 2,986,075 |
| Utilities Other 0.27% | 2,959,040 | ||||
| Magellan Midstream Partners, L.P., | |||||
| Note | 6.450 | 06-01-14 | BBB | 2,800 | 2,959,040 |
| Wireless Telecommunication Services | 1.25% | 13,745,094 | |||
| America Movil S.A. de C.V., | |||||
| Sr Note (Mexico) | 5.750 | 01-15-15 | BBB | 1,905 | 1,890,231 |
| AT&T Wireless Services , Inc., | |||||
| Sr Note | 8.125 | 05-01-12 | A | 1,700 | 1,957,055 |
| Crown Castle Towers LLC, | |||||
| Sub Bond Ser 2005-1A Class A (L) | 4.643 | 06-15-35 | Aaa | 2,565 | 2,495,024 |
| Sub Bond Ser 2005-1A Class D | 5.612 | 06-15-35 | Baa2 | 2,960 | 2,883,490 |
| Nextel Communications, Inc., | |||||
| Sr Note | 5.950 | 03-15-14 | BB | 3,000 | 2,999,988 |
| Rogers Wireless, Inc., | |||||
| Sr Sub Note (Canada) (L) | 8.000 | 12-15-12 | B+ | 1,435 | 1,519,306 |
| Credit | |||
| Issuer, description | rating (A) | Shares | Value |
| Preferred stocks 0.23% | $2,482,892 | ||
| (Cost $2,501,000) | |||
| Agricultural Products 0.23% | 2,482,892 | ||
| Ocean Spray Cranberries, Inc., 6.25%, Ser A (S) | BB+ | 30,500 | 2,482,892 |
| Interest | Maturity | Credit | Par value | ||
| Issuer, description | rate | date | rating (A) | (000) | Value |
| U.S. government and agencies securities 51.06% | $561,746,310 | ||||
| (Cost $564,596,699) | |||||
| Government U.S. 12.75% | 140,265,113 | ||||
| United States Treasury, | |||||
| Bond (L) | 6.875% | 08-15-25 | AAA | $38,795 | 48,901,408 |
| Bond (L) | 5.375 | 02-15-31 | AAA | 45,310 | 49,784,363 |
| Note (L) | 4.500 | 11-15-10 | AAA | 11,350 | 11,386,797 |
| Note (L) | 4.500 | 11-15-15 | AAA | 9,055 | 9,056,413 |
| Note (L) | 4.250 | 10-15-10 | AAA | 7,585�� | 7,521,597 |
| Note (L) | 4.250 | 11-15-13 | AAA | 3,360 | 3,299,624 |
| Note (L) | 4.000 | 02-15-15 | AAA | 10,325 | 9,910,792 |
| Note (L) | 3.875 | 02-15-13 | AAA | 420 | 404,119 |
| See notes to financial statements. |
21
| F I N A N C I A L S TAT E M E N T S |
| Interest | Maturity | Credit | Par value | |||
| Issuer, description | rate | date | rating (A) | (000) | Value | |
| Government U.S. Agency 38.31% | $421,481,197 | |||||
| Federal Home Loan Bank, | ||||||
| Bond | 5.125% | 11-01-10 | AAA | $1,695 | 1,684,891 | |
| Bond | 5.020 | 11-07-08 | AAA | 3,065 | 3,059,541 | |
| Bond | 4.600 | 04-11-08 | AAA | 5,380 | 5,353,649 | |
| Bond | 4.500 | 04-11-08 | AAA | 3,065 | 3,044,431 | |
| Bond | 4.250 | 03-24-08 | AAA | 3,345 | 3,303,977 | |
| Federal Home Loan Mortgage Corp., | ||||||
| 20 Yr Pass Thru Ctf | 11.250 | 01-01-16 | AAA | 85 | 90,700 | |
| 30 Yr Pass Thru Ctf (M) | 6.000 | 12-15-35 | AAA | 23,240 | 23,407,049 | |
| 30 Yr Pass Thru Ctf | 5.000 | 07-01-35 | AAA | 11,038 | 10,618,244 | |
| 30 Yr Pass Thru Ctf | 5.000 | 09-01-35 | AAA | 1,261 | 1,212,835 | |
| CMO REMIC 2489-PE | 6.000 | 08-15-32 | AAA | 2,690 | 2,724,973 | |
| CMO REMIC 2640-WA | 3.500 | 03-15-33 | AAA | 1,562 | 1,503,066 | |
| CMO REMIC 2754-PC | 5.000 | 12-15-28 | AAA | 4,375 | 4,291,458 | |
| CMO REMIC 2836-QD | 5.000 | 09-15-27 | AAA | 6,360 | 6,290,395 | |
| CMO REMIC 3033-JH | 5.000 | 06-15-32 | AAA | 6,621 | 6,527,268 | |
| CMO REMIC 3033-KT | 5.000 | 09-15-22 | AAA | 10,842 | 10,736,805 | |
| CMO REMIC 3046-BA | 5.000 | 10-15-24 | AAA | 7,607 | 7,534,907 | |
| Med Term Note | 4.875 | 10-04-10 | AAA | 5,810 | 5,744,155 | |
| Note | 5.300 | 11-17-10 | AAA | 5,835 | 5,837,241 | |
| Note | 5.100 | 11-14-08 | AAA | 9,000 | 8,984,232 | |
| Note | 4.900 | 11-03-08 | AAA | 7,140 | 7,113,461 | |
| Note | 4.750 | 10-17-08 | AAA | 5,895 | 5,857,213 | |
| Note | 4.625 | 08-22-08 | AAA | 7,625 | 7,562,162 | |
| Federal National Mortgage Assn., | ||||||
| 15 Yr Pass Thru Ctf | 9.000 | 06-01-10 | AAA | 804 | 874,100 | |
| 15 Yr Pass Thru Ctf | 7.500 | 02-01-08 | AAA | 83 | 85,128 | |
| 15 Yr Pass Thru Ctf | 7.000 | 09-01-10 | AAA | 178 | 184,041 | |
| 15 Yr Pass Thru Ctf | 7.000 | 04-01-17 | AAA | 757 | 787,520 | |
| 15 Yr Pass Thru Ctf | 7.000 | 06-01-17 | AAA | 185 | 192,681 | |
| 15 Yr Pass Thru Ctf | 5.500 | 10-01-20 | AAA | 4,000 | 4,018,929 | |
| 15 Yr Pass Thru Ctf | 5.500 | 11-01-20 | AAA | 6,591 | 6,622,101 | |
| 15 Yr Pass Thru Ctf | 5.500 | 12-01-20 | AAA | 11,709 | 11,764,521 | |
| 15 Yr Pass Thru Ctf | 5.000 | 05-01-18 | AAA | 8,059 | 7,954,635 | |
| 15 Yr Pass Thru Ctf | 5.000 | 08-01-19 | AAA | 10,663 | 10,508,246 | |
| 15 Yr Pass Thru Ctf | 5.000 | 10-01-19 | AAA | 21,624 | 21,314,863 | |
| 15 Yr Pass Thru Ctf | 5.000 | 11-01-20 | AAA | 28,305 | 27,894,640 | |
| 15 Yr Pass Thru Ctf | 4.500 | 05-01-18 | AAA | 9,615 | 9,325,226 | |
| 15 Yr Pass Thru Ctf | 4.500 | 10-01-18 | AAA | 19,333 | 18,750,001 | |
| 15 Yr Pass Thru Ctf | 4.500 | 05-01-20 | AAA | 5,358 | 5,181,290 | |
| 30 Yr Pass Thru Ctf | 6.000 | 11-01-34 | AAA | 840 | 845,011 | |
| 30 Yr Pass Thru Ctf | 6.000 | 09-01-35 | AAA | 15,745 | 15,842,820 | |
| 30 Yr Pass Thru Ctf | 6.000 | 10-01-35 | AAA | 579 | 582,854 | |
| 30 Yr Pass Thru Ctf | 5.500 | 05-01-35 | AAA | 56,316 | 55,602,184 | |
| 30 Yr Pass Thru Ctf | 5.000 | 07-01-35 | AAA | 5,585 | 5,373,970 | |
| 30 Yr Pass Thru Ctf | 5.000 | 08-01-35 | AAA | 17,520 | 16,859,961 | |
| See notes to financial statements. |
22
| F I N A N C I A L S TAT E M E N T S |
| Interest | Maturity | Credit | Par value | ||
| Issuer, description | rate | date | rating (A) | (000) | Value |
| Government U.S. Agency (continued) | |||||
| Federal National Mortgage Assn., (continued) | |||||
| 30 Yr Pass Thru Ctf | 4.500% | 09-01-35 | AAA | $9,868 | $9,220,332 |
| CMO REMIC 2003-17-QT | 5.000 | 08-25-27 | AAA | 13,365 | 13,209,280 |
| CMO REMIC 2003-33-AC | 4.250 | 03-25-33 | AAA | 1,289 | 1,241,628 |
| CMO REMIC 2003-49-JE | 3.000 | 04-25-33 | AAA | 3,563 | 3,201,725 |
| CMO REMIC 2003-58-AD | 3.250 | 07-25-33 | AAA | 3,541 | 3,263,408 |
| CMO REMIC 2003-63-PE | 3.500 | 07-25-33 | AAA | 2,833 | 2,596,455 |
| Note | 5.000 | 11-14-08 | AAA | 6,175 | 6,169,856 |
| Note (L) | 5.000 | 04-19-10 | AAA | 4,765 | 4,754,126 |
| Note (L) | 4.750 | 08-25-08 | AAA | 6,580 | 6,556,911 |
| Note (L) | 4.300 | 05-05-08 | AAA | 11,980 | 11,825,230 |
| Financing Corp., | |||||
| Bond | 10.350 | 08-03-18 | Aaa | 3,545 | 5,268,593 |
| Government National Mortgage Assn., | |||||
| 30 Yr Pass Thru Ctf | 10.500 | 01-15-16 | AAA | 25 | 28,128 |
| 30 Yr Pass Thru Ctf | 10.000 | 06-15-20 | AAA | 50 | 55,714 |
| 30 Yr Pass Thru Ctf | 10.000 | 11-15-20 | AAA | 12 | 13,010 |
| 30 Yr Pass Thru Ctf | 9.500 | 03-15-20 | AAA | 38 | 41,958 |
| 30 Yr Pass Thru Ctf | 9.500 | 06-15-20 | AAA | 12 | 13,684 |
| 30 Yr Pass Thru Ctf | 9.500 | 01-15-21 | AAA | 55 | 60,753 |
| 30 Yr Pass Thru Ctf | 9.500 | 05-15-21 | AAA | 22 | 24,910 |
| CMO REMIC 2003-42-XA | 3.750 | 05-16-33 | AAA | 946 | 888,121 |
| Interest | Par value | |||
| Issuer, description, maturity date | rate | (000) | Value | |
| Short-term investments 3.02% | $33,183,000 | |||
| (Cost $33,183,000) | ||||
| Joint Repurchase Agreement 3.02% | 33,183,000 | |||
| Investment in a joint repurchase agreement transaction | ||||
| with UBS Warburg, Inc. -- Dated 11-30-05, due | ||||
| 12-1-05 (secured by U.S. Treasury Inflation Indexed | ||||
| Bonds 3.375% and 3.625%, due 4-15-28 and | ||||
| 4-15-32 and U.S. Treasury Inflation Indexed Note | ||||
| 1.625%, due 1-15-15) | 3.950% | $33,183 | 33,183,000 | |
| Total investments 101.41% | $1,115,593,220 | |||
| Other assets and liabilities, net (1.41%) | ($15,546,646) | |||
| Total net assets 100.00% | $1,100,046,574 | |||
| See notes to financial statements. |
23
| F I N A N C I A L S TAT E M E N T S |
| Notes to Schedule of Investments | |
(A) | Credit ratings are unaudited and are rated by Moody’s Investors Service where Standard & Poor’s ratings are not |
| available unless indicated otherwise. | |
| (B) | This security is fair valued in good faith under procedures established by the Board of Trustees. |
| (G) | Security rated internally by John Hancock Advisers, LLC. |
| (H) | Non-income-producing issuer filed for protection under the Federal Bankruptcy Code or is in default of |
| interest payment. | |
| (L) | All or a portion of this security is on loan as of November 30, 2005. |
| (M) | This security having an aggregate value of $23,407,049, or 2.13% of the Fund’s net assets, has been purchased as |
| a forward commitment -- that is, the Fund has agreed on trade date to take delivery of and to make payment for | |
| this security on a delayed basis subsequent to the date of this schedule. The purchase price and interest rate of this | |
| security is fixed at trade date, although the Fund does not earn any interest on these until settlement date. The | |
| Fund has segregated assets with a current value at least equal to the amount of the forward commitment. | |
| Accordingly, the market value of $23,952,300 of Federal National Mortgage Assn., 4.500%, 10-1-18 and Federal | |
| National Mortgage Assn., 5.000%, 8-25-27 has been segregated to cover the forward commitment. | |
| (O) | Cash interest will be paid on this obligation at the stated rate beginning on the stated date. |
| (P) | Represents rate in effect on November 30, 2005. |
| (S) | These securities are exempt from registration under Rule 144A of the Securities Act of 1933. Such securities may |
| be resold, normally to qualified institutional buyers, in transactions exempt from registration. Rule 144A securities | |
| amounted to $95,528,075 or 8.68% of the Fund’s net assets as of November 30, 2005. | |
| Parenthetical disclosure of a foreign country in the security description represents country of a foreign issuer; how- | |
| ever, security is U.S. dollar-denominated. | |
The percentage shown for each investment category is the total value of that category as a percentage of the net | |
| assets of the Fund. | |
| See notes to financial statements. |
24
| F I N A N C I A L S TAT E M E N T S |
| ASSETS AND LIABILITIES |
| November 30, 2005 (unaudited) |
| This Statement of Assets and Liabilities is the Fund’s balance sheet. It shows the value of what the Fund owns, is due and owes. You’ll also find the net asset value and the maximum offering price per share. |
| Assets | |
| Investments at value (cost $1,121,807,086) | |
| including $178,876,378 of securities loaned | $1,115,593,220 |
| Cash | 32,866 |
| Receivable for investments sold | 3,257,596 |
| Receivable for shares sold | 343,465 |
| Interest receivable | 11,501,297 |
| Unrealized appreciation of swap contracts | 64,175 |
| Other assets | 126,041 |
| Total assets | 1,130,918,660 |
| Liabilities | |
| Payable for investments purchased | 27,981,063 |
| Payable for shares repurchased | 1,677,893 |
| Payable for swap contracts | 19,722 |
| Dividends payable | 136,855 |
| Payable to affiliates | |
| Management fees | 453,113 |
| Distribution and service fees | 70,029 |
| Other | 223,782 |
| Other payables and accrued expenses | 309,629 |
| Total liabilities | 30,872,086 |
| Net assets | |
| Capital paid-in | 1,122,247,984 |
| Accumulated net realized loss on investments, | |
| financial futures contracts and swap contracts | (13,784,820) |
| Net unrealized depreciation of investments | |
| and swap contracts | (6,149,691) |
| Distributions in excess of net investment income | (2,266,899) |
| Net assets | $1,100,046,574 |
| Net asset value per share | |
| Based on net asset values and shares outstanding -- | |
| the Fund has an unlimited number of shares | |
| authorized with no par value | |
| Class A ($958,140,460 ÷ 64,381,532 shares) | $14.88 |
| Class B ($109,399,403 ÷ 7,351,103 shares) | $14.88 |
| Class C ($25,862,463 ÷ 1,737,826 shares) | $14.88 |
| Class I ($6,251,319 ÷ 420,071 shares) | $14.88 |
| Class R ($392,929 ÷ 26,404 shares) | $14.88 |
| Maximum offering price per share | |
| Class A1 ($14.88 ÷ 95.5%) | $15.58 |
1 On single retail sales of less than $100,000. On sales of $100,000 or more and on group sales the offering price is reduced.
| See notes to financial statements. |
25
| F I N A N C I A L S TAT E M E N T S |
| OPERATIONS |
| For the period ended November 30, 2005 (unaudited)1 |
| This Statement of Operations summarizes the Fund’s investment income earned and expenses incurred in operating the Fund. It also shows net gains (losses) for the period stated. |
| Investment income | |
| Interest | $30,672,765 |
| Securities lending | 247,195 |
| Dividends | 166,454 |
| Total investment income | 31,086,414 |
| Expenses | |
| Investment management fees | 2,859,777 |
| Class A distribution and service fees | 1,486,333 |
| Class B distribution and service fees | 597,310 |
| Class C distribution and service fees | 136,793 |
| Class R distribution and service fees | 838 |
| Class A, B and C transfer agent fees | 1,044,205 |
| Class I transfer agent fees | 1,467 |
| Class R transfer agent fees | 343 |
| Accounting and legal services fees | 142,989 |
| Custodian fees | 129,283 |
| Printing | 76,416 |
| Trustees’ fees | 54,496 |
| Miscellaneous | 44,491 |
| Registration and filing fees | 42,134 |
| Professional fees | 37,947 |
| Compliance fees | 12,033 |
| Securities lending fees | 11,311 |
| Interest | 10,837 |
| Total expenses | 6,689,003 |
| Less expense reductions | (42,818) |
| Net expenses | 6,646,185 |
| Net investment income | 24,440,229 |
| Realized and unrealized gain (loss) | |
| Net realized gain (loss) on | |
| Investments | (829,317) |
| Financial futures contracts | 353,112 |
| Swap contracts | (12,222) |
| Change in net unrealized appreciation (depreciation) of | |
| Investments | (29,168,258) |
| Financial futures contracts | 338,237 |
| Swap contracts | 64,175 |
| Net realized and unrealized loss | (29,254,273) |
| Decrease in net assets from operations | ($4,814,044) |
1 Semiannual period from 6-1-05 through 11-30-05.
| See notes to financial statements. |
26
| F I N A N C I A L S TAT E M E N T S |
| CHANGES IN NET ASSETS |
| These Statements of Changes in Net Assets show how the value of the Fund’s net assets has changed during the last two periods. The difference reflects earnings less expenses, any investment gains and losses, distributions, if any, paid to shareholders and the net of Fund share transactions. |
| Year | Period | |
| ended | ended | |
| 5-31-05 | 11-30-051 | |
| Increase (decrease) in net assets | ||
| From operations | ||
| Net investment income | $52,262,850 | $24,440,229 |
| Net realized gain (loss) | 5,559,997 | (488,427) |
| Change in net unrealized | ||
| appreciation (depreciation) | 24,622,118 | (28,765,846) |
| Increase (decrease) in net assets | ||
| resulting from operations | 82,444,965 | (4,814,044) |
| Distributions to shareholders | ||
| From net investment income | ||
| Class A | (49,122,496) | (23,371,897) |
| Class B | (5,941,309) | (2,398,151) |
| Class C | (1,227,067) | (549,752) |
| Class I | (254,528) | (151,125) |
| Class R | (8,053) | (7,541) |
| (56,553,453) | (26,478,466) | |
| From Fund share transactions | (98,851,379) | (43,106,440) |
| Net assets | ||
| Beginning of period | 1,247,405,391 | 1,174,445,524 |
| End of period2 | $1,174,445,524 | $1,100,046,574 |
1 Semiannual period from 6-1-05 through 11-30-05. Unaudited.
2 Includes distributions in excess of net investment of $228,662 and $2,266,899, respectively.
| See notes to financial statements. |
27
| F I N A N C I A L H I G H L I G H T S |
| FINANCIAL HIGHLIGHTS |
CLASS A SHARES
The Financial Highlights show how the Fund’s net asset value for a share has changed since the end of the previous period.
| Period ended | 5-31-011 | 5-31-021,2 | 5-31-03 | 5-31-04 | 5-31-05 | 11-30-053 |
| Per share operating performance | ||||||
| Net asset value, | ||||||
| beginning of period | $13.93 | $14.69 | $14.71 | $15.69 | $14.98 | $15.30 |
| Net investment income4 | 0.92 | 0.82 | 0.72 | 0.70 | 0.67 | 0.33 |
| Net realized and unrealized | ||||||
| gain (loss) on investments | 0.76 | 0.06 | 1.02 | (0.65) | 0.38 | (0.39) |
| Total from | ||||||
| investment operations | 1.68 | 0.88 | 1.74 | 0.05 | 1.05 | (0.06) |
| Less distributions | ||||||
| From net investment income | (0.92) | (0.86) | (0.76) | (0.76) | (0.73) | (0.36) |
| Net asset value, end of period | $14.69 | $14.71 | $15.69 | $14.98 | $15.30 | $14.88 |
| Total return5 (%) | 12.38 | 6.10 | 12.26 | 0.31 | 7.116 | (0.42)6,7 |
| Ratios and supplemental data | ||||||
| Net assets, end of period | ||||||
| (in millions) | $1,140 | $1,144 | $1,192 | $1,047 | $1,012 | $958 |
| Ratio of expenses | ||||||
| to average net assets (%) | 1.12 | 1.11 | 1.12 | 1.09 | 1.05 | 1.078 |
| Ratio of adjusted expenses | ||||||
| to average net assets9 (%) | -- | -- | -- | -- | 1.06 | 1.088 |
| Ratio of net investment income | ||||||
| to average net assets (%) | 6.38 | 5.51 | 4.84 | 4.55 | 4.41 | 4.368 |
| Portfolio turnover (%) | 235 | 189 | 273 | 241 | 139 | 96 |
| See notes to financial statements. |
28
| F I N A N C I A L H I G H L I G H T S |
CLASS B SHARES
| Period ended | 5-31-011 | 5-31-021,2 | 5-31-03 | 5-31-04 | 5-31-05 | 11-30-053 |
| Per share operating performance | ||||||
| Net asset value, | ||||||
| beginning of period | $13.93 | $14.69 | $14.71 | $15.69 | $14.98 | $15.30 |
| Net investment income4 | 0.83 | 0.72 | 0.62 | 0.59 | 0.57 | 0.28 |
| Net realized and unrealized | ||||||
| gain (loss) on investments | 0.76 | 0.06 | 1.02 | (0.65) | 0.37 | (0.39) |
| Total from | ||||||
| investment operations | 1.59 | 0.78 | 1.64 | (0.06) | 0.94 | (0.11) |
| Less distributions | ||||||
| From net investment income | (0.83) | (0.76) | (0.66) | (0.65) | (0.62) | (0.31) |
| Net asset value, end of period | $14.69 | $14.71 | $15.69 | $14.98 | $15.30 | $14.88 |
| Total return5 (%) | 11.64 | 5.37 | 11.48 | (0.39) | 6.376 | (0.77)6,7 |
| Ratios and supplemental data | ||||||
| Net assets, end of period | ||||||
| (in millions) | $218 | $236 | $233 | $164 | $128 | $109 |
| Ratio of expenses | ||||||
| to average net assets (%) | 1.78 | 1.81 | 1.82 | 1.79 | 1.75 | 1.778 |
| Ratio of adjusted expenses | ||||||
| to average net assets9 (%) | -- | -- | -- | -- | 1.76 | 1.788 |
| Ratio of net investment income | ||||||
| to average net assets (%) | 5.71 | 4.81 | 4.15 | 3.84 | 3.70 | 3.668 |
| Portfolio turnover (%) | 235 | 189 | 273 | 241 | 139 | 96 |
| See notes to financial statements. |
29
| F I N A N C I A L H I G H L I G H T S |
CLASS C SHARES
| Period ended | 5-31-011 | 5-31-021,2 | 5-31-03 | 5-31-04 | 5-31-05 | 11-30-053 |
| Per share operating performance | ||||||
| Net asset value, | ||||||
| beginning of period | $13.93 | $14.69 | $14.71 | $15.69 | $14.98 | $15.30 |
| Net investment income4 | 0.82 | 0.72 | 0.62 | 0.59 | 0.57 | 0.28 |
| Net realized and unrealized | ||||||
| gain (loss) on investments | 0.76 | 0.06 | 1.02 | (0.64) | 0.37 | (0.39) |
| Total from | ||||||
| investment operations | 1.58 | 0.78 | 1.64 | (0.05) | 0.94 | (0.11) |
| Less distributions | ||||||
| From net investment income | (0.82) | (0.76) | (0.66) | (0.66) | (0.62) | (0.31) |
| Net asset value, end of period | $14.69 | $14.71 | $15.69 | $14.98 | $15.30 | $14.88 |
| Total return5 (%) | 11.60 | 5.36 | 11.48 | (0.39) | 6.376 | (0.77)6,7 |
| Ratios and supplemental data | ||||||
| Net assets, end of period | ||||||
| (in millions) | $26 | $44 | $45 | $32 | $28 | $26 |
| Ratio of expenses | ||||||
| to average net assets (%) | 1.82 | 1.81 | 1.82 | 1.79 | 1.75 | 1.778 |
| Ratio of adjusted expenses | ||||||
| to average net assets9 (%) | -- | -- | -- | -- | 1.76 | 1.788 |
| Ratio of net investment income | ||||||
| to average net assets (%) | 5.66 | 4.81 | 4.15 | 3.84 | 3.71 | 3.668 |
| Portfolio turnover (%) | 235 | 189 | 273 | 241 | 139 | 96 |
| See notes to financial statements. |
30
| F I N A N C I A L H I G H L I G H T S |
CLASS I SHARES
| Period ended | 5-31-021,2,10 | 5-31-03 | 5-31-04 | 5-31-05 | 11-30-053 |
| Per share operating performance | |||||
| Net asset value, beginning of period | $14.96 | $14.71 | $15.69 | $14.98 | $15.30 |
| Net investment income4 | 0.66 | 0.78 | 0.76 | 0.73 | 0.36 |
| Net realized and unrealized | |||||
| gain (loss) on investments | (0.21) | 1.02 | (0.64) | 0.38 | (0.38) |
| Total from investment operations | 0.45 | 1.80 | 0.12 | 1.11 | (0.02) |
| Less distributions | |||||
| From net investment income | (0.70) | (0.82) | (0.83) | (0.79) | (0.40) |
| Net asset value, end of period | $14.71 | $15.69 | $14.98 | $15.30 | $14.88 |
| Total return5 (%) | 3.047 | 12.71 | 0.78 | 7.55 | (0.20)7 |
| Ratios and supplemental data | |||||
| Net assets, end of period | |||||
| (in millions) | --11 | $9 | $5 | $5 | $6 |
| Ratio of expenses | |||||
| to average net assets (%) | 0.688 | 0.72 | 0.63 | 0.65 | 0.658 |
| Ratio of net investment income | |||||
| to average net assets (%) | 5.948 | 5.23 | 4.98 | 4.82 | 4.788 |
| Portfolio turnover (%) | 189 | 273 | 241 | 139 | 96 |
| See notes to financial statements. |
31
| F I N A N C I A L H I G H L I G H T S |
CLASS R SHARES
| Period ended | 5-31-0410 | 5-31-05 | 11-30-053 |
| Per share operating performance | |||
| Net asset value, | |||
| beginning of period | $14.93 | $14.98 | $15.30 |
| Net investment income4 | 0.54 | 0.67 | 0.31 |
| Net realized and unrealized | |||
| gain (loss) on investments | 0.10 | 0.36 | (0.38) |
| Total from investment operations | 0.64 | 1.03 | (0.07) |
| Less distributions | |||
| From net investment income | (0.59) | (0.71) | (0.35) |
| Net asset value, end of period | $14.98 | $15.30 | $14.88 |
| Total return5 (%) | 4.307 | 7.02 | (0.52)7 |
| Ratios and supplemental data | |||
| Net assets, end of period | |||
| (in millions) | --11 | --11 | --11 |
| Ratio of expenses | |||
| to average net assets (%) | 1.388 | 1.12 | 1.308 |
| Ratio of net investment income | |||
| to average net assets (%) | 4.408 | 4.44 | 4.128 |
| Portfolio turnover (%) | 241 | 139 | 96 |
1Audited by previous auditor.
2As required, effective 6-1-01 the Fund has adopted the provisions of the AICPA Audit and Accounting Guide for Investment Companies, as revised, relating to the amortization of premiums and accretion of discounts on debt securities. The effect of this change on per share amounts for the year ended 5-31-02, was to decrease net investment income per share by $0.04, increase (decrease) net realized and unrealized gains (losses) per share by $0.04 and, had the Fund not made these changes to amortization and accretion, the annualized ratio of net investment income to average net assets would have been 5.81%, 5.11%, 5.09% and 6.24% for Class A, Class B, Class C and Class I shares, respectively. Per share ratios and supplemental data for periods prior to 6-1-01 have not been restated to reflect this change in presentation.
3Semiannual period from 6-1-05 through 11-30-05. Unaudited.
4Based on the average of the shares outstanding.
5Assumes dividend reinvestment and does not reflect the effect of sales charges.
6Total returns would have been lower had certain expenses not been reduced during the periods shown.
7Not annualized.
8Annualized.
9Does not take into effect expense reductions during the periods shown.
10Class I and Class R shares began operations on 9-4-01 and 8-5-03, respectively.
11Less than $500,000.
| See notes to financial statements. |
32
| NOTES TO STATEMENTS |
Unaudited
| Note A Accounting policies |
John Hancock Bond Fund (the “Fund”) is a diversified series of John Hancock Sovereign Bond Fund, an open-end management investment company registered under the Investment Company Act of 1940. The investment objective of the Fund is to generate a high level of current income, consistent with prudent investment risk.
The Trustees have authorized the issuance of multiple classes of shares of the Fund, designated as Class A, Class B, Class C, Class I and Class R shares. The shares of each class represent an interest in the same portfolio of investments of the Fund and have equal rights as to voting, redemptions, dividends and liquidation, except that certain expenses, subject to the approval of the Trustees, may be applied differently to each class of shares in accordance with current regulations of the Securities and Exchange Commission and the Internal Revenue Service. Shareholders of a class that bears distribution and service expenses under the terms of a distribution plan have exclusive voting rights to that distribution plan.
| Significant accounting policies of the Fund are as follows: |
Valuation of investments
Securities in the Fund’s portfolio are valued on the basis of market quotations, valuations provided by independent pricing services or at fair value as determined in good faith in accordance with procedures approved by the Trustees. Short-term debt investments which have a remaining maturity of 60 days or less may be valued at amortized cost, which approximates market value.
Joint repurchase agreement
Pursuant to an exemptive order issued by the Securities and Exchange Commission, the Fund, along with other registered investment companies having a management contract with John Hancock Advisers, LLC (the “Adviser”), a wholly owned subsidiary of John Hancock Financial Services, Inc., may participate in a joint repurchase agreement transaction. Aggregate cash balances are invested in one or more large repurchase agreements, whose underlying securities are obligations of the U.S. government and/or its agencies. The Fund’s custodian bank receives delivery of the underlying securities for the joint account on the Fund’s behalf. The Adviser is responsible for ensuring that the agreement is fully collateralized at all times.
Investment transactions
Investment transactions are recorded as of the date of purchase, sale or maturity. Net realized gains and losses on sales of investments are determined on the identified cost basis. Some securities may be purchased on a “when-issued” or “forward delivery” basis, which means that the securities will be delivered to the Fund at a future date, usually
33
beyond the customary settlement date.
Discount and premium on securities
The Fund accretes discount and amortizes premium from par value on securities from either the date of issue or the date of purchase over the life of the security.
Class allocations
Income, common expenses and realized and unrealized gains (losses) are determined at the fund level and allocated daily to each class of shares based on the appropriate net asset value of the respective classes. Distribution and service fees, if any, and transfer agent fees for Class I and Class R shares are calculated daily at the class level based on the appropriate net asset value of each class and the specific expense rate(s) applicable to each class.
Expenses
The majority of expenses are directly identifiable to an individual fund. Expenses that are not readily identifi-able to a specific fund are allocated in such a manner as deemed equitable, taking into consideration, among other things, the nature and type of expense and the relative sizes of the funds.
Bank borrowings
The Fund is permitted to have bank borrowings for temporary or emergency purposes, including the meeting of redemption requests that otherwise might require the untimely disposition of securities. The Fund has entered into a syndicated line of credit agreement with various banks. This agreement enables the Fund to participate, with other funds managed by the Adviser, in an unsecured line of credit with banks, which permits borrowings of up to $250 million, collectively. Interest is charged to each fund based on its borrowing. In addition, a commitment fee is charged to each fund based on the average daily unused portion of the line of credit, and is allocated among the participating funds. The Fund had no borrowing activity under the line of credit during the period ended November 30, 2005.
Securities lending
The Fund may lend securities to certain qualified brokers who pay the Fund negotiated lender fees. The loans are collateralized at all times with cash or securities with a market value at least equal to the market value of the securities on loan. As with other extensions of credit, the Fund may bear the risk of delay of the loaned securities in recovery or even loss of rights in the collateral, should the borrower of the securities fail financially. At November 30, 2005, the Fund loaned securities having a market value of $178,876,378 collateralized by securities in the amount of $185,299,657. Securities lending expenses are paid by the Fund to the Adviser.
Financial futures contracts
The Fund may buy and sell financial futures contracts. Buying futures tends to increase the Fund’s exposure to the underlying instrument. Selling futures tends to decrease the Fund’s exposure to the underlying instrument or hedge other Fund’s instruments. At the time the Fund enters into a financial futures contract, it is required to deposit with its custodian a specified amount of cash or U.S. government securities, known as “initial margin,” equal to a certain percentage of the value of the financial futures contract being traded. Each day, the futures contract is valued at the official settlement price of the board of trade or U.S. commodities exchange on which it trades. Subsequent payments to and from the broker, known as “variation margin,” are made on a daily basis as the market price of the financial futures contract fluctuates. Daily variation margin adjustments arising from this “mark to market” are recorded by the Fund as unrealized gains or losses.
When the contracts are closed, the Fund recognizes a gain or loss. Risks of entering into financial futures contracts include the possibility that there may be an illiquid
34
market and/or that a change in the value of the contracts may not correlate with changes in the value of the underlying securities. In addition, the Fund could be prevented from opening or realizing the benefits of closing out financial futures positions because of position limits or limits on daily price fluctuation imposed by an exchange.
For federal income tax purposes, the amount, character and timing of the Fund’s gains and/or losses can be affected as a result of financial futures contracts.
The Fund had no open financial futures contracts on November 30, 2005.
Swap contracts
The Fund may enter into swap transactions in order to hedge the value of the Fund’s portfolio against interest rate fluctuations or to enhance the Fund’s income or to manage the Fund’s exposure to credit or market risk.
Credit default swaps involve the exchange of a fixed rate premium for protection against the loss in value of an underlying debt instrument in the event of a defined credit event (such as payment default or bankruptcy). Under the terms of the swap, one party acts as a “guarantor” receiving a periodic payment that is a fixed percentage applied to a notional principal amount. In return the party agrees to purchase the notional amount of the underlying instrument, at par, if a credit event occurs during the term of the swap. Certain funds may enter into credit default swaps in which either it or its counterparty act as guarantors. By acting as the guarantor of a swap, a Fund assumes the market and credit risk of the underlying instrument including liquidity and loss of value.
The Fund records changes in the value of the swaps as unrealized gains or losses on swap contracts. Accrued interest receivable or payable on the swap contracts is recorded as realized gain (loss).
Swap contracts are subject to risks related to the coun-terparty’s ability to perform under the contract and may decline in value if the coun-terparty’s creditworthiness deteriorates. The risks may arise from unanticipated movement in interest rates. The Fund may also suffer losses if it is unable to terminate outstanding swap contracts or reduce its exposure through offsetting transactions.
| The Fund had the following credit default swap contracts open on November 30, 2005: | ||||
| ANNUAL | ||||
| NOTIONAL | PAYMENTS MADE | TERMINATION | ||
| ISSUER | AMOUNT | BY FUND | DATE | APPRECIATION |
| PROTECTION RECEIVED | ||||
| Dow Jones | ||||
| CDX.NA.XO | $5,000,000 | 2.00% | Dec 10 | $64,175 |
Federal income taxes
The Fund qualifies as a “regulated investment company” by complying with the applicable provisions of the Internal Revenue Code and will not be subject to federal income tax on taxable income that is distributed to shareholders. Therefore, no federal income tax provision is required. For federal income tax purposes, the Fund has $13,063,576 of a capital loss carryforward available, to the extent provided by regulations, to offset future net realized capital gains. To the extent that such carryforward is used by the Fund, no capital gain distributions will be made. The loss carryforward expires as follows: May 31, 2009 -- $13,027,799 and May 31, 2010 -- $35,777.
Dividends, interest
and distributions
Dividend income on investment securities is recorded on the ex-dividend date or, in the case of some foreign
35
securities, on the date thereafter when the Fund identifies the dividend. Interest income on investment securities is recorded on the accrual basis. The Fund may place a debt obligation on non-accrual status and reduce related interest income by ceasing current accruals and writing off interest receivables when the collection of interest has become doubtful. Foreign income may be subject to foreign withholding taxes, which are accrued as applicable.
The Fund records distributions to shareholders from net investment income and net realized gains, if any, on the ex-dividend date. The Fund’s net investment income is declared daily as dividends to shareholders of record as of the close of business on the preceding day, and distributed monthly. During the year ended May 31, 2005, the tax character of distributions paid was as follows: ordinary income $56,553,453. Distributions paid by the Fund with respect to each class of shares are calculated in the same manner, at the same time and are in the same amount, except for the effect of expenses that may be applied differently to each class.
Such distributions, on a tax basis, are determined in conformity with income tax regulations, which may differ from accounting principles generally accepted in the United States of America. Distributions in excess of tax basis earnings and profits, if any, are reported in the Fund’s financial statements as a return of capital.
Use of estimates
The preparation of these financial statements, in accordance with accounting principles generally accepted in the United States of America, incorporates estimates made by management in determining the reported amount of assets, liabilities, revenues and expenses of the Fund. Actual results could differ from these estimates.
| Note B Management fee and transactions with affiliates and others |
The Fund has an investment management contract with the Adviser. Under the investment management contract, the Fund pays a monthly management fee to the Adviser equivalent, on an annual basis, to the sum of: (a) 0.50% of the first $1,500,000,000 of the Fund’s average daily net asset value, (b) 0.45% of the next $500,000,000, (c) 0.40% of the next $500,000,000 and (d) 0.35% of the Fund’s average daily net asset value in excess of $2,500,000,000. Effective December 31, 2005, the investment management teams of the Adviser will be reorganized into Sovereign Asset Management LLC (“Sovereign”). The Adviser will remain the principal adviser on the Fund and Sovereign will act as sub-adviser under the supervision of the Adviser. This restructuring will not have an impact on the Fund, which will continue to be managed using the same investment philosophy and process. The Fund will not be responsible for payment of the subadvisory fees.
The Fund has Distribution Plans with John Hancock Funds, LLC (“JH Funds”), a wholly owned subsidiary of the Adviser. The Fund has adopted Distribution Plans with respect to Class A, Class B, Class C and Class R, pursuant to Rule 12b-1 under the Investment Company Act of 1940, to reimburse JH Funds for the services it provides as distributor of shares of the Fund. Accordingly, the Fund makes monthly payments to JH Funds at an annual rate not to exceed 0.30% of Class A average daily net asset value, 1.00% of Class B and Class C average daily net asset value and 0.50% of Class R average daily net asset value. A maximum of 0.25% of such payments may be service fees, as defined by the Conduct Rules of the National Association of Securities Dealers. Under the Conduct Rules, curtailment of a portion of the Fund’s 12b-1 payments could occur under certain circumstances. In addition, under a Service Plan for Class R shares, the Fund pays up to 0.25%
36
of Class R average daily net asset value for certain other services.
Class A shares are assessed up-front sales charges. During the period ended November 30, 2005, JH Funds received net up-front sales charges of $247,500 with regard to sales of Class A shares. Of this amount, $28,366 was retained and used for printing prospectuses, advertising, sales literature and other purposes, $94,392 was paid as sales commissions to unrelated broker-dealers and $124,742 was paid as sales commissions to sales personnel of Signator Investors, Inc. (“Signator Investors”), a related broker-dealer. The Adviser’s indirect parent, John Hancock Life Insurance Company (“JHLICo”), is the indirect sole shareholder of Signator Investors.
Class B shares that are redeemed within six years of purchase are subject to a contingent deferred sales charge (“CDSC”) at declining rates, beginning at 5.00% of the lesser of the current market value at the time of redemption or the original purchase cost of the shares being redeemed. Class C shares that are redeemed within one year of purchase are subject to a CDSC at a rate of 1.00% of the lesser of the current market value at the time of redemption or the original purchase cost of the shares being redeemed. Proceeds from the CDSCs are paid to JH Funds and are used, in whole or in part, to defray its expenses for providing distribution-related services to the Fund in connection with the sale of Class B and Class C shares. During the period ended November 30, 2005, CDSCs received by JH Funds amounted to $103,909 for Class B shares and $619 for Class C shares.
The Fund has a transfer agent agreement with John Hancock Signature Services, Inc. (“Signature Services”), an indirect subsidiary of JHLICo. For Class A, Class B and Class C shares, the Fund pays a monthly transfer agent fee at an annual rate of 0.015% of each class’s average daily net asset value, plus a fee based on the number of shareholder accounts and reimbursement for certain out-of-pocket expenses, aggregated and allocated to each class on the basis of its relative net asset value. For Class I shares, the Fund pays a monthly transfer agent fee at an annual rate of 0.05% of Class I average daily net asset value. For Class R shares, the Fund pays a monthly transfer agent fee at an annual rate of 0.015% of Class R average daily net asset value, plus a fee based on the number of shareholder accounts and reimbursement for certain out-of-pocket expenses. Signature Services agreed to voluntarily reduce the Fund’s asset-based portion of the transfer agent fee if the total transfer agent fee exceeds the Lipper, Inc. median transfer agency fee for comparable mutual funds by greater than 0.05% . Accordingly, the transfer agent expense for Class A, Class B and Class C shares was reduced by $42,818 during the period ended November 30, 2005. Signature Services reserves the right to terminate this limitation in the future.
The Fund has an agreement with the Adviser to perform necessary tax, accounting and legal services for the Fund. The compensation for the period amounted to $142,989. The Fund also paid the Adviser the amount of $379 for certain publishing services, included in the printing fees. The Fund also reimbursed JHLICo for certain compliance costs, included in the Fund’s Statement of Operations.
The Adviser owned 6,698 Class R shares of beneficial interest of the Fund on November 30, 2005.
Mr. James R. Boyle is an offi-cer of certain affiliates of the Adviser, as well as affiliated Trustee of the Fund, and is compensated by the Adviser and/or its affiliates. The compensation of unaffiliated Trustees is borne by the Fund. The unaffiliated Trustees may elect to defer, for tax purposes, their receipt of this compensation under the John Hancock Group of Funds Deferred Compensation Plan. The
37
Fund makes investments into other John Hancock funds, as applicable, to cover its liability for the deferred compensation. Investments to cover the Fund’s deferred compensation liability are recorded on the Fund’s books as an other asset. The deferred compensation liability and the related other asset are always equal and are marked to market on a periodic basis to reflect any income earned by the investments, as well as any unrealized gains or losses. The Deferred Compensation Plan investments had no impact on the operations of the Fund.
| Note C Fund share transactions |
| Year ended 5-31-05 | Period ended 11-30-051 | |||
| Shares | Amount | Shares | Amount | |
| Class A shares | ||||
| Sold | 3,279,955 | $49,959,779 | 1,652,552 | $24,986,195 |
| Distributions reinvested | 2,672,659 | 40,683,038 | 1,304,361 | 19,702,156 |
| Repurchased | (9,645,735) | (146,767,346) | (4,754,897) | (71,801,919) |
| Net decrease | (3,693,121) | ($56,124,529) | (1,797,984) | ($27,113,568) |
| Class B shares | ||||
| Sold | 907,288 | $13,835,452 | 252,812 | $3,827,700 |
| Distributions reinvested | 288,388 | 4,387,875 | 118,547 | 1,791,095 |
| Repurchased | (3,802,719) | (57,917,391) | (1,373,392) | (20,733,815) |
| Net decrease | (2,607,043) | ($39,694,064) | (1,002,033) | ($15,115,020) |
| Class C shares | ||||
| Sold | 185,685 | $2,833,152 | 90,061 | $1,360,952 |
| Distributions reinvested | 62,307 | 948,006 | 28,063 | 423,900 |
| Repurchased | (520,133) | (7,914,164) | (242,519) | (3,659,581) |
| Net decrease | (272,141) | ($4,133,006) | (124,395) | ($1,874,729) |
| Class I shares | ||||
| Sold | 117,767 | $1,798,813 | 82,328 | $1,244,350 |
| Distributions reinvested | 16,220 | 246,932 | 9,045 | 136,566 |
| Repurchased | (76,918) | (1,174,259) | (30,091) | (455,030) |
| Net increase | 57,069 | $871,486 | 61,282 | $925,886 |
| Class R shares | ||||
| Sold | 14,967 | $231,110 | 12,332 | $186,644 |
| Distributions reinvested | 73 | 1,116 | 255 | 3,841 |
| Repurchased | (229) | (3,492) | (7,800) | (119,494) |
| Net increase | 14,811 | $228,734 | 4,787 | $70,991 |
| Net decrease | (6,500,425) | ($98,851,379) | (2,858,343) | ($43,106,440) |
1 Semiannual period from 6-1-05 through 11-30-05. Unaudited.
38
| Note D Investment transactions |
Purchases and proceeds from sales or maturities of securities, other than short-term securities and obligations of the U.S. government, during the period ended November 30, 2005, aggregated $859,376,829 and $877,745,130, respectively.
Purchases and proceeds from sales or maturities of obligations of U.S. government aggregated $209,281,522 and $223,321,178, respectively, during the period ended November 30, 2005.
The cost of investments owned on November 30, 2005, including short-term investments, for federal income tax purposes, was $1,125,502,273. Gross unrealized appreciation and depreciation of investments aggregated $13,861,212 and $23,770,265, respectively, resulting in net unrealized depreciation of $9,909,053. The difference between book basis and tax basis net unrealized depreciation of investments is attributable primarily to the tax deferral of losses on certain sales of securities and amortization of premiums on debt securities.
39
| Board Consideration of and Continuation of Investment Advisory Agreement: John Hancock Bond Fund |
At meetings held on May 19-20 and June 6-7, 2005, the Board, including the Independent Trustees, considered the factors and reached the conclusions described below relating to the selection of the Adviser and the continuation of the Advisory Agreement. During such meetings, the Board’s Contracts/Operations Committee and the Independent Trustees also met in executive sessions with their independent legal counsel. In evaluating the Advisory Agreement, the Board, including the Contracts/Operations Committee and the Independent Trustees, reviewed a broad range of information requested for this purpose by the Independent Trustees, including but not limited to the following: (i) the investment performance of the Fund and a broader universe of relevant funds (the “Universe”) selected by Lipper Inc. (“Lipper”), an independent provider of investment company data, for a range of periods, (ii) advisory and other fees incurred by, and the expense ratios of, the Fund and a peer group of comparable funds selected by Lipper (the “Peer Group”), (iii) the advisory fees of comparable portfolios of other clients of the Adviser, (iv) the Adviser’s financial results and condition, including its and certain of its affiliates’ profitability from services performed for the Fund, (v) breakpoints in the Fund’s and the Peer Group’s fees and a study undertaken at the direction of the Independent Trustees as to the allocation of the benefits of economies of scale between the Fund and the Adviser, (vi) the Adviser’s record of compliance with applicable laws and regulations, with the Fund’s investment policies and restrictions, and with the Fund’s Code of Ethics and the structure and responsibilities of the Adviser’s compliance department, (vii) the background and experience of senior management and investment professionals, and (viii) the nature, cost and character of advisory and non-investment management services provided by the Adviser and its affiliates.
Nature, extent and quality of services
The Board considered the ability of the Adviser, based on its resources, reputation and other attributes, to attract and retain qualified investment professionals, including research, advisory and supervisory personnel. The Board further considered the compliance programs and compliance records of the Adviser. In addition, the Board took into account the administrative services provided to the Fund by the Adviser and its affiliates.
Based on the above factors, together with those referenced below, the Board concluded that, within the context of its full deliberations, the nature, extent and quality of the investment advisory services provided to the Fund by the Adviser were sufficient to support renewal of the Advisory Agreement.
Fund performance
The Board considered the performance results for the
40
Fund over various time periods. The Board also considered these results in comparison to the performance of the Universe, as well as the Fund’s benchmark indexes. Lipper determined the Universe for the Fund. The Board reviewed with a representative of Lipper the methodology used by Lipper to select the funds in the Universe and the Peer Group.
The Board noted that the performance of the Fund was consistently higher than the median and average performance of its Universe, and was higher than or not appreciably lower than the performance of its benchmark indexes, the Lipper A-Rated Bond Funds Index and the Lehman Government/Corporate Bond Index, for the time periods under review.
Investment advisory fee rates and expenses
The Board reviewed and considered the contractual investment advisory fee rate payable by the Fund to the Adviser for investment advisory services (the “Advisory Agreement Rate”). The Board received and considered information comparing the Advisory Agreement Rate with the advisory fees for the Peer Group. The Board noted that the Advisory Agreement Rate was slightly lower than the median rate of the Peer Group. The Board concluded that the Advisory Agreement Rate was reasonable in relation to the services provided.
The Board received and considered information regarding the Fund’s total operating expense ratio and its various components, including contractual advisory fees, actual advisory fees, non-management fees, Rule 12b-1 and non-Rule 12b-1 service fees, transfer agent fees and custodian fees, including and excluding Rule 12b-1 and non-Rule 12b-1 service fees. The Board also considered comparisons of these expenses to the expense information for the Peer Group and the Universe. The Board noted that the total operating expense ratio of the Fund was not appreciably higher than the Peer Group’s and Universe’s median total operating expense ratio.
The Adviser also discussed the Lipper data and rankings, and other relevant information, for the Fund. Based on the above-referenced considerations and other factors, the Board concluded that the Fund’s overall expense results and performance supported the re-approval of the Advisory Agreement.
Profitability
The Board received and considered a detailed profitability analysis of the Adviser based on the Advisory Agreement, as well as on other relationships between the Fund and the Adviser and its affiliates. The Board concluded that, in light of the costs of providing investment management and other services to the Fund, the profits and other ancillary benefits reported by the Adviser were not unreasonable.
Economies of scale
The Board received and considered general information regarding economies of scale with respect to the management of the Fund, including the Fund’s ability to appropriately benefit from economies of scale under the Fund’s fee structure. The Board recognized the inherent limitations of any analysis of economies of scale, stemming largely from the Board’s understanding that most of the Adviser’s costs are not specific to individual Funds, but rather are incurred across a variety of products and services.
To the extent the Board and the Adviser were able to identify actual or potential economies of scale from Fund-specific or allocated expenses, in order to ensure that any such economies continue to be reasonably shared with the Fund as its assets increase, the Adviser and the Board agreed to continue the existing breakpoints.
41
Information about services to other clients
The Board also received information about the nature, extent and quality of services and fee rates offered by the Adviser to its other clients, including other registered investment companies, institutional investors and separate accounts. The Board concluded that the Advisory Agreement Rate was not unreasonable, taking into account fee rates offered to others by the Adviser and giving effect to differences in services covered by such fee rates.
Other benefits to the Adviser
The Board received information regarding potential “fall-out” or ancillary bene-fits received by the Adviser and its affiliates as a result of the Adviser’s relationship with the Fund. Such benefits could include, among others, benefits directly attributable to the relationship of the Adviser with the Fund and benefits potentially derived from an increase in the business of the Adviser as a result of its relationship with the Fund (such as the ability to market to shareholders other finan-cial products offered by the Adviser and its affiliates).
The Board also considered the effectiveness of the Adviser’s and the Fund’s policies and procedures for complying with the requirements of the federal securities laws, including those relating to best execution of portfolio transactions and brokerage allocation.
Other factors and broader review
As discussed above, the Board reviewed detailed materials received from the Adviser as part of the annual re-approval process under Section 15(c) of the 1940 Act. The Board also regularly reviews and assesses the quality of the services that the Fund receives throughout the year. In this regard, the Board reviews reports of the Adviser at least quarterly, which include, among other things, a detailed portfolio review, detailed Fund performance reports and compliance reports. In addition, the Board meets with portfolio managers and senior investment officers at various times throughout the year.
After considering the above-described factors and based on its deliberations and its evaluation of the information described above, the Board concluded that approval of the continuation of the Advisory Agreement for the Fund was in the best interest of the Fund and its shareholders. Accordingly, the Board unanimously approved the continuation of the Advisory Agreement.
42
| OUR FAMILY OF FUNDS |
| Equity | Balanced Fund |
| Classic Value Fund | |
| Core Equity Fund | |
| Focused Equity Fund | |
| Greater China Opportunities Fund | |
| Growth Trends Fund | |
| International Fund | |
| Large Cap Equity Fund | |
| Large Cap Select Fund | |
| Mid Cap Equity Fund | |
| Mid Cap Growth Fund | |
| Multi Cap Growth Fund | |
| Small Cap Fund | |
| Small Cap Equity Fund | |
| Small Cap Growth Fund | |
| Small Cap Intrinsic Value Fund | |
| Sovereign Investors Fund | |
| U.S. Global Leaders Growth Fund | |
| Asset Allocation and | Allocation Growth + Value Portfolio |
| Lifestyle Portfolios | Allocation Core Portfolio |
| Lifestyle Aggressive Portfolio | |
| Lifestyle Growth Portfolio | |
| Lifestyle Balanced Portfolio | |
| Lifestyle Moderate Portfolio | |
| Lifestyle Conservative Portfolio | |
| Sector | Financial Industries Fund |
| Health Sciences Fund | |
| Real Estate Fund | |
| Regional Bank Fund | |
| Technology Fund | |
| Technology Leaders Fund | |
| Income | Bond Fund |
| Government Income Fund | |
| High Yield Fund | |
| Investment Grade Bond Fund | |
| Strategic Income Fund | |
| Tax-Free Income | California Tax-Free Income Fund |
| High Yield Municipal Bond Fund | |
| Massachusetts Tax-Free Income Fund | |
| New York Tax-Free Income Fund | |
| Tax-Free Bond Fund | |
| Money Market | Money Market Fund |
| U.S. Government Cash Reserve | |
For more complete information on any John Hancock Fund and a prospectus, which includes charges and expenses, call your financial professional, or John Hancock Funds at 1-800-225-5291. Please read the prospectus carefully before investing or sending money.
43
| ELECTRONIC DELIVERY |
| Now available from John Hancock Funds |
Instead of sending annual and semiannual reports and prospectuses through the U.S. mail, we’ll notify you by e-mail when these documents are available for online viewing.
| How does electronic delivery benefit you? | |
| ■ | No more waiting for the mail to arrive; you’ll receive an |
| e-mail notification as soon as the document is ready for | |
| online viewing. | |
| ■ | Reduces the amount of paper mail you receive from |
| John Hancock Funds. | |
| ■ | Reduces costs associated with printing and mailing. |
| Sign up for electronic delivery today at www.jhfunds.com/edelivery |
44
| For more information |
The Fund’s proxy voting policies, procedures and records are available without charge, upon request:
| By phone | On the Fund’s Web site | On the SEC’s Web site |
| 1-800-225-5291 | www.jhfunds.com/proxy | www.sec.gov |
| Trustees Ronald R. Dion, Chairman James R. Boyle† James F. Carlin Richard P. Chapman, Jr.* William H. Cunningham Charles L. Ladner* Dr. John A. Moore* Patti McGill Peterson* Steven R. Pruchansky *Members of the Audit Committee †Non-Independent Trustee Officers Keith F. Hartstein President and Chief Executive Officer William H. King Vice President and Treasurer Francis V. Knox, Jr. Vice President and Chief Compliance Officer John G. Vrysen Executive Vice President and Chief Financial Officer |
| Investment adviser John Hancock Advisers, LLC 601 Congress Street Boston, MA 02210-2805 Subadviser Sovereign Asset Management LLC 101 Huntington Avenue Boston, MA 02199 Principal distributor John Hancock Advisers, LLC 601 Congress Street Boston, MA 02210-2805 |
| Custodian The Bank of New York One Wall Street New York, NY 10286 Transfer agent John Hancock Signature Services, Inc. 1 John Hancock Way, Suite 1000 Boston, MA 02217-1000 Legal counsel Wilmer Cutler Pickering Hale and Dorr LLP 60 State Street Boston, MA 02109-1803 |
The Fund’s investment objective, risks, charges and expenses are included in the prospectus and should be considered carefully before investing. For a prospectus, call your financial professional, call John Hancock Funds at 1-800-225-5291, or visit the Fund’s Web site at www.jhfunds.com. Please read the prospectus carefully before investing or sending money.
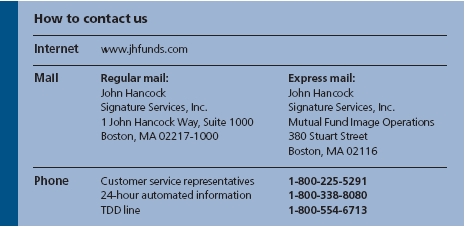
A listing of month-end portfolio holdings is available on our Web site, www.jhfunds.com. A more detailed portfolio holdings summary is available on a quarterly basis 60 days after the fiscal quarter on our Web site or upon request by calling 1-800-225-5291, or on the Securities and Exchange Commission’s Web site, www.sec.gov.
45

| 1-800-225-5291 1-800-554-6713 (TDD) 1-800-338-8080 EASI-Line www.jhfunds. com |
| Now available: electronic delivery www.jhfunds. com/edelivery |
This report is for the information of the shareholders of John Hancock Bond Fund.
| 210SA 11/05 1/06 |
| ITEM 2. CODE OF ETHICS. |
As of the end of the period, November 30, 2005, the registrant has adopted a code of ethics, as defined in Item 2 of Form N-CSR, that applies to its Chief Executive Officer, Chief Financial Officer and Treasurer (respectively, the principal executive officer, the principal financial officer and the principal accounting officer, the “Senior Financial Officers”). A copy of the code of ethics is filed as an exhibit to this Form N-CSR.
The code of ethics was amended effective May 1, 2005 to address new Rule 204A-1 under the Investment Advisers Act of 1940 and to make other related changes.
| The most significant amendments were: |
| (a) | Broadening of the General Principles of the code to cover compliance with all federal securities laws. |
| (b) | Eliminating the interim requirements (since the first quarter of 2004) for access persons to preclear their personal trades of John Hancock mutual funds. This was replaced by post- trade reporting and a 30 day hold requirement for all employees. |
| (c) | A new requirement for “heightened preclearance” with investment supervisors by any access person trading in a personal position worth $100,000 or more. |
ITEM 3. AUDIT COMMITTEE FINANCIAL EXPERT.
Not applicable at this time.
ITEM 4. PRINCIPAL ACCOUNTANT FEES AND SERVICES.
Not applicable at this time.
ITEM 5. AUDIT COMMITTEE OF LISTED REGISTRANTS.
Not applicable at this time.
ITEM 6. SCHEDULE OF INVESTMENTS.
Not applicable.
ITEM 7. DISCLOSURE OF PROXY VOTING POLICIES AND PROCEDURES FOR CLOSED-END MANAGEMENT INVESTMENT COMPANIES.
Not applicable.
ITEM 8. PORTFOLIO MANAGERS OF CLOSED-END MANAGEMENT INVESTMENT COMPANIES.
Not applicable.
ITEM 9. PURCHASES OF EQUITY SECURITIES BY CLOSED-END MANAGEMENT INVESTMENT COMPANY AND AFFILIATED PURCHASERS.
Not applicable.
ITEM 10. SUBMISSION OF MATTERS TO A VOTE OF SECURITY HOLDERS.
There were no material changes to previously disclosed John Hancock Funds - Administration Committee Charter and John Hancock Funds - Governance Committee Charter.
| ITEM 11. CONTROLS AND PROCEDURES. |
(a) Based upon their evaluation of the registrant's disclosure controls and procedures as conducted within 90 days of the filing date of this Form N-CSR, the registrant's principal executive officer and principal financial officer have concluded that those disclosure controls and procedures provide reasonable assurance that the material information required to be disclosed by the registrant on this report is recorded, processed, summarized and reported within the time periods specified in the Securities and Exchange Commission's rules and forms.
(b) There were no changes in the registrant's internal control over financial reporting that occurred during the registrant's most recent fiscal half-year (the registrant's second fiscal half-year in the case of an annual report) that have materially affected, or are reasonably likely to materially affect, the registrant's internal control over financial reporting.
| ITEM 12. EXHIBITS. |
(a)(1) Code of Ethics for Senior Financial Officers is attached.
(a)(2) Separate certifications for the registrant's principal executive officer and principal financial officer, as required by Section 302 of the Sarbanes-Oxley Act of 2002 and Rule 30a-2(a) under the Investment Company Act of 1940, are attached.
(b) Separate certifications for the registrant's principal executive officer and principal financial officer, as required by 18 U.S.C. Section 1350, as adopted pursuant to Section 906 of the Sarbanes-Oxley Act of 2002, and Rule 30a-2(b) under the Investment Company Act of 1940, are attached. The certifications furnished pursuant to this paragraph are not deemed to be "filed" for purposes of Section 18 of the Securities Exchange Act of 1934, or otherwise subject to the liability of that section. Such certifications are not deemed to be incorporated by reference into any filing under the Securities Act of 1933 or the Securities Exchange Act of 1934, except to the extent that the Registrant specifically incorporates them by reference.
| (c) Contact person at the registrant. |
| SIGNATURES |
Pursuant to the requirements of the Securities Exchange Act of 1934 and the Investment Company Act of 1940, the registrant has duly caused this report to be signed on its behalf by the undersigned, thereunto duly authorized.
| John Hancock Sovereign Bond Fund |
| By: /s/ Keith F. Hartstein ------------------------------------- Keith F. Hartstein President and Chief Executive Officer Date: January 27, 2006 |
Pursuant to the requirements of the Securities Exchange Act of 1934 and the Investment Company Act of 1940, this report has been signed below by the following persons on behalf of the registrant and in the capacities and on the dates indicated.
| By: /s/ Keith F. Hartstein ------------------------------------- Keith F. Hartstein President and Chief Executive Officer Date: January 27, 2006 |
By: /s/ John G. Vrysen
-------------------------------------
John G. Vrysen
Executive Vice President and Chief Financial Officer
| Date: January 27, 2006 |