| UNITED STATES | |
| SECURITIES AND EXCHANGE COMMISSION | |
| Washington, D.C. 20549 | |
| FORM N-CSR | |
| CERTIFIED SHAREHOLDER REPORT OF REGISTERED | |
| MANAGEMENT INVESTMENT COMPANIES | |
| Investment Company Act file number 811- 2402 | |
| John Hancock Sovereign Bond Fund | |
| (Exact name of registrant as specified in charter) | |
| 601 Congress Street, Boston, Massachusetts 02210 | |
| (Address of principal executive offices) (Zip code) | |
| Michael J. Leary | |
| Treasurer | |
| 601 Congress Street | |
| Boston, Massachusetts 02210 | |
| (Name and address of agent for service) | |
| Registrant's telephone number, including area code: 617-663-4490 | |
| Date of fiscal year end: | May 31 |
| Date of reporting period: | May 31, 2010 |
Item 1. Schedule of Investments
Management’s discussion of
Fund performance
By MFC Global Investment Management (U.S.), LLC
U.S. bonds posted solid gains during the 12 months ended May 31, 2010. As the economy made a significant turnaround following a severe downturn in late 2008 and early 2009, corporate bonds outperformed substantially, leading the bond market’s advance. High-yield corporate securities and commercial mortgage-backed securities generated the best results, while Treasury bonds lagged as investors shifted toward riskier securities and the federal government boosted issuance of Treasury securities to fund a growing budget deficit.
For the year ended May 31, 2010, John Hancock Bond Fund’s Class A shares posted a total return of 23.83% at net asset value. The Fund outperformed the 8.64% return of its benchmark, the Barclays Capital Government/Credit Bond Index, and the 12.98% average return of the Morningstar, Inc. intermediate-term bond category.
The Fund outpaced the broad bond market indexes and its Morningstar peer group average thanks to our positioning for an economic recovery. We increased the Fund’s holdings of corporate bonds when they were trading at depressed valuations, and this paid off over the past 12 months as the economic environment improved and corporate bonds delivered strong returns. We increased the Fund’s position in corporate securities to almost 60% of the Fund’s portfolio during the period, with approximately one-third of the corporate holdings in high-yield bonds.
As we increased the Fund’s position in corporate bonds, we cut back on the Fund’s holdings of residential mortgage-backed securities, especially those issued by government agencies such as Fannie Mae and Freddie Mac. Unattractive yields, higher refinancing activity and the end of the Fed’s purchase program that helped support this segment of the market led us to shift to an underweight position. In contrast, we added to the Fund’s position in commercial mortgage-backed securities, which rallied sharply during the period. We also modestly increased the Fund’s holdings of Treasury bonds to manage the Fund’s interest-rate sensitivity.
This commentary reflects the views of the portfolio managers through the end of the Fund’s period discussed in this report. The managers’ statements reflect their own opinions. As such, they are in no way guarantees of future events and are not intended to be used as investment advice or a recommendation regarding any specific security. They are also subject to change at any time as market and other conditions warrant.
Past performance is no guarantee of future results.
The major risk factors in this Fund’s performance are interest rate and credit risk. When interest rates rise, bond prices usually fall. Generally, an increase in the Fund’s average maturity will make it more sensitive to interest-rate risk.
Sector investing is subject to greater risks than the market as a whole. Because the Fund may focus on particular sectors of the economy, its performance may depend on the performance of those sectors.
| 6 | Bond Fund | Annual report |
A look at performance
For the period ended May 31, 2010
| Average annual returns (%) | Cumulative total returns (%) | SEC 30-day | |||||||
| with maximum sales charge (POP) | with maximum sales charge (POP) | yield (%) | |||||||
| as of | |||||||||
| 1-year | 5-year | 10-year | 1-year | 5-year | 10-year | 5-31-10 | |||
| Class A | 18.26 | 4.63 | 6.07 | 18.26 | 25.39 | 80.28 | 5.84 | ||
| Class B | 18.05 | 4.53 | 5.97 | 18.05 | 24.82 | 78.64 | 5.42 | ||
| Class C | 21.98 | 4.86 | 5.82 | 21.98 | 26.81 | 76.12 | 5.44 | ||
| Class i1,2 | 24.31 | 6.04 | 7.02 | 24.31 | 34.11 | 97.15 | 6.39 | ||
Performance figures assume all distributions are reinvested. Public offering price (POP) figures reflect maximum sales charges on Class A shares of 4.5% and the applicable contingent deferred sales charge (CDSC) on Class B and Class C shares. The returns for Class C shares have been adjusted to reflect the elimination of the front-end sales charge effective 7-15-04. The Class B shares’ CDSC declines annually between years 1 to 6 according to the following schedule: 5, 4, 3, 3, 2, 1%. No sales charge will be assessed after the sixth year. Class C shares held for less than one year are subject to a 1% CDSC. Sales charges are not applicable for Class I shares.
The expense ratios of the Fund, both net (including any fee waivers or expense limitations) and gross (excluding any fee waivers or expense limitations), are set forth according to the most recent publicly available prospectuses for the Fund and may differ from the expense ratios disclosed in the Financial Highlights tables in this report. The net expenses equal the gross expenses and are as follows: Class A — 1.11%, Class B —1.81%, Class C — 1.81% and Class I — 0.65%.
The returns reflect past results and should not be considered indicative of future performance. The return and principal value of an investment will fluctuate so that shares, when redeemed, may be worth more or less than their original cost. Due to market volatility, the Fund’s current performance may be higher or lower than the performance shown. For current to the most recent month-end performance data, please call 1–800–225–5291 or visit the Fund’s Web site at www.jhfunds.com.
The performance table above and the chart on the next page do not reflect the deduction of taxes that a shareholder may pay on fund distributions or on the redemption of fund shares.
The Fund’s performance results reflect any applicable fee waivers or expense reductions, without which the expenses would increase and results would have been less favorable.
1 For certain types of investors as described in the Fund’s Class I shares prospectus.
2 11-9-73 is the inception date for the oldest class of shares, Class A shares. The inception date for Class I shares is 9-4-01. The returns prior to this date are those of Class A shares that have been recalculated to apply the gross fees and expenses of Class I shares.
| Annual report | Bond Fund | 7 |
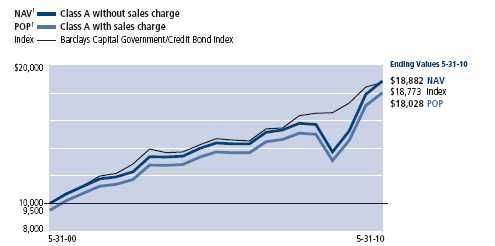
A look at performance
Growth of $10,000
This chart shows what happened to a hypothetical $10,000 investment in John Hancock Bond Fund Class A shares for the period indicated. For comparison, we’ve shown the same investment in the Barclays Capital Government/Credit Bond Index.
| Period | Without | With maximum | ||
| beginning | sales charge | sales charge | Index | |
| Class B2 | 5-31-00 | $17,864 | $17,864 | $18,773 |
| Class C2 | 5-31-00 | 17,612 | 17,612 | 18,773 |
| Class I3,4 | 5-31-00 | 19,715 | 19,715 | 18,773 |
Assuming all distributions were reinvested for the period indicated, the table above shows the value of a $10,000 investment in the Fund’s Class B, Class C, and Class I shares, respectively, as of 5-31-10. The Class C shares investment with maximum sales charge has been adjusted to reflect the elimination of the front-end sales charge effective 7-15-04. Performance of the classes will vary based on the difference in sales charges paid by shareholders investing in the different classes and the fee structure of those classes.
Barclays Capital Government/Credit Bond Index is an unmanaged index of U.S. government bonds, U.S. corporate bonds and Yankee bonds.
It is not possible to invest directly in an index. Index figures do not reflect sales charges or direct expenses, which would have resulted in lower values if they did.
1 NAV represents net asset value and POP represents public offering price.
2 No contingent deferred sales charge applicable.
3 For certain types of investors as described in the Fund’s Class I shares prospectus.
4 11-9-73 is the inception date for the oldest class of shares, Class A shares. The inception date for Class I shares is 9-4-01. The returns prior to this date are those of Class A shares that have been recalculated to apply the gross fees and expenses of Class I shares.
| 8 | Bond Fund | Annual report |
Your expenses
These examples are intended to help you understand your ongoing operating expenses.
Understanding fund expenses
As a shareholder of the Fund, you incur two types of costs:
▪ Transaction costs which include sales charges (loads) on purchases or redemptions (varies by share class), minimum account fee charge, etc.
▪ Ongoing operating expenses including management fees, distribution and service fees (if applicable), and other fund expenses.
We are going to present only your ongoing operating expenses here.
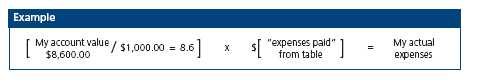
Actual expenses/actual returns
This example is intended to provide information about your fund’s actual ongoing operating expenses, and is based on your fund’s actual return. It assumes an account value of $1,000.00 on December 1, 2009 with the same investment held until May 31, 2010.
| Account value | Ending value | Expenses paid during | |
| on 12-1-09 | on 5-31-10 | period ended 5-31-101 | |
| Class A | $1,000.00 | $1,054.40 | $5.22 |
| Class B | 1,000.00 | 1,050.70 | 8.90 |
| Class C | 1,000.00 | 1,050.80 | 8.74 |
| Class I | 1,000.00 | 1,055.70 | 3.23 |
Together with the value of your account, you may use this information to estimate the operating expenses that you paid over the period. Simply divide your account value at May 31, 2010, by $1,000.00, then multiply it by the “expenses paid” for your share class from the table above. For example, for an account value of $8,600.00, the operating expenses should be calculated as follows:
| Annual report | Bond Fund | 9 |
Your expenses
Hypothetical example for comparison purposes
This table allows you to compare your fund’s ongoing operating expenses with those of any other fund. It provides an example of the Fund’s hypothetical account values and hypothetical expenses based on each class’s actual expense ratio and an assumed 5% annualized return before expenses (which is not your fund’s actual return). It assumes an account value of $1,000.00 on December 1, 2009, with the same investment held until May 31, 2010. Look in any other fund shareholder report to find its hypothetical example and you will be able to compare these expenses.
| Account value | Ending value | Expenses paid during | |
| on 12-1-09 | on 5-31-10 | period ended 5-31-101 | |
| Class A | $1,000.00 | $1,019.80 | $5.14 |
| Class B | 1,000.00 | 1,016.30 | 8.75 |
| Class C | 1,000.00 | 1,016.40 | 8.60 |
| Class I | 1,000.00 | 1,021.80 | 3.18 |
Remember, these examples do not include any transaction costs, therefore, these examples will not help you to determine the relative total costs of owning different funds. If transaction costs were included, your expenses would have been higher. See the prospectus for details regarding transaction costs.
1 Expenses are equal to the Fund’s annualized expense ratio of 1.02%, 1.74%, 1.71% and 0.63% for Class A, Class B, Class C and Class I shares, respectively, multiplied by the average account value over the period, multiplied by 182/365 (to reflect the one-half year period).
| 10 | Bond Fund | Annual report |
Portfolio summary
| Portfolio Composition1 | ||||
| Corporate Bonds | 58% | Asset-Backed Securities | 3% | |
| U.S. Government & Agency Obligations | 18% | Short-Term Investments & Other | 5% | |
| Collateralized Mortgage Obligations | 16% | |||
| Sector Composition1,2 | ||||
| Financials | 24% | Materials | 5% | |
| U.S. Government Agency | 18% | Energy | 4% | |
| Collateralized Mortgage Obligations | 16% | Consumer Staples | 4% | |
| Consumer Discretionary | 7% | Asset-Backed Securities | 3% | |
| Industrials | 6% | Telecommunication Services | 3% | |
| Utilities | 5% | Short-Term Investments & Other | 5% | |
| Quality Composition1,3 | ||||
| U.S. & Government Agency Obligations | 18% | |||
| AAA | 7% | |||
| AA | 5% | |||
| A | 13% | |||
| BBB | 29% | |||
| BB | 9% | |||
| B | 8% | |||
| CCC & Below | 6% | |||
| Not Rated | 0% | |||
| Short-Term Investments & Other | 5% | |||
1 As a percentage of net assets on 5-31-10.
2 Sector investing is subject to greater risks than the market as a whole. Because the Fund may focus on particular sectors of the economy, its performance may depend on the performance of those sectors.
3 Ratings are from Moody’s Investors Services, Inc. If not available, we have used S&P ratings. In the absence of ratings from these agencies, we have used Fitch, Inc ratings. “Not Rated” securities are those with no ratings available. They may have internal ratings similar to those shown. All are as of 5-31-10 and do not reflect subsequent downgrades.
| Annual report | Bond Fund | 11 |
Fund’s investments
As of 5-31-10
| Maturity | |||||
| Rate | date | Par value | Value | ||
| Corporate Bonds 58.30% | $533,305,811 | ||||
| (Cost $514,557,195) | |||||
| Consumer Discretionary 6.91% | 63,219,540 | ||||
| Auto Components 0.61% | |||||
| Allison Transmission, Inc. (S) | 11.000% | 11-01-15 | $1,915,000 | 2,001,175 | |
| Exide Technologies, Series B | 10.500 | 03-15-13 | 1,945,000 | 1,930,413 | |
| Tenneco, Inc. | 8.625 | 11-15-14 | 1,675,000 | 1,658,250 | |
| Auto Manufacturers 0.25% | |||||
| Volvo Treasury AB (S) | 5.950 | 04-01-15 | 2,215,000 | 2,297,750 | |
| Hotels, Restaurants & Leisure 1.41% | |||||
| Greektown Holdings LLC (H)(S) | 10.750 | 12-01-13 | 1,170,000 | 74,588 | |
| HRP Myrtle Beach Operations LLC (H)(S) | — | 04-01-12 | 1,075,000 | 0 | |
| Jacobs Entertainment, Inc. | 9.750 | 06-15-14 | 2,435,000 | 2,276,725 | |
| Little Traverse Bay Bands of Odawa | |||||
| Indians (H)(S) | 10.250 | 02-15-14 | 2,210,000 | 732,063 | |
| MGM Mirage, Inc. (S) | 9.000 | 03-15-20 | 385,000 | 385,963 | |
| Mohegan Tribal Gaming Authority | 8.000 | 04-01-12 | 420,000 | 367,500 | |
| Mohegan Tribal Gaming Authority | 7.125 | 08-15-14 | 1,050,000 | 777,000 | |
| MTR Gaming Group, Inc. | 12.625 | 07-15-14 | 710,000 | 710,000 | |
| MTR Gaming Group, Inc., Series B | 9.000 | 06-01-12 | 1,495,000 | 1,166,100 | |
| Pokagon Gaming Authority (S) | 10.375 | 06-15-14 | 1,815,000 | 1,878,525 | |
| Seminole Indian Tribe of Florida (S) | 6.535 | 10-01-20 | 2,260,000 | 2,016,485 | |
| Turning Stone Resort Casino Enterprises (S) | 9.125 | 09-15-14 | 1,890,000 | 1,880,550 | |
| Waterford Gaming LLC (S) | 8.625 | 09-15-14 | 1,015,000 | 649,600 | |
| Household Durables 0.40% | |||||
| Libbey Glass, Inc. (S) | 10.000 | 02-15-15 | 350,000 | 363,125 | |
| Whirlpool Corp. | 8.600 | 05-01-14 | 1,450,000 | 1,718,275 | |
| Whirlpool Corp. | 8.000 | 05-01-12 | 1,415,000 | 1,550,691 | |
| Media 3.09% | |||||
| AMC Entertainment, Inc. | 8.750 | 06-01-19 | 525,000 | 530,250 | |
| AMC Entertainment, Inc. | 8.000 | 03-01-14 | 2,100,000 | 2,079,000 | |
| Cablevision Systems Corp. (S) | 8.625 | 09-15-17 | 550,000 | 552,750 | |
| CCH II LLC / CCH II Capital Corp. (S) | 13.500 | 11-30-16 | 1,150,089 | 1,306,789 | |
| Cinemark USA, Inc. | 8.625 | 06-15-19 | 725,000 | 732,250 | |
| Clear Channel Worldwide Holdings, Inc., | |||||
| Series A (S) | 9.250 | 12-15-17 | 1,595,000 | 1,614,938 | |
| Comcast Cable Holdings LLC | 9.800 | 02-01-12 | 3,365,000 | 3,776,297 | |
| CSC Holdings, Inc. | 7.875 | 02-15-18 | 1,690,000 | 1,723,800 | |
| See notes to financial statements | ||
| 12 | Bond Fund | Annual report | |
| Maturity | |||||
| Rate | date | Par value | Value | ||
| Media (continued) | |||||
| DirecTV Holdings LLC | 7.625% | 05-15-16 | $3,055,000 | $3,299,400 | |
| DirecTV Holdings LLC (S) | 6.350 | 03-15-40 | 840,000 | 856,694 | |
| Grupo Televisa SA | 6.625 | 01-15-40 | 1,170,000 | 1,171,247 | |
| Regal Cinemas Corp. | 8.625 | 07-15-19 | 465,000 | 471,975 | |
| Time Warner Cable, Inc. | 6.750 | 07-01-18 | 1,995,000 | 2,246,745 | |
| Time Warner Entertainment Company LP | 8.375 | 03-15-23 | 1,705,000 | 2,132,072 | |
| Viacom, Inc. | 7.875 | 07-30-30 | 1,355,000 | 1,486,526 | |
| Videotron Ltee (CAD)(D)(S) | 7.125 | 01-15-20 | 1,720,000 | 1,691,243 | |
| XM Satellite Radio, Inc. (S) | 13.000 | 08-01-13 | $2,000,000 | 2,190,000 | |
| XM Satellite Radio, Inc. (S) | 11.250 | 06-15-13 | 415,000 | 444,050 | |
| Multiline Retail 0.19% | |||||
| Macy’s Retail Holdings, Inc. | 8.375 | 07-15-15 | 1,540,000 | 1,697,850 | |
| Personal Products 0.13% | |||||
| Revlon Consumer Products Corp. (S) | 9.750 | 11-15-15 | 1,170,000 | 1,190,475 | |
| Specialty Retail 0.61% | |||||
| Advance Auto Parts, Inc. | 5.750 | 05-01-20 | 1,855,000 | 1,904,211 | |
| Hillman Group, Inc. (S) | 10.875 | 06-01-18 | 820,000 | 813,850 | |
| Staples, Inc. | 9.750 | 01-15-14 | 1,870,000 | 2,290,125 | |
| Toys R Us Property Company LLC (S) | 8.500 | 12-01-17 | 570,000 | 588,525 | |
| Textiles, Apparel & Luxury Goods 0.22% | |||||
| Burlington Coat Factory Warehouse Corp. | 11.125 | 04-15-14 | 1,600,000 | 1,652,000 | |
| Phillips-Van Heusen Corp. | 7.375 | 05-15-20 | 340,000 | 341,700 | |
| Consumer Staples 3.88% | 35,456,697 | ||||
| Beverages 0.37% | |||||
| Anheuser-Busch InBev Worldwide, Inc. | 4.125 | 01-15-15 | 1,610,000 | 1,661,456 | |
| SABMiller PLC (S) | 5.500 | 08-15-13 | 1,580,000 | 1,726,204 | |
| Food & Staples Retailing 0.40% | |||||
| CVS Caremark Corp., | |||||
| (6.302% to 6-1-12, then 3 month LIBOR | |||||
| + 2.065%) | 6.302 | 06-01-37 | 3,635,000 | 3,289,675 | |
| Susser Holdings LLC / Susser Finance Corp. (S) | 8.500 | 05-15-16 | 370,000 | 365,375 | |
| Food Products 1.43% | |||||
| B&G Foods, Inc. | 7.625 | 01-15-18 | 770,000 | 768,075 | |
| Bumble Bee Foods LLC (S) | 7.750 | 12-15-15 | 765,000 | 761,175 | |
| Bunge Ltd. Finance Corp. | 8.500 | 06-15-19 | 1,295,000 | 1,508,228 | |
| Bunge Ltd. Finance Corp. | 5.350 | 04-15-14 | 1,900,000 | 2,021,226 | |
| Corp. Pesquera Inca SAC (S) | 9.000 | 02-10-17 | 840,000 | 835,800 | |
| Kraft Foods, Inc. | 6.000 | 02-11-13 | 2,760,000 | 3,046,033 | |
| Kraft Foods, Inc. | 5.375 | 02-10-20 | 2,725,000 | 2,830,054 | |
| Smithfield Foods, Inc. (S) | 10.000 | 07-15-14 | 1,195,000 | 1,279,397 | |
| Household Products 0.22% | |||||
| Yankee Acquisition Corp. | 8.500 | 02-15-15 | 2,005,000 | 2,010,013 | |
| Personal Products 0.06% | |||||
| Diversey, Inc. (S) | 8.250 | 11-15-19 | 545,000 | 558,625 | |
| See notes to financial statements | ||
| Annual report | Bond Fund | 13 |
| Maturity | |||||
| Rate | date | Par value | Value | ||
| Tobacco 1.40% | |||||
| Alliance One International, Inc. (S) | 10.000% | 07-15-16 | $1,560,000 | $1,591,200 | |
| Alliance One International, Inc. | 8.500 | 05-15-12 | 890,000 | 901,125 | |
| Altria Group, Inc. | 8.500 | 11-10-13 | 3,245,000 | 3,783,634 | |
| Lorillard Tobacco Company | 6.875 | 05-01-20 | 1,390,000 | 1,400,162 | |
| Philip Morris International, Inc. | 5.650 | 05-16-18 | 2,695,000 | 2,929,689 | |
| Reynolds American, Inc. | 7.250 | 06-01-13 | 1,980,000 | 2,189,551 | |
| Energy 4.03% | 36,894,896 | ||||
| Energy Equipment & Services 0.34% | |||||
| Gibson Energy ULC (S) | 10.000 | 01-15-18 | 990,000 | 967,725 | |
| NGPL PipeCo LLC (S) | 7.119 | 12-15-17 | 2,025,000 | 2,122,830 | |
| Oil, Gas & Consumable Fuels 3.69% | |||||
| Arch Coal, Inc. (S) | 8.750 | 08-01-16 | 410,000 | 418,200 | |
| Drummond Company, Inc. | 7.375 | 02-15-16 | 1,855,000 | 1,766,888 | |
| El Paso Pipeline Partners Operating | |||||
| Company LLC | 6.500 | 04-01-20 | 1,045,000 | 1,056,290 | |
| Energy Transfer Partners LP | 9.700 | 03-15-19 | 1,445,000 | 1,765,352 | |
| Energy Transfer Partners LP | 8.500 | 04-15-14 | 1,450,000 | 1,692,223 | |
| Enterprise Products Operating LLC, | |||||
| (7.000% to 6-1-17, then 3 month LIBOR | |||||
| + 2.778%) | 7.000 | 06-01-67 | 2,585,000 | 2,261,875 | |
| Enterprise Products Operating LLC, | |||||
| (7.034% to 1-15-18, then higher of 7.034% | |||||
| or 3 month LIBOR + 2.680%) | 7.034 | 01-15-68 | 1,860,000 | 1,706,550 | |
| Gulf South Pipeline Company LP (S) | 5.750 | 08-15-12 | 1,460,000 | 1,570,531 | |
| Kinder Morgan Energy Partners LP | 7.750 | 03-15-32 | 840,000 | 940,182 | |
| Linn Energy LLC (S) | 8.625 | 04-15-20 | 730,000 | 722,700 | |
| MarkWest Energy Partners LP, Series B | 8.500 | 07-15-16 | 1,625,000 | 1,633,125 | |
| McMoRan Exploration Company | 11.875 | 11-15-14 | 1,230,000 | 1,237,688 | |
| Motiva Enterprises LLC (S) | 6.850 | 01-15-40 | 1,060,000 | 1,172,929 | |
| Niska Gas Storage US LLC (S) | 8.875 | 03-15-18 | 1,515,000 | 1,522,575 | |
| NuStar Logistics LP | 7.650 | 04-15-18 | 1,390,000 | 1,564,578 | |
| ONEOK Partners LP | 6.150 | 10-01-16 | 2,070,000 | 2,308,421 | |
| Pan American Energy LLC (S) | 7.875 | 05-07-21 | 895,000 | 877,100 | |
| Regency Energy Partners LP (S) | 9.375 | 06-01-16 | 1,225,000 | 1,274,000 | |
| Spectra Energy Capital LLC | 6.200 | 04-15-18 | 1,440,000 | 1,561,121 | |
| Thermon Industries, Inc. (S) | 9.500 | 05-01-17 | 390,000 | 386,100 | |
| Williams Partners LP | 7.250 | 02-01-17 | 3,495,000 | 3,945,460 | |
| Woodside Finance, Ltd. (S) | 4.500 | 11-10-14 | 2,330,000 | 2,420,453 | |
| Financials 23.72% | 216,972,106 | ||||
| Capital Markets 2.91% | |||||
| Jefferies Group, Inc. | 6.450 | 06-08-27 | 1,115,000 | 1,030,620 | |
| Macquarie Group, Ltd. (S) | 7.300 | 08-01-14 | 1,085,000 | 1,185,433 | |
| Macquarie Group, Ltd. (S) | 6.000 | 01-14-20 | 1,290,000 | 1,253,893 | |
| Morgan Stanley (BRL)(D)(S) | 10.090 | 05-03-17 | 8,215,000 | 4,183,617 | |
| Morgan Stanley | 7.300 | 05-13-19 | $2,070,000 | 2,174,202 | |
| Morgan Stanley, Series F, MTN | 6.625 | 04-01-18 | 3,230,000 | 3,316,826 | |
| Northern Trust Corp. | 6.500 | 08-15-18 | 920,000 | 1,065,829 | |
| Northern Trust Corp. | 4.625 | 05-01-14 | 1,600,000 | 1,721,307 | |
| See notes to financial statements | ||
| 14 | Bond Fund | Annual report | |
| Maturity | |||||
| Rate | date | Par value | Value | ||
| Capital Markets (continued) | |||||
| State Street Capital Trust IV (P) | 1.257% | 06-15-37 | $3,470,000 | $2,570,586 | |
| The Charles Schwab Corp. | 4.950 | 06-01-14 | 1,330,000 | 1,432,619 | |
| The Goldman Sachs Group, Inc. | 7.500 | 02-15-19 | 635,000 | 701,067 | |
| The Goldman Sachs Group, Inc. | 6.750 | 10-01-37 | 1,830,000 | 1,713,352 | |
| The Goldman Sachs Group, Inc. | 6.150 | 04-01-18 | 2,845,000 | 2,906,310 | |
| The Goldman Sachs Group, Inc. | 5.375 | 03-15-20 | 1,395,000 | 1,345,819 | |
| Commercial Banks 3.29% | |||||
| Allfirst Preferred Capital Trust (P) | 1.803 | 07-15-29 | 1,305,000 | 937,068 | |
| Bank of Nova Scotia | 3.400 | 01-22-15 | 1,795,000 | 1,827,687 | |
| BPCE SA, (12.50% to 9-30-19 then | |||||
| 3 month LIBOR + 12.980%) (S) | 12.500 | — (Q) | 1,239,000 | 1,402,684 | |
| Chuo Mitsui Trust & Banking Company, Ltd., | |||||
| (5.506% to 4-15-15, then 3 month LIBOR + | |||||
| 2.490%) (S) | 5.506 | — (Q) | 2,530,000 | 2,271,677 | |
| Commonwealth Bank of Australia (S) | 5.000 | 03-19-20 | 2,065,000 | 2,056,469 | |
| Credit Suisse New York | 5.300 | 08-13-19 | 1,680,000 | 1,726,044 | |
| Lloyds TSB Group PLC, | |||||
| (6.413% to 10-1-35, then 3 month LIBOR | |||||
| + 1.496%) (H)(S) | 6.413 | — (Q) | 2,410,000 | 1,277,300 | |
| PNC Funding Corp. | 4.250 | 09-21-15 | 2,780,000 | 2,862,669 | |
| Regions Financial Corp. | 7.750 | 11-10-14 | 1,825,000 | 1,938,411 | |
| Santander Issuances SA, | |||||
| (6.500% to 11-1-14, then 3 month LIBOR | |||||
| + 3.920%) (S) | 6.500 | 08-11-19 | 1,400,000 | 1,461,501 | |
| Silicon Valley Bank | 6.050 | 06-01-17 | 2,335,000 | 2,230,467 | |
| Sovereign Capital Trust VI | 7.908 | 06-13-36 | 1,840,000 | 1,662,572 | |
| The Royal Bank of Scotland PLC | 4.875 | 03-16-15 | 1,275,000 | 1,260,414 | |
| Wachovia Bank NA | 5.850 | 02-01-37 | 1,665,000 | 1,574,058 | |
| Wachovia Bank NA, Series BKNT | 6.600 | 01-15-38 | 1,360,000 | 1,417,946 | |
| Wells Fargo Bank NA | 5.750 | 05-16-16 | 1,805,000 | 1,942,373 | |
| Westpac Banking Corp. | 4.875 | 11-19-19 | 2,275,000 | 2,266,771 | |
| Consumer Finance 1.71% | |||||
| American Express Company | 7.000 | 03-19-18 | 1,995,000 | 2,271,052 | |
| American Express Credit Corp., Series C | 7.300 | 08-20-13 | 2,490,000 | 2,800,904 | |
| Capital One Financial Corp. | 6.150 | 09-01-16 | 2,500,000 | 2,615,273 | |
| Discover Bank | 7.000 | 04-15-20 | 890,000 | 877,215 | |
| Discover Financial Services | 10.250 | 07-15-19 | 2,400,000 | 2,826,967 | |
| Ford Motor Credit Company LLC | 7.500 | 08-01-12 | 575,000 | 585,069 | |
| Nelnet, Inc., | |||||
| (7.400% to 9-29-11, then 3 month LIBOR | |||||
| + 3.376%) | 7.400 | 09-29-36 | 2,595,000 | 2,206,689 | |
| SLM Corp., MTN | 8.450 | 06-15-18 | 1,650,000 | 1,500,553 | |
| Diversified Financial Services 7.23% | |||||
| American Honda Finance Corp. (S) | 7.625 | 10-01-18 | 2,750,000 | 3,274,931 | |
| Astoria Depositor Corp., Series B (S) | 8.144 | 05-01-21 | 3,590,000 | 3,518,200 | |
| Bank of America Corp. | 4.500 | 04-01-15 | 1,310,000 | 1,302,065 | |
| Bear Stearns Companies LLC | 7.250 | 02-01-18 | 1,950,000 | 2,222,981 | |
| Beaver Valley Funding | 9.000 | 06-01-17 | 3,286,000 | 3,544,477 | |
| Bosphorus Financial Services, Ltd. (S) | 2.236 | 02-15-12 | 1,163,750 | 1,138,585 | |
| See notes to financial statements | ||
| Annual report | Bond Fund | 15 |
| Maturity | |||||
| Rate | date | Par value | Value | ||
| Diversified Financial Services (continued) | |||||
| Citigroup, Inc. | 6.375% | 08-12-14 | $3,235,000 | $3,418,308 | |
| Citigroup, Inc. | 6.125 | 11-21-17 | 2,925,000 | 2,983,178 | |
| Citigroup, Inc. | 5.850 | 12-11-34 | 1,275,000 | 1,156,703 | |
| CME Group, Inc. | 5.750 | 02-15-14 | 1,955,000 | 2,153,865 | |
| Crown Castle Towers LLC (S) | 6.113 | 01-15-20 | 1,615,000 | 1,728,552 | |
| ERAC USA Finance Company (S) | 6.375 | 10-15-17 | 1,730,000 | 1,953,172 | |
| ESI Tractebel Acquisition Corp., Series B | 7.990 | 12-30-11 | 2,112,000 | 2,112,000 | |
| General Electric Capital Corp. | 5.625 | 05-01-18 | 1,910,000 | 1,982,849 | |
| General Electric Capital Corp. (P) | 0.916 | 08-15-36 | 2,245,000 | 1,603,543 | |
| General Electric Capital Corp., GMTN | 6.000 | 08-07-19 | 1,340,000 | 1,419,569 | |
| GTP Towers Issuer LLC (S) | 8.112 | 02-15-15 | 1,820,000 | 1,899,334 | |
| GTP Towers Issuer LLC (S) | 4.436 | 02-15-15 | 1,955,000 | 2,021,563 | |
| Harley-Davidson Funding Corp. (S) | 6.800 | 06-15-18 | 1,110,000 | 1,156,378 | |
| Harley-Davidson Funding Corp. (S) | 5.750 | 12-15-14 | 1,085,000 | 1,120,462 | |
| Hyundai Capital Services, Inc. (S) | 6.000 | 05-05-15 | 1,615,000 | 1,741,803 | |
| JPMorgan Chase & Company | 6.000 | 01-15-18 | 3,260,000 | 3,519,516 | |
| JPMorgan Chase & Company | 4.650 | 06-01-14 | 2,575,000 | 2,722,864 | |
| JPMorgan Chase & Company, Series 1, | |||||
| (7.900% to 4-30-18, then 3 month LIBOR | |||||
| + 3.470%) | 7.900 | — (Q) | 2,240,000 | 2,278,640 | |
| LBI Escrow Corp. (S) | 8.000 | 11-01-17 | 380,000 | 386,650 | |
| Merrill Lynch & Company, Inc. | 7.750 | 05-14-38 | 1,770,000 | 1,825,647 | |
| Merrill Lynch & Company, Inc. | 6.875 | 04-25-18 | 2,825,000 | 2,909,725 | |
| Nationstar Mortgage/Nationstar Capital | |||||
| Corp. (S) | 10.875 | 04-01-15 | 1,805,000 | 1,543,275 | |
| Rabobank Nederland NV, | |||||
| (11.000% to 6-30-19, then 3 month LIBOR | |||||
| + 10.868%) (S) | 11.000 | — (Q) | 3,204,000 | 3,886,763 | |
| Teco Finance, Inc. | 6.572 | 11-01-17 | 1,304,000 | 1,450,643 | |
| USB Realty Corp., | |||||
| (6.091% to 1-15-12, then 3 month LIBOR | |||||
| + 1.147%) (S) | 6.091 | — (Q) | 2,900,000 | 2,117,000 | |
| Insurance 4.52% | |||||
| Aflac, Inc. | 8.500 | 05-15-19 | 1,455,000 | 1,730,146 | |
| Aflac, Inc. | 6.900 | 12-17-39 | 930,000 | 930,352 | |
| AXA SA, | |||||
| (6.379% to 12-13-36, then 3 month LIBOR | |||||
| + 2.256%) (S) | 6.379 | — (Q) | 1,170,000 | 924,300 | |
| CNA Financial Corp. | 7.350 | 11-15-19 | 1,280,000 | 1,345,472 | |
| CNA Financial Corp. | 6.500 | 08-15-16 | 1,315,000 | 1,358,704 | |
| Horace Mann Educators Corp. | 6.850 | 04-15-16 | 1,425,000 | 1,481,969 | |
| Liberty Mutual Group, Inc. (S) | 7.800 | 03-15-37 | 2,635,000 | 2,187,050 | |
| Liberty Mutual Group, Inc. (S) | 7.500 | 08-15-36 | 3,070,000 | 2,817,803 | |
| Liberty Mutual Group, Inc. (S) | 7.300 | 06-15-14 | 2,330,000 | 2,521,740 | |
| Lincoln National Corp. | 8.750 | 07-01-19 | 2,045,000 | 2,516,137 | |
| Lincoln National Corp., | |||||
| (6.050% until 4-20-17, then 3 month LIBOR | |||||
| + 2.040%) | 6.050 | 04-20-67 | 915,000 | 704,550 | |
| Massachusetts Mutual Life | |||||
| Insurance Company (S) | 8.875 | 06-01-39 | 895,000 | 1,175,171 | |
| See notes to financial statements | ||
| 16 | Bond Fund | Annual report | |
| Maturity | |||||
| Rate | date | Par value | Value | ||
| Insurance (continued) | |||||
| MetLife, Inc. | 6.750% | 06-01-16 | $1,380,000 | $1,546,413 | |
| New York Life Insurance Company (S) | 6.750 | 11-15-39 | 2,330,000 | 2,558,580 | |
| Progressive Corp., | |||||
| (6.700% to 6-15-17, then 3 month LIBOR | |||||
| + 2.018%) | 6.700 | 06-15-37 | 1,225,000 | 1,117,653 | |
| Prudential Financial, Inc., MTN | 7.375 | 06-15-19 | 885,000 | 1,013,201 | |
| Prudential Financial, Inc., Series D MTN | 5.150 | 01-15-13 | 2,550,000 | 2,695,296 | |
| QBE Insurance Group, Ltd. (S) | 9.750 | 03-14-14 | 1,739,000 | 2,126,385 | |
| Teachers Insurance & Annuity Association of | |||||
| America (S) | 6.850 | 12-16-39 | 2,445,000 | 2,687,400 | |
| Unum Group | 7.125 | 09-30-16 | 1,570,000 | 1,756,430 | |
| UnumProvident Finance Company PLC (S) | 6.850 | 11-15-15 | 2,435,000 | 2,621,555 | |
| W.R. Berkley Corp. | 5.600 | 05-15-15 | 1,460,000 | 1,506,137 | |
| Willis North America, Inc. | 7.000 | 09-29-19 | 1,915,000 | 2,001,357 | |
| Real Estate Investment Trusts 4.06% | |||||
| AMB Property LP | 6.625 | 12-01-19 | 1,965,000 | 2,074,604 | |
| Biomed Realty LP (S) | 6.125 | 04-15-20 | 520,000 | 531,942 | |
| Boston Properties LP | 5.875 | 10-15-19 | 1,085,000 | 1,139,142 | |
| Brandywine Operating Partnership LP | 7.500 | 05-15-15 | 1,390,000 | 1,533,176 | |
| Developers Diversified Realty Corp. | 7.500 | 04-01-17 | 1,740,000 | 1,731,653 | |
| Dexus Property Group (S) | 7.125 | 10-15-14 | 1,985,000 | 2,163,408 | |
| Duke Realty LP | 6.750 | 03-15-20 | 3,215,000 | 3,373,355 | |
| Health Care, Inc. | 6.200 | 06-01-16 | 1,835,000 | 1,993,803 | |
| Healthcare Realty Trust, Inc. | 8.125 | 05-01-11 | 1,340,000 | 1,409,374 | |
| Healthcare Realty Trust, Inc. | 6.500 | 01-17-17 | 2,170,000 | 2,290,849 | |
| HRPT Properties Trust | 6.650 | 01-15-18 | 1,800,000 | 1,855,755 | |
| Mack-Cali Realty Corp. | 7.750 | 08-15-19 | 1,345,000 | 1,555,784 | |
| ProLogis | 6.625 | 05-15-18 | 3,715,000 | 3,588,341 | |
| ProLogis | 5.625 | 11-15-15 | 1,615,000 | 1,595,591 | |
| Reckson Operating Partnership LP (S) | 7.750 | 03-15-20 | 735,000 | 754,463 | |
| Simon Property Group LP | 10.350 | 04-01-19 | 1,495,000 | 1,940,235 | |
| Simon Property Group LP | 5.625 | 08-15-14 | 2,160,000 | 2,338,591 | |
| Vornado Realty Trust | 4.250 | 04-01-15 | 2,815,000 | 2,817,463 | |
| WEA Finance LLC (S) | 6.750 | 09-02-19 | 1,180,000 | 1,305,225 | |
| WEA Finance LLC (S) | 5.400 | 10-01-12 | 1,095,000 | 1,160,997 | |
| Health Care 1.17% | 10,734,666 | ||||
| Health Care Equipment & Supplies 0.13% | |||||
| Inverness Medical Innovations, Inc. | 7.875 | 02-01-16 | 1,240,000 | 1,190,400 | |
| Health Care Providers & Services 0.50% | |||||
| BioScrip, Inc. (S) | 10.250 | 10-01-15 | 725,000 | 706,875 | |
| Medco Health Solutions, Inc. | 7.250 | 08-15-13 | 3,415,000 | 3,917,152 | |
| Life Sciences Tools & Services 0.17% | |||||
| Life Technologies Corp. | 6.000 | 03-01-20 | 1,480,000 | 1,567,122 | |
| Pharmaceuticals 0.37% | |||||
| Catalent Pharma Solutions, Inc., PIK | 9.500 | 04-15-15 | 1,587,387 | 1,543,734 | |
| Watson Pharmaceuticals, Inc. | 6.125 | 08-15-19 | 1,690,000 | 1,809,383 | |
| See notes to financial statements | ||
| Annual report | Bond Fund | 17 |
| Maturity | |||||
| Rate | date | Par value | Value | ||
| Industrials 5.91% | $54,036,124 | ||||
| Aerospace & Defense 0.79% | |||||
| BE Aerospace, Inc. | 8.500% | 07-01-18 | $1,150,000 | 1,190,250 | |
| Bombardier, Inc. (S) | 7.750 | 03-15-20 | 900,000 | 911,250 | |
| Colt Defense LLC (S) | 8.750 | 11-15-17 | 925,000 | 740,000 | |
| Embraer Overseas, Ltd. | 6.375 | 01-15-20 | 1,535,000 | 1,538,838 | |
| Kratos Defense & Security Solutions, Inc. (S) | 10.000 | 06-01-17 | 915,000 | 905,850 | |
| L-3 Communications Corp., Series B | 6.375 | 10-15-15 | 1,925,000 | 1,925,000 | |
| Airlines 1.89% | |||||
| Continental Airlines, Inc., | |||||
| Series 1998-1, Class A | 6.648 | 09-15-17 | 668,989 | 662,299 | |
| Continental Airlines, Inc., | |||||
| Series 1999-1, Class A | 6.545 | 02-02-19 | 579,254 | 590,839 | |
| Continental Airlines, Inc., | |||||
| Series 2000-2, Class B | 8.307 | 04-02-18 | 1,086,696 | 1,070,396 | |
| Continental Airlines, Inc., | |||||
| Series 2007-1, Class A | 5.983 | 04-19-22 | 2,102,101 | 2,091,591 | |
| Delta Air Lines, Inc. (S) | 9.500 | 09-15-14 | 1,435,000 | 1,470,875 | |
| Delta Air Lines, Inc., | |||||
| Class G-1 | 6.718 | 01-02-23 | 2,253,054 | 2,106,606 | |
| Delta Air Lines, Inc., | |||||
| Series 2007-1 Class A | 6.821 | 08-10-22 | 2,738,767 | 2,670,298 | |
| Northwest Airlines, Inc., | |||||
| Series 2002-1, Class G2 | 6.264 | 11-20-21 | 2,003,347 | 1,893,163 | |
| Northwest Airlines, Inc., | |||||
| Series 2007-1, Class A | 7.027 | 11-01-19 | 1,599,373 | 1,495,413 | |
| United Air Lines, Inc. | 10.400 | 11-01-16 | 774,747 | 840,600 | |
| United Air Lines, Inc. (S) | 9.875 | 08-01-13 | 400,000 | 409,000 | |
| United Air Lines, Inc. | 9.750 | 01-15-17 | 1,825,000 | 1,961,875 | |
| Building Materials 0.39% | |||||
| Voto-Votorantim Overseas Trading Operations | |||||
| NV (S) | 6.625 | 09-25-19 | 1,800,000 | 1,768,500 | |
| Voto-Votorantim, Ltd. (S) | 6.750 | 04-05-21 | 1,840,000 | 1,807,800 | |
| Building Products 0.12% | |||||
| Masco Corp. | 7.125 | 03-15-20 | 1,105,000 | 1,070,501 | |
| Commercial Services & Supplies 0.08% | |||||
| ACCO Brands Corp. | 10.625 | 03-15-15 | 315,000 | 340,988 | |
| Garda World Security Corp. (S) | 9.750 | 03-15-17 | 385,000 | 395,588 | |
| Construction Materials 0.11% | |||||
| Odebrecht Finance, Ltd. (S) | 7.000 | 04-21-20 | 1,030,000 | 1,014,550 | |
| Electrical Equipment 0.08% | |||||
| Coleman Cable, Inc. (S) | 9.000 | 02-15-18 | 745,000 | 728,238 | |
| Industrial Conglomerates 0.57% | |||||
| General Electric Company | 5.250 | 12-06-17 | 1,365,000 | 1,461,201 | |
| Hutchison Whampoa International, Ltd. (S) | 5.750 | 09-11-19 | 1,675,000 | 1,704,572 | |
| Textron, Inc. | 5.600 | 12-01-17 | 1,945,000 | 2,034,587 | |
| Machinery 0.41% | |||||
| Altra Holdings, Inc. (S) | 8.125 | 12-01-16 | 805,000 | 802,988 | |
| Case New Holland, Inc. | 7.750 | 09-01-13 | 1,345,000 | 1,368,538 | |
| See notes to financial statements | ||
| 18 | Bond Fund | Annual report | |
| Maturity | |||||
| Rate | date | Par value | Value | ||
| Machinery (continued) | |||||
| Terex Corp. | 10.875% | 06-01-16 | $1,050,000 | $1,128,750 | |
| Trimas Corp. (S) | 9.750 | 12-15-17 | 465,000 | 471,975 | |
| Marine 0.20% | |||||
| Navios Maritime Holdings, Inc. | 9.500 | 12-15-14 | 1,850,000 | 1,799,125 | |
| Road & Rail 0.52% | |||||
| Avis Budget Car Rental LLC (S) | 9.625 | 03-15-18 | 350,000 | 350,000 | |
| Kansas City Southern de Mexico SA de CV | 9.375 | 05-01-12 | 569,000 | 580,380 | |
| Kansas City Southern de Mexico SA de CV (S) | 8.000 | 02-01-18 | 1,265,000 | 1,263,419 | |
| RailAmerica, Inc. | 9.250 | 07-01-17 | 945,000 | 982,800 | |
| Western Express, Inc. (S) | 12.500 | 04-15-15 | 1,745,000 | 1,640,300 | |
| Trading Companies & Distributors 0.53% | |||||
| GATX Corp. | 8.750 | 05-15-14 | 2,220,000 | 2,605,856 | |
| United Rentals North America, Inc. | 10.875 | 06-15-16 | 530,000 | 564,450 | |
| United Rentals North America, Inc. | 7.000 | 02-15-14 | 1,770,000 | 1,659,375 | |
| Transportation Infrastructure 0.22% | |||||
| CMA CGM SA (S) | 7.250 | 02-01-13 | 2,690,000 | 2,017,500 | |
| Information Technology 0.71% | 6,487,001 | ||||
| Electronic Equipment, Instruments & Components 0.46% | |||||
| Amphenol Corp. | 4.750 | 11-15-14 | 2,160,000 | 2,265,790 | |
| Tyco Electronics Group SA | 6.000 | 10-01-12 | 1,760,000 | 1,898,012 | |
| Internet Software & Services 0.07% | |||||
| Equinix, Inc. | 8.125 | 03-01-18 | 625,000 | 634,375 | |
| IT Services 0.18% | |||||
| Fiserv, Inc. | 6.800 | 11-20-17 | 1,505,000 | 1,688,824 | |
| Materials 4.84% | 44,292,437 | ||||
| Chemicals 1.07% | |||||
| American Pacific Corp. | 9.000 | 02-01-15 | 2,160,000 | 2,114,100 | |
| CF Industries, Inc. | 7.125 | 05-01-20 | 205,000 | 206,794 | |
| CF Industries, Inc. | 6.875 | 05-01-18 | 205,000 | 205,256 | |
| Incitec Pivot Finance LLC (S) | 6.000 | 12-10-19 | 1,370,000 | 1,387,509 | |
| Mosaic Company (S) | 7.625 | 12-01-16 | 1,705,000 | 1,871,367 | |
| RPM International, Inc. | 6.500 | 02-15-18 | 1,325,000 | 1,435,227 | |
| Solutia, Inc. | 7.875 | 03-15-20 | 1,080,000 | 1,074,600 | |
| Sterling Chemicals, Inc. | 10.250 | 04-01-15 | 1,490,000 | 1,460,200 | |
| Construction Materials 0.29% | |||||
| CRH America, Inc. | 8.125 | 07-15-18 | 1,930,000 | 2,299,761 | |
| Severstal Columbus LLC (S) | 10.250 | 02-15-18 | 370,000 | 382,950 | |
| Containers & Packaging 0.50% | |||||
| Ball Corp. | 6.750 | 09-15-20 | 1,290,000 | 1,254,525 | |
| BWAY Corp. | 10.000 | 04-15-14 | 1,390,000 | 1,535,950 | |
| Graphic Packaging International, Inc. | 9.500 | 06-15-17 | 690,000 | 717,600 | |
| Solo Cup Company | 10.500 | 11-01-13 | 570,000 | 579,975 | |
| U.S. Corrugated, Inc. | 10.000 | 06-12-13 | 605,000 | 514,250 | |
| Metals & Mining 1.97% | |||||
| Allegheny Technologies, Inc. | 9.375 | 06-01-19 | 1,205,000 | 1,411,233 | |
| ArcelorMittal | 9.850 | 06-01-19 | 2,010,000 | 2,453,492 | |
| CII Carbon LLC (S) | 11.125 | 11-15-15 | 1,835,000 | 1,798,300 | |
| See notes to financial statements | Annual report | Bond Fund | 19 |
| Maturity | |||||
| Rate | date | Par value | Value | ||
| Metals & Mining (continued) | |||||
| Commercial Metals Company | 7.350% | 08-15-18 | $1,295,000 | $1,359,745 | |
| Rio Tinto Alcan, Inc. | 6.125 | 12-15-33 | 1,725,000 | 1,743,242 | |
| Rio Tinto Finance USA, Ltd. | 8.950 | 05-01-14 | 1,345,000 | 1,615,824 | |
| Teck Resources, Ltd. | 10.750 | 05-15-19 | 4,105,000 | 4,946,525 | |
| Vale Overseas, Ltd. | 6.875 | 11-10-39 | 1,290,000 | 1,284,911 | |
| Vedanta Resources PLC (S) | 8.750 | 01-15-14 | 1,345,000 | 1,358,450 | |
| Paper & Forest Products 1.01% | |||||
| Boise Paper Holdings LLC (S) | 8.000 | 04-01-20 | 275,000 | 277,063 | |
| International Paper Company | 9.375 | 05-15-19 | 1,650,000 | 2,070,425 | |
| International Paper Company | 7.950 | 06-15-18 | 2,130,000 | 2,480,181 | |
| NewPage Corp. | 11.375 | 12-31-14 | 540,000 | 504,900 | |
| PE Paper Escrow GmbH (S) | 12.000 | 08-01-14 | 385,000 | 421,575 | |
| Verso Paper Holdings LLC, Series B | 9.125 | 08-01-14 | 1,695,000 | 1,601,775 | |
| Westvaco Corp. | 7.950 | 02-15-31 | 1,785,000 | 1,924,732 | |
| Telecommunication Services 2.48% | 22,663,008 | ||||
| Communications Equipment 0.04% | |||||
| Telcordia Technologies, Inc. (S) | 11.000 | 05-01-18 | 435,000 | 421,406 | |
| Diversified Financial Services 0.05% | |||||
| Inmarsat Finance PLC (S) | 7.375 | 12-01-17 | 430,000 | 428,925 | |
| Diversified Telecommunication Services 1.22% | |||||
| Axtel SAB de CV (S) | 9.000 | 09-22-19 | 630,000 | 535,500 | |
| Citizens Communications Company | 6.250 | 01-15-13 | 2,032,000 | 2,021,840 | |
| Intelsat Jackson Holdings, Ltd. | 11.500 | 06-15-16 | 1,585,000 | 1,660,288 | |
| Level 3 Financing, Inc. (S) | 10.000 | 02-01-18 | 310,000 | 272,800 | |
| New Communications Holdings, Inc. (S) | 8.500 | 04-15-20 | 1,130,000 | 1,113,050 | |
| Qwest Corp. | 7.875 | 09-01-11 | 1,480,000 | 1,550,300 | |
| Telecom Italia Capital SA | 6.175 | 06-18-14 | 1,405,000 | 1,453,491 | |
| West Corp. | 11.000 | 10-15-16 | 2,515,000 | 2,540,150 | |
| Wireless Telecommunication Services 1.17% | |||||
| America Movil SAB de CV (S) | 5.000 | 03-30-20 | 1,640,000 | 1,633,217 | |
| Crown Castle International Corp. | 7.125 | 11-01-19 | 685,000 | 664,450 | |
| Digicel Group, Ltd. (S) | 12.000 | 04-01-14 | 1,140,000 | 1,265,400 | |
| Digicel Group, Ltd. (S) | 8.875 | 01-15-15 | 2,115,000 | 2,046,263 | |
| NII Capital Corp. | 10.000 | 08-15-16 | 940,000 | 1,005,800 | |
| NII Capital Corp. | 8.875 | 12-15-19 | 1,575,000 | 1,602,563 | |
| SBA Telecommunications, Inc. (S) | 8.000 | 08-15-16 | 545,000 | 561,350 | |
| SBA Tower Trust (S) | 5.101 | 04-15-17 | 1,790,000 | 1,886,215 | |
| Utilities 4.65% | 42,549,336 | ||||
| Electric Utilities 2.63% | |||||
| Allegheny Energy Supply Company LLC (S) | 5.750 | 10-15-19 | 1,160,000 | 1,163,823 | |
| Aquila, Inc. | 11.875 | 07-01-12 | 1,905,000 | 2,194,560 | |
| BVPS II Funding Corp. | 8.890 | 06-01-17 | 2,038,000 | 2,298,592 | |
| Commonwealth Edison Company | 5.800 | 03-15-18 | 2,995,000 | 3,294,898 | |
| Duke Energy Corp. | 6.300 | 02-01-14 | 1,360,000 | 1,526,191 | |
| FirstEnergy Solutions Corp. | 4.800 | 02-15-15 | 1,495,000 | 1,542,723 | |
| Israel Electric Corp., Ltd. (S) | 7.250 | 01-15-19 | 2,395,000 | 2,625,480 | |
| ITC Holdings Corp. (S) | 5.875 | 09-30-16 | 745,000 | 792,236 | |
| See notes to financial statements | ||
| 20 | Bond Fund | Annual report | |
| Maturity | |||||
| Rate | date | Par value | Value | ||
| Electric Utilities (continued) | |||||
| ITC Holdings Corp. (S) | 5.500% | 01-15-20 | $1,670,000 | $1,758,712 | |
| Monongahela Power Company (S) | 7.950 | 12-15-13 | 2,080,000 | 2,438,569 | |
| PNPP II Funding Corp. | 9.120 | 05-30-16 | 944,000 | 959,758 | |
| Texas Competitive Electric Holdings | |||||
| Company LLC, Series A | 10.250 | 11-01-15 | 2,305,000 | 1,544,350 | |
| Waterford 3 Funding Corp. | 8.090 | 01-02-17 | 1,885,317 | 1,951,133 | |
| Gas Utilities 0.24% | |||||
| DCP Midstream LLC (S) | 9.750 | 03-15-19 | 1,705,000 | 2,176,291 | |
| Independent Power Producers & Energy Traders 0.57% | |||||
| AES Eastern Energy LP, | |||||
| Series 1999-A | 9.000 | 01-02-17 | 3,049,137 | 3,171,103 | |
| Ipalco Enterprises, Inc. | 8.625 | 11-14-11 | 1,405,000 | 1,464,713 | |
| Listrindo Capital BV (S) | 9.250 | 01-29-15 | 560,000 | 565,740 | |
| Multi-Utilities 0.83% | |||||
| CMS Energy Corp. | 6.250 | 02-01-20 | 2,645,000 | 2,498,401 | |
| DTE Energy Company | 7.625 | 05-15-14 | 1,310,000 | 1,530,559 | |
| Sempra Energy | 8.900 | 11-15-13 | 1,415,000 | 1,684,497 | |
| Sempra Energy | 6.500 | 06-01-16 | 1,645,000 | 1,879,585 | |
| Water Utilities 0.38% | |||||
| Indiantown Cogeneration LP, Series A–9 | 9.260 | 12-15-10 | 363,223 | 370,331 | |
| Midwest Generation LLC, Series B | 8.560 | 01-02-16 | 2,265,754 | 2,254,425 | |
| Salton Sea Funding Corp., Series F | 7.475 | 11-30-18 | 777,856 | 862,666 | |
| Convertible Bonds 0.30% | $2,737,850 | ||||
| (Cost $2,026,465) | |||||
| Financials 0.14% | 1,310,700 | ||||
| Real Estate Investment Trusts 0.14% | |||||
| Corporate Office Properties LP (S) | 4.250% | 04-15-30 | $1,360,000 | 1,310,700 | |
| Industrials 0.16% | 1,427,150 | ||||
| Airlines 0.16% | |||||
| US Airways Group, Inc. | 7.250 | 05-15-14 | 680,000 | 1,427,150 | |
| U.S. Government & Agency Obligations 17.95% | $164,207,236 | ||||
| (Cost $161,007,838) | |||||
| U.S. Government 5.27% | 48,211,350 | ||||
| U.S. Treasury | |||||
| Bond | 4.625% | 02-15-40 | $23,295,000 | 24,874,681 | |
| Note | 3.500 | 05-15-20 | 7,365,000 | 7,486,964 | |
| Note | 2.500 | 03-31-15 | 10,770,000 | 10,998,863 | |
| Note | 2.500 | 04-30-15 | 4,755,000 | 4,850,842 | |
| U.S. Government Agency 12.68% | 115,995,886 | ||||
| Federal Home Loan Bank | 5.375 | 05-18-16 | 1,960,000 | 2,249,318 | |
| Federal Home Loan Mortgage Corp. | 5.000 | 07-01-35 | 2,655,880 | 2,791,579 | |
| Federal National Mortgage Association | |||||
| 15 Yr Pass Thru Ctf | 3.000 | 10-29-14 | 2,605,000 | 2,631,277 | |
| 30 Yr Pass Thru Ctf | 5.500 | 05-01-35 | 15,883,534 | 16,964,359 | |
| TBA | 5.000 | TBA | 30,840,000 | 32,273,579 | |
| 30 Yr Pass Thru Ctf | 5.000 | 11-01-33 | 3,498,143 | 3,678,789 | |
| 30 Yr Pass Thru Ctf | 4.000 | 06-01-24 | 28,130,961 | 28,935,332 | |
| See notes to financial statements | ||
| Annual report | Bond Fund | 21 |
| Maturity | |||||
| Rate | date | Par value | Value | ||
| Federal National Mortgage Association (continued) | |||||
| 30 Yr Pass Thru Ctf | 4.000% | 07-01-24 | $17,705,945 | $18,212,225 | |
| Note | 2.050 | 01-28-13 | 4,500,000 | 4,524,035 | |
| Note | 1.800 | 03-15-13 | 3,720,000 | 3,735,393 | |
| Term Loans 0.24% | $2,172,043 | ||||
| (Cost $2,231,248) | |||||
| Consumer Discretionary 0.15% | 1,332,043 | ||||
| Hotels, Restaurants & Leisure 0.15% | |||||
| East Valley Tourist Development Authority | 12.000% | 08-06-12 | $795,819 | 684,404 | |
| Greektown Holdings LLC | 14.500 | 09-30-10 | 580,621 | 586,428 | |
| Greektown Holdings LLC (T)(U) | — | 09-30-10 | 60,605 | 61,211 | |
| Financials 0.09% | 840,000 | ||||
| Real Estate Management & Development 0.09% | |||||
| Realogy Corp. | 13.500 | 10-15-17 | 800,000 | 840,000 | |
| Collateralized Mortgage Obligations 16.35% | $149,545,471 | ||||
| (Cost $169,915,168) | |||||
| American Home Mortgage Assets | |||||
| Series 2006-6, Class A1A (P) | 0.533% | 12-25-46 | $2,425,033 | 1,268,678 | |
| Series 2006-6, Class XP IO | 2.581 | 12-25-46 | 29,975,547 | 1,280,196 | |
| American Tower Trust | |||||
| Series 2007-1A, Class C (S) | 5.615 | 04-15-37 | 2,875,000 | 3,022,212 | |
| Series 2007-1A, Class D (S) | 5.957 | 04-15-37 | 3,175,000 | 3,341,967 | |
| Banc of America Commercial Mortgage, Inc., | |||||
| Series 2006-3, Class A4 (P) | 5.889 | 07-10-44 | 5,260,000 | 5,283,407 | |
| Banc of America Funding Corp. | |||||
| Series 2006-B, Class 6A1 (P) | 5.826 | 03-20-36 | 2,775,081 | 1,937,327 | |
| Series 2007-E, Class 4A1 (P) | 5.710 | 07-20-47 | 1,713,916 | 1,164,018 | |
| Bear Stearns Alt-A Trust, | |||||
| Series 2005-3, Class B2 (P) | 2.727 | 04-25-35 | 1,154,429 | 62,481 | |
| Bear Stearns Commercial Mortgage | |||||
| Securities, Inc., | |||||
| Series 2006-PW14, Class D (S) | 5.412 | 12-11-38 | 2,480,000 | 893,540 | |
| Bear Stearns Mortgage Funding Trust, | |||||
| Series 2006-AR1, Class 2A1 (P) | 0.563 | 08-25-36 | 1,543,345 | 812,139 | |
| Citigroup Commercial Mortgage Trust, | |||||
| Series 2006-C4, Class A3 (P) | 5.729 | 03-15-49 | 3,350,000 | 3,451,728 | |
| Citigroup Mortgage Loan Trust, Inc. | |||||
| Series 2005-10, Class 1A5A (P) | 5.680 | 12-25-35 | 1,970,895 | 1,262,098 | |
| Series 2005-5, Class 2A3 | 5.000 | 08-25-35 | 1,144,346 | 1,049,222 | |
| Citigroup/Deutsche Bank Commercial | |||||
| Mortgage Trust, | |||||
| Series 2005-CD1, Class C (P) | 5.223 | 07-15-44 | 1,030,000 | 686,764 | |
| Commercial Mortgage Pass Through | |||||
| Certificates, | |||||
| Series 2007-C9, Class A4 (P) | 5.816 | 12-10-49 | 5,295,000 | 5,331,897 | |
| Federal Home Loan Mortgage Corp. | |||||
| Series 3581, Class IO | 6.000 | 10-15-39 | 3,747,657 | 680,822 | |
| Series 3623, Class LI IO | 4.500 | 01-15-25 | 3,831,347 | 406,685 | |
| Series 3630, Class BI IO | 4.000 | 05-15-27 | 2,209,613 | 331,948 | |
| See notes to financial statements | ||
| 22 | Bond Fund | Annual report | |
| Maturity | |||||
| Rate | date | Par value | Value | ||
| Federal National Mortgage Association | |||||
| Series 2009-109, Class IW IO | 4.500% | 04-25-38 | $5,658,326 | $977,785 | |
| Series 2009-47, Class EI IO | 5.000 | 08-25-19 | 5,160,301 | 589,940 | |
| Series 2009-50, Class GI IO | 5.000 | 05-25-39 | 8,500,186 | 1,271,792 | |
| Series 2009-78, Class IB IO | 5.000 | 06-25-39 | 11,961,122 | 2,069,572 | |
| Series 2010-14, Class AI IO | 4.000 | 08-25-27 | 6,666,779 | 1,190,369 | |
| Series 2010-36, Class BI IO | 4.000 | 03-25-28 | 6,780,148 | 966,692 | |
| Series 398, Class C3 IO | 4.500 | 05-25-39 | 7,424,420 | 1,694,539 | |
| Series 401, Class C2 IO | 4.500 | 06-25-39 | 5,006,620 | 1,095,754 | |
| Series 402, Class 3 IO | 4.000 | 11-25-39 | 4,829,358 | 1,125,054 | |
| Series 402, Class 4 IO | 4.000 | 10-25-39 | 8,695,933 | 2,015,522 | |
| Series 402, Class 7 IO | 4.500 | 11-25-39 | 8,513,477 | 1,929,895 | |
| First Horizon Alternative Mortgage Securities | |||||
| Series 2006-RE1, Class A1 | 5.500 | 05-25-35 | 2,803,747 | 2,266,905 | |
| Series 2004-AA5, Class B1 (P) | 2.230 | 12-25-34 | 1,171,675 | 102,582 | |
| Global Tower Partners Acquisition Partners LLC, | |||||
| Series 2007-1A, Class F (S) | 7.050 | 05-15-37 | 780,000 | 795,600 | |
| GMAC Commercial Mortgage Securities, Inc., | |||||
| Series 2003-C2, Class B (P) | 5.675 | 05-10-40 | 7,495,000 | 7,875,351 | |
| GMAC Mortgage Corp. Loan Trust, | |||||
| Series 2006-AR1, Class 2A1 (P) | 5.518 | 04-19-36 | 1,813,263 | 1,498,854 | |
| Greenpoint Mortgage Funding Trust | |||||
| Series 2005-AR4, Class 4A2 (P) | 0.703 | 10-25-45 | 2,340,013 | 579,806 | |
| Series 2006-AR1, Class A2A (P) | 0.713 | 02-25-36 | 3,722,516 | 1,097,137 | |
| Greenwich Capital Commercial Funding Corp. | |||||
| Series 2007-GG9, Class C (P) | 5.554 | 03-10-39 | 1,810,000 | 513,240 | |
| Series 2007-GG9, Class F (P) | 5.633 | 03-10-39 | 995,000 | 185,135 | |
| Series 2007-GG9, Class A4 | 5.444 | 03-10-39 | 4,670,000 | 4,512,840 | |
| GSR Mortgage Loan Trust | |||||
| Series 2005-AR6, Class 3A1 (P) | 2.848 | 09-25-35 | 3,667,057 | 3,453,424 | |
| Series 2004-9, Class B1 (P) | 3.900 | 08-25-34 | 1,655,468 | 640,948 | |
| Series 2006-AR1, Class 3A1 (P) | 5.307 | 01-25-36 | 4,329,325 | 3,914,974 | |
| Harborview Mortgage Loan Trust | |||||
| Series 2005-11, Class X IO | 2.470 | 08-19-45 | 14,831,403 | 537,260 | |
| Series 2005-16, Class 2A1B (P) | 0.669 | 01-19-36 | 1,385,357 | 355,913 | |
| Series 2005-8, Class 1X IO | 2.440 | 09-19-35 | 22,953,559 | 896,623 | |
| Series 2006-SB1, Class A1A (P) | 1.271 | 12-19-36 | 2,811,765 | 1,221,285 | |
| Series 2007-3, Class ES IO | 0.350 | 05-19-47 | 104,071,712 | 551,580 | |
| Series 2007-4, Class ES IO | 0.350 | 07-19-47 | 116,400,608 | 663,483 | |
| Series 2007-6, Class ES IO (S) | 0.342 | 08-19-37 | 83,836,065 | 554,156 | |
| IndyMac Index Mortgage Loan Trust | |||||
| Series 2004-AR13, Class B1 | 5.296 | 01-25-35 | 1,140,446 | 113,600 | |
| Series 2005-AR18, Class 1X IO | 2.384 | 10-25-36 | 37,255,707 | 1,281,596 | |
| Series 2005-AR18, Class 2X IO | 2.110 | 10-25-36 | 62,059,973 | 2,209,335 | |
| Series 2005-AR5, Class B1 (P) | 2.779 | 05-25-35 | 1,617,827 | 66,558 | |
| JPMorgan Chase Commercial Mortgage Securities Corp. | |||||
| Series 2005-LDP3, Class A4B (P) | 4.996 | 08-15-42 | 3,635,000 | 3,256,531 | |
| Series 2005-LDP4, Class B (P) | 5.129 | 10-15-42 | 1,646,000 | 1,203,396 | |
| Series 2007-CB18, Class A4 | 5.440 | 06-12-47 | 4,610,000 | 4,464,826 | |
| Series 2006-LDP7, Class A4 (P) | 5.874 | 04-15-45 | 3,345,000 | 3,485,056 | |
| JPMorgan Mortgage Trust | |||||
| Series 2006-A7, Class 2A5 (P) | 5.757 | 01-25-37 | 3,321,574 | 536,109 | |
| Series 2005-S2, Class 2A16 | 6.500 | 09-25-35 | 1,870,425 | 1,698,854 | |
| See notes to financial statements | ||
| Annual report | Bond Fund | 23 |
| Maturity | |||||
| Rate | date | Par value | Value | ||
| LB–UBS Commercial Mortgage Trust | |||||
| Series 2007-C7, Class A3 (P) | 5.866% | 09-15-45 | $4,685,000 | $4,582,195 | |
| Series 2006-C4, Class A4 (P) | 5.882 | 06-15-38 | 3,950,000 | 4,076,880 | |
| Series 2007-C2, Class A3 | 5.430 | 02-15-40 | 4,910,000 | 4,722,247 | |
| Merrill Lynch/Countrywide Commercial | |||||
| Mortgage Trust, | |||||
| Series 2006-2, Class A4 (P) | 5.909 | 06-12-46 | 4,535,000 | 4,728,439 | |
| MLCC Mortgage Investors, Inc. | |||||
| Series 2007-3, Class M1 (P) | 5.830 | 09-25-37 | 1,492,747 | 624,817 | |
| Series 2007-3, Class M2 (P) | 5.830 | 09-25-37 | 557,996 | 223,506 | |
| Series 2007-3, Class M3 (P) | 5.830 | 09-25-37 | 395,846 | 145,744 | |
| Morgan Stanley Capital I | |||||
| Series 2007-IQ13, Class A4 | 5.364 | 03-15-44 | 4,605,000 | 4,428,939 | |
| Series 2007-IQ15, Class A4 (P) | 5.880 | 06-11-49 | 4,645,000 | 4,660,476 | |
| Series 2005-HQ7, Class A4 (P) | 5.208 | 11-14-42 | 3,065,000 | 3,180,901 | |
| Series 2005-IQ10, Class A4A (P) | 5.230 | 09-15-42 | 2,680,000 | 2,770,792 | |
| Series 2006-IQ12, Class E IO | 5.538 | 12-15-43 | 2,430,000 | 408,128 | |
| PRLM, | |||||
| Series JF-929, Class AI IO | 4.500 | 07-02-40 | 7,885,000 | 1,273,920 | |
| Provident Funding Mortgage Loan Trust, | |||||
| Series 2005-1, Class B1 (P) | 2.980 | 05-25-35 | 1,548,433 | 425,701 | |
| Residential Accredit Loans, Inc., | |||||
| Series 2005-QO4, Class X IO | 2.566 | 12-25-45 | 39,650,660 | 1,339,883 | |
| Structured Asset Securities Corp., | |||||
| Series 2003-6A, Class B1 (P) | 2.790 | 03-25-33 | 2,103,678 | 1,088,670 | |
| Washington Mutual, Inc. | |||||
| Series 2005-AR1, Class X IO | 1.697 | 01-25-45 | 50,158,394 | 1,640,556 | |
| Series 2005-AR13, Class X IO | 1.674 | 10-25-45 | 133,912,965 | 4,184,781 | |
| Series 2005-AR19, Class B1 (P) | 1.043 | 12-25-45 | 2,319,762 | 289,871 | |
| Series 2006-AR4, Class 1A1B (P) | 1.361 | 05-25-46 | 2,486,069 | 1,106,880 | |
| Series 2005-6, Class 1CB | 6.500 | 08-25-35 | 1,265,908 | 883,366 | |
| Series 2005-AR13, Class B1 (P) | 0.943 | 10-25-45 | 3,979,485 | 434,183 | |
| Series 2005-AR6, Class B1 (P) | 0.943 | 04-25-45 | 4,461,157 | 579,076 | |
| Wells Fargo Mortgage Backed Securities Trust | |||||
| Series 2005-AR5, Class 1A1 (P) | 5.090 | 04-25-35 | 3,206,901 | 3,062,685 | |
| Series 2006-AR15, Class A3 (P) | 5.488 | 10-25-36 | 3,382,827 | 955,835 | |
| Asset Backed Securities 3.33% | $30,445,001 | ||||
| (Cost $32,025,097) | |||||
| Bank of America Auto Trust, | |||||
| Series 2009-1A, Class A4 (S) | 3.520% | 06-15-16 | $2,525,000 | 2,629,753 | |
| Bayview Financial Acquisition Trust, | |||||
| Series 2006-A, Class 2A3 (P) | 0.704 | 02-28-41 | 2,169,898 | 1,693,953 | |
| BMW Vehicle Lease Trust, | |||||
| Series 2009-1, Class A4 | 3.660 | 08-15-13 | 2,855,000 | 2,933,114 | |
| Carrington Mortgage Loan Trust, | |||||
| Series 2006-NC4, Class A5 (P) | 0.403 | 10-25-36 | 851,861 | 707,264 | |
| ContiMortgage Home Equity Loan Trust, | |||||
| Series 1995-2, Class A–5 | 8.100 | 08-15-25 | 185,545 | 163,799 | |
| Countrywide Asset-Backed Certificates, | |||||
| Series 2006-3, Class 2A2 (P) | 0.523 | 06-25-36 | 3,530,282 | 2,908,600 | |
| DB Master Finance LLC | |||||
| Series 2006-1, Class-A2 (S) | 5.779 | 06-20-31 | 4,605,000 | 4,543,247 | |
| Series 2006-1, Class-M1 (S) | 8.285 | 06-20-31 | 1,065,000 | 985,423 | |
| See notes to financial statements | ||
| 24 | Bond Fund | Annual report | |
| Maturity | |||||
| Rate | date | Par value | Value | ||
| Dominos Pizza Master Issuer LLC | |||||
| Series 2007-1, Class M1 (S) | 7.629% | 04-25-37 | $3,715,000 | $3,204,224 | |
| Series 2007-1, Class A2 (S) | 5.261 | 04-25-37 | 3,180,000 | 2,965,262 | |
| Hertz Vehicle Financing LLC, | |||||
| Series 2009-2A, Class A2 (S) | 5.290 | 03-25-16 | 3,090,000 | 3,295,022 | |
| Lehman XS Trust | |||||
| Series 2005-5N, Class 3A2 (P) | 0.703 | 11-25-35 | 2,629,260 | 878,594 | |
| Series 2005-7N, Class 1A1B (P) | 0.643 | 12-25-35 | 3,066,592 | 980,886 | |
| Renaissance Home Equity Loan Trust | |||||
| Series 2005-2, Class AF3 | 4.499 | 08-25-35 | 654,292 | 625,212 | |
| Series 2005-2, Class AF4 | 4.934 | 08-25-35 | 2,365,000 | 1,930,648 | |
| Shares | Value | ||||
| Preferred Stocks 0.63% | $5,736,795 | ||||
| (Cost $5,992,202) | |||||
| Consumer Staples 0.19% | 1,720,500 | ||||
| Food & Staples Retailing 0.19% | |||||
| Ocean Spray Cranberries, Inc., 6.250%, Series A (S) | 23,250 | 1,720,500 | |||
| Financials 0.24% | 2,209,979 | ||||
| Diversified Financial Services 0.24% | |||||
| Bank of America Corp., 8.625% | 89,220 | 2,209,979 | |||
| Telecommunication Services 0.20% | 1,806,316 | ||||
| Wireless Telecommunication Services 0.20% | |||||
| Telephone & Data Systems, Inc., 7.600%, Series A | 72,953 | 1,806,316 | |||
| Maturity | |||||
| Yield* | date | Par value | Value | ||
| Short-Term Investments 5.41% | $49,539,000 | ||||
| (Cost $49,539,000) | |||||
| Short-Term Securities 4.92% | 45,000,000 | ||||
| Federal Home Loan Bank Discount Note | 0.060% | 06-01-10 | $45,000,000 | 45,000,000 | |
| Repurchase Agreement 0.49% | 4,539,000 | ||||
| Repurchase Agreement with State Street Corp. | |||||
| dated 5-28-10 at 0.010% to be repurchased | |||||
| at $4,539,005 on 6-1-10, collateralized by | |||||
| $4,465,000 Federal Home Loan Mortgage | |||||
| Corp., 4.125% due 2-24-11 (valued | |||||
| at $4,632,438). | 4,539,000 | 4,539,000 | |||
| Total investments (Cost $937,294,213)† 102.51% | $937,689,207 | ||||
| Other assets and liabilities, net (2.51%) | ($22,933,453) | ||||
| Total net assets 100.00% | $914,755,754 | ||||
The percentage shown for each investment category is the total value of that category as a percentage of the net assets applicable of the Fund.
| See notes to financial statements | ||
| Annual report | Bond Fund | 25 |
Notes to Schedule of Investments
Currency abbreviations
BRL — Brazilian Real
CAD — Canadian Dollar
GMTN Global Medium Term Note
IO Interest Only Security — Interest Tranche of Stripped Mortgage Pool
LIBOR London Interbank Offered Rate
MTN Medium-Term Note PIK Paid In Kind
TBA To Be Announced
(D) Par value of foreign bonds is expressed in local currency as shown parenthetically in security description.
(H) Defaulted security. Currently, the issuer is in default with respect to interest payments.
(P) Variable rate obligation. The coupon rate shown represents the rate at period end.
(Q) Perpetual bonds have no stated maturity date.
(S) These securities are exempt from registration under Rule 144A of the Securities Act of 1933. Such securities may be resold, normally to qualified institutional buyers, in transactions exempt from registration. Rule 144A securities amounted to $189,770,395 or 20.78% of the Fund’s net assets as of May 31, 2010.
(T) All or a portion of this security represents an unsettled term loan commitment. Rate will be determined at time of settlement.
(U) All or a portion of this position represents unfunded loan commitment.
* Yield represents either the annualized yield at the date of purchase, the stated coupon rate or, for floating rate securities, the rate at period end.
† At May 31, 2010, the aggregate cost of investment securities for federal income tax purposes was $938,583,187. Net unrealized depreciation aggregated $893,980, of which $52,059,678 related to appreciated investment securities and $52,953,658 related to depreciated investment securities.
See notes to financial statements
| 26 | Bond Fund | Annual report |
Financial statements
| Statement of assets and liabilities 5-31-10 |
This Statement of Assets and Liabilities is the Fund’s balance sheet. It shows the value of what the Fund owns, is due and owes. You’ll also find the net asset value and the maximum offering price per share.
| Assets | |
| Investments, at value (Cost $937,294,213) | $937,689,207 |
| Cash | 620 |
| Cash held at broker for futures contracts | 52,950 |
| Receivable for investments sold | 1,507,125 |
| Receivable for fund shares sold | 2,091,914 |
| Dividends and interest receivable | 12,543,520 |
| Receivable for securities lending income | 122 |
| Other receivables and prepaid assets | 107,046 |
| Total assets | 953,992,504 |
| Liabilities | |
| Payable for investments purchased | 3,506,328 |
| Payable for delayed delivery securities purchased | 33,231,541 |
| Payable for fund shares repurchased | 1,053,512 |
| Swap contracts, at value (Note 3) | 150,513 |
| Payable for futures variation margin (Note 3) | 47,500 |
| Distributions payable | 857,820 |
| Payable to affiliates | |
| Accounting and legal services fees | 14,361 |
| Transfer agent fees | 163,230 |
| Distribution and service fees | 33,440 |
| Trustees’ fees | 49,083 |
| Other liabilities and accrued expenses | 129,422 |
| Total liabilities | 39,236,750 |
| Net assets | |
| Capital paid-in | $935,632,552 |
| Undistributed net investment income | 1,925,648 |
| Accumulated net realized loss on investments, futures contracts, foreign | |
| currency transactions and swap contracts | (22,999,315) |
| Net unrealized appreciation (depreciation) on investments, futures | |
| contracts, translation of assets and liabilities in foreign currencies and | |
| swap contracts | 196,869 |
| Net assets | $914,755,754 |
| See notes to financial statements | Annual report | Bond Fund | 27 |
F I N A N C I A L S T A T E M E N T S
| Statement of assets and liabilities (continued) |
| Net asset value per share | |
| Based on net asset values and shares outstanding — the Fund has an | |
| unlimited number of shares authorized with no par value | |
| Class A ($819,230,588 ÷ 54,617,521 shares) | $15.00 |
| Class B ($24,937,860 ÷ 1,662,407 shares)1 | $15.00 |
| Class C ($40,267,522 ÷ 2,684,955 shares)1 | $15.00 |
| Class I ($30,319,784 ÷ 2,022,211 shares) | $14.99 |
| Maximum offering price per share | |
| Class A (net asset value per share ÷ 95.5%)2 | $15.71 |
1 Redemption price per share is equal to the net asset value less any applicable contingent deferred sales charge.
2 On single retail sales of less than $50,000. On sales of $50,000 or more and on group sales the offering price is reduced.
| See notes to financial statements | ||
| 28 | Bond Fund | Annual report | |
F I N A N C I A L S T A T E M E N T S
| Statement of operations For the year ended 5-31-10 |
This Statement of Operations summarizes the Fund’s investment income earned and expenses incurred in operating the Fund. It also shows net gains (losses) for the period stated.
| Investment income | |
| Interest | $65,547,963 |
| Dividends | 609,072 |
| Securities lending | 914 |
| Less foreign taxes withheld | (4,909) |
| Total investment income | 66,153,040 |
| Expenses | |
| Investment management fees (Note 5) | 4,265,780 |
| Distribution and service fees (Note 5) | 2,905,282 |
| Accounting and legal services fees (Note 5) | 149,109 |
| Transfer agent fees (Note 5) | 1,626,562 |
| Trustees’ fees (Note 5) | 66,990 |
| State registration fees | 64,084 |
| Printing and postage fees | 191,406 |
| Professional fees | 147,505 |
| Custodian fees | 38,258 |
| Registration and filing fees | 21,143 |
| Other | 38,135 |
| Total expenses | 9,514,254 |
| Less expense reductions (Note 5) | (102,362) |
| Net expenses | 9,411,892 |
| Net investment income | 56,741,148 |
| Realized and unrealized gain (loss) | |
| Net realized gain (loss) on | |
| Investments in unaffiliated issuers | 14,340,359 |
| Investments in affiliated issuers | 278 |
| Futures contracts (Note 3) | (322,000) |
| Swap contracts (Note 3) | 76,969 |
| Foreign currency transactions | 298,387 |
| 14,393,993 | |
| Change in net unrealized appreciation (depreciation) of | |
| Investments in unaffiliated issuers | 105,495,538 |
| Futures contracts (Note 3) | 303,462 |
| Swap contracts (Note 3) | 444,249 |
| Translation of assets and liabilities in foreign currencies | 4,636 |
| 106,247,885 | |
| Net realized and unrealized gain | 120,641,878 |
| Increase in net assets from operations | $177,383,026 |
| See notes to financial statements | ||
| Annual report | Bond Fund | 29 |
F I N A N C I A L S T A T E M E N T S
| Statements of changes in net assets |
These Statements of Changes in Net Assets show how the value of the Fund’s net assets has changed during the last two periods. The difference reflects earnings less expenses, any investment gains and losses, distributions, if any, paid to shareholders and the net of Fund share transactions.
| Year | Year | |
| ended | ended | |
| 5-31-10 | 5-31-09 | |
| Increase (decrease) in net assets | ||
| From operations | ||
| Net investment income | $56,741,148 | $52,778,739 |
| Net realized gain (loss) | 14,393,993 | (14,392,036) |
| Change in net unrealized appreciation (depreciation) | 106,247,885 | (71,838,760) |
| Increase (decrease) in net assets resulting from operations | 177,383,026 | (33,452,057) |
| Distributions to shareholders | ||
| From net investment income | ||
| Class A | (52,254,887) | (48,395,953) |
| Class B | (1,641,832) | (1,985,117) |
| Class C | (2,007,184) | (1,498,050) |
| Class I | (1,597,695) | (1,353,495) |
| Class R1 | (12,611) | (61,014) |
| Total distributions | (57,514,209) | (53,293,629) |
| From Fund share transactions (Note 6) | 35,308,269 | (71,142,760) |
| Total increase (decrease) | 155,177,086 | (157,888,446) |
| Net assets | ||
| Beginning of year | 759,578,668 | 917,467,114 |
| End of year | $914,755,754 | $759,578,668 |
| Undistributed net investment income | $1,925,648 | $930,912 |
| See notes to financial statements | ||
| 30 | Bond Fund | Annual report | |
Financial highlights
The Financial Highlights show how the Fund’s net asset value for a share has changed since the end of the previous period.
| CLASS A SHARES Period ended | 5-31-10 | 5-31-09 | 5-31-08 | 5-31-07 | 5-31-06 |
| Per share operating performance | |||||
| Net asset value, beginning of year | $12.96 | $14.31 | $14.75 | $14.51 | $15.30 |
| Net investment income1 | 0.97 | 0.87 | 0.81 | 0.75 | 0.68 |
| Net realized and unrealized gain (loss) on investments | 2.05 | (1.34) | (0.43) | 0.26 | (0.74) |
| Total from investment operations | 3.02 | (0.47) | 0.38 | 1.01 | (0.06) |
| Less distributions | |||||
| From net investment income | (0.98) | (0.88) | (0.82) | (0.77) | (0.72) |
| Return of capital | — | — | — | — | (0.01) |
| Total distributions | (0.98) | (0.88) | (0.82) | (0.77) | (0.73) |
| Net asset value, end of year | $15.00 | $12.96 | $14.31 | $14.75 | $14.51 |
| Total return (%)2 | 23.833 | (3.02) | 2.57 | 7.08 | (0.45)3 |
| Ratios and supplemental data | |||||
| Net assets, end of year (in millions) | $819 | $686 | $824 | $870 | $899 |
| Ratios (as a percentage of average net assets): | |||||
| Expenses before reductions | 1.08 | 1.164 | 1.05 | 1.05 | 1.08 |
| Expenses net of fee waivers | 1.08 | 1.164 | 1.05 | 1.05 | 1.07 |
| Expenses net of fee waivers and credits | 1.07 | 1.164 | 1.05 | 1.05 | 1.07 |
| Net investment income | 6.71 | 6.71 | 5.54 | 5.11 | 4.56 |
| Portfolio turnover (%) | 88 | 90 | 90 | 106 | 135 |
1 Based on the average daily shares outstanding.
2 Assumes dividend reinvestment (if applicable).
3 Total returns would have been lower had certain expenses not been reduced during the periods shown.
4 Includes the impact of proxy expenses, which amounted to 0.03% of average net assets.
| CLASS B SHARES Period ended | 5-31-10 | 5-31-09 | 5-31-08 | 5-31-07 | 5-31-06 |
| Per share operating performance | |||||
| Net asset value, beginning of year | $12.95 | $14.31 | $14.75 | $14.51 | $15.30 |
| Net investment income1 | 0.86 | 0.77 | 0.71 | 0.65 | 0.58 |
| Net realized and unrealized gain (loss) on investments | 2.07 | (1.34) | (0.43) | 0.26 | (0.74) |
| Total from investment operations | 2.93 | (0.57) | 0.28 | 0.91 | (0.16) |
| Less distributions | |||||
| From net investment income | (0.88) | (0.79) | (0.72) | (0.67) | (0.62) |
| Return of capital | — | — | — | — | (0.01) |
| Total distributions | (0.88) | (0.79) | (0.72) | (0.67) | (0.63) |
| Net asset value, end of year | $15.00 | $12.95 | $14.31 | $14.75 | $14.51 |
| Total return (%)2 | 23.053 | (3.77) | 1.863 | 6.33 | (1.14)3 |
| Ratios and supplemental data | |||||
| Net assets, end of year (in millions) | $25 | $28 | $42 | $59 | $87 |
| Ratios (as a percentage of average net assets): | |||||
| Expenses before reductions | 1.78 | 1.864 | 1.76 | 1.75 | 1.78 |
| Expenses net of fee waivers | 1.78 | 1.864 | 1.76 | 1.75 | 1.77 |
| Expenses net of fee waivers and credits | 1.77 | 1.864 | 1.75 | 1.75 | 1.77 |
| Net investment income | 6.01 | 5.96 | 4.82 | 4.40 | 3.84 |
| Portfolio turnover (%) | 88 | 90 | 90 | 106 | 135 |
1 Based on the average daily shares outstanding.
2 Assumes dividend reinvestment (if applicable).
3 Total returns would have been lower had certain expenses not been reduced during the periods shown.
4 Includes the impact of proxy expenses, which amounted to 0.03% of average net assets.
| See notes to financial statements | ||
| Annual report | Bond Fund | 31 |
| CLASS C SHARES Period ended | 5-31-10 | 5-31-09 | 5-31-08 | 5-31-07 | 5-31-06 |
| Per share operating performance | |||||
| Net asset value, beginning of year | $12.96 | $14.31 | $14.75 | $14.51 | $15.30 |
| Net investment income1 | 0.86 | 0.78 | 0.71 | 0.65 | 0.58 |
| Net realized and unrealized gain (loss) on investments | 2.06 | (1.34) | (0.43) | 0.26 | (0.74) |
| Total from investment operations | 2.92 | (0.56) | 0.28 | 0.91 | (0.16) |
| Less distributions | |||||
| From net investment income | (0.88) | (0.79) | (0.72) | (0.67) | (0.62) |
| Return of capital | — | — | — | — | (0.01) |
| Total distributions | (0.88) | (0.79) | (0.72) | (0.67) | (0.63) |
| Net asset value, end of year | $15.00 | $12.96 | $14.31 | $14.75 | $14.51 |
| Total return (%)2 | 22.983 | (3.70) | 1.86 | 6.33 | (1.14)3 |
| Ratios and supplemental data | |||||
| Net assets, end of year (in millions) | $40 | $26 | $29 | $23 | $24 |
| Ratios (as a percentage of average net assets): | |||||
| Expenses before reductions | 1.78 | 1.864 | 1.75 | 1.75 | 1.78 |
| Expenses net of fee waivers | 1.78 | 1.864 | 1.75 | 1.75 | 1.77 |
| Expenses net of fee waivers and credits | 1.77 | 1.864 | 1.75 | 1.75 | 1.77 |
| Net investment income | 5.98 | 6.02 | 4.86 | 4.41 | 3.86 |
| Portfolio turnover (%) | 88 | 90 | 90 | 106 | 135 |
1 Based on the average daily shares outstanding.
2 Assumes dividend reinvestment (if applicable).
3 Total returns would have been lower had certain expenses not been reduced during the periods shown.
4 Includes the impact of proxy expenses, which amounted to 0.03% of average net assets.
| CLASS I SHARES Period ended | 5-31-10 | 5-31-09 | 5-31-08 | 5-31-07 | 5-31-06 |
| Per share operating performance | |||||
| Net asset value, beginning of year | $12.96 | $14.31 | $14.74 | $14.51 | $15.30 |
| Net investment income1 | 1.03 | 0.93 | 0.88 | 0.81 | 0.75 |
| Net realized and unrealized gain (loss) on investments | 2.05 | (1.35) | (0.43) | 0.25 | (0.74) |
| Total from investment operations | 3.08 | (0.42) | 0.45 | 1.06 | 0.01 |
| Less distributions | |||||
| From net investment income | (1.05) | (0.93) | (0.88) | (0.83) | (0.79) |
| Return of capital | — | — | — | — | (0.01) |
| Total distributions | (1.05) | (0.93) | (0.88) | (0.83) | (0.80) |
| Net asset value, end of year | $14.99 | $12.96 | $14.31 | $14.74 | $14.51 |
| Total return (%)2 | 24.31 | (2.60) | 3.01 | 7.53 | (0.01) |
| Ratios and supplemental data | |||||
| Net assets, end of year (in millions) | $30 | $19 | $22 | $5 | $5 |
| Ratios (as a percentage of average net assets): | |||||
| Expenses before reductions | 0.63 | 0.703 | 0.62 | 0.62 | 0.64 |
| Expenses net of fee waivers | 0.63 | 0.703 | 0.62 | 0.62 | 0.64 |
| Expenses net of fee waivers and credits | 0.63 | 0.703 | 0.62 | 0.62 | 0.64 |
| Net investment income | 7.13 | 7.22 | 6.08 | 5.54 | 4.99 |
| Portfolio turnover (%) | 88 | 90 | 90 | 106 | 135 |
1 Based on the average daily shares outstanding.
2 Assumes dividend reinvestment (if applicable).
3 Includes the impact of proxy expenses, which amounted to 0.03% of average net assets.
| See notes to financial statements | ||
| 32 | Bond Fund | Annual report | |
Notes to financial statements
Note 1 — Organization
John Hancock Bond Fund (the Fund) is a diversified series of John Hancock Sovereign Bond Fund (the Trust), an open-end management investment company organized as a Massachusetts business trust and registered under the Investment Company Act of 1940, as amended (the 1940 Act). The investment objective of the Fund is to seek a high level of current income consistent with prudent investment risk.
The Fund may offer multiple classes of shares. The shares currently offered are detailed in the Statement of Assets and Liabilities. Class A, Class B and Class C shares are offered to all investors. Class I shares are offered to institutions and certain investors. Shareholders of each class have exclusive voting rights to matters that affect that class. The distribution and service fees and transfer agent fees for each class may differ. Class B shares convert to Class A shares eight years after purchase. Effective at the close of business on August 21, 2009, Class R1 shares converted into Class A shares.
Note 2 — Significant accounting policies
The financial statements have been prepared in conformity with accounting principles generally accepted in the United States of America, which require management to make certain estimates and assumptions at the date of the financial statements. Actual results could differ from those estimates. Events or transactions occurring after the end of the fiscal period through the date that the financial statements were issued have been evaluated in the preparation of the financial statements. The following summarizes the significant accounting policies of the Fund:
Security valuation. Investments are stated at value as of the close of regular trading on the New York Stock Exchange (NYSE), normally at 4:00 P.M., Eastern Time. The Fund uses a three-tier hierarchy to prioritize the pricing assumptions, referred to as inputs, used in valuation techniques to measure fair value. Level 1 includes quoted prices in active markets for identical securities. Level 2 includes significant observable inputs. Observable inputs may include quoted prices for similar securities, interest rates, prepayment speeds and credit risk. Prices for securities valued using these techniques are received from independent pricing vendors and brokers and are based on an evaluation of the inputs described. Level 3 includes significant unobservable inpu ts when market prices are not readily available or reliable, including the Fund’s own assumptions in determining the fair value of investments. The inputs or methodology used for valuing securities are not necessarily an indication of the risk associated with investing in those securities.
| Annual report | Bond Fund | 33 |
The following is a summary of the values by input classification of the Fund’s investments as of May 31, 2010, by major security category or type:
| LEVEL 2 | LEVEL 3 | |||
| TOTAL MARKET | SIGNIFICANT | SIGNIFICANT | ||
| VALUE AT | LEVEL 1 | OBSERVABLE | UNOBSERV- | |
| 5-31-10 | QUOTED PRICE | INPUTS | ABLE INPUTS | |
| Corporate Bonds | $533,305,811 | — | $532,791,561 | $514,250 |
| Convertible Bonds | 2,737,850 | — | 2,737,850 | — |
| U.S. Government & Agency | 164,207,236 | — | 164,207,236 | — |
| Obligations | ||||
| Term Loans | 2,172,043 | — | 2,172,043 | — |
| Collateralized Mortgage | 149,545,471 | — | 143,332,417 | 6,213,054 |
| Obligations | ||||
| Asset Backed Securities | 30,445,001 | — | 30,445,001 | — |
| Preferred Stocks | 5,736,795 | $4,016,295 | 1,720,500 | — |
| Short-Term Investments | 49,539,000 | — | 49,539,000 | — |
| Total investments in securities | $937,689,207 | $4,016,295 | $926,945,608 | $6,727,304 |
| Other financial instruments | ($197,366) | ($46,853) | ($150,513) | — |
| Totals | $937,491,841 | $3,969,442 | $926,795,095 | $6,727,304 |
The following is a reconciliation of Level 3 assets for which significant unobservable inputs were used to determine fair value:
| COLLATERALIZED | ASSET | |||
| MORTGAGE | CORPORATE | BACKED | ||
| OBLIGATIONS | BONDS | SECURITIES | TOTAL | |
| Balance as of 5-31-09 | $18,353,377 | $3,073,250 | $1,414,600 | $22,841,227 |
| Accrued discounts/premiums | — | — | — | — |
| Realized gain (loss) | 7,932,181 | — | — | 7,932,181 |
| Change in unrealized | 189,373 | 158,650 | — | 348,023 |
| appreciation (depreciation) | ||||
| Net purchases (sales) | (13,822,578) | — | — | (13,822,578) |
| Net transfers in and out of | (6,439,299) | (2,717,650) | (1,414,600) | (10,571,549) |
| Level 3 | ||||
| Balance as of 5-31-10 | $6,213,054 | $514,250 | — | $6,727,304 |
During the year ended May 31, 2010, there were no significant transfers in or out of Level 1 and Level 2 assets.
In order to value the securities, the Fund uses the following valuation techniques. Equity securities held by the Fund are valued at the last sale price or official closing price on the principal securities exchange on which they trade. In the event there were no sales during the day or closing prices are not available, then securities are valued using the last quoted bid or evaluated price. Debt obligations are valued based on the evaluated prices provided by an independent pricing service, which utilizes both dealer-supplied and electronic data processing techniques, taking into account factors such as institutional-size trading in similar groups of securities, yield, quality, coupon rate, maturity, type of issue, trading characteristics and other market data. Foreign securities and currencies are valued in U.S. dollars, based on foreign currency exchange rates supplied by an independent pricing service. Certain securities traded only in the over-the-coun ter market are valued at the last bid price quoted by brokers making markets in the securities at the close of trading. Certain short-term securities are valued at amortized cost. Other portfolio securities and assets, where market quotations are not readily available, are valued at fair value, as determined in good faith by the Fund’s Pricing Committee, following procedures established by the Board of Trustees.
| 34 | Bond Fund | Annual report |
Repurchase agreements. The Fund may enter into repurchase agreements. When a Fund enters into a repurchase agreement it receives collateral which is held in a segregated account by the Fund’s custodian. The collateral amount is marked-to-market and monitored on a daily basis to ensure that the collateral held is in an amount not less than the principal amount of the repurchase agreement plus any accrued interest. In the event of a default by the counterparty, realization of the collateral proceeds could be delayed, during which time the collateral value may decline.
When-issued/delayed delivery securities. The Fund may purchase or sell debt securities on a when-issued or delayed-delivery basis, or in a “To Be Announced” (TBA) or “forward commitment” transaction, with delivery or payment to occur at a later date beyond the normal settlement period. TBA securities resulting from these transactions are included in the Portfolio of Investments or in a schedule to the Portfolio of Investments (Schedule of Securities Sold Short). At the time that the Fund enters into a commitment to purchase or sell a security, the transaction is recorded and the value of the security is reflected in the Fund’s net asset value. The price of such security and the date that the security will be delivered and paid for are fixed at the time the transaction is negotiated. The value of the security may vary with market fluctuations. No interest accrues to the Fund until payment ta kes place. At the time that the Fund enters into this type of transaction, the Fund is required to have sufficient cash and/or liquid securities to cover its commitments.
Certain risks may arise upon entering into when-issued or delayed-delivery securities transactions, including the potential inability of counterparties to meet the terms of their contracts, and the issuer’s failure to issue the securities due to political, economic, or other factors. Additionally, losses may arise due to declines in the value of the securities prior to settlement date.
Security transactions and related investment income. Investment security transactions are accounted for on a trade date plus one basis for daily net asset value calculations. However, for financial reporting purposes, investment transactions are reported on trade date. Interest income is accrued as earned. Gains and losses on securities sold are determined on the basis of identified cost and may include proceeds from litigation. Dividend income is recorded on the ex-date except for certain foreign dividends where the ex-date may have passed, which are recorded when the Fund becomes aware of the dividends. Interest income includes coupon interest and amortization/ accretion of premiums/discounts on debt securities. Debt obligations may be placed in a non-accrual status and related interest income may be reduced by stopping current accruals and writing off interest receivables when the collection of all or a portion of interest has become doubtful.
Securities lending. A Fund may lend its securities to earn additional income. It receives and maintains cash collateral received from the borrower in an amount not less than the market value of the loaned securities. The Fund will invest its collateral in John Hancock Collateral Investment Trust (JHCIT), which has a floating net asset value (NAV) and invests in short-term investments as part of the securities lending program. As a result, the Fund will receive the benefit of any gains and bear any losses generated by JHCIT. Although risk of the loss of the securities lent is mitigated by holding the collateral, the Fund could experience a delay in recovering its securities and a possible loss of income or value if the borrower fails to return the securities or if collateral investments decline in value. The Fund may receive compensation for lending its securities by retaining a portion of the return on the investme nt of the collateral and compensation from fees earned from borrowers of the securities. Income received from JHCIT is a component of securities lending income as recorded on the Statement of Operations.
Stripped securities. Stripped mortgage backed securities are financial instruments that derive their value from other instruments so that one class receives the entire principal from the underlying mortgage assets (PO or principal only), while the other class receives the interest cash flows (IO or interest only). Both PO and IO investments represent an interest in the cash flows of an underlying
| Annual report | Bond Fund | 35 |
stripped mortgage backed security. If the underlying mortgage assets experience greater than anticipated prepayments of principal, the Fund may fail to fully receive its initial investment in an IO security. The market value of these securities can be extremely volatile in response to changes in interest rates. In addition, these securities present additional credit risk such that the Fund may not receive all or part of its principal because the counterparty or issuer has defaulted on its obligation.
Line of credit. The Fund may borrow from banks for temporary or emergency purposes, including meeting redemption requests that otherwise might require the untimely sale of securities. Pursuant to the custodian agreement, the custodian may loan money to a Fund to make properly authorized payments. The Fund is obligated to repay the custodian for any overdraft, including any related costs or expenses. The custodian has a lien, security interest or security entitlement in any Fund property that is not segregated, to the maximum extent permitted by law for any overdraft.
In addition, the Fund and other affiliated funds have entered into an agreement with the custodian which enables them to participate in a $100 million unsecured committed line of credit. Prior to March 31, 2010, the amount of the line of credit was $150 million. A commitment fee, payable at the end of each calendar quarter, based on the average daily unused portion of the line of credit, is charged to each participating fund on a pro rata basis based on their relative average net assets. For the year ended May 31, 2010, the Fund had no significant borrowings under the line of credit.
Expenses. The majority of expenses are directly attributable to an individual fund. Expenses that are not readily attributable to a specific fund are allocated among all funds in an equitable manner, taking into consideration, among other things, the nature and type of expense and the fund’s relative assets. Expense estimates are accrued in the period to which they relate and adjustments are made when actual amounts are known.
Class allocations. Income, common expenses, and realized and unrealized gains (losses) are determined at the Fund level and allocated daily to each class of shares based on the net asset value of the class. Class-specific expenses, such as distribution and service fees, if any, and transfer agent fees, for all classes are calculated daily at the class level based on the appropriate net asset value of each class and the specific expense rates applicable to each class.
Federal income taxes. The Fund intends to qualify as a regulated investment company by complying with the applicable provisions of the Internal Revenue Code and will not be subject to federal income tax on taxable income that is distributed to shareholders. Therefore, no federal income tax provision is required.
For federal income tax purposes, the Fund has a capital loss carryforward of $21,513,108 available to offset future net realized capital gains. The following table details the capital loss carryforward available as of May 31, 2010.
| CAPITAL LOSS CARRYFORWARD EXPIRING AT MAY 31 | |||||
| 2014 | 2015 | 2017 | 2018 | ||
| $505,866 | $19,095,572 | $939,453 | $972,217 | ||
As of May 31, 2010, the Fund had no uncertain tax positions that would require financial statement recognition, de-recognition or disclosure. The Fund’s federal tax return is subject to examination by the Internal Revenue Service for a period of three years.
Distribution of income and gains. Distributions to shareholders from net investment income and net realized gains, if any, are recorded on the ex-date. The Fund generally declares dividends daily and pays them monthly. Capital gain distributions, if any, are distributed annually. The tax character of distributions for the years ended May 31, 2010 and May 31, 2009 was as follows: ordinary income of $57,514,209 and $53,293,629, respectively.
| 36 | Bond Fund | Annual report |
Distributions paid by the Fund with respect to each class of shares are calculated in the same manner, at the same time and are in the same amount, except for the effect of expenses that may be applied differently to each class. As of May 31, 2010, the components of distributable earnings on a tax basis included $2,656,194 of undistributed ordinary income.
Such distributions and distributable earnings, on a tax basis, are determined in conformity with income tax regulations, which may differ from accounting principles generally accepted in the United States of America. Material distributions in excess of tax basis earnings and profits, if any, are reported in the Fund’s financial statements as a return of capital.
Capital accounts within financial statements are adjusted for permanent book/tax differences. These adjustments have no impact on net assets or the results of operations. Temporary book/ tax differences will reverse in a subsequent period. Permanent book/tax differences are primarily attributable to defaulted bonds and amortization and accretion on debt securities.
Note 3 — Derivative instruments
The Fund may invest in derivatives, including futures contracts and swap contracts, in order to meet its investment objective. The Fund may use derivatives to manage against anticipated changes in securities markets, currency or interest rates, maintain diversification and liquidity, access certain securities markets, enhance potential gains, or manage duration.
The use of derivatives may involve risks different from, or potentially greater than, the risks associated with investing directly in securities. Specifically, derivatives expose the Fund to the risk that the counterparty to an over-the-counter (OTC) derivatives contract will be unable or unwilling to make timely settlement payments or otherwise honor its obligations. OTC derivatives transactions typically can only be closed out with the other party to the transaction. If the counterparty defaults, the Fund will have contractual remedies, but there is no assurance that the counterparty will meet its contractual obligations or that the Fund will succeed in enforcing them.
For more information regarding the Fund’s use of derivatives, please refer to the Fund’s Prospectuses and Statement of Additional Information.
Futures. A futures contract is a contractual agreement to buy or sell a particular commodity, currency, or financial instrument at a pre-determined price in the future. Risks related to the use of futures contracts include possible illiquidity of the futures markets, contract prices that can be highly volatile and imperfectly correlated to movements in hedged security values and/or interest rates and potential losses in excess of the fund’s initial investment.
Futures contracts are valued at the quoted daily settlement prices established by the exchange on which they trade. Upon entering into a futures contract, the Fund is required to deposit initial margin with the broker in the form of cash or securities. The amount of required margin is generally based on a percentage of the contract value; this amount is the initial margin for the trade. The margin deposit must then be maintained at the established level over the life of the contract. Futures contracts are marked-to-market daily and an appropriate payable or receivable for the change in value (variation margin) is recorded by the Fund.
During the year ended May 31, 2010, the Fund used futures contracts to manage duration of the portfolio. The following table summarizes the contracts held at May 31, 2010. The range of futures contracts notional amounts held by the Fund during the year ended May 31, 2010 was approximately $21.7 million to $32.8 million.
| Annual report | Bond Fund | 37 |
| UNREALIZED | ||||||||||
| OPEN | NUMBER OF | APPRECIATION | ||||||||
| CONTRACTS | CONTRACTS | POSITION | EXPIRATION DATE | NOTIONAL VALUE | (DEPRECIATION) | |||||
| U.S. Treasury 30-Year | 50 | Long | Sep 2010 | $6,132,813 | ($94,282) | |||||
| Bond Futures | ||||||||||
| U.S. Treasury 5-Year | 136 | Short | Sep 2010 | (15,867,375) | 47,429 | |||||
| Note Futures | ||||||||||
| ($46,853) | ||||||||||
Swaps. The Fund may enter into interest rate, credit default, and other forms of swap agreements. Swap agreements are privately negotiated agreements between a Fund and counterparty to exchange cash flows, assets, foreign currencies or market-linked returns at specified intervals. Swaps are marked-to-market daily based upon values from third party vendors or broker quotations, and the change in value is recorded as unrealized appreciation/depreciation of swap contracts. The value of the swap will typically implicate collateral posting obligations by the party that is considered out-of-the-money on the swap.
Upfront payments made/received by the Fund are amortized/accreted for financial reporting purposes, with the unamortized/unaccreted portion included in the Statement of Assets and Liabilities. A termination payment by the counterparty or the Fund is recorded as realized gain or loss, as well as the net periodic payments received or paid by a Fund.
Entering into swap agreements involves, to varying degrees, elements of credit, market and documentation risk that may amount to values that are in excess of the amounts recognized on the Statement of Assets and Liabilities. Such risks involve the possibility that there will be no liquid market for the swap, that a counterparty may default on its obligation or delay payment under the swap terms. The counterparty may disagree or contest the terms of the swap. Market risks may also accompany the swap, including interest rate risk. The Fund may also suffer losses if it is unable to terminate or assign outstanding swaps or reduce its exposure through offsetting transactions.
Credit default swaps. Credit default swaps (CDS) involve the exchange of a fixed rate premium (paid by “the Buyer”), for protection against the loss in value of an underlying debt instrument, referenced entity or index, in the event of a defined credit event (such as payment default or bankruptcy). Under the terms of the swap, one party acts as a “guarantor” (the Seller), receiving the premium and agreeing to remedies that are specified within the credit default agreement. The Fund may enter into CDS in which it may act as either Buyer or Seller. By acting as the Seller, the Fund may incur economic leverage since it would be obligated to pay the Buyer the notional amount of the contract in the event of a default. The amount of loss in such case would be reduced by any recovery value on the underlying credit.
Implied credit spreads are utilized in determining the market value of CDS agreements in which the Fund is the Seller at period end. The implied credit spread generally represents the yield of the instrument above a credit-risk free rate, such as the U.S. Treasury Bond Yield, and may include upfront payments required to be made to enter into the agreement. It also serves as an indicator of the current status of the payment/performance risk and represents the likelihood or risk of default for the credit derivative. Wider credit spreads represent a deterioration of the referenced entity’s credit rating and an increased risk of default or other credit event occurring as defined under the terms of the agreement. The maximum potential amount of future payments (undiscounted) that the Fund as the Seller could be required to make under a CDS agreement would be an amount equal to the notional amount of the agreement.
| 38 | Bond Fund | Annual report |
During the year ended May 31, 2010, the Fund held CDS on certain securities to take a long position in the exposure to the reference credit and enhance potential gain. The following table summarizes the credit default swap contracts the Fund held as of May 31, 2010 where the Fund acted as a Seller of protection. During the year ended May 31, 2010, the Fund acted as Seller on credit default swap contracts with total notional values as represented below.
| NOTIONAL | PAY/ | |||||||||||||||
| IMPLIED | AMOUNT/ | RECEIVE | ||||||||||||||
| REFERENCE | CREDIT | EXPOSURE | FIXED | MATURITY | UNREALIZED | |||||||||||
| COUNTERPARTY | OBLIGATION | SPREAD | CURRENCY | PURCHASED | RATE | DATE | DEPRECIATION | VALUE | ||||||||
| Bank of America | The Goodyear | 3.19% | USD | 5,000,000 | 1.51% | Jun 2012 | ($150,513) | ($150,513) | ||||||||
| Tire & Rubber | ||||||||||||||||
| Company | ||||||||||||||||
Fair value of derivative instruments by risk category
The table below summarizes the fair value of derivatives held by the Fund at May 31, 2010, by risk category:
| FINANCIAL | ASSET | LIABILITY | ||||||
| STATEMENT OF ASSETS AND | INSTRUMENTS | DERIVATIVES | DERIVATIVES | |||||
| RISK | LIABILITIES LOCATION | LOCATION | FAIR VALUE | FAIR VALUE | ||||
| Credit contracts | Unrealized appreciation/ | Credit default | — | ($150,513) | ||||
| depreciation of swap | swaps | |||||||
| contracts | ||||||||
| Interest rate | Receivable/payable | Futures | $47,429 | (94,282) | ||||
| contracts | for futures | contracts† | ||||||
| Total | $47,429 | ($244,795) | ||||||
† Reflects cumulative appreciation/depreciation on futures as disclosed in Note 3. Only the year end variation margin is separately disclosed in the Statement of Assets and Liabilities.
Effect of derivative instruments on the Statement of Operations
The table below summarizes the net realized gain (loss) included in the net increase (decrease) in net assets from operations, classified by derivative instrument and risk category, for the year ended May 31, 2010:
| STATEMENT OF | ||||||||
| OPERATIONS | SWAP | |||||||
| RISK | LOCATION | FUTURES | CONTRACTS | TOTAL | ||||
| Credit contracts | Net realized gain | — | $76,969 | $76,969 | ||||
| (loss) on | ||||||||
| Interest rate | Net realized gain | ($322,000) | — | (322,000) | ||||
| contracts | (loss) on | |||||||
| Total | ($322,000) | $76,969 | ($245,031) | |||||
| Annual report | Bond Fund | 39 |
The table below summarizes the net change in unrealized appreciation (depreciation) included in the net increase (decrease) in net assets from operations, classified by derivative instrument and risk category, for the year ended May 31, 2010:
| STATEMENT OF | FUTURES | SWAP | ||||||
| RISK | OPERATIONS LOCATION | CONTRACTS | CONTRACTS | TOTAL | ||||
| Credit contracts | Change in unrealized | — | $444,249 | $444,249 | ||||
| appreciation | ||||||||
| (depreciation) of | ||||||||
| Interest rate contracts | Change in unrealized | $303,462 | — | 303,462 | ||||
| appreciation | ||||||||
| (depreciation) of | ||||||||
| Total | $303,462 | $444,249 | $747,711 | |||||
Note 4 — Guarantees and indemnifications
Under the Fund’s organizational documents, its Officers and Trustees are indemnified against certain liabilities arising out of the performance of their duties to the Fund. Additionally, in the normal course of business, the Fund enters into contracts with service providers that contain general indemnification clauses. The Fund’s maximum exposure under these arrangements is unknown, as this would involve future claims that may be made against the Fund that have not yet occurred. The risk of material loss from such claims is considered remote.
Note 5 — Fees and transactions with affiliates
John Hancock Advisers, LLC (the Adviser) serves as investment adviser for the Fund. John Hancock Funds, LLC (the Distributor), an affiliate of the Adviser, serves as principal underwriter of the Fund. The Adviser and the Distributor are indirect wholly owned subsidiaries of Manulife Financial Corporation (MFC).
Management fee. The Fund has an investment management contract with the Adviser under which the Fund pays a daily management fee to the Adviser equivalent, on an annual basis, to the sum of: (a) 0.50% of the first $1,500,000,000 of the Fund’s average daily net assets, (b) 0.45% of the next $500,000,000 of the Fund’s average daily net assets, (c) 0.40% of the next $500,000,000 of the Fund’s average daily net assets and (d) 0.35% of the Fund’s average daily net assets in excess of $2,500,000,000. Prior to July 1, 2009, the Fund paid this fee monthly. The Adviser has a subadvisory agreement with MFC Global Investment Management (U.S.), LLC, an indirect owned subsidiary of MFC and an affiliate of the Adviser. The Fund is not responsible for payment of the subadvisory fees. The investment management fees incurred for the year ended May 31, 2010 were equivalent to an annual effective rate of 0.50% of the Fund’s average daily net assets.
The Adviser voluntarily waived certain other expenses. Accordingly, these expense reductions amounted to $8,011, $270 and $343 for Class A, Class B and Class C shares, respectively, for the year ended May 31, 2010.
Accounting and legal services. Pursuant to the Service Agreement, the Fund reimburses the Adviser for all expenses associated with providing the administrative, financial, legal, accounting and recordkeeping services of the Fund, including the preparation of all tax returns, periodic reports to shareholders and regulatory reports among other services. These expenses are allocated to each share class based on its relative net assets at the time the expense was incurred. The accounting and legal services fees incurred for the year ended May 31, 2010 amounted to an annual rate of 0.02% of the Fund’s average daily net assets.
| 40 | Bond Fund | Annual report |
Distribution and service plans. The Fund has a distribution agreement with the Distributor. The Fund has adopted distribution and service plans with respect to Class A, Class B, Class C and Class R1 shares pursuant to Rule 12b-1 under the 1940 Act, to pay the Distributor for services provided as the distributor of shares of the Fund. In addition, under a service plan for Class R1 shares, the Fund paid for certain other services. The following table shows the contractual rates of distribution and service fees under these arrangements, expressed as an annual percentage of average daily net assets for each class of the Fund’s shares.
| Class | 12b-1 Fee | Service Fee | ||
| Class A | 0.30% | — | ||
| Class B | 1.00% | — | ||
| Class C | 1.00% | — | ||
| Class R1 | 0.50% | 0.25% | ||
Sales charges. Class A shares are assessed up-front sales charges, which resulted in payments to the Distributor amounting to $677,876 for the year ended May 31, 2010. Of this amount, $79,717 was retained and used for printing prospectuses, advertising, sales literature and other purposes, $451,508 was paid as sales commissions to broker-dealers and $146,651 was paid as sales commissions to sales personnel of Signator Investors, Inc. (Signator Investors), a broker-dealer affiliate of the Adviser.
Class B and Class C shares are subject to contingent deferred sales charges (CDSC). Class B shares that are redeemed within six years of purchase are subject to CDSC, at declining rates, beginning at 5.00% of the lesser of the current market value at the time of redemption or the original purchase cost of the shares being redeemed. Class C shares that are redeemed within one year of purchase are subject to a 1.00% CDSC on the lesser of the current market value at the time of redemption or the original purchase cost of the shares being redeemed. Proceeds from CDSCs are used to compensate the Distributor for providing distribution-related services in connection with the sale of these shares. During the year ended May 31, 2010, CDSCs received by the Distributor amounted to $32,098 and $4,500 for Class B and Class C shares, respectively.
Transfer agent fees. The Fund has a transfer agent agreement with John Hancock Signature Services, Inc. (Signature Services or Transfer Agent), an affiliate of the Adviser. The transfer agent fees are made up of three components:
• The Fund pays a monthly transfer agent fee at an annual rate of 0.015% for all classes, based on each class’s average daily net assets.
• The Fund pays a monthly fee based on an annual rate of $17.50 per shareholder account for all classes.
• In addition, Signature Services is reimbursed for certain out-of-pocket expenses.
Effective July 1, 2010, the transfer agent fees paid to Signature Services are determined based on the cost to Signature Services (Signature Services Cost). The Signature Services Cost is comprised of a component of allocated John Hancock corporate overhead for providing transfer agent services to the Fund and to all other John Hancock affiliated funds. It also includes out-of-pocket expenses that are comprised of payments made to third-parties for services provided to their clients who in invest in one or more John Hancock Funds. Signature Services Cost is calculated monthly and allocated to four categories of share classes: Institutional Share Classes, Retirement Shares Classes, Municipal Bond Classes and all other Retail Shares Classes. Within each of these categories, Signature Services Cost is allocated to the affected John Hancock affiliated funds and/or classes, based on the relative average daily net assets.
| Annual report | Bond Fund | 41 |
Certain investor accounts that maintain small balances are charged an annual small accounts fee by Signature Services. The amounts related to these fees are credited by Signature Services to the Fund. For the year ended May 31, 2010, these fees amounted to $86,845, $3,300 and $3,593 for Class A, Class B and Class C shares, respectively.
Class level expenses for the year ended May 31, 2010 were:
| Distribution and | Transfer | |||
| Class | service fees | agent fees | ||
| Class A | $2,304,858 | $1,498,339 | ||
| Class B | 268,108 | 55,348 | ||
| Class C | 330,916 | 61,466 | ||
| Class I | — | 11,101 | ||
| Class R1 | 1,400 | 308 | ||
| Total | $2,905,282 | $1,626,562 | ||
Trustees expenses. The Trust compensates each Trustee who is not an employee of the Adviser or its affiliates. These Trustees may, for tax purposes, elect to defer receipt of this compensation under the John Hancock Group of Funds Deferred Compensation Plan (the Plan). Deferred amounts are invested in various John Hancock funds and remain in the funds until distributed in accordance with the Plan. The investment of deferred amounts and the offsetting liability are included in the accompanying Statement of Assets and Liabilities.
Note 6 — Fund share transactions
Transactions in Fund shares for the years ended May 31, 2010 and 2009 were as follows:
| Year ended 5-31-10 | Year ended 5-31-09 | |||
| Shares | Amount | Shares | Amount | |
| Class A shares | ||||
| Sold | 5,473,098 | $79,676,983 | 4,592,147 | $57,927,810 |
| Exchanged from Class R1 | 14,796 | 205,314 | — | — |
| Distributions reinvested | 2,963,598 | 42,915,466 | 3,152,395 | 40,387,978 |
| Repurchased | (6,750,531) | (97,368,056) | (12,432,711) | (158,640,619) |
| Net increase (decrease) | 1,700,961 | $25,429,707 | (4,688,169) | ($60,324,831) |
| Class B shares | ||||
| Sold | 550,876 | $7,958,822 | 352,053 | $4,503,181 |
| Distributions reinvested | 81,377 | 1,175,109 | 115,841 | 1,486,548 |
| Repurchased | (1,126,474) | (16,213,145) | (1,224,799) | (15,707,024) |
| Net decrease | (494,221) | ($7,079,214) | (756,905) | ($9,717,295) |
| Class C shares | ||||
| Sold | 1,098,013 | $15,949,073 | 611,213 | $7,703,800 |
| Distributions reinvested | 77,009 | 1,118,509 | 86,209 | 1,103,254 |
| Repurchased | (522,380) | (7,578,893) | (693,368) | (9,067,496) |
| Net increase (decrease) | 652,642 | $9,488,689 | 4,054 | ($260,442) |
| Class I shares | ||||
| Sold | 1,115,153 | $16,434,028 | 1,848,899 | $22,570,485 |
| Distributions reinvested | 47,762 | 691,805 | 89,810 | 1,152,040 |
| Repurchased | (601,483) | (8,775,707) | (1,984,466) | (24,433,546) |
| Net increase (decrease) | 561,432 | $8,350,126 | (45,757) | ($711,021) |
| 42 | Bond Fund | Annual report |
| Year ended 5-31-10 | Year ended 5-31-09 | |||
| Shares | Amount | Shares | Amount | |
| Class R1 shares | ||||
| Sold | 7,840 | $105,554 | 35,396 | $467,732 |
| Exchanged for Class A | (14,793) | (205,314) | — | — |
| Distributions reinvested | 120 | 1,617 | 4,742 | 60,931 |
| Repurchased | (56,536) | (782,896) | (50,342) | (657,834) |
| Net decrease | (63,369) | ($881,039) | (10,204) | ($129,171) |
| Net increase (decrease) | 2,357,445 | $35,308,269 | (5,496,981) | ($71,142,760) |
Note 7 — Purchase and sale of securities
Purchases and sales of securities, other than short-term securities and U.S. Treasury obligations, aggregated $659,283,624 and $663,916,448, respectively, for the year ended May 31, 2010. Purchases and sales of U.S. Treasury obligations aggregated $113,542,458 and $63,475,324, respectively, for the year ended May 31, 2010.
| Annual report | Bond Fund | 43 |
Auditors’ report
Report of Independent Registered Public Accounting Firm
To the Board of Trustees of John Hancock Sovereign Bond Fund and Shareholders of
John Hancock Bond Fund:
In our opinion, the accompanying statement of assets and liabilities, including the schedule of investments, and the related statements of operations and of changes in net assets and the financial highlights present fairly, in all material respects, the financial position of John Hancock Bond Fund (the “Fund”) at May 31, 2010, and the results of its operations, the changes in its net assets and the financial highlights for each of the periods indicated, in conformity with accounting principles generally accepted in the United States of America. These financial statements and financial highlights (hereafter referred to as “financial statements”) are the responsibility of the Fund’s management; our responsibility is to express an opinion on these financial statements based on our audits. We conducted our audits of these financial statements in accordance with the standards of the Public Company Accounting Oversight Board (United State s). Those standards require that we plan and perform the audits to obtain reasonable assurance about whether the financial statements are free of material misstatement. An audit includes examining, on a test basis, evidence supporting the amounts and disclosures in the financial statements, assessing the accounting principles used and significant estimates made by management, and evaluating the overall financial statement presentation. We believe that our audits, which included confirmation of securities at May 31, 2010 by correspondence with the custodian and brokers, and the application of alternative auditing procedures where securities purchased confirmations had not been received, provide a reasonable basis for our opinion.
PricewaterhouseCoopers LLP
Boston, Massachusetts
July 21, 2010
| 44 | Bond Fund | Annual report |
Tax information
Unaudited
For federal income tax purposes, the following information is furnished with respect to the distributions of the Fund, if any, paid during its taxable period ended May 31, 2010.
The Fund hereby designates the maximum amount allowable of its net taxable income as qualified dividend income as provided in the Jobs and Growth Tax Relief Reconciliation Act of 2003. This amount will be reflected on Form 1099-DIV for the calendar year 2010.
Shareholders will be mailed a 2010 Form 1099-DIV in January 2011. This will reflect the total of all distributions that are taxable for calendar year 2010.
| Annual report | Bond Fund | 45 |
Trustees and Officers
This chart provides information about the Trustees and Officers who oversee your John Hancock fund. Officers elected by the Trustees manage the day-to-day operations of the Fund and execute policies formulated by the Trustees.
| Independent Trustees | ||
| Name, Year of Birth | Trustee | Number of John |
| Position(s) held with Fund | of the | Hancock funds |
| Principal occupation(s) and other | Trust | overseen by |
| directorships during past 5 years | since1 | Trustee |
| Patti McGill Peterson, Born: 1943 | 2006 | 47 |
| Chairperson (since December 2008); Principal, PMP Globalinc (consulting) (since 2007); Senior | ||
| Associate, Institute for Higher Education Policy (since 2007); Executive Director, CIES (international | ||
| education agency) (until 2007); Vice President, Institute of International Education (until 2007); Senior | ||
| Fellow, Cornell University Institute of Public Affairs, Cornell University (1997–1998); Former President | ||
| Wells College, St. Lawrence University and the Association of Colleges and Universities of the State | ||
| of New York. Director of the following: Niagara Mohawk Power Corporation (until 2003); Security | ||
| Mutual Life (insurance) (until 1997); ONBANK (until 1993). Trustee of the following: Board of Visitors, | ||
| The University of Wisconsin, Madison (since 2007); Ford Foundation, International Fellowships Program | ||
| (until 2007); UNCF, International Development Partnerships (until 2005); Roth Endowment (since 2002); | ||
| Council for International Educational Exchange (since 2003). | ||
| James F. Carlin, Born: 1940 | 2006 | 47 |
| Chief Executive Officer, Director and Treasurer, Alpha Analytical Laboratories (environmental, | ||
| chemical and pharmaceutical analysis) (since 1985); Part Owner and Treasurer, Lawrence Carlin | ||
| Insurance Agency, Inc. (since 1995); Chairman and Chief Executive Officer, Carlin Consolidated, Inc. | ||
| (management/investments) (since 1987). | ||
| William H. Cunningham, Born: 1944 | 2006 | 47 |
| Professor, University of Texas, Austin, Texas (since 1971); former Chancellor, University of Texas System | ||
| and former President of the University of Texas, Austin, Texas; Director of the following: LIN Television | ||
| (since 2009); Lincoln National Corporation (insurance) (Chairman since 2009 and Director since 2006); | ||
| Resolute Energy Corporation (since 2009); Nanomedical Systems, Inc. (biotechnology company) | ||
| (Chairman since 2008); Yorktown Technologies, LP (tropical fish) (Chairman since 2007); Greater Austin | ||
| Crime Commission (since 2001); Southwest Airlines (since 2000); former Director of the following: | ||
| Introgen (manufacturer of biopharmaceuticals) (until 2008); Hicks Acquisition Company I, Inc. (until | ||
| 2007); Jefferson-Pilot Corporation (diversified life insurance company) (until 2006); and former Advisory | ||
| Director, JP Morgan Chase Bank (formerly Texas Commerce Bank–Austin) (until 2009). | ||
| Deborah C. Jackson,2 Born: 1952 | 2008 | 47 |
| Chief Executive Officer, American Red Cross of Massachusetts Bay (since 2002); Board of Directors | ||
| of Eastern Bank Corporation (since 2001); Board of Directors of Eastern Bank Charitable Foundation | ||
| (since 2001); Board of Directors of American Student Association Corp. (since 1996); Board of Directors | ||
| of Boston Stock Exchange (2002–2008); Board of Directors of Harvard Pilgrim Healthcare (health | ||
| benefits company) (since 2007). | ||
| 46 | Bond Fund | Annual report |
| Independent Trustees (continued) | ||
| Name, Year of Birth | Trustee | Number of John |
| Position(s) held with Fund | of the | Hancock funds |
| Principal occupation(s) and other | Trust | overseen by |
| directorships during past 5 years | since1 | Trustee |
| Charles L. Ladner, Born: 1938 | 2006 | 47 |
| Chairman and Trustee, Dunwoody Village, Inc. (retirement services) (since 2008); Director, Philadelphia | ||
| Archdiocesan Educational Fund (since 2009); Senior Vice President and Chief Financial Officer, UGI | ||
| Corporation (public utility holding company) (retired 1998); Vice President and Director for AmeriGas, | ||
| Inc. (retired 1998); Director of AmeriGas Partners, L.P. (gas distribution) (until 1997); Director, | ||
| EnergyNorth, Inc. (until 1995); Director, Parks and History Association (Cooperating Association, | ||
| National Park Service) (until 2005). | ||
| Stanley Martin,2 Born: 1947 | 2008 | 47 |
| Senior Vice President/Audit Executive, Federal Home Loan Mortgage Corporation (2004–2006); | ||
| Executive Vice President/Consultant, HSBC Bank USA (2000–2003); Chief Financial Officer/Executive | ||
| Vice President, Republic New York Corporation & Republic National Bank of New York (1998–2000); | ||
| Partner, KPMG LLP (1971–1998). | ||
| Dr. John A. Moore, Born: 1939 | 2006 | 47 |
| President and Chief Executive Officer, Institute for Evaluating Health Risks, (nonprofit institution) | ||
| (until 2001); Senior Scientist, Sciences International (health research) (until 2003); Former | ||
| Assistant Administrator & Deputy Administrator, Environmental Protection Agency; Principal, | ||
| Hollyhouse (consulting) (since 2000); Director, CIIT Center for Health Science Research (nonprofit | ||
| research) (until 2007). | ||
| Steven R. Pruchansky,2 Born: 1944 | 2006 | 47 |
| Chairman and Chief Executive Officer, Greenscapes of Southwest Florida, Inc. (since 2000); Director | ||
| and President, Greenscapes of Southwest Florida, Inc. (until 2000); Member, Board of Advisors, First | ||
| American Bank (since 2008); Managing Director, Jon James, LLC (real estate) (since 2000); Director, | ||
| First Signature Bank & Trust Company (until 1991); Director, Mast Realty Trust (until 1994); President, | ||
| Maxwell Building Corp. (until 1991). | ||
| Gregory A. Russo, Born: 1949 | 2008 | 47 |
| Vice Chairman, Risk & Regulatory Matters, KPMG LLP (“KPMG”) (2002–2006); Vice Chairman, Industrial | ||
| Markets, KPMG (1998–2002). | ||
| Non-Independent Trustees3 | ||
| Name, Year of Birth | Trustee | Number of John |
| Position(s) held with Fund | of the | Hancock funds |
| Principal occupation(s) and other | Trust | overseen by |
| directorships during past 5 years | since1 | Trustee |
| James R. Boyle, Born: 1959 | 2005 | 244 |
| Senior Executive Vice President, U.S. Division, Manulife Financial Corporation (since 2009), Executive | ||
| Vice President (1999–2009); President, John Hancock Financial Services; Chairman and Director, | ||
| John Hancock Advisers, LLC and John Hancock Funds, LLC (2005–2010) and Chairman and Director, | ||
| John Hancock Investment Management Services, LLC (2006–2010); Trustee of John Hancock Trust | ||
| (since 2005), John Hancock Funds II (since 2005), and the John Hancock retail funds (since 2005). | ||
| Annual report | Bond Fund | 47 |
| Non-Independent Trustees3 (continued) | ||
| Name, Year of Birth | Trustee | Number of John |
| Position(s) held with Fund | of the | Hancock funds |
| Principal occupation(s) and other | Trust | overseen by |
| directorships during past 5 years | since1 | Trustee |
| John G. Vrysen, Born: 1955 | 2009 | 47 |
| Senior Vice President, Strategic Initiatives, Manulife Financial Corporation (since 2006), Vice | ||
| President (until 2006), Manulife Financial Corporation; Director, Executive Vice President and Chief | ||
| Operating Officer, John Hancock Advisers, LLC, John Hancock Investment Management Services, | ||
| LLC and John Hancock Funds, LLC (since 2005, including other positions); Chief Operating Officer, | ||
| John Hancock Funds II and John Hancock Trust (since 2007); Chief Operating Officer, John Hancock | ||
| retail funds (2007–2009). | ||
| Principal officers who are not Trustees | ||
| Name, Year of Birth | Officer | |
| Position(s) held with Fund | of the | |
| Principal occupation(s) and other | Trust | |
| directorships during past 5 years | since | |
| Keith F. Hartstein, Born: 1956 | 2005 | |
| President and Chief Executive Officer | ||
| Senior Vice President, Manulife Financial Corporation (since 2004); Director, President and Chief | ||
| Executive Officer, John Hancock Advisers, LLC and John Hancock Funds, LLC (since 2005); Director, | ||
| MFC Global Investment Management (U.S.), LLC (since 2005); Director, John Hancock Investment | ||
| Management Services, LLC (since 2006); Director, Chairman and President and Chief Executive Officer, | ||
| John Hancock retail funds (since 2005); President, NM Capital Management, Inc. (since 2005); Member | ||
| and former Chairman, Investment Company Institute Sales Force Marketing Committee (since 2003). | ||
| Andrew G. Arnott, Born: 1971 | 2009 | |
| Chief Operating Officer | ||
| Senior Vice President, Manulife Financial Corporation (since 2009); Executive Vice President, | ||
| John Hancock Advisers, LLC (since 2005, including prior positions); Executive Vice President, | ||
| John Hancock Investment Management Services, LLC (since 2006, including prior positions); Executive | ||
| Vice President, John Hancock Funds, LLC (since 2004, including prior positions); Chief Operating Officer, | ||
| John Hancock retail funds (since 2009) and Vice President (2007–2009); Vice President, John Hancock | ||
| Funds II and John Hancock Trust (since 2006); Senior Vice President, Product Management and | ||
| Development for John Hancock Funds, LLC (2005–2009); Vice President and Director, Marketing and | ||
| Product Management, John Hancock Funds, LLC (1998–2005). | ||
| Thomas M. Kinzler, Born: 1955 | 2006 | |
| Secretary and Chief Legal Officer | ||
| Secretary and Chief Legal Officer, John Hancock retail funds, John Hancock Funds II, and John Hancock | ||
| Trust (since 2006); Secretary and Chief Legal Counsel, John Hancock Advisers, LLC, John Hancock | ||
| Investment Management Services, LLC and John Hancock Funds, LLC (since 2007, including prior | ||
| positions); Vice President and Associate General Counsel, Massachusetts Mutual Life Insurance | ||
| Company (1999–2006); Secretary and Chief Legal Counsel, MML Series Investment Fund | ||
| (2000–2006); Secretary and Chief Legal Counsel, MassMutual Select Funds and MassMutual Premier | ||
| Funds (2004–2006). | ||
| 48 | Bond Fund | Annual report |
| Principal officers who are not Trustees (continued) | |
| Name, Year of Birth | Officer |
| Position(s) held with Fund | of the |
| Principal occupation(s) and other | Trust |
| directorships during past 5 years | since |
| Francis V. Knox, Jr., Born: 1947 | 2005 |
| Chief Compliance Officer | |
| Chief Compliance Officer (since 2008), Vice President and Chief Compliance Officer (2005–2008), | |
| John Hancock retail funds, John Hancock Funds II, and John Hancock Trust; Chief Compliance Officer, | |
| John Hancock Advisers, LLC and John Hancock Investment Management Services, LLC (since 2008); | |
| Vice President and Chief Compliance Officer, John Hancock Advisers, LLC, John Hancock Investment | |
| Management Services, LLC and MFC Global Investment Management (U.S.), LLC (2005–2008). | |
| Charles A. Rizzo, Born: 1957 | 2007 |
| Chief Financial Officer | |
| Senior Vice President, John Hancock Advisers, LLC and John Hancock Investment Management | |
| Services, LLC (since 2008); Chief Financial Officer, John Hancock retail funds, John Hancock Funds II and | |
| John Hancock Trust (since 2007); Assistant Treasurer, Goldman Sachs Mutual Fund Complex (registered | |
| investment companies) (2005–2007); Vice President, Goldman Sachs (2005–2007); Managing Director | |
| and Treasurer of Scudder Funds, Deutsche Asset Management (2003–2005). | |
| Michael J. Leary, Born: 1965 | 2007 |
| Treasurer | |
| Treasurer for John Hancock retail funds, John Hancock Funds II and John Hancock Trust (since 2009); | |
| Vice President, John Hancock Advisers, LLC and John Hancock Investment Management Services, LLC | |
| (since 2007); Assistant Treasurer, John Hancock retail funds, John Hancock Funds II and John Hancock | |
| Trust (2007–2009); Vice President and Director of Fund Administration, JP Morgan (2004–2007). | |
The business address for all Trustees and Officers is 601 Congress Street, Boston, Massachusetts 02210-2805.
The Statement of Additional Information of the Fund includes additional information about members of the Board of Trustees of the Fund and is available without charge, upon request, by calling 1-800-225-5291 or by visiting our Web site www.jhfunds.com.
1 Each Trustee serves until resignation, retirement age or until his or her successor is elected.
2 Member of Audit Committee.
3 Non-Independent Trustees hold positions with the Fund’s investment adviser, underwriter and certain other affiliates.
| Annual report | Bond Fund | 49 |
More information
| Trustees | Investment adviser | |
| Patti McGill Peterson, Chairperson | John Hancock Advisers, LLC | |
| James R. Boyle† | ||
| James F. Carlin | Subadviser | |
| William H. Cunningham | MFC Global Investment | |
| Deborah C. Jackson* | Management (U.S.), LLC | |
| Charles L. Ladner | ||
| Stanley Martin* | Principal distributor | |
| Dr. John A. Moore | John Hancock Funds, LLC | |
| Steven R. Pruchansky* | ||
| Gregory A. Russo | Custodian | |
| John G. Vrysen† | State Street Bank and Trust Company | |
| Officers | Transfer agent | |
| Keith F. Hartstein | John Hancock Signature Services, Inc. | |
| President and Chief Executive Officer | ||
| Legal counsel | ||
| Andrew G. Arnott | K&L Gates LLP | |
| Chief Operating Officer | ||
| Independent registered | ||
| Thomas M. Kinzler | public accounting firm | |
| Secretary and Chief Legal Officer | PricewaterhouseCoopers LLP | |
| Francis V. Knox, Jr. | The report is certified under the Sarbanes-Oxley | |
| Chief Compliance Officer | Act, which requires mutual funds and other public | |
| companies to affirm that, to the best of their | ||
| Charles A. Rizzo | knowledge, the information in their financial reports | |
| Chief Financial Officer | is fairly and accurately stated in all material respects. | |
| Michael J. Leary | ||
| Treasurer | ||
| *Member of the Audit Committee | ||
| †Non-Independent Trustee | ||
The Fund’s proxy voting policies and procedures, as well as the Fund’s proxy voting record for the most recent twelve-month period ended June 30, are available free of charge on the Securities and Exchange Commission (SEC) Web site at www.sec.gov or on our Web site.
The Fund’s complete list of portfolio holdings, for the first and third fiscal quarters, is filed with the SEC on Form N-Q. The Fund’s Form N-Q is available on our Web site and the SEC’s Web site, www.sec.gov, and can be reviewed and copied (for a fee) at the SEC’s Public Reference Room in Washington, DC. Call 1-800-SEC-0330 to receive information on the operation of the SEC’s Public Reference Room.
We make this information on your fund, as well as monthly portfolio holdings, and other fund details available on our Web site www.jhfunds.com or by calling 1-800-225-5291.
| You can also contact us: | ||
| 1-800-225-5291 | Regular mail: | Express mail: |
| jhfunds.com | John Hancock Signature Services, Inc. | John Hancock Signature Services, Inc. |
| P.O. Box 55913 | Mutual Fund Image Operations | |
| Boston, MA 02205-5913 | 30 Dan Road | |
| Canton, MA 02021 |
| 50 | Bond Fund | Annual report |

1-800-225-5291
1-800-554-6713 TDD
1-800-338-8080 EASI-Line
www.jhfunds.com
Now available: electronic delivery
www.jhfunds.com/edelivery
| This report is for the information of the shareholders of John Hancock Bond Fund. | 2100A 5/10 |
| It is not authorized for distribution to prospective investors unless preceded or accompanied by a prospectus. | 7/10 |
ITEM 2. CODE OF ETHICS.
As of the end of the period, May 31, 2010, the registrant has adopted a code of ethics, as defined in Item 2 of Form N-CSR, that applies to its Chief Executive Officer, Chief Financial Officer and Treasurer (respectively, the principal executive officer, the principal financial officer and the principal accounting officer, the “Senior Financial Officers”). A copy of the code of ethics is filed as an exhibit to this Form N-CSR.
ITEM 3. AUDIT COMMITTEE FINANCIAL EXPERT.
Stanley Martin is the audit committee financial expert and is “independent”, pursuant to general instructions on Form N-CSR Item 3.
ITEM 4. PRINCIPAL ACCOUNTANT FEES AND SERVICES.
(a) Audit Fees
The aggregate fees billed for professional services rendered by the principal accountant(s) for the audit of the registrant’s annual financial statements or services that are normally provided by the accountant(s) in connection with statutory and regulatory filings or engagements amounted to $37,583 for the fiscal year ended May 31, 2010 and $42,585 for the fiscal year ended May 31, 2009. These fees were billed to the registrant and were approved by the registrant’s audit committee.
(b) Audit-Related Services
Audit-related services fees amounted to $1,184 for the fiscal year ended May 31, 2010 and there were no audit-related fees during the fiscal year ended May 31, 2009 billed to the registrant or to the registrant's investment adviser (not including any sub-adviser whose role is primarily portfolio management and is subcontracted with or overseen by another investment adviser), and any entity controlling, controlled by, or under common control with the adviser that provides ongoing services to the registrant ("control affiliates").
(c) Tax Fees
The aggregate fees billed for professional services rendered by the principal accountant(s) for the tax compliance, tax advice and tax planning (“tax fees”) amounted to $2,642 for the fiscal year ended May 31, 2010 and $3,966 for the fiscal year ended May 31, 2009. The nature of the services comprising the tax fees was the review of the registrant’s income tax returns and tax distribution requirements. These fees were billed to the registrant and were approved by the registrant’s audit committee. There were no tax fees billed to the control affiliates.
(d) All Other Fees
All other fees amounted to $75 for the fiscal year ended May 31, 2010 and there were no other fees during the fiscal year ended May 31, 2009 billed to the registrant or to the control affiliates.
(e)(1) Audit Committee Pre-Approval Policies and Procedures:
The trust’s Audit Committee must pre-approve all audit and non-audit services provided by the independent registered public accounting firm (the “Auditor”) relating to the operations or financial reporting of the funds. Prior to the commencement of any audit or non-audit services to a fund, the Audit Committee reviews the services to determine whether they are appropriate and permissible under applicable law.
The trust’s Audit Committee has adopted policies and procedures to, among other purposes, provide a framework for the Committee’s consideration of audit-related and non-audit services by the Auditor. The policies and procedures require that any audit-related and non-audit service provided by the Auditor and any non-audit service provided by the Auditor to a fund service
provider that relates directly to the operations and financial reporting of a fund are subject to approval by the Audit Committee before such service is provided. Audit-related services provided by the Auditor that are expected to exceed $25,000 per instance/per fund are subject to specific pre-approval by the Audit Committee. Tax services provided by the Auditor that are expected to exceed $30,000 per instance/per fund are subject to specific pre-approval by the Audit Committee.
All audit services, as well as the audit-related and non-audit services that are expected to exceed the amounts stated above, must be approved in advance of provision of the service by formal resolution of the Audit Committee. At the regularly scheduled Audit Committee meetings, the Committee reviews a report summarizing the services, including fees, provided by the Auditor.
(e)(2) Services approved pursuant to paragraph (c)(7)(i)(C) of Rule 2-01 of Regulation S-X:
Audit-Related Fees, Tax Fees and All Other Fees:
There were no amounts that were approved by the Audit Committee pursuant to the de minimis exception under Rule 2-01 of Regulation S-X.
(f) According to the registrant’s principal accountant, for the fiscal year ended May 31, 2010, the percentage of hours spent on the audit of the registrant's financial statements for the most recent fiscal year that were attributed to work performed by persons who were not full-time, permanent employees of principal accountant was less than 50%.
(g) The aggregate non-audit fees billed by the registrant's accountant(s) for services rendered to the registrant and rendered to the registrant's control affiliates for each of the last two fiscal years of the registrant were $5,213,849 for the fiscal year ended May 31, 2010, and $8,869,711 for the fiscal year ended May 31, 2009.
(h) The audit committee of the registrant has considered the non-audit services provided by the registrant’s principal accountant(s) to the control affiliates and has determined that the services that were not pre-approved are compatible with maintaining the principal accountant(s)' independence.
ITEM 5. AUDIT COMMITTEE OF LISTED REGISTRANTS.
The registrant has a separately-designated standing audit committee comprised of independent trustees. The members of the audit committee are as follows:
Stanley Martin - Chairman
Steven R. Pruchansky
Deborah C. Jackson
ITEM 6. SCHEDULE OF INVESTMENTS.
(a) Not applicable.
(b) Not applicable.
ITEM 7. DISCLOSURE OF PROXY VOTING POLICIES AND PROCEDURES FOR CLOSED-END MANAGEMENT INVESTMENT COMPANIES.
Not applicable.
ITEM 8. PORTFOLIO MANAGERS OF CLOSED-END MANAGEMENT INVESTMENT COMPANIES.
Not applicable.
ITEM 9. PURCHASES OF EQUITY SECURITIES BY CLOSED-END MANAGEMENT INVESTMENT COMPANY AND AFFILIATED PURCHASERS.
Not applicable.
ITEM 10. SUBMISSION OF MATTERS TO A VOTE OF SECURITY HOLDERS.
Not applicable.
ITEM 11. CONTROLS AND PROCEDURES.
(a) Based upon their evaluation of the registrant's disclosure controls and procedures as conducted within 90 days of the filing date of this Form N-CSR, the registrant's principal executive officer and principal financial officer have concluded that those disclosure controls and procedures provide reasonable assurance that the material information required to be disclosed by the registrant on this report is recorded, processed, summarized and reported within the time periods specified in the Securities and Exchange Commission's rules and forms.
(b) There were no changes in the registrant's internal control over financial reporting that occurred during the registrant's most recent fiscal half-year (the registrant's second fiscal half-year in the case of an annual report) that have materially affected, or are reasonably likely to materially affect, the registrant's internal control over financial reporting.
ITEM 12. EXHIBITS.
(a)(1) Code of Ethics for Senior Financial Officers is attached.
(a)(2) Separate certifications for the registrant's principal executive officer and principal financial officer, as required by Section 302 of the Sarbanes-Oxley Act of 2002 and Rule 30a-2(a) under the Investment Company Act of 1940, are attached.
(b) Separate certifications for the registrant's principal executive officer and principal financial officer, as required by 18 U.S.C. Section 1350, as adopted pursuant to Section 906 of the Sarbanes-Oxley Act of 2002, and Rule 30a-2(b) under the Investment Company Act of 1940, are attached. The certifications furnished pursuant to this paragraph are not deemed to be "filed" for purposes of Section 18 of the Securities Exchange Act of 1934, or otherwise subject to the liability of that section. Such certifications are not deemed to be incorporated by reference into any filing under the Securities Act of 1933 or the Securities Exchange Act of 1934, except to the extent that the Registrant specifically incorporates them by reference.
(c) Contact person at the registrant.
| SIGNATURES |
Pursuant to the requirements of the Securities Exchange Act of 1934 and the Investment Company Act of 1940, the registrant has duly caused this report to be signed on its behalf by the undersigned, thereunto duly authorized.
John Hancock Sovereign Bond Fund
By: /s/ Keith F. Hartstein
---------------------------------
Keith F. Hartstein
President and Chief Executive Officer
Date: July 23, 2010
Pursuant to the requirements of the Securities Exchange Act of 1934 and the Investment Company Act of 1940, this report has been signed below by the following persons on behalf of the registrant and in the capacities and on the dates indicated.
By: /s/ Keith F. Hartstein
---------------------------------
Keith F. Hartstein
President and Chief Executive Officer
Date: July 23, 2010
By: /s/ Charles A. Rizzo
---------------------------------
Charles A. Rizzo
Chief Financial Officer
Date: July 23, 2010