UNITED STATES
SECURITIES AND EXCHANGE COMMISSION
Washington, D.C. 20549
FORM N-CSR
CERTIFIED SHAREHOLDER REPORT OF REGISTERED
MANAGEMENT INVESTMENT COMPANIES
Investment Company Act file number 811- 1677
John Hancock Capital Series
(Exact name of registrant as specified in charter)
601 Congress Street, Boston, Massachusetts 02210
(Address of principal executive offices) (Zip code)
Salvatore Schiavone
Treasurer
601 Congress Street
Boston, Massachusetts 02210
(Name and address of agent for service)
Registrant's telephone number, including area code: 617-663-4497
Date of fiscal year end: | October 31 |
|
|
Date of reporting period: | April 30, 2015 |
ITEM 1. REPORT TO SHAREHOLDERS.
John Hancock
U.S. Global Leaders Growth Fund
Semiannual report 4/30/15


A message to shareholders
Dear fellow shareholder,
U.S. economic growth continued, despite recent weakness caused largely by the harsh winter weather. The market expansion that began in 2009 so far remains intact. Positive economic and business news has translated into good news for U.S. investors, with continued solid results for a range of U.S. equity indexes in recent months. Many fixed-income indexes have also seen positive returns in this environment.
Outside of the United States, economies are struggling to replicate the kind of success we have enjoyed at home. Central banks across Europe and Asia have announced dramatic monetary policy measures to promote economic activity—similar to the monetary policy activity of the U.S. Federal Reserve in recent years. As was the case in the United States beginning in 2009, many international markets have rallied in advance of sustained economic progress. China's stock market in particular has delivered extraordinary gains. In fact, our network of asset managers and research firms believes that government and central bank stimulus may prove to be the biggest driver of international market returns in 2015.
While maintaining adequate portfolio diversification is vital in any market environment, we believe it is especially important today given the unprecedented central bank interventions of the past few years and the very real geopolitical risk around the world. The uncertainty of today's global financial markets is one of the reasons we at John Hancock Investments believe it is important for long-term portfolios to have exposure to a diverse range of investments. Now may be a good time to discuss the resilience of your portfolio with your financial advisor.
On behalf of everyone at John Hancock Investments, I'd like to take this opportunity to welcome new shareholders and to thank existing shareholders for the continued trust you've placed in us.
Sincerely,

Andrew G. Arnott
President and Chief Executive Officer
John Hancock Investments
This commentary reflects the CEO's views as of April 30, 2015. They are subject to change at any time. For more up-to-date information, you can visit our website at jhinvestments.com.
John Hancock
U.S. Global Leaders Growth Fund
1
INVESTMENT OBJECTIVE
The fund seeks long-term growth of capital.
AVERAGE ANNUAL TOTAL RETURNS AS OF 4/30/15 (%)
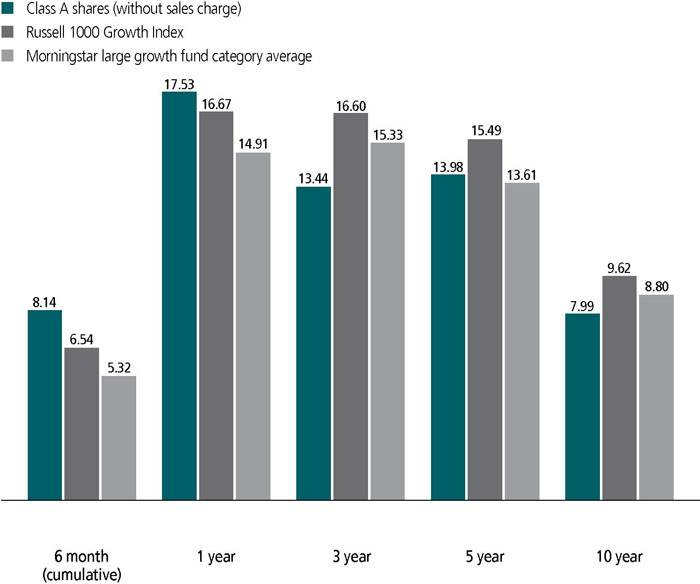
The Russell 1000 Growth Index is an unmanaged index of companies in the Russell 1000 Index (the 1,000 largest U.S. publicly traded companies) with high price-to-book ratios and higher forecasted growth values.
It is not possible to invest directly in an index. Index figures do not reflect expenses or sales charges, which would result in lower values.
Figures from Morningstar, Inc. include reinvested distributions and do not take into account sales charges. Actual load-adjusted performance is lower.
The past performance shown here reflects reinvested distributions and the beneficial effect of any expense reductions, and does not guarantee future results. Returns for periods shorter than one year are cumulative, and results for other share classes will vary. Shares will fluctuate in value and, when redeemed, may be worth more or less than their original cost. Current performance may be lower or higher than the performance cited, and can be found at jhinvestments.com or by calling 800-225-5291. For further information on the fund's objectives, risks, and strategy, see the fund's prospectuses.
2
PERFORMANCE HIGHLIGHTS OVER THE LAST SIX MONTHS
U.S. stocks advanced
The U.S. equity market rallied despite some volatility stemming from economic uncertainty, geopolitical turmoil, and falling energy prices.
Fund outperformed its benchmark
The fund produced a solid gain and outpaced its benchmark, the Russell 1000 Growth Index.
Consumer discretionary stocks added value
Stock selection in the consumer discretionary sector contributed the most to the fund's outperformance relative to its benchmark.
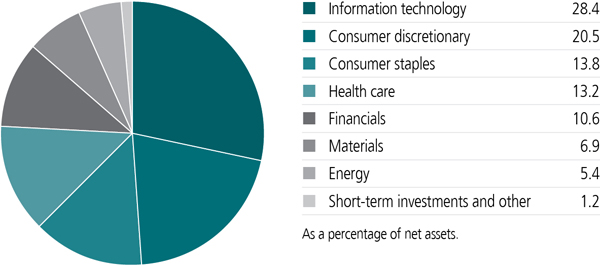
PORTFOLIO COMPOSITION AS OF 4/30/15 (%)

A note about risks
Growth stocks may be more susceptible to earnings disappointments as compared with value stocks, and market values can be more volatile. Large company stocks could fall out of favor. Foreign investing has additional risks, such as currency and market volatility and political and social instability. A portfolio concentrated in one sector or that holds a limited number of securities may fluctuate more than a diversified portfolio. Investments in a non-diversified fund may magnify the fund's losses from adverse events affecting a particular issuer. Please see the fund's prospectuses for additional risks.
3
An interview with Portfolio Manager Gordon M. Marchand, CPA, CFA, CIC, Sustainable Growth Advisers, LP

Gordon M. Marchand, CPA, CFA, CIC
Portfolio Manager
Sustainable Growth Advisors
Can you talk about the market environment over the past six months?
The U.S. equity market advanced for the six-month period as the broad S&P 500 Index returned 4.40% and the fund's benchmark, the Russell 1000 Growth Index, returned 6.54%. The broad market advance masked some interim volatility as stocks were buffeted by concerns about economic weakness outside of the United States, geopolitical issues in Ukraine and the Middle East, a sharp decline in energy prices, and the potential impact of a stronger U.S. dollar on domestic economic growth and corporate earnings.
We invest in high-quality, large-cap growth stocks that are able to generate attractive and sustainable earnings, revenue, and cash flow growth. Consequently, we monitor the relative performance of higher-quality stocks versus lower-quality stocks, companies with higher earnings growth rates versus those with lower growth rates, and factors such as return on equity (ROE) and corporate debt levels. In addition, given our focus on large growth stocks with global reach, we track how the market rewards large-cap versus small-cap stocks, U.S. versus non-U.S. stocks, and growth versus value.
How did these factors fare during the reporting period?
They were mixed but generally positive for our strategy. Higher-quality stocks outperformed early in the reporting period, while lower-quality stocks performed better in the latter half of the period. Stocks with higher ROE outperformed those with lower ROE, and stocks with less debt outpaced those with more debt. However, companies with lower earnings growth outperformed those with higher earnings growth, particularly over the last few months of the reporting period. Non-U.S. stocks outperformed the U.S. market, growth stocks beat value, and large-cap stocks trailed both mid- and small-cap issues.
Turning to the portfolio, what contributed to the fund's outperformance of its benchmark?
Stock selection in the consumer discretionary sector contributed the most to the fund's outperformance. The leading contributor was e-commerce retailer Amazon.com, Inc., which we added to the portfolio in early 2014. The company exceeded earnings expectations amid robust
4
Another top contributor was home improvement retailer Lowe's Companies, Inc. We increased the fund's position in Lowe's in the fall of 2014, when market volatility provided an attractive opportunity. The stock subsequently delivered a strong earnings report as the company benefited from improving employment and income trends. In addition, Lowe's continued to make progress in its initiatives to enhance profit margins. We trimmed the fund's position in the stock following its recent rally.
Natural foods grocery chain Whole Foods Market, Inc., another stock we purchased in 2014, produced strong results for the portfolio during the six-month period. Whole Foods reported solid earnings and showed positive results from the company's strategic initiatives—enhancing value for the customer, increasing the rollout of new stores to benefit from its larger scale, and branding initiatives that highlight its quality advantage relative to the competition. Although the path of improvement will vary from quarter to quarter, we believe Whole Foods will be able to maintain its leadership position in the rapidly growing natural and organic food retailing industry.
What holdings detracted from performance versus the benchmark?
The most significant individual detractor was financial services provider American Express Company. In early 2015, the company ended its long-standing relationship with Costco Wholesale
SECTOR COMPOSITION AS OF 4/30/15 (%)
5
Corp. Although efforts to retain cardholders from this relationship will involve higher marketing costs in the near term, American Express will likely be able to sell the Costco receivables for an attractive price, which will help offset some of the costs. American Express also faced an adverse court ruling that would allow merchants to steer clients toward credit cards that are less costly to the merchant. In our view, American Express remains a strong brand that merchants will continue to seek out given the attractive income and spending profiles of their cardholders, so we took advantage of the decline in the stock to increase the fund's position.
Energy equipment and services provider Schlumberger, Ltd. was another detractor as a substantial drop in the price of oil, ongoing geopolitical tensions in the Middle East, and the likelihood of reduced spending on exploration by oil companies weighed on the entire energy sector. The current disequilibrium in the oil market stemmed from a significant increase in nontraditional production in North America, combined with a refusal on the part of OPEC to reduce production. We believe that attractive growth opportunities over a three- to five-year time horizon will emerge as more oil rigs are idled and supplies contract. We trimmed the fund's position in Schlumberger early in the reporting period on strength and have added back to the position more recently on weakness.
Another noteworthy detractor was Fastenal Company, a wholesale distributor of fasteners and other industrial supplies. The stock fell as weaker industrial production trends, especially in the energy and mining industries, and declining exports resulting from a stronger U.S. dollar put downward pressure on the company's pricing structure. As Fastenal's earnings and revenue growth expectations became less predictable, we eliminated the stock to make room for more attractive opportunities.
What other changes did you make to the portfolio during the reporting period?
Fastenal was the only stock we eliminated from the portfolio over the last six months. However, we added two new stocks—snack food maker Mondelez International, Inc. and specialty oil services
TOP 10 HOLDINGS AS OF 4/30/15 (%)
| Lowe's Companies, Inc. | 5.3 |
| Visa, Inc., Class A | 4.6 |
| Amgen, Inc. | 4.4 |
| Schlumberger, Ltd. | 4.3 |
| The Priceline Group, Inc. | 4.2 |
| The Walt Disney Company | 4.2 |
| Google, Inc., Class C | 4.2 |
| Automatic Data Processing, Inc. | 4.1 |
| Cerner Corp. | 4.0 |
| Ecolab, Inc. | 4.0 |
| TOTAL | 43.3 |
| As a percentage of net assets. | |
| Cash and cash equivalents are not included. | |
6
provider Core Laboratories NV. Mondelez, which was spun off from Kraft Foods in 2012, has strong global brands—including Nabisco, Oreo, and Cadbury—that give the company superior pricing power and leading market share. We see the potential for substantial improvement in the company's operating margins as Mondelez modernizes its supply chain and manufacturing base.
Core Labs' energy-related services are focused on improving reservoir performance and increasing oil and gas recovery from producing fields. The company has a lean cost structure and a high value proposition that should allow it to weather the current downturn better than other oil service firms. While 2015 is expected to be a down year for earnings, we expect double-digit earnings growth for the next three years as the supply-and-demand equilibrium in global energy markets is restored.
MANAGED BY
 | George P. Fraise On the fund since 2000 Investing since 1987 |
| | Gordon M. Marchand, CPA, CFA, CIC On the fund since 1995 Investing since 1977 |
 | Robert L. Rohn On the fund since 2003 Investing since 1983 |
![]()
COUNTRY COMPOSITION AS OF 4/30/15 (%)
| United States | 89.8 |
| Germany | 3.5 |
| United Kingdom | 3.0 |
| France | 2.0 |
| Netherlands | 1.1 |
| Ireland | 0.6 |
| Total | 100.0 |
| As a percentage of net assets. |
7
TOTAL RETURNS FOR THE PERIOD ENDED APRIL 30, 2015
| Average annual total returns (%) with maximum sales charge | Cumulative total returns (%) with maximum sales charge | ||||||
| 1-year | 5-year | 10-year | 6-month | 5-year | 10-year | ||
| Class A | 11.66 | 12.82 | 7.44 | 2.73 | 82.75 | 104.95 | |
| Class B | 11.68 | 12.88 | 7.34 | 3.14 | 83.24 | 103.12 | |
| Class C | 15.64 | 13.13 | 7.19 | 6.82 | 85.32 | 100.16 | |
| Class I1 | 17.84 | 14.37 | 8.42 | 8.28 | 95.70 | 124.51 | |
| Class R21,2 | 17.31 | 13.92 | 7.91 | 8.04 | 91.83 | 114.05 | |
| Class R61,2 | 17.96 | 14.44 | 8.42 | 8.32 | 96.25 | 124.53 | |
| Index 1† | 16.67 | 15.49 | 9.62 | 6.54 | 105.49 | 150.60 | |
| Index 2† | 12.98 | 14.33 | 8.32 | 4.40 | 95.31 | 122.39 | |
Performance figures assume all distributions have been reinvested. Figures reflect maximum sales charges on Class A shares of 5% and the applicable contingent deferred sales charge (CDSC) on Class B and Class C shares. The Class B shares' CDSC declines annually between years 1 to 6 according to the following schedule: 5%, 4%, 3%, 3%, 2%, 1%. No sales charge will be assessed after the sixth year. Class C shares sold within one year of purchase are subject to a 1% CDSC. Sales charges are not applicable to Class I, Class R2, and Class R6 shares.
The expense ratios of the fund, both net (including any fee waivers or expense limitations) and gross (excluding any fee waivers or expense limitations), are set forth according to the most recent publicly available prospectuses for the fund and may differ from those disclosed in the Financial highlights tables in this report. Had the fee waivers and expense limitations not been in place, gross expenses would apply. The expense ratios are as follows:
| Class A | Class B | Class C | Class I | Class R2 | Class R6 | |
| Gross (%) | 1.19 | 1.94 | 1.94 | 0.93 | 1.33 | 0.83 |
| Net (%) | 1.19 | 1.94 | 1.94 | 0.93 | 1.33 | 0.81 |
Please refer to the most recent prospectus and annual or semiannual report for more information on expenses and any expense limitation arrangements for each class.
The returns reflect past results and should not be considered indicative of future performance. The return and principal value of an investment will fluctuate so that shares, when redeemed, may be worth more or less than their original cost. Due to market volatility and other factors, the fund's current performance may be higher or lower than the performance shown. For current to the most recent month-end performance data, please call 800-225-5291 or visit the fund's website at jhinvestments.com.
The performance table above and the chart on the next page do not reflect the deduction of taxes that a shareholder would pay on fund distributions or the redemption of fund shares. The fund's performance results reflect any applicable fee waivers or expense reductions, without which the expenses would increase and results would have been less favorable.
| † | Index 1 is the Russell 1000 Growth Index; Index 2 is the S&P 500 Index. |
See the following page for footnotes.
8
This chart and table show what happened to a hypothetical $10,000 investment in John Hancock U.S. Global Leaders Growth Fund for the share classes and periods indicated, assuming all distributions were reinvested. For comparison, we've shown the same investment in two separate indexes.
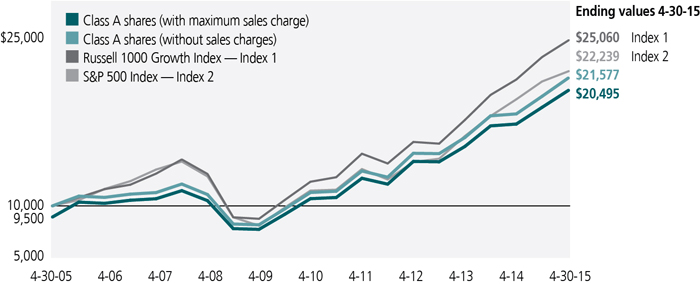
| Start date | With maximum sales charge ($) | Without sales charge ($) | Index 1 ($) | Index 2 ($) | |
| Class B3 | 4-30-05 | 20,312 | 20,312 | 25,060 | 22,239 |
| Class C3 | 4-30-05 | 20,016 | 20,016 | 25,060 | 22,239 |
| Class I1 | 4-30-05 | 22,451 | 22,451 | 25,060 | 22,239 |
| Class R21,2 | 4-30-05 | 21,405 | 21,405 | 25,060 | 22,239 |
| Class R61,2 | 4-30-05 | 22,453 | 22,453 | 25,060 | 22,239 |
Performance of the classes will vary based on the difference in sales charges paid by shareholders investing in the different classes and the fee structure of those classes.
The Russell 1000 Growth Index is an unmanaged index of companies in the Russell 1000 Index (the 1,000 largest U.S. publicly traded companies) with high price-to-book ratios and higher forecasted growth values.
The S&P 500 Index is an unmanaged index that includes 500 widely traded common stocks.
It is not possible to invest directly in an index. Index figures do not reflect expenses or sales charges, which would result in lower values.
Footnotes related to performance pages
| 1 | For certain types of investors, as described in the fund's prospectuses. |
| 2 | Class R6 and Class R2 shares were first offered on 9-1-11 and 3-1-12, respectively. The returns prior to these dates are those of Class A shares that have been recalculated to apply the gross fees and expenses of Class R6 and Class R2 shares, as applicable. |
| 3 | The contingent deferred sales charge is not applicable. |
9
These examples are intended to help you understand your ongoing operating expenses of investing in the fund so you can compare these costs with the ongoing costs of investing in other mutual funds.
Understanding fund expenses
As a shareholder of the fund, you incur two types of costs:
| • | Transaction costs, which include sales charges (loads) on purchases or redemptions (varies by share class), minimum account fee charge, etc. |
| • | Ongoing operating expenses, including management fees, distribution and service fees (if applicable), and other fund expenses. |
We are presenting only your ongoing operating expenses here.
Actual expenses/actual returns
This example is intended to provide information about the fund's actual ongoing operating expenses, and is based on the fund's actual return. It assumes an account value of $1,000.00 on November 1, 2014, with the same investment held until April 30, 2015.
| Account value on 11-1-2014 | Ending value on 4-30-2015 | Expenses paid during period ended 4-30-20151 | Annualized expense ratio | |
| Class A | $1,000.00 | $1,081.40 | $5.99 | 1.16% |
| Class B | 1,000.00 | 1,077.10 | 9.84 | 1.91% |
| Class C | 1,000.00 | 1,077.40 | 9.84 | 1.91% |
| Class I | 1,000.00 | 1,082.80 | 4.65 | 0.90% |
| Class R2 | 1,000.00 | 1,080.40 | 6.65 | 1.29% |
| Class R6 | 1,000.00 | 1,083.20 | 4.08 | 0.79% |
Together with the value of your account, you may use this information to estimate the operating expenses that you paid over the period. Simply divide your account value at April 30, 2015, by $1,000.00, then multiply it by the "expenses paid" for your share class from the table above. For example, for an account value of $8,600.00, the operating expenses should be calculated as follows:
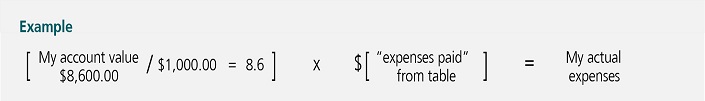
10
Hypothetical example for comparison purposes
This table allows you to compare the fund's ongoing operating expenses with those of any other fund. It provides an example of the fund's hypothetical account values and hypothetical expenses based on each class's actual expense ratio and an assumed 5% annualized return before expenses (which is not the fund's actual return). It assumes an account value of $1,000.00 on November 1, 2014, with the same investment held until April 30, 2015. Look in any other fund shareholder report to find its hypothetical example and you will be able to compare these expenses. Please remember that these hypothetical account values and expenses may not be used to estimate the actual ending account balance or expenses you paid for the period.
| Account value on 11-1-2014 | Ending value on 4-30-2015 | Expenses paid during period ended 4-30-20151 | Annualized expense ratio | |
| Class A | $1,000.00 | $1,019.00 | $5.81 | 1.16% |
| Class B | 1,000.00 | 1,015.30 | 9.54 | 1.91% |
| Class C | 1,000.00 | 1,015.30 | 9.54 | 1.91% |
| Class I | 1,000.00 | 1,020.30 | 4.51 | 0.90% |
| Class R2 | 1,000.00 | 1,018.40 | 6.46 | 1.29% |
| Class R6 | 1,000.00 | 1,020.90 | 3.96 | 0.79% |
Remember, these examples do not include any transaction costs, therefore, these examples will not help you to determine the relative total costs of owning different funds. If transaction costs were included, your expenses would have been higher. See the prospectuses for details regarding transaction costs.
| 1 | Expenses are equal to the fund's annualized expense ratio, multiplied by the average account value over the period, multiplied by 181/365 (to reflect the one-half year period). |
11
Fund's investments
| As of 4-30-15 (unaudited) | ||||||||||||||
| Shares | Value | |||||||||||||
| Common stocks 98.8% | $1,073,974,039 | |||||||||||||
| (Cost $725,358,239) | ||||||||||||||
| Consumer discretionary 20.5% | 222,483,021 | |||||||||||||
| Hotels, restaurants and leisure 3.2% | ||||||||||||||
| Starbucks Corp. | 697,760 | 34,594,941 | ||||||||||||
| Internet and catalog retail 7.8% | ||||||||||||||
| Amazon.com, Inc. (I) | 91,459 | 38,575,577 | ||||||||||||
| The Priceline Group, Inc. (I) | 37,207 | 46,055,197 | ||||||||||||
| Media 4.2% | ||||||||||||||
| The Walt Disney Company | 419,440 | 45,601,517 | ||||||||||||
| Specialty retail 5.3% | ||||||||||||||
| Lowe's Companies, Inc. | 837,290 | 57,655,789 | ||||||||||||
| Consumer staples 13.8% | 150,037,024 | |||||||||||||
| Food and staples retailing 3.4% | ||||||||||||||
| Whole Foods Market, Inc. | 783,435 | 37,416,856 | ||||||||||||
| Food products 6.9% | ||||||||||||||
| Mondelez International, Inc., Class A | 1,044,474 | 40,076,467 | ||||||||||||
| The Hershey Company | 378,665 | 34,806,887 | ||||||||||||
| Household products 3.5% | ||||||||||||||
| Colgate-Palmolive Company | 560,892 | 37,736,814 | ||||||||||||
| Energy 5.4% | 58,462,585 | |||||||||||||
| Energy equipment and services 5.4% | ||||||||||||||
| Core Laboratories NV (L) | 91,902 | 12,064,895 | ||||||||||||
| Schlumberger, Ltd. | 490,410 | 46,397,690 | ||||||||||||
| Financials 10.6% | 115,055,523 | |||||||||||||
| Capital markets 3.7% | ||||||||||||||
| State Street Corp. | 513,940 | 39,635,053 | ||||||||||||
| Consumer finance 3.9% | ||||||||||||||
| American Express Company | 550,160 | 42,609,889 | ||||||||||||
| Insurance 3.0% | ||||||||||||||
| Aon PLC | 340,960 | 32,810,581 | ||||||||||||
| Health care 13.2% | 143,855,019 | |||||||||||||
| Biotechnology 6.6% | ||||||||||||||
| Amgen, Inc. | 306,590 | 48,413,627 | ||||||||||||
| Regeneron Pharmaceuticals, Inc. (I) | 51,980 | 23,778,771 | ||||||||||||
| Health care technology 4.0% | ||||||||||||||
| Cerner Corp. (I) | 600,750 | 43,139,858 | ||||||||||||
| Shares | Value | |||||||||||||
| Health care (continued) | ||||||||||||||
| Pharmaceuticals 2.6% | ||||||||||||||
| Perrigo Company PLC | 37,171 | $6,812,701 | ||||||||||||
| Sanofi, ADR | 429,477 | 21,710,062 | ||||||||||||
| Information technology 28.4% | 309,147,507 | |||||||||||||
| Communications equipment 2.1% | ||||||||||||||
| QUALCOMM, Inc. | 329,010 | 22,372,680 | ||||||||||||
| Internet software and services 9.5% | ||||||||||||||
| Equinix, Inc. | 162,998 | 41,716,078 | ||||||||||||
| Google, Inc., Class C (I) | 84,642 | 45,481,374 | ||||||||||||
| LinkedIn Corp., Class A (I) | 65,464 | 16,505,438 | ||||||||||||
| IT services 8.7% | ||||||||||||||
| Automatic Data Processing, Inc. | 524,390 | 44,331,931 | ||||||||||||
| Visa, Inc., Class A | 764,600 | 50,501,830 | ||||||||||||
| Software 8.1% | ||||||||||||||
| Red Hat, Inc. (I) | 364,010 | 27,395,393 | ||||||||||||
| Salesforce.com, Inc. (I) | 311,997 | 22,719,622 | ||||||||||||
| SAP SE, ADR (L) | 503,675 | 38,123,161 | ||||||||||||
| Materials 6.9% | 74,933,360 | |||||||||||||
| Chemicals 6.9% | ||||||||||||||
| Ecolab, Inc. | 384,420 | 43,047,352 | ||||||||||||
| Monsanto Company | 279,800 | 31,886,008 | ||||||||||||
| Yield (%) | Shares | Value | ||||||||||||
| Securities lending collateral 3.0% | $32,312,725 | |||||||||||||
| (Cost $32,312,077) | ||||||||||||||
| John Hancock Collateral Trust (W) | 0.1215(Y | ) | 3,229,593 | 32,312,725 | ||||||||||
| Short-term investments 1.3% | $14,907,155 | |||||||||||||
| (Cost $14,907,155) | ||||||||||||||
| Money market funds 1.3% | 14,907,155 | |||||||||||||
| State Street Institutional U.S. Government Money Market Fund | 0.0000(Y | ) | 14,907,155 | 14,907,155 | ||||||||||
| Total investments (Cost $772,577,471)† 103.1% | $1,121,193,919 | |||||||||||||
| Other assets and liabilities, net (3.1%) | ($34,006,775 | ) | ||||||||||||
| Total net assets 100.0% | $1,087,187,144 | |||||||||||||
| The percentage shown for each investment category is the total value of the category as a percentage of the net assets of the fund. | ||||
| Key to Security Abbreviations and Legend | ||||
| ADR | American Depositary Receipts | |||
| (I) | Non-income producing security. | |||
| (L) | A portion of this security is on loan as of 4-30-15. | |||
| (W) | Investment is an affiliate of the fund, the advisor and/or subadvisor. This investment represents collateral received for securities lending. | |||
| (Y) | The rate shown is the annualized seven-day yield as of 4-30-15. | |||
| † | At 4-30-15, the aggregate cost of investment securities for federal income tax purposes was $776,309,619. Net unrealized appreciation aggregated $344,884,300, of which $346,353,005 related to appreciated investment securities and $1,468,705 related to depreciated investment securities. | |||
Financial statements
STATEMENT OF ASSETS AND LIABILITIES 4-30-15 (unaudited)
| Assets | ||||||||||||||||||||||||||||||||||||||||
| Investments in unaffiliated issuers, at value (Cost $740,265,394) including $31,685,480 of securities loaned | $1,088,881,194 | |||||||||||||||||||||||||||||||||||||||
| Investments in affiliated issuers, at value (Cost $32,312,077) | 32,312,725 | |||||||||||||||||||||||||||||||||||||||
| Total investments, at value (Cost $772,577,471) | 1,121,193,919 | |||||||||||||||||||||||||||||||||||||||
| Receivable for investments sold | 7,835,591 | |||||||||||||||||||||||||||||||||||||||
| Receivable for fund shares sold | 2,459,268 | |||||||||||||||||||||||||||||||||||||||
| Dividends and interest receivable | 747,286 | |||||||||||||||||||||||||||||||||||||||
| Receivable for securities lending income | 8,182 | |||||||||||||||||||||||||||||||||||||||
| Other receivables and prepaid expenses | 86,324 | |||||||||||||||||||||||||||||||||||||||
| Total assets | 1,132,330,570 | |||||||||||||||||||||||||||||||||||||||
| Liabilities | ||||||||||||||||||||||||||||||||||||||||
| Payable for investments purchased | 8,516,238 | |||||||||||||||||||||||||||||||||||||||
| Payable for fund shares repurchased | 2,719,963 | |||||||||||||||||||||||||||||||||||||||
| Payable upon return of securities loaned | 32,324,170 | |||||||||||||||||||||||||||||||||||||||
| Payable to affiliates | ||||||||||||||||||||||||||||||||||||||||
| Accounting and legal services fees | 1,881 | |||||||||||||||||||||||||||||||||||||||
| Transfer agent fees | 215,877 | |||||||||||||||||||||||||||||||||||||||
| Distribution and service fees | 532,443 | |||||||||||||||||||||||||||||||||||||||
| Trustees' fees | 1,554 | |||||||||||||||||||||||||||||||||||||||
| Investment management fees | 668,279 | |||||||||||||||||||||||||||||||||||||||
| Other liabilities and accrued expenses | 163,021 | |||||||||||||||||||||||||||||||||||||||
| Total liabilities | 45,143,426 | |||||||||||||||||||||||||||||||||||||||
| Net assets | $1,087,187,144 | |||||||||||||||||||||||||||||||||||||||
| Net assets consist of | ||||||||||||||||||||||||||||||||||||||||
| Paid-in capital | $714,573,319 | |||||||||||||||||||||||||||||||||||||||
| Accumulated distributions in excess of net investment income | (480,822 | ) | ||||||||||||||||||||||||||||||||||||||
| Accumulated net realized gain (loss) on investments | 24,478,199 | |||||||||||||||||||||||||||||||||||||||
| Net unrealized appreciation (depreciation) on investments | 348,616,448 | |||||||||||||||||||||||||||||||||||||||
| Net assets | $1,087,187,144 | |||||||||||||||||||||||||||||||||||||||
STATEMENT OF ASSETS AND LIABILITIES (continued)
| Net asset value per share | ||||||||||||||||||
| Based on net asset values and shares outstanding-the fund has an unlimited number of shares authorized with no par value | ||||||||||||||||||
| Class A ($625,255,185 ÷ 14,921,109 shares)1 | $41.90 | |||||||||||||||||
| Class B ($25,783,539 ÷ 691,231 shares)1 | $37.30 | |||||||||||||||||
| Class C ($130,376,929 ÷ 3,493,783 shares)1 | $37.32 | |||||||||||||||||
| Class I ($293,695,445 ÷ 6,653,135 shares) | $44.14 | |||||||||||||||||
| Class R2 ($7,878,424 ÷ 179,595 shares) | $43.87 | |||||||||||||||||
| Class R6 ($4,197,622 ÷ 94,906 shares) | $44.23 | |||||||||||||||||
| Maximum offering price per share | ||||||||||||||||||
| Class A (net asset value per share ÷ 95%)2 | $44.11 | |||||||||||||||||
| 1 | Redemption price per share is equal to net asset value less any applicable contingent deferred sales charge. | |||||||
| 2 | On single retail sales of less than $50,000. On sales of $50,000 or more and on group sales the offering price is reduced. | |||||||
STATEMENT OF OPERATIONS For the six months ended 4-30-15 (unaudited)
| Investment income | ||||||||||||||||||||||||||||||||||||||||
| Dividends | $6,087,251 | |||||||||||||||||||||||||||||||||||||||
| Securities lending | 39,333 | |||||||||||||||||||||||||||||||||||||||
| Less foreign taxes withheld | (5,986 | ) | ||||||||||||||||||||||||||||||||||||||
| Total investment income | 6,120,598 | |||||||||||||||||||||||||||||||||||||||
| Expenses | ||||||||||||||||||||||||||||||||||||||||
| Investment management fees | 4,055,970 | |||||||||||||||||||||||||||||||||||||||
| Distribution and service fees | 1,615,628 | |||||||||||||||||||||||||||||||||||||||
| Accounting and legal services fees | 72,964 | |||||||||||||||||||||||||||||||||||||||
| Transfer agent fees | 617,383 | |||||||||||||||||||||||||||||||||||||||
| Trustees' fees | 14,577 | |||||||||||||||||||||||||||||||||||||||
| State registration fees | 65,700 | |||||||||||||||||||||||||||||||||||||||
| Printing and postage | 63,403 | |||||||||||||||||||||||||||||||||||||||
| Professional fees | 34,115 | |||||||||||||||||||||||||||||||||||||||
| Custodian fees | 66,864 | |||||||||||||||||||||||||||||||||||||||
| Registration and filing fees | 20,205 | |||||||||||||||||||||||||||||||||||||||
| Other | 16,223 | |||||||||||||||||||||||||||||||||||||||
| Total expenses | 6,643,032 | |||||||||||||||||||||||||||||||||||||||
| Less expense reductions | (42,288 | ) | ||||||||||||||||||||||||||||||||||||||
| Net expenses | 6,600,744 | |||||||||||||||||||||||||||||||||||||||
| Net investment loss | (480,146 | ) | ||||||||||||||||||||||||||||||||||||||
| Realized and unrealized gain (loss) | ||||||||||||||||||||||||||||||||||||||||
| Net realized gain (loss) on | ||||||||||||||||||||||||||||||||||||||||
| Investments in unaffiliated issuers | 28,215,703 | |||||||||||||||||||||||||||||||||||||||
| Investments in affiliated issuers | (3,107 | ) | ||||||||||||||||||||||||||||||||||||||
| 28,212,596 | ||||||||||||||||||||||||||||||||||||||||
| Change in net unrealized appreciation (depreciation) of | ||||||||||||||||||||||||||||||||||||||||
| Investments in unaffiliated issuers | 58,557,627 | |||||||||||||||||||||||||||||||||||||||
| Investments in affiliated issuers | 155 | |||||||||||||||||||||||||||||||||||||||
| 58,557,782 | ||||||||||||||||||||||||||||||||||||||||
| Net realized and unrealized gain | 86,770,378 | |||||||||||||||||||||||||||||||||||||||
| Increase in net assets from operations | $86,290,232 | |||||||||||||||||||||||||||||||||||||||
STATEMENTS OF CHANGES IN NET ASSETS
| Six months ended 4-30-15 | Year ended 10-31-14 | ||||||||||||||||||||||||||||||||||||||||||||
| (unaudited) | |||||||||||||||||||||||||||||||||||||||||||||
| Increase (decrease) in net assets | �� | ||||||||||||||||||||||||||||||||||||||||||||
| From operations | |||||||||||||||||||||||||||||||||||||||||||||
| Net investment income (loss) | ($480,146 | ) | $2,782,502 | ||||||||||||||||||||||||||||||||||||||||||
| Net realized gain | 28,212,596 | 151,156,136 | |||||||||||||||||||||||||||||||||||||||||||
| Change in net unrealized appreciation (depreciation) | 58,557,782 | (47,211,403 | ) | ||||||||||||||||||||||||||||||||||||||||||
| Increase in net assets resulting from operations | 86,290,232 | 106,727,235 | |||||||||||||||||||||||||||||||||||||||||||
| Distributions to shareholders | |||||||||||||||||||||||||||||||||||||||||||||
| From net investment income | |||||||||||||||||||||||||||||||||||||||||||||
| Class A | (1,292,278 | ) | (569,456 | ) | |||||||||||||||||||||||||||||||||||||||||
| Class I | (1,203,657 | ) | (674,178 | ) | |||||||||||||||||||||||||||||||||||||||||
| Class R2 | (34,533 | ) | (11,535 | ) | |||||||||||||||||||||||||||||||||||||||||
| Class R6 | (18,692 | ) | (10,189 | ) | |||||||||||||||||||||||||||||||||||||||||
| From net realized gain | |||||||||||||||||||||||||||||||||||||||||||||
| Class A | (80,357,508 | ) | (20,049,098 | ) | |||||||||||||||||||||||||||||||||||||||||
| Class B | (3,938,428 | ) | (999,781 | ) | |||||||||||||||||||||||||||||||||||||||||
| Class C | (19,500,146 | ) | (4,082,434 | ) | |||||||||||||||||||||||||||||||||||||||||
| Class I | (39,880,649 | ) | (8,473,404 | ) | |||||||||||||||||||||||||||||||||||||||||
| Class R2 | (4,345,694 | ) | (886,864 | ) | |||||||||||||||||||||||||||||||||||||||||
| Class R6 | (487,863 | ) | (101,558 | ) | |||||||||||||||||||||||||||||||||||||||||
| Total distributions | (151,059,448 | ) | (35,858,497 | ) | |||||||||||||||||||||||||||||||||||||||||
| From fund share transactions | 37,027,423 | (158,965,900 | ) | ||||||||||||||||||||||||||||||||||||||||||
| Total decrease | (27,741,793 | ) | (88,097,162 | ) | |||||||||||||||||||||||||||||||||||||||||
| Net assets | |||||||||||||||||||||||||||||||||||||||||||||
| Beginning of period | 1,114,928,937 | 1,203,026,099 | |||||||||||||||||||||||||||||||||||||||||||
| End of period | $1,087,187,144 | $1,114,928,937 | |||||||||||||||||||||||||||||||||||||||||||
| Undistributed (accumulated distributions in excess of) net investment income | ($480,822 | ) | $2,548,484 | ||||||||||||||||||||||||||||||||||||||||||
Financial highlights
| Class A Shares Period ended | 4-30-15 | 1 | 10-31-14 | 10-31-13 | 10-31-12 | 10-31-11 | 10-31-10 | |||||||||||||||||||||||||||||||||||||||||||||||||||||||||||||||||||||||||||||||||||||||||||||||||||||||||||||||
| Per share operating performance | ||||||||||||||||||||||||||||||||||||||||||||||||||||||||||||||||||||||||||||||||||||||||||||||||||||||||||||||||||||||
| Net asset value, beginning of period | $45.02 | $42.25 | $35.04 | $30.97 | $27.83 | $23.89 | ||||||||||||||||||||||||||||||||||||||||||||||||||||||||||||||||||||||||||||||||||||||||||||||||||||||||||||||||
| Net investment income (loss)2 | (0.01 | ) | 0.11 | 0.04 | (0.03 | ) | — | 3 | — | 3 | ||||||||||||||||||||||||||||||||||||||||||||||||||||||||||||||||||||||||||||||||||||||||||||||||||||||||||||
| Net realized and unrealized gain on investments | 3.09 | 3.90 | 7.96 | 5.08 | 3.14 | 3.96 | ||||||||||||||||||||||||||||||||||||||||||||||||||||||||||||||||||||||||||||||||||||||||||||||||||||||||||||||||
| Total from investment operations | 3.08 | 4.01 | 8.00 | 5.05 | 3.14 | 3.96 | ||||||||||||||||||||||||||||||||||||||||||||||||||||||||||||||||||||||||||||||||||||||||||||||||||||||||||||||||
| Less distributions | ||||||||||||||||||||||||||||||||||||||||||||||||||||||||||||||||||||||||||||||||||||||||||||||||||||||||||||||||||||||
| From net investment income | (0.10 | ) | (0.03 | ) | — | — | — | (0.02 | ) | |||||||||||||||||||||||||||||||||||||||||||||||||||||||||||||||||||||||||||||||||||||||||||||||||||||||||||||
| From net realized gain | (6.10 | ) | (1.21 | ) | (0.79 | ) | (0.98 | ) | — | — | ||||||||||||||||||||||||||||||||||||||||||||||||||||||||||||||||||||||||||||||||||||||||||||||||||||||||||||
| Total distributions | (6.20 | ) | (1.24 | ) | (0.79 | ) | (0.98 | ) | — | (0.02 | ) | |||||||||||||||||||||||||||||||||||||||||||||||||||||||||||||||||||||||||||||||||||||||||||||||||||||||||||
| Net asset value, end of period | $41.90 | $45.02 | $42.25 | $35.04 | $30.97 | $27.83 | ||||||||||||||||||||||||||||||||||||||||||||||||||||||||||||||||||||||||||||||||||||||||||||||||||||||||||||||||
| Total return (%)4,5 | 8.14 | 6 | 9.74 | 23.30 | 16.96 | 11.28 | 16.58 | |||||||||||||||||||||||||||||||||||||||||||||||||||||||||||||||||||||||||||||||||||||||||||||||||||||||||||||||
| Ratios and supplemental data | ||||||||||||||||||||||||||||||||||||||||||||||||||||||||||||||||||||||||||||||||||||||||||||||||||||||||||||||||||||||
| Net assets, end of period (in millions) | $625 | $600 | $697 | $413 | $282 | $264 | ||||||||||||||||||||||||||||||||||||||||||||||||||||||||||||||||||||||||||||||||||||||||||||||||||||||||||||||||
| Ratios (as a percentage of average net assets): | ||||||||||||||||||||||||||||||||||||||||||||||||||||||||||||||||||||||||||||||||||||||||||||||||||||||||||||||||||||||
| Expenses before reductions | 1.17 | 7 | 1.19 | 1.23 | 1.30 | 1.26 | 1.50 | |||||||||||||||||||||||||||||||||||||||||||||||||||||||||||||||||||||||||||||||||||||||||||||||||||||||||||||||
| Expenses including reductions | 1.16 | 7 | 1.18 | 1.23 | 1.30 | 1.26 | 1.30 | |||||||||||||||||||||||||||||||||||||||||||||||||||||||||||||||||||||||||||||||||||||||||||||||||||||||||||||||
| Net investment income (loss) | (0.05 | ) 7 | 0.27 | 0.10 | (0.10 | ) | (0.01 | ) | 0.01 | |||||||||||||||||||||||||||||||||||||||||||||||||||||||||||||||||||||||||||||||||||||||||||||||||||||||||||||
| Portfolio turnover (%) | 14 | 43 | 30 | 30 | 50 | 33 | ||||||||||||||||||||||||||||||||||||||||||||||||||||||||||||||||||||||||||||||||||||||||||||||||||||||||||||||||
| 1 | Six months ended 4-30-15. Unaudited. | |||||||||||||||||||||||||||||||||||||
| 2 | Based on average daily shares outstanding. | |||||||||||||||||||||||||||||||||||||
| 3 | Less than $0.005 per share. | |||||||||||||||||||||||||||||||||||||
| 4 | Does not reflect the effect of sales charges, if any. | |||||||||||||||||||||||||||||||||||||
| 5 | Total returns would have been lower had certain expenses not been reduced during the applicable periods. | |||||||||||||||||||||||||||||||||||||
| 6 | Not annualized. | |||||||||||||||||||||||||||||||||||||
| 7 | Annualized. | |||||||||||||||||||||||||||||||||||||
| Class B Shares Period ended | 4-30-15 | 1 | 10-31-14 | 10-31-13 | 10-31-12 | 10-31-11 | 10-31-10 | |||||||||||||||||||||||||||||||||||||||||||||||||||||||||||||||||||||||||||||||||||||||||||||||||||||||||||||||
| Per share operating performance | ||||||||||||||||||||||||||||||||||||||||||||||||||||||||||||||||||||||||||||||||||||||||||||||||||||||||||||||||||||||
| Net asset value, beginning of period | $40.80 | $38.65 | $32.36 | $28.89 | $26.16 | $22.60 | ||||||||||||||||||||||||||||||||||||||||||||||||||||||||||||||||||||||||||||||||||||||||||||||||||||||||||||||||
| Net investment loss2 | (0.15 | ) | (0.19 | ) | (0.22 | ) | (0.26 | ) | (0.21 | ) | (0.19 | ) | ||||||||||||||||||||||||||||||||||||||||||||||||||||||||||||||||||||||||||||||||||||||||||||||||||||||||||
| Net realized and unrealized gain on investments | 2.75 | 3.55 | 7.30 | 4.71 | 2.94 | 3.75 | ||||||||||||||||||||||||||||||||||||||||||||||||||||||||||||||||||||||||||||||||||||||||||||||||||||||||||||||||
| Total from investment operations | 2.60 | 3.36 | 7.08 | 4.45 | 2.73 | 3.56 | ||||||||||||||||||||||||||||||||||||||||||||||||||||||||||||||||||||||||||||||||||||||||||||||||||||||||||||||||
| Less distributions | ||||||||||||||||||||||||||||||||||||||||||||||||||||||||||||||||||||||||||||||||||||||||||||||||||||||||||||||||||||||
| From net realized gain | (6.10 | ) | (1.21 | ) | (0.79 | ) | (0.98 | ) | — | — | ||||||||||||||||||||||||||||||||||||||||||||||||||||||||||||||||||||||||||||||||||||||||||||||||||||||||||||
| Total distributions | (6.10 | ) | (1.21 | ) | (0.79 | ) | (0.98 | ) | — | — | ||||||||||||||||||||||||||||||||||||||||||||||||||||||||||||||||||||||||||||||||||||||||||||||||||||||||||||
| Net asset value, end of period | $37.30 | $40.80 | $38.65 | $32.36 | $28.89 | $26.16 | ||||||||||||||||||||||||||||||||||||||||||||||||||||||||||||||||||||||||||||||||||||||||||||||||||||||||||||||||
| Total return (%)3,4 | 7.71 | 5 | 8.93 | 22.37 | 16.07 | 10.44 | 15.75 | |||||||||||||||||||||||||||||||||||||||||||||||||||||||||||||||||||||||||||||||||||||||||||||||||||||||||||||||
| Ratios and supplemental data | ||||||||||||||||||||||||||||||||||||||||||||||||||||||||||||||||||||||||||||||||||||||||||||||||||||||||||||||||||||||
| Net assets, end of period (in millions) | $26 | $27 | $33 | $30 | $27 | $39 | ||||||||||||||||||||||||||||||||||||||||||||||||||||||||||||||||||||||||||||||||||||||||||||||||||||||||||||||||
| Ratios (as a percentage of average net assets): | ||||||||||||||||||||||||||||||||||||||||||||||||||||||||||||||||||||||||||||||||||||||||||||||||||||||||||||||||||||||
| Expenses before reductions | 1.92 | 6 | 1.94 | 1.99 | 2.05 | 2.01 | 2.24 | |||||||||||||||||||||||||||||||||||||||||||||||||||||||||||||||||||||||||||||||||||||||||||||||||||||||||||||||
| Expenses including reductions | 1.91 | 6 | 1.93 | 1.98 | 2.05 | 2.00 | 2.05 | |||||||||||||||||||||||||||||||||||||||||||||||||||||||||||||||||||||||||||||||||||||||||||||||||||||||||||||||
| Net investment loss | (0.80 | ) 6 | (0.48 | ) | (0.64 | ) | (0.85 | ) | (0.75 | ) | (0.75 | ) | ||||||||||||||||||||||||||||||||||||||||||||||||||||||||||||||||||||||||||||||||||||||||||||||||||||||||||
| Portfolio turnover (%) | 14 | 43 | 30 | 30 | 50 | 33 | ||||||||||||||||||||||||||||||||||||||||||||||||||||||||||||||||||||||||||||||||||||||||||||||||||||||||||||||||
| 1 | Six months ended 4-30-15. Unaudited. | |||||||||||||||||||||||||||||||||||||
| 2 | Based on average daily shares outstanding. | |||||||||||||||||||||||||||||||||||||
| 3 | Does not reflect the effect of sales charges, if any. | |||||||||||||||||||||||||||||||||||||
| 4 | Total returns would have been lower had certain expenses not been reduced during the applicable periods. | |||||||||||||||||||||||||||||||||||||
| 5 | Not annualized. | |||||||||||||||||||||||||||||||||||||
| 6 | Annualized. | |||||||||||||||||||||||||||||||||||||
| Class C Shares Period ended | 4-30-15 | 1 | 10-31-14 | 10-31-13 | 10-31-12 | 10-31-11 | 10-31-10 | |||||||||||||||||||||||||||||||||||||||||||||||||||||||||||||||||||||||||||||||||||||||||||||||||||||||||||||||
| Per share operating performance | ||||||||||||||||||||||||||||||||||||||||||||||||||||||||||||||||||||||||||||||||||||||||||||||||||||||||||||||||||||||
| Net asset value, beginning of period | $40.81 | $38.66 | $32.37 | $28.90 | $26.16 | $22.61 | ||||||||||||||||||||||||||||||||||||||||||||||||||||||||||||||||||||||||||||||||||||||||||||||||||||||||||||||||
| Net investment loss2 | (0.15 | ) | (0.19 | ) | (0.22 | ) | (0.26 | ) | (0.21 | ) | (0.19 | ) | ||||||||||||||||||||||||||||||||||||||||||||||||||||||||||||||||||||||||||||||||||||||||||||||||||||||||||
| Net realized and unrealized gain on investments | 2.76 | 3.55 | 7.30 | 4.71 | 2.95 | 3.74 | ||||||||||||||||||||||||||||||||||||||||||||||||||||||||||||||||||||||||||||||||||||||||||||||||||||||||||||||||
| Total from investment operations | 2.61 | 3.36 | 7.08 | 4.45 | 2.74 | 3.55 | ||||||||||||||||||||||||||||||||||||||||||||||||||||||||||||||||||||||||||||||||||||||||||||||||||||||||||||||||
| Less distributions | ||||||||||||||||||||||||||||||||||||||||||||||||||||||||||||||||||||||||||||||||||||||||||||||||||||||||||||||||||||||
| From net realized gain | (6.10 | ) | (1.21 | ) | (0.79 | ) | (0.98 | ) | �� | — | — | |||||||||||||||||||||||||||||||||||||||||||||||||||||||||||||||||||||||||||||||||||||||||||||||||||||||||||
| Total distributions | (6.10 | ) | (1.21 | ) | (0.79 | ) | (0.98 | ) | — | — | ||||||||||||||||||||||||||||||||||||||||||||||||||||||||||||||||||||||||||||||||||||||||||||||||||||||||||||
| Net asset value, end of period | $37.32 | $40.81 | $38.66 | $32.37 | $28.90 | $26.16 | ||||||||||||||||||||||||||||||||||||||||||||||||||||||||||||||||||||||||||||||||||||||||||||||||||||||||||||||||
| Total return (%)3,4 | 7.74 | 5 | 8.92 | 22.36 | 16.07 | 10.47 | 15.70 | |||||||||||||||||||||||||||||||||||||||||||||||||||||||||||||||||||||||||||||||||||||||||||||||||||||||||||||||
| Ratios and supplemental data | ||||||||||||||||||||||||||||||||||||||||||||||||||||||||||||||||||||||||||||||||||||||||||||||||||||||||||||||||||||||
| Net assets, end of period (in millions) | $130 | $133 | $130 | $81 | $58 | $60 | ||||||||||||||||||||||||||||||||||||||||||||||||||||||||||||||||||||||||||||||||||||||||||||||||||||||||||||||||
| Ratios (as a percentage of average net assets): | ||||||||||||||||||||||||||||||||||||||||||||||||||||||||||||||||||||||||||||||||||||||||||||||||||||||||||||||||||||||
| Expenses before reductions | 1.92 | 6 | 1.94 | 1.98 | 2.05 | 2.01 | 2.23 | |||||||||||||||||||||||||||||||||||||||||||||||||||||||||||||||||||||||||||||||||||||||||||||||||||||||||||||||
| Expenses including reductions | 1.91 | 6 | 1.93 | 1.98 | 2.05 | 2.01 | 2.05 | |||||||||||||||||||||||||||||||||||||||||||||||||||||||||||||||||||||||||||||||||||||||||||||||||||||||||||||||
| Net investment loss | (0.80 | ) 6 | (0.48 | ) | (0.65 | ) | (0.85 | ) | (0.75 | ) | (0.76 | ) | ||||||||||||||||||||||||||||||||||||||||||||||||||||||||||||||||||||||||||||||||||||||||||||||||||||||||||
| Portfolio turnover (%) | 14 | 43 | 30 | 30 | 50 | 33 | ||||||||||||||||||||||||||||||||||||||||||||||||||||||||||||||||||||||||||||||||||||||||||||||||||||||||||||||||
| 1 | Six months ended 4-30-15. Unaudited. | |||||||||||||||||||||||||||||||||||||
| 2 | Based on average daily shares outstanding. | |||||||||||||||||||||||||||||||||||||
| 3 | Does not reflect the effect of sales charges, if any. | |||||||||||||||||||||||||||||||||||||
| 4 | Total returns would have been lower had certain expenses not been reduced during the applicable periods. | |||||||||||||||||||||||||||||||||||||
| 5 | Not annualized. | |||||||||||||||||||||||||||||||||||||
| 6 | Annualized. | |||||||||||||||||||||||||||||||||||||
| Class I Shares Period ended | 4-30-15 | 1 | 10-31-14 | 10-31-13 | 10-31-12 | 10-31-11 | 10-31-10 | |||||||||||||||||||||||||||||||||||||||||||||||||||||||||||||||||||||||||||||||||||||||||||||||||||||||||||||||
| Per share operating performance | ||||||||||||||||||||||||||||||||||||||||||||||||||||||||||||||||||||||||||||||||||||||||||||||||||||||||||||||||||||||
| Net asset value, beginning of period | $47.12 | $44.12 | $36.44 | $32.06 | $28.69 | $24.55 | ||||||||||||||||||||||||||||||||||||||||||||||||||||||||||||||||||||||||||||||||||||||||||||||||||||||||||||||||
| Net investment income2 | 0.05 | 0.24 | 0.16 | 0.08 | 0.12 | 0.11 | ||||||||||||||||||||||||||||||||||||||||||||||||||||||||||||||||||||||||||||||||||||||||||||||||||||||||||||||||
| Net realized and unrealized gain (loss) on investments | 3.25 | 4.07 | 8.31 | 5.28 | 3.25 | 4.10 | ||||||||||||||||||||||||||||||||||||||||||||||||||||||||||||||||||||||||||||||||||||||||||||||||||||||||||||||||
| Total from investment operations | 3.30 | 4.31 | 8.47 | 5.36 | 3.37 | 4.21 | ||||||||||||||||||||||||||||||||||||||||||||||||||||||||||||||||||||||||||||||||||||||||||||||||||||||||||||||||
| Less distributions | ||||||||||||||||||||||||||||||||||||||||||||||||||||||||||||||||||||||||||||||||||||||||||||||||||||||||||||||||||||||
| From net investment income | (0.18 | ) | (0.10 | ) | — | — | — | (0.07 | ) | |||||||||||||||||||||||||||||||||||||||||||||||||||||||||||||||||||||||||||||||||||||||||||||||||||||||||||||
| From net realized gain | (6.10 | ) | (1.21 | ) | (0.79 | ) | (0.98 | ) | — | — | ||||||||||||||||||||||||||||||||||||||||||||||||||||||||||||||||||||||||||||||||||||||||||||||||||||||||||||
| Total distributions | (6.28 | ) | (1.31 | ) | (0.79 | ) | �� | (0.98 | ) | — | (0.07 | ) | ||||||||||||||||||||||||||||||||||||||||||||||||||||||||||||||||||||||||||||||||||||||||||||||||||||||||||
| Net asset value, end of period | $44.14 | $47.12 | $44.12 | $36.44 | $32.06 | $28.69 | ||||||||||||||||||||||||||||||||||||||||||||||||||||||||||||||||||||||||||||||||||||||||||||||||||||||||||||||||
| Total return (%)3 | 8.28 | 4 | 10.01 | 23.70 | 17.36 | 11.75 | 17.15 | |||||||||||||||||||||||||||||||||||||||||||||||||||||||||||||||||||||||||||||||||||||||||||||||||||||||||||||||
| Ratios and supplemental data | ||||||||||||||||||||||||||||||||||||||||||||||||||||||||||||||||||||||||||||||||||||||||||||||||||||||||||||||||||||||
| Net assets, end of period (in millions) | $294 | $317 | $307 | $169 | $55 | $37 | ||||||||||||||||||||||||||||||||||||||||||||||||||||||||||||||||||||||||||||||||||||||||||||||||||||||||||||||||
| Ratios (as a percentage of average net assets): | ||||||||||||||||||||||||||||||||||||||||||||||||||||||||||||||||||||||||||||||||||||||||||||||||||||||||||||||||||||||
| Expenses before reductions | 0.91 | 5 | 0.93 | 0.93 | 0.96 | 0.90 | 0.93 | |||||||||||||||||||||||||||||||||||||||||||||||||||||||||||||||||||||||||||||||||||||||||||||||||||||||||||||||
| Expenses including reductions | 0.90 | 5 | 0.92 | 0.93 | 0.94 | 0.85 | 0.85 | |||||||||||||||||||||||||||||||||||||||||||||||||||||||||||||||||||||||||||||||||||||||||||||||||||||||||||||||
| Net investment income | 0.21 | 5 | 0.53 | 0.41 | 0.24 | 0.39 | 0.43 | |||||||||||||||||||||||||||||||||||||||||||||||||||||||||||||||||||||||||||||||||||||||||||||||||||||||||||||||
| Portfolio turnover (%) | 14 | 43 | 30 | 30 | 50 | 33 | ||||||||||||||||||||||||||||||||||||||||||||||||||||||||||||||||||||||||||||||||||||||||||||||||||||||||||||||||
| 1 | Six months ended 4-30-15. Unaudited. | |||||||||||||||||||||||||||||||||||||
| 2 | Based on average daily shares outstanding. | |||||||||||||||||||||||||||||||||||||
| 3 | Total returns would have been lower had certain expenses not been reduced during the applicable periods. | |||||||||||||||||||||||||||||||||||||
| 4 | Not annualized. | |||||||||||||||||||||||||||||||||||||
| 5 | Annualized. | |||||||||||||||||||||||||||||||||||||
| Class R2 Shares Period ended | 4-30-15 | 1 | 10-31-14 | 10-31-13 | 10-31-12 | 2 | ||||||||||||||||||||||||||||||||||||||||||||||||||||||||||||||||||||||||||||||||||
| Per share operating performance | ||||||||||||||||||||||||||||||||||||||||||||||||||||||||||||||||||||||||||||||||||||||||
| Net asset value, beginning of period | $46.82 | $43.93 | $36.40 | $34.46 | ||||||||||||||||||||||||||||||||||||||||||||||||||||||||||||||||||||||||||||||||||||
| Net investment income (loss)3 | (0.04 | ) | 0.06 | (0.04 | ) | 0.02 | ||||||||||||||||||||||||||||||||||||||||||||||||||||||||||||||||||||||||||||||||||
| Net realized and unrealized gain on investments | 3.24 | 4.06 | 8.36 | 1.92 | ||||||||||||||||||||||||||||||||||||||||||||||||||||||||||||||||||||||||||||||||||||
| Total from investment operations | 3.20 | 4.12 | 8.32 | 1.94 | ||||||||||||||||||||||||||||||||||||||||||||||||||||||||||||||||||||||||||||||||||||
| Less distributions | ||||||||||||||||||||||||||||||||||||||||||||||||||||||||||||||||||||||||||||||||||||||||
| From net investment income | (0.05 | ) | (0.02 | ) | — | — | ||||||||||||||||||||||||||||||||||||||||||||||||||||||||||||||||||||||||||||||||||
| From net realized gain | (6.10 | ) | (1.21 | ) | (0.79 | ) | — | |||||||||||||||||||||||||||||||||||||||||||||||||||||||||||||||||||||||||||||||||
| Total distributions | (6.15 | ) | (1.23 | ) | (0.79 | ) | — | |||||||||||||||||||||||||||||||||||||||||||||||||||||||||||||||||||||||||||||||||
| Net asset value, end of period | $43.87 | $46.82 | $43.93 | $36.40 | ||||||||||||||||||||||||||||||||||||||||||||||||||||||||||||||||||||||||||||||||||||
| Total return (%)4 | 8.04 | 5 | 9.59 | 23.31 | 5.63 | 5 | ||||||||||||||||||||||||||||||||||||||||||||||||||||||||||||||||||||||||||||||||||
| Ratios and supplemental data | ||||||||||||||||||||||||||||||||||||||||||||||||||||||||||||||||||||||||||||||||||||||||
| Net assets, end of period (in millions) | $8 | $34 | $32 | — | 6 | |||||||||||||||||||||||||||||||||||||||||||||||||||||||||||||||||||||||||||||||||||
| Ratios (as a percentage of average net assets): | ||||||||||||||||||||||||||||||||||||||||||||||||||||||||||||||||||||||||||||||||||||||||
| Expenses before reductions | 1.30 | 7 | 1.33 | 1.32 | 1.13 | 7 | ||||||||||||||||||||||||||||||||||||||||||||||||||||||||||||||||||||||||||||||||||
| Expenses including reductions | 1.29 | 7 | 1.32 | 1.31 | 1.13 | 7 | ||||||||||||||||||||||||||||||||||||||||||||||||||||||||||||||||||||||||||||||||||
| Net investment income (loss) | (0.18 | ) 7 | 0.13 | (0.09 | ) | 0.08 | 7 | |||||||||||||||||||||||||||||||||||||||||||||||||||||||||||||||||||||||||||||||||
| Portfolio turnover (%) | 14 | 43 | 30 | 30 | 8 | |||||||||||||||||||||||||||||||||||||||||||||||||||||||||||||||||||||||||||||||||||
| 1 | Six months ended 4-30-15. Unaudited. | |||||||||||||||||||||||||||||||
| 2 | The inception date for Class R2 shares is 3-1-12. | |||||||||||||||||||||||||||||||
| 3 | Based on average daily shares outstanding. | |||||||||||||||||||||||||||||||
| 4 | Total returns would have been lower had certain expenses not been reduced during the applicable periods. | |||||||||||||||||||||||||||||||
| 5 | Not annualized. | |||||||||||||||||||||||||||||||
| 6 | Less than $500,000. | |||||||||||||||||||||||||||||||
| 7 | Annualized. | |||||||||||||||||||||||||||||||
| 8 | The portfolio turnover is shown for the period from 11-1-11 to 10-31-12. | |||||||||||||||||||||||||||||||
| Class R6 Shares Period ended | 4-30-15 | 1 | 10-31-14 | 10-31-13 | 10-31-12 | 10-31-11 | 2 | ||||||||||||||||||||||||||||||||||||||||||||||||||||||||||||||||||||||||||||||||||||||||||||||||
| Per share operating performance | |||||||||||||||||||||||||||||||||||||||||||||||||||||||||||||||||||||||||||||||||||||||||||||||||||||||
| Net asset value, beginning of period | $47.23 | $44.19 | $36.46 | $32.06 | $30.81 | ||||||||||||||||||||||||||||||||||||||||||||||||||||||||||||||||||||||||||||||||||||||||||||||||||
| Net investment income3 | 0.07 | 0.28 | 0.18 | 0.11 | 0.03 | ||||||||||||||||||||||||||||||||||||||||||||||||||||||||||||||||||||||||||||||||||||||||||||||||||
| Net realized and unrealized gain on investments | 3.26 | 4.09 | 8.34 | 5.27 | 1.22 | ||||||||||||||||||||||||||||||||||||||||||||||||||||||||||||||||||||||||||||||||||||||||||||||||||
| Total from investment operations | 3.33 | 4.37 | 8.52 | 5.38 | 1.25 | ||||||||||||||||||||||||||||||||||||||||||||||||||||||||||||||||||||||||||||||||||||||||||||||||||
| Less distributions | |||||||||||||||||||||||||||||||||||||||||||||||||||||||||||||||||||||||||||||||||||||||||||||||||||||||
| From net investment income | (0.23 | ) | (0.12 | ) | — | — | — | ||||||||||||||||||||||||||||||||||||||||||||||||||||||||||||||||||||||||||||||||||||||||||||||||
| From net realized gain | (6.10 | ) | (1.21 | ) | (0.79 | ) | (0.98 | ) | — | ||||||||||||||||||||||||||||||||||||||||||||||||||||||||||||||||||||||||||||||||||||||||||||||
| Total distributions | (6.33 | ) | (1.33 | ) | (0.79 | ) | (0.98 | ) | — | ||||||||||||||||||||||||||||||||||||||||||||||||||||||||||||||||||||||||||||||||||||||||||||||
| Net asset value, end of period | $44.23 | $47.23 | $44.19 | $36.46 | $32.06 | ||||||||||||||||||||||||||||||||||||||||||||||||||||||||||||||||||||||||||||||||||||||||||||||||||
| Total return (%)4 | 8.32 | 5 | 10.15 | 23.83 | 17.42 | 4.06 | 5 | ||||||||||||||||||||||||||||||||||||||||||||||||||||||||||||||||||||||||||||||||||||||||||||||||
| Ratios and supplemental data | |||||||||||||||||||||||||||||||||||||||||||||||||||||||||||||||||||||||||||||||||||||||||||||||||||||||
| Net assets, end of period (in millions) | $4 | $4 | $4 | — | 6 | — | 6 | ||||||||||||||||||||||||||||||||||||||||||||||||||||||||||||||||||||||||||||||||||||||||||||||||
| Ratios (as a percentage of average net assets): | |||||||||||||||||||||||||||||||||||||||||||||||||||||||||||||||||||||||||||||||||||||||||||||||||||||||
| Expenses before reductions | 0.82 | 7 | 0.83 | 0.84 | 0.88 | 0.88 | 7 | ||||||||||||||||||||||||||||||||||||||||||||||||||||||||||||||||||||||||||||||||||||||||||||||||
| Expenses including reductions | 0.79 | 7 | 0.80 | 0.84 | 0.85 | 0.85 | 7 | ||||||||||||||||||||||||||||||||||||||||||||||||||||||||||||||||||||||||||||||||||||||||||||||||
| Net investment income | 0.31 | 7 | 0.64 | 0.47 | 0.30 | 0.66 | 7 | ||||||||||||||||||||||||||||||||||||||||||||||||||||||||||||||||||||||||||||||||||||||||||||||||
| Portfolio turnover (%) | 14 | 43 | 30 | 30 | 50 | 8 | |||||||||||||||||||||||||||||||||||||||||||||||||||||||||||||||||||||||||||||||||||||||||||||||||
| 1 | Six months ended 4-30-15. Unaudited. | |||||||||||||||||||||||||||||||||||
| 2 | The inception date for Class R6 shares is 9-1-11 | |||||||||||||||||||||||||||||||||||
| 3 | Based on average daily shares outstanding. | |||||||||||||||||||||||||||||||||||
| 4 | Total returns would have been lower had certain expenses not been reduced during the applicable periods. | |||||||||||||||||||||||||||||||||||
| 5 | Not annualized. | |||||||||||||||||||||||||||||||||||
| 6 | Less than $500,000. | |||||||||||||||||||||||||||||||||||
| 7 | Annualized. | |||||||||||||||||||||||||||||||||||
| 8 | The portfolio turnover is shown for the period from 11-1-10 to 10-31-11. | |||||||||||||||||||||||||||||||||||
Note 1 — Organization
John Hancock U.S. Global Leaders Growth Fund (the fund) is a series of John Hancock Capital Series (the Trust), an open-end management investment company organized as a Massachusetts business trust and registered under the Investment Company Act of 1940, as amended (the 1940 Act). The investment objective of the fund is to seek long-term growth of capital.
The fund may offer multiple classes of shares. The shares currently offered are detailed in the Statement of assets and liabilities. Class A and Class C shares are offered to all investors. Class B shares are closed to new investors. Class I shares are offered to institutions and certain investors. Class R2 shares are available only to certain retirement plans. Class R6 shares are available only to certain retirement plans, institutions and other investors. Shareholders of each class have exclusive voting rights to matters that affect that class. The distribution and service fees, if any, and transfer agent fees, for each class may differ. Class B shares convert to Class A shares eight years after purchase.
Note 2 — Significant accounting policies
The financial statements have been prepared in conformity with accounting principles generally accepted in the United States of America (US GAAP), which require management to make certain estimates and assumptions as of the date of the financial statements. Actual results could differ from those estimates and those differences could be significant. The fund qualifies as an investment company under Topic 946 of Accounting Standards Codification of US GAAP.
Events or transactions occurring after the end of the fiscal period through the date that the financial statements were issued have been evaluated in the preparation of the financial statements. The following summarizes the significant accounting policies of the fund:
Security valuation. Investments are stated at value as of the close of regular trading on the New York Stock Exchange (NYSE), normally at 4:00 p.m., Eastern Time. In order to value the securities, the fund uses the following valuation techniques: Equity securities held by the fund are valued at the last sale price or official closing price on the exchange where the security was acquired or most likely will be sold. In the event there were no sales during the day or closing prices are not available, the securities are valued using the last available bid price. Investments by the fund in open-end mutual funds, including John Hancock Collateral Trust (JHCT), are valued at their respective net asset values each business day. Other portfolio securities and assets, for which reliable market quotations are not readily available, are valued at fair value as determined in good faith by the fund's Pricing Committee following procedures established by the Board of Trustees. The frequency with which these fair valuation procedures are used cannot be predicted and fair value of securities may differ significantly from the value that would have been used had a ready market for such securities existed.
The fund uses a three-tier hierarchy to prioritize the pricing assumptions, referred to as inputs, used in valuation techniques to measure fair value. Level 1 includes securities valued using quoted prices in active markets for identical securities. Level 2 includes securities valued using other significant observable inputs. Observable inputs may include quoted prices for similar securities, interest rates, prepayment speeds and credit risk. Prices for securities valued using these inputs are received from independent pricing vendors and brokers and are based on an evaluation of the inputs described. Level 3 includes securities valued using significant unobservable inputs when market prices are not readily available or reliable, including the fund's own assumptions in determining the fair value of investments. Factors used in determining value may include market or issuer specific events or trends, changes in interest rates and credit quality. The inputs or methodology used for valuing securities are not necessarily an indication of the risks associated with investing in those securities. Changes in valuation techniques may result in transfers into or out of an assigned level within the disclosure hierarchy.
As of April 30, 2015, all investments are categorized as Level 1 under the hierarchy described above.
Security transactions and related investment income. Investment security transactions are accounted for on a trade date plus one basis for daily net asset value calculations. However, for financial reporting purposes, investment transactions are reported on trade date. Interest income is accrued as earned. Dividend income is recorded on the ex-date, except for dividends of foreign securities where the dividend may not be known until after the ex-date. In those cases, dividend income, net of withholding taxes, is recorded when the fund becomes aware of the dividends. Foreign taxes are provided for based on
25
the fund's understanding of the tax rules and rates that exist in the foreign markets in which it invests. Gains and losses on securities sold are determined on the basis of identified cost and may include proceeds from litigation.
Securities lending. The fund may lend its securities to earn additional income. The fund receives cash collateral from the borrower in an amount not less than the market value of the loaned securities. The fund will invest its collateral in JHCT, an affiliate of the fund, which has a floating net asset value and is registered with the Securities and Exchange Commission as an investment company. JHCT invests cash received as collateral as part of the securities lending program in short-term money market investments. The fund will receive the benefit of any gains and bear any losses generated by JHCT with respect to the cash collateral.
If a borrower fails to return loaned securities when due, then the lending agent is responsible and indemnifies the fund for the lent securities. The lending agent uses the collateral received from the borrower to purchase replacement securities of the same issue, type, class and series of the loaned securities. If the value of the collateral is less than the purchase cost of replacement securities, the lending agent is responsible for satisfying the shortfall but only to the extent that the shortfall is not due to any decrease in the value of JHCT.
Although the risk of the loss of the securities lent is mitigated by receiving collateral from the borrower and through lending agent indemnification, the fund could experience a delay in recovering securities or could experience a lower than expected return if the borrower fails to return the securities on a timely basis. The fund may receive compensation for lending its securities by retaining a portion of the return on the investment of the collateral and compensation from fees earned from borrowers of the securities. Net income received from JHCT is a component of securities lending income as recorded on the Statement of operations.
Obligations to repay collateral received by the fund is shown on the Statement of assets and liabilities as Payable upon return of securities loaned.
Foreign taxes. The fund may be subject to withholding tax on income and/or capital gains or repatriation taxes imposed by certain countries in which the fund invests. Taxes are accrued based upon investment income, realized gains or unrealized appreciation.
Line of credit. The fund may borrow from banks for temporary or emergency purposes, including meeting redemption requests that otherwise might require the untimely sale of securities. Pursuant to the fund's custodian agreement, the custodian may loan money to the fund to make properly authorized payments. The fund is obligated to repay the custodian for any overdraft, including any related costs or expenses. The custodian may have a lien, security interest or security entitlement in any fund property that is not otherwise segregated or pledged, to the extent of any overdraft, and to the maximum extent permitted by law.
In addition, the fund and other affiliated funds have entered into an agreement with Citibank N.A. that enables them to participate in a $300 million unsecured committed line of credit. A commitment fee, payable at the end of each calendar quarter, based on the average daily unused portion of the line of credit, is charged to each participating fund on a pro rata basis and is reflected in Other expenses on the Statement of operations. Commitment fees for the six months ended April 30, 2015 were $1,443. For the six months ended April 30, 2015, the fund had no borrowings under the line of credit.
Expenses. Within the John Hancock group of funds complex, expenses that are directly attributable to an individual fund are allocated to such fund. Expenses that are not readily attributable to a specific fund are allocated among all funds in an equitable manner, taking into consideration, among other things, the nature and type of expense and the fund's relative net assets. Expense estimates are accrued in the period to which they relate and adjustments are made when actual amounts are known.
Class allocations. Income, common expenses and realized and unrealized gains (losses) are determined at the fund level and allocated daily to each class of shares based on the net assets of the class. Class-specific expenses, such as distribution and service fees, if any, and transfer agent fees, are calculated daily for each class, based on the net asset value of the class and the applicable specific expense rates.
26
Federal income taxes. The fund intends to continue to qualify as a regulated investment company by complying with the applicable provisions of the Internal Revenue Code and will not be subject to federal income tax on taxable income that is distributed to shareholders. Therefore, no federal income tax provision is required.
As of October 31, 2014, the fund had no uncertain tax positions that would require financial statement recognition, derecognition or disclosure. The fund's federal tax returns are subject to examination by the Internal Revenue Service for a period of three years.
Distribution of income and gains. Distributions to shareholders from net investment income and net realized gains, if any, are recorded on the ex-date. The fund generally declares and pays dividends and capital gain distributions, if any, annually.
Distributions paid by the fund with respect to each class of shares are calculated in the same manner, at the same time and in the same amount, except for the effect of class level expenses that may be applied differently to each class.
Such distributions, on a tax basis, are determined in conformity with income tax regulations, which may differ from US GAAP.
Capital accounts within the financial statements are adjusted for permanent book-tax differences. These adjustments have no impact on net assets or the results of operations. Temporary book-tax differences, if any, will reverse in a subsequent period. Book-tax differences are primarily attributable to wash sale loss deferrals and litigation proceeds.
Note 3 — Guarantees and indemnifications
Under the Trust's organizational documents, its Officers and Trustees are indemnified against certain liabilities arising out of the performance of their duties to the Trust, including the fund. Additionally, in the normal course of business, the fund enters into contracts with service providers that contain general indemnification clauses. The fund's maximum exposure under these arrangements is unknown, as this would involve future claims that may be made against the fund that have not yet occurred. The risk of material loss from such claims is considered remote.
Note 4 — Fees and transactions with affiliates
John Hancock Advisers, LLC (the Advisor) serves as investment advisor for the fund. John Hancock Funds, LLC (the Distributor), an affiliate of the Advisor, serves as principal underwriter of the fund. The Advisor and the Distributor are indirect, wholly owned subsidiaries of Manulife Financial Corporation (MFC).
Management fee. The fund has an investment management agreement with the Advisor under which the fund pays a monthly management fee to the Advisor equivalent, on an annual basis, to the sum of: (a) 0.75% of the first $500 million of the fund's average daily net assets; (b) 0.73% of the next $500 million of the fund's average daily net assets; (c) 0.71% of the next $1 billion of the fund's average daily net assets; (d) 0.70% of the next $3 billion of the fund's average daily net assets; and (e) 0.65% of the fund's average daily net assets in excess of $5 billion. The Advisor has a subadvisory agreement with Sustainable Growth Advisers, LP. The fund is not responsible for payment of the subadvisory fees.
The Advisor has contractually agreed to waive a portion of its management fee and/or reimburse expenses for certain funds of the John Hancock funds complex, including the fund (the participating portfolios). This waiver is based upon aggregate net assets of all the participating portfolios. The amount of the reimbursement is calculated daily and allocated among all the participating portfolios in proportion to the daily net assets of each fund. During the six months ended April 30, 2015, this waiver amounted to 0.01% of the fund's average net assets. This arrangement may be amended or terminated at any time by the Advisor upon notice to the funds and with approval of the Board of Trustees.
The Advisor has contractually agreed to waive and/or reimburse all class-specific expenses for Class R6 shares of the fund to the extent they exceed 0.00% of average annual net assets, on an annualized basis. The waiver expires on February 29, 2016, unless renewed by mutual agreement of the fund and the Advisor based upon a determination that this is appropriate under the circumstances at that time.
27
Prior to March 1, 2015, the Advisor had contractually agreed to waive and/or reimburse all class specific expenses for Class B shares of the fund, including Rule 12b-1 fees and transfer agency fees and service fees, as applicable, to the extent they exceeded 1.30% of average annual net assets attributable to Class B shares.
Prior to March 1, 2015, the Advisor contractually agreed to reduce its management fee or, if necessary, make payment to Class R6 shares in an amount equal to the amount by which expenses of the share class exceeded 0.85% of average annual net assets, on an annualized basis.
For the six months ended April 30, 2015, these expense reductions described above amounted to the following:
| Class | Expense reduction | Class | Expense reduction | |
| Class A | $23,092 | Class R2 | $1,180 | |
| Class B | 1,003 | Class R6 | 427 | |
| Class C | 4,983 | Total | $42,288 | |
| Class I | 11,603 |
The investment management fees, including the impact of the waivers and reimbursements as described above, incurred for the six months ended April 30, 2015 were equivalent to a net annual effective rate of 0.73% of the fund's average daily net assets.
Accounting and legal services. Pursuant to the Accounting and Legal Services Agreement, the fund reimburses the Advisor for all expenses associated with providing the administrative, financial, legal, accounting and recordkeeping services to the fund, including the preparation of all tax returns, periodic reports to shareholders and regulatory reports, among other services. These expenses are allocated to each share class based on its relative net assets at the time the expense was incurred. These accounting and legal services fees incurred for the six months ended April 30, 2015 amounted to an annual rate of 0.01% of the fund's average daily net assets.
Distribution and service plans. The fund has a distribution agreement with the Distributor. The fund has adopted distribution and service plans with respect to Class A, Class B, Class C and Class R2 pursuant to Rule 12b-1 under the 1940 Act, to pay the Distributor for services provided as the distributor of shares of the fund. In addition, under a service plan for Class R2 shares, the fund pays for certain other services. The fund may pay up to the following contractual rates of distribution and service fees under these arrangements, expressed as an annual percentage of average daily net assets for each class of the fund's shares.
| Class | Rule 12b-1 fee | Service fee | Class | Rule 12b-1 fee | Service fee | |
| Class A | 0.25% | — | Class C | 1.00% | — | |
| Class B | 1.00% | — | Class R2 | 0.25% | 0.25% |
Sales charges. Class A shares are assessed up-front sales charges, which resulted in payments to the Distributor amounting to $1,037,455 for the six months ended April 30, 2015. Of this amount, $177,045 was retained and used for printing prospectuses, advertising, sales literature and other purposes, $844,133 was paid as sales commissions to broker-dealers and $16,277 was paid as sales commissions to sales personnel of Signator Investors, Inc., a broker-dealer affiliate of the Advisor.
Class A, Class B and Class C shares may be subject to contingent deferred sales charges (CDSCs). Certain Class A shares that are acquired through purchases of $1 million or more and are redeemed within one year of purchase are subject to a 1.00% sales charge. Class B shares that are redeemed within six years of purchase are subject to CDSCs, at declining rates, beginning at 5.00%. Class C shares that are redeemed within one year of purchase are subject to a 1.00% CDSC. CDSCs are applied to the lesser of the current market value at the time of redemption or the original purchase cost of the shares being redeemed. Proceeds from CDSCs are used to compensate the Distributor for providing distribution-related services in connection with the sale of these shares. During the six months ended April 30, 2015, CDSCs received by the Distributor amounted to $4,440, $18,668 and $5,221 for Class A, Class B and Class C shares, respectively.
28
Transfer agent fees. The fund has a transfer agent agreement with John Hancock Signature Services, Inc. (Signature Services), an affiliate of the Advisor. The transfer agent fees paid to Signature Services are determined based on the cost to Signature Services (Signature Services Cost) of providing recordkeeping services. The Signature Services Cost includes a component of allocated John Hancock corporate overhead for providing transfer agent services to the fund and to all other John Hancock affiliated funds. It also includes out-of-pocket expenses, including payments made to third-parties for recordkeeping services provided to their clients who invest in one or more John Hancock funds. In addition, Signature Services Cost may be reduced by certain fees that Signature Services receives in connection with retirement and small accounts. Signature Services Cost is calculated monthly and allocated, as applicable, to five categories of share classes: Retail Share and Institutional Classes of Non-Municipal Bond Funds, Class R6 Shares, Retirement Share Classes and Municipal Bond Share Classes. Within each of these categories, the applicable costs are allocated to the affected John Hancock affiliated funds and/or classes, based on the relative average daily net assets.
Class level expenses. Class level expenses for the six months ended April 30, 2015 were:
| Class | Distribution and service fees | Transfer agent fees |
| Class A | $755,615 | $362,358 |
| Class B | 131,451 | 15,713 |
| Class C | 652,691 | 78,137 |
| Class I | — | 158,663 |
| Class R2 | 75,871 | 2,233 |
| Class R6 | — | 279 |
| Total | $1,615,628 | $617,383 |
Trustee expenses. The fund compensates each Trustee who is not an employee of the Advisor or its affiliates. The costs of paying Trustee compensation and expenses are allocated to each fund based on its net assets relative to other funds within the John Hancock group of funds complex.
Note 5 — Fund share transactions
Transactions in fund shares for the six months ended April 30, 2015 and the year ended October 31, 2014 were as follows:
| Six months ended 4-30-15 | Year ended 10-31-14 | |||||||||||||||||||||||||
| Shares | Amount | Shares | Amount | |||||||||||||||||||||||
| Class A shares | ||||||||||||||||||||||||||
| Sold | 1,437,918 | $59,938,831 | 3,738,416 | $159,056,967 | ||||||||||||||||||||||
| Distributions reinvested | 2,042,994 | 78,369,240 | 477,472 | 19,810,284 | ||||||||||||||||||||||
| Repurchased | (1,884,228 | ) | (78,578,863 | ) | (7,393,831 | ) | (314,311,259 | ) | ||||||||||||||||||
| Net increase (decrease) | 1,596,684 | $59,729,208 | (3,177,943 | ) | ($135,444,008 | ) | ||||||||||||||||||||
| Class B shares | ||||||||||||||||||||||||||
| Sold | 16,743 | $596,230 | 39,779 | $1,546,699 | ||||||||||||||||||||||
| Distributions reinvested | 103,355 | 3,538,881 | 22,554 | 853,437 | ||||||||||||||||||||||
| Repurchased | (99,054 | ) | (3,711,140 | ) | (235,132 | ) | (9,106,020 | ) | ||||||||||||||||||
| Net increase (decrease) | 21,044 | $423,971 | (172,799 | ) | ($6,705,884 | ) | ||||||||||||||||||||
| Class C shares | ||||||||||||||||||||||||||
| Sold | 298,362 | $10,838,486 | 583,313 | $22,598,985 | ||||||||||||||||||||||
| Distributions reinvested | 455,791 | 15,610,833 | 81,395 | 3,081,624 | ||||||||||||||||||||||
| Repurchased | (517,272 | ) | (19,210,343 | ) | (782,703 | ) | (30,326,973 | ) | ||||||||||||||||||
| Net increase (decrease) | 236,881 | $7,238,976 | (117,995 | ) | ($4,646,364 | ) | ||||||||||||||||||||
29
| Six months ended 4-30-15 | Year ended 10-31-14 | |||||||||||||||||||||||||
| Shares | Amount | Shares | Amount | |||||||||||||||||||||||
| Class I shares | ||||||||||||||||||||||||||
| Sold | 842,876 | $36,350,324 | 3,152,881 | $140,977,893 | ||||||||||||||||||||||
| Distributions reinvested | 866,698 | 34,988,580 | 167,837 | 7,270,696 | ||||||||||||||||||||||
| Repurchased | (1,788,403 | ) | (78,056,029 | ) | (3,557,174 | ) | (160,154,012 | ) | ||||||||||||||||||
| Net decrease | (78,829 | ) | ($6,717,125 | ) | (236,456 | ) | ($11,905,423 | ) | ||||||||||||||||||
| Class R2 shares | ||||||||||||||||||||||||||
| Sold | 105,336 | $4,504,229 | 411,884 | $18,203,020 | ||||||||||||||||||||||
| Distributions reinvested | 98,228 | 3,946,810 | 16,421 | 709,383 | ||||||||||||||||||||||
| Repurchased | (744,416 | ) | (32,646,678 | ) | (424,932 | ) | (18,951,370 | ) | ||||||||||||||||||
| Net increase (decrease) | (540,852 | ) | ($24,195,639 | ) | 3,373 | ($38,967 | ) | |||||||||||||||||||
| Class R6 shares | ||||||||||||||||||||||||||
| Sold | 22,362 | $954,307 | 25,427 | $1,127,747 | ||||||||||||||||||||||
| Distributions reinvested | 12,529 | 506,556 | 2,576 | 111,747 | ||||||||||||||||||||||
| Repurchased | (21,532 | ) | (912,831 | ) | (32,954 | ) | (1,464,748 | ) | ||||||||||||||||||
| Net increase (decrease) | 13,359 | $548,032 | (4,951 | ) | ($225,254 | ) | ||||||||||||||||||||
| Total net increase (decrease) | 1,248,287 | $37,027,423 | (3,706,771 | ) | ($158,965,900 | ) | ||||||||||||||||||||
Note 6 — Purchase and sale of securities
Purchases and sales of securities, other than short-term investments, amounted to $148,926,087 and $269,861,883, respectively, for the six months ended April 30, 2015.
Note 7 — Industry or sector risk
The fund may invest a large percentage of its assets in one or more particular industries or sectors of the economy. If a large percentage of the fund's assets are economically tied to a single or small number of industries or sectors of the economy, the fund will be less diversified than a more broadly diversified fund, and it may cause the fund to underperform if that industry or sector underperforms. In addition, focusing on a particular industry or sector may make the fund's net asset value more volatile. Further, a fund that invests in particular industries or sectors is particularly susceptible to the impact of market, economic, regulatory and other factors affecting those industries or sectors.
30
Trustees James M. Oates, Chairperson Officers Andrew G. Arnott John J. Danello Francis V. Knox, Jr. Charles A. Rizzo Salvatore Schiavone | Investment advisor John Hancock Advisers, LLC Subadvisor Sustainable Growth Advisers, LP (SGA) Principal distributor John Hancock Funds, LLC Custodian State Street Bank and Trust Company Transfer agent John Hancock Signature Services, Inc. Legal counsel K&L Gates LLP |
*Member of the Audit Committee
†Non-Independent Trustee
#Effective 3-10-15
The fund's proxy voting policies and procedures, as well as the fund proxy voting record for the most recent twelve-month period ended June 30, are available free of charge on the Securities and Exchange Commission (SEC) website at sec.gov or on our website.
The fund's complete list of portfolio holdings, for the first and third fiscal quarters, is filed with the SEC on Form N-Q. The fund's Form N-Q is available on our website and the SEC's website, sec.gov, and can be reviewed and copied (for a fee) at the SEC's Public Reference Room in Washington, DC. Call 800-SEC-0330 to receive information on the operation of the SEC's Public Reference Room.
We make this information on your fund, as well as monthly portfolio holdings, and other fund details available on our website at jhinvestments.com or by calling 800-225-5291.
| You can also contact us: | |||
| 800-225-5291 jhinvestments.com | Regular mail: John Hancock Signature Services, Inc. | Express mail: John Hancock Signature Services, Inc. | |
31
Family of funds
DOMESTIC EQUITY FUNDS Balanced Blue Chip Growth Classic Value Disciplined Value Disciplined Value Mid Cap Equity-Income Fundamental All Cap Core Fundamental Large Cap Core Fundamental Large Cap Value Large Cap Equity New Opportunities Select Growth Small Cap Equity Small Cap Value Small Company Strategic Growth U.S. Equity U.S. Global Leaders Growth Value Equity GLOBAL AND INTERNATIONAL EQUITY FUNDS Disciplined Value International Emerging Markets Emerging Markets Equity Global Equity Global Opportunities Global Shareholder Yield Greater China Opportunities International Core International Growth International Small Company International Value Equity INCOME FUNDS Bond California Tax-Free Income Core High Yield Emerging Markets Debt Floating Rate Income Focused High Yield Global Income Government Income High Yield Municipal Bond | INCOME FUNDS (continued) Income Investment Grade Bond Money Market Short Duration Credit Opportunities Spectrum Income Strategic Income Opportunities Tax-Free Bond ALTERNATIVE AND SPECIALTY FUNDS Absolute Return Currency Alternative Asset Allocation Enduring Equity Financial Industries Global Absolute Return Strategies Global Conservative Absolute Return Natural Resources Redwood Regional Bank Seaport Technical Opportunities ASSET ALLOCATION Income Allocation Fund Lifestyle Aggressive Portfolio Lifestyle Balanced Portfolio Lifestyle Conservative Portfolio Lifestyle Growth Portfolio Lifestyle Moderate Portfolio Retirement Choices Portfolios (2010-2055) Retirement Living Portfolios (2010-2055) Retirement Living II Portfolios (2010-2055) CLOSED-END FUNDS Financial Opportunities Hedged Equity & Income Income Securities Trust Investors Trust Preferred Income Preferred Income II Preferred Income III Premium Dividend Tax-Advantaged Dividend Income Tax-Advantaged Global Shareholder Yield |
The fund's investment objectives, risks, charges, and expenses are included in the prospectus and should be considered carefully before investing. For a prospectus, contact your financial professional, call John Hancock Investments at 800-225-5291, or visit the fund's website at jhinvestments.com. Please read the prospectus carefully before investing or sending money.
John Hancock Investments
A trusted brand
John Hancock has helped individuals and institutions build and
protect wealth since 1862. Today, we are one of America's strongest
and most-recognized brands.
A better way to invest
As a manager of managers, we search the world to find proven
portfolio teams with specialized expertise for every fund we offer,
then apply vigorous investment oversight to ensure they continue
to meet our uncompromising standards.
Results for investors
Our unique approach to asset management has led to a diverse set
of investments deeply rooted in investor needs, along with strong
risk-adjusted returns across asset classes.

 | John Hancock Funds, LLC n Member FINRA, SIPC 601 Congress Street n Boston, MA 02210-2805 800-225-5291 n jhinvestments.com | |
| This report is for the information of the shareholders of John Hancock U.S. Global Leaders Growth Fund. It is not authorized for distribution to prospective investors unless preceded or accompanied by a prospectus. | ||
| MF230746 | 26SA 4/15 6/15 | |
John Hancock
Classic Value Fund
Semiannual report 4/30/15
A message to shareholders
Dear fellow shareholder,
U.S. economic growth continued, despite recent weakness caused largely by the harsh winter weather. The market expansion that began in 2009 so far remains intact. Positive economic and business news has translated into good news for U.S. investors, with continued solid results for a range of U.S. equity indexes in recent months. Many fixed-income indexes have also seen positive returns in this environment.
Outside of the United States, economies are struggling to replicate the kind of success we have enjoyed at home. Central banks across Europe and Asia have announced dramatic monetary policy measures to promote economic activity—similar to the monetary policy activity of the U.S. Federal Reserve in recent years. As was the case in the United States beginning in 2009, many international markets have rallied in advance of sustained economic progress. China's stock market in particular has delivered extraordinary gains. In fact, our network of asset managers and research firms believes that government and central bank stimulus may prove to be the biggest driver of international market returns in 2015.
While maintaining adequate portfolio diversification is vital in any market environment, we believe it is especially important today given the unprecedented central bank interventions of the past few years and the very real geopolitical risk around the world. The uncertainty of today's global financial markets is one of the reasons we at John Hancock Investments believe it is important for long-term portfolios to have exposure to a diverse range of investments. Now may be a good time to discuss the resilience of your portfolio with your financial advisor.
On behalf of everyone at John Hancock Investments, I'd like to take this opportunity to welcome new shareholders and to thank existing shareholders for the continued trust you've placed in us.
Sincerely,
Andrew G. Arnott
President and Chief Executive Officer
John Hancock Investments
This commentary reflects the CEO's views as of April 30, 2015. They are subject to change at any time. For more up-to-date information, you can visit our website at jhinvestments.com.
John Hancock
Classic Value Fund
1
INVESTMENT OBJECTIVE
The fund seeks long-term growth of capital.
AVERAGE ANNUAL TOTAL RETURNS AS OF 4/30/15 (%)
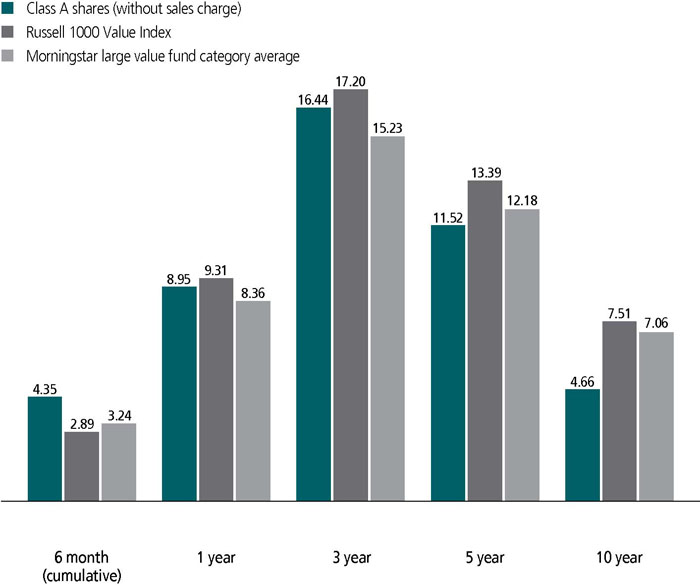
The Russell 1000 Value Index is an unmanaged index containing those securities in the Russell 1000 Index with a less-than-average growth orientation.
It is not possible to invest directly in an index. Index figures do not reflect expenses or sales charges, which would result in lower values.
Figures from Morningstar, Inc. include reinvested distributions and do not take into account sales charges. Actual load-adjusted performance is lower.
The past performance shown here reflects reinvested distributions and the beneficial effect of any expense reductions, and does not guarantee future results. Returns for periods shorter than one year are cumulative, and results for other share classes will vary. Shares will fluctuate in value and, when redeemed, may be worth more or less than their original cost. Current performance may be lower or higher than the performance cited, and can be found at jhinvestments.com or by calling 800-225-5291. For further information on the fund's objectives, risks, and strategy, see the fund's prospectuses.
2
PERFORMANCE HIGHLIGHTS OVER THE LAST SIX MONTHS
Accommodative monetary policy supported equities
Equity markets benefited from continued stimulus from the U.S. Federal Reserve in the form of near-zero interest rates.
Oil price volatility had positive and negative sector effects
A sharp decline in oil prices has caused an economic rebalancing beneficial to sectors related to consumer spending, but detrimental to corporate spending across energy-related sectors.
Stock selection favorably impacted results
The fund outperformed both the Russell 1000 Value Index and its large-cap value peers, primarily due to stock selection in the financials and energy sectors.
PORTFOLIO COMPOSITION AS OF 4/30/15 (%)
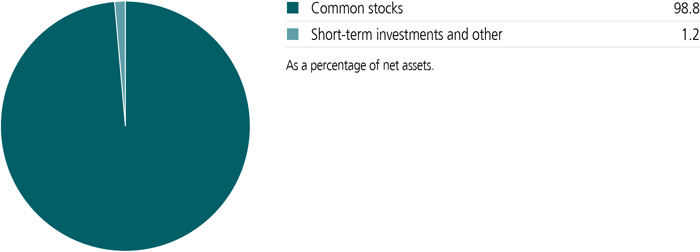
A note about risks
Sector investing is subject to greater risks than the market as a whole. Because the fund may focus on particular sectors of the economy, its performance may depend on the performance of those sectors, and investments focused in one sector may fluctuate more widely than investments diversified across sectors. Value stocks may decline in price. The value of a company's equity securities is subject to changes in the company's financial condition and overall market and economic conditions. Foreign investing has additional risks, such as currency and market volatility and political and social instability. Please see the fund's prospectuses for additional risks.
3

Richard S. Pzena
Portfolio Manager
Pzena Investment Management, LLC

John P. Goetz
Portfolio Manager
Pzena Investment Management, LLC

Benjamin S. Silver, CFA, CPA
Portfolio Manager
Pzena Investment Management, LLC
What major factors impacted the U.S. economy and equity markets during the period?
Stock market volatility increased during the latest six-month period, due primarily to a sharp drop in oil prices, a strengthening U.S. dollar, and uncertainty over when the U.S. Federal Reserve (Fed) will raise interest rates. Crude oil prices declined more than 40% in the first three months of the period, causing exploration and production companies to sharply cut rig counts and spending. While oil prices rallied near the end of the reporting period, the energy sector was in the midst of adjusting to lower crude prices that impacted corporate spending not only among energy companies but also the industrial and financial companies that support the industry. On the positive side, commodity weakness has been a tailwind for consumer-related sectors as well as those that benefit from lower input costs for petroleum products.
Mixed economic results and the negative impact of a strengthening U.S. dollar on the earnings of companies with significant business overseas pushed out expectations for an initial rate hike by the Fed to the second half of 2015. While employment growth continued at a healthy pace over the last six months, the wage growth that could spur inflation has remained subdued. Meanwhile the U.S. economy contracted by 0.7% in the first quarter of 2015, negatively impacted by transitory conditions that included severe winter weather and a West Coast port slowdown, as well capital spending cuts.
What actions have you taken in response to these conditions?
While U.S. equity multiples appear to be extended in many parts of the market, we continued to see attractive valuations in the most economically sensitive sectors, providing ample opportunities to find good businesses trading at attractive prices. Companies with management savvy and balance
4
The fund outperformed its benchmark for the period. What drove these results?
As bottom-up, fundamental investors, individual stock selection was the primary contributor to performance. In particular, merger-and-acquisition activity had a positive impact during the period. Oil services company Baker-Hughes, Inc. was a leading contributor on positive reaction to its pending merger with rival oil services firm Halliburton Company. Shares of office supplies retailer Staples, Inc., benefited from the company's announced acquisition of Office Depot, Inc. The fund does not have positions in Halliburton or Office Depot.
Stocks in the financials sector, whose multiples declined with interest rates, enjoyed a relief rally during the period as spreads between short- and long-term rates began to widen. Global insurance provider Axis Capital Holdings, Ltd., insurance broker Willis Group Holdings PLC, and global investment bank UBS AG were substantial contributors to performance. Health insurer Cigna Corp. also continued to perform well due to strong pricing power and lower nonpayment ratios.
What factors detracted from the fund's performance?
Integrated oil companies Royal Dutch Shell PLC and Exxon Mobil Corp. declined as lower oil prices
SECTOR COMPOSITION AS OF 4/30/15 (%)
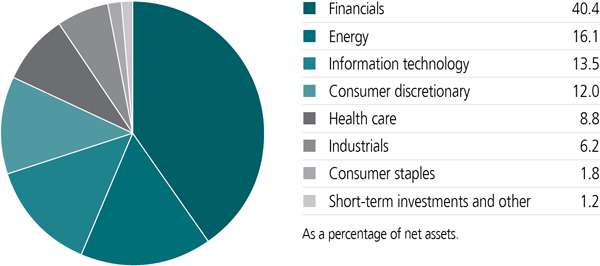
5
Did you make any significant changes to the fund during the period?
We sold out of General Motors Company and purchased Ford Motor Company. We like the exposure to construction, and Ford is the most dominant player in light trucks. The company is also driving results through innovations such as its EcoBoost engine and efficient production platforms.
We also established a new position in Stanley Black & Decker, Inc. Shares of the power tools maker weakened as it embarked on an acquisition program to reduce its reliance on business from home improvement retailers Lowe's Companies, Inc. and Home Depot, Inc. (neither is owned by the fund). Stanley's cash flow has trailed net income, but should normalize as the company focuses on operations. Also in the consumer space, we purchased shares of Wal-Mart Stores, Inc. The discount retailer increased market share during the recession as consumers became more price-conscious, but it has lost business in an improving economy as shoppers return to higher-end stores. We believe wage inflation among lower-income workers will benefit Wal-Mart.
To stick with our price discipline, we sold out of medical supplier Becton, Dickinson and Company after its stock appreciated strongly following its acquisition of CareFusion Corp. We also trimmed
TOP 10 HOLDINGS AS OF 4/30/15 (%)
| BP PLC, ADR | 4.9 |
| Royal Dutch Shell PLC, ADR, Class A | 4.3 |
| Hewlett-Packard Company | 3.5 |
| American International Group, Inc. | 3.4 |
| Citigroup, Inc. | 3.4 |
| Axis Capital Holdings, Ltd. | 3.3 |
| Cigna Corp. | 3.3 |
| Bank of America Corp. | 3.2 |
| Exxon Mobil Corp. | 3.1 |
| UBS Group AG | 3.0 |
| TOTAL | 35.4 |
| As a percentage of net assets. | |
| Cash and cash equivalents are not included. | |
6
the fund's positions in Cigna Corp. and building materials manufacturer Masco Corp., which performed well along with the rest of the home improvement segment as the economy strengthened.
How was the fund positioned at the end of the period?
We remain focused on economically sensitive stocks, which continue to trade at more attractive valuations than stocks in less cyclical sectors. We maintain overweight allocations to the financials, consumer discretionary, and energy sectors, which is a reflection of our bottom-up research.
MANAGED BY
| | Richard S. Pzena On the fund since 1996 Investing since 1980 |
| | John P. Goetz On the fund since 1996 Investing since 1979 |
| | Benjamin S. Silver, CFA, CPA On the fund since 2012 Investing since 1991 |
![]()
COUNTRY COMPOSITION AS OF 4/30/15 (%)
| United States | 82.9 |
| United Kingdom | 6.5 |
| Netherlands | 4.3 |
| Bermuda | 3.3 |
| Switzerland | 3.0 |
| TOTAL | 100.0 |
| As a percentage of net assets. | |
7
TOTAL RETURNS FOR THE PERIOD ENDED APRIL 30, 2015
| Average annual total returns (%) with maximum sales charge | Cumulative total returns (%) with maximum sales charge | ||||||
| 1-year | 5-year | 10-year | 6-month | 5-year | 10-year | ||
| Class A | 3.51 | 10.38 | 4.13 | -0.87 | 63.88 | 49.87 | |
| Class B | 3.09 | 10.42 | 4.04 | -1.08 | 64.14 | 48.57 | |
| Class C | 7.09 | 10.69 | 3.88 | 2.92 | 66.19 | 46.28 | |
| Class I1 | 9.22 | 11.89 | 5.04 | 4.46 | 75.38 | 63.52 | |
| Class R11 | 8.49 | 11.18 | 4.31 | 4.12 | 69.86 | 52.55 | |
| Class R21,2 | 8.83 | 11.55 | 4.63 | 4.24 | 72.69 | 57.20 | |
| Class R31,2 | 8.59 | 11.27 | 4.36 | 4.16 | 70.58 | 53.30 | |
| Class R41,2 | 9.12 | 11.72 | 4.74 | 4.40 | 74.05 | 58.83 | |
| Class R51,2 | 9.26 | 11.94 | 4.99 | 4.50 | 75.74 | 62.74 | |
| Class R61,2 | 9.28 | 11.96 | 5.08 | 4.48 | 75.94 | 64.21 | |
| Index† | 9.31 | 13.39 | 7.51 | 2.89 | 87.41 | 106.24 | |
Performance figures assume all distributions have been reinvested. Figures reflect maximum sales charges on Class A shares of 5% and the applicable contingent deferred sales charge (CDSC) on Class B and Class C shares. The Class B shares' CDSC declines annually between years 1 to 6 according to the following schedule: 5%, 4%, 3%, 3%, 2%, 1%. No sales charge will be assessed after the sixth year. Class C shares held for less than one year are subject to a 1% CDSC. Sales charges are not applicable to Class I, Class R1, Class R2, Class R3, Class R4, Class R5, and Class R6 shares.
The expense ratios of the fund, both net (including any fee waivers and/or expense limitations) and gross (excluding any fee waivers and/or expense limitations), are set forth according to the most recent publicly available prospectuses for the fund and may differ from those disclosed in the Financial highlights tables in this report. Had the fee waivers and expense limitations not been in place, gross expenses would apply. The expense ratios are as follows:
| Class A | Class B | Class C | Class I | Class R1 | Class R2 | Class R3 | Class R4 | Class R5 | Class R6 | |
| Gross (%) | 1.19 | 1.94 | 1.94 | 0.93 | 1.57 | 1.33 | 1.47 | 1.17 | 0.88 | 0.83 |
| Net (%) | 1.19 | 1.94 | 1.94 | 0.93 | 1.57 | 1.33 | 1.47 | 1.07 | 0.88 | 0.81 |
Please refer to the most recent prospectus and annual or semiannual report for more information on expenses and any expense limitation arrangements for each class.
The returns reflect past results and should not be considered indicative of future performance. The return and principal value of an investment will fluctuate so that shares, when redeemed, may be worth more or less than their original cost. Due to market volatility and other factors, the fund's current performance may be higher or lower than the performance shown. For current to the most recent month-end performance data, please call 800-225-5291 or visit the fund's website at jhinvestments.com.
The performance table above and the chart on the next page do not reflect the deduction of taxes that a shareholder would pay on fund distributions or the redemption of fund shares. The fund's performance results reflect any applicable fee waivers or expense reductions, without which the expenses would increase and results would have been less favorable.
| † | Index is the Russell 1000 Value Index. |
See the following page for footnotes.
8
This chart and table show what happened to a hypothetical $10,000 investment in John Hancock Classic Value Fund for the share classes and periods indicated, assuming all distributions were reinvested. For comparison, we've shown the same investment in the Russell 1000 Value Index.
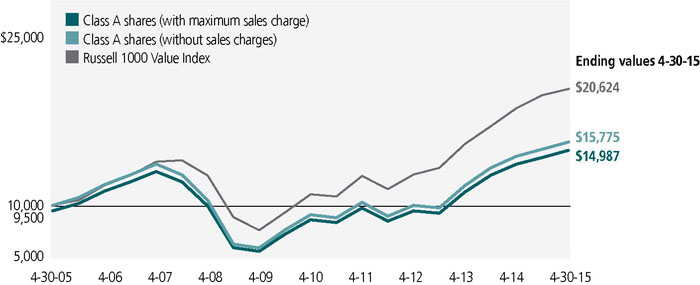
| Start date | With maximum sales charge ($) | Without sales charge ($) | Index ($) | |
| Class B3 | 4-30-05 | 14,857 | 14,857 | 20,624 |
| Class C3 | 4-30-05 | 14,628 | 14,628 | 20,624 |
| Class I1 | 4-30-05 | 16,352 | 16,352 | 20,624 |
| Class R11 | 4-30-05 | 15,255 | 15,255 | 20,624 |
| Class R21,2 | 4-30-05 | 15,720 | 15,720 | 20,624 |
| Class R31,2 | 4-30-05 | 15,330 | 15,330 | 20,624 |
| Class R41,2 | 4-30-05 | 15,883 | 15,883 | 20,624 |
| Class R51,2 | 4-30-05 | 16,274 | 16,274 | 20,624 |
| Class R61,2 | 4-30-05 | 16,421 | 16,421 | 20,624 |
Performance of the classes will vary based on the difference in sales charges paid by shareholders investing in the different classes and the fee structure of those classes.
The Russell 1000 Value Index is an unmanaged index containing those securities in the Russell 1000 Index with a less-than-average growth orientation.
It is not possible to invest directly in an index. Index figures do not reflect expenses or sales charges, which would result in lower values.
Footnotes related to performance pages
| 1 | For certain types of investors, as described in the fund's prospectuses. |
| 2 | Class R3, Class R4, and Class R5 shares were first offered on 5-22-09; Class R6 shares were first offered on 9-1-11; Class R2 shares were first offered on 3-1-12. The returns prior to these dates are those of Class A shares that have been recalculated to apply the gross fees and expenses of Class R3, Class R4, Class R5, Class R6, and Class R2 shares, as applicable. |
| 3 | The contingent deferred sales charge is not applicable. |
9
These examples are intended to help you understand your ongoing operating expenses of investing in the fund so you can compare these costs with the ongoing costs of investing in other mutual funds.
Understanding fund expenses
As a shareholder of the fund, you incur two types of costs:
| • | Transaction costs, which include sales charges (loads) on purchases or redemptions (varies by share class), minimum account fee charge, etc. |
| • | Ongoing operating expenses, including management fees, distribution and service fees (if applicable), and other fund expenses. |
We are presenting only your ongoing operating expenses here.
Actual expenses/actual returns
This example is intended to provide information about the fund's actual ongoing operating expenses, and is based on the fund's actual return. It assumes an account value of $1,000.00 on November 1, 2014, with the same investment held until April 30, 2015.
| Account value on 11-1-2014 | Ending value on 4-30-2015 | Expenses paid during period ended 4-30-20151 | Annualized expense ratio | |
| Class A | $1,000.00 | $1,043.50 | $5.93 | 1.17% |
| Class B | 1,000.00 | 1,039.20 | 9.71 | 1.92% |
| Class C | 1,000.00 | 1,039.20 | 9.71 | 1.92% |
| Class I | 1,000.00 | 1,044.60 | 4.56 | 0.90% |
| Class R1 | 1,000.00 | 1,041.20 | 7.90 | 1.56% |
| Class R2 | 1,000.00 | 1,042.40 | 6.03 | 1.19% |
| Class R3 | 1,000.00 | 1,041.60 | 7.44 | 1.47% |
| Class R4 | 1,000.00 | 1,044.00 | 4.87 | 0.96% |
| Class R5 | 1,000.00 | 1,045.00 | 4.26 | 0.84% |
| Class R6 | 1,000.00 | 1,044.80 | 4.11 | 0.81% |
Together with the value of your account, you may use this information to estimate the operating expenses that you paid over the period. Simply divide your account value at April 30, 2015, by $1,000.00, then multiply it by the "expenses paid" for your share class from the table above. For example, for an account value of $8,600.00, the operating expenses should be calculated as follows:
10
Hypothetical example for comparison purposes
This table allows you to compare the fund's ongoing operating expenses with those of any other fund. It provides an example of the fund's hypothetical account values and hypothetical expenses based on each class's actual expense ratio and an assumed 5% annualized return before expenses (which is not the fund's actual return). It assumes an account value of $1,000.00 on November 1, 2014, with the same investment held until April 30, 2015. Look in any other fund shareholder report to find its hypothetical example and you will be able to compare these expenses. Please remember that these hypothetical account values and expenses may not be used to estimate the actual ending account balance or expenses you paid for the period.
| Account value on 11-1-2014 | Ending value on 4-30-2015 | Expenses paid during period ended 4-30-20151 | Annualized expense ratio | |
| Class A | $1,000.00 | $1,019.00 | $5.86 | 1.17% |
| Class B | 1,000.00 | 1,015.30 | 9.59 | 1.92% |
| Class C | 1,000.00 | 1,015.30 | 9.59 | 1.92% |
| Class I | 1,000.00 | 1,020.30 | 4.51 | 0.90% |
| Class R1 | 1,000.00 | 1,017.10 | 7.80 | 1.56% |
| Class R2 | 1,000.00 | 1,018.90 | 5.96 | 1.19% |
| Class R3 | 1,000.00 | 1,017.50 | 7.35 | 1.47% |
| Class R4 | 1,000.00 | 1,020.00 | 4.81 | 0.96% |
| Class R5 | 1,000.00 | 1,020.60 | 4.21 | 0.84% |
| Class R6 | 1,000.00 | 1,020.80 | 4.06 | 0.81% |
Remember, these examples do not include any transaction costs, therefore, these examples will not help you to determine the relative total costs of owning different funds. If transaction costs were included, your expenses would have been higher. See the prospectuses for details regarding transaction costs.
| 1 | Expenses are equal to the fund's annualized expense ratio, multiplied by the average account value over the period, multiplied by 181/365 (to reflect the one-half year period). |
11
Fund's investments
| As of 4-30-15 (unaudited) | |||||||||||||||||
| Shares | Value | ||||||||||||||||
| Common stocks 98.8% | $2,502,921,936 | ||||||||||||||||
| (Cost $1,923,069,289) | |||||||||||||||||
| Consumer discretionary 12.0% | 303,026,642 | ||||||||||||||||
| Auto components 1.0% | |||||||||||||||||
| TRW Automotive Holdings Corp. (I) | 247,215 | 25,972,408 | |||||||||||||||
| Automobiles 2.1% | |||||||||||||||||
| Ford Motor Company | 3,342,715 | 52,814,897 | |||||||||||||||
| Media 6.9% | |||||||||||||||||
| News Corp., Class A (I) | 3,925,115 | 61,938,315 | |||||||||||||||
| News Corp., Class B (I) | 1,105,809 | 17,217,446 | |||||||||||||||
| Omnicom Group, Inc. | 837,439 | 63,444,379 | |||||||||||||||
| The Interpublic Group of Companies, Inc. | 1,525,475 | 31,790,899 | |||||||||||||||
| Specialty retail 2.0% | |||||||||||||||||
| Staples, Inc. | 3,054,430 | 49,848,298 | |||||||||||||||
| Consumer staples 1.8% | 46,067,608 | ||||||||||||||||
| Food and staples retailing 1.8% | |||||||||||||||||
| Wal-Mart Stores, Inc. | 590,232 | 46,067,608 | |||||||||||||||
| Energy 16.1% | 407,834,185 | ||||||||||||||||
| Energy equipment and services 2.0% | |||||||||||||||||
| Baker Hughes, Inc. | 743,015 | 50,866,807 | |||||||||||||||
| Oil, gas and consumable fuels 14.1% | |||||||||||||||||
| BP PLC, ADR | 2,871,020 | 123,913,222 | |||||||||||||||
| Exxon Mobil Corp. | 892,241 | 77,955,096 | |||||||||||||||
| Murphy Oil Corp. | 959,700 | 45,691,317 | |||||||||||||||
| Royal Dutch Shell PLC, ADR, Class A | 1,724,858 | 109,407,743 | |||||||||||||||
| Financials 40.4% | 1,023,581,598 | ||||||||||||||||
| Banks 13.7% | |||||||||||||||||
| Bank of America Corp. | 5,104,713 | 81,318,078 | |||||||||||||||
| Citigroup, Inc. | 1,599,241 | 85,271,530 | |||||||||||||||
| Comerica, Inc. | 570,739 | 27,058,736 | |||||||||||||||
| JPMorgan Chase & Co. | 1,100,011 | 69,586,696 | |||||||||||||||
| Regions Financial Corp. | 3,515,225 | 34,554,662 | |||||||||||||||
| The PNC Financial Services Group, Inc. | 545,716 | 50,058,529 | |||||||||||||||
| Capital markets 13.1% | |||||||||||||||||
| Franklin Resources, Inc. | 1,205,892 | 62,175,792 | |||||||||||||||
| Morgan Stanley | 1,720,546 | 64,193,571 | |||||||||||||||
| State Street Corp. | 853,802 | 65,845,210 | |||||||||||||||
| The Goldman Sachs Group, Inc. | 319,978 | 62,850,079 | |||||||||||||||
| UBS Group AG (I)(L) | 3,842,526 | 77,119,497 | |||||||||||||||
| Shares | Value | ||||||||||||||||
| Financials (continued) | |||||||||||||||||
| Diversified financial services 2.7% | |||||||||||||||||
| Voya Financial, Inc. | 1,599,993 | $67,743,704 | |||||||||||||||
| Insurance 10.9% | |||||||||||||||||
| American International Group, Inc. | 1,535,327 | 86,423,557 | |||||||||||||||
| Axis Capital Holdings, Ltd. | 1,624,774 | 84,585,734 | |||||||||||||||
| MetLife, Inc. | 1,255,818 | 64,410,905 | |||||||||||||||
| Willis Group Holdings PLC | 830,461 | 40,385,318 | |||||||||||||||
| Health care 8.8% | 223,660,949 | ||||||||||||||||
| Health care equipment and supplies 4.5% | |||||||||||||||||
| Abbott Laboratories | 1,122,077 | 52,086,814 | |||||||||||||||
| Baxter International, Inc. | 916,150 | 62,976,151 | |||||||||||||||
| Health care providers and services 4.3% | |||||||||||||||||
| Cigna Corp. | 670,117 | 83,523,383 | |||||||||||||||
| Laboratory Corp. of America Holdings (I) | 209,724 | 25,074,601 | |||||||||||||||
| Industrials 6.2% | 157,557,933 | ||||||||||||||||
| Building products 1.0% | |||||||||||||||||
| Masco Corp. | 947,097 | 25,088,600 | |||||||||||||||
| Machinery 5.2% | |||||||||||||||||
| Parker Hannifin Corp. | 548,875 | 65,513,720 | |||||||||||||||
| Stanley Black & Decker, Inc. | 678,375 | 66,955,613 | |||||||||||||||
| Information technology 13.5% | 341,193,021 | ||||||||||||||||
| Electronic equipment, instruments and components 1.8% | |||||||||||||||||
| Corning, Inc. | 2,144,050 | 44,874,967 | |||||||||||||||
| Semiconductors and semiconductor equipment 2.6% | |||||||||||||||||
| Intel Corp. | 2,068,739 | 67,337,454 | |||||||||||||||
| Software 5.6% | |||||||||||||||||
| Microsoft Corp. | 1,335,698 | 64,968,351 | |||||||||||||||
| Oracle Corp. | 1,747,489 | 76,225,470 | |||||||||||||||
| Technology hardware, storage and peripherals 3.5% | |||||||||||||||||
| Hewlett-Packard Company | 2,662,626 | 87,786,779 | |||||||||||||||
| Yield (%) | Shares | Value | |||||||||||||||
| Securities lending collateral 0.7% | $18,390,077 | ||||||||||||||||
| (Cost $18,389,667) | |||||||||||||||||
| John Hancock Collateral Trust (W) | 0.1215(Y) | 1,838,052 | 18,390,077 | ||||||||||||||
| Par value | Value | ||||||||||||||||
| Short-term investments 0.7% | $18,819,000 | ||||||||||||||||
| (Cost $18,819,000) | |||||||||||||||||
| Repurchase agreement 0.7% | 18,819,000 | ||||||||||||||||
| Repurchase Agreement with State Street Corp. dated 4-30-15 at 0.000% to be repurchased at $18,819,000 on 5-1-15, collateralized by $19,150,000 Federal National Mortgage Association, 1.670% due 2-10-20 (valued at $19,197,833, including interest) | 18,819,000 | 18,819,000 | |||||||||||||||
| Total investments (Cost $1,960,277,956)† 100.2% | $2,540,131,013 | ||||||||||||||||
| Other assets and liabilities, net (0.2%) | ($6,137,654 | ) | |||||||||||||||
| Total net assets 100.0% | $2,533,993,359 | ||||||||||||||||
| The percentage shown for each investment category is the total value of the category as a percentage of the net assets of the fund. | |||||
| Key to Security Abbreviations and Legend | |||||
| ADR | American Depositary Receipts | ||||
| (I) | Non-income producing security. | ||||
| (L) | A portion of this security is on loan as of 4-30-15. | ||||
| (W) | Investment is an affiliate of the fund, the advisor and/or subadvisor. This investment represents collateral received for securities lending. | ||||
| (Y) | The rate shown is the annualized seven-day yield as of 4-30-15. | ||||
| † | At 4-30-15, the aggregate cost of investment securities for federal income tax purposes was $2,024,699,099. Net unrealized appreciation aggregated $515,431,914, of which $549,876,482 related to appreciated investment securities and $34,444,568 related to depreciated investment securities. | ||||
Financial statements
STATEMENT OF ASSETS AND LIABILITIES 4-30-15 (unaudited)
| Assets | ||||||||||||||||||||||||||||||||||||||||
| Investments in unaffiliated issuers, at value (Cost $1,941,888,289) including $17,788,041 of securities loaned | $2,521,740,936 | |||||||||||||||||||||||||||||||||||||||
| Investments in affiliated issuers, at value (Cost $18,389,667) | 18,390,077 | |||||||||||||||||||||||||||||||||||||||
| Total investments, at value (Cost $1,960,277,956) | 2,540,131,013 | |||||||||||||||||||||||||||||||||||||||
| Cash | 211 | |||||||||||||||||||||||||||||||||||||||
| Receivable for investments sold | 56,289,225 | |||||||||||||||||||||||||||||||||||||||
| Receivable for fund shares sold | 3,791,857 | |||||||||||||||||||||||||||||||||||||||
| Dividends and interest receivable | 1,438,804 | |||||||||||||||||||||||||||||||||||||||
| Receivable for securities lending income | 5,609 | |||||||||||||||||||||||||||||||||||||||
| Other receivables and prepaid expenses | 123,447 | |||||||||||||||||||||||||||||||||||||||
| Total assets | 2,601,780,166 | |||||||||||||||||||||||||||||||||||||||
| Liabilities | ||||||||||||||||||||||||||||||||||||||||
| Payable for investments purchased | 43,516,761 | |||||||||||||||||||||||||||||||||||||||
| Payable for fund shares repurchased | 3,175,443 | |||||||||||||||||||||||||||||||||||||||
| Payable upon return of securities loaned | 18,390,725 | |||||||||||||||||||||||||||||||||||||||
| Payable to affiliates | ||||||||||||||||||||||||||||||||||||||||
| Accounting and legal services fees | 4,350 | |||||||||||||||||||||||||||||||||||||||
| Transfer agent fees | 466,906 | |||||||||||||||||||||||||||||||||||||||
| Distribution and service fees | 348,813 | |||||||||||||||||||||||||||||||||||||||
| Trustees' fees | 3,208 | |||||||||||||||||||||||||||||||||||||||
| Investment management fees | 1,561,113 | |||||||||||||||||||||||||||||||||||||||
| Other liabilities and accrued expenses | 319,488 | |||||||||||||||||||||||||||||||||||||||
| Total liabilities | 67,786,807 | |||||||||||||||||||||||||||||||||||||||
| Net assets | $2,533,993,359 | |||||||||||||||||||||||||||||||||||||||
| Net assets consist of | ||||||||||||||||||||||||||||||||||||||||
| Paid-in capital | $3,705,732,164 | |||||||||||||||||||||||||||||||||||||||
| Undistributed net investment income | 6,594,392 | |||||||||||||||||||||||||||||||||||||||
| Accumulated net realized gain (loss) on investments | (1,758,186,254 | ) | ||||||||||||||||||||||||||||||||||||||
| Net unrealized appreciation (depreciation) on investments | 579,853,057 | |||||||||||||||||||||||||||||||||||||||
| Net assets | $2,533,993,359 | |||||||||||||||||||||||||||||||||||||||
STATEMENT OF ASSETS AND LIABILITIES (continued)
| Net asset value per share | ||||||||||||||||||
| Based on net asset values and shares outstanding-the fund has an unlimited number of shares authorized with no par value | ||||||||||||||||||
| Class A ($382,615,687 ÷ 14,326,338 shares)1 | $26.71 | |||||||||||||||||
| Class B ($9,844,574 ÷ 373,823 shares)1 | $26.33 | |||||||||||||||||
| Class C ($98,334,212 ÷ 3,735,443 shares)1 | $26.32 | |||||||||||||||||
| Class I ($2,035,613,782 ÷ 76,103,989 shares) | $26.75 | |||||||||||||||||
| Class R1 ($4,357,336 ÷ 162,810 shares) | $26.76 | |||||||||||||||||
| Class R2 ($466,724 ÷ 17,483 shares) | $26.70 | |||||||||||||||||
| Class R3 ($1,249,156 ÷ 46,849 shares) | $26.66 | |||||||||||||||||
| Class R4 ($59,480 ÷ 2,224 shares) | $26.74 | |||||||||||||||||
| Class R5 ($106,782 ÷ 3,991.5 shares) | $26.75 | |||||||||||||||||
| Class R6 ($1,345,626 ÷ 50,275 shares) | $26.77 | |||||||||||||||||
| Maximum offering price per share | ||||||||||||||||||
| Class A (net asset value per share ÷ 95%)2 | $28.12 | |||||||||||||||||
| 1 | Redemption price per share is equal to net asset value less any applicable contingent deferred sales charge. | |||||||
| 2 | On single retail sales of less than $50,000. On sales of $50,000 or more and on group sales the offering price is reduced. | |||||||
STATEMENT OF OPERATIONS For the six months ended 4-30-15 (unaudited)
| Investment income | ||||||||||||||||||||||||||||||||||||||||
| Dividends | $26,196,709 | |||||||||||||||||||||||||||||||||||||||
| Securities lending | 83,200 | |||||||||||||||||||||||||||||||||||||||
| Less foreign taxes withheld | (486,410 | ) | ||||||||||||||||||||||||||||||||||||||
| Total investment income | 25,793,499 | |||||||||||||||||||||||||||||||||||||||
| Expenses | ||||||||||||||||||||||||||||||||||||||||
| Investment management fees | 9,764,221 | |||||||||||||||||||||||||||||||||||||||
| Distribution and service fees | 1,053,257 | |||||||||||||||||||||||||||||||||||||||
| Accounting and legal services fees | 181,422 | |||||||||||||||||||||||||||||||||||||||
| Transfer agent fees | 1,394,300 | |||||||||||||||||||||||||||||||||||||||
| Trustees' fees | 36,983 | |||||||||||||||||||||||||||||||||||||||
| State registration fees | 103,212 | |||||||||||||||||||||||||||||||||||||||
| Printing and postage | 163,814 | |||||||||||||||||||||||||||||||||||||||
| Professional fees | 66,765 | |||||||||||||||||||||||||||||||||||||||
| Custodian fees | 138,261 | |||||||||||||||||||||||||||||||||||||||
| Registration and filing fees | 24,218 | |||||||||||||||||||||||||||||||||||||||
| Other | 31,353 | |||||||||||||||||||||||||||||||||||||||
| Total expenses | 12,957,806 | |||||||||||||||||||||||||||||||||||||||
| Less expense reductions | (99,184 | ) | ||||||||||||||||||||||||||||||||||||||
| Net expenses | 12,858,622 | |||||||||||||||||||||||||||||||||||||||
| Net investment income | 12,934,877 | |||||||||||||||||||||||||||||||||||||||
| Realized and unrealized gain (loss) | ||||||||||||||||||||||||||||||||||||||||
| Net realized gain (loss) on | ||||||||||||||||||||||||||||||||||||||||
| Investments in unaffiliated issuers | 178,306,226 | |||||||||||||||||||||||||||||||||||||||
| Investments in affiliated issuers | (778 | ) | ||||||||||||||||||||||||||||||||||||||
| 178,305,448 | ||||||||||||||||||||||||||||||||||||||||
| Change in net unrealized appreciation (depreciation) of | ||||||||||||||||||||||||||||||||||||||||
| Investments in unaffiliated issuers | (70,343,587 | ) | ||||||||||||||||||||||||||||||||||||||
| Investments in affiliated issuers | 288 | |||||||||||||||||||||||||||||||||||||||
| (70,343,299 | ) | |||||||||||||||||||||||||||||||||||||||
| Net realized and unrealized gain | 107,962,149 | |||||||||||||||||||||||||||||||||||||||
| Increase in net assets from operations | $120,897,026 | |||||||||||||||||||||||||||||||||||||||
STATEMENTS OF CHANGES IN NET ASSETS
| Six months ended 4-30-15 | Year ended 10-31-14 | ||||||||||||||||||||||||||||||||||||||||||||
| (unaudited) | |||||||||||||||||||||||||||||||||||||||||||||
| Increase (decrease) in net assets | |||||||||||||||||||||||||||||||||||||||||||||
| From operations | |||||||||||||||||||||||||||||||||||||||||||||
| Net investment income | $12,934,877 | $25,464,152 | |||||||||||||||||||||||||||||||||||||||||||
| Net realized gain | 178,305,448 | 170,336,685 | |||||||||||||||||||||||||||||||||||||||||||
| Change in net unrealized appreciation (depreciation) | (70,343,299 | ) | 144,716,657 | ||||||||||||||||||||||||||||||||||||||||||
| Increase in net assets resulting from operations | 120,897,026 | 340,517,494 | |||||||||||||||||||||||||||||||||||||||||||
| Distributions to shareholders | |||||||||||||||||||||||||||||||||||||||||||||
| From net investment income | |||||||||||||||||||||||||||||||||||||||||||||
| Class A | (3,212,030 | ) | (4,109,470 | ) | |||||||||||||||||||||||||||||||||||||||||
| Class B | (13,671 | ) | (20,261 | ) | |||||||||||||||||||||||||||||||||||||||||
| Class C | (123,133 | ) | (117,229 | ) | |||||||||||||||||||||||||||||||||||||||||
| Class I | (22,957,701 | ) | (23,864,080 | ) | |||||||||||||||||||||||||||||||||||||||||
| Class R1 | (32,345 | ) | (29,251 | ) | |||||||||||||||||||||||||||||||||||||||||
| Class R2 | (3,998 | ) | (4,629 | ) | |||||||||||||||||||||||||||||||||||||||||
| Class R3 | (6,808 | ) | (2,759 | ) | |||||||||||||||||||||||||||||||||||||||||
| Class R4 | (632 | ) | (575 | ) | |||||||||||||||||||||||||||||||||||||||||
| Class R5 | (1,438 | ) | (763 | ) | |||||||||||||||||||||||||||||||||||||||||
| Class R6 | (7,858 | ) | (6,189 | ) | |||||||||||||||||||||||||||||||||||||||||
| Total distributions | (26,359,614 | ) | (28,155,206 | ) | |||||||||||||||||||||||||||||||||||||||||
| From fund share transactions | (421,644,366 | ) | (64,376,552 | ) | |||||||||||||||||||||||||||||||||||||||||
| Total increase (decrease) | (327,106,954 | ) | 247,985,736 | ||||||||||||||||||||||||||||||||||||||||||
| Net assets | |||||||||||||||||||||||||||||||||||||||||||||
| Beginning of period | 2,861,100,313 | 2,613,114,577 | |||||||||||||||||||||||||||||||||||||||||||
| End of period | $2,533,993,359 | $2,861,100,313 | |||||||||||||||||||||||||||||||||||||||||||
| Undistributed net investment income | $6,594,392 | $20,019,129 | |||||||||||||||||||||||||||||||||||||||||||
Financial highlights
| Class A Shares Period ended | 4-30-15 | 1 | 10-31-14 | 10-31-13 | 10-31-12 | 10-31-11 | 10-31-10 | |||||||||||||||||||||||||||||||||||||||||||||||||||||||||||||||||||||||||||||||||||||||||||||||||||||||||||||||
| Per share operating performance | ||||||||||||||||||||||||||||||||||||||||||||||||||||||||||||||||||||||||||||||||||||||||||||||||||||||||||||||||||||||
| Net asset value, beginning of period | $25.82 | $23.12 | $17.02 | $15.86 | $15.64 | $13.77 | ||||||||||||||||||||||||||||||||||||||||||||||||||||||||||||||||||||||||||||||||||||||||||||||||||||||||||||||||
| Net investment income2 | 0.10 | 0.18 | 0.20 | 0.20 | 0.10 | 0.07 | ||||||||||||||||||||||||||||||||||||||||||||||||||||||||||||||||||||||||||||||||||||||||||||||||||||||||||||||||
| Net realized and unrealized gain on investments | 1.01 | 2.72 | 6.09 | 1.12 | 0.15 | 1.91 | ||||||||||||||||||||||||||||||||||||||||||||||||||||||||||||||||||||||||||||||||||||||||||||||||||||||||||||||||
| Total from investment operations | 1.11 | 2.90 | 6.29 | 1.32 | 0.25 | 1.98 | ||||||||||||||||||||||||||||||||||||||||||||||||||||||||||||||||||||||||||||||||||||||||||||||||||||||||||||||||
| Less distributions | ||||||||||||||||||||||||||||||||||||||||||||||||||||||||||||||||||||||||||||||||||||||||||||||||||||||||||||||||||||||
| From net investment income | (0.22 | ) | (0.20 | ) | (0.19 | ) | (0.16 | ) | (0.03 | ) | (0.11 | ) | ||||||||||||||||||||||||||||||||||||||||||||||||||||||||||||||||||||||||||||||||||||||||||||||||||||||||||
| Net asset value, end of period | $26.71 | $25.82 | $23.12 | $17.02 | $15.86 | $15.64 | ||||||||||||||||||||||||||||||||||||||||||||||||||||||||||||||||||||||||||||||||||||||||||||||||||||||||||||||||
| Total return (%)3,4 | 4.35 | 5 | 12.64 | 37.32 | 8.45 | 1.59 | 14.48 | |||||||||||||||||||||||||||||||||||||||||||||||||||||||||||||||||||||||||||||||||||||||||||||||||||||||||||||||
| Ratios and supplemental data | ||||||||||||||||||||||||||||||||||||||||||||||||||||||||||||||||||||||||||||||||||||||||||||||||||||||||||||||||||||||
| Net assets, end of period (in millions) | $383 | $384 | $476 | $417 | $557 | $931 | ||||||||||||||||||||||||||||||||||||||||||||||||||||||||||||||||||||||||||||||||||||||||||||||||||||||||||||||||
| Ratios (as a percentage of average net assets): | ||||||||||||||||||||||||||||||||||||||||||||||||||||||||||||||||||||||||||||||||||||||||||||||||||||||||||||||||||||||
| Expenses before reductions | 1.18 | 6 | 1.19 | 1.25 | 1.31 | 1.30 | 1.41 | |||||||||||||||||||||||||||||||||||||||||||||||||||||||||||||||||||||||||||||||||||||||||||||||||||||||||||||||
| Expenses including reductions | 1.17 | 6 | 1.18 | 1.25 | 1.31 | 1.30 | 1.33 | |||||||||||||||||||||||||||||||||||||||||||||||||||||||||||||||||||||||||||||||||||||||||||||||||||||||||||||||
| Net investment income | 0.79 | 6 | 0.73 | 1.00 | 1.24 | 0.59 | 0.47 | |||||||||||||||||||||||||||||||||||||||||||||||||||||||||||||||||||||||||||||||||||||||||||||||||||||||||||||||
| Portfolio turnover (%) | 11 | 24 | 30 | 37 | 37 | 55 | ||||||||||||||||||||||||||||||||||||||||||||||||||||||||||||||||||||||||||||||||||||||||||||||||||||||||||||||||
| 1 | Six months ended 4-30-15. Unaudited. | |||||||||||||||||||||||||||||||||||||
| 2 | Based on average daily shares outstanding. | |||||||||||||||||||||||||||||||||||||
| 3 | Does not reflect the effect of sales charges, if any. | |||||||||||||||||||||||||||||||||||||
| 4 | Total returns would have been lower had certain expenses not been reduced during the applicable periods. | |||||||||||||||||||||||||||||||||||||
| 5 | Not annualized. | |||||||||||||||||||||||||||||||||||||
| 6 | Annualized. | |||||||||||||||||||||||||||||||||||||
| Class B Shares Period ended | 4-30-15 | 1 | 10-31-14 | 10-31-13 | 10-31-12 | 10-31-11 | 10-31-10 | |||||||||||||||||||||||||||||||||||||||||||||||||||||||||||||||||||||||||||||||||||||||||||||||||||||||||||||||
| Per share operating performance | ||||||||||||||||||||||||||||||||||||||||||||||||||||||||||||||||||||||||||||||||||||||||||||||||||||||||||||||||||||||
| Net asset value, beginning of period | $25.37 | $22.72 | $16.73 | $15.58 | $15.45 | $13.62 | ||||||||||||||||||||||||||||||||||||||||||||||||||||||||||||||||||||||||||||||||||||||||||||||||||||||||||||||||
| Net investment income (loss)2 | 0.01 | — | 3 | 0.07 | 0.08 | (0.03 | ) | (0.04 | ) | |||||||||||||||||||||||||||||||||||||||||||||||||||||||||||||||||||||||||||||||||||||||||||||||||||||||||||||
| Net realized and unrealized gain on investments | 0.98 | 2.68 | 5.98 | 1.10 | 0.16 | 1.89 | ||||||||||||||||||||||||||||||||||||||||||||||||||||||||||||||||||||||||||||||||||||||||||||||||||||||||||||||||
| Total from investment operations | 0.99 | 2.68 | 6.05 | 1.18 | 0.13 | 1.85 | ||||||||||||||||||||||||||||||||||||||||||||||||||||||||||||||||||||||||||||||||||||||||||||||||||||||||||||||||
| Less distributions | ||||||||||||||||||||||||||||||||||||||||||||||||||||||||||||||||||||||||||||||||||||||||||||||||||||||||||||||||||||||
| From net investment income | (0.03 | ) | (0.03 | ) | (0.06 | ) | (0.03 | ) | — | (0.02 | ) | |||||||||||||||||||||||||||||||||||||||||||||||||||||||||||||||||||||||||||||||||||||||||||||||||||||||||||
| Net asset value, end of period | $26.33 | $25.37 | $22.72 | $16.73 | $15.58 | $15.45 | ||||||||||||||||||||||||||||||||||||||||||||||||||||||||||||||||||||||||||||||||||||||||||||||||||||||||||||||||
| Total return (%)4,5 | 3.92 | 6 | 11.79 | 36.30 | 7.62 | 0.84 | 13.63 | |||||||||||||||||||||||||||||||||||||||||||||||||||||||||||||||||||||||||||||||||||||||||||||||||||||||||||||||
| Ratios and supplemental data | ||||||||||||||||||||||||||||||||||||||||||||||||||||||||||||||||||||||||||||||||||||||||||||||||||||||||||||||||||||||
| Net assets, end of period (in millions) | $10 | $11 | $18 | $25 | $41 | $57 | ||||||||||||||||||||||||||||||||||||||||||||||||||||||||||||||||||||||||||||||||||||||||||||||||||||||||||||||||
| Ratios (as a percentage of average net assets): | ||||||||||||||||||||||||||||||||||||||||||||||||||||||||||||||||||||||||||||||||||||||||||||||||||||||||||||||||||||||
| Expenses before reductions | 1.93 | 7 | 1.94 | 2.00 | 2.06 | 2.05 | 2.16 | |||||||||||||||||||||||||||||||||||||||||||||||||||||||||||||||||||||||||||||||||||||||||||||||||||||||||||||||
| Expenses including reductions | 1.92 | 7 | 1.93 | 2.00 | 2.06 | 2.05 | 2.08 | |||||||||||||||||||||||||||||||||||||||||||||||||||||||||||||||||||||||||||||||||||||||||||||||||||||||||||||||
| Net investment income (loss) | 0.06 | 7 | 0.01 | 0.34 | 0.50 | (0.16 | ) | (0.29 | ) | |||||||||||||||||||||||||||||||||||||||||||||||||||||||||||||||||||||||||||||||||||||||||||||||||||||||||||||
| Portfolio turnover (%) | 11 | 24 | 30 | 37 | 37 | 55 | ||||||||||||||||||||||||||||||||||||||||||||||||||||||||||||||||||||||||||||||||||||||||||||||||||||||||||||||||
| 1 | Six months ended 4-30-15. Unaudited. | |||||||||||||||||||||||||||||||||||||
| 2 | Based on average daily shares outstanding. | |||||||||||||||||||||||||||||||||||||
| 3 | Less than $0.005 per share. | |||||||||||||||||||||||||||||||||||||
| 4 | Does not reflect the effect of sales charges, if any. | |||||||||||||||||||||||||||||||||||||
| 5 | Total returns would have been lower had certain expenses not been reduced during the applicable periods. | |||||||||||||||||||||||||||||||||||||
| 6 | Not annualized. | |||||||||||||||||||||||||||||||||||||
| 7 | Annualized. | |||||||||||||||||||||||||||||||||||||
| Class C Shares Period ended | 4-30-15 | 1 | 10-31-14 | 10-31-13 | 10-31-12 | 10-31-11 | 10-31-10 | |||||||||||||||||||||||||||||||||||||||||||||||||||||||||||||||||||||||||||||||||||||||||||||||||||||||||||||||
| Per share operating performance | ||||||||||||||||||||||||||||||||||||||||||||||||||||||||||||||||||||||||||||||||||||||||||||||||||||||||||||||||||||||
| Net asset value, beginning of period | $25.36 | $22.71 | $16.73 | $15.58 | $15.44 | $13.61 | ||||||||||||||||||||||||||||||||||||||||||||||||||||||||||||||||||||||||||||||||||||||||||||||||||||||||||||||||
| Net investment income (loss)2 | 0.01 | (0.01 | ) | 0.05 | 0.08 | (0.03 | ) | (0.04 | ) | |||||||||||||||||||||||||||||||||||||||||||||||||||||||||||||||||||||||||||||||||||||||||||||||||||||||||||||
| Net realized and unrealized gain on investments | 0.98 | 2.69 | 5.99 | 1.10 | 0.17 | 1.89 | ||||||||||||||||||||||||||||||||||||||||||||||||||||||||||||||||||||||||||||||||||||||||||||||||||||||||||||||||
| Total from investment operations | 0.99 | 2.68 | 6.04 | 1.18 | 0.14 | 1.85 | ||||||||||||||||||||||||||||||||||||||||||||||||||||||||||||||||||||||||||||||||||||||||||||||||||||||||||||||||
| Less distributions | ||||||||||||||||||||||||||||||||||||||||||||||||||||||||||||||||||||||||||||||||||||||||||||||||||||||||||||||||||||||
| From net investment income | (0.03 | ) | (0.03 | ) | (0.06 | ) | (0.03 | ) | — | (0.02 | ) | |||||||||||||||||||||||||||||||||||||||||||||||||||||||||||||||||||||||||||||||||||||||||||||||||||||||||||
| Net asset value, end of period | $26.32 | $25.36 | $22.71 | $16.73 | $15.58 | $15.44 | ||||||||||||||||||||||||||||||||||||||||||||||||||||||||||||||||||||||||||||||||||||||||||||||||||||||||||||||||
| Total return (%)3,4 | 3.92 | 5 | 11.80 | 36.24 | 7.62 | 0.91 | 13.64 | |||||||||||||||||||||||||||||||||||||||||||||||||||||||||||||||||||||||||||||||||||||||||||||||||||||||||||||||
| Ratios and supplemental data | ||||||||||||||||||||||||||||||||||||||||||||||||||||||||||||||||||||||||||||||||||||||||||||||||||||||||||||||||||||||
| Net assets, end of period (in millions) | $98 | $101 | $95 | $81 | $101 | $132 | ||||||||||||||||||||||||||||||||||||||||||||||||||||||||||||||||||||||||||||||||||||||||||||||||||||||||||||||||
| Ratios (as a percentage of average net assets): | ||||||||||||||||||||||||||||||||||||||||||||||||||||||||||||||||||||||||||||||||||||||||||||||||||||||||||||||||||||||
| Expenses before reductions | 1.93 | 6 | 1.94 | 2.00 | 2.06 | 2.05 | 2.16 | |||||||||||||||||||||||||||||||||||||||||||||||||||||||||||||||||||||||||||||||||||||||||||||||||||||||||||||||
| Expenses including reductions | 1.92 | 6 | 1.93 | 2.00 | 2.06 | 2.05 | 2.08 | |||||||||||||||||||||||||||||||||||||||||||||||||||||||||||||||||||||||||||||||||||||||||||||||||||||||||||||||
| Net investment income (loss) | 0.05 | 6 | (0.04 | ) | 0.25 | 0.47 | (0.16 | ) | (0.29 | ) | ||||||||||||||||||||||||||||||||||||||||||||||||||||||||||||||||||||||||||||||||||||||||||||||||||||||||||||
| Portfolio turnover (%) | 11 | 24 | 30 | 37 | 37 | 55 | ||||||||||||||||||||||||||||||||||||||||||||||||||||||||||||||||||||||||||||||||||||||||||||||||||||||||||||||||
| 1 | Six months ended 4-30-15. Unaudited. | |||||||||||||||||||||||||||||||||||||
| 2 | Based on average daily shares outstanding. | |||||||||||||||||||||||||||||||||||||
| 3 | Does not reflect the effect of sales charges, if any. | |||||||||||||||||||||||||||||||||||||
| 4 | Total returns would have been lower had certain expenses not been reduced during the applicable periods. | |||||||||||||||||||||||||||||||||||||
| 5 | Not annualized. | |||||||||||||||||||||||||||||||||||||
| 6 | Annualized. | |||||||||||||||||||||||||||||||||||||
| Class I Shares Period ended | 4-30-15 | 1 | 10-31-14 | 10-31-13 | 10-31-12 | 10-31-11 | 10-31-10 | |||||||||||||||||||||||||||||||||||||||||||||||||||||||||||||||||||||||||||||||||||||||||||||||||||||||||||||||
| Per share operating performance | ||||||||||||||||||||||||||||||||||||||||||||||||||||||||||||||||||||||||||||||||||||||||||||||||||||||||||||||||||||||
| Net asset value, beginning of period | $25.90 | $23.19 | $17.07 | $15.93 | $15.70 | $13.81 | ||||||||||||||||||||||||||||||||||||||||||||||||||||||||||||||||||||||||||||||||||||||||||||||||||||||||||||||||
| Net investment income2 | 0.14 | 0.24 | 0.25 | 0.26 | 0.16 | 0.12 | ||||||||||||||||||||||||||||||||||||||||||||||||||||||||||||||||||||||||||||||||||||||||||||||||||||||||||||||||
| Net realized and unrealized gain (loss) on investments | 1.00 | 2.74 | 6.11 | 1.11 | 0.15 | 1.93 | ||||||||||||||||||||||||||||||||||||||||||||||||||||||||||||||||||||||||||||||||||||||||||||||||||||||||||||||||
| Total from investment operations | 1.14 | 2.98 | 6.36 | 1.37 | 0.31 | 2.05 | ||||||||||||||||||||||||||||||||||||||||||||||||||||||||||||||||||||||||||||||||||||||||||||||||||||||||||||||||
| Less distributions | ||||||||||||||||||||||||||||||||||||||||||||||||||||||||||||||||||||||||||||||||||||||||||||||||||||||||||||||||||||||
| From net investment income | (0.29 | ) | (0.27 | ) | (0.24 | ) | (0.23 | ) | (0.08 | ) | (0.16 | ) | ||||||||||||||||||||||||||||||||||||||||||||||||||||||||||||||||||||||||||||||||||||||||||||||||||||||||||
| Net asset value, end of period | $26.75 | $25.90 | $23.19 | $17.07 | $15.93 | $15.70 | ||||||||||||||||||||||||||||||||||||||||||||||||||||||||||||||||||||||||||||||||||||||||||||||||||||||||||||||||
| Total return (%)3 | 4.46 | 4 | 12.95 | 37.76 | 8.78 | 1.98 | 14.95 | |||||||||||||||||||||||||||||||||||||||||||||||||||||||||||||||||||||||||||||||||||||||||||||||||||||||||||||||
| Ratios and supplemental data | ||||||||||||||||||||||||||||||||||||||||||||||||||||||||||||||||||||||||||||||||||||||||||||||||||||||||||||||||||||||
| Net assets, end of period (in millions) | $2,036 | $2,355 | $2,018 | $982 | $849 | $994 | ||||||||||||||||||||||||||||||||||||||||||||||||||||||||||||||||||||||||||||||||||||||||||||||||||||||||||||||||
| Ratios (as a percentage of average net assets): | ||||||||||||||||||||||||||||||||||||||||||||||||||||||||||||||||||||||||||||||||||||||||||||||||||||||||||||||||||||||
| Expenses before reductions | 0.91 | 5 | 0.93 | 0.94 | 0.97 | 0.94 | 0.92 | |||||||||||||||||||||||||||||||||||||||||||||||||||||||||||||||||||||||||||||||||||||||||||||||||||||||||||||||
| Expenses including reductions | 0.90 | 5 | 0.92 | 0.94 | 0.96 | 0.94 | 0.92 | |||||||||||||||||||||||||||||||||||||||||||||||||||||||||||||||||||||||||||||||||||||||||||||||||||||||||||||||
| Net investment income | 1.08 | 5 | 0.97 | 1.24 | 1.55 | 0.95 | 0.83 | |||||||||||||||||||||||||||||||||||||||||||||||||||||||||||||||||||||||||||||||||||||||||||||||||||||||||||||||
| Portfolio turnover (%) | 11 | 24 | 30 | 37 | 37 | 55 | ||||||||||||||||||||||||||||||||||||||||||||||||||||||||||||||||||||||||||||||||||||||||||||||||||||||||||||||||
| 1 | Six months ended 4-30-15. Unaudited. | |||||||||||||||||||||||||||||||||||||
| 2 | Based on average daily shares outstanding. | |||||||||||||||||||||||||||||||||||||
| 3 | Total returns would have been lower had certain expenses not been reduced during the applicable periods. | |||||||||||||||||||||||||||||||||||||
| 4 | Not annualized. | |||||||||||||||||||||||||||||||||||||
| 5 | Annualized. | |||||||||||||||||||||||||||||||||||||
| Class R1 Shares Period ended | 4-30-15 | 1 | 10-31-14 | 10-31-13 | 10-31-12 | 10-31-11 | 10-31-10 | |||||||||||||||||||||||||||||||||||||||||||||||||||||||||||||||||||||||||||||||||||||||||||||||||||||||||||||||
| Per share operating performance | ||||||||||||||||||||||||||||||||||||||||||||||||||||||||||||||||||||||||||||||||||||||||||||||||||||||||||||||||||||||
| Net asset value, beginning of period | $25.83 | $23.13 | $17.03 | $15.87 | $15.68 | $13.77 | ||||||||||||||||||||||||||||||||||||||||||||||||||||||||||||||||||||||||||||||||||||||||||||||||||||||||||||||||
| Net investment income2 | 0.06 | 0.08 | 0.13 | 0.15 | 0.04 | 0.05 | ||||||||||||||||||||||||||||||||||||||||||||||||||||||||||||||||||||||||||||||||||||||||||||||||||||||||||||||||
| Net realized and unrealized gain on investments | 1.00 | 2.73 | 6.10 | 1.11 | 0.15 | 1.92 | ||||||||||||||||||||||||||||||||||||||||||||||||||||||||||||||||||||||||||||||||||||||||||||||||||||||||||||||||
| Total from investment operations | 1.06 | 2.81 | 6.23 | 1.26 | 0.19 | 1.97 | ||||||||||||||||||||||||||||||||||||||||||||||||||||||||||||||||||||||||||||||||||||||||||||||||||||||||||||||||
| Less distributions | ||||||||||||||||||||||||||||||||||||||||||||||||||||||||||||||||||||||||||||||||||||||||||||||||||||||||||||||||||||||
| From net investment income | (0.13 | ) | (0.11 | ) | (0.13 | ) | (0.10 | ) | — | (0.06 | ) | |||||||||||||||||||||||||||||||||||||||||||||||||||||||||||||||||||||||||||||||||||||||||||||||||||||||||||
| Net asset value, end of period | $26.76 | $25.83 | $23.13 | $17.03 | $15.87 | $15.68 | ||||||||||||||||||||||||||||||||||||||||||||||||||||||||||||||||||||||||||||||||||||||||||||||||||||||||||||||||
| Total return (%)3 | 4.12 | 4 | 12.21 | 36.84 | 8.06 | 1.21 | 14.08 | |||||||||||||||||||||||||||||||||||||||||||||||||||||||||||||||||||||||||||||||||||||||||||||||||||||||||||||||
| Ratios and supplemental data | ||||||||||||||||||||||||||||||||||||||||||||||||||||||||||||||||||||||||||||||||||||||||||||||||||||||||||||||||||||||
| Net assets, end of period (in millions) | $4 | $7 | $6 | $4 | $5 | $7 | ||||||||||||||||||||||||||||||||||||||||||||||||||||||||||||||||||||||||||||||||||||||||||||||||||||||||||||||||
| Ratios (as a percentage of average net assets): | ||||||||||||||||||||||||||||||||||||||||||||||||||||||||||||||||||||||||||||||||||||||||||||||||||||||||||||||||||||||
| Expenses before reductions | 1.57 | 5 | 1.57 | 1.60 | 1.65 | 1.64 | 1.48 | 6 | ||||||||||||||||||||||||||||||||||||||||||||||||||||||||||||||||||||||||||||||||||||||||||||||||||||||||||||||
| Expenses including reductions | 1.56 | 5 | 1.57 | 1.60 | 1.65 | 1.64 | 1.48 | 6 | ||||||||||||||||||||||||||||||||||||||||||||||||||||||||||||||||||||||||||||||||||||||||||||||||||||||||||||||
| Net investment income | 0.43 | 5 | 0.32 | 0.63 | 0.88 | 0.24 | 0.30 | |||||||||||||||||||||||||||||||||||||||||||||||||||||||||||||||||||||||||||||||||||||||||||||||||||||||||||||||
| Portfolio turnover (%) | 11 | 24 | 30 | 37 | 37 | 55 | ||||||||||||||||||||||||||||||||||||||||||||||||||||||||||||||||||||||||||||||||||||||||||||||||||||||||||||||||
| 1 | Six months ended 4-30-15. Unaudited. | |||||||||||||||||||||||||||||||||||||
| 2 | Based on average daily shares outstanding. | |||||||||||||||||||||||||||||||||||||
| 3 | Total returns would have been lower had certain expenses not been reduced during the applicable periods. | |||||||||||||||||||||||||||||||||||||
| 4 | Not annualized. | |||||||||||||||||||||||||||||||||||||
| 5 | Annualized. | |||||||||||||||||||||||||||||||||||||
| 6 | Includes the impact of a revision of 0.25% related to certain expense accruals. Without this adjustment, net investment income and total return for the year ended 10-31-10 would have been lower. | |||||||||||||||||||||||||||||||||||||
| Class R2 Shares Period ended | 4-30-15 | 1 | 10-31-14 | 10-31-13 | 10-31-12 | 2 | ||||||||||||||||||||||||||||||||||||||||||||||||||||||||||||||||||||||||||||||||||
| Per share operating performance | ||||||||||||||||||||||||||||||||||||||||||||||||||||||||||||||||||||||||||||||||||||||||
| Net asset value, beginning of period | $25.85 | $23.16 | $17.05 | $17.08 | ||||||||||||||||||||||||||||||||||||||||||||||||||||||||||||||||||||||||||||||||||||
| Net investment income3 | 0.10 | 0.17 | 0.18 | 0.13 | ||||||||||||||||||||||||||||||||||||||||||||||||||||||||||||||||||||||||||||||||||||
| Net realized and unrealized gain (loss) on investments | 0.99 | 2.75 | 6.15 | (0.16 | ) | |||||||||||||||||||||||||||||||||||||||||||||||||||||||||||||||||||||||||||||||||||
| Total from investment operations | 1.09 | 2.92 | 6.33 | (0.03 | ) | |||||||||||||||||||||||||||||||||||||||||||||||||||||||||||||||||||||||||||||||||||
| Less distributions | ||||||||||||||||||||||||||||||||||||||||||||||||||||||||||||||||||||||||||||||||||||||||
| From net investment income | (0.24 | ) | (0.23 | ) | (0.22 | ) | — | |||||||||||||||||||||||||||||||||||||||||||||||||||||||||||||||||||||||||||||||||
| Net asset value, end of period | $26.70 | $25.85 | $23.16 | $17.05 | ||||||||||||||||||||||||||||||||||||||||||||||||||||||||||||||||||||||||||||||||||||
| Total return (%)4 | 4.24 | 5 | 12.70 | 37.53 | (0.18 | ) 5 | ||||||||||||||||||||||||||||||||||||||||||||||||||||||||||||||||||||||||||||||||||
| Ratios and supplemental data | ||||||||||||||||||||||||||||||||||||||||||||||||||||||||||||||||||||||||||||||||||||||||
| Net assets, end of period (in millions) | — | 6 | — | 6 | — | 6 | — | 6 | ||||||||||||||||||||||||||||||||||||||||||||||||||||||||||||||||||||||||||||||||
| Ratios (as a percentage of average net assets): | ||||||||||||||||||||||||||||||||||||||||||||||||||||||||||||||||||||||||||||||||||||||||
| Expenses before reductions | 1.20 | 7 | 1.19 | 1.13 | 1.13 | 7 | ||||||||||||||||||||||||||||||||||||||||||||||||||||||||||||||||||||||||||||||||||
| Expenses including reductions | 1.19 | 7 | 1.18 | 1.13 | 1.13 | 7 | ||||||||||||||||||||||||||||||||||||||||||||||||||||||||||||||||||||||||||||||||||
| Net investment income | 0.76 | 7 | 0.68 | 0.86 | 1.17 | 7 | ||||||||||||||||||||||||||||||||||||||||||||||||||||||||||||||||||||||||||||||||||
| Portfolio turnover (%) | 11 | 24 | 30 | 37 | 8 | |||||||||||||||||||||||||||||||||||||||||||||||||||||||||||||||||||||||||||||||||||
| 1 | Six months ended 4-30-15. Unaudited. | |||||||||||||||||||||||||||||||
| 2 | The inception date for Class R2 shares is 3-1-12. | |||||||||||||||||||||||||||||||
| 3 | Based on average daily shares outstanding. | |||||||||||||||||||||||||||||||
| 4 | Total returns would have been lower had certain expenses not been reduced during the applicable periods. | |||||||||||||||||||||||||||||||
| 5 | Not annualized. | |||||||||||||||||||||||||||||||
| 6 | Less than $500,000. | |||||||||||||||||||||||||||||||
| 7 | Annualized. | |||||||||||||||||||||||||||||||
| 8 | The portfolio turnover is shown for the period from 11-1-11 to 10-31-12. | |||||||||||||||||||||||||||||||
| Class R3 Shares Period ended | 4-30-15 | 1 | 10-31-14 | 10-31-13 | 10-31-12 | 10-31-11 | 10-31-10 | |||||||||||||||||||||||||||||||||||||||||||||||||||||||||||||||||||||||||||||||||||||||||||||||||||||||||||||||
| Per share operating performance | ||||||||||||||||||||||||||||||||||||||||||||||||||||||||||||||||||||||||||||||||||||||||||||||||||||||||||||||||||||||
| Net asset value, beginning of period | $25.75 | $23.08 | $17.00 | $15.84 | $15.62 | $13.76 | ||||||||||||||||||||||||||||||||||||||||||||||||||||||||||||||||||||||||||||||||||||||||||||||||||||||||||||||||
| Net investment income2 | 0.06 | 0.09 | 0.14 | 0.17 | 0.07 | — | 3 | |||||||||||||||||||||||||||||||||||||||||||||||||||||||||||||||||||||||||||||||||||||||||||||||||||||||||||||||
| Net realized and unrealized gain on investments | 1.00 | 2.74 | 6.10 | 1.12 | 0.15 | 1.93 | ||||||||||||||||||||||||||||||||||||||||||||||||||||||||||||||||||||||||||||||||||||||||||||||||||||||||||||||||
| Total from investment operations | 1.06 | 2.83 | 6.24 | 1.29 | 0.22 | 1.93 | ||||||||||||||||||||||||||||||||||||||||||||||||||||||||||||||||||||||||||||||||||||||||||||||||||||||||||||||||
| Less distributions | ||||||||||||||||||||||||||||||||||||||||||||||||||||||||||||||||||||||||||||||||||||||||||||||||||||||||||||||||||||||
| From net investment income | (0.15 | ) | (0.16 | ) | (0.16 | ) | (0.13 | ) | — | (0.07 | ) | |||||||||||||||||||||||||||||||||||||||||||||||||||||||||||||||||||||||||||||||||||||||||||||||||||||||||||
| Net asset value, end of period | $26.66 | $25.75 | $23.08 | $17.00 | $15.84 | $15.62 | ||||||||||||||||||||||||||||||||||||||||||||||||||||||||||||||||||||||||||||||||||||||||||||||||||||||||||||||||
| Total return (%)4 | 4.16 | 5 | 12.34 | 37.01 | 8.28 | 1.41 | 14.04 | |||||||||||||||||||||||||||||||||||||||||||||||||||||||||||||||||||||||||||||||||||||||||||||||||||||||||||||||
| Ratios and supplemental data | ||||||||||||||||||||||||||||||||||||||||||||||||||||||||||||||||||||||||||||||||||||||||||||||||||||||||||||||||||||||
| Net assets, end of period (in millions) | $1 | $1 | — | 6 | — | 6 | — | 6 | — | 6 | ||||||||||||||||||||||||||||||||||||||||||||||||||||||||||||||||||||||||||||||||||||||||||||||||||||||||||||
| Ratios (as a percentage of average net assets): | ||||||||||||||||||||||||||||||||||||||||||||||||||||||||||||||||||||||||||||||||||||||||||||||||||||||||||||||||||||||
| Expenses before reductions | 1.48 | 7 | 1.47 | 1.42 | 1.48 | 1.48 | 2.76 | |||||||||||||||||||||||||||||||||||||||||||||||||||||||||||||||||||||||||||||||||||||||||||||||||||||||||||||||
| Expenses including reductions | 1.47 | 7 | 1.47 | 1.41 | 1.48 | 1.48 | 1.73 | |||||||||||||||||||||||||||||||||||||||||||||||||||||||||||||||||||||||||||||||||||||||||||||||||||||||||||||||
| Net investment income | 0.49 | 7 | 0.37 | 0.65 | 1.01 | 0.44 | 0.02 | |||||||||||||||||||||||||||||||||||||||||||||||||||||||||||||||||||||||||||||||||||||||||||||||||||||||||||||||
| Portfolio turnover (%) | 11 | 24 | 30 | 37 | 37 | 55 | ||||||||||||||||||||||||||||||||||||||||||||||||||||||||||||||||||||||||||||||||||||||||||||||||||||||||||||||||
| 1 | Six months ended 4-30-15. Unaudited. | |||||||||||||||||||||||||||||||||||||
| 2 | Based on average daily shares outstanding. | |||||||||||||||||||||||||||||||||||||
| 3 | Less than $0.005 per share. | |||||||||||||||||||||||||||||||||||||
| 4 | Total returns would have been lower had certain expenses not been reduced during the applicable periods. | |||||||||||||||||||||||||||||||||||||
| 5 | Not annualized. | |||||||||||||||||||||||||||||||||||||
| 6 | Less than $500,000. | |||||||||||||||||||||||||||||||||||||
| 7 | Annualized. | |||||||||||||||||||||||||||||||||||||
| Class R4 Shares Period ended | 4-30-15 | 1 | 10-31-14 | 10-31-13 | 10-31-12 | 10-31-11 | 10-31-10 | |||||||||||||||||||||||||||||||||||||||||||||||||||||||||||||||||||||||||||||||||||||||||||||||||||||||||||||||
| Per share operating performance | ||||||||||||||||||||||||||||||||||||||||||||||||||||||||||||||||||||||||||||||||||||||||||||||||||||||||||||||||||||||
| Net asset value, beginning of period | $25.90 | $23.19 | $17.07 | $15.90 | $15.64 | $13.77 | ||||||||||||||||||||||||||||||||||||||||||||||||||||||||||||||||||||||||||||||||||||||||||||||||||||||||||||||||
| Net investment income2 | 0.13 | 0.23 | 0.25 | 0.23 | 0.13 | 0.05 | ||||||||||||||||||||||||||||||||||||||||||||||||||||||||||||||||||||||||||||||||||||||||||||||||||||||||||||||||
| Net realized and unrealized gain on investments | 0.99 | 2.74 | 6.10 | 1.13 | 0.15 | 1.92 | ||||||||||||||||||||||||||||||||||||||||||||||||||||||||||||||||||||||||||||||||||||||||||||||||||||||||||||||||
| Total from investment operations | 1.12 | 2.97 | 6.35 | 1.36 | 0.28 | 1.97 | ||||||||||||||||||||||||||||||||||||||||||||||||||||||||||||||||||||||||||||||||||||||||||||||||||||||||||||||||
| Less distributions | ||||||||||||||||||||||||||||||||||||||||||||||||||||||||||||||||||||||||||||||||||||||||||||||||||||||||||||||||||||||
| From net investment income | (0.28 | ) | (0.26 | ) | (0.23 | ) | (0.19 | ) | (0.02 | ) | (0.10 | ) | ||||||||||||||||||||||||||||||||||||||||||||||||||||||||||||||||||||||||||||||||||||||||||||||||||||||||||
| Net asset value, end of period | $26.74 | $25.90 | $23.19 | $17.07 | $15.90 | $15.64 | ||||||||||||||||||||||||||||||||||||||||||||||||||||||||||||||||||||||||||||||||||||||||||||||||||||||||||||||||
| Total return (%)3 | 4.40 | 4 | 12.92 | 37.66 | 8.69 | 1.77 | 14.38 | |||||||||||||||||||||||||||||||||||||||||||||||||||||||||||||||||||||||||||||||||||||||||||||||||||||||||||||||
| Ratios and supplemental data | ||||||||||||||||||||||||||||||||||||||||||||||||||||||||||||||||||||||||||||||||||||||||||||||||||||||||||||||||||||||
| Net assets, end of period (in millions) | — | 5 | — | 5 | — | 5 | — | 5 | — | 5 | — | 5 | ||||||||||||||||||||||||||||||||||||||||||||||||||||||||||||||||||||||||||||||||||||||||||||||||||||||||||
| Ratios (as a percentage of average net assets): | ||||||||||||||||||||||||||||||||||||||||||||||||||||||||||||||||||||||||||||||||||||||||||||||||||||||||||||||||||||||
| Expenses before reductions | 1.07 | 6 | 1.07 | 1.10 | 1.13 | 1.15 | 2.87 | |||||||||||||||||||||||||||||||||||||||||||||||||||||||||||||||||||||||||||||||||||||||||||||||||||||||||||||||
| Expenses including reductions | 0.96 | 6 | 0.96 | 1.00 | 1.09 | 1.15 | 1.43 | |||||||||||||||||||||||||||||||||||||||||||||||||||||||||||||||||||||||||||||||||||||||||||||||||||||||||||||||
| Net investment income | 1.01 | 6 | 0.93 | 1.23 | 1.41 | 0.76 | 0.34 | |||||||||||||||||||||||||||||||||||||||||||||||||||||||||||||||||||||||||||||||||||||||||||||||||||||||||||||||
| Portfolio turnover (%) | 11 | 24 | 30 | 37 | 37 | 55 | ||||||||||||||||||||||||||||||||||||||||||||||||||||||||||||||||||||||||||||||||||||||||||||||||||||||||||||||||
| 1 | Six months ended 4-30-15. Unaudited. | |||||||||||||||||||||||||||||||||||||
| 2 | Based on average daily shares outstanding. | |||||||||||||||||||||||||||||||||||||
| 3 | Total returns would have been lower had certain expenses not been reduced during the applicable periods. | |||||||||||||||||||||||||||||||||||||
| 4 | Not annualized. | |||||||||||||||||||||||||||||||||||||
| 5 | Less than $500,000. | |||||||||||||||||||||||||||||||||||||
| 6 | Annualized. | |||||||||||||||||||||||||||||||||||||
| Class R5 Shares Period ended | 4-30-15 | 1 | 10-31-14 | 10-31-13 | 10-31-12 | 10-31-11 | 10-31-10 | |||||||||||||||||||||||||||||||||||||||||||||||||||||||||||||||||||||||||||||||||||||||||||||||||||||||||||||||
| Per share operating performance | ||||||||||||||||||||||||||||||||||||||||||||||||||||||||||||||||||||||||||||||||||||||||||||||||||||||||||||||||||||||
| Net asset value, beginning of period | $25.92 | $23.22 | $17.09 | $15.94 | $15.67 | $13.79 | ||||||||||||||||||||||||||||||||||||||||||||||||||||||||||||||||||||||||||||||||||||||||||||||||||||||||||||||||
| Net investment income2 | 0.15 | 0.25 | 0.28 | 0.27 | 0.17 | 0.09 | ||||||||||||||||||||||||||||||||||||||||||||||||||||||||||||||||||||||||||||||||||||||||||||||||||||||||||||||||
| Net realized and unrealized gain on investments | 1.00 | 2.74 | 6.11 | 1.11 | 0.15 | 1.93 | ||||||||||||||||||||||||||||||||||||||||||||||||||||||||||||||||||||||||||||||||||||||||||||||||||||||||||||||||
| Total from investment operations | 1.15 | 2.99 | 6.39 | 1.38 | 0.32 | 2.02 | ||||||||||||||||||||||||||||||||||||||||||||||||||||||||||||||||||||||||||||||||||||||||||||||||||||||||||||||||
| Less distributions | ||||||||||||||||||||||||||||||||||||||||||||||||||||||||||||||||||||||||||||||||||||||||||||||||||||||||||||||||||||||
| From net investment income | (0.32 | ) | (0.29 | ) | (0.26 | ) | (0.23 | ) | (0.05 | ) | (0.14 | ) | ||||||||||||||||||||||||||||||||||||||||||||||||||||||||||||||||||||||||||||||||||||||||||||||||||||||||||
| Net asset value, end of period | $26.75 | $25.92 | $23.22 | $17.09 | $15.94 | $15.67 | ||||||||||||||||||||||||||||||||||||||||||||||||||||||||||||||||||||||||||||||||||||||||||||||||||||||||||||||||
| Total return (%)3 | 4.50 | 4 | 13.02 | 37.87 | 8.85 | 2.07 | 14.72 | |||||||||||||||||||||||||||||||||||||||||||||||||||||||||||||||||||||||||||||||||||||||||||||||||||||||||||||||
| Ratios and supplemental data | ||||||||||||||||||||||||||||||||||||||||||||||||||||||||||||||||||||||||||||||||||||||||||||||||||||||||||||||||||||||
| Net assets, end of period (in millions) | — | 5 | — | 5 | — | 5 | — | 5 | — | 5 | — | 5 | ||||||||||||||||||||||||||||||||||||||||||||||||||||||||||||||||||||||||||||||||||||||||||||||||||||||||||
| Ratios (as a percentage of average net assets): | ||||||||||||||||||||||||||||||||||||||||||||||||||||||||||||||||||||||||||||||||||||||||||||||||||||||||||||||||||||||
| Expenses before reductions | 0.85 | 6 | 0.84 | 0.85 | 0.90 | 0.90 | 2.64 | |||||||||||||||||||||||||||||||||||||||||||||||||||||||||||||||||||||||||||||||||||||||||||||||||||||||||||||||
| Expenses including reductions | 0.84 | 6 | 0.83 | 0.85 | 0.90 | 0.90 | 1.13 | |||||||||||||||||||||||||||||||||||||||||||||||||||||||||||||||||||||||||||||||||||||||||||||||||||||||||||||||
| Net investment income | 1.14 | 6 | 1.03 | 1.37 | 1.62 | 1.02 | 0.63 | |||||||||||||||||||||||||||||||||||||||||||||||||||||||||||||||||||||||||||||||||||||||||||||||||||||||||||||||
| Portfolio turnover (%) | 11 | 24 | 30 | 37 | 37 | 55 | ||||||||||||||||||||||||||||||||||||||||||||||||||||||||||||||||||||||||||||||||||||||||||||||||||||||||||||||||
| 1 | Six months ended 4-30-15. Unaudited. | |||||||||||||||||||||||||||||||||||||
| 2 | Based on average daily shares outstanding. | |||||||||||||||||||||||||||||||||||||
| 3 | Total returns would have been lower had certain expenses not been reduced during the applicable periods. | |||||||||||||||||||||||||||||||||||||
| 4 | Not annualized. | |||||||||||||||||||||||||||||||||||||
| 5 | Less than $500,000. | |||||||||||||||||||||||||||||||||||||
| 6 | Annualized. | |||||||||||||||||||||||||||||||||||||
| Class R6 Shares Period ended | 4-30-15 | 1 | 10-31-14 | 10-31-13 | 10-31-12 | 10-31-11 | 2 | ||||||||||||||||||||||||||||||||||||||||||||||||||||||||||||||||||||||||||||||||||||||||||||||||
| Per share operating performance | |||||||||||||||||||||||||||||||||||||||||||||||||||||||||||||||||||||||||||||||||||||||||||||||||||||||
| Net asset value, beginning of period | $25.94 | $23.21 | $17.09 | $15.93 | $15.38 | ||||||||||||||||||||||||||||||||||||||||||||||||||||||||||||||||||||||||||||||||||||||||||||||||||
| Net investment income3 | 0.14 | 0.27 | 0.24 | 0.27 | 0.02 | ||||||||||||||||||||||||||||||||||||||||||||||||||||||||||||||||||||||||||||||||||||||||||||||||||
| Net realized and unrealized gain on investments | 1.01 | 2.74 | 6.13 | 1.12 | 0.53 | ||||||||||||||||||||||||||||||||||||||||||||||||||||||||||||||||||||||||||||||||||||||||||||||||||
| Total from investment operations | 1.15 | 3.01 | 6.37 | 1.39 | 0.55 | ||||||||||||||||||||||||||||||||||||||||||||||||||||||||||||||||||||||||||||||||||||||||||||||||||
| Less distributions | |||||||||||||||||||||||||||||||||||||||||||||||||||||||||||||||||||||||||||||||||||||||||||||||||||||||
| From net investment income | (0.32 | ) | (0.28 | ) | (0.25 | ) | (0.23 | ) | — | ||||||||||||||||||||||||||||||||||||||||||||||||||||||||||||||||||||||||||||||||||||||||||||||
| Net asset value, end of period | $26.77 | $25.94 | $23.21 | $17.09 | $15.93 | ||||||||||||||||||||||||||||||||||||||||||||||||||||||||||||||||||||||||||||||||||||||||||||||||||
| Total return (%)4 | 4.48 | 5 | 13.11 | 37.80 | 8.93 | 3.58 | 5 | ||||||||||||||||||||||||||||||||||||||||||||||||||||||||||||||||||||||||||||||||||||||||||||||||
| Ratios and supplemental data | |||||||||||||||||||||||||||||||||||||||||||||||||||||||||||||||||||||||||||||||||||||||||||||||||||||||
| Net assets, end of period (in millions) | $1 | $1 | $1 | — | 6 | — | 6 | ||||||||||||||||||||||||||||||||||||||||||||||||||||||||||||||||||||||||||||||||||||||||||||||||
| Ratios (as a percentage of average net assets): | |||||||||||||||||||||||||||||||||||||||||||||||||||||||||||||||||||||||||||||||||||||||||||||||||||||||
| Expenses before reductions | 0.83 | 7 | 0.83 | 0.85 | 0.89 | 0.87 | 7 | ||||||||||||||||||||||||||||||||||||||||||||||||||||||||||||||||||||||||||||||||||||||||||||||||
| Expenses including reductions | 0.81 | 7 | 0.80 | 0.85 | 0.89 | 0.87 | 7 | ||||||||||||||||||||||||||||||||||||||||||||||||||||||||||||||||||||||||||||||||||||||||||||||||
| Net investment income | 1.10 | 7 | 1.08 | 1.13 | 1.61 | 0.90 | 7 | ||||||||||||||||||||||||||||||||||||||||||||||||||||||||||||||||||||||||||||||||||||||||||||||||
| Portfolio turnover (%) | 11 | 24 | 30 | 37 | 37 | 8 | |||||||||||||||||||||||||||||||||||||||||||||||||||||||||||||||||||||||||||||||||||||||||||||||||
| 1 | Six months ended 4-30-15. Unaudited. | |||||||||||||||||||||||||||||||||||
| 2 | The inception date for Class R6 shares is 9-1-11. | |||||||||||||||||||||||||||||||||||
| 3 | Based on average daily shares outstanding. | |||||||||||||||||||||||||||||||||||
| 4 | Total returns would have been lower had certain expenses not been reduced during the applicable periods. | |||||||||||||||||||||||||||||||||||
| 5 | Not annualized. | |||||||||||||||||||||||||||||||||||
| 6 | Less than $500,000. | |||||||||||||||||||||||||||||||||||
| 7 | Annualized. | |||||||||||||||||||||||||||||||||||
| 8 | The portfolio turnover is shown for the period from 11-1-10 to 10-31-11. | |||||||||||||||||||||||||||||||||||
Note 1 — Organization
John Hancock Classic Value Fund (the fund) is a series of John Hancock Capital Series (the Trust), an open-end management investment company organized as a Massachusetts business trust and registered under the Investment Company Act of 1940, as amended (the 1940 Act). The investment objective of the fund is to seek long-term growth of capital.
The fund may offer multiple classes of shares. The shares currently offered are detailed in the Statement of assets and liabilities. Class A and Class C shares are offered to all investors. Class B shares are closed to new investors. Class I shares are offered to institutions and certain investors. Class R1, Class R2, Class R3, Class R4 and Class R5 shares are available only to certain retirement plans. Class R6 shares are available only to certain retirement plans, institutions and other investors. Shareholders of each class have exclusive voting rights to matters that affect that class. The distribution and service fees, if any, and transfer agent fees for each class may differ. Class B shares convert to Class A shares eight years after purchase.
Note 2 — Significant accounting policies
The financial statements have been prepared in conformity with accounting principles generally accepted in the United States of America (US GAAP), which require management to make certain estimates and assumptions as of the date of the financial statements. Actual results could differ from those estimates and those differences could be significant. The fund qualifies as an investment company under Topic 946 of Accounting Standards Codification of US GAAP.
Events or transactions occurring after the end of the fiscal period through the date that the financial statements were issued have been evaluated in the preparation of the financial statements. The following summarizes the significant accounting policies of the fund:
Security valuation. Investments are stated at value as of the close of regular trading on the New York Stock Exchange (NYSE), normally at 4:00 p.m., Eastern Time. In order to value the securities, the fund uses the following valuation techniques: Equity securities held by the fund are valued at the last sale price or official closing price on the exchange where the security was acquired or most likely will be sold. In the event there were no sales during the day or closing prices are not available, the securities are valued using the last available bid price. Investments by the fund in open-end mutual funds, including John Hancock Collateral Trust (JHCT), are valued at their respective net asset values each business day. Foreign securities and currencies are valued in U.S. dollars, based on foreign currency exchange rates supplied by an independent pricing vendor. Other portfolio securities and assets, for which reliable market quotations are not readily available, are valued at fair value as determined in good faith by the fund's Pricing Committee following procedures established by the Board of Trustees. The frequency with which these fair valuation procedures are used cannot be predicted and fair value of securities may differ significantly from the value that would have been used had a ready market for such securities existed.
The fund uses a three-tier hierarchy to prioritize the pricing assumptions, referred to as inputs, used in valuation techniques to measure fair value. Level 1 includes securities valued using quoted prices in active markets for identical securities. Level 2 includes securities valued using other significant observable inputs. Observable inputs may include quoted prices for similar securities, interest rates, prepayment speeds and credit risk. Prices for securities valued using these inputs are received from independent pricing vendors and brokers and are based on an evaluation of the inputs described. Level 3 includes securities valued using significant unobservable inputs when market prices are not readily available or reliable, including the fund's own assumptions in determining the fair value of investments. Factors used in determining value may include market or issuer specific events or trends, changes in interest rates and credit quality. The inputs or methodology used for valuing securities are not necessarily an indication of the risks associated with investing in those securities. Changes in valuation techniques may result in transfers into or out of an assigned level within the disclosure hierarchy.
As of April 30, 2015, all investments are categorized as Level 1 under the hierarchy described above, except repurchase agreements, which are categorized as Level 2.
Repurchase agreements. The fund may enter into repurchase agreements. When the fund enters into a repurchase agreement, it receives collateral that is held in a segregated account by the fund's custodian. The collateral amount is marked-to-market and monitored on a daily basis to ensure that the collateral held is in an amount not less than the principal
29
amount of the repurchase agreement plus any accrued interest. Collateral received by the fund for repurchase agreements is disclosed in the Fund's investments as part of the caption related to the repurchase agreement.
Repurchase agreements are typically governed by the terms and conditions of the Master Repurchase Agreement and/or Global Master Repurchase Agreement (collectively, MRA). Upon an event of default, the non-defaulting party may close out all transactions traded under the MRA and net amounts owed. Absent an event of default, assets and liabilities resulting from repurchase agreements are not offset in the Statement of assets and liabilities. In the event of a default by the counterparty, realization of the collateral proceeds could be delayed, during which time the collateral value may decline or the counterparty may have insufficient assets to pay back claims resulting from close-out of the transactions.
Security transactions and related investment income. Investment security transactions are accounted for on a trade date plus one basis for daily net asset value calculations. However, for financial reporting purposes, investment transactions are reported on trade date. Interest income is accrued as earned. Dividend income is recorded on the ex-date, except for dividends of foreign securities where the dividend may not be known until after the ex-date. In those cases, dividend income, net of withholding taxes, is recorded when the fund becomes aware of the dividends. Foreign taxes are provided for based on the fund's understanding of the tax rules and rates that exist in the foreign markets in which it invests. Gains and losses on securities sold are determined on the basis of identified cost and may include proceeds from litigation.
Securities lending. The fund may lend its securities to earn additional income. The fund receives cash collateral from the borrower in an amount not less than the market value of the loaned securities. The fund will invest its collateral in JHCT, an affiliate of the fund, which has a floating net asset value and is registered with the Securities and Exchange Commission as an investment company. JHCT invests cash received as collateral as part of the securities lending program in short-term money market investments. The fund will receive the benefit of any gains and bear any losses generated by JHCT with respect to the cash collateral.
If a borrower fails to return loaned securities when due, then the lending agent is responsible and indemnifies the fund for the lent securities. The lending agent uses the collateral received from the borrower to purchase replacement securities of the same issue, type, class and series of the loaned securities. If the value of the collateral is less than the purchase cost of replacement securities, the lending agent is responsible for satisfying the shortfall but only to the extent that the shortfall is not due to any decrease in the value of JHCT.
Although the risk of the loss of the securities lent is mitigated by receiving collateral from the borrower and through lending agent indemnification, the fund could experience a delay in recovering securities or could experience a lower than expected return if the borrower fails to return the securities on a timely basis. The fund may receive compensation for lending its securities by retaining a portion of the return on the investment of the collateral and compensation from fees earned from borrowers of the securities. Net income received from JHCT is a component of securities lending income as recorded on the Statement of operations.
Obligations to repay collateral received by the fund is shown on the Statement of assets and liabilities as Payable upon return of securities loaned.
Foreign taxes. The fund may be subject to withholding tax on income and/or capital gains or repatriation taxes imposed by certain countries in which the fund invests. Taxes are accrued based upon investment income, realized gains or unrealized appreciation.
Line of credit. The fund may borrow from banks for temporary or emergency purposes, including meeting redemption requests that otherwise might require the untimely sale of securities. Pursuant to the fund's custodian agreement, the custodian may loan money to the fund to make properly authorized payments. The fund is obligated to repay the custodian for any overdraft, including any related costs or expenses. The custodian may have a lien, security interest or security entitlement in any fund property that is not otherwise segregated or pledged, to the extent of any overdraft, and to the maximum extent permitted by law.
30
In addition, the fund and other affiliated funds have entered into an agreement with Citibank N.A. that enables them to participate in a $300 million unsecured committed line of credit. A commitment fee, payable at the end of each calendar quarter, based on the average daily unused portion of the line of credit, is charged to each participating fund on a pro rata basis and is reflected in Other expenses on the Statement of operations. Commitment fees for the six months ended April 30, 2015 were $727. For the six months ended April 30, 2015, the fund had no borrowings under the line of credit.
Expenses. Within the John Hancock group of funds complex, expenses that are directly attributable to an individual fund are allocated to such fund. Expenses that are not readily attributable to a specific fund are allocated among all funds in an equitable manner, taking into consideration, among other things, the nature and type of expense and the fund's relative net assets. Expense estimates are accrued in the period to which they relate and adjustments are made when actual amounts are known.
Class allocations. Income, common expenses and realized and unrealized gains (losses) are determined at the fund level and allocated daily to each class of shares based on the net assets of the class. Class-specific expenses, such as distribution and service fees, if any, and transfer agent fees, are calculated daily for each class, based on the net asset value of the class and the applicable specific expense rates.
Federal income taxes. The fund intends to continue to qualify as a regulated investment company by complying with the applicable provisions of the Internal Revenue Code and will not be subject to federal income tax on taxable income that is distributed to shareholders. Therefore, no federal income tax provision is required.
Under the Regulated Investment Company Modernization Act of 2010, the fund is permitted to carry forward capital losses incurred in taxable years beginning after December 22, 2010 for an unlimited period. Any losses incurred during those taxable years will be required to be utilized prior to the losses incurred in pre-enactment taxable years. As a result of this ordering rule, pre-enactment capital loss carryforwards may be more likely to expire unused. Additionally, post-enactment capital losses that are carried forward will retain their character as either short-term or long-term capital losses rather than being considered all short-term as under previous law.
For federal income tax purposes, as of October 31, 2014, the fund had a capital loss carryforward of $1,872,070,559 available to offset future net realized capital gains. This carryforward expires as follows: October 31, 2016 -- $392,858,897 and October 31, 2017 -- $1,479,211,662.
As of October 31, 2014, the fund had no uncertain tax positions that would require financial statement recognition, derecognition or disclosure. The fund's federal tax returns are subject to examination by the Internal Revenue Service for a period of three years.
Distribution of income and gains. Distributions to shareholders from net investment income and net realized gains, if any, are recorded on the ex-date. The fund generally declares and pays dividends and capital gain distributions, if any, annually.
Distributions paid by the fund with respect to each class of shares are calculated in the same manner, at the same time and in the same amount, except for the effect of class level expenses that may be applied differently to each class.
Such distributions, on a tax basis, are determined in conformity with income tax regulations, which may differ from US GAAP.
Capital accounts within the financial statements are adjusted for permanent book-tax differences. These adjustments have no impact on net assets or the results of operations. Temporary book-tax differences, if any, will reverse in a subsequent period. Book-tax differences are primarily attributable to wash sale loss deferrals and redemptions in kind.
Note 3 — Guarantees and indemnifications
Under the Trust's organizational documents, its Officers and Trustees are indemnified against certain liabilities arising out of the performance of their duties to the Trust, including the fund. Additionally, in the normal course of business, the fund enters into contracts with service providers that contain general indemnification clauses. The fund's maximum exposure under
31
these arrangements is unknown, as this would involve future claims that may be made against the fund that have not yet occurred. The risk of material loss from such claims is considered remote.
Note 4 — Fees and transactions with affiliates
John Hancock Advisers, LLC (the Advisor) serves as investment advisor for the fund. John Hancock Funds, LLC (the Distributor), an affiliate of the Advisor, serves as principal underwriter of the fund. The Advisor and the Distributor are indirect, wholly owned subsidiaries of Manulife Financial Corporation (MFC).
Management fee. The fund has an investment management agreement with the Advisor under which the fund pays a monthly management fee to the Advisor equivalent, on an annual basis to the sum of: (a) 0.750% of the first $2.5 billion of the fund's average daily net assets; (b) 0.740% of the next $2.5 billion of the fund's average daily net assets; and (c) 0.730% of the fund's average daily net assets in excess of $5 billion. The Advisor has a subadvisory agreement with Pzena Investment Management, LLC. The fund is not responsible for payment of the subadvisory fees.
The Advisor has contractually agreed to waive a portion of its management fee and/or reimburse expenses for certain funds of the John Hancock complex, including the fund (the participating portfolios). This waiver is based upon aggregate net assets of all the participating portfolios. The amount of the reimbursement is calculated daily and allocated among all the participating portfolios in proportion to the daily net assets of each fund. During the six months ended April 30, 2015, this waiver amounted to 0.01% of the fund's average net assets on an annualized basis. This arrangement may be amended or terminated at any time by the Advisor upon notice to the fund and with the approval of the Board of Trustees.
The Advisor has contractually agreed to waive and/or reimburse all class specific expenses for Class R6 shares of the fund to the extent they exceed 0.00% of average annual net assets, on an annualized basis. The fee waiver and/or reimbursement will continue in effect until February 29, 2016, unless renewed by mutual agreement of the fund and Advisor based upon a determination of that this is appropriate under the circumstances at the time.
Prior to March 1, 2015, the Advisor had contractually agreed to waive and/or reimburse all class specific expenses for Class B shares of the fund, including Rule 12b-1 fees and transfer agency fees and service fees, as applicable, to the extent they exceeded 1.30% of average annual net assets attributable to Class B shares.
For the six months ended April 30, 2015, these expense reductions described above amounted to the following:
| Class | Expense reduction | Class | Expense reduction | |
| Class A | $14,457 | Class R3 | $45 | |
| Class B | 410 | Class R4 | 2 | |
| Class C | 3,773 | Class R5 | 4 | |
| Class I | 80,120 | Class R6 | 76 | |
| Class R1 | 251 | Total | $99,155 | |
| Class R2 | 17 |
The investment management fees, including the impact of the waivers and reimbursements as described above, incurred for the six months ended April 30, 2015 were equivalent to a net annual effective rate of 0.74% of the fund's average daily net assets.
Accounting and legal services. Pursuant to The Accounting and Legal Services Agreement, the fund reimburses the Advisor for all expenses associated with providing the administrative, financial, legal, accounting and recordkeeping services to the fund, including the preparation of all tax returns, periodic reports to shareholders and regulatory reports, among other services. These expenses are allocated to each share class based on its relative net assets at the time the expense was incurred. These accounting and legal services fees incurred for the six months ended April 30, 2015 amounted to an annual rate of 0.01% of the fund's average daily net assets.
Distribution and service plans. The fund has a distribution agreement with the Distributor. The fund has adopted distribution and service plans with respect to Class A, Class B, Class C, Class R1, Class R2, Class R3 and Class R4 shares
32
pursuant to Rule 12b-1 under the 1940 Act, to pay the Distributor for services provided as the distributor of shares of the fund. In addition, under a service plan for Class R1, Class R2, Class R3, Class R4 and Class R5 shares, the fund pays for certain other services. The fund may pay up to the following contractual rates of distribution and service fees under these arrangements, expressed as an annual percentage of average daily net assets for each class of the fund's shares.
| Class | Rule 12b-1 fee | Service fee | Class | Rule 12b-1 fee | Service fee | |
| Class A | 0.25% | — | Class R2 | 0.25% | 0.25% | |
| Class B | 1.00% | — | Class R3 | 0.50% | 0.15% | |
| Class C | 1.00% | — | Class R4 | 0.25% | 0.10% | |
| Class R1 | 0.50% | 0.25% | Class R5 | — | 0.05% |
The fund's Distributor has contractually agreed to waive 0.10% of Rule 12b-1 fees for Class R4 shares to limit the Rule 12b-1 fees on Class R4 to 0.15% of the average daily net assets of Class R4 shares, until at least February 29, 2016, unless renewed by mutual agreement of the fund and the Distributor based upon a determination that this is appropriate under the circumstances at the time. Reimbursements related to this contractual waiver amounted to $29 for Class R4 shares for the six months ended April 30, 2015.
Sales charges. Class A shares are assessed up-front sales charges, which resulted in payments to the Distributor amounting to $318,468 for the six months ended April 30, 2015. Of this amount, $52,882 was retained and used for printing prospectuses, advertising, sales literature and other purposes, $260,430 was paid as sales commissions to broker-dealers and $5,156 was paid as sales commissions to sales personnel of Signator Investors, Inc., a broker-dealer affiliate of the Advisor.
Class A, Class B and Class C shares may be subject to contingent deferred sales charges (CDSCs). Certain Class A shares that are acquired through purchases of $1 million or more and are redeemed within one year of purchase are subject to a 1.00% sales charge. Class B shares that are redeemed within six years of purchase are subject to CDSCs, at declining rates, beginning at 5.00%. Class C shares that are redeemed within one year of purchase are subject to a 1.00% CDSC. CDSCs are applied to the lesser of the current market value at the time of redemption or the original purchase cost of the shares being redeemed. Proceeds from CDSCs are used to compensate the Distributor for providing distribution-related services in connection with the sale of these shares. During the six months ended April 30, 2015, CDSCs received by the Distributor amounted to $978, $3,774 and $6,108 for Class A, Class B and Class C shares, respectively.
Transfer agent fees. The fund has a transfer agent agreement with John Hancock Signature Services, Inc. (Signature Services), an affiliate of the Advisor. The transfer agent fees paid to Signature Services are determined based on the cost to Signature Services (Signature Services Cost) of providing recordkeeping services. The Signature Services Cost includes a component of allocated John Hancock corporate overhead for providing transfer agent services to the fund and to all other John Hancock affiliated funds. It also includes out-of-pocket expenses, including payments made to third-parties for recordkeeping services provided to their clients who invest in one or more John Hancock funds. In addition, Signature Services Cost may be reduced by certain fees that Signature Services receives in connection with retirement and small accounts. Signature Services Cost is calculated monthly and allocated, as applicable, to five categories of share classes: Retail Share and Institutional Share Classes of Non-Municipal Bond Funds, Class R6 Shares, Retirement Share Classes and Municipal Bond Share Classes. Within each of these categories, the applicable costs are allocated to the affected John Hancock affiliated funds and/or classes, based on the relative average daily net assets.
Class level expenses. Class level expenses for the six months ended April 30, 2015 were:
| Class | Distribution and service fees | Transfer agent fees | ||||||
| Class A | $474,492 | $227,149 | ||||||
| Class B | 53,847 | 6,426 | ||||||
| Class C | 495,392 | 59,254 | ||||||
| Class I | — | 1,100,813 |
33
| Class | Distribution and service fees | Transfer agent fees | ||||||
| Class R1 | 24,723 | 476 | ||||||
| Class R2 | 843 | 33 | ||||||
| Class R3 | 3,870 | 87 | ||||||
| Class R4 | 73 | 4 | ||||||
| Class R5 | 17 | 8 | ||||||
| Class R6 | — | 50 | ||||||
| Total | $1,053,257 | $1,394,300 |
Trustee expenses. The fund compensates each Trustee who is not an employee of the Advisor or its affiliates. The costs of paying Trustee compensation and expenses are allocated to each fund based on its net assets relative to other funds within the John Hancock group of funds complex.
Interfund lending program. Pursuant to an Exemptive Order issued by the SEC, the fund, along with certain other funds advised by the Advisor, may participate in an interfund lending program. This program provides an alternative credit facility allowing the funds to borrow from, or lend money to, other participating affiliated funds. At period end, no interfund loans were outstanding. Interest expense is included in Other expenses on the Statement of operations. The fund's activity in this program during the period for which loans were outstanding was as follows:
| Borrower or lender | Weighted average loan balance | Days outstanding | Weighted average interest rate | Interest expense |
| Borrower | $90,569,631 | 2 | 0.46% | $2,314 |
Note 5 — Fund share transactions
Transactions in fund shares for the six months ended April 30, 2015 and for the year ended October 31, 2014 were as follows:
| Six months ended 4-30-15 | Year ended 10-31-14 | |||||||||||||||||||||||||
| Shares | Amount | Shares | Amount | |||||||||||||||||||||||
| Class A shares | ||||||||||||||||||||||||||
| Sold | 736,956 | $19,345,550 | 2,393,476 | $58,359,607 | ||||||||||||||||||||||
| Distributions reinvested | 118,808 | 2,999,916 | 166,924 | 3,917,695 | ||||||||||||||||||||||
| Repurchased | (1,404,716 | ) | (36,883,196 | ) | (8,252,020 | ) | (209,538,636 | ) | ||||||||||||||||||
| Net decrease | (548,952 | ) | ($14,537,730 | ) | (5,691,620 | ) | ($147,261,334 | ) | ||||||||||||||||||
| Class B shares | ||||||||||||||||||||||||||
| Sold | 17,089 | $443,449 | 52,852 | $1,296,475 | ||||||||||||||||||||||
| Distributions reinvested | 477 | 11,910 | 732 | 16,985 | ||||||||||||||||||||||
| Repurchased | (88,726 | ) | (2,293,100 | ) | (395,219 | ) | (9,464,994 | ) | ||||||||||||||||||
| Net decrease | (71,160 | ) | ($1,837,741 | ) | (341,635 | ) | ($8,151,534 | ) | ||||||||||||||||||
| Class C shares | ||||||||||||||||||||||||||
| Sold | 132,240 | $3,431,406 | 545,108 | $13,266,782 | ||||||||||||||||||||||
| Distributions reinvested | 3,870 | 96,594 | 3,926 | 91,077 | ||||||||||||||||||||||
| Repurchased | (384,428 | ) | (9,958,421 | ) | (728,241 | ) | (17,751,252 | ) | ||||||||||||||||||
| Net decrease | (248,318 | ) | ($6,430,421 | ) | (179,207 | ) | ($4,393,393 | ) | ||||||||||||||||||
| Class I shares | ||||||||||||||||||||||||||
| Sold | 7,196,283 | $189,099,961 | 29,657,292 | $734,896,493 | ||||||||||||||||||||||
| Distributions reinvested | 644,257 | 16,280,369 | 576,503 | 13,536,284 | ||||||||||||||||||||||
| Repurchased | (22,687,889 | ) | (602,130,098 | ) | (26,306,871 | ) | (654,126,626 | ) | ||||||||||||||||||
| Net increase (decrease) | (14,847,349 | ) | ($396,749,768 | ) | 3,926,924 | $94,306,151 | ||||||||||||||||||||
34
| Six months ended 4-30-15 | Year ended 10-31-14 | |||||||||||||||||||||||||
| Shares | Amount | Shares | Amount | |||||||||||||||||||||||
| Class R1 shares | ||||||||||||||||||||||||||
| Sold | 18,419 | $487,154 | 61,721 | $1,522,821 | ||||||||||||||||||||||
| Distributions reinvested | 1,050 | 26,611 | 1,043 | 24,573 | ||||||||||||||||||||||
| Repurchased | (127,533 | ) | (3,397,895 | ) | (45,226 | ) | (1,126,366 | ) | ||||||||||||||||||
| Net increase (decrease) | (108,064 | ) | ($2,884,130 | ) | 17,538 | $421,028 | ||||||||||||||||||||
| Class R2 shares | ||||||||||||||||||||||||||
| Sold | 3,628 | $94,222 | 10,770 | $261,314 | ||||||||||||||||||||||
| Distributions reinvested | 91 | 2,294 | 127 | 2,974 | ||||||||||||||||||||||
| Repurchased | (2,524 | ) | (65,967 | ) | (14,328 | ) | (333,734 | ) | ||||||||||||||||||
| Net increase (decrease) | 1,195 | $30,549 | (3,431 | ) | ($69,446 | ) | ||||||||||||||||||||
| Class R3 shares | ||||||||||||||||||||||||||
| Sold | 2,306 | $60,805 | 29,406 | $717,630 | ||||||||||||||||||||||
| Distributions reinvested | 256 | 6,470 | 102 | 2,397 | ||||||||||||||||||||||
| Repurchased | (203 | ) | (5,408 | ) | (1,708 | ) | (41,670 | ) | ||||||||||||||||||
| Net increase | 2,359 | $61,867 | 27,800 | $678,357 | ||||||||||||||||||||||
| Class R5 shares | ||||||||||||||||||||||||||
| Sold | 456.5 | $12,030 | 1,932 | $48,864 | ||||||||||||||||||||||
| Distributions reinvested | 29 | 733 | 5 | 109 | ||||||||||||||||||||||
| Repurchased | (990 | ) | (26,452 | ) | (9 | ) | (239 | ) | ||||||||||||||||||
| Net increase (decrease) | (504.5 | ) | ($13,689 | ) | 1,928 | $48,734 | ||||||||||||||||||||
| Class R6 shares | ||||||||||||||||||||||||||
| Sold | 27,167 | $723,715 | 2,995 | $74,411 | ||||||||||||||||||||||
| Distributions reinvested | 228 | 5,761 | 185 | 4,345 | ||||||||||||||||||||||
| Repurchased | (487 | ) | (12,779 | ) | (1,365 | ) | (33,871 | ) | ||||||||||||||||||
| Net increase | 26,908 | $716,697 | 1,815 | $44,885 | ||||||||||||||||||||||
| Total net decrease | (15,793,885.5 | ) | ($421,644,366 | ) | (2,239,888 | ) | ($64,376,552 | ) | ||||||||||||||||||
There were no transactions in fund shares for the six months ended April 30, 2015 and the year ended October 31, 2014 for Class R4.
Affiliates of the fund owned 33%, 5%, 100%, 56% and 13% of shares of beneficial interest of Class R2, Class R3, Class R4, Class R5 and Class R6 shares, respectively, on April 30, 2015.
Note 6 — Purchase and sale of securities
Purchases and sales of securities, other than short-term investments, amounted to $274,693,221 and $692,737,381, respectively, for the six months ended April 30, 2015.
Note 7 — Industry or sector risk
The fund may invest a large percentage of its assets in one or more particular industries or sectors of the economy. If a large percentage of the fund's assets are economically tied to a single or small number of industries or sectors of the economy, the fund will be less diversified than a more broadly diversified fund, and it may cause the fund to underperform if that industry or sector underperforms. In addition, focusing on a particular industry or sector may make the fund's net asset value more volatile. Further, a fund that invests in particular industries or sectors is particularly susceptible to the impact of market, economic, regulatory and other factors affecting those industries or sectors.
35
Trustees James M. Oates, Chairperson Officers Andrew G. Arnott John J. Danello Francis V. Knox, Jr. Charles A. Rizzo Salvatore Schiavone | Investment advisor John Hancock Advisers, LLC Subadvisor Pzena Investment Management, LLC Principal distributor John Hancock Funds, LLC Custodian State Street Bank and Trust Company Transfer agent John Hancock Signature Services, Inc. Legal counsel K&L Gates LLP |
*Member of the Audit Committee
†Non-Independent Trustee
#Effective 3-10-15
The fund's proxy voting policies and procedures, as well as the fund proxy voting record for the most recent twelve-month period ended June 30, are available free of charge on the Securities and Exchange Commission (SEC) website at sec.gov or on our website.
The fund's complete list of portfolio holdings, for the first and third fiscal quarters, is filed with the SEC on Form N-Q. The fund's Form N-Q is available on our website and the SEC's website, sec.gov, and can be reviewed and copied (for a fee) at the SEC's Public Reference Room in Washington, DC. Call 800-SEC-0330 to receive information on the operation of the SEC's Public Reference Room.
We make this information on your fund, as well as monthly portfolio holdings, and other fund details available on our website at jhinvestments.com or by calling 800-225-5291.
| You can also contact us: | |||
| 800-225-5291 jhinvestments.com | Regular mail: John Hancock Signature Services, Inc. | Express mail: John Hancock Signature Services, Inc. | |
36
Family of funds
DOMESTIC EQUITY FUNDS Balanced Blue Chip Growth Classic Value Disciplined Value Disciplined Value Mid Cap Equity-Income Fundamental All Cap Core Fundamental Large Cap Core Fundamental Large Cap Value Large Cap Equity New Opportunities Select Growth Small Cap Equity Small Cap Value Small Company Strategic Growth U.S. Equity U.S. Global Leaders Growth Value Equity GLOBAL AND INTERNATIONAL EQUITY FUNDS Disciplined Value International Emerging Markets Emerging Markets Equity Global Equity Global Opportunities Global Shareholder Yield Greater China Opportunities International Core International Growth International Small Company International Value Equity INCOME FUNDS Bond California Tax-Free Income Core High Yield Emerging Markets Debt Floating Rate Income Focused High Yield Global Income Government Income High Yield Municipal Bond | INCOME FUNDS (continued) Income Investment Grade Bond Money Market Short Duration Credit Opportunities Spectrum Income Strategic Income Opportunities Tax-Free Bond ALTERNATIVE AND SPECIALTY FUNDS Absolute Return Currency Alternative Asset Allocation Enduring Equity Financial Industries Global Absolute Return Strategies Global Conservative Absolute Return Natural Resources Redwood Regional Bank Seaport Technical Opportunities ASSET ALLOCATION Income Allocation Fund Lifestyle Aggressive Portfolio Lifestyle Balanced Portfolio Lifestyle Conservative Portfolio Lifestyle Growth Portfolio Lifestyle Moderate Portfolio Retirement Choices Portfolios (2010-2055) Retirement Living Portfolios (2010-2055) Retirement Living II Portfolios (2010-2055) CLOSED-END FUNDS Financial Opportunities Hedged Equity & Income Income Securities Trust Investors Trust Preferred Income Preferred Income II Preferred Income III Premium Dividend Tax-Advantaged Dividend Income Tax-Advantaged Global Shareholder Yield |
The fund's investment objectives, risks, charges, and expenses are included in the prospectus and should be considered carefully before investing. For a prospectus, contact your financial professional, call John Hancock Investments at 800-225-5291, or visit the fund's website at jhinvestments.com. Please read the prospectus carefully before investing or sending money.
John Hancock Investments
A trusted brand
John Hancock has helped individuals and institutions build and
protect wealth since 1862. Today, we are one of America's strongest
and most-recognized brands.
A better way to invest
As a manager of managers, we search the world to find proven
portfolio teams with specialized expertise for every fund we offer,
then apply vigorous investment oversight to ensure they continue
to meet our uncompromising standards.
Results for investors
Our unique approach to asset management has led to a diverse set
of investments deeply rooted in investor needs, along with strong
risk-adjusted returns across asset classes.
| | John Hancock Funds, LLC n Member FINRA, SIPC 601 Congress Street n Boston, MA 02210-2805 800-225-5291 n jhinvestments.com | |
| This report is for the information of the shareholders of John Hancock Classic Value Fund. It is not authorized for distribution to prospective investors unless preceded or accompanied by a prospectus. | ||
| MF230730 | 38SA 4/15 6/15 | |
ITEM 2. CODE OF ETHICS.
Not applicable.
ITEM 3. AUDIT COMMITTEE FINANCIAL EXPERT.
Not applicable at this time.
ITEM 4. PRINCIPAL ACCOUNTANT FEES AND SERVICES.
Not applicable at this time.
ITEM 5. AUDIT COMMITTEE OF LISTED REGISTRANTS.
Not applicable at this time.
ITEM 6. SCHEDULE OF INVESTMENTS.
(a)
Not applicable.
(b)
Not applicable.
ITEM 7. DISCLOSURE OF PROXY VOTING POLICIES AND PROCEDURES FOR CLOSED-END MANAGEMENT INVESTMENT COMPANIES.
Not applicable.
ITEM 8. PORTFOLIO MANAGERS OF CLOSED-END MANAGEMENT INVESTMENT COMPANIES.
Not applicable.
ITEM 9. PURCHASES OF EQUITY SECURITIES BY CLOSED-END MANAGEMENT INVESTMENT COMPANY AND AFFILIATED PURCHASERS.
Not applicable.
ITEM 10. SUBMISSION OF MATTERS TO A VOTE OF SECURITY HOLDERS.
The registrant has adopted procedures by which shareholders may recommend nominees to the registrant’s Board of Trustees. A copy of the procedures is filed as an exhibit to this Form N-CSR. See attached “John Hancock Funds – Nominating, Governance and Administration Committee Charter.”
ITEM 11. CONTROLS AND PROCEDURES.
(a) Based upon their evaluation of the registrant's disclosure controls and procedures as conducted within 90 days of the filing date of this Form N-CSR, the registrant's principal executive officer and principal financial officer have concluded that those disclosure controls and procedures provide reasonable assurance that the material information required to be disclosed by the registrant on this report is recorded, processed, summarized and reported within the time periods specified in the Securities and Exchange Commission's rules and forms.
(b) There were no changes in the registrant's internal control over financial reporting that occurred during the registrant's most recent fiscal half-year (the registrant's second fiscal half-year in the case of an annual report) that have materially affected, or are reasonably likely to materially affect, the registrant's internal control over financial reporting.
ITEM 12. EXHIBITS.
(a) Separate certifications for the registrant's principal executive officer and principal financial officer, as required by Section 302 of the Sarbanes-Oxley Act of 2002 and Rule 30a-2(a) under the Investment Company Act of 1940, are attached.
(b) Separate certifications for the registrant's principal executive officer and principal financial officer, as required by 18 U.S.C. Section 1350, as adopted pursuant to Section 906 of the Sarbanes-Oxley Act of 2002, and Rule 30a-2(b) under the Investment Company Act of 1940, are attached. The certifications furnished pursuant to this paragraph are not deemed to be "filed" for purposes of Section 18 of the Securities Exchange Act of 1934, or otherwise subject to the liability of that section. Such certifications are not deemed to be incorporated by reference into any filing under the Securities Act of 1933 or the Securities Exchange Act of 1934, except to the extent that the Registrant specifically incorporates them by reference.
(c)(1) Submission of Matters to a Vote of Security Holders is attached. See attached “John Hancock Funds – Nominating, Governance and Administration Committee Charter.”
(c)(2) Contact person at the registrant.
SIGNATURES
Pursuant to the requirements of the Securities Exchange Act of 1934 and the Investment Company Act of 1940, the registrant has duly caused this report to be signed on its behalf by the undersigned, thereunto duly authorized.
John Hancock Capital Series
By:
/s/ Andrew Arnott
______________________________
Andrew Arnott
President
Date: June 17, 2015
Pursuant to the requirements of the Securities Exchange Act of 1934 and the Investment Company Act of 1940, this report has been signed below by the following persons on behalf of the registrant and in the capacities and on the dates indicated.
By:
/s/ Andrew Arnott
______________________________
Andrew Arnott
President
Date: June 17, 2015
By:
/s/ Charles A. Rizzo
______________________________
Charles A. Rizzo
Chief Financial Officer
Date: June 17, 2015