UNITED STATES
SECURITIES AND EXCHANGE COMMISSION
Washington, D.C. 20549
FORM N-CSR
CERTIFIED SHAREHOLDER REPORT OF REGISTERED
MANAGEMENT INVESTMENT COMPANIES
Investment Company Act file number 811- 1677
John Hancock Capital Series
(Exact name of registrant as specified in charter)
601 Congress Street, Boston, Massachusetts 02210
(Address of principal executive offices) (Zip code)
Salvatore Schiavone
Treasurer
601 Congress Street
Boston, Massachusetts 02210
(Name and address of agent for service)
Registrant's telephone number, including area code: 617-663-4497
| Date of fiscal year end: | October 31 | |
| Date of reporting period: | April 30, 2018 |
ITEM 1. REPORTS TO STOCKHOLDERS.
John Hancock
U.S. Global Leaders Growth Fund
Semiannual report 4/30/18


A message to shareholders
Dear shareholder,
Financial markets around the world experienced a meaningful rise in volatility in the last half of the reporting period, leading to some mixed results for equity investors. Stocks generally declined late in the period as investors reacted to a potential trade war between the United States and China and the prospect of rising inflation. While some in the asset management community believe the sell-off will be temporary, we have suggested for some time that the era of extremely low volatility would eventually come to an end, and that now appears to be the case.
Ultimately, the asset prices of stocks are underpinned by fundamentals, and the good news is that those continue to appear supportive. Unemployment remained close to historic lows, consumer confidence rose, and the housing market continued to notch steady gains. One moderating factor was the U.S. Federal Reserve's steady tightening of monetary policy. While higher interest rates alone may not cause the economy to pull back, markets will be closely attuned to any sign of policymakers quickening the pace of interest-rate increases in the year ahead.
Your best resource in unpredictable markets is your financial advisor, who can help position your portfolio so that it's sufficiently diversified to meet your long-term objectives and to withstand the inevitable turbulence along the way.
On behalf of everyone at John Hancock Investments, I'd like to take this opportunity to welcome new shareholders and to thank existing shareholders for the continued trust you've placed in us.
Sincerely,

Andrew G. Arnott
President and CEO,
John Hancock Investments
Head of Wealth and Asset Management,
United States and Europe
This commentary reflects the CEO's views, which are subject to change at any time. Investing involves risks, including the potential loss of principal. Diversification does not guarantee a profit or eliminate the risk of a loss. It is not possible to invest directly into an index. For more up-to-date information, please visit our website at jhinvestments.com.
John Hancock
U.S. Global Leaders Growth Fund
INVESTMENT OBJECTIVE
The fund seeks long-term growth of capital.
AVERAGE ANNUAL TOTAL RETURNS AS OF 4/30/18 (%)
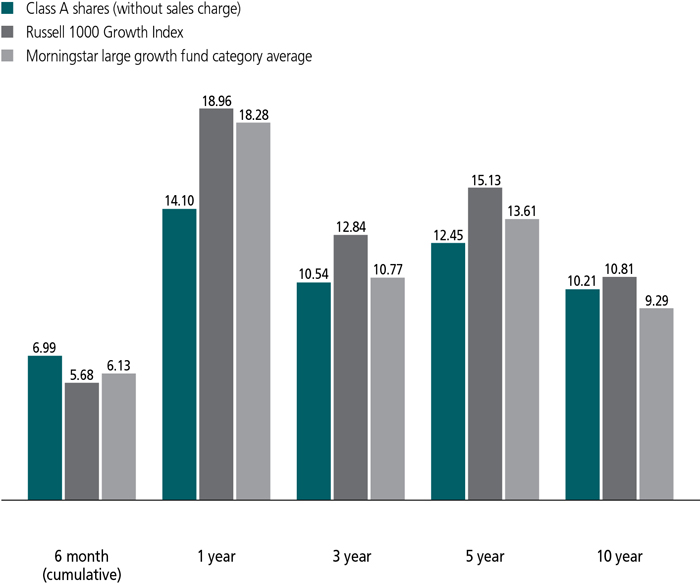
The Russell 1000 Growth Index is an unmanaged index of companies in the Russell 1000 Index (the 1,000 largest U.S. publicly traded companies) with high price-to-book ratios and higher forecasted growth values.
It is not possible to invest directly in an index. Index figures do not reflect expenses or sales charges, which would result in lower returns.
Figures from Morningstar, Inc. include reinvested distributions and do not take into account sales charges. Actual load-adjusted performance is lower.
The past performance shown here reflects reinvested distributions and the beneficial effect of any expense reductions, and does not guarantee future results. Returns for periods shorter than one year are cumulative. Performance of the other share classes will vary based on the difference in the fees and expenses of those classes. Shares will fluctuate in value and, when redeemed, may be worth more or less than their original cost. Current month-end performance may be lower or higher than the performance cited, and can be found at jhinvestments.com or by calling 800-225-5291. For further information on the fund's objectives, risks, and strategy, see the fund's prospectus.
PERFORMANCE HIGHLIGHTS OVER THE LAST SIX MONTHS
Stocks advanced despite increased market volatility
Improving economic growth and strong corporate earnings lifted U.S. stocks, but market volatility increased late in the period as a possible consequence of rising inflation expectations, higher interest rates, and growing trade tensions.
The fund outperformed
The fund outpaced the broader U.S. equity market and its benchmark, the Russell 1000 Growth Index.
Sector allocation and stock selection added value
Holdings in the high-performing information technology sector contributed the most to the fund's performance.
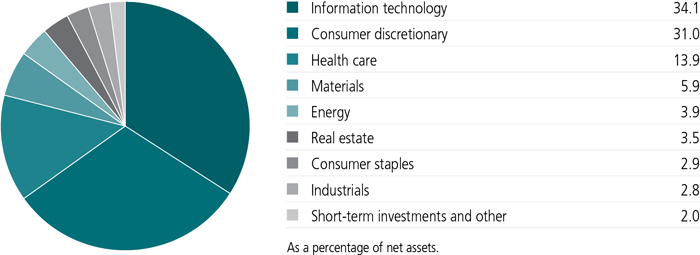
SECTOR COMPOSITION AS OF 4/30/18 (%)
A note about risks
Growth stocks may be more susceptible to earnings disappointments as compared with value stocks, and market values can be more volatile. Large company stocks could fall out of favor. Foreign investing has additional risks, such as currency and market volatility and political and social instability. A portfolio concentrated in one sector or that holds a limited number of securities may fluctuate more than a more broadly invested fund. Please see the fund's prospectus for additional risks.
An interview with Portfolio Manager Gordon M. Marchand, CPA, CFA, CIC, Sustainable Growth Advisers, LP

Gordon M. Marchand, CPA, CFA, CIC
Portfolio Manager
Sustainable Growth Advisors
How did the U.S. equity market perform during the six months ended April 30, 2018?
Although U.S. stocks posted positive returns overall for the reporting period, the period featured two distinct market environments. During the first half, the equity market's steady advance was characterized by strong momentum and low volatility. Optimism about an improving U.S. economy, strengthening corporate earnings, and the passage of federal tax reform legislation provided a favorable backdrop for a momentum-driven stock market rally.
In the latter half of the period, the market gave back some of its earlier gains amid a significant increase in volatility. Stocks were buffeted by rising inflation expectations, an increase in short-term rates by the U.S. Federal Reserve, increased regulatory scrutiny in the information technology sector, and a potential trade war between the U.S. and China. As a result, the broad-based S&P 500 Index experienced 23 daily moves of more than 1% in the first quarter of 2018, compared with eight times during the entire year in 2017.
Growth stocks outperformed value stocks as the fund's benchmark, the Russell 1000 Growth Index, returned 5.68%. Economically sensitive sectors such as consumer discretionary and energy led the market's advance.
In this environment, how did the fund perform?
The fund outperformed its benchmark. It trailed early in the period, when volatility was low and momentum was driving the market higher, but outperformed in the volatile market environment that characterized the last half of the period. Historically, greater market volatility has been a tailwind for our investment approach as the downside protection offered by the revenue predictability, long runways of growth, and high cash flow generation of the companies in which we invest becomes more highly valued in the marketplace.
What contributed the most to the fund's outperformance of the benchmark?
Stock selection in the information technology sector contributed the most to relative performance. The leading contributor was open source software provider Red Hat, Inc., which exceeded earnings
Another top contributor was business payment services provider FleetCor Technologies, Inc., which reported attractive growth across its core businesses. The company also established a new customer relationship with discount retailer Wal-Mart Stores, Inc. (not held by the fund), which has begun to accept FleetCor's fuel cards across their filling station locations. FleetCor continues to build its brand via new partnerships and acquisitions, and our research indicates the company is well positioned for attractive growth moving forward.
Fund holdings in the consumer discretionary sector also added value during the period, led by athletic apparel maker NIKE, Inc. and beauty products retailer Ulta Beauty, Inc. NIKE benefited from improving sales outside of the U.S. and a burgeoning shift toward direct sales to consumers, while Ulta rallied sharply late in the period after reporting stronger-than-expected earnings.
What fund holdings detracted from performance?
Stock selection in the healthcare sector was a drag on relative performance. Biotechnology firm Regeneron Pharmaceuticals, Inc. was the most significant detractor as concerns persisted over increased competition for one of the company's key products, Eylea, which treats different forms of macular degeneration. While we expect that Eylea will likely face greater competition, we remain confident that it will continue to be a front-line therapy for many patients. In addition, we believe that Regeneron's significant research and development investments and evolving pipeline of new
TOP 10 HOLDINGS AS OF 4/30/18 (%)
| Amazon.com, Inc. | 4.2 |
| Visa, Inc., Class A | 4.1 |
| FleetCor Technologies, Inc. | 4.0 |
| Yum! Brands, Inc. | 4.0 |
| UnitedHealth Group, Inc. | 4.0 |
| Alphabet, Inc., Class C | 3.9 |
| Ecolab, Inc. | 3.9 |
| Schlumberger, Ltd. | 3.9 |
| Autodesk, Inc. | 3.8 |
| NIKE, Inc., Class B | 3.8 |
| TOTAL | 39.6 |
| As a percentage of net assets. | |
| Cash and cash equivalents are not included. | |
Healthcare information technology company Cerner Corp. was another noteworthy detractor as the company reported booking delays and lower-than-expected earnings guidance for 2018. Although we feel that Cerner remains well positioned to help its clients navigate the changing healthcare cost reimbursement landscape, increased revenue volatility and declining profit margins in the near term created headwinds for the stock. Consequently, we replaced Cerner with a higher-confidence growth opportunity.
Outside of the healthcare sector, one of the largest detractors was restaurant chain Chipotle Mexican Grill, Inc., which reported declining restaurant traffic in the wake of food safety issues that put downward pressure on profit margins. The brand equity of Chipotle proved to be less resilient than we expected given the social media response to the company's food safety issues, bringing our investment thesis into question. We ultimately sold the fund's position in the stock.
What other changes did you make to the portfolio during the period?
Along with Cerner and Chipotle, we sold energy equipment and services provider Core Laboratories NV and financial services company State Street Corp. We eliminated State Street on valuation concerns following the stock's sharp rally in late 2017, and we sold Core Labs to consolidate the fund's energy holdings in global oil services leader Schlumberger, Ltd., which we expect to benefit from its greater exposure to growing international oilfield investment.
We added four new stocks to the portfolio during the period. Two of the new holdings are consumer-related companies—media and entertainment conglomerate The Walt Disney Company and restaurant chain Yum! Brands, Inc. Disney recently announced a planned acquisition of selected media assets from Twenty-First Century Fox, Inc. that should be highly complementary to Disney's other media properties and its global expansion plans. Yum! derives strong recurring revenues from its three brand franchises—Taco Bell, KFC, and Pizza Hut—that are enhanced by affordable price points, geographic and product diversity, and ongoing menu innovation.
Specialty gas provider Praxair, Inc., and medical technology company Becton, Dickinson and Company were also added to the portfolio. Praxair generates substantial recurring revenues, and its pending acquisition of rival gas producer Linde AG (not held) is expected to extend the company's global reach. Becton, Dickinson maintains a strong global market share in disposable medical
products, such as syringes and needles. Its highly recurring revenue stream is supported by reliable and high-quality manufacturing on a global scale, and the company is well positioned to grow globally as healthcare services improve in emerging economies.
How was the fund positioned at the end of the reporting period?
While the fund's sector allocation is a function of our emphasis on individual security selection, the fund's largest sector weightings at period-end included information technology, consumer discretionary, and healthcare.
We believe the fund is well positioned to benefit from fundamental changes developing in the U.S. equity market. Improving global economic growth has led to rising inflation expectations and higher interest rates. Given the market's lofty expectations for economic and profit growth while interest rates and trade tensions are rising, we could see a potential mismatch between expectations and reality that could lead to greater market volatility. In this environment, we believe the fund's sustainable earnings growth, superior business quality characteristics, and attractive cash-flow-based valuation relative to the broader market will be supportive for performance going forward.
Can you tell us about an upcoming change in control?
On February 2, 2018, it was announced that Sustainable Growth Advisors was being purchased by Virtus Investment Partners. The new change in control is expected to take place on or about June 30, 2018. It is expected to have no effect on the objectives of the fund or on the personnel who manage it.
MANAGED BY
 | George P. Fraise On the fund since 2000 Investing since 1987 |
| | Gordon M. Marchand, CPA, CFA, CIC On the fund since 1995 Investing since 1977 |
 | Robert L. Rohn On the fund since 2003 Investing since 1983 |
![]()
TOTAL RETURNS FOR THE PERIOD ENDED APRIL 30, 2018
| Average annual total returns (%) with maximum sales charge | Cumulative total returns (%) with maximum sales charge | ||||||
| 1-year | 5-year | 10-year | 6-month | 5-year | 10-year | ||
| Class A | 8.39 | 11.30 | 9.64 | 1.64 | 70.81 | 151.05 | |
| Class B | 8.24 | 11.35 | 9.54 | 1.69 | 71.18 | 148.78 | |
| Class C | 12.23 | 11.61 | 9.38 | 5.61 | 73.19 | 145.11 | |
| Class I1 | 14.38 | 12.75 | 10.58 | 7.12 | 82.20 | 173.49 | |
| Class R21,2 | 13.92 | 12.30 | 10.15 | 6.92 | 78.57 | 162.87 | |
| Class R61,2 | 14.50 | 12.87 | 10.49 | 7.17 | 83.16 | 171.14 | |
| Index 1† | 18.96 | 15.13 | 10.81 | 5.68 | 102.25 | 179.13 | |
| Index 2† | 13.27 | 12.96 | 9.02 | 3.82 | 83.93 | 137.11 | |
Performance figures assume all distributions have been reinvested. Figures reflect maximum sales charges on Class A shares of 5% and the applicable contingent deferred sales charge (CDSC) on Class B and Class C shares. The Class B shares' CDSC declines annually between years 1 to 6 according to the following schedule: 5%, 4%, 3%, 3%, 2%, 1%. No sales charge will be assessed after the sixth year. Class C shares sold within one year of purchase are subject to a 1% CDSC. Sales charges are not applicable to Class I, Class R2, and Class R6 shares.
The expense ratios of the fund, both net (including any fee waivers and/or expense limitations) and gross (excluding any fee waivers and/or expense limitations), are set forth according to the most recent publicly available prospectus for the fund and may differ from those disclosed in the Financial highlights tables in this report. The expense ratios are as follows:
| Class A | Class B | Class C | Class I | Class R2 | Class R6 | ||
| Gross/Net (%) | 1.17 | 1.92 | 1.92 | 0.91 | 1.32 | 0.82 |
Please refer to the most recent prospectus and annual or semiannual report for more information on expenses and any expense limitation arrangements for each class.
The returns reflect past results and should not be considered indicative of future performance. The return and principal value of an investment will fluctuate so that shares, when redeemed, may be worth more or less than their original cost. Due to market volatility and other factors, the fund's current performance may be higher or lower than the performance shown. For current to the most recent month-end performance data, please call 800-225-5291 or visit the fund's website at jhinvestments.com.
The performance table above and the chart on the next page do not reflect the deduction of taxes that a shareholder would pay on fund distributions or the redemption of fund shares. The fund's performance results reflect any applicable fee waivers or expense reductions, without which the expenses would increase and results would have been less favorable.
| † | Index 1 is the Russell 1000 Growth Index; Index 2 is the S&P 500 Index. |
See the following page for footnotes.
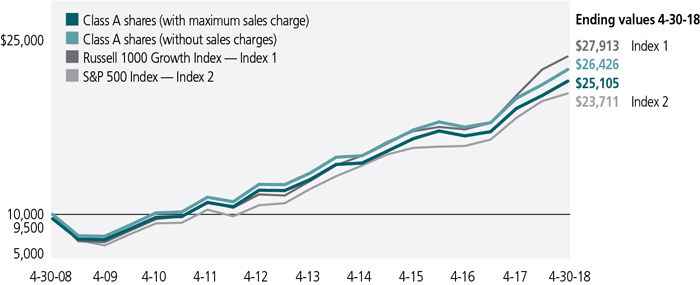
This chart and table show what happened to a hypothetical $10,000 investment in John Hancock U.S. Global Leaders Growth Fund for the share classes and periods indicated, assuming all distributions were reinvested. For comparison, we've shown the same investment in two separate indexes.
| Start date | With maximum sales charge ($) | Without sales charge ($) | Index 1 ($) | Index 2 ($) | |
| Class B3 | 4-30-08 | 24,878 | 24,878 | 27,913 | 23,711 |
| Class C3 | 4-30-08 | 24,511 | 24,511 | 27,913 | 23,711 |
| Class I1 | 4-30-08 | 27,349 | 27,349 | 27,913 | 23,711 |
| Class R21,2 | 4-30-08 | 26,287 | 26,287 | 27,913 | 23,711 |
| Class R61,2 | 4-30-08 | 27,114 | 27,114 | 27,913 | 23,711 |
The Russell 1000 Growth Index is an unmanaged index of companies in the Russell 1000 Index (the 1,000 largest U.S. publicly traded companies) with high price-to-book ratios and higher forecasted growth values.
The S&P 500 Index is an unmanaged index that includes 500 widely traded common stocks.
It is not possible to invest directly in an index. Index figures do not reflect expenses or sales charges, which would result in lower returns.
Footnotes related to performance pages
| 1 | For certain types of investors, as described in the fund's prospectus. |
| 2 | Class R2 and Class R6 shares were first offered on 3-1-12 and 9-1-11, respectively. Returns prior to these dates are those of Class A shares (first offered on 10-3-95) that have not been adjusted for class-specific expenses; otherwise, returns would vary. |
| 3 | The contingent deferred sales charge is not applicable. |
These examples are intended to help you understand your ongoing operating expenses of investing in the fund so you can compare these costs with the ongoing costs of investing in other mutual funds.
Understanding fund expenses
As a shareholder of the fund, you incur two types of costs:
| • | Transaction costs, which include sales charges (loads) on purchases or redemptions (varies by share class), minimum account fee charge, etc. |
| • | Ongoing operating expenses, including management fees, distribution and service fees (if applicable), and other fund expenses. |
We are presenting only your ongoing operating expenses here.
Actual expenses/actual returns
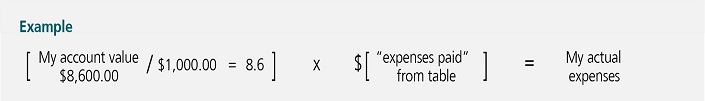
The first line of each share class in the table on the following page is intended to provide information about the fund's actual ongoing operating expenses, and is based on the fund's actual return. It assumes an account value of $1,000.00 on November 1, 2017, with the same investment held until April 30, 2018.
Together with the value of your account, you may use this information to estimate the operating expenses that you paid over the period. Simply divide your account value at April 30, 2018, by $1,000.00, then multiply it by the "expenses paid" for your share class from the table. For example, for an account value of $8,600.00, the operating expenses should be calculated as follows:
Hypothetical example for comparison purposes
The second line of each share class in the table on the following page allows you to compare the fund's ongoing operating expenses with those of any other fund. It provides an example of the fund's hypothetical account values and hypothetical expenses based on each class's actual expense ratio and an assumed 5% annualized return before expenses (which is not the fund's actual return). It assumes an account value of $1,000.00 on November 1, 2017, with the same investment held until April 30, 2018. Look in any other fund shareholder report to find its hypothetical example and you will be able to compare these expenses. Please remember that these hypothetical account values and expenses may not be used to estimate the actual ending account balance or expenses you paid for the period.
Remember, these examples do not include any transaction costs, therefore, these examples will not help you to determine the relative total costs of owning different funds. If transaction costs were included, your expenses would have been higher. See the prospectus for details regarding transaction costs.
SHAREHOLDER EXPENSE EXAMPLE CHART
| Account value on 11-1-2017 | Ending value on 4-30-2018 | Expenses paid during period ended 4-30-20181 | Annualized expense ratio | ||
| Class A | Actual expenses/actual returns | $1,000.00 | $1,069.90 | $5.90 | 1.15% |
| Hypothetical example for comparison purposes | 1,000.00 | 1,019.10 | 5.76 | 1.15% | |
| Class B | Actual expenses/actual returns | 1,000.00 | 1,066.00 | 9.73 | 1.90% |
| Hypothetical example for comparison purposes | 1,000.00 | 1,015.40 | 9.49 | 1.90% | |
| Class C | Actual expenses/actual returns | 1,000.00 | 1,065.90 | 9.73 | 1.90% |
| Hypothetical example for comparison purposes | 1,000.00 | 1,015.40 | 9.49 | 1.90% | |
| Class I | Actual expenses/actual returns | 1,000.00 | 1,071.20 | 4.62 | 0.90% |
| Hypothetical example for comparison purposes | 1,000.00 | 1,020.30 | 4.51 | 0.90% | |
| Class R2 | Actual expenses/actual returns | 1,000.00 | 1,069.20 | 6.62 | 1.29% |
| Hypothetical example for comparison purposes | 1,000.00 | 1,018.40 | 6.46 | 1.29% | |
| Class R6 | Actual expenses/actual returns | 1,000.00 | 1,071.70 | 4.11 | 0.80% |
| Hypothetical example for comparison purposes | 1,000.00 | 1,020.80 | 4.01 | 0.80% | |
| 1 | Expenses are equal to the annualized expense ratio, multiplied by the average account value over the period, multiplied by 181/365 (to reflect the one-half year period). |
| Fund’s investments |
| Shares | Value | ||||
| Common stocks 98.0% | $1,408,882,894 | ||||
| (Cost $943,149,768) | |||||
| Consumer discretionary 31.0% | 445,216,493 | ||||
| Hotels, restaurants and leisure 6.9% | |||||
| Starbucks Corp. | 732,283 | 42,157,532 | |||
| Yum! Brands, Inc. | 662,670 | 57,718,557 | |||
| Internet and direct marketing retail 7.5% | |||||
| Amazon.com, Inc. (A) | 38,916 | 60,947,515 | |||
| Booking Holdings, Inc. (A) | 21,375 | 46,554,750 | |||
| Media 3.6% | |||||
| The Walt Disney Company | 510,057 | 51,174,019 | |||
| Specialty retail 9.2% | |||||
| Lowe's Companies, Inc. | 467,813 | 38,561,826 | |||
| The TJX Companies, Inc. | 508,208 | 43,121,449 | |||
| Ulta Beauty, Inc. (A) | 203,509 | 51,062,443 | |||
| Textiles, apparel and luxury goods 3.8% | |||||
| NIKE, Inc., Class B | 788,396 | 53,918,402 | |||
| Consumer staples 2.9% | 41,183,846 | ||||
| Food products 2.9% | |||||
| Mondelez International, Inc., Class A | 1,042,629 | 41,183,846 | |||
| Energy 3.9% | 56,223,382 | ||||
| Energy equipment and services 3.9% | |||||
| Schlumberger, Ltd. | 820,061 | 56,223,382 | |||
| Health care 13.9% | 199,274,731 | ||||
| Biotechnology 3.3% | |||||
| Regeneron Pharmaceuticals, Inc. (A) | 155,578 | 47,245,927 | |||
| Health care equipment and supplies 3.3% | |||||
| Becton, Dickinson and Company | 202,633 | 46,984,514 | |||
| Health care providers and services 4.0% | |||||
| UnitedHealth Group, Inc. | 242,396 | 57,302,414 | |||
| Pharmaceuticals 3.3% | |||||
| Novo Nordisk A/S, ADR (B) | 1,017,083 | 47,741,876 | |||
| Industrials 2.8% | 39,702,613 | ||||
| Road and rail 2.8% | |||||
| J.B. Hunt Transport Services, Inc. | 338,096 | 39,702,613 | |||
| Information technology 34.1% | 490,972,598 | ||||
| Internet software and services 6.0% | |||||
| Alphabet, Inc., Class C (A) | 55,723 | 56,688,680 | |||
| Facebook, Inc., Class A (A) | 177,626 | 30,551,672 | |||
| 12 | JOHN HANCOCK U.S. GLOBAL LEADERS GROWTH FUND | SEMIANNUAL REPORT | SEE NOTES TO FINANCIAL STATEMENTS |
| Shares | Value | ||||
| Information technology (continued) | |||||
| IT services 14.2% | |||||
| Alliance Data Systems Corp. | 213,641 | $43,379,805 | |||
| Automatic Data Processing, Inc. | 366,030 | 43,220,822 | |||
| FleetCor Technologies, Inc. (A) | 278,561 | 57,740,124 | |||
| Visa, Inc., Class A | 470,029 | 59,637,280 | |||
| Software 13.9% | |||||
| Autodesk, Inc. (A) | 439,249 | 55,301,449 | |||
| Red Hat, Inc. (A) | 299,319 | 48,806,956 | |||
| salesforce.com, Inc. (A) | 432,386 | 52,314,383 | |||
| SAP SE, ADR (B) | 390,972 | 43,331,427 | |||
| Materials 5.9% | 85,633,071 | ||||
| Chemicals 5.9% | |||||
| Ecolab, Inc. | 390,398 | 56,517,918 | |||
| Praxair, Inc. | 190,894 | 29,115,153 | |||
| Real estate 3.5% | 50,676,160 | ||||
| Equity real estate investment trusts 3.5% | |||||
| Equinix, Inc. | 120,431 | 50,676,160 | |||
| Yield (%) | Shares | Value | |||
| Securities lending collateral 0.0% | $463,387 | ||||
| (Cost $463,378) | |||||
| John Hancock Collateral Trust (C) | 1.8834(D) | 46,323 | 463,387 | ||
| Short-term investments 2.4% | $34,244,406 | ||||
| (Cost $34,244,406) | |||||
| Money market funds 2.4% | 34,244,406 | ||||
| State Street Institutional U.S. Government Money Market Fund, Premier Class | 1.6333(D) | 34,244,406 | 34,244,406 | ||
| Total investments (Cost $977,857,552) 100.4% | $1,443,590,687 | ||||
| Other assets and liabilities, net (0.4%) | (6,242,592) | ||||
| Total net assets 100.0% | $1,437,348,095 | ||||
| The percentage shown for each investment category is the total value of the category as a percentage of the net assets of the fund. | |
| Security Abbreviations and Legend | |
| ADR | American Depositary Receipt |
| (A) | Non-income producing security. |
| (B) | A portion of this security is on loan as of 4-30-18. |
| (C) | Investment is an affiliate of the fund, the advisor and/or subadvisor. This security represents the investment of cash collateral received for securities lending. |
| (D) | The rate shown is the annualized seven-day yield as of 4-30-18. |
| SEE NOTES TO FINANCIAL STATEMENTS | SEMIANNUAL REPORT | JOHN HANCOCK U.S. GLOBAL LEADERS GROWTH FUND | 13 |
Financial statements
STATEMENT OF ASSETS AND LIABILITIES 4-30-18 (unaudited)
| Assets | ||||||||||||||||||||||||||||||
| Unaffiliated investments, at value (Cost $977,394,174) including $454,176 of securities loaned | $1,443,127,300 | |||||||||||||||||||||||||||||
| Affiliated investments, at value (Cost $463,378) | 463,387 | |||||||||||||||||||||||||||||
| Total investments, at value (Cost $977,857,552) | 1,443,590,687 | |||||||||||||||||||||||||||||
| Receivable for investments sold | 2,310,053 | |||||||||||||||||||||||||||||
| Receivable for fund shares sold | 2,730,870 | |||||||||||||||||||||||||||||
| Dividends and interest receivable | 557,859 | |||||||||||||||||||||||||||||
| Receivable for securities lending income | 1,573 | |||||||||||||||||||||||||||||
| Other receivables and prepaid expenses | 145,143 | |||||||||||||||||||||||||||||
| Total assets | 1,449,336,185 | |||||||||||||||||||||||||||||
| Liabilities | ||||||||||||||||||||||||||||||
| Payable for investments purchased | 7,791,394 | |||||||||||||||||||||||||||||
| Payable for fund shares repurchased | 2,132,929 | |||||||||||||||||||||||||||||
| Payable upon return of securities loaned | 485,068 | |||||||||||||||||||||||||||||
| Distributions payable | 561 | |||||||||||||||||||||||||||||
| Payable to affiliates | ||||||||||||||||||||||||||||||
| Accounting and legal services fees | 163,214 | |||||||||||||||||||||||||||||
| Transfer agent fees | 128,841 | |||||||||||||||||||||||||||||
| Distribution and service fees | 212,219 | |||||||||||||||||||||||||||||
| Trustees' fees | 2,265 | |||||||||||||||||||||||||||||
| Investment management fees | 882,773 | |||||||||||||||||||||||||||||
| Other liabilities and accrued expenses | 188,826 | |||||||||||||||||||||||||||||
| Total liabilities | 11,988,090 | |||||||||||||||||||||||||||||
| Net assets | $1,437,348,095 | |||||||||||||||||||||||||||||
| Net assets consist of | ||||||||||||||||||||||||||||||
| Paid-in capital | $898,002,752 | |||||||||||||||||||||||||||||
| Accumulated net investment loss | (1,258,889 | ) | ||||||||||||||||||||||||||||
| Accumulated net realized gain (loss) on investments | 74,871,097 | |||||||||||||||||||||||||||||
| Net unrealized appreciation (depreciation) on investments | 465,733,135 | |||||||||||||||||||||||||||||
| Net assets | $1,437,348,095 | |||||||||||||||||||||||||||||
STATEMENT OF ASSETS AND LIABILITIES (continued)
| Net asset value per share | ||||||||||||||||||
| Based on net asset values and shares outstanding-the fund has an unlimited number of shares authorized with no par value | ||||||||||||||||||
| Class A ($579,414,000 ÷ 12,326,129 shares)1 | $47.01 | |||||||||||||||||
| Class B ($14,122,036 ÷ 354,674 shares)1 | $39.82 | |||||||||||||||||
| Class C ($100,406,626 ÷ 2,520,438 shares)1 | $39.84 | |||||||||||||||||
| Class I ($605,481,252 ÷ 12,016,552 shares) | $50.39 | |||||||||||||||||
| Class R2 ($3,306,480 ÷ 66,840 shares) | $49.47 | |||||||||||||||||
| Class R6 ($134,617,701 ÷ 2,658,076 shares) | $50.64 | |||||||||||||||||
| Maximum offering price per share | ||||||||||||||||||
| Class A (net asset value per share ÷ 95%)2 | $49.48 | |||||||||||||||||
| 1 | Redemption price per share is equal to net asset value less any applicable contingent deferred sales charge. | ||||||||||||||||
| 2 | On single retail sales of less than $50,000. On sales of $50,000 or more and on group sales the offering price is reduced. | ||||||||||||||||
STATEMENT OF OPERATIONS For the six months ended 4-30-18 (unaudited)
| Investment income | ||||||||||||||||||||||||
| Dividends | $6,478,296 | |||||||||||||||||||||||
| Interest | 199,218 | |||||||||||||||||||||||
| Securities lending | 117,664 | |||||||||||||||||||||||
| Less foreign taxes withheld | (144,806 | ) | ||||||||||||||||||||||
| Total investment income | 6,650,372 | |||||||||||||||||||||||
| Expenses | ||||||||||||||||||||||||
| Investment management fees | 5,413,658 | |||||||||||||||||||||||
| Distribution and service fees | 1,318,736 | |||||||||||||||||||||||
| Accounting and legal services fees | 164,071 | |||||||||||||||||||||||
| Transfer agent fees | 750,106 | |||||||||||||||||||||||
| Trustees' fees | 12,046 | |||||||||||||||||||||||
| State registration fees | 97,578 | |||||||||||||||||||||||
| Printing and postage | 82,184 | |||||||||||||||||||||||
| Professional fees | 31,644 | |||||||||||||||||||||||
| Custodian fees | 85,315 | |||||||||||||||||||||||
| Other | 17,293 | |||||||||||||||||||||||
| Total expenses | 7,972,631 | |||||||||||||||||||||||
| Less expense reductions | (63,370 | ) | ||||||||||||||||||||||
| Net expenses | 7,909,261 | |||||||||||||||||||||||
| Net investment loss | (1,258,889 | ) | ||||||||||||||||||||||
| Realized and unrealized gain (loss) | ||||||||||||||||||||||||
| Net realized gain (loss) on | ||||||||||||||||||||||||
| Unaffiliated investments | 79,328,480 | |||||||||||||||||||||||
| Affiliated investments | (6,744 | ) | ||||||||||||||||||||||
| Capital gain distributions received from unaffiliated investments | 41 | |||||||||||||||||||||||
| 79,321,777 | ||||||||||||||||||||||||
| Change in net unrealized appreciation (depreciation) of | ||||||||||||||||||||||||
| Unaffiliated investments | 23,589,477 | |||||||||||||||||||||||
| Affiliated investments | (829 | ) | ||||||||||||||||||||||
| 23,588,648 | ||||||||||||||||||||||||
| Net realized and unrealized gain | 102,910,425 | |||||||||||||||||||||||
| Increase in net assets from operations | $101,651,536 | |||||||||||||||||||||||
STATEMENTS OF CHANGES IN NET ASSETS
| Six months ended 4-30-18 | Year ended 10-31-17 | ||||||||||||||||||||||||||||||||||||||||||||
| (unaudited) | |||||||||||||||||||||||||||||||||||||||||||||
| Increase (decrease) in net assets | |||||||||||||||||||||||||||||||||||||||||||||
| From operations | |||||||||||||||||||||||||||||||||||||||||||||
| Net investment loss | ($1,258,889 | ) | ($1,047,544 | ) | |||||||||||||||||||||||||||||||||||||||||
| Net realized gain | 79,321,777 | 100,999,283 | |||||||||||||||||||||||||||||||||||||||||||
| Change in net unrealized appreciation (depreciation) | 23,588,648 | 142,938,280 | |||||||||||||||||||||||||||||||||||||||||||
| Increase in net assets resulting from operations | 101,651,536 | 242,890,019 | |||||||||||||||||||||||||||||||||||||||||||
| Distributions to shareholders | |||||||||||||||||||||||||||||||||||||||||||||
| From net realized gain | |||||||||||||||||||||||||||||||||||||||||||||
| Class A | (40,115,885 | ) | (30,348,038 | ) | |||||||||||||||||||||||||||||||||||||||||
| Class B | (1,232,810 | ) | (1,064,374 | ) | |||||||||||||||||||||||||||||||||||||||||
| Class C | (8,254,625 | ) | (6,633,373 | ) | |||||||||||||||||||||||||||||||||||||||||
| Class I | (42,870,457 | ) | (15,554,816 | ) | |||||||||||||||||||||||||||||||||||||||||
| Class R2 | (354,873 | ) | (299,904 | ) | |||||||||||||||||||||||||||||||||||||||||
| Class R6 | (7,877,251 | ) | (253,662 | ) | |||||||||||||||||||||||||||||||||||||||||
| Total distributions | (100,705,901 | ) | (54,154,167 | ) | |||||||||||||||||||||||||||||||||||||||||
| From fund share transactions | (21,265,167 | ) | 200,952,038 | ||||||||||||||||||||||||||||||||||||||||||
| Total increase (decrease) | (20,319,532 | ) | 389,687,890 | ||||||||||||||||||||||||||||||||||||||||||
| Net assets | |||||||||||||||||||||||||||||||||||||||||||||
| Beginning of period | 1,457,667,627 | 1,067,979,737 | |||||||||||||||||||||||||||||||||||||||||||
| End of period | $1,437,348,095 | $1,457,667,627 | |||||||||||||||||||||||||||||||||||||||||||
| Accumulated net investment loss | ($1,258,889 | ) | — | ||||||||||||||||||||||||||||||||||||||||||
Financial highlights
| Class A Shares Period ended | 4-30-18 | 1 | 10-31-17 | 10-31-16 | 10-31-15 | 10-31-14 | 10-31-13 | |||||||||||||||||||||||||||||||||||||||||||||||||||||||||||||||||||||||||||||||||||||||||||||||||||||||||||||||
| Per share operating performance | ||||||||||||||||||||||||||||||||||||||||||||||||||||||||||||||||||||||||||||||||||||||||||||||||||||||||||||||||||||||
| Net asset value, beginning of period | $47.15 | $41.00 | $43.87 | $45.02 | $42.25 | $35.04 | ||||||||||||||||||||||||||||||||||||||||||||||||||||||||||||||||||||||||||||||||||||||||||||||||||||||||||||||||
| Net investment income (loss)2 | (0.06 | ) | (0.05 | ) | (0.03 | ) | 0.07 | 0.11 | 0.04 | |||||||||||||||||||||||||||||||||||||||||||||||||||||||||||||||||||||||||||||||||||||||||||||||||||||||||||||
| Net realized and unrealized gain (loss) on investments | 3.25 | 8.31 | (0.13 | ) | 4.98 | 3.90 | 7.96 | |||||||||||||||||||||||||||||||||||||||||||||||||||||||||||||||||||||||||||||||||||||||||||||||||||||||||||||||
| Total from investment operations | 3.19 | 8.26 | (0.16 | ) | 5.05 | 4.01 | 8.00 | |||||||||||||||||||||||||||||||||||||||||||||||||||||||||||||||||||||||||||||||||||||||||||||||||||||||||||||||
| Less distributions | ||||||||||||||||||||||||||||||||||||||||||||||||||||||||||||||||||||||||||||||||||||||||||||||||||||||||||||||||||||||
| From net investment income | — | — | (0.04 | ) | (0.10 | ) | (0.03 | ) | — | |||||||||||||||||||||||||||||||||||||||||||||||||||||||||||||||||||||||||||||||||||||||||||||||||||||||||||||
| From net realized gain | (3.33 | ) | (2.11 | ) | (2.67 | ) | (6.10 | ) | (1.21 | ) | (0.79 | ) | ||||||||||||||||||||||||||||||||||||||||||||||||||||||||||||||||||||||||||||||||||||||||||||||||||||||||||
| Total distributions | (3.33 | ) | (2.11 | ) | (2.71 | ) | (6.20 | ) | (1.24 | ) | (0.79 | ) | ||||||||||||||||||||||||||||||||||||||||||||||||||||||||||||||||||||||||||||||||||||||||||||||||||||||||||
| Net asset value, end of period | $47.01 | $47.15 | $41.00 | $43.87 | $45.02 | $42.25 | ||||||||||||||||||||||||||||||||||||||||||||||||||||||||||||||||||||||||||||||||||||||||||||||||||||||||||||||||
| Total return (%)3,4 | 6.99 | 5 | 21.12 | (0.42 | ) | 13.19 | 9.74 | 23.30 | ||||||||||||||||||||||||||||||||||||||||||||||||||||||||||||||||||||||||||||||||||||||||||||||||||||||||||||||
| Ratios and supplemental data | ||||||||||||||||||||||||||||||||||||||||||||||||||||||||||||||||||||||||||||||||||||||||||||||||||||||||||||||||||||||
| Net assets, end of period (in millions) | $579 | $577 | $608 | $660 | $600 | $697 | ||||||||||||||||||||||||||||||||||||||||||||||||||||||||||||||||||||||||||||||||||||||||||||||||||||||||||||||||
| Ratios (as a percentage of average net assets): | ||||||||||||||||||||||||||||||||||||||||||||||||||||||||||||||||||||||||||||||||||||||||||||||||||||||||||||||||||||||
| Expenses before reductions | 1.16 | 6 | 1.17 | 1.18 | 1.18 | 1.19 | 1.23 | |||||||||||||||||||||||||||||||||||||||||||||||||||||||||||||||||||||||||||||||||||||||||||||||||||||||||||||||
| Expenses including reductions | 1.15 | 6 | 1.16 | 1.17 | 1.17 | 1.18 | 1.23 | |||||||||||||||||||||||||||||||||||||||||||||||||||||||||||||||||||||||||||||||||||||||||||||||||||||||||||||||
| Net investment income (loss) | (0.25 | ) 6 | (0.12 | ) | (0.07 | ) | 0.16 | 0.27 | 0.10 | |||||||||||||||||||||||||||||||||||||||||||||||||||||||||||||||||||||||||||||||||||||||||||||||||||||||||||||
| Portfolio turnover (%) | 19 | 41 | 44 | 30 | 43 | 30 | ||||||||||||||||||||||||||||||||||||||||||||||||||||||||||||||||||||||||||||||||||||||||||||||||||||||||||||||||
| 1 | Six months ended 4-30-18. Unaudited. | ||||||||||||||||||||||||||||||||||||||||||||||||||||||||||||||||||||||||||||||||||
| 2 | Based on average daily shares outstanding. | ||||||||||||||||||||||||||||||||||||||||||||||||||||||||||||||||||||||||||||||||||
| 3 | Does not reflect the effect of sales charges, if any. | ||||||||||||||||||||||||||||||||||||||||||||||||||||||||||||||||||||||||||||||||||
| 4 | Total returns would have been lower had certain expenses not been reduced during the applicable periods. | ||||||||||||||||||||||||||||||||||||||||||||||||||||||||||||||||||||||||||||||||||
| 5 | Not annualized. | ||||||||||||||||||||||||||||||||||||||||||||||||||||||||||||||||||||||||||||||||||
| 6 | Annualized. | ||||||||||||||||||||||||||||||||||||||||||||||||||||||||||||||||||||||||||||||||||
| Class B Shares Period ended | 4-30-18 | 1 | 10-31-17 | 10-31-16 | 10-31-15 | 10-31-14 | 10-31-13 | |||||||||||||||||||||||||||||||||||||||||||||||||||||||||||||||||||||||||||||||||||||||||||||||||||||||||||||||
| Per share operating performance | ||||||||||||||||||||||||||||||||||||||||||||||||||||||||||||||||||||||||||||||||||||||||||||||||||||||||||||||||||||||
| Net asset value, beginning of period | $40.57 | $35.82 | $38.90 | $40.80 | $38.65 | $32.36 | ||||||||||||||||||||||||||||||||||||||||||||||||||||||||||||||||||||||||||||||||||||||||||||||||||||||||||||||||
| Net investment loss2 | (0.20 | ) | (0.32 | ) | (0.29 | ) | (0.22 | ) | (0.19 | ) | (0.22 | ) | ||||||||||||||||||||||||||||||||||||||||||||||||||||||||||||||||||||||||||||||||||||||||||||||||||||||||||
| Net realized and unrealized gain (loss) on investments | 2.78 | 7.18 | (0.12 | ) | 4.42 | 3.55 | 7.30 | |||||||||||||||||||||||||||||||||||||||||||||||||||||||||||||||||||||||||||||||||||||||||||||||||||||||||||||||
| Total from investment operations | 2.58 | 6.86 | (0.41 | ) | 4.20 | 3.36 | 7.08 | |||||||||||||||||||||||||||||||||||||||||||||||||||||||||||||||||||||||||||||||||||||||||||||||||||||||||||||||
| Less distributions | ||||||||||||||||||||||||||||||||||||||||||||||||||||||||||||||||||||||||||||||||||||||||||||||||||||||||||||||||||||||
| From net investment income | — | — | — | — | — | — | ||||||||||||||||||||||||||||||||||||||||||||||||||||||||||||||||||||||||||||||||||||||||||||||||||||||||||||||||
| From net realized gain | (3.33 | ) | (2.11 | ) | (2.67 | ) | (6.10 | ) | (1.21 | ) | (0.79 | ) | ||||||||||||||||||||||||||||||||||||||||||||||||||||||||||||||||||||||||||||||||||||||||||||||||||||||||||
| Total distributions | (3.33 | ) | (2.11 | ) | (2.67 | ) | (6.10 | ) | (1.21 | ) | (0.79 | ) | ||||||||||||||||||||||||||||||||||||||||||||||||||||||||||||||||||||||||||||||||||||||||||||||||||||||||||
| Net asset value, end of period | $39.82 | $40.57 | $35.82 | $38.90 | $40.80 | $38.65 | ||||||||||||||||||||||||||||||||||||||||||||||||||||||||||||||||||||||||||||||||||||||||||||||||||||||||||||||||
| Total return (%)3,4 | 6.60 | 5 | 20.22 | (1.16 | ) | 12.33 | 8.93 | 22.37 | ||||||||||||||||||||||||||||||||||||||||||||||||||||||||||||||||||||||||||||||||||||||||||||||||||||||||||||||
| Ratios and supplemental data | ||||||||||||||||||||||||||||||||||||||||||||||||||||||||||||||||||||||||||||||||||||||||||||||||||||||||||||||||||||||
| Net assets, end of period (in millions) | $14 | $16 | $19 | $24 | $27 | $33 | ||||||||||||||||||||||||||||||||||||||||||||||||||||||||||||||||||||||||||||||||||||||||||||||||||||||||||||||||
| Ratios (as a percentage of average net assets): | ||||||||||||||||||||||||||||||||||||||||||||||||||||||||||||||||||||||||||||||||||||||||||||||||||||||||||||||||||||||
| Expenses before reductions | 1.91 | 6 | 1.92 | 1.93 | 1.93 | 1.94 | 1.99 | |||||||||||||||||||||||||||||||||||||||||||||||||||||||||||||||||||||||||||||||||||||||||||||||||||||||||||||||
| Expenses including reductions | 1.90 | 6 | 1.91 | 1.92 | 1.92 | 1.93 | 1.98 | |||||||||||||||||||||||||||||||||||||||||||||||||||||||||||||||||||||||||||||||||||||||||||||||||||||||||||||||
| Net investment loss | (1.00 | ) 6 | (0.86 | ) | (0.82 | ) | (0.60 | ) | (0.48 | ) | (0.64 | ) | ||||||||||||||||||||||||||||||||||||||||||||||||||||||||||||||||||||||||||||||||||||||||||||||||||||||||||
| Portfolio turnover (%) | 19 | 41 | 44 | 30 | 43 | 30 | ||||||||||||||||||||||||||||||||||||||||||||||||||||||||||||||||||||||||||||||||||||||||||||||||||||||||||||||||
| 1 | Six months ended 4-30-18. Unaudited. | ||||||||||||||||||||||||||||||||||||||||||||||||||||||||||||||||||||||||||||||||||
| 2 | Based on average daily shares outstanding. | ||||||||||||||||||||||||||||||||||||||||||||||||||||||||||||||||||||||||||||||||||
| 3 | Does not reflect the effect of sales charges, if any. | ||||||||||||||||||||||||||||||||||||||||||||||||||||||||||||||||||||||||||||||||||
| 4 | Total returns would have been lower had certain expenses not been reduced during the applicable periods. | ||||||||||||||||||||||||||||||||||||||||||||||||||||||||||||||||||||||||||||||||||
| 5 | Not annualized. | ||||||||||||||||||||||||||||||||||||||||||||||||||||||||||||||||||||||||||||||||||
| 6 | Annualized. | ||||||||||||||||||||||||||||||||||||||||||||||||||||||||||||||||||||||||||||||||||
| Class C Shares Period ended | 4-30-18 | 1 | 10-31-17 | 10-31-16 | 10-31-15 | 10-31-14 | 10-31-13 | |||||||||||||||||||||||||||||||||||||||||||||||||||||||||||||||||||||||||||||||||||||||||||||||||||||||||||||||
| Per share operating performance | ||||||||||||||||||||||||||||||||||||||||||||||||||||||||||||||||||||||||||||||||||||||||||||||||||||||||||||||||||||||
| Net asset value, beginning of period | $40.59 | $35.84 | $38.92 | $40.81 | $38.66 | $32.37 | ||||||||||||||||||||||||||||||||||||||||||||||||||||||||||||||||||||||||||||||||||||||||||||||||||||||||||||||||
| Net investment loss2 | (0.20 | ) | (0.32 | ) | (0.29 | ) | (0.22 | ) | (0.19 | ) | (0.22 | ) | ||||||||||||||||||||||||||||||||||||||||||||||||||||||||||||||||||||||||||||||||||||||||||||||||||||||||||
| Net realized and unrealized gain (loss) on investments | 2.78 | 7.18 | (0.12 | ) | 4.43 | 3.55 | 7.30 | |||||||||||||||||||||||||||||||||||||||||||||||||||||||||||||||||||||||||||||||||||||||||||||||||||||||||||||||
| Total from investment operations | 2.58 | 6.86 | (0.41 | ) | 4.21 | 3.36 | 7.08 | |||||||||||||||||||||||||||||||||||||||||||||||||||||||||||||||||||||||||||||||||||||||||||||||||||||||||||||||
| Less distributions | ||||||||||||||||||||||||||||||||||||||||||||||||||||||||||||||||||||||||||||||||||||||||||||||||||||||||||||||||||||||
| From net realized gain | (3.33 | ) | (2.11 | ) | (2.67 | ) | (6.10 | ) | (1.21 | ) | (0.79 | ) | ||||||||||||||||||||||||||||||||||||||||||||||||||||||||||||||||||||||||||||||||||||||||||||||||||||||||||
| Total distributions | (3.33 | ) | (2.11 | ) | (2.67 | ) | (6.10 | ) | (1.21 | ) | (0.79 | ) | ||||||||||||||||||||||||||||||||||||||||||||||||||||||||||||||||||||||||||||||||||||||||||||||||||||||||||
| Net asset value, end of period | $39.84 | $40.59 | $35.84 | $38.92 | $40.81 | $38.66 | ||||||||||||||||||||||||||||||||||||||||||||||||||||||||||||||||||||||||||||||||||||||||||||||||||||||||||||||||
| Total return (%)3,4 | 6.59 | 5 | 20.21 | (1.16 | ) | 12.36 | 8.92 | 22.36 | ||||||||||||||||||||||||||||||||||||||||||||||||||||||||||||||||||||||||||||||||||||||||||||||||||||||||||||||
| Ratios and supplemental data | ||||||||||||||||||||||||||||||||||||||||||||||||||||||||||||||||||||||||||||||||||||||||||||||||||||||||||||||||||||||
| Net assets, end of period (in millions) | $100 | $102 | $117 | $136 | $133 | $130 | ||||||||||||||||||||||||||||||||||||||||||||||||||||||||||||||||||||||||||||||||||||||||||||||||||||||||||||||||
| Ratios (as a percentage of average net assets): | ||||||||||||||||||||||||||||||||||||||||||||||||||||||||||||||||||||||||||||||||||||||||||||||||||||||||||||||||||||||
| Expenses before reductions | 1.91 | 6 | 1.92 | 1.93 | 1.93 | 1.94 | 1.98 | |||||||||||||||||||||||||||||||||||||||||||||||||||||||||||||||||||||||||||||||||||||||||||||||||||||||||||||||
| Expenses including reductions | 1.90 | 6 | 1.91 | 1.92 | 1.92 | 1.93 | 1.98 | |||||||||||||||||||||||||||||||||||||||||||||||||||||||||||||||||||||||||||||||||||||||||||||||||||||||||||||||
| Net investment loss | (1.00 | ) 6 | (0.86 | ) | (0.82 | ) | (0.59 | ) | (0.48 | ) | (0.65 | ) | ||||||||||||||||||||||||||||||||||||||||||||||||||||||||||||||||||||||||||||||||||||||||||||||||||||||||||
| Portfolio turnover (%) | 19 | 41 | 44 | 30 | 43 | 30 | ||||||||||||||||||||||||||||||||||||||||||||||||||||||||||||||||||||||||||||||||||||||||||||||||||||||||||||||||
| 1 | Six months ended 4-30-18. Unaudited. | ||||||||||||||||||||||||||||||||||||||||||||||||||||||||||||||||||||||||||||||||||
| 2 | Based on average daily shares outstanding. | ||||||||||||||||||||||||||||||||||||||||||||||||||||||||||||||||||||||||||||||||||
| 3 | Does not reflect the effect of sales charges, if any. | ||||||||||||||||||||||||||||||||||||||||||||||||||||||||||||||||||||||||||||||||||
| 4 | Total returns would have been lower had certain expenses not been reduced during the applicable periods. | ||||||||||||||||||||||||||||||||||||||||||||||||||||||||||||||||||||||||||||||||||
| 5 | Not annualized. | ||||||||||||||||||||||||||||||||||||||||||||||||||||||||||||||||||||||||||||||||||
| 6 | Annualized. | ||||||||||||||||||||||||||||||||||||||||||||||||||||||||||||||||||||||||||||||||||
| Class I Shares Period ended | 4-30-18 | 1 | 10-31-17 | 10-31-16 | 10-31-15 | 10-31-14 | 10-31-13 | |||||||||||||||||||||||||||||||||||||||||||||||||||||||||||||||||||||||||||||||||||||||||||||||||||||||||||||||
| Per share operating performance | ||||||||||||||||||||||||||||||||||||||||||||||||||||||||||||||||||||||||||||||||||||||||||||||||||||||||||||||||||||||
| Net asset value, beginning of period | $50.25 | $43.45 | $46.27 | $47.12 | $44.12 | $36.44 | ||||||||||||||||||||||||||||||||||||||||||||||||||||||||||||||||||||||||||||||||||||||||||||||||||||||||||||||||
| Net investment income2 | — | 3 | 0.06 | 0.08 | 0.18 | 0.24 | 0.16 | |||||||||||||||||||||||||||||||||||||||||||||||||||||||||||||||||||||||||||||||||||||||||||||||||||||||||||||||
| Net realized and unrealized gain (loss) on investments | 3.47 | 8.85 | (0.13 | ) | 5.25 | 4.07 | 8.31 | |||||||||||||||||||||||||||||||||||||||||||||||||||||||||||||||||||||||||||||||||||||||||||||||||||||||||||||||
| Total from investment operations | 3.47 | 8.91 | (0.05 | ) | 5.43 | 4.31 | 8.47 | |||||||||||||||||||||||||||||||||||||||||||||||||||||||||||||||||||||||||||||||||||||||||||||||||||||||||||||||
| Less distributions | ||||||||||||||||||||||||||||||||||||||||||||||||||||||||||||||||||||||||||||||||||||||||||||||||||||||||||||||||||||||
| From net investment income | — | — | (0.10 | ) | (0.18 | ) | (0.10 | ) | — | |||||||||||||||||||||||||||||||||||||||||||||||||||||||||||||||||||||||||||||||||||||||||||||||||||||||||||||
| From net realized gain | (3.33 | ) | (2.11 | ) | (2.67 | ) | (6.10 | ) | (1.21 | ) | (0.79 | ) | ||||||||||||||||||||||||||||||||||||||||||||||||||||||||||||||||||||||||||||||||||||||||||||||||||||||||||
| Total distributions | (3.33 | ) | (2.11 | ) | (2.77 | ) | (6.28 | ) | (1.31 | ) | (0.79 | ) | ||||||||||||||||||||||||||||||||||||||||||||||||||||||||||||||||||||||||||||||||||||||||||||||||||||||||||
| Net asset value, end of period | $50.39 | $50.25 | $43.45 | $46.27 | $47.12 | $44.12 | ||||||||||||||||||||||||||||||||||||||||||||||||||||||||||||||||||||||||||||||||||||||||||||||||||||||||||||||||
| Total return (%)4 | 7.12 | 5 | 21.44 | (0.14 | ) | 13.48 | 10.01 | 23.70 | ||||||||||||||||||||||||||||||||||||||||||||||||||||||||||||||||||||||||||||||||||||||||||||||||||||||||||||||
| Ratios and supplemental data | ||||||||||||||||||||||||||||||||||||||||||||||||||||||||||||||||||||||||||||||||||||||||||||||||||||||||||||||||||||||
| Net assets, end of period (in millions) | $605 | $751 | $313 | $293 | $317 | $307 | ||||||||||||||||||||||||||||||||||||||||||||||||||||||||||||||||||||||||||||||||||||||||||||||||||||||||||||||||
| Ratios (as a percentage of average net assets): | ||||||||||||||||||||||||||||||||||||||||||||||||||||||||||||||||||||||||||||||||||||||||||||||||||||||||||||||||||||||
| Expenses before reductions | 0.91 | 6 | 0.91 | 0.92 | 0.91 | 0.93 | 0.93 | |||||||||||||||||||||||||||||||||||||||||||||||||||||||||||||||||||||||||||||||||||||||||||||||||||||||||||||||
| Expenses including reductions | 0.90 | 6 | 0.90 | 0.91 | 0.91 | 0.92 | 0.93 | |||||||||||||||||||||||||||||||||||||||||||||||||||||||||||||||||||||||||||||||||||||||||||||||||||||||||||||||
| Net investment income | — | 6,7 | 0.13 | 0.19 | 0.41 | 0.53 | 0.41 | |||||||||||||||||||||||||||||||||||||||||||||||||||||||||||||||||||||||||||||||||||||||||||||||||||||||||||||||
| Portfolio turnover (%) | 19 | 41 | 44 | 30 | 43 | 30 | ||||||||||||||||||||||||||||||||||||||||||||||||||||||||||||||||||||||||||||||||||||||||||||||||||||||||||||||||
| 1 | Six months ended 4-30-18. Unaudited. | ||||||||||||||||||||||||||||||||||||||||||||||||||||||||||||||||||||||||||||||||||
| 2 | Based on average daily shares outstanding. | ||||||||||||||||||||||||||||||||||||||||||||||||||||||||||||||||||||||||||||||||||
| 3 | Less than $0.005 per share. | ||||||||||||||||||||||||||||||||||||||||||||||||||||||||||||||||||||||||||||||||||
| 4 | Total returns would have been lower had certain expenses not been reduced during the applicable periods. | ||||||||||||||||||||||||||||||||||||||||||||||||||||||||||||||||||||||||||||||||||
| 5 | Not annualized. | ||||||||||||||||||||||||||||||||||||||||||||||||||||||||||||||||||||||||||||||||||
| 6 | Annualized. | ||||||||||||||||||||||||||||||||||||||||||||||||||||||||||||||||||||||||||||||||||
| 7 | Less than 0.005%. | ||||||||||||||||||||||||||||||||||||||||||||||||||||||||||||||||||||||||||||||||||
| Class R2 Shares Period ended | 4-30-18 | 1 | 10-31-17 | 10-31-16 | 10-31-15 | 10-31-14 | 10-31-13 | |||||||||||||||||||||||||||||||||||||||||||||||||||||||||||||||||||||||||||||||||||||||||||||||||||||||||||||||
| Per share operating performance | ||||||||||||||||||||||||||||||||||||||||||||||||||||||||||||||||||||||||||||||||||||||||||||||||||||||||||||||||||||||
| Net asset value, beginning of period | $49.48 | $42.99 | $45.89 | $46.82 | $43.93 | $36.40 | ||||||||||||||||||||||||||||||||||||||||||||||||||||||||||||||||||||||||||||||||||||||||||||||||||||||||||||||||
| Net investment income (loss)2 | (0.09 | ) | (0.12 | ) | (0.09 | ) | (0.05 | ) | 0.06 | (0.04 | ) | |||||||||||||||||||||||||||||||||||||||||||||||||||||||||||||||||||||||||||||||||||||||||||||||||||||||||||
| Net realized and unrealized gain (loss) on investments | 3.41 | 8.72 | (0.13 | ) | 5.27 | 4.06 | 8.36 | |||||||||||||||||||||||||||||||||||||||||||||||||||||||||||||||||||||||||||||||||||||||||||||||||||||||||||||||
| Total from investment operations | 3.32 | 8.60 | (0.22 | ) | 5.22 | 4.12 | 8.32 | |||||||||||||||||||||||||||||||||||||||||||||||||||||||||||||||||||||||||||||||||||||||||||||||||||||||||||||||
| Less distributions | ||||||||||||||||||||||||||||||||||||||||||||||||||||||||||||||||||||||||||||||||||||||||||||||||||||||||||||||||||||||
| From net investment income | — | — | (0.01 | ) | (0.05 | ) | (0.02 | ) | — | |||||||||||||||||||||||||||||||||||||||||||||||||||||||||||||||||||||||||||||||||||||||||||||||||||||||||||||
| From net realized gain | (3.33 | ) | (2.11 | ) | (2.67 | ) | (6.10 | ) | (1.21 | ) | (0.79 | ) | ||||||||||||||||||||||||||||||||||||||||||||||||||||||||||||||||||||||||||||||||||||||||||||||||||||||||||
| Total distributions | (3.33 | ) | (2.11 | ) | (2.68 | ) | (6.15 | ) | (1.23 | ) | (0.79 | ) | ||||||||||||||||||||||||||||||||||||||||||||||||||||||||||||||||||||||||||||||||||||||||||||||||||||||||||
| Net asset value, end of period | $49.47 | $49.48 | $42.99 | $45.89 | $46.82 | $43.93 | ||||||||||||||||||||||||||||||||||||||||||||||||||||||||||||||||||||||||||||||||||||||||||||||||||||||||||||||||
| Total return (%)3 | 6.92 | 4 | 20.93 | (0.54 | ) | 13.01 | 9.59 | 23.31 | ||||||||||||||||||||||||||||||||||||||||||||||||||||||||||||||||||||||||||||||||||||||||||||||||||||||||||||||
| Ratios and supplemental data | ||||||||||||||||||||||||||||||||||||||||||||||||||||||||||||||||||||||||||||||||||||||||||||||||||||||||||||||||||||||
| Net assets, end of period (in millions) | $3 | $5 | $6 | $8 | $34 | $32 | ||||||||||||||||||||||||||||||||||||||||||||||||||||||||||||||||||||||||||||||||||||||||||||||||||||||||||||||||
| Ratios (as a percentage of average net assets): | ||||||||||||||||||||||||||||||||||||||||||||||||||||||||||||||||||||||||||||||||||||||||||||||||||||||||||||||||||||||
| Expenses before reductions | 1.30 | 5 | 1.31 | 1.32 | 1.30 | 1.33 | 1.32 | |||||||||||||||||||||||||||||||||||||||||||||||||||||||||||||||||||||||||||||||||||||||||||||||||||||||||||||||
| Expenses including reductions | 1.29 | 5 | 1.30 | 1.32 | 1.29 | 1.32 | 1.31 | |||||||||||||||||||||||||||||||||||||||||||||||||||||||||||||||||||||||||||||||||||||||||||||||||||||||||||||||
| Net investment income (loss) | (0.37 | ) 5 | (0.26 | ) | (0.21 | ) | (0.11 | ) | 0.13 | (0.09 | ) | |||||||||||||||||||||||||||||||||||||||||||||||||||||||||||||||||||||||||||||||||||||||||||||||||||||||||||
| Portfolio turnover (%) | 19 | 41 | 44 | 30 | 43 | 30 | ||||||||||||||||||||||||||||||||||||||||||||||||||||||||||||||||||||||||||||||||||||||||||||||||||||||||||||||||
| 1 | Six months ended 4-30-18. Unaudited. | ||||||||||||||||||||||||||||||||||||||||||||||||||||||||||||||||||||||||||||||||||
| 2 | Based on average daily shares outstanding. | ||||||||||||||||||||||||||||||||||||||||||||||||||||||||||||||||||||||||||||||||||
| 3 | Total returns would have been lower had certain expenses not been reduced during the applicable periods. | ||||||||||||||||||||||||||||||||||||||||||||||||||||||||||||||||||||||||||||||||||
| 4 | Not annualized. | ||||||||||||||||||||||||||||||||||||||||||||||||||||||||||||||||||||||||||||||||||
| 5 | Annualized. | ||||||||||||||||||||||||||||||||||||||||||||||||||||||||||||||||||||||||||||||||||
| Class R6 Shares Period ended | 4-30-18 | 1 | 10-31-17 | 10-31-16 | 10-31-15 | 10-31-14 | 10-31-13 | |||||||||||||||||||||||||||||||||||||||||||||||||||||||||||||||||||||||||||||||||||||||||||||||||||||||||||||||
| Per share operating performance | ||||||||||||||||||||||||||||||||||||||||||||||||||||||||||||||||||||||||||||||||||||||||||||||||||||||||||||||||||||||
| Net asset value, beginning of period | $50.47 | $43.59 | $46.39 | $47.23 | $44.19 | $36.46 | ||||||||||||||||||||||||||||||||||||||||||||||||||||||||||||||||||||||||||||||||||||||||||||||||||||||||||||||||
| Net investment income2 | 0.02 | 0.11 | 0.13 | 0.24 | 0.28 | 0.18 | ||||||||||||||||||||||||||||||||||||||||||||||||||||||||||||||||||||||||||||||||||||||||||||||||||||||||||||||||
| Net realized and unrealized gain (loss) on investments | 3.48 | 8.88 | (0.13 | ) | 5.25 | 4.09 | 8.34 | |||||||||||||||||||||||||||||||||||||||||||||||||||||||||||||||||||||||||||||||||||||||||||||||||||||||||||||||
| Total from investment operations | 3.50 | 8.99 | — | 5.49 | 4.37 | 8.52 | ||||||||||||||||||||||||||||||||||||||||||||||||||||||||||||||||||||||||||||||||||||||||||||||||||||||||||||||||
| Less distributions | ||||||||||||||||||||||||||||||||||||||||||||||||||||||||||||||||||||||||||||||||||||||||||||||||||||||||||||||||||||||
| From net investment income | — | — | (0.13 | ) | (0.23 | ) | (0.12 | ) | — | |||||||||||||||||||||||||||||||||||||||||||||||||||||||||||||||||||||||||||||||||||||||||||||||||||||||||||||
| From net realized gain | (3.33 | ) | (2.11 | ) | (2.67 | ) | (6.10 | ) | (1.21 | ) | (0.79 | ) | ||||||||||||||||||||||||||||||||||||||||||||||||||||||||||||||||||||||||||||||||||||||||||||||||||||||||||
| Total distributions | (3.33 | ) | (2.11 | ) | (2.80 | ) | (6.33 | ) | (1.33 | ) | (0.79 | ) | ||||||||||||||||||||||||||||||||||||||||||||||||||||||||||||||||||||||||||||||||||||||||||||||||||||||||||
| Net asset value, end of period | $50.64 | $50.47 | $43.59 | $46.39 | $47.23 | $44.19 | ||||||||||||||||||||||||||||||||||||||||||||||||||||||||||||||||||||||||||||||||||||||||||||||||||||||||||||||||
| Total return (%)3 | 7.17 | 4 | 21.56 | (0.03 | ) | 13.61 | 10.15 | 23.83 | ||||||||||||||||||||||||||||||||||||||||||||||||||||||||||||||||||||||||||||||||||||||||||||||||||||||||||||||
| Ratios and supplemental data | ||||||||||||||||||||||||||||||||||||||||||||||||||||||||||||||||||||||||||||||||||||||||||||||||||||||||||||||||||||||
| Net assets, end of period (in millions) | $135 | $6 | $5 | $6 | $4 | $4 | ||||||||||||||||||||||||||||||||||||||||||||||||||||||||||||||||||||||||||||||||||||||||||||||||||||||||||||||||
| Ratios (as a percentage of average net assets): | ||||||||||||||||||||||||||||||||||||||||||||||||||||||||||||||||||||||||||||||||||||||||||||||||||||||||||||||||||||||
| Expenses before reductions | 0.81 | 5 | 0.82 | 0.82 | 0.82 | 0.83 | 0.84 | |||||||||||||||||||||||||||||||||||||||||||||||||||||||||||||||||||||||||||||||||||||||||||||||||||||||||||||||
| Expenses including reductions | 0.80 | 5 | 0.80 | 0.80 | 0.80 | 0.80 | 0.84 | |||||||||||||||||||||||||||||||||||||||||||||||||||||||||||||||||||||||||||||||||||||||||||||||||||||||||||||||
| Net investment income | 0.10 | 5 | 0.23 | 0.30 | 0.55 | 0.64 | 0.47 | |||||||||||||||||||||||||||||||||||||||||||||||||||||||||||||||||||||||||||||||||||||||||||||||||||||||||||||||
| Portfolio turnover (%) | 19 | 41 | 44 | 30 | 43 | 30 | ||||||||||||||||||||||||||||||||||||||||||||||||||||||||||||||||||||||||||||||||||||||||||||||||||||||||||||||||
| 1 | Six months ended 4-30-18. Unaudited. | ||||||||||||||||||||||||||||||||||||||||||||||||||||||||||||||||||||||||||||||||||
| 2 | Based on average daily shares outstanding. | ||||||||||||||||||||||||||||||||||||||||||||||||||||||||||||||||||||||||||||||||||
| 3 | Total returns would have been lower had certain expenses not been reduced during the applicable periods. | ||||||||||||||||||||||||||||||||||||||||||||||||||||||||||||||||||||||||||||||||||
| 4 | Not annualized. | ||||||||||||||||||||||||||||||||||||||||||||||||||||||||||||||||||||||||||||||||||
| 5 | Annualized. | ||||||||||||||||||||||||||||||||||||||||||||||||||||||||||||||||||||||||||||||||||
Note 1 — Organization
John Hancock U.S. Global Leaders Growth Fund (the fund) is a series of John Hancock Capital Series (the Trust), an open-end management investment company organized as a Massachusetts business trust and registered under the Investment Company Act of 1940, as amended (the 1940 Act). The investment objective of the fund is to seek long-term growth of capital.
The fund may offer multiple classes of shares. The shares currently offered by the fund are detailed in the Statements of assets and liabilities. Class A and Class C shares are offered to all investors. Class B shares are closed to new investors. Class I shares are offered to institutions and certain investors. Class R2 shares are available only to certain retirement and 529 plans. Class R6 shares are only available to certain retirement plans, institutions and other investors. Class B shares convert to Class A shares eight years after purchase. Shareholders of each class have exclusive voting rights to matters that affect that class. The distribution and service fees, if any, and transfer agent fees for each class may differ. Effective May 1, 2018, Class C shares convert to Class A shares ten years after purchase (certain exclusions may apply).
Note 2 — Significant accounting policies
The financial statements have been prepared in conformity with accounting principles generally accepted in the United States of America (US GAAP), which require management to make certain estimates and assumptions as of the date of the financial statements. Actual results could differ from those estimates and those differences could be significant. The fund qualifies as an investment company under Topic 946 of Accounting Standards Codification of US GAAP.
Events or transactions occurring after the end of the fiscal period through the date that the financial statements were issued have been evaluated in the preparation of the financial statements. The following summarizes the significant accounting policies of the fund:
Security valuation. Investments are stated at value as of the scheduled close of regular trading on the New York Stock Exchange (NYSE), normally at 4:00 p.m., Eastern Time. In case of emergency or other disruption resulting in the NYSE not opening for trading or the NYSE closing at a time other than the regularly scheduled close, the net asset value (NAV) may be determined as of the regularly scheduled close of the NYSE pursuant to the fund's Valuation Policies and Procedures.
In order to value the securities, the fund uses the following valuation techniques: Equity securities held by the fund are typically valued at the last sale price or official closing price on the exchange or principal market where the security trades. In the event there were no sales during the day or closing prices are not available, the securities are valued using the last available bid price. Investments by the fund in open-end mutual funds, including John Hancock Collateral Trust (JHCT), are valued at their respective NAVs each business day.
In certain instances, the Pricing Committee may determine to value equity securities using prices obtained from another exchange or market if trading on the exchange or market on which prices are typically obtained did not open for trading as scheduled, or if trading closed earlier than scheduled, and trading occurred as normal on another exchange or market. Other portfolio securities and assets, for which reliable market quotations are not readily available, are valued at fair value as determined in good faith by the fund's Pricing Committee following procedures established by the Board of Trustees. The frequency with which these fair valuation procedures are used cannot be predicted and fair value of securities may differ significantly from the value that would have been used had a ready market for such securities existed.
The fund uses a three-tier hierarchy to prioritize the pricing assumptions, referred to as inputs, used in valuation techniques to measure fair value. Level 1 includes securities valued using quoted prices in active markets for identical securities. Level 2 includes securities valued using other significant observable inputs. Observable inputs may include quoted prices for similar securities, interest rates, prepayment speeds and credit risk. Prices for securities valued using these inputs are received from independent pricing vendors and brokers and are based on an evaluation of the inputs described. Level 3 includes securities valued using significant unobservable inputs when market prices are not readily available or reliable, including the fund's own assumptions in determining the fair value of investments. Factors used in determining value may include market or issuer specific events or trends, changes in interest rates and credit quality. The inputs or methodology used for valuing securities are not necessarily an indication of the risks associated with investing in those securities. Changes in valuation techniques and related inputs may result in transfers into or out of an assigned level within the disclosure hierarchy.
As of April 30, 2018, all investments are categorized as Level 1 under the hierarchy described above.
Security transactions and related investment income. Investment security transactions are accounted for on a trade date plus one basis for daily NAV calculations. However, for financial reporting purposes, investment transactions are reported on trade date. Interest income is accrued as earned. Dividend income is recorded on the ex-date, except for dividends of foreign securities where the dividend may not be known until after the ex-date. In those cases, dividend income, net of withholding taxes, is recorded when the fund becomes aware of the dividends. Gains and losses on securities sold are determined on the basis of identified cost and may include proceeds from litigation.
Real estate investment trusts. The fund may invest in real estate investment trusts (REITs). Distributions from REITs may be recorded as income and subsequently characterized by the REIT at the end of the fiscal year as a reduction of cost of investments and/or as a realized gain. As a result, the fund will estimate the components of distributions from these securities. Such estimates are revised when the actual components of the distributions are known.
Securities lending. The fund may lend its securities to earn additional income. The fund receives cash collateral from the borrower in an amount not less than the market value of the loaned securities. The fund will invest its collateral in JHCT, an affiliate of the fund, which has a floating NAV and is registered with the Securities and Exchange Commission (SEC) as an investment company. JHCT invests in short-term money market investments. The fund will receive the benefit of any gains and bear any losses generated by JHCT with respect to the cash collateral.
The fund has the right to recall loaned securities on demand. If a borrower fails to return loaned securities when due, then the lending agent is responsible and indemnifies the fund for the lent securities. The lending agent uses the collateral received from the borrower to purchase replacement securities of the same issue, type, class and series of the loaned securities. If the value of the collateral is less than the purchase cost of replacement securities, the lending agent is responsible for satisfying the shortfall but only to the extent that the shortfall is not due to any decrease in the value of JHCT.
Although the risk of the loss of the securities lent is mitigated by receiving collateral from the borrower and through lending agent indemnification, the fund could experience a delay in recovering securities or could experience a lower than expected return if the borrower fails to return the securities on a timely basis. The fund receives compensation for lending its securities by retaining a portion of the return on the investment of the collateral and compensation from fees earned from borrowers of the securities. Securities lending income received by the fund is net of fees retained by the securities lending agent. Net income received from JHCT is a component of securities lending income as recorded on the Statement of operations.
Obligations to repay collateral received by the fund are shown on the Statement of assets and liabilities as Payable upon return of securities loaned and are secured by the loaned securities. As of April 30, 2018, the fund loaned common stocks valued at $454,176 and received $485,068 of cash collateral.
Foreign taxes. The fund may be subject to withholding tax on income, capital gains or repatriation taxes imposed by certain countries, a portion of which may be recoverable. Foreign taxes are accrued based upon the fund's understanding of the tax rules and rates that exist in the foreign markets in which it invests. Taxes are accrued based on gains realized by the fund as a result of certain foreign security sales. Estimated taxes are accrued based on unrealized appreciation of such securities. Investment income is recorded net of foreign withholding taxes, less any amounts reclaimable.
Line of credit. The fund may have the ability to borrow from banks for temporary or emergency purposes, including meeting redemption requests that otherwise might require the untimely sale of securities. Pursuant to the fund's custodian agreement, the custodian may loan money to the fund to make properly authorized payments. The fund is obligated to repay the custodian for any overdraft, including any related costs or expenses. The custodian may have a lien, security interest or security entitlement in any fund property that is not otherwise segregated or pledged, to the extent of any overdraft, and to the maximum extent permitted by law.
The fund and other affiliated funds have entered into a syndicated line of credit agreement with Citibank, N.A. as the administrative agent that enables them to participate in a $750 million unsecured committed line of credit. Excluding commitments designated for a certain fund and subject to the needs of all other affiliated funds, the fund can borrow up to an aggregate commitment amount of $500 million, subject to asset coverage and other limitations as specified in the agreement. A commitment fee payable at the end of each calendar quarter, based on the average daily unused portion of the line of credit, is charged to each participating fund based on a combination of fixed and asset based allocations and is reflected in Other expenses on the Statement of
operations. For the six months ended April 30, 2018, the fund had no borrowings under the line of credit. Commitment fees for the six months ended April 30, 2018 were $3,168.
Expenses. Within the John Hancock group of funds complex, expenses that are directly attributable to an individual fund are allocated to such fund. Expenses that are not readily attributable to a specific fund are allocated among all funds in an equitable manner, taking into consideration, among other things, the nature and type of expense and the fund's relative net assets. Expense estimates are accrued in the period to which they relate and adjustments are made when actual amounts are known.
Class allocations. Income, common expenses and realized and unrealized gains (losses) are determined at the fund level and allocated daily to each class of shares based on the net assets of the class. Class-specific expenses, such as distribution and service fees, if any, and transfer agent fees, for all classes, are charged daily at the class level based on the net assets of each class and the specific expense rates applicable to each class.
Federal income taxes. The fund intends to continue to qualify as a regulated investment company by complying with the applicable provisions of the Internal Revenue Code and will not be subject to federal income tax on taxable income that is distributed to shareholders. Therefore, no federal income tax provision is required.
As of October 31, 2017, the fund had no uncertain tax positions that would require financial statement recognition, derecognition or disclosure. The fund's federal tax returns are subject to examination by the Internal Revenue Service for a period of three years.
Distribution of income and gains. Distributions to shareholders from net investment income and net realized gains, if any, are recorded on the ex-date. The fund generally declares and pays dividends and capital gain distributions, if any, annually.
Distributions paid by the fund with respect to each class of shares are calculated in the same manner, at the same time and in the same amount, except for the effect of class level expenses that may be applied differently to each class.
Such distributions, on a tax basis, are determined in conformity with income tax regulations, which may differ from US GAAP. Distributions in excess of tax basis earnings and profits, if any, are reported in the fund's financial statements as a return of capital. The final determination of tax characteristics of the fund's distribution will occur at the end of the year and will subsequently be reported to shareholders.
Capital accounts within the financial statements are adjusted for permanent book-tax differences. These adjustments have no impact on net assets or the results of operations. Temporary book-tax differences, if any, will reverse in a subsequent period. Book-tax differences are primarily attributable to net operating losses and wash sale loss deferrals.
Note 3 — Guarantees and indemnifications
Under the Trust's organizational documents, its Officers and Trustees are indemnified against certain liabilities arising out of the performance of their duties to the Trust, including the fund. Additionally, in the normal course of business, the fund enters into contracts with service providers that contain general indemnification clauses. The fund's maximum exposure under these arrangements is unknown, as this would involve future claims that may be made against the fund that have not yet occurred. The risk of material loss from such claims is considered remote.
Note 4 — Fees and transactions with affiliates
John Hancock Advisers, LLC (the Advisor) serves as investment advisor for the fund. John Hancock Funds, LLC (the Distributor), an affiliate of the Advisor, serves as principal underwriter of the fund. The Advisor and the Distributor are indirect, wholly owned subsidiaries of Manulife Financial Corporation (MFC).
Management fee. The fund has an investment management agreement with the Advisor under which the fund pays a monthly management fee to the Advisor equivalent on an annual basis to the sum of: (a) 0.75% of the first $500 million of the fund's average daily net assets; (b) 0.73% of the next $500 million of the fund's average daily net assets; (c) 0.71% of the next $1 billion of the fund's average daily net assets; (d) 0.70% of the next $3 billion of the fund's average daily net assets; and (e) 0.65% of the fund's average daily net assets in excess of $5 billion. The Advisor has a subadvisory agreement with Sustainable Growth Advisers, LP. The fund is not responsible for payment of the subadvisory fees.
The Advisor has contractually agreed to waive a portion of its management fee and/or reimburse expenses for certain funds of the John Hancock group of funds complex, including the fund (the participating portfolios). This waiver is based upon aggregate net
assets of all the participating portfolios. The amount of the reimbursement is calculated daily and allocated among all the participating portfolios in proportion to the daily net assets of each fund. During the six months ended April 30, 2018, this waiver amounted to 0.01% of the fund's average net assets on an annualized basis. This arrangement may be amended or terminated at any time by the Advisor upon notice to the fund and with the approval of the Board of Trustees.
For the six months ended April 30, 2018, the expense reductions described above amounted to the following:
| Class | Expense reduction | Class | Expense reduction | |
| Class A | $24,770 | Class R2 | $169 | |
| Class B | 641 | Class R6 | 5,166 | |
| Class C | 4,353 | Total | $63,370 | |
| Class I | 28,271 |
Expenses waived or reimbursed in the current fiscal period are not subject to recapture in future fiscal periods.
The investment management fees incurred for the six months ended April 30, 2018 were equivalent to a net annual effective rate of 0.72% of the fund's average daily net assets.
Accounting and legal services. Pursuant to the Accounting and Legal Services Agreement the fund reimburses the Advisor for all expenses associated with providing the administrative, financial, legal, compliance, accounting and recordkeeping services to the fund, including the preparation of all tax returns, periodic reports to shareholders and regulatory reports, among other services. These expenses are allocated to each share class based on its relative net assets at the time the expense was incurred. These accounting and legal services fees incurred for the six months ended April 30, 2018 amounted to an annual rate of 0.02% of the fund's average daily net assets.
Distribution and service plans. The fund has a distribution agreement with the Distributor. The fund has adopted distribution and service plans with respect to Class A, Class B, Class C and Class R2 shares pursuant to Rule 12b-1 under the 1940 Act, to pay the Distributor for services provided as the distributor of shares of the fund. In addition, under a service plan for Class R2 shares, the fund pays for certain other services. The fund may pay up to the following contractual rates of distribution and service fees under these arrangements, expressed as an annual percentage of average daily net assets for each class of the fund's shares.
| Class | Rule 12b-1 fee | Service fee | Class | Rule 12b-1 fee | Service fee | |
| Class A | 0.25% | — | Class C | 1.00% | — | |
| Class B | 1.00% | — | Class R2 | 0.25% | 0.25% |
Sales charges. Class A shares are assessed up-front sales charges, which resulted in payments to the Distributor amounting to $274,662 for the six months ended April 30, 2018. Of this amount, $45,671 was retained and used for printing prospectuses, advertising, sales literature and other purposes, $219,565 was paid as sales commissions to broker-dealers and $9,426 was paid as sales commissions to sales personnel of Signator Investors, Inc., a broker-dealer affiliate of the Advisor.
Class A, Class B and Class C shares may be subject to contingent deferred sales charges (CDSCs). Certain Class A shares that are acquired through purchases of $1 million or more and are redeemed within one year of purchase are subject to a 1.00% sales charge. Class B shares that are redeemed within six years of purchase are subject to CDSCs, at declining rates, beginning at 5.00%. Class C shares that are redeemed within one year of purchase are subject to a 1.00% CDSC. CDSCs are applied to the lesser of the current market value at the time of redemption or the original purchase cost of the shares being redeemed. Proceeds from CDSCs are used to compensate the Distributor for providing distribution-related services in connection with the sale of these shares. During the six months ended April 30, 2018, CDSCs received by the Distributor amounted to $3,874, $4,807 and $2,062 for Class A, Class B and Class C shares, respectively.
Transfer agent fees. The John Hancock Group of Funds has a complex-wide transfer agent agreement with John Hancock Signature Services, Inc. (Signature Services), an affiliate of the Advisor. The transfer agent fees paid to Signature Services are determined based on the cost to Signature Services (Signature Services Cost) of providing recordkeeping services. It also includes out-of-pocket expenses, including payments made to third-parties for recordkeeping services provided to their clients who invest in one or more John Hancock funds. In addition, Signature Services Cost may be reduced by certain fees that Signature Services receives in connection with retirement and small accounts. Signature Services Cost is calculated monthly and allocated, as
applicable, to five categories of share classes: Retail Share and Institutional Share Classes of Non-Municipal Bond Funds, Class R6 Shares, Retirement Share Classes and Municipal Bond Share Classes. Within each of these categories, the applicable costs are allocated to the affected John Hancock affiliated funds and/or classes, based on the relative average daily net assets.
Class level expenses. Class level expenses for the six months ended April 30, 2018 were:
| Class | Distribution and service fees | Transfer agent fees |
| Class A | $724,578 | $313,443 |
| Class B | 75,032 | 8,106 |
| Class C | 509,421 | 55,079 |
| Class I | — | 365,898 |
| Class R2 | 9,705 | 240 |
| Class R6 | — | 7,340 |
| Total | $1,318,736 | $750,106 |
Trustee expenses. The fund compensates each Trustee who is not an employee of the Advisor or its affiliates. The costs of paying Trustee compensation and expenses are allocated to the fund based on its net assets relative to other funds within the John Hancock group of funds complex.
Note 5 — Fund share transactions
Transactions in fund shares for the six months ended April 30, 2018 and for the year ended October 31, 2017 were as follows:
| Six months ended 4-30-18 | Year ended 10-31-17 | |||||||||||||||||||||||||
| Shares | Amount | Shares | Amount | |||||||||||||||||||||||
| Class A shares | ||||||||||||||||||||||||||
| Sold | 559,501 | $26,185,877 | 1,650,569 | $71,553,086 | ||||||||||||||||||||||
| Distributions reinvested | 842,616 | 38,431,702 | 741,848 | 29,399,464 | ||||||||||||||||||||||
| Repurchased | (1,322,964 | ) | (62,063,578 | ) | (4,975,171 | ) | (211,142,536 | ) | ||||||||||||||||||
| Net increase (decrease) | 79,153 | $2,554,001 | (2,582,754 | ) | ($110,189,986 | ) | ||||||||||||||||||||
| Class B shares | ||||||||||||||||||||||||||
| Sold | 6,240 | $250,508 | 10,974 | $413,702 | ||||||||||||||||||||||
| Distributions reinvested | 29,529 | 1,143,957 | 28,642 | 982,997 | ||||||||||||||||||||||
| Repurchased | (64,790 | ) | (2,586,722 | ) | (180,095 | ) | (6,728,361 | ) | ||||||||||||||||||
| Net decrease | (29,021 | ) | ($1,192,257 | ) | (140,479 | ) | ($5,331,662 | ) | ||||||||||||||||||
| Class C shares | ||||||||||||||||||||||||||
| Sold | 85,617 | $3,403,560 | 248,122 | $9,281,668 | ||||||||||||||||||||||
| Distributions reinvested | 201,802 | 7,821,856 | 163,819 | 5,625,549 | ||||||||||||||||||||||
| Repurchased | (292,151 | ) | (11,639,637 | ) | (1,150,876 | ) | (43,215,342 | ) | ||||||||||||||||||
| Net decrease | (4,732 | ) | ($414,221 | ) | (738,935 | ) | ($28,308,125 | ) | ||||||||||||||||||
| Class I shares | ||||||||||||||||||||||||||
| Sold | 2,158,365 | $108,109,880 | 12,795,709 | $581,560,007 | ||||||||||||||||||||||
| Distributions reinvested | 844,360 | 41,246,991 | 323,792 | 13,644,599 | ||||||||||||||||||||||
| Repurchased | (5,933,556 | ) | (298,072,625 | ) | (5,369,963 | ) | (248,528,151 | ) | ||||||||||||||||||
| Net increase (decrease) | (2,930,831 | ) | ($148,715,754 | ) | 7,749,538 | $346,676,455 | ||||||||||||||||||||
| Class R2 shares | ||||||||||||||||||||||||||
| Sold | 11,791 | $572,495 | 40,931 | $1,805,950 | ||||||||||||||||||||||
| Distributions reinvested | 6,094 | 292,693 | 6,010 | 250,320 | ||||||||||||||||||||||
| Repurchased | (61,085 | ) | (2,976,033 | ) | (77,570 | ) | (3,526,106 | ) | ||||||||||||||||||
| Net decrease | (43,200 | ) | ($2,110,845 | ) | (30,629 | ) | ($1,469,836 | ) | ||||||||||||||||||
| Six months ended 4-30-18 | Year ended 10-31-17 | |||||||||||||||||||||||||
| Shares | Amount | Shares | Amount | |||||||||||||||||||||||
| Class R6 shares | ||||||||||||||||||||||||||
| Sold | 2,661,078 | $134,653,885 | 27,047 | $1,277,851 | ||||||||||||||||||||||
| Distributions reinvested | 160,487 | 7,876,721 | 5,998 | 253,662 | ||||||||||||||||||||||
| Repurchased | (275,915 | ) | (13,916,697 | ) | (43,886 | ) | (1,956,321 | ) | ||||||||||||||||||
| Net increase (decrease) | 2,545,650 | $128,613,909 | (10,841 | ) | ($424,808 | ) | ||||||||||||||||||||
| Total net increase (decrease) | (382,981 | ) | ($21,265,167 | ) | 4,245,900 | $200,952,038 | ||||||||||||||||||||
Note 6 — Purchase and sale of securities
Purchases and sales of securities, other than short-term investments, amounted to $274,090,519 and $399,287,181, respectively, for the six months ended April 30, 2018.
Note 7 — Industry or sector risk
The fund may invest a large percentage of its assets in one or more particular industries or sectors of the economy. If a large percentage of the fund's assets are economically tied to a single or small number of industries or sectors of the economy, the fund will be less diversified than a more broadly diversified fund, and it may cause the fund to underperform if that industry or sector underperforms. In addition, focusing on a particular industry or sector may make the fund's NAV more volatile. Further, a fund that invests in particular industries or sectors is particularly susceptible to the impact of market, economic, regulatory and other factors affecting those industries or sectors.
Trustees Hassell H. McClellan, Chairperson Officers Andrew G. Arnott John J. Danello Francis V. Knox, Jr. Charles A. Rizzo Salvatore Schiavone | Investment advisor John Hancock Advisers, LLC Subadvisor Sustainable Growth Advisers, LP (SGA) Principal distributor John Hancock Funds, LLC Custodian State Street Bank and Trust Company Transfer agent John Hancock Signature Services, Inc. Legal counsel K&L Gates LLP |
*Member of the Audit Committee
†Non-Independent Trustee
#Effective 6-20-17
The fund's proxy voting policies and procedures, as well as the fund proxy voting record for the most recent twelve-month period ended June 30, are available free of charge on the Securities and Exchange Commission (SEC) website at sec.gov or on our website.
The fund's complete list of portfolio holdings, for the first and third fiscal quarters, is filed with the SEC on Form N-Q. The fund's Form N-Q is available on our website and the SEC's website, sec.gov, and can be reviewed and copied (for a fee) at the SEC's Public Reference Room in Washington, DC. Call 800-SEC-0330 to receive information on the operation of the SEC's Public Reference Room.
We make this information on your fund, as well as monthly portfolio holdings, and other fund details available on our website at jhinvestments.com or by calling 800-225-5291.
| You can also contact us: | |||
| 800-225-5291 jhinvestments.com | Regular mail: John Hancock Signature Services, Inc. | Express mail: John Hancock Signature Services, Inc. | |
John Hancock family of funds
DOMESTIC EQUITY FUNDS Balanced Blue Chip Growth Classic Value Disciplined Value Disciplined Value Mid Cap Equity Income Fundamental All Cap Core Fundamental Large Cap Core Fundamental Large Cap Value New Opportunities Small Cap Core Small Cap Growth Small Cap Value Strategic Growth U.S. Global Leaders Growth U.S. Growth Value Equity GLOBAL AND INTERNATIONAL EQUITY FUNDS Disciplined Value International Emerging Markets Emerging Markets Equity Fundamental Global Franchise Global Equity Global Shareholder Yield Greater China Opportunities International Growth International Small Company International Value Equity | INCOME FUNDS Bond California Tax-Free Income Emerging Markets Debt Floating Rate Income Government Income High Yield High Yield Municipal Bond Income Investment Grade Bond Money Market Short Duration Credit Opportunities Spectrum Income Strategic Income Opportunities Tax-Free Bond ALTERNATIVE AND SPECIALTY FUNDS Absolute Return Currency Alternative Asset Allocation Enduring Assets Financial Industries Global Absolute Return Strategies Global Conservative Absolute Return Global Focused Strategies Natural Resources Redwood Regional Bank Seaport Long/Short Technical Opportunities |
A fund's investment objectives, risks, charges, and expenses should be considered carefully before investing. The prospectus contains this and other important information about the fund. To obtain a prospectus, contact your financial professional, call John Hancock Investments at 800-225-5291, or visit our website at jhinvestments.com. Please read the prospectus carefully before investing or sending money.
ASSET ALLOCATION Income Allocation Multi-Index Lifetime Portfolios Multi-Index Preservation Portfolios Multimanager Lifestyle Portfolios Multimanager Lifetime Portfolios Retirement Income 2040 EXCHANGE-TRADED FUNDS John Hancock Multifactor Consumer Discretionary ETF John Hancock Multifactor Consumer Staples ETF John Hancock Multifactor Developed International ETF John Hancock Multifactor Energy ETF John Hancock Multifactor Financials ETF John Hancock Multifactor Healthcare ETF John Hancock Multifactor Industrials ETF John Hancock Multifactor Large Cap ETF John Hancock Multifactor Materials ETF John Hancock Multifactor Mid Cap ETF John Hancock Multifactor Small Cap ETF John Hancock Multifactor Technology ETF John Hancock Multifactor Utilities ETF | ENVIRONMENTAL, SOCIAL, AND GOVERNANCE FUNDS ESG All Cap Core ESG Core Bond ESG International Equity ESG Large Cap Core CLOSED-END FUNDS Financial Opportunities Hedged Equity & Income Income Securities Trust Investors Trust Preferred Income Preferred Income II Preferred Income III Premium Dividend Tax-Advantaged Dividend Income Tax-Advantaged Global Shareholder Yield |
John Hancock Multifactor ETF shares are bought and sold at market price (not NAV), and are not individually redeemed
from the fund. Brokerage commissions will reduce returns.
John Hancock ETFs are distributed by Foreside Fund Services, LLC, and are subadvised by Dimensional Fund Advisors LP.
Foreside is not affiliated with John Hancock Funds, LLC or Dimensional Fund Advisors LP.
Dimensional Fund Advisors LP receives compensation from John Hancock in connection with licensing rights to the
John Hancock Dimensional indexes. Dimensional Fund Advisors LP does not sponsor, endorse, or sell, and makes no
representation as to the advisability of investing in, John Hancock Multifactor ETFs.
John Hancock Investments
A trusted brand
John Hancock Investments is a premier asset manager representing one of
America's most trusted brands, with a heritage of financial stewardship dating
back to 1862. Helping our shareholders pursue their financial goals is at the
core of everything we do. It's why we support the role of professional financial
advice and operate with the highest standards of conduct and integrity.
A better way to invest
We serve investors globally through a unique multimanager approach:
We search the world to find proven portfolio teams with specialized
expertise for every strategy we offer, then we apply robust investment
oversight to ensure they continue to meet our uncompromising standards
and serve the best interests of our shareholders.
Results for investors
Our unique approach to asset management enables us to provide a diverse set
of investments backed by some of the world's best managers, along with strong
risk-adjusted returns across asset classes.

 | John Hancock Funds, LLC n Member FINRA, SIPC 601 Congress Street n Boston, MA 02210-2805 800-225-5291 n jhinvestments.com | |
| This report is for the information of the shareholders of John Hancock U.S. Global Leaders Growth Fund. It is not authorized for distribution to prospective investors unless preceded or accompanied by a prospectus. | ||
| MF450502 | 26SA 4/18 6/18 | |
John Hancock
Classic Value Fund
Semiannual report 4/30/18
A message to shareholders
Dear shareholder,
Financial markets around the world experienced a meaningful rise in volatility in the last half of the reporting period, leading to some mixed results for equity investors. Stocks generally declined late in the period as investors reacted to a potential trade war between the United States and China and the prospect of rising inflation. While some in the asset management community believe the sell-off will be temporary, we have suggested for some time that the era of extremely low volatility would eventually come to an end, and that now appears to be the case.
Ultimately, the asset prices of stocks are underpinned by fundamentals, and the good news is that those continue to appear supportive. Unemployment remained close to historic lows, consumer confidence rose, and the housing market continued to notch steady gains. One moderating factor was the U.S. Federal Reserve's steady tightening of monetary policy. While higher interest rates alone may not cause the economy to pull back, markets will be closely attuned to any sign of policymakers quickening the pace of interest-rate increases in the year ahead.
Your best resource in unpredictable markets is your financial advisor, who can help position your portfolio so that it's sufficiently diversified to meet your long-term objectives and to withstand the inevitable turbulence along the way.
On behalf of everyone at John Hancock Investments, I'd like to take this opportunity to welcome new shareholders and to thank existing shareholders for the continued trust you've placed in us.
Sincerely,
Andrew G. Arnott
President and CEO,
John Hancock Investments
Head of Wealth and Asset Management,
United States and Europe
This commentary reflects the CEO's views, which are subject to change at any time. Investing involves risks, including the potential loss of principal. Diversification does not guarantee a profit or eliminate the risk of a loss. It is not possible to invest directly into an index. For more up-to-date information, please visit our website at jhinvestments.com.
John Hancock
Classic Value Fund
INVESTMENT OBJECTIVE
The fund seeks long-term growth of capital.
AVERAGE ANNUAL TOTAL RETURNS AS OF 4/30/18 (%)
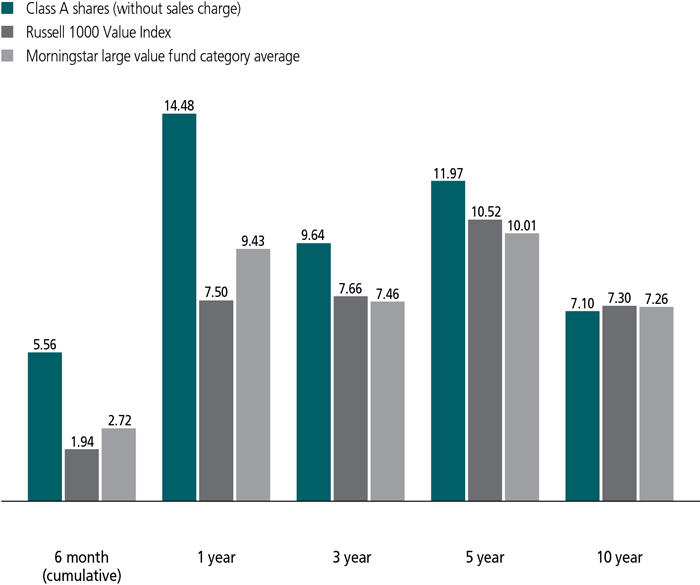
The Russell 1000 Value Index is an unmanaged index containing those securities in the Russell 1000 Index with a less-than-average growth orientation.
It is not possible to invest directly in an index. Index figures do not reflect expenses or sales charges, which would result in lower returns.
Figures from Morningstar, Inc. include reinvested distributions and do not take into account sales charges. Actual load-adjusted performance is lower.
The past performance shown here reflects reinvested distributions and the beneficial effect of any expense reductions, and does not guarantee future results. Returns for periods shorter than one year are cumulative. Performance of the other share classes will vary based on the difference in the fees and expenses of those classes. Shares will fluctuate in value and, when redeemed, may be worth more or less than their original cost. Current month-end performance may be lower or higher than the performance cited, and can be found at jhinvestments.com or by calling 800-225-5291. For further information on the fund's objectives, risks, and strategy, see the fund's prospectus.
PERFORMANCE HIGHLIGHTS OVER THE LAST SIX MONTHS
Markets advanced, but volatility dampened performance
Volatility in the final three months caused by rising interest rates and a possible trade war between the United States and China muted the strong returns generated during the first half of the period.
Stock selection key to fund's outperformance
The fund led its benchmark, the Russell 1000 Value Index, due to stock selection in the consumer discretionary and healthcare sectors.
Several industries failed to advance
Holdings in software and insurance firms were among the fund's detractors.
SECTOR COMPOSITION AS OF 4/30/18 (%)
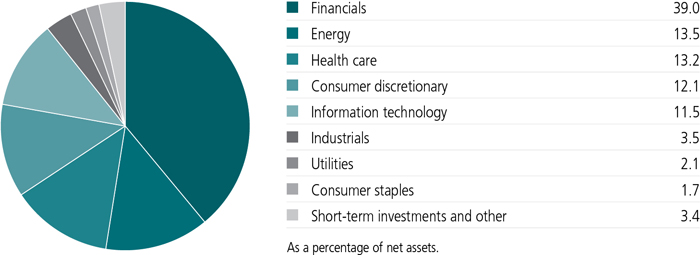
A note about risks
The value of a company's equity securities is subject to changes in the company's financial condition and overall market and economic conditions. The securities of value companies are subject to the risk that the companies may not overcome the adverse business developments or other factors causing their securities to be underpriced or that the market may never come to recognize their fundamental value. Because the fund may focus on particular sectors of the economy, its performance may depend on the performance of those sectors, and investments focused in one sector may fluctuate more widely than investments broadly invested across sectors. Foreign investing has additional risks, such as currency and market volatility and political and social instability. Please see the fund's prospectus for additional risks.

Richard S. Pzena
Portfolio Manager
Pzena Investment Management, LLC

John Flynn
Portfolio Manager
Pzena Investment Management, LLC

Benjamin S. Silver, CFA, CPA
Portfolio Manager
Pzena Investment Management, LLC
How did the markets perform during the six months ended April 30, 2018?
U.S. equity markets continued their long bull market advance, although volatility in the final three months muted the strong returns generated during the first half of the period. Favorable sentiment over continued economic growth and year-end tax reform legislation was tempered by rising interest rates, rumblings of a trade war between the United States and China, and global tensions around Russia's involvement with Syria. Higher oil prices helped the energy sector post strong returns but also added to inflationary fears. As 10-year U.S. Treasury yields hit 3%, investors pulled money out of so-called bond proxies—such as consumer staples and utilities—in favor of growth stalwarts. The spread in valuations between the cheapest and most expensive stocks is among the widest it has been in the last 50 years, leaving a wide set of opportunities for the fund.
The fund outperformed its benchmark, the Russell 1000 Value Index, and the broad market, as measured by the S&P 500 Index. What factors contributed to performance?
Stock selection in the consumer discretionary and healthcare sectors accounted for a majority of the outperformance. The other major contributor was having relatively little exposure to consumer staples and utilities, sectors that lagged as investors turned away from bond proxy sectors such as these.
The fund's two advertising agency holdings—The Interpublic Group of Companies, Inc. and Omnicom Group, Inc.—made contributions to performance after posting better-than-expected organic growth despite investors' concerns over potential disruption by technology and new market participants.
Voya Financial, Inc. and Hewlett Packard Enterprise Company (HPE) were also significant contributors. Voya rose sharply after announcing the sale of its variable annuity business, eliminating a potential risk that had weighed on the company's valuation. A strong earnings report and increase in its share repurchase program also contributed to Voya's strength. HPE, the server and networking products business that was spun out of HP, Inc., advanced on strong earnings, robust sales growth, and plans to return $7 billion to shareholders over the next two years.
What factors detracted relative to the benchmark?
Major detractors from relative performance included Micro Focus International PLC, a multinational software and consulting business, whose stock fell as the company pre-announced a sharper-than-expected revenue decline and the departure of its CEO. The company recently completed its merger with the legacy software business spun out of Hewlett-Packard (not held) and has struggled to integrate the two operations.
TOP 10 HOLDINGS AS OF 4/30/18 (%)
| Ford Motor Company | 4.3 |
| Citigroup, Inc. | 3.6 |
| Royal Dutch Shell PLC, ADR, Class A | 3.6 |
| Cognizant Technology Solutions Corp., Class A | 3.6 |
| Voya Financial, Inc. | 3.4 |
| Mylan NV | 3.3 |
| Oracle Corp. | 3.2 |
| American International Group, Inc. | 3.2 |
| Morgan Stanley | 3.1 |
| MetLife, Inc. | 3.1 |
| TOTAL | 34.4 |
| As a percentage of net assets. | |
| Cash and cash equivalents are not included. | |
Oracle Corp., a global leader in database and applications software, weakened on concerns over the pace of converting customers to its cloud computing platform. The controversy centers around the ability of the company to migrate customers to the software-as-a-service model. Apart from this challenge, a notable surprise was the continued popularity of the company's licensed software.
American International Group, Inc. (AIG), the global multi-line insurer, was down due to reserve charges in its commercial insurance unit and catastrophe losses from hurricanes Harvey, Irma, and Maria. The reserve charge was a disappointment as the company had just completed a comprehensive reserve study with no adverse findings. Despite these losses, the company's consumer insurance segment performed well, and an additional positive is that the company is no longer considered a systemically important financial institution by government regulators, which will mean less stringent capital requirements. AIG remains focused on commercial underwriting, which we believe should position the company for long-term profitable growth.
What were some notable changes to the fund?
The largest additions to the portfolio were in the healthcare sector, including drug companies Merck & Company, Inc. and Amgen, Inc., as well as drug distributor Cardinal Health, Inc. Merck, a leading biopharma company, came under pressure because of news surrounding one of its recently launched drugs. We believe the market reaction provided the opportunity to purchase a diverse drug portfolio at an attractive price. Amgen, a leading biotechnology company, has seen its valuation decline due to upcoming patent expirations and a slower-than-expected launch of one of its new drugs. Despite these concerns, we believe a significant portion of Amgen's market value resides in existing drugs, providing significant downside protection at current valuation levels. We added Cardinal Health, a pharmaceutical distributor, to the portfolio as concerns about disruption in
COUNTRY COMPOSITION AS OF 4/30/18 (%)
| United States | 87.6 |
| Netherlands | 3.6 |
| United Kingdom | 2.5 |
| Bermuda | 2.4 |
| Canada | 2.1 |
| Switzerland | 1.8 |
| TOTAL | 100.0 |
| As a percentage of net assets. |
the pharmaceutical supply chain weighed on the stock price. We are attracted by the strong and stable returns of this business, negative working capital requirements, and long-term growth.
We also added utility company Edison International. We believe that the company's current valuation is being underestimated as uncertainty around liabilities from California wildfires weighed on the stock, and was therefore an attractive buying opportunity. Toward the end of the period we initiated positions in General Electric Company and Newell Brands, Inc.
Sales included Hilton Worldwide Holdings, Inc., Parker-Hannifin Corp., and Seagate Technology PLC, all as their stock prices appreciated toward our estimate of fair value. We also trimmed HPE and Walmart, Inc. based on strength, locking in some profits.
How was the portfolio positioned at the end of the period?
We continue to see meaningful valuation dispersion in the market and the fund remained tilted toward cyclicals. The largest change was an increase in the fund's exposure to healthcare, which was funded in part by sales and trims in the information technology, industrials, and consumer staples sectors. The fund's largest exposures are in the financial services, energy, healthcare, and consumer discretionary sectors; it continues to have little exposure to consumer staples stocks, which we believe are trading at premium valuations, even considering their recent pullback. We also avoided telecommunication services and real estate for the same reason.
MANAGED BY
| | Richard S. Pzena On the fund since 1996 Investing since 1980 |
| | John Flynn On the fund since 2017 Investing since 2000 |
| | Benjamin S. Silver, CFA, CPA On the fund since 2012 Investing since 1991 |
![]()
TOTAL RETURNS FOR THE PERIOD ENDED APRIL 30, 2018
| Average annual total returns (%) with maximum sales charge | Cumulative total returns (%) with maximum sales charge | ||||||
| 1-year | 5-year | 10-year | 6-month | 5-year | 10-year | ||
| Class A | 8.75 | 10.83 | 6.55 | 0.28 | 67.19 | 88.54 | |
| Class B | 8.68 | 10.87 | 6.45 | 0.21 | 67.54 | 86.90 | |
| Class C | 12.68 | 11.14 | 6.30 | 4.21 | 69.57 | 84.18 | |
| Class I1 | 14.80 | 12.26 | 7.44 | 5.70 | 78.31 | 104.90 | |
| Class R11 | 14.05 | 11.55 | 6.73 | 5.37 | 72.72 | 91.78 | |
| Class R21,2 | 14.33 | 11.88 | 7.08 | 5.50 | 75.33 | 98.17 | |
| Class R31,2 | 14.18 | 11.67 | 6.84 | 5.45 | 73.65 | 93.87 | |
| Class R41,2 | 14.73 | 12.22 | 7.25 | 5.67 | 77.94 | 101.35 | |
| Class R51,2 | 14.84 | 12.35 | 7.42 | 5.74 | 79.00 | 104.49 | |
| Class R61,2 | 14.93 | 12.39 | 7.37 | 5.76 | 79.31 | 103.59 | |
| Index† | 7.50 | 10.52 | 7.30 | 1.94 | 64.92 | 102.28 | |
Performance figures assume all distributions have been reinvested. Figures reflect maximum sales charges on Class A shares of 5% and the applicable contingent deferred sales charge (CDSC) on Class B and Class C shares. The Class B shares' CDSC declines annually between years 1 to 6 according to the following schedule: 5%, 4%, 3%, 3%, 2%, 1%. No sales charge will be assessed after the sixth year. Class C shares held for less than one year are subject to a 1% CDSC. Sales charges are not applicable to Class I, Class R1, Class R2, Class R3, Class R4, Class R5, and Class R6 shares.
The expense ratios of the fund, both net (including any fee waivers and/or expense limitations) and gross (excluding any fee waivers and/or expense limitations), are set forth according to the most recent publicly available prospectus for the fund and may differ from those disclosed in the Financial highlights tables in this report. Net expenses reflect contractual expense limitations in effect until February 28, 2019 and are subject to change. Had the contractual fee waivers and expense limitations not been in place, gross expenses would apply. The expense ratios are as follows:
| Class A | Class B | Class C | Class I | Class R1 | Class R2 | Class R3 | Class R4 | Class R5 | Class R6 | |
| Gross (%) | 1.18 | 1.93 | 1.93 | 0.92 | 1.58 | 1.33 | 1.48 | 1.18 | 0.88 | 0.83 |
| Net (%) | 1.18 | 1.93 | 1.93 | 0.92 | 1.58 | 1.33 | 1.48 | 1.08 | 0.88 | 0.83 |
Please refer to the most recent prospectus and annual or semiannual report for more information on expenses and any expense limitation arrangements for each class.
The returns reflect past results and should not be considered indicative of future performance. The return and principal value of an investment will fluctuate so that shares, when redeemed, may be worth more or less than their original cost. Due to market volatility and other factors, the fund's current performance may be higher or lower than the performance shown. For current to the most recent month-end performance data, please call 800-225-5291 or visit the fund's website at jhinvestments.com.
The performance table above and the chart on the next page do not reflect the deduction of taxes that a shareholder would pay on fund distributions or the redemption of fund shares. The fund's performance results reflect any applicable fee waivers or expense reductions, without which the expenses would increase and results would have been less favorable.
| † | Index is the Russell 1000 Value Index. |
See the following page for footnotes.
This chart and table show what happened to a hypothetical $10,000 investment in John Hancock Classic Value Fund for the share classes and periods indicated, assuming all distributions were reinvested. For comparison, we've shown the same investment in the Russell 1000 Value Index.
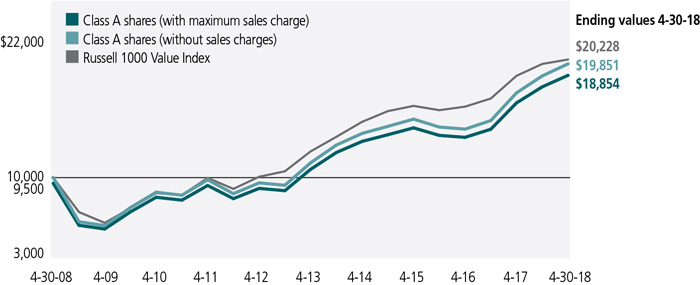
The Russell 1000 Value Index is an unmanaged index containing those securities in the Russell 1000 Index with a less-than-average growth orientation.
It is not possible to invest directly in an index. Index figures do not reflect expenses or sales charges, which would result in lower returns.
Footnotes related to performance pages
| 1 | For certain types of investors, as described in the fund's prospectus. |
| 2 | Class R2 shares were first offered on 3/1/12; Class R3, Class R4, and Class R5 shares were first offered on 5/22/09; Class R6 shares were first offered on 9/1/11. Returns prior to these dates are those of Class A shares (first offered on 6/24/96) and have not been adjusted for expenses; otherwise, returns would vary. |
| 3 | The contingent deferred sales charge is not applicable. |
These examples are intended to help you understand your ongoing operating expenses of investing in the fund so you can compare these costs with the ongoing costs of investing in other mutual funds.
Understanding fund expenses
As a shareholder of the fund, you incur two types of costs:
| • | Transaction costs, which include sales charges (loads) on purchases or redemptions (varies by share class), minimum account fee charge, etc. |
| • | Ongoing operating expenses, including management fees, distribution and service fees (if applicable), and other fund expenses. |
We are presenting only your ongoing operating expenses here.
Actual expenses/actual returns
The first line of each share class in the table on the following page is intended to provide information about the fund's actual ongoing operating expenses, and is based on the fund's actual return. It assumes an account value of $1,000.00 on November 1, 2017, with the same investment held until April 30, 2018.
Together with the value of your account, you may use this information to estimate the operating expenses that you paid over the period. Simply divide your account value at April 30, 2018, by $1,000.00, then multiply it by the "expenses paid" for your share class from the table. For example, for an account value of $8,600.00, the operating expenses should be calculated as follows:
Hypothetical example for comparison purposes
The second line of each share class in the table on the following page allows you to compare the fund's ongoing operating expenses with those of any other fund. It provides an example of the fund's hypothetical account values and hypothetical expenses based on each class's actual expense ratio and an assumed 5% annualized return before expenses (which is not the fund's actual return). It assumes an account value of $1,000.00 on November 1, 2017, with the same investment held until April 30, 2018. Look in any other fund shareholder report to find its hypothetical example and you will be able to compare these expenses. Please remember that these hypothetical account values and expenses may not be used to estimate the actual ending account balance or expenses you paid for the period.
Remember, these examples do not include any transaction costs, therefore, these examples will not help you to determine the relative total costs of owning different funds. If transaction costs were included, your expenses would have been higher. See the prospectus for details regarding transaction costs.
SHAREHOLDER EXPENSE EXAMPLE CHART
| Account value on 11-1-2017 | Ending value on 4-30-2018 | Expenses paid during period ended 4-30-20181 | Annualized expense ratio | ||
| Class A | Actual expenses/actual returns | $1,000.00 | $1,055.60 | $5.91 | 1.16% |
| Hypothetical example for comparison purposes | 1,000.00 | 1,019.00 | 5.81 | 1.16% | |
| Class B | Actual expenses/actual returns | 1,000.00 | 1,052.10 | 9.72 | 1.91% |
| Hypothetical example for comparison purposes | 1,000.00 | 1,015.30 | 9.54 | 1.91% | |
| Class C | Actual expenses/actual returns | 1,000.00 | 1,052.10 | 9.72 | 1.91% |
| Hypothetical example for comparison purposes | 1,000.00 | 1,015.30 | 9.54 | 1.91% | |
| Class I | Actual expenses/actual returns | 1,000.00 | 1,057.00 | 4.64 | 0.91% |
| Hypothetical example for comparison purposes | 1,000.00 | 1,020.30 | 4.56 | 0.91% | |
| Class R1 | Actual expenses/actual returns | 1,000.00 | 1,053.70 | 7.94 | 1.56% |
| Hypothetical example for comparison purposes | 1,000.00 | 1,017.10 | 7.80 | 1.56% | |
| Class R2 | Actual expenses/actual returns | 1,000.00 | 1,055.00 | 6.67 | 1.31% |
| Hypothetical example for comparison purposes | 1,000.00 | 1,018.30 | 6.56 | 1.31% | |
| Class R3 | Actual expenses/actual returns | 1,000.00 | 1,054.50 | 7.03 | 1.38% |
| Hypothetical example for comparison purposes | 1,000.00 | 1,018.00 | 6.90 | 1.38% | |
| Class R4 | Actual expenses/actual returns | 1,000.00 | 1,056.70 | 4.90 | 0.96% |
| Hypothetical example for comparison purposes | 1,000.00 | 1,020.00 | 4.81 | 0.96% | |
| Class R5 | Actual expenses/actual returns | 1,000.00 | 1,057.40 | 4.39 | 0.86% |
| Hypothetical example for comparison purposes | 1,000.00 | 1,020.50 | 4.31 | 0.86% | |
| Class R6 | Actual expenses/actual returns | 1,000.00 | 1,057.60 | 4.13 | 0.81% |
| Hypothetical example for comparison purposes | 1,000.00 | 1,020.80 | 4.06 | 0.81% | |
| 1 | Expenses are equal to the annualized expense ratio, multiplied by the average account value over the period, multiplied by 181/365 (to reflect the one-half year period). |
| Fund’s investments |
| Shares | Value | ||||
| Common stocks 96.6% | $2,299,983,115 | ||||
| (Cost $1,939,956,625) | |||||
| Consumer discretionary 12.1% | 288,615,942 | ||||
| Automobiles 4.3% | |||||
| Ford Motor Company | 9,055,311 | 101,781,696 | |||
| Household durables 0.8% | |||||
| Newell Brands, Inc. | 691,761 | 19,113,356 | |||
| Media 7.0% | |||||
| News Corp., Class A | 2,160,052 | 34,517,631 | |||
| Omnicom Group, Inc. | 855,252 | 62,997,862 | |||
| The Interpublic Group of Companies, Inc. | 2,976,066 | 70,205,397 | |||
| Consumer staples 1.7% | 40,771,656 | ||||
| Food and staples retailing 1.7% | |||||
| Walmart, Inc. | 460,905 | 40,771,656 | |||
| Energy 13.5% | 320,517,290 | ||||
| Energy equipment and services 2.1% | |||||
| Halliburton Company | 933,995 | 49,492,395 | |||
| Oil, gas and consumable fuels 11.4% | |||||
| BP PLC, ADR | 1,083,645 | 48,319,731 | |||
| Cenovus Energy, Inc. | 5,094,120 | 51,094,024 | |||
| Exxon Mobil Corp. | 634,254 | 49,313,249 | |||
| Murphy Oil Corp. | 1,231,754 | 37,088,113 | |||
| Royal Dutch Shell PLC, ADR, Class A | 1,219,024 | 85,209,778 | |||
| Financials 39.0% | 927,576,906 | ||||
| Banks 11.7% | |||||
| Bank of America Corp. | 2,376,024 | 71,090,638 | |||
| Citigroup, Inc. | 1,252,054 | 85,477,727 | |||
| JPMorgan Chase & Co. | 537,719 | 58,493,073 | |||
| Wells Fargo & Company | 1,196,410 | 62,165,462 | |||
| Capital markets 12.2% | |||||
| Franklin Resources, Inc. | 1,552,832 | 52,237,268 | |||
| Morgan Stanley | 1,429,596 | 73,795,746 | |||
| State Street Corp. | 559,865 | 55,863,330 | |||
| The Goldman Sachs Group, Inc. | 274,028 | 65,309,093 | |||
| UBS Group AG (A)(B) | 2,577,126 | 43,295,717 | |||
| Consumer finance 3.0% | |||||
| Capital One Financial Corp. | 775,281 | 70,255,964 | |||
| Diversified financial services 3.4% | |||||
| Voya Financial, Inc. | 1,562,843 | 81,814,831 | |||
| Insurance 8.7% | |||||
| American International Group, Inc. | 1,340,451 | 75,065,256 | |||
| 12 | JOHN HANCOCK CLASSIC VALUE FUND | SEMIANNUAL REPORT | SEE NOTES TO FINANCIAL STATEMENTS |
| Shares | Value | ||||
| Financials (continued) | |||||
| Insurance (continued) | |||||
| Axis Capital Holdings, Ltd. | 973,620 | $57,151,494 | |||
| Brighthouse Financial, Inc. (A) | 56,735 | 2,881,003 | |||
| MetLife, Inc. | 1,524,655 | 72,680,304 | |||
| Health care 13.2% | 314,432,764 | ||||
| Biotechnology 1.9% | |||||
| Amgen, Inc. | 257,415 | 44,913,769 | |||
| Health care providers and services 5.8% | |||||
| Cardinal Health, Inc. | 355,479 | 22,811,087 | |||
| Express Scripts Holding Company (A) | 671,456 | 50,829,219 | |||
| McKesson Corp. | 419,951 | 65,600,546 | |||
| Pharmaceuticals 5.5% | |||||
| Merck & Company, Inc. | 892,128 | 52,519,575 | |||
| Mylan NV (A) | 2,006,155 | 77,758,568 | |||
| Industrials 3.5% | 83,581,270 | ||||
| Industrial conglomerates 0.5% | |||||
| General Electric Company | 898,978 | 12,648,620 | |||
| Machinery 3.0% | |||||
| Dover Corp. | 765,185 | 70,932,650 | |||
| Information technology 11.5% | 274,067,943 | ||||
| IT services 3.6% | |||||
| Cognizant Technology Solutions Corp., Class A | 1,030,906 | 84,348,729 | |||
| Software 3.6% | |||||
| Micro Focus International PLC, ADR | 631,668 | 10,940,490 | |||
| Oracle Corp. | 1,659,113 | 75,771,691 | |||
| Technology hardware, storage and peripherals 4.3% | |||||
| Hewlett Packard Enterprise Company | 4,087,547 | 69,692,676 | |||
| HP, Inc. | 1,550,226 | 33,314,357 | |||
| Utilities 2.1% | 50,419,344 | ||||
| Electric utilities 2.1% | |||||
| Edison International | 769,526 | 50,419,344 | |||
| Yield (%) | Shares | Value | |||
| Securities lending collateral 0.0% | $831,491 | ||||
| (Cost $831,466) | |||||
| John Hancock Collateral Trust (C) | 1.8834(D) | 83,121 | 831,491 | ||
| SEE NOTES TO FINANCIAL STATEMENTS | SEMIANNUAL REPORT | JOHN HANCOCK CLASSIC VALUE FUND | 13 |
| Par value^ | Value | ||||
| Short-term investments 3.7% | $86,808,000 | ||||
| (Cost $86,808,000) | |||||
| Repurchase agreement 3.7% | 86,808,000 | ||||
| Repurchase Agreement with State Street Corp. dated 4-30-18 at 0.740% to be repurchased at $86,809,784 on 5-1-18, collateralized by $91,870,000 U.S. Treasury Notes, 2.125% due 2-29-24 (valued at $88,545,408, including interest) | 86,808,000 | 86,808,000 |
| Total investments (Cost $2,027,596,091) 100.3% | $2,387,622,606 | ||||
| Other assets and liabilities, net (0.3%) | (6,087,929) | ||||
| Total net assets 100.0% | $2,381,534,677 | ||||
| The percentage shown for each investment category is the total value of the category as a percentage of the net assets of the fund. | |
| ^All par values are denominated in U.S. dollars unless otherwise indicated. | |
| Security Abbreviations and Legend | |
| ADR | American Depositary Receipt |
| (A) | Non-income producing security. |
| (B) | A portion of this security is on loan as of 4-30-18. |
| (C) | Investment is an affiliate of the fund, the advisor and/or subadvisor. This security represents the investment of cash collateral received for securities lending. |
| (D) | The rate shown is the annualized seven-day yield as of 4-30-18. |
| 14 | JOHN HANCOCK CLASSIC VALUE FUND | SEMIANNUAL REPORT | SEE NOTES TO FINANCIAL STATEMENTS |
Financial statements
STATEMENT OF ASSETS AND LIABILITIES 4-30-18 (unaudited)
| Assets | ||||||||||||||||||||||||||||||
| Unaffiliated investments, at value (Cost $2,026,764,625) including $810,724 of securities loaned | $2,386,791,115 | |||||||||||||||||||||||||||||
| Affiliated investments, at value (Cost $831,466) | 831,491 | |||||||||||||||||||||||||||||
| Total investments, at value (Cost $2,027,596,091) | 2,387,622,606 | |||||||||||||||||||||||||||||
| Cash | 905 | |||||||||||||||||||||||||||||
| Receivable for fund shares sold | 5,461,281 | |||||||||||||||||||||||||||||
| Dividends and interest receivable | 2,032,711 | |||||||||||||||||||||||||||||
| Receivable for securities lending income | 3,146 | |||||||||||||||||||||||||||||
| Other receivables and prepaid expenses | 187,002 | |||||||||||||||||||||||||||||
| Total assets | 2,395,307,651 | |||||||||||||||||||||||||||||
| Liabilities | ||||||||||||||||||||||||||||||
| Payable for investments purchased | 8,839,374 | |||||||||||||||||||||||||||||
| Payable for fund shares repurchased | 1,783,337 | |||||||||||||||||||||||||||||
| Payable upon return of securities loaned | 831,450 | |||||||||||||||||||||||||||||
| Payable to affiliates | ||||||||||||||||||||||||||||||
| Accounting and legal services fees | 255,631 | |||||||||||||||||||||||||||||
| Transfer agent fees | 194,405 | |||||||||||||||||||||||||||||
| Distribution and service fees | 141,130 | |||||||||||||||||||||||||||||
| Trustees' fees | 3,402 | |||||||||||||||||||||||||||||
| Investment management fees | 1,451,414 | |||||||||||||||||||||||||||||
| Other liabilities and accrued expenses | 272,831 | |||||||||||||||||||||||||||||
| Total liabilities | 13,772,974 | |||||||||||||||||||||||||||||
| Net assets | $2,381,534,677 | |||||||||||||||||||||||||||||
| Net assets consist of | ||||||||||||||||||||||||||||||
| Paid-in capital | $1,968,577,922 | |||||||||||||||||||||||||||||
| Undistributed net investment income | 12,028,672 | |||||||||||||||||||||||||||||
| Accumulated net realized gain (loss) on investments and foreign currency transactions | 40,901,568 | |||||||||||||||||||||||||||||
| Net unrealized appreciation (depreciation) on investments | 360,026,515 | |||||||||||||||||||||||||||||
| Net assets | $2,381,534,677 | |||||||||||||||||||||||||||||
STATEMENT OF ASSETS AND LIABILITIES (continued)
| Net asset value per share | ||||||||||||||||||
| Based on net asset values and shares outstanding-the fund has an unlimited number of shares authorized with no par value | ||||||||||||||||||
| Class A ($356,658,822 ÷ 10,554,016 shares)1 | $33.79 | |||||||||||||||||
| Class B ($3,639,076 ÷ 109,423 shares)1 | $33.26 | |||||||||||||||||
| Class C ($74,479,249 ÷ 2,240,264 shares)1 | $33.25 | |||||||||||||||||
| Class I ($1,580,929,268 ÷ 46,687,067 shares) | $33.86 | |||||||||||||||||
| Class R1 ($3,518,877 ÷ 103,984 shares) | $33.84 | |||||||||||||||||
| Class R2 ($7,961,232 ÷ 236,015 shares) | $33.73 | |||||||||||||||||
| Class R3 ($1,561,699 ÷ 46,309 shares) | $33.72 | |||||||||||||||||
| Class R4 ($75,270 ÷ 2,224 shares) | $33.84 | |||||||||||||||||
| Class R5 ($72,262 ÷ 2,133 shares) | $33.88 | |||||||||||||||||
| Class R6 ($352,638,922 ÷ 10,406,161 shares) | $33.89 | |||||||||||||||||
| Maximum offering price per share | ||||||||||||||||||
| Class A (net asset value per share ÷ 95%)2 | $35.57 | |||||||||||||||||
| 1 | Redemption price per share is equal to net asset value less any applicable contingent deferred sales charge. | ||||||||||||||||
| 2 | On single retail sales of less than $50,000. On sales of $50,000 or more and on group sales the offering price is reduced. | ||||||||||||||||
STATEMENT OF OPERATIONS For the six months ended 4-30-18 (unaudited)
| Investment income | ||||||||||||||||||||||||
| Dividends | $30,037,125 | |||||||||||||||||||||||
| Interest | 219,669 | |||||||||||||||||||||||
| Securities lending | 9,646 | |||||||||||||||||||||||
| Less foreign taxes withheld | (259,899 | ) | ||||||||||||||||||||||
| Total investment income | 30,006,541 | |||||||||||||||||||||||
| Expenses | ||||||||||||||||||||||||
| Investment management fees | 8,707,491 | |||||||||||||||||||||||
| Distribution and service fees | 889,851 | |||||||||||||||||||||||
| Accounting and legal services fees | 256,714 | |||||||||||||||||||||||
| Transfer agent fees | 1,107,117 | |||||||||||||||||||||||
| Trustees' fees | 18,748 | |||||||||||||||||||||||
| State registration fees | 124,833 | |||||||||||||||||||||||
| Printing and postage | 107,993 | |||||||||||||||||||||||
| Professional fees | 38,749 | |||||||||||||||||||||||
| Custodian fees | 127,771 | |||||||||||||||||||||||
| Other | 23,410 | |||||||||||||||||||||||
| Total expenses | 11,402,677 | |||||||||||||||||||||||
| Less expense reductions | (99,255 | ) | ||||||||||||||||||||||
| Net expenses | 11,303,422 | |||||||||||||||||||||||
| Net investment income | 18,703,119 | |||||||||||||||||||||||
| Realized and unrealized gain (loss) | ||||||||||||||||||||||||
| Net realized gain (loss) on | ||||||||||||||||||||||||
| Unaffiliated investments and foreign currency transactions | 49,745,121 | |||||||||||||||||||||||
| Affiliated investments | (1,442 | ) | ||||||||||||||||||||||
| 49,743,679 | ||||||||||||||||||||||||
| Change in net unrealized appreciation (depreciation) of | ||||||||||||||||||||||||
| Unaffiliated investments | 59,026,403 | |||||||||||||||||||||||
| Affiliated investments | 91 | |||||||||||||||||||||||
| 59,026,494 | ||||||||||||||||||||||||
| Net realized and unrealized gain | 108,770,173 | |||||||||||||||||||||||
| Increase in net assets from operations | $127,473,292 | |||||||||||||||||||||||
STATEMENTS OF CHANGES IN NET ASSETS
| Six months ended 4-30-18 | Year ended 10-31-17 | ||||||||||||||||||||||||||||||||||||||||||||
| (unaudited) | |||||||||||||||||||||||||||||||||||||||||||||
| Increase (decrease) in net assets | |||||||||||||||||||||||||||||||||||||||||||||
| From operations | |||||||||||||||||||||||||||||||||||||||||||||
| Net investment income | $18,703,119 | $24,683,648 | |||||||||||||||||||||||||||||||||||||||||||
| Net realized gain | 49,743,679 | 268,089,327 | |||||||||||||||||||||||||||||||||||||||||||
| Change in net unrealized appreciation (depreciation) | 59,026,494 | 126,279,672 | |||||||||||||||||||||||||||||||||||||||||||
| Increase in net assets resulting from operations | 127,473,292 | 419,052,647 | |||||||||||||||||||||||||||||||||||||||||||
| Distributions to shareholders | |||||||||||||||||||||||||||||||||||||||||||||
| From net investment income | |||||||||||||||||||||||||||||||||||||||||||||
| Class A | (3,493,763 | ) | (6,123,008 | ) | |||||||||||||||||||||||||||||||||||||||||
| Class B | (11,751 | ) | (69,061 | ) | |||||||||||||||||||||||||||||||||||||||||
| Class C | (213,388 | ) | (1,011,833 | ) | |||||||||||||||||||||||||||||||||||||||||
| Class I | (17,742,840 | ) | (25,583,802 | ) | |||||||||||||||||||||||||||||||||||||||||
| Class R1 | (22,029 | ) | (47,697 | ) | |||||||||||||||||||||||||||||||||||||||||
| Class R2 | (60,489 | ) | (15,242 | ) | |||||||||||||||||||||||||||||||||||||||||
| Class R3 | (9,760 | ) | (16,786 | ) | |||||||||||||||||||||||||||||||||||||||||
| Class R4 | (870 | ) | (1,277 | ) | |||||||||||||||||||||||||||||||||||||||||
| Class R5 | (869 | ) | (1,025 | ) | |||||||||||||||||||||||||||||||||||||||||
| Class R6 | (4,515,692 | ) | (64,570 | ) | |||||||||||||||||||||||||||||||||||||||||
| Total distributions | (26,071,451 | ) | (32,934,301 | ) | |||||||||||||||||||||||||||||||||||||||||
| From fund share transactions | 65,593,252 | 285,906,812 | |||||||||||||||||||||||||||||||||||||||||||
| Total increase | 166,995,093 | 672,025,158 | |||||||||||||||||||||||||||||||||||||||||||
| Net assets | |||||||||||||||||||||||||||||||||||||||||||||
| Beginning of period | 2,214,539,584 | 1,542,514,426 | |||||||||||||||||||||||||||||||||||||||||||
| End of period | $2,381,534,677 | $2,214,539,584 | |||||||||||||||||||||||||||||||||||||||||||
| Undistributed net investment income | $12,028,672 | $19,397,004 | |||||||||||||||||||||||||||||||||||||||||||
Financial highlights
| Class A Shares Period ended | 4-30-18 | 1 | 10-31-17 | 10-31-16 | 10-31-15 | 10-31-14 | 10-31-13 | |||||||||||||||||||||||||||||||||||||||||||||||||||||||||||||||||||||||||||||||||||||||||||||||||||||||||||||||
| Per share operating performance | ||||||||||||||||||||||||||||||||||||||||||||||||||||||||||||||||||||||||||||||||||||||||||||||||||||||||||||||||||||||
| Net asset value, beginning of period | $32.32 | $26.12 | $25.49 | $25.82 | $23.12 | $17.02 | ||||||||||||||||||||||||||||||||||||||||||||||||||||||||||||||||||||||||||||||||||||||||||||||||||||||||||||||||
| Net investment income2 | 0.24 | 0.34 | 0.43 | 0.28 | 0.18 | 0.20 | ||||||||||||||||||||||||||||||||||||||||||||||||||||||||||||||||||||||||||||||||||||||||||||||||||||||||||||||||
| Net realized and unrealized gain (loss) on investments | 1.55 | 6.38 | 0.54 | (0.39 | ) | 2.72 | 6.09 | |||||||||||||||||||||||||||||||||||||||||||||||||||||||||||||||||||||||||||||||||||||||||||||||||||||||||||||||
| Total from investment operations | 1.79 | 6.72 | 0.97 | (0.11 | ) | 2.90 | 6.29 | |||||||||||||||||||||||||||||||||||||||||||||||||||||||||||||||||||||||||||||||||||||||||||||||||||||||||||||||
| Less distributions | ||||||||||||||||||||||||||||||||||||||||||||||||||||||||||||||||||||||||||||||||||||||||||||||||||||||||||||||||||||||
| From net investment income | (0.32 | ) | (0.52 | ) | (0.34 | ) | (0.22 | ) | (0.20 | ) | (0.19 | ) | ||||||||||||||||||||||||||||||||||||||||||||||||||||||||||||||||||||||||||||||||||||||||||||||||||||||||||
| Net asset value, end of period | $33.79 | $32.32 | $26.12 | $25.49 | $25.82 | $23.12 | ||||||||||||||||||||||||||||||||||||||||||||||||||||||||||||||||||||||||||||||||||||||||||||||||||||||||||||||||
| Total return (%)3,4 | 5.56 | 5 | 25.91 | 3.90 | (0.42 | ) | 12.64 | 37.32 | ||||||||||||||||||||||||||||||||||||||||||||||||||||||||||||||||||||||||||||||||||||||||||||||||||||||||||||||
| Ratios and supplemental data | ||||||||||||||||||||||||||||||||||||||||||||||||||||||||||||||||||||||||||||||||||||||||||||||||||||||||||||||||||||||
| Net assets, end of period (in millions) | $357 | $354 | $308 | $351 | $384 | $476 | ||||||||||||||||||||||||||||||||||||||||||||||||||||||||||||||||||||||||||||||||||||||||||||||||||||||||||||||||
| Ratios (as a percentage of average net assets): | ||||||||||||||||||||||||||||||||||||||||||||||||||||||||||||||||||||||||||||||||||||||||||||||||||||||||||||||||||||||
| Expenses before reductions | 1.17 | 6 | 1.18 | 1.19 | 1.19 | 1.19 | 1.25 | |||||||||||||||||||||||||||||||||||||||||||||||||||||||||||||||||||||||||||||||||||||||||||||||||||||||||||||||
| Expenses including reductions | 1.16 | 6 | 1.17 | 1.18 | 1.18 | 1.18 | 1.25 | |||||||||||||||||||||||||||||||||||||||||||||||||||||||||||||||||||||||||||||||||||||||||||||||||||||||||||||||
| Net investment income | 1.42 | 6 | 1.12 | 1.76 | 1.07 | 0.73 | 1.00 | |||||||||||||||||||||||||||||||||||||||||||||||||||||||||||||||||||||||||||||||||||||||||||||||||||||||||||||||
| Portfolio turnover (%) | 12 | 45 | 21 | 17 | 24 | 30 | ||||||||||||||||||||||||||||||||||||||||||||||||||||||||||||||||||||||||||||||||||||||||||||||||||||||||||||||||
| 1 | Six months ended 4-30-18. Unaudited. | ||||||||||||||||||||||||||||||||||||||||||||||||||||||||||||||||||||||||||||||||||
| 2 | Based on average daily shares outstanding. | ||||||||||||||||||||||||||||||||||||||||||||||||||||||||||||||||||||||||||||||||||
| 3 | Does not reflect the effect of sales charges, if any. | ||||||||||||||||||||||||||||||||||||||||||||||||||||||||||||||||||||||||||||||||||
| 4 | Total returns would have been lower had certain expenses not been reduced during the applicable periods. | ||||||||||||||||||||||||||||||||||||||||||||||||||||||||||||||||||||||||||||||||||
| 5 | Not annualized. | ||||||||||||||||||||||||||||||||||||||||||||||||||||||||||||||||||||||||||||||||||
| 6 | Annualized. | ||||||||||||||||||||||||||||||||||||||||||||||||||||||||||||||||||||||||||||||||||
| Class B Shares Period ended | 4-30-18 | 1 | 10-31-17 | 10-31-16 | 10-31-15 | 10-31-14 | 10-31-13 | |||||||||||||||||||||||||||||||||||||||||||||||||||||||||||||||||||||||||||||||||||||||||||||||||||||||||||||||
| Per share operating performance | ||||||||||||||||||||||||||||||||||||||||||||||||||||||||||||||||||||||||||||||||||||||||||||||||||||||||||||||||||||||
| Net asset value, beginning of period | $31.70 | $25.66 | $25.04 | $25.37 | $22.72 | $16.73 | ||||||||||||||||||||||||||||||||||||||||||||||||||||||||||||||||||||||||||||||||||||||||||||||||||||||||||||||||
| Net investment income2 | 0.11 | 0.12 | 0.25 | 0.08 | — | 3 | 0.07 | |||||||||||||||||||||||||||||||||||||||||||||||||||||||||||||||||||||||||||||||||||||||||||||||||||||||||||||||
| Net realized and unrealized gain (loss) on investments | 1.54 | 6.26 | 0.52 | (0.38 | ) | 2.68 | 5.98 | |||||||||||||||||||||||||||||||||||||||||||||||||||||||||||||||||||||||||||||||||||||||||||||||||||||||||||||||
| Total from investment operations | 1.65 | 6.38 | 0.77 | (0.30 | ) | 2.68 | 6.05 | |||||||||||||||||||||||||||||||||||||||||||||||||||||||||||||||||||||||||||||||||||||||||||||||||||||||||||||||
| Less distributions | ||||||||||||||||||||||||||||||||||||||||||||||||||||||||||||||||||||||||||||||||||||||||||||||||||||||||||||||||||||||
| From net investment income | (0.09 | ) | (0.34 | ) | (0.15 | ) | (0.03 | ) | (0.03 | ) | (0.06 | ) | ||||||||||||||||||||||||||||||||||||||||||||||||||||||||||||||||||||||||||||||||||||||||||||||||||||||||||
| Net asset value, end of period | $33.26 | $31.70 | $25.66 | $25.04 | $25.37 | $22.72 | ||||||||||||||||||||||||||||||||||||||||||||||||||||||||||||||||||||||||||||||||||||||||||||||||||||||||||||||||
| Total return (%)4,5 | 5.21 | 6 | 24.96 | 3.10 | (1.18 | ) | 11.79 | 36.30 | ||||||||||||||||||||||||||||||||||||||||||||||||||||||||||||||||||||||||||||||||||||||||||||||||||||||||||||||
| Ratios and supplemental data | ||||||||||||||||||||||||||||||||||||||||||||||||||||||||||||||||||||||||||||||||||||||||||||||||||||||||||||||||||||||
| Net assets, end of period (in millions) | $4 | $4 | $6 | $8 | $11 | $18 | ||||||||||||||||||||||||||||||||||||||||||||||||||||||||||||||||||||||||||||||||||||||||||||||||||||||||||||||||
| Ratios (as a percentage of average net assets): | ||||||||||||||||||||||||||||||||||||||||||||||||||||||||||||||||||||||||||||||||||||||||||||||||||||||||||||||||||||||
| Expenses before reductions | 1.92 | 7 | 1.93 | 1.94 | 1.93 | 1.94 | 2.00 | |||||||||||||||||||||||||||||||||||||||||||||||||||||||||||||||||||||||||||||||||||||||||||||||||||||||||||||||
| Expenses including reductions | 1.91 | 7 | 1.92 | 1.93 | 1.93 | 1.93 | 2.00 | |||||||||||||||||||||||||||||||||||||||||||||||||||||||||||||||||||||||||||||||||||||||||||||||||||||||||||||||
| Net investment income | 0.67 | 7 | 0.40 | 1.03 | 0.32 | 0.01 | 0.34 | |||||||||||||||||||||||||||||||||||||||||||||||||||||||||||||||||||||||||||||||||||||||||||||||||||||||||||||||
| Portfolio turnover (%) | 12 | 45 | 21 | 17 | 24 | 30 | ||||||||||||||||||||||||||||||||||||||||||||||||||||||||||||||||||||||||||||||||||||||||||||||||||||||||||||||||
| 1 | Six months ended 4-30-18. Unaudited. | ||||||||||||||||||||||||||||||||||||||||||||||||||||||||||||||||||||||||||||||||||
| 2 | Based on average daily shares outstanding. | ||||||||||||||||||||||||||||||||||||||||||||||||||||||||||||||||||||||||||||||||||
| 3 | Less than $0.005 per share. | ||||||||||||||||||||||||||||||||||||||||||||||||||||||||||||||||||||||||||||||||||
| 4 | Does not reflect the effect of sales charges, if any. | ||||||||||||||||||||||||||||||||||||||||||||||||||||||||||||||||||||||||||||||||||
| 5 | Total returns would have been lower had certain expenses not been reduced during the applicable periods. | ||||||||||||||||||||||||||||||||||||||||||||||||||||||||||||||||||||||||||||||||||
| 6 | Not annualized. | ||||||||||||||||||||||||||||||||||||||||||||||||||||||||||||||||||||||||||||||||||
| 7 | Annualized. | ||||||||||||||||||||||||||||||||||||||||||||||||||||||||||||||||||||||||||||||||||
| Class C Shares Period ended | 4-30-18 | 1 | 10-31-17 | 10-31-16 | 10-31-15 | 10-31-14 | 10-31-13 | |||||||||||||||||||||||||||||||||||||||||||||||||||||||||||||||||||||||||||||||||||||||||||||||||||||||||||||||
| Per share operating performance | ||||||||||||||||||||||||||||||||||||||||||||||||||||||||||||||||||||||||||||||||||||||||||||||||||||||||||||||||||||||
| Net asset value, beginning of period | $31.69 | $25.65 | $25.03 | $25.36 | $22.71 | $16.73 | ||||||||||||||||||||||||||||||||||||||||||||||||||||||||||||||||||||||||||||||||||||||||||||||||||||||||||||||||
| Net investment income (loss)2 | 0.11 | 0.11 | 0.24 | 0.08 | (0.01 | ) | 0.05 | |||||||||||||||||||||||||||||||||||||||||||||||||||||||||||||||||||||||||||||||||||||||||||||||||||||||||||||||
| Net realized and unrealized gain (loss) on investments | 1.54 | 6.27 | 0.53 | (0.38 | ) | 2.69 | 5.99 | |||||||||||||||||||||||||||||||||||||||||||||||||||||||||||||||||||||||||||||||||||||||||||||||||||||||||||||||
| Total from investment operations | 1.65 | 6.38 | 0.77 | (0.30 | ) | 2.68 | 6.04 | |||||||||||||||||||||||||||||||||||||||||||||||||||||||||||||||||||||||||||||||||||||||||||||||||||||||||||||||
| Less distributions | ||||||||||||||||||||||||||||||||||||||||||||||||||||||||||||||||||||||||||||||||||||||||||||||||||||||||||||||||||||||
| From net investment income | (0.09 | ) | (0.34 | ) | (0.15 | ) | (0.03 | ) | (0.03 | ) | (0.06 | ) | ||||||||||||||||||||||||||||||||||||||||||||||||||||||||||||||||||||||||||||||||||||||||||||||||||||||||||
| Net asset value, end of period | $33.25 | $31.69 | $25.65 | $25.03 | $25.36 | $22.71 | ||||||||||||||||||||||||||||||||||||||||||||||||||||||||||||||||||||||||||||||||||||||||||||||||||||||||||||||||
| Total return (%)3,4 | 5.21 | 5 | 24.96 | 3.11 | (1.18 | ) | 11.80 | 36.24 | ||||||||||||||||||||||||||||||||||||||||||||||||||||||||||||||||||||||||||||||||||||||||||||||||||||||||||||||
| Ratios and supplemental data | ||||||||||||||||||||||||||||||||||||||||||||||||||||||||||||||||||||||||||||||||||||||||||||||||||||||||||||||||||||||
| Net assets, end of period (in millions) | $74 | $75 | $76 | $88 | $101 | $95 | ||||||||||||||||||||||||||||||||||||||||||||||||||||||||||||||||||||||||||||||||||||||||||||||||||||||||||||||||
| Ratios (as a percentage of average net assets): | ||||||||||||||||||||||||||||||||||||||||||||||||||||||||||||||||||||||||||||||||||||||||||||||||||||||||||||||||||||||
| Expenses before reductions | 1.92 | 6 | 1.93 | 1.94 | 1.94 | 1.94 | 2.00 | |||||||||||||||||||||||||||||||||||||||||||||||||||||||||||||||||||||||||||||||||||||||||||||||||||||||||||||||
| Expenses including reductions | 1.91 | 6 | 1.92 | 1.93 | 1.93 | 1.93 | 2.00 | |||||||||||||||||||||||||||||||||||||||||||||||||||||||||||||||||||||||||||||||||||||||||||||||||||||||||||||||
| Net investment income (loss) | 0.67 | 6 | 0.38 | 1.01 | 0.32 | (0.04 | ) | 0.25 | ||||||||||||||||||||||||||||||||||||||||||||||||||||||||||||||||||||||||||||||||||||||||||||||||||||||||||||||
| Portfolio turnover (%) | 12 | 45 | 21 | 17 | 24 | 30 | ||||||||||||||||||||||||||||||||||||||||||||||||||||||||||||||||||||||||||||||||||||||||||||||||||||||||||||||||
| 1 | Six months ended 4-30-18. Unaudited. | ||||||||||||||||||||||||||||||||||||||||||||||||||||||||||||||||||||||||||||||||||
| 2 | Based on average daily shares outstanding. | ||||||||||||||||||||||||||||||||||||||||||||||||||||||||||||||||||||||||||||||||||
| 3 | Does not reflect the effect of sales charges, if any. | ||||||||||||||||||||||||||||||||||||||||||||||||||||||||||||||||||||||||||||||||||
| 4 | Total returns would have been lower had certain expenses not been reduced during the applicable periods. | ||||||||||||||||||||||||||||||||||||||||||||||||||||||||||||||||||||||||||||||||||
| 5 | Not annualized. | ||||||||||||||||||||||||||||||||||||||||||||||||||||||||||||||||||||||||||||||||||
| 6 | Annualized. | ||||||||||||||||||||||||||||||||||||||||||||||||||||||||||||||||||||||||||||||||||
| Class I Shares Period ended | 4-30-18 | 1 | 10-31-17 | 10-31-16 | 10-31-15 | 10-31-14 | 10-31-13 | |||||||||||||||||||||||||||||||||||||||||||||||||||||||||||||||||||||||||||||||||||||||||||||||||||||||||||||||
| Per share operating performance | ||||||||||||||||||||||||||||||||||||||||||||||||||||||||||||||||||||||||||||||||||||||||||||||||||||||||||||||||||||||
| Net asset value, beginning of period | $32.42 | $26.19 | $25.56 | $25.90 | $23.19 | $17.07 | ||||||||||||||||||||||||||||||||||||||||||||||||||||||||||||||||||||||||||||||||||||||||||||||||||||||||||||||||
| Net investment income2 | 0.28 | 0.41 | 0.51 | 0.35 | 0.24 | 0.25 | ||||||||||||||||||||||||||||||||||||||||||||||||||||||||||||||||||||||||||||||||||||||||||||||||||||||||||||||||
| Net realized and unrealized gain (loss) on investments | 1.56 | 6.41 | 0.53 | (0.40 | ) | 2.74 | 6.11 | |||||||||||||||||||||||||||||||||||||||||||||||||||||||||||||||||||||||||||||||||||||||||||||||||||||||||||||||
| Total from investment operations | 1.84 | 6.82 | 1.04 | (0.05 | ) | 2.98 | 6.36 | |||||||||||||||||||||||||||||||||||||||||||||||||||||||||||||||||||||||||||||||||||||||||||||||||||||||||||||||
| Less distributions | ||||||||||||||||||||||||||||||||||||||||||||||||||||||||||||||||||||||||||||||||||||||||||||||||||||||||||||||||||||||
| From net investment income | (0.40 | ) | (0.59 | ) | (0.41 | ) | (0.29 | ) | (0.27 | ) | (0.24 | ) | ||||||||||||||||||||||||||||||||||||||||||||||||||||||||||||||||||||||||||||||||||||||||||||||||||||||||||
| Net asset value, end of period | $33.86 | $32.42 | $26.19 | $25.56 | $25.90 | $23.19 | ||||||||||||||||||||||||||||||||||||||||||||||||||||||||||||||||||||||||||||||||||||||||||||||||||||||||||||||||
| Total return (%)3 | 5.70 | 4 | 26.24 | 4.18 | (0.19 | ) | 12.95 | 37.76 | ||||||||||||||||||||||||||||||||||||||||||||||||||||||||||||||||||||||||||||||||||||||||||||||||||||||||||||||
| Ratios and supplemental data | ||||||||||||||||||||||||||||||||||||||||||||||||||||||||||||||||||||||||||||||||||||||||||||||||||||||||||||||||||||||
| Net assets, end of period (in millions) | $1,581 | $1,767 | $1,146 | $1,591 | $2,355 | $2,018 | ||||||||||||||||||||||||||||||||||||||||||||||||||||||||||||||||||||||||||||||||||||||||||||||||||||||||||||||||
| Ratios (as a percentage of average net assets): | ||||||||||||||||||||||||||||||||||||||||||||||||||||||||||||||||||||||||||||||||||||||||||||||||||||||||||||||||||||||
| Expenses before reductions | 0.92 | 5 | 0.92 | 0.93 | 0.92 | 0.93 | 0.94 | |||||||||||||||||||||||||||||||||||||||||||||||||||||||||||||||||||||||||||||||||||||||||||||||||||||||||||||||
| Expenses including reductions | 0.91 | 5 | 0.91 | 0.92 | 0.91 | 0.92 | 0.94 | |||||||||||||||||||||||||||||||||||||||||||||||||||||||||||||||||||||||||||||||||||||||||||||||||||||||||||||||
| Net investment income | 1.68 | 5 | 1.35 | 2.07 | 1.34 | 0.97 | 1.24 | |||||||||||||||||||||||||||||||||||||||||||||||||||||||||||||||||||||||||||||||||||||||||||||||||||||||||||||||
| Portfolio turnover (%) | 12 | 45 | 21 | 17 | 24 | 30 | ||||||||||||||||||||||||||||||||||||||||||||||||||||||||||||||||||||||||||||||||||||||||||||||||||||||||||||||||
| 1 | Six months ended 4-30-18. Unaudited. | ||||||||||||||||||||||||||||||||||||||||||||||||||||||||||||||||||||||||||||||||||
| 2 | Based on average daily shares outstanding. | ||||||||||||||||||||||||||||||||||||||||||||||||||||||||||||||||||||||||||||||||||
| 3 | Total returns would have been lower had certain expenses not been reduced during the applicable periods. | ||||||||||||||||||||||||||||||||||||||||||||||||||||||||||||||||||||||||||||||||||
| 4 | Not annualized. | ||||||||||||||||||||||||||||||||||||||||||||||||||||||||||||||||||||||||||||||||||
| 5 | Annualized. | ||||||||||||||||||||||||||||||||||||||||||||||||||||||||||||||||||||||||||||||||||
| Class R1 Shares Period ended | 4-30-18 | 1 | 10-31-17 | 10-31-16 | 10-31-15 | 10-31-14 | 10-31-13 | |||||||||||||||||||||||||||||||||||||||||||||||||||||||||||||||||||||||||||||||||||||||||||||||||||||||||||||||
| Per share operating performance | ||||||||||||||||||||||||||||||||||||||||||||||||||||||||||||||||||||||||||||||||||||||||||||||||||||||||||||||||||||||
| Net asset value, beginning of period | $32.31 | $26.13 | $25.49 | $25.83 | $23.13 | $17.03 | ||||||||||||||||||||||||||||||||||||||||||||||||||||||||||||||||||||||||||||||||||||||||||||||||||||||||||||||||
| Net investment income2 | 0.17 | 0.21 | 0.34 | 0.17 | 0.08 | 0.13 | ||||||||||||||||||||||||||||||||||||||||||||||||||||||||||||||||||||||||||||||||||||||||||||||||||||||||||||||||
| Net realized and unrealized gain (loss) on investments | 1.56 | 6.40 | 0.55 | (0.38 | ) | 2.73 | 6.10 | |||||||||||||||||||||||||||||||||||||||||||||||||||||||||||||||||||||||||||||||||||||||||||||||||||||||||||||||
| Total from investment operations | 1.73 | 6.61 | 0.89 | (0.21 | ) | 2.81 | 6.23 | |||||||||||||||||||||||||||||||||||||||||||||||||||||||||||||||||||||||||||||||||||||||||||||||||||||||||||||||
| Less distributions | ||||||||||||||||||||||||||||||||||||||||||||||||||||||||||||||||||||||||||||||||||||||||||||||||||||||||||||||||||||||
| From net investment income | (0.20 | ) | (0.43 | ) | (0.25 | ) | (0.13 | ) | (0.11 | ) | (0.13 | ) | ||||||||||||||||||||||||||||||||||||||||||||||||||||||||||||||||||||||||||||||||||||||||||||||||||||||||||
| Net asset value, end of period | $33.84 | $32.31 | $26.13 | $25.49 | $25.83 | $23.13 | ||||||||||||||||||||||||||||||||||||||||||||||||||||||||||||||||||||||||||||||||||||||||||||||||||||||||||||||||
| Total return (%)3 | 5.37 | 4 | 25.43 | 3.53 | (0.82 | ) | 12.21 | 36.84 | ||||||||||||||||||||||||||||||||||||||||||||||||||||||||||||||||||||||||||||||||||||||||||||||||||||||||||||||
| Ratios and supplemental data | ||||||||||||||||||||||||||||||||||||||||||||||||||||||||||||||||||||||||||||||||||||||||||||||||||||||||||||||||||||||
| Net assets, end of period (in millions) | $4 | $4 | $3 | $3 | $7 | $6 | ||||||||||||||||||||||||||||||||||||||||||||||||||||||||||||||||||||||||||||||||||||||||||||||||||||||||||||||||
| Ratios (as a percentage of average net assets): | ||||||||||||||||||||||||||||||||||||||||||||||||||||||||||||||||||||||||||||||||||||||||||||||||||||||||||||||||||||||
| Expenses before reductions | 1.57 | 5 | 1.57 | 1.55 | 1.57 | 1.57 | 1.60 | |||||||||||||||||||||||||||||||||||||||||||||||||||||||||||||||||||||||||||||||||||||||||||||||||||||||||||||||
| Expenses including reductions | 1.56 | 5 | 1.56 | 1.55 | 1.57 | 1.57 | 1.60 | |||||||||||||||||||||||||||||||||||||||||||||||||||||||||||||||||||||||||||||||||||||||||||||||||||||||||||||||
| Net investment income | 1.04 | 5 | 0.71 | 1.40 | 0.64 | 0.32 | 0.63 | |||||||||||||||||||||||||||||||||||||||||||||||||||||||||||||||||||||||||||||||||||||||||||||||||||||||||||||||
| Portfolio turnover (%) | 12 | 45 | 21 | 17 | 24 | 30 | ||||||||||||||||||||||||||||||||||||||||||||||||||||||||||||||||||||||||||||||||||||||||||||||||||||||||||||||||
| 1 | Six months ended 4-30-18. Unaudited. | ||||||||||||||||||||||||||||||||||||||||||||||||||||||||||||||||||||||||||||||||||
| 2 | Based on average daily shares outstanding. | ||||||||||||||||||||||||||||||||||||||||||||||||||||||||||||||||||||||||||||||||||
| 3 | Total returns would have been lower had certain expenses not been reduced during the applicable periods. | ||||||||||||||||||||||||||||||||||||||||||||||||||||||||||||||||||||||||||||||||||
| 4 | Not annualized. | ||||||||||||||||||||||||||||||||||||||||||||||||||||||||||||||||||||||||||||||||||
| 5 | Annualized. | ||||||||||||||||||||||||||||||||||||||||||||||||||||||||||||||||||||||||||||||||||
| Class R2 Shares Period ended | 4-30-18 | 1 | 10-31-17 | 10-31-16 | 10-31-15 | 10-31-14 | 10-31-13 | |||||||||||||||||||||||||||||||||||||||||||||||||||||||||||||||||||||||||||||||||||||||||||||||||||||||||||||||
| Per share operating performance | ||||||||||||||||||||||||||||||||||||||||||||||||||||||||||||||||||||||||||||||||||||||||||||||||||||||||||||||||||||||
| Net asset value, beginning of period | $32.24 | $26.07 | $25.46 | $25.85 | $23.16 | $17.05 | ||||||||||||||||||||||||||||||||||||||||||||||||||||||||||||||||||||||||||||||||||||||||||||||||||||||||||||||||
| Net investment income2 | 0.22 | 0.25 | 0.36 | 0.26 | 0.17 | 0.18 | ||||||||||||||||||||||||||||||||||||||||||||||||||||||||||||||||||||||||||||||||||||||||||||||||||||||||||||||||
| Net realized and unrealized gain (loss) on investments | 1.55 | 6.41 | 0.58 | (0.41 | ) | 2.75 | 6.15 | |||||||||||||||||||||||||||||||||||||||||||||||||||||||||||||||||||||||||||||||||||||||||||||||||||||||||||||||
| Total from investment operations | 1.77 | 6.66 | 0.94 | (0.15 | ) | 2.92 | 6.33 | |||||||||||||||||||||||||||||||||||||||||||||||||||||||||||||||||||||||||||||||||||||||||||||||||||||||||||||||
| Less distributions | ||||||||||||||||||||||||||||||||||||||||||||||||||||||||||||||||||||||||||||||||||||||||||||||||||||||||||||||||||||||
| From net investment income | (0.28 | ) | (0.49 | ) | (0.33 | ) | (0.24 | ) | (0.23 | ) | (0.22 | ) | ||||||||||||||||||||||||||||||||||||||||||||||||||||||||||||||||||||||||||||||||||||||||||||||||||||||||||
| Net asset value, end of period | $33.73 | $32.24 | $26.07 | $25.46 | $25.85 | $23.16 | ||||||||||||||||||||||||||||||||||||||||||||||||||||||||||||||||||||||||||||||||||||||||||||||||||||||||||||||||
| Total return (%)3 | 5.50 | 4 | 25.71 | 3.76 | (0.56 | ) | 12.70 | 37.53 | ||||||||||||||||||||||||||||||||||||||||||||||||||||||||||||||||||||||||||||||||||||||||||||||||||||||||||||||
| Ratios and supplemental data | ||||||||||||||||||||||||||||||||||||||||||||||||||||||||||||||||||||||||||||||||||||||||||||||||||||||||||||||||||||||
| Net assets, end of period (in millions) | $8 | $7 | $1 | — | 5 | — | 5 | — | 5 | |||||||||||||||||||||||||||||||||||||||||||||||||||||||||||||||||||||||||||||||||||||||||||||||||||||||||||||
| Ratios (as a percentage of average net assets): | ||||||||||||||||||||||||||||||||||||||||||||||||||||||||||||||||||||||||||||||||||||||||||||||||||||||||||||||||||||||
| Expenses before reductions | 1.32 | 6 | 1.33 | 1.33 | 1.26 | 1.19 | 1.13 | |||||||||||||||||||||||||||||||||||||||||||||||||||||||||||||||||||||||||||||||||||||||||||||||||||||||||||||||
| Expenses including reductions | 1.31 | 6 | 1.32 | 1.32 | 1.26 | 1.18 | 1.13 | |||||||||||||||||||||||||||||||||||||||||||||||||||||||||||||||||||||||||||||||||||||||||||||||||||||||||||||||
| Net investment income | 1.29 | 6 | 0.84 | 1.47 | 0.99 | 0.68 | 0.86 | |||||||||||||||||||||||||||||||||||||||||||||||||||||||||||||||||||||||||||||||||||||||||||||||||||||||||||||||
| Portfolio turnover (%) | 12 | 45 | 21 | 17 | 24 | 30 | ||||||||||||||||||||||||||||||||||||||||||||||||||||||||||||||||||||||||||||||||||||||||||||||||||||||||||||||||
| 1 | Six months ended 4-30-18. Unaudited. | ||||||||||||||||||||||||||||||||||||||||||||||||||||||||||||||||||||||||||||||||||
| 2 | Based on average daily shares outstanding. | ||||||||||||||||||||||||||||||||||||||||||||||||||||||||||||||||||||||||||||||||||
| 3 | Total returns would have been lower had certain expenses not been reduced during the applicable periods. | ||||||||||||||||||||||||||||||||||||||||||||||||||||||||||||||||||||||||||||||||||
| 4 | Not annualized. | ||||||||||||||||||||||||||||||||||||||||||||||||||||||||||||||||||||||||||||||||||
| 5 | Less than $500,000. | ||||||||||||||||||||||||||||||||||||||||||||||||||||||||||||||||||||||||||||||||||
| 6 | Annualized. | ||||||||||||||||||||||||||||||||||||||||||||||||||||||||||||||||||||||||||||||||||
| Class R3 Shares Period ended | 4-30-18 | 10-31-17 | 10-31-16 | 10-31-15 | 10-31-14 | 10-31-13 | ||||||||||||||||||||||||||||||||||||||||||||||||||||||||||||||||||||||||||||||||||||||||||||||||||||||||||||||||
| Per share operating performance | ||||||||||||||||||||||||||||||||||||||||||||||||||||||||||||||||||||||||||||||||||||||||||||||||||||||||||||||||||||||
| Net asset value, beginning of period | $32.20 | $26.03 | $25.41 | $25.75 | $23.08 | $17.00 | ||||||||||||||||||||||||||||||||||||||||||||||||||||||||||||||||||||||||||||||||||||||||||||||||||||||||||||||||
| Net investment income2 | 0.20 | 0.24 | 0.36 | 0.20 | 0.09 | 0.14 | ||||||||||||||||||||||||||||||||||||||||||||||||||||||||||||||||||||||||||||||||||||||||||||||||||||||||||||||||
| Net realized and unrealized gain (loss) on investments | 1.55 | 6.38 | 0.53 | (0.39 | ) | 2.74 | 6.10 | |||||||||||||||||||||||||||||||||||||||||||||||||||||||||||||||||||||||||||||||||||||||||||||||||||||||||||||||
| Total from investment operations | 1.75 | 6.62 | 0.89 | (0.19 | ) | 2.83 | 6.24 | |||||||||||||||||||||||||||||||||||||||||||||||||||||||||||||||||||||||||||||||||||||||||||||||||||||||||||||||
| Less distributions | ||||||||||||||||||||||||||||||||||||||||||||||||||||||||||||||||||||||||||||||||||||||||||||||||||||||||||||||||||||||
| From net investment income | (0.23 | ) | (0.45 | ) | (0.27 | ) | (0.15 | ) | (0.16 | ) | (0.16 | ) | ||||||||||||||||||||||||||||||||||||||||||||||||||||||||||||||||||||||||||||||||||||||||||||||||||||||||||
| Net asset value, end of period | $33.72 | $32.20 | $26.03 | $25.41 | $25.75 | $23.08 | ||||||||||||||||||||||||||||||||||||||||||||||||||||||||||||||||||||||||||||||||||||||||||||||||||||||||||||||||
| Total return (%)3 | 5.45 | 4 | 25.58 | 3.57 | (0.73 | ) | 12.34 | 37.01 | ||||||||||||||||||||||||||||||||||||||||||||||||||||||||||||||||||||||||||||||||||||||||||||||||||||||||||||||
| Ratios and supplemental data | ||||||||||||||||||||||||||||||||||||||||||||||||||||||||||||||||||||||||||||||||||||||||||||||||||||||||||||||||||||||
| Net assets, end of period (in millions) | $2 | $1 | $1 | $1 | $1 | — | 5 | |||||||||||||||||||||||||||||||||||||||||||||||||||||||||||||||||||||||||||||||||||||||||||||||||||||||||||||||
| Ratios (as a percentage of average net assets): | ||||||||||||||||||||||||||||||||||||||||||||||||||||||||||||||||||||||||||||||||||||||||||||||||||||||||||||||||||||||
| Expenses before reductions | 1.39 | 6 | 1.47 | 1.48 | 1.48 | 1.47 | 1.42 | |||||||||||||||||||||||||||||||||||||||||||||||||||||||||||||||||||||||||||||||||||||||||||||||||||||||||||||||
| Expenses including reductions | 1.38 | 6 | 1.47 | 1.47 | 1.47 | 1.47 | 1.41 | |||||||||||||||||||||||||||||||||||||||||||||||||||||||||||||||||||||||||||||||||||||||||||||||||||||||||||||||
| Net investment income | 1.22 | 6 | 0.79 | 1.48 | 0.78 | 0.37 | 0.65 | |||||||||||||||||||||||||||||||||||||||||||||||||||||||||||||||||||||||||||||||||||||||||||||||||||||||||||||||
| Portfolio turnover (%) | 12 | 45 | 21 | 17 | 24 | 30 | ||||||||||||||||||||||||||||||||||||||||||||||||||||||||||||||||||||||||||||||||||||||||||||||||||||||||||||||||
| 1 | Six months ended 4-30-18. Unaudited. | ||||||||||||||||||||||||||||||||||||||||||||||||||||||||||||||||||||||||||||||||||
| 2 | Based on average daily shares outstanding. | ||||||||||||||||||||||||||||||||||||||||||||||||||||||||||||||||||||||||||||||||||
| 3 | Total returns would have been lower had certain expenses not been reduced during the applicable periods. | ||||||||||||||||||||||||||||||||||||||||||||||||||||||||||||||||||||||||||||||||||
| 4 | Not annualized. | ||||||||||||||||||||||||||||||||||||||||||||||||||||||||||||||||||||||||||||||||||
| 5 | Less than $500,000. | ||||||||||||||||||||||||||||||||||||||||||||||||||||||||||||||||||||||||||||||||||
| 6 | Annualized. | ||||||||||||||||||||||||||||||||||||||||||||||||||||||||||||||||||||||||||||||||||
| Class R4 Shares Period ended | 4-30-18 | 1 | 10-31-17 | 10-31-16 | 10-31-15 | 10-31-14 | 10-31-13 | |||||||||||||||||||||||||||||||||||||||||||||||||||||||||||||||||||||||||||||||||||||||||||||||||||||||||||||||
| Per share operating performance | ||||||||||||||||||||||||||||||||||||||||||||||||||||||||||||||||||||||||||||||||||||||||||||||||||||||||||||||||||||||
| Net asset value, beginning of period | $32.40 | $26.17 | $25.55 | $25.90 | $23.19 | $17.07 | ||||||||||||||||||||||||||||||||||||||||||||||||||||||||||||||||||||||||||||||||||||||||||||||||||||||||||||||||
| Net investment income2 | 0.27 | 0.40 | 0.48 | 0.34 | 0.23 | 0.25 | ||||||||||||||||||||||||||||||||||||||||||||||||||||||||||||||||||||||||||||||||||||||||||||||||||||||||||||||||
| Net realized and unrealized gain (loss) on investments | 1.56 | 6.40 | 0.54 | (0.41 | ) | 2.74 | 6.10 | |||||||||||||||||||||||||||||||||||||||||||||||||||||||||||||||||||||||||||||||||||||||||||||||||||||||||||||||
| Total from investment operations | 1.83 | 6.80 | 1.02 | (0.07 | ) | 2.97 | 6.35 | |||||||||||||||||||||||||||||||||||||||||||||||||||||||||||||||||||||||||||||||||||||||||||||||||||||||||||||||
| Less distributions | ||||||||||||||||||||||||||||||||||||||||||||||||||||||||||||||||||||||||||||||||||||||||||||||||||||||||||||||||||||||
| From net investment income | (0.39 | ) | (0.57 | ) | (0.40 | ) | (0.28 | ) | (0.26 | ) | (0.23 | ) | ||||||||||||||||||||||||||||||||||||||||||||||||||||||||||||||||||||||||||||||||||||||||||||||||||||||||||
| Net asset value, end of period | $33.84 | $32.40 | $26.17 | $25.55 | $25.90 | $23.19 | ||||||||||||||||||||||||||||||||||||||||||||||||||||||||||||||||||||||||||||||||||||||||||||||||||||||||||||||||
| Total return (%)3 | 5.67 | 4 | 26.20 | 4.10 | (0.24 | ) | 12.92 | 37.66 | ||||||||||||||||||||||||||||||||||||||||||||||||||||||||||||||||||||||||||||||||||||||||||||||||||||||||||||||
| Ratios and supplemental data | ||||||||||||||||||||||||||||||||||||||||||||||||||||||||||||||||||||||||||||||||||||||||||||||||||||||||||||||||||||||
| Net assets, end of period (in millions) | — | 5 | — | 5 | — | 5 | — | 5 | — | 5 | — | 5 | ||||||||||||||||||||||||||||||||||||||||||||||||||||||||||||||||||||||||||||||||||||||||||||||||||||||||||
| Ratios (as a percentage of average net assets): | ||||||||||||||||||||||||||||||||||||||||||||||||||||||||||||||||||||||||||||||||||||||||||||||||||||||||||||||||||||||
| Expenses before reductions | 1.06 | 6 | 1.08 | 1.08 | 1.08 | 1.07 | 1.10 | |||||||||||||||||||||||||||||||||||||||||||||||||||||||||||||||||||||||||||||||||||||||||||||||||||||||||||||||
| Expenses including reductions | 0.96 | 6 | 0.97 | 0.97 | 0.97 | 0.96 | 1.00 | |||||||||||||||||||||||||||||||||||||||||||||||||||||||||||||||||||||||||||||||||||||||||||||||||||||||||||||||
| Net investment income | 1.62 | 6 | 1.31 | 1.96 | 1.28 | 0.93 | 1.23 | |||||||||||||||||||||||||||||||||||||||||||||||||||||||||||||||||||||||||||||||||||||||||||||||||||||||||||||||
| Portfolio turnover (%) | 12 | 45 | 21 | 17 | 24 | 30 | ||||||||||||||||||||||||||||||||||||||||||||||||||||||||||||||||||||||||||||||||||||||||||||||||||||||||||||||||
| 1 | Six months ended 4-30-18. Unaudited. | ||||||||||||||||||||||||||||||||||||||||||||||||||||||||||||||||||||||||||||||||||
| 2 | Based on average daily shares outstanding. | ||||||||||||||||||||||||||||||||||||||||||||||||||||||||||||||||||||||||||||||||||
| 3 | Total returns would have been lower had certain expenses not been reduced during the applicable periods. | ||||||||||||||||||||||||||||||||||||||||||||||||||||||||||||||||||||||||||||||||||
| 4 | Not annualized. | ||||||||||||||||||||||||||||||||||||||||||||||||||||||||||||||||||||||||||||||||||
| 5 | Less than $500,000. | ||||||||||||||||||||||||||||||||||||||||||||||||||||||||||||||||||||||||||||||||||
| 6 | Annualized. | ||||||||||||||||||||||||||||||||||||||||||||||||||||||||||||||||||||||||||||||||||
| Class R5 Shares Period ended | 4-30-18 | 1 | 10-31-17 | 10-31-16 | 10-31-15 | 10-31-14 | 10-31-13 | |||||||||||||||||||||||||||||||||||||||||||||||||||||||||||||||||||||||||||||||||||||||||||||||||||||||||||||||
| Per share operating performance | ||||||||||||||||||||||||||||||||||||||||||||||||||||||||||||||||||||||||||||||||||||||||||||||||||||||||||||||||||||||
| Net asset value, beginning of period | $32.44 | $26.21 | $25.57 | $25.92 | $23.22 | $17.09 | ||||||||||||||||||||||||||||||||||||||||||||||||||||||||||||||||||||||||||||||||||||||||||||||||||||||||||||||||
| Net investment income2 | 0.29 | 0.43 | 0.54 | 0.37 | 0.25 | 0.28 | ||||||||||||||||||||||||||||||||||||||||||||||||||||||||||||||||||||||||||||||||||||||||||||||||||||||||||||||||
| Net realized and unrealized gain (loss) on investments | 1.57 | 6.40 | 0.52 | (0.40 | ) | 2.74 | 6.11 | |||||||||||||||||||||||||||||||||||||||||||||||||||||||||||||||||||||||||||||||||||||||||||||||||||||||||||||||
| Total from investment operations | 1.86 | 6.83 | 1.06 | (0.03 | ) | 2.99 | 6.39 | |||||||||||||||||||||||||||||||||||||||||||||||||||||||||||||||||||||||||||||||||||||||||||||||||||||||||||||||
| Less distributions | ||||||||||||||||||||||||||||||||||||||||||||||||||||||||||||||||||||||||||||||||||||||||||||||||||||||||||||||||||||||
| From net investment income | (0.42 | ) | (0.60 | ) | (0.42 | ) | (0.32 | ) | (0.29 | ) | (0.26 | ) | ||||||||||||||||||||||||||||||||||||||||||||||||||||||||||||||||||||||||||||||||||||||||||||||||||||||||||
| Net asset value, end of period | $33.88 | $32.44 | $26.21 | $25.57 | $25.92 | $23.22 | ||||||||||||||||||||||||||||||||||||||||||||||||||||||||||||||||||||||||||||||||||||||||||||||||||||||||||||||||
| Total return (%)3 | 5.74 | 4 | 26.27 | 4.27 | (0.11 | ) | 13.02 | 37.87 | ||||||||||||||||||||||||||||||||||||||||||||||||||||||||||||||||||||||||||||||||||||||||||||||||||||||||||||||
| Ratios and supplemental data | ||||||||||||||||||||||||||||||||||||||||||||||||||||||||||||||||||||||||||||||||||||||||||||||||||||||||||||||||||||||
| Net assets, end of period (in millions) | — | 5 | — | 5 | — | 5 | — | 5 | — | 5 | — | 5 | ||||||||||||||||||||||||||||||||||||||||||||||||||||||||||||||||||||||||||||||||||||||||||||||||||||||||||
| Ratios (as a percentage of average net assets): | ||||||||||||||||||||||||||||||||||||||||||||||||||||||||||||||||||||||||||||||||||||||||||||||||||||||||||||||||||||||
| Expenses before reductions | 0.87 | 6 | 0.88 | 0.86 | 0.85 | 0.84 | 0.85 | |||||||||||||||||||||||||||||||||||||||||||||||||||||||||||||||||||||||||||||||||||||||||||||||||||||||||||||||
| Expenses including reductions | 0.86 | 6 | 0.87 | 0.86 | 0.84 | 0.83 | 0.85 | |||||||||||||||||||||||||||||||||||||||||||||||||||||||||||||||||||||||||||||||||||||||||||||||||||||||||||||||
| Net investment income | 1.73 | 6 | 1.40 | 2.22 | 1.40 | 1.03 | 1.37 | |||||||||||||||||||||||||||||||||||||||||||||||||||||||||||||||||||||||||||||||||||||||||||||||||||||||||||||||
| Portfolio turnover (%) | 12 | 45 | 21 | 17 | 24 | 30 | ||||||||||||||||||||||||||||||||||||||||||||||||||||||||||||||||||||||||||||||||||||||||||||||||||||||||||||||||
| 1 | Six months ended 4-30-18. Unaudited. | ||||||||||||||||||||||||||||||||||||||||||||||||||||||||||||||||||||||||||||||||||
| 2 | Based on average daily shares outstanding. | ||||||||||||||||||||||||||||||||||||||||||||||||||||||||||||||||||||||||||||||||||
| 3 | Total returns would have been lower had certain expenses not been reduced during the applicable periods. | ||||||||||||||||||||||||||||||||||||||||||||||||||||||||||||||||||||||||||||||||||
| 4 | Not annualized. | ||||||||||||||||||||||||||||||||||||||||||||||||||||||||||||||||||||||||||||||||||
| 5 | Less than $500,000. | ||||||||||||||||||||||||||||||||||||||||||||||||||||||||||||||||||||||||||||||||||
| 6 | Annualized. | ||||||||||||||||||||||||||||||||||||||||||||||||||||||||||||||||||||||||||||||||||
| Class R6 Shares Period ended | 4-30-18 | 1 | 10-31-17 | 10-31-16 | 10-31-15 | 10-31-14 | 10-31-13 | |||||||||||||||||||||||||||||||||||||||||||||||||||||||||||||||||||||||||||||||||||||||||||||||||||||||||||||||
| Per share operating performance | ||||||||||||||||||||||||||||||||||||||||||||||||||||||||||||||||||||||||||||||||||||||||||||||||||||||||||||||||||||||
| Net asset value, beginning of period | $32.46 | $26.21 | $25.59 | $25.94 | $23.21 | $17.09 | ||||||||||||||||||||||||||||||||||||||||||||||||||||||||||||||||||||||||||||||||||||||||||||||||||||||||||||||||
| Net investment income2 | 0.29 | 0.47 | 0.52 | 0.39 | 0.27 | 0.24 | ||||||||||||||||||||||||||||||||||||||||||||||||||||||||||||||||||||||||||||||||||||||||||||||||||||||||||||||||
| Net realized and unrealized gain (loss) on investments | 1.57 | 6.39 | 0.54 | (0.42 | ) | 2.74 | 6.13 | |||||||||||||||||||||||||||||||||||||||||||||||||||||||||||||||||||||||||||||||||||||||||||||||||||||||||||||||
| Total from investment operations | 1.86 | 6.86 | 1.06 | (0.03 | ) | 3.01 | 6.37 | |||||||||||||||||||||||||||||||||||||||||||||||||||||||||||||||||||||||||||||||||||||||||||||||||||||||||||||||
| Less distributions | ||||||||||||||||||||||||||||||||||||||||||||||||||||||||||||||||||||||||||||||||||||||||||||||||||||||||||||||||||||||
| From net investment income | (0.43 | ) | (0.61 | ) | (0.44 | ) | (0.32 | ) | (0.28 | ) | (0.25 | ) | ||||||||||||||||||||||||||||||||||||||||||||||||||||||||||||||||||||||||||||||||||||||||||||||||||||||||||
| Net asset value, end of period | $33.89 | $32.46 | $26.21 | $25.59 | $25.94 | $23.21 | ||||||||||||||||||||||||||||||||||||||||||||||||||||||||||||||||||||||||||||||||||||||||||||||||||||||||||||||||
| Total return (%)3 | 5.76 | 4 | 26.41 | 4.26 | (0.09 | ) | 13.11 | 37.80 | ||||||||||||||||||||||||||||||||||||||||||||||||||||||||||||||||||||||||||||||||||||||||||||||||||||||||||||||
| Ratios and supplemental data | ||||||||||||||||||||||||||||||||||||||||||||||||||||||||||||||||||||||||||||||||||||||||||||||||||||||||||||||||||||||
| Net assets, end of period (in millions) | $353 | $1 | $1 | $1 | $1 | $1 | ||||||||||||||||||||||||||||||||||||||||||||||||||||||||||||||||||||||||||||||||||||||||||||||||||||||||||||||||
| Ratios (as a percentage of average net assets): | ||||||||||||||||||||||||||||||||||||||||||||||||||||||||||||||||||||||||||||||||||||||||||||||||||||||||||||||||||||||
| Expenses before reductions | 0.82 | 5 | 0.83 | 0.83 | 0.83 | 0.83 | 0.85 | |||||||||||||||||||||||||||||||||||||||||||||||||||||||||||||||||||||||||||||||||||||||||||||||||||||||||||||||
| Expenses including reductions | 0.81 | 5 | 0.81 | 0.81 | 0.81 | 0.80 | 0.85 | |||||||||||||||||||||||||||||||||||||||||||||||||||||||||||||||||||||||||||||||||||||||||||||||||||||||||||||||
| Net investment income | 1.72 | 5 | 1.53 | 2.11 | 1.51 | 1.08 | 1.13 | |||||||||||||||||||||||||||||||||||||||||||||||||||||||||||||||||||||||||||||||||||||||||||||||||||||||||||||||
| Portfolio turnover (%) | 12 | 45 | 21 | 17 | 24 | 30 | ||||||||||||||||||||||||||||||||||||||||||||||||||||||||||||||||||||||||||||||||||||||||||||||||||||||||||||||||
| 1 | Six months ended 4-30-18. Unaudited. | ||||||||||||||||||||||||||||||||||||||||||||||||||||||||||||||||||||||||||||||||||
| 2 | Based on average daily shares outstanding. | ||||||||||||||||||||||||||||||||||||||||||||||||||||||||||||||||||||||||||||||||||
| 3 | Total returns would have been lower had certain expenses not been reduced during the applicable periods. | ||||||||||||||||||||||||||||||||||||||||||||||||||||||||||||||||||||||||||||||||||
| 4 | Not annualized. | ||||||||||||||||||||||||||||||||||||||||||||||||||||||||||||||||||||||||||||||||||
| 5 | Annualized. | ||||||||||||||||||||||||||||||||||||||||||||||||||||||||||||||||||||||||||||||||||
Note 1 — Organization
John Hancock Classic Value Fund (the fund) is a series of John Hancock Capital Series (the Trust), an open-end management investment company organized as a Massachusetts business trust and registered under the Investment Company Act of 1940, as amended (the 1940 Act). The investment objective of the fund is to seek long-term growth of capital.
The fund may offer multiple classes of shares. The shares currently offered by the fund are detailed in the Statement of assets and liabilities. Class A and Class C are offered to all investors. Class B shares are closed to new investors. Class I shares are offered to institutions and certain investors. Class R1, Class R2, Class R3, Class R4 and Class R5 shares are available only to certain retirement and 529 plans. Class R6 shares are only available to certain retirement plans, institutions and other investors. Class B shares convert to Class A shares eight years after purchase. Shareholders of each class have exclusive voting rights to matters that affect that class. The distribution and service fees, if any, and transfer agent fees for each class may differ. Effective May 1, 2018, Class C shares convert to Class A shares ten years after purchase (certain exclusions may apply).
Note 2 — Significant accounting policies
The financial statements have been prepared in conformity with accounting principles generally accepted in the United States of America (US GAAP), which require management to make certain estimates and assumptions as of the date of the financial statements. Actual results could differ from those estimates and those differences could be significant. The fund qualifies as an investment company under Topic 946 of Accounting Standards Codification of US GAAP.
Events or transactions occurring after the end of the fiscal period through the date that the financial statements were issued have been evaluated in the preparation of the financial statements. The following summarizes the significant accounting policies of the fund:
Security valuation. Investments are stated at value as of the scheduled close of regular trading on the New York Stock Exchange (NYSE), normally at 4:00 p.m., Eastern Time. In case of emergency or other disruption resulting in the NYSE not opening for trading or the NYSE closing at a time other than the regularly scheduled close, the net asset value (NAV) may be determined as of the regularly scheduled close of the NYSE pursuant to the fund's Valuation Policies and Procedures.
In order to value the securities, the fund uses the following valuation techniques: Equity securities held by the fund are typically valued at the last sale price or official closing price on the exchange or principal market where the security trades. In the event there were no sales during the day or closing prices are not available, the securities are valued using the last available bid price. Investments by the fund in open-end management investment funds, including John Hancock Collateral Trust (JHCT), are valued at their respective NAVs each business day. Debt obligations are valued based on the evaluated prices provided by an independent pricing vendor or from broker-dealers. Independent pricing vendors utilize matrix pricing which takes into account factors such as institutional-size trading in similar groups of securities, yield, quality, coupon rate, maturity, type of issue, trading characteristics and other market data, as well as broker supplied prices. Foreign securities and currencies are valued in U.S. dollars based on foreign currency exchange rates supplied by an independent pricing vendor.
In certain instances, the Pricing Committee may determine to value equity securities using prices obtained from another exchange or market if trading on the exchange or market on which prices are typically obtained did not open for trading as scheduled, or if trading closed earlier than scheduled, and trading occurred as normal on another exchange or market. Other portfolio securities and assets, for which reliable market quotations are not readily available, are valued at fair value as determined in good faith by the fund's Pricing Committee following procedures established by the Board of Trustees. The frequency with which these fair valuation procedures are used cannot be predicted and fair value of securities may differ significantly from the value that would have been used had a ready market for such securities existed.
The fund uses a three-tier hierarchy to prioritize the pricing assumptions, referred to as inputs, used in valuation techniques to measure fair value. Level 1 includes securities valued using quoted prices in active markets for identical securities. Level 2 includes securities valued using other significant observable inputs. Observable inputs may include quoted prices for similar securities, interest rates, prepayment speeds and credit risk. Prices for securities valued using these inputs are received from independent pricing vendors and brokers and are based on an evaluation of the inputs described. Level 3 includes securities valued using significant unobservable inputs when market prices are not readily available or reliable, including the fund's own assumptions in determining the fair value of investments. Factors used in determining value may include market or
issuer specific events or trends, changes in interest rates and credit quality. The inputs or methodology used for valuing securities are not necessarily an indication of the risks associated with investing in those securities. Changes in valuation techniques and related inputs may result in transfers into or out of an assigned level within the disclosure hierarchy.
As of April 30, 2018, all investments are categorized as Level 1 under the hierarchy described above, except the repurchase agreement, which is categorized as Level 2.
Repurchase agreements. The fund may enter into repurchase agreements. When the fund enters into a repurchase agreement, it receives collateral that is held in a segregated account by the fund's custodian. The collateral amount is marked-to-market and monitored on a daily basis to ensure that the collateral held is in an amount not less than the principal amount of the repurchase agreement plus any accrued interest. Collateral received by the fund for repurchase agreements is disclosed in the Fund's investments as part of the caption related to the repurchase agreement.
Repurchase agreements are typically governed by the terms and conditions of the Master Repurchase Agreement and/or Global Master Repurchase Agreement (collectively, MRA). Upon an event of default, the non-defaulting party may close out all transactions traded under the MRA and net amounts owed. Absent an event of default, assets and liabilities resulting from repurchase agreements are not offset in the Statement of assets and liabilities. In the event of a default by the counterparty, realization of the collateral proceeds could be delayed, during which time the collateral value may decline or the counterparty may have insufficient assets to pay back claims resulting from close-out of the transactions.
Security transactions and related investment income. Investment security transactions are accounted for on a trade date plus one basis for daily NAV calculations. However, for financial reporting purposes, investment transactions are reported on trade date. Interest income is accrued as earned. Dividend income is recorded on the ex-date, except for dividends of foreign securities where the dividend may not be known until after the ex-date. In those cases, dividend income, net of withholding taxes, is recorded when the fund becomes aware of the dividends. Gains and losses on securities sold are determined on the basis of identified cost and may include proceeds from litigation.
Securities lending. The fund may lend its securities to earn additional income. The fund receives cash collateral from the borrower in an amount not less than the market value of the loaned securities. The fund will invest its collateral in JHCT, an affiliate of the fund, which has a floating NAV and is registered with the Securities and Exchange Commission as an investment company. JHCT invests in short-term money market investments. The fund will receive the benefit of any gains and bear any losses generated by JHCT with respect to the cash collateral.
The fund has the right to recall loaned securities on demand. If a borrower fails to return loaned securities when due, then the lending agent is responsible and indemnifies the fund for the lent securities. The lending agent uses the collateral received from the borrower to purchase replacement securities of the same issue, type, class and series of the loaned securities. If the value of the collateral is less than the purchase cost of replacement securities, the lending agent is responsible for satisfying the shortfall but only to the extent that the shortfall is not due to any decrease in the value of JHCT.
Although the risk of the loss of the securities lent is mitigated by receiving collateral from the borrower and through lending agent indemnification, the fund could experience a delay in recovering securities or could experience a lower than expected return if the borrower fails to return the securities on a timely basis. The fund receives compensation for lending its securities by retaining a portion of the return on the investment of the collateral and compensation from fees earned from borrowers of the securities. Securities lending income received by the fund is net of fees retained by the securities lending agent. Net income received from JHCT is a component of securities lending income as recorded on the Statement of operations.
Obligations to repay collateral received by the fund are shown on the Statement of assets and liabilities as Payable upon return of securities loaned and are secured by the loaned securities. As of April 30, 2018, the fund loaned common stocks valued at $810,724 and received $831,450 of cash collateral.
Foreign taxes. The fund may be subject to withholding tax on income, capital gains or repatriation taxes imposed by certain countries, a portion of which may be recoverable. Foreign taxes are accrued based upon the fund's understanding of the tax rules and rates that exist in the foreign markets in which it invests. Taxes are accrued based on gains realized by the fund as a result of certain foreign security sales. Estimated taxes are accrued based on unrealized appreciation of such securities. Investment income is recorded net of foreign withholding taxes, less any amounts reclaimable.
Line of credit. The fund may have the ability to borrow from banks for temporary or emergency purposes, including meeting redemption requests that otherwise might require the untimely sale of securities. Pursuant to the fund's custodian agreement, the custodian may loan money to the fund to make properly authorized payments. The fund is obligated to repay the custodian for any overdraft, including any related costs or expenses. The custodian may have a lien, security interest or security entitlement in any fund property that is not otherwise segregated or pledged, to the extent of any overdraft, and to the maximum extent permitted by law.
The fund and other affiliated funds have entered into a syndicated line of credit agreement with Citibank, N.A. as the administrative agent that enables them to participate in a $750 million unsecured committed line of credit. Excluding commitments designated for a certain fund and subject to the needs of all other affiliated funds, the fund can borrow up to an aggregate commitment amount of $500 million, subject to asset coverage and other limitations as specified in the agreement. A commitment fee payable at the end of each calendar quarter, based on the average daily unused portion of the line of credit, is charged to each participating fund based on a combination of fixed and asset based allocations and is reflected in Other expenses on the Statement of operations. For the six months ended April 30, 2018, the fund had no borrowings under the line of credit. Commitment fees for the six months ended April 30, 2018 were $4,018.
Expenses. Within the John Hancock group of funds complex, expenses that are directly attributable to an individual fund are allocated to such fund. Expenses that are not readily attributable to a specific fund are allocated among all funds in an equitable manner, taking into consideration, among other things, the nature and type of expense and the fund's relative net assets. Expense estimates are accrued in the period to which they relate and adjustments are made when actual amounts are known.
Class allocations. Income, common expenses and realized and unrealized gains (losses) are determined at the fund level and allocated daily to each class of shares based on the net assets of the class. Class-specific expenses, such as distribution and service fees, if any, and transfer agent fees, for all classes, are charged daily at the class level based on the net assets of each class and the specific expense rates applicable to each class.
Federal income taxes. The fund intends to continue to qualify as a regulated investment company by complying with the applicable provisions of the Internal Revenue Code and will not be subject to federal income tax on taxable income that is distributed to shareholders. Therefore, no federal income tax provision is required.
As of October 31, 2017, the fund had no uncertain tax positions that would require financial statement recognition, derecognition or disclosure. The fund's federal tax returns are subject to examination by the Internal Revenue Service for a period of three years.
Distribution of income and gains. Distributions to shareholders from net investment income and net realized gains, if any, are recorded on the ex-date. The fund typically declares and pays dividends and capital gain distributions, if any, annually.
Distributions paid by the fund with respect to each class of shares are calculated in the same manner, at the same time and in the same amount, except for the effect of class level expenses that may be applied differently to each class.
Such distributions, on a tax basis, are determined in conformity with income tax regulations, which may differ from US GAAP. Distributions in excess of tax basis earnings and profits, if any, are reported in the fund's financial statements as a return of capital. The final determination of tax characteristics of the fund's distribution will occur at the end of the year and will subsequently be reported to shareholders.
Capital accounts within the financial statements are adjusted for permanent book-tax differences. These adjustments have no impact on net assets or the results of operations. Temporary book-tax differences, if any, will reverse in a subsequent period. Book-tax differences are primarily attributable to wash sale loss deferrals.
Note 3 — Guarantees and indemnifications
Under the Trust's organizational documents, its Officers and Trustees are indemnified against certain liabilities arising out of the performance of their duties to the Trust, including the fund. Additionally, in the normal course of business, the fund enters into contracts with service providers that contain general indemnification clauses. The fund's maximum exposure under
these arrangements is unknown, as this would involve future claims that may be made against the fund that have not yet occurred. The risk of material loss from such claims is considered remote.
Note 4 — Fees and transactions with affiliates
John Hancock Advisers, LLC (the Advisor) serves as investment advisor for the fund. John Hancock Funds, LLC (the Distributor), an affiliate of the Advisor, serves as principal underwriter of the fund. The Advisor and the Distributor are indirect, wholly owned subsidiaries of Manulife Financial Corporation (MFC).
Management fee. The fund has an investment management agreement with the Advisor under which the fund pays a monthly management fee to the Advisor equivalent on an annual basis to the sum of: (a) 0.750% of the first $2.5 billion of the fund's average daily net assets; (b) 0.740% of the next $2.5 billion of the fund's average daily net assets and (3) 0.730% of the fund's average daily net assets in excess of $5 billion. The Advisor has a subadvisory agreement with Pzena Investment Management, LLC. The fund is not responsible for payment of the subadvisory fees.
The Advisor has contractually agreed to waive a portion of its management fee and/or reimburse expenses for certain funds of the John Hancock group of funds complex, including the fund (the participating portfolios). This waiver is based upon aggregate net assets of all the participating portfolios. The amount of the reimbursement is calculated daily and allocated among all the participating portfolios in proportion to the daily net assets of each fund. During the six months ended April 30, 2018, this waiver amounted to 0.01% of the fund's average net assets on an annualized basis. This arrangement may be amended or terminated at any time by the Advisor upon notice to the fund and with the approval of the Board of Trustees.
For the six months ended April 30, 2018, these expense reductions described above amounted to the following:
| Class | Expense reduction | Class | Expense reduction | |
| Class A | $15,408 | Class R3 | $63 | |
| Class B | 175 | Class R4 | 3 | |
| Class C | 3,259 | Class R5 | 3 | |
| Class I | 65,532 | Class R6 | 14,293 | |
| Class R1 | 156 | Total | $99,218 | |
| Class R2 | 326 |
Expenses waived or reimbursed in the current fiscal period are not subject to recapture in future fiscal periods.
The investment management fees incurred for the six months ended April 30, 2018 were equivalent to a net annual effective rate of 0.74% of the fund's average daily net assets.
Accounting and legal services. Pursuant to a service agreement, the fund reimburses the Advisor for all expenses associated with providing the administrative, financial, legal, compliance, accounting and recordkeeping services to the fund, including the preparation of all tax returns, periodic reports to shareholders and regulatory reports, among other services. These expenses are allocated to each share class based on its relative net assets at the time the expense was incurred. These accounting and legal services fees incurred for the six months ended April 30, 2018 amounted to an annual rate of 0.02% of the fund's average daily net assets.
Distribution and service plans. The fund has a distribution agreement with the Distributor. The fund has adopted distribution and service plans with respect to Class A, Class B, Class C, Class R1, Class R2, Class R3 and Class R4 shares pursuant to Rule 12b-1 under the 1940 Act, to pay the Distributor for services provided as the distributor of shares of the fund. In addition, under a service plan for Class R1, Class R2, Class R3, Class R4 and Class R5, the fund pays for certain other services. The fund may pay up to the following contractual rates of distribution and service fees under these arrangements, expressed as an annual percentage of average daily net assets for each class of the fund's shares:
| Class | Rule 12b-1 fee | Service fee | Class | Rule 12b-1 fee | Service fee | |||||||||||||||
| Class A | 0.25% | — | Class R2 | 0.25% | 0.25% | |||||||||||||||
| Class B | 1.00% | — | Class R3 | 0.50% | 0.15% |
| Class | Rule 12b-1 fee | Service fee | Class | Rule 12b-1 fee | Service fee | |||||||||||||||
| Class C | 1.00% | — | Class R4 | 0.25% | 0.10% | |||||||||||||||
| Class R1 | 0.50% | 0.25% | Class R5 | — | 0.05% |
The fund's Distributor has contractually agreed to waive 0.10% of Rule12b-1 fees for Class R4 shares. The current waiver agreement expires on February 28, 2019, unless renewed by mutual agreement of the fund and the Distributor based upon a determination that this is appropriate under the circumstances at the time. This contractual waiver amounted to $37 for Class R4 shares for the six months ended April 30, 2018.
Sales charges. Class A shares are assessed up-front sales charges, which resulted in payments to the Distributor amounting to $111,381 for the six months ended April 30, 2018. Of this amount, $18,561 was retained and used for printing prospectuses, advertising, sales literature and other purposes, $85,696 was paid as sales commissions to broker-dealers and $7,124 was paid as sales commissions to sales personnel of Signator Investors, Inc., a broker-dealer affiliate of the Advisor.
Class A, Class B and Class C shares may be subject to contingent deferred sales charges (CDSCs). Certain Class A shares that are acquired through purchases of $1 million or more and are redeemed within one year of purchase are subject to a 1.00% sales charge. Class B shares that are redeemed within six years of purchase are subject to CDSCs, at declining rates, beginning at 5.00%. Class C shares that are redeemed within one year of purchase are subject to a 1.00% CDSC. CDSCs are applied to the lesser of the current market value at the time of redemption or the original purchase cost of the shares being redeemed. Proceeds from CDSCs are used to compensate the Distributor for providing distribution-related services in connection with the sale of these shares. During the six months ended April 30, 2018, CDSCs received by the Distributor amounted to $494, $668 and $579 for Class A, Class B and Class C shares, respectively.
Transfer agent fees. The John Hancock Group of Funds has a complex-wide transfer agent agreement with John Hancock Signature Services, Inc. (Signature Services), an affiliate of the Advisor. The transfer agent fees paid to Signature Services are determined based on the cost to Signature Services (Signature Services Cost) of providing recordkeeping services. It also includes out-of-pocket expenses, including payments made to third-parties for recordkeeping services provided to their clients who invest in one or more John Hancock funds. In addition, Signature Services Cost may be reduced by certain fees that Signature Services receives in connection with retirement and small accounts. Signature Services Cost is calculated monthly and allocated, as applicable, to five categories of share classes: Retail Share and Institutional Share Classes of Non-Municipal Bond Funds, Class R6 Shares, Retirement Share Classes and Municipal Bond Share Classes. Within each of these categories, the applicable costs are allocated to the affected John Hancock affiliated funds and/or classes, based on the relative average daily net assets.
Class level expenses. Class level expenses for the six months ended April 30, 2018 were:
| Class | Distribution and service fees | Transfer agent fees |
| Class A | $450,957 | $195,165 |
| Class B | 20,525 | 2,216 |
| Class C | 381,611 | 41,282 |
| Class I | — | 847,354 |
| Class R1 | 13,545 | 221 |
| Class R2 | 18,949 | 459 |
| Class R3 | 4,153 | 90 |
| Class R4 | 93 | 4 |
| Class R5 | 18 | 5 |
| Class R6 | — | 20,321 |
| Total | $889,851 | $1,107,117 |
Trustee expenses. The fund compensates each Trustee who is not an employee of the Advisor or its affiliates. The costs of paying Trustee compensation and expenses are allocated to the fund based on its net assets relative to other funds within the John Hancock group of funds complex.
Note 5 — Fund share transactions
Transactions in fund shares for the six months ended April 30, 2018 and for the year ended October 31, 2017 were as follows:
| Six months ended 4-30-18 | Year ended 10-31-17 | |||||||||||||||||||||||||
| Shares | Amount | Shares | Amount | |||||||||||||||||||||||
| Class A shares | ||||||||||||||||||||||||||
| Sold | 407,455 | $13,846,696 | 1,741,170 | $52,263,842 | ||||||||||||||||||||||
| Distributions reinvested | 96,878 | 3,228,010 | 194,622 | 5,762,744 | ||||||||||||||||||||||
| Repurchased | (913,103 | ) | (31,001,134 | ) | (2,780,522 | ) | (83,623,434 | ) | ||||||||||||||||||
| Net decrease | (408,770 | ) | ($13,926,428 | ) | (844,730 | ) | ($25,596,848 | ) | ||||||||||||||||||
| Class B shares | ||||||||||||||||||||||||||
| Sold | 2,346 | $75,933 | 13,322 | $394,186 | ||||||||||||||||||||||
| Distributions reinvested | 337 | 11,102 | 2,126 | 62,173 | ||||||||||||||||||||||
| Repurchased | (31,503 | ) | (1,047,363 | ) | (92,083 | ) | (2,729,048 | ) | ||||||||||||||||||
| Net decrease | (28,820 | ) | ($960,328 | ) | (76,635 | ) | ($2,272,689 | ) | ||||||||||||||||||
| Class C shares | ||||||||||||||||||||||||||
| Sold | 47,833 | $1,606,396 | 292,354 | $8,475,115 | ||||||||||||||||||||||
| Distributions reinvested | 6,124 | 201,291 | 28,499 | 833,017 | ||||||||||||||||||||||
| Repurchased | (192,798 | ) | (6,422,870 | ) | (913,769 | ) | (27,079,294 | ) | ||||||||||||||||||
| Net decrease | (138,841 | ) | ($4,615,183 | ) | (592,916 | ) | ($17,771,162 | ) | ||||||||||||||||||
| Class I shares | ||||||||||||||||||||||||||
| Sold | 7,815,696 | $266,316,246 | 24,224,480 | $734,272,624 | ||||||||||||||||||||||
| Distributions reinvested | 489,456 | 16,328,256 | 740,798 | 21,957,249 | ||||||||||||||||||||||
| Repurchased | (16,124,718 | ) | (534,121,832 | ) | (14,232,178 | ) | (430,352,129 | ) | ||||||||||||||||||
| Net increase (decrease) | (7,819,566 | ) | ($251,477,330 | ) | 10,733,100 | $325,877,744 | ||||||||||||||||||||
| Class R1 shares | ||||||||||||||||||||||||||
| Sold | 7,401 | $249,892 | 46,404 | $1,403,455 | ||||||||||||||||||||||
| Distributions reinvested | 560 | 18,732 | 1,389 | 41,265 | ||||||||||||||||||||||
| Repurchased | (14,994 | ) | (504,386 | ) | (40,644 | ) | (1,239,448 | ) | ||||||||||||||||||
| Net increase (decrease) | (7,033 | ) | ($235,762 | ) | 7,149 | $205,272 | ||||||||||||||||||||
| Class R2 shares | ||||||||||||||||||||||||||
| Sold | 45,512 | $1,560,496 | 261,929 | $8,125,842 | ||||||||||||||||||||||
| Distributions reinvested | 1,813 | 60,331 | 511 | 15,123 | ||||||||||||||||||||||
| Repurchased | (33,368 | ) | (1,122,500 | ) | (72,289 | ) | (2,311,603 | ) | ||||||||||||||||||
| Net increase | 13,957 | $498,327 | 190,151 | $5,829,362 | ||||||||||||||||||||||
| Class R3 shares | ||||||||||||||||||||||||||
| Sold | 5,042 | $175,989 | 16,571 | $501,803 | ||||||||||||||||||||||
| Distributions reinvested | 293 | 9,760 | 568 | 16,786 | ||||||||||||||||||||||
| Repurchased | (547 | ) | (18,229 | ) | (9,868 | ) | (298,569 | ) | ||||||||||||||||||
| Net increase | 4,788 | $167,520 | 7,271 | $220,020 | ||||||||||||||||||||||
| Class R5 shares | ||||||||||||||||||||||||||
| Sold | 107 | $3,629 | 455 | $13,864 | ||||||||||||||||||||||
| Distributions reinvested | 26 | 869 | 35 | 1,025 | ||||||||||||||||||||||
| Repurchased | (54 | ) | (1,859 | ) | (366 | ) | (11,071 | ) | ||||||||||||||||||
| Net increase | 79 | $2,639 | 124 | $3,818 | ||||||||||||||||||||||
| Six months ended 4-30-18 | Year ended 10-31-17 | |||||||||||||||||||||||||
| Shares | Amount | Shares | Amount | |||||||||||||||||||||||
| Class R6 shares | ||||||||||||||||||||||||||
| Sold | 11,368,690 | $370,187,239 | 77,044 | $2,334,880 | ||||||||||||||||||||||
| Distributions reinvested | 135,322 | 4,515,692 | 2,179 | 64,570 | ||||||||||||||||||||||
| Repurchased | (1,134,425 | ) | (38,563,134 | ) | (97,493 | ) | (2,988,155 | ) | ||||||||||||||||||
| Net increase (decrease) | 10,369,587 | $336,139,797 | (18,270 | ) | ($588,705 | ) | ||||||||||||||||||||
| Total net increase | 1,985,381 | $65,593,252 | 9,405,244 | $285,906,812 | ||||||||||||||||||||||
There were no share transactions for Class R4 for the six months ended April 30, 2018 and for the year ended October 31, 2017. Affiliates of the fund owned 100% of shares of Class R4 on April 30, 2018. Such concentration of shareholders' capital could have a material effect on the fund if such shareholders redeem from the fund.
Note 6 — Purchase and sale of securities
Purchases and sales of securities, other than short-term investments, amounted to $343,049,706 and $268,915,417, respectively, for the six months ended April 30, 2018.
Note 7 — Industry or sector risk
The fund may invest a large percentage of its assets in one or more particular industries or sectors of the economy. If a large percentage of the fund's assets are economically tied to a single or small number of industries or sectors of the economy, the fund will be less diversified than a more broadly diversified fund, and it may cause the fund to underperform if that industry or sector underperforms. In addition, focusing on a particular industry or sector may make the fund's NAV more volatile. Further, a fund that invests in particular industries or sectors is particularly susceptible to the impact of market, economic, regulatory and other factors affecting those industries or sectors.
Trustees Hassell H. McClellan, Chairperson Officers Andrew G. Arnott John J. Danello Francis V. Knox, Jr. Charles A. Rizzo Salvatore Schiavone | Investment advisor John Hancock Advisers, LLC Subadvisor Pzena Investment Management, LLC Principal distributor John Hancock Funds, LLC Custodian State Street Bank and Trust Company Transfer agent John Hancock Signature Services, Inc. Legal counsel K&L Gates LLP |
*Member of the Audit Committee
†Non-Independent Trustee
#Effective 6-20-17
The fund's proxy voting policies and procedures, as well as the fund proxy voting record for the most recent twelve-month period ended June 30, are available free of charge on the Securities and Exchange Commission (SEC) website at sec.gov or on our website.
The fund's complete list of portfolio holdings, for the first and third fiscal quarters, is filed with the SEC on Form N-Q. The fund's Form N-Q is available on our website and the SEC's website, sec.gov, and can be reviewed and copied (for a fee) at the SEC's Public Reference Room in Washington, DC. Call 800-SEC-0330 to receive information on the operation of the SEC's Public Reference Room.
We make this information on your fund, as well as monthly portfolio holdings, and other fund details available on our website at jhinvestments.com or by calling 800-225-5291.
| You can also contact us: | |||
| 800-225-5291 jhinvestments.com | Regular mail: John Hancock Signature Services, Inc. | Express mail: John Hancock Signature Services, Inc. | |
John Hancock family of funds
DOMESTIC EQUITY FUNDS Balanced Blue Chip Growth Classic Value Disciplined Value Disciplined Value Mid Cap Equity Income Fundamental All Cap Core Fundamental Large Cap Core Fundamental Large Cap Value New Opportunities Small Cap Core Small Cap Growth Small Cap Value Strategic Growth U.S. Global Leaders Growth U.S. Growth Value Equity GLOBAL AND INTERNATIONAL EQUITY FUNDS Disciplined Value International Emerging Markets Emerging Markets Equity Fundamental Global Franchise Global Equity Global Shareholder Yield Greater China Opportunities International Growth International Small Company International Value Equity | INCOME FUNDS Bond California Tax-Free Income Emerging Markets Debt Floating Rate Income Global Income Government Income High Yield High Yield Municipal Bond Income Investment Grade Bond Money Market Short Duration Credit Opportunities Spectrum Income Strategic Income Opportunities Tax-Free Bond ALTERNATIVE AND SPECIALTY FUNDS Absolute Return Currency Alternative Asset Allocation Enduring Assets Financial Industries Global Absolute Return Strategies Global Conservative Absolute Return Global Focused Strategies Natural Resources Redwood Regional Bank Seaport Long/Short Technical Opportunities |
A fund's investment objectives, risks, charges, and expenses should be considered carefully before investing. The prospectus contains this and other important information about the fund. To obtain a prospectus, contact your financial professional, call John Hancock Investments at 800-225-5291, or visit our website at jhinvestments.com. Please read the prospectus carefully before investing or sending money.
ASSET ALLOCATION Income Allocation Multi-Index Lifetime Portfolios Multi-Index Preservation Portfolios Multimanager Lifestyle Portfolios Multimanager Lifetime Portfolios Retirement Income 2040 EXCHANGE-TRADED FUNDS John Hancock Multifactor Consumer Discretionary ETF John Hancock Multifactor Consumer Staples ETF John Hancock Multifactor Developed International ETF John Hancock Multifactor Energy ETF John Hancock Multifactor Financials ETF John Hancock Multifactor Healthcare ETF John Hancock Multifactor Industrials ETF John Hancock Multifactor Large Cap ETF John Hancock Multifactor Materials ETF John Hancock Multifactor Mid Cap ETF John Hancock Multifactor Small Cap ETF John Hancock Multifactor Technology ETF John Hancock Multifactor Utilities ETF | ENVIRONMENTAL, SOCIAL, AND GOVERNANCE FUNDS ESG All Cap Core ESG Core Bond ESG International Equity ESG Large Cap Core CLOSED-END FUNDS Financial Opportunities Hedged Equity & Income Income Securities Trust Investors Trust Preferred Income Preferred Income II Preferred Income III Premium Dividend Tax-Advantaged Dividend Income Tax-Advantaged Global Shareholder Yield |
John Hancock Multifactor ETF shares are bought and sold at market price (not NAV), and are not individually redeemed
from the fund. Brokerage commissions will reduce returns.
John Hancock ETFs are distributed by Foreside Fund Services, LLC, and are subadvised by Dimensional Fund Advisors LP.
Foreside is not affiliated with John Hancock Funds, LLC or Dimensional Fund Advisors LP.
Dimensional Fund Advisors LP receives compensation from John Hancock in connection with licensing rights to the
John Hancock Dimensional indexes. Dimensional Fund Advisors LP does not sponsor, endorse, or sell, and makes no
representation as to the advisability of investing in, John Hancock Multifactor ETFs.
John Hancock Investments
A trusted brand
John Hancock Investments is a premier asset manager representing one of
America's most trusted brands, with a heritage of financial stewardship dating
back to 1862. Helping our shareholders pursue their financial goals is at the
core of everything we do. It's why we support the role of professional financial
advice and operate with the highest standards of conduct and integrity.
A better way to invest
We serve investors globally through a unique multimanager approach:
We search the world to find proven portfolio teams with specialized
expertise for every strategy we offer, then we apply robust investment
oversight to ensure they continue to meet our uncompromising standards
and serve the best interests of our shareholders.
Results for investors
Our unique approach to asset management enables us to provide a diverse set
of investments backed by some of the world's best managers, along with strong
risk-adjusted returns across asset classes.
| | John Hancock Funds, LLC n Member FINRA, SIPC 601 Congress Street n Boston, MA 02210-2805 800-225-5291 n jhinvestments.com | |
| This report is for the information of the shareholders of John Hancock Classic Value Fund. It is not authorized for distribution to prospective investors unless preceded or accompanied by a prospectus. | ||
| MF450357 | 38SA 4/18 6/18 | |
ITEM 2. CODE OF ETHICS.
Not applicable.
ITEM 3. AUDIT COMMITTEE FINANCIAL EXPERT.
Not applicable at this time.
ITEM 4. PRINCIPAL ACCOUNTANT FEES AND SERVICES.
Not applicable at this time.
ITEM 5. AUDIT COMMITTEE OF LISTED REGISTRANTS.
Not applicable at this time.
ITEM 6. SCHEDULE OF INVESTMENTS.
ITEM 7. DISCLOSURE OF PROXY VOTING POLICIES AND PROCEDURES FOR CLOSED-END MANAGEMENT INVESTMENT COMPANIES.
Not applicable.
ITEM 8. PORTFOLIO MANAGERS OF CLOSED-END MANAGEMENT INVESTMENT COMPANIES.
Not applicable.
ITEM 9. PURCHASES OF EQUITY SECURITIES BY CLOSED-END MANAGEMENT INVESTMENT COMPANY AND AFFILIATED PURCHASERS.
Not applicable.
ITEM 10. SUBMISSION OF MATTERS TO A VOTE OF SECURITY HOLDERS.
The registrant has adopted procedures by which shareholders may recommend nominees to the registrant’s Board of Trustees. A copy of the procedures is filed as an exhibit to this Form N-CSR. See attached “John Hancock Funds – Nominating, Governance and Administration Committee Charter.”
ITEM 11. CONTROLS AND PROCEDURES.
(a) Based upon their evaluation of the registrant's disclosure controls and procedures as conducted within 90 days of the filing date of this Form N-CSR, the registrant's principal executive officer and principal financial officer have concluded that those disclosure controls and procedures provide reasonable assurance that the material information required to be disclosed by the registrant on this report is recorded, processed, summarized and reported within the time periods specified in the Securities and Exchange Commission's rules and forms.
(b) There were no changes in the registrant's internal control over financial reporting that occurred during the second fiscal quarter of the period covered by this report that have materially affected, or are reasonably likely to materially affect, the registrant's internal control over financial reporting.
ITEM 12. DISCLOSURE OF SECURITIES LENDING ACTIVITIES FOR CLOSED-END MANAGEMENT INVESTMENT COMPANIES.: Not applicable.
ITEM 13. EXHIBITS.
(a) Separate certifications for the registrant's principal executive officer and principal financial officer, as required by Section 302 of the Sarbanes-Oxley Act of 2002 and Rule 30a-2(a) under the Investment Company Act of 1940, are attached.
(b) Separate certifications for the registrant's principal executive officer and principal financial officer, as required by 18 U.S.C. Section 1350, as adopted pursuant to Section 906 of the Sarbanes-Oxley Act of 2002, and Rule 30a-2(b) under the Investment Company Act of 1940, are attached. The certifications furnished pursuant to this paragraph are not deemed to be "filed" for purposes of Section 18 of the Securities Exchange Act of 1934, or otherwise subject to the liability of that section. Such certifications are not deemed to be incorporated by reference into any filing under the Securities Act of 1933 or the Securities Exchange Act of 1934, except to the extent that the Registrant specifically incorporates them by reference.
(c)(1) Submission of Matters to a Vote of Security Holders is attached. See attached “John Hancock Funds – Nominating, Governance and Administration Committee Charter.”
SIGNATURES
Pursuant to the requirements of the Securities Exchange Act of 1934 and the Investment Company Act of 1940, the registrant has duly caused this report to be signed on its behalf by the undersigned, thereunto duly authorized.
John Hancock Capital Series
| By: | /s/ Andrew Arnott | |
| Andrew Arnott | ||
| President | ||
| Date: | June 15, 2018 | |
Pursuant to the requirements of the Securities Exchange Act of 1934 and the Investment Company Act of 1940, this report has been signed below by the following persons on behalf of the registrant and in the capacities and on the dates indicated.
| By: | /s/ Andrew Arnott | |
| Andrew Arnott | ||
| President | ||
| Date: | June 15, 2018 | |
| By: | /s/ Charles A. Rizzo | |
| Charles A. Rizzo | ||
| Chief Financial Officer | ||
| Date: | June 15, 2018 | |