UNITED STATES
SECURITIES AND EXCHANGE COMMISSION
Washington, D.C. 20549
FORM N-CSR
Certified Shareholder Report of
Registered Management Investment Companies
Investment Company Act File Number: 811-00066
American Balanced Fund
(Exact Name of Registrant as Specified in Charter)
6455 Irvine Center Drive
Irvine, California 92618
(Address of Principal Executive Offices)
Registrant's telephone number, including area code: (949) 975-5000
Date of fiscal year end: December 31
Date of reporting period: December 31, 2014
Michael W. Stockton
American Balanced Fund
6455 Irvine Center Drive
Irvine, California 92618
(Name and Address of Agent for Service)
Copies to:
Michael Glazer
Morgan, Lewis & Bockius LLP
355 South Grand Avenue, Suite 4400
Los Angeles, California 90071
(Counsel for the Registrant)
ITEM 1 – Reports to Stockholders

Find balance that is
actively achieved and
maintained over time.
Special feature page 6
 | American Balanced Fund® Annual report
for the year ended
December 31, 2014 |
American Balanced Fund seeks conservation of capital, current income, and long-term growth of both capital and income.
This fund is one of more than 40 offered by one of the nation’s largest mutual fund families, American Funds, from Capital Group. For more than 80 years, Capital has invested with a long-term focus based on thorough research and attention to risk.
Fund results shown in this report, unless otherwise indicated, are for Class A shares at net asset value. If a sales charge (maximum 5.75%) had been deducted, the results would have been lower. Results are for past periods and are not predictive of results for future periods. Current and future results may be lower or higher than those shown. Share prices and returns will vary, so investors may lose money. Investing for short periods makes losses more likely. Investments are not FDIC-insured, nor are they deposits of or guaranteed by a bank or any other entity, so they may lose value. For current information and month-end results, visit americanfunds.com.
See page 4 for Class A share results with relevant sales charges deducted. For other share class results, visit americanfunds.com and americanfundsretirement.com.
Investment results assume all distributions are reinvested and reflect applicable fees and expenses. When applicable, investment results reflect fee waivers, without which results would have been lower. Visit americanfunds.com for more information.
The fund’s 30-day yield for Class A shares as of January 31, 2015, calculated in accordance with the U.S. Securities and Exchange Commission (SEC) formula, was 1.40%. The fund’s 12-month distribution rate for Class A shares as of that date was 1.41%. Both reflect the 5.75% maximum sales charge. The SEC yield reflects the rate at which the fund is earning income on its current portfolio of securities while the distribution rate reflects the fund’s past dividends paid to shareholders. Accordingly, the fund’s SEC yield and distribution rate may differ.
The return of principal for bond funds and for funds with significant underlying bond holdings is not guaranteed. Fund shares are subject to the same interest rate, inflation and credit risks associated with the underlying bond holdings. Refer to the fund prospectus and the Risk Factors section of this report for more information on these and other risks associated with investing in the fund.

Fellow investors:
In a market environment that favored equities over fixed-income securities, American Balanced Fund gained 8.85% for the 12-month period ended December 31, 2014, exceeding the 7.21% return of the Lipper Balanced Funds Index. American Balanced Fund’s returns for the past three-, five- and 10-year periods were 14.80%, 12.17% and 6.97% — all outpacing the Lipper index returns of 11.78%, 9.50% and 6.01%, respectively. Looking at the bigger, long-term picture, over the near-40 years that Capital Research and Management Company has managed the fund, American Balanced Fund realized an average annual total return of 10.94%, compared with 10.07% for the Lipper index.
In short, fund investors seeking to increase their wealth — prudently, over time, through a balanced approach —historically have been rewarded as the fund has invested primarily in blue-chip equities and investment-grade (rated BBB/Baa and above) fixed-income securities with a U.S. emphasis.
For many investors, their introduction to American Balanced Fund has been through their employer’s retirement plan. In 2014, the fund continued to help Americans prepare for retirement as one of the most widely used balanced funds in defined benefit 401(k)s, with over $16.3 billion in participant contributions, according to Pensions & Investments (September 2014).
2014 market review
The U.S. economy started the year on shaky ground, due to an unusually harsh winter. As temperatures rose, the equity markets picked up steam — soon at record-breaking levels — extending one of the longest-running bull markets in history. The unmanaged Standard & Poor’s 500 Composite Index climbed above 2,000 for the first time ever, as it gained 13.66% for the year, with dividends reinvested. The Dow Jones Industrial Average surpassed the 18,000 mark during the year and ended 2014 with a 10.02% annual gain, with dividends reinvested.
Investors, it seems, were encouraged by the U.S. economy’s gradual improvement, high corporate profits and attractive stock valuations compared to fixed-income securities.
Uncertainty about interest rates and how they would affect investments had investors taking a cautious approach to fixed-income markets through much of 2014. Month after month, many investors expected rates to go up but, in fact, they continued to do the exact opposite. This can be attributed to economic weakness in the rest of the world, rising geopolitical risks and a lower-than-anticipated level of inflation. Finally, in mid-December, the Fed shifted its position on the timing of future interest rate hikes. That day, there was a 288-point gain (+1.69%) in the Dow Jones Industrial Average. The next day, the Dow was up 421 points (+2.43%), its best day of the year.
Despite concerns investors may have about interest rates, a sound fixed-income investment strategy can provide current income and potentially mitigate volatility associated with equity investing. Furthermore, the very strong U.S. equity
We’ve made a conscious effort to adjust the equity portion of American Balanced Fund from 74%, where it started the year, to 67% to help protect gains our investors were able to make in 2014.
results of the past few years and the associated rise in valuations argues for a more cautious equity investment position. To that end, we’ve made a conscious effort to adjust the equity portion of American Balanced Fund from 74%, where it started the year, to 67%, and increase the fixed-income allocation from 23% to 28%. Our goal is to help our investors protect gains they were able to make during the year in 2014. (To learn more about balanced investing, read the special feature beginning on page 6.)
AMBAL portfolio highlights
Most sectors of the S&P 500 advanced in 2014, led by a 28.98% rise in utilities. Health care and information technology rose at notable rates, gaining 25.34% and 20.12%, respectively. But energy stocks, hurt by plunging crude oil prices in the second half of the year, lost 7.78%.
AMBAL’s lower-than-index position in energy companies proved positive for relative results, and careful investment selection further helped to lift returns. Similarly, having fewer investments in telecommunication services companies was additive to the fund’s relative returns.
While health care companies outpaced the broader market, AMBAL’s smaller position dampened returns and became one of the fund’s largest detractors. A notable bright spot in our health care investment strategy was UnitedHealth Group (+34.25%), which served as one of the fund’s top 10 contributors for 2014. (See page 11 for more information about UnitedHealth.)
Two stocks that have helped the fund in the past but detracted from results in 2014 were Amazon (–22.18%) and Boeing (–4.77%). On the plus side, Lockheed Martin (+29.54%) and Microsoft (+24.10%) buoyed results (see pages 10 and 11, respectively). We continue to be enthusiastic about all four of these securities on a long-term basis.
Moving forward, the overall mix of the fund’s portfolio has been adjusted to be more defensive. We’ve increased our investment in more defensive sectors such as consumer staples. Fixed income has also been increased, so U.S. Treasury, U.S. agency and agency pass-through securities, as well as other high-quality mortgage and investment-grade corporate bonds, will play an important role for our investors, helping to provide income and mitigating volatility. And the fund’s level of cash is higher as well.
Thank you for your support
We welcome our many new shareholders to the fund and assure all of our investors that we will continue to follow our prudent, research-driven approach to investing that has characterized American Balanced Fund for almost 40 years. We look forward to reporting to you again in six months’ time.
Sincerely,

Gregory D. Johnson
Vice Chairman of the Board and President
February 10, 2015
For current information about the fund, visit americanfunds.com.
History of American Balanced Fund
A historical view of the comparative total returns of stocks, bonds, the 60%/40% S&P/BC Index, the Lipper Balanced Funds Index and AMBAL.
Stocks, bonds and balance (July 26, 1975, to December 31, 2014)
Total
returns (through December 31) | | U.S.
stocks | | U.S.
bonds | | 60%/40%
S&P/BC Index | | Lipper
Balanced
Funds Index | | American
Balanced
Fund |
| 1975 (from July 26) | | | 3.14 | % | | | 5.58 | % | | | 4.16 | % | | | 3.40 | % | | | 5.58 | % |
| 1976 | | | 23.93 | | | | 15.60 | | | | 20.74 | | | | 26.03 | | | | 25.98 | |
| 1977 | | | –7.16 | | | | 3.04 | | | | –3.13 | | | | –0.72 | | | | 0.70 | |
| 1978 | | | 6.57 | | | | 1.39 | | | | 4.74 | | | | 4.80 | | | | 6.21 | |
| 1979 | | | 18.61 | | | | 1.93 | | | | 11.77 | | | | 14.67 | | | | 7.63 | |
| 1980 | | | 32.50 | | | | 2.71 | | | | 20.43 | | | | 19.70 | | | | 14.36 | |
| 1981 | | | –4.92 | | | | 6.25 | | | | –0.47 | | | | 1.86 | | | | 4.40 | |
| 1982 | | | 21.55 | | | | 32.62 | | | | 26.19 | | | | 30.63 | | | | 29.36 | |
| 1983 | | | 22.56 | | | | 8.36 | | | | 16.76 | | | | 17.44 | | | | 16.11 | |
| 1984 | | | 6.27 | | | | 15.15 | | | | 9.96 | | | | 7.46 | | | | 9.36 | |
| 1985 | | | 31.73 | | | | 22.10 | | | | 27.94 | | | | 29.83 | | | | 29.11 | |
| 1986 | | | 18.67 | | | | 15.26 | | | | 17.61 | | | | 18.43 | | | | 16.87 | |
| 1987 | | | 5.25 | | | | 2.76 | | | | 5.65 | | | | 4.13 | | | | 4.02 | |
| 1988 | | | 16.56 | | | | 7.89 | | | | 13.07 | | | | 11.18 | | | | 12.87 | |
| 1989 | | | 31.63 | | | | 14.53 | | | | 24.72 | | | | 19.70 | | | | 21.53 | |
| 1990 | | | –3.11 | | | | 8.96 | | | | 1.81 | | | | 0.66 | | | | –1.57 | |
| 1991 | | | 30.40 | | | | 16.00 | | | | 24.73 | | | | 25.83 | | | | 24.69 | |
| 1992 | | | 7.61 | | | | 7.40 | | | | 7.58 | | | | 7.46 | | | | 9.48 | |
| 1993 | | | 10.06 | | | | 9.75 | | | | 9.98 | | | | 11.95 | | | | 11.27 | |
| 1994 | | | 1.32 | | | | –2.92 | | | | –0.33 | | | | –2.05 | | | | 0.34 | |
| 1995 | | | 37.53 | | | | 18.47 | | | | 29.64 | | | | 24.89 | | | | 27.13 | |
| 1996 | | | 22.95 | | | | 3.63 | | | | 14.96 | | | | 13.05 | | | | 13.16 | |
| 1997 | | | 33.35 | | | | 9.65 | | | | 23.61 | | | | 20.30 | | | | 21.04 | |
| 1998 | | | 28.58 | | | | 8.69 | | | | 20.98 | | | | 15.09 | | | | 11.13 | |
| 1999 | | | 21.04 | | | | –0.82 | | | | 12.00 | | | | 8.98 | | | | 3.47 | |
| 2000 | | | –9.10 | | | | 11.63 | | | | –0.99 | | | | 2.39 | | | | 15.85 | |
| 2001 | | | –11.88 | | | | 8.44 | | | | –3.71 | | | | –3.24 | | | | 8.19 | |
| 2002 | | | –22.09 | | | | 10.26 | | | | –9.82 | | | | –10.69 | | | | –6.27 | |
| 2003 | | | 28.67 | | | | 4.10 | | | | 18.47 | | | | 19.94 | | | | 22.82 | |
| 2004 | | | 10.87 | | | | 4.34 | | | | 8.29 | | | | 8.99 | | | | 8.92 | |
| 2005 | | | 4.91 | | | | 2.43 | | | | 4.00 | | | | 5.20 | | | | 3.12 | |
| 2006 | | | 15.78 | | | | 4.33 | | | | 11.11 | | | | 11.60 | | | | 11.80 | |
| 2007 | | | 5.49 | | | | 6.97 | | | | 6.22 | | | | 6.53 | | | | 6.60 | |
| 2008 | | | –36.99 | | | | 5.24 | | | | –22.06 | | | | –26.18 | | | | –25.73 | |
| 2009 | | | 26.47 | | | | 5.93 | | | | 18.40 | | | | 23.35 | | | | 21.08 | |
| 2010 | | | 15.08 | | | | 6.54 | | | | 12.14 | | | | 11.90 | | | | 13.02 | |
| 2011 | | | 2.09 | | | | 7.84 | | | | 4.67 | | | | 0.74 | | | | 3.82 | |
| 2012 | | | 15.99 | | | | 4.21 | | | | 11.30 | | | | 11.94 | | | | 14.19 | |
| 2013 | | | 32.37 | | | | –2.02 | | | | 17.55 | | | | 16.39 | | | | 21.73 | |
| 2014 | | | 13.66 | | | | 5.97 | | | | 10.60 | | | | 7.21 | | | | 8.85 | |
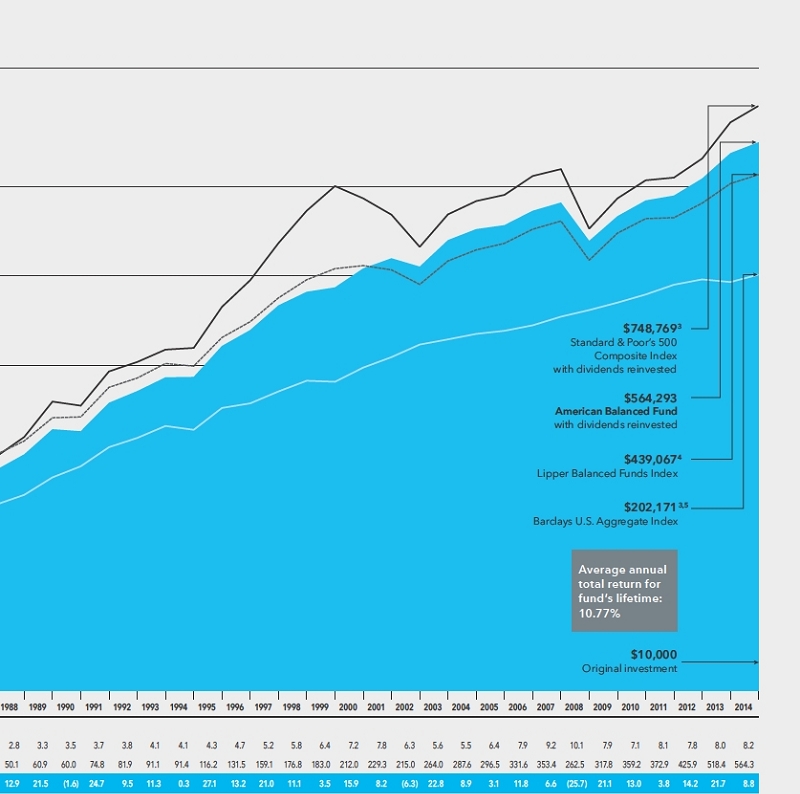
| Average annual total returns | | | 11.57 | % | | | 7.92 | % | | | 10.39 | % | | | 10.07 | % | | | 10.94 | % |
| Volatility | | | 14.95 | % | | | 5.47 | % | | | 9.70 | % | | | 10.12 | % | | | 9.68 | % |
Figures assume reinvestment of all distributions.
Sources: Stocks — S&P 500; Bonds — Barclays U.S. Aggregate Index. Barclays U.S. Aggregate Index represents the U.S. investment-grade fixed-rate bond market. For the period July 31, 1975, to December 31, 1975, Barclays Government/Credit Bond Index was used.
The 60%/40% S&P/BC Index blends the S&P 500 with the Barclays U.S. Aggregate Index by weighting their total returns at 60% and 40%, respectively. The portfolio is rebalanced monthly.
The market indexes are unmanaged and, therefore, have no expenses. Investors cannot invest directly in an index.
The Lipper Balanced Funds Index is an equally weighted index of the 30 largest U.S. balanced funds.
Capital Research and Management Company became the fund’s investment adviser on July 26, 1975.
Volatility is calculated using annualized standard deviation (based on monthly returns), a measure of how returns over time have varied from the mean; a lower number signifies lower volatility.
Fund results shown are for Class A shares and reflect deduction of the maximum sales charge of 5.75% on the $10,000 investment.1 Thus, the net amount invested was $9,425.2 Results are for past periods and are not predictive of results for future periods. Current and future results may be lower or higher than those shown. Share prices and returns will vary, so investors may lose money. For current information and month-end results, visit americanfunds.com.
The results shown are before taxes on fund distributions and sale of fund shares.
| 1 | As outlined in the prospectus, the sales charge is reduced for accounts (and aggregated investments) of $25,000 or more and is eliminated for purchases of $1 million or more. There is no sales charge on dividends or capital gain distributions that are reinvested in additional shares. |
| 2 | The maximum initial sales charge was 8.50% prior to July 1, 1988. |
| 3 | The market indexes are unmanaged and, therefore, have no expenses. Investors cannot invest directly in an index. |
| 4 | Results of the Lipper Balanced Funds Index do not reflect any sales charges. |
| 5 | Barclays U.S. Aggregate Index represents the U.S. investment-grade fixed-rate bond market. For the period July 31, 1975, to December 1, 1975, Barclays Government/Credit Bond Index was used. |
| 6 | For the period July 26, 1975 (when Capital Research and Management Company became the fund’s investment adviser) through December 31, 1975. |
The value of a long-term perspective

How a $10,000 investment has grown
This chart shows how a hypothetical $10,000 investment in American Balanced Fund grew from July 26, 1975 — when Capital Research and Management Company became the fund’s investment adviser — to December 31, 2014. As you can see, the investment grew to $564,293 with all distributions reinvested. The fund’s year-by-year results appear under the chart. You can use this table to estimate how the value of your own holdings has grown.
We take an active hand in maintaining a balance of growth and stability.

Balance. We can see it in nature. Many of us seek it in our everyday lives. And investment professionals stress its importance as we pursue our long-term financial goals.
But when it comes to the right mix of investments, balance isn’t so much found as created. And once achieved, it must be maintained. The portfolio managers and analysts of American Balanced Fund (AMBAL) are dedicated to this task.
 | |  | |  |
| | | | | |
| Greg Johnson | | Hilda Applbaum | | Jim Mulally |
| Portfolio Manager | | Portfolio Manager | | Portfolio Manager |
The role of balanced investing
“Our job is to help investors grow their wealth and generate income without keeping them up all night worrying about volatility,” says Greg Johnson, president and portfolio manager of AMBAL.
Balanced funds, like AMBAL, combine equity and fixed-income securities to enable investors to mitigate downside risk while still being able to take advantage of some upside market potential. By nature, balanced funds typically lag pure equity funds in a sharply rising market but tend to hold up better during a decline.
The concept of balanced investing isn’t new. The potential benefits of this strategy probably first became clear when the stock market crash of 1929 wiped out 89% of stock market value, as measured by the Dow Jones Industrial Average excluding dividends. Over the years, the popularity of balanced funds has grown as more and more investors have sought relative safety in addition to growth.
AMBAL can serve as a complete investment program for an investor. It may be particularly attractive to those who don’t keep up with the markets and aren’t sure how to create a balanced investment strategy on their own. Older investors nearing retirement may find some peace of mind from a conservative approach designed to help them preserve their hard-earned nest eggs while seeking growth to last through their golden years.
Why investors choose AMBAL
“AMBAL has proven over time to be an investment vehicle for all seasons,” says Greg.
The fund’s objectives — conservation of capital, current income and long-term growth of capital and income — may not be so different from other balanced funds. It’s in the execution of these goals that AMBAL can be distinguished.
Investors should start by asking “What exactly does ‘balanced’ mean?” suggests Greg. “At American Funds, balance is not only the allocation between equity and fixed income, though that’s obviously one piece of it. To us, balance is also strategic diversification of investments in both areas.”
Portfolio Manager Hilda Applbaum adds, “Diversification isn’t necessarily about the number of securities you invest in. You can hold hundreds of stocks and not be diversified if they’re all basically doing the same thing. True diversification requires different ideas working together within the fund.” In AMBAL, these ideas are introduced through a diversified team of investment professionals with different backgrounds, each owning their best ideas. The fund operates in a research-driven environment that enables these portfolio managers and analysts to identify investment opportunities and manage risk.
AMBAL’s asset allocation in action
AMBAL’s balance of equity and fixed-income investments can be re-aligned to more effectively pursue the fund’s objectives. “If you look at the fund’s allocation over time,” suggests Portfolio Manager Jim Mulally, “you’ll see that it adjusts to economic and market conditions — not in a daily, tactical way but as a strategic mix.” Consider these two different points in history:
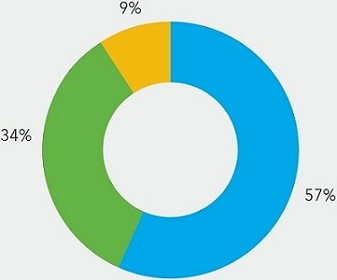
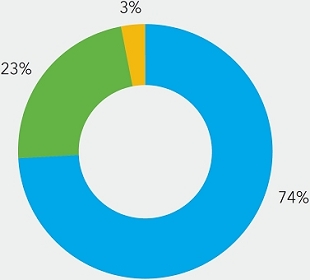
| 1999: Potentially overvalued market | | | 2013: Strong market growth |
| | | | |
| Wall Street closed its books on a century of unprecedented growth with the Dow Jones Industrial Average, the Nasdaq Composite Index and Standard & Poor’s 500 Composite Index reaching record highs. Already concerned about the sustainability of high stock valuations, AMBAL’s portfolio managers kept the fund’s portfolio close to the levels they had set in 1996 – ending the year just 57% in equities (with 34% in fixed income and 9% in cash). | | | Five years after a devastating crash, the equity market had not only recovered, it rewarded those who remained invested with substantial growth. The Dow and the S&P 500 posted their largest gains since the late 1990s. The Nasdaq rose almost 40% to levels it hadn’t reached since 2000. In order to help investors take advantage of the strong 2013 market, AMBAL maintained an equity allocation over 70%, ending the year almost 74% invested in equities (23% in fixed income and 3% in cash). |
| | | | |
 | | |  |
| | | | |
| ■ Total equities ■ Total fixed income ■ Cash & equivalents |
Source: Capital Group (as of December 31, 2013).
Two keys to AMBAL’s success are its asset allocation strategy and time-tested investment process called The Capital System.SM
AMBAL’s dynamic asset allocation strategy
Many balanced funds available today remain at a target asset allocation of approximately 60% equities and 40% fixed-income securities, regardless of market environment.
In contrast, AMBAL seeks a better balance at any given point in time through built-in flexibility. “By design,” explains Greg, “equities can account for as much as 75% and no less than 50% of the AMBAL portfolio. Sometimes, we’ve found that 65% in equities and 35% in fixed-income and cash is where we need to be to effectively pursue the fund’s objectives. There are, however, times when it may be more prudent to move that allocation to one extreme or the other.”
According to Greg, “There are a number of factors we consider as we assess where AMBAL should be in terms of asset allocation, including equity valuations, the term structure of interest rates and our fixed-income professionals’ forecasts on the direction of rates.”
A time-tested system
Balance can be a very personal concept. American Funds understands the value of individual perspectives, even within the structure of a common objective. In AMBAL, as with all of the American Funds, a combination of
 | |  | |  |
| | | | | |
| John Smet | | Wesley Phoa | | Andy Barth |
| Portfolio Manager | | Portfolio Manager | | Portfolio Manager |
independence and teamwork defines The Capital System — a process that has, over time, benefited investors as it has enabled each of the portfolio managers and analysts to invest in their strongest convictions. Blended together, these holdings create a broadly diversified portfolio of equity and fixed-income securities that the team believes are most likely to succeed.
“This philosophy,” says Portfolio Manager Wesley Phoa, “has been tried and tested for decades through many, many different market environments. So when you invest in AMBAL, you’re not putting your money into something that has worked well for three or five years. This investment philosophy was working long ago, when the world was totally different from the way it is today. We’re confident that it can continue to work over the next 20 years and beyond, as the world continues to change.”
Research is the backbone of The Capital System. “The amount of deep, fundamental research that goes into every one of the investments in AMBAL is extraordinarily rigorous,” says Justin Toner, investment analyst and coordinator of AMBAL’s research portfolio. Each of the 23 investment analysts in the research portfolio study individual industries and companies in depth — actually visiting these companies in person and meeting with company executives, employees, suppliers, customers and even competitors. Portfolio managers tap this knowledge when making investment decisions on their portion of the overall fund portfolio.
Additionally, AMBAL’s investment analysts, led by Justin, use the research portfolio to invest a portion of the fund based on the sectors they cover. The goal is to own a stock, for example, alongside one of the portfolio managers in the fund, although that’s not a requirement.
“As coordinator of the research portfolio, I keep track of what the analysts are recommending and their level of conviction for each investment,” explains Justin. “If I have an analyst who wants to buy a stock but for some reason didn’t get a portfolio manager to buy it with them, I might typically encourage them to make a larger investment so that it can have a meaningful impact on the overall fund.”
It’s all about balance
Deep fundamental research. A dynamic asset allocation strategy that has historically added to the fund. And a process for investing that has stood the test of time. “It’s all about balance,” says Portfolio Manager Andy Barth. “The structure of AMBAL gives us the flexibility to do what we believe is right for our investors.” ■
How the fund is managed
Portfolio managers
AMBAL’s 10 portfolio managers have an average of 30 years of investment experience.* The knowledge and wisdom they have accumulated over the years have helped them manage your fund through many different stock market cycles.
| Hilda L. Applbaum | 28 years | James R. Mulally | 39 years |
| Andrew F. Barth | 30 years | Dina N. Perry | 37 years |
| Alan N. Berro | 29 years | Wesley K.-S. Phoa | 21 years |
| Gregory D. Johnson | 21 years | John H. Smet | 33 years |
| Jeffrey T. Lager | 20 years | Eugene P. Stein | 44 years |
Investment analysts
The analysts invest in their strongest convictions through the research portfolio, which is coordinated by Justin Toner.
| * | List of investment professionals and their years of experience are as of the prospectus dated March 1, 2015 (unaudited). |
A closer look at the fixed-income portfolio
In 2008, there were few safe harbors for investors. In the fixed-income market, many were surprised at the volatility of high-grade corporate bonds. Only Treasuries did well.
“Since then, the fixed-income market has become even more complex,” says Portfolio Manager John Smet. “More instruments are available and the number of players, including non-U.S. investors, has grown dramatically.”
To effectively cover this market, AMBAL has five fixed-income portfolio managers. John Smet, Jim Mulally and Hilda Applbaum are generalists who buy U.S. Treasury bonds, investment-grade bonds issued by governments and corporations, and securities backed by home mortgages from Fannie Mae, Freddie Mac and Ginnie Mae. Wesley Phoa and Andy Barth together act as a fourth generalist manager; Wesley focuses on Treasuries, government agencies and mortgages, while Andy specializes in credit securities, which are primarily investment-grade corporate bonds (rated BBB/Baa and above).
“One of the main things we all try to remember is that fixed income is meant to be a part of AMBAL that is stable and generates income. It’s an important part of the balance for our investors,” describes Wesley.
Research is a critical component of their efforts. Andy explains, “I think our investors are fully aware of the strong research capability that Capital brings on the equity side. We’re doing that very same thing in fixed income as well in order to make informed decisions.”
As part of that initiative, two groups were introduced, post-2008, to better leverage the power of The Capital System of investing:
Portfolio Strategy Group (PSG): “The PSG is a part of The Capital System that’s unique to fixed income,” explains Jim. “It provides discipline to the portfolio through top-down guidance, which helps us make more consistent investment decisions.” Specifically, the PSG establishes broad, strategic parameters that act as a guide in the construction of AMBAL’s fixed-income portfolio. It is then up to the portfolio managers to use their own creativity within those guidelines. The overall goal of the PSG is to promote good investment results over full market cycles.
Risk and Quantitative Solutions Group (RQS): This team of risk analysts are integrated into Capital Group’s fixed-income organization to contribute to superior long-term investment results through rigorous discipline and quantitative analysis based on computer modeling. A “virtual” portfolio of the fund’s holdings is subjected to a variety of simulations designed to mirror the effects of potential economic scenarios and market movements over time. “Future risk is a big challenge for anyone in the fixed-income market,” says John. “The simulation work done by RQS is an effective way to understand the risk in our portfolios.”
Inside the research portfolio:

Justin Toner
Sectors
U.S. Aerospace and defense
U.S. and Japanese automobiles
Waste services (environmental services)
Beyond coordinating the overall research portfolio, Justin invests in three equities in AMBAL, including Lockheed Martin, one of the fund’s top industrial holdings. “This has been a large investment for us for many years, and we invested a lot more in it fairly recently,” says Justin. “Lockheed Martin is an extremely well-managed, cash-generative company. And management returns that cash to shareholders through dividends and share re-purchases.
“It was an extremely cheap equity in early 2013, when it looked like defense spending was going to be hit hard in Washington. But it’s often when sentiment is most negative that you have the opportunity to invest in a good company at a great price. Even now, as it appears defense spending may rise again, albeit modestly, the company remains a reasonably valued investment.”

Four of our investment analysts describe the conviction behind a key AMBAL investment each holds.

Diana Wagner
Sectors
Health care services
Semi-conductor equipment
Paper and forest products
UnitedHealth Group is not only Diana’s largest holding, it represents one of AMBAL’s top holdings in the health care sector.
Diana explains, “Many worried that the Affordable Care Act (ACA) was a government takeover of health care, but I think it further promoted the role of the private sector. UnitedHealth is already, in many ways, enabling the country’s health care agenda as the government’s contractor for the federal health insurance exchange through its Optum subsidiary. Optum is now one-third of profits and also sells services to help hospitals, doctors, employers and even other insurers adapt to the changing health care environment.
“However, the biggest growth opportunity I see for UnitedHealth is the continued privatization of Medicare and Medicaid, which is still in the early stages.”

Paul Benjamin
Sectors
Information technology hardware
Information technology software
One of Paul’s investments, Microsoft, is AMBAL’s largest holding. “We’ve been building our position in Microsoft in a material way, especially in 2013,” says Paul. “The stock was downgraded, partly due to weak investments in the consumer franchise area — such as the Surface tablet, retail stores and Bing. But that’s only 20% of the picture.
“The other 80% of the profits comes from a very healthy enterprise business that’s growing 8% to 10% a year. Today, Microsoft is the second-largest infrastructure cloud vendor, after Amazon. As more people turn to these services, I feel confident that Microsoft is the one legacy IT company best positioned to succeed in the cloud — even more so under the direction of new CEO Satya Nadella and new Chairman John Thompson, whose background from IBM and Symantec should prove valuable to Microsoft moving forward.”

Andrei Muresianu
Sectors
Telecommunications
Cable and satellite
Traditional U.S. media
Andrei invests in Comcast, a top AMBAL holding in the consumer discretionary area. “In addition to a steady cash flow from their core cable TV business, I was attracted to Comcast’s position as a leader in broadband communications. A lot of Americans are interested in getting broadband at home and upgrading the speed of their service.
“Another reason for my conviction is Comcast’s acquisition of NBC/Universal from General Electric. This could enable Comcast to become a very profitable integrated media company with the means to shape the evolution of the media ecosystem, ranging from video-on-demand to dynamic addressable advertising to out-of-home TV-everywhere rights that can make their product mobile and customizable.”

Summary investment portfolio December 31, 2014
| Investment mix by security type | Percent of net assets |
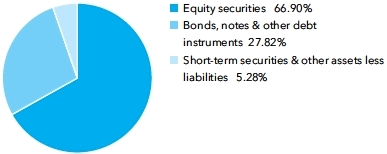
| Common stocks 66.90% | | Shares | | | Value
(000) | |
| Financials 12.36% | | | | | | | | |
| Wells Fargo & Co. | | | 30,902,000 | | | $ | 1,694,048 | |
| Berkshire Hathaway Inc., Class A1 | | | 6,580 | | | | 1,487,080 | |
| JPMorgan Chase & Co. | | | 20,651,000 | | | | 1,292,339 | |
| American Express Co. | | | 11,300,000 | | | | 1,051,352 | |
| ACE Ltd. | | | 5,095,000 | | | | 585,314 | |
| Citigroup Inc. | | | 9,500,000 | | | | 514,045 | |
| Weyerhaeuser Co.1 | | | 13,115,242 | | | | 470,706 | |
| SunTrust Banks, Inc. | | | 11,000,000 | | | | 460,900 | |
| Capital One Financial Corp. | | | 5,569,000 | | | | 459,721 | |
| Other securities | | | | | | | 1,827,034 | |
| | | | | | | | 9,842,539 | |
| | | | | | | | | |
| Consumer discretionary 9.93% | | | | | | | | |
| Comcast Corp., Class A | | | 36,050,000 | | | | 2,091,260 | |
| Home Depot, Inc. | | | 16,929,349 | | | | 1,777,074 | |
| Amazon.com, Inc.1 | | | 4,119,500 | | | | 1,278,487 | |
| Twenty-First Century Fox, Inc., Class A | | | 25,156,900 | | | | 966,151 | |
| Walt Disney Co. | | | 5,220,000 | | | | 491,672 | |
| Other securities | | | | | | | 1,304,966 | |
| | | | | | | | 7,909,610 | |
| | | | | | | | | |
| Information technology 8.84% | | | | | | | | |
| Microsoft Corp. | | | 59,655,000 | | | | 2,770,975 | |
| Texas Instruments Inc. | | | 11,232,000 | | | | 600,519 | |
| ASML Holding NV (New York registered) | | | 4,055,401 | | | | 437,294 | |
| ASML Holding NV2 | | | 1,470,405 | | | | 157,534 | |
| Cisco Systems, Inc. | | | 18,250,000 | | | | 507,624 | |
| TE Connectivity Ltd. | | | 7,805,000 | | | | 493,666 | |
| Other securities | | | | | | | 2,076,570 | |
| | | | | | | | 7,044,182 | |
| | | | | | | | | |
| Industrials 8.49% | | | | | | | | |
| Boeing Co. | | | 12,695,000 | | | | 1,650,096 | |
| Lockheed Martin Corp. | | | 6,574,037 | | | | 1,265,962 | |
| Union Pacific Corp. | | | 7,040,000 | | | | 838,675 | |
| General Electric Co. | | | 23,650,000 | | | | 597,635 | |
| Parker-Hannifin Corp. | | | 4,100,000 | | | | 528,695 | |
| United Technologies Corp. | | | 3,690,000 | | | | 424,350 | |
| Other securities | | | | | | | 1,459,411 | |
| | | | | | | | 6,764,824 | |
| | | | | | | | | |
| Consumer staples 7.61% | | | | | | | | |
| Philip Morris International Inc. | | | 14,750,000 | | | | 1,201,387 | |
| Coca-Cola Co. | | | 27,663,000 | | | | 1,167,932 | |
| Procter & Gamble Co. | | | 9,935,000 | | | | 904,979 | |
| PepsiCo, Inc. | | | 8,766,000 | | | | 828,913 | |
| Costco Wholesale Corp. | | | 5,677,326 | | | | 804,761 | |
| | | Shares | | | Value
(000) | |
| Nestlé SA2 | | | 8,140,000 | | | $ | 596,675 | |
| Nestlé SA (ADR) | | | 1,000,000 | | | | 72,950 | |
| Other securities | | | | | | | 488,725 | |
| | | | | | | | 6,066,322 | |
| | | | | | | | | |
| Health care 6.71% | | | | | | | | |
| Merck & Co., Inc. | | | 22,990,000 | | | | 1,305,602 | |
| UnitedHealth Group Inc. | | | 9,295,000 | | | | 939,632 | |
| Pfizer Inc. | | | 21,905,000 | | | | 682,341 | |
| Roche Holding AG2 | | | 2,358,957 | | | | 639,373 | |
| Bristol-Myers Squibb Co. | | | 9,950,000 | | | | 587,348 | |
| Johnson & Johnson | | | 5,510,000 | | | | 576,181 | |
| Other securities | | | | | | | 618,769 | |
| | | | | | | | 5,349,246 | |
| | | | | | | | | |
| Energy 4.39% | | | | | | | | |
| Chevron Corp. | | | 5,244,755 | | | | 588,357 | |
| Royal Dutch Shell PLC, Class B (ADR) | | | 8,058,000 | | | | 560,514 | |
| Enbridge Inc. | | | 9,795,000 | | | | 503,561 | |
| ConocoPhillips | | | 7,169,508 | | | | 495,126 | |
| Other securities | | | | | | | 1,346,052 | |
| | | | | | | | 3,493,610 | |
| | | | | | | | | |
| Materials 3.07% | | | | | | | | |
| Potash Corp. of Saskatchewan Inc. | | | 19,850,000 | | | | 701,102 | |
| E.I. du Pont de Nemours and Co. | | | 6,750,000 | | | | 499,095 | |
| Other securities | | | | | | | 1,247,313 | |
| | | | | | | | 2,447,510 | |
| | | | | | | | | |
| Other 0.73% | | | | | | | | |
| Other securities | | | | | | | 579,754 | |
| | | | | | | | | |
| Miscellaneous 4.77% | | | | | | | | |
| Other common stocks in initial period of acquisition | | | | | | | 3,797,825 | |
| | | | | | | | | |
| Total common stocks (cost: $32,600,515,000) | | | | | | | 53,295,422 | |
| | | | | | | | | |
| Bonds, notes & other debt instruments 27.82% | | Principal amount
(000) | | | | | |
| Corporate bonds & notes 9.26% | | | | | | | | |
| Financials 2.93% | | | | | | | | |
| American Express Co. 6.15% 2017 | | $ | 22,800 | | | | 25,421 | |
| American Express Credit Co. 1.55% 2017 | | | 15,465 | | | | 15,507 | |
| Berkshire Hathaway Inc. 2.00%–2.90% 2016–2020 | | | 60,840 | | | | 62,108 | |
| JPMorgan Chase & Co. 1.35%–3.88% 2017–2024 | | | 159,365 | | | | 159,511 | |
| JPMorgan Chase & Co., Series S, junior subordinated, perpetual, 6.75% (undated)3 | | | 25,000 | | | | 26,531 | |
| Wells Fargo & Co. 1.25%–4.60% 2016–2024 | | | 111,300 | | | | 115,201 | |
| Other securities | | | | | | | 1,929,647 | |
| | | | | | | | 2,333,926 | |
| | | | | | | | | |
| Consumer discretionary 1.07% | | | | | | | | |
| 21st Century Fox America, Inc. 3.70% 20244 | | | 18,420 | | | | 18,985 | |
| Amazon.com, Inc. 3.80%–4.95% 2024–2044 | | | 109,575 | | | | 113,343 | |
| Comcast Corp. 3.60%–6.45% 2017–2044 | | | 60,350 | | | | 70,803 | |
| Home Depot, Inc. 2.00%–5.95% 2019–2041 | | | 77,700 | | | | 84,241 | |
| News America Inc. 3.00% 2022 | | | 6,000 | | | | 5,970 | |
| Other securities | | | | | | | 556,200 | |
| | | | | | | | 849,542 | |
| | | | | | | | | |
| Consumer staples 0.98% | | | | | | | | |
| Coca-Cola Co. 1.50%–1.80% 2015–2016 | | | 36,470 | | | | 36,961 | |
| PepsiCo, Inc. 7.90% 2018 | | | 15,000 | | | | 18,264 | |
| Philip Morris International Inc. 3.25%–4.88% 2024–2044 | | | 59,800 | | | | 60,616 | |
| Procter & Gamble Co. 1.45% 2016 | | | 13,460 | | | | 13,625 | |
| Other securities | | | | | | | 647,716 | |
| | | | | | | | 777,182 | |
| Bonds, notes & other debt instruments (continued) | | Principal amount
(000) | | | Value
(000) | |
| Corporate bonds & notes (continued) | | | | | | | | |
| Health care 0.91% | | | | | | | | |
| UnitedHealth Group Inc. 1.40%–6.00% 2017–2018 | | $ | 67,170 | | | $ | 74,022 | |
| Other securities | | | | | | | 653,041 | |
| | | | | | | | 727,063 | |
| | | | | | | | | |
| Industrials 0.54% | | | | | | | | |
| Boeing Company 0.95% 2018 | | | 12,000 | | | | 11,743 | |
| General Electric Capital Corp. 1.00%–6.00% 2015–2024 | | | 99,605 | | | | 103,139 | |
| General Electric Co. 0.85%–4.50% 2015–2044 | | | 44,100 | | | | 44,881 | |
| General Electric Corp. 5.25% 2017 | | | 16,000 | | | | 17,758 | |
| Union Pacific Corp. 5.70% 2018 | | | 11,150 | | | | 12,711 | |
| Other securities | | | | | | | 240,145 | |
| | | | | | | | 430,377 | |
| | | | | | | | | |
| Other 2.83% | | | | | | | | |
| Other securities | | | | | | | 2,258,557 | |
| | | | | | | | | |
| Total corporate bonds & notes | | | | | | | 7,376,647 | |
| | | | | | | | | |
| U.S. Treasury bonds & notes 7.90% | | | | | | | | |
| U.S. Treasury 6.34% | | | | | | | | |
| U.S. Treasury 0.25% 2015 | | | 489,000 | | | | 489,323 | |
| U.S. Treasury 0.38%–5.50% 2015–2044 | | | 3,128,524 | | | | 3,297,525 | |
| U.S. Treasury 0.625% 2018 | | | 775,000 | | | | 759,438 | |
| U.S. Treasury 1.50% 2019 | | | 511,500 | | | | 508,201 | |
| | | | | | | | 5,054,487 | |
| | | | | | | | | |
| U.S. Treasury inflation-protected securities 1.56% | | | | | | | | |
| U.S. Treasury Inflation-Protected Security 0.13%–2.38% 2015–20435 | | | 729,170 | | | | 740,096 | |
| U.S. Treasury Inflation-Protected Security 1.375% 20445 | | | 438,688 | | | | 501,401 | |
| | | | | | | | 1,241,497 | |
| | | | | | | | | |
| Total U.S. Treasury bonds & notes | | | | | | | 6,295,984 | |
| | | | | | | | | |
| Mortgage-backed obligations 6.67% | | | | | | | | |
| Federal agency mortgage-backed obligations 4.45% | | | | | | | | |
| Fannie Mae 0.00%–11.01% 2018–20473,6,7 | | | 2,504,771 | | | | 2,647,668 | |
| Freddie Mac 0.00%–6.50% 2023–20443,6 | | | 200,498 | | | | 213,297 | |
| Other securities | | | | | | | 683,771 | |
| | | | | | | | 3,544,736 | |
| | | | | | | | | |
| Other 2.22% | | | | | | | | |
| Other securities | | | | | | | 1,771,509 | |
| | | | | | | | | |
| Total mortgage-backed obligations | | | | | | | 5,316,245 | |
| | | | | | | | | |
| Federal agency bonds & notes 2.30% | | | | | | | | |
| Fannie Mae 0.38%–6.25% 2015–20293,6 | | | 759,454 | | | | 770,848 | |
| Federal Home Loan Bank 0.38%–5.50% 2016–2036 | | | 171,405 | | | | 174,107 | |
| Freddie Mac 0.50%–3.53% 2015–20243,6 | | | 723,416 | | | | 729,247 | |
| Other securities | | | | | | | 158,950 | |
| | | | | | | | 1,833,152 | |
| | | | | | | | | |
| Other 1.64% | | | | | | | | |
| Other securities | | | | | | | 1,302,738 | |
| | | | | | | | | |
| Miscellaneous 0.05% | | | | | | | | |
| Other bonds, notes and other debt instruments in initial period of acquisition | | | | | | | 39,507 | |
| | | | | | | | | |
| Total bonds, notes & other debt instruments (cost: $21,574,677,000) | | | | | | | 22,164,273 | |
| | | | | | | | | |
| Short-term securities 5.97% | | | | | | | | |
| Chariot Funding, LLC 0.25%–0.27% due 5/21/2015–8/26/20154 | | | 120,600 | | | | 120,428 | |
| Coca-Cola Co. 0.13%–0.19% due 1/8/2015–4/23/20154 | | | 162,100 | | | | 162,069 | |
| Fannie Mae 0.06%–0.16% due 1/7/2015–10/1/2015 | | | 1,172,994 | | | | 1,172,609 | |
| Federal Home Loan Bank 0.07%–0.17% due 1/14/2015–11/4/2015 | | | 1,491,397 | | | | 1,491,012 | |
| Freddie Mac 0.07%–0.17% due 1/12/2015–8/18/2015 | | | 698,400 | | | | 698,185 | |
| | | Principal amount
(000) | | | Value
(000) | |
| General Electric Capital Corp. 0.19%–0.20% due 5/5/2015–5/13/2015 | | $ | 120,000 | | | $ | 119,923 | |
| JPMorgan Chase & Co. 0.25% due 3/11/20154 | | | 25,000 | | | | 24,991 | |
| Jupiter Securitization Co., LLC 0.21% due 5/5/20154 | | | 25,000 | | | | 24,980 | |
| Procter & Gamble Co. 0.08%–0.15% due 1/5/2015–2/9/20154 | | | 140,000 | | | | 139,995 | |
| Other securities | | | | | | | 802,842 | |
| | | | | | | | | |
| Total short-term securities (cost: $4,756,675,000) | | | | | | | 4,757,034 | |
| Total investment securities 100.69% (cost: $58,931,867,000) | | | | | | | 80,216,729 | |
| Other assets less liabilities (0.69)% | | | | | | | (553,050 | ) |
| | | | | | | | | |
| Net assets 100.00% | | | | | | $ | 79,663,679 | |
This summary investment portfolio is designed to streamline the report and help investors better focus on the fund’s principal holdings. See the inside back cover for details on how to obtain a complete schedule of portfolio holdings.
As permitted by U.S. Securities and Exchange Commission regulations, “Miscellaneous” securities include holdings in their first year of acquisition that have not previously been publicly disclosed.
“Other securities” includes all issues that are not disclosed separately in the summary investment portfolio, including loan participations and assignments which may be subject to legal or contractual restrictions on resale. The total value of all such loans was $5,506,000, which represented .01% of the net assets of the fund.
The following footnotes apply to either the individual securities noted or one or more of the securities aggregated and listed as a single line item.
| 1 | Security did not produce income during the last 12 months. |
| 2 | Valued under fair value procedures adopted by authority of the board of trustees. The total value of all such securities, including those in “Miscellaneous” and “Other securities,” was $1,785,370,000, which represented 2.24% of the net assets of the fund. This amount includes $1,773,228,000 related to certain securities trading outside the U.S. whose values were adjusted as a result of significant market movements following the close of local trading. |
| 3 | Coupon rate may change periodically. |
| 4 | Acquired in a transaction exempt from registration under Rule 144A or Section 4(2) of the Securities Act of 1933. May be resold in the U.S. in transactions exempt from registration, normally to qualified institutional buyers. The total value of all such securities, including those in “Other securities,” was $3,055,295,000, which represented 3.84% of the net assets of the fund. |
| 5 | Index-linked bond whose principal amount moves with a government price index. |
| 6 | Principal payments may be made periodically. Therefore, the effective maturity date may be earlier than the stated maturity date. |
| 7 | A portion or all of the security purchased on a TBA basis. |
Key to abbreviations
ADR = American Depository Receipts
TBA = To be announced
See Notes to Financial Statements
Financial statements
| Statement of assets and liabilities | | | | | | |
| at December 31, 2014 | (dollars in thousands) | |
| | |
| Assets: | | | | | | | | |
| Investment securities, at value (cost: $58,931,867) | | | | | | $ | 80,216,729 | |
| Cash | | | | | | | 1,163 | |
| Receivables for: | | | | | | | | |
| Sales of investments | | $ | 755,690 | | | | | |
| Sales of fund’s shares | | | 337,088 | | | | | |
| Dividends and interest | | | 196,414 | | | | 1,289,192 | |
| | | | | | | | 81,507,084 | |
| Liabilities: | | | | | | | | |
| Payables for: | | | | | | | | |
| Purchases of investments | | | 1,559,586 | | | | | |
| Repurchases of fund’s shares | | | 233,196 | | | | | |
| Investment advisory services | | | 15,589 | | | | | |
| Services provided by related parties | | | 29,073 | | | | | |
| Trustees’ deferred compensation | | | 4,227 | | | | | |
| Other | | | 1,734 | | | | 1,843,405 | |
| Net assets at December 31, 2014 | | | | | | $ | 79,663,679 | |
| | | | | | | | | |
| Net assets consist of: | | | | | | | | |
| Capital paid in on shares of beneficial interest | | | | | | $ | 58,078,777 | |
| Undistributed net investment income | | | | | | | 122,668 | |
| Undistributed net realized gain | | | | | | | 178,586 | |
| Net unrealized appreciation | | | | | | | 21,283,648 | |
| Net assets at December 31, 2014 | | | | | | $ | 79,663,679 | |
(dollars and shares in thousands, except per-share amounts)
Shares of beneficial interest issued and outstanding (no stated par value) —
unlimited shares authorized (3,220,722 total shares outstanding)
| | | Net assets | | | Shares
outstanding | | | Net asset
value per share | |
| Class A | | $ | 46,916,623 | | | | 1,895,258 | | | $ | 24.75 | |
| Class B | | | 541,503 | | | | 21,915 | | | | 24.71 | |
| Class C | | | 5,573,575 | | | | 226,297 | | | | 24.63 | |
| Class F-1 | | | 2,841,081 | | | | 114,837 | | | | 24.74 | |
| Class F-2 | | | 1,869,537 | | | | 75,555 | | | | 24.74 | |
| Class 529-A | | | 2,831,067 | | | | 114,526 | | | | 24.72 | |
| Class 529-B | | | 72,769 | | | | 2,939 | | | | 24.76 | |
| Class 529-C | | | 904,726 | | | | 36,622 | | | | 24.70 | |
| Class 529-E | | | 144,261 | | | | 5,839 | | | | 24.71 | |
| Class 529-F-1 | | | 110,888 | | | | 4,489 | | | | 24.71 | |
| Class R-1 | | | 157,898 | | | | 6,417 | | | | 24.61 | |
| Class R-2 | | | 1,307,723 | | | | 53,115 | | | | 24.62 | |
| Class R-2E | | | 10 | | | | — | * | | | 24.75 | |
| Class R-3 | | | 3,315,311 | | | | 134,519 | | | | 24.65 | |
| Class R-4 | | | 4,384,832 | | | | 177,399 | | | | 24.72 | |
| Class R-5 | | | 2,616,255 | | | | 105,610 | | | | 24.77 | |
| Class R-6 | | | 6,075,620 | | | | 245,385 | | | | 24.76 | |
*Amount less than one thousand.
See Notes to Financial Statements
| Statement of operations | | |
| for the year ended December 31, 2014 | | (dollars in thousands) | |
| | | |
| Investment income: | | | | | | | | |
| Income: | | | | | | | | |
| Dividends (net of non-U.S. taxes of $13,991) | | $ | 1,173,278 | | | | | |
| Interest | | | 486,595 | | | $ | 1,659,873 | |
| Fees and expenses*: | | | | | | | | |
| Investment advisory services | | | 173,885 | | | | | |
| Distribution services | | | 227,751 | | | | | |
| Transfer agent services | | | 74,564 | | | | | |
| Administrative services | | | 19,275 | | | | | |
| Reports to shareholders | | | 2,326 | | | | | |
| Registration statement and prospectus | | | 1,058 | | | | | |
| Trustees’ compensation | | | 703 | | | | | |
| Auditing and legal | | | 142 | | | | | |
| Custodian | | | 609 | | | | | |
| Other | | | 3,814 | | | | 504,127 | |
| Net investment income | | | | | | | 1,155,746 | |
| | | | | | | | | |
| | | | | | | | | |
| Net realized gain and unrealized appreciation on investments and currency: | | | | | | | | |
| Net realized gain (loss) on: | | | | | | | | |
| Investments | | | 4,942,260 | | | | | |
| Currency transactions | | | (906 | ) | | | 4,941,354 | |
| Net unrealized appreciation (depreciation) on: | | | | | | | | |
| Investments (net of non-U.S. taxes of $511) | | | 272,453 | | | | | |
| Currency translations | | | (926 | ) | | | 271,527 | |
| Net realized gain and unrealized appreciation on investments and currency | | | | | | | 5,212,881 | |
| | | | | | | | | |
| Net increase in net assets resulting from operations | | | | | | $ | 6,368,627 | |
*Additional information related to class-specific fees and expenses is included in the Notes to Financial Statements.
| Statements of changes in net assets | | | | | | |
| | | (dollars in thousands) |
| | | | |
| | | Year ended December 31 | |
| | | 2014 | | | 2013 | |
| | | | | | | |
| Operations: | | | | | | | | |
| Net investment income | | $ | 1,155,746 | | | $ | 970,228 | |
| Net realized gain on investments and currency transactions | | | 4,941,354 | | | | 1,873,080 | |
| Net unrealized appreciation on investments and currency translations | | | 271,527 | | | | 9,504,575 | |
| Net increase in net assets resulting from operations | | | 6,368,627 | | | | 12,347,883 | |
| | | | | | | | | |
| Dividends and distributions paid to shareholders: | | | | | | | | |
| Dividends from net investment income | | | (1,089,310 | ) | | | (1,016,591 | ) |
| Distributions from net realized gain on investments | | | (4,365,643 | ) | | | — | |
| Total dividends and distributions paid to shareholders | | | (5,454,953 | ) | | | (1,016,591 | ) |
| | | | | | | | | |
| Net capital share transactions | | | 7,862,108 | | | | 3,682,825 | |
| | | | | | | | | |
| Total increase in net assets | | | 8,775,782 | | | | 15,014,117 | |
| | | | | | | | | |
| Net assets: | | | | | | | | |
| Beginning of year | | | 70,887,897 | | | | 55,873,780 | |
| End of year (including undistributed net investment income: $122,668 and $45,929, respectively) | | $ | 79,663,679 | | | $ | 70,887,897 | |
See Notes to Financial Statements
Notes to financial statements
1. Organization
American Balanced Fund (the “fund”) is registered under the Investment Company Act of 1940 as an open-end, diversified investment company. The fund seeks conservation of capital, current income, and long-term growth of both capital and income.
The fund has 17 share classes consisting of five retail share classes (Classes A, B and C, as well as two F share classes, F-1 and F-2), five 529 college savings plan share classes (Classes 529-A, 529-B, 529-C, 529-E and 529-F-1) and seven retirement plan share classes (Classes R-1, R-2, R2-E, R-3, R-4, R-5 and R-6). The 529 college savings plan share classes can be used to save for college education. The retirement plan share classes are generally offered only through eligible employer-sponsored retirement plans. The fund’s share classes are described further in the following table:
| Share class | | Initial sales
charge | | Contingent deferred sales
charge upon redemption | | Conversion feature | |
| Classes A and 529-A | | Up to 5.75% | | None (except 1% for certain redemptions within one year of purchase without an initial sales charge) | | None | |
| Classes B and 529-B* | | None | | Declines from 5% to 0% for redemptions within six years of purchase | | Classes B and 529-B convert to Classes A and 529-A, respectively, after eight years | |
| Class C | | None | | 1% for redemptions within one year of purchase | | Class C converts to Class F-1 after 10 years | |
| Class 529-C | | None | | 1% for redemptions within one year of purchase | | None | |
| Class 529-E | | None | | None | | None | |
| Classes F-1, F-2 and 529-F-1 | | None | | None | | None | |
| Classes R-1, R-2, R-2E, R-3, R-4, R-5 and R-6 | | None | | None | | None | |
*Class B and 529-B shares of the fund are not available for purchase.
On August 29, 2014, the fund made an additional retirement plan share class (Class R-2E) available for sale pursuant to an amendment to its registration statement filed with the U.S. Securities and Exchange Commission. Refer to the fund’s prospectus for more details.
Holders of all share classes have equal pro rata rights to the assets, dividends and liquidation proceeds of the fund. Each share class has identical voting rights, except for the exclusive right to vote on matters affecting only its class. Share classes have different fees and expenses (“class-specific fees and expenses”), primarily due to different arrangements for distribution, transfer agent and administrative services. Differences in class-specific fees and expenses will result in differences in net investment income and, therefore, the payment of different per-share dividends by each share class.
2. Significant accounting policies
The fund is an investment company that applies the accounting and reporting guidance issued in Topic 946 by the U.S. Financial Accounting Standards Board. The fund’s financial statements have been prepared to comply with U.S. generally accepted accounting principles (“U.S. GAAP”). These principles require the fund’s investment adviser to make estimates and assumptions that affect reported amounts and disclosures. Actual results could differ from those estimates. The fund follows the significant accounting policies described in this section, as well as the valuation policies described in the next section on valuation.
Security transactions and related investment income — Security transactions are recorded by the fund as of the date the trades are executed with brokers. Realized gains and losses from security transactions are determined based on the specific identified cost of the securities. In the event a security is purchased with a delayed payment date, the fund will segregate liquid assets sufficient to meet its payment obligations. Dividend income is recognized on the ex-dividend date and interest income is recognized on an accrual basis. Market discounts, premiums and original issue discounts on fixed-income securities are amortized daily over the expected life of the security.
Class allocations — Income, fees and expenses (other than class-specific fees and expenses) and realized and unrealized gains and losses are allocated daily among the various share classes based on their relative net assets. Class-specific fees and expenses, such as distribution, transfer agent and administrative services, are charged directly to the respective share class.
Dividends and distributions to shareholders — Dividends and distributions to shareholders are recorded on the ex-dividend date.
Currency translation — Assets and liabilities, including investment securities, denominated in currencies other than U.S. dollars are translated into U.S. dollars at the exchange rates supplied by one or more pricing vendors on the valuation date. Purchases and sales of investment securities and income and expenses are translated into U.S. dollars at the exchange rates on the dates of such transactions. The effects of changes in exchange rates on investment securities are included with the net realized gain or loss and net unrealized appreciation or depreciation on investments in the fund’s statement of operations. The realized gain or loss and unrealized appreciation or depreciation resulting from all other transactions denominated in currencies other than U.S. dollars are disclosed separately.
3. Valuation
Capital Research and Management Company (“CRMC”), the fund’s investment adviser, values the fund’s investments at fair value as defined by U.S. GAAP. The net asset value of each share class of the fund is generally determined as of approximately 4:00 p.m. New York time each day the New York Stock Exchange is open.
Methods and inputs — The fund’s investment adviser uses the following methods and inputs to establish the fair value of the fund’s assets and liabilities. Use of particular methods and inputs may vary over time based on availability and relevance as market and economic conditions evolve.
Equity securities are generally valued at the official closing price of, or the last reported sale price on, the exchange or market on which such securities are traded, as of the close of business on the day the securities are being valued or, lacking any sales, at the last available bid price. Prices for each security are taken from the principal exchange or market on which the security trades.
Fixed-income securities, including short-term securities, are generally valued at prices obtained from one or more pricing vendors. Vendors value such securities based on one or more of the inputs described in the following table. The table provides examples of inputs that are commonly relevant for valuing particular classes of fixed-income securities in which the fund is authorized to invest. However, these classifications are not exclusive, and any of the inputs may be used to value any other class of fixed-income security.
| Fixed-income class | Examples of standard inputs |
| All | Benchmark yields, transactions, bids, offers, quotations from dealers and trading systems, new issues, spreads and other relationships observed in the markets among comparable securities; and proprietary pricing models such as yield measures calculated using factors such as cash flows, financial or collateral performance and other reference data (collectively referred to as “standard inputs”) |
| Corporate bonds & notes; convertible securities | Standard inputs and underlying equity of the issuer |
| Bonds & notes of governments & government agencies | Standard inputs and interest rate volatilities |
| Mortgage-backed; asset-backed obligations | Standard inputs and cash flows, prepayment information, default rates, delinquency and loss assumptions, collateral characteristics, credit enhancements and specific deal information |
| Municipal securities | Standard inputs and, for certain distressed securities, cash flows or liquidation values using a net present value calculation based on inputs that include, but are not limited to, financial statements and debt contracts |
When the fund’s investment adviser deems it appropriate to do so (such as when vendor prices are unavailable or deemed to be not representative), fixed-income securities will be valued in good faith at the mean quoted bid and ask prices that are reasonably and timely available (or bid prices, if ask prices are not available) or at prices for securities of comparable maturity, quality and type.
Securities with both fixed-income and equity characteristics, or equity securities traded principally among fixed-income dealers, are generally valued in the manner described above for either equity or fixed-income securities, depending on which method is deemed most appropriate by the fund’s investment adviser.
Securities and other assets for which representative market quotations are not readily available or are considered unreliable by the fund’s investment adviser are fair valued as determined in good faith under fair valuation guidelines adopted by authority of the fund’s board of trustees as further described. The investment adviser follows fair valuation guidelines, consistent with U.S. Securities and Exchange Commission rules and guidance, to consider relevant principles and factors when making fair value determinations. The investment adviser considers relevant indications of value that are reasonably and timely available to it in determining the fair value to be assigned to
a particular security, such as the type and cost of the security; contractual or legal restrictions on resale of the security; relevant financial or business developments of the issuer; actively traded similar or related securities; conversion or exchange rights on the security; related corporate actions; significant events occurring after the close of trading in the security; and changes in overall market conditions. In addition, the closing prices of equity securities that trade in markets outside U.S. time zones may be adjusted to reflect significant events that occur after the close of local trading but before the net asset value of each share class of the fund is determined. Fair valuations and valuations of investments that are not actively trading involve judgment and may differ materially from valuations that would have been used had greater market activity occurred.
Processes and structure — The fund’s board of trustees has delegated authority to the fund’s investment adviser to make fair value determinations, subject to board oversight. The investment adviser has established a Joint Fair Valuation Committee (the “Fair Valuation Committee”) to administer, implement and oversee the fair valuation process, and to make fair value decisions. The Fair Valuation Committee regularly reviews its own fair value decisions, as well as decisions made under its standing instructions to the investment adviser’s valuation teams. The Fair Valuation Committee reviews changes in fair value measurements from period to period and may, as deemed appropriate, update the fair valuation guidelines to better reflect the results of back testing and address new or evolving issues. The Fair Valuation Committee reports any changes to the fair valuation guidelines to the board of trustees with supplemental information to support the changes. The fund’s board and audit committee also regularly review reports that describe fair value determinations and methods.
The fund’s investment adviser has also established a Fixed-Income Pricing Review Group to administer and oversee the fixed-income valuation process, including the use of fixed-income pricing vendors. This group regularly reviews pricing vendor information and market data. Pricing decisions, processes and controls over security valuation are also subject to additional internal reviews, including an annual control self-evaluation program facilitated by the investment adviser’s compliance group.
Classifications — The fund’s investment adviser classifies the fund’s assets and liabilities into three levels based on the inputs used to value the assets or liabilities. Level 1 values are based on quoted prices in active markets for identical securities. Level 2 values are based on significant observable market inputs, such as quoted prices for similar securities and quoted prices in inactive markets. Certain securities trading outside the U.S. may transfer between Level 1 and Level 2 due to valuation adjustments resulting from significant market movements following the close of local trading. Level 3 values are based on significant unobservable inputs that reflect the investment adviser’s determination of assumptions that market participants might reasonably use in valuing the securities. The valuation levels are not necessarily an indication of the risk or liquidity associated with the underlying investment. For example, U.S. government securities are reflected as Level 2 because the inputs used to determine fair value may not always be quoted prices in an active market. The following table presents the fund’s valuation levels as of December 31, 2014 (dollars in thousands):
| | | Investment securities | |
| | | Level 1 | | | Level 2* | | | Level 3 | | | Total | |
| Assets: | | | | | | | | | | | | | | | | |
| Common stocks: | | | | | | | | | | | | | | | | |
| Financials | | $ | 9,842,539 | | | $ | — | | | $ | — | | | $ | 9,842,539 | |
| Consumer discretionary | | | 7,909,610 | | | | — | | | | — | | | | 7,909,610 | |
| Information technology | | | 6,886,648 | | | | 157,534 | | | | — | | | | 7,044,182 | |
| Industrials | | | 6,764,824 | | | | — | | | | — | | | | 6,764,824 | |
| Consumer staples | | | 5,469,647 | | | | 596,675 | | | | — | | | | 6,066,322 | |
| Health care | | | 4,709,873 | | | | 639,373 | | | | — | | | | 5,349,246 | |
| Energy | | | 3,493,610 | | | | — | | | | — | | | | 3,493,610 | |
| Materials | | | 2,447,510 | | | | — | | | | — | | | | 2,447,510 | |
| Other | | | 579,754 | | | | — | | | | — | | | | 579,754 | |
| Miscellaneous | | | 3,418,178 | | | | 379,647 | | | | — | | | | 3,797,825 | |
| Bonds, notes & other debt instruments: | | | | | | | | | | | | | | | | |
| Corporate bonds & notes | | | — | | | | 7,376,647 | | | | — | | | | 7,376,647 | |
| U.S. Treasury bonds & notes | | | — | | | | 6,295,984 | | | | — | | | | 6,295,984 | |
| Mortgage-backed obligations | | | — | | | | 5,316,245 | | | | — | | | | 5,316,245 | |
| Federal agency bonds & notes | | | — | | | | 1,833,152 | | | | — | | | | 1,833,152 | |
| Other | | | — | | | | 1,302,738 | | | | — | | | | 1,302,738 | |
| Miscellaneous | | | — | | | | 39,507 | | | | — | | | | 39,507 | |
| Short-term securities | | | — | | | | 4,757,034 | | | | — | | | | 4,757,034 | |
| Total | | $ | 51,522,193 | | | $ | 28,694,536 | | | $ | — | | | $ | 80,216,729 | |
| * | Securities with a value of $1,393,582,000, which represented 1.75% of the net assets of the fund, transferred from Level 1 to Level 2 since the prior fiscal year-end, primarily due to significant market movements following the close of local trading. |
4. Risk factors
Investing in the fund may involve certain risks including, but not limited to, those described below.
Market conditions — The prices of, and the income generated by, the common stocks, bonds and other securities held by the fund may decline – sometimes rapidly or unpredictably – due to various factors, including events or conditions affecting the general economy or particular industries; overall market changes; local, regional or global political, social or economic instability; governmental or governmental agency responses to economic conditions; and currency exchange, interest rate and commodity price fluctuations.
Issuer risks — The prices of, and the income generated by, securities held by the fund may decline in response to various factors directly related to the issuers of such securities, including reduced demand for an issuer’s goods or services, poor management performance and strategic initiatives such as mergers, acquisitions or dispositions and the market response to any such initiatives.
Investing in growth-oriented stocks — Growth-oriented common stocks and other equity-type securities (such as preferred stocks, convertible preferred stocks and convertible bonds) may involve larger price swings and greater potential for loss than other types of investments.
Investing in income-oriented stocks — Income provided by the fund may be reduced by changes in the dividend policies of, and the capital resources available for dividend payments at, the companies in which the fund invests.
Investing in debt instruments — The prices of, and the income generated by, bonds and other debt securities held by the fund may be affected by changing interest rates and by changes in the effective maturities and credit ratings of these securities.
Rising interest rates will generally cause the prices of bonds and other debt securities to fall. Falling interest rates may cause an issuer to redeem, call or refinance a debt security before its stated maturity, which may result in the fund having to reinvest the proceeds in lower yielding securities. Longer maturity debt securities generally have greater sensitivity to changes in interest rates and may be subject to greater price fluctuations than shorter maturity debt securities.
Bonds and other debt securities are also subject to credit risk, which is the possibility that the credit strength of an issuer will weaken and/or an issuer of a debt security will fail to make timely payments of principal or interest and the security will go into default. Lower quality debt securities generally have higher rates of interest and may be subject to greater price fluctuations than higher quality debt securities. Credit risk is gauged, in part, by the credit ratings of the debt securities in which the fund invests. However, ratings are only the opinions of the rating agencies issuing them and are not guarantees as to credit quality or an evaluation of market risk. The fund’s investment adviser relies on its own credit analysts to research issuers and issues in seeking to mitigate various credit and default risks.
Investing in securities backed by the U.S. government — Securities backed by the U.S. Treasury or the full faith and credit of the U.S. government are guaranteed only as to the timely payment of interest and principal when held to maturity. Accordingly, the current market values for these securities will fluctuate with changes in interest rates. Securities issued by government-sponsored entities and federal agencies and instrumentalities that are not backed by the full faith and credit of the U.S. government are neither issued nor guaranteed by the U.S. government.
Investing in mortgage-related and other asset-backed securities — Mortgage-related securities, such as mortgage-backed securities, and other asset-backed securities, include debt obligations that represent interests in pools of mortgages or other income-bearing assets, such as consumer loans or receivables. Such securities often involve risks that are different from or more acute than the risks associated with investing in other types of debt securities. Mortgage-backed and other asset-backed securities are subject to changes in the payment patterns of borrowers of the underlying debt. When interest rates fall, borrowers are more likely to refinance or prepay their debt before its stated maturity. This may result in the fund having to reinvest the proceeds in lower yielding securities, effectively reducing the fund’s income. Conversely, if interest rates rise and borrowers repay their debt more slowly than expected, the time in which the mortgage-backed and other asset-backed securities are paid off could be extended, reducing the fund’s cash available for reinvestment in higher yielding securities.
Thinly traded securities — There may be little trading in the secondary market for particular bonds or other debt securities, which may make them more difficult to value, acquire or sell.
Investing outside the U.S. — Securities of issuers domiciled outside the U.S., or with significant operations or revenues outside the U.S., may lose value because of adverse political, social, economic or market developments (including social instability, regional conflicts, terrorism and war) in the countries or regions in which the issuers operate or generate revenue. These securities may also lose value due
to changes in foreign currency exchange rates against the U.S. dollar and/or currencies of other countries. Issuers of these securities may be more susceptible to actions of foreign governments, such as the imposition of price controls or punitive taxes, that could adversely impact revenues. Securities markets in certain countries may be more volatile and/or less liquid than those in the U.S. Investments outside the U.S. may also be subject to different accounting practices and different regulatory, legal and reporting standards and practices, and may be more difficult to value, than those in the U.S. In addition, the value of investments outside the U.S. may be reduced by foreign taxes, including foreign withholding taxes on interest and dividends. Further, there may be increased risks of delayed settlement of securities purchased or sold by the fund. The risks of investing outside the U.S. may be heightened in connection with investments in emerging markets.
Management — The investment adviser to the fund actively manages the fund’s investments. Consequently, the fund is subject to the risk that the methods and analyses employed by the investment adviser in this process may not produce the desired results. This could cause the fund to lose value or its investment results to lag relevant benchmarks or other funds with similar objectives.
5. Certain investment techniques
Index-linked bonds — The fund has invested in index-linked bonds, which are fixed-income securities whose principal value is periodically adjusted to a government price index. Over the life of an index-linked bond, interest is paid on the adjusted principal value. Increases or decreases in the principal value of index-linked bonds are recorded as interest income in the fund’s statement of operations.
Mortgage dollar rolls — The fund has entered into mortgage dollar roll transactions in which the fund sells a mortgage-backed security to a counterparty and simultaneously enters into an agreement with the same counterparty to buy back a similar security on a specific future date at a predetermined price. Mortgage dollar rolls are accounted for as purchase and sale transactions, which may increase the fund’s portfolio turnover rate.
Loan transactions — The fund has entered into loan transactions in which the fund acquires a loan either through an agent, by assignment from another holder, or as a participation interest in another holder’s portion of a loan. The loan is often administered by a financial institution that acts as agent for the holders of the loan, and the fund may be required to receive approval from the agent and/or borrower prior to the sale of the investment. The loan’s interest rate and maturity date may change based on the terms of the loan, including potential early payments of principal.
6. Taxation and distributions
Federal income taxation — The fund complies with the requirements under Subchapter M of the Internal Revenue Code applicable to mutual funds and intends to distribute substantially all of its net taxable income and net capital gains each year. The fund is not subject to income taxes to the extent such distributions are made. Therefore, no federal income tax provision is required.
As of and during the period ended December 31, 2014, the fund did not have a liability for any unrecognized tax benefits. The fund recognizes interest and penalties, if any, related to unrecognized tax benefits as income tax expense in the statement of operations. During the period, the fund did not incur any interest or penalties.
The fund is not subject to examination by U.S. federal tax authorities for tax years before 2011 and by state tax authorities for tax years before 2010.
Non-U.S. taxation — Dividend and interest income are recorded net of non-U.S. taxes paid.
Distributions — Distributions paid to shareholders are based on net investment income and net realized gains determined on a tax basis, which may differ from net investment income and net realized gains for financial reporting purposes. These differences are due primarily to different treatment for items such as currency gains and losses; short-term capital gains and losses; capital losses related to sales of certain securities within 30 days of purchase; deferred expenses; cost of investments sold; and paydowns on fixed-income securities. The fiscal year in which amounts are distributed may differ from the year in which the net investment income and net realized gains are recorded by the fund for financial reporting purposes. The fund may also designate a portion of the amount paid to redeeming shareholders as a distribution for tax purposes.
During the year ended December 31, 2014, the fund reclassified $53,000 from undistributed net investment income to capital paid in on shares of beneficial interest, $10,356,000 from undistributed net realized gain to undistributed net investment income and $330,520,000 from undistributed net realized gain to capital paid in on shares of beneficial interest to align financial reporting with tax reporting.
As of December 31, 2014, the tax-basis components of distributable earnings, unrealized appreciation (depreciation) and cost of investment securities were as follows (dollars in thousands):
| Undistributed ordinary income | | $ | 126,541 | |
| Undistributed long-term capital gains | | | 293,489 | |
| Gross unrealized appreciation on investment securities | | | 21,786,135 | |
| Gross unrealized depreciation on investment securities | | | (616,538 | ) |
| Net unrealized appreciation on investment securities | | | 21,169,597 | |
| Cost of investment securities | | | 59,047,132 | |
The tax character of distributions paid to shareholders was as follows (dollars in thousands):
| | | Year ended December 31, 2014 | | | Year ended December 31, 2013 |
| | | | | | | | | Total | | | | | | | | | Total | |
| | | Ordinary | | | Long-term | | | distributions | | | Ordinary | | | Long-term | | | distributions | |
| Share class | | income | | | capital gains | | | paid | | | income | | | capital gains | | | paid | |
| Class A | | $ | 682,770 | | | $ | 2,574,901 | | | $ | 3,257,671 | | | $ | 652,292 | | | $ | — | | | $ | 652,292 | |
| Class B | | | 4,570 | | | | 30,111 | | | | 34,681 | | | | 8,009 | | | | — | | | | 8,009 | |
| Class C | | | 39,424 | | | | 306,922 | | | | 346,346 | | | | 43,012 | | | | — | | | | 43,012 | |
| Class F-1 | | | 40,381 | | | | 156,238 | | | | 196,619 | | | | 33,091 | | | | — | | | | 33,091 | |
| Class F-2 | | | 23,275 | | | | 100,875 | | | | 124,150 | | | | 11,288 | | | | — | | | | 11,288 | |
| Class 529-A | | | 39,082 | | | | 155,378 | | | | 194,460 | | | | 37,869 | | | | — | | | | 37,869 | |
| Class 529-B | | | 507 | | | | 4,036 | | | | 4,543 | | | | 894 | | | | — | | | | 894 | |
| Class 529-C | | | 5,839 | | | | 49,737 | | | | 55,576 | | | | 6,380 | | | | — | | | | 6,380 | |
| Class 529-E | | | 1,657 | | | | 7,925 | | | | 9,582 | | | | 1,684 | | | | — | | | | 1,684 | |
| Class 529-F-1 | | | 1,791 | | | | 6,088 | | | | 7,879 | | | | 1,669 | | | | — | | | | 1,669 | |
| Class R-1 | | | 1,139 | | | | 8,714 | | | | 9,853 | | | | 1,279 | | | | — | | | | 1,279 | |
| Class R-2 | | | 10,014 | | | | 72,266 | | | | 82,280 | | | | 12,038 | | | | — | | | | 12,038 | |
| Class R-2E* | | | — | † | | | 1 | | | | 1 | | | | | | | | | | | | | |
| Class R-3 | | | 38,877 | | | | 183,868 | | | | 222,745 | | | | 40,498 | | | | — | | | | 40,498 | |
| Class R-4 | | | 63,239 | | | | 242,446 | | | | 305,685 | | | | 61,020 | | | | — | | | | 61,020 | |
| Class R-5 | | | 45,017 | | | | 146,814 | | | | 191,831 | | | | 45,056 | | | | — | | | | 45,056 | |
| Class R-6 | | | 91,728 | | | | 319,323 | | | | 411,051 | | | | 60,512 | | | | — | | | | 60,512 | |
| Total | | $ | 1,089,310 | | | $ | 4,365,643 | | | $ | 5,454,953 | | | $ | 1,016,591 | | | $ | — | | | $ | 1,016,591 | |
| * | Class R-2E shares were offered beginning August 29, 2014. |
| † | Amount less than one thousand. |
7. Fees and transactions with related parties
CRMC, the fund’s investment adviser, is the parent company of American Funds Distributors,® Inc. (“AFD”), the principal underwriter of the fund’s shares, and American Funds Service Company® (“AFS”), the fund’s transfer agent. CRMC, AFD and AFS are considered related parties to the fund.
Investment advisory services — The fund has an investment advisory and service agreement with CRMC that provides for monthly fees accrued daily. These fees are based on a series of decreasing annual rates beginning with 0.420% on the first $500 million of daily net assets and decreasing to 0.210% on such assets in excess of $71 billion. For the year ended December 31, 2014, the investment advisory services fee was $173,885,000, which was equivalent to an annualized rate of 0.232% of average daily net assets.
Class-specific fees and expenses — Expenses that are specific to individual share classes are accrued directly to the respective share class. The principal class-specific fees and expenses are further described below:
Distribution services — The fund has plans of distribution for all share classes, except Class F-2, R-5 and R-6 shares. Under the plans, the board of trustees approves certain categories of expenses that are used to finance activities primarily intended to sell fund shares and service existing accounts. The plans provide for payments, based on an annualized percentage of average daily net assets, ranging from 0.25% to 1.00% as noted in this section. In some cases, the board of trustees has limited the amounts that may be paid to less than the maximum allowed by the plans. All share classes with a plan may use up to 0.25% of average daily net assets to pay
service fees, or to compensate AFD for paying service fees, to firms that have entered into agreements with AFD to provide certain shareholder services. The remaining amounts available to be paid under each plan are paid to dealers to compensate them for their sales activities.
For Class A and 529-A shares, distribution-related expenses include the reimbursement of dealer and wholesaler commissions paid by AFD for certain shares sold without a sales charge. These share classes reimburse AFD for amounts billed within the prior 15 months but only to the extent that the overall annual expense limit of 0.25% is not exceeded. As of December 31, 2014, there were no unreimbursed expenses subject to reimbursement for Class A or 529-A shares.
| Share class | | Currently approved limits | | Plan limits |
| Class A | | | 0.25 | % | | | 0.25 | % |
| Class 529-A | | | 0.25 | | | | 0.50 | |
| Classes B and 529-B | | | 1.00 | | | | 1.00 | |
| Classes C, 529-C and R-1 | | | 1.00 | | | | 1.00 | |
| Class R-2 | | | 0.75 | | | | 1.00 | |
| Class R-2E | | | 0.60 | | | | 0.85 | |
| Classes 529-E and R-3 | | | 0.50 | | | | 0.75 | |
| Classes F-1, 529-F-1 and R-4 | | | 0.25 | | | | 0.50 | |
Transfer agent services — The fund has a shareholder services agreement with AFS under which the fund compensates AFS for providing transfer agent services to each of the fund’s share classes. These services include recordkeeping, shareholder communications and transaction processing. In addition, the fund reimburses AFS for amounts paid to third parties for performing transfer agent services on behalf of fund shareholders.
Administrative services — The fund has an administrative services agreement with CRMC under which the fund compensates CRMC for providing administrative services to Class A, C, F, 529 and R shares. These services include, but are not limited to, coordinating, monitoring, assisting and overseeing third parties that provide services to fund shareholders. Under the agreement, Class A shares pay an annual fee of 0.01% and Class C, F, 529 and R shares pay an annual fee of 0.05% of their respective average daily net assets.
529 plan services — Each 529 share class is subject to service fees to compensate the Virginia College Savings Plan (“Virginia529”) for its oversight and administration of the 529 college savings plan. During the period January 1, 2014, to March 31, 2014, the quarterly fee was based on a series of decreasing annual rates beginning with 0.10% on the first $30 billion of the net assets invested in Class 529 shares of the American Funds and decreasing to 0.06% on such assets between $120 billion and $150 billion. Effective April 1, 2014, the quarterly fee was amended to provide for reduced annual rates of 0.07%, 0.06% and 0.05% over $30 billion, $50 billion and $70 billion, respectively, of the net assets invested in Class 529 shares of the American Funds. The fee for any given calendar quarter is accrued and calculated on the basis of the average net assets of Class 529 shares of the American Funds for the last month of the prior calendar quarter. The fee is included in other expenses in the fund’s statement of operations. Virginia529 is not considered a related party to the fund.
For the year ended December 31, 2014, class-specific expenses under the agreements were as follows (dollars in thousands):
| | | Distribution | | Transfer agent | | Administrative | | 529 plan |
| Share class | | services | | services | | services | | services |
| Class A | | $106,617 | | $46,310 | | $4,456 | | Not applicable |
| Class B | | 6,538 | | 675 | | Not applicable | | Not applicable |
| Class C | | 53,412 | | 5,419 | | 2,677 | | Not applicable |
| Class F-1 | | 6,702 | | 3,025 | | 1,343 | | Not applicable |
| Class F-2 | | Not applicable | | 1,238 | | 630 | | Not applicable |
| Class 529-A | | 6,081 | | 2,136 | | 1,355 | | $2,470 |
| Class 529-B | | 872 | | 80 | | 44 | | 80 |
| Class 529-C | | 8,641 | | 724 | | 435 | | 793 |
| Class 529-E | | 691 | | 77 | | 70 | | 127 |
| Class 529-F-1 | | — | | 83 | | 54 | | 98 |
| Class R-1 | | 1,522 | | 149 | | 76 | | Not applicable |
| Class R-2 | | 9,664 | | 4,155 | | 648 | | Not applicable |
| Class R-2E* | | — | | — | † | — | † | Not applicable |
| Class R-3 | | 16,385 | | 4,918 | | 1,641 | | Not applicable |
| Class R-4 | | 10,626 | | 4,286 | | 2,126 | | Not applicable |
| Class R-5 | | Not applicable | | 1,266 | | 1,276 | | Not applicable |
| Class R-6 | | Not applicable | | 23 | | 2,444 | | Not applicable |
| Total class-specific expenses | | $227,751 | | $74,564 | | $19,275 | | $3,568 |
| * | Class R-2E shares were offered beginning August 29, 2014. |
| † | Amount less than one thousand. |
Trustees’ deferred compensation — Trustees who are unaffiliated with CRMC may elect to defer the cash payment of part or all of their compensation. These deferred amounts, which remain as liabilities of the fund, are treated as if invested in shares of the fund or other American Funds. These amounts represent general, unsecured liabilities of the fund and vary according to the total returns of the selected funds. Trustees’ compensation of $703,000 in the fund’s statement of operations includes $359,000 in current fees (either paid in cash or deferred) and a net increase of $344,000 in the value of the deferred amounts.
Affiliated officers and trustees — Officers and certain trustees of the fund are or may be considered to be affiliated with CRMC, AFD and AFS. No affiliated officers or trustees received any compensation directly from the fund.
8. Capital share transactions
Capital share transactions in the fund were as follows (dollars and shares in thousands):
| | | | | | | | | Reinvestments of | | | | | | | | | Net increase | |
| | | Sales1 | | | dividends and distributions | | | Repurchases1 | | | (decrease) | |
| Share class | | Amount | | | Shares | | | Amount | | | Shares | | | Amount | | | Shares | | | Amount | | | Shares | |
| | | | | | | | | | | | | | | | | | | | | | | |
| Year ended December 31, 2014 | | | | | | | | | | | | | | | | | | | | | | |
| | | | | | | | | | | | | | | | | | | | | | | | | | | | | | | | | |
| Class A | | $ | 5,744,075 | | | | 229,172 | | | $ | 3,208,616 | | | | 128,744 | | | $ | (5,334,850 | ) | | | (212,761 | ) | | $ | 3,617,841 | | | | 145,155 | |
| Class B | | | 11,642 | | | | 468 | | | | 34,382 | | | | 1,383 | | | | (339,367 | ) | | | (13,639 | ) | | | (293,343 | ) | | | (11,788 | ) |
| Class C | | | 1,264,417 | | | | 50,711 | | | | 340,638 | | | | 13,740 | | | | (1,346,464 | ) | | | (54,047 | ) | | | 258,591 | | | | 10,404 | |
| Class F-1 | | | 1,131,467 | | | | 45,255 | | | | 191,675 | | | | 7,698 | | | | (991,786 | ) | | | (39,337 | ) | | | 331,356 | | | | 13,616 | |
| Class F-2 | | | 1,221,630 | | | | 48,341 | | | | 117,423 | | | | 4,710 | | | | (225,168 | ) | | | (8,954 | ) | | | 1,113,885 | | | | 44,097 | |
| Class 529-A | | | 349,840 | | | | 13,993 | | | | 194,398 | | | | 7,813 | | | | (347,878 | ) | | | (13,849 | ) | | | 196,360 | | | | 7,957 | |
| Class 529-B | | | 3,128 | | | | 125 | | | | 4,542 | | | | 183 | | | | (44,288 | ) | | | (1,773 | ) | | | (36,618 | ) | | | (1,465 | ) |
| Class 529-C | | | 127,469 | | | | 5,097 | | | | 55,560 | | | | 2,235 | | | | (130,776 | ) | | | (5,210 | ) | | | 52,253 | | | | 2,122 | |
| Class 529-E | | | 18,259 | | | | 729 | | | | 9,582 | | | | 386 | | | | (19,879 | ) | | | (791 | ) | | | 7,962 | | | | 324 | |
| Class 529-F-1 | | | 21,845 | | | | 874 | | | | 7,877 | | | | 317 | | | | (21,674 | ) | | | (865 | ) | | | 8,048 | | | | 326 | |
| Class R-1 | | | 33,513 | | | | 1,347 | | | | 9,788 | | | | 395 | | | | (37,993 | ) | | | (1,530 | ) | | | 5,308 | | | | 212 | |
| Class R-2 | | | 282,068 | | | | 11,333 | | | | 82,235 | | | | 3,318 | | | | (378,716 | ) | | | (15,212 | ) | | | (14,413 | ) | | | (561 | ) |
| Class R-2E2 | | | 10 | | | | — | 3 | | | — | | | | — | | | | — | | | | — | | | | 10 | | | | — | 3 |
| Class R-3 | | | 774,249 | | | | 31,058 | | | | 222,561 | | | | 8,971 | | | | (939,199 | ) | | | (37,601 | ) | | | 57,611 | | | | 2,428 | |
| Class R-4 | | | 1,019,955 | | | | 40,816 | | | | 305,651 | | | | 12,284 | | | | (990,090 | ) | | | (39,478 | ) | | | 335,516 | | | | 13,622 | |
| Class R-5 | | | 698,623 | | | | 27,924 | | | | 191,801 | | | | 7,691 | | | | (800,550 | ) | | | (32,002 | ) | | | 89,874 | | | | 3,613 | |
| Class R-6 | | | 2,191,350 | | | | 87,519 | | | | 411,051 | | | | 16,488 | | | | (470,534 | ) | | | (18,714 | ) | | | 2,131,867 | | | | 85,293 | |
| Total net increase (decrease) | | $ | 14,893,540 | | | | 594,762 | | | $ | 5,387,780 | | | | 216,356 | | | $ | (12,419,212 | ) | | | (495,763 | ) | | $ | 7,862,108 | | | | 315,355 | |
| | | | | | | | | Reinvestments of | | | | | | | | | Net increase | |
| | | Sales1 | | | dividends and distributions | | | Repurchases1 | | | (decrease) | |
| Share class | | Amount | | | Shares | | | Amount | | | Shares | | | Amount | | | Shares | | | Amount | | | Shares | |
| | | | | | | | | | | | | | | | | | | | | | | |
| Year ended December 31, 2013 | | | | | | | | | | | | | | | | | | | | | | |
| | | | | | | | | | | | | | | | | | | | | | | | | | | | | | | | | |
| Class A | | $ | 5,771,710 | | | | 257,019 | | | $ | 638,399 | | | | 28,228 | | | $ | (4,829,974 | ) | | | (215,037 | ) | | $ | 1,580,135 | | | | 70,210 | |
| Class B | | | 28,456 | | | | 1,275 | | | | 7,915 | | | | 353 | | | | (512,404 | ) | | | (23,120 | ) | | | (476,033 | ) | | | (21,492 | ) |
| Class C | | | 1,085,377 | | | | 48,422 | | | | 41,910 | | | | 1,864 | | | | (1,071,709 | ) | | | (47,809 | ) | | | 55,578 | | | | 2,477 | |
| Class F-1 | | | 953,519 | | | | 42,210 | | | | 32,319 | | | | 1,425 | | | | (359,799 | ) | | | (15,964 | ) | | | 626,039 | | | | 27,671 | |
| Class F-2 | | | 339,973 | | | | 15,053 | | | | 9,980 | | | | 440 | | | | (103,614 | ) | | | (4,571 | ) | | | 246,339 | | | | 10,922 | |
| Class 529-A | | | 353,333 | | | | 15,775 | | | | 37,862 | | | | 1,677 | | | | (314,364 | ) | | | (14,003 | ) | | | 76,831 | | | | 3,449 | |
| Class 529-B | | | 4,298 | | | | 192 | | | | 894 | | | | 40 | | | | (54,165 | ) | | | (2,423 | ) | | | (48,973 | ) | | | (2,191 | ) |
| Class 529-C | | | 125,242 | | | | 5,596 | | | | 6,377 | | | | 283 | | | | (122,695 | ) | | | (5,469 | ) | | | 8,924 | | | | 410 | |
| Class 529-E | | | 18,834 | | | | 840 | | | | 1,684 | | | | 75 | | | | (20,477 | ) | | | (909 | ) | | | 41 | | | | 6 | |
| Class 529-F-1 | | | 20,468 | | | | 910 | | | | 1,669 | | | | 74 | | | | (18,738 | ) | | | (840 | ) | | | 3,399 | | | | 144 | |
| Class R-1 | | | 45,246 | | | | 2,057 | | | | 1,273 | | | | 57 | | | | (41,530 | ) | | | (1,868 | ) | | | 4,989 | | | | 246 | |
| Class R-2 | | | 305,186 | | | | 13,736 | | | | 12,032 | | | | 536 | | | | (392,794 | ) | | | (17,617 | ) | | | (75,576 | ) | | | (3,345 | ) |
| Class R-3 | | | 809,579 | | | | 36,322 | | | | 40,465 | | | | 1,798 | | | | (780,292 | ) | | | (34,843 | ) | | | 69,752 | | | | 3,277 | |
| Class R-4 | | | 1,267,150 | | | | 57,206 | | | | 61,018 | | | | 2,703 | | | | (984,030 | ) | | | (43,663 | ) | | | 344,138 | | | | 16,246 | |
| Class R-5 | | | 551,314 | | | | 24,580 | | | | 45,053 | | | | 1,991 | | | | (561,872 | ) | | | (24,996 | ) | | | 34,495 | | | | 1,575 | |
| Class R-6 | | | 1,519,961 | | | | 67,390 | | | | 60,512 | | | | 2,664 | | | | (347,726 | ) | | | (15,363 | ) | | | 1,232,747 | | | | 54,691 | |
| Total net increase (decrease) | | $ | 13,199,646 | | | | 588,583 | | | $ | 999,362 | | | | 44,208 | | | $ | (10,516,183 | ) | | | (468,495 | ) | | $ | 3,682,825 | | | | 164,296 | |
| 1 | Includes exchanges between share classes of the fund. |
| 2 | Class R-2E shares were offered beginning August 29, 2014. |
| 3 | Amount less than one thousand. |
9. Investment transactions
The fund made purchases and sales of investment securities, excluding short-term securities and U.S. government obligations, if any, of $38,349,712,000 and $36,945,803,000, respectively, during the year ended December 31, 2014.
Financial highlights
| | | | | | Income (loss) from
investment operations1 | | | Dividends and distributions | | | | | | | | | | | | | | | |
| | | Net asset
value,
beginning
of period | | | Net
investment
income
(loss)2 | | | Net gains
(losses) on
securities
(both
realized and
unrealized) | | | Total from
investment
operations | | | Dividends
(from net
investment
income) | | | Distributions
(from capital
gains) | | | Total
dividends
and
distributions | | | Net asset
value,
end
of period | | | Total
return3,4 | | | Net assets,
end of period
(in millions) | | | Ratio of
expenses to
average
net assets | | | Ratio of
net income
(loss) to
average
net assets2 | |
| Class A: | | | | | | | | | | | | | | | | | | | | | | | | | | | | | | | | | | | | | | | | | | | | | | | | |
| Year ended 12/31/2014 | | $ | 24.42 | | | $ | .41 | | | $ | 1.75 | | | $ | 2.16 | | | $ | (.39 | ) | | $ | (1.44 | ) | | $ | (1.83 | ) | | $ | 24.75 | | | | 8.85 | % | | $ | 46,917 | | | | .59 | % | | | 1.62 | % |
| Year ended 12/31/2013 | | | 20.40 | | | | .36 | | | | 4.04 | | | | 4.40 | | | | (.38 | ) | | | — | | | | (.38 | ) | | | 24.42 | | | | 21.73 | | | | 42,735 | | | | .61 | | | | 1.62 | |
| Year ended 12/31/2012 | | | 18.21 | | | | .38 | | | | 2.19 | | | | 2.57 | | | | (.38 | ) | | | — | | | | (.38 | ) | | | 20.40 | | | | 14.19 | | | | 34,272 | | | | .63 | | | | 1.94 | |
| Year ended 12/31/2011 | | | 17.93 | | | | .36 | | | | .32 | | | | .68 | | | | (.40 | ) | | | — | | | | (.40 | ) | | | 18.21 | | | | 3.82 | | | | 30,716 | | | | .62 | | | | 1.97 | |
| Year ended 12/31/2010 | | | 16.21 | | | | .40 | | | | 1.68 | | | | 2.08 | | | | (.36 | ) | | | — | | | | (.36 | ) | | | 17.93 | | | | 13.02 | | | | 31,409 | | | | .63 | | | | 2.42 | |
| Class B: | | | | | | | | | | | | | | | | | | | | | | | | | | | | | | | | | | | | | | | | | | | | | | | | |
| Year ended 12/31/2014 | | | 24.37 | | | | .22 | | | | 1.74 | | | | 1.96 | | | | (.18 | ) | | | (1.44 | ) | | | (1.62 | ) | | | 24.71 | | | | 8.05 | | | | 541 | | | | 1.34 | | | | .87 | |
| Year ended 12/31/2013 | | | 20.35 | | | | .19 | | | | 4.03 | | | | 4.22 | | | | (.20 | ) | | | — | | | | (.20 | ) | | | 24.37 | | | | 20.81 | | | | 821 | | | | 1.36 | | | | .86 | |
| Year ended 12/31/2012 | | | 18.16 | | | | .23 | | | | 2.19 | | | | 2.42 | | | | (.23 | ) | | | — | | | | (.23 | ) | | | 20.35 | | | | 13.35 | | | | 1,123 | | | | 1.38 | | | | 1.17 | |
| Year ended 12/31/2011 | | | 17.87 | | | | .22 | | | | .33 | | | | .55 | | | | (.26 | ) | | | — | | | | (.26 | ) | | | 18.16 | | | | 3.08 | | | | 1,745 | | | | 1.38 | | | | 1.21 | |
| Year ended 12/31/2010 | | | 16.16 | | | | .28 | | | | 1.66 | | | | 1.94 | | | | (.23 | ) | | | — | | | | (.23 | ) | | | 17.87 | | | | 12.12 | | | | 2,573 | | | | 1.38 | | | | 1.66 | |
| Class C: | | | | | | | | | | | | | | | | | | | | | | | | | | | | | | | | | | | | | | | | | | | | | | | | |
| Year ended 12/31/2014 | | | 24.30 | | | | .21 | | | | 1.75 | | | | 1.96 | | | | (.19 | ) | | | (1.44 | ) | | | (1.63 | ) | | | 24.63 | | | | 8.03 | | | | 5,574 | | | | 1.39 | | | | .83 | |
| Year ended 12/31/2013 | | | 20.31 | | | | .19 | | | | 4.00 | | | | 4.19 | | | | (.20 | ) | | | — | | | | (.20 | ) | | | 24.30 | | | | 20.72 | | | | 5,247 | | | | 1.41 | | | | .83 | |
| Year ended 12/31/2012 | | | 18.13 | | | | .22 | | | | 2.18 | | | | 2.40 | | | | (.22 | ) | | | — | | | | (.22 | ) | | | 20.31 | | | | 13.30 | | | | 4,334 | | | | 1.42 | | | | 1.14 | |
| Year ended 12/31/2011 | | | 17.85 | | | | .21 | | | | .32 | | | | .53 | | | | (.25 | ) | | | — | | | | (.25 | ) | | | 18.13 | | | | 3.00 | | | | 4,247 | | | | 1.42 | | | | 1.17 | |
| Year ended 12/31/2010 | | | 16.14 | | | | .27 | | | | 1.67 | | | | 1.94 | | | | (.23 | ) | | | — | | | | (.23 | ) | | | 17.85 | | | | 12.11 | | | | 4,576 | | | | 1.43 | | | | 1.61 | |
| Class F-1: | | | | | | | | | | | | | | | | | | | | | | | | | | | | | | | | | | | | | | | | | | | | | | | | |
| Year ended 12/31/2014 | | | 24.41 | | | | .39 | | | | 1.75 | | | | 2.14 | | | | (.37 | ) | | | (1.44 | ) | | | (1.81 | ) | | | 24.74 | | | | 8.80 | | | | 2,841 | | | | .65 | | | | 1.57 | |
| Year ended 12/31/2013 | | | 20.39 | | | | .36 | | | | 4.03 | | | | 4.39 | | | | (.37 | ) | | | — | | | | (.37 | ) | | | 24.41 | | | | 21.70 | | | | 2,471 | | | | .66 | | | | 1.58 | |
| Year ended 12/31/2012 | | | 18.21 | | | | .38 | | | | 2.18 | | | | 2.56 | | | | (.38 | ) | | | — | | | | (.38 | ) | | | 20.39 | | | | 14.13 | | | | 1,500 | | | | .64 | | | | 1.94 | |
| Year ended 12/31/2011 | | | 17.92 | | | | .36 | | | | .33 | | | | .69 | | | | (.40 | ) | | | — | | | | (.40 | ) | | | 18.21 | | | | 3.87 | | | | 1,014 | | | | .63 | | | | 1.96 | |
| Year ended 12/31/2010 | | | 16.21 | | | | .40 | | | | 1.67 | | | | 2.07 | | | | (.36 | ) | | | — | | | | (.36 | ) | | | 17.92 | | | | 12.95 | | | | 895 | | | | .63 | | | | 2.41 | |
| Class F-2: | | | | | | | | | | | | | | | | | | | | | | | | | | | | | | | | | | | | | | | | | | | | | | | | |
| Year ended 12/31/2014 | | | 24.41 | | | | .46 | | | | 1.75 | | | | 2.21 | | | | (.44 | ) | | | (1.44 | ) | | | (1.88 | ) | | | 24.74 | | | | 9.08 | | | | 1,869 | | | | .39 | | | | 1.83 | |
| Year ended 12/31/2013 | | | 20.39 | | | | .41 | | | | 4.04 | | | | 4.45 | | | | (.43 | ) | | | — | | | | (.43 | ) | | | 24.41 | | | | 21.99 | | | | 768 | | | | .41 | | | | 1.83 | |
| Year ended 12/31/2012 | | | 18.21 | | | | .43 | | | | 2.18 | | | | 2.61 | | | | (.43 | ) | | | — | | | | (.43 | ) | | | 20.39 | | | | 14.40 | | | | 419 | | | | .40 | | | | 2.18 | |
| Year ended 12/31/2011 | | | 17.92 | | | | .40 | | | | .33 | | | | .73 | | | | (.44 | ) | | | — | | | | (.44 | ) | | | 18.21 | | | | 4.12 | | | | 277 | | | | .40 | | | | 2.19 | |
| Year ended 12/31/2010 | | | 16.21 | | | | .44 | | | | 1.67 | | | | 2.11 | | | | (.40 | ) | | | — | | | | (.40 | ) | | | 17.92 | | | | 13.21 | | | | 228 | | | | .40 | | | | 2.63 | |
| Class 529-A: | | | | | | | | | | | | | | | | | | | | | | | | | | | | | | | | | | | | | | | | | | | | | | | | |
| Year ended 12/31/2014 | | | 24.39 | | | | .38 | | | | 1.75 | | | | 2.13 | | | | (.36 | ) | | | (1.44 | ) | | | (1.80 | ) | | | 24.72 | | | | 8.76 | | | | 2,831 | | | | .68 | | | | 1.53 | |
| Year ended 12/31/2013 | | | 20.38 | | | | .34 | | | | 4.03 | | | | 4.37 | | | | (.36 | ) | | | — | | | | (.36 | ) | | | 24.39 | | | | 21.60 | | | | 2,599 | | | | .70 | | | | 1.53 | |
| Year ended 12/31/2012 | | | 18.19 | | | | .36 | | | | 2.19 | | | | 2.55 | | | | (.36 | ) | | | — | | | | (.36 | ) | | | 20.38 | | | | 14.12 | | | | 2,101 | | | | .71 | | | | 1.86 | |
| Year ended 12/31/2011 | | | 17.91 | | | | .34 | | | | .33 | | | | .67 | | | | (.39 | ) | | | — | | | | (.39 | ) | | | 18.19 | | | | 3.75 | | | | 1,751 | | | | .70 | | | | 1.89 | |
| Year ended 12/31/2010 | | | 16.19 | | | | .39 | | | | 1.68 | | | | 2.07 | | | | (.35 | ) | | | — | | | | (.35 | ) | | | 17.91 | | | | 12.97 | | | | 1,589 | | | | .69 | | | | 2.35 | |
| Class 529-B: | | | | | | | | | | | | | | | | | | | | | | | | | | | | | | | | | | | | | | | | | | | | | | | | |
| Year ended 12/31/2014 | | | 24.41 | | | | .19 | | | | 1.75 | | | | 1.94 | | | | (.15 | ) | | | (1.44 | ) | | | (1.59 | ) | | | 24.76 | | | | 7.94 | | | | 73 | | | | 1.46 | | | | .75 | |
| Year ended 12/31/2013 | | | 20.39 | | | | .17 | | | | 4.02 | | | | 4.19 | | | | (.17 | ) | | | — | | | | (.17 | ) | | | 24.41 | | | | 20.63 | | | | 108 | | | | 1.49 | | | | .74 | |
| Year ended 12/31/2012 | | | 18.19 | | | | .21 | | | | 2.19 | | | | 2.40 | | | | (.20 | ) | | | — | | | | (.20 | ) | | | 20.39 | | | | 13.24 | | | | 134 | | | | 1.50 | | | | 1.05 | |
| Year ended 12/31/2011 | | | 17.90 | | | | .20 | | | | .33 | | | | .53 | | | | (.24 | ) | | | — | | | | (.24 | ) | | | 18.19 | | | | 2.95 | | | | 180 | | | | 1.49 | | | | 1.09 | |
| Year ended 12/31/2010 | | | 16.19 | | | | .26 | | | | 1.66 | | | | 1.92 | | | | (.21 | ) | | | — | | | | (.21 | ) | | | 17.90 | | | | 11.99 | | | | 244 | | | | 1.48 | | | | 1.56 | |
Financial highlights (continued)
| | | | | | Income (loss) from
investment operations1 | | Dividends and distributions | | | | | | | | | | | | | | | |
| | Net asset
value,
beginning
of period | | | Net
investment
income
(loss)2 | | | Net gains
(losses) on
securities
(both
realized and
unrealized) | | | Total from
investment
operations | | | Dividends
(from net
investment
income) | | | Distributions
(from capital
gains) | | | Total
dividends
and
distributions | | | Net asset
value,
end
of period | | | Total
return3,4 | | | Net assets,
end of period
(in millions) | | | Ratio of
expenses to
average
net assets | | | Ratio of
net income
(loss) to
average
net assets2 | |
| Class 529-C: | | | | | | | | | | | | | | | | | | | | | | | | | | | | | | | | | | | | | | | | | | | | | | | | |
| Year ended 12/31/2014 | | $ | 24.38 | | | $ | .19 | | | $ | 1.74 | | | $ | 1.93 | | | $ | (.17 | ) | | $ | (1.44 | ) | | $ | (1.61 | ) | | $ | 24.70 | | | | 7.90 | % | | $ | 905 | | | | 1.46 | % | | | .76 | % |
| Year ended 12/31/2013 | | | 20.37 | | | | .17 | | | | 4.03 | | | | 4.20 | | | | (.19 | ) | | | — | | | | (.19 | ) | | | 24.38 | | | | 20.68 | | | | 841 | | | | 1.48 | | | | .76 | |
| Year ended 12/31/2012 | | | 18.19 | | | | .21 | | | | 2.18 | | | | 2.39 | | | | (.21 | ) | | | — | | | | (.21 | ) | | | 20.37 | | | | 13.19 | | | | 694 | | | | 1.49 | | | | 1.08 | |
| Year ended 12/31/2011 | | | 17.90 | | | | .20 | | | | .33 | | | | .53 | | | | (.24 | ) | | | — | | | | (.24 | ) | | | 18.19 | | | | 3.00 | | | | 607 | | | | 1.48 | | | | 1.11 | |
| Year ended 12/31/2010 | | | 16.19 | | | | .26 | | | | 1.67 | | | | 1.93 | | | | (.22 | ) | | | — | | | | (.22 | ) | | | 17.90 | | | | 12.03 | | | | 583 | | | | 1.48 | | | | 1.57 | |
| Class 529-E: | | | | | | | | | | | | | | | | | | | | | | | | | | | | | | | | | | | | | | | | | | | | | | | | |
| Year ended 12/31/2014 | | | 24.38 | | | | .32 | | | | 1.75 | | | | 2.07 | | | | (.30 | ) | | | (1.44 | ) | | | (1.74 | ) | | | 24.71 | | | | 8.50 | | | | 144 | | | | .93 | | | | 1.28 | |
| Year ended 12/31/2013 | | | 20.37 | | | | .29 | | | | 4.02 | | | | 4.31 | | | | (.30 | ) | | | — | | | | (.30 | ) | | | 24.38 | | | | 21.31 | | | | 134 | | | | .95 | | | | 1.29 | |
| Year ended 12/31/2012 | | | 18.18 | | | | .31 | | | | 2.19 | | | | 2.50 | | | | (.31 | ) | | | — | | | | (.31 | ) | | | 20.37 | | | | 13.84 | | | | 112 | | | | .97 | | | | 1.60 | |
| Year ended 12/31/2011 | | | 17.90 | | | | .30 | | | | .32 | | | | .62 | | | | (.34 | ) | | | — | | | | (.34 | ) | | | 18.18 | | | | 3.47 | | | | 98 | | | | .97 | | | | 1.62 | |
| Year ended 12/31/2010 | | | 16.19 | | | | .35 | | | | 1.66 | | | | 2.01 | | | | (.30 | ) | | | — | | | | (.30 | ) | | | 17.90 | | | | 12.59 | | | | 92 | | | | .97 | | | | 2.07 | |
| Class 529-F-1: | | | | | | | | | | | | | | | | | | | | | | | | | | | | | | | | | | | | | | | | | | | | | | | | |
| Year ended 12/31/2014 | | | 24.37 | | | | .44 | | | | 1.76 | | | | 2.20 | | | | (.42 | ) | | | (1.44 | ) | | | (1.86 | ) | | | 24.71 | | | | 9.05 | | | | 111 | | | | .46 | | | | 1.76 | |
| Year ended 12/31/2013 | | | 20.36 | | | | .39 | | | | 4.03 | | | | 4.42 | | | | (.41 | ) | | | — | | | | (.41 | ) | | | 24.37 | | | | 21.88 | | | | 101 | | | | .48 | | | | 1.76 | |
| Year ended 12/31/2012 | | | 18.18 | | | | .41 | | | | 2.18 | | | | 2.59 | | | | (.41 | ) | | | — | | | | (.41 | ) | | | 20.36 | | | | 14.32 | | | | 82 | | | | .49 | | | | 2.09 | |
| Year ended 12/31/2011 | | | 17.90 | | | | .38 | | | | .33 | | | | .71 | | | | (.43 | ) | | | — | | | | (.43 | ) | | | 18.18 | | | | 3.98 | | | | 61 | | | | .48 | | | | 2.11 | |
| Year ended 12/31/2010 | | | 16.19 | | | | .43 | | | | 1.67 | | | | 2.10 | | | | (.39 | ) | | | — | | | | (.39 | ) | | | 17.90 | | | | 13.15 | | | | 57 | | | | .47 | | | | 2.57 | |
| Class R-1: | | | | | | | | | | | | | | | | | | | | | | | | | | | | | | | | | | | | | | | | | | | | | | | | |
| Year ended 12/31/2014 | | | 24.28 | | | | .21 | | | | 1.75 | | | | 1.96 | | | | (.19 | ) | | | (1.44 | ) | | | (1.63 | ) | | | 24.61 | | | | 8.05 | | | | 158 | | | | 1.38 | | | | .83 | |
| Year ended 12/31/2013 | | | 20.29 | | | | .19 | | | | 4.01 | | | | 4.20 | | | | (.21 | ) | | | — | | | | (.21 | ) | | | 24.28 | | | | 20.76 | | | | 151 | | | | 1.39 | | | | .84 | |
| Year ended 12/31/2012 | | | 18.12 | | | | .23 | | | | 2.17 | | | | 2.40 | | | | (.23 | ) | | | — | | | | (.23 | ) | | | 20.29 | | | | 13.28 | | | | 121 | | | | 1.40 | | | | 1.16 | |
| Year ended 12/31/2011 | | | 17.83 | | | | .22 | | | | .33 | | | | .55 | | | | (.26 | ) | | | — | | | | (.26 | ) | | | 18.12 | | | | 3.09 | | | | 126 | | | | 1.40 | | | | 1.19 | |
| Year ended 12/31/2010 | | | 16.13 | | | | .27 | | | | 1.66 | | | | 1.93 | | | | (.23 | ) | | | — | | | | (.23 | ) | | | 17.83 | | | | 12.10 | | | | 135 | | | | 1.40 | | | | 1.65 | |
| Class R-2: | | | | | | | | | | | | | | | | | | | | | | | | | | | | | | | | | | | | | | | | | | | | | | | | |
| Year ended 12/31/2014 | | | 24.30 | | | | .21 | | | | 1.74 | | | | 1.95 | | | | (.19 | ) | | | (1.44 | ) | | | (1.63 | ) | | | 24.62 | | | | 8.03 | | | | 1,308 | | | | 1.36 | | | | .86 | |
| Year ended 12/31/2013 | | | 20.30 | | | | .20 | | | | 4.02 | | | | 4.22 | | | | (.22 | ) | | | — | | | | (.22 | ) | | | 24.30 | | | | 20.87 | | | | 1,304 | | | | 1.34 | | | | .90 | |
| Year ended 12/31/2012 | | | 18.13 | | | | .23 | | | | 2.18 | | | | 2.41 | | | | (.24 | ) | | | — | | | | (.24 | ) | | | 20.30 | | | | 13.31 | | | | 1,158 | | | | 1.37 | | | | 1.20 | |
| Year ended 12/31/2011 | | | 17.85 | | | | .22 | | | | .32 | | | | .54 | | | | (.26 | ) | | | — | | | | (.26 | ) | | | 18.13 | | | | 3.05 | | | | 1,079 | | | | 1.38 | | | | 1.21 | |
| Year ended 12/31/2010 | | | 16.14 | | | | .27 | | | | 1.67 | | | | 1.94 | | | | (.23 | ) | | | — | | | | (.23 | ) | | | 17.85 | | | | 12.14 | | | | 1,128 | | | | 1.40 | | | | 1.64 | |
| Class R-2E: | | | | | | | | | | | | | | | | | | | | | | | | | | | | | | | | | | | | | | | | | | | | | | | | |
Period from 8/29/2014
to 12/31/20145,6 | | | 25.81 | | | | .15 | | | | .41 | | | | .56 | | | | (.21 | ) | | | (1.41 | ) | | | (1.62 | ) | | | 24.75 | | | | 2.17 | | | | — | 7 | | | .16 | 4,8 | | | .58 | 4,8 |
| Class R-3: | | | | | | | | | | | | | | | | | | | | | | | | | | | | | | | | | | | | | | | | | | | | | | | | |
| Year ended 12/31/2014 | | | 24.32 | | | | .32 | | | | 1.75 | | | | 2.07 | | | | (.30 | ) | | | (1.44 | ) | | | (1.74 | ) | | | 24.65 | | | | 8.51 | | | | 3,315 | | | | .94 | | | | 1.28 | |
| Year ended 12/31/2013 | | | 20.32 | | | | .29 | | | | 4.02 | | | | 4.31 | | | | (.31 | ) | | | — | | | | (.31 | ) | | | 24.32 | | | | 21.33 | | | | 3,212 | | | | .94 | | | | 1.30 | |
| Year ended 12/31/2012 | | | 18.14 | | | | .32 | | | | 2.18 | | | | 2.50 | | | | (.32 | ) | | | — | | | | (.32 | ) | | | 20.32 | | | | 13.83 | | | | 2,617 | | | | .95 | | | | 1.62 | |
| Year ended 12/31/2011 | | | 17.86 | | | | .30 | | | | .32 | | | | .62 | | | | (.34 | ) | | | — | | | | (.34 | ) | | | 18.14 | | | | 3.50 | | | | 2,331 | | | | .95 | | | | 1.64 | |
| Year ended 12/31/2010 | | | 16.15 | | | | .35 | | | | 1.67 | | | | 2.02 | | | | (.31 | ) | | | — | | | | (.31 | ) | | | 17.86 | | | | 12.64 | | | | 2,408 | | | | .94 | | | | 2.10 | |
| | | | | | Income (loss) from
investment operations1 | | Dividends and distributions | | | | | | | | | | | | | | | | | |
| | | Net asset
value,
beginning
of period | | | Net
investment
income
(loss)2 | | | Net gains
(losses) on
securities
(both
realized and
unrealized) | | | Total from
investment
operations | | | Dividends
(from net
investment
income) | | | Distributions
(from capital
gains) | | | Total
dividends
and
distributions | | | Net asset
value,
end
of period | | | Total
return3,4 | | | Net assets,
end of period
(in millions) | | | Ratio of
expenses to
average
net assets | | | Ratio of
net income
(loss) to
average
net assets2 | |
| Class R-4: | | | | | | | | | | | | | | | | | | | | | | | | | | | | | | | | | | | | | | | | | | | | | | | | |
| Year ended 12/31/2014 | | $ | 24.38 | | | $ | .40 | | | $ | 1.75 | | | $ | 2.15 | | | $ | (.37 | ) | | $ | (1.44 | ) | | $ | (1.81 | ) | | $ | 24.72 | | | | 8.85 | % | | $ | 4,385 | | | | .64 | % | | | 1.58 | % |
| Year ended 12/31/2013 | | | 20.37 | | | | .36 | | | | 4.02 | | | | 4.38 | | | | (.37 | ) | | | — | | | | (.37 | ) | | | 24.38 | | | | 21.68 | | | | 3,994 | | | | .65 | | | | 1.60 | |
| Year ended 12/31/2012 | | | 18.19 | | | | .38 | | | | 2.18 | | | | 2.56 | | | | (.38 | ) | | | — | | | | (.38 | ) | | | 20.37 | | | | 14.14 | | | | 3,006 | | | | .64 | | | | 1.94 | |
| Year ended 12/31/2011 | | | 17.91 | | | | .35 | | | | .33 | | | | .68 | | | | (.40 | ) | | | — | | | | (.40 | ) | | | 18.19 | | | | 3.80 | | | | 2,152 | | | | .65 | | | | 1.94 | |
| Year ended 12/31/2010 | | | 16.19 | | | | .40 | | | | 1.68 | | | | 2.08 | | | | (.36 | ) | | | — | | | | (.36 | ) | | | 17.91 | | | | 13.01 | | | | 2,007 | | | | .65 | | | | 2.39 | |
| Class R-5: | | | | | | | | | | | | | | | | | | | | | | | | | | | | | | | | | | | | | | | | | | | | | | | | |
| Year ended 12/31/2014 | | | 24.43 | | | | .47 | | | | 1.76 | | | | 2.23 | | | | (.45 | ) | | | (1.44 | ) | | | (1.89 | ) | | | 24.77 | | | | 9.16 | | | | 2,616 | | | | .34 | | | | 1.88 | |
| Year ended 12/31/2013 | | | 20.41 | | | | .43 | | | | 4.03 | | | | 4.46 | | | | (.44 | ) | | | — | | | | (.44 | ) | | | 24.43 | | | | 22.04 | | | | 2,492 | | | | .34 | | | | 1.89 | |
| Year ended 12/31/2012 | | | 18.22 | | | | .44 | | | | 2.19 | | | | 2.63 | | | | (.44 | ) | | | — | | | | (.44 | ) | | | 20.41 | | | | 14.51 | | | | 2,050 | | | | .35 | | | | 2.23 | |
| Year ended 12/31/2011 | | | 17.94 | | | | .41 | | | | .32 | | | | .73 | | | | (.45 | ) | | | — | | | | (.45 | ) | | | 18.22 | | | | 4.11 | | | | 1,544 | | | | .35 | | | | 2.24 | |
| Year ended 12/31/2010 | | | 16.22 | | | | .45 | | | | 1.68 | | | | 2.13 | | | | (.41 | ) | | | — | | | | (.41 | ) | | | 17.94 | | | | 13.32 | | | | 1,545 | | | | .35 | | | | 2.69 | |
| Class R-6: | | | | | | | | | | | | | | | | | | | | | | | | | | | | | | | | | | | | | | | | | | | | | | | | |
| Year ended 12/31/2014 | | | 24.42 | | | | .49 | | | | 1.75 | | | | 2.24 | | | | (.46 | ) | | | (1.44 | ) | | | (1.90 | ) | | | 24.76 | | | | 9.22 | | | | 6,076 | | | | .29 | | | | 1.93 | |
| Year ended 12/31/2013 | | | 20.40 | | | | .44 | | | | 4.03 | | | | 4.47 | | | | (.45 | ) | | | — | | | | (.45 | ) | | | 24.42 | | | | 22.12 | | | | 3,910 | | | | .29 | | | | 1.95 | |
| Year ended 12/31/2012 | | | 18.21 | | | | .45 | | | | 2.19 | | | | 2.64 | | | | (.45 | ) | | | — | | | | (.45 | ) | | | 20.40 | | | | 14.57 | | | | 2,151 | | | | .30 | | | | 2.28 | |
| Year ended 12/31/2011 | | | 17.93 | | | | .42 | | | | .32 | | | | .74 | | | | (.46 | ) | | | — | | | | (.46 | ) | | | 18.21 | | | | 4.16 | | | | 1,486 | | | | .30 | | | | 2.30 | |
| Year ended 12/31/2010 | | | 16.21 | | | | .46 | | | | 1.67 | | | | 2.13 | | | | (.41 | ) | | | — | | | | (.41 | ) | | | 17.93 | | | | 13.38 | | | | 1,063 | | | | .30 | | | | 2.75 | |
| | | Year ended December 31 |
| Portfolio turnover rate for all share classes9 | | 2014 | | | 2013 | | | 2012 | | | 2011 | | | 2010 | |
| Including mortgage dollar roll transactions | | | 68% | | | | 55% | | | | 54% | | | | 47% | | | | 37% | |
| Excluding mortgage dollar roll transactions | | | 48% | | | | Not available |
| 1 | Based on average shares outstanding. |
| 2 | For the year ended December 31, 2010, this column reflects the impact of a corporate action event that resulted in a one-time increase to net investment income. If the corporate action event had not occurred, the Class A net investment income per share and ratio of net income to average net assets would have been lower by $.04 and .25 percentage points, respectively. The impact to the other share classes would have been similar. |
| 3 | Total returns exclude any applicable sales charges, including contingent deferred sales charges. |
| 4 | Not annualized. |
| 5 | Based on operations for the period shown and, accordingly, is not representative of a full year. |
| 6 | Class R-2E shares were offered beginning August 29, 2014. |
| 7 | Amount less than $1 million. |
| 8 | Class R-2E assets consisted solely of seed capital invested by CRMC; therefore, certain fees were not accrued. |
| 9 | Refer to Note 5 for further information on mortgage dollar rolls. |
See Notes to Financial Statements
Report of Independent Registered Public Accounting Firm
To the Shareholders and Board of Trustees of American Balanced Fund:
We have audited the accompanying statement of assets and liabilities of American Balanced Fund (the “Fund”), including the summary investment portfolio, as of December 31, 2014, and the related statement of operations for the year then ended, the statements of changes in net assets for each of the two years in the period then ended, and the financial highlights for each of the periods presented. These financial statements and financial highlights are the responsibility of the Fund’s management. Our responsibility is to express an opinion on these financial statements and financial highlights based on our audits.
We conducted our audits in accordance with the standards of the Public Company Accounting Oversight Board (United States). Those standards require that we plan and perform the audit to obtain reasonable assurance about whether the financial statements and financial highlights are free of material misstatement. The Fund is not required to have, nor were we engaged to perform, an audit of its internal control over financial reporting. Our audits included consideration of internal control over financial reporting as a basis for designing audit procedures that are appropriate in the circumstances, but not for the purpose of expressing an opinion on the effectiveness of the Fund’s internal control over financial reporting. Accordingly, we express no such opinion. An audit also includes examining, on a test basis, evidence supporting the amounts and disclosures in the financial statements, assessing the accounting principles used and significant estimates made by management, as well as evaluating the overall financial statement presentation. Our procedures included confirmation of securities owned as of December 31, 2014, by correspondence with the custodian and brokers; where replies were not received from brokers, we performed other auditing procedures. We believe that our audits provide a reasonable basis for our opinion.
In our opinion, such financial statements and financial highlights referred to above present fairly, in all material respects, the financial position of American Balanced Fund as of December 31, 2014, the results of its operations for the year then ended, the changes in its net assets for each of the two years in the period then ended, and the financial highlights for each of the periods presented, in conformity with accounting principles generally accepted in the United States of America.
Deloitte & Touche LLP
Costa Mesa, California
February 10, 2015
As a fund shareholder, you incur two types of costs: (1) transaction costs, such as initial sales charges on purchase payments and contingent deferred sales charges on redemptions (loads), and (2) ongoing costs, including management fees, distribution and service (12b-1) fees, and other expenses. This example is intended to help you understand your ongoing costs (in dollars) of investing in the fund so you can compare these costs with the ongoing costs of investing in other mutual funds. The example is based on an investment of $1,000 invested at the beginning of the period and held for the entire six-month period (July 1, 2014, through December 31, 2014).
Actual expenses:
The first line of each share class in the table on the following page provides information about actual account values and actual expenses. You may use the information in this line, together with the amount you invested, to estimate the expenses that you paid over the period. Simply divide your account value by $1,000 (for example, an $8,600 account value divided by $1,000 = 8.6), then multiply the result by the number in the first line under the heading entitled “Expenses paid during period” to estimate the expenses you paid on your account during this period.
Hypothetical example for comparison purposes:
The second line of each share class in the table on the following page provides information about hypothetical account values and hypothetical expenses based on the actual expense ratio for the share class and an assumed rate of return of 5.00% per year before expenses, which is not the actual return of the share class. The hypothetical account values and expenses may not be used to estimate the actual ending account balance or expenses you paid for the period. You may use this information to compare the ongoing costs of investing in the fund and other funds. To do so, compare this 5.00% hypothetical example with the 5.00% hypothetical examples that appear in the shareholder reports of the other funds.
Notes:
Retirement plan participants may be subject to certain fees charged by the plan sponsor, and Class F-1, F-2 and 529-F-1 shareholders may be subject to fees charged by financial intermediaries, typically ranging from 0.75% to 1.50% of assets annually depending on services offered. You can estimate the impact of these fees by adding the amount of the fees to the total estimated expenses you paid on your account during the period as calculated above. In addition, your ending account value would be lower by the amount of these fees.
Note that the expenses shown in the table on the following page are meant to highlight your ongoing costs only and do not reflect any transactional costs, such as sales charges (loads). Therefore, the second line of each share class in the table is useful in comparing ongoing costs only and will not help you determine the relative total costs of owning different funds. In addition, if these transactional costs were included, your costs would have been higher.
| | | Beginning | | | Ending | | | | | | | |
| | | account value | | | account value | | | Expenses paid | | | Annualized | |
| | | 7/1/2014 | | | 12/31/2014 | | | during period* | | | expense ratio | |
| Class A - actual return | | $ | 1,000.00 | | | $ | 1,037.74 | | | $ | 3.03 | | | | .59 | % |
| Class A - assumed 5% return | | | 1,000.00 | | | | 1,022.23 | | | | 3.01 | | | | .59 | |
| Class B - actual return | | | 1,000.00 | | | | 1,034.09 | | | | 6.82 | | | | 1.33 | |
| Class B - assumed 5% return | | | 1,000.00 | | | | 1,018.50 | | | | 6.77 | | | | 1.33 | |
| Class C - actual return | | | 1,000.00 | | | | 1,033.82 | | | | 7.07 | | | | 1.38 | |
| Class C - assumed 5% return | | | 1,000.00 | | | | 1,018.25 | | | | 7.02 | | | | 1.38 | |
| Class F-1 - actual return | | | 1,000.00 | | | | 1,037.87 | | | | 3.34 | | | | .65 | |
| Class F-1 - assumed 5% return | | | 1,000.00 | | | | 1,021.93 | | | | 3.31 | | | | .65 | |
| Class F-2 - actual return | | | 1,000.00 | | | | 1,038.86 | | | | 1.95 | | | | .38 | |
| Class F-2 - assumed 5% return | | | 1,000.00 | | | | 1,023.29 | | | | 1.94 | | | | .38 | |
| Class 529-A - actual return | | | 1,000.00 | | | | 1,037.72 | | | | 3.49 | | | | .68 | |
| Class 529-A - assumed 5% return | | | 1,000.00 | | | | 1,021.78 | | | | 3.47 | | | | .68 | |
| Class 529-B - actual return | | | 1,000.00 | | | | 1,033.71 | | | | 7.48 | | | | 1.46 | |
| Class 529-B - assumed 5% return | | | 1,000.00 | | | | 1,017.85 | | | | 7.43 | | | | 1.46 | |
| Class 529-C - actual return | | | 1,000.00 | | | | 1,033.35 | | | | 7.43 | | | | 1.45 | |
| Class 529-C - assumed 5% return | | | 1,000.00 | | | | 1,017.90 | | | | 7.37 | | | | 1.45 | |
| Class 529-E - actual return | | | 1,000.00 | | | | 1,036.46 | | | | 4.77 | | | | .93 | |
| Class 529-E - assumed 5% return | | | 1,000.00 | | | | 1,020.52 | | | | 4.74 | | | | .93 | |
| Class 529-F-1 - actual return | | | 1,000.00 | | | | 1,038.88 | | | | 2.31 | | | | .45 | |
| Class 529-F-1 - assumed 5% return | | | 1,000.00 | | | | 1,022.94 | | | | 2.29 | | | | .45 | |
| Class R-1 - actual return | | | 1,000.00 | | | | 1,034.28 | | | | 7.08 | | | | 1.38 | |
| Class R-1 - assumed 5% return | | | 1,000.00 | | | | 1,018.25 | | | | 7.02 | | | | 1.38 | |
| Class R-2 - actual return | | | 1,000.00 | | | | 1,033.99 | | | | 6.87 | | | | 1.34 | |
| Class R-2 - assumed 5% return | | | 1,000.00 | | | | 1,018.45 | | | | 6.82 | | | | 1.34 | |
| Class R-2E - actual return† | | | 1,000.00 | | | | 1,021.66 | | | | 1.68 | | | | .49 | |
| Class R-2E - assumed 5% return† | | | 1,000.00 | | | | 1,022.74 | | | | 2.50 | | | | .49 | |
| Class R-3 - actual return | | | 1,000.00 | | | | 1,036.48 | | | | 4.77 | | | | .93 | |
| Class R-3 - assumed 5% return | | | 1,000.00 | | | | 1,020.52 | | | | 4.74 | | | | .93 | |
| Class R-4 - actual return | | | 1,000.00 | | | | 1,037.92 | | | | 3.29 | | | | .64 | |
| Class R-4 - assumed 5% return | | | 1,000.00 | | | | 1,021.98 | | | | 3.26 | | | | .64 | |
| Class R-5 - actual return | | | 1,000.00 | | | | 1,039.37 | | | | 1.75 | | | | .34 | |
| Class R-5 - assumed 5% return | | | 1,000.00 | | | | 1,023.49 | | | | 1.73 | | | | .34 | |
| Class R-6 - actual return | | | 1,000.00 | | | | 1,039.67 | | | | 1.49 | | | | .29 | |
| Class R-6 - assumed 5% return | | | 1,000.00 | | | | 1,023.74 | | | | 1.48 | | | | .29 | |
| * | The “expenses paid during period” are equal to the “annualized expense ratio,” multiplied by the average account value over the period, multiplied by the number of days in the period, and divided by 365 (to reflect the one-half year period). |
| † | The period for the “annualized expense ratio” and “actual return” line is based on the number of days since the initial sale of the share class on August 29, 2014. The “assumed 5% return” line is based on 184 days. |
We are required to advise you of the federal tax status of certain distributions received by shareholders during the fiscal year. The fund hereby designates the following amounts for the fund’s fiscal year ended December 31, 2014:
| Long-term capital gains | $4,365,643,000 |
| Qualified dividend income | 100% |
| Corporate dividends received deduction | $994,887,000 |
| U.S. government income that may be exempt from state taxation | $68,054,000 |
Individual shareholders should refer to their Form 1099 or other tax information, which was mailed in January 2015, to determine the calendar year amounts to be included on their 2014 tax returns. Shareholders should consult their tax advisors.
Approval of Investment Advisory and Service Agreement
The American Balanced Fund’s board has approved the fund’s Investment Advisory and Service Agreement (the “agreement”) with Capital Research and Management Company (“CRMC”) for an additional period through January 31, 2016. The agreement was amended to add additional advisory fee breakpoints if and when the fund’s net assets exceed $89 billion. The board approved the agreement following the recommendation of the fund’s Contracts Committee (the “committee”), which is composed of all of the fund’s independent board members. The board and the committee determined that the fund’s advisory fee structure was fair and reasonable in relation to the services provided, and that approving the agreement was in the best interests of the fund and its shareholders.
In reaching this decision, the board and the committee took into account information furnished to them throughout the year and otherwise provided to them, as well as information prepared specifically in connection with their review of the agreement, and were advised by their independent counsel. They considered the following factors, among others, but did not identify any single issue or particular piece of information that, in isolation, was the controlling factor, and each board and committee member did not necessarily attribute the same weight to each factor.
1. Nature, extent and quality of services
The board and the committee considered the depth and quality of CRMC’s investment management process, including its global research capabilities; the experience, capability and integrity of its senior management and other personnel; the low turnover rates of its key personnel; the overall financial strength and stability of CRMC and the Capital Group organization; and the ongoing evolution of CRMC’s organizational structure designed to maintain and strengthen these qualities. The board and the committee also considered the nature, extent and quality of administrative, compliance and shareholder services provided by CRMC to the fund under the agreement and other agreements, as well as the benefits to fund shareholders from investing in a fund that is part of a large family of funds. The board and the committee concluded that the nature, extent and quality of the services provided by CRMC have benefited and should continue to benefit the fund and its shareholders.
2. Investment results
The board and the committee considered the investment results of the fund in light of its objectives of providing conservation of capital, current income and long-term growth of capital and income. They compared the fund’s investment results with those of other relevant funds (including funds that form the basis of the Lipper index for the category in which the fund is included), and data such as relevant market and fund indexes, over various periods through June 30, 2014. This report, including the letter to shareholders and related disclosures, contains certain information about the fund’s investment results. The board and the committee reviewed the fund’s investment results measured against various indexes, including the Lipper Balanced Funds Index, the S&P 500 Index, the Barclays U.S. Aggregate Index and a customized index that is 60% S&P 500 Index and 40% Barclays U.S. Aggregate Index (adjusted for Fund expenses). They noted that the investment results of the fund generally exceeded those of these indexes for the lifetime, 20-year, 10-year and five-year periods, except for the S&P 500 Index. They also noted that the volatility of the fund’s monthly returns for such periods was at or near that of the Lipper Balanced Funds Index and less than that of the S&P 500 Index. The board and the committee concluded that the fund’s investment results have been satisfactory for renewal of the agreement and that CRMC’s record in managing the fund indicated that its continued management should benefit the fund and its shareholders.
3. Advisory fees and total expenses
The board and the committee compared the advisory fees and total expense levels of the fund to those of other relevant funds. They observed that the fund’s advisory fees and expenses generally compared favorably to those of other similar funds included in the Lipper Balanced Funds category. The board and the committee also considered the breakpoint discounts in the fund’s advisory fee structure that reduce the level of fees charged by CRMC to the fund as fund assets increase. In addition, they reviewed information regarding the effective advisory fees charged to non-mutual fund clients by CRMC and its affiliates. They noted that, to the extent there were differences between the advisory fees paid by the fund and the advisory fees paid by those clients, the differences appropriately reflected the investment, operational and regulatory differences between advising the fund and the other clients. The board and the committee concluded that the fund’s cost structure was fair and reasonable in relation to the services provided, and that the fund’s shareholders receive reasonable value in return for the advisory fees and other amounts paid to CRMC by the fund.
4. Ancillary benefits
The board and the committee considered a variety of other benefits that CRMC and its affiliates receive as a result of CRMC’s relationship with the fund and the other American Funds, including fees for administrative services provided to certain share classes; fees paid to CRMC’s affiliated transfer agent; sales charges and distribution fees received and retained by the fund’s principal underwriter, an affiliate of CRMC; and possible ancillary benefits to CRMC and its institutional management affiliates in managing other investment vehicles. The board and the committee reviewed CRMC’s portfolio trading practices, noting that while CRMC received the benefit of research provided by broker-dealers executing portfolio transactions on behalf of the fund, it did not obtain third-party research or other services in return for allocating brokerage to such broker-dealers. The board and the committee took these ancillary benefits into account in evaluating the reasonableness of the advisory fees and other amounts paid to CRMC by the fund.
5. Adviser financial information
The board and the committee reviewed information regarding CRMC’s costs of providing services to the American Funds, including personnel, systems and resources of investment, compliance, trading, accounting and other administrative operations. They considered CRMC’s costs and willingness to invest in technology, infrastructure and staff to maintain and expand services and capabilities, respond to industry and regulatory developments, and attract and retain qualified personnel. They noted information regarding the compensation structure for CRMC’s investment professionals. The board and the committee also compared CRMC’s profitability and compensation data to the reported results and data of several large, publicly held investment management companies. The board and the committee noted the competitiveness and cyclicality of both the mutual fund industry and the capital markets, and the importance in that environment of CRMC’s long-term profitability for maintaining its independence, company culture and management continuity. They further considered the breakpoint discounts in the fund’s advisory fee structure. The board and the committee concluded that the fund’s advisory fee structure reflected a reasonable sharing of benefits between CRMC and the fund’s shareholders.
Board of trustees and other officers
Independent trustees1
| Name and year of birth | | Year first
elected
a trustee
of the fund2 | | Principal occupation(s) during past five years | | Number of
portfolios in fund
complex overseen
by trustee | | Other directorships3
held by trustee |
| William H. Baribault, 1945 | | 2012 | | CEO and President, Richard Nixon Foundation; former Chairman of the Board and CEO, Oakwood Enterprises (private investment and consulting) | | 72 | | None |
| Vanessa C. L. Chang, 1952 | | 2012 | | Director, EL & EL Investments (real estate) | | 7 | | Edison International; Transocean Ltd. |
| Linda Griego, 1947 | | 2012 | | President and CEO, Griego Enterprises, Inc. (business management company) | | 4 | | AECOM Technology Corporation; CBS Corporation |
| Leonade D. Jones, 1947 | | 1993 | | Retired; former Treasurer, The Washington Post Company (retired 1996) | | 10 | | None |
| William D. Jones, 1955 | | 2008 | | Real estate developer/owner, President and CEO, CityLink Investment Corporation (acquires, develops and manages real estate ventures in selected urban communities) and City Scene Management Company (provides commercial asset and property management services) | | 8 | | Sempra Energy |
| James J. Postl, 1946 | | 2007 | | Retired; former President and CEO, Pennzoil-Quaker State Company (automotive products and services) (retired 2002) | | 4 | | Pulte, Inc. |
| Margaret Spellings, 1957 | | 2012 | | President, George W. Bush Foundation; former President and CEO, Margaret Spellings & Company (public policy and strategic consulting); former President, U.S. Chamber Foundation and Senior Advisor to the President and CEO, U.S. Chamber of Commerce | | 72 | | None |
Isaac Stein, 1946
Chairman of the Board
(Independent and Non-Executive) | | 2004 | | President, Waverley Associates (private investment fund); Chairman Emeritus of the Board of Trustees, Stanford University | | 4 | | Alexza Pharmaceuticals, Inc.; Maxygen, Inc. |
Interested trustee4,5
Name, year of birth and
position with fund | | Year first
elected
a trustee
or officer
of the fund2 | | Principal occupation(s) during past five years
and positions held with affiliated entities or
the principal underwriter of the fund | | Number of
portfolios in fund
complex overseen
by trustee | | Other directorships3
held by trustee |
Gregory D. Johnson, 1963
Vice Chairman of the Board and President | | 2003 | | Partner — Capital World Investors, Capital Research and Management Company | | 1 | | None |
The fund’s statement of additional information includes further details about fund trustees and is available without charge upon request by calling American Funds Service Company at (800) 421-4225 or by visiting the American Funds website at americanfunds.com. The address for all trustees and officers of the fund is 333 South Hope Street, Los Angeles, CA 90071, Attention: Secretary.
See page 36 for footnotes.
Other officers5
Name, year of birth and
position with fund | | Year first
elected
an officer
of the fund2 | | Principal occupation(s) during past five years and positions held with affiliated entities
or the principal underwriter of the fund |
Hilda L. Applbaum, 1961
Senior Vice President | | 1999 | | Partner — Capital World Investors, Capital Research and Management Company |
Jeffrey T. Lager, 1968
Senior Vice President | | 2002 | | Partner — Capital World Investors, Capital Research and Management Company;
Director, American Funds Service Company6 |
James R. Mulally, 1952
Senior Vice President | | 2009 | | Partner — Capital Fixed Income Investors, Capital Research and Management Company |
Paul F. Roye, 1953
Senior Vice President | | 2007 | | Senior Vice President — Fund Business Management Group, Capital Research and Management Company;
Director, American Funds Service Company6 |
John H. Smet, 1956
Senior Vice President | | 2000 | | Partner — Capital Fixed Income Investors, Capital Research and Management Company;
Director, Capital Research and Management Company |
Paul R. Benjamin, 1979
Vice President | | 2014 | | Vice President — Capital World Investors, Capital Research and Management Company |
Alan N. Berro, 1960
Vice President | | 2010 | | Partner — Capital World Investors, Capital Research and Management Company |
Donald H. Rolfe, 1972
Vice President | | 2012 | | Chief Compliance Officer, Capital Research Company6; Chief Compliance Officer, Capital Research and Management Company; Vice President and Senior Counsel — Fund Business Management Group, Capital Research and Management Company |
Richmond A. Wolf, 1970
Vice President | | 2014 | | Vice President — Capital World Investors, Capital Research and Management Company |
Michael W. Stockton, 1967
Secretary | | 2014 | | Vice President — Fund Business Management Group, Capital Research and Management Company |
Jeffrey P. Regal, 1971
Treasurer | | 2011 | | Vice President — Investment Operations, Capital Research and Management Company |
Viviane T. Russo, 1981
Assistant Secretary | | 2014 | | Associate — Fund Business Management Group, Capital Research and Management Company |
Dori Laskin, 1951
Assistant Treasurer | | 2011 | | Vice President — Investment Operations, Capital Research and Management Company |
Ari M. Vinocor, 1974
Assistant Treasurer | | 2012 | | Vice President — Investment Operations, Capital Research and Management Company |
| 1 | The term independent trustee refers to a trustee who is not an “interested person” of the fund within the meaning of the Investment Company Act of 1940. |
| 2 | Trustees and officers of the fund serve until their resignation, removal or retirement. |
| 3 | This includes all directorships/trusteeships (other than those in the American Funds or other funds managed by Capital Research and Management Company or its affiliates) that are held by each trustee as a trustee or director of a public company or a registered investment company. |
| 4 | The term interested trustee refers to a trustee who is an “interested person” within the meaning of the Investment Company Act of 1940, on the basis of their affiliation with the fund’s investment adviser, Capital Research and Management Company, or affiliated entities (including the fund’s principal underwriter). |
| 5 | All of the directors/trustees and/or officers listed, except Paul R. Benjamin, James R. Mulally and Richmond A. Wolf, are officers and/or directors/trustees of one or more of the other funds for which Capital Research and Management Company serves as investment adviser. |
| 6 | Company affiliated with Capital Research and Management Company. |
Office of the fund
6455 Irvine Center Drive
Irvine, CA 92618-4518
Investment adviser
Capital Research and Management Company
333 South Hope Street
Los Angeles, CA 90071-1406
6455 Irvine Center Drive
Irvine, CA 92618-4518
Transfer agent for shareholder accounts
American Funds Service Company
(Write to the address near you.)
P.O. Box 6007
Indianapolis, IN 46206-6007
P.O. Box 2280
Norfolk, VA 23501-2280
Custodian of assets
JPMorgan Chase Bank
270 Park Avenue
New York, NY 10017-2070
Counsel
Morgan, Lewis & Bockius LLP
355 South Grand Avenue, Suite 4400
Los Angeles, CA 90071-3106
Independent registered public accounting firm
Deloitte & Touche LLP
695 Town Center Drive
Suite 1200
Costa Mesa, CA 92626-7188
Principal underwriter
American Funds Distributors, Inc.
333 South Hope Street
Los Angeles, CA 90071-1406
Investors should carefully consider investment objectives, risks, charges and expenses. This and other important information is contained in the fund prospectus and summary prospectus, which can be obtained from your financial professional and should be read carefully before investing. You may also call American Funds Service Company (AFS) at (800) 421-4225 or visit the American Funds website at americanfunds.com.
“American Funds Proxy Voting Procedures and Principles” — which describes how we vote proxies relating to portfolio securities — is available on the American Funds website or upon request by calling AFS. The fund files its proxy voting record with the U.S. Securities and Exchange Commission (SEC) for the 12 months ended June 30 by August 31. The proxy voting record is available free of charge on the SEC website at sec.gov and on the American Funds website.
A complete December 31, 2014, portfolio of American Balanced Fund’s investments is available free of charge by calling AFS or visiting the SEC website (where it is part of Form N-CSR).
American Balanced Fund files a complete list of its portfolio holdings with the SEC for the first and third quarters of each fiscal year on Form N-Q. This filing is available free of charge on the SEC website. You may also review or, for a fee, copy this filing at the SEC’s Public Reference Room in Washington, D.C. Additional information regarding the operation of the Public Reference Room may be obtained by calling the SEC’s Office of Investor Education and Advocacy at (800) SEC-0330. Additionally, the list of portfolio holdings is available by calling AFS.
This report is for the information of shareholders of American Balanced Fund, but it also may be used as sales literature when preceded or accompanied by the current prospectus or summary prospectus, which gives details about charges, expenses, investment objectives and operating policies of the fund. If used as sales material after March 31, 2015, this report must be accompanied by an American Funds statistical update for the most recently completed calendar quarter.
The American Funds Advantage
Since 1931, American Funds, part of Capital Group, has helped investors pursue long-term investment success. Our consistent approach — in combination with The Capital SystemSM — has resulted in a superior long-term track record.
Aligned with investor success
We base our decisions on a long-term perspective, which we believe aligns our goals with the interests of our clients. Our portfolio managers average 27 years of investment experience, including 22 years at our company, reflecting a career commitment to our long-term approach.1
The Capital SystemSM
Our investment process, The Capital System, combines individual accountability with teamwork. Each fund is divided into portions that are managed independently by investment professionals with diverse backgrounds, ages and investment approaches. An extensive global research effort is the backbone of our system.
Superior long-term track record
Our equity funds have beaten their Lipper peer indexes in 91% of 10-year periods and 96% of 20-year periods. Our fixed-income funds have beaten their Lipper indexes in 54% of 10-year periods and 57% of 20-year periods.2 Our fund management fees have been among the lowest in the industry.3
| | 1 | Portfolio manager experience as of December 31, 2014. |
| | 2 | Based on Class A share results for rolling periods through December 31, 2014. Periods covered are the shorter of the fund’s lifetime or since the comparable Lipper index inception date (except SMALLCAP World Fund, for which the Lipper average was used). |
| | 3 | On average, our management fees were in the lowest quintile 70% of the time, based on the 20-year period ended December 31, 2014, versus comparable Lipper categories, excluding funds of funds. |

ITEM 2 – Code of Ethics
The Registrant has adopted a Code of Ethics that applies to its Principal Executive Officer and Principal Financial Officer. The Registrant undertakes to provide to any person without charge, upon request, a copy of the Code of Ethics. Such request can be made to American Funds Service Company at 800/421-9225 or to the Secretary of the Registrant, 6455 Irvine Center Drive, Irvine, California 92618.
ITEM 3 – Audit Committee Financial Expert
The Registrant’s board has determined that Vanessa C. L. Chang, a member of the Registrant’s audit committee, is an “audit committee financial expert” and "independent," as such terms are defined in this Item. This designation will not increase the designee’s duties, obligations or liability as compared to his or her duties, obligations and liability as a member of the audit committee and of the board, nor will it reduce the responsibility of the other audit committee members. There may be other individuals who, through education or experience, would qualify as "audit committee financial experts" if the board had designated them as such. Most importantly, the board believes each member of the audit committee contributes significantly to the effective oversight of the Registrant’s financial statements and condition.
ITEM 4 – Principal Accountant Fees and Services
| | Registrant: |
| | | a) Audit Fees: |
| | | | 2013 | $100,000 |
| | | | 2014 | $106,000 |
| | | | |
| | | b) Audit-Related Fees: |
| | | | 2013 | $25,000 |
| | | | 2014 | $17,000 |
| | | | The audit-related fees consist of assurance and related services relating to the examination of the Registrant’s investment adviser conducted in accordance with Statement on Standards for Attestation Engagements Number 16 issued by the American Institute of Certified Public Accountants. |
| | | | |
| | | c) Tax Fees: |
| | | | 2013 | None |
| | | | 2014 | $8,000 |
| | | | The tax fees consist of professional services relating to the preparation of the Registrant’s tax returns including returns relating to the Registrant’s investments in non-U.S. jurisdictions. |
| | | | |
| | | d) All Other Fees: |
| | | | 2013 | None |
| | | | 2014 | None |
| | | | |
| | Adviser and affiliates (includes only fees for non-audit services billed to the adviser and affiliates for engagements that relate directly to the operations and financial reporting of the Registrant and were subject to the pre-approval policies described below): |
| | | a) Audit Fees: |
| | | | Not Applicable |
| | | | |
| | | b) Audit-Related Fees: |
| | | | 2013 | $1,020,000 |
| | | | 2014 | $927,000 |
| | | | The audit-related fees consist of assurance and related services relating to the examination of the Registrant’s transfer agent, principal underwriter and investment adviser conducted in accordance with Statement on Standards for Attestation Engagements Number 16 issued by the American Institute of Certified Public Accountants. |
| | | | |
| | | c) Tax Fees: |
| | | | 2013 | $10,000 |
| | | | 2014 | $33,000 |
| | | | The tax fees consist of consulting services relating to the Registrant’s investments. |
| | | | |
| | | d) All Other Fees: |
| | | | 2013 | $3,000 |
| | | | 2014 | $3,000 |
| | | | The other fees consist of subscription services related to an accounting research tool. |
| | | | |
All audit and permissible non-audit services that the Registrant’s audit committee considers compatible with maintaining the independent registered public accounting firm’s independence are required to be pre-approved by the committee. The pre-approval requirement will extend to all non-audit services provided to the Registrant, the investment adviser, and any entity controlling, controlled by, or under common control with the investment adviser that provides ongoing services to the Registrant, if the engagement relates directly to the operations and financial reporting of the Registrant. The committee will not delegate its responsibility to pre-approve these services to the investment adviser. The committee may delegate to one or more committee members the authority to review and pre-approve audit and permissible non-audit services. Actions taken under any such delegation will be reported to the full committee at its next meeting. The pre-approval requirement is waived with respect to non-audit services if certain conditions are met. The pre-approval requirement was not waived for any of the non-audit services listed above provided to the Registrant, adviser and affiliates.
Aggregate non-audit fees paid to the Registrant’s auditors, including fees for all services billed to the Registrant, adviser and affiliates that provide ongoing services to the Registrant, were $1,471,000 for fiscal year 2013 and $1,286,000 for fiscal year 2014. The non-audit services represented by these amounts were brought to the attention of the committee and considered to be compatible with maintaining the auditors’ independence.
ITEM 5 – Audit Committee of Listed Registrants
Not applicable to this Registrant, insofar as the Registrant is not a listed issuer as defined in Rule 10A-3 under the Securities Exchange Act of 1934.
ITEM 6 – Schedule of Investments
American Balanced Fund®
Investment portfolio
December 31, 2014
Common stocks 66.90%
Financials 12.36% | Shares | Value
(000) |
| Wells Fargo & Co. | 30,902,000 | $1,694,048 |
| Berkshire Hathaway Inc., Class A1 | 6,580 | 1,487,080 |
| JPMorgan Chase & Co. | 20,651,000 | 1,292,339 |
| American Express Co. | 11,300,000 | 1,051,352 |
| ACE Ltd. | 5,095,000 | 585,314 |
| Citigroup Inc. | 9,500,000 | 514,045 |
| Weyerhaeuser Co.1 | 13,115,242 | 470,706 |
| SunTrust Banks, Inc. | 11,000,000 | 460,900 |
| Capital One Financial Corp. | 5,569,000 | 459,721 |
| U.S. Bancorp | 8,545,000 | 384,098 |
| Goldman Sachs Group, Inc. | 1,756,700 | 340,501 |
| Equity Residential | 4,079,600 | 293,078 |
| Chubb Corp. | 1,500,000 | 155,205 |
| Allstate Corp. | 2,000,000 | 140,500 |
| Bank of America Corp. | 7,000,000 | 125,230 |
| Moody’s Corp. | 1,195,000 | 114,493 |
| BlackRock, Inc. | 300,000 | 107,268 |
| American Tower Corp. | 1,060,000 | 104,781 |
| Sumitomo Mitsui Financial Group, Inc. (ADR) | 8,500,000 | 61,880 |
| | | 9,842,539 |
| Consumer discretionary 9.93% | | |
| Comcast Corp., Class A | 36,050,000 | 2,091,260 |
| Home Depot, Inc. | 16,929,349 | 1,777,074 |
| Amazon.com, Inc.1 | 4,119,500 | 1,278,487 |
| Twenty-First Century Fox, Inc., Class A | 25,156,900 | 966,151 |
| Walt Disney Co. | 5,220,000 | 491,672 |
| VF Corp. | 4,890,000 | 366,261 |
| Macy’s, Inc. | 3,500,000 | 230,125 |
| CBS Corp., Class B | 4,095,000 | 226,617 |
| Time Warner Inc. | 2,000,000 | 170,840 |
| NIKE, Inc., Class B | 1,305,000 | 125,476 |
| General Motors Co. | 3,500,000 | 122,185 |
| Carnival Corp., units | 1,400,000 | 63,462 |
| | | 7,909,610 |
| Information technology 8.84% | | |
| Microsoft Corp. | 59,655,000 | 2,770,975 |
| Texas Instruments Inc. | 11,232,000 | 600,519 |
| ASML Holding NV (New York registered) | 4,055,401 | 437,294 |
| ASML Holding NV2 | 1,470,405 | 157,534 |
| Cisco Systems, Inc. | 18,250,000 | 507,624 |
| TE Connectivity Ltd. | 7,805,000 | 493,666 |
| Taiwan Semiconductor Manufacturing Co. Ltd. (ADR) | 17,175,000 | 384,376 |
| Avago Technologies Ltd. | 3,605,000 | 362,627 |
| VeriSign, Inc.1 | 5,400,000 | 307,800 |
| Intel Corp. | 7,500,000 | 272,175 |
American Balanced Fund — Page 1 of 27
Common stocks
Information technology (continued) | Shares | Value
(000) |
| Analog Devices, Inc. | 4,715,000 | $261,777 |
| Google Inc., Class A1 | 371,350 | 197,061 |
| Broadcom Corp., Class A | 4,000,000 | 173,320 |
| salesforce.com, inc.1 | 1,980,000 | 117,434 |
| | | 7,044,182 |
| Industrials 8.49% | | |
| Boeing Co. | 12,695,000 | 1,650,096 |
| Lockheed Martin Corp. | 6,574,037 | 1,265,962 |
| Union Pacific Corp. | 7,040,000 | 838,675 |
| General Electric Co. | 23,650,000 | 597,635 |
| Parker-Hannifin Corp. | 4,100,000 | 528,695 |
| United Technologies Corp. | 3,690,000 | 424,350 |
| Cummins Inc. | 2,924,400 | 421,611 |
| Deere & Co. | 3,610,000 | 319,377 |
| Northrop Grumman Corp. | 1,250,000 | 184,238 |
| Honeywell International Inc. | 1,500,000 | 149,880 |
| Norfolk Southern Corp. | 1,120,000 | 122,763 |
| Caterpillar Inc. | 1,300,000 | 118,989 |
| General Dynamics Corp. | 600,000 | 82,572 |
| Rockwell Collins, Inc. | 710,000 | 59,981 |
| | | 6,764,824 |
| Consumer staples 7.61% | | |
| Philip Morris International Inc. | 14,750,000 | 1,201,387 |
| Coca-Cola Co. | 27,663,000 | 1,167,932 |
| Procter & Gamble Co. | 9,935,000 | 904,979 |
| PepsiCo, Inc. | 8,766,000 | 828,913 |
| Costco Wholesale Corp. | 5,677,326 | 804,761 |
| Nestlé SA2 | 8,140,000 | 596,675 |
| Nestlé SA (ADR) | 1,000,000 | 72,950 |
| Walgreens Boots Alliance, Inc. | 3,500,000 | 266,700 |
| Wal-Mart Stores, Inc. | 1,500,000 | 128,820 |
| Unilever NV (New York registered) | 1,200,000 | 46,848 |
| Colgate-Palmolive Co. | 670,000 | 46,357 |
| | | 6,066,322 |
| Health care 6.71% | | |
| Merck & Co., Inc. | 22,990,000 | 1,305,602 |
| UnitedHealth Group Inc. | 9,295,000 | 939,632 |
| Pfizer Inc. | 21,905,000 | 682,341 |
| Roche Holding AG2 | 2,358,957 | 639,373 |
| Bristol-Myers Squibb Co. | 9,950,000 | 587,348 |
| Johnson & Johnson | 5,510,000 | 576,181 |
| Express Scripts Holding Co.1 | 2,045,000 | 173,150 |
| AbbVie Inc. | 2,600,000 | 170,144 |
| Baxter International Inc. | 1,500,000 | 109,935 |
| Gilead Sciences, Inc.1 | 1,000,000 | 94,260 |
| Vertex Pharmaceuticals Inc.1 | 600,000 | 71,280 |
| | | 5,349,246 |
| Energy 4.39% | | |
| Chevron Corp. | 5,244,755 | 588,357 |
| Royal Dutch Shell PLC, Class B (ADR) | 8,058,000 | 560,514 |
| Enbridge Inc. | 9,795,000 | 503,561 |
American Balanced Fund — Page 2 of 27
Common stocks
Energy (continued) | Shares | Value
(000) |
| ConocoPhillips | 7,169,508 | $495,126 |
| Kinder Morgan, Inc. | 4,735,000 | 200,338 |
| Phillips 66 | 2,180,000 | 156,306 |
| Baker Hughes Inc. | 2,750,000 | 154,193 |
| Chesapeake Energy Corp. | 7,790,000 | 152,450 |
| CONSOL Energy Inc. | 4,500,000 | 152,145 |
| Concho Resources Inc.1 | 1,475,000 | 147,131 |
| Southwestern Energy Co.1 | 5,000,000 | 136,450 |
| Occidental Petroleum Corp. | 1,200,000 | 96,732 |
| Suncor Energy Inc. | 2,000,000 | 63,522 |
| Transocean Ltd. | 2,500,000 | 45,825 |
| TOTAL SA (ADR) | 800,000 | 40,960 |
| | | 3,493,610 |
| Materials 3.07% | | |
| Potash Corp. of Saskatchewan Inc. | 19,850,000 | 701,102 |
| E.I. du Pont de Nemours and Co. | 6,750,000 | 499,095 |
| Mosaic Co. | 8,455,000 | 385,970 |
| Dow Chemical Co. | 7,980,000 | 363,968 |
| Nucor Corp. | 4,500,000 | 220,725 |
| Monsanto Co. | 1,800,000 | 215,046 |
| First Quantum Minerals Ltd. | 4,000,000 | 56,843 |
| Cliffs Natural Resources Inc. | 666,777 | 4,761 |
| | | 2,447,510 |
| Utilities 0.50% | | |
| PG&E Corp. | 4,450,000 | 236,918 |
| Exelon Corp. | 2,650,000 | 98,262 |
| FirstEnergy Corp. | 1,675,000 | 65,308 |
| | | 400,488 |
| Telecommunication services 0.23% | | |
| AT&T Inc. | 3,415,000 | 114,710 |
| Verizon Communications Inc. | 1,380,000 | 64,556 |
| | | 179,266 |
| Miscellaneous 4.77% | | |
| Other common stocks in initial period of acquisition | | 3,797,825 |
| Total common stocks (cost: $32,600,515,000) | | 53,295,422 |
Bonds, notes & other debt instruments 27.82%
Corporate bonds & notes 9.26%
Financials 2.93% | Principal amount
(000) | |
| ACE INA Holdings Inc. 2.60% 2015 | $12,665 | 12,867 |
| ACE INA Holdings Inc. 3.35% 2024 | 7,000 | 7,088 |
| American Campus Communities, Inc. 3.75% 2023 | 7,915 | 7,915 |
| American Campus Communities, Inc. 4.125% 2024 | 12,175 | 12,321 |
| American Express Co. 6.15% 2017 | 22,800 | 25,421 |
| American Express Credit Co. 1.55% 2017 | 15,465 | 15,507 |
| American International Group, Inc. 2.30% 2019 | 20,680 | 20,723 |
| American International Group, Inc. 3.375% 2020 | 12,000 | 12,481 |
| American International Group, Inc. 4.125% 2024 | 5,000 | 5,333 |
| American Tower Corp. 4.625% 2015 | 10,000 | 10,090 |
American Balanced Fund — Page 3 of 27
Bonds, notes & other debt instruments
Corporate bonds & notes (continued)
Financials (continued) | Principal amount
(000) | Value
(000) |
| American Tower Corp. 3.40% 2019 | $13,550 | $13,805 |
| ANZ National (International) Ltd. 3.125% 20153 | 16,500 | 16,748 |
| AvalonBay Communities, Inc. 3.625% 2020 | 15,000 | 15,621 |
| AXA SA, Series B, junior subordinated 6.379% (undated)3,4 | 6,680 | 7,264 |
| Bank of America Corp., Series L, 3.625% 2016 | 13,820 | 14,215 |
| Bank of America Corp. 3.75% 2016 | 21,955 | 22,754 |
| Bank of America Corp. 1.25% 2017 | 15,000 | 14,974 |
| Bank of America Corp., Series L, 2.65% 2019 | 30,000 | 30,250 |
| Bank of America Corp. 5.625% 2020 | 15,500 | 17,669 |
| Bank of America Corp. 4.00% 2024 | 12,500 | 13,030 |
| Bank of America Corp. 4.20% 2024 | 10,725 | 10,939 |
| Bank of America Corp. 4.25% 2026 | 19,590 | 19,573 |
| Bank of New York Mellon Corp., Series G, 2.50% 2016 | 17,000 | 17,331 |
| Bank of Nova Scotia 2.55% 2017 | 20,000 | 20,522 |
| Barclays Bank PLC 2.50% 2019 | 11,095 | 11,253 |
| BB&T Corp. 1.00% 2017 | 15,000 | 14,887 |
| BB&T Corp., Series C, 1.60% 2017 | 16,750 | 16,753 |
| BB&T Corp. 2.45% 2020 | 79,600 | 79,482 |
| Berkshire Hathaway Inc. 2.20% 2016 | 23,000 | 23,494 |
| Berkshire Hathaway Inc. 2.00% 2018 | 16,340 | 16,539 |
| Berkshire Hathaway Inc. 2.90% 2020 | 21,500 | 22,075 |
| BNP Paribas 3.60% 2016 | 13,000 | 13,368 |
| BNP Paribas 4.25% 2024 | 7,370 | 7,461 |
| Boston Properties, Inc. 3.70% 2018 | 20,000 | 21,106 |
| BPCE SA group 4.00% 2024 | 8,000 | 8,382 |
| BPCE SA group 4.625% 20243 | 7,200 | 7,003 |
| BPCE SA group 5.15% 20243 | 19,235 | 19,858 |
| Brandywine Operating Partnership, LP 3.95% 2023 | 1,639 | 1,656 |
| Citigroup Inc. 4.587% 2015 | 20,950 | 21,656 |
| Citigroup Inc. 3.953% 2016 | 6,050 | 6,284 |
| Citigroup Inc. 8.50% 2019 | 8,416 | 10,497 |
| CME Group Inc. 5.30% 2043 | 6,800 | 8,272 |
| CNA Financial Corp. 6.50% 2016 | 13,500 | 14,611 |
| CNA Financial Corp. 3.95% 2024 | 9,910 | 10,040 |
| Corporate Office Properties LP 5.25% 2024 | 29,480 | 31,719 |
| Corporate Office Properties Trust 3.60% 2023 | 12,100 | 11,647 |
| Credit Suisse Group AG 3.625% 2024 | 38,970 | 39,690 |
| DDR Corp. 3.50% 2021 | 7,000 | 7,087 |
| Developers Diversified Realty Corp. 9.625% 2016 | 1,825 | 2,004 |
| Developers Diversified Realty Corp. 7.875% 2020 | 6,365 | 7,859 |
| Discover Financial Services 4.20% 2023 | 16,955 | 17,823 |
| ERP Operating LP 5.375% 2016 | 25,000 | 26,660 |
| ERP Operating LP 4.75% 2020 | 12,000 | 13,200 |
| ERP Operating LP 4.50% 2044 | 11,400 | 11,930 |
| Essex Portfolio L.P. 3.875% 2024 | 21,515 | 21,938 |
| Goldman Sachs Group, Inc. 3.625% 2016 | 46,650 | 47,886 |
| Goldman Sachs Group, Inc. 2.90% 2018 | 15,000 | 15,396 |
| Goldman Sachs Group, Inc. 2.55% 2019 | 95,250 | 94,902 |
| Goldman Sachs Group, Inc. 5.25% 2021 | 20,000 | 22,592 |
| Goldman Sachs Group, Inc. 5.75% 2022 | 20,000 | 23,156 |
| Goldman Sachs Group, Inc. 3.625% 2023 | 7,840 | 7,953 |
| Goldman Sachs Group, Inc. 3.85% 2024 | 14,700 | 15,094 |
| Goldman Sachs Group, Inc. 4.00% 2024 | 7,760 | 8,065 |
| HCP, Inc. 5.375% 2021 | 15,000 | 16,772 |
American Balanced Fund — Page 4 of 27
Bonds, notes & other debt instruments
Corporate bonds & notes (continued)
Financials (continued) | Principal amount
(000) | Value
(000) |
| Hospitality Properties Trust 6.30% 2016 | $12,631 | $13,201 |
| Hospitality Properties Trust 6.70% 2018 | 23,400 | 25,871 |
| Hospitality Properties Trust 5.00% 2022 | 4,350 | 4,591 |
| Hospitality Properties Trust 4.50% 2023 | 16,130 | 16,444 |
| Hospitality Properties Trust 4.50% 2025 | 1,600 | 1,614 |
| HSBC Holdings PLC 4.25% 2024 | 25,400 | 26,481 |
| Intercontinentalexchange, Inc. 2.50% 2018 | 26,000 | 26,498 |
| Intesa Sanpaolo SpA 5.017% 20243 | 26,160 | 25,436 |
| JPMorgan Chase & Co. 1.35% 2017 | 23,520 | 23,533 |
| JPMorgan Chase & Co. 1.625% 2018 | 21,500 | 21,283 |
| JPMorgan Chase & Co. 3.25% 2022 | 12,000 | 12,090 |
| JPMorgan Chase & Co. 3.20% 2023 | 5,000 | 5,007 |
| JPMorgan Chase & Co. 3.625% 2024 | 2,330 | 2,388 |
| JPMorgan Chase & Co. 3.875% 2024 | 95,015 | 95,210 |
| JPMorgan Chase & Co., Series S, junior subordinated, perpetual, 6.75% (undated)4 | 25,000 | 26,531 |
| Keybank National Association 2.50% 2019 | 17,000 | 17,089 |
| Kimco Realty Corp., Series C, 5.783% 2016 | 14,000 | 14,751 |
| Kimco Realty Corp. 5.70% 2017 | 6,180 | 6,735 |
| Kimco Realty Corp. 3.125% 2023 | 15,705 | 15,415 |
| Leucadia National Corp. 5.50% 2023 | 830 | 853 |
| Liberty Mutual Group Inc. 4.25% 20233 | 3,000 | 3,097 |
| Lloyds Banking Group PLC 2.30% 2018 | 7,430 | 7,507 |
| Lloyds Banking Group PLC 2.35% 2019 | 17,895 | 17,902 |
| Lloyds Banking Group PLC 4.50% 2024 | 17,000 | 17,189 |
| MetLife Global Funding I 2.50% 20153 | 16,000 | 16,234 |
| MetLife Global Funding I 2.30% 20193 | 31,975 | 32,133 |
| Metlife, Inc. 3.60% 2024 | 12,375 | 12,725 |
| Morgan Stanley 3.80% 2016 | 5,700 | 5,891 |
| Morgan Stanley 2.375% 2019 | 23,865 | 23,792 |
| Morgan Stanley 3.75% 2023 | 5,000 | 5,138 |
| Morgan Stanley 3.70% 2024 | 13,815 | 14,032 |
| Morgan Stanley, Series F, 3.875% 2024 | 38,800 | 39,888 |
| Morgan Stanley 4.35% 2026 | 14,025 | 14,128 |
| National Australia Bank 2.40% 20193 | 24,300 | 24,282 |
| Nationwide Mutual Insurance Co. 5.81% 20243,4 | 8,150 | 8,168 |
| New York Life Global Funding 2.10% 20193 | 15,000 | 15,068 |
| PNC Bank 2.40% 2019 | 14,800 | 14,879 |
| PNC Financial Services Group, Inc. 3.90% 2024 | 23,800 | 24,236 |
| PRICOA Global Funding I 1.35% 20173 | 15,500 | 15,447 |
| Prologis, Inc. 4.25% 2023 | 29,420 | 31,141 |
| Prudential Financial, Inc. 2.30% 2018 | 7,595 | 7,690 |
| Prudential Financial, Inc. 3.50% 2024 | 25,300 | 25,767 |
| QBE Insurance Group Ltd. 2.40% 20183 | 17,000 | 17,015 |
| Rabobank Nederland 2.25% 2019 | 15,000 | 15,126 |
| Rabobank Nederland 4.625% 2023 | 35,495 | 37,719 |
| Scentre Group 2.375% 20193 | 14,845 | 14,753 |
| Scentre Group, 3.50% 20253 | 33,445 | 33,647 |
| Simon Property Group, LP 1.50% 20183 | 13,825 | 13,748 |
| State Street Corp. 3.30% 2024 | 15,000 | 15,256 |
| Sumitomo Mitsui Banking Corp. 2.50% 2018 | 12,475 | 12,623 |
| Svenska Handelsbanken AB 2.25% 2019 | 10,000 | 10,061 |
| Toronto-Dominion Bank 2.375% 2016 | 5,725 | 5,862 |
| Toronto-Dominion Bank 2.25% 2019 | 14,000 | 14,044 |
| Unum Group 5.625% 2020 | 345 | 389 |
American Balanced Fund — Page 5 of 27
Bonds, notes & other debt instruments
Corporate bonds & notes (continued)
Financials (continued) | Principal amount
(000) | Value
(000) |
| US Bancorp., Series T, 1.65% 2017 | $19,500 | $19,658 |
| US Bancorp. 3.70% 2024 | 26,300 | 27,700 |
| US Bank NA 2.125% 2019 | 30,000 | 29,923 |
| WEA Finance LLC 2.70% 20193 | 5,395 | 5,399 |
| WEA Finance LLC 3.75% 20243 | 22,800 | 23,184 |
| WEA Finance LLC 4.75% 20443 | 6,670 | 7,142 |
| Wells Fargo & Co. 1.25% 2016 | 3,000 | 3,012 |
| Wells Fargo & Co. 3.676% 2016 | 19,000 | 19,720 |
| Wells Fargo & Co. 2.125% 2019 | 25,000 | 25,019 |
| Wells Fargo & Co. 4.60% 2021 | 25,000 | 27,855 |
| Wells Fargo & Co. 3.30% 2024 | 39,300 | 39,595 |
| Westpac Banking Corp. 3.00% 2015 | 15,300 | 15,630 |
| | | 2,333,926 |
| Consumer discretionary 1.07% | | |
| 21st Century Fox America, Inc. 3.70% 20243 | 18,420 | 18,985 |
| Amazon.com, Inc. 3.80% 2024 | 53,575 | 54,999 |
| Amazon.com, Inc. 4.80% 2034 | 20,000 | 20,981 |
| Amazon.com, Inc. 4.95% 2044 | 36,000 | 37,363 |
| American Honda Finance Corp. 2.25% 20195 | 16,500 | 16,564 |
| Bed Bath & Beyond Inc. 3.749% 2024 | 9,095 | 9,231 |
| Carnival Corp. 3.95% 2020 | 1,795 | 1,883 |
| CBS Corp. 2.30% 2019 | 39,300 | 38,873 |
| Comcast Corp. 6.30% 2017 | 16,750 | 18,984 |
| Comcast Corp. 3.60% 2024 | 1,600 | 1,684 |
| Comcast Corp. 6.45% 2037 | 15,000 | 20,022 |
| Comcast Corp. 4.65% 2042 | 5,000 | 5,495 |
| Comcast Corp. 4.75% 2044 | 22,000 | 24,618 |
| Cox Communications, Inc. 2.95% 20233 | 4,500 | 4,323 |
| DaimlerChrysler North America Holding Corp. 1.30% 20153 | 6,000 | 6,026 |
| DaimlerChrysler North America Holding Corp. 1.375% 20173 | 15,125 | 15,065 |
| DaimlerChrysler North America Holding Corp. 2.40% 20173 | 12,000 | 12,258 |
| DaimlerChrysler North America Holding Corp. 2.25% 20193 | 13,000 | 12,970 |
| DaimlerChrysler North America Holding Corp. 2.875% 20213 | 14,900 | 15,054 |
| DaimlerChrysler North America Holding Corp. 3.25% 20243 | 7,570 | 7,639 |
| DIRECTV Holdings LLC and DIRECTV Financing Co., Inc. 5.15% 2042 | 7,100 | 7,364 |
| Ford Motor Credit Co. 1.70% 2016 | 17,000 | 17,069 |
| Ford Motor Credit Co. 2.50% 2016 | 13,000 | 13,151 |
| Ford Motor Credit Co. 1.50% 2017 | 8,500 | 8,459 |
| Ford Motor Credit Co. 2.375% 2018 | 8,990 | 9,049 |
| Ford Motor Credit Co. 2.597% 2019 | 50,735 | 50,519 |
| Ford Motor Credit Co. 4.375% 2023 | 25,475 | 27,283 |
| Ford Motor Credit Co. 3.664% 2024 | 17,500 | 17,570 |
| General Motors Co. 4.00% 2025 | 6,075 | 6,105 |
| General Motors Co. 5.20% 2045 | 13,500 | 14,276 |
| General Motors Financial Co. 3.50% 2019 | 4,685 | 4,789 |
| Home Depot, Inc. 2.00% 2019 | 47,700 | 47,867 |
| Home Depot, Inc. 4.40% 2021 | 15,000 | 16,710 |
| Home Depot, Inc. 5.95% 2041 | 15,000 | 19,664 |
| Johnson Controls, Inc. 1.40% 2017 | 10,000 | 9,917 |
| NBC Universal Enterprise, Inc. 5.25% (undated)3 | 475 | 495 |
| NBCUniversal Media, LLC 2.875% 2016 | 12,000 | 12,311 |
| News America Inc. 3.00% 2022 | 6,000 | 5,970 |
| Nordstrom, Inc. 4.00% 2021 | 6,245 | 6,691 |
American Balanced Fund — Page 6 of 27
Bonds, notes & other debt instruments
Corporate bonds & notes (continued)
Consumer discretionary (continued) | Principal amount
(000) | Value
(000) |
| Thomson Reuters Corp. 1.65% 2017 | $9,790 | $9,737 |
| Thomson Reuters Corp. 6.50% 2018 | 20,815 | 23,677 |
| Thomson Reuters Corp. 4.30% 2023 | 4,500 | 4,796 |
| Thomson Reuters Corp. 5.65% 2043 | 2,000 | 2,320 |
| Time Inc., Term Loan B, 4.25% 20214,6,7 | 5,547 | 5,506 |
| Time Warner Cable Inc. 6.75% 2018 | 20,000 | 22,956 |
| Time Warner Inc. 5.875% 2016 | 9,210 | 9,990 |
| Time Warner Inc. 4.65% 2044 | 12,000 | 12,562 |
| Toyota Motor Credit Corp. 0.875% 2015 | 16,000 | 16,047 |
| Toyota Motor Credit Corp. 2.125% 2019 | 9,450 | 9,488 |
| Viacom Inc. 2.75% 2019 | 9,995 | 10,026 |
| Viacom Inc. 4.25% 2023 | 8,000 | 8,263 |
| Viacom Inc. 3.875% 2024 | 13,100 | 13,175 |
| Viacom Inc. 4.85% 2034 | 10,055 | 10,322 |
| Volkswagen Group of America Finance, LLC 1.60% 20173 | 11,600 | 11,567 |
| Volkswagen Group of America Finance, LLC 2.45% 20193 | 10,250 | 10,329 |
| Volkswagen International Finance NV 2.375% 20173 | 16,000 | 16,320 |
| Walt Disney Co. 1.10% 2017 | 14,255 | 14,185 |
| | | 849,542 |
| Energy 1.06% | | |
| Anadarko Petroleum Corp. 5.95% 2016 | 14,500 | 15,516 |
| Anadarko Petroleum Corp. 3.45% 2024 | 8,260 | 8,080 |
| Anadarko Petroleum Corp. 6.45% 2036 | 3,700 | 4,460 |
| BG Energy Capital PLC 2.50% 20153 | 7,200 | 7,313 |
| BG Energy Capital PLC 2.875% 20163 | 8,325 | 8,539 |
| Canadian Natural Resources Ltd. 5.70% 2017 | 11,925 | 12,935 |
| Canadian Natural Resources Ltd. 3.80% 2024 | 1,720 | 1,691 |
| Cenovus Energy Inc. 3.00% 2022 | 7,395 | 6,933 |
| Cenovus Energy Inc. 3.80% 2023 | 20,710 | 20,260 |
| Chevron Corp. 2.193% 2019 | 19,330 | 19,423 |
| ConocoPhillips 1.05% 2017 | 16,000 | 15,806 |
| Devon Energy Corp. 2.25% 2018 | 12,060 | 12,028 |
| Diamond Offshore Drilling, Inc. 4.875% 2043 | 25,530 | 21,827 |
| Enbridge Energy Partners, LP, Series B, 6.50% 2018 | 12,250 | 13,885 |
| Enbridge Energy Partners, LP 4.20% 2021 | 300 | 314 |
| Enbridge Energy Partners, LP, Series B, 7.50% 2038 | 12,250 | 15,034 |
| Enbridge Energy Partners, LP 5.50% 2040 | 15,000 | 14,754 |
| Enbridge Inc. 5.60% 2017 | 10,000 | 10,863 |
| Enbridge Inc. 4.00% 2023 | 45,000 | 44,027 |
| EnLink Midstream Partners, LP 4.40% 2024 | 16,245 | 16,487 |
| EnLink Midstream Partners, LP 5.05% 2045 | 9,405 | 9,121 |
| Enterprise Products Operating LLC 1.25% 2015 | 10,000 | 10,029 |
| Enterprise Products Operating LLC 2.55% 2019 | 10,285 | 10,193 |
| Enterprise Products Operating LLC 5.20% 2020 | 6,355 | 7,018 |
| Enterprise Products Operating LLC 3.35% 2023 | 13,000 | 12,881 |
| Enterprise Products Operating LLC 3.90% 2024 | 34,845 | 35,555 |
| Enterprise Products Operating LLC 3.75% 2025 | 4,175 | 4,200 |
| Exxon Mobil Corp. 0.921% 2017 | 15,000 | 14,990 |
| Exxon Mobil Corp. 1.819% 2019 | 20,000 | 20,065 |
| Halliburton Co. 2.00% 2018 | 10,000 | 9,965 |
| Kinder Morgan Energy Partners, LP 6.00% 2017 | 18,000 | 19,455 |
| Kinder Morgan Energy Partners, LP 2.65% 2019 | 20,000 | 19,725 |
| Kinder Morgan Energy Partners, LP 3.50% 2021 | 3,980 | 3,921 |
American Balanced Fund — Page 7 of 27
Bonds, notes & other debt instruments
Corporate bonds & notes (continued)
Energy (continued) | Principal amount
(000) | Value
(000) |
| Kinder Morgan Energy Partners, LP 4.15% 2022 | $12,855 | $12,974 |
| Kinder Morgan Energy Partners, LP 4.25% 2024 | 13,045 | 13,096 |
| Kinder Morgan Energy Partners, LP 5.40% 2044 | 13,135 | 13,210 |
| Kinder Morgan Energy Partners, LP 5.50% 2044 | 8,793 | 8,971 |
| Kinder Morgan, Inc. 3.05% 2019 | 17,150 | 17,033 |
| Kinder Morgan, Inc. 4.30% 2025 | 25,695 | 25,834 |
| Kinder Morgan, Inc. 5.30% 2034 | 8,205 | 8,354 |
| Kinder Morgan, Inc. 5.55% 2045 | 21,500 | 22,102 |
| Marathon Oil Corp. 0.90% 2015 | 16,000 | 15,959 |
| Petróleos Mexicanos 3.50% 2023 | 22,000 | 21,098 |
| Shell International Finance BV 1.125% 2017 | 21,000 | 20,979 |
| Shell International Finance BV 2.00% 2018 | 8,915 | 8,984 |
| Spectra Energy Partners, LP 4.75% 2024 | 7,030 | 7,549 |
| Statoil ASA 3.125% 2017 | 16,500 | 17,250 |
| Statoil ASA 2.75% 2021 | 11,945 | 11,999 |
| Statoil ASA 3.25% 2024 | 3,405 | 3,423 |
| Statoil ASA 4.25% 2041 | 6,000 | 6,175 |
| StatoilHydro ASA 1.80% 2016 | 16,000 | 16,240 |
| Total Capital Canada Ltd. 1.45% 2018 | 10,940 | 10,871 |
| Total Capital International 2.125% 2018 | 10,500 | 10,594 |
| Total Capital International 2.10% 2019 | 15,000 | 15,023 |
| Total Capital SA 3.00% 2015 | 17,000 | 17,201 |
| TransCanada PipeLines Ltd. 0.875% 2015 | 13,000 | 13,007 |
| TransCanada PipeLines Ltd. 5.00% 2043 | 22,000 | 23,139 |
| Transocean Inc. 6.375% 2021 | 13,050 | 12,054 |
| Williams Companies, Inc. 4.55% 2024 | 5,903 | 5,500 |
| Williams Partners LP 4.125% 2020 | 3,000 | 3,078 |
| Williams Partners LP 4.50% 2023 | 12,400 | 12,536 |
| Williams Partners LP 4.30% 2024 | 7,870 | 7,870 |
| Williams Partners LP 3.90% 2025 | 12,000 | 11,557 |
| Williams Partners LP 5.40% 2044 | 1,915 | 1,882 |
| | | 842,835 |
| Consumer staples 0.98% | | |
| Altria Group, Inc. 9.25% 2019 | 5,067 | 6,519 |
| Altria Group, Inc. 2.625% 2020 | 30,125 | 30,247 |
| Altria Group, Inc. 2.95% 2023 | 12,000 | 11,625 |
| Altria Group, Inc. 4.00% 2024 | 7,400 | 7,730 |
| Altria Group, Inc. 9.95% 2038 | 13,500 | 23,165 |
| Altria Group, Inc. 4.50% 2043 | 18,700 | 18,907 |
| Altria Group, Inc. 5.375% 2044 | 4,000 | 4,571 |
| Anheuser-Busch InBev NV 3.625% 2015 | 33,000 | 33,294 |
| Anheuser-Busch InBev NV 4.125% 2015 | 16,500 | 16,516 |
| Anheuser-Busch InBev NV 1.375% 2017 | 16,000 | 15,997 |
| Anheuser-Busch InBev NV 7.75% 2019 | 20,000 | 24,246 |
| British American Tobacco International Finance PLC 2.125% 20173 | 16,000 | 16,159 |
| British American Tobacco International Finance PLC 9.50% 20183 | 11,955 | 15,061 |
| Coca-Cola Co. 1.50% 2015 | 18,970 | 19,163 |
| Coca-Cola Co. 1.80% 2016 | 17,500 | 17,798 |
| ConAgra Foods, Inc. 1.90% 2018 | 4,220 | 4,195 |
| ConAgra Foods, Inc. 3.20% 2023 | 10,347 | 10,153 |
| CVS Caremark Corp. 2.25% 2019 | 10,960 | 10,926 |
| CVS Caremark Corp. 4.00% 2023 | 9,800 | 10,390 |
| General Mills, Inc. 1.40% 2017 | 8,115 | 8,087 |
American Balanced Fund — Page 8 of 27
Bonds, notes & other debt instruments
Corporate bonds & notes (continued)
Consumer staples (continued) | Principal amount
(000) | Value
(000) |
| General Mills, Inc. 2.20% 2019 | $9,235 | $9,168 |
| Imperial Tobacco Finance PLC 2.05% 20183 | 16,000 | 15,922 |
| Imperial Tobacco Finance PLC 3.50% 20233 | 17,000 | 16,732 |
| Kraft Foods Inc. 2.25% 2017 | 9,725 | 9,892 |
| Kraft Foods Inc. 5.375% 2020 | 10,472 | 11,898 |
| Kraft Foods Inc. 3.50% 2022 | 23,285 | 23,899 |
| Kroger Co. 3.85% 2023 | 3,655 | 3,796 |
| Kroger Co. 5.00% 2042 | 2,500 | 2,734 |
| Kroger Co. 5.15% 2043 | 6,800 | 7,772 |
| Mondelez International, Inc. 4.00% 2024 | 12,400 | 12,998 |
| PepsiCo, Inc. 7.90% 2018 | 15,000 | 18,264 |
| Pernod Ricard SA 2.95% 20173 | 35,500 | 36,341 |
| Pernod Ricard SA 4.45% 20223 | 9,600 | 10,294 |
| Philip Morris International Inc. 3.25% 2024 | 49,800 | 50,012 |
| Philip Morris International Inc. 4.875% 2043 | 4,000 | 4,477 |
| Philip Morris International Inc. 4.25% 2044 | 6,000 | 6,127 |
| Procter & Gamble Co. 1.45% 2016 | 13,460 | 13,625 |
| Reynolds American Inc. 3.25% 2022 | 11,420 | 11,143 |
| Reynolds American Inc. 4.85% 2023 | 12,000 | 12,940 |
| Reynolds American Inc. 6.15% 2043 | 4,385 | 5,104 |
| SABMiller Holdings Inc. 2.45% 20173 | 20,245 | 20,667 |
| SABMiller Holdings Inc. 2.20% 20183 | 18,700 | 18,766 |
| Tyson Foods, Inc. 3.95% 2024 | 7,325 | 7,587 |
| Walgreens Boots Alliance, Inc. 3.30% 2021 | 20,000 | 20,169 |
| Walgreens Boots Alliance, Inc. 3.80% 2024 | 28,750 | 29,381 |
| Wal-Mart Stores, Inc. 2.875% 2015 | 11,700 | 11,768 |
| Wal-Mart Stores, Inc. 2.80% 2016 | 19,000 | 19,508 |
| Wal-Mart Stores, Inc. 3.30% 2024 | 19,055 | 19,713 |
| Wal-Mart Stores, Inc. 4.00% 2043 | 2,784 | 2,901 |
| Wal-Mart Stores, Inc. 4.30% 2044 | 6,516 | 7,143 |
| WM. Wrigley Jr. Co 2.40% 20183 | 300 | 302 |
| WM. Wrigley Jr. Co 3.375% 20203 | 30,670 | 31,390 |
| | | 777,182 |
| Health care 0.91% | | |
| AbbVie Inc. 1.75% 2017 | 8,000 | 8,024 |
| AbbVie Inc. 2.90% 2022 | 9,100 | 8,975 |
| AbbVie Inc. 4.40% 2042 | 13,400 | 13,880 |
| Aetna Inc. 2.20% 2019 | 10,050 | 9,994 |
| Bayer AG 2.375% 20193 | 24,345 | 24,469 |
| Bayer AG 3.00% 20213 | 16,300 | 16,458 |
| Bayer AG 3.375% 20243 | 7,000 | 7,138 |
| Becton, Dickinson and Co. 3.734% 2024 | 26,270 | 27,091 |
| Becton, Dickinson and Co. 4.685% 2044 | 8,500 | 9,192 |
| Catholic Health Initiatives, Series 2012, 1.60% 2017 | 2,000 | 1,993 |
| Celgene Corp 3.625% 2024 | 32,655 | 33,409 |
| Celgene Corp 4.625% 2044 | 2,400 | 2,499 |
| DENTSPLY International Inc. 2.75% 2016 | 9,830 | 10,051 |
| Express Scripts Inc. 3.125% 2016 | 5,000 | 5,143 |
| Gilead Sciences, Inc. 3.05% 2016 | 11,425 | 11,864 |
| Gilead Sciences, Inc. 2.35% 2020 | 16,000 | 16,105 |
| Gilead Sciences, Inc. 3.70% 2024 | 21,850 | 22,961 |
| Gilead Sciences, Inc. 3.50% 2025 | 11,710 | 12,044 |
| Gilead Sciences, Inc. 4.50% 2045 | 23,500 | 25,222 |
American Balanced Fund — Page 9 of 27
Bonds, notes & other debt instruments
Corporate bonds & notes (continued)
Health care (continued) | Principal amount
(000) | Value
(000) |
| Humana Inc. 3.15% 2022 | $20,000 | $19,481 |
| McKesson Corp. 3.796% 2024 | 14,345 | 14,764 |
| Medco Health Solutions, Inc. 2.75% 2015 | 10,095 | 10,230 |
| Medtronic, Inc. 2.50% 20203 | 14,580 | 14,636 |
| Medtronic, Inc. 3.50% 20253 | 42,200 | 43,262 |
| Medtronic, Inc. 4.375% 20353 | 18,140 | 19,309 |
| Medtronic, Inc. 4.625% 20453 | 19,325 | 21,036 |
| Novartis Capital Corp. 2.90% 2015 | 16,000 | 16,125 |
| Novartis Capital Corp. 3.40% 2024 | 23,650 | 24,652 |
| Pfizer Inc. 7.20% 2039 | 1,200 | 1,750 |
| Pfizer Inc. 2.10% 2019 | 26,385 | 26,554 |
| Pfizer Inc. 3.40% 2024 | 9,505 | 9,909 |
| Pfizer Inc. 4.40% 2044 | 6,000 | 6,554 |
| Roche Holdings, Inc. 2.25% 20193 | 17,000 | 17,127 |
| Roche Holdings, Inc. 2.875% 20213 | 22,000 | 22,308 |
| Roche Holdings, Inc. 3.35% 20243 | 27,240 | 28,207 |
| Thermo Fisher Scientific Inc. 1.30% 2017 | 15,000 | 14,924 |
| Thermo Fisher Scientific Inc. 2.40% 2019 | 13,375 | 13,408 |
| Thermo Fisher Scientific Inc. 3.30% 2022 | 4,550 | 4,565 |
| Thermo Fisher Scientific Inc. 4.15% 2024 | 26,630 | 28,137 |
| UnitedHealth Group Inc. 1.40% 2017 | 10,000 | 9,999 |
| UnitedHealth Group Inc. 6.00% 2017 | 22,170 | 24,597 |
| UnitedHealth Group Inc. 6.00% 2018 | 35,000 | 39,426 |
| WellPoint, Inc. 2.25% 2019 | 15,500 | 15,361 |
| WellPoint, Inc. 3.50% 2024 | 14,100 | 14,230 |
| | | 727,063 |
| Utilities 0.77% | | |
| American Electric Power Co. 2.95% 2022 | 16,090 | 15,811 |
| Berkshire Hathaway Energy Co. 2.40% 20203 | 10,053 | 10,021 |
| Berkshire Hathaway Energy Co. 3.50% 20253 | 8,630 | 8,703 |
| CenterPoint Energy Resources Corp. 4.50% 2021 | 8,751 | 9,609 |
| CMS Energy Corp. 8.75% 2019 | 6,647 | 8,330 |
| CMS Energy Corp. 5.05% 2022 | 8,100 | 9,095 |
| CMS Energy Corp. 3.875% 2024 | 14,310 | 14,887 |
| Consumers Energy Co., First Mortgage Bonds, 3.125% 2024 | 17,095 | 17,188 |
| Dominion Gas Holdings LLC 2.50% 2019 | 17,885 | 17,950 |
| Dominion Gas Holdings LLC 3.60 2024 | 8,678 | 8,846 |
| Duke Energy Carolinas, Inc. 4.0% 2042 | 96 | 99 |
| Duke Energy Corp. 3.95% 2023 | 7,000 | 7,435 |
| Duke Energy Corp. 3.75% 2024 | 16,800 | 17,510 |
| Duke Energy Progress Inc. 4.15% 2044 | 26,830 | 28,645 |
| E.ON International Finance BV 5.80% 20183 | 24,450 | 27,290 |
| Electricité de France SA 6.95% 20393 | 12,000 | 16,357 |
| Electricité de France SA 4.875% 20443 | 9,000 | 10,029 |
| Entergy Corp. 4.70% 2017 | 9,600 | 10,115 |
| MidAmerican Energy Co. 2.40% 2019 | 5,500 | 5,590 |
| MidAmerican Energy Holdings Co. 5.75% 2018 | 15,300 | 17,159 |
| MidAmerican Energy Holdings Co. 3.75% 2023 | 33,100 | 34,575 |
| National Rural Utilities Cooperative Finance Corp. 10.375% 2018 | 8,450 | 11,017 |
| National Rural Utilities Cooperative Finance Corp. 2.15% 2019 | 18,000 | 18,027 |
| National Rural Utilities Cooperative Finance Corp. 3.40% 2023 | 8,000 | 8,290 |
| Niagara Mohawk Power Corp. 3.508% 20243 | 6,375 | 6,579 |
| Northern States Power Co. 4.125% 2044 | 18,000 | 19,126 |
American Balanced Fund — Page 10 of 27
Bonds, notes & other debt instruments
Corporate bonds & notes (continued)
Utilities (continued) | Principal amount
(000) | Value
(000) |
| NV Energy, Inc 6.25% 2020 | $10,168 | $11,961 |
| Ohio Power Co., Series G, 6.60% 2033 | 165 | 220 |
| Pacific Gas and Electric Co. 3.25% 2023 | 7,528 | 7,556 |
| Pacific Gas and Electric Co. 3.85% 2023 | 21,430 | 22,347 |
| Pacific Gas and Electric Co. 3.40% 2024 | 21,559 | 21,861 |
| Pacific Gas and Electric Co. 3.75% 2024 | 30,000 | 31,297 |
| Pacific Gas and Electric Co. 4.75% 2044 | 5,200 | 5,742 |
| Pacific Gas and Electric Co. 4.30% 2045 | 8,570 | 8,834 |
| PacifiCorp., First Mortgage Bonds, 5.65% 2018 | 2,465 | 2,787 |
| PacifiCorp., First Mortgage Bonds, 3.60% 2024 | 20,505 | 21,232 |
| PG&E Corp. 2.40% 2019 | 9,380 | 9,404 |
| Public Service Electric and Gas Co. 2.00% 2019 | 10,680 | 10,663 |
| Public Service Electric and Gas Co., 2.375% 2023 | 2,075 | 1,999 |
| Public Service Electric and Gas Co., 3.05% 2024 | 13,425 | 13,506 |
| Puget Sound Energy, Inc., First Lien, 6.50% 2020 | 5,750 | 6,766 |
| Puget Sound Energy, Inc., First Lien, 6.00% 2021 | 8,400 | 9,841 |
| Puget Sound Energy, Inc., First Lien, 5.625% 2022 | 9,050 | 10,488 |
| Sierra Pacific Power Co., General and Refunding Mortgage Notes, Series T, 3.375% 2023 | 14,000 | 14,560 |
| Tampa Electric Co. 4.35% 2044 | 18,025 | 19,302 |
| Teco Finance, Inc. 5.15% 2020 | 5,627 | 6,291 |
| Tri-State Generation and Transmission Assn. Inc., Pass Through Trust, Series 2003-A, 6.04% 20183,6 | 1,886 | 2,001 |
| Virginia Electric and Power Co., Series B, 5.95% 2017 | 10,000 | 11,163 |
| Virginia Electric and Power Co. 3.45% 2024 | 6,415 | 6,618 |
| Virginia Electric and Power Co. 4.45% 2044 | 1,195 | 1,311 |
| | | 616,033 |
| Industrials 0.54% | | |
| American Airlines, Inc., Series 2013-2, Class A, 4.95% 20246 | 11,013 | 11,839 |
| Atlas Copco AB 5.60% 20173 | 15,905 | 17,356 |
| Boeing Company 0.95% 2018 | 12,000 | 11,743 |
| Burlington Northern Santa Fe LLC 3.00% 2023 | 4,000 | 3,995 |
| Burlington Northern Santa Fe LLC 4.90% 2044 | 15,000 | 16,933 |
| Canadian National Railway Co. 1.45% 2016 | 8,900 | 8,968 |
| Continental Airlines, Inc., Series 1997-1, Class A, 7.461% 20166 | 435 | 441 |
| Continental Airlines, Inc., Series 1998-1, Class A, 6.648% 20196 | 3,709 | 3,897 |
| Continental Airlines, Inc., Series 1997-4, Class A, 6.90% 20196 | 2,667 | 2,806 |
| Continental Airlines, Inc., Series 1999-1, Class A, 6.545% 20206 | 5,606 | 6,205 |
| Continental Airlines, Inc., Series 2001-1, Class A-1, 6.703% 20226 | 6,365 | 6,859 |
| CSX Corp. 6.25% 2015 | 1,997 | 2,024 |
| CSX Corp. 3.40% 2024 | 8,620 | 8,748 |
| Danaher Corp. 2.30% 2016 | 16,795 | 17,184 |
| ERAC USA Finance Co. 2.80% 20183 | 9,900 | 10,121 |
| General Electric Capital Corp. 1.00% 2015 | 8,700 | 8,741 |
| General Electric Capital Corp., Series A, 2.25% 2015 | 21,500 | 21,803 |
| General Electric Capital Corp. 2.95% 2016 | 5,305 | 5,463 |
| General Electric Capital Corp. 2.30% 2017 | 26,100 | 26,750 |
| General Electric Capital Corp. 2.45% 2017 | 15,000 | 15,420 |
| General Electric Capital Corp., Series A, 6.00% 2019 | 9,000 | 10,479 |
| General Electric Capital Corp. 3.45% 2024 | 14,000 | 14,483 |
| General Electric Co. 0.85% 2015 | 14,500 | 14,542 |
| General Electric Co. 2.70% 2022 | 16,000 | 16,034 |
| General Electric Co. 4.125% 2042 | 11,000 | 11,435 |
| General Electric Co. 4.50% 2044 | 2,600 | 2,870 |
| General Electric Corp. 5.25% 2017 | 16,000 | 17,758 |
American Balanced Fund — Page 11 of 27
Bonds, notes & other debt instruments
Corporate bonds & notes (continued)
Industrials (continued) | Principal amount
(000) | Value
(000) |
| Norfolk Southern Corp. 5.75% 2016 | $7,615 | $7,983 |
| Southwest Airlines Co. 2.75% 2019 | 11,780 | 11,847 |
| Union Pacific Corp. 5.70% 2018 | 11,150 | 12,711 |
| United Technologies Corp. 3.10% 2022 | 44,309 | 45,284 |
| United Technologies Corp. 4.50% 2042 | 22,060 | 24,116 |
| Volvo Treasury AB 5.95% 20153 | 9,460 | 9,571 |
| Waste Management, Inc. 2.60% 2016 | 8,890 | 9,100 |
| Waste Management, Inc. 2.90% 2022 | 15,000 | 14,868 |
| | | 430,377 |
| Telecommunication services 0.48% | | |
| AT&T Inc. 2.40% 2016 | 18,000 | 18,376 |
| AT&T Inc. 4.80% 2044 | 11,800 | 12,071 |
| British Telecommunications PLC 2.35% 2019 | 18,950 | 18,941 |
| Deutsche Telekom International Finance BV 9.25% 2032 | 9,719 | 15,751 |
| Deutsche Telekom International Finance BV 4.875% 20423 | 620 | 665 |
| France Télécom 4.125% 2021 | 20,000 | 21,457 |
| Orange SA 2.75% 2019 | 16,977 | 17,309 |
| Orange SA 5.50% 2044 | 14,000 | 16,485 |
| Telecom Italia Capital SA 6.999% 2018 | 4,992 | 5,566 |
| Telefónica Emisiones, SAU 3.992% 2016 | 18,000 | 18,521 |
| Telefónica Emisiones, SAU 3.192% 2018 | 15,000 | 15,439 |
| Verizon Communications Inc. 3.00% 2021 | 10,000 | 9,877 |
| Verizon Communications Inc. 5.15% 2023 | 57,250 | 63,262 |
| Verizon Communications Inc. 3.50% 2024 | 27,040 | 26,622 |
| Verizon Communications Inc. 6.25% 2037 | 20,000 | 24,593 |
| Verizon Communications Inc. 6.55% 2043 | 35,095 | 45,028 |
| Verizon Communications Inc. 4.862% 20463 | 21,656 | 22,300 |
| Verizon Communications Inc. 5.012% 20543 | 28,783 | 29,908 |
| | | 382,171 |
| Materials 0.31% | | |
| Cliffs Natural Resources Inc. 4.875% 2021 | 2,310 | 1,253 |
| Eastman Chemical Co. 2.70% 2020 | 21,000 | 21,143 |
| Eastman Chemical Co. 3.80% 2025 | 9,800 | 9,997 |
| Ecolab Inc. 3.00% 2016 | 9,410 | 9,723 |
| Ecolab Inc. 4.35% 2021 | 1,000 | 1,091 |
| Ecolab Inc. 5.50% 2041 | 1,500 | 1,812 |
| Georgia-Pacific Corp. 2.539% 20193 | 21,000 | 21,017 |
| Georgia-Pacific Corp. 3.60% 20253 | 17,000 | 17,108 |
| Glencore Xstrata LLC 2.50% 20193 | 16,000 | 15,770 |
| Glencore Xstrata LLC 4.625% 20243 | 8,300 | 8,374 |
| Holcim Ltd. 5.15% 20233 | 12,500 | 13,957 |
| International Paper Co. 3.65% 2024 | 8,500 | 8,511 |
| International Paper Co. 7.30% 2039 | 8,425 | 11,208 |
| Monsanto Co. 3.375% 2024 | 10,000 | 10,181 |
| Monsanto Co. 4.40% 2044 | 13,090 | 13,638 |
| Mosaic Co. 4.25% 2023 | 4,600 | 4,863 |
| Mosaic Co. 5.625% 2043 | 4,000 | 4,601 |
| Newcrest Finance Pty Ltd. 4.45% 20213 | 12,625 | 12,015 |
| Packaging Corp. of America 4.50% 2023 | 610 | 640 |
| Praxair, Inc. 1.05% 2017 | 16,000 | 15,843 |
| Rio Tinto Finance (USA) Ltd. 2.25% 2016 | 15,000 | 15,286 |
| Rio Tinto Finance (USA) Ltd. 1.625% 2017 | 16,000 | 16,005 |
American Balanced Fund — Page 12 of 27
Bonds, notes & other debt instruments
Corporate bonds & notes (continued)
Materials (continued) | Principal amount
(000) | Value
(000) |
| Rohm and Haas Co. 6.00% 2017 | $5,003 | $5,537 |
| Xstrata Canada Financial Corp. 4.95% 20213 | 10,000 | 10,565 |
| | | 250,138 |
| Information technology 0.21% | | |
| International Business Machines Corp. 1.95% 2016 | 52,500 | 53,522 |
| International Business Machines Corp. 2.00% 2016 | 16,000 | 16,241 |
| International Business Machines Corp. 3.625% 2024 | 30,960 | 32,317 |
| KLA-Tencor Corp. 4.65% 2024 | 17,000 | 17,633 |
| Oracle Corp. 2.25% 2019 | 18,500 | 18,645 |
| Oracle Corp. 2.375% 2019 | 17,500 | 17,820 |
| Oracle Corp. 2.80% 2021 | 6,100 | 6,185 |
| Xerox Corp. 2.75% 2019 | 5,000 | 5,017 |
| | | 167,380 |
| Total corporate bonds & notes | | 7,376,647 |
U.S. Treasury bonds & notes 7.90%
U.S. Treasury 6.34% | | |
| U.S. Treasury 0.25% 2015 | 489,000 | 489,323 |
| U.S. Treasury 0.375% 2015 | 382,000 | 382,489 |
| U.S. Treasury 1.375% 2015 | 70,000 | 70,712 |
| U.S. Treasury 0.625% 2016 | 217,500 | 217,798 |
| U.S. Treasury 1.50% 2016 | 205,000 | 208,087 |
| U.S. Treasury 4.50% 2016 | 58,500 | 61,215 |
| U.S. Treasury 0.875% 2017 | 136,675 | 136,857 |
| U.S. Treasury 0.625% 2018 | 775,000 | 759,438 |
| U.S. Treasury 1.50% 2019 | 511,500 | 508,201 |
| U.S. Treasury 1.50% 2019 | 157,895 | 157,536 |
| U.S. Treasury 1.625% 2019 | 351,250 | 350,864 |
| U.S. Treasury 1.625% 2019 | 65,000 | 65,173 |
| U.S. Treasury 1.625% 2019 | 40,000 | 40,066 |
| U.S. Treasury 1.75% 2019 | 382,150 | 384,328 |
| U.S. Treasury 2.25% 2024 | 256,000 | 257,841 |
| U.S. Treasury 2.75% 2024 | 50,000 | 52,601 |
| U.S. Treasury 5.50% 2028 | 58,750 | 80,304 |
| U.S. Treasury 5.375% 2031 | 40,000 | 55,819 |
| U.S. Treasury 4.50% 2036 | 104,882 | 140,082 |
| U.S. Treasury 3.75% 2041 | 1,000 | 1,206 |
| U.S. Treasury 3.125% 2043 | 78,550 | 84,374 |
| U.S. Treasury 3.625% 2043 | 135,350 | 159,247 |
| U.S. Treasury 3.00% 2044 | 13,100 | 13,766 |
| U.S. Treasury 3.125% 2044 | 39,797 | 42,828 |
| U.S. Treasury 3.375% 2044 | 27,000 | 30,411 |
| U.S. Treasury 3.625% 2044 | 258,125 | 303,921 |
| | | 5,054,487 |
| U.S. Treasury inflation-protected securities 1.56% | | |
| U.S. Treasury Inflation-Protected Security 0.50% 20155 | 27,392 | 27,037 |
| U.S. Treasury Inflation-Protected Security 2.125% 20195 | 55,298 | 59,552 |
| U.S. Treasury Inflation-Protected Security 0.375% 20235 | 22,550 | 22,389 |
| U.S. Treasury Inflation-Protected Security 0.125% 20245 | 62,627 | 60,600 |
| U.S. Treasury Inflation-Protected Security 0.625% 20245 | 349,363 | 352,521 |
| U.S. Treasury Inflation-Protected Security 2.375% 20255 | 62,986 | 74,279 |
American Balanced Fund — Page 13 of 27
Bonds, notes & other debt instruments
U.S. Treasury bonds & notes (continued)
U.S. Treasury inflation-protected securities (continued) | Principal amount
(000) | Value
(000) |
| U.S. Treasury Inflation-Protected Security 0.75% 20425 | $79,550 | $77,920 |
| U.S. Treasury Inflation-Protected Security 0.625% 20435 | 69,404 | 65,798 |
| U.S. Treasury Inflation-Protected Security 1.375% 20445 | 438,688 | 501,401 |
| | | 1,241,497 |
| Total U.S. Treasury bonds & notes | | 6,295,984 |
| Mortgage-backed obligations 6.67% | | |
| Australia & New Zealand Banking Group Ltd. 1.00% 20163,6 | 500 | 502 |
| Australia & New Zealand Banking Group Ltd. 2.40% 20163,6 | 750 | 768 |
| Aventura Mall Trust, Series A, 3.743% 20323,4,6 | 20,700 | 22,023 |
| Banc of America Commercial Mortgage Inc., Series 2006-3, Class A-4, 5.889% 20444,6 | 6,533 | 6,881 |
| Banc of America Commercial Mortgage Inc., Series 2006-1, Class A1A, 5.378% 20454,6 | 23,585 | 24,365 |
| Banc of America Commercial Mortgage Inc., Series 2005-5, Class A-4, 5.115% 20454,6 | 5,899 | 5,988 |
| Banc of America Commercial Mortgage Inc., Series 2006-4, Class A-4, 5.634% 20466 | 1,854 | 1,941 |
| Banc of America Commercial Mortgage Inc., Series 2007-2, Class A-M, 5.791% 20494,6 | 4,100 | 4,436 |
| Banc of America Commercial Mortgage Inc., Series 2007-3, Class A-4, 5.563% 20494,6 | 13,569 | 14,576 |
| Banc of America Commercial Mortgage Inc., Series 2008-1, Class A-4, 6.427% 20514,6 | 24,985 | 27,615 |
| Bank of Montreal 2.85% 20153,6 | 17,000 | 17,172 |
| Bank of Montreal 2.625% 20163,6 | 650 | 664 |
| Bank of Montreal 1.95% 20173,6 | 250 | 254 |
| Bank of Nova Scotia 2.15% 20163,6 | 350 | 357 |
| Bank of Nova Scotia 1.95% 20173,6 | 200 | 203 |
| Bank of Nova Scotia 1.75% 20173,6 | 65,625 | 66,431 |
| Bank of Nova Scotia 2.125% 20196 | 16,225 | 16,278 |
| Barclays Bank PLC 2.50% 20153,6 | 550 | 558 |
| Barclays Bank PLC 2.25% 20173,6 | 2,850 | 2,910 |
| Bear Stearns Commercial Mortgage Securities Inc., Series 2005-PW10, Class AM, 5.449% 20404,6 | 20,000 | 20,658 |
| Bear Stearns Commercial Mortgage Securities Trust, Series 2006-T22, Class A1A, 5.557% 20384,6 | 8,308 | 8,676 |
| Bear Stearns Commercial Mortgage Securities Trust, Series 2007-PW17, Class A-4, 5.694% 20504,6 | 9,665 | 10,496 |
| Bear Stearns Commercial Mortgage Securities Trust, Series 2007-PW17, Class A-1-A, 5.65% 20504,6 | 1,840 | 2,006 |
| Bear Stearns Commercial Mortgage Securities Trust, Series 2007-PW18, Class A-M, 6.084% 20504,6 | 6,425 | 7,076 |
| Caisse Centrale Desjardins 1.60% 20173,6 | 600 | 606 |
| Canadian Imperial Bank of Commerce 2.75% 20163,6 | 400 | 409 |
| CHL Mortgage Pass-Through Trust, Series 2003-56, Class 6-A-1, 2.489% 20334,6 | 2,784 | 2,754 |
| Citigroup Commercial Mortgage Trust, Series 2006-C5, Class A-4, 5.431% 20496 | 6,352 | 6,730 |
| Citigroup-Deutsche Bank Commercial Mortgage Trust, Series 2005-CD1, Class A-4, 5.40% 20444,6 | 8,657 | 8,800 |
| Citigroup-Deutsche Bank Commercial Mortgage Trust, Series 2006-CD3, Class A-5, 5.617% 20486 | 21,281 | 22,365 |
| COMM Mortgage Trust Series 2014-277P, Class A, 3.611% 20493,4,6 | 33,500 | 35,054 |
| Commercial Mortgage Trust, Series 2006-C8, Class A1A, 5.292% 20466 | 18,806 | 20,101 |
| Commercial Mortgage Trust, Series 2007-C9, Class A-1-A, 5.796% 20494,6 | 1,008 | 1,092 |
| Commonwealth Bank of Australia 0.75% 20163,6 | 13,750 | 13,754 |
| Commonwealth Bank of Australia 2.25% 20173,6 | 675 | 690 |
| Commonwealth Bank of Australia 1.875% 20183,6 | 5,700 | 5,698 |
| Commonwealth Bank of Australia 2.00% 20193,6 | 23,500 | 23,488 |
| Connecticut Avenue Securities, Series 2013-C01, Class M-1, 2.155% 20233,4,6 | 816 | 820 |
| Connecticut Avenue Securities, Series 2014-C01, Class M-1, 1.755% 20243,4,6 | 1,734 | 1,727 |
| Connecticut Avenue Securities, Series 2014-C02, Class 1M1, 1.105% 20244,6 | 7,771 | 7,636 |
| Connecticut Avenue Securities, Series 2014-C03, Class 2M-1, 1.355% 20244,6 | 4,509 | 4,437 |
| Connecticut Avenue Securities, Series 2014-C03, Class 1M-1, 1.355% 20244,6 | 2,827 | 2,800 |
| Credit Mutuel-CIC Home Loan SFH 1.50% 20173,6 | 800 | 803 |
| Credit Suisse Group AG 2.60% 20163,6 | 700 | 717 |
| CS First Boston Mortgage Securities Corp., Series 2014-ICE, Class A, 01.05% 20273,4,6 | 5,215 | 5,209 |
| CS First Boston Mortgage Securities Corp., Series 2002-30, Class I-A-1, 7.50% 20326 | 474 | 514 |
American Balanced Fund — Page 14 of 27
Bonds, notes & other debt instruments
Mortgage-backed obligations (continued) | Principal amount
(000) | Value
(000) |
| CS First Boston Mortgage Securities Corp., Series 2002-34, Class I-A-1, 7.50% 20326 | $747 | $799 |
| CS First Boston Mortgage Securities Corp., Series 2003-21, Class V-A-1, 6.50% 20336 | 621 | 667 |
| CS First Boston Mortgage Securities Corp., Series 2003-29, Class V-A-1, 7.00% 20336 | 1,116 | 1,187 |
| CS First Boston Mortgage Securities Corp., Series 2004-5, Class IV-A-1, 6.00% 20346 | 3,717 | 3,830 |
| CS First Boston Mortgage Securities Corp., Series 2007-C3, Class A-1-A-1, 5.893% 20394,6 | 6,970 | 7,488 |
| CS First Boston Mortgage Securities Corp., Series 2006-C4, Class A1A, 5.46% 20396 | 7,244 | 7,642 |
| CS First Boston Mortgage Securities Corp., Series 2007-C5, Class A4, 5.695% 20404,6 | 18,360 | 19,833 |
| DBUBS Mortgage Trust, Series 2011-LC2A, Class A-2, 3.386% 20443,6 | 15,381 | 15,817 |
| DBUBS Mortgage Trust, Series 2011-LC1A, Class A1, 3.742% 20463,6 | 13,228 | 13,548 |
| DBUBS Mortgage Trust, Series 2011-LC1A, Class A3, 5.002% 20463,6 | 9,500 | 10,733 |
| DNB ASA 1.45% 20193,6 | 925 | 919 |
EQTY 2014-INNS Mortgage Trust Commercial Mortgage Pass-Through Certificates,
Series 2014-A, 1.003% 20313,4,6 | 20,910 | 20,924 |
EQTY 2014-INNS Mortgage Trust Commercial Mortgage Pass-Through Certificates,
Series 2014-B, 1.353% 20313,4,6 | 4,005 | 3,966 |
| Fannie Mae 11.00% 20186 | 41 | 44 |
| Fannie Mae 4.50% 20256 | 6,383 | 6,900 |
| Fannie Mae 4.50% 20256 | 6,461 | 6,984 |
| Fannie Mae 2.50% 20276 | 1,175 | 1,199 |
| Fannie Mae 2.50% 20276 | 2,389 | 2,439 |
| Fannie Mae 2.50% 20276 | 1,860 | 1,898 |
| Fannie Mae 2.50% 20276 | 987 | 1,007 |
| Fannie Mae 2.50% 20276 | 34,537 | 35,255 |
| Fannie Mae 2.50% 20276 | 33,237 | 33,928 |
| Fannie Mae 2.50% 20276 | 992 | 1,012 |
| Fannie Mae 2.50% 20276 | 2,090 | 2,133 |
| Fannie Mae 2.50% 20286 | 26,327 | 26,859 |
| Fannie Mae 2.50% 20286 | 6,161 | 6,289 |
| Fannie Mae 2.50% 20286 | 1,733 | 1,768 |
| Fannie Mae 2.50% 20286 | 402 | 410 |
| Fannie Mae 2.50% 20286 | 861 | 878 |
| Fannie Mae 2.50% 20286 | 1,086 | 1,108 |
| Fannie Mae 2.50% 20286 | 2,642 | 2,695 |
| Fannie Mae 2.50% 20286 | 2,624 | 2,677 |
| Fannie Mae 2.50% 20286 | 2,837 | 2,891 |
| Fannie Mae 5.50% 20336 | 471 | 530 |
| Fannie Mae 5.50% 20336 | 4,598 | 5,169 |
| Fannie Mae 5.50% 20336 | 4,102 | 4,617 |
| Fannie Mae 4.50% 20346 | 16,815 | 18,330 |
| Fannie Mae 5.50% 20356 | 1,978 | 2,226 |
| Fannie Mae 5.50% 20356 | 1,054 | 1,191 |
| Fannie Mae 5.00% 20356 | 1,842 | 2,045 |
| Fannie Mae 6.50% 20356 | 3,803 | 4,405 |
| Fannie Mae 5.50% 20366 | 407 | 457 |
| Fannie Mae 5.50% 20366 | 368 | 413 |
| Fannie Mae 6.00% 20366 | 1,158 | 1,313 |
| Fannie Mae 6.00% 20376 | 15,315 | 17,333 |
| Fannie Mae 6.50% 20376 | 1,609 | 1,816 |
| Fannie Mae 7.00% 20376 | 379 | 424 |
| Fannie Mae 6.50% 20376 | 3,165 | 3,495 |
| Fannie Mae 6.50% 20376 | 3,121 | 3,541 |
| Fannie Mae 7.00% 20376 | 834 | 931 |
| Fannie Mae 7.00% 20376 | 615 | 687 |
| Fannie Mae 5.50% 20386 | 903 | 1,009 |
| Fannie Mae 6.50% 20386 | 4,464 | 4,947 |
American Balanced Fund — Page 15 of 27
Bonds, notes & other debt instruments
Mortgage-backed obligations (continued) | Principal amount
(000) | Value
(000) |
| Fannie Mae 6.00% 20396 | $23,196 | $26,330 |
| Fannie Mae 5.50% 20396 | 152 | 170 |
| Fannie Mae 5.00% 20406 | 2,406 | 2,660 |
| Fannie Mae 3.251% 20404,6 | 1,413 | 1,513 |
| Fannie Mae 4.38% 20404,6 | 1,330 | 1,411 |
| Fannie Mae 3.577% 20404,6 | 948 | 1,015 |
| Fannie Mae 5.00% 20406 | 20,065 | 22,192 |
| Fannie Mae 4.00% 20406 | 25,024 | 26,884 |
| Fannie Mae 4.186% 20404,6 | 3,569 | 3,788 |
| Fannie Mae 4.50% 20406 | 16,915 | 18,381 |
| Fannie Mae 5.00% 20406 | 3,274 | 3,624 |
| Fannie Mae 5.00% 20406 | 2,272 | 2,509 |
| Fannie Mae 4.50% 20406 | 25,814 | 28,051 |
| Fannie Mae 4.50% 20406 | 21,325 | 23,177 |
| Fannie Mae 4.00% 20406 | 4,547 | 4,901 |
| Fannie Mae 4.50% 20416 | 10,024 | 10,889 |
| Fannie Mae 3.076% 20414,6 | 838 | 895 |
| Fannie Mae 3.529% 20414,6 | 481 | 506 |
| Fannie Mae 5.00% 20416 | 3,657 | 4,042 |
| Fannie Mae 5.00% 20416 | 3,095 | 3,426 |
| Fannie Mae 4.00% 20416 | 12,676 | 13,546 |
| Fannie Mae 5.00% 20416 | 3,156 | 3,491 |
| Fannie Mae 5.00% 20416 | 1,490 | 1,647 |
| Fannie Mae 5.00% 20416 | 294 | 325 |
| Fannie Mae 3.441% 20414,6 | 1,079 | 1,138 |
| Fannie Mae 5.00% 20416 | 3,451 | 3,821 |
| Fannie Mae 5.00% 20416 | 2,916 | 3,229 |
| Fannie Mae 5.00% 20416 | 344 | 381 |
| Fannie Mae 5.00% 20416 | 44 | 49 |
| Fannie Mae 5.00% 20416 | 40 | 44 |
| Fannie Mae 5.00% 20416 | 2,625 | 2,908 |
| Fannie Mae 5.00% 20416 | 2,056 | 2,274 |
| Fannie Mae 5.00% 20416 | 748 | 828 |
| Fannie Mae 5.00% 20416 | 709 | 788 |
| Fannie Mae 5.00% 20416 | 250 | 276 |
| Fannie Mae 5.00% 20416 | 157 | 175 |
| Fannie Mae 5.00% 20416 | 849 | 940 |
| Fannie Mae 4.00% 20416 | 12,933 | 13,897 |
| Fannie Mae 4.00% 20416 | 2,445 | 2,637 |
| Fannie Mae 5.00% 20416 | 358 | 396 |
| Fannie Mae 5.00% 20416 | 82 | 91 |
| Fannie Mae 4.00% 20416 | 3,587 | 3,863 |
| Fannie Mae 3.547% 20414,6 | 14,783 | 15,510 |
| Fannie Mae 4.00% 20416 | 16,785 | 18,034 |
| Fannie Mae 4.00% 20416 | 13,971 | 14,927 |
| Fannie Mae 4.00% 20416 | 8,389 | 8,963 |
| Fannie Mae 4.00% 20416 | 7,567 | 8,154 |
| Fannie Mae 4.00% 20416 | 4,316 | 4,652 |
| Fannie Mae 4.00% 20426 | 12,385 | 13,347 |
| Fannie Mae 4.00% 20426 | 3,072 | 3,295 |
| Fannie Mae 5.00% 20426 | 656 | 726 |
| Fannie Mae 4.00% 20426 | 37,458 | 40,362 |
| Fannie Mae 4.00% 20426 | 10,035 | 10,784 |
| Fannie Mae 4.00% 20426 | 4,483 | 4,808 |
| Fannie Mae 4.00% 20426 | 17,569 | 18,880 |
American Balanced Fund — Page 16 of 27
Bonds, notes & other debt instruments
Mortgage-backed obligations (continued) | Principal amount
(000) | Value
(000) |
| Fannie Mae 3.50% 20426 | $23,800 | $24,839 |
| Fannie Mae 4.00% 20426 | 6,733 | 7,275 |
| Fannie Mae 3.50% 20426 | 6,959 | 7,287 |
| Fannie Mae 4.00% 20426 | 30,511 | 32,600 |
| Fannie Mae 4.00% 20426 | 17,289 | 18,473 |
| Fannie Mae 4.00% 20426 | 2,802 | 2,993 |
| Fannie Mae 4.00% 20426 | 54,078 | 58,443 |
| Fannie Mae 4.00% 20426 | 26,615 | 28,766 |
| Fannie Mae 5.00% 20426 | 508 | 560 |
| Fannie Mae 4.00% 20426 | 11,158 | 12,039 |
| Fannie Mae 2.515% 20434,6 | 1,337 | 1,350 |
| Fannie Mae 3.00% 20436 | 11,079 | 11,224 |
| Fannie Mae 4.00% 20436 | 18,639 | 20,081 |
| Fannie Mae 3.00% 20436 | 37,234 | 37,718 |
| Fannie Mae 3.00% 20436 | 21,716 | 22,006 |
| Fannie Mae 3.00% 20436 | 4,705 | 4,766 |
| Fannie Mae 3.00% 20436 | 907 | 918 |
| Fannie Mae 3.50% 20436 | 53,309 | 55,625 |
| Fannie Mae 3.50% 20436 | 45,711 | 47,698 |
| Fannie Mae 3.00% 20436 | 4,688 | 4,748 |
| Fannie Mae 3.00% 20436 | 2,743 | 2,778 |
| Fannie Mae 3.00% 20436 | 1,169 | 1,184 |
| Fannie Mae 3.00% 20436 | 1,086 | 1,100 |
| Fannie Mae 3.00% 20436 | 959 | 971 |
| Fannie Mae 3.00% 20436 | 929 | 941 |
| Fannie Mae 3.00% 20436 | 888 | 900 |
| Fannie Mae 3.50% 20436 | 28,424 | 29,659 |
| Fannie Mae 4.00% 20436 | 66,701 | 71,959 |
| Fannie Mae 4.00% 20436 | 3,392 | 3,659 |
| Fannie Mae 3.00% 20436 | 41,118 | 41,645 |
| Fannie Mae 3.00% 20436 | 7,913 | 8,013 |
| Fannie Mae 3.00% 20436 | 923 | 935 |
| Fannie Mae 3.00% 20436 | 736 | 745 |
| Fannie Mae 3.50% 20436 | 20,163 | 21,039 |
| Fannie Mae 3.50% 20436 | 19,213 | 20,048 |
| Fannie Mae 3.50% 20436 | 10,696 | 11,160 |
| Fannie Mae 3.50% 20436 | 9,325 | 9,730 |
| Fannie Mae 3.50% 20436 | 9,175 | 9,574 |
| Fannie Mae 3.50% 20436 | 6,603 | 6,890 |
| Fannie Mae 3.00% 20436 | 163,816 | 165,888 |
| Fannie Mae 3.00% 20436 | 2,540 | 2,573 |
| Fannie Mae 3.00% 20436 | 2,464 | 2,495 |
| Fannie Mae 3.00% 20436 | 1,913 | 1,937 |
| Fannie Mae 3.00% 20436 | 1,876 | 1,900 |
| Fannie Mae 3.00% 20436 | 866 | 877 |
| Fannie Mae 3.00% 20436 | 865 | 875 |
| Fannie Mae 3.00% 20436 | 818 | 828 |
| Fannie Mae 4.00% 20436 | 9,284 | 9,920 |
| Fannie Mae 4.00% 20436 | 5,296 | 5,659 |
| Fannie Mae 3.00% 20436 | 16,270 | 16,474 |
| Fannie Mae 3.00% 20436 | 16,147 | 16,360 |
| Fannie Mae 3.00% 20436 | 13,090 | 13,251 |
| Fannie Mae 3.00% 20436 | 4,766 | 4,826 |
| Fannie Mae 3.00% 20436 | 4,725 | 4,783 |
| Fannie Mae 3.00% 20436 | 4,626 | 4,683 |
American Balanced Fund — Page 17 of 27
Bonds, notes & other debt instruments
Mortgage-backed obligations (continued) | Principal amount
(000) | Value
(000) |
| Fannie Mae 3.00% 20436 | $2,621 | $2,653 |
| Fannie Mae 3.00% 20436 | 956 | 968 |
| Fannie Mae 3.00% 20436 | 953 | 964 |
| Fannie Mae 4.00% 20436 | 79,291 | 84,721 |
| Fannie Mae 3.00% 20436 | 21,683 | 21,957 |
| Fannie Mae 3.00% 20436 | 19,364 | 19,606 |
| Fannie Mae 3.00% 20436 | 199 | 202 |
| Fannie Mae 4.00% 20436 | 4,627 | 4,965 |
| Fannie Mae 3.00% 20436 | 8,275 | 8,377 |
| Fannie Mae 4.00% 20436 | 10,973 | 11,797 |
| Fannie Mae 4.00% 20436 | 1,104 | 1,191 |
| Fannie Mae 4.00% 20436 | 144 | 154 |
| Fannie Mae 3.00% 20436 | 17,491 | 17,709 |
| Fannie Mae 4.00% 20436 | 648 | 700 |
| Fannie Mae 4.00% 20436 | 648 | 700 |
| Fannie Mae 4.00% 20436 | 633 | 683 |
| Fannie Mae 4.00% 20436 | 499 | 539 |
| Fannie Mae 4.00% 20436 | 472 | 508 |
| Fannie Mae 4.50% 20436 | 24,267 | 26,352 |
| Fannie Mae 4.50% 20436 | 16,215 | 17,607 |
| Fannie Mae 3.00% 20446 | 166 | 168 |
| Fannie Mae 3.50% 20446 | 43,864 | 45,770 |
| Fannie Mae 3.50% 20446 | 29,021 | 30,283 |
| Fannie Mae 3.50% 20446 | 26,743 | 27,906 |
| Fannie Mae 3.50% 20456,8 | 349,130 | 363,794 |
| Fannie Mae 4.50% 20456,8 | 92,417 | 100,310 |
| Fannie Mae 5.00% 20456,8 | 96,715 | 106,857 |
| Fannie Mae 4.00% 20456,8 | 45,000 | 47,891 |
| Fannie Mae 4.50% 20456,8 | 164,483 | 178,223 |
| Fannie Mae 7.00% 20476 | 18 | 20 |
| Fannie Mae 6.50% 20476 | 276 | 308 |
| Fannie Mae 6.50% 20476 | 82 | 91 |
| Fannie Mae 6.50% 20476 | 59 | 65 |
| Fannie Mae 7.00% 20476 | 297 | 335 |
| Fannie Mae 7.00% 20476 | 269 | 304 |
| Fannie Mae 7.00% 20476 | 249 | 281 |
| Fannie Mae 7.00% 20476 | 89 | 101 |
| Fannie Mae 6.50% 20476 | 434 | 484 |
| Fannie Mae 7.00% 20476 | 294 | 332 |
| Fannie Mae, Series 2001-4, Class NA, 10.005% 20254,6 | 16 | 17 |
| Fannie Mae, Series 2001-20, Class D, 11.006% 20314,6 | 9 | 9 |
| Fannie Mae, Series 2006-43, Class JO, principal only, 0% 20366 | 1,872 | 1,718 |
| Fannie Mae, Series 2006-49, Class PA, 6.00% 20366 | 3,647 | 4,034 |
| Fannie Mae, Series 2001-50, Class BA, 7.00% 20416 | 223 | 248 |
| Fannie Mae, Series 2002-W3, Class A-5, 7.50% 20416 | 381 | 442 |
| Fannie Mae, Series 2001-T10, Class A-1, 7.00% 20416 | 297 | 347 |
| Fannie Mae, Series 2002-W1, Class 2A, 6.532% 20424,6 | 434 | 507 |
| Firstmac Bond Trust, Series 2014-1A, Class A2A, 0.504% 20153,4,6 | 24,250 | 24,276 |
| Freddie Mac 5.00% 20236 | 3,083 | 3,336 |
| Freddie Mac 5.00% 20236 | 1,973 | 2,134 |
| Freddie Mac 5.00% 20236 | 740 | 800 |
| Freddie Mac 5.00% 20236 | 836 | 904 |
| Freddie Mac 5.00% 20236 | 833 | 901 |
| Freddie Mac 5.00% 20236 | 4,499 | 4,866 |
| Freddie Mac 5.00% 20246 | 6,104 | 6,643 |
American Balanced Fund — Page 18 of 27
Bonds, notes & other debt instruments
Mortgage-backed obligations (continued) | Principal amount
(000) | Value
(000) |
| Freddie Mac 6.00% 20266 | $2,313 | $2,619 |
| Freddie Mac 6.00% 20266 | 1,885 | 2,136 |
| Freddie Mac 6.00% 20266 | 1,700 | 1,927 |
| Freddie Mac 6.50% 20276 | 1,108 | 1,263 |
| Freddie Mac 6.50% 20276 | 342 | 390 |
| Freddie Mac 6.50% 20276 | 135 | 154 |
| Freddie Mac 6.50% 20286 | 493 | 563 |
| Freddie Mac 5.50% 20376 | 114 | 127 |
| Freddie Mac 5.50% 20376 | 425 | 476 |
| Freddie Mac 5.50% 20386 | 384 | 430 |
| Freddie Mac 6.00% 20386 | 405 | 458 |
| Freddie Mac 6.00% 20386 | 2,631 | 2,974 |
| Freddie Mac 5.50% 20386 | 156 | 174 |
| Freddie Mac 5.50% 20396 | 538 | 602 |
| Freddie Mac 3.835% 20394,6 | 1,024 | 1,093 |
| Freddie Mac 4.50% 20406 | 761 | 825 |
| Freddie Mac 4.50% 20406 | 19,953 | 21,653 |
| Freddie Mac 3.106% 20404,6 | 123 | 132 |
| Freddie Mac 2.834% 20414,6 | 157 | 164 |
| Freddie Mac 4.50% 20416 | 823 | 896 |
| Freddie Mac 3.401% 20414,6 | 163 | 172 |
| Freddie Mac 4.50% 20416 | 2,394 | 2,598 |
| Freddie Mac 4.50% 20416 | 1,028 | 1,120 |
| Freddie Mac 3.249% 20414,6 | 1,628 | 1,728 |
| Freddie Mac 4.50% 20416 | 879 | 954 |
| Freddie Mac 5.00% 20416 | 922 | 1,023 |
| Freddie Mac 4.50% 20416 | 2,211 | 2,401 |
| Freddie Mac 4.50% 20416 | 476 | 517 |
| Freddie Mac 2.575% 20424,6 | 1,063 | 1,075 |
| Freddie Mac 2.352% 20434,6 | 8,501 | 8,536 |
| Freddie Mac 4.00% 20436 | 1,791 | 1,923 |
| Freddie Mac 4.00% 20436 | 3,101 | 3,328 |
| Freddie Mac 4.00% 20436 | 1,292 | 1,387 |
| Freddie Mac 4.00% 20436 | 1,094 | 1,178 |
| Freddie Mac 4.00% 20436 | 894 | 963 |
| Freddie Mac 4.00% 20436 | 748 | 805 |
| Freddie Mac 4.00% 20436 | 560 | 604 |
| Freddie Mac 3.50% 20446 | 75,633 | 78,711 |
| Freddie Mac 3.128% 20444,6 | 4,285 | 4,433 |
| Freddie Mac, Series 2013-DN1, Class M-1, 3.555% 20234,6 | 9,384 | 9,702 |
| Freddie Mac, Series 2013-DN2, Class M-1, 1.605% 20234,6 | 7,395 | 7,359 |
| Freddie Mac, Series 2014-DN1, Class M-1, 1.155% 20244,6 | 1,255 | 1,246 |
| Freddie Mac, Series 2014-DN2, Class M-1, 1.005% 20244,6 | 6,175 | 6,128 |
| Freddie Mac, Series 2014-DN2, Class M-2, 1.805% 20244,6 | 8,535 | 8,244 |
| Freddie Mac, Series 2014-DN3, Class M-1, 1.507% 20244,6 | 21,798 | 21,771 |
| Freddie Mac, Series 2014-HQ1, Class M-1, 1.807% 20244,6 | 19,635 | 19,641 |
| Freddie Mac, Series 2014-DN3, Class M-2, 2.557% 20244,6 | 3,100 | 3,096 |
| Freddie Mac, Series 2014-HQ1, Class M-2, 2.657% 20244,6 | 11,100 | 10,943 |
| Freddie Mac, Series 2014-HQ2, Class M-1, 1.604% 20244,6 | 17,793 | 17,716 |
| Freddie Mac, Series 2014-HQ2, Class M-2, 2.354% 20244,6 | 21,320 | 20,651 |
| Freddie Mac, Series 2014-HQ3, Class M-1, 1.82% 20244,6 | 17,062 | 17,054 |
| Freddie Mac, Series 2014-DN4, Class M-2, 2.57% 20244,6 | 10,135 | 10,124 |
| Freddie Mac, Series T-041, Class 3-A, 6.539% 20324,6 | 1,934 | 2,207 |
| Freddie Mac, Series 3061, Class PN, 5.50% 20356 | 2,976 | 3,290 |
| Freddie Mac, Series 3146, Class PO, principal only, 0% 20366 | 3,343 | 3,143 |
American Balanced Fund — Page 19 of 27
Bonds, notes & other debt instruments
Mortgage-backed obligations (continued) | Principal amount
(000) | Value
(000) |
| Freddie Mac, Series 3156, Class PO, principal only, 0% 20366 | $4,786 | $4,486 |
| Freddie Mac, Series 3233, Class PA, 6.00% 20366 | 8,558 | 9,599 |
| Freddie Mac, Series 3272, Class PA, 6.00% 20376 | 4,684 | 5,232 |
| Freddie Mac, Series 3312, Class PA, 5.50% 20376 | 6,125 | 6,751 |
| Freddie Mac, Series 3318, Class JT, 5.50% 20376 | 5,891 | 6,493 |
| GE Commercial Mortgage Corp., Series 2005-C4, Class A-3A, 5.312% 20454,6 | 12,431 | 12,449 |
| GMAC Commercial Mortgage Securities, Inc., Series 2006-C1, Class AM, 5.29% 20454,6 | 8,000 | 8,236 |
| Government National Mortgage Assn. 10.00% 20216 | 140 | 162 |
| Government National Mortgage Assn. 6.50% 20386 | 6,867 | 7,858 |
| Government National Mortgage Assn. 6.00% 20386 | 14,207 | 15,966 |
| Government National Mortgage Assn. 4.00% 20396 | 1,654 | 1,776 |
| Government National Mortgage Assn. 4.00% 20396 | 2,607 | 2,799 |
| Government National Mortgage Assn. 4.00% 20396 | 2,637 | 2,832 |
| Government National Mortgage Assn. 4.00% 20406 | 4,505 | 4,841 |
| Government National Mortgage Assn. 4.00% 20406 | 1,888 | 2,030 |
| Government National Mortgage Assn. 4.00% 20406 | 17,378 | 18,897 |
| Government National Mortgage Assn. 4.00% 20406 | 4,000 | 4,348 |
| Government National Mortgage Assn. 4.00% 20406 | 3,938 | 4,233 |
| Government National Mortgage Assn. 4.00% 20406 | 2,590 | 2,783 |
| Government National Mortgage Assn. 4.00% 20406 | 13,699 | 14,710 |
| Government National Mortgage Assn. 4.00% 20416 | 31,554 | 33,918 |
| Government National Mortgage Assn. 4.00% 20416 | 4,352 | 4,675 |
| Government National Mortgage Assn. 4.00% 20416 | 2,428 | 2,608 |
| Government National Mortgage Assn. 4.00% 20416 | 554 | 595 |
| Government National Mortgage Assn. 4.00% 20446 | 218,853 | 234,855 |
| Government National Mortgage Assn. 4.00% 20446 | 20,674 | 22,205 |
| Government National Mortgage Assn. 4.00% 20446 | 170,730 | 183,447 |
| Government National Mortgage Assn. 4.00% 20446 | 110,081 | 118,233 |
| Greenwich Capital Commercial Funding Corp., Series 2006-GG7, Class A-4, 5.819% 20384,6 | 21,920 | 22,927 |
| Greenwich Capital Commercial Funding Corp., Series 2006-GG7, Class A-1-A, 5.819% 20384,6 | 2,428 | 2,549 |
| Greenwich Capital Commercial Funding Corp., Series 2007-GG9, Class A-1-A, 5.426% 20396 | 4,373 | 4,699 |
| Greenwich Capital Commercial Funding Corp., Series 2007-GG9, Class A-4, 5.444% 20396 | 38,708 | 41,325 |
| Greenwich Capital Commercial Funding Corp., Series 2007-GG11, Class A-1-A, 5.704% 20496 | 34,116 | 37,386 |
| GS Mortgage Securities Corp. II, Series 2006-GG8, Class A-4, 5.56% 20396 | 11,683 | 12,389 |
| GS Mortgage Securities Corp. II, Series 2011-GC3, Class A-2, 3.645% 20443,6 | 2,336 | 2,393 |
| GS Mortgage Securities Corp. II, Series 2007-GG10, Class A-1-A, 5.796% 20454,6 | 3,025 | 3,291 |
| Hilton USA Trust, Series 2013-HLF-AFX, 2.662% 20303,6 | 14,110 | 14,140 |
| Hilton USA Trust, Series 2013-HLF-BFX, 3.367% 20303,6 | 4,000 | 4,054 |
| J.P. Morgan Chase Commercial Mortgage Securities Corp., Series 2014-INN, Class A, 1.074% 20293,4,6 | 8,000 | 7,985 |
| J.P. Morgan Chase Commercial Mortgage Securities Corp., Series 2005-CIBC12, Class A-3B, 5.467% 20374,6 | 6,626 | 6,626 |
| J.P. Morgan Chase Commercial Mortgage Securities Corp., Series 2006-LDP6, Class A-1-A, 5.471% 20434,6 | 3,719 | 3,889 |
| J.P. Morgan Chase Commercial Mortgage Securities Corp., Series 2006-CB15, Class A-1-A, 5.811% 20434,6 | 1,444 | 1,519 |
| J.P. Morgan Chase Commercial Mortgage Securities Corp., Series 2006-CB15, Class A-4, 5.814% 20434,6 | 5,063 | 5,311 |
| J.P. Morgan Chase Commercial Mortgage Securities Corp., Series 2006-LDP7, Class A-4, 5.863% 20454,6 | 16,835 | 17,589 |
| J.P. Morgan Chase Commercial Mortgage Securities Corp., Series 2011-C3A, Class A-2, 3.673% 20463,6 | 28,038 | 28,865 |
| J.P. Morgan Chase Commercial Mortgage Securities Corp., Series 2011-C4, Class A-2, 3.341% 20463,6 | 11,962 | 12,282 |
| J.P. Morgan Chase Commercial Mortgage Securities Corp., Series 2007-CB18, Class A-1-A, 5.092% 20474,6 | 5,138 | 5,487 |
| J.P. Morgan Chase Commercial Mortgage Securities Corp., Series 2007-LDPX, Class A-1-A, 5.439% 20496 | 5,741 | 6,144 |
| J.P. Morgan Chase Commercial Mortgage Securities Corp., Series 2007-CB19, Class A-1-A, 5.703% 20494,6 | 36,493 | 39,506 |
| J.P. Morgan Chase Commercial Mortgage Securities Corp., Series 2007-CB19, Class A-4, 5.703% 20494,6 | 32,990 | 35,444 |
| J.P. Morgan Chase Commercial Mortgage Securities Corp., Series 2007-C1, Class A-4, 5.716% 20516 | 19,436 | 20,940 |
| J.P. Morgan Chase Commercial Mortgage Securities Corp., Series 2007-LD12, Class A-1-A, 5.85% 20514,6 | 11,131 | 12,150 |
| J.P. Morgan Chase Commercial Mortgage Securities Trust, Series 2006-LDP8, Class A-4, 5.399% 20456 | 30,357 | 31,965 |
| J.P. Morgan Chase Commercial Mortgage Securities Trust, Series 2006-LDP9, Class A-3, 5.336% 20476 | 9,891 | 10,513 |
| J.P. Morgan Chase Commercial Mortgage Securities Trust, Series 2006-LDP9, Class A-M, 5.372% 20476 | 10,596 | 11,011 |
American Balanced Fund — Page 20 of 27
Bonds, notes & other debt instruments
Mortgage-backed obligations (continued) | Principal amount
(000) | Value
(000) |
| L.A. Arena Funding, LLC, Series 1, Class A, 7.656% 20263,6 | $12,041 | $13,496 |
| LB Commercial Mortgage Trust, Series 2007-C3, Class A-1-A, multifamily 5.858% 20444,6 | 6,432 | 7,015 |
| LB-UBS Commercial Mortgage Trust, Series 2006-C3, Class A1A, 5.641% 20394,6 | 8,933 | 9,302 |
| LB-UBS Commercial Mortgage Trust, Series 2007-C2, Class A-1-A, 5.387% 20406 | 42,056 | 45,246 |
| LB-UBS Commercial Mortgage Trust, Series 2007-C2, Class A-3, 5.43% 20406 | 28,167 | 30,171 |
| LB-UBS Commercial Mortgage Trust, Series 2007-C2, Class A-M, 5.493% 20404,6 | 2,675 | 2,824 |
| LB-UBS Commercial Mortgage Trust, Series 2007-C6, Class A-M, 6.114% 20404,6 | 24,060 | 26,127 |
| LB-UBS Commercial Mortgage Trust, Series 2007-C7, Class A-M, 6.163% 20454,6 | 11,575 | 12,898 |
| Merrill Lynch Mortgage Trust, Series 2007-C1, Class A-4, 6.028% 20504,6 | 8,000 | 8,606 |
| ML-CFC Commercial Mortgage Trust, Series 2006-2, Class A-1-A, 6.062% 20464,6 | 9,566 | 10,076 |
| ML-CFC Commercial Mortgage Trust, Series 2007-8, Class A-3, 6.079% 20494,6 | 10,000 | 10,921 |
| Morgan Stanley Capital I Trust, Series 2014-CPT, Class A, 3.35% 20213,6 | 19,870 | 20,587 |
| Morgan Stanley Capital I Trust, Series 2006-IQ12, Class A1A, 5.319% 20436 | 20,685 | 21,994 |
| Morgan Stanley Capital I Trust, Series 2007-IQ13, Class A-M, 5.406% 20446 | 4,500 | 4,797 |
| Morgan Stanley Capital I Trust, Series 2007-IQ15, Class A-4, 6.105% 20494,6 | 23,511 | 25,597 |
| National Australia Bank 2.00% 20173,6 | 500 | 508 |
| National Australia Bank 1.25% 20183,6 | 14,120 | 13,947 |
| National Australia Bank 2.00% 20193,6 | 4,925 | 4,938 |
| National Australia Bank 2.125% 20193,6 | 11,000 | 11,037 |
| National Bank of Canada 2.20% 20163,6 | 600 | 614 |
| Norddeutsche Landesbank 2.00% 20193,6 | 5,400 | 5,443 |
| Nordea Eiendomskreditt AS 2.125% 20173,6 | 700 | 713 |
| Northern Rock PLC 5.625% 20173,6 | 2,025 | 2,224 |
| Pepper Residential Securities Trust, Series 2013-1A, Class A-U2, 0.455% 20153,4,6 | 25,000 | 25,028 |
| Royal Bank of Canada 1.125% 20166 | 1,000 | 1,005 |
| Royal Bank of Canada 2.20% 20196 | 37,700 | 38,018 |
| Royal Bank of Canada 2.00% 20196 | 3,550 | 3,587 |
| Skandinaviska Enskilda 1.375% 20183,6 | 950 | 943 |
| Sparebank 1 Boligkreditt AS 2.625% 20173,6 | 400 | 410 |
| Sparebank 1 Boligkreditt AS 2.30% 20183,6 | 750 | 770 |
| Sparebank 1 Boligkreditt AS 1.25% 20193,6 | 1,200 | 1,183 |
| Sparebank 1 Boligkreditt AS 1.75% 20203,6 | 3,950 | 3,871 |
| Stadshypotek AB 1.875% 20193,6 | 775 | 766 |
| Swedbank AB 2.95% 20163,6 | 300 | 308 |
| Swedbank AB 2.125% 20163,6 | 525 | 536 |
| Swedbank AB 1.375% 20183,6 | 925 | 917 |
| Toronto-Dominion Bank 1.625% 20163,6 | 400 | 405 |
| Toronto-Dominion Bank 1.50% 20173,6 | 65,000 | 65,541 |
| UBS AG 1.875% 20153,6 | 600 | 600 |
| UBS AG 0.75% 20173,6 | 925 | 924 |
| UBS AG 2.25% 20173,6 | 650 | 665 |
| Wachovia Bank Commercial Mortgage Trust, Series 2006-C25, Class A1A, 5.707% 20434,6 | 35,152 | 36,660 |
| Wachovia Bank Commercial Mortgage Trust, Series 2007-C30, Class A-5, 5.342% 20436 | 14,000 | 14,958 |
| Wachovia Bank Commercial Mortgage Trust, Series 2006-C27, Class A1A, 5.749% 20454,6 | 3,851 | 4,084 |
| Wachovia Bank Commercial Mortgage Trust, Series 2007-C31, Class A-5, 5.50% 20476 | 10,000 | 10,789 |
| Wachovia Bank Commercial Mortgage Trust, Series 2007-C32, Class A-3, 5.933% 20494,6 | 31,635 | 34,010 |
| Wachovia Bank Commercial Mortgage Trust, Series 2007-C33, Class A-M, 5.941% 20514,6 | 17,000 | 18,550 |
| Wells Fargo Mortgage-backed Securities Trust, Series 2005-AR10, Class II-A-6, 2.614% 20354,6 | 9,745 | 9,817 |
| Westpac Banking Corp. 1.375% 20153,6 | 700 | 703 |
| Westpac Banking Corp. 2.45% 20163,6 | 575 | 590 |
| Westpac Banking Corp. 1.25% 20173,6 | 800 | 793 |
| Westpac Banking Corp. 1.85% 20183,6 | 8,300 | 8,308 |
| Westpac Banking Corp. 2.00% 20193,6 | 28,300 | 28,228 |
| Westpac Banking Corp. 1.375% 20193,6 | 3,325 | 3,283 |
| WFLD Mortgage Trust, Series 2014-MONT, Class A, 3.755% 20313,4,6 | 20,000 | 21,177 |
American Balanced Fund — Page 21 of 27
Bonds, notes & other debt instruments
Mortgage-backed obligations (continued) | Principal amount
(000) | Value
(000) |
| WFLD Mortgage Trust, Series 2014-MONT, Class B, 3.755% 20313,4,6 | $4,700 | $4,898 |
| WFLD Mortgage Trust, Series 2014-MONT, Class C, 3.755% 20313,4,6 | 2,650 | 2,696 |
| | | 5,316,245 |
| Federal agency bonds & notes 2.30% | | |
| CoBank, ACB 0.834% 20223,4 | 16,135 | 15,127 |
| Export-Import Bank of the United States-Guaranteed, Ethiopian Leasing 2012 LLC 2.646% 20266 | 6,744 | 6,792 |
| Fannie Mae 0.50% 2015 | 175,000 | 175,238 |
| Fannie Mae 0.50% 2016 | 94,090 | 94,054 |
| Fannie Mae 0.375% 2016 | 64,125 | 63,958 |
| Fannie Mae 0.625% 2016 | 62,975 | 62,994 |
| Fannie Mae 5.00% 2017 | 5,820 | 6,334 |
| Fannie Mae 1.75% 2019 | 52,375 | 52,416 |
| Fannie Mae 2.625% 2024 | 73,995 | 75,033 |
| Fannie Mae 6.25% 2029 | 4,000 | 5,581 |
| Fannie Mae, Series 2014-M2, Class A-S-Q2, multifamily 0.478% 20156 | 8,517 | 8,517 |
| Fannie Mae, Series 2014-M6, Class FA, multifamily 0.4588% 20174,6 | 12,352 | 12,344 |
| Fannie Mae, Series 2012-M8, multifamily 1.52% 20196 | 16,665 | 16,689 |
| Fannie Mae, Series 2012-M5, Class A2, multifamily 2.715% 20226 | 14,000 | 14,240 |
| Fannie Mae, Series 2012-M9, Class A2, multifamily 2.482% 20226 | 21,843 | 21,846 |
| Fannie Mae, Series 2012-M14, Class A2, multifamily 2.301% 20224,6 | 8,570 | 8,454 |
| Fannie Mae, Series 2014-M1, multifamily 3.373% 20234,6 | 24,550 | 25,759 |
| Fannie Mae, Series 2013-M14, Class A2, multifamily 3.329% 20234,6 | 24,642 | 25,962 |
| Fannie Mae, Series 2014-M2, Class A2, multifamily 3.513% 20234,6 | 30,325 | 32,385 |
| Fannie Mae, Series 2014-M3, Class A2, multifamily 3.477% 20244,6 | 39,555 | 42,089 |
| Fannie Mae, Series 2014-M9, multifamily 3.103% 20244,6 | 26,055 | 26,955 |
| Federal Farm Credit Banks 0.225% 20174 | 23,143 | 23,147 |
| Federal Farm Credit Banks 0.212% 20174 | 31,250 | 31,259 |
| Federal Home Loan Bank 0.375% 2016 | 21,230 | 21,209 |
| Federal Home Loan Bank 2.125% 2016 | 61,140 | 62,489 |
| Federal Home Loan Bank 0.50% 2016 | 35,895 | 35,819 |
| Federal Home Loan Bank 0.625% 2016 | 10,040 | 10,017 |
| Federal Home Loan Bank 1.875% 2020 | 25,660 | 25,669 |
| Federal Home Loan Bank 3.375% 2023 | 16,840 | 18,083 |
| Federal Home Loan Bank 5.50% 2036 | 600 | 821 |
| Freddie Mac 1.75% 2015 | 22,425 | 22,653 |
| Freddie Mac 0.50% 2016 | 114,105 | 114,080 |
| Freddie Mac 2.50% 2016 | 83,400 | 85,695 |
| Freddie Mac 0.875% 2016 | 50,000 | 50,201 |
| Freddie Mac 0.75% 2018 | 200,400 | 197,915 |
| Freddie Mac 2.375% 2022 | 27,000 | 27,373 |
| Freddie Mac, Series K706, Class A2, multifamily 2.323% 20186 | 1,050 | 1,072 |
| Freddie Mac, Series K711, Class A2, multifamily 1.73% 20196 | 20,000 | 19,857 |
| Freddie Mac, Series KGRP, Class A, multifamily 0.536% 20204,6 | 12,924 | 12,972 |
| Freddie Mac, Series KF02, Class A3, multifamily 0.80% 20204,6 | 2,686 | 2,695 |
| Freddie Mac, Series K013, Class A1, multifamily 2.902% 20206 | 2,050 | 2,119 |
| Freddie Mac, Series K714, Class A2, multifamily 3.034% 20204,6 | 15,500 | 16,212 |
| Freddie Mac, Series K716, Class A2, multifamily 3.132% 20216 | 11,960 | 12,510 |
| Freddie Mac, Series KS01, Class A1, multifamily 1.693% 20226 | 5,398 | 5,362 |
| Freddie Mac, Series K019, Class A2, multifamily 2.272% 20226 | 16,000 | 15,905 |
| Freddie Mac, Series K021, Class A2, multifamily 2.396% 20226 | 16,555 | 16,529 |
| Freddie Mac, Series K031, Class A1, multifamily 2.778% 20226 | 1,080 | 1,117 |
| Freddie Mac, Series K025, Class A2, multifamily 2.682% 20226 | 15,904 | 16,089 |
| Freddie Mac, Series K029, Class A1, multifamily 2.839% 20226 | 961 | 996 |
| Freddie Mac, Series KS01, Class A2, multifamily 2.522% 20236 | 1,075 | 1,077 |
American Balanced Fund — Page 22 of 27
Bonds, notes & other debt instruments
Federal agency bonds & notes (continued) | Principal amount
(000) | Value
(000) |
| Freddie Mac, Series K027, Class A2, multifamily 2.637% 20236 | $14,500 | $14,587 |
| Freddie Mac, Series K034, Class A1, multifamily 2.669% 20236 | 17,033 | 17,485 |
| Freddie Mac, Series K036, Class A1, multifamily 2.777% 20236 | 6,774 | 6,984 |
| Freddie Mac, Series K036, Class A2, multifamily 3.527% 20234,6 | 16,500 | 17,636 |
| Freddie Mac, Series K040, Class A2, multifamily 3.241% 20246 | 13,416 | 14,030 |
| Freddie Mac, Series K041, Class A-2, multifamily 3.171% 20246 | 34,720 | 36,096 |
| Private Export Funding Corp. 2.80% 2022 | 3,125 | 3,183 |
| Private Export Funding Corp. 3.55% 2024 | 25,897 | 27,654 |
| Tennessee Valley Authority, Series A, 3.875% 2021 | 5,000 | 5,496 |
| Tennessee Valley Authority 1.875% 2022 | 1,650 | 1,588 |
| Tennessee Valley Authority, Series B, 3.50% 2042 | 14,750 | 14,667 |
| United States Agency for International Development, Jordan (Kingdom of) 2.503% 2020 | 5,800 | 5,974 |
| United States Agency for International Development, Ukraine, 1.844% 2019 | 8,665 | 8,742 |
United States Government-Guaranteed Certificates of Participation, Overseas Private
Investment Corp, 0% 2016 | 866 | 873 |
United States Government-Guaranteed Certificates of Participation, Overseas Private
Investment Corp, 3.49% 20296 | 829 | 870 |
United States Government-Guaranteed Certificates of Participation, Overseas Private
Investment Corp, 3.82% 20326 | 4,262 | 4,577 |
| Export-Import Bank of the United States-Guaranteed, VCK Lease SA 2.591% 20266 | 3,929 | 3,919 |
| | | 1,833,152 |
| Asset-backed obligations 1.20% | | |
| Aesop Funding LLC, Series 2013-2A, Class A, 2.97% 20203,6 | 16,535 | 16,998 |
| Aesop Funding LLC, Series 2014-2A, Class A, 2.50% 20213,6 | 18,500 | 18,436 |
| Ally Auto Receivables Trust, Series 2014-1, Class A3, 0.97% 20186 | 21,410 | 21,381 |
| Ally Master Owner Trust, Series 2014-1, Class A1, 0.624% 20194,6 | 6,985 | 6,981 |
| Ally Master Owner Trust, Series 2014-1, Class A2, 1.29% 20196 | 7,675 | 7,661 |
| Ally Master Owner Trust, Series 2014-4, Class A1, 0.554% 20194,6 | 10,000 | 9,985 |
| Ally Master Owner Trust, Series 2014-5, Class A2, 1.60% 20196 | 11,800 | 11,778 |
| American Express Credit Account Master Trust, Series 2014-4, Class A, 1.43% 20206 | 28,610 | 28,570 |
| AmeriCredit Automobile Receivables Trust, Series 2012-1, Class C-2, 2.67% 20156 | 3,600 | 3,645 |
| AmeriCredit Automobile Receivables Trust, Series 2014-3, Class A-3, 1.15% 20176 | 6,300 | 6,262 |
| AmeriCredit Automobile Receivables Trust, Series 2014-4, Class A-2-A, 0.72% 20186 | 14,450 | 14,446 |
| AmeriCredit Automobile Receivables Trust, Series 2012-4, Class C, 1.93% 20186 | 710 | 715 |
| AmeriCredit Automobile Receivables Trust, Series 2014-4, Class A-3, 1.27% 20196 | 12,300 | 12,261 |
| Appalachian Consumer Rate Relief Funding LLC, Series 2013-1, Class A-2, 3.77% 20316 | 1,310 | 1,411 |
| ARI Fleet Lease Trust, Series 2014-A, Class A-2, 0.81% 20223,6 | 2,625 | 2,618 |
| BA Credit Card Trust, Series 2014-A1, Class A, 0.534% 20214,6 | 11,535 | 11,516 |
| Bank of the West Auto Trust, Series 2014-1, Class A-2, 0.69% 20173,6 | 14,000 | 14,001 |
| Bank of the West Auto Trust, Series 2014-1, Class A-3, 1.09% 20193,6 | 5,580 | 5,581 |
| Capital One Multi-asset Execution Trust, Series 2014-A5, Class A, 1.48% 20206 | 15,110 | 15,136 |
| Carlyle Global Market Strategies Commodities Fund, Series 2014-1A, Class A, 2.131% 20212,3,4,6 | 12,145 | 12,142 |
| CarMaxAuto Owner Trust, Series 2014-1, Class A-2, 0.47% 20176 | 6,558 | 6,557 |
| CarMaxAuto Owner Trust, Series 2014-1, Class A-3, 0.79% 20186 | 16,285 | 16,238 |
| CarMaxAuto Owner Trust, Series 2014-3, Class A-3, 1.16% 20196 | 8,475 | 8,450 |
| CarMaxAuto Owner Trust, Series 2014-4, Class A-3, 1.25% 20196 | 12,600 | 12,576 |
| Chase Issuance Trust, Series 2014-A7, Class A, 1.38% 20196 | 22,000 | 22,004 |
| Chesapeake Funding LLC, Series 2014-1-A, Class A, 0.579% 20263,4,6 | 17,095 | 17,099 |
| Chrysler Capital Auto Receivables Trust, Series 2014-A-A, Class A-3, 0.83% 20183,6 | 6,225 | 6,212 |
| Chrysler Capital Auto Receivables Trust, Series 2014-A-A, Class A-4, 1.31% 20193,6 | 4,150 | 4,138 |
| Citibank Credit Card Issuance Trust, Series 2014-A-2, Class A-2, 1.02% 20196 | 16,380 | 16,322 |
| Citibank Credit Card Issuance Trust, Series 2014-A6, Class A6, 2.15% 20196 | 22,725 | 22,853 |
| CWABS, Inc., Series 2004-BC1, Class M-1, 0.905% 20344,6 | 2,581 | 2,481 |
| Dell Equipment Finance Trust, Series 2014-1, Class A2, 0.64% 20163,6 | 10,000 | 10,000 |
American Balanced Fund — Page 23 of 27
Bonds, notes & other debt instruments
Asset-backed obligations (continued) | Principal amount
(000) | Value
(000) |
| Discover Card Execution Note Trust, Series 2014-A4, Class A4, 2.12% 20216 | $20,680 | $20,784 |
| Enterprise Fleet Financing LLC, Series 2014-1, Class A2, 0.87% 20193,6 | 11,855 | 11,849 |
| Enterprise Fleet Financing LLC, Series 2014-1, Class A3, 1.38% 20193,6 | 5,000 | 5,004 |
| Enterprise Fleet Financing LLC, Series 2014-2, Class A2, 1.05% 20203,6 | 26,765 | 26,745 |
| Fifth Third Auto Trust, Series 2014-1, Class A3, 0.68% 20186 | 9,300 | 9,289 |
| Fifth Third Auto Trust, Series 2014-3, Class A3, 0.96% 20196 | 7,555 | 7,530 |
| Ford Credit Auto Lease Trust, Series 2014-B, Class A3, 0.89% 20176 | 18,720 | 18,678 |
| Ford Credit Auto Owner Trust, Series 2014-A-A3, 0.79% 20186 | 11,225 | 11,213 |
| Ford Credit Auto Owner Trust, Series 2014-B-A3, 0.90% 20186 | 24,780 | 24,758 |
| Ford Credit Auto Owner Trust, Series 2014-1-A, 2.26% 20253,6 | 4,250 | 4,278 |
| Ford Credit Auto Owner Trust, Series 2014-2-A, 2.31% 20263,6 | 33,900 | 34,067 |
| Henderson Receivables LLC, Series 2014-2A, Class A, 3.61% 20733,6 | 7,477 | 7,591 |
| Henderson Receivables LLC, Series 2014-3A, Class A, 3.50% 20773,6 | 2,997 | 3,012 |
| Hertz Fleet Lease Funding LP, Series 2014-1-A, 0.554% 20283,4,6 | 19,135 | 19,138 |
| Hertz Vehicle Financing LLC, Rental Car Asset-backed Notes, Series 2013-1A, Class A-1, 1.12% 20173,6 | 16,000 | 15,995 |
| Hilton Grand Vacation Trust, Series 2014-AA, Class A, 1.77% 20263,6 | 4,881 | 4,835 |
| Honda Auto Receivables Owner Trust, Series 2014-3, Class A-3, 0.88% 20176 | 13,315 | 13,274 |
| Honda Auto Receivables Owner Trust, Series 2014-1, Class A-3, 0.67% 20176 | 33,265 | 33,194 |
| Honda Auto Receivables Owner Trust, Series 2014-4, Class A-3, 0.99% 20186 | 11,560 | 11,535 |
| Honda Auto Receivables Owner Trust, Series 2014-1, Class A-4, 1.04% 20206 | 30,000 | 29,880 |
| Hyundai Auto Receivables Trust, Series 2014-A, Class A2, 0.46% 20176 | 7,242 | 7,240 |
| Hyundai Auto Receivables Trust, Series 2013-B, Class A4, 1.01% 20196 | 10,500 | 10,510 |
| Mercedes-Benz Auto Receivables Trust, Series 2014-1, Class A3, 0.87% 20186 | 12,750 | 12,720 |
| Mississippi Higher Education Assistance Corp., Series 2014-1, Class A1, 0.835% 20354,6 | 5,573 | 5,564 |
| Navient Student Loan Trust, Series 2014-AA, Class A-1, 0.641% 20223,4,6 | 5,109 | 5,114 |
| New Residential Advance Receivables Trust, Series 2014-T-2, Class A-2, 2.377% 20473,6 | 12,755 | 12,772 |
| RAMP Trust, Series 2003-RZ4, Class A-7, 4.79% 20334,6 | 584 | 611 |
| RAMP Trust, Series 2003-RS11, Class A-I-7, 4.828% 20336 | 1,202 | 1,256 |
| Residential Asset Securities Corp. Trust, Series 2003-KS8, Class A-I-6, 4.83% 20336 | 857 | 878 |
| Santander Drive Auto Receivables Trust, Series 2012-2, Class C, 3.20% 20156 | 1,665 | 1,684 |
| Santander Drive Auto Receivables Trust, Series 2012-4, Class C, 2.94% 20166 | 3,690 | 3,741 |
| Santander Drive Auto Receivables Trust, Series 2011-1, Class D, 4.01% 20176 | 3,475 | 3,533 |
| Santander Drive Auto Receivables Trust, Series 2013-2, Class C, 1.95% 20176 | 9,489 | 9,541 |
| Santander Drive Auto Receivables Trust, Series 2012-6, Class C, 1.94% 20166 | 2,335 | 2,351 |
| Santander Drive Auto Receivables Trust, Series 2014-5, Class A-2, 0.72% 20186 | 10,000 | 9,997 |
| Santander Drive Auto Receivables Trust, Series 2012-3, Class C, 3.01% 20186 | 1,230 | 1,248 |
| Santander Drive Auto Receivables Trust, Series 2014-3, Class A3, 0.81% 20186 | 15,000 | 14,969 |
| Santander Drive Auto Receivables Trust, Series 2014-4, Class A3, 1.08% 20186 | 12,975 | 12,963 |
| Santander Drive Auto Receivables Trust, Series 2014-1, Class B, 1.59% 20186 | 8,155 | 8,175 |
| Santander Drive Auto Receivables Trust, Series 2014-5, Class A-3, 1.15% 20196 | 15,175 | 15,157 |
| Santander Drive Auto Receivables Trust, Series 2013-A, Class C, 3.12% 20193,6 | 1,040 | 1,066 |
| Santander Drive Auto Receivables Trust, Series 2013-4, Class C, 3.25% 20206 | 1,275 | 1,313 |
| Santander Drive Auto Receivables Trust, Series 2014-1, Class C, 2.36% 20206 | 11,496 | 11,571 |
| SLM Private Credit Student Loan Trust, Series 2014-A, Class A-1, 0.755% 20223,4,6 | 3,995 | 4,005 |
| South Carolina Student Loan Corp., Series 2014-1, Class A1, 0.918% 20304,6 | 4,550 | 4,557 |
| South Carolina Student Loan Corp., Series 2014-1, Class A2, 1.168% 20334,6 | 7,000 | 6,983 |
| South Carolina Student Loan Corp., Series 2014-1, Class B, 1.668% 20354,6 | 3,350 | 3,176 |
| SpringCastle America Funding LLC, Series 2014-AA, Class A, 2.70% 20233,6 | 7,762 | 7,762 |
| Toyota Auto Receivables Owner Trust, Series 2014-B, Class A3, 0.76% 20186 | 7,850 | 7,835 |
| Trade Maps Ltd., 2013-1-A-A, 0.854% 20183,4,6 | 11,320 | 11,340 |
| Trade Maps Ltd., 2013-1-A-B, 1.404% 20183,4,6 | 2,220 | 2,220 |
| USAA Auto Owner Trust, Series 2014-1, Class A-3, 0.58% 20176 | 7,500 | 7,491 |
| Utility Debt Securitization Auth., Series 2013-T, 2.042% 20216 | 3,510 | 3,534 |
| Utility Debt Securitization Auth., Series 2013-T, 3.435% 20256 | 2,625 | 2,746 |
| Volkswagen Auto Lease Trust, Series 2014-A, Class A-3, 0.80% 20176 | 2,815 | 2,808 |
American Balanced Fund — Page 24 of 27
Bonds, notes & other debt instruments
Asset-backed obligations (continued) | Principal amount
(000) | Value
(000) |
| Volkswagen Auto Loan Enhanced Trust, Series 2014-2, Class A-3 0.95% 20196 | $37,000 | $36,817 |
| World Financial Network Credit Card Master Note Trust, Series 2014-A, Class A, 0.534% 20194,6 | 8,225 | 8,230 |
| World Omni Auto Receivables Trust, Series 2014-B, Class A-3, 1.14% 20206 | 8,990 | 8,947 |
| | | 951,528 |
| Bonds & notes of governments & government agencies outside the U.S. 0.30% | | |
| Caisse d’Amortissement de la Dette Sociale 1.125% 20173 | 9,205 | 9,246 |
| Caisse d’Amortissement de la Dette Sociale 3.375% 20243 | 10,000 | 10,707 |
| Colombia (Republic of) Global 5.625% 2044 | 16,700 | 18,871 |
| Europe Government Agency-Guaranteed, Dexia Credit Local 1.25% 20163 | 2,300 | 2,311 |
| FMS Wertmanagement 1.625% 2018 | 5,000 | 5,016 |
| Instituto de Credito Oficial 1.125% 20163 | 9,000 | 9,010 |
| Inter-American Development Bank 4.375% 2044 | 6,500 | 7,975 |
| International Bank for Reconstruction and Development 8.25% 2016 | 1,050 | 1,177 |
| Israeli Government 3.15% 2023 | 35,000 | 35,784 |
| Japan Finance Organization for Municipalities 2.125% 20193 | 10,000 | 10,063 |
| Landwirtschaftliche Rentenbank 1.75% 2019 | 8,880 | 8,913 |
| Province of Manitoba 3.05% 2024 | 7,450 | 7,709 |
| Spanish Government 4.00% 20183 | 81,950 | 86,343 |
| Swedish Export Credit Corp. 2.875% 20233 | 3,000 | 2,972 |
| United Mexican States Government Global 3.60% 2025 | 10,000 | 10,015 |
| United Mexican States Government Global 5.55% 2045 | 13,000 | 15,145 |
| | | 241,257 |
| Municipals 0.14% | | |
| State of California, Los Angeles Community College Dist. (County of Los Angeles), G.O. Build America Bonds, 2008 Election, Series 2010-E, 6.60% 2042 | 15,000 | 21,319 |
State of Connecticut, Housing Fin. Auth., Housing Mortgage Fin. Program Rev. Ref. Bonds,
Series 2013-B-2, 4.00% 2032 | 1,925 | 2,090 |
| State of Florida, Hurricane Catastrophe Fund Fin. Corp., Rev. Bonds, Series 2013-A, 2.107% 2018 | 12,400 | 12,505 |
| State of Florida, Hurricane Catastrophe Fund Fin. Corp., Rev. Bonds, Series 2013-A, 2.995% 2020 | 15,000 | 15,263 |
| State of Illinois, Housing Dev. Auth., Housing Rev. Bonds, Series 2013-A, 2.45% 20436 | 1,326 | 1,275 |
| State of Massachusetts, Housing Fin. Agcy., Single-family Housing Rev. Bonds, Series 167, 4.00% 2043 | 685 | 744 |
| State of Minnesota, Housing Fin. Agcy., Residential Housing Fin. Bonds, Series 2014-C, AMT, 4.00% 2045 | 10,000 | 10,862 |
| State of Nebraska, Investment Fin. Auth., Single-family Housing Rev. Bonds, Series 2013-E, 3.00% 2043 | 420 | 435 |
| State of Nebraska, Investment Fin. Auth., Single-family Housing Rev. Bonds, Series 2013-E, 3.00% 2043 | 545 | 569 |
State of New Jersey, Transportation Trust Fund Auth., Transportation System Rev. Ref. Bonds,
Series 2013-B, 1.758% 2018 | 15,250 | 14,910 |
| State of Puerto Rico, Highways and Transportation Auth., Transportation Rev. Ref. Bonds, Series 2002-D, Assured Guaranty Municipal insured, 5.00% 2032 | 2,970 | 2,970 |
| State of Puerto Rico, Highways and Transportation Auth., Transportation Rev. Ref. Bonds, Series 2007-N, Assured Guaranty insured 5.25% 2036 | 2,700 | 2,763 |
| State of Puerto Rico, Highways and Transportation Auth., Transportation Rev. Ref. Bonds, Series 2007-N, Assured Guaranty insured, 5.25% 2034 | 1,140 | 1,172 |
| State of South Carolina, Housing Fin. Auth., Mortgage Rev. Ref. Bonds, AMT, 4.0% 2041 | 4,490 | 4,887 |
State of South Dakota, Housing Dev. Auth., Homeownership Mortgage Bonds, Series 2013-E, AMT,
4.00% 2044 | 820 | 866 |
| State of South Dakota, Housing Dev. Auth., Homeownership Mortgage Bonds, Series 2014-F, 4.00% 2034 | 1,750 | 1,833 |
| State of Tennessee, Housing Dev. Agcy., Residential Fin. Program Bonds, Series 2013-2-A, AMT, 4.00% 2043 | 990 | 1,048 |
State of Washington, Energy Northwest, Columbia Generating Station Electric Rev. Bonds,
Series 2012-E, 2.197% 2019 | 14,500 | 14,442 |
| | | 109,953 |
American Balanced Fund — Page 25 of 27
Bonds, notes & other debt instruments
Miscellaneous 0.05% | Principal amount
(000) | Value
(000) |
| Other bonds, notes & other debt instruments in initial period of acquisition | | $39,507 |
| Total bonds, notes & other debt instruments (cost: $21,574,677,000) | | 22,164,273 |
| Short-term securities 5.97% | | |
| Abbott Laboratories 0.11% due 2/26/20153 | $ 9,950 | 9,948 |
| Apple Inc. 0.13% due 1/13/20153 | 35,000 | 34,999 |
| CAFCO, LLC 0.22% due 5/1/2015 | 7,900 | 7,894 |
| Caterpillar Inc. 0.09% due 1/6/2015 | 62,100 | 62,099 |
| Chariot Funding, LLC 0.25%–0.27% due 5/21/2015–8/26/20153 | 120,600 | 120,428 |
| Chevron Corp. 0.08%–0.14% due 1/9/2015–4/10/20153 | 145,200 | 145,170 |
| Ciesco LLC 0.17% due 3/3/2015 | 20,000 | 19,994 |
| Citicorp 0.20% due 3/17/2015 | 25,000 | 24,990 |
| Coca-Cola Co. 0.13%–0.19% due 1/8/2015–4/23/20153 | 162,100 | 162,069 |
| Emerson Electric Co. 0.10%–0.11% due 1/28/2015–2/25/20153 | 42,600 | 42,594 |
| Fannie Mae 0.06%–0.16% due 1/7/2015–10/1/2015 | 1,172,994 | 1,172,609 |
| Federal Farm Credit Banks 0.10%–0.15% due 1/5/2015–7/29/2015 | 175,000 | 174,911 |
| Federal Home Loan Bank 0.07%–0.17% due 1/14/2015–11/4/2015 | 1,491,397 | 1,491,012 |
| Freddie Mac 0.07%–0.17% due 1/12/2015–8/18/2015 | 698,400 | 698,185 |
| General Electric Capital Corp. 0.19%–0.20% due 5/5/2015–5/13/2015 | 120,000 | 119,923 |
| Google Inc. 0.09%–0.11% due 1/14/2015–3/4/20153 | 77,200 | 77,190 |
| John Deere Capital Corp. 0.12% due 2/13/20153 | 55,000 | 54,990 |
| John Deere Financial Ltd. 0.10% due 1/12/20153 | 11,700 | 11,699 |
| JPMorgan Chase & Co. 0.25% due 3/11/20153 | 25,000 | 24,991 |
| Jupiter Securitization Co., LLC 0.21% due 5/5/20153 | 25,000 | 24,980 |
| National Rural Utilities Cooperative Finance Corp. 0.13% due 2/6/2015 | 38,100 | 38,094 |
| Paccar Financial Corp. 0.11% due 1/22/2015 | 30,000 | 29,997 |
| Private Export Funding Corp. 0.13% due 2/12/20153 | 40,000 | 39,994 |
| Procter & Gamble Co. 0.08%–0.15% due 1/5/2015–2/9/20153 | 140,000 | 139,995 |
| Regents of the University of California 0.14% due 1/14/2015 | 22,480 | 22,479 |
| Wal-Mart Stores, Inc. 0.07% due 1/13/20153 | 5,800 | 5,800 |
| Total short-term securities (cost: $4,756,675,000) | | 4,757,034 |
| Total investment securities 100.69% (cost: $58,931,867,000) | | 80,216,729 |
| Other assets less liabilities (0.69)% | | (553,050) |
| Net assets 100.00% | | $79,663,679 |
As permitted by U.S. Securities and Exchange Commission regulations, “Miscellaneous” securities include holdings in their first year of acquisition that have not previously been publicly disclosed.
| 1 | Security did not produce income during the last 12 months. |
| 2 | Valued under fair value procedures adopted by authority of the board of trustees. The total value of all such securities, including those in “Miscellaneous,“ was $1,785,370,000, which represented 2.24% of the net assets of the fund. This amount includes $1,773,228,000 related to certain securities trading outside the U.S. whose values were adjusted as a result of significant market movements following the close of local trading. |
| 3 | Acquired in a transaction exempt from registration under Rule 144A or Section 4(2) of the Securities Act of 1933. May be resold in the U.S. in transactions exempt from registration, normally to qualified institutional buyers. The total value of all such securities was $3,055,295,000, which represented 3.84% of the net assets of the fund. |
| 4 | Coupon rate may change periodically. |
| 5 | Index-linked bond whose principal amount moves with a government price index. |
| 6 | Principal payments may be made periodically. Therefore, the effective maturity date may be earlier than the stated maturity date. |
| 7 | Loan participations and assignments; may be subject to legal or contractual restrictions on resale. The total value of all such loans was $5,506,000, which represented .01% of the net assets of the fund. |
| 8 | A portion or all of the security purchased on a TBA basis. |
American Balanced Fund — Page 26 of 27
| Key to abbreviations |
| ADR = American Depository Receipts |
| TBA = To be announced |
Investments are not FDIC-insured, nor are they deposits of or guaranteed by a bank or any other entity, so they may lose value.
Investors should carefully consider investment objectives, risks, charges and expenses. This and other important information is contained in the fund prospectus and summary prospectus, which can be obtained from your financial professional and should be read carefully before investing. You may also call American Funds Service Company (AFS) at (800) 421-4225 or visit the American Funds website at americanfunds.com.
| MFGEFPX-011-0215O-S42205 | American Balanced Fund — Page 27 of 27 |
REPORT OF INDEPENDENT REGISTERED PUBLIC ACCOUNTING FIRM
To the Shareholders and Board of Trustees of
American Balanced Fund:
We have audited the accompanying statement of assets and liabilities of American Balanced Fund (the “Fund”), including the summary schedule of investments, as of December 31, 2014, and the related statements of operations for the year then ended, the statements of changes in net assets for each of the two years in the period then ended (collectively, the “financial statements”), the financial highlights for each of the five years in the period then ended (the financial statements and financial highlights are included in Item 1 of this Form N-CSR), and the schedule of investments in securities as of December 31, 2014 (included in Item 6 of this Form N-CSR). These financial statements, financial highlights, and schedule of investments in securities are the responsibility of the Fund’s management. Our responsibility is to express an opinion on these financial statements, financial highlights, and schedule of investments in securities based on our audits.
We conducted our audits in accordance with the standards of the Public Company Accounting Oversight Board (United States). Those standards require that we plan and perform the audit to obtain reasonable assurance about whether the financial statements, financial highlights, and schedule of investments in securities are free of material misstatement. An audit includes examining, on a test basis, evidence supporting the amounts and disclosures in the financial statements and schedule of investments in securities. Our procedures included confirmation of securities owned as of December 31, 2014, by correspondence with the custodian and brokers; where replies were not received from brokers, we performed other auditing procedures. An audit also includes assessing the accounting principles used and significant estimates made by management, as well as evaluating the overall financial statement presentation. We believe that our audits provide a reasonable basis for our opinion.
In our opinion, the financial statements, financial highlights, and schedule of investments in securities referred to above present fairly, in all material respects, the financial position of American Balanced Fund as of December 31, 2014, and the results of its operations for the year then ended, the changes in its net assets for each of the two years in the period then ended, and the financial highlights for each of the five years in the period then ended, in conformity with accounting principles generally accepted in the United States of America.
DELOITTE & TOUCHE LLP
Costa Mesa, California
February 10, 2015
ITEM 7 – Disclosure of Proxy Voting Policies and Procedures for Closed-End Management Investment Companies
Not applicable to this Registrant, insofar as the Registrant is not a closed-end management investment company.
ITEM 8 – Portfolio Managers of Closed-End Management Investment Companies
Not applicable to this Registrant, insofar as the Registrant is not a closed-end management investment company.
ITEM 9 – Purchases of Equity Securities by Closed-End Management Investment Company and Affiliated Purchasers
Not applicable to this Registrant, insofar as the Registrant is not a closed-end management investment company.
ITEM 10 – Submission of Matters to a Vote of Security Holders
There have been no material changes to the procedures by which shareholders may recommend nominees to the Registrant’s board of trustees since the Registrant last submitted a proxy statement to its shareholders. The procedures are as follows. The Registrant has a nominating and governance committee comprised solely of persons who are not considered ‘‘interested persons’’ of the Registrant within the meaning of the Investment Company Act of 1940, as amended. The committee periodically reviews such issues as the board’s composition, responsibilities, committees, compensation and other relevant issues, and recommends any appropriate changes to the full board of trustees. While the committee normally is able to identify from its own resources an ample number of qualified candidates, it will consider shareholder suggestions of persons to be considered as nominees to fill future vacancies on the board. Such suggestions must be sent in writing to the nominating and governance committee of the Registrant, c/o the Registrant’s Secretary, and must be accompanied by complete biographical and occupational data on the prospective nominee, along with a written consent of the prospective nominee for consideration of his or her name by the nominating and governance committee.
ITEM 11 – Controls and Procedures
| (a) | The Registrant’s Principal Executive Officer and Principal Financial Officer have concluded, based on their evaluation of the Registrant’s disclosure controls and procedures (as such term is defined in Rule 30a-3 under the Investment Company Act of 1940), that such controls and procedures are adequate and reasonably designed to achieve the purposes described in paragraph (c) of such rule. |
| | |
| (b) | There were no changes in our internal control over financial reporting during the quarter ended December 31, 2014, which were identified in connection with management's evaluation required by paragraph (d) of Rule 13a-15 and 15d-15 under the Exchange Act, that have materially affected, or are reasonably likely to materially affect, our internal control over financial reporting, other than as provided below. Effective November 10, 2014, the American Balanced Fund’s investment adviser implemented a new accounting system. In connection with introducing this new system, additional automated and manual controls were implemented and some existing controls were modified. None of these changes were in response to any identified deficiency or weakness in the American Balanced Fund’s internal control over financial reporting. |
ITEM 12 – Exhibits
| (a)(1) | The Code of Ethics that is the subject of the disclosure required by Item 2 is attached as an exhibit hereto. |
| | |
| (a)(2) | The certifications required by Rule 30a-2 of the Investment Company Act of 1940 and Sections 302 and 906 of the Sarbanes-Oxley Act of 2002 are attached as exhibits hereto. |
SIGNATURES
Pursuant to the requirements of the Securities Exchange Act of 1934 and the Investment Company Act of 1940, the Registrant has duly caused this report to be signed on its behalf by the undersigned, thereunto duly authorized.
| | AMERICAN BALANCED FUND |
| | |
| | By /s/ Gregory D. Johnson |
| | Gregory D. Johnson, Vice Chairman, President and Principal Executive Officer |
| | |
| | Date: February 27, 2015 |
Pursuant to the requirements of the Securities Exchange Act of 1934 and the Investment Company Act of 1940, this report has been signed below by the following persons on behalf of the Registrant and in the capacities and on the dates indicated.
| By /s/ Gregory D. Johnson |
| Gregory D. Johnson, Vice Chairman, President and Principal Executive Officer |
| |
| Date: February 27, 2015 |
| By /s/ Jeffrey P. Regal |
Jeffrey P. Regal, Treasurer and Principal Financial Officer |
| |
| Date: February 27, 2015 |