UNITED STATES
SECURITIES AND EXCHANGE COMMISSION
Washington, D.C. 20549
FORM N-CSR
Certified Shareholder Report of
Registered Management Investment Companies
Investment Company Act File Number: 811-00066
American Balanced Fund
(Exact Name of Registrant as Specified in Charter)
6455 Irvine Center Drive
Irvine, California 92618
(Address of Principal Executive Offices)
Registrant's telephone number, including area code: (213) 486-9200
Date of fiscal year end: December 31
Date of reporting period: December 31, 2016
Michael W. Stockton
American Balanced Fund
333 South Hope Street
Los Angeles, California 90071
(Name and Address of Agent for Service)
ITEM 1 – Reports to Stockholders

Find balance in the
midst of change.
Special feature page 6
| | | |
 | | American Balanced Fund® Annual report
for the year ended
December 31, 2016 |
American Balanced Fund seeks conservation of capital, current income and long-term growth of capital and income.
This fund is one of more than 40 offered by one of the nation’s largest mutual fund families, American Funds, from Capital Group. For more than 85 years, Capital has invested with a long-term focus based on thorough research and attention to risk.
Fund results shown in this report, unless otherwise indicated, are for Class A shares at net asset value. If a sales charge (maximum 5.75%) had been deducted, the results would have been lower. Results are for past periods and are not predictive of results for future periods. Current and future results may be lower or higher than those shown. Share prices and returns will vary, so investors may lose money. Investing for short periods makes losses more likely. Investments are not FDIC-insured, nor are they deposits of or guaranteed by a bank or any other entity, so they may lose value. For current information and month-end results, visit americanfunds.com.
See page 4 for Class A share results with relevant sales charges deducted. For other share class results, visit americanfunds.com and americanfundsreitrement.com.
Investment results assume all distributions are reinvested and reflect applicable fees and expenses. When applicable, investment results reflect fee waivers, without which results would have been lower. Visit americanfunds.com for more information.
The fund’s 30-day yield for Class A shares as of January 31, 2017, calculated in accordance with the U.S. Securities and Exchange Commission (SEC) formula, was 1.61%. The fund’s 12-month distribution rate for Class A shares as of that date was 1.61%. Both reflect the 5.75% maximum sales charge. The SEC yield reflects the rate at which the fund is earning income on its current portfolio of securities while the distribution rate reflects the fund’s past dividends paid to shareholders. Accordingly, the fund’s SEC yield and distribution rate may differ.
The return of principal for bond funds and for funds with significant underlying bond holdings is not guaranteed. Fund shares are subject to the same interest rate, inflation and credit risks associated with the underlying bond holdings. Refer to the fund prospectus and the Risk Factors section of this report for more information on these and other risks associated with investing in the fund.

Special feature
Fellow investors:
Volatility was an obvious issue for many of us in 2016. The U.S. stock market opened the year with its worst-ever start and yet managed to recover, hitting record highs by July and again in December. Those who remained invested through market fluctuations resulting from, among other things, global unrest, shifting oil prices, the U.K.’s decision to leave the European Union and a stormy presidential election cycle, were ultimately rewarded. The Dow Jones Industrial Average closed the year with a 16.40% gain.
American Balanced Fund (AMBAL) continued to serve its shareholders well, gaining 8.62% for the 12-month period ended December 31, 2016.
In comparison, the 60%/40% S&P 500/Bloomberg Barclays U.S. Aggregate Index and the Lipper Balanced Funds Index — two broad benchmark measures for balanced funds — trailed, with one-year returns of 8.31% and 7.20%, respectively. From a longer term perspective, we are pleased to report that AMBAL’s five-, 10-year and lifetime results were 10.82%, 6.52% and 10.65%, respectively, and that they continue to outpace the long-term results of both the balanced fund index and the 60%/40% blend. (See “Results at a glance” below.)
Such results may be one of the reasons why Kiplinger listed AMBAL as one of the “26 best funds for your retirement nest egg.”*
AMBAL Highlights
Clearly, 2016 was a good reminder to all investors of the importance of diversification.
By investing in a strategic blend of equities and fixed income, AMBAL pursues its objectives of conservation of capital, current income and long-term growth of
| * | Kiplinger.com, November 2016 |
Results at a glance
For periods ended December 31, 2016, with all distributions reinvested
| | | Cumulative | | Average annual |
| | | total returns | | total returns |
| | | | | | | | | Lifetime |
| | | 1 year | | 5 years | | 10 years | | (since 7/26/75)1 |
| | | | | | | | | | | |
| AMBAL (Class A shares) | | | 8.62 | % | | | 10.82 | % | | | 6.52 | % | | | 10.65 | % |
| 60%/40% S&P 500/Bloomberg Barclays U.S. Aggregate Index2,3 | | | 8.31 | | | | 9.69 | | | | 6.21 | | | | 10.11 | |
| Lipper Balanced Funds Index4 | | | 7.20 | | | | 8.32 | | | | 5.01 | | | | 9.73 | |
The market indexes shown in this report are unmanaged and, therefore, have no expenses. Investors cannot invest directly in an index.
| 1 | Date Capital Research and Management Company began managing the fund. |
| 2 | Sources: Bloomberg Index Services Ltd. and S&P Dow Jones Indices LLC. Blends the S&P 500 with the Bloomberg Barclays U.S. Aggregate Index by weighting their total returns at 60% and 40%, respectively. Results assume the blend is rebalanced monthly. |
| 3 | Source: Bloomberg Index Services Ltd. The Bloomberg Barclays U.S. Aggregate Index did not exist until December 31, 1975. For the period between July 31, 1975, and December 31, 1975, Bloomberg Barclays Government/Credit Bond Index results were used. The Bloomberg Barclays indexes are based on July 31, 1975, index value. |
| 4 | Source: Thomson Reuters Lipper. Lipper indexes track the largest mutual funds (no more than 30), represented by one share class per fund, in the corresponding Lipper category. |
| | |

capital and income. We believe that our investment process, the Capital SystemSM — supported by an extensive global research effort — provides a structure for superior long-term results.
In addition, three factors played a critical role in helping us achieve AMBAL’s results for the year: a dynamic asset allocation, careful investment selection and a fixed income component that served as a cushion to counter equity volatility.
Asset allocation: We have the ability to adjust AMBAL’s equity allocation from a minimum of 50% to a maximum of 75% of the overall portfolio. Over the course of the fund’s history, we have taken full advantage of that flexibility, based on market conditions, and will continue to do so in the future.
In 2013, for example, the fund ended the year with 74% equities after the U.S. economy had recovered and equity valuations seemed attractive. However, over the past three years, with an eye toward capital preservation, we have steadily reduced equities and increased our positions in fixed income. At one point in 2016, the equity allocation was as low as 53% and ended the year at 62%. These movements reflect, generally, the investment team’s collective input. (See page 8 for additional commentary on our approach to asset allocation.)
Securities selection: On the equity side of the portfolio, we increased our holdings in energy with a focus on integrated oil and service companies. Energy, the weakest S&P 500 sector in 2015, began a recovery after the first quarter of 2016 and proved to be a strong contributor to AMBAL for the year. In particular, our investment in Royal Dutch Shell, one of the world’s largest integrated oil companies, boosted results as the company benefited from rising oil prices as well as expectations for improved results from upstream operations. Also additive to returns were select investments among health care companies and consumer discretionary companies — notably, Comcast, which was a top contributor to the portfolio. While shareholders may recognize Comcast as a major U.S. cable company, it is also an innovator in entertainment and online communication services.
There were also investment opportunities that didn’t produce as anticipated. Our investment selection among financial companies diminished AMBAL’s returns, with Wells Fargo among the largest detractors. While Wells Fargo had its difficulties this year, we continue to be optimistic about the stock for the long term. Additionally, a smaller position in telecommunications than the broader market was a drag on relative returns.
Fixed income: Overall, the fixed income portfolio did exactly what it is intended to do — mitigate the downside volatility of equity holdings and add stability to the shareholder experience. During periods of extreme volatility, bonds tend to do better than equities. This year, our higher-than-index weighting to investment-grade corporate bonds bolstered returns. An overweight position in Treasuries, while a drag on results, was offset by strong security selection among Treasury investments, specifically holdings in Treasury Inflation Protected Securities (TIPS).
Bond investors experienced a bit of déjà vu in 2016, waiting for news of the next interest rate hike by the Federal Reserve. Such was also the case in 2015 as investors balanced expectations for a hike with concerns over the path and pace of further similar actions down the road. In both instances, the increase was announced in December, an expression of confidence in the U.S. economy.
Looking forward
We are guardedly optimistic about the direction of the market and potential investment opportunities we may find in 2017.
On the heels of a volatile year, AMBAL’s popularity has continued to grow. We welcome our many new shareholders and would like to assure all of our investors that we will continue to follow our prudent approach to investing that has characterized American Balanced Fund for over 40 years. We look forward to reporting to you again in six months’ time.
Sincerely,

Gregory D. Johnson
Vice Chairman of the Board and President
February 8, 2017
For current information about the fund, visit americanfunds.com.
History of American Balanced Fund
A historical view of the comparative total returns of stocks, bonds, AMBAL and its relevant indexes (July 26, 1975, to December 31, 2016)
| Total | | U.S. | | U.S. | | 60%/40% | | Lipper Balanced | | American |
| returns (through December 31) | | stocks | | bonds | | S&P/BBC Index | | Funds Index | | Balanced Fund |
| 1975 (from July 26) | | | 3.14 | % | | | 5.58 | % | | | 4.16 | % | | | 3.40 | % | | | 5.58 | % |
| 1976 | | | 23.93 | | | | 15.60 | | | | 20.74 | | | | 26.03 | | | | 25.98 | |
| 1977 | | | –7.16 | | | | 3.04 | | | | –3.13 | | | | –0.72 | | | | 0.70 | |
| 1978 | | | 6.57 | | | | 1.39 | | | | 4.74 | | | | 4.80 | | | | 6.21 | |
| 1979 | | | 18.61 | | | | 1.93 | | | | 11.77 | | | | 14.67 | | | | 7.63 | |
| 1980 | | | 32.50 | | | | 2.71 | | | | 20.43 | | | | 19.70 | | | | 14.36 | |
| 1981 | | | –4.92 | | | | 6.25 | | | | –0.47 | | | | 1.86 | | | | 4.40 | |
| 1982 | | | 21.55 | | | | 32.62 | | | | 26.19 | | | | 30.63 | | | | 29.36 | |
| 1983 | | | 22.56 | | | | 8.36 | | | | 16.76 | | | | 17.44 | | | | 16.11 | |
| 1984 | | | 6.27 | | | | 15.15 | | | | 9.96 | | | | 7.46 | | | | 9.36 | |
| 1985 | | | 31.73 | | | | 22.10 | | | | 27.94 | | | | 29.83 | | | | 29.11 | |
| 1986 | | | 18.67 | | | | 15.26 | | | | 17.61 | | | | 18.43 | | | | 16.87 | |
| 1987 | | | 5.25 | | | | 2.76 | | | | 5.65 | | | | 4.13 | | | | 4.02 | |
| 1988 | | | 16.61 | | | | 7.89 | | | | 13.10 | | | | 11.18 | | | | 12.87 | |
| 1989 | | | 31.69 | | | | 14.53 | | | | 24.75 | | | | 19.70 | | | | 21.53 | |
| 1990 | | | –3.10 | | | | 8.96 | | | | 1.81 | | | | 0.66 | | | | –1.57 | |
| 1991 | | | 30.47 | | | | 16.00 | | | | 24.77 | | | | 25.83 | | | | 24.69 | |
| 1992 | | | 7.62 | | | | 7.40 | | | | 7.59 | | | | 7.46 | | | | 9.48 | |
| 1993 | | | 10.08 | | | | 9.75 | | | | 9.99 | | | | 11.95 | | | | 11.27 | |
| 1994 | | | 1.32 | | | | –2.92 | | | | –0.33 | | | | –2.05 | | | | 0.34 | |
| 1995 | | | 37.58 | | | | 18.47 | | | | 29.66 | | | | 24.89 | | | | 27.13 | |
| 1996 | | | 22.96 | | | | 3.63 | | | | 14.97 | | | | 13.05 | | | | 13.16 | |
| 1997 | | | 33.36 | | | | 9.65 | | | | 23.62 | | | | 20.30 | | | | 21.04 | |
| 1998 | | | 28.58 | | | | 8.69 | | | | 20.99 | | | | 15.09 | | | | 11.13 | |
| 1999 | | | 21.04 | | | | –0.82 | | | | 12.00 | | | | 8.98 | | | | 3.47 | |
| 2000 | | | –9.10 | | | | 11.63 | | | | –1.00 | | | | 2.39 | | | | 15.85 | |
| 2001 | | | –11.89 | | | | 8.44 | | | | –3.71 | | | | –3.24 | | | | 8.19 | |
| 2002 | | | –22.10 | | | | 10.26 | | | | –9.82 | | | | –10.69 | | | | –6.27 | |
| 2003 | | | 28.68 | | | | 4.10 | | | | 18.48 | | | | 19.94 | | | | 22.82 | |
| 2004 | | | 10.88 | | | | 4.34 | | | | 8.30 | | | | 8.99 | | | | 8.92 | |
| 2005 | | | 4.91 | | | | 2.43 | | | | 4.00 | | | | 5.20 | | | | 3.12 | |
| 2006 | | | 15.79 | | | | 4.33 | | | | 11.12 | | | | 11.60 | | | | 11.80 | |
| 2007 | | | 5.49 | | | | 6.97 | | | | 6.22 | | | | 6.53 | | | | 6.60 | |
| 2008 | | | –37.00 | | | | 5.24 | | | | –22.06 | | | | –26.18 | | | �� | –25.73 | |
| 2009 | | | 26.46 | | | | 5.93 | | | | 18.40 | | | | 23.35 | | | | 21.08 | |
| 2010 | | | 15.06 | | | | 6.54 | | | | 12.13 | | | | 11.90 | | | | 13.02 | |
| 2011 | | | 2.11 | | | | 7.84 | | | | 4.69 | | | | 0.74 | | | | 3.82 | |
| 2012 | | | 16.00 | | | | 4.21 | | | | 11.31 | | | | 11.94 | | | | 14.19 | |
| 2013 | | | 32.39 | | | | –2.02 | | | | 17.56 | | | | 16.39 | | | | 21.73 | |
| 2014 | | | 13.69 | | | | 5.97 | | | | 10.62 | | | | 7.21 | | | | 8.85 | |
| 2015 | | | 1.38 | | | | 0.55 | | | | 1.28 | | | | –0.42 | | | | 1.72 | |
| 2016 | | | 11.96 | | | | 2.65 | | | | 8.31 | | | | 7.20 | | | | 8.62 | |
| Average annual total returns | | | 11.33 | % | | | 7.61 | % | | | 10.11 | % | | | 9.73 | % | | | 10.65 | % |
| Volatility | | | 14.82 | % | | | 5.39 | % | | | 9.59 | % | | | 9.99 | % | | | 9.59 | % |
Figures assume reinvestment of all distributions.
Sources: Stocks — S&P Dow Jones Indices LLC.; Bonds — Bloomberg Index Services Ltd. Bloomberg Barclays U.S. Aggregate Index. Bloomberg Barclays U.S. Aggregate Index represents the U.S. investment-grade fixed-rate bond market. For the period July 31, 1975, to December 31, 1975, Bloomberg Barclays Government/Credit Bond Index was used.
The 60%/40% S&P/BBC Index blends the S&P 500 with the Bloomberg Barclays U.S. Aggregate Index by weighting their total returns at 60% and 40%, respectively. The portfolio is rebalanced monthly.
The market indexes are unmanaged and, therefore, have no expenses. Investors cannot invest directly in an index.
Source: Thomson Reuters Lipper. The Lipper Balanced Funds Index is an equally weighted index of the 30 largest U.S. balanced funds.
Capital Research and Management Company became the fund’s investment adviser on July 26, 1975.
Volatility is calculated using annualized standard deviation (based on monthly returns), a measure of how returns over time have varied from the mean; a lower number signifies lower volatility.
The value of a long-term perspective
Fund results shown are for Class A shares and reflect deduction of the maximum sales charge of 5.75% on the $10,000 investment.¹ Thus, the net amount invested was $9,425.2 Results are for past periods and are not predictive of results for future periods. Current and future results may be lower or higher than those shown. Share prices and returns will vary, so investors may lose money. For current information and month-end results, visit americanfunds.com.
The results shown are before taxes on fund distributions and sale of fund shares.
| 1 | As outlined in the prospectus, the sales charge is reduced for accounts (and aggregated investments) of $25,000 or more and is eliminated for purchases of $1 million or more. There is no sales charge on dividends or capital gain distributions that are reinvested in additional shares. |
| 2 | The maximum initial sales charge was 8.50% prior to July 1, 1988. |
| 3 | The market indexes are unmanaged and, therefore, have no expenses. Investors cannot invest directly in an index. |
| 4 | Source: S&P Dow Jones Indices LLC. |
| 5 | Source: Thomson Reuters Lipper. Results of the Lipper Balanced Funds Index do not reflect any sales charges. Lipper indexes track the largest mutual funds (no more than 30), represented by one share class per fund, in the corresponding Lipper category. |
| 6 | Source: Bloomberg Index Services Ltd. Bloomberg Barclays U.S. Aggregate Index represents the U.S. investment-grade fixed-rate bond market. For the period July 31, 1975, to December 31, 1975, Bloomberg Barclays Government/Credit Bond Index was used. |
| 7 | For the period July 26, 1975 (when Capital Research and Management Company became the fund’s investment adviser) through December 31, 1975. |
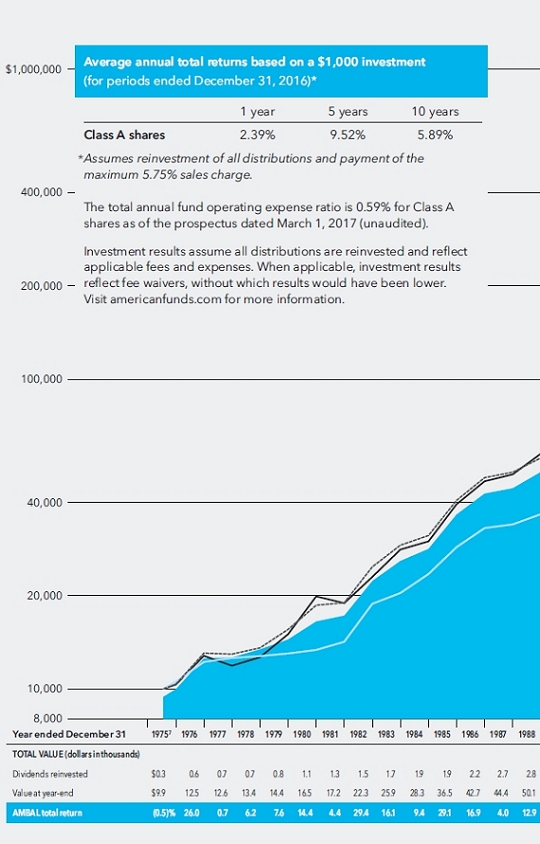
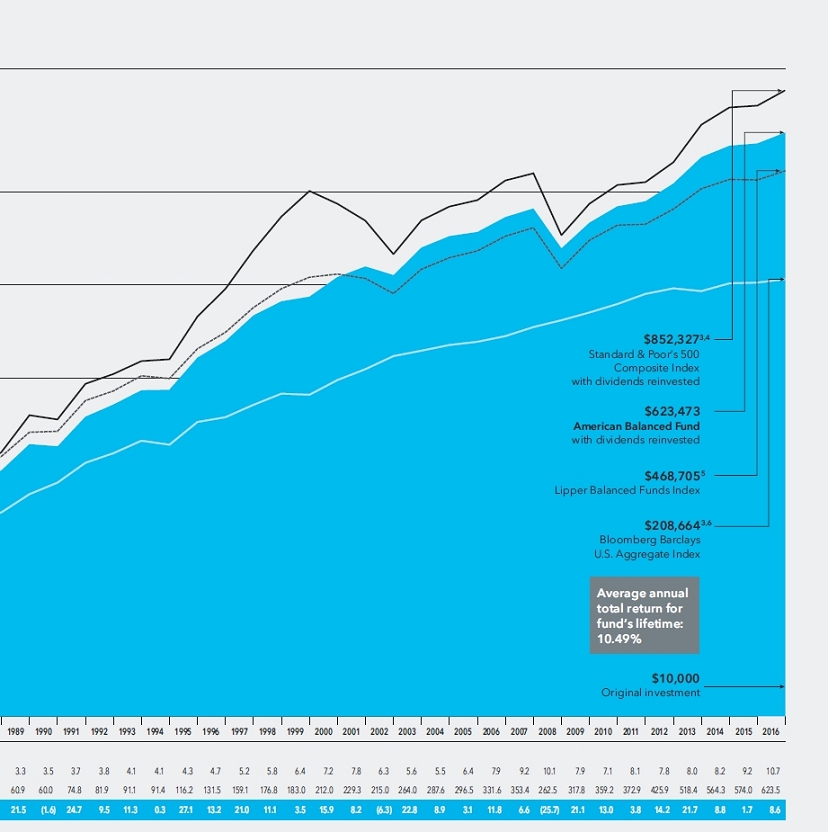
How a $10,000 investment has grown
This chart shows how a hypothetical $10,000 investment in American Balanced Fund grew from July 26, 1975 — when Capital Research and Management Company became the fund’s investment adviser — to December 31, 2016. As you can see, the investment grew to $623,473 with all distributions reinvested. The fund’s year-by-year results appear under the chart. You can use this table to estimate how the value of your own holdings has grown.
Balancing risk and reward in a challenging environment.
Some investors see a change in investment climate as a cause for concern.
The portfolio managers and analysts of American Balanced Fund view it as a potential source of opportunity. With careful thought, they seek to manage the ups and downs of investment markets so shareholders can more confidently pursue their financial goals.
A year of change
To be sure, 2016 offered investors plenty of unpredictable twists and turns.
In times of such dramatic change, emotions can run high. “What’s safe? Where should I invest now?” “Can I still reach my financial goals?” “Will I be able to generate enough income in retirement?” Interestingly, the reactions of unnerved investors tend to contribute to the very market volatility they are hoping to avoid.
However, at American Funds, we are aware that market fluctuations can often reveal new investment opportunities and growing sectors to consider. Rather than struggle to avoid change, we seek to understand it so we can help investors take advantage of upside market opportunity while mitigating downside effects of volatility over time. That is the hallmark of American Balanced Fund (AMBAL).
A balanced approach
While balanced investing may seem a timely idea during any intemperate period, the concept is hardly new. Investors have been using balanced investment strategies to cope with the ups and downs of the markets since the crash of 1929, when as much as 89% of stock market value was wiped out, as measured by the Dow Jones Industrial Average, excluding dividends.
“Stock market declines are the last thing anyone wants to experience, but they’re an inevitable part of investing,” says Greg Johnson, president and portfolio manager of AMBAL. Indeed, market declines are a regular occurrence; the Dow Jones Industrial Average typically dips 10% or more once a year on average. “Since the future is difficult to predict, a balanced strategy can serve investors well, especially during periods of extreme volatility.”
“Depending on your needs and your time horizon, there are different ways you can pursue returns,” explains Alan Wilson, portfolio manager. “You can seek capital appreciation through equities. You could also get your return from income via bonds. Neither is necessarily better than the other.”
“AMBAL balances the equation by providing a strategic blend of quality stocks and bonds. The equities often deliver greater returns over time but come with a greater risk of loss. The fixed income component acts as a cushion to reduce equity volatility as bonds tend to move in the opposite direction from stocks. Together, they can make the journey a lot less harrowing.”
Regardless of market environment, the objectives of the fund remain constant: capital conservation, current income and long-term growth of capital and income. “That first objective — conservation of capital — is something we take very seriously as we work to grow people’s wealth, prudently, over time.” says Greg.
This intention — to protect investor assets in times of uncertainty or volatility — is likely a primary factor behind the fund’s popularity. In 2016 alone, total net assets for AMBAL reached over $101 billion, a substantial increase from $84.5 billion in 2015.
In 2008, volatility drove many out of the investment markets, in many cases locking in losses they may have incurred during that difficult time and setting them back from achieving their objectives. This was especially true for those about to retire or those already living in retirement. AMBAL’s focus, combined with a defensive asset allocation, has provided its shareholders with a degree of comfort that encourages them to remain invested, even during declines, improving their chances of reaching their financial goals.
Three portfolio managers discuss how American Balanced Fund seeks to protect investors at all times.
 |  |  |
Greg Johnson Portfolio manager | Alan Wilson Portfolio manager | John Queen Portfolio manager |

“With American Balanced Fund, one investment decision gives you equity and fixed income exposure, while a company you can trust determines the asset mix for you.”
Greg Johnson, portfolio manager
“I think one reason for the fund’s popularity is that there are millions of investors who were hurt in 2008-09 and its taken them nearly a decade to recover. They’re back in the market, but looking for some protection on the downside.”
Jim Mulally, portfolio manager
The New Geography of Investing®
While most of the companies that AMBAL invests in are based in the U.S., many do business on a global basis. For example, approximately 1% of the companies are based in developing countries, yet a meaningful portion of the revenues generated by those very companies may come from the same place. This is why it’s important to have active management supported by a global research operation when investing in today’s markets.
Equity portion breakdown by domicile (%)

| | Region | | Fund | | Index |
| g | United States | | | 92 | % | | | 100 | % |
| g | Canada | | | 1 | | | | — | |
| g | Europe | | | 6 | | | | — | |
| g | Japan | | | — | | | | — | |
| g | Asia-Pacific ex. Japan | | | — | | | | — | |
| g | Emerging markets | | | 1 | | | | — | |
| | Total | | | 100 | % | | | 100 | % |
Equity portion breakdown by revenue (%)
| | Region | | Fund | | Index |
| g | United States | | | 58 | % | | | 64 | % |
| g | Canada | | | 3 | | | | 2 | |
| g | Europe | | | 12 | | | | 12 | |
| g | Japan | | | 3 | | | | 2 | |
| g | Asia-Pacific ex. Japan | | | 2 | | | | 1 | |
| g | Emerging markets | | | 22 | | | | 19 | |
| | Total | | | 100 | % | | | 100 | % |
Compared with the S&P 500 as a percent of net assets. All figures include convertible securities.
Source: Capital Group (as of December 31, 2016).
The fund has historically outperformed its peers and benchmarks over the long term.
A dynamic asset allocation
AMBAL invests primarily in blue chip equities and investment-grade fixed income securities using a balanced approach.
“I think volatile years like 2016 can be the best test and testament to the value of our active investment management style that we practice at American Funds — for both fixed income and equities. Investors can see that value in the pattern of our results,” says John Queen, portfolio manager.
“We have a good mix of styles and perspectives at work among the portfolio managers. The investment team has added value by investing in stocks and bonds using a fundamental, valuation-based approach,” says Greg. “But equally important is the flexibility we have to move between stocks, bonds and cash in a material way when we think it is appropriate.”
The adaptability of the fund’s asset allocation — not static at 60% equities and 40% fixed income — has made it possible for AMBAL to be positioned in a way that can serve shareholders through changing market environments. For example, in 2013 when equities were doing dramatically better than fixed income, nearly 74% of the fund’s assets were invested in equities by year-end. In contrast, stocks were reduced to as low as 53% at one point in 2016, given a view that we were likely entering the latter stages of the market cycle and stock valuations were not as attractive as they were before.
“That’s the benefit of our asset allocation strategy within the context of balanced investing,” says John. “Different asset classes can behave differently at different times. During periods of high volatility, you have a higher probability of seeing that negative correlation. In January, our exposure to equities was about as low as we could make it; fixed income investments carried the day when equities were doing poorly. On the other hand,
by year-end, we had adjusted the equity allocation to just over 61%, reducing our position in fixed income. That was fortunate because, post-election, equities were doing much better than Treasuries.”
An equity manager’s perspective
“In any volatile year, there are two things to consider: the underlying economic outlook — how companies perform in whatever environment they’re in — and how their stocks respond to that environment,” says Alan. “Despite the headlines, I’d say 2016 offered a lot of good news. Many companies had growing earnings. We had declining unemployment. There were a lot of things to be positive about with respect to the aggregate economy. Underneath that, however, was the challenge of shifting sands within industries. That’s not necessarily a bad thing because volatility can create investment opportunity.”
Against that backdrop, each of the equity managers of AMBAL brings their own unique experience and investment style to a segment of the overall portfolio, acting on their strongest convictions. The blend of managers tends to balance any inherent investment biases and is designed to lower volatility while striving for consistent long-term returns. That is the Capital System at work.
“I’m what I’d call an environmentalist as an investor,” says Alan. “If I knew for certain that we were going to have only sunny days for the next 20 years, I would own every sunglasses company in town. Conversely, if I knew for certain that it was going to rain for the next 20 years, I’d have only umbrella manufacturers. Either situation is great when you know what the environment will be. But we can’t accurately predict the weather over the long term.”
“So I prefer to focus on companies that I believe will have advantages independent of the economic environment. Energy, for example. One of the interesting things about energy, particularly crude oil production, is the issue of depletion.
When you initially tap a reservoir, pressure is released and pushes the oil up from the ground. But the nature of releasing that pressure eventually makes it harder and harder to pull out incremental barrels of oil. Meanwhile, demand for the oil continues to grow. So a lot more activity needs to go on in order to sustain energy production than almost any other manufacturing process. For that reason, I tend to hold a reasonable number of the service companies that help the process of extracting the oil out of the ground.”
“It’s hard enough to figure out what might happen. If you also had to figure out when it was going to happen, the task would become impossible. So even when there was dissenting sentiment for oil at the beginning of the year, it was easy for me to say, ‘You know what? Given the way reservoirs work, the nature of depletion and the certainty of rising demand, energy is going to turn around.’ What I couldn’t know was when that would happen. What is important is getting the ‘what’ right. And if you get there a little bit early, that may allow us to get even better pricing and bigger positions.”
A fixed income manager’s perspective
“The first job of the fixed income portfolio is to provide balance to the balanced portfolio,” explains John. “You’re going to get your long-term growth from equities. And that benefit comes at the expense of equity volatility. AMBAL provides a component that is designed to reduce the risk.”
“American Balanced Fund can act as an anchor in any sort of storm. You get peace of mind during periods of volatility and an asset mix that has withstood the test of time.”
Alan Berro, portfolio manager
How AMBAL is managed
Portfolio managers
The Capital System combines individual accountability with teamwork. AMBAL’s nine portfolio managers have an average of 30 years of experience.* Each is assigned a portion of the overall assets to manage independently, bringing to bear their own personal investment style and highest conviction ideas.
| Hilda L. Applbaum | | | 30 years | | | James R. Mulally | | | 41 years | |
| Alan N. Berro | | | 31 years | | | John R. Queen | | | 26 years | |
| Gregory D. Johnson | | | 23 years | | | John H. Smet | | | 35 years | |
| Michael T. Kerr | | | 34 years | | | Alan J. Wilson | | | 32 years | |
| Jeffrey T. Lager | | | 22 years | | | | | | | |
Investment analysts
Investment analysts also invest in their strongest convictions through the research portfolio.
| * | List of investment professionals and their years of experience are as of the prospectus dated March 1, 2017 (unaudited). |

“The fixed income team seeks to do that by managing a diversified, high-quality portfolio that includes U.S. Treasuries, U.S. Treasury Inflation Protected Securities (TIPS), mortgage- and asset-backed securities and corporate bonds. Even when interest rates are rising, as they were toward the end of 2016, Treasuries play an important role as they provide liquidity and structure to our side of the overall portfolio. In an effort to improve results, we use a number of different investment strategies, whether its duration shifts, looking at different parts of the yield curve, or buying different sectors and adjusting those sectors as values shift. Among corporates, for example, we found attractive opportunities in energy and healthcare.”
For the fixed income managers, research is a key part of the process. The Portfolio Strategy Group establishes broad, strategic parameters that act as a guide in the construction of the fixed income portfolio and guides the managers in making informed investment decisions. “We devote considerable resources to top-down analysis, like all fixed income investors, but we also put an incredible amount of effort into research at the security level,” says John. “We believe this combination is essential to our ability to add value over time.”
“Of course, we also have an eye on the potential risk we’re taking in the portfolio. A lot of people think bonds have no risk. But outside of a Treasury bill, any incremental yield you’re getting comes with some degree of risk.” To help the fixed income component of AMBAL continue to provide a buffer to volatility, the Risk and Quantitative Solutions group offers additional insight that helps managers fully understand the risk they may be taking under a variety of possible scenarios.
“The value of this research shows up in our numbers. This year, despite volatility, we were able to provide an incremental return within the fixed income portfolio, in addition to our primary goal of bringing balance to the overall fund,” says John.
Greater than the sum of its parts
Volatility comes and goes. Markets rise, decline and rise again. This is nothing new. However it does serve to underscore the importance of a diversified portfolio, such as AMBAL’s, as well as the need for a long-term investment perspective.
But the story of AMBAL isn’t only about a balanced fund that — through a unique approach to investing, careful portfolio construction, a dynamic asset allocation strategy and fundamental research — has effectively weathered difficult markets to produce superior long-term results. It’s also a historical chronicle of the many shareholders who have used the fund to prudently grow their assets in an effort to reach their financial goals.
“That’s the bigger picture we never lose sight of,” says, Greg. “And it’s our privilege to do our very best to help you reach your objectives.”
 | R.D. Kern Investment analyst |
Inside the research portfolio
“The basis of my job is fundamental research,” says R.D. Kern, investment analyst. In addition to conducting financial analysis and modeling at the office, the role of analyst requires a lot of travel — actually visiting the companies we are interested in, meeting with all levels of management and connecting to folks in the supply chain of the industries I cover.”
“What I’m looking for is insight into opportunities that the market may misunderstand or underappreciate. That means rising above the headlines because an industry may be painted in a narrative that’s not true. I dig deeper to determine where there may be a disconnect between the consensus view out there and what I think is actually happening.”
“Once I find a company I find attractive, I communicate the idea to the portfolio managers. There’s a lot of value in that relationship as the managers have seen numerous market cycles and can consider the opportunity with an impartial perspective. Whether they ultimately share my conviction, I can still invest in the stock through the research portfolio (RP). To determine the size of the position I might take, I work with the RP coordinator to gauge my conviction relative to the ideas of other analysts in the portfolio.”
“There are generally a number of attractive investments in the industries that I cover. Any time you have a lot of change going on in the market, there are good opportunities for those who know how to recognize them — but it isn’t always easy. You’ve got to be selective and do your homework. That’s my job.”
Summary investment portfolio December 31, 2016
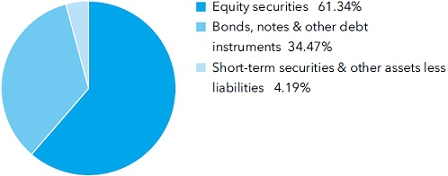
| Investment mix by security type | Percent of net assets |
| Common stocks 61.27% | | Shares | | | Value
(000) | |
| Information technology 10.69% | | | | | | | | |
| Microsoft Corp. | | | 57,929,407 | | | $ | 3,599,733 | |
| Broadcom Ltd. | | | 5,608,286 | | | | 991,377 | |
| Intel Corp. | | | 21,888,100 | | | | 793,881 | |
| ASML Holding NV (New York registered) | | | 5,117,458 | | | | 574,179 | |
| ASML Holding NV1 | | | 1,905,000 | | | | 213,443 | |
| Intuit Inc. | | | 6,285,000 | | | | 720,324 | |
| Facebook, Inc., Class A2 | | | 5,500,000 | | | | 632,775 | |
| Texas Instruments Inc. | | | 8,132,000 | | | | 593,392 | |
| Taiwan Semiconductor Manufacturing Co., Ltd. (ADR) | | | 20,520,000 | | | | 589,950 | |
| Alphabet Inc., Class C2 | | | 647,800 | | | | 499,985 | |
| TE Connectivity Ltd. | | | 7,205,000 | | | | 499,162 | |
| Other securities | | | | | | | 1,098,777 | |
| | | | | | | | 10,806,978 | |
| | | | | | | | | |
| Consumer discretionary 9.06% | | | | | | | | |
| Home Depot, Inc. | | | 16,062,349 | | | | 2,153,640 | |
| Comcast Corp., Class A | | | 30,517,000 | | | | 2,107,199 | |
| Amazon.com, Inc.2 | | | 2,241,400 | | | | 1,680,759 | |
| Other securities | | | | | | | 3,226,507 | |
| | | | | | | | 9,168,105 | |
| | | | | | | | | |
| Financials 8.57% | | | | | | | | |
| Berkshire Hathaway Inc., Class A2 | | | 8,080 | | | | 1,972,498 | |
| Berkshire Hathaway Inc., Class B2 | | | 800,000 | | | | 130,384 | |
| JPMorgan Chase & Co. | | | 19,761,000 | | | | 1,705,177 | |
| Wells Fargo & Co. | | | 23,103,000 | | | | 1,273,206 | |
| Chubb Ltd. | | | 6,070,500 | | | | 802,034 | |
| Citigroup Inc. | | | 10,700,000 | | | | 635,901 | |
| SunTrust Banks, Inc. | | | 10,383,411 | | | | 569,530 | |
| Capital One Financial Corp. | | | 5,421,000 | | | | 472,928 | |
| Other securities | | | | | | | 1,110,852 | |
| | | | | | | | 8,672,510 | |
| | | | | | | | | |
| Energy 7.56% | | | | | | | | |
| Schlumberger Ltd. | | | 16,869,000 | | | | 1,416,153 | |
| Royal Dutch Shell PLC, Class B (ADR) | | | 19,135,000 | | | | 1,109,256 | |
| Royal Dutch Shell PLC, Class B1 | | | 4,000,000 | | | | 114,143 | |
| Chevron Corp. | | | 7,594,755 | | | | 893,903 | |
| Exxon Mobil Corp. | | | 7,200,000 | | | | 649,872 | |
| ConocoPhillips | | | 12,837,668 | | | | 643,681 | |
| Enbridge Inc. | | | 13,900,000 | | | | 585,468 | |
| Other securities | | | | | | | 2,234,043 | |
| | | | | | | | 7,646,519 | |
| Common stocks (continued) | | Shares | | | Value
(000) | |
| Consumer staples 6.11% | | | | | | | | |
| Philip Morris International Inc. | | | 16,892,000 | | | $ | 1,545,449 | |
| Coca-Cola Co. | | | 30,068,000 | | | | 1,246,619 | |
| Kraft Heinz Co. | | | 11,620,850 | | | | 1,014,733 | |
| Procter & Gamble Co. | | | 9,837,563 | | | | 827,142 | |
| Other securities | | | | | | | 1,541,977 | |
| | | | | | | | 6,175,920 | |
| | | | | | | | | |
| Health care 6.03% | | | | | | | | |
| UnitedHealth Group Inc. | | | 9,647,500 | | | | 1,543,986 | |
| Merck & Co., Inc. | | | 21,332,000 | | | | 1,255,815 | |
| Johnson & Johnson | | | 6,610,000 | | | | 761,538 | |
| Express Scripts Holding Co.2 | | | 10,476,400 | | | | 720,671 | |
| Bristol-Myers Squibb Co. | | | 9,474,300 | | | | 553,678 | |
| Other securities | | | | | | | 1,258,373 | |
| | | | | | | | 6,094,061 | |
| | | | | | | | | |
| Industrials 4.62% | | | | | | | | |
| Boeing Co. | | | 9,052,000 | | | | 1,409,215 | |
| Lockheed Martin Corp. | | | 4,407,037 | | | | 1,101,495 | |
| General Electric Co. | | | 20,000,000 | | | | 632,000 | |
| Other securities | | | | | | | 1,533,818 | |
| | | | | | | | 4,676,528 | |
| | | | | | | | | |
| Materials 3.03% | | | | | | | | |
| E.I. du Pont de Nemours and Co. | | | 20,059,388 | | | | 1,472,359 | |
| Praxair, Inc. | | | 5,011,400 | | | | 587,286 | |
| Other securities | | | | | | | 1,001,674 | |
| | | | | | | | 3,061,319 | |
| | | | | | | | | |
| Other 1.40% | | | | | | | | |
| Other securities | | | | | | | 1,417,944 | |
| | | | | | | | | |
| Miscellaneous 4.20% | | | | | | | | |
| Other common stocks in initial period of acquisition | | | | | | | 4,244,326 | |
| | | | | | | | | |
| Total common stocks (cost: $40,695,500,000) | | | | | | | 61,964,210 | |
| | | | | | | | | |
| Preferred securities 0.01% | | | | | | | | |
| Financials 0.01% | | | | | | | | |
| Other securities | | | | | | | 4,745 | |
| | | | | | | | | |
| Total preferred securities (cost: $5,208,000) | | | | | | | 4,745 | |
| | | | | | | | | |
| Convertible stocks 0.06% | | | | | | | | |
| Miscellaneous 0.06% | | | | | | | | |
| Other convertible stocks in initial period of acquisition | | | | | | | 59,764 | |
| | | | | | | | | |
| Total convertible stocks (cost: $59,055,000) | | | | | | | 59,764 | |
| | | | | | | | | |
| Bonds, notes & other debt instruments 34.47% | Principal amount
(000) | | | | | |
| U.S. Treasury bonds & notes 14.14% | | | | | | | | |
| U.S. Treasury 11.88% | | | | | | | | |
| U.S. Treasury 0.625% 20183 | | $ | 985,000 | | | | 979,937 | |
| U.S. Treasury 1.25% 2020 | | | 617,000 | | | | 612,471 | |
| U.S. Treasury 1.375% 2020 | | | 540,660 | | | | 534,026 | |
| U.S. Treasury 2.00% 2021 | | | 475,620 | | | | 475,323 | |
| U.S. Treasury 2.00% 2026 | | | 701,677 | | | | 675,364 | |
| U.S. Treasury 2.875% 2046 | | | 992,060 | | | | 955,195 | |
| U.S. Treasury 0.75%–5.38% 2017–2046 | | | 7,921,409 | | | | 7,780,394 | |
| | | | | | | | 12,012,710 | |
| | | Principal amount
(000) | | | Value
(000) | |
| U.S. Treasury inflation-protected securities 2.25% | | | | | | |
| U.S. Treasury Inflation-Protected Securities 0.13%–2.63% 2017–20464 | | $ | 2,223,725 | | | $ | 2,273,696 | |
| | | | | | | | | |
| Federal agency bonds & notes 0.01% | | | | | | | | |
| Other securities | | | | | | | 9,987 | |
| | | | | | | | | |
| Total U.S. Treasury bonds & notes | | | | | | | 14,296,393 | |
| | | | | | | | | |
| Corporate bonds & notes 11.81% | | | | | | | | |
| Financials 2.73% | | | | | | | | |
| Berkshire Hathaway Finance Corp. 1.30% 2019 | | | 15,320 | | | | 15,133 | |
| Berkshire Hathaway Inc. 2.00%–2.90% 2018–2023 | | | 42,835 | | | | 43,112 | |
| JPMorgan Chase & Co. 1.35%–6.75% 2017–2049 | | | 234,740 | | | | 237,359 | |
| Wells Fargo & Co. 2.10%–4.60% 2019–2026 | | | 202,717 | | | | 201,828 | |
| Other securities | | | | | | | 2,262,670 | |
| | | | | | | | 2,760,102 | |
| | | | | | | | | |
| Health care 1.96% | | | | | | | | |
| UnitedHealth Group Inc. 1.40%–6.00% 2017–2022 | | | 106,770 | | | | 109,037 | |
| Other securities | | | | | | | 1,876,515 | |
| | | | | | | | 1,985,552 | |
| | | | | | | | | |
| Consumer discretionary 1.59% | | | | | | | | |
| Amazon.com, Inc. 3.80%–4.95% 2024–2044 | | | 93,475 | | | | 101,442 | |
| Comcast Corp. 1.63%–6.45% 2017–2046 | | | 112,965 | | | | 114,958 | |
| Home Depot, Inc. 2.00%–5.95% 2021–2056 | | | 104,515 | | | | 104,329 | |
| Other securities | | | | | | | 1,289,332 | |
| | | | | | | | 1,610,061 | |
| | | | | | | | | |
| Energy 1.58% | | | | | | | | |
| Chevron Corp. 2.10%–3.33% 2021–2026 | | | 60,400 | | | | 59,984 | |
| Royal Dutch Shell PLC 1.75%–3.75% 2021–2046 | | | 62,815 | | | | 59,407 | |
| Schlumberger BV 3.00%–4.00% 2020–20255 | | | 69,465 | | | | 72,050 | |
| Shell International Finance BV 1.88%–2.88% 2020–2026 | | | 107,305 | | | | 105,795 | |
| Other securities | | | | | | | 1,295,932 | |
| | | | | | | | 1,593,168 | |
| | | | | | | | | |
| Consumer staples 0.77% | | | | | | | | |
| Kraft Heinz Co. 2.25%–4.38% 2017–2046 | | | 51,485 | | | | 50,569 | |
| Philip Morris International Inc. 1.88%–4.25% 2021–2044 | | | 68,415 | | | | 68,320 | |
| Other securities | | | | | | | 657,755 | |
| | | | | | | | 776,644 | |
| | | | | | | | | |
| Information technology 0.52% | | | | | | | | |
| Microsoft Corp. 1.55%–4.20% 2021–2046 | | | 111,435 | | | | 108,464 | |
| Other securities | | | | | | | 414,583 | |
| | | | | | | | 523,047 | |
| | | | | | | | | |
| Industrials 0.45% | | | | | | | | |
| Lockheed Martin Corp. 3.10%–4.70% 2023–2046 | | | 64,250 | | | | 66,405 | |
| Other securities | | | | | | | 391,107 | |
| | | | | | | | 457,512 | |
| | | | | | | | | |
| Other corporate bonds & notes 2.21% | | | | | | | | |
| Other securities | | | | | | | 2,233,494 | |
| | | | | | | | | |
| Total corporate bonds & notes | | | | | | | 11,939,580 | |
| | | | | | | | | |
| Mortgage-backed obligations 6.24% | | | | | | | | |
| Fannie Mae 0%–11.01% 2017–20476,7,8 | | | 2,922,576 | | | | 3,004,602 | |
| Freddie Mac, Series K056, Class A1, multifamily 2.20% 20257 | | | 23,809 | | | | 23,142 | |
| Freddie Mac 0%–6.50% 2021–20476,7,8 | | | 1,907,207 | | | | 1,973,419 | |
| Other securities | | | | | | | 1,307,647 | |
| | | | | | | | 6,308,810 | |
| Bonds, notes & other debt instruments (continued) | | Principal amount
(000) | | | Value
(000) | |
| Federal agency bonds & notes 0.64% | | | | | | | | |
| Fannie Mae 0.88%–6.25% 2018–2029 | | $ | 204,510 | | | $ | 201,231 | |
| Federal Home Loan Bank 0.88%–5.50% 2018–2036 | | | 170,240 | | | | 171,289 | |
| Freddie Mac 0.75%–1.13% 2018–2019 | | | 175,732 | | | | 174,132 | |
| Other securities | | | | | | | 97,646 | |
| | | | | | | | 644,298 | |
| | | | | | | | | |
| Other bonds & notes 1.57% | | | | | | | | |
| Other securities | | | | | | | 1,598,656 | |
| | | | | | | | | |
| Miscellaneous 0.07% | | | | | | | | |
| Other bonds & notes in initial period of acquisition | | | | | | | 71,633 | |
| | | | | | | | | |
| Total bonds, notes & other debt instruments (cost: $34,905,316,000) | | | | | | | 34,859,370 | |
| | | | | | | | | |
| Short-term securities 4.43% | | | | | | | | |
| Chariot Funding, LLC 1.00% due 1/17/20175 | | | 25,000 | | | | 24,993 | |
| Chevron Corp. 0.53%–0.82% due 1/17/2017–3/2/20175 | | | 269,000 | | | | 268,843 | |
| Federal Home Loan Bank 0.31%–0.56% due 1/3/2017–5/26/2017 | | | 2,155,475 | | | | 2,153,724 | |
| Jupiter Securitization Co., LLC 0.85% due 1/9/20175 | | | 43,000 | | | | 42,994 | |
| Microsoft Corp. 0.74%–0.82% due 2/14/2017–2/21/20175 | | | 192,200 | | | | 192,044 | |
| U.S. Treasury Bills 0.39%–0.51% due 1/5/2017–3/30/2017 | | | 864,200 | | | | 863,705 | |
| Wells Fargo Bank, N.A. 1.01% due 1/18/2017 | | | 100,000 | | | | 100,022 | |
| Other securities | | | | | | | 840,057 | |
| | | | | | | | | |
| Total short-term securities (cost: $4,486,128,000) | | | | | | | 4,486,382 | |
| Total investment securities 100.24% (cost: $80,151,207,000) | | | | | | | 101,374,471 | |
| Other assets less liabilities (0.24)% | | | | | | | (244,411 | ) |
| | | | | | | | | |
| Net assets 100.00% | | | | | | $ | 101,130,060 | |
This summary investment portfolio is designed to streamline the report and help investors better focus on the fund’s principal holdings. See the inside back cover for details on how to obtain a complete schedule of portfolio holdings.
As permitted by U.S. Securities and Exchange Commission regulations, “Miscellaneous” securities include holdings in their first year of acquisition that have not previously been publicly disclosed.
“Other securities” includes all issues that are not disclosed separately in the summary investment portfolio.
Investments in affiliates
A company is an affiliate of the fund under the Investment Company Act of 1940 if the fund’s holdings in that company represent 5% or more of the outstanding voting shares. The value of the fund’s affiliated-company holdings is included in “Other securities” under the respective industry sector in the summary investment portfolio. Further details on such holdings and related transactions during the year ended December 31, 2016, appear below.
| | | | Beginning
shares | | | | Additions | | | | Reductions | | | | Ending
shares | | | | Dividend
income
(000) | | | | Value of
affiliates at
12/31/2016
(000) | |
| VeriSign, Inc.2 | | | 5,400,000 | | | | 500,000 | | | | 400,000 | | | | 5,500,000 | | | $ | — | | | $ | 418,385 | |
The following footnotes apply to either the individual securities noted or one or more of the securities aggregated and listed as a single line item.
| 1 | Valued under fair value procedures adopted by authority of the board of trustees. The total value of all such securities, including those in “Miscellaneous” and “Other securities,” was $1,820,903,000, which represented 1.80% of the net assets of the fund. This amount includes $1,620,838,000 related to certain securities trading outside the U.S. whose values were adjusted as a result of significant market movements following the close of local trading. |
| 2 | Security did not produce income during the last 12 months. |
| 3 | A portion of this security was pledged as collateral. The total value of pledged collateral was $336,000, which represented less than .01% of the net assets of the fund. |
| 4 | Index-linked bond whose principal amount moves with a government price index. |
| 5 | Acquired in a transaction exempt from registration under Rule 144A or Section 4(2) of the Securities Act of 1933. May be resold in the U.S. in transactions exempt from registration, normally to qualified institutional buyers. The total value of all such securities, including those in “Other securities,” was $4,040,401,000, which represented 4.00% of the net assets of the fund. |
| 6 | Coupon rate may change periodically. |
| 7 | Principal payments may be made periodically. Therefore, the effective maturity date may be earlier than the stated maturity date. |
| 8 | Purchased on a TBA basis. |
Key to abbreviations
ADR = American Depositary Receipts
TBA = To-be-announced
See Notes to Financial Statements
Financial statements
| Statement of assets and liabilities | | | | | | | | |
| at December 31, 2016 | | (dollars in thousands) | |
| | | | |
| Assets: | | | | | | | | |
| Investment securities, at value: | | | | | | | | |
| Unaffiliated issuers (cost: $79,901,983) | | $ | 100,956,086 | | | | | |
| Affiliated issuers (cost: $249,224) | | | 418,385 | | | $ | 101,374,471 | |
| Cash | | | | | | | 6,834 | |
| Receivables for: | | | | | | | | |
| Sales of investments | | | 2,073,312 | | | | | |
| Sales of fund’s shares | | | 283,911 | | | | | |
| Dividends and interest | | | 254,408 | | | | | |
| Other | | | 1,013 | | | | 2,612,644 | |
| Liabilities: | | | | | | | 103,993,949 | |
| Payables for: | | | | | | | | |
| Purchases of investments | | | 2,506,011 | | | | | |
| Repurchases of fund’s shares | | | 303,136 | | | | | |
| Investment advisory services | | | 19,342 | | | | | |
| Services provided by related parties | | | 30,380 | | | | | |
| Trustees’ deferred compensation | | | 3,761 | | | | | |
| Other | | | 1,259 | | | | 2,863,889 | |
| Net assets at December 31, 2016 | | | | | | $ | 101,130,060 | |
| | | | | | | | | |
| Net assets consist of: | | | | | | | | |
| Capital paid in on shares of beneficial interest | | | | | | $ | 79,480,578 | |
| Undistributed net investment income | | | | | | | 103,107 | |
| Undistributed net realized gain | | | | | | | 323,319 | |
| Net unrealized appreciation | | | | | | | 21,223,056 | |
| Net assets at December 31, 2016 | | | | | | $ | 101,130,060 | |
(dollars and shares in thousands, except per-share amounts)
Shares of beneficial interest issued and outstanding (no stated par value) —
unlimited shares authorized (4,080,245 total shares outstanding)
| | | | | | | | | | |
| | | Net assets | | | Shares
outstanding | | | Net asset value
per share | |
| Class A | | $ | 55,379,180 | | | | 2,232,369 | | | $ | 24.81 | |
| Class B | | | 66,106 | | | | 2,662 | | | | 24.84 | |
| Class C | | | 7,766,678 | | | | 314,908 | | | | 24.66 | |
| Class F-1 | | | 4,090,869 | | | | 165,033 | | | | 24.79 | |
| Class F-2 | | | 5,703,072 | | | | 230,034 | | | | 24.79 | |
| Class 529-A | | | 3,115,093 | | | | 125,762 | | | | 24.77 | |
| Class 529-B | | | 8,948 | | | | 359 | | | | 24.91 | |
| Class 529-C | | | 975,235 | | | | 39,399 | | | | 24.75 | |
| Class 529-E | | | 152,454 | | | | 6,158 | | | | 24.76 | |
| Class 529-F-1 | | | 134,709 | | | | 5,442 | | | | 24.75 | |
| Class R-1 | | | 154,000 | | | | 6,249 | | | | 24.64 | |
| Class R-2 | | | 1,241,189 | | | | 50,330 | | | | 24.66 | |
| Class R-2E | | | 17,219 | | | | 696 | | | | 24.74 | |
| Class R-3 | | | 3,349,006 | | | | 135,655 | | | | 24.69 | |
| Class R-4 | | | 5,930,410 | | | | 239,471 | | | | 24.76 | |
| Class R-5E | | | 1,954 | | | | 79 | | | | 24.78 | |
| Class R-5 | | | 1,985,921 | | | | 79,981 | | | | 24.83 | |
| Class R-6 | | | 11,058,017 | | | | 445,658 | | | | 24.81 | |
See Notes to Financial Statements
| Statement of operations | | | | | | | | |
| for the year ended December 31, 2016 | | (dollars in thousands) | |
| | | | |
| Investment income: | | | | | | | | |
| Income: | | | | | | | | |
| Dividends (net of non-U.S. taxes of $11,952) | | $ | 1,307,034 | | | | | |
| Interest | | | 787,866 | | | $ | 2,094,900 | |
| Fees and expenses*: | | | | | | | | |
| Investment advisory services | | | 211,108 | | | | | |
| Distribution services | | | 265,026 | | | | | |
| Transfer agent services | | | 86,494 | | | | | |
| Administrative services | | | 25,292 | | | | | |
| Reports to shareholders | | | 2,702 | | | | | |
| Registration statement and prospectus | | | 3,934 | | | | | |
| Trustees’ compensation | | | 502 | | | | | |
| Auditing and legal | | | 175 | | | | | |
| Custodian | | | 403 | | | | | |
| Other | | | 3,531 | | | | 599,167 | |
| Net investment income | | | | | | | 1,495,733 | |
| | | | | | | | | |
| Net realized gain and unrealized appreciation: | | | | | | | | |
| Net realized gain on: | | | | | | | | |
| Investments (net of non-U.S. taxes of $10; also includes $7,836 net gain from affiliates) | | | 2,498,824 | | | | | |
| Currency transactions | | | 1,303 | | | | 2,500,127 | |
| Net unrealized appreciation on: | | | | | | | | |
| Investments (net of non-U.S. taxes of $238) | | | 3,672,732 | | | | | |
| Currency translations | | | 829 | | | | 3,673,561 | |
| Net realized gain and unrealized appreciation | | | | | | | 6,173,688 | |
| | | | | | | | | |
| Net increase in net assets resulting from operations | | | | | | $ | 7,669,421 | |
| * | Additional information related to class-specific fees and expenses is included in the Notes to Financial Statements. |
Statements of changes in net assets
(dollars in thousands)
| | | Year ended December 31 | |
| | | 2016 | | | 2015 | |
| Operations: | | | | | | | | |
| Net investment income | | $ | 1,495,733 | | | $ | 1,335,042 | |
| Net realized gain | | | 2,500,127 | | | | 3,724,444 | |
| Net unrealized appreciation (depreciation) | | | 3,673,561 | | | | (3,734,153 | ) |
| Net increase in net assets resulting from operations | | | 7,669,421 | | | | 1,325,333 | |
| | | | | | | | | |
| Dividends and distributions paid to shareholders: | | | | | | | | |
| Dividends from net investment income | | | (1,636,470 | ) | | | (1,276,612 | ) |
| Distributions from net realized gain on investments | | | (2,406,499 | ) | | | (3,176,474 | ) |
| Total dividends and distributions paid to shareholders | | | (4,042,969 | ) | | | (4,453,086 | ) |
| | | | | | | | | |
| Net capital share transactions | | | 12,936,574 | | | | 8,031,108 | |
| | | | | | | | | |
| Total increase in net assets | | | 16,563,026 | | | | 4,903,355 | |
| | | | | | | | | |
| Net assets: | | | | | | | | |
| Beginning of year | | | 84,567,034 | | | | 79,663,679 | |
| End of year (including undistributed net investment income: $103,107 and $195,437, respectively) | | $ | 101,130,060 | | | $ | 84,567,034 | |
See Notes to Financial Statements
Notes to financial statements
1. Organization
American Balanced Fund (the “fund”) is registered under the Investment Company Act of 1940 as an open-end, diversified management investment company. The fund seeks conservation of capital, current income and long-term growth of capital and income.
The fund has 18 share classes consisting of five retail share classes (Classes A, B and C, as well as two F share classes, F-1 and F-2), five 529 college savings plan share classes (Classes 529-A, 529-B, 529-C, 529-E and 529-F-1) and eight retirement plan share classes (Classes R-1, R-2, R-2E, R-3, R-4, R-5E, R-5 and R-6). The 529 college savings plan share classes can be used to save for college education. The retirement plan share classes are generally offered only through eligible employer-sponsored retirement plans. The fund’s share classes are described further in the following table:
| Share class | | Initial sales charge | | Contingent deferred sales charge upon redemption | | Conversion feature | |
| Classes A and 529-A | | Up to 5.75% | | None (except 1% for certain redemptions within one year of purchase without an initial sales charge) | | None | |
| Classes B and 529-B* | | None | | Declines from 5% to 0% for redemptions within six years of purchase | | Classes B and 529-B convert to Classes A and 529-A, respectively, after eight years | |
| Class C | | None | | 1% for redemptions within one year of purchase | | Class C converts to Class F-1 after 10 years | |
| Class 529-C | | None | | 1% for redemptions within one year of purchase | | None | |
| Class 529-E | | None | | None | | None | |
| Classes F-1, F-2 and 529-F-1 | | None | | None | | None | |
| Classes R-1, R-2, R-2E, R-3, R-4, R-5E, R-5 and R-6 | | None | | None | | None | |
| * | Class B and 529-B shares of the fund are not available for purchase. |
Holders of all share classes have equal pro rata rights to the assets, dividends and liquidation proceeds of the fund. Each share class has identical voting rights, except for the exclusive right to vote on matters affecting only its class. Share classes have different fees and expenses (“class-specific fees and expenses”), primarily due to different arrangements for distribution, transfer agent and administrative services. Differences in class-specific fees and expenses will result in differences in net investment income and, therefore, the payment of different per-share dividends by each share class.
2. Significant accounting policies
The fund is an investment company that applies the accounting and reporting guidance issued in Topic 946 by the U.S. Financial Accounting Standards Board. The fund’s financial statements have been prepared to comply with U.S. generally accepted accounting principles (“U.S. GAAP”). These principles require the fund’s investment adviser to make estimates and assumptions that affect reported amounts and disclosures. Actual results could differ from those estimates. Subsequent events, if any, have been evaluated through the date of issuance in the preparation of the financial statements. The fund follows the significant accounting policies described in this section, as well as the valuation policies described in the next section on valuation.
Security transactions and related investment income — Security transactions are recorded by the fund as of the date the trades are executed with brokers. Realized gains and losses from security transactions are determined based on the specific identified cost of the securities. In the event a security is purchased with a delayed payment date, the fund will segregate liquid assets sufficient to meet its payment obligations. Dividend income is recognized on the ex-dividend date and interest income is recognized on an accrual basis. Market discounts, premiums and original issue discounts on fixed-income securities are amortized daily over the expected life of the security.
Class allocations — Income, fees and expenses (other than class-specific fees and expenses) and realized and unrealized gains and losses are allocated daily among the various share classes based on their relative net assets. Class-specific fees and expenses, such as distribution, transfer agent and administrative services, are charged directly to the respective share class.
Dividends and distributions to shareholders — Dividends and distributions to shareholders are recorded on the ex-dividend date.
Currency translation — Assets and liabilities, including investment securities, denominated in currencies other than U.S. dollars are translated into U.S. dollars at the exchange rates supplied by one or more pricing vendors on the valuation date. Purchases and sales of investment securities and income and expenses are translated into U.S. dollars at the exchange rates on the dates of such transactions. The effects of changes in exchange rates on investment securities are included with the net realized gain or loss and net unrealized appreciation or depreciation on investments in the fund’s statement of operations. The realized gain or loss and unrealized appreciation or depreciation resulting from all other transactions denominated in currencies other than U.S. dollars are disclosed separately.
3. Valuation
Capital Research and Management Company (“CRMC”), the fund’s investment adviser, values the fund’s investments at fair value as defined by U.S. GAAP. The net asset value of each share class of the fund is generally determined as of approximately 4:00 p.m. New York time each day the New York Stock Exchange is open.
Methods and inputs — The fund’s investment adviser uses the following methods and inputs to establish the fair value of the fund’s assets and liabilities. Use of particular methods and inputs may vary over time based on availability and relevance as market and economic conditions evolve.
Equity securities are generally valued at the official closing price of, or the last reported sale price on, the exchange or market on which such securities are traded, as of the close of business on the day the securities are being valued or, lacking any sales, at the last available bid price. Prices for each security are taken from the principal exchange or market on which the security trades.
Fixed-income securities, including short-term securities, are generally valued at prices obtained from one or more pricing vendors. Vendors value such securities based on one or more of the inputs described in the following table. The table provides examples of inputs that are commonly relevant for valuing particular classes of fixed-income securities in which the fund is authorized to invest. However, these classifications are not exclusive, and any of the inputs may be used to value any other class of fixed-income security.
| Fixed-income class | | Examples of standard inputs |
| All | | Benchmark yields, transactions, bids, offers, quotations from dealers and trading systems, new issues, spreads and other relationships observed in the markets among comparable securities; and proprietary pricing models such as yield measures calculated using factors such as cash flows, financial or collateral performance and other reference data (collectively referred to as “standard inputs”) |
| Corporate bonds & notes; convertible securities | | Standard inputs and underlying equity of the issuer |
| Bonds & notes of governments & government agencies | | Standard inputs and interest rate volatilities |
| Mortgage-backed; asset-backed obligations | | Standard inputs and cash flows, prepayment information, default rates, delinquency and loss assumptions, collateral characteristics, credit enhancements and specific deal information |
| Municipal securities | | Standard inputs and, for certain distressed securities, cash flows or liquidation values using a net present value calculation based on inputs that include, but are not limited to, financial statements and debt contracts |
When the fund’s investment adviser deems it appropriate to do so (such as when vendor prices are unavailable or deemed to be not representative), fixed-income securities will be valued in good faith at the mean quoted bid and ask prices that are reasonably and timely available (or bid prices, if ask prices are not available) or at prices for securities of comparable maturity, quality and type.
Securities with both fixed-income and equity characteristics, or equity securities traded principally among fixed-income dealers, are generally valued in the manner described for either equity or fixed-income securities, depending on which method is deemed most appropriate by the fund’s investment adviser.
Securities and other assets for which representative market quotations are not readily available or are considered unreliable by the fund’s investment adviser are fair valued as determined in good faith under fair valuation guidelines adopted by authority of the fund’s board of trustees as further described. The investment adviser follows fair valuation guidelines, consistent with U.S. Securities and Exchange Commission rules and guidance, to consider relevant principles and factors when making fair value determinations. The investment adviser considers relevant indications of value that are reasonably and timely available to it in determining the fair value to be assigned to a particular security, such as the type and cost of the security; contractual or legal restrictions on resale of the security; relevant financial or business developments of the issuer; actively traded similar or related securities; conversion or exchange rights on the security; related
corporate actions; significant events occurring after the close of trading in the security; and changes in overall market conditions. In addition, the closing prices of equity securities that trade in markets outside U.S. time zones may be adjusted to reflect significant events that occur after the close of local trading but before the net asset value of each share class of the fund is determined. Fair valuations and valuations of investments that are not actively trading involve judgment and may differ materially from valuations that would have been used had greater market activity occurred.
Processes and structure — The fund’s board of trustees has delegated authority to the fund’s investment adviser to make fair value determinations, subject to board oversight. The investment adviser has established a Joint Fair Valuation Committee (the “Fair Valuation Committee”) to administer, implement and oversee the fair valuation process, and to make fair value decisions. The Fair Valuation Committee regularly reviews its own fair value decisions, as well as decisions made under its standing instructions to the investment adviser’s valuation teams. The Fair Valuation Committee reviews changes in fair value measurements from period to period and may, as deemed appropriate, update the fair valuation guidelines to better reflect the results of back testing and address new or evolving issues. The Fair Valuation Committee reports any changes to the fair valuation guidelines to the board of trustees with supplemental information to support the changes. The fund’s board and audit committee also regularly review reports that describe fair value determinations and methods.
The fund’s investment adviser has also established a Fixed-Income Pricing Review Group to administer and oversee the fixed-income valuation process, including the use of fixed-income pricing vendors. This group regularly reviews pricing vendor information and market data. Pricing decisions, processes and controls over security valuation are also subject to additional internal reviews, including an annual control self-evaluation program facilitated by the investment adviser’s compliance group.
Classifications — The fund’s investment adviser classifies the fund’s assets and liabilities into three levels based on the inputs used to value the assets or liabilities. Level 1 values are based on quoted prices in active markets for identical securities. Level 2 values are based on significant observable market inputs, such as quoted prices for similar securities and quoted prices in inactive markets. Certain securities trading outside the U.S. may transfer between Level 1 and Level 2 due to valuation adjustments resulting from significant market movements following the close of local trading. Level 3 values are based on significant unobservable inputs that reflect the investment adviser’s determination of assumptions that market participants might reasonably use in valuing the securities. The valuation levels are not necessarily an indication of the risk or liquidity associated with the underlying investment. For example, U.S. government securities are reflected as Level 2 because the inputs used to determine fair value may not always be quoted prices in an active market. The following table presents the fund’s valuation levels as of December 31, 2016 (dollars in thousands):
| | | Investment securities | |
| | | Level 1 | | | Level 2* | | | Level 3 | | | Total | |
| Assets: | | | | | | | | | | | | | | | | |
| Common stocks: | | | | | | | | | | | | | | | | |
| Information technology | | $ | 10,593,535 | | | $ | 213,443 | | | $ | — | | | $ | 10,806,978 | |
| Consumer discretionary | | | 9,168,105 | | | | — | | | | — | | | | 9,168,105 | |
| Financials | | | 8,375,950 | | | | 296,560 | | | | — | | | | 8,672,510 | |
| Energy | | | 7,087,498 | | | | 559,021 | | | | — | | | | 7,646,519 | |
| Consumer staples | | | 6,175,920 | | | | — | | | | — | | | | 6,175,920 | |
| Health care | | | 6,094,061 | | | | — | | | | — | | | | 6,094,061 | |
| Industrials | | | 4,676,528 | | | | — | | | | — | | | | 4,676,528 | |
| Materials | | | 3,061,319 | | | | — | | | | — | | | | 3,061,319 | |
| Other | | | 1,417,944 | | | | — | | | | — | | | | 1,417,944 | |
| Miscellaneous | | | 3,609,156 | | | | 635,170 | | | | — | | | | 4,244,326 | |
| Preferred securities | | | — | | | | 4,745 | | | | — | | | | 4,745 | |
| Convertible stocks | | | 59,764 | | | | — | | | | — | | | | 59,764 | |
| Bonds, notes & other debt instruments: | | | | | | | | | | | | | | | | |
| U.S. Treasury bonds & notes | | | — | | | | 14,296,393 | | | | — | | | | 14,296,393 | |
| Corporate bonds & notes | | | — | | | | 11,939,580 | | | | — | | | | 11,939,580 | |
| Mortgage-backed obligations | | | — | | | | 6,308,810 | | | | — | | | | 6,308,810 | |
| Federal agency bonds & notes | | | — | | | | 644,298 | | | | — | | | | 644,298 | |
| Other bonds & notes | | | — | | | | 1,591,503 | | | | 7,153 | | | | 1,598,656 | |
| Miscellaneous | | | — | | | | 71,633 | | | | — | | | | 71,633 | |
| Short-term securities | | | — | | | | 4,486,382 | | | | — | | | | 4,486,382 | |
| Total | | $ | 60,319,780 | | | $ | 41,047,538 | | | $ | 7,153 | | | $ | 101,374,471 | |
| * | Securities with a value of $1,620,838,000, which represented 1.60% of the net assets of the fund, were classified as Level 2 due to significant market movements following the close of local trading. |
4. Risk factors
Investing in the fund may involve certain risks including, but not limited to, those described below.
Market conditions — The prices of, and the income generated by, the common stocks, bonds and other securities held by the fund may decline — sometimes rapidly or unpredictably — due to various factors, including events or conditions affecting the general economy or particular industries; overall market changes; local, regional or global political, social or economic instability; governmental or governmental agency responses to economic conditions; and currency exchange rate, interest rate and commodity price fluctuations.
Issuer risks — The prices of, and the income generated by, securities held by the fund may decline in response to various factors directly related to the issuers of such securities, including reduced demand for an issuer’s goods or services, poor management performance and strategic initiatives such as mergers, acquisitions or dispositions and the market response to any such initiatives.
Investing in growth-oriented stocks — Growth-oriented common stocks and other equity-type securities (such as preferred stocks, convertible preferred stocks and convertible bonds) may involve larger price swings and greater potential for loss than other types of investments.
Investing in income-oriented stocks — Income provided by the fund may be reduced by changes in the dividend policies of, and the capital resources available for dividend payments at, the companies in which the fund invests.
Investing in debt instruments — The prices of, and the income generated by, bonds and other debt securities held by the fund may be affected by changing interest rates and by changes in the effective maturities and credit ratings of these securities.
Rising interest rates will generally cause the prices of bonds and other debt securities to fall. Falling interest rates may cause an issuer to redeem, call or refinance a debt security before its stated maturity, which may result in the fund having to reinvest the proceeds in lower yielding securities. Longer maturity debt securities generally have greater sensitivity to changes in interest rates and may be subject to greater price fluctuations than shorter maturity debt securities.
Bonds and other debt securities are also subject to credit risk, which is the possibility that the credit strength of an issuer will weaken and/or an issuer of a debt security will fail to make timely payments of principal or interest and the security will go into default. Lower quality debt securities generally have higher rates of interest and may be subject to greater price fluctuations than higher quality debt securities. Credit risk is gauged, in part, by the credit ratings of the debt securities in which the fund invests. However, ratings are only the opinions of the rating agencies issuing them and are not guarantees as to credit quality or an evaluation of market risk. The fund’s investment adviser relies on its own credit analysts to research issuers and issues in seeking to mitigate various credit and default risks.
Investing in securities backed by the U.S. government — Securities backed by the U.S. Treasury or the full faith and credit of the U.S. government are guaranteed only as to the timely payment of interest and principal when held to maturity. Accordingly, the current market values for these securities will fluctuate with changes in interest rates. Securities issued by government-sponsored entities and federal agencies and instrumentalities that are not backed by the full faith and credit of the U.S. government are neither issued nor guaranteed by the U.S. government.
Investing in mortgage-related and other asset-backed securities — Mortgage-related securities, such as mortgage-backed securities, and other asset-backed securities, include debt obligations that represent interests in pools of mortgages or other income-bearing assets, such as consumer loans or receivables. Such securities often involve risks that are different from or more acute than the risks associated with investing in other types of debt securities. Mortgage-backed and other asset-backed securities are subject to changes in the payment patterns of borrowers of the underlying debt. When interest rates fall, borrowers are more likely to refinance or prepay their debt before its stated maturity. This may result in the fund having to reinvest the proceeds in lower yielding securities, effectively reducing the fund’s income. Conversely, if interest rates rise and borrowers repay their debt more slowly than expected, the time in which the mortgage-backed and other asset-backed securities are paid off could be extended, reducing the fund’s cash available for reinvestment in higher yielding securities.
Liquidity risk — Certain fund holdings may be deemed to be less liquid or illiquid because they cannot be readily sold without significantly impacting the value of the holdings. Liquidity risk may result from the lack of an active market for a holding, legal or contractual restrictions on resale, or the reduced number and capacity of market participants to make a market in such holding. Market prices for less liquid or illiquid holdings may be volatile, and reduced liquidity may have an adverse impact on the market price of such holdings. Additionally, the sale of less liquid or illiquid holdings may involve substantial delays (including delays in settlement) and additional costs and the fund may be unable to sell such holdings when necessary to meet its liquidity needs.
Investing outside the U.S. — Securities of issuers domiciled outside the U.S., or with significant operations or revenues outside the U.S., may lose value because of adverse political, social, economic or market developments (including social instability, regional conflicts, terrorism and war) in the countries or regions in which the issuers operate or generate revenue. These securities may also lose value due
to changes in foreign currency exchange rates against the U.S. dollar and/or currencies of other countries. Issuers of these securities may be more susceptible to actions of foreign governments, such as the imposition of price controls or punitive taxes, that could adversely impact the value of these securities. Securities markets in certain countries may be more volatile and/or less liquid than those in the U.S. Investments outside the U.S. may also be subject to different accounting practices and different regulatory, legal and reporting standards and practices, and may be more difficult to value, than those in the U.S. In addition, the value of investments outside the U.S. may be reduced by foreign taxes, including foreign withholding taxes on interest and dividends. Further, there may be increased risks of delayed settlement of securities purchased or sold by the fund. The risks of investing outside the U.S. may be heightened in connection with investments in emerging markets.
Management — The investment adviser to the fund actively manages the fund’s investments. Consequently, the fund is subject to the risk that the methods and analyses employed by the investment adviser in this process may not produce the desired results. This could cause the fund to lose value or its investment results to lag relevant benchmarks or other funds with similar objectives.
5. Certain investment techniques
Index-linked bonds — The fund has invested in index-linked bonds, which are fixed-income securities whose principal value is periodically adjusted to a government price index. Over the life of an index-linked bond, interest is paid on the adjusted principal value. Increases or decreases in the principal value of index-linked bonds are recorded as interest income in the fund’s statement of operations.
Mortgage dollar rolls — The fund has entered into mortgage dollar roll transactions in which the fund sells a mortgage-backed security to a counterparty and simultaneously enters into an agreement with the same counterparty to buy back a similar security on a specific future date at a predetermined price. Mortgage dollar rolls are accounted for as purchase and sale transactions, which may increase the fund’s portfolio turnover rate.
Collateral — The fund participates in a collateral program due to its use of future delivery contracts. The program calls for the fund to either receive or pledge collateral based on the net gain or loss on unsettled contracts by certain counterparties. The purpose of the collateral is to cover potential losses that could occur in the event that either party cannot meet its contractual obligations.
6. Taxation and distributions
Federal income taxation — The fund complies with the requirements under Subchapter M of the Internal Revenue Code applicable to mutual funds and intends to distribute substantially all of its net taxable income and net capital gains each year. The fund is not subject to income taxes to the extent such distributions are made. Therefore, no federal income tax provision is required.
As of and during the period ended December 31, 2016, the fund did not have a liability for any unrecognized tax benefits. The fund recognizes interest and penalties, if any, related to unrecognized tax benefits as income tax expense in the statement of operations. During the period, the fund did not incur any interest or penalties.
The fund is not subject to examination by U.S. federal tax authorities for tax years before 2013, by state tax authorities for tax years before 2012 and by tax authorities outside the U.S. for tax years before 2014.
Non-U.S. taxation — Dividend and interest income are recorded net of non-U.S. taxes paid. The fund may file withholding tax reclaims in certain jurisdictions to recover a portion of amounts previously withheld. As a result of rulings from European courts, the fund filed for additional reclaims related to prior years. These reclaims are recorded when the amount is known and there are no significant uncertainties on collectability. Gains realized by the fund on the sale of securities in certain countries are subject to non-U.S. taxes. The fund records an estimated deferred tax liability based on unrealized gains to provide for potential non-U.S. taxes payable upon the sale of these securities.
Distributions — Distributions paid to shareholders are based on net investment income and net realized gains determined on a tax basis, which may differ from net investment income and net realized gains for financial reporting purposes. These differences are due primarily to different treatment for items such as currency gains and losses; short-term capital gains and losses; capital losses related to sales of certain securities within 30 days of purchase and paydowns on fixed-income securities. The fiscal year in which amounts are distributed may differ from the year in which the net investment income and net realized gains are recorded by the fund for financial reporting purposes. The fund may also designate a portion of the amount paid to redeeming shareholders as a distribution for tax purposes.
During the year ended December 31, 2016, the fund reclassified $98,000 from undistributed net investment income to capital paid in on shares of beneficial interest, $48,505,000 from undistributed net realized gain to undistributed net investment income and $194,454,000 from undistributed net realized gain to capital paid in on shares of beneficial interest to align financial reporting with tax reporting.
As of December 31, 2016, the tax basis components of distributable earnings, unrealized appreciation (depreciation) and cost of investment securities were as follows (dollars in thousands):
| Undistributed ordinary income | | $ | 105,397 | |
| Undistributed long-term capital gains | | | 421,244 | |
| Gross unrealized appreciation on investment securities | | | 22,354,312 | |
| Gross unrealized depreciation on investment securities | | | (1,228,519 | ) |
| Net unrealized appreciation on investment securities | | | 21,125,793 | |
| Cost of investment securities | | | 80,248,678 | |
The tax character of distributions paid or accrued to shareholders was as follows (dollars in thousands):
| | | Year ended December 31, 2016 | | | Year ended December 31, 2015 | |
| Share class | | Ordinary
income | | | Long-term
capital gains | | | Total
dividends and
distributions paid | | | Ordinary
income | | | Long-term
capital gains | | | Total
dividends and
distributions
paid | |
| Class A | | $ | 946,069 | | | $ | 1,330,543 | | | $ | 2,276,612 | | | $ | 780,804 | | | $ | 1,850,230 | | | $ | 2,631,034 | |
| Class B | | | 1,060 | | | | 2,173 | | | | 3,233 | | | | 2,887 | | | | 11,278 | | | | 14,165 | |
| Class C | | | 73,871 | | | | 185,174 | | | | 259,045 | | | | 49,142 | | | | 230,739 | | | | 279,881 | |
| Class F-1 | | | 65,724 | | | | 97,542 | | | | 163,266 | | | | 49,755 | | | | 125,871 | | | | 175,626 | |
| Class F-2 | | | 84,464 | | | | 123,561 | | | | 208,025 | | | | 40,892 | | | | 94,983 | | | | 135,875 | |
| Class 529-A | | | 51,256 | | | | 75,290 | | | | 126,546 | | | | 43,528 | | | | 108,092 | | | | 151,620 | |
| Class 529-B | | | 128 | | | | 310 | | | | 438 | | | | 334 | | | | 1,564 | | | | 1,898 | |
| Class 529-C | | | 8,983 | | | | 23,696 | | | | 32,679 | | | | 6,846 | | | | 34,327 | | | | 41,173 | |
| Class 529-E | | | 2,177 | | | | 3,698 | | | | 5,875 | | | | 1,830 | | | | 5,378 | | | | 7,208 | |
| Class 529-F-1 | | | 2,450 | | | | 3,211 | | | | 5,661 | | | | 2,010 | | | | 4,397 | | | | 6,407 | |
| Class R-1 | | | 1,565 | | | | 3,783 | | | | 5,348 | | | | 1,296 | | | | 5,762 | | | | 7,058 | |
| Class R-2 | | | 12,602 | | | | 30,477 | | | | 43,079 | | | | 11,109 | | | | 46,871 | | | | 57,980 | |
| Class R-2E | | | 144 | | | | 351 | | | | 495 | | | | 10 | | | | 81 | | | | 91 | |
| Class R-3 | | | 47,533 | | | | 81,888 | | | | 129,421 | | | | 41,432 | | | | 121,458 | | | | 162,890 | |
| Class R-4 | | | 88,272 | | | | 137,789 | | | | 226,061 | | | | 71,022 | | | | 169,504 | | | | 240,526 | |
| Class R-5E* | | | 12 | | | | 35 | | | | 47 | | | | — | † | | | — | † | | | — | † |
| Class R-5 | | | 51,662 | | | | 53,855 | | | | 105,517 | | | | 48,877 | | | | 98,335 | | | | 147,212 | |
| Class R-6 | | | 198,498 | | | | 253,123 | | | | 451,621 | | | | 124,838 | | | | 267,604 | | | | 392,442 | |
| Total | | $ | 1,636,470 | | | $ | 2,406,499 | | | $ | 4,042,969 | | | $ | 1,276,612 | | | $ | 3,176,474 | | | $ | 4,453,086 | |
| * | Class R-5E shares were offered beginning November 20, 2015. |
| † | Amount less than one thousand. |
7. Fees and transactions with related parties
CRMC, the fund’s investment adviser, is the parent company of American Funds Distributors,® Inc. (“AFD”), the principal underwriter of the fund’s shares, and American Funds Service Company® (“AFS”), the fund’s transfer agent. CRMC, AFD and AFS are considered related parties to the fund.
Investment advisory services — The fund has an investment advisory and service agreement with CRMC that provides for monthly fees accrued daily. These fees are based on a series of decreasing annual rates beginning with 0.420% on the first $500 million of daily net assets and decreasing to 0.207% on such assets in excess of $89 billion. For the year ended December 31, 2016, the investment advisory services fee was $211,108,000, which was equivalent to an annualized rate of 0.228% of average daily net assets.
Class-specific fees and expenses — Expenses that are specific to individual share classes are accrued directly to the respective share class. The principal class-specific fees and expenses are further described below:
Distribution services — The fund has plans of distribution for all share classes, except Class F-2, R-5E, R-5 and R-6 shares. Under the plans, the board of trustees approves certain categories of expenses that are used to finance activities primarily intended to sell fund shares and service existing accounts. The plans provide for payments, based on an annualized percentage of average daily net assets, ranging from 0.25% to 1.00% as noted in this section. In some cases, the board of trustees has limited the amounts that may be paid to less than the maximum allowed by the plans. All share classes with a plan may use up to 0.25% of average daily net assets
to pay service fees, or to compensate AFD for paying service fees, to firms that have entered into agreements with AFD to provide certain shareholder services. The remaining amounts available to be paid under each plan are paid to dealers to compensate them for their sales activities.
For Class A and 529-A shares, distribution-related expenses include the reimbursement of dealer and wholesaler commissions paid by AFD for certain shares sold without a sales charge. These share classes reimburse AFD for amounts billed within the prior 15 months but only to the extent that the overall annual expense limit of 0.25% is not exceeded. As of December 31, 2016, there were no unreimbursed expenses subject to reimbursement for Class A or 529-A shares.
| Share class | | Currently approved limits | | Plan limits |
| Class A | | | 0.25 | % | | | 0.25 | % |
| Class 529-A | | | 0.25 | | | | 0.50 | |
| Classes B and 529-B | | | 1.00 | | | | 1.00 | |
| Classes C, 529-C and R-1 | | | 1.00 | | | | 1.00 | |
| Class R-2 | | | 0.75 | | | | 1.00 | |
| Class R-2E | | | 0.60 | | | | 0.85 | |
| Classes 529-E and R-3 | | | 0.50 | | | | 0.75 | |
| Classes F-1, 529-F-1 and R-4 | | | 0.25 | | | | 0.50 | |
Transfer agent services — The fund has a shareholder services agreement with AFS under which the fund compensates AFS for providing transfer agent services to each of the fund’s share classes. These services include recordkeeping, shareholder communications and transaction processing. In addition, the fund reimburses AFS for amounts paid to third parties for performing transfer agent services on behalf of fund shareholders.
Administrative services — The fund has an administrative services agreement with CRMC under which the fund compensates CRMC for providing administrative services to Class A, C, F, 529 and R shares. These services include, but are not limited to, coordinating, monitoring, assisting and overseeing third parties that provide services to fund shareholders. Under the agreement, Class A shares pay an annual fee of 0.01% and Class C, F, 529 and R shares pay an annual fee of 0.05% of their respective average daily net assets.
529 plan services — Each 529 share class is subject to service fees to compensate the Virginia College Savings Plan (“Virginia529”) for its oversight and administration of the 529 college savings plan. From January 1, 2016 to June 30, 2016, the quarterly fee was based on a series of decreasing annual rates beginning with 0.10% on the first $30 billion of the net assets invested in Class 529 shares of the American Funds and decreasing to 0.05% on such assets in excess of $70 billion. Effective July 1, 2016, the quarterly fee was amended to annual rates of 0.10% on the first $20 billion of the net assets invested in the Class 529 shares of the American Funds, 0.05% on such assets between $20 billion and $100 billion, and 0.03% on such assets over $100 billion. The fee for any given calendar quarter is accrued and calculated on the basis of the average net assets of Class 529 shares of the American Funds for the last month of the prior calendar quarter. The fee is included in other expenses in the fund’s statement of operations. Virginia529 is not considered a related party to the fund.
For the year ended December 31, 2016, class-specific expenses under the agreements were as follows (dollars in thousands):
| Share class | | | Distribution
services | | | Transfer agent
services | | | Administrative
services | | | 529 plan
services | |
| Class A | | | | $128,037 | | | | $52,238 | | | | $5,239 | | | | Not applicable | |
| Class B | | | | 1,588 | | | | 186 | | | | Not applicable | | | | Not applicable | |
| Class C | | | | 70,091 | | | | 6,693 | | | | 3,512 | | | | Not applicable | |
| Class F-1 | | | | 9,282 | | | | 4,733 | | | | 1,866 | | | | Not applicable | |
| Class F-2 | | | | Not applicable | | | | 4,002 | | | | 1,940 | | | | Not applicable | |
| Class 529-A | | | | 6,801 | | | | 2,334 | | | | 1,491 | | | | $2,347 | |
| Class 529-B | | | | 228 | | | | 26 | | | | 12 | | | | 19 | |
| Class 529-C | | | | 9,330 | | | | 772 | | | | 471 | | | | 741 | |
| Class 529-E | | | | 728 | | | | 71 | | | | 73 | | | | 115 | |
| Class 529-F-1 | | | | — | | | | 96 | | | | 62 | | | | 98 | |
| Class R-1 | | | | 1,516 | | | | 147 | | | | 76 | | | | Not applicable | |
| Class R-2 | | | | 9,132 | | | | 4,115 | | | | 614 | | | | Not applicable | |
| Class R-2E | | | | 60 | | | | 19 | | | | 5 | | | | Not applicable | |
| Class R-3 | | | | 16,196 | | | | 4,830 | | | | 1,623 | | | | Not applicable | |
| Class R-4 | | | | 12,037 | | | | 4,806 | | | | 2,412 | | | | Not applicable | |
| Class R-5E | | | | Not applicable | | | | 1 | | | | — | * | | | Not applicable | |
| Class R-5 | | | | Not applicable | | | | 1,334 | | | | 1,328 | | | | Not applicable | |
| Class R-6 | | | | Not applicable | | | | 91 | | | | 4,568 | | | | Not applicable | |
| Total class-specific expenses | | | | $265,026 | | | | $86,494 | | | | $25,292 | | | | $3,320 | |
| * | Amount less than one thousand. |
Trustees’ deferred compensation — Trustees who are unaffiliated with CRMC may elect to defer the cash payment of part or all of their compensation. These deferred amounts, which remain as liabilities of the fund, are treated as if invested in shares of the fund or other American Funds. These amounts represent general, unsecured liabilities of the fund and vary according to the total returns of the selected funds. Trustees’ compensation of $502,000 in the fund’s statement of operations reflects $336,000 in current fees (either paid in cash or deferred) and a net increase of $166,000 in the value of the deferred amounts.
Affiliated officers and trustees — Officers and certain trustees of the fund are or may be considered to be affiliated with CRMC, AFD and AFS. No affiliated officers or trustees received any compensation directly from the fund.
Security transactions with related funds — The fund may purchase from, or sell securities to, other CRMC-managed funds (or funds managed by certain affiliates of CRMC) under procedures adopted by the fund’s board of trustees. The funds involved in such transactions are considered related by virtue of having a common investment adviser (or affiliated investment advisers), common trustees and/or common officers. When such transactions occur, each transaction is executed at the current market price of the security and no brokerage commissions or fees are paid in accordance with Rule 17a-7 of the 1940 Act.
8. Capital share transactions
Capital share transactions in the fund were as follows (dollars and shares in thousands):
| | | Sales1 | | | Reinvestments of
dividends and distributions | | | Repurchases1 | | | Net increase
(decrease) |
| Share class | | Amount | | | Shares | | | Amount | | | Shares | | | Amount | | | Shares | | | Amount | | | Shares | |
| | | | | | | | | | | | | | | | | | | | | | | | | | |
| Year ended December 31, 2016 | | | | | | | | | | | | | | | | | | | | | | | | | |
| | | | | | | | | | | | | | | | | | | | | | | | | | | | | | | | | |
| Class A | | $ | 8,757,067 | | | | 358,896 | | | $ | 2,241,249 | | | | 90,845 | | | $ | (6,915,731 | ) | | | (282,347 | ) | | $ | 4,082,585 | | | | 167,394 | |
| Class B | | | 3,973 | | | | 165 | | | | 3,205 | | | | 131 | | | | (227,367 | ) | | | (9,369 | ) | | | (220,189 | ) | | | (9,073 | ) |
| Class C | | | 2,486,671 | | | | 102,574 | | | | 254,951 | | | | 10,367 | | | | (1,420,028 | ) | | | (58,455 | ) | | | 1,321,594 | | | | 54,486 | |
| Class F-1 | | | 1,165,494 | | | | 47,762 | | | | 159,358 | | | | 6,461 | | | | (748,608 | ) | | | (30,572 | ) | | | 576,244 | | | | 23,651 | |
| Class F-2 | | | 3,674,683 | | | | 149,338 | | | | 200,023 | | | | 8,093 | | | | (933,696 | ) | | | (37,986 | ) | | | 2,941,010 | | | | 119,445 | |
| Class 529-A | | | 445,581 | | | | 18,265 | | | | 126,517 | | | | 5,135 | | | | (437,560 | ) | | | (17,862 | ) | | | 134,538 | | | | 5,538 | |
| Class 529-B | | | 1,175 | | | | 48 | | | | 438 | | | | 18 | | | | (32,554 | ) | | | (1,334 | ) | | | (30,941 | ) | | | (1,268 | ) |
| Class 529-C | | | 159,261 | | | | 6,543 | | | | 32,671 | | | | 1,324 | | | | (159,507 | ) | | | (6,520 | ) | | | 32,425 | | | | 1,347 | |
| Class 529-E | | | 21,281 | | | | 871 | | | | 5,874 | | | | 239 | | | | (22,370 | ) | | | (912 | ) | | | 4,785 | | | | 198 | |
| Class 529-F-1 | | | 31,861 | | | | 1,304 | | | | 5,661 | | | | 230 | | | | (24,230 | ) | | | (994 | ) | | | 13,292 | | | | 540 | |
| Class R-1 | | | 44,753 | | | | 1,839 | | | | 5,334 | | | | 217 | | | | (53,075 | ) | | | (2,181 | ) | | | (2,988 | ) | | | (125 | ) |
| Class R-2 | | | 310,155 | | | | 12,804 | | | | 43,048 | | | | 1,752 | | | | (380,485 | ) | | | (15,689 | ) | | | (27,282 | ) | | | (1,133 | ) |
| Class R-2E | | | 31,089 | | | | 1,260 | | | | 495 | | | | 20 | | | | (17,216 | ) | | | (692 | ) | | | 14,368 | | | | 588 | |
| Class R-3 | | | 829,309 | | | | 34,115 | | | | 129,283 | | | | 5,261 | | | | (906,300 | ) | | | (37,327 | ) | | | 52,292 | | | | 2,049 | |
| Class R-4 | | | 2,172,314 | | | | 89,073 | | | | 226,051 | | | | 9,164 | | | | (1,093,915 | ) | | | (44,985 | ) | | | 1,304,450 | | | | 53,252 | |
| Class R-5E | | | 1,928 | | | | 78 | | | | 47 | | | | 2 | | | | (35 | ) | | | (1 | ) | | | 1,940 | | | | 79 | |
| Class R-5 | | | 719,201 | | | | 29,524 | | | | 105,457 | | | | 4,285 | | | | (1,509,585 | ) | | | (61,629 | ) | | | (684,927 | ) | | | (27,820 | ) |
| Class R-6 | | | 4,239,152 | | | | 173,253 | | | | 451,558 | | | | 18,289 | | | | (1,267,332 | ) | | | (51,684 | ) | | | 3,423,378 | | | | 139,858 | |
| Total net increase (decrease) | | $ | 25,094,948 | | | | 1,027,712 | | | $ | 3,991,220 | | | | 161,833 | | | $ | (16,149,594 | ) | | | (660,539 | ) | | $ | 12,936,574 | | | | 529,006 | |
| | | | | | | | | | | | | | | | | | | | | | | | | | | | | | | | | |
| Year ended December 31, 2015 | | | | | | | | | | | | | | | | | | | | | | | | | |
| | | | | | | | | | | | | | | | | | | | | | | | | | | | | | | | | |
| Class A | | $ | 7,043,352 | | | | 285,127 | | | $ | 2,591,527 | | | | 108,336 | | | $ | (5,519,559 | ) | | | (223,746 | ) | | $ | 4,115,320 | | | | 169,717 | |
| Class B | | | 6,906 | | | | 280 | | | | 14,048 | | | | 587 | | | | (273,144 | ) | | | (11,047 | ) | | | (252,190 | ) | | | (10,180 | ) |
| Class C | | | 1,825,914 | | | | 74,298 | | | | 275,693 | | | | 11,615 | | | | (1,272,632 | ) | | | (51,788 | ) | | | 828,975 | | | | 34,125 | |
| Class F-1 | | | 992,383 | | | | 40,137 | | | | 171,126 | | | | 7,161 | | | | (511,293 | ) | | | (20,753 | ) | | | 652,216 | | | | 26,545 | |
| Class F-2 | | | 1,189,017 | | | | 48,224 | | | | 130,153 | | | | 5,448 | | | | (458,772 | ) | | | (18,638 | ) | | | 860,398 | | | | 35,034 | |
| Class 529-A | | | 359,270 | | | | 14,560 | | | | 151,586 | | | | 6,345 | | | | (374,996 | ) | | | (15,207 | ) | | | 135,860 | | | | 5,698 | |
| Class 529-B | | | 2,004 | | | | 81 | | | | 1,898 | | | | 79 | | | | (36,444 | ) | | | (1,472 | ) | | | (32,542 | ) | | | (1,312 | ) |
| Class 529-C | | | 135,252 | | | | 5,487 | | | | 41,160 | | | | 1,728 | | | | (142,426 | ) | | | (5,785 | ) | | | 33,986 | | | | 1,430 | |
| Class 529-E | | | 17,938 | | | | 727 | | | | 7,205 | | | | 302 | | | | (22,337 | ) | | | (908 | ) | | | 2,806 | | | | 121 | |
| Class 529-F-1 | | | 23,632 | | | | 957 | | | | 6,406 | | | | 268 | | | | (20,026 | ) | | | (812 | ) | | | 10,012 | | | | 413 | |
| Class R-1 | | | 37,207 | | | | 1,513 | | | | 7,024 | | | | 296 | | | | (45,485 | ) | | | (1,852 | ) | | | (1,254 | ) | | | (43 | ) |
| Class R-2 | | | 284,265 | | | | 11,573 | | | | 57,906 | | | | 2,438 | | | | (384,208 | ) | | | (15,663 | ) | | | (42,037 | ) | | | (1,652 | ) |
| Class R-2E | | | 2,576 | | | | 104 | | | | 91 | | | | 4 | | | | (4 | ) | | | — | 2 | | | 2,663 | | | | 108 | |
| Class R-3 | | | 744,649 | | | | 30,283 | | | | 162,704 | | | | 6,834 | | | | (934,158 | ) | | | (38,030 | ) | | | (26,805 | ) | | | (913 | ) |
| Class R-4 | | | 977,391 | | | | 39,555 | | | | 240,507 | | | | 10,065 | | | | (1,002,730 | ) | | | (40,800 | ) | | | 215,168 | | | | 8,820 | |
| Class R-5E3 | | | 10 | | | | — | 2 | | | — | | | | — | | | | — | | | | — | | | | 10 | | | | — | 2 |
| Class R-5 | | | 512,901 | | | | 20,723 | | | | 147,202 | | | | 6,142 | | | | (607,400 | ) | | | (24,674 | ) | | | 52,703 | | | | 2,191 | |
| Class R-6 | | | 2,504,254 | | | | 101,426 | | | | 392,442 | | | | 16,404 | | | | (1,420,877 | ) | | | (57,415 | ) | | | 1,475,819 | | | | 60,415 | |
| Total net increase (decrease) | | $ | 16,658,921 | | | | 675,055 | | | $ | 4,398,678 | | | | 184,052 | | | $ | (13,026,491 | ) | | | (528,590 | ) | | $ | 8,031,108 | | | | 330,517 | |
| 1 | Includes exchanges between share classes of the fund. |
| 2 | Amount less than one thousand. |
| 3 | Class R-5E shares were offered beginning November 20, 2015. |
9. Investment transactions
The fund made purchases and sales of investment securities, excluding short-term securities and U.S. government obligations, if any, of $57,355,132,000 and $50,605,271,000, respectively, during the year ended December 31, 2016.
Financial highlights
| | | | | | Income (loss) from
investment operations1 | | | Dividends and distributions | | | | | | | | | | | | | | | | | | | | | |
| | | Net asset
value,
beginning
of period | | | Net
investment
income | | | Net gains
(losses) on
securities (both
realized and
unrealized) | | | Total from
investment
operations | | | Dividends
(from net
investment
income) | | | Distributions
(from capital
gains) | | | Total
dividends
and
distributions | | | Net asset
value,
end
of period | | | Total
return2 | | | Net assets,
end of period
(in millions) | | | Ratio of
expenses to
average
net assets | | | Ratio of
net income
to average
net assets | |
| Class A: | | | | | | | | | | | | | | | | | | | | | | | | | | | | | | | | | | | | | | | | | | | | | | | | |
| Year ended 12/31/2016 | | $ | 23.83 | | | $ | .41 | | | $ | 1.62 | | | $ | 2.03 | | | $ | (.44 | ) | | $ | (.61 | ) | | $ | (1.05 | ) | | $ | 24.81 | | | | 8.62 | % | | $ | 55,379 | | | | .59 | % | | | 1.67 | % |
| Year ended 12/31/2015 | | | 24.75 | | | | .42 | | | | — | 3 | | | .42 | | | | (.40 | ) | | | (.94 | ) | | | (1.34 | ) | | | 23.83 | | | | 1.72 | | | | 49,215 | | | | .58 | | | | 1.69 | |
| Year ended 12/31/2014 | | | 24.42 | | | | .41 | | | | 1.75 | | | | 2.16 | | | | (.39 | ) | | | (1.44 | ) | | | (1.83 | ) | | | 24.75 | | | | 8.85 | | | | 46,917 | | | | .59 | | | | 1.62 | |
| Year ended 12/31/2013 | | | 20.40 | | | | .36 | | | | 4.04 | | | | 4.40 | | | | (.38 | ) | | | — | | | | (.38 | ) | | | 24.42 | | | | 21.73 | | | | 42,735 | | | | .61 | | | | 1.62 | |
| Year ended 12/31/2012 | | | 18.21 | | | | .38 | | | | 2.19 | | | | 2.57 | | | | (.38 | ) | | | — | | | | (.38 | ) | | | 20.40 | | | | 14.19 | | | | 34,272 | | | | .63 | | | | 1.94 | |
| Class B: | | | | | | | | | | | | | | | | | | | | | | | | | | | | | | | | | | | | | | | | | | | | | | | | |
| Year ended 12/31/2016 | | | 23.81 | | | | .21 | | | | 1.63 | | | | 1.84 | | | | (.20 | ) | | | (.61 | ) | | | (.81 | ) | | | 24.84 | | | | 7.78 | | | | 66 | | | | 1.35 | | | | .89 | |
| Year ended 12/31/2015 | | | 24.71 | | | | .23 | | | | — | 3 | | | .23 | | | | (.19 | ) | | | (.94 | ) | | | (1.13 | ) | | | 23.81 | | | | .96 | | | | 279 | | | | 1.33 | | | | .93 | |
| Year ended 12/31/2014 | | | 24.37 | | | | .22 | | | | 1.74 | | | | 1.96 | | | | (.18 | ) | | | (1.44 | ) | | | (1.62 | ) | | | 24.71 | | | | 8.05 | | | | 541 | | | | 1.34 | | | | .87 | |
| Year ended 12/31/2013 | | | 20.35 | | | | .19 | | | | 4.03 | | | | 4.22 | | | | (.20 | ) | | | — | | | | (.20 | ) | | | 24.37 | | | | 20.81 | | | | 821 | | | | 1.36 | | | | .86 | |
| Year ended 12/31/2012 | | | 18.16 | | | | .23 | | | | 2.19 | | | | 2.42 | | | | (.23 | ) | | | — | | | | (.23 | ) | | | 20.35 | | | | 13.35 | | | | 1,123 | | | | 1.38 | | | | 1.17 | |
| Class C: | | | | | | | | | | | | | | | | | | | | | | | | | | | | | | | | | | | | | | | | | | | | | | | | |
| Year ended 12/31/2016 | | | 23.71 | | | | .21 | | | | 1.60 | | | | 1.81 | | | | (.25 | ) | | | (.61 | ) | | | (.86 | ) | | | 24.66 | | | | 7.70 | | | | 7,767 | | | | 1.38 | | | | .88 | |
| Year ended 12/31/2015 | | | 24.63 | | | | .22 | | | | .01 | | | | .23 | | | | (.21 | ) | | | (.94 | ) | | | (1.15 | ) | | | 23.71 | | | | .93 | | | | 6,173 | | | | 1.38 | | | | .90 | |
| Year ended 12/31/2014 | | | 24.30 | | | | .21 | | | | 1.75 | | | | 1.96 | | | | (.19 | ) | | | (1.44 | ) | | | (1.63 | ) | | | 24.63 | | | | 8.03 | | | | 5,574 | | | | 1.39 | | | | .83 | |
| Year ended 12/31/2013 | | | 20.31 | | | | .19 | | | | 4.00 | | | | 4.19 | | | | (.20 | ) | | | — | | | | (.20 | ) | | | 24.30 | | | | 20.72 | | | | 5,247 | | | | 1.41 | | | | .83 | |
| Year ended 12/31/2012 | | | 18.13 | | | | .22 | | | | 2.18 | | | | 2.40 | | | | (.22 | ) | | | — | | | | (.22 | ) | | | 20.31 | | | | 13.30 | | | | 4,334 | | | | 1.42 | | | | 1.14 | |
| Class F-1: | | | | | | | | | | | | | | | | | | | | | | | | | | | | | | | | | | | | | | | | | | | | | | | | |
| Year ended 12/31/2016 | | | 23.82 | | | | .39 | | | | 1.61 | | | | 2.00 | | | | (.42 | ) | | | (.61 | ) | | | (1.03 | ) | | | 24.79 | | | | 8.50 | | | | 4,091 | | | | .66 | | | | 1.60 | |
| Year ended 12/31/2015 | | | 24.74 | | | | .40 | | | | .01 | | | | .41 | | | | (.39 | ) | | | (.94 | ) | | | (1.33 | ) | | | 23.82 | | | | 1.67 | | | | 3,367 | | | | .65 | | | | 1.63 | |
| Year ended 12/31/2014 | | | 24.41 | | | | .39 | | | | 1.75 | | | | 2.14 | | | | (.37 | ) | | | (1.44 | ) | | | (1.81 | ) | | | 24.74 | | | | 8.80 | | | | 2,841 | | | | .65 | | | | 1.57 | |
| Year ended 12/31/2013 | | | 20.39 | | | | .36 | | | | 4.03 | | | | 4.39 | | | | (.37 | ) | | | — | | | | (.37 | ) | | | 24.41 | | | | 21.70 | | | | 2,471 | | | | .66 | | | | 1.58 | |
| Year ended 12/31/2012 | | | 18.21 | | | | .38 | | | | 2.18 | | | | 2.56 | | | | (.38 | ) | | | — | | | | (.38 | ) | | | 20.39 | | | | 14.13 | | | | 1,500 | | | | .64 | | | | 1.94 | |
| Class F-2: | | | | | | | | | | | | | | | | | | | | | | | | | | | | | | | | | | | | | | | | | | | | | | | | |
| Year ended 12/31/2016 | | | 23.82 | | | | .46 | | | | 1.61 | | | | 2.07 | | | | (.49 | ) | | | (.61 | ) | | | (1.10 | ) | | | 24.79 | | | | 8.80 | | | | 5,703 | | | | .39 | | | | 1.88 | |
| Year ended 12/31/2015 | | | 24.74 | | | | .47 | | | | — | 3 | | | .47 | | | | (.45 | ) | | | (.94 | ) | | | (1.39 | ) | | | 23.82 | | | | 1.92 | | | | 2,634 | | | | .39 | | | | 1.89 | |
| Year ended 12/31/2014 | | | 24.41 | | | | .46 | | | | 1.75 | | | | 2.21 | | | | (.44 | ) | | | (1.44 | ) | | | (1.88 | ) | | | 24.74 | | | | 9.08 | | | | 1,869 | | | | .39 | | | | 1.83 | |
| Year ended 12/31/2013 | | | 20.39 | | | | .41 | | | | 4.04 | | | | 4.45 | | | | (.43 | ) | | | — | | | | (.43 | ) | | | 24.41 | | | | 21.99 | | | | 768 | | | | .41 | | | | 1.83 | |
| Year ended 12/31/2012 | | | 18.21 | | | | .43 | | | | 2.18 | | | | 2.61 | | | | (.43 | ) | | | — | | | | (.43 | ) | | | 20.39 | | | | 14.40 | | | | 419 | | | | .40 | | | | 2.18 | |
| Class 529-A: | | | | | | | | | | | | | | | | | | | | | | | | | | | | | | | | | | | | | | | | | | | | | | | | |
| Year ended 12/31/2016 | | | 23.80 | | | | .39 | | | | 1.61 | | | | 2.00 | | | | (.42 | ) | | | (.61 | ) | | | (1.03 | ) | | | 24.77 | | | | 8.50 | | | | 3,115 | | | | .67 | | | | 1.59 | |
| Year ended 12/31/2015 | | | 24.72 | | | | .39 | | | | .01 | | | | .40 | | | | (.38 | ) | | | (.94 | ) | | | (1.32 | ) | | | 23.80 | | | | 1.63 | | | | 2,861 | | | | .68 | | | | 1.60 | |
| Year ended 12/31/2014 | | | 24.39 | | | | .38 | | | | 1.75 | | | | 2.13 | | | | (.36 | ) | | | (1.44 | ) | | | (1.80 | ) | | | 24.72 | | | | 8.76 | | | | 2,831 | | | | .68 | | | | 1.53 | |
| Year ended 12/31/2013 | | | 20.38 | | | | .34 | | | | 4.03 | | | | 4.37 | | | | (.36 | ) | | | — | | | | (.36 | ) | | | 24.39 | | | | 21.60 | | | | 2,599 | | | | .70 | | | | 1.53 | |
| Year ended 12/31/2012 | | | 18.19 | | | | .36 | | | | 2.19 | | | | 2.55 | | | | (.36 | ) | | | — | | | | (.36 | ) | | | 20.38 | | | | 14.12 | | | | 2,101 | | | | .71 | | | | 1.86 | |
| Class 529-B: | | | | | | | | | | | | | | | | | | | | | | | | | | | | | | | | | | | | | | | | | | | | | | | | |
| Year ended 12/31/2016 | | | 23.87 | | | | .19 | | | | 1.62 | | | | 1.81 | | | | (.16 | ) | | | (.61 | ) | | | (.77 | ) | | | 24.91 | | | | 7.64 | | | | 9 | | | | 1.46 | | | | .78 | |
| Year ended 12/31/2015 | | | 24.76 | | | | .20 | | | | .01 | | | | .21 | | | | (.16 | ) | | | (.94 | ) | | | (1.10 | ) | | | 23.87 | | | | .86 | | | | 39 | | | | 1.46 | | | | .81 | |
| Year ended 12/31/2014 | | | 24.41 | | | | .19 | | | | 1.75 | | | | 1.94 | | | | (.15 | ) | | | (1.44 | ) | | | (1.59 | ) | | | 24.76 | | | | 7.94 | | | | 73 | | | | 1.46 | | | | .75 | |
| Year ended 12/31/2013 | | | 20.39 | | | | .17 | | | | 4.02 | | | | 4.19 | | | | (.17 | ) | | | — | | | | (.17 | ) | | | 24.41 | | | | 20.63 | | | | 108 | | | | 1.49 | | | | .74 | |
| Year ended 12/31/2012 | | | 18.19 | | | | .21 | | | | 2.19 | | | | 2.40 | | | | (.20 | ) | | | — | | | | (.20 | ) | | | 20.39 | | | | 13.24 | | | | 134 | | | | 1.50 | | | | 1.05 | |
See page 29 for footnotes.
Financial highlights (continued)
| | | | | | Income (loss) from
investment operations1 | | | Dividends and distributions | | | | | | | | | | | | | | | | | | | | | |
| | | Net asset
value,
beginning
of period | | | Net
investment
income | | | Net gains
(losses) on
securities (both
realized and
unrealized) | | | Total from
investment
operations | | | Dividends
(from net
investment
income) | | | Distributions
(from capital
gains) | | | Total
dividends
and
distributions | | | Net asset
value,
end
of period | | | Total
return2 | | | Net assets,
end of period
(in millions) | | | Ratio of
expenses to
average
net assets | | | Ratio of
net income
to average
net assets | |
| Class 529-C: | | | | | | | | | | | | | | | | | | | | | | | | | | | | | | | | | | | | | | | | | | | | | | | | |
| Year ended 12/31/2016 | | $ | 23.79 | | | $ | .20 | | | $ | 1.60 | | | $ | 1.80 | | | $ | (.23 | ) | | $ | (.61 | ) | | $ | (.84 | ) | | $ | 24.75 | | | | 7.63 | % | | $ | 975 | | | | 1.44 | % | | | .82 | % |
| Year ended 12/31/2015 | | | 24.70 | | | | .20 | | | | .02 | | | | .22 | | | | (.19 | ) | | | (.94 | ) | | | (1.13 | ) | | | 23.79 | | | | .88 | | | | 905 | | | | 1.45 | | | | .83 | |
| Year ended 12/31/2014 | | | 24.38 | | | | .19 | | | | 1.74 | | | | 1.93 | | | | (.17 | ) | | | (1.44 | ) | | | (1.61 | ) | | | 24.70 | | | | 7.90 | | | | 905 | | | | 1.46 | | | | .76 | |
| Year ended 12/31/2013 | | | 20.37 | | | | .17 | | | | 4.03 | | | | 4.20 | | | | (.19 | ) | | | — | | | | (.19 | ) | | | 24.38 | | | | 20.68 | | | | 841 | | | | 1.48 | | | | .76 | |
| Year ended 12/31/2012 | | | 18.19 | | | | .21 | | | | 2.18 | | | | 2.39 | | | | (.21 | ) | | | — | | | | (.21 | ) | | | 20.37 | | | | 13.19 | | | | 694 | | | | 1.49 | | | | 1.08 | |
| Class 529-E: | | | | | | | | | | | | | | | | | | | | | | | | | | | | | | | | | | | | | | | | | | | | | | | | |
| Year ended 12/31/2016 | | | 23.79 | | | | .33 | | | | 1.61 | | | | 1.94 | | | | (.36 | ) | | | (.61 | ) | | | (.97 | ) | | | 24.76 | | | | 8.24 | | | | 153 | | | | .91 | | | | 1.35 | |
| Year ended 12/31/2015 | | | 24.71 | | | | .33 | | | | .01 | | | | .34 | | | | (.32 | ) | | | (.94 | ) | | | (1.26 | ) | | | 23.79 | | | | 1.38 | | | | 142 | | | | .92 | | | | 1.36 | |
| Year ended 12/31/2014 | | | 24.38 | | | | .32 | | | | 1.75 | | | | 2.07 | | | | (.30 | ) | | | (1.44 | ) | | | (1.74 | ) | | | 24.71 | | | | 8.50 | | | | 144 | | | | .93 | | | | 1.28 | |
| Year ended 12/31/2013 | | | 20.37 | | | | .29 | | | | 4.02 | | | | 4.31 | | | | (.30 | ) | | | — | | | | (.30 | ) | | | 24.38 | | | | 21.31 | | | | 134 | | | | .95 | | | | 1.29 | |
| Year ended 12/31/2012 | | | 18.18 | | | | .31 | | | | 2.19 | | | | 2.50 | | | | (.31 | ) | | | — | | | | (.31 | ) | | | 20.37 | | | | 13.84 | | | | 112 | | | | .97 | | | | 1.60 | |
| Class 529-F-1: | | | | | | | | | | | | | | | | | | | | | | | | | | | | | | | | | | | | | | | | | | | | | | | | |
| Year ended 12/31/2016 | | | 23.78 | | | | .44 | | | | 1.62 | | | | 2.06 | | | | (.48 | ) | | | (.61 | ) | | | (1.09 | ) | | | 24.75 | | | | 8.75 | | | | 135 | | | | .44 | | | | 1.82 | |
| Year ended 12/31/2015 | | | 24.71 | | | | .45 | | | | (.01 | ) | | | .44 | | | | (.43 | ) | | | (.94 | ) | | | (1.37 | ) | | | 23.78 | | | | 1.82 | | | | 117 | | | | .46 | | | | 1.82 | |
| Year ended 12/31/2014 | | | 24.37 | | | | .44 | | | | 1.76 | | | | 2.20 | | | | (.42 | ) | | | (1.44 | ) | | | (1.86 | ) | | | 24.71 | | | | 9.05 | | | | 111 | | | | .46 | | | | 1.76 | |
| Year ended 12/31/2013 | | | 20.36 | | | | .39 | | | | 4.03 | | | | 4.42 | | | | (.41 | ) | | | — | | | | (.41 | ) | | | 24.37 | | | | 21.88 | | | | 101 | | | | .48 | | | | 1.76 | |
| Year ended 12/31/2012 | | | 18.18 | | | | .41 | | | | 2.18 | | | | 2.59 | | | | (.41 | ) | | | — | | | | (.41 | ) | | | 20.36 | | | | 14.32 | | | | 82 | | | | .49 | | | | 2.09 | |
| Class R-1: | | | | | | | | | | | | | | | | | | | | | | | | | | | | | | | | | | | | | | | | | | | | | | | | |
| Year ended 12/31/2016 | | | 23.68 | | | | .22 | | | | 1.60 | | | | 1.82 | | | | (.25 | ) | | | (.61 | ) | | | (.86 | ) | | | 24.64 | | | | 7.75 | | | | 154 | | | | 1.38 | | | | .89 | |
| Year ended 12/31/2015 | | | 24.61 | | | | .22 | | | | (.01 | ) | | | .21 | | | | (.20 | ) | | | (.94 | ) | | | (1.14 | ) | | | 23.68 | | | | .88 | | | | 151 | | | | 1.38 | | | | .90 | |
| Year ended 12/31/2014 | | | 24.28 | | | | .21 | | | | 1.75 | | | | 1.96 | | | | (.19 | ) | | | (1.44 | ) | | | (1.63 | ) | | | 24.61 | | | | 8.05 | | | | 158 | | | | 1.38 | | | | .83 | |
| Year ended 12/31/2013 | | | 20.29 | | | | .19 | | | | 4.01 | | | | 4.20 | | | | (.21 | ) | | | — | | | | (.21 | ) | | | 24.28 | | | | 20.76 | | | | 151 | | | | 1.39 | | | | .84 | |
| Year ended 12/31/2012 | | | 18.12 | | | | .23 | | | | 2.17 | | | | 2.40 | | | | (.23 | ) | | | — | | | | (.23 | ) | | | 20.29 | | | | 13.28 | | | | 121 | | | | 1.40 | | | | 1.16 | |
| Class R-2: | | | | | | | | | | | | | | | | | | | | | | | | | | | | | | | | | | | | | | | | | | | | | | | | |
| Year ended 12/31/2016 | | | 23.70 | | | | .22 | | | | 1.60 | | | | 1.82 | | | | (.25 | ) | | | (.61 | ) | | | (.86 | ) | | | 24.66 | | | | 7.74 | | | | 1,241 | | | | 1.37 | | | | .89 | |
| Year ended 12/31/2015 | | | 24.62 | | | | .23 | | | | .01 | | | | .24 | | | | (.22 | ) | | | (.94 | ) | | | (1.16 | ) | | | 23.70 | | | | .97 | | | | 1,220 | | | | 1.32 | | | | .95 | |
| Year ended 12/31/2014 | | | 24.30 | | | | .21 | | | | 1.74 | | | | 1.95 | | | | (.19 | ) | | | (1.44 | ) | | | (1.63 | ) | | | 24.62 | | | | 8.03 | | | | 1,308 | | | | 1.36 | | | | .86 | |
| Year ended 12/31/2013 | | | 20.30 | | | | .20 | | | | 4.02 | | | | 4.22 | | | | (.22 | ) | | | — | | | | (.22 | ) | | | 24.30 | | | | 20.87 | | | | 1,304 | | | | 1.34 | | | | .90 | |
| Year ended 12/31/2012 | | | 18.13 | | | | .23 | | | | 2.18 | | | | 2.41 | | | | (.24 | ) | | | — | | | | (.24 | ) | | | 20.30 | | | | 13.31 | | | | 1,158 | | | | 1.37 | | | | 1.20 | |
| Class R-2E: | | | | | | | | | | | | | | | | | | | | | | | | | | | | | | | | | | | | | | | | | | | | | | | | |
| Year ended 12/31/2016 | | | 23.77 | | | | .29 | | | | 1.62 | | | | 1.91 | | | | (.33 | ) | | | (.61 | ) | | | (.94 | ) | | | 24.74 | | | | 8.10 | | | | 17 | | | | 1.08 | | | | 1.18 | |
| Year ended 12/31/2015 | | | 24.75 | | | | .29 | | | | .10 | | | | .39 | | | | (.43 | ) | | | (.94 | ) | | | (1.37 | ) | | | 23.77 | | | | 1.60 | | | | 2 | | | | .96 | | | | 1.22 | |
| Period from 8/29/2014 to 12/31/20144,5 | | | 25.81 | | | | .15 | | | | .41 | | | | .56 | | | | (.21 | ) | | | (1.41 | ) | | | (1.62 | ) | | | 24.75 | | | | 2.17 | 6,7 | | | — | 8 | | | .16 | 6,7 | | | .58 | 6,7 |
| Class R-3: | | | | | | | | | | | | | | | | | | | | | | | | | | | | | | | | | | | | | | | | | | | | | | | | |
| Year ended 12/31/2016 | | | 23.72 | | | | .32 | | | | 1.62 | | | | 1.94 | | | | (.36 | ) | | | (.61 | ) | | | (.97 | ) | | | 24.69 | | | | 8.24 | | | | 3,349 | | | | .93 | | | | 1.33 | |
| Year ended 12/31/2015 | | | 24.65 | | | | .33 | | | | (.01 | ) | | | .32 | | | | (.31 | ) | | | (.94 | ) | | | (1.25 | ) | | | 23.72 | | | | 1.34 | | | | 3,170 | | | | .93 | | | | 1.35 | |
| Year ended 12/31/2014 | | | 24.32 | | | | .32 | | | | 1.75 | | | | 2.07 | | | | (.30 | ) | | | (1.44 | ) | | | (1.74 | ) | | | 24.65 | | | | 8.51 | | | | 3,315 | | | | .94 | | | | 1.28 | |
| Year ended 12/31/2013 | | | 20.32 | | | | .29 | | | | 4.02 | | | | 4.31 | | | | (.31 | ) | | | — | | | | (.31 | ) | | | 24.32 | | | | 21.33 | | | | 3,212 | | | | .94 | | | | 1.30 | |
| Year ended 12/31/2012 | | | 18.14 | | | | .32 | | | | 2.18 | | | | 2.50 | | | | (.32 | ) | | | — | | | | (.32 | ) | | | 20.32 | | | | 13.83 | | | | 2,617 | | | | .95 | | | | 1.62 | |
| | | | | | Income (loss) from
investment operations1 | | | Dividends and distributions | | | | | | | | | | | | | | | | | | | | | |
| | | Net asset
value,
beginning
of period | | | Net
investment
income | | | Net gains
(losses) on
securities (both
realized and
unrealized) | | | Total from
investment
operations | | | Dividends
(from net
investment
income) | | | Distributions
(from capital
gains) | | | Total
dividends
and
distributions | | | Net asset
value,
end
of period | | | Total
return2 | | | Net assets,
end of period
(in millions) | | | Ratio of
expenses to
average
net assets | | | Ratio of
net income
to average
net assets | |
| Class R-4: | | | | | | | | | | | | | | | | | | | | | | | | | | | | | | | | | | | | | | | | | | | | | | | | |
| Year ended 12/31/2016 | | $ | 23.80 | | | $ | .40 | | | $ | 1.60 | | | $ | 2.00 | | | $ | (.43 | ) | | $ | (.61 | ) | | $ | (1.04 | ) | | $ | 24.76 | | | | 8.50 | % | | $ | 5,930 | | | | .64 | % | | | 1.63 | % |
| Year ended 12/31/2015 | | | 24.72 | | | | .41 | | | | — | 3 | | | .41 | | | | (.39 | ) | | | (.94 | ) | | | (1.33 | ) | | | 23.80 | | | | 1.67 | | | | 4,431 | | | | .63 | | | | 1.65 | |
| Year ended 12/31/2014 | | | 24.38 | | | | .40 | | | | 1.75 | | | | 2.15 | | | | (.37 | ) | | | (1.44 | ) | | | (1.81 | ) | | | 24.72 | | | | 8.85 | | | | 4,385 | | | | .64 | | | | 1.58 | |
| Year ended 12/31/2013 | | | 20.37 | | | | .36 | | | | 4.02 | | | | 4.38 | | | | (.37 | ) | | | — | | | | (.37 | ) | | | 24.38 | | | | 21.68 | | | | 3,994 | | | | .65 | | | | 1.60 | |
| Year ended 12/31/2012 | | | 18.19 | | | | .38 | | | | 2.18 | | | | 2.56 | | | | (.38 | ) | | | — | | | | (.38 | ) | | | 20.37 | | | | 14.14 | | | | 3,006 | | | | .64 | | | | 1.94 | |
| Class R-5E: | | | | | | | | | | | | | | | | | | | | | | | | | | | | | | | | | | | | | | | | | | | | | | | | |
| Year ended 12/31/2016 | | | 23.82 | | | | .48 | | | | 1.56 | | | | 2.04 | | | | (.47 | ) | | | (.61 | ) | | | (1.08 | ) | | | 24.78 | | | | 8.65 | | | | 2 | | | | .42 | | | | 1.94 | |
| Period from 11/20/2015 to 12/31/20154,9 | | | 25.09 | | | | .05 | | | | (.36 | ) | | | (.31 | ) | | | (.12 | ) | | | (.84 | ) | | | (.96 | ) | | | 23.82 | | | | (1.21 | )6 | | | — | 8 | | | .05 | 6 | | | .20 | 6 |
| Class R-5: | | | | | | | | | | | | | | | | | | | | | | | | | | | | | | | | | | | | | | | | | | | | | | | | |
| Year ended 12/31/2016 | | | 23.85 | | | | .47 | | | | 1.62 | | | | 2.09 | | | | (.50 | ) | | | (.61 | ) | | | (1.11 | ) | | | 24.83 | | | | 8.88 | | | | 1,986 | | | | .34 | | | | 1.91 | |
| Year ended 12/31/2015 | | | 24.77 | | | | .48 | | | | — | 3 | | | .48 | | | | (.46 | ) | | | (.94 | ) | | | (1.40 | ) | | | 23.85 | | | | 1.98 | | | | 2,571 | | | | .34 | | | | 1.94 | |
| Year ended 12/31/2014 | | | 24.43 | | | | .47 | | | | 1.76 | | | | 2.23 | | | | (.45 | ) | | | (1.44 | ) | | | (1.89 | ) | | | 24.77 | | | | 9.16 | | | | 2,616 | | | | .34 | | | | 1.88 | |
| Year ended 12/31/2013 | | | 20.41 | | | | .43 | | | | 4.03 | | | | 4.46 | | | | (.44 | ) | | | — | | | | (.44 | ) | | | 24.43 | | | | 22.04 | | | | 2,492 | | | | .34 | | | | 1.89 | |
| Year ended 12/31/2012 | | | 18.22 | | | | .44 | | | | 2.19 | | | | 2.63 | | | | (.44 | ) | | | — | | | | (.44 | ) | | | 20.41 | | | | 14.51 | | | | 2,050 | | | | .35 | | | | 2.23 | |
| Class R-6: | | | | | | | | | | | | | | | | | | | | | | | | | | | | | | | | | | | | | | | | | | | | | | | | |
| Year ended 12/31/2016 | | | 23.84 | | | | .48 | | | | 1.61 | | | | 2.09 | | | | (.51 | ) | | | (.61 | ) | | | (1.12 | ) | | | 24.81 | | | | 8.90 | | | | 11,058 | | | | .29 | | | | 1.98 | |
| Year ended 12/31/2015 | | | 24.76 | | | | .49 | | | | — | 3 | | | .49 | | | | (.47 | ) | | | (.94 | ) | | | (1.41 | ) | | | 23.84 | | | | 2.02 | | | | 7,290 | | | | .29 | | | | 1.99 | |
| Year ended 12/31/2014 | | | 24.42 | | | | .49 | | | | 1.75 | | | | 2.24 | | | | (.46 | ) | | | (1.44 | ) | | | (1.90 | ) | | | 24.76 | | | | 9.22 | | | | 6,076 | | | | .29 | | | | 1.93 | |
| Year ended 12/31/2013 | | | 20.40 | | | | .44 | | | | 4.03 | | | | 4.47 | | | | (.45 | ) | | | — | | | | (.45 | ) | | | 24.42 | | | | 22.12 | | | | 3,910 | | | | .29 | | | | 1.95 | |
| Year ended 12/31/2012 | | | 18.21 | | | | .45 | | | | 2.19 | | | | 2.64 | | | | (.45 | ) | | | — | | | | (.45 | ) | | | 20.40 | | | | 14.57 | | | | 2,151 | | | | .30 | | | | 2.28 | |
| | | Year ended December 31 |
| Portfolio turnover rate for all share classes10 | | 2016 | | 2015 | | 2014 | | 2013 | | 2012 |
| Including mortgage dollar roll transactions | | | 79 | % | | | 82 | % | | | 68 | % | | | 55 | % | | | 54 | % |
| Excluding mortgage dollar roll transactions | | | 48 | % | | | 45 | % | | | 48 | % | | Not available |
| 1 | Based on average shares outstanding. |
| 2 | Total returns exclude any applicable sales charges, including contingent deferred sales charges. |
| 3 | Amount less than $.01. |
| 4 | Based on operations for the period shown and, accordingly, is not representative of a full year. |
| 5 | Class R-2E shares were offered beginning August 29, 2014. |
| 6 | Not annualized. |
| 7 | All or a significant portion of assets in this class consisted of seed capital invested by CRMC and/or its affiliates. Fees for distribution services are not charged or accrued on these seed capital assets. If such fees were paid by the fund on seed capital assets, fund expenses would have been higher and net income and total return would have been lower. |
| 8 | Amount less than $1 million. |
| 9 | Class R-5E shares were offered beginning November 20, 2015. |
| 10 | Refer to Note 5 for further information on mortgage dollar rolls. |
See Notes to Financial Statements
Report of Independent Registered Public Accounting Firm
To the Shareholders and Board of Trustees of American Balanced Fund:
We have audited the accompanying statement of assets and liabilities of American Balanced Fund (the “Fund”), including the summary investment portfolio, as of December 31, 2016, and the related statement of operations for the year then ended, the statements of changes in net assets for each of the two years in the period then ended, and the financial highlights for each of the periods presented. These financial statements and financial highlights are the responsibility of the Fund’s management. Our responsibility is to express an opinion on these financial statements and financial highlights based on our audits.
We conducted our audits in accordance with the standards of the Public Company Accounting Oversight Board (United States). Those standards require that we plan and perform the audit to obtain reasonable assurance about whether the financial statements and financial highlights are free of material misstatement. The Fund is not required to have, nor were we engaged to perform, an audit of its internal control over financial reporting. Our audits included consideration of internal control over financial reporting as a basis for designing audit procedures that are appropriate in the circumstances, but not for the purpose of expressing an opinion on the effectiveness of the Fund’s internal control over financial reporting. Accordingly, we express no such opinion. An audit also includes examining, on a test basis, evidence supporting the amounts and disclosures in the financial statements, assessing the accounting principles used and significant estimates made by management, as well as evaluating the overall financial statement presentation. Our procedures included confirmation of securities owned as of December 31, 2016, by correspondence with the custodian and brokers; where replies were not received from brokers, we performed other auditing procedures. We believe that our audits provide a reasonable basis for our opinion.
In our opinion, such financial statements and financial highlights referred to above present fairly, in all material respects, the financial position of American Balanced Fund as of December 31, 2016, the results of its operations for the year then ended, the changes in its net assets for each of the two years in the period then ended, and the financial highlights for each of the periods presented, in conformity with accounting principles generally accepted in the United States of America.
Deloitte & Touche LLP
Costa Mesa, California
February 8, 2017
As a fund shareholder, you incur two types of costs: (1) transaction costs, such as initial sales charges on purchase payments and contingent deferred sales charges on redemptions (loads), and (2) ongoing costs, including management fees, distribution and service (12b-1) fees, and other expenses. This example is intended to help you understand your ongoing costs (in dollars) of investing in the fund so you can compare these costs with the ongoing costs of investing in other mutual funds. The example is based on an investment of $1,000 invested at the beginning of the period and held for the entire six-month period (July 1, 2016, through December 31, 2016).
Actual expenses:
The first line of each share class in the table on the following page provides information about actual account values and actual expenses. You may use the information in this line, together with the amount you invested, to estimate the expenses that you paid over the period. Simply divide your account value by $1,000 (for example, an $8,600 account value divided by $1,000 = 8.6), then multiply the result by the number in the first line under the heading titled “Expenses paid during period” to estimate the expenses you paid on your account during this period.
Hypothetical example for comparison purposes:
The second line of each share class in the table on the following page provides information about hypothetical account values and hypothetical expenses based on the actual expense ratio for the share class and an assumed rate of return of 5.00% per year before expenses, which is not the actual return of the share class. The hypothetical account values and expenses may not be used to estimate the actual ending account balance or expenses you paid for the period. You may use this information to compare the ongoing costs of investing in the fund and other funds. To do so, compare this 5.00% hypothetical example with the 5.00% hypothetical examples that appear in the shareholder reports of the other funds.
Notes:
Retirement plan participants may be subject to certain fees charged by the plan sponsor, and Class F-1, F-2 and 529-F-1 shareholders may be subject to fees charged by financial intermediaries, typically ranging from 0.75% to 1.50% of assets annually depending on services offered. You can estimate the impact of these fees by adding the amount of the fees to the total estimated expenses you paid on your account during the period as calculated above. In addition, your ending account value would be lower by the amount of these fees.
Note that the expenses shown in the table on the following page are meant to highlight your ongoing costs only and do not reflect any transactional costs, such as sales charges (loads). Therefore, the second line of each share class in the table is useful in comparing ongoing costs only and will not help you determine the relative total costs of owning different funds. In addition, if these transactional costs were included, your costs would have been higher.
| | | Beginning
account value
7/1/2016 | | | Ending
account value
12/31/2016 | | | Expenses paid
during period* | | | Annualized
expense ratio | |
| Class A - actual return | | $ | 1,000.00 | | | $ | 1,035.30 | | | $ | 3.03 | | | | .59 | % |
| Class A - assumed 5% return | | | 1,000.00 | | | | 1,022.23 | | | | 3.01 | | | | .59 | |
| Class B - actual return | | | 1,000.00 | | | | 1,031.08 | | | | 6.86 | | | | 1.34 | |
| Class B - assumed 5% return | | | 1,000.00 | | | | 1,018.45 | | | | 6.82 | | | | 1.34 | |
| Class C - actual return | | | 1,000.00 | | | | 1,030.66 | | | | 7.01 | | | | 1.37 | |
| Class C - assumed 5% return | | | 1,000.00 | | | | 1,018.30 | | | | 6.97 | | | | 1.37 | |
| Class F-1 - actual return | | | 1,000.00 | | | | 1,034.59 | | | | 3.38 | | | | .66 | |
| Class F-1 - assumed 5% return | | | 1,000.00 | | | | 1,021.88 | | | | 3.36 | | | | .66 | |
| Class F-2 - actual return | | | 1,000.00 | | | | 1,036.00 | | | | 2.00 | | | | .39 | |
| Class F-2 - assumed 5% return | | | 1,000.00 | | | | 1,023.24 | | | | 1.99 | | | | .39 | |
| Class 529-A - actual return | | | 1,000.00 | | | | 1,034.54 | | | | 3.38 | | | | .66 | |
| Class 529-A - assumed 5% return | | | 1,000.00 | | | | 1,021.88 | | | | 3.36 | | | | .66 | |
| Class 529-B - actual return | | | 1,000.00 | | | | 1,030.85 | | | | 7.37 | | | | 1.44 | |
| Class 529-B - assumed 5% return | | | 1,000.00 | | | | 1,017.95 | | | | 7.32 | | | | 1.44 | |
| Class 529-C - actual return | | | 1,000.00 | | | | 1,030.59 | | | | 7.27 | | | | 1.42 | |
| Class 529-C - assumed 5% return | | | 1,000.00 | | | | 1,018.05 | | | | 7.22 | | | | 1.42 | |
| Class 529-E - actual return | | | 1,000.00 | | | | 1,033.75 | | | | 4.56 | | | | .89 | |
| Class 529-E - assumed 5% return | | | 1,000.00 | | | | 1,020.72 | | | | 4.53 | | | | .89 | |
| Class 529-F-1 - actual return | | | 1,000.00 | | | | 1,035.81 | | | | 2.21 | | | | .43 | |
| Class 529-F-1 - assumed 5% return | | | 1,000.00 | | | | 1,023.04 | | | | 2.19 | | | | .43 | |
| Class R-1 - actual return | | | 1,000.00 | | | | 1,030.64 | | | | 7.06 | | | | 1.38 | |
| Class R-1 - assumed 5% return | | | 1,000.00 | | | | 1,018.25 | | | | 7.02 | | | | 1.38 | |
| Class R-2 - actual return | | | 1,000.00 | | | | 1,030.99 | | | | 7.12 | | | | 1.39 | |
| Class R-2 - assumed 5% return | | | 1,000.00 | | | | 1,018.20 | | | | 7.07 | | | | 1.39 | |
| Class R-2E - actual return | | | 1,000.00 | | | | 1,032.45 | | | | 5.53 | | | | 1.08 | |
| Class R-2E - assumed 5% return | | | 1,000.00 | | | | 1,019.76 | | | | 5.50 | | | | 1.08 | |
| Class R-3 - actual return | | | 1,000.00 | | | | 1,033.30 | | | | 4.87 | | | | .95 | |
| Class R-3 - assumed 5% return | | | 1,000.00 | | | | 1,020.42 | | | | 4.84 | | | | .95 | |
| Class R-4 - actual return | | | 1,000.00 | | | | 1,034.40 | | | | 3.28 | | | | .64 | |
| Class R-4 - assumed 5% return | | | 1,000.00 | | | | 1,021.98 | | | | 3.26 | | | | .64 | |
| Class R-5E - actual return | | | 1,000.00 | | | | 1,035.68 | | | | 2.16 | | | | .42 | |
| Class R-5E - assumed 5% return | | | 1,000.00 | | | | 1,023.09 | | | | 2.14 | | | | .42 | |
| Class R-5 - actual return | | | 1,000.00 | | | | 1,036.55 | | | | 1.75 | | | | .34 | |
| Class R-5 - assumed 5% return | | | 1,000.00 | | | | 1,023.49 | | | | 1.73 | | | | .34 | |
| Class R-6 - actual return | | | 1,000.00 | | | | 1,036.46 | | | | 1.44 | | | | .28 | |
| Class R-6 - assumed 5% return | | | 1,000.00 | | | | 1,023.79 | | | | 1.43 | | | | .28 | |
| * | The “expenses paid during period” are equal to the “annualized expense ratio,” multiplied by the average account value over the period, multiplied by the number of days in the period, and divided by 365 (to reflect the one-half year period). |
We are required to advise you of the federal tax status of certain distributions received by shareholders during the fiscal year. The fund hereby designates the following amounts for the fund’s fiscal year ended December 31, 2016:
| Long-term capital gains | | $ | 2,578,857,000 |
| Qualified dividend income | | $ | 1,403,010,000 |
| Corporate dividends received deduction | | $ | 1,015,969,000 |
| U.S. government income that may be exempt from state taxation | | $ | 163,581,000 |
Individual shareholders should refer to their Form 1099 or other tax information, which was mailed in January 2017, to determine the calendar year amounts to be included on their 2016 tax returns. Shareholders should consult their tax advisors.
Approval of Investment Advisory and Service Agreement
American Balanced Fund’s board has approved the fund’s Investment Advisory and Service Agreement (the “agreement”) with Capital Research and Management Company (“CRMC”) for an additional one-year term through January 31, 2018. The board approved the agreement following the recommendation of the fund’s Contracts Committee (the “committee”), which is composed of all of the fund’s independent board members. The board and the committee determined that the fund’s advisory fee structure was fair and reasonable in relation to the services provided, and that approving the agreement was in the best interests of the fund and its shareholders.
In reaching this decision, the board and the committee took into account information furnished to them throughout the year and otherwise provided to them, as well as information prepared specifically in connection with their review of the agreement, and were advised by their independent counsel. They considered the following factors, among others, but did not identify any single issue or particular piece of information that, in isolation, was the controlling factor, and each board and committee member did not necessarily attribute the same weight to each factor.
1. Nature, extent and quality of services
The board and the committee considered the depth and quality of CRMC’s investment management process, including its global research capabilities; the experience, capability and integrity of its senior management and other personnel; the low turnover rates of its key personnel; the overall financial strength and stability of CRMC and the Capital Group organization; and the ongoing evolution of CRMC’s organizational structure designed to maintain and strengthen these qualities. The board and the committee also considered the nature, extent and quality of administrative, compliance and shareholder services provided by CRMC to the fund under the agreement and other agreements, as well as the benefits to fund shareholders from investing in a fund that is part of a large family of funds. The board and the committee concluded that the nature, extent and quality of the services provided by CRMC have benefited and should continue to benefit the fund and its shareholders.
2. Investment results
The board and the committee considered the investment results of the fund in light of its objectives of providing conservation of capital, current income and long-term growth of capital and income. They compared the fund’s investment results with those of other funds (including funds that form the basis of the Lipper index for the category in which the fund is included), and data such as relevant market and fund indexes, over various periods through June 30, 2016. This report, including the letter to shareholders and related disclosures, contains certain information about the fund’s investment results. The board and the committee reviewed the fund’s investment results measured against various indexes, including the Lipper Balanced Funds Index, the Standard & Poor’s 500 Composite Index, the Bloomberg Barclays U.S. Aggregate Index and a customized index comprised 60% of the S&P 500 Index and 40% of the Bloomberg Barclays Index (adjusted for Fund expenses). They noted that the investment results of the fund generally exceeded those of these indexes for the lifetime, 20-year, 10-year and 5-year periods, except for the S&P 500 Index. They also noted that the volatility of the Fund’s monthly returns for such periods was at or near that of the Lipper Index and less than that of the S&P 500 Index. The board and the committee concluded that the fund’s investment results have been satisfactory for renewal of the agreement and that CRMC’s record in managing the fund indicated that its continued management should benefit the fund and its shareholders.
3. Advisory fees and total expenses
The board and the committee compared the advisory fees and total expense levels of the fund to those of other relevant funds. They observed that the fund’s advisory fees and expenses generally compared favorably to those of other similar funds included in the Lipper Balanced Funds category. The board and the committee also considered the breakpoint discounts in the fund’s advisory fee structure that reduce the level of fees charged by CRMC to the fund as fund assets increase. In addition, they reviewed information regarding the effective advisory fees charged to non-mutual fund clients by CRMC and its affiliates. They noted that, to the extent there were differences between the advisory fees paid by the fund and the advisory fees paid by those clients, the differences appropriately reflected the investment, operational and regulatory differences between advising the fund and the other clients. The board and the committee concluded that the fund’s cost structure was fair and reasonable in relation to the services provided, and that the fund’s shareholders receive reasonable value in return for the advisory fees and other amounts paid to CRMC by the fund.
4. Ancillary benefits
The board and the committee considered a variety of other benefits that CRMC and its affiliates receive as a result of CRMC’s relationship with the fund and the other American Funds, including fees for administrative services provided to certain share classes; fees paid to CRMC’s affiliated transfer agent; sales charges and distribution fees received and retained by the fund’s principal underwriter, an affiliate of CRMC; and possible ancillary benefits to CRMC and its institutional management affiliates in managing other investment vehicles. The board and the committee reviewed CRMC’s portfolio trading practices, noting the benefits CRMC receives from the research obtained with commissions from portfolio transactions made on behalf of the fund. The board and the committee took these ancillary benefits into account in evaluating the reasonableness of the advisory fees and other amounts paid to CRMC by the fund.
5. Adviser financial information
The board and the committee reviewed information regarding CRMC’s costs of providing services to the American Funds, including personnel, systems and resources of investment, compliance, trading, accounting and other administrative operations. They considered CRMC’s costs and related cost allocation methodology as well as its willingness to invest in technology, infrastructure and staff to maintain and expand services and capabilities, respond to industry and regulatory developments, and attract and retain qualified personnel. They noted information regarding the compensation structure for CRMC’s investment professionals. The board and the committee also compared CRMC’s profitability and compensation data to the reported results and data of several large, publicly held investment management companies. The board and the committee noted the competitiveness and cyclicality of both the mutual fund industry and the capital markets, and the importance in that environment of CRMC’s long-term profitability for maintaining its independence, company culture and management continuity. They further considered the breakpoint discounts in the fund’s advisory fee structure. The board and the committee concluded that the fund’s advisory fee structure reflected a reasonable sharing of benefits between CRMC and the fund’s shareholders.
Board of trustees and other officers
Independent trustees1
| Name and year of birth | | Year first
elected
a trustee
of the fund2 | | Principal occupation(s) during past five years | | Number of
portfolios in fund
complex overseen
by trustee3 | | Other directorships4
held by trustee |
| William H. Baribault, 1945 | | 2012 | | CEO and President, Richard Nixon Foundation; Chairman of the Board and CEO, Oakwood Enterprises (private investment and consulting) | | 81 | | General Finance Corporation |
| Vanessa C. L. Chang, 1952 | | 2012 | | Director, EL & EL Investments (real estate) | | 17 | | Edison International; Sykes Enterprises; Transocean Ltd. |
| Linda Griego, 1947 | | 2012 | | President and CEO, Griego Enterprises, Inc. (business management company) | | 7 | | AECOM Technology Corporation; CBS Corporation |
| Leonade D. Jones, 1947 | | 1993 | | Retired; former Treasurer, The Washington Post Company (retired 1996) | | 10 | | None |
| William D. Jones, 1955 | | 2008 | | Real estate developer/owner, President and CEO, CityLink Investment Corporation (acquires, develops and manages real estate ventures in urban communities) and City Scene Management Company (provides commercial asset management services) | | 8 | | Sempra Energy |
| James J. Postl, 1946 | | 2007 | | Retired; former President and CEO, Pennzoil-Quaker State Company (automotive products and services) (retired 2002) | | 4 | | Pulte, Inc. |
| Margaret Spellings, 1957 | | 2012 | | President, The University of North Carolina; former President, George W. Bush Foundation; former President and CEO, Margaret Spellings & Company (public policy and strategic consulting); former President, U.S. Chamber Foundation and Senior Advisor to the President and CEO, U.S. Chamber of Commerce | | 82 | | ClubCorp Holdings, Inc. |
Isaac Stein, 1946
Chairman of the Board (Independent and Non-Executive) | | 2004 | | Private investor; former President, Waverley Associates (private investment fund); Chairman Emeritus of the Board of Trustees, Stanford University | | 4 | | Alexza Pharmaceuticals, Inc. |
Interested trustee5,6
Name, year of birth and
position with fund | | Year first
elected
a trustee
or officer
of the fund2 | | Principal occupation(s) during past five years
and positions held with affiliated entities or
the principle underwriter of the fund | | Number of
portfolios in fund
complex overseen
by trustee3 | | Other directorships4
held by trustee |
Gregory D. Johnson, 1963
Vice Chairman of the Board and President | | 2003 | | Director, Capital Research and Management Company; Partner — Capital World Investors, Capital Research and Management Company | | 1 | | None |
The fund’s statement of additional information includes further details about fund trustees and is available without charge upon request by calling American Funds Service Company at (800) 421-4225 or by visiting the American Funds website at americanfunds.com. The address for all trustees and officers of the fund is 333 South Hope Street, Los Angeles, CA 90071, Attention: Secretary.
See page 36 for footnotes.
Other officers6
Name, year of birth and
position with fund | | Year first
elected
an officer
of the fund2 | | Principal occupation(s) during past five years and positions held with affiliated entities
or the principal underwriter of the fund |
Hilda L. Applbaum, 1961
Senior Vice President | | 1999 | | Partner — Capital World Investors, Capital Research and Management Company |
Jeffrey T. Lager, 1968
Senior Vice President | | 2002 | | Partner — Capital World Investors, Capital Research and Management Company |
James R. Mulally, 1952
Senior Vice President | | 2009 | | Partner — Capital Fixed Income Investors, Capital Research and Management Company |
Paul F. Roye, 1953
Senior Vice President | | 2007 | | Director, Capital Research and Management Company; Senior Vice President and Senior Counsel — Fund Business Management Group, Capital Research and Management Company |
John H. Smet, 1956
Senior Vice President | | 2000 | | Partner — Capital Fixed Income Investors, Capital Research and Management Company; Director, Capital Research and Management Company |
Paul R. Benjamin, 1979
Vice President | | 2014 | | Partner — Capital World Investors, Capital Research and Management Company |
Alan N. Berro, 1960
Vice President | | 2010 | | Partner — Capital World Investors, Capital Research and Management Company; Director, Capital Research and Management Company |
Donald H. Rolfe, 1972
Vice President | | 2012 | | Senior Vice President and Senior Counsel — Fund Business Management Group, Capital Research and Management Company |
Richmond A. Wolf, 1970
Vice President | | 2014 | | Partner — Capital World Investors, Capital Research and Management Company |
Michael W. Stockton, 1967
Secretary | | 2014 | | Vice President — Fund Business Management Group, Capital Research and Management Company |
Brian C. Janssen, 1972
Treasurer | | 2016 | | Vice President — Investment Operations, Capital Research and Management Company |
Viviane T. Russo, 1981
Assistant Secretary | | 2014 | | Associate — Fund Business Management Group, Capital Research and Management Company |
Dori Laskin, 1951
Assistant Treasurer | | 2011 | | Vice President — Investment Operations, Capital Research and Management Company |
Hong T. Le, 1978
Assistant Treasurer | | 2016 | | Assistant Vice President — Investment Operations, Capital Research and Management Company |
| 1 | The term independent trustee refers to a trustee who is not an “interested person” of the fund within the meaning of the Investment Company Act of 1940. |
| 2 | Trustees and officers of the fund serve until their resignation, removal or retirement. |
| 3 | Funds managed by Capital Research and Management Company or its affiliates. |
| 4 | This includes all directorships/trusteeships (other than those in the American Funds or other funds managed by Capital Research and Management Company or its affiliates) that are held by each trustee as a trustee or director of a public company or a registered investment company. |
| 5 | The term interested trustee refers to a trustee who is an “interested person” within the meaning of the Investment Company Act of 1940, on the basis of their affiliation with the fund’s investment adviser, Capital Research and Management Company, or affiliated entities (including the fund’s principal underwriter). |
| 6 | All of the trustees and/or officers listed, except Paul R. Benjamin, James R. Mulally and Richmond A. Wolf, are officers and/or directors/trustees of one or more of the other funds for which Capital Research and Management Company serves as investment adviser. |
Office of the fund
6455 Irvine Center Drive
Irvine, CA 92618-4518
Investment adviser
Capital Research and Management Company
333 South Hope Street
Los Angeles, CA 90071-1406
6455 Irvine Center Drive
Irvine, CA 92618-4518
Transfer agent for shareholder accounts
American Funds Service Company
(Write to the address near you.)
P.O. Box 6007
Indianapolis, IN 46206-6007
P.O. Box 2280
Norfolk, VA 23501-2280
Custodian of assets
JPMorgan Chase Bank
270 Park Avenue
New York, NY 10017-2070
Counsel
Morgan, Lewis & Bockius LLP
300 South Grand Avenue, 22nd Floor
Los Angeles, CA 90071-3132
Independent registered public accounting firm
Deloitte & Touche LLP
695 Town Center Drive
Suite 1200
Costa Mesa, CA 92626-7188
Principal underwriter
American Funds Distributors, Inc.
333 South Hope Street
Los Angeles, CA 90071-1406
Investors should carefully consider investment objectives, risks, charges and expenses. This and other important information is contained in the fund prospectus and summary prospectus, which can be obtained from your financial professional and should be read carefully before investing. You may also call American Funds Service Company (AFS) at (800) 421-4225 or visit the American Funds website at americanfunds.com.
“American Funds Proxy Voting Procedures and Principles” — which describes how we vote proxies relating to portfolio securities — is available on the American Funds website or upon request by calling AFS. The fund files its proxy voting record with the U.S. Securities and Exchange Commission (SEC) for the 12 months ended June 30 by August 31. The proxy voting record is available free of charge on the SEC website at sec.gov and on the American Funds website.
A complete December 31, 2016, portfolio of American Balanced Fund’s investments is available free of charge by calling AFS or visiting the SEC website (where it is part of Form N-CSR).
American Balanced Fund files a complete list of its portfolio holdings with the SEC for the first and third quarters of each fiscal year on Form N-Q. This filing is available free of charge on the SEC website. You may also review or, for a fee, copy this filing at the SEC’s Public Reference Room in Washington, D.C. Additional information regarding the operation of the Public Reference Room may be obtained by calling the SEC’s Office of Investor Education and Advocacy at (800) SEC-0330. Additionally, the list of portfolio holdings is available by calling AFS.
This report is for the information of shareholders of American Balanced Fund, but it also may be used as sales literature when preceded or accompanied by the current prospectus or summary prospectus, which gives details about charges, expenses, investment objectives and operating policies of the fund. If used as sales material after March 31, 2017, this report must be accompanied by an American Funds statistical update for the most recently completed calendar quarter.
Bloomberg® is a trademark of Bloomberg Finance L.P. (collectively with its affiliates, “Bloomberg”). Barclays® is a trademark of Barclays Bank Plc (collectively with its affiliates, “Barclays”), used under license. Neither Bloomberg nor Barclays approves or endorses this material, guarantees the accuracy or completeness of any information herein and, to the maximum extent allowed by law, neither shall have any liability or responsibility for injury or damages arising in connection therewith.
The Standard & Poor’s 500 Composite Index (“Index”) is a product of S&P Dow Jones Indices LLC and/or its affiliates and has been licensed for use by Capital Group. Copyright © 2017 S&P Dow Jones Indices LLC, a division of S&P Global, and/or its affiliates. All rights reserved. Redistribution or reproduction in whole or in part are prohibited without written permission of S&P Dow Jones Indices LLC.
American Funds from Capital Group
The Capital AdvantageSM
Since 1931, American Funds, part of Capital Group, has helped investors pursue long-term investment success. Our consistent approach — in combination with The Capital SystemSM — has resulted in a superior long-term track record.
Aligned with investor success
We base our decisions on a long-term perspective, which we believe aligns our goals with the interests of our clients. Our portfolio managers average 27 years of investment experience, including 22 years at our company, reflecting a career commitment to our long-term approach.1
The Capital SystemSM
The Capital System combines individual accountability with teamwork. Funds using The Capital System are divided into portions that are managed independently by investment professionals with diverse backgrounds, ages and investment approaches. An extensive global research effort is the backbone of our system.
American Funds’ superior long-term track record
Equity funds have beaten their Lipper peer indexes in 91% of 10-year periods and 95% of 20-year periods. Fixed income funds have beaten their Lipper indexes in 58% of 10-year periods and 58% of 20-year periods.2 Fund management fees have been among the lowest in the industry.3
| | 1 | Portfolio manager experience as of December 31, 2015. |
| | 2 | Based on Class A share results for rolling periods through December 31, 2015. Periods covered are the shorter of the fund’s lifetime or since the comparable Lipper index inception date (except Capital Income Builder and SMALLCAP World Fund, for which the Lipper average was used). Expenses differ for each share class, so results will vary. |
| | 3 | On average, our management fees were in the lowest quintile 68% of the time, based on the 20-year period ended December 31, 2015, versus comparable Lipper categories, excluding funds of funds. |

ITEM 2 – Code of Ethics
The Registrant has adopted a Code of Ethics that applies to its Principal Executive Officer and Principal Financial Officer. The Registrant undertakes to provide to any person without charge, upon request, a copy of the Code of Ethics. Such request can be made to American Funds Service Company at 800/421-9225 or to the Secretary of the Registrant, 6455 Irvine Center Drive, Irvine, California 92618.
ITEM 3 – Audit Committee Financial Expert
The Registrant’s board has determined that Vanessa C. L. Chang, a member of the Registrant’s audit committee, is an “audit committee financial expert” and "independent," as such terms are defined in this Item. This designation will not increase the designee’s duties, obligations or liability as compared to his or her duties, obligations and liability as a member of the audit committee and of the board, nor will it reduce the responsibility of the other audit committee members. There may be other individuals who, through education or experience, would qualify as "audit committee financial experts" if the board had designated them as such. Most importantly, the board believes each member of the audit committee contributes significantly to the effective oversight of the Registrant’s financial statements and condition.
| ITEM 4 – Principal Accountant Fees and Services | |
| | | |
| Registrant: | |
| a) Audit Fees: |
| | 2015 | $110,000 |
| | 2016 | $112,000 |
| | |
| b) Audit-Related Fees: |
| | 2015 | $25,000 |
| | 2016 | $27,000 |
| | |
| c) Tax Fees: |
| | 2015 | $8,000 |
| | 2016 | $9,000 |
| | The tax fees consist of professional services relating to the preparation of the Registrant’s tax returns. |
| | |
| d) All Other Fees: |
| | 2015 | None |
| | 2016 | None |
| | |
| | Adviser and affiliates (includes only fees for non-audit services billed to the adviser and affiliates for engagements that relate directly to the operations and financial reporting of the Registrant and were subject to the pre-approval policies described below): |
| a) Audit Fees: |
| | Not Applicable |
| | |
| b) Audit-Related Fees: |
| | 2015 | $1,183,000 |
| | 2016 | $1,098,000 |
| | The audit-related fees consist of assurance and related services relating to the examination of the Registrant’s transfer agent, principal underwriter and investment adviser conducted in accordance with Statement on Standards for Attestation Engagements Number 16 issued by the American Institute of Certified Public Accountants. |
| | |
| c) Tax Fees: |
| | 2015 | None |
| | 2016 | None |
| | The tax fees consist of consulting services relating to the Registrant’s investments. |
| | | |
| | | |
| d) All Other Fees: |
| | 2015 | $5,000 |
| | 2016 | None |
| | The other fees consist of subscription services related to an accounting research tool. |
| | |
| All audit and permissible non-audit services that the Registrant’s audit committee considers compatible with maintaining the independent registered public accounting firm’s independence are required to be pre-approved by the committee. The pre-approval requirement will extend to all non-audit services provided to the Registrant, the investment adviser, and any entity controlling, controlled by, or under common control with the investment adviser that provides ongoing services to the Registrant, if the engagement relates directly to the operations and financial reporting of the Registrant. The committee will not delegate its responsibility to pre-approve these services to the investment adviser. The committee may delegate to one or more committee members the authority to review and pre-approve audit and permissible non-audit services. Actions taken under any such delegation will be reported to the full committee at its next meeting. The pre-approval requirement is waived with respect to non-audit services if certain conditions are met. The pre-approval requirement was not waived for any of the non-audit services listed above provided to the Registrant, adviser and affiliates. |
| | | |
| Aggregate non-audit fees paid to the Registrant’s auditors, including fees for all services billed to the Registrant, adviser and affiliates that provide ongoing services to the Registrant, were $1,491,000 for fiscal year 2015 and $1,281,000 for fiscal year 2016. The non-audit services represented by these amounts were brought to the attention of the committee and considered to be compatible with maintaining the auditors’ independence. |
ITEM 5 – Audit Committee of Listed Registrants
Not applicable to this Registrant, insofar as the Registrant is not a listed issuer as defined in Rule 10A-3 under the Securities Exchange Act of 1934.
ITEM 6 – Schedule of Investments
American Balanced Fund®
Investment portfolio
December 31, 2016
Common stocks 61.27%
Information technology 10.69% | Shares | Value
(000) |
| Microsoft Corp. | 57,929,407 | $3,599,733 |
| Broadcom Ltd. | 5,608,286 | 991,377 |
| Intel Corp. | 21,888,100 | 793,881 |
| ASML Holding NV (New York registered) | 5,117,458 | 574,179 |
| ASML Holding NV1 | 1,905,000 | 213,443 |
| Intuit Inc. | 6,285,000 | 720,324 |
| Facebook, Inc., Class A2 | 5,500,000 | 632,775 |
| Alphabet Inc., Class C2 | 647,800 | 499,985 |
| Alphabet Inc., Class A2 | 158,000 | 125,207 |
| Texas Instruments Inc. | 8,132,000 | 593,392 |
| Taiwan Semiconductor Manufacturing Co., Ltd. (ADR) | 20,520,000 | 589,950 |
| TE Connectivity Ltd. | 7,205,000 | 499,162 |
| VeriSign, Inc.2,3 | 5,500,000 | 418,385 |
| Visa Inc., Class A | 4,438,000 | 346,253 |
| Analog Devices, Inc. | 1,700,000 | 123,454 |
| MasterCard Inc., Class A | 472,000 | 48,734 |
| KLA-Tencor Corp. | 467,000 | 36,744 |
| | | 10,806,978 |
| Consumer discretionary 9.06% | | |
| Home Depot, Inc. | 16,062,349 | 2,153,640 |
| Comcast Corp., Class A | 30,517,000 | 2,107,199 |
| Amazon.com, Inc.2 | 2,241,400 | 1,680,759 |
| Twenty-First Century Fox, Inc., Class A | 14,097,306 | 395,288 |
| CBS Corp., Class B | 5,619,000 | 357,481 |
| Starbucks Corp. | 6,330,000 | 351,441 |
| McDonald’s Corp. | 2,823,000 | 343,615 |
| VF Corp. | 5,016,000 | 267,604 |
| Viacom Inc., Class B | 7,537,000 | 264,549 |
| Time Warner Inc. | 2,200,000 | 212,366 |
| Target Corp. | 2,700,000 | 195,021 |
| Charter Communications, Inc., Class A2 | 551,562 | 158,806 |
| General Motors Co. | 4,000,000 | 139,360 |
| NIKE, Inc., Class B | 2,637,000 | 134,039 |
| Walt Disney Co. | 1,200,000 | 125,064 |
| Hasbro, Inc. | 1,370,000 | 106,572 |
| Macy’s, Inc. | 2,800,000 | 100,268 |
| Dollar General Corp. | 1,013,000 | 75,033 |
| | | 9,168,105 |
| Financials 8.57% | | |
| Berkshire Hathaway Inc., Class A2 | 8,080 | 1,972,498 |
| Berkshire Hathaway Inc., Class B2 | 800,000 | 130,384 |
| JPMorgan Chase & Co. | 19,761,000 | 1,705,177 |
| Wells Fargo & Co. | 23,103,000 | 1,273,206 |
| Chubb Ltd. | 6,070,500 | 802,034 |
| Citigroup Inc. | 10,700,000 | 635,901 |
American Balanced Fund — Page 1 of 32
Common stocks
Financials (continued) | Shares | Value
(000) |
| SunTrust Banks, Inc. | 10,383,411 | $569,530 |
| Capital One Financial Corp. | 5,421,000 | 472,928 |
| Goldman Sachs Group, Inc. | 1,238,762 | 296,622 |
| BlackRock, Inc. | 739,000 | 281,219 |
| Bank of America Corp. | 10,000,000 | 221,000 |
| Legal & General Group PLC1 | 70,000,000 | 213,204 |
| HDFC Bank Ltd.1 | 4,275,000 | 83,356 |
| HDFC Bank Ltd. (ADR) | 16,600 | 1,007 |
| Intercontinental Exchange, Inc. | 256,000 | 14,444 |
| | | 8,672,510 |
| Energy 7.56% | | |
| Schlumberger Ltd. | 16,869,000 | 1,416,153 |
| Royal Dutch Shell PLC, Class B (ADR) | 19,135,000 | 1,109,256 |
| Royal Dutch Shell PLC, Class B1 | 4,000,000 | 114,143 |
| Chevron Corp. | 7,594,755 | 893,903 |
| Exxon Mobil Corp. | 7,200,000 | 649,872 |
| ConocoPhillips | 12,837,668 | 643,681 |
| Enbridge Inc. | 13,900,000 | 585,468 |
| Noble Energy, Inc. | 11,593,729 | 441,257 |
| BP PLC1 | 58,950,000 | 366,285 |
| Halliburton Co. | 6,183,000 | 334,438 |
| Suncor Energy Inc. | 5,801,500 | 189,689 |
| Suncor Energy Inc. | 198,500 | 6,490 |
| Baker Hughes Inc. | 3,000,000 | 194,910 |
| Phillips 66 | 2,180,000 | 188,374 |
| Concho Resources Inc.2 | 1,090,000 | 144,534 |
| TOTAL SA1 | 1,539,588 | 78,593 |
| TOTAL SA (ADR) | 867,394 | 44,211 |
| Murphy Oil Corp. | 3,600,080 | 112,070 |
| Weatherford International PLC2 | 15,850,000 | 79,092 |
| Southwestern Energy Co.2 | 5,000,000 | 54,100 |
| | | 7,646,519 |
| Consumer staples 6.11% | | |
| Philip Morris International Inc. | 16,892,000 | 1,545,449 |
| Coca-Cola Co. | 30,068,000 | 1,246,619 |
| Kraft Heinz Co. | 11,620,850 | 1,014,733 |
| Procter & Gamble Co. | 9,837,563 | 827,142 |
| Walgreens Boots Alliance, Inc. | 3,800,000 | 314,488 |
| Reynolds American Inc. | 5,609,000 | 314,328 |
| Kellogg Co. | 3,150,000 | 232,187 |
| Altria Group, Inc. | 1,735,000 | 117,321 |
| Costco Wholesale Corp. | 700,000 | 112,077 |
| Mead Johnson Nutrition Co. | 1,345,000 | 95,172 |
| General Mills, Inc. | 1,500,000 | 92,655 |
| The Estée Lauder Companies Inc., Class A | 1,200,000 | 91,788 |
| Coty Inc., Class A | 3,722,754 | 68,164 |
| Pinnacle Foods Inc. | 1,002,000 | 53,557 |
| Coca-Cola European Partners PLC | 1,600,000 | 50,240 |
| | | 6,175,920 |
American Balanced Fund — Page 2 of 32
Common stocks
Health care 6.03% | Shares | Value
(000) |
| UnitedHealth Group Inc. | 9,647,500 | $1,543,986 |
| Merck & Co., Inc. | 21,332,000 | 1,255,815 |
| Johnson & Johnson | 6,610,000 | 761,538 |
| Express Scripts Holding Co.2 | 10,476,400 | 720,671 |
| Bristol-Myers Squibb Co. | 9,474,300 | 553,678 |
| Medtronic PLC | 6,005,000 | 427,736 |
| Thermo Fisher Scientific Inc. | 1,176,000 | 165,934 |
| Gilead Sciences, Inc. | 2,101,758 | 150,507 |
| Pfizer Inc. | 3,250,000 | 105,560 |
| Humana Inc. | 454,000 | 92,630 |
| Regeneron Pharmaceuticals, Inc.2 | 240,000 | 88,102 |
| Intercept Pharmaceuticals, Inc.2 | 706,622 | 76,774 |
| Vertex Pharmaceuticals Inc.2 | 998,500 | 73,559 |
| Amgen Inc. | 276,000 | 40,354 |
| Kite Pharma, Inc.2 | 830,000 | 37,217 |
| | | 6,094,061 |
| Industrials 4.62% | | |
| Boeing Co. | 9,052,000 | 1,409,215 |
| Lockheed Martin Corp. | 4,407,037 | 1,101,495 |
| General Electric Co. | 20,000,000 | 632,000 |
| Union Pacific Corp. | 2,826,000 | 293,000 |
| Parker-Hannifin Corp. | 2,000,000 | 280,000 |
| Nielsen Holdings PLC | 4,800,000 | 201,360 |
| Cummins Inc. | 1,350,000 | 184,504 |
| Deere & Co. | 1,600,000 | 164,864 |
| Rockwell Automation | 1,200,000 | 161,280 |
| Caterpillar Inc. | 1,300,000 | 120,562 |
| TransDigm Group Inc. | 381,000 | 94,854 |
| Rockwell Collins, Inc. | 360,000 | 33,394 |
| | | 4,676,528 |
| Materials 3.03% | | |
| E.I. du Pont de Nemours and Co. | 20,059,388 | 1,472,359 |
| Praxair, Inc. | 5,011,400 | 587,286 |
| Syngenta AG (ADR) | 4,000,000 | 316,200 |
| LyondellBasell Industries NV | 2,642,100 | 226,639 |
| Dow Chemical Co. | 2,500,000 | 143,050 |
| Royal Gold, Inc. | 1,770,000 | 112,130 |
| Nucor Corp. | 1,750,000 | 104,160 |
| Potash Corp. of Saskatchewan Inc. | 5,500,000 | 99,495 |
| | | 3,061,319 |
| Real estate 0.67% | | |
| Crown Castle International Corp. REIT | 2,905,446 | 252,105 |
| Iron Mountain Inc. REIT | 5,132,000 | 166,687 |
| Weyerhaeuser Co. REIT2 | 4,700,000 | 141,423 |
| American Tower Corp. REIT | 1,145,000 | 121,004 |
| | | 681,219 |
American Balanced Fund — Page 3 of 32
Common stocks
Utilities 0.43% | Shares | Value
(000) |
| Dominion Resources, Inc. | 3,070,000 | $235,131 |
| PG&E Corp. | 2,000,000 | 121,540 |
| Pinnacle West Capital Corp. | 1,000,000 | 78,030 |
| | | 434,701 |
| Telecommunication services 0.30% | | |
| AT&T Inc. | 4,295,000 | 182,666 |
| Verizon Communications Inc. | 2,236,000 | 119,358 |
| | | 302,024 |
| Miscellaneous 4.20% | | |
| Other common stocks in initial period of acquisition | | 4,244,326 |
| Total common stocks (cost: $40,695,500,000) | | 61,964,210 |
Preferred securities 0.01%
Financials 0.01% | | |
| CoBank, ACB, Class E, noncumulative4 | 7,440 | 4,745 |
| Total preferred securities (cost: $5,208,000) | | 4,745 |
Convertible stocks 0.06%
Miscellaneous 0.06% | | |
| Other convertible stocks in initial period of acquisition | | 59,764 |
| Total convertible stocks (cost: $59,055,000) | | 59,764 |
Bonds, notes & other debt instruments 34.47%
U.S. Treasury bonds & notes 14.14%
U.S. Treasury 11.88% | Principal amount
(000) | |
| U.S. Treasury 0.875% 2017 | $130,000 | 130,120 |
| U.S. Treasury 0.625% 20185 | 985,000 | 979,937 |
| U.S. Treasury 0.75% 2018 | 350,000 | 348,180 |
| U.S. Treasury 0.75% 2018 | 208,998 | 208,434 |
| U.S. Treasury 0.75% 2018 | 47,000 | 46,847 |
| U.S. Treasury 1.00% 2018 | 300,000 | 299,052 |
| U.S. Treasury 1.125% 2018 | 180,000 | 180,184 |
| U.S. Treasury 1.25% 2018 | 255,000 | 255,413 |
| U.S. Treasury 0.75% 2019 | 275,000 | 271,015 |
| U.S. Treasury 0.75% 2019 | 226,000 | 222,540 |
| U.S. Treasury 0.875% 2019 | 250,000 | 246,757 |
| U.S. Treasury 0.875% 2019 | 35,000 | 34,666 |
| U.S. Treasury 1.00% 2019 | 160,500 | 158,800 |
| U.S. Treasury 1.00% 2019 | 95,000 | 94,506 |
| U.S. Treasury 1.125% 2019 | 40,000 | 39,930 |
| U.S. Treasury 1.375% 2019 | 150,000 | 149,644 |
| U.S. Treasury 1.50% 2019 | 44,000 | 44,089 |
| U.S. Treasury 1.75% 2019 | 110,000 | 111,082 |
| U.S. Treasury 1.25% 2020 | 617,000 | 612,471 |
| U.S. Treasury 1.375% 2020 | 540,660 | 534,026 |
| U.S. Treasury 1.375% 2020 | 118,000 | 117,386 |
| U.S. Treasury 1.50% 2020 | 101,000 | 100,696 |
American Balanced Fund — Page 4 of 32
Bonds, notes & other debt instruments
U.S. Treasury bonds & notes (continued)
U.S. Treasury (continued) | Principal amount
(000) | Value
(000) |
| U.S. Treasury 1.625% 2020 | $400,991 | $399,408 |
| U.S. Treasury 1.125% 2021 | 469,875 | 457,249 |
| U.S. Treasury 1.125% 2021 | 224,250 | 216,691 |
| U.S. Treasury 1.125% 2021 | 4,000 | 3,859 |
| U.S. Treasury 1.25% 2021 | 100,900 | 98,574 |
| U.S. Treasury 1.375% 2021 | 409,480 | 401,720 |
| U.S. Treasury 1.375% 2021 | 301,960 | 297,183 |
| U.S. Treasury 1.75% 2021 | 200,250 | 198,780 |
| U.S. Treasury 2.00% 2021 | 475,620 | 475,323 |
| U.S. Treasury 2.25% 2021 | 97,270 | 98,805 |
| U.S. Treasury 1.75% 2022 | 469,265 | 460,410 |
| U.S. Treasury 2.00% 2022 | 179,750 | 178,598 |
| U.S. Treasury 2.00% 2022 | 35,000 | 35,062 |
| U.S. Treasury 1.375% 2023 | 297,860 | 282,163 |
| U.S. Treasury 1.375% 2023 | 100,000 | 94,777 |
| U.S. Treasury 1.375% 2023 | 36,935 | 35,096 |
| U.S. Treasury 1.625% 2023 | 27,675 | 26,635 |
| U.S. Treasury 1.75% 2023 | 32,790 | 32,047 |
| U.S. Treasury 2.125% 2023 | 100,000 | 99,375 |
| U.S. Treasury 2.25% 2023 | 100,000 | 100,098 |
| U.S. Treasury 2.25% 2024 | 75,000 | 74,563 |
| U.S. Treasury 2.00% 2025 | 30,000 | 29,208 |
| U.S. Treasury 2.125% 2025 | 25,000 | 24,518 |
| U.S. Treasury 2.25% 2025 | 43,000 | 42,462 |
| U.S. Treasury 1.625% 2026 | 288,112 | 268,699 |
| U.S. Treasury 1.625% 2026 | 157,611 | 147,299 |
| U.S. Treasury 2.00% 2026 | 701,677 | 675,364 |
| U.S. Treasury 5.375% 2031 | 20,000 | 26,606 |
| U.S. Treasury 2.75% 2042 | 32,950 | 31,071 |
| U.S. Treasury 2.875% 2043 | 36,410 | 35,110 |
| U.S. Treasury 3.125% 2043 | 48,025 | 48,563 |
| U.S. Treasury 3.125% 2044 | 39,797 | 40,193 |
| U.S. Treasury 3.625% 2044 | 25,000 | 27,660 |
| U.S. Treasury 2.50% 2045 | 115,000 | 102,165 |
| U.S. Treasury 2.875% 2045 | 110,000 | 105,550 |
| U.S. Treasury 3.00% 2045 | 110,500 | 108,690 |
| U.S. Treasury 3.00% 2045 | 25,000 | 24,599 |
| U.S. Treasury 2.50% 2046 | 76,255 | 67,567 |
| U.S. Treasury 2.875% 2046 | 992,060 | 955,195 |
| | | 12,012,710 |
| U.S. Treasury inflation-protected securities 2.25% | | |
| U.S. Treasury Inflation-Protected Security 0.125% 20176 | 106,423 | 106,669 |
| U.S. Treasury Inflation-Protected Security 2.375% 20176 | 119,862 | 119,879 |
| U.S. Treasury Inflation-Protected Security 2.625% 20176 | 116,628 | 119,465 |
| U.S. Treasury Inflation-Protected Security 2.125% 20196 | 56,293 | 59,487 |
| U.S. Treasury Inflation-Protected Security 0.125% 20216 | 101,988 | 102,647 |
| U.S. Treasury Inflation-Protected Security 0.125% 20246 | 98,746 | 97,151 |
| U.S. Treasury Inflation-Protected Security 0.625% 20246 | 340,361 | 346,799 |
| U.S. Treasury Inflation-Protected Security 0.375% 20256 | 418,765 | 416,896 |
| U.S. Treasury Inflation-Protected Security 2.375% 20256 | 64,118 | 73,656 |
| U.S. Treasury Inflation-Protected Security 0.125% 20266 | 60,505 | 58,566 |
| U.S. Treasury Inflation-Protected Security 0.625% 20266 | 122,451 | 123,624 |
| U.S. Treasury Inflation-Protected Security 1.75% 20286 | 31,037 | 34,685 |
American Balanced Fund — Page 5 of 32
Bonds, notes & other debt instruments
U.S. Treasury bonds & notes (continued)
U.S. Treasury inflation-protected securities (continued) | Principal amount
(000) | Value
(000) |
| U.S. Treasury Inflation-Protected Security 0.75% 20426 | $51,898 | $49,282 |
| U.S. Treasury Inflation-Protected Security 1.375% 20446 | 305,677 | 334,458 |
| U.S. Treasury Inflation-Protected Security 1.00% 20466 | 228,973 | 230,432 |
| | | 2,273,696 |
| Federal agency bonds & notes 0.01% | | |
| Japan Finance Organization for Municipalities 2.125% 20194 | 10,000 | 9,987 |
| Total U.S. Treasury bonds & notes | | 14,296,393 |
Corporate bonds & notes 11.81%
Financials 2.73% | | |
| ACE INA Holdings Inc. 2.30% 2020 | 7,635 | 7,631 |
| ACE INA Holdings Inc. 2.875% 2022 | 22,180 | 22,354 |
| ACE INA Holdings Inc. 3.15% 2025 | 10,050 | 10,012 |
| ACE INA Holdings Inc. 3.35% 2026 | 5,180 | 5,246 |
| Allstate Corp. 3.28% 2026 | 10,185 | 10,224 |
| American Express Co. 6.15% 2017 | 22,800 | 23,476 |
| American Express Credit Co. 1.55% 2017 | 9,055 | 9,066 |
| AXA SA, Series B, junior subordinated 6.379% (undated)4 | 2,000 | 2,140 |
| Bank of America Corp. 2.625% 2020 | 20,000 | 20,014 |
| Bank of America Corp. 5.625% 2020 | 15,500 | 17,045 |
| Bank of America Corp. 2.625% 2021 | 4,730 | 4,698 |
| Bank of America Corp. 2.503% 2022 | 29,000 | 28,052 |
| Bank of America Corp. 3.875% 2025 | 25,385 | 25,825 |
| Bank of America Corp. 3.248% 2027 | 52,015 | 49,689 |
| Bank of Nova Scotia 4.50% 2025 | 24,000 | 24,667 |
| Barclays Bank PLC 3.25% 2021 | 19,345 | 19,419 |
| Barclays Bank PLC 3.65% 2025 | 18,500 | 17,954 |
| BB&T Corp. 2.45% 2020 | 37,000 | 37,283 |
| Berkshire Hathaway Finance Corp. 1.30% 2019 | 15,320 | 15,133 |
| Berkshire Hathaway Inc. 2.00% 2018 | 16,340 | 16,457 |
| Berkshire Hathaway Inc. 2.90% 2020 | 9,500 | 9,727 |
| Berkshire Hathaway Inc. 2.75% 2023 | 16,995 | 16,928 |
| BNP Paribas 4.375% 20254 | 5,700 | 5,670 |
| BNP Paribas 4.375% 20264 | 28,425 | 28,087 |
| BPCE SA group 2.65% 2021 | 6,000 | 5,999 |
| BPCE SA group 2.75% 2021 | 15,800 | 15,644 |
| BPCE SA group 5.70% 20234 | 8,000 | 8,431 |
| BPCE SA group 5.15% 20244 | 40,605 | 41,297 |
| Capital One Financial Corp. 3.20% 2025 | 20,000 | 19,394 |
| Charles Schwab Corp. 3.45% 2026 | 3,885 | 3,918 |
| Citigroup Inc. 2.05% 2019 | 24,500 | 24,412 |
| Citigroup Inc. 8.50% 2019 | 8,416 | 9,603 |
| Citigroup Inc. 2.35% 2021 | 71,000 | 69,463 |
| Citigroup Inc. 2.70% 2021 | 24,500 | 24,447 |
| Citigroup Inc. 2.90% 2021 | 60,000 | 59,848 |
| Citigroup Inc. 3.20% 2026 | 20,000 | 19,135 |
| Citigroup Inc. 3.70% 2026 | 9,500 | 9,456 |
| Citigroup Inc. 4.45% 2027 | 4,763 | 4,853 |
| Citigroup Inc. 4.125% 2028 | 4,050 | 4,003 |
| CME Group Inc. 5.30% 2043 | 3,135 | 3,674 |
| CNA Financial Corp. 3.95% 2024 | 9,910 | 10,056 |
| Credit Agricole SA 2.375% 20214 | 6,645 | 6,541 |
| Credit Agricole SA 4.375% 20254 | 26,615 | 26,190 |
American Balanced Fund — Page 6 of 32
Bonds, notes & other debt instruments
Corporate bonds & notes (continued)
Financials (continued) | Principal amount
(000) | Value
(000) |
| Credit Suisse Group AG 1.70% 2018 | $12,000 | $11,974 |
| Credit Suisse Group AG 3.45% 2021 | 20,000 | 20,129 |
| Credit Suisse Group AG 3.80% 2022 | 10,000 | 10,091 |
| Credit Suisse Group AG 3.80% 2023 | 32,275 | 32,250 |
| Credit Suisse Group AG 3.75% 2025 | 11,570 | 11,400 |
| Credit Suisse Group AG 4.55% 2026 | 17,130 | 17,800 |
| Danske Bank AS 2.00% 20214 | 37,870 | 36,812 |
| DNB ASA 2.375% 20214 | 27,000 | 26,721 |
| Goldman Sachs Group, Inc. 2.90% 2018 | 15,000 | 15,210 |
| Goldman Sachs Group, Inc. 2.55% 2019 | 66,250 | 66,749 |
| Goldman Sachs Group, Inc. 2.60% 2020 | 14,610 | 14,627 |
| Goldman Sachs Group, Inc. 2.75% 2020 | 20,725 | 20,817 |
| Goldman Sachs Group, Inc. 2.242% 20217 | 25,782 | 26,139 |
| Goldman Sachs Group, Inc. 2.35% 2021 | 32,655 | 31,731 |
| Goldman Sachs Group, Inc. 2.625% 2021 | 24,340 | 24,167 |
| Goldman Sachs Group, Inc. 2.875% 2021 | 19,245 | 19,337 |
| Goldman Sachs Group, Inc. 5.25% 2021 | 20,000 | 21,923 |
| Goldman Sachs Group, Inc. 5.75% 2022 | 20,000 | 22,488 |
| Goldman Sachs Group, Inc. 3.50% 2025 | 3,250 | 3,208 |
| Goldman Sachs Group, Inc. 3.50% 2026 | 2,350 | 2,307 |
| Goldman Sachs Group, Inc. 3.75% 2026 | 12,629 | 12,672 |
| HSBC Holdings PLC 2.95% 2021 | 47,500 | 47,470 |
| HSBC Holdings PLC 4.25% 2024 | 8,000 | 8,132 |
| HSBC Holdings PLC 3.90% 2026 | 7,825 | 7,876 |
| Intercontinentalexchange, Inc. 2.50% 2018 | 20,000 | 20,274 |
| Intesa Sanpaolo SpA 5.017% 20244 | 31,485 | 29,110 |
| JPMorgan Chase & Co. 1.35% 2017 | 8,520 | 8,522 |
| JPMorgan Chase & Co. 2.25% 2020 | 42,185 | 42,078 |
| JPMorgan Chase & Co. 2.55% 2020 | 32,300 | 32,269 |
| JPMorgan Chase & Co. 2.40% 2021 | 40,220 | 39,840 |
| JPMorgan Chase & Co. 2.55% 2021 | 16,515 | 16,457 |
| JPMorgan Chase & Co. 3.25% 2022 | 10,000 | 10,110 |
| JPMorgan Chase & Co. 3.875% 2024 | 25,000 | 25,307 |
| JPMorgan Chase & Co., Series Z, junior subordinated 5.30% (undated) | 35,000 | 35,807 |
| JPMorgan Chase & Co., Series S, junior subordinated 6.75% (undated) | 25,000 | 26,969 |
| Keybank National Association 2.50% 2019 | 17,000 | 17,176 |
| Leucadia National Corp. 5.50% 2023 | 830 | 879 |
| Liberty Mutual Group Inc. 4.25% 20234 | 3,000 | 3,142 |
| Lloyds Banking Group PLC 4.50% 2024 | 17,000 | 17,265 |
| Lloyds Banking Group PLC 4.582% 2025 | 14,750 | 14,829 |
| MetLife Global Funding I 1.55% 20194 | 15,500 | 15,264 |
| MetLife Global Funding I 2.30% 20194 | 10,120 | 10,191 |
| MetLife Global Funding I 2.00% 20204 | 6,125 | 6,055 |
| MetLife Global Funding I 2.50% 20204 | 46,300 | 46,305 |
| MetLife Global Funding I 1.95% 20214 | 15,500 | 15,064 |
| MetLife, Inc. 3.60% 2025 | 4,595 | 4,671 |
| MetLife, Inc. 4.05% 2045 | 8,285 | 7,948 |
| MetLife, Inc. 5.25% 2049 | 4,600 | 4,669 |
| Mitsubishi UFJ Financial Group, Inc. 2.19% 2021 | 25,500 | 24,791 |
| Morgan Stanley 2.50% 2021 | 66,300 | 65,589 |
| Morgan Stanley 2.625% 2021 | 25,500 | 25,197 |
| Morgan Stanley 2.282% 20237 | 25,000 | 25,298 |
| Morgan Stanley 4.00% 2025 | 8,950 | 9,178 |
| Morgan Stanley 3.125% 2026 | 7,633 | 7,296 |
American Balanced Fund — Page 7 of 32
Bonds, notes & other debt instruments
Corporate bonds & notes (continued)
Financials (continued) | Principal amount
(000) | Value
(000) |
| Morgan Stanley 3.875% 2026 | $12,115 | $12,244 |
| National Australia Bank Ltd. 1.375% 2019 | 10,200 | 10,028 |
| National Australia Bank Ltd. 1.875% 2021 | 10,200 | 9,870 |
| Nationwide Mutual Insurance Co. 3.253% 20244,7 | 8,150 | 8,042 |
| New York Life Global Funding 1.50% 20194 | 15,265 | 15,059 |
| New York Life Global Funding 2.10% 20194 | 15,000 | 15,063 |
| New York Life Global Funding 1.95% 20204 | 16,000 | 15,883 |
| New York Life Global Funding 1.70% 20214 | 40,500 | 39,045 |
| New York Life Global Funding 2.35% 20264 | 11,890 | 11,078 |
| Nordea Bank AB 2.50% 20204 | 19,955 | 19,966 |
| Nordea Bank AB 2.25% 20214 | 8,800 | 8,660 |
| PNC Bank 1.45% 2019 | 33,375 | 32,919 |
| PNC Bank 2.40% 2019 | 14,800 | 14,935 |
| PNC Bank 2.60% 2020 | 30,000 | 30,252 |
| PNC Bank 2.55% 2021 | 17,000 | 17,009 |
| PNC Financial Services Group, Inc. 3.90% 2024 | 20,000 | 20,511 |
| Prudential Financial, Inc. 2.30% 2018 | 7,595 | 7,660 |
| Prudential Financial, Inc. 3.50% 2024 | 23,600 | 24,099 |
| QBE Insurance Group Ltd. 2.40% 20184 | 19,300 | 19,335 |
| Rabobank Nederland 2.25% 2019 | 15,000 | 15,079 |
| Rabobank Nederland 2.50% 2021 | 38,570 | 38,554 |
| Rabobank Nederland 4.375% 2025 | 22,650 | 23,253 |
| Skandinaviska Enskilda Banken AB 1.875% 2021 | 25,500 | 24,653 |
| Skandinaviska Enskilda Banken AB 2.625% 2021 | 23,000 | 23,017 |
| Sumitomo Mitsui Banking Corp. 2.50% 2018 | 12,475 | 12,576 |
| Svenska Handelsbanken AB 1.875% 2021 | 37,165 | 36,034 |
| UBS Group AG 2.95% 20204 | 20,000 | 20,011 |
| UBS Group AG 4.125% 20254 | 28,250 | 28,705 |
| Unum Group 5.625% 2020 | 345 | 376 |
| Unum Group 3.875% 2025 | 5,045 | 4,933 |
| US Bancorp. 3.70% 2024 | 18,000 | 18,710 |
| US Bancorp. 2.375% 2026 | 35,000 | 32,463 |
| US Bank NA 1.40% 2019 | 5,465 | 5,405 |
| US Bank NA 2.125% 2019 | 30,000 | 30,106 |
| Wells Fargo & Co. 2.15% 2019 | 20,000 | 19,994 |
| Wells Fargo & Co. 2.55% 2020 | 28,235 | 28,261 |
| Wells Fargo & Co. 2.10% 2021 | 35,600 | 34,631 |
| Wells Fargo & Co. 2.50% 2021 | 67,182 | 66,667 |
| Wells Fargo & Co. 4.60% 2021 | 25,000 | 26,857 |
| Wells Fargo & Co. 3.00% 2026 | 26,700 | 25,418 |
| | | 2,760,102 |
| Health care 1.96% | | |
| Abbott Laboratories 2.90% 2021 | 49,920 | 49,858 |
| Abbott Laboratories 3.40% 2023 | 16,745 | 16,688 |
| Abbott Laboratories 3.75% 2026 | 61,670 | 61,336 |
| Abbott Laboratories 4.75% 2036 | 20,850 | 21,230 |
| Abbott Laboratories 4.90% 2046 | 41,695 | 42,878 |
| AbbVie Inc. 2.50% 2020 | 10,400 | 10,405 |
| AbbVie Inc. 2.30% 2021 | 25,485 | 24,974 |
| AbbVie Inc. 3.20% 2022 | 5,685 | 5,690 |
| AbbVie Inc. 2.85% 2023 | 11,095 | 10,767 |
| AbbVie Inc. 3.60% 2025 | 23,000 | 22,792 |
| AbbVie Inc. 3.20% 2026 | 36,045 | 34,313 |
American Balanced Fund — Page 8 of 32
Bonds, notes & other debt instruments
Corporate bonds & notes (continued)
Health care (continued) | Principal amount
(000) | Value
(000) |
| AbbVie Inc. 4.50% 2035 | $10,360 | $10,195 |
| AbbVie Inc. 4.30% 2036 | 4,730 | 4,515 |
| AbbVie Inc. 4.45% 2046 | 36,500 | 35,020 |
| Aetna Inc. 1.70% 2018 | 42,635 | 42,604 |
| Aetna Inc. 1.90% 2019 | 49,000 | 48,904 |
| Aetna Inc. 2.40% 2021 | 66,940 | 66,647 |
| Aetna Inc. 2.80% 2023 | 8,685 | 8,558 |
| Aetna Inc. 3.20% 2026 | 88,065 | 87,167 |
| Aetna Inc. 4.25% 2036 | 8,360 | 8,396 |
| Aetna Inc. 4.375% 2046 | 7,215 | 7,260 |
| Allergan PLC 3.00% 2020 | 26,950 | 27,330 |
| Allergan PLC 3.45% 2022 | 32,390 | 32,882 |
| Allergan PLC 3.85% 2024 | 15,000 | 15,140 |
| Allergan PLC 3.80% 2025 | 25,550 | 25,592 |
| Allergan PLC 4.55% 2035 | 18,870 | 18,706 |
| Allergan PLC 4.75% 2045 | 53,080 | 52,211 |
| AmerisourceBergen Corp. 3.25% 2025 | 2,170 | 2,153 |
| AmerisourceBergen Corp. 4.25% 2045 | 2,045 | 1,962 |
| Amgen Inc. 1.85% 2021 | 16,470 | 15,871 |
| Amgen Inc. 2.70% 2022 | 21,240 | 21,035 |
| Amgen Inc. 2.25% 2023 | 10,250 | 9,646 |
| Amgen Inc. 4.40% 2045 | 30,250 | 29,088 |
| AstraZeneca PLC 3.375% 2025 | 41,445 | 41,148 |
| Baxalta Inc. 4.00% 2025 | 29,020 | 29,118 |
| Bayer AG 2.375% 20194 | 8,245 | 8,259 |
| Becton, Dickinson and Co. 3.734% 2024 | 2,896 | 2,964 |
| Biogen Inc. 3.625% 2022 | 10,210 | 10,482 |
| Boston Scientific Corp. 3.375% 2022 | 20,000 | 20,332 |
| Boston Scientific Corp. 3.85% 2025 | 72,550 | 72,728 |
| Catholic Health Initiatives, Series 2012, 1.60% 2017 | 2,000 | 2,009 |
| Celgene Corp. 3.55% 2022 | 10,770 | 11,048 |
| Celgene Corp. 3.625% 2024 | 32,655 | 32,828 |
| Celgene Corp. 3.875% 2025 | 38,540 | 39,110 |
| Celgene Corp. 4.625% 2044 | 2,400 | 2,354 |
| Celgene Corp. 5.00% 2045 | 10,000 | 10,417 |
| EMD Finance LLC 2.40% 20204 | 24,900 | 24,756 |
| EMD Finance LLC 2.95% 20224 | 12,850 | 12,798 |
| EMD Finance LLC 3.25% 20254 | 50,700 | 49,586 |
| Gilead Sciences, Inc. 2.35% 2020 | 10,000 | 10,051 |
| Gilead Sciences, Inc. 1.95% 2022 | 15,410 | 14,905 |
| Gilead Sciences, Inc. 2.50% 2023 | 18,280 | 17,623 |
| Gilead Sciences, Inc. 2.95% 2027 | 10,000 | 9,568 |
| Gilead Sciences, Inc. 4.00% 2036 | 21,220 | 20,354 |
| Gilead Sciences, Inc. 4.15% 2047 | 7,205 | 6,846 |
| Humana Inc. 3.15% 2022 | 20,000 | 19,989 |
| Johnson & Johnson 2.45% 2026 | 9,485 | 9,069 |
| Medtronic, Inc. 3.50% 2025 | 37,500 | 38,605 |
| Medtronic, Inc. 4.375% 2035 | 7,222 | 7,643 |
| Medtronic, Inc. 4.625% 2045 | 8,220 | 8,893 |
| Pfizer Inc. 7.20% 2039 | 485 | 701 |
| Roche Holdings, Inc. 2.875% 20214 | 22,000 | 22,372 |
| Roche Holdings, Inc. 1.75% 20224 | 18,330 | 17,610 |
| Roche Holdings, Inc. 3.00% 20254 | 19,000 | 18,832 |
| Roche Holdings, Inc. 2.375% 20274 | 19,685 | 18,418 |
American Balanced Fund — Page 9 of 32
Bonds, notes & other debt instruments
Corporate bonds & notes (continued)
Health care (continued) | Principal amount
(000) | Value
(000) |
| Shire PLC 1.90% 2019 | $20,000 | $19,750 |
| Shire PLC 2.40% 2021 | 54,555 | 52,708 |
| Shire PLC 2.875% 2023 | 38,195 | 36,315 |
| Shire PLC 3.20% 2026 | 32,450 | 30,344 |
| St. Jude Medical, Inc. 2.80% 2020 | 13,870 | 13,950 |
| Stryker Corp. 2.625% 2021 | 5,200 | 5,221 |
| Teva Pharmaceutical Finance Company BV 1.40% 2018 | 43,665 | 43,318 |
| Teva Pharmaceutical Finance Company BV 1.70% 2019 | 44,530 | 43,760 |
| Teva Pharmaceutical Finance Company BV 2.20% 2021 | 31,195 | 29,848 |
| Teva Pharmaceutical Finance Company BV 2.80% 2023 | 15,940 | 15,094 |
| Teva Pharmaceutical Finance Company BV 3.15% 2026 | 22,675 | 20,916 |
| Teva Pharmaceutical Finance Company BV 4.10% 2046 | 13,140 | 11,282 |
| Thermo Fisher Scientific Inc. 2.40% 2019 | 10,000 | 10,077 |
| Thermo Fisher Scientific Inc. 4.15% 2024 | 11,840 | 12,334 |
| UnitedHealth Group Inc. 1.40% 2017 | 10,000 | 10,003 |
| UnitedHealth Group Inc. 6.00% 2017 | 20,170 | 20,586 |
| UnitedHealth Group Inc. 6.00% 2018 | 35,000 | 36,699 |
| UnitedHealth Group Inc. 2.125% 2021 | 26,195 | 25,882 |
| UnitedHealth Group Inc. 3.35% 2022 | 15,405 | 15,867 |
| WellPoint, Inc. 2.25% 2019 | 15,500 | 15,471 |
| Zimmer Holdings, Inc. 2.70% 2020 | 12,915 | 12,918 |
| Zimmer Holdings, Inc. 3.15% 2022 | 18,910 | 18,862 |
| Zimmer Holdings, Inc. 4.25% 2035 | 1,197 | 1,118 |
| | | 1,985,552 |
| Consumer discretionary 1.59% | | |
| Amazon.com, Inc. 3.80% 2024 | 49,975 | 52,539 |
| Amazon.com, Inc. 4.80% 2034 | 20,000 | 22,047 |
| Amazon.com, Inc. 4.95% 2044 | 23,500 | 26,856 |
| American Honda Finance Corp. 1.20% 2019 | 25,500 | 25,045 |
| American Honda Finance Corp. 2.25% 2019 | 16,500 | 16,659 |
| American Honda Finance Corp. 1.65% 2021 | 28,865 | 27,791 |
| American Honda Finance Corp. 2.30% 2026 | 5,390 | 5,030 |
| Bayerische Motoren Werke AG 2.25% 20234 | 15,500 | 14,852 |
| CBS Corp. 3.50% 2025 | 15,000 | 14,865 |
| CBS Corp. 4.60% 2045 | 25,000 | 24,108 |
| CCO Holdings LLC and CCO Holdings Capital Corp. 4.464% 2022 | 22,500 | 23,517 |
| CCO Holdings LLC and CCO Holdings Capital Corp. 4.908% 2025 | 26,000 | 27,415 |
| CCO Holdings LLC and CCO Holdings Capital Corp. 6.384% 2035 | 11,125 | 12,721 |
| CCO Holdings LLC and CCO Holdings Capital Corp. 6.484% 2045 | 18,025 | 20,875 |
| Comcast Corp. 6.30% 2017 | 16,750 | 17,445 |
| Comcast Corp. 1.625% 2022 | 10,250 | 9,814 |
| Comcast Corp. 3.15% 2026 | 11,215 | 11,063 |
| Comcast Corp. 2.35% 2027 | 27,250 | 25,178 |
| Comcast Corp. 3.20% 2036 | 7,250 | 6,524 |
| Comcast Corp. 6.45% 2037 | 15,000 | 19,373 |
| Comcast Corp. 4.60% 2045 | 20,000 | 20,974 |
| Comcast Corp. 3.40% 2046 | 5,250 | 4,587 |
| DaimlerChrysler North America Holding Corp. 1.375% 20174 | 15,125 | 15,126 |
| DaimlerChrysler North America Holding Corp. 2.40% 20174 | 12,000 | 12,038 |
| DaimlerChrysler North America Holding Corp. 1.50% 20194 | 25,500 | 25,087 |
| DaimlerChrysler North America Holding Corp. 2.25% 20194 | 13,000 | 13,007 |
| DaimlerChrysler North America Holding Corp. 2.25% 20204 | 20,810 | 20,710 |
| DaimlerChrysler North America Holding Corp. 2.00% 20214 | 30,300 | 29,414 |
American Balanced Fund — Page 10 of 32
Bonds, notes & other debt instruments
Corporate bonds & notes (continued)
Consumer discretionary (continued) | Principal amount
(000) | Value
(000) |
| DaimlerChrysler North America Holding Corp. 2.875% 20214 | $14,900 | $14,988 |
| DaimlerChrysler North America Holding Corp. 3.25% 20244 | 7,570 | 7,534 |
| Ford Motor Co. 5.291% 2046 | 10,000 | 10,149 |
| Ford Motor Credit Co. 1.50% 2017 | 8,500 | 8,501 |
| Ford Motor Credit Co. 2.145% 2018 | 15,485 | 15,510 |
| Ford Motor Credit Co. 2.375% 2018 | 8,990 | 9,031 |
| Ford Motor Credit Co. 2.551% 2018 | 9,015 | 9,068 |
| Ford Motor Credit Co. 2.597% 2019 | 26,735 | 26,700 |
| Ford Motor Credit Co. 2.943% 2019 | 21,000 | 21,243 |
| Ford Motor Credit Co. 2.459% 2020 | 18,090 | 17,860 |
| Ford Motor Credit Co. 3.157% 2020 | 30,400 | 30,630 |
| Ford Motor Credit Co. 3.219% 2022 | 16,000 | 15,823 |
| Ford Motor Credit Co. 3.096% 2023 | 24,000 | 23,185 |
| Ford Motor Credit Co. 4.375% 2023 | 15,475 | 15,976 |
| Ford Motor Credit Co. 3.664% 2024 | 10,000 | 9,762 |
| Ford Motor Credit Co. 4.134% 2025 | 21,355 | 21,425 |
| Ford Motor Credit Co. 4.389% 2026 | 13,000 | 13,182 |
| General Motors Co. 6.60% 2036 | 11,785 | 13,489 |
| General Motors Financial Co. 2.35% 2019 | 18,000 | 17,792 |
| General Motors Financial Co. 2.40% 2019 | 20,435 | 20,384 |
| General Motors Financial Co. 3.50% 2019 | 4,685 | 4,771 |
| General Motors Financial Co. 3.70% 2020 | 42,325 | 43,061 |
| General Motors Financial Co. 3.20% 2021 | 23,600 | 23,407 |
| General Motors Financial Co. 4.20% 2021 | 23,000 | 23,669 |
| General Motors Financial Co. 4.375% 2021 | 5,500 | 5,706 |
| General Motors Financial Co. 3.45% 2022 | 52,100 | 51,532 |
| General Motors Financial Co. 3.70% 2023 | 28,200 | 27,757 |
| General Motors Financial Co. 4.30% 2025 | 18,175 | 18,038 |
| General Motors Financial Co. 4.00% 2026 | 17,545 | 16,890 |
| Home Depot, Inc. 2.00% 2021 | 18,000 | 17,852 |
| Home Depot, Inc. 4.40% 2021 | 15,000 | 16,260 |
| Home Depot, Inc. 2.125% 2026 | 25,000 | 23,054 |
| Home Depot, Inc. 5.95% 2041 | 7,500 | 9,538 |
| Home Depot, Inc. 4.25% 2046 | 19,800 | 20,796 |
| Home Depot, Inc. 3.50% 2056 | 19,215 | 16,829 |
| Hyundai Capital America 2.00% 20194 | 11,960 | 11,870 |
| Hyundai Capital America 2.45% 20214 | 33,000 | 32,251 |
| Lowe’s Companies, Inc. 2.50% 2026 | 23,310 | 22,131 |
| McDonald’s Corp. 3.70% 2026 | 17,905 | 18,238 |
| NBC Universal Enterprise, Inc. 5.25% 20494 | 475 | 500 |
| Newell Rubbermaid Inc. 3.15% 2021 | 43,135 | 43,904 |
| Newell Rubbermaid Inc. 3.85% 2023 | 31,830 | 33,028 |
| Newell Rubbermaid Inc. 4.20% 2026 | 58,710 | 61,265 |
| Newell Rubbermaid Inc. 5.50% 2046 | 10,800 | 12,404 |
| NIKE, Inc. 2.375% 2026 | 25,500 | 24,052 |
| NIKE, Inc. 3.375% 2046 | 20,500 | 18,521 |
| Nordstrom, Inc. 4.00% 2021 | 6,245 | 6,540 |
| Starbucks Corp. 2.10% 2021 | 1,395 | 1,390 |
| Thomson Reuters Corp. 1.65% 2017 | 4,965 | 4,971 |
| Thomson Reuters Corp. 6.50% 2018 | 20,815 | 22,236 |
| Thomson Reuters Corp. 4.30% 2023 | 4,500 | 4,710 |
| Thomson Reuters Corp. 3.35% 2026 | 12,410 | 12,062 |
| Thomson Reuters Corp. 5.65% 2043 | 2,000 | 2,207 |
| Time Warner Cable Inc. 6.75% 2018 | 20,000 | 21,357 |
American Balanced Fund — Page 11 of 32
Bonds, notes & other debt instruments
Corporate bonds & notes (continued)
Consumer discretionary (continued) | Principal amount
(000) | Value
(000) |
| Time Warner Inc. 3.80% 2027 | $6,045 | $6,004 |
| Toyota Motor Credit Corp. 2.15% 2020 | 18,500 | 18,463 |
| Toyota Motor Credit Corp. 2.25% 2023 | 30,985 | 29,862 |
| Volkswagen International Finance NV 2.375% 20174 | 16,000 | 16,043 |
| | | 1,610,061 |
| Energy 1.58% | | |
| Anadarko Petroleum Corp. 4.85% 2021 | 24,635 | 26,418 |
| Anadarko Petroleum Corp. 5.55% 2026 | 13,895 | 15,560 |
| Anadarko Petroleum Corp. 6.45% 2036 | 685 | 816 |
| Anadarko Petroleum Corp. 6.60% 2046 | 16,735 | 20,677 |
| APT Pipelines Ltd. 4.20% 20254 | 27,300 | 27,229 |
| Canadian Natural Resources Ltd. 5.70% 2017 | 11,925 | 12,103 |
| Canadian Natural Resources Ltd. 3.80% 2024 | 1,720 | 1,715 |
| Cenovus Energy Inc. 3.00% 2022 | 2,000 | 1,934 |
| Cenovus Energy Inc. 3.80% 2023 | 20,710 | 20,222 |
| Chevron Corp. 2.10% 2021 | 32,000 | 31,717 |
| Chevron Corp. 2.566% 2023 | 13,000 | 12,813 |
| Chevron Corp. 3.326% 2025 | 8,700 | 8,865 |
| Chevron Corp. 2.954% 2026 | 6,700 | 6,589 |
| ConocoPhillips 4.20% 2021 | 34,295 | 36,434 |
| ConocoPhillips 4.95% 2026 | 18,000 | 19,882 |
| Devon Energy Corp. 5.00% 2045 | 17,340 | 17,066 |
| Diamond Offshore Drilling, Inc. 4.875% 2043 | 26,725 | 19,117 |
| Enbridge Energy Partners, LP 9.875% 2019 | 11,250 | 12,787 |
| Enbridge Energy Partners, LP 4.375% 2020 | 15,730 | 16,424 |
| Enbridge Energy Partners, LP 4.20% 2021 | 300 | 312 |
| Enbridge Energy Partners, LP 5.875% 2025 | 48,445 | 54,037 |
| Enbridge Energy Partners, LP 5.50% 2040 | 15,000 | 14,921 |
| Enbridge Energy Partners, LP 7.375% 2045 | 19,575 | 24,321 |
| Enbridge Energy Partners, LP, Series B, 6.50% 2018 | 17,370 | 18,281 |
| Enbridge Energy Partners, LP, Series B, 7.50% 2038 | 12,250 | 14,671 |
| Enbridge Inc. 5.60% 2017 | 10,000 | 10,103 |
| Enbridge Inc. 4.00% 2023 | 37,535 | 38,120 |
| Enbridge Inc. 3.50% 2024 | 990 | 965 |
| Enbridge Inc. 4.25% 2026 | 12,235 | 12,534 |
| Enbridge Inc. 5.50% 2046 | 21,595 | 23,254 |
| Energy Transfer Partners, LP 4.15% 2020 | 11,500 | 11,910 |
| Energy Transfer Partners, LP 4.75% 2026 | 16,100 | 16,653 |
| Energy Transfer Partners, LP 6.125% 2045 | 14,990 | 15,976 |
| EnLink Midstream Partners, LP 4.40% 2024 | 16,245 | 16,148 |
| EnLink Midstream Partners, LP 4.15% 2025 | 37,740 | 36,650 |
| EnLink Midstream Partners, LP 4.85% 2026 | 25,000 | 25,231 |
| EnLink Midstream Partners, LP 5.05% 2045 | 9,405 | 8,541 |
| Enterprise Products Operating LLC 5.20% 2020 | 6,355 | 6,940 |
| Enterprise Products Operating LLC 2.85% 2021 | 21,135 | 21,299 |
| Enterprise Products Operating LLC 3.90% 2024 | 16,545 | 17,071 |
| Enterprise Products Operating LLC 3.95% 2027 | 550 | 564 |
| Enterprise Products Operating LLC 4.90% 2046 | 8,405 | 8,645 |
| EOG Resources, Inc. 4.15% 2026 | 10,220 | 10,700 |
| Exxon Mobil Corp. 2.222% 2021 | 18,000 | 18,006 |
| Exxon Mobil Corp. 2.726% 2023 | 12,000 | 12,039 |
| Halliburton Co. 3.80% 2025 | 44,890 | 45,626 |
| Halliburton Co. 5.00% 2045 | 32,870 | 35,718 |
American Balanced Fund — Page 12 of 32
Bonds, notes & other debt instruments
Corporate bonds & notes (continued)
Energy (continued) | Principal amount
(000) | Value
(000) |
| Kinder Morgan Energy Partners, LP 6.00% 2017 | $18,000 | $18,055 |
| Kinder Morgan Energy Partners, LP 2.65% 2019 | 20,000 | 20,108 |
| Kinder Morgan Energy Partners, LP 9.00% 2019 | 4,395 | 4,950 |
| Kinder Morgan Energy Partners, LP 3.50% 2021 | 3,980 | 4,041 |
| Kinder Morgan Energy Partners, LP 4.15% 2022 | 12,855 | 13,193 |
| Kinder Morgan Energy Partners, LP 4.25% 2024 | 10,545 | 10,796 |
| Kinder Morgan Energy Partners, LP 5.40% 2044 | 13,135 | 13,116 |
| Kinder Morgan Energy Partners, LP 5.50% 2044 | 4,571 | 4,668 |
| Kinder Morgan Finance Co. 5.05% 2046 | 13,241 | 13,132 |
| Kinder Morgan, Inc. 3.05% 2019 | 17,150 | 17,400 |
| Kinder Morgan, Inc. 4.30% 2025 | 19,285 | 19,864 |
| Kinder Morgan, Inc. 5.30% 2034 | 8,205 | 8,339 |
| Kinder Morgan, Inc. 5.55% 2045 | 11,835 | 12,470 |
| Noble Corp. PLC 7.20% 2025 | 8,745 | 8,242 |
| Petróleos Mexicanos 5.50% 2021 | 9,500 | 9,785 |
| Petróleos Mexicanos 6.375% 20214 | 12,110 | 12,927 |
| Petróleos Mexicanos 5.375% 20224 | 16,135 | 16,542 |
| Petróleos Mexicanos 3.50% 2023 | 22,000 | 20,251 |
| Petróleos Mexicanos 4.625% 20234 | 10,000 | 9,753 |
| Petróleos Mexicanos 6.875% 20264 | 11,350 | 12,003 |
| Petróleos Mexicanos 6.50% 20274 | 21,055 | 21,745 |
| Petróleos Mexicanos 5.50% 2044 | 2,173 | 1,819 |
| Petróleos Mexicanos 5.625% 2046 | 25,290 | 21,086 |
| Petróleos Mexicanos 6.75% 20474 | 29,952 | 28,374 |
| Phillips 66 Partners LP 3.605% 2025 | 5,380 | 5,271 |
| Phillips 66 Partners LP 3.55% 2026 | 3,350 | 3,244 |
| Phillips 66 Partners LP 4.90% 2046 | 20,100 | 19,339 |
| Pioneer Natural Resources Co. 3.45% 2021 | 11,530 | 11,784 |
| Pioneer Natural Resources Co. 4.45% 2026 | 6,370 | 6,765 |
| Royal Dutch Shell PLC 1.75% 2021 | 31,065 | 30,179 |
| Royal Dutch Shell PLC 3.75% 2046 | 31,750 | 29,228 |
| Schlumberger BV 3.00% 20204 | 14,535 | 14,839 |
| Schlumberger BV 3.625% 20224 | 29,365 | 30,426 |
| Schlumberger BV 4.00% 20254 | 25,565 | 26,785 |
| Shell International Finance BV 2.25% 2020 | 49,450 | 49,370 |
| Shell International Finance BV 1.875% 2021 | 46,355 | 45,310 |
| Shell International Finance BV 2.875% 2026 | 11,500 | 11,115 |
| Spectra Energy Partners, LP 4.75% 2024 | 7,030 | 7,466 |
| Spectra Energy Partners, LP 3.375% 2026 | 6,160 | 5,895 |
| Spectra Energy Partners, LP 4.50% 2045 | 6,765 | 6,445 |
| Statoil ASA 3.125% 2017 | 16,500 | 16,689 |
| Statoil ASA 2.75% 2021 | 5,395 | 5,447 |
| Statoil ASA 3.25% 2024 | 1,690 | 1,713 |
| Statoil ASA 4.25% 2041 | 6,000 | 5,991 |
| TC PipeLines, LP 4.375% 2025 | 7,880 | 7,947 |
| TransCanada PipeLines Ltd. 5.00% 2043 | 12,000 | 13,335 |
| TransCanada PipeLines Ltd., junior subordinated 5.625% 2075 | 6,410 | 6,490 |
| Western Gas Partners LP 3.95% 2025 | 3,730 | 3,680 |
| Western Gas Partners LP 4.65% 2026 | 7,045 | 7,298 |
| Williams Partners LP 4.50% 2023 | 12,400 | 12,742 |
| Williams Partners LP 4.30% 2024 | 16,170 | 16,335 |
| Williams Partners LP 3.90% 2025 | 12,000 | 11,774 |
| Williams Partners LP 4.00% 2025 | 4,800 | 4,748 |
American Balanced Fund — Page 13 of 32
Bonds, notes & other debt instruments
Corporate bonds & notes (continued)
Energy (continued) | Principal amount
(000) | Value
(000) |
| Williams Partners LP 5.10% 2045 | $13,795 | $13,136 |
| Woodside Petroleum Ltd. 3.65% 20254 | 12,400 | 12,119 |
| | | 1,593,168 |
| Utilities 0.91% | | |
| Ameren Corp. 3.65% 2026 | 1,410 | 1,418 |
| American Electric Power Co., Inc. 2.95% 2022 | 13,694 | 13,783 |
| American Electric Power Co., Inc. 2.75% 2026 | 5,690 | 5,372 |
| Berkshire Hathaway Energy Co. 2.40% 2020 | 13,643 | 13,682 |
| CMS Energy Corp. 8.75% 2019 | 5,797 | 6,695 |
| CMS Energy Corp. 5.05% 2022 | 9,215 | 10,096 |
| CMS Energy Corp. 3.875% 2024 | 14,310 | 14,889 |
| CMS Energy Corp. 3.60% 2025 | 1,595 | 1,615 |
| Comision Federal de Electricidad 4.75% 20274 | 10,725 | 10,323 |
| Commonwealth Edison Company 2.55% 2026 | 16,785 | 15,987 |
| Commonwealth Edison Company 4.35% 2045 | 8,345 | 8,731 |
| Consumers Energy Co. 3.375% 2023 | 1,435 | 1,480 |
| Consumers Energy Co. 3.125% 2024 | 10,520 | 10,595 |
| Consumers Energy Co. 3.25% 2046 | 10,635 | 9,393 |
| Dominion Resources, Inc. 1.875% 20184 | 25,000 | 24,965 |
| Dominion Resources, Inc. 1.60% 2019 | 3,660 | 3,605 |
| Dominion Resources, Inc. 2.962% 2019 | 11,040 | 11,179 |
| Dominion Resources, Inc. 2.00% 2021 | 13,335 | 12,934 |
| Dominion Resources, Inc. 4.104% 2021 | 26,180 | 27,275 |
| Duke Energy Carolinas, Inc. 2.50% 2023 | 2,700 | 2,675 |
| Duke Energy Corp. 1.80% 2021 | 10,635 | 10,246 |
| Duke Energy Corp. 3.75% 2024 | 24,295 | 25,064 |
| Duke Energy Corp. 2.65% 2026 | 10,250 | 9,572 |
| Duke Energy Corp. 3.75% 2046 | 10,250 | 9,247 |
| Duke Energy Progress Inc. 4.15% 2044 | 26,190 | 26,031 |
| Duke Energy Progress Inc. 3.70% 2046 | 29,270 | 27,729 |
| E.ON International Finance BV 5.80% 20184 | 24,450 | 25,648 |
| Electricité de France SA 2.35% 20204 | 4,600 | 4,555 |
| Electricité de France SA 6.95% 20394 | 9,000 | 11,301 |
| Emera Inc. 6.75% 2076 | 11,600 | 12,470 |
| Emera US Finance LP 2.15% 20194 | 9,165 | 9,151 |
| Emera US Finance LP 2.70% 20214 | 11,940 | 11,820 |
| Emera US Finance LP 3.55% 20264 | 17,715 | 17,424 |
| Enersis Américas SA 4.00% 2026 | 4,330 | 4,141 |
| Entergy Corp. 2.95% 2026 | 24,040 | 22,501 |
| Eversource Energy 2.50% 2021 | 10,200 | 10,129 |
| Eversource Energy 2.70% 2026 | 4,085 | 3,925 |
| Exelon Corp. 2.85% 2020 | 15,000 | 15,164 |
| Exelon Corp. 3.40% 2026 | 2,840 | 2,788 |
| Exelon Corp. 4.45% 2046 | 12,640 | 12,399 |
| MidAmerican Energy Co. 2.40% 2019 | 5,500 | 5,567 |
| MidAmerican Energy Holdings Co. 5.75% 2018 | 15,300 | 16,074 |
| MidAmerican Energy Holdings Co. 3.75% 2023 | 20,000 | 20,922 |
| National Rural Utilities Cooperative Finance Corp. 10.375% 2018 | 8,450 | 9,745 |
| National Rural Utilities Cooperative Finance Corp. 2.15% 2019 | 18,000 | 18,137 |
| National Rural Utilities Cooperative Finance Corp. 2.00% 2020 | 14,460 | 14,353 |
| National Rural Utilities Cooperative Finance Corp. 2.30% 2020 | 13,625 | 13,540 |
| National Rural Utilities Cooperative Finance Corp. 2.70% 2023 | 5,400 | 5,364 |
| National Rural Utilities Cooperative Finance Corp. 3.25% 2025 | 15,500 | 15,716 |
American Balanced Fund — Page 14 of 32
Bonds, notes & other debt instruments
Corporate bonds & notes (continued)
Utilities (continued) | Principal amount
(000) | Value
(000) |
| Niagara Mohawk Power Corp. 3.508% 20244 | $6,375 | $6,492 |
| Northeast Utilities 1.60% 2018 | 10,000 | 9,979 |
| Northeast Utilities 3.15% 2025 | 8,845 | 8,737 |
| Northern States Power Co. 4.125% 2044 | 18,000 | 18,309 |
| NV Energy, Inc 6.25% 2020 | 10,168 | 11,532 |
| Ohio Power Co., Series G, 6.60% 2033 | 165 | 203 |
| Pacific Gas and Electric Co. 3.25% 2023 | 6,742 | 6,881 |
| Pacific Gas and Electric Co. 3.85% 2023 | 21,430 | 22,617 |
| Pacific Gas and Electric Co. 3.40% 2024 | 3,369 | 3,444 |
| Pacific Gas and Electric Co. 3.75% 2024 | 20,000 | 20,841 |
| Pacific Gas and Electric Co. 2.95% 2026 | 11,205 | 10,984 |
| Pacific Gas and Electric Co. 4.75% 2044 | 4,930 | 5,421 |
| Pacific Gas and Electric Co. 4.30% 2045 | 3,170 | 3,249 |
| PacifiCorp. 3.35% 2025 | 7,800 | 7,914 |
| PacifiCorp., First Mortgage Bonds, 5.65% 2018 | 2,465 | 2,612 |
| PacifiCorp., First Mortgage Bonds, 3.60% 2024 | 18,405 | 19,138 |
| PG&E Corp. 2.40% 2019 | 9,380 | 9,418 |
| Public Service Electric and Gas Co., 1.90% 2021 | 6,810 | 6,687 |
| Public Service Electric and Gas Co., 2.375% 2023 | 2,075 | 2,028 |
| Public Service Electric and Gas Co., 3.05% 2024 | 13,425 | 13,527 |
| Public Service Enterprise Group Inc. 2.00% 2021 | 7,985 | 7,733 |
| Public Service Enterprise Group Inc. 2.25% 2026 | 3,875 | 3,595 |
| Puget Energy, Inc. 6.50% 2020 | 5,750 | 6,483 |
| Puget Energy, Inc. 6.00% 2021 | 13,200 | 14,785 |
| Puget Energy, Inc. 5.625% 2022 | 14,950 | 16,557 |
| Puget Energy, Inc. 3.65% 2025 | 9,400 | 9,268 |
| Sierra Pacific Power Co. 2.60% 2026 | 8,000 | 7,652 |
| Sierra Pacific Power Co., General and Refunding Mortgage Notes, Series T, 3.375% 2023 | 14,000 | 14,329 |
| Southern California Edison Co. 1.845% 20228 | 12,120 | 11,921 |
| Tampa Electric Co. 4.35% 2044 | 11,410 | 11,437 |
| Teco Finance, Inc. 5.15% 2020 | 5,627 | 5,976 |
| Tri-State Generation and Transmission Assn. Inc., Pass Through Trust, Series 2003-A, 6.04% 20184,8 | 801 | 818 |
| Virginia Electric and Power Co., Series B, 5.95% 2017 | 8,000 | 8,244 |
| Xcel Energy Inc. 4.70% 2020 | 4,845 | 5,153 |
| Xcel Energy Inc. 2.60% 2022 | 5,590 | 5,568 |
| Xcel Energy Inc. 3.30% 2025 | 5,795 | 5,800 |
| | | 922,747 |
| Consumer staples 0.77% | | |
| Altria Group, Inc. 9.25% 2019 | 5,067 | 5,980 |
| Altria Group, Inc. 2.625% 2020 | 14,760 | 14,931 |
| Altria Group, Inc. 2.95% 2023 | 12,000 | 11,997 |
| Altria Group, Inc. 4.00% 2024 | 7,400 | 7,822 |
| Altria Group, Inc. 2.625% 2026 | 18,585 | 17,610 |
| Altria Group, Inc. 9.95% 2038 | 13,500 | 22,952 |
| Altria Group, Inc. 4.50% 2043 | 13,700 | 13,951 |
| Altria Group, Inc. 5.375% 2044 | 6,825 | 7,899 |
| Altria Group, Inc. 3.875% 2046 | 12,970 | 11,996 |
| Anheuser-Busch InBev NV 2.20% 2018 | 18,700 | 18,830 |
| Anheuser-Busch InBev NV 7.75% 2019 | 20,000 | 22,280 |
| Anheuser-Busch InBev NV 3.30% 2023 | 22,345 | 22,748 |
| Anheuser-Busch InBev NV 3.65% 2026 | 11,385 | 11,562 |
| British American Tobacco International Finance PLC 2.125% 20174 | 16,000 | 16,045 |
| British American Tobacco International Finance PLC 3.50% 20224 | 17,905 | 18,346 |
American Balanced Fund — Page 15 of 32
Bonds, notes & other debt instruments
Corporate bonds & notes (continued)
Consumer staples (continued) | Principal amount
(000) | Value
(000) |
| British American Tobacco International Finance PLC 3.95% 20254 | $16,500 | $17,084 |
| Imperial Tobacco Finance PLC 2.05% 20184 | 16,000 | 16,017 |
| Imperial Tobacco Finance PLC 3.50% 20234 | 17,000 | 17,149 |
| Kraft Foods Inc. 2.25% 2017 | 4,725 | 4,740 |
| Kraft Foods Inc. 3.50% 2022 | 23,285 | 23,695 |
| Kraft Heinz Co. 4.375% 2046 | 23,475 | 22,134 |
| Kroger Co. 2.60% 2021 | 6,100 | 6,088 |
| Kroger Co. 3.50% 2026 | 16,135 | 16,218 |
| Mead Johnson Nutrition Co. 3.00% 2020 | 6,525 | 6,608 |
| Mead Johnson Nutrition Co. 4.125% 2025 | 3,355 | 3,432 |
| Molson Coors Brewing Co. 1.45% 2019 | 7,465 | 7,356 |
| Molson Coors Brewing Co. 2.10% 2021 | 11,385 | 11,090 |
| Molson Coors Brewing Co. 3.00% 2026 | 17,755 | 16,793 |
| Molson Coors Brewing Co. 4.20% 2046 | 10,475 | 9,786 |
| PepsiCo, Inc. 1.35% 2019 | 13,215 | 13,113 |
| Pernod Ricard SA 2.95% 20174 | 35,500 | 35,519 |
| Pernod Ricard SA 4.45% 20224 | 9,600 | 10,187 |
| Philip Morris International Inc. 1.875% 2021 | 25,020 | 24,481 |
| Philip Morris International Inc. 3.25% 2024 | 10,000 | 10,066 |
| Philip Morris International Inc. 3.375% 2025 | 27,395 | 27,846 |
| Philip Morris International Inc. 4.25% 2044 | 6,000 | 5,927 |
| Procter & Gamble Co. 1.70% 2021 | 8,270 | 8,126 |
| Procter & Gamble Co. 2.45% 2026 | 15,000 | 14,370 |
| Reynolds American Inc. 2.30% 2018 | 5,900 | 5,939 |
| Reynolds American Inc. 3.25% 2022 | 11,420 | 11,386 |
| Reynolds American Inc. 4.00% 2022 | 6,695 | 7,004 |
| Reynolds American Inc. 4.85% 2023 | 12,000 | 13,038 |
| Reynolds American Inc. 4.45% 2025 | 34,365 | 36,300 |
| Reynolds American Inc. 5.70% 2035 | 1,555 | 1,788 |
| Reynolds American Inc. 6.15% 2043 | 1,975 | 2,387 |
| Reynolds American Inc. 5.85% 2045 | 32,595 | 38,669 |
| The JM Smucker Co. 3.00% 2022 | 4,985 | 5,034 |
| The JM Smucker Co. 3.50% 2025 | 5,775 | 5,826 |
| Walgreens Boots Alliance, Inc. 2.60% 2021 | 23,146 | 23,004 |
| Walgreens Boots Alliance, Inc. 3.30% 2021 | 20,000 | 20,379 |
| Walgreens Boots Alliance, Inc. 3.45% 2026 | 17,660 | 17,344 |
| Wal-Mart Stores, Inc. 3.30% 2024 | 12,295 | 12,640 |
| WM. Wrigley Jr. Co 3.375% 20204 | 22,500 | 23,132 |
| | | 776,644 |
| Real estate 0.62% | | |
| Alexandria Real Estate Equities, Inc. 4.30% 2026 | 15,720 | 16,164 |
| American Campus Communities, Inc. 3.35% 2020 | 16,070 | 16,338 |
| American Campus Communities, Inc. 3.75% 2023 | 7,915 | 7,989 |
| American Campus Communities, Inc. 4.125% 2024 | 14,235 | 14,601 |
| American Tower Corp. 3.40% 2019 | 13,550 | 13,849 |
| AvalonBay Communities, Inc. 3.625% 2020 | 15,000 | 15,573 |
| Boston Properties, Inc. 3.70% 2018 | 20,000 | 20,605 |
| Brandywine Operating Partnership, LP 3.95% 2023 | 1,639 | 1,633 |
| Corporate Office Properties LP 3.60% 2023 | 12,100 | 11,647 |
| Corporate Office Properties LP 5.25% 2024 | 30,030 | 31,298 |
| Corporate Office Properties LP 5.00% 2025 | 6,735 | 6,883 |
| DDR Corp. 3.50% 2021 | 7,000 | 7,107 |
| DDR Corp. 3.625% 2025 | 15,075 | 14,590 |
American Balanced Fund — Page 16 of 32
Bonds, notes & other debt instruments
Corporate bonds & notes (continued)
Real estate (continued) | Principal amount
(000) | Value
(000) |
| DDR Corp. 4.25% 2026 | $7,370 | $7,415 |
| Developers Diversified Realty Corp. 7.875% 2020 | 6,365 | 7,413 |
| EPR Properties 4.50% 2025 | 4,460 | 4,408 |
| EPR Properties 4.75% 2026 | 43,650 | 43,246 |
| ERP Operating LP 4.75% 2020 | 12,000 | 12,913 |
| Essex Portfolio L.P. 3.875% 2024 | 21,515 | 21,912 |
| Essex Portfolio L.P. 3.50% 2025 | 21,965 | 21,644 |
| Essex Portfolio L.P. 3.375% 2026 | 2,395 | 2,317 |
| HCP, Inc. 5.375% 2021 | 15,000 | 16,388 |
| Hospitality Properties Trust 6.70% 2018 | 23,400 | 23,994 |
| Hospitality Properties Trust 4.25% 2021 | 30,925 | 31,998 |
| Hospitality Properties Trust 5.00% 2022 | 4,350 | 4,593 |
| Hospitality Properties Trust 4.50% 2023 | 11,630 | 11,599 |
| Kimco Realty Corp. 3.40% 2022 | 15,690 | 15,925 |
| Kimco Realty Corp. 3.125% 2023 | 11,705 | 11,593 |
| Kimco Realty Corp. 2.70% 2024 | 9,275 | 8,878 |
| Kimco Realty Corp. 2.80% 2026 | 10,000 | 9,312 |
| Prologis, Inc. 4.25% 2023 | 20,000 | 21,239 |
| Scentre Group 2.375% 20194 | 14,845 | 14,836 |
| Scentre Group 2.375% 20214 | 20,430 | 20,093 |
| Scentre Group 3.25% 20254 | 11,492 | 11,100 |
| Scentre Group 3.50% 20254 | 20,415 | 20,154 |
| Select Income REIT 3.60% 2020 | 8,000 | 8,016 |
| Simon Property Group, LP 1.50% 20184 | 13,825 | 13,819 |
| Simon Property Group, LP 3.30% 2026 | 14,600 | 14,524 |
| WEA Finance LLC 2.70% 20194 | 5,395 | 5,458 |
| WEA Finance LLC 3.25% 20204 | 32,500 | 33,067 |
| WEA Finance LLC 3.75% 20244 | 22,800 | 23,056 |
| Weingarten Realty Investors 3.25% 2026 | 1,645 | 1,553 |
| | | 620,740 |
| Telecommunication services 0.52% | | |
| AT&T Inc. 1.418% 20177 | 8,000 | 8,005 |
| AT&T Inc. 2.80% 2021 | 54,500 | 54,075 |
| AT&T Inc. 3.00% 2022 | 30,000 | 29,454 |
| AT&T Inc. 3.60% 2023 | 18,400 | 18,562 |
| AT&T Inc. 4.125% 2026 | 25,100 | 25,428 |
| AT&T Inc. 4.50% 2035 | 7,000 | 6,774 |
| AT&T Inc. 4.35% 2045 | 9,691 | 8,652 |
| AT&T Inc. 4.75% 2046 | 2,426 | 2,303 |
| AT&T Inc. 4.50% 2048 | 6,000 | 5,431 |
| British Telecommunications PLC 2.35% 2019 | 13,285 | 13,364 |
| Deutsche Telekom International Finance BV 1.95% 20214 | 10,000 | 9,637 |
| Deutsche Telekom International Finance BV 2.485% 20234 | 20,900 | 19,971 |
| Deutsche Telekom International Finance BV 9.25% 2032 | 9,993 | 15,433 |
| France Télécom 4.125% 2021 | 20,000 | 21,122 |
| France Télécom 9.00% 2031 | 1,690 | 2,543 |
| Orange SA 1.625% 2019 | 20,000 | 19,705 |
| Orange SA 2.75% 2019 | 14,870 | 15,069 |
| Orange SA 5.50% 2044 | 14,000 | 16,110 |
| SoftBank Group Corp. 3.36% 20234,8 | 15,000 | 15,031 |
| Telefónica Emisiones, SAU 3.192% 2018 | 15,000 | 15,218 |
| Verizon Communications Inc. 1.375% 2019 | 20,430 | 20,116 |
| Verizon Communications Inc. 1.75% 2021 | 9,545 | 9,158 |
American Balanced Fund — Page 17 of 32
Bonds, notes & other debt instruments
Corporate bonds & notes (continued)
Telecommunication services (continued) | Principal amount
(000) | Value
(000) |
| Verizon Communications Inc. 3.00% 2021 | $5,674 | $5,718 |
| Verizon Communications Inc. 2.625% 2026 | 40,000 | 36,843 |
| Verizon Communications Inc. 4.272% 2036 | 64,568 | 61,899 |
| Verizon Communications Inc. 6.25% 2037 | 20,000 | 23,748 |
| Verizon Communications Inc. 4.125% 2046 | 52,864 | 47,942 |
| | | 527,311 |
| Information technology 0.52% | | |
| Alphabet Inc. 1.998% 2026 | 51,000 | 46,797 |
| Apple Inc. 1.55% 2021 | 43,665 | 42,204 |
| Apple Inc. 2.25% 2021 | 23,000 | 22,998 |
| Cisco Systems, Inc. 1.85% 2021 | 30,025 | 29,303 |
| Cisco Systems, Inc. 2.20% 2023 | 10,000 | 9,617 |
| Cisco Systems, Inc. 2.50% 2026 | 10,000 | 9,508 |
| Dell Inc. 4.42% 20214 | 50,695 | 52,464 |
| Harris Corp. 3.832% 2025 | 6,615 | 6,723 |
| Harris Corp. 4.854% 2035 | 8,245 | 8,676 |
| Intel Corp. 3.70% 2025 | 22,000 | 23,199 |
| Intel Corp. 4.90% 2045 | 14,540 | 16,272 |
| KLA-Tencor Corp. 4.65% 2024 | 10,000 | 10,591 |
| Microsoft Corp. 1.55% 2021 | 51,435 | 49,873 |
| Microsoft Corp. 2.40% 2026 | 27,000 | 25,515 |
| Microsoft Corp. 4.20% 2035 | 18,000 | 18,948 |
| Microsoft Corp. 3.70% 2046 | 15,000 | 14,128 |
| Oracle Corp. 2.375% 2019 | 17,500 | 17,736 |
| Oracle Corp. 2.80% 2021 | 6,100 | 6,216 |
| Oracle Corp. 2.65% 2026 | 31,000 | 29,418 |
| Visa Inc. 2.80% 2022 | 23,000 | 23,098 |
| Visa Inc. 3.15% 2025 | 49,000 | 49,203 |
| Visa Inc. 4.30% 2045 | 10,000 | 10,560 |
| | | 523,047 |
| Industrials 0.45% | | |
| 3M Co. 1.625% 2021 | 15,000 | 14,613 |
| 3M Co. 2.25% 2026 | 10,000 | 9,384 |
| 3M Co. 3.125% 2046 | 10,000 | 8,917 |
| American Airlines, Inc., Series 2013-2, Class A, 4.95% 20248 | 9,323 | 9,953 |
| Canadian National Railway Co. 3.20% 2046 | 17,110 | 15,045 |
| Continental Airlines, Inc., Series 1998-1, Class A, 6.648% 20198 | 1,235 | 1,253 |
| Continental Airlines, Inc., Series 1997-4, Class A, 6.90% 20198 | 724 | 730 |
| Continental Airlines, Inc., Series 1999-1, Class A, 6.545% 20208 | 4,495 | 4,704 |
| Continental Airlines, Inc., Series 2001-1, Class A1, 6.703% 20228 | 1,521 | 1,628 |
| ERAC USA Finance Co. 2.80% 20184 | 9,900 | 10,027 |
| ERAC USA Finance Co. 2.70% 20234 | 25,500 | 24,506 |
| FedEx Corp. 4.75% 2045 | 65,685 | 68,163 |
| Fortive Corp. 1.80% 20194 | 8,000 | 7,953 |
| Fortive Corp. 2.35% 20214 | 6,505 | 6,419 |
| General Electric Capital Corp. 2.342% 2020 | 18,286 | 18,254 |
| General Electric Capital Corp., Series A, 6.00% 2019 | 2,577 | 2,847 |
| General Electric Co. 2.70% 2022 | 11,000 | 10,994 |
| General Electric Co. 4.125% 2042 | 11,000 | 11,157 |
| General Electric Corp. 5.25% 2017 | 11,000 | 11,396 |
| Honeywell International Inc. 1.85% 2021 | 17,905 | 17,492 |
| Honeywell International Inc. 2.50% 2026 | 20,000 | 18,965 |
American Balanced Fund — Page 18 of 32
Bonds, notes & other debt instruments
Corporate bonds & notes (continued)
Industrials (continued) | Principal amount
(000) | Value
(000) |
| Johnson Controls, Inc. 1.40% 2017 | $10,000 | $10,017 |
| Lockheed Martin Corp. 3.10% 2023 | 4,710 | 4,763 |
| Lockheed Martin Corp. 3.55% 2026 | 48,050 | 49,118 |
| Lockheed Martin Corp. 4.70% 2046 | 11,490 | 12,524 |
| Roper Technologies, Inc. 2.80% 2021 | 9,660 | 9,657 |
| Roper Technologies, Inc. 3.80% 2026 | 8,325 | 8,394 |
| Siemens AG 1.70% 20214 | 25,500 | 24,491 |
| Southwest Airlines Co. 2.75% 2019 | 6,255 | 6,371 |
| Union Pacific Corp. 5.70% 2018 | 11,150 | 11,871 |
| United Technologies Corp. 3.10% 2022 | 30,000 | 30,825 |
| Waste Management, Inc. 2.90% 2022 | 15,000 | 15,081 |
| | | 457,512 |
| Materials 0.16% | | |
| BHP Billiton Finance Ltd. 6.25% 20754 | 3,175 | 3,450 |
| BHP Billiton Finance Ltd. 6.75% 20754 | 12,825 | 14,428 |
| Chevron Phillips Chemical Company LLC 2.45% 20204 | 16,880 | 16,762 |
| CRH America, Inc. 3.875% 20254 | 7,700 | 7,844 |
| Eastman Chemical Co. 2.70% 2020 | 21,000 | 21,127 |
| Eastman Chemical Co. 3.80% 2025 | 7,405 | 7,471 |
| Ecolab Inc. 4.35% 2021 | 1,000 | 1,081 |
| Ecolab Inc. 5.50% 2041 | 1,500 | 1,767 |
| Georgia-Pacific Corp. 2.539% 20194 | 21,000 | 21,188 |
| Holcim Ltd. 5.15% 20234 | 12,500 | 13,560 |
| International Paper Co. 7.30% 2039 | 6,425 | 8,200 |
| Monsanto Co. 4.40% 2044 | 13,090 | 12,676 |
| Praxair, Inc. 1.05% 2017 | 16,000 | 15,978 |
| Praxair, Inc. 2.25% 2020 | 12,034 | 12,004 |
| Rohm and Haas Co. 6.00% 2017 | 5,003 | 5,160 |
| | | 162,696 |
| Total corporate bonds & notes | | 11,939,580 |
| Mortgage-backed obligations 6.24% | | |
| Aventura Mall Trust, Series A, 3.743% 20324,7,8 | 9,200 | 9,674 |
| Banc of America Commercial Mortgage Inc., Series 2006-3, Class A4, 5.889% 20447,8 | 92 | 91 |
| Banc of America Commercial Mortgage Inc., Series 2007-3, Class A4, 5.548% 20497,8 | 5,780 | 5,813 |
| Banc of America Commercial Mortgage Inc., Series 2007-2, Class AM, 5.648% 20497,8 | 4,100 | 4,112 |
| Banc of America Commercial Mortgage Inc., Series 2007-4, Class AM, 5.814% 20517,8 | 1,250 | 1,273 |
| Banc of America Commercial Mortgage Inc., Series 2008-1, Class A4, 6.235% 20517,8 | 20,155 | 20,679 |
| Bank of Nova Scotia 1.75% 20174,8 | 65,625 | 65,703 |
| Bank of Nova Scotia 2.125% 20198 | 16,225 | 16,306 |
| Barclays Bank PLC 2.25% 20174,8 | 2,850 | 2,861 |
| Bear Stearns Commercial Mortgage Securities Trust, Series 2007-PW17, Class A1A, 5.65% 20507,8 | 1,436 | 1,463 |
| Bear Stearns Commercial Mortgage Securities Trust, Series 2007-PW17, Class A4, 5.694% 20507,8 | 8,103 | 8,244 |
| Bear Stearns Commercial Mortgage Securities Trust, Series 2007-PW18, Class AM, 6.084% 20507,8 | 6,425 | 6,628 |
| Bellemeade Re Ltd., Series 2015-1A, Class M1, 3.256% 20254,7,8 | 1,353 | 1,359 |
| Caisse Centrale Desjardins 1.60% 20174,8 | 600 | 601 |
| CHL Mortgage Pass-Through Trust, Series 2003-56, Class 6A1, 3.465% 20337,8 | 1,832 | 1,853 |
| Citigroup Commercial Mortgage Trust, Series 2015-GC29, Class AAB, 2.984% 20488 | 3,370 | 3,395 |
| Commercial Mortgage Trust, Series 2007-C9, Class A1A, 5.812% 20497,8 | 806 | 816 |
| Commercial Mortgage Trust, Series 2015-PC1, Class A5, 3.902% 20508 | 15,265 | 15,969 |
| Commonwealth Bank of Australia 2.25% 20174,8 | 675 | 676 |
| Commonwealth Bank of Australia 1.875% 20184,8 | 5,700 | 5,708 |
American Balanced Fund — Page 19 of 32
Bonds, notes & other debt instruments
Mortgage-backed obligations (continued) | Principal amount
(000) | Value
(000) |
| Commonwealth Bank of Australia 2.00% 20194,8 | $23,500 | $23,541 |
| Connecticut Avenue Securities, Series 2013-C01, Class M1, 2.756% 20234,7,8 | 338 | 341 |
| Connecticut Avenue Securities, Series 2014-C01, Class M1, 2.356% 20244,7,8 | 837 | 843 |
| Core Industrial Trust, Series 2015-CALW, Class A, 3.04% 20344,8 | 19,570 | 19,979 |
| Credit Mutuel-CIC Home Loan SFH 1.50% 20174,8 | 800 | 799 |
| CS First Boston Mortgage Securities Corp., Series 2002-34, Class IA1, 7.50% 20328 | 559 | 614 |
| CS First Boston Mortgage Securities Corp., Series 2002-30, Class IA1, 7.50% 20328 | 383 | 417 |
| CS First Boston Mortgage Securities Corp., Series 2003-21, Class VA1, 6.50% 20338 | 533 | 575 |
| CS First Boston Mortgage Securities Corp., Series 2003-29, Class VA1, 7.00% 20338 | 848 | 909 |
| CS First Boston Mortgage Securities Corp., Series 2004-5, Class IVA1, 6.00% 20348 | 2,514 | 2,567 |
| CS First Boston Mortgage Securities Corp., Series 2007-C3, Class A1A1, 5.687% 20397,8 | 2,868 | 2,877 |
| CS First Boston Mortgage Securities Corp., Series 2007-C5, Class A4, 5.695% 20407,8 | 12,117 | 12,292 |
| CSAIL Commercial Mortgage Trust, Series 2015-C4, Class ASB, 3.617% 20488 | 5,600 | 5,789 |
| DBUBS Mortgage Trust, Series 2011-LC1A, Class A3, 5.002% 20464,8 | 9,500 | 10,307 |
| DNB ASA 1.45% 20194,8 | 925 | 924 |
EQTY 2014-INNS Mortgage Trust Commercial Mortgage Pass-Through Certificates, Series 2014-A,
1.499% 20314,7,8 | 8,992 | 8,999 |
| Fannie Mae 11.00% 20188 | 5 | 6 |
| Fannie Mae 4.50% 20258 | 3,610 | 3,822 |
| Fannie Mae 4.50% 20258 | 2,725 | 2,874 |
| Fannie Mae 2.50% 20278 | 24,175 | 24,245 |
| Fannie Mae 2.50% 20278 | 23,247 | 23,314 |
| Fannie Mae 2.50% 20278 | 1,577 | 1,582 |
| Fannie Mae 2.50% 20278 | 1,533 | 1,538 |
| Fannie Mae 2.50% 20278 | 1,209 | 1,212 |
| Fannie Mae 2.50% 20278 | 880 | 883 |
| Fannie Mae 2.50% 20278 | 772 | 774 |
| Fannie Mae 2.50% 20278 | 708 | 710 |
| Fannie Mae 2.50% 20288 | 18,682 | 18,737 |
| Fannie Mae 2.50% 20288 | 4,317 | 4,327 |
| Fannie Mae 2.50% 20288 | 2,384 | 2,389 |
| Fannie Mae 2.50% 20288 | 2,166 | 2,173 |
| Fannie Mae 2.50% 20288 | 1,902 | 1,907 |
| Fannie Mae 2.50% 20288 | 1,314 | 1,318 |
| Fannie Mae 2.50% 20288 | 781 | 783 |
| Fannie Mae 2.50% 20288 | 638 | 640 |
| Fannie Mae 2.50% 20288 | 324 | 325 |
| Fannie Mae 2.50% 20318 | 193,451 | 193,897 |
| Fannie Mae 2.50% 20318 | 65,150 | 65,300 |
| Fannie Mae 2.50% 20328 | 251,331 | 251,919 |
| Fannie Mae 2.50% 20328 | 177,474 | 177,883 |
| Fannie Mae 2.50% 20328,9 | 19,000 | 19,022 |
| Fannie Mae 5.50% 20338 | 2,787 | 3,124 |
| Fannie Mae 5.50% 20338 | 2,521 | 2,822 |
| Fannie Mae 5.50% 20338 | 278 | 312 |
| Fannie Mae 4.50% 20348 | 9,516 | 10,285 |
| Fannie Mae 3.00% 20358 | 34,714 | 35,171 |
| Fannie Mae 3.50% 20358 | 50,309 | 52,134 |
| Fannie Mae 3.50% 20358 | 39,685 | 41,227 |
| Fannie Mae 3.50% 20358 | 27,793 | 28,833 |
| Fannie Mae 3.50% 20358 | 27,712 | 28,787 |
| Fannie Mae 3.50% 20358 | 11,103 | 11,534 |
| Fannie Mae 5.00% 20358 | 1,011 | 1,108 |
| Fannie Mae 5.50% 20358 | 1,158 | 1,298 |
| Fannie Mae 5.50% 20358 | 641 | 725 |
American Balanced Fund — Page 20 of 32
Bonds, notes & other debt instruments
Mortgage-backed obligations (continued) | Principal amount
(000) | Value
(000) |
| Fannie Mae 6.50% 20358 | $2,583 | $3,011 |
| Fannie Mae 5.50% 20368 | 236 | 265 |
| Fannie Mae 5.50% 20368 | 204 | 229 |
| Fannie Mae 6.00% 20368 | 733 | 826 |
| Fannie Mae 6.00% 20378 | 8,926 | 10,202 |
| Fannie Mae 6.50% 20378 | 1,724 | 1,977 |
| Fannie Mae 6.50% 20378 | 1,608 | 1,771 |
| Fannie Mae 6.50% 20378 | 874 | 961 |
| Fannie Mae 7.00% 20378 | 405 | 444 |
| Fannie Mae 7.00% 20378 | 393 | 431 |
| Fannie Mae 7.00% 20378 | 166 | 183 |
| Fannie Mae 5.50% 20388 | 487 | 544 |
| Fannie Mae 6.50% 20388 | 2,460 | 2,820 |
| Fannie Mae 5.50% 20398 | 77 | 87 |
| Fannie Mae 6.00% 20398 | 12,252 | 13,871 |
| Fannie Mae 4.00% 20408 | 3,482 | 3,689 |
| Fannie Mae 4.50% 20408 | 14,716 | 15,862 |
| Fannie Mae 4.50% 20408 | 12,276 | 13,236 |
| Fannie Mae 4.50% 20408 | 9,666 | 10,419 |
| Fannie Mae 5.00% 20408 | 11,021 | 12,034 |
| Fannie Mae 5.00% 20408 | 2,600 | 2,855 |
| Fannie Mae 5.00% 20408 | 1,473 | 1,610 |
| Fannie Mae 5.00% 20408 | 1,114 | 1,218 |
| Fannie Mae 4.00% 20418 | 11,806 | 12,498 |
| Fannie Mae 4.00% 20418 | 9,174 | 9,712 |
| Fannie Mae 4.00% 20418 | 8,550 | 9,005 |
| Fannie Mae 4.00% 20418 | 5,425 | 5,747 |
| Fannie Mae 4.00% 20418 | 3,288 | 3,475 |
| Fannie Mae 4.00% 20418 | 2,617 | 2,772 |
| Fannie Mae 4.00% 20418 | 1,755 | 1,860 |
| Fannie Mae 4.50% 20418 | 7,704 | 8,310 |
| Fannie Mae 5.00% 20418 | 2,318 | 2,536 |
| Fannie Mae 5.00% 20418 | 1,786 | 1,955 |
| Fannie Mae 5.00% 20418 | 1,607 | 1,756 |
| Fannie Mae 5.00% 20418 | 1,558 | 1,702 |
| Fannie Mae 5.00% 20418 | 1,407 | 1,539 |
| Fannie Mae 5.00% 20418 | 1,322 | 1,441 |
| Fannie Mae 5.00% 20418 | 1,122 | 1,228 |
| Fannie Mae 5.00% 20418 | 813 | 890 |
| Fannie Mae 5.00% 20418 | 579 | 636 |
| Fannie Mae 5.00% 20418 | 515 | 564 |
| Fannie Mae 5.00% 20418 | 429 | 469 |
| Fannie Mae 5.00% 20418 | 287 | 314 |
| Fannie Mae 5.00% 20418 | 235 | 256 |
| Fannie Mae 5.00% 20418 | 158 | 173 |
| Fannie Mae 5.00% 20418 | 140 | 153 |
| Fannie Mae 5.00% 20418 | 93 | 102 |
| Fannie Mae 5.00% 20418 | 39 | 42 |
| Fannie Mae 5.00% 20418 | 31 | 34 |
| Fannie Mae 5.00% 20418 | 26 | 28 |
| Fannie Mae 3.50% 20428 | 20,881 | 21,527 |
| Fannie Mae 4.00% 20428 | 26,535 | 28,113 |
| Fannie Mae 4.00% 20428 | 13,677 | 14,482 |
| Fannie Mae 4.00% 20428 | 9,254 | 9,811 |
| Fannie Mae 4.00% 20428 | 8,983 | 9,516 |
American Balanced Fund — Page 21 of 32
Bonds, notes & other debt instruments
Mortgage-backed obligations (continued) | Principal amount
(000) | Value
(000) |
| Fannie Mae 4.00% 20428 | $7,146 | $7,566 |
| Fannie Mae 4.00% 20428 | 3,161 | 3,341 |
| Fannie Mae 4.00% 20428 | 2,195 | 2,321 |
| Fannie Mae 5.00% 20428 | 254 | 277 |
| Fannie Mae 3.00% 20438 | 30,068 | 30,048 |
| Fannie Mae 3.00% 20438 | 29,080 | 29,060 |
| Fannie Mae 3.00% 20438 | 17,450 | 17,438 |
| Fannie Mae 3.00% 20438 | 16,737 | 16,726 |
| Fannie Mae 3.00% 20438 | 16,430 | 16,419 |
| Fannie Mae 3.00% 20438 | 13,266 | 13,257 |
| Fannie Mae 3.00% 20438 | 13,259 | 13,246 |
| Fannie Mae 3.00% 20438 | 12,927 | 12,918 |
| Fannie Mae 3.00% 20438 | 10,961 | 10,954 |
| Fannie Mae 3.00% 20438 | 9,050 | 9,044 |
| Fannie Mae 3.00% 20438 | 6,874 | 6,870 |
| Fannie Mae 3.00% 20438 | 3,755 | 3,752 |
| Fannie Mae 3.00% 20438 | 3,736 | 3,733 |
| Fannie Mae 3.00% 20438 | 3,718 | 3,716 |
| Fannie Mae 3.00% 20438 | 3,588 | 3,585 |
| Fannie Mae 3.50% 20438 | 27,577 | 28,280 |
| Fannie Mae 3.50% 20438 | 18,958 | 19,537 |
| Fannie Mae 3.50% 20438 | 14,590 | 15,035 |
| Fannie Mae 3.50% 20438 | 5,462 | 5,629 |
| Fannie Mae 3.50% 20438 | 2,524 | 2,601 |
| Fannie Mae 3.50% 20438 | 1,667 | 1,718 |
| Fannie Mae 4.00% 20438 | 13,794 | 14,607 |
| Fannie Mae 4.00% 20438 | 8,379 | 8,869 |
| Fannie Mae 4.00% 20438 | 3,763 | 3,979 |
| Fannie Mae 4.00% 20438 | 2,645 | 2,804 |
| Fannie Mae 4.00% 20438 | 2,614 | 2,771 |
| Fannie Mae 4.00% 20438 | 889 | 943 |
| Fannie Mae 4.00% 20438 | 568 | 604 |
| Fannie Mae 4.00% 20438 | 511 | 541 |
| Fannie Mae 4.00% 20438 | 485 | 515 |
| Fannie Mae 4.00% 20438 | 430 | 457 |
| Fannie Mae 4.00% 20438 | 366 | 388 |
| Fannie Mae 4.50% 20438 | 15,560 | 16,768 |
| Fannie Mae 3.50% 20448 | 19,190 | 19,691 |
| Fannie Mae 3.50% 20448 | 16,787 | 17,211 |
| Fannie Mae 3.50% 20448 | 1,777 | 1,822 |
| Fannie Mae 3.50% 20458 | 21,956 | 22,585 |
| Fannie Mae 4.00% 20458 | 80,409 | 85,095 |
| Fannie Mae 4.00% 20458 | 74,165 | 78,483 |
| Fannie Mae 4.00% 20458 | 57,889 | 60,896 |
| Fannie Mae 4.00% 20458 | 41,325 | 43,735 |
| Fannie Mae 4.00% 20458 | 36,329 | 38,454 |
| Fannie Mae 4.00% 20458 | 24,478 | 25,910 |
| Fannie Mae 4.00% 20458 | 17,715 | 18,755 |
| Fannie Mae 4.00% 20458 | 14,257 | 14,995 |
| Fannie Mae 3.00% 20468 | 201,441 | 200,262 |
| Fannie Mae 3.50% 20468 | 76,888 | 78,857 |
| Fannie Mae 3.50% 20468 | 66,231 | 67,913 |
| Fannie Mae 3.50% 20468 | 35,000 | 35,939 |
| Fannie Mae 3.50% 20468 | 29,477 | 30,314 |
| Fannie Mae 3.50% 20468 | 11,625 | 11,924 |
American Balanced Fund — Page 22 of 32
Bonds, notes & other debt instruments
Mortgage-backed obligations (continued) | Principal amount
(000) | Value
(000) |
| Fannie Mae 4.00% 20468 | $121,626 | $127,962 |
| Fannie Mae 4.00% 20468 | 39,227 | 41,279 |
| Fannie Mae 4.00% 20468 | 32,295 | 33,985 |
| Fannie Mae 4.00% 20468 | 5,021 | 5,312 |
| Fannie Mae 4.00% 20468 | 4,706 | 4,951 |
| Fannie Mae 4.00% 20468 | 4,283 | 4,507 |
| Fannie Mae 4.00% 20468 | 3,214 | 3,394 |
| Fannie Mae 4.50% 20468 | 4,990 | 5,379 |
| Fannie Mae 4.50% 20468 | 2,841 | 3,062 |
| Fannie Mae 3.50% 20478,9 | 75,000 | 76,828 |
| Fannie Mae 4.00% 20478,9 | 75,750 | 79,604 |
| Fannie Mae 4.50% 20478,9 | 14,750 | 15,862 |
| Fannie Mae 4.50% 20478,9 | 9,250 | 9,936 |
| Fannie Mae 6.50% 20478 | 192 | 213 |
| Fannie Mae 6.50% 20478 | 120 | 133 |
| Fannie Mae 6.50% 20478 | 80 | 89 |
| Fannie Mae 7.00% 20478 | 238 | 269 |
| Fannie Mae 7.00% 20478 | 128 | 145 |
| Fannie Mae 7.00% 20478 | 104 | 118 |
| Fannie Mae 7.00% 20478 | 88 | 100 |
| Fannie Mae 7.00% 20478 | 11 | 12 |
| Fannie Mae, Series 2014-M6, Class FA, multifamily 0.823% 20177,8 | 1,809 | 1,810 |
| Fannie Mae, Series 2012-M8, multifamily 1.52% 20198 | 8,564 | 8,581 |
| Fannie Mae, Series 2012-M9, Class A2, multifamily 2.482% 20228 | 21,843 | 21,783 |
| Fannie Mae, Series 2012-M5, Class A2, multifamily 2.715% 20228 | 14,000 | 14,130 |
| Fannie Mae, Series 2014-M1, Class A2, multifamily 3.251% 20237,8 | 16,000 | 16,522 |
| Fannie Mae, Series 2013-M14, Class A2, multifamily 3.329% 20237,8 | 19,245 | 19,956 |
| Fannie Mae, Series 2014-M2, Class A2, multifamily 3.513% 20237,8 | 16,585 | 17,286 |
| Fannie Mae, Series 2014-M9, multifamily 3.103% 20247,8 | 16,865 | 17,117 |
| Fannie Mae, Series 2014-M3, Class A2, multifamily 3.472% 20247,8 | 18,000 | 18,795 |
| Fannie Mae, Series 2001-4, Class NA, 9.653% 20257,8 | 5 | 5 |
| Fannie Mae, Series 2001-20, Class D, 11.010% 20317,8 | 1 | 1 |
| Fannie Mae, Series 2006-43, Class JO, principal only, 0% 20368 | 1,184 | 1,033 |
| Fannie Mae, Series 2001-T10, Class A1, 7.00% 20418 | 238 | 270 |
| Fannie Mae, Series 2001-50, Class BA, 7.00% 20418 | 151 | 170 |
| Fannie Mae, Series 2002-W3, Class A5, 7.50% 20418 | 304 | 351 |
| Fannie Mae, Series 2002-W1, Class 2A, 6.181% 20427,8 | 319 | 363 |
| Freddie Mac 5.00% 20238 | 2,380 | 2,535 |
| Freddie Mac 5.00% 20238 | 1,710 | 1,820 |
| Freddie Mac 5.00% 20238 | 1,087 | 1,157 |
| Freddie Mac 5.00% 20238 | 487 | 520 |
| Freddie Mac 5.00% 20238 | 477 | 508 |
| Freddie Mac 5.00% 20238 | 366 | 390 |
| Freddie Mac 5.00% 20248 | 3,100 | 3,317 |
| Freddie Mac 6.50% 20278 | 526 | 592 |
| Freddie Mac 6.50% 20278 | 283 | 321 |
| Freddie Mac 6.50% 20278 | 85 | 97 |
| Freddie Mac 6.50% 20288 | 338 | 382 |
| Freddie Mac 3.00% 20318 | 74,568 | 76,602 |
| Freddie Mac 3.50% 20348 | 55,458 | 57,496 |
| Freddie Mac 3.00% 20358 | 3,264 | 3,308 |
| Freddie Mac 3.00% 20358 | 3,192 | 3,244 |
| Freddie Mac 3.50% 20358 | 32,661 | 33,738 |
| Freddie Mac 3.50% 20358 | 31,949 | 33,003 |
| Freddie Mac 3.50% 20358 | 22,779 | 23,573 |
American Balanced Fund — Page 23 of 32
Bonds, notes & other debt instruments
Mortgage-backed obligations (continued) | Principal amount
(000) | Value
(000) |
| Freddie Mac 5.50% 20378 | $341 | $380 |
| Freddie Mac 5.50% 20378 | 64 | 71 |
| Freddie Mac 5.50% 20388 | 206 | 229 |
| Freddie Mac 5.50% 20388 | 81 | 91 |
| Freddie Mac 6.00% 20388 | 1,403 | 1,589 |
| Freddie Mac 6.00% 20388 | 180 | 204 |
| Freddie Mac 5.50% 20398 | 323 | 360 |
| Freddie Mac 3.302% 20407,8 | 65 | 69 |
| Freddie Mac 4.50% 20408 | 11,141 | 11,990 |
| Freddie Mac 4.50% 20408 | 725 | 782 |
| Freddie Mac 4.50% 20418 | 1,899 | 2,050 |
| Freddie Mac 4.50% 20418 | 1,528 | 1,644 |
| Freddie Mac 4.50% 20418 | 663 | 714 |
| Freddie Mac 4.50% 20418 | 532 | 574 |
| Freddie Mac 4.50% 20418 | 114 | 123 |
| Freddie Mac 4.50% 20418 | 89 | 96 |
| Freddie Mac 5.00% 20418 | 614 | 674 |
| Freddie Mac 3.50% 20428 | 1,736 | 1,788 |
| Freddie Mac 4.00% 20428 | 14,966 | 15,815 |
| Freddie Mac 3.50% 20438 | 1,479 | 1,524 |
| Freddie Mac 4.00% 20438 | 2,233 | 2,359 |
| Freddie Mac 4.00% 20438 | 922 | 973 |
| Freddie Mac 4.00% 20438 | 868 | 919 |
| Freddie Mac 4.00% 20438 | 734 | 778 |
| Freddie Mac 4.00% 20438 | 438 | 465 |
| Freddie Mac 3.50% 20448 | 33,110 | 34,083 |
| Freddie Mac 4.00% 20448 | 6,816 | 7,214 |
| Freddie Mac 3.50% 20458 | 41,506 | 42,732 |
| Freddie Mac 4.00% 20458 | 84,967 | 89,851 |
| Freddie Mac 4.00% 20458 | 39,725 | 42,069 |
| Freddie Mac 4.00% 20458 | 23,326 | 24,704 |
| Freddie Mac 4.00% 20458 | 13,530 | 14,305 |
| Freddie Mac 3.50% 20468 | 272,336 | 279,025 |
| Freddie Mac 3.50% 20468 | 133,738 | 137,026 |
| Freddie Mac 3.50% 20468 | 121,881 | 124,904 |
| Freddie Mac 3.50% 20468 | 84,500 | 86,684 |
| Freddie Mac 3.50% 20468 | 44,622 | 45,728 |
| Freddie Mac 4.00% 20468 | 217,405 | 228,470 |
| Freddie Mac 4.00% 20468 | 105,124 | 110,476 |
| Freddie Mac 4.00% 20468 | 32,580 | 34,338 |
| Freddie Mac 4.00% 20468 | 27,714 | 29,116 |
| Freddie Mac 4.00% 20468 | 10,294 | 10,878 |
| Freddie Mac 4.00% 20468 | 2,344 | 2,477 |
| Freddie Mac 4.50% 20468 | 3,660 | 3,940 |
| Freddie Mac 4.50% 20468 | 2,860 | 3,078 |
| Freddie Mac 4.00% 20478,9 | 30,000 | 31,496 |
| Freddie Mac, Series K716, Class A2, multifamily 3.13% 20218 | 7,560 | 7,863 |
| Freddie Mac, Series KS01, Class A1, multifamily 1.693% 20228 | 2,353 | 2,331 |
| Freddie Mac, Series K019, Class A2, multifamily 2.272% 20228 | 16,000 | 15,941 |
| Freddie Mac, Series K021, Class A2, multifamily 2.396% 20228 | 16,555 | 16,560 |
| Freddie Mac, Series K025, Class A2, multifamily 2.682% 20228 | 15,904 | 16,118 |
| Freddie Mac, Series K721, Class A2, multifamily 3.090% 20228 | 23,000 | 23,752 |
| Freddie Mac, Series 2013-DN2, Class M1, 2.206% 20237,8 | 3,442 | 3,458 |
| Freddie Mac, Series K723, Class A2, multifamily 2.454% 20238 | 29,715 | 29,519 |
| Freddie Mac, Series KS01, Class A2, multifamily 2.522% 20238 | 1,075 | 1,079 |
American Balanced Fund — Page 24 of 32
Bonds, notes & other debt instruments
Mortgage-backed obligations (continued) | Principal amount
(000) | Value
(000) |
| Freddie Mac, Series K034, Class A1, multifamily 2.669% 20238 | $7,156 | $7,247 |
| Freddie Mac, Series K036, Class A2, multifamily 3.527% 20237,8 | 16,500 | 17,408 |
| Freddie Mac, Series 2013-DN1, Class M1, 4.156% 20237,8 | 4,812 | 4,895 |
| Freddie Mac, Series 2014-DN1, Class M1, 1.756% 20247,8 | 1,723 | 1,725 |
| Freddie Mac, Series 2014-HQ2, Class M1, 2.206% 20247,8 | 5,018 | 5,042 |
| Freddie Mac, Series 2014-DN2, Class M2, 2.406% 20247,8 | 10,212 | 10,299 |
| Freddie Mac, Series 2014-HQ2, Class M2, 2.956% 20247,8 | 21,320 | 21,805 |
| Freddie Mac, Series K043, Class A2, multifamily 3.062% 20248 | 36,400 | 37,169 |
| Freddie Mac, Series 2014-DN4, Class M2, 3.156% 20247,8 | 1,786 | 1,793 |
| Freddie Mac, Series 2014-HQ1, Class M2, 3.256% 20247,8 | 8,681 | 8,810 |
| Freddie Mac, Series 2015-HQ2, Class M1, 1.856% 20257,8 | 1,360 | 1,363 |
| Freddie Mac, Series K056, Class A1, multifamily 2.20% 20258 | 23,809 | 23,142 |
| Freddie Mac, Series 2015-HQ2, Class M2, 2.706% 20257,8 | 11,200 | 11,373 |
| Freddie Mac, Series K044, Class A2, multifamily 2.811% 20258 | 13,505 | 13,547 |
| Freddie Mac, Series K047, Class A2, multifamily 3.329% 20258 | 20,000 | 20,743 |
| Freddie Mac, Series K050, Class A2, multifamily 3.334% 20257,8 | 11,440 | 11,860 |
| Freddie Mac, Series 2015-HQA2, Class M1, 1.906% 20287,8 | 301 | 301 |
| Freddie Mac, Series T-041, Class 3A, 1.776% 20327,8 | 1,574 | 1,729 |
| Freddie Mac, Series 3156, Class PO, principal only, 0% 20368 | 2,992 | 2,605 |
| Freddie Mac, Series 3146, Class PO, principal only, 0% 20368 | 2,022 | 1,782 |
| Freddie Mac, Series 3318, Class JT, 5.50% 20378 | 3,509 | 3,844 |
| GMAC Commercial Mortgage Securities, Inc., Series 2006-C1, Class AM, 5.29% 20457,8 | 2,701 | 2,698 |
| Government National Mortgage Assn. 10.00% 20218 | 67 | 73 |
| Government National Mortgage Assn. 6.00% 20388 | 8,038 | 9,066 |
| Government National Mortgage Assn. 6.50% 20388 | 4,145 | 4,741 |
| Government National Mortgage Assn. 4.00% 20398 | 1,756 | 1,864 |
| Government National Mortgage Assn. 4.00% 20398 | 1,536 | 1,630 |
| Government National Mortgage Assn. 4.00% 20398 | 959 | 1,018 |
| Government National Mortgage Assn. 4.00% 20408 | 13,245 | 14,249 |
| Government National Mortgage Assn. 4.00% 20408 | 9,609 | 10,270 |
| Government National Mortgage Assn. 4.00% 20408 | 3,014 | 3,211 |
| Government National Mortgage Assn. 4.00% 20408 | 2,902 | 3,122 |
| Government National Mortgage Assn. 4.00% 20408 | 2,612 | 2,797 |
| Government National Mortgage Assn. 4.00% 20408 | 1,417 | 1,507 |
| Government National Mortgage Assn. 4.00% 20408 | 1,406 | 1,498 |
| Government National Mortgage Assn. 4.00% 20418 | 20,097 | 21,416 |
| Government National Mortgage Assn. 4.00% 20418 | 2,582 | 2,752 |
| Government National Mortgage Assn. 4.00% 20418 | 1,475 | 1,571 |
| Government National Mortgage Assn. 4.00% 20418 | 316 | 337 |
| Government National Mortgage Assn. 4.50% 20438 | 2,641 | 2,822 |
| Government National Mortgage Assn. 4.00% 20448 | 196 | 208 |
| Government National Mortgage Assn. 4.50% 20458 | 79,582 | 85,027 |
| Government National Mortgage Assn. 4.50% 20458 | 72,907 | 77,896 |
| Government National Mortgage Assn. 4.50% 20458 | 48,077 | 51,361 |
| Government National Mortgage Assn. 4.50% 20458 | 35,795 | 38,244 |
| Government National Mortgage Assn. 4.50% 20458 | 34,271 | 36,616 |
| Government National Mortgage Assn. 4.50% 20458 | 20,782 | 22,204 |
| Government National Mortgage Assn. 4.50% 20468 | 17,723 | 18,946 |
| Government National Mortgage Assn. 4.50% 20468 | 2,266 | 2,421 |
| Government National Mortgage Assn. 5.083% 20618 | 1,229 | 1,284 |
| Greenwich Capital Commercial Funding Corp., Series 2007-GG11, Class A1A, 5.704% 20498 | 31,693 | 32,128 |
| GS Mortgage Securities Corp. II, Series 2007-GG10, Class A1A, 5.793% 20457,8 | 2,794 | 2,822 |
| GS Mortgage Securities Corp. II, Series 2015-GS1, Class AAB, 3.553% 20488 | 5,000 | 5,189 |
| J.P. Morgan Chase Commercial Mortgage Securities Trust, Series 2006-LDP9, Class AM, 5.372% 20478 | 11,714 | 11,710 |
| J.P. Morgan Chase Commercial Mortgage Securities Corp., Series 2007-CB18, Class A1A, 5.431% 20477,8 | 1,387 | 1,387 |
American Balanced Fund — Page 25 of 32
Bonds, notes & other debt instruments
Mortgage-backed obligations (continued) | Principal amount
(000) | Value
(000) |
| J.P. Morgan Chase Commercial Mortgage Securities Corp., Series 2007-LDPX, Class A1A, 5.439% 20498 | $1,314 | $1,318 |
| J.P. Morgan Chase Commercial Mortgage Securities Corp., Series 2007-CB19, Class A1A, 5.713% 20497,8 | 34,375 | 34,613 |
| J.P. Morgan Chase Commercial Mortgage Securities Corp., Series 2007-CB19, Class A4, 5.713% 20497,8 | 18,845 | 18,960 |
| J.P. Morgan Chase Commercial Mortgage Securities Corp., Series 2007-C1, Class A4, 5.716% 20518 | 14,530 | 14,858 |
| J.P. Morgan Chase Commercial Mortgage Securities Corp., Series 2007-LD12, Class A1A, 5.85% 20517,8 | 11,871 | 12,005 |
| L.A. Arena Funding, LLC, Series 1, Class A, 7.656% 20264,8 | 6,783 | 7,194 |
| LB Commercial Mortgage Trust, Series 2007-C3, Class A1A, multifamily 5.873% 20447,8 | 6,071 | 6,138 |
| LB-UBS Commercial Mortgage Trust, Series 2007-C2, Class A1A, 5.387% 20408 | 29,908 | 29,994 |
| LB-UBS Commercial Mortgage Trust, Series 2007-C2, Class A3, 5.43% 20408 | 6,789 | 6,803 |
| LB-UBS Commercial Mortgage Trust, Series 2007-C2, Class AM, 5.493% 20407,8 | 2,675 | 2,697 |
| LB-UBS Commercial Mortgage Trust, Series 2007-C6, Class AM, 6.114% 20407,8 | 24,060 | 24,696 |
| LB-UBS Commercial Mortgage Trust, Series 2007-C7, Class AM, 6.159% 20457,8 | 11,575 | 11,953 |
| Merrill Lynch Mortgage Trust, Series 2007-C1, Class A4, 5.826% 20507,8 | 7,442 | 7,505 |
| ML-CFC Commercial Mortgage Trust, Series 2007-8, Class A3, 6.852% 20497,8 | 9,221 | 9,334 |
| Morgan Stanley Bank of America Merrill Lynch Trust, Series 2015-C27, Class ASB, 3.557% 20478 | 4,000 | 4,135 |
| Morgan Stanley Bank of America Merrill Lynch Trust, Series 2015-C22, Class ASB, 3.04% 20488 | 3,380 | 3,414 |
| Morgan Stanley Capital I Trust, Series 2014-CPT, Class A, 3.35% 20294,8 | 14,570 | 15,060 |
| Morgan Stanley Capital I Trust, Series 2007-IQ13, Class AM, 5.406% 20448 | 4,500 | 4,497 |
| Morgan Stanley Capital I Trust, Series 2007-IQ15, Class A4, 5.902% 20497,8 | 15,778 | 16,028 |
| Mortgage Repurchase Agreement Financing Trust, Series 2016-3, Class A1, 1.664% 20181,4,7,8 | 46,400 | 46,418 |
| National Australia Bank 2.00% 20174,8 | 500 | 502 |
| National Australia Bank 1.25% 20184,8 | 14,120 | 14,071 |
| National Australia Bank 2.00% 20194,8 | 4,925 | 4,939 |
| Nationstar HECM Loan Trust, Series 2016-3A, Class A, 2.013% 20264,8 | 4,565 | 4,581 |
| Nationstar HECM Loan Trust, Series 2016-2A, Class A, 2.239% 20261,4,8 | 6,278 | 6,300 |
| Royal Bank of Canada 2.00% 20198 | 3,550 | 3,574 |
| Royal Bank of Canada 2.20% 20198 | 37,700 | 37,905 |
| Royal Bank of Canada 1.875% 20208 | 18,000 | 17,907 |
| Royal Bank of Canada 2.10% 20208 | 5,000 | 4,978 |
| Station Place Securitization Trust, Series 2016-1, Class A, 1.756% 20481,7,8 | 16,000 | 16,000 |
| Station Place Securitization Trust, Series 2016-3, Class A, 1.856% 20481,4,7,8 | 39,000 | 39,000 |
| Swedbank AB 1.375% 20184,8 | 925 | 922 |
| Towd Point Mortgage Trust, Series 2016-4, Class A1, 2.25% 20564,7,8 | 7,992 | 7,927 |
| Wachovia Bank Commercial Mortgage Trust, Series 2007-C30, Class A5, 5.342% 20438 | 3,677 | 3,673 |
| Wachovia Bank Commercial Mortgage Trust, Series 2007-C31, Class A5, 5.50% 20478 | 10,000 | 10,052 |
| Wachovia Bank Commercial Mortgage Trust, Series 2007-C32, Class A3, 5.707% 20497,8 | 30,864 | 31,053 |
| Wachovia Bank Commercial Mortgage Trust, Series 2007-C33, Class AM, 5.969% 20517,8 | 17,000 | 17,207 |
| Wells Fargo Mortgage-backed Securities Trust, Series 2005-AR10, Class IIA6, 3.010% 20357,8 | 5,979 | 6,288 |
| Westpac Banking Corp. 1.25% 20174,8 | 800 | 798 |
| Westpac Banking Corp. 1.375% 20184,8 | 3,325 | 3,312 |
| Westpac Banking Corp. 1.85% 20184,8 | 8,300 | 8,308 |
| Westpac Banking Corp. 2.00% 20194,8 | 28,300 | 28,400 |
| Westpac Banking Corp. 2.25% 20204,8 | 12,500 | 12,502 |
| Westpac Banking Corp. 2.00% 20214,8 | 10,825 | 10,746 |
| | | 6,308,810 |
| Asset-backed obligations 1.14% | | |
| Aesop Funding LLC, Series 2013-2A, Class A, 2.97% 20204,8 | 16,535 | 16,709 |
| Aesop Funding LLC, Series 2015-1, Class A, 2.50% 20214,8 | 55,500 | 55,078 |
| Aesop Funding LLC, Series 2014-2A, Class A, 2.50% 20214,8 | 18,500 | 18,433 |
| Aesop Funding LLC, Series 2015-2A, Class A, 2.63% 20214,8 | 11,665 | 11,524 |
| Ally Master Owner Trust, Series 2014-4, Class A1, 1.104% 20197,8 | 10,000 | 10,003 |
| Ally Master Owner Trust, Series 2014-1, Class A1, 1.174% 20197,8 | 6,985 | 6,986 |
| Ally Master Owner Trust, Series 2014-1, Class A2, 1.29% 20198 | 7,675 | 7,675 |
| American Express Credit Account Master Trust, Series 2014-4, Class A, 1.43% 20208 | 13,510 | 13,533 |
American Balanced Fund — Page 26 of 32
Bonds, notes & other debt instruments
Asset-backed obligations (continued) | Principal amount
(000) | Value
(000) |
| AmeriCredit Automobile Receivables Trust, Series 2012-4, Class C, 1.93% 20188 | $71 | $71 |
| AmeriCredit Automobile Receivables Trust, Series 2014-3, Class A3, 1.15% 20198 | 3,284 | 3,283 |
| AmeriCredit Automobile Receivables Trust, Series 2015-1, Class A3, 1.26% 20198 | 7,461 | 7,453 |
| AmeriCredit Automobile Receivables Trust, Series 2014-4, Class A3, 1.27% 20198 | 5,959 | 5,959 |
| AmeriCredit Automobile Receivables Trust, Series 2016-1, Class C, 2.89% 20228 | 3,190 | 3,230 |
| ARI Fleet Lease Trust, Series 2014-A, Class A2, 0.81% 20224,8 | 205 | 205 |
| Avant Loans Funding Trust, Series 2016-C, Class A, 2.96% 20194,8 | 6,181 | 6,178 |
| Avant Loans Funding Trust, Series 2016-B, Class A, 3.92% 20194,8 | 658 | 660 |
| Avant Loans Funding Trust, Series 2016-A, Class A, 4.11% 20194,8 | 6,074 | 6,087 |
| Bank of the West Auto Trust, Series 2014-1, Class A3, 1.09% 20194,8 | 2,500 | 2,499 |
| Cabela’s Master Credit Card Trust, Series 2016-1, Class A1, 1.78% 20228 | 19,600 | 19,547 |
| Capital One Multi-asset Execution Trust, Series 2014-A5, Class A, 1.48% 20208 | 15,110 | 15,140 |
| Carlyle Global Market Strategies Commodities Fund, Series 2015-1A, Class A, 2.131% 20201,4,7,8 | 3,904 | 3,025 |
| Carlyle Global Market Strategies Commodities Fund, Series 2014-1A, Class A, 2.78% 20211,4,7,8 | 5,194 | 4,128 |
| CarMaxAuto Owner Trust, Series 2014-4, Class A3, 1.25% 20198 | 9,234 | 9,234 |
| Chase Issuance Trust, Series 2016-A7, Class A, 1.06% 20198 | 55,000 | 54,954 |
| Chase Issuance Trust, Series 2016-A6, Class A6, 1.10% 20208 | 98,630 | 98,407 |
| Chesapeake Funding LLC, Series 2014-1A, Class A, 1.072% 20264,7,8 | 7,820 | 7,793 |
| Chrysler Capital Auto Receivables Trust, Series 2015-AA, Class A3, 1.22% 20194,8 | 15,383 | 15,383 |
| Chrysler Capital Auto Receivables Trust, Series 2014-AA, Class A4, 1.31% 20194,8 | 3,235 | 3,236 |
| Citi Held For Issuance, Series 2015-PM2, Class A, 2.35% 20224,8 | 4,078 | 4,076 |
| Citi Held For Issuance, Series 2015-PM3, Class A, 2.56% 20224,8 | 1,641 | 1,639 |
| Citi Held For Issuance, Series 2016-PM1, Class A, 4.65% 20254,8 | 1,914 | 1,938 |
| Citibank Credit Card Issuance Trust, Series 2008-A2, Class A2, 1.905% 20207,8 | 8,000 | 8,084 |
| Citibank Credit Card Issuance Trust, Series 2014-A6, Class A6, 2.15% 20218 | 16,725 | 16,865 |
| CLI Funding V LLC, Series 2013-2A, Class Note, 3.22% 20284,8 | 602 | 583 |
| CLI Funding V LLC, Series 2014-1A, Class A, 3.29% 20294,8 | 4,109 | 3,964 |
| CLI Funding V LLC, Series 2014-2A, Class A, 3.38% 20294,8 | 2,733 | 2,629 |
| Consumer Credit Origination Loan Trust, Series 2015-1, Class A, 2.82% 20214,8 | 551 | 554 |
| CPS Auto Receivables Trust, Series 2015-A, Class A, 1.53% 20194,8 | 1,167 | 1,167 |
| CPS Auto Receivables Trust, Series 2015-C, Class A, 1.77% 20194,8 | 2,464 | 2,468 |
| CPS Auto Receivables Trust, Series 2016-B, Class A, 2.07% 20194,8 | 1,538 | 1,540 |
| CPS Auto Receivables Trust, Series 2015-A, Class B, 2.79% 20214,8 | 1,250 | 1,262 |
| CPS Auto Receivables Trust, Series 2016-A, Class C, 3.80% 20214,8 | 10,350 | 10,452 |
| CPS Auto Receivables Trust, Series 2015-A, Class C, 4.00% 20214,8 | 960 | 968 |
| CWABS, Inc., Series 2004-BC1, Class M1, 1.506% 20347,8 | 2,116 | 2,023 |
| Discover Card Execution Note Trust, Series 2014-A4, Class A4, 2.12% 20218 | 7,595 | 7,662 |
| Drive Auto Receivables Trust, Series 2015-AA, Class B, 2.28% 20194,8 | 2,129 | 2,133 |
| Drive Auto Receivables Trust, Series 2015-BA, Class C, 2.76% 20214,8 | 20,720 | 20,848 |
| Drive Auto Receivables Trust, Series 2015-CA, Class C, 3.01% 20214,8 | 7,910 | 7,979 |
| Drive Auto Receivables Trust, Series 2015-AA, Class C, 3.06% 20214,8 | 9,500 | 9,595 |
| Drive Auto Receivables Trust, Series 2015-DA, Class C, 3.38% 20214,8 | 20,790 | 21,092 |
| Drive Auto Receivables Trust, Series 2016-AA, Class C, 3.91% 20214,8 | 29,000 | 29,427 |
| Drivetime Auto Owner Trust, Series 2015-3A, Class A, 1.66% 20194,8 | 2,111 | 2,112 |
| Drivetime Auto Owner Trust, Series 2016-2A, Class A, 1.73% 20194,8 | 2,645 | 2,647 |
| Drivetime Auto Owner Trust, Series 2016-1A, Class C, 3.54% 20214,8 | 2,730 | 2,751 |
| Enterprise Fleet Financing LLC, Series 2014-1, Class A2, 0.87% 20194,8 | 529 | 529 |
| Enterprise Fleet Financing LLC, Series 2014-1, Class A3, 1.38% 20194,8 | 5,000 | 4,994 |
| Enterprise Fleet Financing LLC, Series 2014-2, Class A2, 1.05% 20204,8 | 4,046 | 4,042 |
| Enterprise Fleet Financing LLC, Series 2015-1, Class A2, 1.30% 20204,8 | 9,506 | 9,500 |
| Enterprise Fleet Financing LLC, Series 2016-2, Class A2, 1.74% 20224,8 | 7,795 | 7,775 |
| Fifth Third Auto Trust, Series 2014-3, Class A3, 0.96% 20198 | 3,844 | 3,842 |
| Ford Credit Auto Owner Trust, Series 2014-AA3, 0.79% 20188 | 863 | 863 |
| Ford Credit Auto Owner Trust, Series 2014-1A, 2.26% 20254,8 | 4,250 | 4,287 |
| Ford Credit Auto Owner Trust, Series 2015-1, Class A, 2.12% 20264,8 | 19,800 | 19,827 |
American Balanced Fund — Page 27 of 32
Bonds, notes & other debt instruments
Asset-backed obligations (continued) | Principal amount
(000) | Value
(000) |
| Ford Credit Auto Owner Trust, Series 2014-2A, 2.31% 20264,8 | $26,380 | $26,599 |
| Ford Credit Auto Owner Trust, Series 2016-2, Class A, 2.03% 20274,8 | 50,000 | 49,181 |
| Ford Credit Auto Owner Trust, Series 2016-1, Class A, 2.31% 20274,8 | 35,370 | 35,305 |
| Ford Credit Auto Owner Trust, Series 2015-2, Class A, 2.44% 20274,8 | 33,450 | 33,747 |
| Ford Credit Floorplan Master Owner Trust, Series 2015-1, Class A1, 1.42% 20208 | 18,860 | 18,846 |
| Ford Credit Floorplan Master Owner Trust, Series 2016-3, Class A1, 1.55% 20218 | 22,500 | 22,272 |
| Ford Credit Floorplan Master Owner Trust, Series 2015-2, Class A1, 1.98% 20228 | 14,390 | 14,426 |
| Hertz Fleet Lease Funding LP, Series 2014-1A, 1.064% 20284,7,8 | 5,587 | 5,588 |
| Hertz Vehicle Financing LLC, Rental Car Asset-backed Notes, Series 2013-1A, Class A2, 1.83% 20194,8 | 23,840 | 23,655 |
| Hertz Vehicle Financing LLC, Rental Car Asset-backed Notes, Series 2015-3A, Class A, 2.67% 20214,8 | 18,085 | 18,103 |
| Hertz Vehicle Financing LLC, Rental Car Asset-backed Notes, Series 2015-1, Class A, 2.73% 20214,8 | 31,211 | 31,016 |
| Hertz Vehicle Financing LLC, Rental Car Asset-backed Notes, Series 2015-1, Class A, 3.52% 20214,8 | 1,263 | 1,253 |
| Honda Auto Receivables Owner Trust, Series 2014-3, Class A3, 0.88% 20188 | 5,160 | 5,157 |
| MarketPlace Loan Trust, Series 2015-AV1, Class A, 4.00% 20211,4,8 | 1,830 | 1,838 |
| RAMP Trust, Series 2003-RS11, Class AI7, 4.828% 20338 | 424 | 439 |
| RAMP Trust, Series 2003-RZ4, Class A7, 5.29% 20337,8 | 87 | 90 |
| Residential Asset Securities Corp. Trust, Series 2003-KS8, Class AI6, 4.83% 20338 | 240 | 254 |
| Santander Drive Auto Receivables Trust, Series 2013-3, Class C, 1.81% 20198 | 4,994 | 5,002 |
| Santander Drive Auto Receivables Trust, Series 2014-4, Class B, 1.82% 20198 | 4,129 | 4,133 |
| Santander Drive Auto Receivables Trust, Series 2013-2, Class C, 1.95% 20198 | 3,866 | 3,872 |
| Santander Drive Auto Receivables Trust, Series 2014-2, Class C, 2.33% 20198 | 5,000 | 5,026 |
| Santander Drive Auto Receivables Trust, Series 2013-A, Class C, 3.12% 20194,8 | 735 | 740 |
| Santander Drive Auto Receivables Trust, Series 2015-5, Class B, 1.96% 20208 | 4,500 | 4,511 |
| Santander Drive Auto Receivables Trust, Series 2014-1, Class C, 2.36% 20208 | 10,235 | 10,279 |
| Santander Drive Auto Receivables Trust, Series 2013-4, Class C, 3.25% 20208 | 776 | 781 |
| Santander Drive Auto Receivables Trust, Series 2015-2, Class C, 2.44% 20218 | 15,310 | 15,429 |
| Santander Drive Auto Receivables Trust, Series 2016-2, Class C, 2.66% 20218 | 5,555 | 5,572 |
| Santander Drive Auto Receivables Trust, Series 2015-5, Class C, 2.74% 20218 | 17,985 | 18,132 |
| Santander Drive Auto Receivables Trust, Series 2015-3, Class C, 2.74% 20218 | 125 | 126 |
| Santander Drive Auto Receivables Trust, Series 2015-4, Class C, 2.97% 20218 | 7,100 | 7,170 |
| SMB Private Education Loan Trust, Series 2015-A, Class A2A, 2.49% 20274,8 | 2,100 | 2,082 |
| Social Professional Loan Program LLC, Series 2015-C, Class A1, 1.806% 20354,7,8 | 5,510 | 5,545 |
| Social Professional Loan Program LLC, Series 2015-D, Class A2, 2.72% 20364,8 | 20,163 | 20,303 |
| South Carolina Student Loan Corp., Series 2014-1, Class A1, 1.367% 20307,8 | 4,550 | 4,437 |
| South Carolina Student Loan Corp., Series 2014-1, Class A2, 1.617% 20337,8 | 12,240 | 11,857 |
| South Carolina Student Loan Corp., Series 2014-1, Class B, 2.117% 20357,8 | 3,350 | 2,902 |
| TAL Advantage V LLC, Series 2013-1A, Class A, 2.83% 20384,8 | 2,766 | 2,632 |
| TAL Advantage V LLC, Series 2013-2A, Class A, 3.55% 20384,8 | 6,215 | 6,034 |
| TAL Advantage V LLC, Series 2014-3A, Class A, 3.27% 20394,8 | 689 | 658 |
| TAL Advantage V LLC, Series 2014-2A, Class A2, 3.33% 20394,8 | 15,039 | 14,504 |
| TAL Advantage V LLC, Series 2014-1A, Class A, 3.51% 20394,8 | 7,632 | 7,359 |
| Utility Debt Securitization Auth., Series 2013-T, 2.042% 20218 | 3,510 | 3,525 |
| Utility Debt Securitization Auth., Series 2013-T, 3.435% 20258 | 2,625 | 2,716 |
| Verizon Owner Trust, Series 2016-1A, Class A, 1.42% 20214,8 | 18,945 | 18,832 |
| Verizon Owner Trust, Series 2016-2A, Class A, 1.68% 20214,8 | 16,300 | 16,237 |
| Volkswagen Auto Loan Enhanced Trust, Series 2014-2, Class A3, 0.95% 20198 | 25,723 | 25,665 |
| Westlake Automobile Receivables Trust, Series 2016-1A, Class C, 3.29% 20214,8 | 4,500 | 4,547 |
| World Financial Network Credit Card Master Note Trust, Series 2015-A, Class A, 1.184% 20227,8 | 2,625 | 2,631 |
| World Omni Auto Receivables Trust, Series 2014-B, Class A3, 1.14% 20208 | 6,271 | 6,266 |
| | | 1,155,804 |
| Federal agency bonds & notes 0.64% | | |
| CoBank, ACB 1.563% 20224,7 | 25,105 | 24,164 |
| Fannie Mae 0.875% 2018 | 10,000 | 9,973 |
| Fannie Mae 1.00% 2019 | 100,000 | 98,686 |
American Balanced Fund — Page 28 of 32
Bonds, notes & other debt instruments
Federal agency bonds & notes (continued) | Principal amount
(000) | Value
(000) |
| Fannie Mae 1.00% 2019 | $15,000 | $14,904 |
| Fannie Mae 1.375% 2021 | 30,000 | 29,190 |
| Fannie Mae 2.125% 2026 | 45,510 | 43,142 |
| Fannie Mae 6.25% 2029 | 4,000 | 5,336 |
| Federal Farm Credit Banks 0.786% 20177 | 31,250 | 31,266 |
| Federal Home Loan Bank 0.875% 2018 | 77,140 | 76,898 |
| Federal Home Loan Bank 0.875% 2018 | 50,000 | 49,701 |
| Federal Home Loan Bank 1.875% 2020 | 25,660 | 25,919 |
| Federal Home Loan Bank 3.375% 2023 | 16,840 | 17,983 |
| Federal Home Loan Bank 5.50% 2036 | 600 | 788 |
| Freddie Mac 0.75% 2018 | 38,120 | 37,907 |
| Freddie Mac 0.75% 2018 | 22,612 | 22,545 |
| Freddie Mac 0.875% 2019 | 100,000 | 98,738 |
| Freddie Mac 1.125% 2019 | 15,000 | 14,942 |
| Private Export Funding Corp. 3.55% 2024 | 25,897 | 27,752 |
| Tennessee Valley Authority, Series B, 3.50% 2042 | 14,750 | 14,464 |
| | | 644,298 |
| Bonds & notes of governments & government agencies outside the U.S. 0.23% | | |
| Caisse d’Amortissement de la Dette Sociale 1.125% 20174 | 9,205 | 9,205 |
| CPPIB Capital Inc. 1.25% 20194 | 23,300 | 22,979 |
| FMS Wertmanagement 1.625% 2018 | 5,000 | 5,016 |
| Israel (State of) 3.15% 2023 | 35,000 | 35,603 |
| Landwirtschaftliche Rentenbank 1.75% 2019 | 8,880 | 8,910 |
| Manitoba (Province of) 3.05% 2024 | 13,500 | 13,771 |
| Ontario (Province of) 3.20% 2024 | 10,000 | 10,273 |
| Spain (Kingdom of) 4.00% 20184 | 54,950 | 56,234 |
| Swedish Export Credit Corp. 2.875% 20234 | 3,000 | 2,992 |
| United Mexican States 3.60% 2025 | 32,600 | 31,508 |
| United Mexican States 4.125% 2026 | 26,650 | 26,503 |
| United Mexican States 5.55% 2045 | 15,000 | 15,394 |
| | | 238,388 |
| Municipals 0.20% | | |
| State of California, Industry Public Facs. Auth., Tax Allocation Rev. Ref. Bonds (Civic - Recreational-Industrial Redev. Project No. 1), Series 2015-A, Assured Guaranty Municipal insured, 3.821% 2022 | 11,640 | 12,125 |
State of California, Los Angeles Community College Dist. (County of Los Angeles), G.O. Build America
Bonds, 2008 Election, Series 2010-E, 6.60% 2042 | 15,000 | 20,862 |
| State of California, Veterans G.O. Ref. Bonds, Series 2015-CM, AMT, 2.45% 2031 | 2,240 | 2,232 |
State of Connecticut, Housing Fin. Auth., Housing Mortgage Fin. Program Bonds, Series 2014-A-1,
4.00% 2044 | 1,640 | 1,720 |
State of Connecticut, Housing Fin. Auth., Housing Mortgage Fin. Program Bonds, Series 2014-C-1,
4.00% 2044 | 2,100 | 2,187 |
| State of Connecticut, Housing Fin. Auth., Housing Mortgage Fin. Program Rev. Ref. Bonds, Series 2013-B-2, 4.00% 2032 | 1,530 | 1,619 |
| State of Connecticut, Housing Fin. Auth., Housing Mortgage Fin. Program Rev. Ref. Bonds, Series 2015-C-1, 3.50% 2045 | 3,840 | 3,984 |
| State of Florida, Housing Fin. Corp., Homeowner Mortgage Rev. Bonds, Series 2011-C, 4.50% 2030 | 175 | 182 |
| State of Florida, Hurricane Catastrophe Fund Fin. Corp., Rev. Bonds, Series 2013-A, 2.995% 2020 | 4,000 | 4,098 |
| State of Georgia, Housing and Fin. Auth., Single Family Mortgage Bonds, Series 2013-A, 3.00% 2043 | 55 | 55 |
| State of Georgia, Housing and Fin. Auth., Single Family Mortgage Bonds, Series 2015-A-1, 3.50% 2045 | 2,105 | 2,184 |
| State of Georgia, Housing and Fin. Auth., Single Family Mortgage Bonds, Series 2015-B-1, 3.50% 2045 | 930 | 965 |
| State of Illinois, Housing Dev. Auth., Housing Rev. Bonds, Series 2013-A, 2.45% 20438 | 999 | 986 |
| State of Illinois, Housing Dev. Auth., Multifamily Housing Rev. Notes (Marshall Field Garden Apartment Homes), 1.72% 2050 (put 2025)7 | 6,500 | 6,434 |
American Balanced Fund — Page 29 of 32
Bonds, notes & other debt instruments
Municipals (continued) | Principal amount
(000) | Value
(000) |
State of Iowa, Fin. Auth., Single Family Mortgage Bonds (Mortgage-backed Securities Program),
Series 2013-1, 2.15% 20438 | $632 | $591 |
| State of Kentucky, Housing Corp., Housing Rev. Bonds, Series 2013-D, 3.50% 2033 | 1,105 | 1,143 |
| State of Maine, Housing Auth., Mortgage Purchase Rev. Ref. Bonds, Series 2014-A-1, AMT, 3.25% 2043 | 710 | 724 |
| State of Maine, Housing Auth., Mortgage Purchase Rev. Ref. Bonds, Series 2014-C-1, AMT, 3.50% 2044 | 745 | 775 |
| State of Maine, Housing Auth., Mortgage Purchase Rev. Ref. Bonds, Series 2015-E-1, AMT, 3.50% 2035 | 6,495 | 6,697 |
| State of Maryland, Community Dev. Administration, Dept. of Housing and Community Dev., Residential Rev. Bonds, Series 2014-B, AMT, 3.25% 2044 | 3,575 | 3,659 |
| State of Maryland, Community Dev. Administration, Dept. of Housing and Community Dev., Residential Rev. Ref. Bonds, Series 2014-E, 2.857% 2040 | 3,145 | 3,122 |
| State of Massachusetts, Housing Fin. Agcy., Single Family Housing Rev. Bonds, Series 167, 4.00% 2043 | 505 | 523 |
| State of Massachusetts, Housing Fin. Agcy., Single Family Housing Rev. Bonds, Series 178, 3.50% 2042 | 950 | 987 |
State of Massachusetts, Housing Fin. Agcy., Single Family Housing Rev. Ref. Bonds, Series 177, AMT,
4.00% 2039 | 2,590 | 2,719 |
| State of Michigan, City of Detroit, Sewage Disposal System Rev. Ref. Bonds, Series 2006-D, Assured Guaranty Municipal insured, 1.167% 20327 | 5,000 | 4,349 |
| State of Michigan, Fin. Auth., Local Government Loan Program Rev. Bonds (City of Detroit Fin. Recovery Income Tax Local Project), Series 2014-F-2, 4.60% 2022 | 9,000 | 9,149 |
| State of Michigan, Fin. Auth., Student Loan Rev. Ref. Bonds, Series 2015-B-1, 1.511% 20307,8 | 8,558 | 8,328 |
| State of Minnesota, Housing Fin. Agcy., Homeownership Fin. Bonds (GNMA and FNMA Pass-Through Program), Series 2012-B, 2.25% 20428 | 1,104 | 1,097 |
| State of Minnesota, Housing Fin. Agcy., Homeownership Fin. Bonds (GNMA and FNMA Pass-Through Program), Series 2013-A, 2.35% 20438 | 1,177 | 1,146 |
| State of Minnesota, Housing Fin. Agcy., Residential Housing Fin. Bonds, Series 2013-A, AMT, 3.00% 2031 | 240 | 243 |
| State of Minnesota, Housing Fin. Agcy., Residential Housing Fin. Bonds, Series 2014-B, 4.00% 2038 | 1,095 | 1,156 |
| State of Minnesota, Housing Fin. Agcy., Residential Housing Fin. Bonds, Series 2014-C, AMT, 4.00% 2045 | 8,265 | 8,652 |
| State of Minnesota, Housing Fin. Agcy., Residential Housing Fin. Bonds, Series 2015-A, AMT, 4.00% 2041 | 880 | 925 |
| State of Minnesota, Housing Fin. Agcy., Residential Housing Fin. Bonds, Series 2015-E, AMT, 3.50% 2046 | 3,160 | 3,258 |
| State of Mississippi, Home Corp., Single Family Mortgage Rev. Bonds, Series 2009-A-2, 5.00% 2039 | 290 | 307 |
| State of Missouri, Housing Dev. Commission, Single Family Mortgage Rev. Bonds (Special Homeownership Loan Program), Series 2014-A, 4.00% 2041 | 1,250 | 1,303 |
| State of Missouri, Housing Dev. Commission, Single Family Mortgage Rev. Bonds (Special Homeownership Loan Program), Series 2015-A, 3.75% 2038 | 1,110 | 1,160 |
| State of Montana, Board of Housing, Single Family Mortgage Bonds, Series 2015-B-2, AMT, 3.50% 2042 | 1,445 | 1,493 |
| State of Nebraska, Investment Fin. Auth., Single Family Housing Rev. Bonds, Series 2013-E, 3.00% 2043 | 240 | 244 |
| State of Nebraska, Investment Fin. Auth., Single Family Housing Rev. Bonds, Series 2013-E, 3.00% 2043 | 355 | 361 |
State of Nebraska, Investment Fin. Auth., Single Family Housing Rev. Bonds, Series 2015-C,
3.50% 2045 | 1,865 | 1,931 |
State of New Jersey, Econ. Dev. Auth., School Facs. Construction Rev. Ref. Bonds, Series 2015-YY,
4.447% 2020 | 12,000 | 12,126 |
State of New Jersey, Transportation Trust Fund Auth., Transportation System Rev. Ref. Bonds,
Series 2013-B, 1.758% 2018 | 15,250 | 14,914 |
| State of New York, Mortgage Agcy., Homeowner Mortgage Rev. Bonds, Series 52, AMT, 3.50% 2030 | 2,605 | 2,686 |
| State of North Dakota, Housing Fin. Agcy., Housing Fin. Program Bonds (Home Mortgage Fin. Program), Series 2015-B, 4.00% 2036 | 2,965 | 3,125 |
| State of Oklahoma, Housing Fin. Agcy., Single Family Mortgage Rev. Bonds (Homeownership Loan Program), Series 2012-A, 5.00% 2043 | 685 | 732 |
| State of Pennsylvania, Housing Fin. Agcy., Single Family Mortgage Rev. Bonds, Series 2015-118-A, AMT, 3.50% 2040 | 5,295 | 5,456 |
| Territory of Puerto Rico, Electric Power Auth., Power Rev. Ref. Bonds, Series UU, Assured Guaranty Municipal insured, 1.087% 20297 | 10,200 | 7,738 |
| State of South Carolina, Housing Fin. Auth., Mortgage Rev. Ref. Bonds, AMT, 4.00% 2041 | 3,850 | 4,042 |
State of South Dakota, Housing Dev. Auth., Homeownership Mortgage Bonds,
Series 2013-E, AMT, 4.00% 2044 | 580 | 603 |
American Balanced Fund — Page 30 of 32
Bonds, notes & other debt instruments
Municipals (continued) | Principal amount
(000) | Value
(000) |
State of South Dakota, Housing Dev. Auth., Homeownership Mortgage Bonds,
Series 2014-F, 4.00% 2034 | $1,140 | $1,183 |
State of South Dakota, Housing Dev. Auth., Homeownership Mortgage Bonds,
Series 2015-D, 4.00% 2045 | 3,380 | 3,590 |
| State of Tennessee, Housing Dev. Agcy., Homeownership Program Rev. Ref. Bonds, Issue 2015-A, 3.50% 2045 | 1,635 | 1,702 |
| State of Tennessee, Housing Dev. Agcy., Residential Fin. Program Bonds, AMT, 4.00% 2046 | 4,120 | 4,323 |
| State of Tennessee, Housing Dev. Agcy., Residential Fin. Program Bonds, Series 2013-2-A, AMT, 4.00% 2043 | 725 | 752 |
| State of Tennessee, Housing Dev. Agcy., Residential Fin. Program Bonds, Series 2015-1-A, AMT, 4.00% 2045 | 3,665 | 3,856 |
| State of Utah, Housing Corp., Single Family Mortgage Bonds, Class III, Series 2015-D-2, 4.00% 2045 | 1,945 | 2,054 |
| State of Washington, Housing Fin. Commission, Single Family Program Bonds, Series 2014-1-N, 3.00% 2037 | 515 | 525 |
| State of Washington, Housing Fin. Commission, Single Family Program Rev. Ref. Bonds, Series 2013-1-N, 3.00% 2043 | 165 | 168 |
| State of Washington, Housing Fin. Commission, Single Family Program Rev. Ref. Bonds, Series 2015-A-R, AMT, 3.50% 2038 | 4,915 | 5,072 |
State of Wisconsin, Housing and Econ. Dev. Auth., Home Ownership Rev. Bonds, Series 2015-A, AMT,
4.00% 2045 | 3,050 | 3,179 |
| State of Wyoming, Community Dev. Auth., Housing Rev. Bonds, Series 2015-6, 4.00% 2045 | 910 | 963 |
| | | 204,464 |
| Miscellaneous 0.07% | | |
| Other bonds & notes in initial period of acquisition | | 71,633 |
| Total bonds, notes & other debt instruments (cost: $34,905,316,000) | | 34,859,370 |
| Short-term securities 4.43% | | |
| Apple Inc. 0.55%–0.63% due 1/11/2017–2/1/20174 | 200,000 | 199,940 |
| CAFCO, LLC 1.06%–1.22% due 2/23/2017–4/4/20174 | 43,100 | 43,020 |
| Chariot Funding, LLC 1.00% due 1/17/20174 | 25,000 | 24,993 |
| Chevron Corp. 0.53%–0.82% due 1/17/2017–3/2/20174 | 269,000 | 268,843 |
| Ciesco LLC 1.08% due 3/27/20174 | 50,000 | 49,885 |
| Estée Lauder Companies Inc. 0.74% due 2/13/20174 | 50,000 | 49,960 |
| Federal Farm Credit Banks 0.50%–0.61% due 3/6/2017–7/6/2017 | 254,000 | 253,555 |
| Federal Home Loan Bank 0.31%–0.56% due 1/3/2017–5/26/2017 | 2,155,475 | 2,153,724 |
| Jupiter Securitization Co., LLC 0.85% due 1/9/20174 | 43,000 | 42,994 |
| Microsoft Corp. 0.74%–0.82% due 2/14/2017–2/21/20174 | 192,200 | 192,044 |
| Private Export Funding Corp. 0.56% due 1/12/20174 | 50,000 | 49,991 |
| Svenska Handelsbanken Inc. 1.02% due 2/21/20174 | 50,000 | 49,949 |
| U.S. Treasury Bills 0.39%–0.51% due 1/5/2017–3/30/2017 | 864,200 | 863,705 |
| Walt Disney Co. 0.73% due 2/24/20174 | 43,900 | 43,857 |
| Wells Fargo Bank, N.A. 1.01% due 1/18/2017 | 100,000 | 100,022 |
| Westpac Banking Corp. 1.04% due 2/15/20174 | 100,000 | 99,900 |
| Total short-term securities (cost: $4,486,128,000) | | 4,486,382 |
| Total investment securities 100.24% (cost: $80,151,207,000) | | 101,374,471 |
| Other assets less liabilities (0.24)% | | (244,411) |
| Net assets 100.00% | | $101,130,060 |
As permitted by U.S. Securities and Exchange Commission regulations, “Miscellaneous” securities include holdings in their first year of acquisition that have not previously been publicly disclosed.
American Balanced Fund — Page 31 of 32
The following footnotes apply to either the individual securities noted or one or more of the securities aggregated and listed as a single line item.
| 1 | Valued under fair value procedures adopted by authority of the board of trustees. The total value of all such securities, including those in “Miscellaneous,“ was $1,820,903,000, which represented 1.80% of the net assets of the fund. This amount includes $1,620,838,000 related to certain securities trading outside the U.S. whose values were adjusted as a result of significant market movements following the close of local trading. |
| 2 | Security did not produce income during the last 12 months. |
| 3 | Represents an affiliated company as defined under the Investment Company Act of 1940. |
| 4 | Acquired in a transaction exempt from registration under Rule 144A or Section 4(2) of the Securities Act of 1933. May be resold in the U.S. in transactions exempt from registration, normally to qualified institutional buyers. The total value of all such securities was $4,040,401,000, which represented 4.00% of the net assets of the fund. |
| 5 | A portion of this security was pledged as collateral. The total value of pledged collateral was $336,000, which represented less than .01% of the net assets of the fund. |
| 6 | Index-linked bond whose principal amount moves with a government price index. |
| 7 | Coupon rate may change periodically. |
| 8 | Principal payments may be made periodically. Therefore, the effective maturity date may be earlier than the stated maturity date. |
| 9 | Purchased on a TBA basis. |
| Key to abbreviations |
| ADR = American Depositary Receipts |
| Agcy. = Agency |
| AMT = Alternative Minimum Tax |
| Auth. = Authority |
| Dept. = Department |
| Dev. = Development |
| Dist. = District |
| Econ. = Economic |
| Facs. = Facilities |
| Fin. = Finance |
| G.O. = General Obligation |
| Redev. = Redevelopment |
| Ref. = Refunding |
| Rev. = Revenue |
| TBA = To-be-announced |
Refer to the fund’s current shareholder report for additional disclosures.
Investments are not FDIC-insured, nor are they deposits of or guaranteed by a bank or any other entity, so they may lose value.
Investors should carefully consider investment objectives, risks, charges and expenses. This and other important information is contained in the fund prospectus and summary prospectus, which can be obtained from your financial professional and should be read carefully before investing. You may also call American Funds Service Company (AFS) at (800) 421-4225 or visit the American Funds website at americanfunds.com.
| MFGEFPX-011-0217O-S54098 | American Balanced Fund — Page 32 of 32 |
REPORT OF INDEPENDENT REGISTERED PUBLIC ACCOUNTING FIRM
To the Shareholders and Board of Trustees of
American Balanced Fund:
We have audited the accompanying statement of assets and liabilities of American Balanced Fund (the “Fund”), including the summary schedule of investments, as of December 31, 2016, and the related statements of operations for the year then ended, the statements of changes in net assets for each of the two years in the period then ended (collectively, the “financial statements”), the financial highlights for each of the five years in the period then ended (the financial statements and financial highlights are included in Item 1 of this Form N-CSR), and the schedule of investments in securities as of December 31, 2016 (included in Item 6 of this Form N-CSR). These financial statements, financial highlights, and schedule of investments in securities are the responsibility of the Fund’s management. Our responsibility is to express an opinion on these financial statements, financial highlights, and schedule of investments in securities based on our audits.
We conducted our audits in accordance with the standards of the Public Company Accounting Oversight Board (United States). Those standards require that we plan and perform the audit to obtain reasonable assurance about whether the financial statements, financial highlights, and schedule of investments in securities are free of material misstatement. An audit includes examining, on a test basis, evidence supporting the amounts and disclosures in the financial statements and schedule of investments in securities, assessing the accounting principles used and significant estimates made by management, as well as evaluating the overall financial statement presentation. Our procedures included confirmation of securities owned as of December 31, 2016, by correspondence with the custodian and brokers; where replies were not received from brokers, we performed other auditing procedures. We believe that our audits provide a reasonable basis for our opinion.
In our opinion, the financial statements, financial highlights, and schedule of investments in securities referred to above present fairly, in all material respects, the financial position of American Balanced Fund as of December 31, 2016, and the results of its operations for the year then ended, the changes in its net assets for each of the two years in the period then ended, and the financial highlights for each of the five years in the period then ended, in conformity with accounting principles generally accepted in the United States of America.
DELOITTE & TOUCHE LLP
Costa Mesa, California
February 8, 2017
ITEM 7 – Disclosure of Proxy Voting Policies and Procedures for Closed-End Management Investment Companies
Not applicable to this Registrant, insofar as the Registrant is not a closed-end management investment company.
ITEM 8 – Portfolio Managers of Closed-End Management Investment Companies
Not applicable to this Registrant, insofar as the Registrant is not a closed-end management investment company.
ITEM 9 – Purchases of Equity Securities by Closed-End Management Investment Company and Affiliated Purchasers
Not applicable to this Registrant, insofar as the Registrant is not a closed-end management investment company.
ITEM 10 – Submission of Matters to a Vote of Security Holders
There have been no material changes to the procedures by which shareholders may recommend nominees to the Registrant’s board of trustees since the Registrant last submitted a proxy statement to its shareholders. The procedures are as follows. The Registrant has a nominating and governance committee comprised solely of persons who are not considered ‘‘interested persons’’ of the Registrant within the meaning of the Investment Company Act of 1940, as amended. The committee periodically reviews such issues as the board’s composition, responsibilities, committees, compensation and other relevant issues, and recommends any appropriate changes to the full board of trustees. While the committee normally is able to identify from its own resources an ample number of qualified candidates, it will consider shareholder suggestions of persons to be considered as nominees to fill future vacancies on the board. Such suggestions must be sent in writing to the nominating and governance committee of the Registrant, c/o the Registrant’s Secretary, and must be accompanied by complete biographical and occupational data on the prospective nominee, along with a written consent of the prospective nominee for consideration of his or her name by the nominating and governance committee.
ITEM 11 – Controls and Procedures
| (a) | The Registrant’s Principal Executive Officer and Principal Financial Officer have concluded, based on their evaluation of the Registrant’s disclosure controls and procedures (as such term is defined in Rule 30a-3 under the Investment Company Act of 1940), that such controls and procedures are adequate and reasonably designed to achieve the purposes described in paragraph (c) of such rule. |
| | |
| (b) | There were no changes in the Registrant’s internal controls over financial reporting (as defined in Rule 30a-3(d) under the Investment Company Act of 1940) that occurred during the Registrant’s second fiscal quarter of the period covered by this report that has materially affected, or is reasonably likely to materially affect, the Registrant’s internal control over financial reporting. |
ITEM 12 – Exhibits
| (a)(1) | The Code of Ethics that is the subject of the disclosure required by Item 2 is attached as an exhibit hereto. |
| | |
| (a)(2) | The certifications required by Rule 30a-2 of the Investment Company Act of 1940 and Sections 302 and 906 of the Sarbanes-Oxley Act of 2002 are attached as exhibits hereto. |
SIGNATURES
Pursuant to the requirements of the Securities Exchange Act of 1934 and the Investment Company Act of 1940, the Registrant has duly caused this report to be signed on its behalf by the undersigned, thereunto duly authorized.
| | AMERICAN BALANCED FUND |
| | |
| | By /s/ Gregory D. Johnson |
| | Gregory D. Johnson, Vice Chairman, President and Principal Executive Officer |
| | |
| | Date: February 28, 2017 |
Pursuant to the requirements of the Securities Exchange Act of 1934 and the Investment Company Act of 1940, this report has been signed below by the following persons on behalf of the Registrant and in the capacities and on the dates indicated.
| By /s/ Gregory D. Johnson |
Gregory D. Johnson, Vice Chairman, President and Principal Executive Officer |
| |
| Date: February 28, 2017 |
| By /s/ Brian C. Janssen |
Brian C. Janssen, Treasurer and Principal Financial Officer |
| |
| Date: February 28, 2017 |