UNITED STATES
SECURITIES AND EXCHANGE COMMISSION
Washington, D.C. 20549
FORM N-CSR
Certified Shareholder Report of
Registered Management Investment Companies
Investment Company Act File Number: 811-00066
American Balanced Fund
(Exact Name of Registrant as Specified in Charter)
6455 Irvine Center Drive
Irvine, California 92618
(Address of Principal Executive Offices)
Registrant's telephone number, including area code: (213) 486-9200
Date of fiscal year end: December 31
Date of reporting period: December 31, 2018
Michael W. Stockton
American Balanced Fund
333 South Hope Street
Los Angeles, California 90071
(Name and Address of Agent for Service)
ITEM 1 – Reports to Stockholders
| American Balanced Fund® |  |
Annual report
for the year ended
December 31, 2018 |
| |

Invest in a balanced fund that has stood the test of time.
Beginning January 1, 2021, as permitted by regulations adopted by the U.S. Securities and Exchange Commission, we intend to no longer mail paper copies of the fund’s shareholder reports, unless specifically requested from American Funds or your financial intermediary, such as a broker-dealer or bank. Instead, the reports will be made available on the American Funds website (americanfunds.com); you will be notified by mail and provided with a website link to access the report each time a report is posted. If you have already elected to receive shareholder reports electronically, you will not be affected by this change and do not need to take any action. If you prefer to receive shareholder reports and other communications electronically, you may update your mailing preferences with your financial intermediary, or enroll in e-delivery at americanfunds.com (for accounts held directly with the fund).
You may elect to receive paper copies of all future reports free of charge. If you invest through a financial intermediary, you may contact your financial intermediary to request that you continue to receive paper copies of your shareholder reports. If you invest directly with the fund, you may inform American Funds that you wish to continue receiving paper copies of your shareholder reports by contacting us at (800) 421-4225. Your election to receive paper reports will apply to all funds held with American Funds or through your financial intermediary.
American Balanced Fund seeks conservation of capital, current income and long-term growth of capital and income.
This fund is one of more than 40 offered by Capital Group, home of American Funds, one of the nation’s largest mutual fund families. For more than 85 years, Capital Group has invested with a long-term focus based on thorough research and attention to risk.
Fund results shown in this report, unless otherwise indicated, are for Class A shares at net asset value. If a sales charge (maximum 5.75%) had been deducted, the results would have been lower. Results are for past periods and are not predictive of results for future periods. Current and future results may be lower or higher than those shown. Share prices and returns will vary, so investors may lose money. Investing for short periods makes losses more likely. For current information and month-end results, visit americanfunds.com.
See page 4 for Class A share results with relevant sales charges deducted. For other share class results, visit americanfunds.com and americanfundsretirement.com.
Investment results assume all distributions are reinvested and reflect applicable fees and expenses. When applicable, investment results reflect fee waivers, without which results would have been lower. Visit americanfunds.com for more information.
The fund’s 30-day yield for Class A shares as of January 31, 2019, calculated in accordance with the U.S. Securities and Exchange Commission (SEC) formula, was 1.92%. The fund’s 12-month distribution rate for Class A shares as of that date was 1.82%. Both reflect the 5.75% maximum sales charge.The SEC yield reflects the rate at which the fund is earning income on its current portfolio of securities while the distribution rate reflects the fund’s past dividends paid to shareholders. Accordingly, the fund’s SEC yield and distribution rate may differ.
The return of principal for bond funds and for funds with significant underlying bond holdings is not guaranteed. Fund shares are subject to the same interest rate, inflation and credit risks associated with the underlying bond holdings. Refer to the fund prospectus and the Risk Factors section of this report for more information on these and other risks associated with investing in the fund.
Investments are not FDIC-insured, nor are they deposits of or guaranteed by a bank or any other entity, so they may lose value.
Fellow investors:
After a year of relative calm in 2017, the longest running bull market in history provided investors a very different experience in 2018.
2018 market review
The U.S. economy continued to grow, though at a slower pace than the year before (U.S. GDP increased about 3%). Unemployment hit its lowest point in decades. There was strong consumer and government spending. The number of companies surpassing their earnings estimates, as of the third quarter, was at its highest level since 2012. And inflation grew within expected levels, enough that the U.S. Federal Reserve felt it could stick to its plans for raising interest rates to more normal levels.
The first signs of volatility were felt in February, as investors acted on concerns over rising interest rates, the threat of higher inflation, trade policy and a drop in the price of oil.
While recovery followed and stocks reached several highs during the year, peaking in the fall, nervous investor sentiment — and volatility — eventually prevailed. Markets declined dramatically in the fourth quarter and the Dow and the S&P 500 Composite Index posted annual losses for the first time since 2008.
Fund results
Against such a backdrop, we were satisfied with the results of American Balanced Fund (AMBAL) and how it did relative to its peers and benchmarks.
Specifically, AMBAL was down 2.71% for the 12-month period ended December 31, 2018, while the Lipper Balanced Funds Index fell 4.68% and the 60%/40% S&P 500/Bloomberg Barclays U.S. Aggregate Index declined 2.35%.
While it’s good to check in on results each year, we believe the true measure of any fund is its ability to help shareholders pursue their long-term financial goals. With that in mind, it is worth noting that AMBAL’s five-year, 10-year and lifetime results were 6.20%, 10.31% and 10.43%, respectively. This kept pace and, more often, outpaced both of the other indexes. (See “Results at a glance” chart.)
Results at a glance
For periods ended December 31, 2018, with all distributions reinvested
| | | Cumulative | | | | | | | | | |
| | | total returns | | Average annual total returns |
| | | 1 year | | | 5 years | | 10 years | | Lifetime
(since 7/26/75)1 |
| | | | | | | | | | |
| AMBAL (Class A shares) | | | –2.71 | % | | | 6.20 | % | | | 10.31 | % | | | 10.43 | % |
| 60%/40% S&P 500/Bloomberg Barclays U.S. Aggregate Index2,3 | | | –2.35 | | | | 6.24 | | | | 9.42 | | | | 9.90 | |
| Lipper Balanced Funds Index4 | | | –4.68 | | | | 4.48 | | | | 8.47 | | | | 9.47 | |
The market indexes are unmanaged and, therefore, have no expenses. Investors cannot invest directly in an index.
| 1 | Date Capital Research and Management Company began managing the fund. |
| 2 | Sources: Bloomberg Index Services Ltd. and S&P Dow Jones Indices LLC. Blends the S&P 500 Composite Index with the Bloomberg Barclays U.S. Aggregate Index by weighting their total returns at 60% and 40%, respectively. Results assume the blend is rebalanced monthly. |
| 3 | Source: Bloomberg Index Services Ltd. The Bloomberg Barclays U.S. Aggregate Index did not exist until December 31, 1975. For the period between July 31, 1975, and December 31, 1975, Bloomberg Barclays Government/Credit Bond Index results were used. The Bloomberg Barclays indexes are based on July 31, 1975, index value. |
| 4 | Source: Thompson Reuters Lipper. Lipper indexes track the largest mutual funds (no more than 30), represented by one share class per fund, in the corresponding Lipper category. |
| | |
The New Geography of Investing®
Where a company does business can be more important than where it’s located. While most of the companies that AMBAL invests in are based in the U.S., many do business on a global basis. For example, only 3% of the companies are based in emerging markets, yet a meaningful portion of the revenues generated by those companies may come from the very same place.
The charts below show the countries and regions where AMBAL’s equity investments are located and where the revenue is generated.
Equity portion breakdown by domicile (%)
| | Country/Region | | Fund | | | Index | |
| g | United States | | | 89 | % | | | 100 | % |
| g | Canada | | | 1 | | | | — | |
| g | Europe | | | 7 | | | | — | |
| g | Japan | | | — | | | | — | |
| g | Asia-Pacific ex. Japan | | | — | | | | — | |
| g | Emerging markets | | | 3 | | | | — | |
| | Total | | | 100 | % | | | 100 | % |
Equity portion breakdown by revenue (%)
| | Country/Region | | Fund | | | Index | |
| g | United States | | | 61 | % | | | 62 | % |
| g | Canada | | | 2 | | | | 2 | |
| g | Europe | | | 11 | | | | 12 | |
| g | Japan | | | 3 | | | | 3 | |
| g | Asia-Pacific ex. Japan | | | 2 | | | | 1 | |
| g | Emerging markets | | | 21 | | | | 20 | |
| | Total | | | 100 | % | | | 100 | % |
Compared with the S&P 500 Index as a percent of net assets. All figures include convertible securities.
Source: Capital Group (as of December 31, 2018).
The need for balance
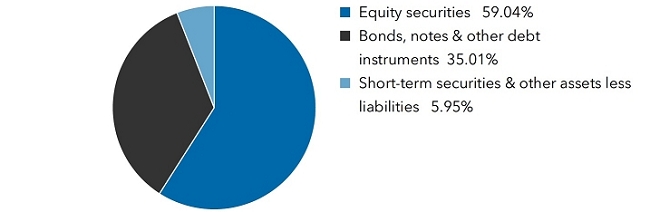
The past year, in particular, showed investors the value of a balanced investment approach. AMBAL combines both equity and fixed income securities to enable shareholders to mitigate downside risk, while still being able to take advantage of upside market potential. We seek to help shareholders grow their wealth and generate income without keeping them up all night worrying about volatility.
Maintaining a relatively constant asset allocation mix throughout the year (59% equities, 35% fixed income and 6% cash and equivalents at year-end), the fund gave investors exposure to the stock market, which did well for much of the year. But when the market dipped, especially during a seven-day period in December that saw the Dow drop by at least 350 points on six different occasions, the fixed income portion of the fund was there to cushion results.
Our fixed income strategy
There is a tendency to ask, “why should I own bonds when equities are doing well?” 2018 provided that answer. The fact is, no one can accurately predict when there will be a correction or even a dip in the market.
Our fixed income component continually seeks to deliver balance with diversification from equities, income, capital preservation and inflation protection.
Beyond that, we strive to create a certain “character of return” for AMBAL’s bond portfolio. Many variables must be considered to maintain such a profile. We want a high-grade universe of bonds that behave like bonds, meaning they tend to be more stable than equities and generally
move in the opposite direction of equities during times of stress in the market.
Within this context, we then look for opportunities to add value — that is, add to return and yield. During 2018, we made a number of adjustments in an effort to optimize AMBAL’s bond portfolio: our positioning in Treasury Inflation-Protected Securities (TIPS) was increased or reduced at points; we made reductions in our credit exposure, particularly in the energy sector; and we increased our durations later in the year. In the final analysis, our bond selection in investment-grade (BBB/Baa and above) corporate bonds, mortgage-backed securities and U.S. agency bonds boosted the fund’s results relative to the Bloomberg Barclays U.S. Aggregate Index. Our bond selection in agency pass-through bonds and some higher yielding corporate bonds weighed on results.
Overall, we are pleased to report that the fixed income portfolio did what it was designed to do: smooth out the ups and downs of the market for our shareholders.
The bond portfolio also provided a place from which our portfolio managers could draw assets in order to reinvest in attractive equity market opportunities during downturns, enabling us to buy these investments cheaper and give the fund a greater position in them during market recovery. Essentially, the fixed income portfolio helped us take advantage of market volatility rather than be a victim of it.
The equity portfolio
Within AMBAL, balance is not only achieved by the allocation between equity and fixed income but through strategic diversification of investments in both areas. Our portfolio managers build the fund’s equity portfolio one company at a time, basing each decision on the company’s long-term business prospects. This generally served our shareholders well in 2018 as it has done in years past.
Smaller positions in the industrials sector were beneficial for relative results against the S&P 500 as these companies were among those most affected by concerns over higher tariffs on global trade. Our investment selection further lifted relative returns for AMBAL.
Additionally, our investment selections in the real estate and health care sectors lifted relative returns. In particular, UnitedHealth Group, the largest provider of health benefits to employers in the U.S., saw its U.S. shares rally with double-digit growth in its health insurance and Optum health care businesses.
NIKE also proved a bright spot for the fund, posting strong results as it boosted its competitive position through new product launches.
While strong returns from our investment in Microsoft were additive to results, propelled by steady revenue streams and success with its Azure cloud computing platform, AMBAL’s smaller-than-index holdings in the information technology sector were a detractor from relative results.
Larger-than-index exposure to consumer staples and materials companies weighed on results — notably, our investment in Philip Morris International, one of the world’s largest tobacco companies, and DowDuPont, a global chemical and life sciences company. Similarly, larger investments in energy companies also held back returns as that was among the weakest sectors for the year. That said, we remain positive for future prospects in the oil and gas industry.
Thank you
We would like to thank our shareholders for the trust they have placed in our investment team and our balanced investment strategy.
We will continue to follow the prudent, research-driven approach to investing that has characterized American Balanced Fund for more than four decades. We look forward to reporting to you again in six months’ time.
Sincerely,

Gregory D. Johnson
Co-President

Jeffrey T. Lager
Co-President
February 8, 2019
For current information about the fund, visit americanfunds.com.
The value of a long-term perspective

Fund results shown are for Class A shares and reflect deduction of the maximum sales charge of 5.75% on the $10,000 investment.¹Thus, the net amount invested was $9,425.²Results are for past periods and are not predictive of results for future periods. Current and future results may be lower or higher than those shown. Share prices and returns will vary, so investors may lose money. For current information and month-end results, visit americanfunds.com.
The results shown are before taxes on fund distributions and sale of fund shares.
| 1 | As outlined in the prospectus, the sales charge is reduced for accounts (and aggregated investments) of $25,000 or more and is eliminated for purchases of $1 million or more. There is no sales charge on dividends or capital gain distributions that are reinvested in additional shares. |
| 2 | The maximum initial sales charge was 8.50% prior to July 1, 1988. |
| 3 | The market indexes are unmanaged and, therefore, have no expenses. Investors cannot invest directly in an index. |
| 4 | Source: S&P Dow Jones Indices LLC. |
| 5 | Includes dividends of $228,173 and capital gain distributions of $235,083 reinvested in the years 1975 to 2018. |
| 6 | Source: Thomson Reuters Lipper. Results of the Lipper Balanced Funds Index do not reflect any sales charges. Lipper indexes track the largest mutual funds (no more than 30), represented by one share class per fund, in the corresponding Lipper category. |
| 7 | Source: Bloomberg Index Services Ltd. Bloomberg Barclays U.S. Aggregate Index represents the U.S. investment-grade fixed-rate bond market. For the period July 31, 1975, to December 31, 1975, Bloomberg Barclays Government/ Credit Bond Index was used. |
| 8 | For the period July 26, 1975 (when Capital Research and Management Company became the fund’s investment adviser) through December 31, 1975. |
| | |
How a $10,000 investment has grown
This chart shows how a hypothetical $10,000 investment in American Balanced Fund grew from July 26, 1975 — when Capital Research and Management Company became the fund’s investment adviser — to December 31, 2018. As you can see, the investment grew to $700,475 with all distributions reinvested. The fund’s year-by-year results appear under the chart. You can use this table to estimate how the value of your own holdings has grown.
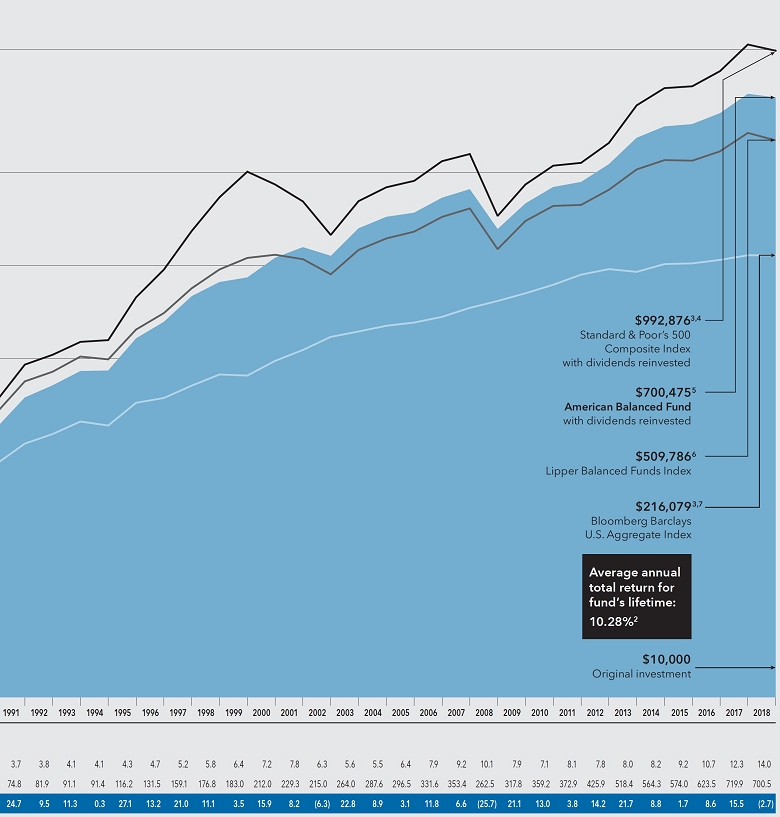
History of American Balanced Fund
A historical view of the comparative total returns of stocks, bonds, AMBAL and its relevant indexes (For the period July 26, 1975, to December 31, 2018, with all distributions reinvested)
Total
returns (through December 31) | | U.S.
stocks | | U.S.
bonds | | 60%/40%
S&P/BBC Index | | Lipper Balanced
Funds Index | | American
Balanced Fund |
| 1975 (from July 26) | | | 3.14 | % | | | 5.58 | % | | | 4.16 | % | | | 3.40 | % | | | 5.58 | % |
| 1976 | | | 23.93 | | | | 15.60 | | | | 20.74 | | | | 26.03 | | | | 25.98 | |
| 1977 | | | –7.16 | | | | 3.04 | | | | –3.13 | | | | –0.72 | | | | 0.70 | |
| 1978 | | | 6.57 | | | | 1.39 | | | | 4.74 | | | | 4.80 | | | | 6.21 | |
| 1979 | | | 18.61 | | | | 1.93 | | | | 11.77 | | | | 14.67 | | | | 7.63 | |
| 1980 | | | 32.50 | | | | 2.71 | | | | 20.43 | | | | 19.70 | | | | 14.36 | |
| 1981 | | | –4.92 | | | | 6.25 | | | | –0.47 | | | | 1.86 | | | | 4.40 | |
| 1982 | | | 21.55 | | | | 32.62 | | | | 26.19 | | | | 30.63 | | | | 29.36 | |
| 1983 | | | 22.56 | | | | 8.36 | | | | 16.76 | | | | 17.44 | | | | 16.11 | |
| 1984 | | | 6.27 | | | | 15.15 | | | | 9.96 | | | | 7.46 | | | | 9.36 | |
| 1985 | | | 31.73 | | | | 22.10 | | | | 27.94 | | | | 29.83 | | | | 29.11 | |
| 1986 | | | 18.67 | | | | 15.26 | | | | 17.61 | | | | 18.43 | | | | 16.87 | |
| 1987 | | | 5.25 | | | | 2.76 | | | | 5.65 | | | | 4.13 | | | | 4.02 | |
| 1988 | | | 16.61 | | | | 7.89 | | | | 13.10 | | | | 11.18 | | | | 12.87 | |
| 1989 | | | 31.69 | | | | 14.53 | | | | 24.75 | | | | 19.70 | | | | 21.53 | |
| 1990 | | | –3.10 | | | | 8.96 | | | | 1.81 | | | | 0.66 | | | | –1.57 | |
| 1991 | | | 30.47 | | | | 16.00 | | | | 24.77 | | | | 25.83 | | | | 24.69 | |
| 1992 | | | 7.62 | | | | 7.40 | | | | 7.59 | | | | 7.46 | | | | 9.48 | |
| 1993 | | | 10.08 | | | | 9.75 | | | | 9.99 | | | | 11.95 | | | | 11.27 | |
| 1994 | | | 1.32 | | | | –2.92 | | | | –0.33 | | | | –2.05 | | | | 0.34 | |
| 1995 | | | 37.58 | | | | 18.47 | | | | 29.66 | | | | 24.89 | | | | 27.13 | |
| 1996 | | | 22.96 | | | | 3.63 | | | | 14.97 | | | | 13.05 | | | | 13.16 | |
| 1997 | | | 33.36 | | | | 9.65 | | | | 23.62 | | | | 20.30 | | | | 21.04 | |
| 1998 | | | 28.58 | | | | 8.69 | | | | 20.99 | | | | 15.09 | | | | 11.13 | |
| 1999 | | | 21.04 | | | | –0.82 | | | | 12.00 | | | | 8.98 | | | | 3.47 | |
| 2000 | | | –9.10 | | | | 11.63 | | | | –1.00 | | | | 2.39 | | | | 15.85 | |
| 2001 | | | –11.89 | | | | 8.44 | | | | –3.71 | | | | –3.24 | | | | 8.19 | |
| 2002 | | | –22.10 | | | | 10.26 | | | | –9.82 | | | | –10.69 | | | | –6.27 | |
| 2003 | | | 28.68 | | | | 4.10 | | | | 18.48 | | | | 19.94 | | | | 22.82 | |
| 2004 | | | 10.88 | | | | 4.34 | | | | 8.30 | | | | 8.99 | | | | 8.92 | |
| 2005 | | | 4.91 | | | | 2.43 | | | | 4.00 | | | | 5.20 | | | | 3.12 | |
| 2006 | | | 15.79 | | | | 4.33 | | | | 11.12 | | | | 11.60 | | | | 11.80 | |
| 2007 | | | 5.49 | | | | 6.97 | | | | 6.22 | | | | 6.53 | | | | 6.60 | |
| 2008 | | | –37.00 | | | | 5.24 | | | | –22.06 | | | | –26.18 | | | | –25.73 | |
| 2009 | | | 26.46 | | | | 5.93 | | | | 18.40 | | | | 23.35 | | | | 21.08 | |
| 2010 | | | 15.06 | | | | 6.54 | | | | 12.13 | | | | 11.90 | | | | 13.02 | |
| 2011 | | | 2.11 | | | | 7.84 | | | | 4.69 | | | | 0.74 | | | | 3.82 | |
| 2012 | | | 16.00 | | | | 4.21 | | | | 11.31 | | | | 11.94 | | | | 14.19 | |
| 2013 | | | 32.39 | | | | –2.02 | | | | 17.56 | | | | 16.39 | | | | 21.73 | |
| 2014 | | | 13.69 | | | | 5.97 | | | | 10.62 | | | | 7.21 | | | | 8.85 | |
| 2015 | | | 1.38 | | | | 0.55 | | | | 1.28 | | | | –0.42 | | | | 1.72 | |
| 2016 | | | 11.96 | | | | 2.65 | | | | 8.31 | | | | 7.20 | | | | 8.62 | |
| 2017 | | | 21.83 | | | | 3.54 | | | | 14.21 | | | | 14.10 | | | | 15.47 | |
| 2018 | | | –4.38 | | | | 0.01 | | | | –2.35 | | | | –4.68 | | | | –2.71 | |
| Average annual total returns | | | 11.17 | % | | | 7.33 | % | | | 9.90 | % | | | 9.47 | % | | | 10.43 | % |
| Volatility | | | 14.68 | % | | | 5.30 | % | | | 9.48 | % | | | 9.85 | % | | | 9.48 | % |
Sources: Stocks (Standard & Poor’s 500 Composite Index) — S&P Dow Jones Indices LLC; Bonds (Bloomberg Barclays U.S. Aggregate Index) — Bloomberg Index Services Ltd. Bloomberg Barclays U.S. Aggregate Index represents the U.S. investment-grade fixed-rate bond market. For the period July 31, 1975, to December 31, 1975, Bloomberg Barclays Government/Credit Bond Index was used.
The 60%/40% S&P/BBC Index blends the S&P 500 with the Bloomberg Barclays U.S. Aggregate Index by weighting their total returns at 60% and 40%, respectively. The portfolio is rebalanced monthly.
The market indexes are unmanaged and, therefore, have no expenses. Investors cannot invest directly in an index.
Source: Thomson Reuters Lipper. The Lipper Balanced Funds Index is an equally weighted index of the 30 largest U.S. balanced funds.
Capital Research and Management Company became the fund’s investment adviser on July 26, 1975.
Volatility is calculated using annualized standard deviation (based on monthly returns), a measure of how returns over time have varied from the mean; a lower number signifies lower volatility.
Summary investment portfolioDecember 31, 2018
| Investment mix by security type | Percent of net assets |
| Common stocks 58.96% | | Shares | | | Value
(000) | |
| Information technology 11.61% | | | | | | | | |
| Microsoft Corp. | | | 47,509,000 | | | $ | 4,825,489 | |
| Broadcom Inc. | | | 8,632,800 | | | | 2,195,148 | |
| Intel Corp. | | | 36,117,100 | | | | 1,694,976 | |
| Taiwan Semiconductor Manufacturing Co., Ltd. (ADR) | | | 42,389,000 | | | | 1,564,578 | |
| ASML Holding NV (New York registered) | | | 4,716,458 | | | | 733,975 | |
| ASML Holding NV | | | 1,845,000 | | | | 289,944 | |
| Other securities | | | | | | | 3,474,649 | |
| | | | | | | | 14,778,759 | |
| | | | | | | | | |
| Health care 8.89% | | | | | | | | |
| UnitedHealth Group Inc. | | | 12,926,500 | | | | 3,220,250 | |
| Merck & Co., Inc. | | | 18,350,000 | | | | 1,402,123 | |
| Cigna Corp. | | | 6,982,004 | | | | 1,326,022 | |
| Johnson & Johnson | | | 8,584,300 | | | | 1,107,804 | |
| Pfizer Inc. | | | 16,821,000 | | | | 734,237 | |
| Centene Corp.1 | | | 5,743,163 | | | | 662,187 | |
| Other securities | | | | | | | 2,870,540 | |
| | | | | | | | 11,323,163 | |
| | | | | | | | | |
| Financials 7.84% | | | | | | | | |
| Berkshire Hathaway Inc., Class A1 | | | 9,354 | | | | 2,862,324 | |
| Berkshire Hathaway Inc., Class B1 | | | 800,000 | | | | 163,344 | |
| JPMorgan Chase & Co. | | | 8,570,000 | | | | 836,603 | |
| Chubb Ltd. | | | 6,435,093 | | | | 831,285 | |
| BlackRock, Inc. | | | 1,874,000 | | | | 736,145 | |
| PNC Financial Services Group, Inc. | | | 5,447,000 | | | | 636,809 | |
| Wells Fargo & Co. | | | 12,679,500 | | | | 584,271 | |
| Other securities | | | | | | | 3,332,538 | |
| | | | | | | | 9,983,319 | |
| | | | | | | | | |
| Energy 6.41% | | | | | | | | |
| Royal Dutch Shell PLC, Class B (ADR) | | | 21,382,000 | | | | 1,281,637 | |
| Royal Dutch Shell PLC, Class B | | | 4,000,000 | | | | 119,303 | |
| Royal Dutch Shell PLC, Class A (ADR) | | | 497,977 | | | | 29,017 | |
| Royal Dutch Shell PLC, Class A | | | 130,129 | | | | 3,827 | |
| ConocoPhillips | | | 21,715,150 | | | | 1,353,940 | |
| EOG Resources, Inc. | | | 11,594,000 | | | | 1,011,113 | |
| Chevron Corp. | | | 9,094,755 | | | | 989,418 | |
| Enbridge Inc. | | | 14,018,194 | | | | 435,685 | |
| Enbridge Inc. (CAD denominated)2 | | | 4,808,645 | | | | 149,381 | |
| Enbridge Inc. (CAD denominated) | | | 155,997 | | | | 4,846 | |
| Other securities | | | | | | | 2,780,993 | |
| | | | | | | | 8,159,160 | |
| Common stocks(continued) | | Shares | | | Value
(000) | |
| Consumer discretionary 6.19% | | | | | | | | |
| Home Depot, Inc. | | | 15,122,000 | | | $ | 2,598,262 | |
| NIKE, Inc., Class B | | | 24,165,000 | | | | 1,791,593 | |
| Amazon.com, Inc.1 | | | 691,500 | | | | 1,038,612 | |
| Other securities | | | | | | | 2,453,749 | |
| | | | | | | | 7,882,216 | |
| | | | | | | | | |
| Consumer staples 4.04% | | | | | | | | |
| Philip Morris International Inc. | | | 24,359,422 | | | | 1,626,235 | |
| Nestlé SA3 | | | 9,920,000 | | | | 805,211 | |
| Coca-Cola Co. | | | 15,990,000 | | | | 757,126 | |
| Altria Group, Inc. | | | 11,104,547 | | | | 548,454 | |
| Other securities | | | | | | | 1,402,268 | |
| | | | | | | | 5,139,294 | |
| Communication services 3.48% | | | | | | | | |
| Comcast Corp., Class A | | | 42,355,000 | | | | 1,442,188 | |
| Alphabet Inc., Class C1 | | | 846,200 | | | | 876,333 | |
| Alphabet Inc., Class A1 | | | 371,900 | | | | 388,621 | |
| Facebook, Inc., Class A1 | | | 5,033,000 | | | | 659,776 | |
| Other securities | | | | | | | 1,059,407 | |
| | | | | | | | 4,426,325 | |
| | | | | | | | | |
| Materials 3.28% | | | | | | | | |
| DowDuPont Inc. | | | 30,358,500 | | | | 1,623,572 | |
| LyondellBasell Industries NV | | | 6,484,100 | | | | 539,218 | |
| Other securities | | | | | | | 2,012,137 | |
| | | | | | | | 4,174,927 | |
| | | | | | | | | |
| Industrials 3.25% | | | | | | | | |
| Boeing Co. | | | 3,374,400 | | | | 1,088,244 | |
| Lockheed Martin Corp. | | | 4,080,000 | | | | 1,068,307 | |
| Other securities | | | | | | | 1,987,767 | |
| | | | | | | | 4,144,318 | |
| | | | | | | | | |
| Real estate 3.10% | | | | | | | | |
| Simon Property Group, Inc. REIT | | | 8,359,000 | | | | 1,404,228 | |
| Crown Castle International Corp. REIT | | | 5,822,802 | | | | 632,531 | |
| Other securities | | | | | | | 1,909,693 | |
| | | | | | | | 3,946,452 | |
| | | | | | | | | |
| Utilities 0.87% | | | | | | | | |
| Public Service Enterprise Group Inc. | | | 11,650,439 | | | | 606,405 | |
| Other securities | | | | | | | 496,839 | |
| | | | | | | | 1,103,244 | |
| | | | | | | | | |
| Total common stocks (cost: $56,010,157,000) | | | | | | | 75,061,177 | |
| | | | | | | | | |
| Preferred securities 0.00% | | | | | | | | |
| Financials 0.00% | | | | | | | | |
| Other securities | | | | | | | 4,501 | |
| | | | | | | | | |
| Total preferred securities (cost: $5,208,000) | | | | | | | 4,501 | |
| | | | | | | | | |
| Convertible stocks 0.08% | | | | | | | | |
| Real estate 0.08% | | | | | | | | |
| Other securities | | | | | | | 105,225 | |
| | | | | | | | | |
| Total convertible stocks (cost: $105,498,000) | | | | | | | 105,225 | |
| Bonds, notes & other debt instruments 35.01% | Principal amount
(000) | | | Value
(000) | |
| Corporate bonds & notes 13.00% | | | | | | | | |
| Financials 3.90% | | | | | | | | |
| Berkshire Hathaway Finance Corp. 1.30%–4.20% 2019–2048 | | $ | 46,895 | | | $ | 46,659 | |
| Berkshire Hathaway Inc. 2.75% 2023 | | | 5,000 | | | | 4,911 | |
| Other securities | | | | | | | 4,918,912 | |
| | | | | | | | 4,970,482 | |
| | | | | | | | | |
| Health care 1.77% | | | | | | | | |
| Cigna Corp. 3.40%–4.90% 2021–20482 | | | 165,080 | | | | 164,654 | |
| Other securities | | | | | | | 2,084,350 | |
| | | | | | | | 2,249,004 | |
| | | | | | | | | |
| Energy 1.48% | | | | | | | | |
| Shell International Finance BV 1.88%–3.88% 2020–2028 | | | 115,768 | | | | 117,143 | |
| Other securities | | | | | | | 1,761,071 | |
| | | | | | | | 1,878,214 | |
| | | | | | | | | |
| Consumer staples 1.22% | | | | | | | | |
| Philip Morris International Inc. 1.88%–4.25% 2020–2044 | | | 143,560 | | | | 138,984 | |
| Other securities | | | | | | | 1,416,699 | |
| | | | | | | | 1,555,683 | |
| | | | | | | | | |
| Utilities 1.21% | | | | | | | | |
| Berkshire Hathaway Energy Co. 2.40% 2020 | | | 4,355 | | | | 4,327 | |
| MidAmerican Energy Holdings Co. 2.40%–3.75% 2019–2027 | | | 46,835 | | | | 46,590 | |
| NV Energy, Inc. 6.25% 2020 | | | 10,168 | | | | 10,686 | |
| PacifiCorp., First Mortgage Bonds 3.60%–4.13% 2024–2049 | | | 37,230 | | | | 37,192 | |
| Sierra Pacific Power Co., General and Refunding Mortgage Notes, Series T, 3.375% 2023 | | | 14,000 | | | | 13,997 | |
| Other securities | | | | | | | 1,427,212 | |
| | | | | | | | 1,540,004 | |
| | | | | | | | | |
| Consumer discretionary 1.08% | | | | | | | | |
| Home Depot, Inc. 3.25% 2022 | | | 20,125 | | | | 20,342 | |
| Home Depot, Inc. 1.80%–5.95% 2020–2046 | | | 65,005 | | | | 66,825 | |
| Other securities | | | | | | | 1,291,150 | |
| | | | | | | | 1,378,317 | |
| | | | | | | | | |
| Communication services 0.66% | | | | | | | | |
| Alphabet Inc. 1.998% 2026 | | | 17,000 | | | | 15,479 | |
| Comcast Corp. 2.35%–6.45% 2025–2048 | | | 248,982 | | | | 248,541 | |
| NBCUniversal Enterprise, Inc. 5.25% 20492 | | | 5,730 | | | | 5,816 | |
| Other securities | | | | | | | 567,151 | |
| | | | | | | | 836,987 | |
| | | | | | | | | |
| Information technology 0.44% | | | | | | | | |
| Broadcom Ltd. 2.65%–3.88% 2022–2028 | | | 332,813 | | | | 311,220 | |
| Intel Corp. 3.70% 2025 | | | 22,000 | | | | 22,220 | |
| Microsoft Corp. 1.55%–4.20% 2021–2046 | | | 92,005 | | | | 91,071 | |
| Other securities | | | | | | | 129,618 | |
| | | | | | | | 554,129 | |
| | | | | | | | | |
| Materials 0.27% | | | | | | | | |
| Dow Chemical Co. 4.55% 20252 | | | 40,434 | | | | 41,212 | |
| DowDuPont Inc. 4.21%–4.73% 2023–2028 | | | 107,420 | | | | 110,797 | |
| Other securities | | | | | | | 198,292 | |
| | | | | | | | 350,301 | |
| | | | | | | | | |
| Other corporate bonds & notes 0.97% | | | | | | | | |
| Other securities | | | | | | | 1,237,015 | |
| | | | | | | | | |
| Total corporate bonds & notes | | | | | | | 16,550,136 | |
| | | | | | | | | |
| U.S. Treasury bonds & notes 12.79% | | | | | | | | |
| U.S. Treasury 10.59% | | | | | | | | |
| U.S. Treasury 2.625% 2023 | | | 750,725 | | | | 754,771 | |
| U.S. Treasury 2.875% 2023 | | | 1,468,522 | | | | 1,494,397 | |
| U.S. Treasury 2.25% 2024 | | | 670,750 | | | | 659,428 | |
| U.S. Treasury 3.00% 2025 | | | 735,000 | | | | 754,095 | |
| Bonds, notes & other debt instruments(continued) | Principal amount
(000) | | | Value
(000) | |
| U.S. Treasury bonds & notes (continued) | | | | | | | | |
| U.S. Treasury (continued) | | | | | | | | |
| U.S. Treasury 3.00% 2025 | | $ | 600,000 | | | $ | 615,468 | |
| U.S. Treasury 2.875% 2028 | | | 600,000 | | | | 609,888 | |
| U.S. Treasury 3.125% 2028 | | | 624,390 | | | | 648,423 | |
| U.S. Treasury 3.00% 20484 | | | 669,573 | | | | 667,437 | |
| U.S. Treasury 1.13%–5.38% 2019–20484 | | | 7,327,515 | | | | 7,275,517 | |
| | | | | | | | 13,479,424 | |
| | | | | | | | | |
| U.S. Treasury inflation-protected securities 2.20% | | | | | | | | |
| U.S. Treasury Inflation-Protected Security 0.625% 20235 | | | 585,367 | | | | 576,235 | |
| U.S. Treasury Inflation-Protected Securities 0.13%–2.38% 2019–20485 | | | 2,321,468 | | | | 2,222,081 | |
| | | | | | | | 2,798,316 | |
| | | | | | | | | |
| Total U.S. Treasury bonds & notes | | | | | | | 16,277,740 | |
| | | | | | | | | |
| Mortgage-backed obligations 7.57% | | | | | | | | |
| Fannie Mae 0%–9.07% 2022–20586,7,8 | | | 4,047,653 | | | | 4,094,765 | |
| Freddie Mac 3.00%–6.50% 2027–20496 | | | 2,798,311 | | | | 2,827,123 | |
| Government National Mortgage Assn. 3.00%–6.00% 2038–20616,8 | | | 1,425,721 | | | | 1,455,837 | |
| Other securities | | | | | | | 1,259,952 | |
| | | | | | | | 9,637,677 | |
| | | | | | | | | |
| Municipals 0.25% | | | | | | | | |
| Other 0.25% | | | | | | | | |
| Other securities | | | | | | | 324,501 | |
| | | | | | | | 324,501 | |
| | | | | | | | | |
| Federal agency bonds & notes 0.24% | | | | | | | | |
| Fannie Mae 2.00%–6.25% 2022–20294 | | | 79,510 | | | | 78,236 | |
| Federal Home Loan Bank 2.38%–5.50% 2020–2036 | | | 200,600 | | | | 200,338 | |
| Other securities | | | | | | | 26,939 | |
| | | | | | | | 305,513 | |
| | | | | | | | | |
| Other bonds & notes 1.16% | | | | | | | | |
| Other securities | | | | | | | 1,475,114 | |
| | | | | | | | | |
| Total bonds, notes & other debt instruments (cost: $44,907,559,000) | | | | | | | 44,570,681 | |
| | | | | | | | | |
| Short-term securities 5.65% | | | | | | | | |
| Fannie Mae 2.23% due 1/7/2019 | | | 10,500 | | | | 10,496 | |
| Federal Home Loan Bank 2.25%–2.40% due 1/10/2019–3/11/2019 | | | 1,572,500 | | | | 1,567,615 | |
| Merck & Co. Inc. 2.34%–2.38% due 1/24/2019–1/28/20192 | | | 109,800 | | | | 109,603 | |
| U.S. Treasury Bills 1.98%–2.44% due 1/15/2019–5/23/2019 | | | 4,923,700 | | | | 4,901,550 | |
| Other securities | | | | | | | 608,377 | |
| | | | | | | | | |
| Total short-term securities (cost: $7,198,041,000) | | | | | | | 7,197,641 | |
| Total investment securities 99.70% (cost: $108,226,463,000) | | | | | | | 126,939,225 | |
| Other assets less liabilities 0.30% | | | | | | | 376,921 | |
| | | | | | | | | |
| Net assets 100.00% | | | | | | $ | 127,316,146 | |
This summary investment portfolio is designed to streamline the report and help investors better focus on the fund’s principal holdings. See the inside back cover for details on how to obtain a complete schedule of portfolio holdings.
“Other securities” includes all issues that are not disclosed separately in the summary investment portfolio.
Futures contracts
| Contracts | | Type | | Number of
contracts | | Expiration | | Notional
amount9
(000) | | | Value at
12/31/201810
(000) | | Unrealized
appreciation
(depreciation)
at 12/31/2018
(000) | |
| 2 Year U.S. Treasury Note Futures | | Long | | 24,870 | | April 2019 | | $ | 4,974,000 | | | $ | 5,280,212 | | | $ | 17,287 | |
| 5 Year U.S. Treasury Note Futures | | Long | | 15,118 | | April 2019 | | | 1,511,800 | | | | 1,733,846 | | | | 20,590 | |
| 10 Year U.S. Treasury Note Futures | | Long | | 8,165 | | March 2019 | | | 816,500 | | | | 996,258 | | | | 14,965 | |
| 10 Year Ultra U.S. Treasury Note Futures | | Short | | 1,862 | | March 2019 | | | (186,200 | ) | | | (242,206 | ) | | | (7,599 | ) |
| 30 Year Ultra U.S. Treasury Bond Futures | | Long | | 194 | | March 2019 | | | 19,400 | | | | 31,167 | | | | 1,633 | |
| | | | | | | | | | | | | | | | | $ | 46,876 | |
Swap contracts
Interest rate swaps
| Receive | | | Pay | | | Expiration
date | | Notional
(000) | | | Value at
12/31/2018
(000) | | Upfront
payments/
receipts
(000) | | Unrealized
depreciation
at 12/31/2018
(000) | |
| U.S. EFFR | | | 2.4435% | | | 12/20/2023 | | | $ 152,945 | | | | $ (1,174 | ) | | $ | — | | | | $ (1,174 | ) |
| U.S. EFFR | | | 2.45375% | | | 12/20/2023 | | | 1,370,053 | | | | (11,178 | ) | | | — | | | | (11,178 | ) |
| U.S. EFFR | | | 2.4225% | | | 12/24/2023 | | | 627,445 | | | | (4,202 | ) | | | — | | | | (4,202 | ) |
| | | | | | | | | | | | | | | | | $ | — | | | | $(16,554 | ) |
Investments in affiliates
A company is an affiliate of the fund under the Investment Company Act of 1940 if the fund’s holdings in that company represent 5% or more of the outstanding voting shares. The value of the fund’s holdings in affiliated companies is included in “Other securities” under the respective industry sectors in the summary investment portfolio. Further details on these holdings and related transactions during the year ended December 31, 2018, appear below.
| | | Beginning
shares | | Additions | | Reductions | | Ending
shares | | Net
realized
gain (loss)
(000) | | | Net
unrealized
appreciation
(depreciation)
(000) | | | Dividend
income
(000) | | | Value of
affiliates at
12/31/2018
(000) | |
| Common stocks 0.29% | | | | | | | | | | | | | | | | | | | | | | | | |
| Information technology 0.00% | | | | | | | | | | | | | | | | | | | | | | | | |
| VeriSign, Inc.1,11 | | 5,300,000 | | — | | 1,800,000 | | 3,500,000 | | $ | 138,400 | | | $ | 11,364 | | | $ | — | | | $ | — | |
| Symantec Corp.11 | | 32,026,000 | | — | | 9,786,194 | | 22,239,806 | | | (62,271 | ) | | | (228,700 | ) | | | 7,914 | | | | — | |
| | | | | | | | | | | | | | | | | | | | | | | | — | |
| | | | | | | | | | | | | | | | | | | | | | | | | |
| Materials 0.29% | | | | | | | | | | | | | | | | | | | | | | | | |
| Royal Gold, Inc. | | 4,175,000 | | 79,500 | | — | | 4,254,500 | | | — | | | | 14,637 | | | | 4,236 | | | | 364,398 | |
| Total 0.29% | | | | | | | | | | $ | 76,129 | | | $ | (202,699 | ) | | $ | 12,150 | | | $ | 364,398 | |
The following footnotes apply to either the individual securities noted or one or more of the securities aggregated and listed as a single line item.
| 1 | Security did not produce income during the last 12 months. |
| 2 | Acquired in a transaction exempt from registration under Rule 144A or Section 4(2) of the Securities Act of 1933. May be resold in the U.S. in transactions exempt from registration, normally to qualified institutional buyers. The total value of all such securities, including those in “Other securities,” was $5,010,400,000, which represented 3.94% of the net assets of the fund. |
| 3 | Valued under fair value procedures adopted by authority of the board of trustees. The total value of all such securities, including those in “Other securities,” was $1,299,622,000, which represented 1.02% of the net assets of the fund. This amount includes $1,284,367,000 related to certain securities trading outside the U.S. whose values were adjusted as a result of significant market movements following the close of local trading. |
| 4 | All or a portion of this security was pledged as collateral. The total value of pledged collateral was $77,660,000, which represented .06% of the net assets of the fund. |
| 5 | Index-linked bond whose principal amount moves with a government price index. |
| 6 | Principal payments may be made periodically. Therefore, the effective maturity date may be earlier than the stated maturity date. |
| 7 | Coupon rate may change periodically. |
| 8 | Purchased on a TBA basis. |
| 9 | Notional amount is calculated based on the number of contracts and notional contract size. |
| 10 | Value is calculated based on the notional amount and current market price. |
| 11 | Unaffiliated issuer at 12/31/2018. |
Key to abbreviations
ADR = American Depositary Receipts
CAD = Canadian dollars
EFFR = Effective Federal Funds Rate
TBA = To-be-announced
See notes to financial statements
Financial statements
Statement of assets and liabilities
at December 31, 2018 | | (dollars in thousands) | |
| | | | | | | | | |
| Assets: | | | | | | | | |
| Investment securities, at value: | | | | | | | | |
| Unaffiliated issuers (cost: $107,929,436) | | $ | 126,574,827 | | | | | |
| Affiliated issuers (cost: $297,027) | | | 364,398 | | | $ | 126,939,225 | |
| Cash | | | | | | | 2,941 | |
| Receivables for: | | | | | | | | |
| Sales of investments | | | 1,242,979 | | | | | |
| Sales of fund’s shares | | | 504,459 | | | | | |
| Dividends and interest | | | 388,728 | | | | | |
| Variation margin on futures contracts | | | 10,582 | | | | | |
| Variation margin on swap contracts | | | 430 | | | | | |
| Other | | | 1,537 | | | | 2,148,715 | |
| | | | | | | | 129,090,881 | |
| Liabilities: | | | | | | | | |
| Payables for: | | | | | | | | |
| Purchases of investments | | | 1,358,619 | | | | | |
| Repurchases of fund’s shares | | | 341,548 | | | | | |
| Investment advisory services | | | 24,278 | | | | | |
| Services provided by related parties | | | 38,979 | | | | | |
| Trustees’ deferred compensation | | | 4,070 | | | | | |
| Variation margin on futures contracts | | | 873 | | | | | |
| Variation margin on swap contracts | | | 4,831 | | | | | |
| Other | | | 1,537 | | | | 1,774,735 | |
| Net assets at December 31, 2018 | | | | | | $ | 127,316,146 | |
| | | | | | | | | |
| Net assets consist of: | | | | | | | | |
| Capital paid in on shares of beneficial interest | | | | | | $ | 107,586,484 | |
| Total distributable earnings | | | | | | | 19,729,662 | |
| Net assets at December 31, 2018 | | | | | | $ | 127,316,146 | |
(dollars and shares in thousands, except per-share amounts)
Shares of beneficial interest issued and outstanding (no stated par value) —
unlimited shares authorized (5,117,313 total shares outstanding)
| | | Net assets | | | Shares
outstanding | | | Net asset value
per share | |
| Class A | | $ | 62,647,870 | | | | 2,515,924 | | | $ | 24.90 | |
| Class C | | | 8,610,761 | | | | 348,105 | | | | 24.74 | |
| Class T | | | 10 | | | | — | * | | | 24.90 | |
| Class F-1 | | | 4,599,122 | | | | 184,866 | | | | 24.88 | |
| Class F-2 | | | 11,331,814 | | | | 455,406 | | | | 24.88 | |
| Class F-3 | | | 3,400,919 | | | | 136,641 | | | | 24.89 | |
| Class 529-A | | | 3,732,772 | | | | 150,175 | | | | 24.86 | |
| Class 529-C | | | 722,791 | | | | 29,072 | | | | 24.86 | |
| Class 529-E | | | 165,607 | | | | 6,666 | | | | 24.84 | |
| Class 529-T | | | 11 | | | | — | * | | | 24.90 | |
| Class 529-F-1 | | | 201,194 | | | | 8,101 | | | | 24.84 | |
| Class R-1 | | | 110,234 | | | | 4,459 | | | | 24.72 | |
| Class R-2 | | | 1,111,206 | | | | 44,924 | | | | 24.73 | |
| Class R-2E | | | 75,249 | | | | 3,034 | | | | 24.80 | |
| Class R-3 | | | 2,991,855 | | | | 120,797 | | | | 24.77 | |
| Class R-4 | | | 5,666,880 | | | | 228,013 | | | | 24.85 | |
| Class R-5E | | | 167,734 | | | | 6,741 | | | | 24.88 | |
| Class R-5 | | | 1,809,222 | | | | 72,582 | | | | 24.93 | |
| Class R-6 | | | 19,970,895 | | | | 801,807 | | | | 24.91 | |
| * | Amount less than one thousand. |
See notes to financial statements
Statement of operations
for the year ended December 31, 2018 | | (dollars in thousands) | |
| | | | | | | |
| Investment income: | | | | | | | | |
| Income: | | | | | | | | |
| Dividends (net of non-U.S. taxes of $23,817; also includes $12,150 from affiliates) | | $ | 1,710,333 | | | | | |
| Interest | | | 1,544,620 | | | $ | 3,254,953 | |
| Fees and expenses*: | | | | | | | | |
| Investment advisory services | | | 287,258 | | | | | |
| Distribution services | | | 322,649 | | | | | |
| Transfer agent services | | | 93,695 | | | | | |
| Administrative services | | | 38,970 | | | | | |
| Reports to shareholders | | | 2,934 | | | | | |
| Registration statement and prospectus | | | 6,901 | | | | | |
| Trustees’ compensation | | | 494 | | | | | |
| Auditing and legal | | | 103 | | | | | |
| Custodian | | | 1,434 | | | | | |
| Other | | | 3,866 | | | | | |
| Total fees and expenses before waiver | | | 758,304 | | | | | |
| Less investment advisory services waiver | | | 34 | | | | | |
| Total fees and expenses after waiver | | | | | | | 758,270 | |
| Net investment income | | | | | | | 2,496,683 | |
| | | | | | | | | |
| Net realized gain and unrealized depreciation: | | | | | | | | |
| Net realized gain (loss) on: | | | | | | | | |
| Investments (net of non-U.S. taxes of $90): | | | | | | | | |
| Unaffiliated issuers | | | 5,240,636 | | | | | |
| Affiliated issuers | | | 76,129 | | | | | |
| Futures contracts | | | 21,763 | | | | | |
| Swap contracts | | | (50 | ) | | | | |
| Currency transactions | | | (1,707 | ) | | | 5,336,771 | |
| Net unrealized (depreciation) appreciation on: | | | | | | | | |
| Investments (net of non-U.S. taxes of $402): | | | | | | | | |
| Unaffiliated issuers | | | (11,328,790 | ) | | | | |
| Affiliated issuers | | | (202,699 | ) | | | | |
| Futures contracts | | | 46,876 | | | | | |
| Swap contracts | | | (16,554 | ) | | | | |
| Currency translations | | | (260 | ) | | | (11,501,427 | ) |
| Net realized gain and unrealized depreciation | | | | | | | (6,164,656 | ) |
| Net decrease in net assets resulting from operations | | | | | | $ | (3,667,973 | ) |
| * | Additional information related to class-specific fees and expenses is included in the notes to financial statements. |
See notes to financial statements
Statements of changes in net assets
(dollars in thousands)
| | | Year ended December 31 | |
| | | 2018 | | | 2017 | |
| | | | | | | | | |
| Operations: | | | | | | | | |
| Net investment income | | $ | 2,496,683 | | | $ | 2,003,605 | |
| Net realized gain | | | 5,336,771 | | | | 5,273,455 | |
| Net unrealized (depreciation) appreciation | | | (11,501,427 | ) | | | 9,021,015 | |
| Net (decrease) increase in net assets resulting from operations | | | (3,667,973 | ) | | | 16,298,075 | |
| | | | | | | | | |
| Distributions paid to shareholders | | | (7,450,132 | ) | | | (6,395,569 | )* |
| | | | | | | | | |
| Net capital share transactions | | | 13,372,178 | | | | 14,029,507 | |
| | | | | | | | | |
| Total increase in net assets | | | 2,254,073 | | | | 23,932,013 | |
| | | | | | | | | |
| Net assets: | | | | | | | | |
| Beginning of year | | | 125,062,073 | | | | 101,130,060 | |
| End of year | | $ | 127,316,146 | | | $ | 125,062,073 | |
| * | Prior year comparative amounts have been adjusted to reflect current presentation under new accounting standards. Prior year distributions were $2,059,266 from net investment income and $4,336,303 from net realized gain on investments. |
See notes to financial statements
Notes to financial statements
1. Organization
American Balanced Fund (the “fund”) is registered under the Investment Company Act of 1940 as an open-end, diversified management investment company. The fund seeks conservation of capital, current income and long-term growth of capital and income.
The fund has 19 share classes consisting of six retail share classes (Classes A, C, T, F-1, F-2 and F-3), five 529 college savings plan share classes (Classes 529-A, 529-C, 529-E, 529-T and 529-F-1) and eight retirement plan share classes (Classes R-1, R-2, R-2E, R-3, R-4, R-5E, R-5 and R-6). The 529 college savings plan share classes can be used to save for college education. The retirement plan share classes are generally offered only through eligible employer-sponsored retirement plans. The fund’s share classes are described further in the following table:
| Share class | | Initial sales charge | | Contingent deferred sales
charge upon redemption | | Conversion feature |
| Classes A and 529-A | | Up to 5.75% | | None (except 1% for certain redemptions within 18 months of purchase without an initial sales charge) | | None |
| Class C | | None | | 1% for redemptions within one year of purchase | | Class C converts to Class F-1 after 10 years |
| Class 529-C | | None | | 1% for redemptions within one year of purchase | | Class 529-C converts to Class 529-A after 10 years |
| Class 529-E | | None | | None | | None |
| Classes T and 529-T* | | Up to 2.50% | | None | | None |
| Classes F-1, F-2, F-3 and 529-F-1 | | None | | None | | None |
| Classes R-1, R-2, R-2E, R-3, R-4, R-5E, R-5 and R-6 | | None | | None | | None |
| * | Class T and 529-T shares are not available for purchase. |
Holders of all share classes have equal pro rata rights to the assets, dividends and liquidation proceeds of the fund. Each share class has identical voting rights, except for the exclusive right to vote on matters affecting only its class. Share classes have different fees and expenses (“class-specific fees and expenses”), primarily due to different arrangements for distribution, transfer agent and administrative services. Differences in class-specific fees and expenses will result in differences in net investment income and, therefore, the payment of different per-share dividends by each share class.
2. Significant accounting policies
The fund is an investment company that applies the accounting and reporting guidance issued in Topic 946 by the U.S. Financial Accounting Standards Board. The fund’s financial statements have been prepared to comply with U.S. generally accepted accounting principles (“U.S. GAAP”). These principles require the fund’s investment adviser to make estimates and assumptions that affect reported amounts and disclosures. Actual results could differ from those estimates. Subsequent events, if any, have been evaluated through the date of issuance in the preparation of the financial statements. The fund follows the significant accounting policies described in this section, as well as the valuation policies described in the next section on valuation.
Cash— Cash may include amounts held in an interest bearing deposit facility.
Security transactions and related investment income— Security transactions are recorded by the fund as of the date the trades are executed with brokers. Realized gains and losses from security transactions are determined based on the specific identified cost of the securities. In the event a security is purchased with a delayed payment date, the fund will segregate liquid assets sufficient to meet its payment obligations. Dividend income is recognized on the ex-dividend date and interest income is recognized on an accrual basis. Market discounts, premiums and original issue discounts on fixed-income securities are amortized daily over the expected life of the security.
Class allocations— Income, fees and expenses (other than class-specific fees and expenses) and realized and unrealized gains and losses are allocated daily among the various share classes based on their relative net assets. Class-specific fees and expenses, such as distribution, transfer agent and administrative services, are charged directly to the respective share class.
Distributions paid to shareholders— Income dividends and capital gain distributions are recorded on the ex-dividend date.
Currency translation— Assets and liabilities, including investment securities, denominated in currencies other than U.S. dollars are translated into U.S. dollars at the exchange rates supplied by one or more pricing vendors on the valuation date. Purchases and sales of investment securities and income and expenses are translated into U.S. dollars at the exchange rates on the dates of such transactions. The effects of changes in exchange rates on investment securities are included with the net realized gain or loss and net unrealized appreciation or depreciation on investments in the fund’s statement of operations. The realized gain or loss and unrealized appreciation or depreciation resulting from all other transactions denominated in currencies other than U.S. dollars are disclosed separately.
3. Valuation
Capital Research and Management Company (“CRMC”), the fund’s investment adviser, values the fund’s investments at fair value as defined by U.S. GAAP. The net asset value of each share class of the fund is generally determined as of approximately 4:00 p.m. New York time each day the New York Stock Exchange is open.
Methods and inputs— The fund’s investment adviser uses the following methods and inputs to establish the fair value of the fund’s assets and liabilities. Use of particular methods and inputs may vary over time based on availability and relevance as market and economic conditions evolve.
Equity securities are generally valued at the official closing price of, or the last reported sale price on, the exchange or market on which such securities are traded, as of the close of business on the day the securities are being valued or, lacking any sales, at the last available bid price. Prices for each security are taken from the principal exchange or market on which the security trades.
Fixed-income securities, including short-term securities, are generally valued at prices obtained from one or more pricing vendors. Vendors value such securities based on one or more of the inputs described in the following table. The table provides examples of inputs that are commonly relevant for valuing particular classes of fixed-income securities in which the fund is authorized to invest. However, these classifications are not exclusive, and any of the inputs may be used to value any other class of fixed-income security.
| Fixed-income class | Examples of standard inputs |
| All | Benchmark yields, transactions, bids, offers, quotations from dealers and trading systems, new issues, spreads and other relationships observed in the markets among comparable securities; and proprietary pricing models such as yield measures calculated using factors such as cash flows, financial or collateral performance and other reference data (collectively referred to as “standard inputs”) |
| Corporate bonds & notes; convertible securities | Standard inputs and underlying equity of the issuer |
| Bonds & notes of governments & government agencies | Standard inputs and interest rate volatilities |
| Mortgage-backed; asset-backed obligations | Standard inputs and cash flows, prepayment information, default rates, delinquency and loss assumptions, collateral characteristics, credit enhancements and specific deal information |
| Municipal securities | Standard inputs and, for certain distressed securities, cash flows or liquidation values using a net present value calculation based on inputs that include, but are not limited to, financial statements and debt contracts |
When the fund’s investment adviser deems it appropriate to do so (such as when vendor prices are unavailable or deemed to be not representative), fixed-income securities will be valued in good faith at the mean quoted bid and ask prices that are reasonably and timely available (or bid prices, if ask prices are not available) or at prices for securities of comparable maturity, quality and type.
Securities with both fixed-income and equity characteristics, or equity securities traded principally among fixed-income dealers, are generally valued in the manner described for either equity or fixed-income securities, depending on which method is deemed most appropriate by the fund’s investment adviser. Exchange-traded futures are generally valued at the official settlement price of the exchange or market on which such instruments are traded, as of the close of business on the day the futures are being valued. Interest rate swaps are generally valued by pricing vendors based on market inputs that include the index and term of index, reset frequency, payer/receiver, currency and pay frequency.
Securities and other assets for which representative market quotations are not readily available or are considered unreliable by the fund’s investment adviser are fair valued as determined in good faith under fair valuation guidelines adopted by authority of the fund’s board of trustees as further described. The investment adviser follows fair valuation guidelines, consistent with U.S. Securities and Exchange Commission rules and guidance, to consider relevant principles and factors when making fair value determinations. The investment
adviser considers relevant indications of value that are reasonably and timely available to it in determining the fair value to be assigned to a particular security, such as the type and cost of the security; contractual or legal restrictions on resale of the security; relevant financial or business developments of the issuer; actively traded similar or related securities; conversion or exchange rights on the security; related corporate actions; significant events occurring after the close of trading in the security; and changes in overall market conditions. In addition, the closing prices of equity securities that trade in markets outside U.S. time zones may be adjusted to reflect significant events that occur after the close of local trading but before the net asset value of each share class of the fund is determined. Fair valuations and valuations of investments that are not actively trading involve judgment and may differ materially from valuations that would have been used had greater market activity occurred.
Processes and structure— The fund’s board of trustees has delegated authority to the fund’s investment adviser to make fair value determinations, subject to board oversight. The investment adviser has established a Joint Fair Valuation Committee (the “Fair Valuation Committee”) to administer, implement and oversee the fair valuation process, and to make fair value decisions. The Fair Valuation Committee regularly reviews its own fair value decisions, as well as decisions made under its standing instructions to the investment adviser’s valuation teams. The Fair Valuation Committee reviews changes in fair value measurements from period to period and may, as deemed appropriate, update the fair valuation guidelines to better reflect the results of back testing and address new or evolving issues. The Fair Valuation Committee reports any changes to the fair valuation guidelines to the board of trustees. The fund’s board and audit committee also regularly review reports that describe fair value determinations and methods.
The fund’s investment adviser has also established a Fixed-Income Pricing Review Group to administer and oversee the fixed-income valuation process, including the use of fixed-income pricing vendors. This group regularly reviews pricing vendor information and market data. Pricing decisions, processes and controls over security valuation are also subject to additional internal reviews, including an annual control self-evaluation program facilitated by the investment adviser’s compliance group.
Classifications— The fund’s investment adviser classifies the fund’s assets and liabilities into three levels based on the inputs used to value the assets or liabilities. Level 1 values are based on quoted prices in active markets for identical securities. Level 2 values are based on significant observable market inputs, such as quoted prices for similar securities and quoted prices in inactive markets. Certain securities trading outside the U.S. may transfer between Level 1 and Level 2 due to valuation adjustments resulting from significant market movements following the close of local trading. Level 3 values are based on significant unobservable inputs that reflect the investment adviser’s determination of assumptions that market participants might reasonably use in valuing the securities. The valuation levels are not necessarily an indication of the risk or liquidity associated with the underlying investment. For example, U.S. government securities are reflected as Level 2 because the inputs used to determine fair value may not always be quoted prices in an active market. The following tables present the fund’s valuation levels as of December 31, 2018 (dollars in thousands):
| | | Investment securities | |
| | | Level 1 | | | Level 2 | | | Level 3 | | | Total | |
| Assets: | | | | | | | | | | | | | | | | |
| Common stocks: | | | | | | | | | | | | | | | | |
| Information technology | | $ | 14,581,405 | | | $ | 197,354 | | | $ | — | | | $ | 14,778,759 | |
| Health care | | | 11,323,163 | | | | — | | | | — | | | | 11,323,163 | |
| Financials | | | 9,983,319 | | | | — | | | | — | | | | 9,983,319 | |
| Energy | | | 8,159,160 | | | | — | | | | — | | | | 8,159,160 | |
| Consumer discretionary | | | 7,882,216 | | | | — | | | | — | | | | 7,882,216 | |
| Consumer staples | | | 4,334,083 | | | | 805,211 | | | | — | | | | 5,139,294 | |
| Communication services | | | 4,316,427 | | | | 109,898 | | | | — | | | | 4,426,325 | |
| Materials | | | 4,003,023 | | | | 171,904 | | | | — | | | | 4,174,927 | |
| Industrials | | | 4,144,318 | | | | — | | | | — | | | | 4,144,318 | |
| Real estate | | | 3,946,452 | | | | — | | | | — | | | | 3,946,452 | |
| Utilities | | | 1,103,244 | | | | — | | | | — | | | | 1,103,244 | |
| Preferred securities | | | — | | | | 4,501 | | | | — | | | | 4,501 | |
| Convertible stocks | | | 105,225 | | | | — | | | | — | | | | 105,225 | |
| Bonds, notes & other debt instruments: | | | | | | | | | | | | | | | | |
| Corporate bonds & notes | | | — | | | | 16,549,604 | | | | 532 | | | | 16,550,136 | |
| U.S. Treasury bonds & notes | | | — | | | | 16,277,740 | | | | — | | | | 16,277,740 | |
| Mortgage-backed obligations | | | — | | | | 9,637,677 | | | | — | | | | 9,637,677 | |
| Municipals | | | — | | | | 324,501 | | | | — | | | | 324,501 | |
| Federal agency bonds & notes | | | — | | | | 305,513 | | | | — | | | | 305,513 | |
| Other bonds & notes | | | — | | | | 1,475,114 | | | | — | | | | 1,475,114 | |
| Short-term securities | | | — | | | | 7,197,641 | | | | — | | | | 7,197,641 | |
| Total | | $ | 73,882,035 | | | $ | 53,056,658 | | | $ | 532 | | | $ | 126,939,225 | |
| | | Other investments* | |
| | | Level 1 | | | Level 2 | | | Level 3 | | | Total | |
| Assets: | | | | | | | | | | | | | | | | |
| Unrealized appreciation on futures contracts | | $ | 54,475 | | | $ | — | | | $ | — | | | $ | 54,475 | |
| Liabilities: | | | | | | | | | | | | | | | | |
| Unrealized depreciation on futures contracts | | | (7,599 | ) | | | — | | | | — | | | | (7,599 | ) |
| Unrealized depreciation on interest rate swaps | | | — | | | | (16,554 | ) | | | — | | | | (16,554 | ) |
| Total | | $ | 46,876 | | | $ | (16,554 | ) | | $ | — | | | $ | 30,322 | |
| * | Futures contracts and interest rate swaps are not included in the investment portfolio. |
4. Risk factors
Investing in the fund may involve certain risks including, but not limited to, those described below.
Market conditions— The prices of, and the income generated by, the common stocks, bonds and other securities held by the fund may decline — sometimes rapidly or unpredictably — due to various factors, including events or conditions affecting the general economy or particular industries; overall market changes; local, regional or global political, social or economic instability; governmental, governmental agency or central bank responses to economic conditions; and currency exchange rate, interest rate and commodity price fluctuations.
Issuer risks— The prices of, and the income generated by, securities held by the fund may decline in response to various factors directly related to the issuers of such securities, including reduced demand for an issuer’s goods or services, poor management performance, major litigation against the issuer, changes in government regulations affecting the issuer or its competitive environment and strategic initiatives such as mergers, acquisitions or dispositions and the market response to any such initiatives.
Investing in growth-oriented stocks— Growth-oriented common stocks and other equity-type securities (such as preferred stocks, convertible preferred stocks and convertible bonds) may involve larger price swings and greater potential for loss than other types of investments.
Investing in income-oriented stocks— The value of the fund’s securities and income provided by the fund may be reduced by changes in the dividend policies of, and the capital resources available for dividend payments at, the companies in which the fund invests.
Investing in debt instruments— The prices of, and the income generated by, bonds and other debt securities held by the fund may be affected by changing interest rates and by changes in the effective maturities and credit ratings of these securities.
Rising interest rates will generally cause the prices of bonds and other debt securities to fall. A general rise in interest rates may cause investors to sell debt securities on a large scale, which could also adversely affect the price and liquidity of debt securities and could also result in increased redemptions from the fund. Falling interest rates may cause an issuer to redeem, call or refinance a debt security before its stated maturity, which may result in the fund failing to recoup the full amount of its initial investment and having to reinvest the proceeds in lower yielding securities. Longer maturity debt securities generally have greater sensitivity to changes in interest rates and may be subject to greater price fluctuations than shorter maturity debt securities.
Bonds and other debt securities are also subject to credit risk, which is the possibility that the credit strength of an issuer or guarantor will weaken or be perceived to be weaker, and/or an issuer of a debt security will fail to make timely payments of principal or interest and the security will go into default. A downgrade or default affecting any of the fund’s securities could cause the value of the fund’s shares to decrease. Lower quality debt securities generally have higher rates of interest and may be subject to greater price fluctuations than higher quality debt securities. Credit risk is gauged, in part, by the credit ratings of the debt securities in which the fund invests. However, ratings are only the opinions of the rating agencies issuing them and are not guarantees as to credit quality or an evaluation of market risk. The fund’s investment adviser relies on its own credit analysts to research issuers and issues in seeking to assess credit and default risks.
Investing in securities backed by the U.S. government— Securities backed by the U.S. Treasury or the full faith and credit of the U.S. government are guaranteed only as to the timely payment of interest and principal when held to maturity. Accordingly, the current market values for these securities will fluctuate with changes in interest rates and the credit rating of the U.S. government. Securities issued by government-sponsored entities and federal agencies and instrumentalities that are not backed by the full faith and credit of the U.S. government are neither issued nor guaranteed by the U.S. government.
Investing in mortgage-related and other asset-backed securities— Mortgage-related securities, such as mortgage-backed securities, and other asset-backed securities, include debt obligations that represent interests in pools of mortgages or other income-bearing assets, such as consumer loans or receivables. Such securities often involve risks that are different from or more acute than the risks associated
with investing in other types of debt securities. Mortgage-backed and other asset-backed securities are subject to changes in the payment patterns of borrowers of the underlying debt, potentially increasing the volatility of the securities and the fund’s net asset value. When interest rates fall, borrowers are more likely to refinance or prepay their debt before its stated maturity. This may result in the fund having to reinvest the proceeds in lower yielding securities, effectively reducing the fund’s income. Conversely, if interest rates rise and borrowers repay their debt more slowly than expected, the time in which the mortgage-backed and other asset-backed securities are paid off could be extended, reducing the fund’s cash available for reinvestment in higher yielding securities. Mortgage-backed securities are also subject to the risk that underlying borrowers will be unable to meet their obligations and the value of property that secures the mortgages may decline in value and be insufficient, upon foreclosure, to repay the associated loans. Investments in asset-backed securities are subject to similar risks.
Liquidity risk— Certain fund holdings may be or become difficult or impossible to sell, particularly during times of market turmoil. Illiquidity may result from the lack of an active market for a holding, legal or contractual restrictions on resale, or the reduced number and capacity of market participants to make a market in such holding. Market prices for less liquid or illiquid holdings may be volatile, and reduced liquidity may have an adverse impact on the market price of such holdings. Additionally, the sale of less liquid or illiquid holdings may involve substantial delays (including delays in settlement) and additional costs and the fund may be unable to sell such holdings when necessary to meet its liquidity needs or may be forced to sell at a loss.
Investing outside the U.S.— Securities of issuers domiciled outside the U.S., or with significant operations or revenues outside the U.S., may lose value because of adverse political, social, economic or market developments (including social instability, regional conflicts, terrorism and war) in the countries or regions in which the issuers operate or generate revenue. These securities may also lose value due to changes in foreign currency exchange rates against the U.S. dollar and/or currencies of other countries. Issuers of these securities may be more susceptible to actions of foreign governments, such as nationalization, currency blockage or the imposition of price controls or punitive taxes, each of which could adversely impact the value of these securities. Securities markets in certain countries may be more volatile and/or less liquid than those in the U.S. Investments outside the U.S. may also be subject to different accounting practices and different regulatory, legal and reporting standards and practices, and may be more difficult to value, than those in the U.S. In addition, the value of investments outside the U.S. may be reduced by foreign taxes, including foreign withholding taxes on interest and dividends. Further, there may be increased risks of delayed settlement of securities purchased or sold by the fund. The risks of investing outside the U.S. may be heightened in connection with investments in emerging markets.
Management— The investment adviser to the fund actively manages the fund’s investments. Consequently, the fund is subject to the risk that the methods and analyses, including models, tools and data, employed by the investment adviser in this process may be flawed or incorrect and may not produce the desired results. This could cause the fund to lose value or its investment results to lag relevant benchmarks or other funds with similar objectives.
5. Certain investment techniques
Index-linked bonds— The fund has invested in index-linked bonds, which are fixed-income securities whose principal value is periodically adjusted to a government price index. Over the life of an index-linked bond, interest is paid on the adjusted principal value. Increases or decreases in the principal value of index-linked bonds are recorded as interest income in the fund’s statement of operations.
Mortgage dollar rolls— The fund has entered into mortgage dollar roll transactions in which the fund sells a mortgage-backed security to a counterparty and simultaneously enters into an agreement with the same counterparty to buy back a similar security on a specific future date at a predetermined price. Mortgage dollar rolls are accounted for as purchase and sale transactions. Portfolio turnover rates excluding and including mortgage dollar rolls are presented at the end of the fund’s financial highlights table.
Futures contracts— The fund has entered into futures contracts, which provide for the future sale by one party and purchase by another party of a specified amount of a specific financial instrument for a specified price, date, time and place designated at the time the contract is made. Futures contracts are used to strategically manage the fund’s interest rate sensitivity by increasing or decreasing the duration of the fund or a portion of the fund’s portfolio.
Upon entering into futures contracts, and to maintain the fund’s open positions in futures contracts, the fund is required to deposit with a futures broker, or FCM, in a segregated account in the name of the FCM an amount of cash, U.S. government securities or other liquid securities, known as initial margin. The margin required for a particular futures contract is set by the exchange on which the contract is traded to serve as collateral, and may be significantly modified from time to time by the exchange during the term of the contract. Securities deposited as initial margin, if any, are disclosed in the investment portfolio and cash deposited as initial margin, if any, is reflected as restricted cash pledged for futures contracts in the fund’s statement of assets and liabilities.
On a daily basis, the fund pays or receives variation margin based on the increase or decrease in the value of the futures contracts and records variation margin on futures contracts in the statement of assets and liabilities. In addition, the fund segregates liquid assets equivalent to the fund’s outstanding obligations under the contract in excess of the initial margin and variation margin, if any. Futures contracts may involve a risk of loss in excess of the variation margin shown on the fund’s statement of assets and liabilities. The fund records realized gains or losses at the time the futures contract is closed or expires. Net realized gains or losses and net unrealized appreciation or depreciation from futures contracts are recorded in the fund’s statement of operations. The average month-end notional amount of futures contracts while held was $3,541,150,000.
Interest rate swaps— The fund has entered into interest rate swap contracts, which are agreements to exchange one stream of future interest payments for another based on a specified notional amount. Typically, interest rate swaps exchange a fixed interest rate for a payment that floats relative to a benchmark or vice versa. The fund’s investment adviser uses interest rate swaps to seek to manage the interest rate sensitivity of the fund by increasing or decreasing the duration of the fund or a portion of the fund’s portfolio. Risks may arise as a result of the fund’s investment adviser incorrectly anticipating changes in interest rates, increased volatility, reduced liquidity and the potential inability of counterparties to meet the terms of their agreements.
Upon entering into an interest rate swap contract, the fund is required to deposit cash, U.S. government securities or other liquid securities, which is known as initial margin. Generally, the initial margin required for a particular interest rate swap is set and held as collateral by the clearinghouse on which the contract is cleared. The amount of initial margin required may be significantly modified from time to time by the clearinghouse during the term of the contract.
On a daily basis, the fund’s investment adviser records daily interest accruals related to the exchange of future payments as a receivable and payable in the fund’s statement of assets and liabilities. The fund also pays or receives a variation margin based on the increase or decrease in the value of the interest rate swaps, including accrued interest, and records variation margin on interest rate swaps in the statement of assets and liabilities. The fund records realized gains and losses on both the net accrued interest and any gain or loss recognized at the time the interest rate swap is closed or expires. Net realized gains or losses, as well as any net unrealized appreciation or depreciation, from interest rate swaps are recorded in the fund’s statement of operations. The average month-end notional amount of interest rate swaps while held was $2,150,443,000.
The following tables present the financial statement impacts resulting from the fund’s use of futures contracts and interest rate swaps as of, or for the year ended, December 31, 2018 (dollars in thousands):
| | | | | Assets | | | Liabilities | |
| Contracts | | Risk type | | Location on statement of
assets and liabilities | | Value | | | Location on statement of
assets and liabilities | | Value | |
| Futures | | Interest | | Unrealized appreciation* | | $ | 54,475 | | | Unrealized depreciation* | | $ | 7,599 | |
| Swaps | | Interest | | Unrealized appreciation* | | | — | | | Unrealized depreciation* | | | 16,554 | |
| | | | | | | $ | 54,475 | | | | | $ | 24,153 | |
| | | | | | | | | | | | | | | |
| | | | | Net realized gain (loss) | | | Net unrealized appreciation (depreciation) | |
| Contracts | | Risk type | | Location on statement of
operations | | Value | | | Location on statement of
operations | | Value | |
| Futures | | Interest | | Net realized gain on futures contracts | | $ | 21,763 | | | Net unrealized appreciation on futures contracts | | $ | 46,876 | |
| Swaps | | Interest | | Net realized loss on swap contracts | | | (50 | ) | | Net unrealized depreciation on swap contracts | | | (16,554 | ) |
| | | | | | | $ | 21,713 | | | | | $ | 30,322 | |
| * | Includes cumulative appreciation/depreciation on futures contracts and interest rate swaps as reported in the applicable tables following the fund’s investment portfolio. Only current day’s variation margin is reported within the statement of assets and liabilities. |
Collateral— The fund participates in a collateral program that calls for the fund to either receive or pledge highly liquid assets, such as cash or U.S. government securities, as collateral due to its use of futures contracts, interest rate swaps and future delivery contracts. For futures contracts and interest rate swaps, the program calls for the fund to pledge collateral for initial and variation margin by contract. For future delivery contracts, the program calls for the fund to either receive or pledge collateral based on the net gain or loss on unsettled contracts by certain counterparties. The purpose of the collateral is to cover potential losses that could occur in the event that either party cannot meet its contractual obligation. Non-cash collateral pledged by the fund, if any, is disclosed in the fund’s investment portfolio, and
cash collateral pledged by the fund, if any, is held in a segregated account with the fund’s custodian, which is reflected as pledged cash in the fund’s statement of assets and liabilities.
6. Taxation and distributions
Federal income taxation— The fund complies with the requirements under Subchapter M of the Internal Revenue Code applicable to mutual funds and intends to distribute substantially all of its net taxable income and net capital gains each year. The fund is not subject to income taxes to the extent such distributions are made. Therefore, no federal income tax provision is required.
As of and during the period ended December 31, 2018, the fund did not have a liability for any unrecognized tax benefits. The fund recognizes interest and penalties, if any, related to unrecognized tax benefits as income tax expense in the statement of operations. During the period, the fund did not incur any significant interest or penalties.
The fund’s tax returns are not subject to examination by federal, state and, if applicable, non-U.S. tax authorities after the expiration of each jurisdiction’s statute of limitations, which is generally three years after the date of filing but can be extended in certain jurisdictions.
Non-U.S. taxation— Dividend and interest income are recorded net of non-U.S. taxes paid. The fund may file withholding tax reclaims in certain jurisdictions to recover a portion of amounts previously withheld. As a result of rulings from European courts, the fund filed for additional reclaims related to prior years. These reclaims are recorded when the amount is known and there are no significant uncertainties on collectability. Gains realized by the fund on the sale of securities in certain countries, if any, may be subject to non-U.S. taxes. If applicable, the fund records an estimated deferred tax liability based on unrealized gains to provide for potential non-U.S. taxes payable upon the sale of these securities.
Distributions— Distributions paid to shareholders are based on net investment income and net realized gains determined on a tax basis, which may differ from net investment income and net realized gains for financial reporting purposes. These differences are due primarily to different treatment for items such as currency gains and losses; short-term capital gains and losses; capital losses related to sales of certain securities within 30 days of purchase; cost of investments sold and income on certain investments. The fiscal year in which amounts are distributed may differ from the year in which the net investment income and net realized gains are recorded by the fund for financial reporting purposes. The fund may also designate a portion of the amount paid to redeeming shareholders as a distribution for tax purposes.
During the year ended December 31, 2018, the fund reclassified $396,867,000 from total distributable earnings to capital paid in on shares of beneficial interest to align financial reporting with tax reporting.
As of December 31, 2018, the tax basis components of distributable earnings, unrealized appreciation (depreciation) and cost of investments were as follows (dollars in thousands):
| Undistributed ordinary income | | $ | 106,372 | |
| Undistributed long-term capital gains | | | 458,053 | |
| Gross unrealized appreciation on investments | | | 23,540,858 | |
| Gross unrealized depreciation on investments | | | (4,364,197 | ) |
| Net unrealized appreciation on investments | | | 19,176,661 | |
| Cost of investments | | | 107,792,886 | |
Distributions paid were characterized for tax purposes as follows (dollars in thousands):
| | | Year ended December 31, 2018 | | | Year ended December 31, 2017 | |
| Share class | | Ordinary
income | | | Long-term
capital gains | | | Total
distributions
paid | | | Ordinary
income | | | Long-term
capital gains | | | Total
distributions
paid | |
| Class A | | $ | 1,242,710 | | | $ | 2,438,938 | | | $ | 3,681,648 | | | $ | 1,091,907 | | | $ | 2,212,925 | | | $ | 3,304,832 | |
| Class B1 | | | | | | | | | | | | | | | — | | | | — | | | | — | |
| Class C | | | 102,078 | | | | 337,741 | | | | 439,819 | | | | 87,142 | | | | 309,066 | | | | 396,208 | |
| Class T2 | | | — | 3 | | | — | 3 | | | — | 3 | | | — | 3 | | | — | 3 | | | — | 3 |
| Class F-1 | | | 90,250 | | | | 180,643 | | | | 270,893 | | | | 80,879 | | | | 172,915 | | | | 253,794 | |
| Class F-2 | | | 224,832 | | | | 434,354 | | | | 659,186 | | | | 150,501 | | | | 296,493 | | | | 446,994 | |
| Class F-34 | | | 71,103 | | | | 131,316 | | | | 202,419 | | | | 31,279 | | | | 77,895 | | | | 109,174 | |
| Class 529-A | | | 71,725 | | | | 145,857 | | | | 217,582 | | | | 61,155 | | | | 133,574 | | | | 194,729 | |
| Class 529-B1 | | | | | | | | | | | | | | | — | | | | — | | | | — | |
| Class 529-C | | | 8,244 | | | | 28,362 | | | | 36,606 | | | | 8,420 | | | | 29,790 | | | | 38,210 | |
| Class 529-E | | | 2,793 | | | | 6,479 | | | | 9,272 | | | | 2,492 | | | | 6,074 | | | | 8,566 | |
| Class 529-T2 | | | — | 3 | | | — | 3 | | | — | 3 | | | — | 3 | | | — | 3 | | | — | 3 |
| Class 529-F-1 | | | 4,104 | | | | 7,790 | | | | 11,894 | | | | 3,159 | | | | 6,095 | | | | 9,254 | |
| Class R-1 | | | 1,341 | | | | 4,351 | | | | 5,692 | | | | 1,360 | | | | 4,762 | | | | 6,122 | |
| Class R-2 | | | 13,335 | | | | 43,726 | | | | 57,061 | | | | 12,663 | | | | 44,461 | | | | 57,124 | |
| Class R-2E | | | 1,039 | | | | 2,970 | | | | 4,009 | | | | 565 | | | | 1,909 | | | | 2,474 | |
| Class R-3 | | | 49,938 | | | | 116,892 | | | | 166,830 | | | | 50,139 | | | | 123,059 | | | | 173,198 | |
| Class R-4 | | | 112,344 | | | | 222,864 | | | | 335,208 | | | | 109,385 | | | | 223,836 | | | | 333,221 | |
| Class R-5E | | | 4,461 | | | | 6,462 | | | | 10,923 | | | | 376 | | | | 1,010 | | | | 1,386 | |
| Class R-5 | | | 42,106 | | | | 71,624 | | | | 113,730 | | | | 42,776 | | | | 76,038 | | | | 118,814 | |
| Class R-6 | | | 446,996 | | | | 780,364 | | | | 1,227,360 | | | | 325,068 | | | | 616,401 | | | | 941,469 | |
| Total | | $ | 2,489,399 | | | $ | 4,960,733 | | | $ | 7,450,132 | | | $ | 2,059,266 | | | $ | 4,336,303 | | | $ | 6,395,569 | |
| 1 | Class B and 529-B shares were fully liquidated on May 5, 2017. |
| 2 | Class T and 529-T shares began investment operations on April 7, 2017. |
| 3 | Amount less than one thousand. |
| 4 | Class F-3 shares began investment operations on January 27, 2017. |
7. Fees and transactions with related parties
CRMC, the fund’s investment adviser, is the parent company of American Funds Distributors,® Inc. (“AFD”), the principal underwriter of the fund’s shares, and American Funds Service Company® (“AFS”), the fund’s transfer agent. CRMC, AFD and AFS are considered related parties to the fund.
Investment advisory services— The fund has an investment advisory and service agreement with CRMC that provides for monthly fees accrued daily. At the beginning of the year, these fees were based on a series of decreasing annual rates beginning with 0.420% on the first $500 million of daily net assets and decreasing to 0.207% on such assets in excess of $89 billion. On December 7, 2017, the fund’s board of trustees approved an amended investment advisory and service agreement effective February 1, 2018, decreasing the annual rate to 0.204% on daily net assets in excess of $115 billion. CRMC voluntarily reduced investment advisory services fees to the approved rate in advance of the effective date. On December 13, 2018, the fund’s board of trustees approved an amended investment advisory and service agreement effective February 1, 2019, decreasing the annual rate to 0.202% on daily net assets in excess of $144 billion. For the year ended December 31, 2018, total investment advisory services fees waived by CRMC were $34,000. As a result, the fee of $287,258,000 shown on the statement of operations was reduced to $287,224,000, both of which were equivalent to an annualized rate of 0.222% of average daily net assets.
Class-specific fees and expenses— Expenses that are specific to individual share classes are accrued directly to the respective share class. The principal class-specific fees and expenses are further described below:
Distribution services— The fund has plans of distribution for all share classes, except Class F-2, F-3, R-5E, R-5 and R-6 shares. Under the plans, the board of trustees approves certain categories of expenses that are used to finance activities primarily intended to sell fund shares and service existing accounts. The plans provide for payments, based on an annualized percentage of average daily net assets, ranging from 0.25% to 1.00% as noted in this section. In some cases, the board of trustees has limited the amounts that may be paid to less than the maximum allowed by the plans. All share classes with a plan may use up to 0.25% of average daily net assets to pay service fees, or to compensate AFD for paying service fees, to firms that have entered into agreements with AFD to provide
certain shareholder services. The remaining amounts available to be paid under each plan are paid to dealers to compensate them for their sales activities.
| Share class | | Currently approved limits | | Plan limits | |
| Class A | | | 0.25 | % | | | 0.25 | % | |
| Class 529-A | | | 0.25 | | | | 0.50 | | |
| Classes C, 529-C and R-1 | | | 1.00 | | | | 1.00 | | |
| Class R-2 | | | 0.75 | | | | 1.00 | | |
| Class R-2E | | | 0.60 | | | | 0.85 | | |
| Classes 529-E and R-3 | | | 0.50 | | | | 0.75 | | |
| Classes T, F-1, 529-T, 529-F-1 and R-4 | | | 0.25 | | | | 0.50 | | |
For Class A and 529-A shares, distribution-related expenses include the reimbursement of dealer and wholesaler commissions paid by AFD for certain shares sold without a sales charge. These share classes reimburse AFD for amounts billed within the prior 15 months but only to the extent that the overall annual expense limits are not exceeded. As of December 31, 2018, unreimbursed expenses subject to reimbursement totaled $3,697,000 for Class A shares. There were no unreimbursed expenses subject to reimbursement for Class 529-A shares.
Transfer agent services— The fund has a shareholder services agreement with AFS under which the fund compensates AFS for providing transfer agent services to each of the fund’s share classes. These services include recordkeeping, shareholder communications and transaction processing. In addition, the fund reimburses AFS for amounts paid to third parties for performing transfer agent services on behalf of fund shareholders.
Administrative services— The fund has an administrative services agreement with CRMC under which the fund compensates CRMC for providing administrative services to Class A, C, T, F, 529 and R shares. Administrative services are provided by CRMC to help assist third parties providing non-distribution services to fund shareholders. These services include providing in depth information on the fund and market developments that impact fund investments. Administrative services also include, but are not limited to, coordinating, monitoring and overseeing third parties that provide services to fund shareholders. The agreement between the fund and CRMC provides the fund the ability to charge an administrative services fee of 0.05% of average daily net assets for all share classes. Currently Class A shares pay an annual fee of 0.01% of average daily net assets (which could be increased as noted above) and Class C, T, F, 529 and R shares pay an annual fee of 0.05% of their respective average daily net assets.
529 plan services— Each 529 share class is subject to service fees to compensate the Virginia College Savings Plan (“Virginia529”) for its oversight and administration of the CollegeAmerica 529 college savings plan. The fee is based on the combined net assets invested in Class 529 and ABLE shares of the American Funds. Class ABLE shares are offered on other American Funds by Virginia529 through ABLEAmerica, a tax-advantaged savings program for individuals with disabilities. The quarterly fee is based on a series of decreasing annual rates beginning with 0.10% on the first $20 billion of the combined net assets invested in the American Funds and decreasing to 0.03% on such assets in excess of $100 billion. The fee for any given calendar quarter is accrued and calculated on the basis of the average net assets of Class 529 and ABLE shares of the American Funds for the last month of the prior calendar quarter. The fee is included in other expenses in the fund’s statement of operations. Virginia529 is not considered a related party to the fund.
For the year ended December 31, 2018, class-specific expenses under the agreements were as follows (dollars in thousands):
| Share class | | Distribution
services | | | Transfer agent
services | | | Administrative
services | | | 529 plan
services | |
| Class A | | | $161,481 | | | | $50,557 | | | | $6,459 | | | Not applicable | |
| Class C | | | 88,745 | | | | 6,852 | | | | 4,444 | | | Not applicable | |
| Class T | | | — | | | | — | * | | | — | * | | Not applicable | |
| Class F-1 | | | 12,219 | | | | 5,638 | | | | 2,456 | | | Not applicable | |
| Class F-2 | | Not applicable | | | | 10,209 | | | | 5,088 | | | Not applicable | |
| Class F-3 | | Not applicable | | | | 206 | | | | 1,533 | | | Not applicable | |
| Class 529-A | | | 9,240 | | | | 2,612 | | | | 1,949 | | | $2,563 | |
| Class 529-C | | | 7,810 | | | | 536 | | | | 395 | | | 519 | |
| Class 529-E | | | 865 | | | | 70 | | | | 87 | | | 115 | |
| Class 529-T | | | — | | | | — | * | | | — | * | | — | * |
| Class 529-F-1 | | | — | | | | 126 | | | | 96 | | | 127 | |
| Class R-1 | | | 1,250 | | | | 119 | | | | 63 | | | Not applicable | |
| Class R-2 | | | 8,974 | | | | 4,099 | | | | 599 | | | Not applicable | |
| Class R-2E | | | 412 | | | | 137 | | | | 34 | | | Not applicable | |
| Class R-3 | | | 16,353 | | | | 4,932 | | | | 1,637 | | | Not applicable | |
| Class R-4 | | | 15,300 | | | | 6,158 | | | | 3,061 | | | Not applicable | |
| Class R-5E | | Not applicable | | | | 326 | | | | 128 | | | Not applicable | |
| Class R-5 | | Not applicable | | | | 998 | | | | 991 | | | Not applicable | |
| Class R-6 | | Not applicable | | | | 120 | | | | 9,950 | | | Not applicable | |
| Total class-specific expenses | | | $322,649 | | | | $93,695 | | | | $38,970 | | | $3,324 | |
| * | Amount less than one thousand. |
Trustees’ deferred compensation— Trustees who are unaffiliated with CRMC may elect to defer the cash payment of part or all of their compensation. These deferred amounts, which remain as liabilities of the fund, are treated as if invested in shares of the fund or other American Funds. These amounts represent general, unsecured liabilities of the fund and vary according to the total returns of the selected funds. Trustees’ compensation of $494,000 in the fund’s statement of operations reflects $399,000 in current fees (either paid in cash or deferred) and a net increase of $95,000 in the value of the deferred amounts.
Affiliated officers and trustees— Officers and certain trustees of the fund are or may be considered to be affiliated with CRMC, AFD and AFS. No affiliated officers or trustees received any compensation directly from the fund.
Security transactions with related funds— The fund may purchase from, or sell securities to, other funds managed by CRMC (or funds managed by certain affiliates of CRMC) under procedures adopted by the fund’s board of trustees. The funds involved in such transactions are considered related by virtue of having a common investment adviser (or affiliated investment advisers), common trustees and/or common officers. When such transactions occur, each transaction is executed at the current market price of the security and no brokerage commissions or fees are paid in accordance with Rule 17a-7 of the 1940 Act.
Interfund lending— Pursuant to an exemptive order issued by the SEC, the fund, along with other CRMC-managed funds (or funds managed by certain affiliates of CRMC), may participate in an interfund lending program. The program provides an alternate credit facility that permits the funds to lend or borrow cash for temporary purposes directly to or from one another, subject to the conditions of the exemptive order. The fund did not lend or borrow cash through the interfund lending program at any time during the year ended December 31, 2018.
8. Capital share transactions
Capital share transactions in the fund were as follows (dollars and shares in thousands):
| | | Sales1 | | | Reinvestments of
distributions | | | Repurchases1 | | | Net increase
(decrease) | |
| Share class | | Amount | | | Shares | | | Amount | | | Shares | | | Amount | | | Shares | | | Amount | | | Shares | |
| | | | | | | | | | | | | | | | | | | | | | | | | |
| Year ended December 31, 2018 |
| Class A | | $ | 9,131,176 | | | | 337,074 | | | $ | 3,636,788 | | | | 142,532 | | | $ | (8,235,983 | ) | | | (304,752 | ) | | $ | 4,531,981 | | | | 174,854 | |
| Class C | | | 1,976,581 | | | | 73,265 | | | | 434,667 | | | | 17,272 | | | | (1,862,635 | ) | | | (69,191 | ) | | | 548,613 | | | | 21,346 | |
| Class T | | | — | | | | — | | | | — | | | | — | | | | — | | | | — | | | | — | | | | — | |
| Class F-1 | | | 1,142,173 | | | | 42,038 | | | | 265,684 | | | | 10,420 | | | | (1,365,669 | ) | | | (50,302 | ) | | | 42,188 | | | | 2,156 | |
| Class F-2 | | | 5,326,385 | | | | 196,870 | | | | 633,067 | | | | 24,848 | | | | (2,350,908 | ) | | | (87,466 | ) | | | 3,608,544 | | | | 134,252 | |
| Class F-3 | | | 1,704,608 | | | | 62,609 | | | | 200,558 | | | | 7,863 | | | | (561,150 | ) | | | (20,802 | ) | | | 1,344,016 | | | | 49,670 | |
| Class 529-A | | | 589,199 | | | | 21,718 | | | | 217,512 | | | | 8,541 | | | | (606,985 | ) | | | (22,365 | ) | | | 199,726 | | | | 7,894 | |
| Class 529-C | | | 135,081 | | | | 4,982 | | | | 36,594 | | | | 1,447 | | | | (208,884 | ) | | | (7,690 | ) | | | (37,209 | ) | | | (1,261 | ) |
| Class 529-E | | | 26,777 | | | | 988 | | | | 9,266 | | | | 365 | | | | (30,491 | ) | | | (1,126 | ) | | | 5,552 | | | | 227 | |
| Class 529-T | | | — | | | | — | | | | 1 | | | | — | 2 | | | — | | | | — | | | | 1 | | | | — | 2 |
| Class 529-F-1 | | | 60,237 | | | | 2,226 | | | | 11,892 | | | | 468 | | | | (31,020 | ) | | | (1,148 | ) | | | 41,109 | | | | 1,546 | |
| Class R-1 | | | 27,532 | | | | 1,020 | | | | 5,684 | | | | 226 | | | | (47,404 | ) | | | (1,758 | ) | | | (14,188 | ) | | | (512 | ) |
| Class R-2 | | | 289,139 | | | | 10,710 | | | | 56,998 | | | | 2,264 | | | | (393,290 | ) | | | (14,571 | ) | | | (47,153 | ) | | | (1,597 | ) |
| Class R-2E | | | 47,175 | | | | 1,739 | | | | 4,009 | | | | 159 | | | | (26,461 | ) | | | (982 | ) | | | 24,723 | | | | 916 | |
| Class R-3 | | | 737,850 | | | | 27,406 | | | | 166,692 | | | | 6,581 | | | | (1,115,699 | ) | | | (41,290 | ) | | | (211,157 | ) | | | (7,303 | ) |
| Class R-4 | | | 955,187 | | | | 35,044 | | | | 335,146 | | | | 13,158 | | | | (1,480,577 | ) | | | (54,613 | ) | | | (190,244 | ) | | | (6,411 | ) |
| Class R-5E | | | 523,677 | | | | 19,023 | | | | 10,922 | | | | 424 | | | | (368,898 | ) | | | (13,896 | ) | | | 165,701 | | | | 5,551 | |
| Class R-5 | | | 389,329 | | | | 14,307 | | | | 113,560 | | | | 4,435 | | | | (624,794 | ) | | | (23,067 | ) | | | (121,905 | ) | | | (4,325 | ) |
| Class R-6 | | | 5,242,782 | | | | 192,619 | | | | 1,227,291 | | | | 48,002 | | | | (2,988,193 | ) | | | (110,370 | ) | | | 3,481,880 | | | | 130,251 | |
| Total net increase (decrease) | | $ | 28,304,888 | | | | 1,043,638 | | | $ | 7,366,331 | | | | 289,005 | | | $ | (22,299,041 | ) | | | (825,389 | ) | | $ | 13,372,178 | | | | 507,254 | |
| | | | | | | | | | | | | | | | | | | | | | | | | | | | | | | | | |
| Year ended December 31, 2017 |
| Class A | | $ | 8,554,152 | | | | 324,896 | | | $ | 3,259,567 | | | | 121,254 | | | $ | (8,902,605 | ) | | | (337,449 | ) | | $ | 2,911,114 | | | | 108,701 | |
| Class B3 | | | 194 | | | | 7 | | | | — | | | | — | | | | (68,161 | ) | | | (2,669 | ) | | | (67,967 | ) | | | (2,662 | ) |
| Class C | | | 1,940,598 | | | | 74,227 | | | | 390,976 | | | | 14,598 | | | | (2,017,593 | ) | | | (76,974 | ) | | | 313,981 | | | | 11,851 | |
| Class T4 | | | 10 | | | | — | 2 | | | — | | | | — | | | | — | | | | — | | | | 10 | | | | — | 2 |
| Class F-1 | | | 1,373,792 | | | | 52,244 | | | | 248,862 | | | | 9,262 | | | | (1,158,108 | ) | | | (43,829 | ) | | | 464,546 | | | | 17,677 | |
| Class F-2 | | | 4,858,604 | | | | 184,594 | | | | 429,964 | | | | 15,997 | | | | (2,875,175 | ) | | | (109,471 | ) | | | 2,413,393 | | | | 91,120 | |
| Class F-35 | | | 2,384,260 | | | | 90,293 | | | | 106,878 | | | | 3,961 | | | | (196,255 | ) | | | (7,283 | ) | | | 2,294,883 | | | | 86,971 | |
| Class 529-A | | | 734,731 | | | | 27,326 | | | | 194,672 | | | | 7,251 | | | | (477,540 | ) | | | (18,058 | ) | | | 451,863 | | | | 16,519 | |
| Class 529-B3 | | | 42 | | | | 2 | | | | — | | | | — | | | | (9,221 | ) | | | (361 | ) | | | (9,179 | ) | | | (359 | ) |
| Class 529-C | | | 148,336 | | | | 5,642 | | | | 38,199 | | | | 1,422 | | | | (439,474 | ) | | | (16,130 | ) | | | (252,939 | ) | | | (9,066 | ) |
| Class 529-E | | | 25,313 | | | | 960 | | | | 8,566 | | | | 319 | | | | (26,402 | ) | | | (998 | ) | | | 7,477 | | | | 281 | |
| Class 529-T4 | | | 10 | | | | — | 2 | | | 1 | | | | — | 2 | | | — | | | | — | | | | 11 | | | | — | 2 |
| Class 529-F-1 | | | 45,111 | | | | 1,710 | | | | 9,252 | | | | 345 | | | | (24,929 | ) | | | (942 | ) | | | 29,434 | | | | 1,113 | |
| Class R-1 | | | 24,816 | | | | 953 | | | | 6,116 | | | | 229 | | | | (63,902 | ) | | | (2,460 | ) | | | (32,970 | ) | | | (1,278 | ) |
| Class R-2 | | | 306,621 | | | | 11,713 | | | | 57,095 | | | | 2,133 | | | | (461,251 | ) | | | (17,655 | ) | | | (97,535 | ) | | | (3,809 | ) |
| Class R-2E | | | 50,383 | | | | 1,910 | | | | 2,473 | | | | 92 | | | | (15,219 | ) | | | (580 | ) | | | 37,637 | | | | 1,422 | |
| Class R-3 | | | 776,489 | | | | 29,784 | | | | 172,985 | | | | 6,465 | | | | (1,149,150 | ) | | | (43,804 | ) | | | (199,676 | ) | | | (7,555 | ) |
| Class R-4 | | | 1,238,514 | | | | 47,450 | | | | 333,197 | | | | 12,420 | | | | (1,709,546 | ) | | | (64,917 | ) | | | (137,835 | ) | | | (5,047 | ) |
| Class R-5E | | | 30,784 | | | | 1,154 | | | | 1,385 | | | | 51 | | | | (2,549 | ) | | | (94 | ) | | | 29,620 | | | | 1,111 | |
| Class R-5 | | | 446,667 | | | | 16,964 | | | | 118,669 | | | | 4,414 | | | | (645,809 | ) | | | (24,452 | ) | | | (80,473 | ) | | | (3,074 | ) |
| Class R-6 | | | 6,688,340 | | | | 254,080 | | | | 941,421 | | | | 35,000 | | | | (1,675,649 | ) | | | (63,182 | ) | | | 5,954,112 | | | | 225,898 | |
| Total net increase (decrease) | | $ | 29,627,767 | | | | 1,125,909 | | | $ | 6,320,278 | | | | 235,213 | | | $ | (21,918,538 | ) | | | (831,308 | ) | | $ | 14,029,507 | | | | 529,814 | |
| 1 | Includes exchanges between share classes of the fund. |
| 2 | Amount less than one thousand. |
| 3 | Class B and 529-B shares were fully liquidated on May 5, 2017. |
| 4 | Class T and 529-T shares began investment operations on April 7, 2017. |
| 5 | Class F-3 shares began investment operations on January 27, 2017. |
9. Investment transactions
The fund made purchases and sales of investment securities, excluding short-term securities and U.S. government obligations, if any, of $85,787,880,000 and $79,181,153,000, respectively, during the year ended December 31, 2018.
Financial highlights
| | | | | | (Loss) income from
investment operations1 | | | Dividends and distributions | | | | | | | | | | | | | | | | |
| Period ended | | Net asset
value,
beginning
of period | | | Net
investment
income | | | Net (losses)
gains on
securities
(both
realized and
unrealized) | | | Total from
investment
operations | | | Dividends
(from net
investment
income) | | | Distributions
(from capital
gains) | | | Total
dividends
and
distributions | | | Net asset
value,
end
of period | | | Total
return2 | | | Net assets,
end of period
(in millions) | | | Ratio of
expenses to
average
net assets | | | Ratio of
net income
to average
net assets | |
| Class A: | | | | | | | | | | | | | | | | | | | | | | | | | | | | | | | | | | | | | | | | | | | | | | | | |
| 12/31/2018 | | $ | 27.15 | | | $ | .53 | | | $ | (1.24 | ) | | $ | (.71 | ) | | $ | (.52 | ) | | $ | (1.02 | ) | | $ | (1.54 | ) | | $ | 24.90 | | | | (2.71 | )% | | $ | 62,648 | | | | .57 | % | | | 1.94 | % |
| 12/31/2017 | | | 24.81 | | | | .48 | | | | 3.33 | | | | 3.81 | | | | (.49 | ) | | | (.98 | ) | | | (1.47 | ) | | | 27.15 | | | | 15.47 | | | | 63,563 | | | | .57 | | | | 1.80 | |
| 12/31/2016 | | | 23.83 | | | | .41 | | | | 1.62 | | | | 2.03 | | | | (.44 | ) | | | (.61 | ) | | | (1.05 | ) | | | 24.81 | | | | 8.62 | | | | 55,379 | | | | .59 | | | | 1.67 | |
| 12/31/2015 | | | 24.75 | | | | .42 | | | | — | 3 | | | .42 | | | | (.40 | ) | | | (.94 | ) | | | (1.34 | ) | | | 23.83 | | | | 1.72 | | | | 49,215 | | | | .58 | | | | 1.69 | |
| 12/31/2014 | | | 24.42 | | | | .41 | | | | 1.75 | | | | 2.16 | | | | (.39 | ) | | | (1.44 | ) | | | (1.83 | ) | | | 24.75 | | | | 8.85 | | | | 46,917 | | | | .59 | | | | 1.62 | |
| Class C: | | | | | | | | | | | | | | | | | | | | | | | | | | | | | | | | | | | | | | | | | | | | | | | | |
| 12/31/2018 | | | 26.98 | | | | .31 | | | | (1.22 | ) | | | (.91 | ) | | | (.31 | ) | | | (1.02 | ) | | | (1.33 | ) | | | 24.74 | | | | (3.45 | ) | | | 8,611 | | | | 1.36 | | | | 1.15 | |
| 12/31/2017 | | | 24.66 | | | | .26 | | | | 3.32 | | | | 3.58 | | | | (.28 | ) | | | (.98 | ) | | | (1.26 | ) | | | 26.98 | | | | 14.58 | | | | 8,816 | | | | 1.37 | | | | 1.01 | |
| 12/31/2016 | | | 23.71 | | | | .21 | | | | 1.60 | | | | 1.81 | | | | (.25 | ) | | | (.61 | ) | | | (.86 | ) | | | 24.66 | | | | 7.70 | | | | 7,767 | | | | 1.38 | | | | .88 | |
| 12/31/2015 | | | 24.63 | | | | .22 | | | | .01 | | | | .23 | | | | (.21 | ) | | | (.94 | ) | | | (1.15 | ) | | | 23.71 | | | | .93 | | | | 6,173 | | | | 1.38 | | | | .90 | |
| 12/31/2014 | | | 24.30 | | | | .21 | | | | 1.75 | | | | 1.96 | | | | (.19 | ) | | | (1.44 | ) | | | (1.63 | ) | | | 24.63 | | | | 8.03 | | | | 5,574 | | | | 1.39 | | | | .83 | |
| Class T: | | | | | | | | | | | | | | | | | | | | | | | | | | | | | | | | | | | | | | | | | | | | | | | | |
| 12/31/2018 | | | 27.15 | | | | .59 | | | | (1.24 | ) | | | (.65 | ) | | | (.58 | ) | | | (1.02 | ) | | | (1.60 | ) | | | 24.90 | | | | (2.49 | )4 | | | — | 5 | | | .35 | 4 | | | 2.16 | 4 |
| 12/31/20176,7 | | | 25.77 | | | | .41 | | | | 2.38 | | | | 2.79 | | | | (.43 | ) | | | (.98 | ) | | | (1.41 | ) | | | 27.15 | | | | 10.91 | 4,8 | | | — | 5 | | | .36 | 4,9 | | | 2.08 | 4,9 |
| Class F-1: | | | | | | | | | | | | | | | | | | | | | | | | | | | | | | | | | | | | | | | | | | | | | | | | |
| 12/31/2018 | | | 27.13 | | | | .51 | | | | (1.24 | ) | | | (.73 | ) | | | (.50 | ) | | | (1.02 | ) | | | (1.52 | ) | | | 24.88 | | | | (2.78 | ) | | | 4,599 | | | | .64 | | | | 1.86 | |
| 12/31/2017 | | | 24.79 | | | | .45 | | | | 3.33 | | | | 3.78 | | | | (.46 | ) | | | (.98 | ) | | | (1.44 | ) | | | 27.13 | | | | 15.40 | | | | 4,957 | | | | .65 | | | | 1.72 | |
| 12/31/2016 | | | 23.82 | | | | .39 | | | | 1.61 | | | | 2.00 | | | | (.42 | ) | | | (.61 | ) | | | (1.03 | ) | | | 24.79 | | | | 8.50 | | | | 4,091 | | | | .66 | | | | 1.60 | |
| 12/31/2015 | | | 24.74 | | | | .40 | | | | .01 | | | | .41 | | | | (.39 | ) | | | (.94 | ) | | | (1.33 | ) | | | 23.82 | | | | 1.67 | | | | 3,367 | | | | .65 | | | | 1.63 | |
| 12/31/2014 | | | 24.41 | | | | .39 | | | | 1.75 | | | | 2.14 | | | | (.37 | ) | | | (1.44 | ) | | | (1.81 | ) | | | 24.74 | | | | 8.80 | | | | 2,841 | | | | .65 | | | | 1.57 | |
| Class F-2: | | | | | | | | | | | | | | | | | | | | | | | | | | | | | | | | | | | | | | | | | | | | | | | | |
| 12/31/2018 | | | 27.13 | | | | .58 | | | | (1.24 | ) | | | (.66 | ) | | | (.57 | ) | | | (1.02 | ) | | | (1.59 | ) | | | 24.88 | | | | (2.52 | ) | | | 11,332 | | | | .38 | | | | 2.14 | |
| 12/31/2017 | | | 24.79 | | | | .53 | | | | 3.32 | | | | 3.85 | | | | (.53 | ) | | | (.98 | ) | | | (1.51 | ) | | | 27.13 | | | | 15.69 | | | | 8,714 | | | | .39 | | | | 1.99 | |
| 12/31/2016 | | | 23.82 | | | | .46 | | | | 1.61 | | | | 2.07 | | | | (.49 | ) | | | (.61 | ) | | | (1.10 | ) | | | 24.79 | | | | 8.80 | | | | 5,703 | | | | .39 | | | | 1.88 | |
| 12/31/2015 | | | 24.74 | | | | .47 | | | | — | 3 | | | .47 | | | | (.45 | ) | | | (.94 | ) | | | (1.39 | ) | | | 23.82 | | | | 1.92 | | | | 2,634 | | | | .39 | | | | 1.89 | |
| 12/31/2014 | | | 24.41 | | | | .46 | | | | 1.75 | | | | 2.21 | | | | (.44 | ) | | | (1.44 | ) | | | (1.88 | ) | | | 24.74 | | | | 9.08 | | | | 1,869 | | | | .39 | | | | 1.83 | |
| Class F-3: | | | | | | | | | | | | | | | | | | | | | | | | | | | | | | | | | | | | | | | | | | | | | | | | |
| 12/31/2018 | | | 27.14 | | | | .61 | | | | (1.24 | ) | | | (.63 | ) | | | (.60 | ) | | | (1.02 | ) | | | (1.62 | ) | | | 24.89 | | | | (2.43 | ) | | | 3,401 | | | | .29 | | | | 2.24 | |
| 12/31/20176,10 | | | 25.38 | | | | .53 | | | | 2.77 | | | | 3.30 | | | | (.56 | ) | | | (.98 | ) | | | (1.54 | ) | | | 27.14 | | | | 13.17 | 8 | | | 2,361 | | | | .29 | 9 | | | 2.11 | 9 |
| Class 529-A: | | | | | | | | | | | | | | | | | | | | | | | | | | | | | | | | | | | | | | | | | | | | | | | | |
| 12/31/2018 | | | 27.11 | | | | .50 | | | | (1.23 | ) | | | (.73 | ) | | | (.50 | ) | | | (1.02 | ) | | | (1.52 | ) | | | 24.86 | | | | (2.78 | ) | | | 3,733 | | | | .65 | | | | 1.86 | |
| 12/31/2017 | | | 24.77 | | | | .46 | | | | 3.33 | | | | 3.79 | | | | (.47 | ) | | | (.98 | ) | | | (1.45 | ) | | | 27.11 | | | | 15.42 | | | | 3,857 | | | | .65 | | | | 1.73 | |
| 12/31/2016 | | | 23.80 | | | | .39 | | | | 1.61 | | | | 2.00 | | | | (.42 | ) | | | (.61 | ) | | | (1.03 | ) | | | 24.77 | | | | 8.50 | | | | 3,115 | | | | .67 | | | | 1.59 | |
| 12/31/2015 | | | 24.72 | | | | .39 | | | | .01 | | | | .40 | | | | (.38 | ) | | | (.94 | ) | | | (1.32 | ) | | | 23.80 | | | | 1.63 | | | | 2,861 | | | | .68 | | | | 1.60 | |
| 12/31/2014 | | | 24.39 | | | | .38 | | | | 1.75 | | | | 2.13 | | | | (.36 | ) | | | (1.44 | ) | | | (1.80 | ) | | | 24.72 | | | | 8.76 | | | | 2,831 | | | | .68 | | | | 1.53 | |
| | | | | | (Loss) income from
investment operations1 | | | Dividends and distributions | | | | | | | | | | | | | | | | |
| Period ended | | Net asset
value,
beginning
of period | | | Net
investment
income | | | Net (losses)
gains on
securities
(both
realized and
unrealized) | | | Total from
investment
operations | | | Dividends
(from net
investment
income) | | | Distributions
(from capital
gains) | | | Total
dividends
and
distributions | | | Net asset
value,
end
of period | | | Total
return2 | | | Net assets,
end of period
(in millions) | | | Ratio of
expenses to
average
net assets | | | Ratio of
net income
to average
net assets | |
| Class 529-C: | | | | | | | | | | | | | | | | | | | | | | | | | | | | | | | | | | | | |
| 12/31/2018 | | $ | 27.11 | | | $ | .30 | | | $ | (1.24 | ) | | $ | (.94 | ) | | $ | (.29 | ) | | $ | (1.02 | ) | | $ | (1.31 | ) | | $ | 24.86 | | | | (3.53 | )% | | $ | 723 | | | | 1.40 | % | | | 1.10 | % |
| 12/31/2017 | | | 24.75 | | | | .25 | | | | 3.33 | | | | 3.58 | | | | (.24 | ) | | | (.98 | ) | | | (1.22 | ) | | | 27.11 | | | | 14.55 | | | | 822 | | | | 1.42 | | | | .96 | |
| 12/31/2016 | | | 23.79 | | | | .20 | | | | 1.60 | | | | 1.80 | | | | (.23 | ) | | | (.61 | ) | | | (.84 | ) | | | 24.75 | | | | 7.63 | | | | 975 | | | | 1.44 | | | | .82 | |
| 12/31/2015 | | | 24.70 | | | | .20 | | | | .02 | | | | .22 | | | | (.19 | ) | | | (.94 | ) | | | (1.13 | ) | | | 23.79 | | | | .88 | | | | 905 | | | | 1.45 | | | | .83 | |
| 12/31/2014 | | | 24.38 | | | | .19 | | | | 1.74 | | | | 1.93 | | | | (.17 | ) | | | (1.44 | ) | | | (1.61 | ) | | | 24.70 | | | | 7.90 | | | | 905 | | | | 1.46 | | | | .76 | |
| Class 529-E: | | | | | | | | | | | | | | | | | | | | | | | | | | | | | | | | | | | | | | | | | | | | | | | | |
| 12/31/2018 | | | 27.09 | | | | .44 | | | | (1.23 | ) | | | (.79 | ) | | | (.44 | ) | | | (1.02 | ) | | | (1.46 | ) | | | 24.84 | | | | (3.02 | ) | | | 165 | | | | .88 | | | | 1.63 | |
| 12/31/2017 | | | 24.76 | | | | .39 | | | | 3.32 | | | | 3.71 | | | | (.40 | ) | | | (.98 | ) | | | (1.38 | ) | | | 27.09 | | | | 15.11 | | | | 175 | | | | .89 | | | | 1.49 | |
| 12/31/2016 | | | 23.79 | | | | .33 | | | | 1.61 | | | | 1.94 | | | | (.36 | ) | | | (.61 | ) | | | (.97 | ) | | | 24.76 | | | | 8.24 | | | | 153 | | | | .91 | | | | 1.35 | |
| 12/31/2015 | | | 24.71 | | | | .33 | | | | .01 | | | | .34 | | | | (.32 | ) | | | (.94 | ) | | | (1.26 | ) | | | 23.79 | | | | 1.38 | | | | 142 | | | | .92 | | | | 1.36 | |
| 12/31/2014 | | | 24.38 | | | | .32 | | | | 1.75 | | | | 2.07 | | | | (.30 | ) | | | (1.44 | ) | | | (1.74 | ) | | | 24.71 | | | | 8.50 | | | | 144 | | | | .93 | | | | 1.28 | |
| Class 529-T: | | | | | | | | | | | | | | | | | | | | | | | | | | | | | | | | | | | | | | | | | | | | | | | | |
| 12/31/2018 | | | 27.15 | | | | .57 | | | | (1.23 | ) | | | (.66 | ) | | | (.57 | ) | | | (1.02 | ) | | | (1.59 | ) | | | 24.90 | | | | (2.55 | )4 | | | — | 5 | | | .41 | 4 | | | 2.09 | 4 |
| 12/31/20176,7 | | | 25.77 | | | | .40 | | | | 2.38 | | | | 2.78 | | | | (.42 | ) | | | (.98 | ) | | | (1.40 | ) | | | 27.15 | | | | 10.88 | 4,8 | | | — | 5 | | | .41 | 4,9 | | | 2.03 | 4,9 |
| Class 529-F-1: | | | | | | | | | | | | | | | | | | | | | | | | | | | | | | | | | | | | | | | | | | | |
| 12/31/2018 | | | 27.09 | | | | .57 | | | | (1.23 | ) | | | (.66 | ) | | | (.57 | ) | | | (1.02 | ) | | | (1.59 | ) | | | 24.84 | | | | (2.56 | ) | | | 201 | | | | .41 | | | | 2.10 | |
| 12/31/2017 | | | 24.75 | | | | .52 | | | | 3.33 | | | | 3.85 | | | | (.53 | ) | | | (.98 | ) | | | (1.51 | ) | | | 27.09 | | | | 15.68 | | | | 178 | | | | .42 | | | | 1.95 | |
| 12/31/2016 | | | 23.78 | | | | .44 | | | | 1.62 | | | | 2.06 | | | | (.48 | ) | | | (.61 | ) | | | (1.09 | ) | | | 24.75 | | | | 8.75 | | | | 135 | | | | .44 | | | | 1.82 | |
| 12/31/2015 | | | 24.71 | | | | .45 | | | | (.01 | ) | | | .44 | | | | (.43 | ) | | | (.94 | ) | | | (1.37 | ) | | | 23.78 | | | | 1.82 | | | | 117 | | | | .46 | | | | 1.82 | |
| 12/31/2014 | | | 24.37 | | | | .44 | | | | 1.76 | | | | 2.20 | | | | (.42 | ) | | | (1.44 | ) | | | (1.86 | ) | | | 24.71 | | | | 9.05 | | | | 111 | | | | .46 | | | | 1.76 | |
| Class R-1: | | | | | | | | | | | | | | | | | | | | | | | | | | | | | | | | | | | | | | | | | | | | | | | | |
| 12/31/2018 | | | 26.97 | | | | .30 | | | | (1.23 | ) | | | (.93 | ) | | | (.30 | ) | | | (1.02 | ) | | | (1.32 | ) | | | 24.72 | | | | (3.48 | ) | | | 110 | | | | 1.37 | | | | 1.13 | |
| 12/31/2017 | | | 24.64 | | | | .26 | | | | 3.32 | | | | 3.58 | | | | (.27 | ) | | | (.98 | ) | | | (1.25 | ) | | | 26.97 | | | | 14.56 | | | | 134 | | | | 1.37 | | | | .99 | |
| 12/31/2016 | | | 23.68 | | | | .22 | | | | 1.60 | | | | 1.82 | | | | (.25 | ) | | | (.61 | ) | | | (.86 | ) | | | 24.64 | | | | 7.75 | | | | 154 | | | | 1.38 | | | | .89 | |
| 12/31/2015 | | | 24.61 | | | | .22 | | | | (.01 | ) | | | .21 | | | | (.20 | ) | | | (.94 | ) | | | (1.14 | ) | | | 23.68 | | | | .88 | | | | 151 | | | | 1.38 | | | | .90 | |
| 12/31/2014 | | | 24.28 | | | | .21 | | | | 1.75 | | | | 1.96 | | | | (.19 | ) | | | (1.44 | ) | | | (1.63 | ) | | | 24.61 | | | | 8.05 | | | | 158 | | | | 1.38 | | | | .83 | |
| Class R-2: | | | | | | | | | | | | | | | | | | | | | | | | | | | | | | | | | | | | | | | | | | | | | | | | |
| 12/31/2018 | | | 26.98 | | | | .31 | | | | (1.24 | ) | | | (.93 | ) | | | (.30 | ) | | | (1.02 | ) | | | (1.32 | ) | | | 24.73 | | | | (3.46 | ) | | | 1,111 | | | | 1.37 | | | | 1.13 | |
| 12/31/2017 | | | 24.66 | | | | .26 | | | | 3.31 | | | | 3.57 | | | | (.27 | ) | | | (.98 | ) | | | (1.25 | ) | | | 26.98 | | | | 14.58 | | | | 1,255 | | | | 1.37 | | | | 1.00 | |
| 12/31/2016 | | | 23.70 | | | | .22 | | | | 1.60 | | | | 1.82 | | | | (.25 | ) | | | (.61 | ) | | | (.86 | ) | | | 24.66 | | | | 7.74 | | | | 1,241 | | | | 1.37 | | | | .89 | |
| 12/31/2015 | | | 24.62 | | | | .23 | | | | .01 | | | | .24 | | | | (.22 | ) | | | (.94 | ) | | | (1.16 | ) | | | 23.70 | | | | .97 | | | | 1,220 | | | | 1.32 | | | | .95 | |
| 12/31/2014 | | | 24.30 | | | | .21 | | | | 1.74 | | | | 1.95 | | | | (.19 | ) | | | (1.44 | ) | | | (1.63 | ) | | | 24.62 | | | | 8.03 | | | | 1,308 | | | | 1.36 | | | | .86 | |
| Class R-2E: | | | | | | | | | | | | | | | | | | | | | | | | | | | | | | | | | | | | | | | | | | | | | | | | |
| 12/31/2018 | | | 27.05 | | | | .39 | | | | (1.23 | ) | | | (.84 | ) | | | (.39 | ) | | | (1.02 | ) | | | (1.41 | ) | | | 24.80 | | | | (3.20 | ) | | | 75 | | | | 1.08 | | | | 1.44 | |
| 12/31/2017 | | | 24.74 | | | | .35 | | | | 3.31 | | | | 3.66 | | | | (.37 | ) | | | (.98 | ) | | | (1.35 | ) | | | 27.05 | | | | 14.89 | | | | 57 | | | | 1.08 | | | | 1.32 | |
| 12/31/2016 | | | 23.77 | | | | .29 | | | | 1.62 | | | | 1.91 | | | | (.33 | ) | | | (.61 | ) | | | (.94 | ) | | | 24.74 | | | | 8.10 | | | | 17 | | | | 1.08 | | | | 1.18 | |
| 12/31/2015 | | | 24.75 | | | | .29 | | | | .10 | | | | .39 | | | | (.43 | ) | | | (.94 | ) | | | (1.37 | ) | | | 23.77 | | | | 1.60 | | | | 2 | | | | .96 | | | | 1.22 | |
| 12/31/20146,11 | | | 25.81 | | | | .15 | | | | .41 | | | | .56 | | | | (.21 | ) | | | (1.41 | ) | | | (1.62 | ) | | | 24.75 | | | | 2.17 | 4,8 | | | — | 5 | | | .16 | 4,8 | | | .58 | 4,8 |
See end of table for footnotes.
Financial highlights(continued)
| | | | | | (Loss) income from
investment operations1 | | | Dividends and distributions | | | | | | | | | | | | | | | | |
| Period ended | | Net asset
value,
beginning
of period | | | Net
investment
income | | | Net (losses)
gains on
securities
(both
realized and
unrealized) | | | Total from
investment
operations | | | Dividends
(from net
investment
income) | | | Distributions
(from capital
gains) | | | Total
dividends
and
distributions | | | Net asset
value,
end
of period | | | Total
return2 | | | Net assets,
end of period
(in millions) | | | Ratio of
expenses to
average
net assets | | | Ratio of
net income
to average
net assets | |
| Class R-3: | | | | | | | | | | | | | | | | | | | | | | | | | | | | | | | | | | | | |
| 12/31/2018 | | $ | 27.01 | | | $ | .43 | | | $ | (1.23 | ) | | $ | (.80 | ) | | $ | (.42 | ) | | $ | (1.02 | ) | | $ | (1.44 | ) | | $ | 24.77 | | | | (3.04 | )% | $ | | 2,992 | | | | .93 | % | | | 1.57 | % |
| 12/31/2017 | | | 24.69 | | | | .38 | | | | 3.31 | | | | 3.69 | | | | (.39 | ) | | | (.98 | ) | | | (1.37 | ) | | | 27.01 | | | | 15.05 | | | | 3,460 | | | | .93 | | | | 1.44 | |
| 12/31/2016 | | | 23.72 | | | | .32 | | | | 1.62 | | | | 1.94 | | | | (.36 | ) | | | (.61 | ) | | | (.97 | ) | | | 24.69 | | | | 8.24 | | | | 3,349 | | | | .93 | | | | 1.33 | |
| 12/31/2015 | | | 24.65 | | | | .33 | | | | (.01 | ) | | | .32 | | | | (.31 | ) | | | (.94 | ) | | | (1.25 | ) | | | 23.72 | | | | 1.34 | | | | 3,170 | | | | .93 | | | | 1.35 | |
| 12/31/2014 | | | 24.32 | | | | .32 | | | | 1.75 | | | | 2.07 | | | | (.30 | ) | | | (1.44 | ) | | | (1.74 | ) | | | 24.65 | | | | 8.51 | | | | 3,315 | | | | .94 | | | | 1.28 | |
| Class R-4: | | | | | | | | | | | | | | | | | | | | | | | | | | | | | | | | | | | | | | | | | | | | | | | | |
| 12/31/2018 | | | 27.10 | | | | .51 | | | | (1.24 | ) | | | (.73 | ) | | | (.50 | ) | | | (1.02 | ) | | | (1.52 | ) | | | 24.85 | | | | (2.77 | ) | | | 5,667 | | | | .63 | | | | 1.87 | |
| 12/31/2017 | | | 24.76 | | | | .46 | | | | 3.33 | | | | 3.79 | | | | (.47 | ) | | | (.98 | ) | | | (1.45 | ) | | | 27.10 | | | | 15.44 | | | | 6,353 | | | | .63 | | | | 1.74 | |
| 12/31/2016 | | | 23.80 | | | | .40 | | | | 1.60 | | | | 2.00 | | | | (.43 | ) | | | (.61 | ) | | | (1.04 | ) | | | 24.76 | | | | 8.50 | | | | 5,930 | | | | .64 | | | | 1.63 | |
| 12/31/2015 | | | 24.72 | | | | .41 | | | | — | 3 | | | .41 | | | | (.39 | ) | | | (.94 | ) | | | (1.33 | ) | | | 23.80 | | | | 1.67 | | | | 4,431 | | | | .63 | | | | 1.65 | |
| 12/31/2014 | | | 24.38 | | | | .40 | | | | 1.75 | | | | 2.15 | | | | (.37 | ) | | | (1.44 | ) | | | (1.81 | ) | | | 24.72 | | | | 8.85 | | | | 4,385 | | | | .64 | | | | 1.58 | |
| Class R-5E: | | | | | | | | | | | | | | | | | | | | | | | | | | | | | | | | | | | | | | | | | | | | | | | | |
| 12/31/2018 | | | 27.12 | | | | .60 | | | | (1.27 | ) | | | (.67 | ) | | | (.55 | ) | | | (1.02 | ) | | | (1.57 | ) | | | 24.88 | | | | (2.58 | ) | | | 168 | | | | .40 | | | | 2.19 | |
| 12/31/2017 | | | 24.78 | | | | .52 | | | | 3.33 | | | | 3.85 | | | | (.53 | ) | | | (.98 | ) | | | (1.51 | ) | | | 27.12 | | | | 15.70 | | | | 32 | | | | .41 | | | | 1.93 | |
| 12/31/2016 | | | 23.82 | | | | .48 | | | | 1.56 | | | | 2.04 | | | | (.47 | ) | | | (.61 | ) | | | (1.08 | ) | | | 24.78 | | | | 8.65 | | | | 2 | | | | .42 | | | | 1.94 | |
| 12/31/20156,12 | | | 25.09 | | | | .05 | | | | (.36 | ) | | | (.31 | ) | | | (.12 | ) | | | (.84 | ) | | | (.96 | ) | | | 23.82 | | | | (1.21 | )8 | | | — | 5 | | | .05 | 8 | | | .20 | 8 |
| Class R-5: | | | | | | | | | | | | | | | | | | | | | | | | | | | | | | | | | | | | | | | | | | | | | | | | |
| 12/31/2018 | | | 27.18 | | | | .59 | | | | (1.23 | ) | | | (.64 | ) | | | (.59 | ) | | | (1.02 | ) | | | (1.61 | ) | | | 24.93 | | | | (2.47 | ) | | | 1,809 | | | | .33 | | | | 2.17 | |
| 12/31/2017 | | | 24.83 | | | | .54 | | | | 3.34 | | | | 3.88 | | | | (.55 | ) | | | (.98 | ) | | | (1.53 | ) | | | 27.18 | | | | 15.78 | | | | 2,090 | | | | .33 | | | | 2.04 | |
| 12/31/2016 | | | 23.85 | | | | .47 | | | | 1.62 | | | | 2.09 | | | | (.50 | ) | | | (.61 | ) | | | (1.11 | ) | | | 24.83 | | | | 8.88 | | | | 1,986 | | | | .34 | | | | 1.91 | |
| 12/31/2015 | | | 24.77 | | | | .48 | | | | — | 3 | | | .48 | | | | (.46 | ) | | | (.94 | ) | | | (1.40 | ) | | | 23.85 | | | | 1.98 | | | | 2,571 | | | | .34 | | | | 1.94 | |
| 12/31/2014 | | | 24.43 | | | | .47 | | | | 1.76 | | | | 2.23 | | | | (.45 | ) | | | (1.44 | ) | | | (1.89 | ) | | | 24.77 | | | | 9.16 | | | | 2,616 | | | | .34 | | | | 1.88 | |
| Class R-6: | | | | | | | | | | | | | | | | | | | | | | | | | | | | | | | | | | | | | | | | | | | | | | | | |
| 12/31/2018 | | | 27.16 | | | | .61 | | | | (1.24 | ) | | | (.63 | ) | | | (.60 | ) | | | (1.02 | ) | | | (1.62 | ) | | | 24.91 | | | | (2.42 | ) | | | 19,971 | | | | .28 | | | | 2.23 | |
| 12/31/2017 | | | 24.81 | | | | .56 | | | | 3.33 | | | | 3.89 | | | | (.56 | ) | | | (.98 | ) | | | (1.54 | ) | | | 27.16 | | | | 15.84 | | | | 18,238 | | | | .28 | | | | 2.10 | |
| 12/31/2016 | | | 23.84 | | | | .48 | | | | 1.61 | | | | 2.09 | | | | (.51 | ) | | | (.61 | ) | | | (1.12 | ) | | | 24.81 | | | | 8.90 | | | | 11,058 | | | | .29 | | | | 1.98 | |
| 12/31/2015 | | | 24.76 | | | | .49 | | | | — | 3 | | | .49 | | | | (.47 | ) | | | (.94 | ) | | | (1.41 | ) | | | 23.84 | | | | 2.02 | | | | 7,290 | | | | .29 | | | | 1.99 | |
| 12/31/2014 | | | 24.42 | | | | .49 | | | | 1.75 | | | | 2.24 | | | | (.46 | ) | | | (1.44 | ) | | | (1.90 | ) | | | 24.76 | | | | 9.22 | | | | 6,076 | | | | .29 | | | | 1.93 | |
| | | Year ended December 31 |
| Portfolio turnover rate for all share classes13 | | 2018 | | 2017 | | 2016 | | 2015 | | 2014 |
| Excluding mortgage dollar roll transactions | | | 72% | | | | 58% | | | | 48% | | | | 45% | | | | 48% | |
| Including mortgage dollar roll transactions | | | 105% | | | | 95% | | | | 79% | | | | 82% | | | | 68% | |
| 1 | Based on average shares outstanding. |
| 2 | Total returns exclude any applicable sales charges, including contingent deferred sales charges. |
| 3 | Amount less than $.01. |
| 4 | All or a significant portion of assets in this class consisted of seed capital invested by CRMC and/or its affiliates. Fees for distribution services are not charged or accrued on these seed capital assets. If such fees were paid by the fund on seed capital assets, fund expenses would have been higher and net income and total return would have been lower. |
| 5 | Amount less than $1 million. |
| 6 | Based on operations for a period that is less than a full year. |
| 7 | Class T and 529-T shares began investment operations on April 7, 2017. |
| 8 | Not annualized. |
| 9 | Annualized. |
| 10 | Class F-3 shares began investment operations on January 27, 2017. |
| 11 | Class R-2E shares began investment operations on August 29, 2014. |
| 12 | Class R-5E shares began investment operations on November 20, 2015. |
| 13 | Refer to Note 5 for more information on mortgage dollar rolls. |
See notes to financial statements
Report of Independent Registered Public Accounting Firm
To the Shareholders and Board of Trustees of American Balanced Fund:
Opinion on the Financial Statements and Financial Highlights
We have audited the accompanying statement of assets and liabilities of American Balanced Fund (the “Fund”), including the summary investment portfolio, as of December 31, 2018, the related statement of operations for the year then ended, the statements of changes in net assets for each of the two years in the period then ended, the financial highlights for each of the five years in the period then ended, and the related notes. In our opinion, the financial statements and financial highlights present fairly, in all material respects, the financial position of the Fund as of December 31, 2018, and the results of its operations for the year then ended, the changes in its net assets for each of the two years in the period then ended, and the financial highlights for each of the five years in the period then ended, in conformity with accounting principles generally accepted in the United States of America.
Basis for Opinion
These financial statements and financial highlights are the responsibility of the Fund’s management. Our responsibility is to express an opinion on the Fund’s financial statements and financial highlights based on our audits. We are a public accounting firm registered with the Public Company Accounting Oversight Board (United States) (PCAOB) and are required to be independent with respect to the Fund in accordance with the U.S. federal securities laws and the applicable rules and regulations of the Securities and Exchange Commission and the PCAOB.
We conducted our audits in accordance with the standards of the PCAOB. Those standards require that we plan and perform the audit to obtain reasonable assurance about whether the financial statements and financial highlights are free of material misstatement, whether due to error or fraud. The Fund is not required to have, nor were we engaged to perform, an audit of its internal control over financial reporting. As part of our audits we are required to obtain an understanding of internal control over financial reporting but not for the purpose of expressing an opinion on the effectiveness of the Fund’s internal control over financial reporting. Accordingly, we express no such opinion.
Our audits included performing procedures to assess the risks of material misstatement of the financial statements and financial highlights, whether due to error or fraud, and performing procedures that respond to those risks. Such procedures included examining, on a test basis, evidence regarding the amounts and disclosures in the financial statements and financial highlights. Our audits also included evaluating the accounting principles used and significant estimates made by management, as well as evaluating the overall presentation of the financial statements and financial highlights. Our procedures included confirmation of securities owned as of December 31, 2018, by correspondence with the custodian and brokers; when replies were not received from brokers, we performed other auditing procedures. We believe that our audits provide a reasonable basis for our opinion.
Deloitte & Touche LLP
Costa Mesa, California
February 8, 2019
We have served as the auditor of one or more American Funds investment companies since 1956.
As a fund shareholder, you incur two types of costs: (1) transaction costs, such as initial sales charges on purchase payments and contingent deferred sales charges on redemptions (loads), and (2) ongoing costs, including management fees, distribution and service (12b-1) fees, and other expenses. This example is intended to help you understand your ongoing costs (in dollars) of investing in the fund so you can compare these costs with the ongoing costs of investing in other mutual funds. The example is based on an investment of $1,000 invested at the beginning of the period and held for the entire six-month period (July 1, 2018, through December 31, 2018).
Actual expenses:
The first line of each share class in the table on the following page provides information about actual account values and actual expenses. You may use the information in this line, together with the amount you invested, to estimate the expenses that you paid over the period. Simply divide your account value by $1,000 (for example, an $8,600 account value divided by $1,000 = 8.6), then multiply the result by the number in the first line under the heading titled “Expenses paid during period” to estimate the expenses you paid on your account during this period.
Hypothetical example for comparison purposes:
The second line of each share class in the table on the following page provides information about hypothetical account values and hypothetical expenses based on the actual expense ratio for the share class and an assumed rate of return of 5.00% per year before expenses, which is not the actual return of the share class. The hypothetical account values and expenses may not be used to estimate the actual ending account balance or expenses you paid for the period. You may use this information to compare the ongoing costs of investing in the fund and other funds. To do so, compare this 5.00% hypothetical example with the 5.00% hypothetical examples that appear in the shareholder reports of the other funds.
Notes:
Retirement plan participants may be subject to certain fees charged by the plan sponsor, and Class F-1, F-2, F-3 and 529-F-1 shareholders may be subject to fees charged by financial intermediaries, typically ranging from 0.75% to 1.50% of assets annually depending on services offered. You can estimate the impact of these fees by adding the amount of the fees to the total estimated expenses you paid on your account during the period as calculated above. In addition, your ending account value would be lower by the amount of these fees.
Note that the expenses shown in the table on the following page are meant to highlight your ongoing costs only and do not reflect any transactional costs, such as sales charges (loads). Therefore, the second line of each share class in the table is useful in comparing ongoing costs only and will not help you determine the relative total costs of owning different funds. In addition, if these transactional costs were included, your costs would have been higher.
| | | Beginning
account value
7/1/2018 | | | Ending
account value
12/31/2018 | | | Expenses paid
during period* | | | Annualized
expense ratio | |
| Class A – actual return | | $ | 1,000.00 | | | $ | 964.58 | | | $ | 2.82 | | | | .57 | % |
| Class A – assumed 5% return | | | 1,000.00 | | | | 1,022.33 | | | | 2.91 | | | | .57 | |
| Class C – actual return | | | 1,000.00 | | | | 960.88 | | | | 6.67 | | | | 1.35 | |
| Class C – assumed 5% return | | | 1,000.00 | | | | 1,018.40 | | | | 6.87 | | | | 1.35 | |
| Class T – actual return | | | 1,000.00 | | | | 965.65 | | | | 1.73 | | | | .35 | |
| Class T – assumed 5% return | | | 1,000.00 | | | | 1,023.44 | | | | 1.79 | | | | .35 | |
| Class F-1 – actual return | | | 1,000.00 | | | | 964.17 | | | | 3.17 | | | | .64 | |
| Class F-1 – assumed 5% return | | | 1,000.00 | | | | 1,021.98 | | | | 3.26 | | | | .64 | |
| Class F-2 – actual return | | | 1,000.00 | | | | 965.14 | | | | 1.88 | | | | .38 | |
| Class F-2 – assumed 5% return | | | 1,000.00 | | | | 1,023.29 | | | | 1.94 | | | | .38 | |
| Class F-3 – actual return | | | 1,000.00 | | | | 965.98 | | | | 1.44 | | | | .29 | |
| Class F-3 – assumed 5% return | | | 1,000.00 | | | | 1,023.74 | | | | 1.48 | | | | .29 | |
| Class 529-A – actual return | | | 1,000.00 | | | | 964.10 | | | | 3.22 | | | | .65 | |
| Class 529-A – assumed 5% return | | | 1,000.00 | | | | 1,021.93 | | | | 3.31 | | | | .65 | |
| Class 529-C – actual return | | | 1,000.00 | | | | 960.39 | | | | 6.87 | | | | 1.39 | |
| Class 529-C – assumed 5% return | | | 1,000.00 | | | | 1,018.20 | | | | 7.07 | | | | 1.39 | |
| Class 529-E – actual return | | | 1,000.00 | | | | 962.92 | | | | 4.35 | | | | .88 | |
| Class 529-E – assumed 5% return | | | 1,000.00 | | | | 1,020.77 | | | | 4.48 | | | | .88 | |
| Class 529-T – actual return | | | 1,000.00 | | | | 965.35 | | | | 2.03 | | | | .41 | |
| Class 529-T – assumed 5% return | | | 1,000.00 | | | | 1,023.14 | | | | 2.09 | | | | .41 | |
| Class 529-F-1 – actual return | | | 1,000.00 | | | | 965.31 | | | | 2.03 | | | | .41 | |
| Class 529-F-1 – assumed 5% return | | | 1,000.00 | | | | 1,023.14 | | | | 2.09 | | | | .41 | |
| Class R-1 – actual return | | | 1,000.00 | | | | 960.22 | | | | 6.82 | | | | 1.38 | |
| Class R-1 – assumed 5% return | | | 1,000.00 | | | | 1,018.25 | | | | 7.02 | | | | 1.38 | |
| Class R-2 – actual return | | | 1,000.00 | | | | 960.70 | | | | 6.82 | | | | 1.38 | |
| Class R-2 – assumed 5% return | | | 1,000.00 | | | | 1,018.25 | | | | 7.02 | | | | 1.38 | |
| Class R-2E – actual return | | | 1,000.00 | | | | 961.92 | | | | 5.39 | | | | 1.09 | |
| Class R-2E – assumed 5% return | | | 1,000.00 | | | | 1,019.71 | | | | 5.55 | | | | 1.09 | |
| Class R-3 – actual return | | | 1,000.00 | | | | 962.91 | | | | 4.60 | | | | .93 | |
| Class R-3 – assumed 5% return | | | 1,000.00 | | | | 1,020.52 | | | | 4.74 | | | | .93 | |
| Class R-4 – actual return | | | 1,000.00 | | | | 964.18 | | | | 3.12 | | | | .63 | |
| Class R-4 – assumed 5% return | | | 1,000.00 | | | | 1,022.03 | | | | 3.21 | | | | .63 | |
| Class R-5E – actual return | | | 1,000.00 | | | | 965.12 | | | | 1.98 | | | | .40 | |
| Class R-5E – assumed 5% return | | | 1,000.00 | | | | 1,023.19 | | | | 2.04 | | | | .40 | |
| Class R-5 – actual return | | | 1,000.00 | | | | 965.79 | | | | 1.64 | | | | .33 | |
| Class R-5 – assumed 5% return | | | 1,000.00 | | | | 1,023.54 | | | | 1.68 | | | | .33 | |
| Class R-6 – actual return | | | 1,000.00 | | | | 966.01 | | | | 1.39 | | | | .28 | |
| Class R-6 – assumed 5% return | | | 1,000.00 | | | | 1,023.79 | | | | 1.43 | | | | .28 | |
| * | The “expenses paid during period” are equal to the “annualized expense ratio,” multiplied by the average account value over the period, multiplied by the number of days in the period, and divided by 365 (to reflect the one-half year period). |
We are required to advise you of the federal tax status of certain distributions received by shareholders during the fiscal year. The fund hereby designates the following amounts for the fund’s fiscal year ended December 31, 2018:
| Long-term capital gains | $ | 5,357,477,000 |
| Qualified dividend income | $ | 1,561,874,000 |
| Corporate dividends received deduction | $ | 1,191,121,000 |
| U.S. government income that may be exempt from state taxation | | $396,825,000 |
Individual shareholders should refer to their Form 1099 or other tax information, which was mailed in January 2019, to determine thecalendar yearamounts to be included on their 2018 tax returns. Shareholders should consult their tax advisors.
Approval of Investment Advisory and Service Agreement
American Balanced Fund’s board has approved the fund’s Investment Advisory and Service Agreement (the “agreement”) with Capital Research and Management Company (“CRMC”) for an additional one-year term through January 31, 2020. The agreement was amended to add additional advisory fee breakpoints if and when the fund’s net assets exceed $144 billion. The board approved the agreement following the recommendation of the fund’s Contracts Committee (the “committee”), which is composed of all of the fund’s independent board members. The board and the committee determined in the exercise of their business judgment that the fund’s advisory fee structure was fair and reasonable in relation to the services provided, and that approving the agreement was in the best interests of the fund and its shareholders.
In reaching this decision, the board and the committee took into account information furnished to them throughout the year and otherwise provided to them, as well as information prepared specifically in connection with their review of the agreement, and were advised by their independent counsel. They considered the following factors, among others, but did not identify any single issue or particular piece of information that, in isolation, was the controlling factor, and each board and committee member did not necessarily attribute the same weight to each factor.
1. Nature, extent and quality of services
The board and the committee considered the depth and quality of CRMC’s investment management process, including its global research capabilities; the experience, capability and integrity of its senior management and other personnel; the low turnover rates of its key personnel; the overall financial strength and stability of CRMC and the Capital Group organization; the resources and systems CRMC devotes to investment management, compliance, trading, portfolio accounting and other services; and the ongoing evolution of CRMC’s organizational structure designed to maintain and strengthen these qualities. The board and the committee also considered the nature, extent and quality of administrative, compliance and shareholder services provided by CRMC to the fund under the agreement and other agreements, as well as the benefits to fund shareholders from investing in a fund that is part of a large family of funds. The board and the committee concluded that the nature, extent and quality of the services provided by CRMC have benefited and should continue to benefit the fund and its shareholders.
2. Investment results
The board and the committee considered the investment results of the fund in light of its objectives of providing conservation of capital, current income and long-term growth of capital and income. They compared the fund’s investment results with those of other funds (including funds that currently form the basis of the Lipper index for the category in which the fund is included), and data such as relevant market and fund indexes, over various periods through July 31, 2018. This report, including the letter to shareholders and related disclosures, contains certain information about the fund’s investment results. The board and the committee reviewed the fund’s investment results measured against various indexes, including the Lipper Balanced Funds Index, Standard & Poor’s 500 Composite Index, the Bloomberg Barclays U.S. Aggregate Index and a customized index comprising 60% of the S&P 500 Index and 40% of the Bloomberg Barclays Index (adjusted for fund expenses). They reviewed the results for the one-year, three-year, five-year, 10-year, 20-year and lifetime periods, and placed greater emphasis on longer term periods. They noted that the investment results of the fund generally exceeded those of these indexes for the lifetime, 20-year, 10-year and five-year periods, with the exception of the S&P 500 Index. The board and the committee concluded that the fund’s investment results have been satisfactory for renewal of the agreement, and that CRMC’s record in managing the fund indicated that its continued management should benefit the fund and its shareholders.
3. Advisory fees and total expenses
The board and the committee compared the advisory fees and total expense levels of the fund to those of other relevant funds. They observed that the fund’s advisory fees and expenses generally compared favorably to those of other similar funds included in the Lipper Balanced Funds category. The board and the committee also considered the breakpoint discounts in the fund’s advisory fee structure that reduce the level of fees charged by CRMC to the fund as fund assets increase. In addition, they reviewed information regarding the effective advisory fees charged to non-mutual fund clients by CRMC and its affiliates. They noted that, to the extent there were differences between the advisory fees paid by the fund and the advisory fees paid by those clients, the differences appropriately reflected the investment, operational, regulatory and market differences between advising the fund and the other clients. The board and the committee concluded that the fund’s cost structure was fair and reasonable in relation to the services provided, and that the fund’s shareholders receive reasonable value in return for the advisory fees and other amounts paid to CRMC by the fund.
4. Ancillary benefits
The board and the committee considered a variety of other benefits that CRMC and its affiliates receive as a result of CRMC’s relationship with the fund and other American Funds, including fees for administrative services provided to certain share classes; fees paid to CRMC’s affiliated transfer agent; sales charges and distribution fees received and retained by the fund’s principal underwriter, an affiliate of CRMC; and possible ancillary benefits to CRMC and its institutional management affiliates in managing other investment vehicles. The board and the committee reviewed CRMC’s portfolio trading practices, noting that through December 31, 2018, CRMC benefited from receiving research obtained with commissions from portfolio transactions made on behalf of the fund and since that time has undertaken to bear the cost for such services. The board and the committee took these ancillary benefits into account in evaluating the reasonableness of the advisory fees and other amounts paid to CRMC by the fund.
5. Adviser financial information
The board and the committee reviewed information regarding CRMC’s costs of providing services to the American Funds, including personnel, systems and resources of investment, compliance, trading, accounting and other administrative operations. They considered CRMC’s costs and related cost allocation methodology as well as its willingness to invest in technology, infrastructure and staff to maintain and expand services and capabilities, respond to industry and regulatory developments, and attract and retain qualified personnel. They noted information regarding the compensation structure for CRMC’s investment professionals. They reviewed information on the profitability of the investment adviser and its affiliates. The board and the committee also compared CRMC’s profitability and compensation data to the reported results and data of several large, publicly held investment management companies. The board and the committee noted the competitiveness and cyclicality of both the mutual fund industry and the capital markets, and the importance in that environment of CRMC’s long-term profitability for maintaining its independence, company culture and management continuity. They further considered the breakpoint discounts in the fund’s advisory fee structure and CRMC’s sharing of potential economies of scale, or efficiencies, through breakpoints and other fee reductions and costs voluntarily absorbed. The board and the committee concluded that the fund’s advisory fee structure reflected a reasonable sharing of benefits between CRMC and the fund’s shareholders.
This page was intentionally left blank.
This page was intentionally left blank.
This page was intentionally left blank.
This page was intentionally left blank.
This page was intentionally left blank.
Board of trustees and other officers
Independent trustees1
| Name and year of birth | | Year first
elected
a trustee
of the fund2 | | Principal occupation(s) during past five years | | Number of
portfolios in fund
complex overseen
by trustee3 | | Other directorships4
held by trustee |
| William H. Baribault,1945 | | 2012 | | CEO and President, Richard Nixon Foundation; Chairman of the Board and CEO, Oakwood Enterprises (private investment and consulting) | | 81 | | General Finance Corporation |
| Michael C. Camuñez,1969 | | 2019 | | President and CEO, Monarch Global Strategies LLC, previously ManattJones Global Strategies (international consulting); former Assistant Secretary of Commerce, U.S. Department of Commerce | | 4 | | Edison International/ Southern California Edison |
| Vanessa C. L. Chang,1952 | | 2012 | | Former Director, EL & EL Investments (real estate) | | 17 | | Edison International; Sykes Enterprises; Transocean Ltd. |
| Linda Griego,1947 | | 2012 | | President and CEO, Griego Enterprises, Inc. (business management company) | | 7 | | AECOM; CBS Corporation |
| Leonade D. Jones,1947 | | 1993 | | Retired; former Treasurer, The Washington Post Company (retired 1996) | | 10 | | None |
| William D. Jones,1955 | | 2008 | | Real estate developer/owner, President and CEO, CityLink Investment Corporation (acquires, develops and manages real estate ventures in urban communities) and for the former City Scene Management Company (provides commercial asset management services) | | 18 | | Sempra Energy |
James J. Postl,1946
Chairman of the Board
(Independent and Non-Executive) | | 2007 | | Retired; former President and CEO, Pennzoil-Quaker State Company (automotive products and services) (retired 2002) | | 4 | | None |
| Josette Sheeran,1954 | | 2019 | | President and CEO, Asia Society; United Nations Special Envoy for Haiti | | 7 | | None |
| Margaret Spellings,1957 | | 2012 | | President, The University of North Carolina; former President, George W. Bush Foundation | | 82 | | None |
| Isaac Stein,1946 | | 2004 | | Private investor; former President, Waverley Associates (private investment fund); Chairman Emeritus of the Board of Trustees, Stanford University | | 4 | | None |
Interested trustees5,6
Name, year of birth and
position with fund | | Year first
elected
a trustee
or officer
of the fund2 | | Principal occupation(s) during past five years
and positions held with affiliated entities or
the principal underwriter of the fund | | Number of
portfolios in fund
complex overseen
by trustee3 | | Other directorships4
held by trustee |
Gregory D. Johnson,1963
Co-President | | 2003 | | Partner — Capital World Investors, Capital Research and Management Company; Director, Capital Research and Management Company | | 1 | | None |
Hilda L. Applbaum,1961
Senior Vice President | | 1999 | | Partner — Capital World Investors, Capital Research and Management Company | | 4 | | None |
The fund’s statement of additional information includes further details about fund trustees and is available without charge upon request by calling American Funds Service Company at (800) 421-4225 or by visiting the American Funds website at americanfunds.com. The address for all trustees and officers of the fund is 333 South Hope Street, Los Angeles, CA 90071, Attention: Secretary.
Other officers6
Name, year of birth and
position with fund | | Year first
elected
an officer
of the fund2 | | Principal occupation(s) during past five years and positions held with affiliated entities
or the principal underwriter of the fund |
Jeffrey T. Lager,1968
Co-President | | 2002 | | Partner — Capital International Investors, Capital Research and Management Company |
Donald H. Rolfe,1972
Executive Vice President | | 2012 | | Senior Vice President and Senior Counsel — Fund Business Management Group, Capital Research
and Management Company; Secretary, Capital Research and Management Company |
Paul R. Benjamin,1979
Senior Vice President | | 2014 | | Partner — Capital World Investors, Capital Research and Management Company |
James R. Mulally,1952
Senior Vice President | | 2009 | | Partner — Capital Fixed Income Investors, Capital Research and Management Company |
John R. Queen,1965
Senior Vice President | | 2018 | | Partner — Capital Fixed Income Investors, Capital Research and Management Company;
Senior Vice President — Private Client Services Division, Capital Bank and Trust Company7 |
Paul F. Roye,1953
Senior Vice President | | 2007 | | Director, Capital Research and Management Company; Senior Vice President and
Senior Counsel — Fund Business Management Group, Capital Research and Management Company |
John H. Smet,1956
Senior Vice President | | 2000 | | Partner — Capital Fixed Income Investors, Capital Research and Management Company;
Director, Capital Research and Management Company |
Richmond A. Wolf,1970
Senior Vice President | | 2014 | | Partner — Capital World Investors, Capital Research and Management Company |
Alan N. Berro,1960
Vice President | | 2010 | | Partner — Capital World Investors, Capital Research and Management Company;
Director, Capital Research and Management Company |
Michael W. Stockton,1967
Secretary | | 2014 | | Senior Vice President — Fund Business Management Group, Capital Research and Management Company |
Hong T. Le,1978
Treasurer | | 2016 | | Assistant Vice President — Investment Operations, Capital Research and Management Company;
Assistant Vice President — CIT Division, Capital Bank and Trust Company7 |
Courtney R. Taylor,1975
Assistant Secretary | | 2018 | | Assistant Vice President — Fund Business Management Group, Capital Research and Management
Company; Secretary, Capital Guardian Trust Company7 |
Brian C. Janssen,1972
Assistant Treasurer | | 2016 | | Vice President — Investment Operations, Capital Research and Management Company |
Dori Laskin,1951
Assistant Treasurer | | 2011 | | Vice President — Investment Operations, Capital Research and Management Company |
| 1 | The term independent trustee refers to a trustee who is not an “interested person” of the fund within the meaning of the Investment Company Act of 1940. |
| 2 | Trustees and officers of the fund serve until their resignation, removal or retirement. |
| 3 | Funds managed by Capital Research and Management Company or its affiliates. |
| 4 | This includes all directorships/trusteeships (other than those in the American Funds or other funds managed by Capital Research and Management Company or its affiliates) that are held by each trustee as a trustee or director of a public company or a registered investment company. |
| 5 | The term interested trustee refers to a trustee who is an “interested person” within the meaning of the Investment Company Act of 1940, on the basis of their affiliation with the fund’s investment adviser, Capital Research and Management Company, or affiliated entities (including the fund’s principal underwriter). |
| 6 | All of the trustees and/or officers listed, except Paul R. Benjamin, James R. Mulally and Richmond A. Wolf, are officers and/or directors/trustees of one or more of the other funds for which Capital Research and Management Company serves as investment adviser. |
| 7 | Company affiliated with Capital Research and Management Company. |
Board of trustees and other officers(continued)
Results of special meeting of shareholders
Held November 28, 2018
Shares outstanding (all classes) on August 31, 2018 (record date):
4,807,376,482
Total shares voting on November 28, 2018:
3,879,810,606 (80.7% of shares outstanding)
The proposal: to elect board members
| | | Votes for | | Percent
of shares
voting for | | Votes
withheld | | Percent
of shares
withheld |
| Hilda L. Applbaum | | 3,807,826,969 | | | 98.1 | % | | 71,983,637 | | | 1.9 | % |
| William H. Baribault | | 3,795,154,994 | | | 97.8 | | | 84,655,612 | | | 2.2 | |
| Michael C. Camuñez | | 3,801,664,901 | | | 98.0 | | | 78,145,705 | | | 2.0 | |
| Vanessa C. L. Chang | | 3,803,857,068 | | | 98.0 | | | 75,953,538 | | | 2.0 | |
| Linda Griego | | 3,803,120,679 | | | 98.0 | | | 76,689,926 | | | 2.0 | |
| Gregory D. Johnson | | 3,805,156,715 | | | 98.1 | | | 74,653,890 | | | 1.9 | |
| Leonade D. Jones | | 3,796,464,376 | | | 97.9 | | | 83,346,230 | | | 2.1 | |
| William D. Jones | | 3,801,193,689 | | | 98.0 | | | 78,616,917 | | | 2.0 | |
| James J. Postl | | 3,798,593,099 | | | 97.9 | | | 81,217,507 | | | 2.1 | |
| Josette Sheeran | | 3,806,582,052 | | | 98.1 | | | 73,228,554 | | | 1.9 | |
| Margaret Spellings | | 3,804,728,100 | | | 98.1 | | | 75,082,506 | | | 1.9 | |
| Isaac Stein | | 3,797,464,443 | | | 97.9 | | | 82,346,162 | | | 2.1 | |
Office of the fund
6455 Irvine Center Drive
Irvine, CA 92618-4518
Investment adviser
Capital Research and Management Company
333 South Hope Street
Los Angeles, CA 90071-1406
6455 Irvine Center Drive
Irvine, CA 92618-4518
Transfer agent for shareholder accounts
American Funds Service Company
(Write to the address near you.)
P.O. Box 6007
Indianapolis, IN 46206-6007
P.O. Box 2280
Norfolk, VA 23501-2280
Custodian of assets
JPMorgan Chase Bank
270 Park Avenue
New York, NY 10017-2070
Counsel
Morgan, Lewis & Bockius LLP
One Federal Street
Boston, MA 02110-1726
Independent registered public accounting firm
Deloitte & Touche LLP
695 Town Center Drive
Suite 1200
Costa Mesa, CA 92626-7188
Principal underwriter
American Funds Distributors, Inc.
333 South Hope Street
Los Angeles, CA 90071-1406
Investors should carefully consider investment objectives, risks, charges and expenses. This and other important information is contained in the fund prospectus and summary prospectus, which can be obtained from your financial professional and should be read carefully before investing. You may also call American Funds Service Company (AFS) at (800) 421-4225 or visit the American Funds website at americanfunds.com. Fund shares offered through American Funds Distributors, Inc.
“American Funds Proxy Voting Procedures and Principles” — which describes how we vote proxies relating to portfolio securities — is available on the American Funds website or upon request by calling AFS. The fund files its proxy voting record with the U.S. Securities and Exchange Commission (SEC) for the 12 months ended June 30 by August 31. The proxy voting record is available free of charge on the SEC website at sec.gov and on the American Funds website.
A complete December 31, 2018, portfolio of American Balanced Fund’s investments is available free of charge by calling AFS or visiting the SEC website (where it is part of Form N-CSR).
American Balanced Fund files a complete list of its portfolio holdings with the SEC for the first and third quarters of each fiscal year on Form N-Q. This filing is available free of charge on the SEC website. Additionally, the list of portfolio holdings is available by calling AFS.
This report is for the information of shareholders of American Balanced Fund, but it also may be used as sales literature when preceded or accompanied by the current prospectus or summary prospectus, which gives details about charges, expenses, investment objectives and operating policies of the fund. If used as sales material after March 31, 2019, this report must be accompanied by an American Funds statistical update for the most recently completed calendar quarter.
Bloomberg® is a trademark of Bloomberg Finance L.P. (collectively with its affiliates, “Bloomberg”). Barclays® is a trademark of Barclays Bank Plc (collectively with its affiliates, “Barclays”), used under license. Neither Bloomberg nor Barclays approves or endorses this material, guarantees the accuracy or completeness of any information herein and, to the maximum extent allowed by law, neither shall have any liability or responsibility for injury or damages arising in connection therewith.
The Standard & Poor’s 500 Composite Index is a product of S&P Dow Jones Indices LLC and/or its affiliates and has been licensed for use by Capital Group. Copyright © 2019 S&P Dow Jones Indices LLC, a division of S&P Global, and/or its affiliates. All rights reserved. Redistribution or reproduction in whole or in part is prohibited without written permission of S&P Dow Jones Indices LLC.
The Capital Advantage®
Since 1931, Capital Group, home of American Funds, has helped investors pursue long-term investment success. Our consistent approach — in combination with The Capital SystemSM— has resulted in a superior long-term track record.
Aligned with investor success
We base our decisions on a long-term perspective, which we believe aligns our goals with the interests of our clients. Our portfolio managers average 27 years of investment experience, including 20 years at our company, reflecting a career commitment to our long-term approach.1
The Capital System
The Capital System combines individual accountability with teamwork. Funds using The Capital System are divided into portions that are managed independently by investment professionals with diverse backgrounds, ages and investment approaches. An extensive global research effort is the backbone of our system.
American Funds’ superior long-term track record
Equity funds have beaten their Lipper peer indexes in 92% of 10-year periods and 99% of 20-year periods. Fixed income funds have beaten their Lipper indexes in 75% of 10-year periods and 80% of 20-year periods.2Fund management fees have been among the lowest in the industry.3
| 1 | Portfolio manager experience as of December 31, 2018. |
| 2 | Based on Class F-2 share results for rolling periods through December 31, 2018. Periods covered are the shorter of the fund’s lifetime or since the comparable Lipper index inception date (except Capital Income Builder and SMALLCAP World Fund, for which the Lipper average was used). Expenses differ for each share class, so results will vary. Class F-2 shares were first offered on August 1, 2008. Class F-2 share results prior to the date of first sale are hypothetical based on Class A share results without a sales charge, adjusted for typical estimated expenses. Results for certain funds with an inception date after August 1, 2008, also include hypothetical returns because those funds’ Class F-2 shares sold after the funds’ date of first offering. Please see americanfunds.com for more information on specific expense adjustments and the actual dates of first sale. |
| 3 | On average, our management fees were in the lowest quintile 70% of the time, based on the 20-year period ended December 31, 2018, versus comparable Lipper categories, excluding funds of funds. |
All Capital Group trademarks referenced are registered trademarks owned by The Capital Group Companies, Inc. or an affiliated company. All other company and product names mentioned are the trademarks or registered trademarks of their respective companies.

ITEM 2 – Code of Ethics
The Registrant has adopted a Code of Ethics that applies to its Principal Executive Officer and Principal Financial Officer. The Registrant undertakes to provide to any person without charge, upon request, a copy of the Code of Ethics. Such request can be made by calling 800/421-4225 or to the Secretary of the Registrant, 6455 Irvine Center Drive, Irvine, California 92618.
ITEM 3 – Audit Committee Financial Expert
The Registrant’s board has determined that Vanessa C. L. Chang, a member of the Registrant’s audit committee, is an “audit committee financial expert” and "independent," as such terms are defined in this Item. This designation will not increase the designee’s duties, obligations or liability as compared to his or her duties, obligations and liability as a member of the audit committee and of the board, nor will it reduce the responsibility of the other audit committee members. There may be other individuals who, through education or experience, would qualify as "audit committee financial experts" if the board had designated them as such. Most importantly, the board believes each member of the audit committee contributes significantly to the effective oversight of the Registrant’s financial statements and condition.
| ITEM 4 – Principal Accountant Fees and Services | AMBAL |
| | | |
| Registrant: | |
| a) Audit Fees: |
| | | |
| | 2017 | $141,000 |
| | 2018 | $12,000 |
| | |
| b) Audit-Related Fees: |
| | 2017 | $29,000 |
| | 2018 | $33,000 |
| | |
| c) Tax Fees: |
| | 2017 | $10,000 |
| | 2018 | $8,000 |
| | The tax fees consist of professional services relating to the preparation of the Registrant’s tax returns. |
| | |
| d) All Other Fees: |
| | 2017 | None |
| | 2018 | None |
| | |
| | Adviser and affiliates (includes only fees for non-audit services billed to the adviser and affiliates for engagements that relate directly to the operations and financial reporting of the Registrant and were subject to the pre-approval policies described below): |
| a) Audit Fees: |
| | Not Applicable |
| | |
| b) Audit-Related Fees: |
| | 2017 | $1,429,000 |
| | 2018 | $2,258,000 |
| | The audit-related fees consist of assurance and related services relating to the examination of the Registrant’s transfer agent, principal underwriter and investment adviser conducted in accordance with Statement on Standards for Attestation Engagements Number 16 issued by the American Institute of Certified Public Accountants. |
| | |
| c) Tax Fees: |
| | 2017 | None |
| | 2018 | None |
| | The tax fees consist of consulting services relating to the Registrant’s investments. |
| | | |
| | | |
| d) All Other Fees: |
| | 2017 | None |
| | 2018 | None |
| | The other fees consist of subscription services related to an accounting research tool. |
| | |
| | | |
| | All audit and permissible non-audit services that the Registrant’s audit committee considers compatible with maintaining the independent registered public accounting firm’s independence are required to be pre-approved by the committee. The pre-approval requirement will extend to all non-audit services provided to the Registrant, the investment adviser, and any entity controlling, controlled by, or under common control with the investment adviser that provides ongoing services to the Registrant, if the engagement relates directly to the operations and financial reporting of the Registrant. The committee will not delegate its responsibility to pre-approve these services to the investment adviser. The committee may delegate to one or more committee members the authority to review and pre-approve audit and permissible non-audit services. Actions taken under any such delegation will be reported to the full committee at its next meeting. The pre-approval requirement is waived with respect to non-audit services if certain conditions are met. The pre-approval requirement was not waived for any of the non-audit services listed above provided to the Registrant, adviser and affiliates. |
| | | |
| | Aggregate non-audit fees paid to the Registrant’s auditors, including fees for all services billed to the Registrant, adviser and affiliates that provide ongoing services to the Registrant, were $1,554,000 for fiscal year 2017 and $2,380,000 for fiscal year 2018. The non-audit services represented by these amounts were brought to the attention of the committee and considered to be compatible with maintaining the auditors’ independence. |
ITEM 5 – Audit Committee of Listed Registrants
Not applicable to this Registrant, insofar as the Registrant is not a listed issuer as defined in Rule 10A-3 under the Securities Exchange Act of 1934.
ITEM 6 – Schedule of Investments
American Balanced Fund®
Investment portfolio
December 31, 2018
Common stocks 58.96%
Information technology 11.61% | Shares | Value
(000) |
| Microsoft Corp. | 47,509,000 | $4,825,489 |
| Broadcom Inc. | 8,632,800 | 2,195,148 |
| Intel Corp. | 36,117,100 | 1,694,976 |
| Taiwan Semiconductor Manufacturing Co., Ltd. (ADR) | 42,389,000 | 1,564,578 |
| ASML Holding NV (New York registered) | 4,716,458 | 733,975 |
| ASML Holding NV | 1,845,000 | 289,944 |
| VeriSign, Inc.1 | 3,500,000 | 519,015 |
| Visa Inc., Class A | 3,753,000 | 495,171 |
| Symantec Corp. | 22,239,806 | 420,221 |
| Intuit Inc. | 1,800,000 | 354,330 |
| TE Connectivity Ltd. | 4,045,000 | 305,923 |
| Mastercard Inc., Class A | 1,535,000 | 289,578 |
| Apple Inc. | 1,365,000 | 215,315 |
| Workday, Inc., Class A1 | 865,000 | 138,123 |
| Analog Devices, Inc. | 1,440,000 | 123,595 |
| Amphenol Corp., Class A | 1,401,000 | 113,509 |
| Keyence Corp.2 | 213,000 | 108,080 |
| Jack Henry & Associates, Inc. | 813,000 | 102,861 |
| FleetCor Technologies, Inc.1 | 551,500 | 102,425 |
| Autodesk, Inc.1 | 756,000 | 97,229 |
| Samsung Electronics Co., Ltd., nonvoting preferred2 | 3,149,000 | 89,274 |
| | | 14,778,759 |
| Health care 8.89% | | |
| UnitedHealth Group Inc. | 12,926,500 | 3,220,250 |
| Merck & Co., Inc. | 18,350,000 | 1,402,123 |
| Cigna Corp. | 6,982,004 | 1,326,022 |
| Johnson & Johnson | 8,584,300 | 1,107,804 |
| Pfizer Inc. | 16,821,000 | 734,237 |
| Centene Corp.1 | 5,743,163 | 662,187 |
| Thermo Fisher Scientific Inc. | 1,849,300 | 413,855 |
| AbbVie Inc. | 3,835,000 | 353,549 |
| CVS Health Corp. | 4,645,349 | 304,363 |
| Hologic, Inc.1 | 7,005,000 | 287,905 |
| Boston Scientific Corp.1 | 6,350,000 | 224,409 |
| AstraZeneca PLC | 2,997,000 | 224,347 |
| Medtronic PLC | 2,040,000 | 185,558 |
| Gilead Sciences, Inc. | 2,750,000 | 172,013 |
| Teva Pharmaceutical Industries Ltd. (ADR) | 10,443,758 | 161,043 |
| ResMed Inc. | 1,313,000 | 149,511 |
| Humana Inc. | 454,000 | 130,062 |
| Bluebird Bio, Inc.1 | 1,205,000 | 119,536 |
| BioMarin Pharmaceutical Inc.1 | 1,018,000 | 86,683 |
| Vertex Pharmaceuticals Inc.1 | 313,300 | 51,917 |
| Regeneron Pharmaceuticals, Inc.1 | 15,500 | 5,789 |
| | | 11,323,163 |
American Balanced Fund — Page 1 of 33
Common stocks (continued)
Financials 7.84% | Shares | Value
(000) |
| Berkshire Hathaway Inc., Class A1 | 9,354 | $2,862,324 |
| Berkshire Hathaway Inc., Class B1 | 800,000 | 163,344 |
| JPMorgan Chase & Co. | 8,570,000 | 836,603 |
| Chubb Ltd. | 6,435,093 | 831,285 |
| BlackRock, Inc. | 1,874,000 | 736,145 |
| PNC Financial Services Group, Inc. | 5,447,000 | 636,809 |
| Wells Fargo & Co. | 12,679,500 | 584,271 |
| Capital One Financial Corp. | 6,368,047 | 481,361 |
| SunTrust Banks, Inc. | 7,395,000 | 373,004 |
| Bank of New York Mellon Corp. | 6,500,000 | 305,955 |
| Intercontinental Exchange, Inc. | 3,848,000 | 289,870 |
| Blackstone Group LP | 8,743,370 | 260,640 |
| CME Group Inc., Class A | 1,192,000 | 224,239 |
| Bank of America Corp. | 9,000,000 | 221,760 |
| Goldman Sachs Group, Inc. | 1,253,628 | 209,418 |
| Legal & General Group PLC | 70,000,000 | 206,103 |
| Citigroup Inc. | 3,750,000 | 195,225 |
| RenaissanceRe Holdings Ltd. | 973,000 | 130,090 |
| HDFC Bank Ltd. | 4,253,000 | 129,250 |
| Itaú Unibanco Holding SA, preferred nominative (ADR) | 13,997,500 | 127,937 |
| Moody’s Corp. | 393,000 | 55,036 |
| Aon PLC, Class A | 345,000 | 50,149 |
| Nasdaq, Inc. | 583,000 | 47,555 |
| Marsh & McLennan Companies, Inc. | 312,800 | 24,946 |
| | | 9,983,319 |
| Energy 6.41% | | |
| Royal Dutch Shell PLC, Class B (ADR) | 21,382,000 | 1,281,637 |
| Royal Dutch Shell PLC, Class B | 4,000,000 | 119,303 |
| Royal Dutch Shell PLC, Class A (ADR) | 497,977 | 29,017 |
| Royal Dutch Shell PLC, Class A | 130,129 | 3,827 |
| ConocoPhillips | 21,715,150 | 1,353,940 |
| EOG Resources, Inc. | 11,594,000 | 1,011,113 |
| Chevron Corp. | 9,094,755 | 989,418 |
| Enbridge Inc. | 14,018,194 | 435,685 |
| Enbridge Inc. (CAD denominated)3 | 4,808,645 | 149,381 |
| Enbridge Inc. (CAD denominated) | 155,997 | 4,846 |
| Suncor Energy Inc. | 15,381,346 | 429,601 |
| Concho Resources Inc.1 | 3,549,000 | 364,802 |
| Noble Energy, Inc. | 18,490,000 | 346,872 |
| Baker Hughes, a GE Co., Class A | 14,888,000 | 320,092 |
| Diamondback Energy, Inc. | 3,166,000 | 293,488 |
| Occidental Petroleum Corp. | 3,977,000 | 244,108 |
| Cabot Oil & Gas Corp. | 10,126,000 | 226,316 |
| Halliburton Co. | 6,000,000 | 159,480 |
| Exxon Mobil Corp. | 2,000,000 | 136,380 |
| Murphy Oil Corp. | 3,963,806 | 92,714 |
| Schlumberger Ltd. | 2,500,000 | 90,200 |
| Pioneer Natural Resources Co. | 500,000 | 65,760 |
| Weatherford International PLC1 | 20,000,000 | 11,180 |
| | | 8,159,160 |
American Balanced Fund — Page 2 of 33
Common stocks (continued)
Consumer discretionary 6.19% | Shares | Value
(000) |
| Home Depot, Inc. | 15,122,000 | $2,598,262 |
| NIKE, Inc., Class B | 24,165,000 | 1,791,593 |
| Amazon.com, Inc.1 | 691,500 | 1,038,612 |
| General Motors Co. | 11,570,000 | 387,017 |
| VF Corp. | 4,637,000 | 330,804 |
| Darden Restaurants, Inc. | 3,250,000 | 324,545 |
| McDonald’s Corp. | 1,700,000 | 301,869 |
| MGM Resorts International | 10,601,000 | 257,180 |
| Marriott International, Inc., Class A | 2,076,400 | 225,414 |
| LVMH Moët Hennessy-Louis Vuitton SE | 571,000 | 168,920 |
| Starbucks Corp. | 1,885,000 | 121,394 |
| Wynn Resorts, Ltd. | 1,003,000 | 99,207 |
| Carnival Corp., units | 2,000,000 | 98,600 |
| Hasbro, Inc. | 635,400 | 51,626 |
| Toll Brothers, Inc. | 1,565,000 | 51,535 |
| Booking Holdings Inc.1 | 11,200 | 19,291 |
| Las Vegas Sands Corp. | 175,000 | 9,109 |
| LKQ Corp.1 | 305,000 | 7,238 |
| | | 7,882,216 |
| Consumer staples 4.04% | | |
| Philip Morris International Inc. | 24,359,422 | 1,626,235 |
| Nestlé SA2 | 9,920,000 | 805,211 |
| Coca-Cola Co. | 15,990,000 | 757,126 |
| Altria Group, Inc. | 11,104,547 | 548,454 |
| Coca-Cola European Partners PLC | 5,040,000 | 231,084 |
| Sysco Corp. | 3,379,000 | 211,728 |
| Procter & Gamble Co. | 1,750,000 | 160,860 |
| Costco Wholesale Corp. | 695,000 | 141,578 |
| Walgreens Boots Alliance, Inc. | 1,900,000 | 129,827 |
| British American Tobacco PLC | 2,845,000 | 90,656 |
| British American Tobacco PLC (ADR) | 1,100,000 | 35,046 |
| Constellation Brands, Inc., Class A | 733,000 | 117,881 |
| General Mills, Inc. | 3,000,000 | 116,820 |
| Kellogg Co. | 1,650,000 | 94,067 |
| Anheuser-Busch InBev SA/NV | 1,100,000 | 72,721 |
| | | 5,139,294 |
| Communication services 3.48% | | |
| Comcast Corp., Class A | 42,355,000 | 1,442,188 |
| Alphabet Inc., Class C1 | 846,200 | 876,333 |
| Alphabet Inc., Class A1 | 371,900 | 388,621 |
| Facebook, Inc., Class A1 | 5,033,000 | 659,776 |
| Activision Blizzard, Inc. | 6,383,000 | 297,256 |
| Charter Communications, Inc., Class A1 | 842,100 | 239,973 |
| CBS Corp., Class B | 4,770,000 | 208,544 |
| Netflix, Inc.1 | 607,000 | 162,470 |
| Nintendo Co., Ltd.2 | 364,000 | 96,921 |
| Verizon Communications Inc. | 734,000 | 41,266 |
| SoftBank Group Corp.2 | 195,000 | 12,977 |
| | | 4,426,325 |
American Balanced Fund — Page 3 of 33
Common stocks (continued)
Materials 3.28% | Shares | Value
(000) |
| DowDuPont Inc. | 30,358,500 | $1,623,572 |
| LyondellBasell Industries NV | 6,484,100 | 539,218 |
| Sherwin-Williams Co. | 1,076,400 | 423,520 |
| Linde PLC | 2,667,000 | 416,159 |
| Royal Gold, Inc.4 | 4,254,500 | 364,398 |
| Nucor Corp. | 2,500,000 | 129,525 |
| Rio Tinto PLC | 2,500,000 | 118,856 |
| Norsk Hydro ASA2 | 20,518,637 | 93,242 |
| Newmont Mining Corp. | 2,612,000 | 90,506 |
| Alcoa Corp.1 | 3,388,000 | 90,053 |
| Steel Dynamics, Inc. | 2,782,000 | 83,571 |
| Shin-Etsu Chemical Co., Ltd.2 | 1,011,100 | 78,662 |
| Glencore PLC | 17,955,000 | 66,677 |
| Vale SA, ordinary nominative (ADR) | 4,319,000 | 56,968 |
| | | 4,174,927 |
| Industrials 3.25% | | |
| Boeing Co. | 3,374,400 | 1,088,244 |
| Lockheed Martin Corp. | 4,080,000 | 1,068,307 |
| Northrop Grumman Corp. | 2,072,500 | 507,555 |
| United Parcel Service, Inc., Class B | 3,980,000 | 388,169 |
| CSX Corp. | 3,210,000 | 199,437 |
| FedEx Corp. | 1,200,000 | 193,596 |
| Cummins Inc. | 1,250,000 | 167,050 |
| Union Pacific Corp. | 1,025,000 | 141,686 |
| Safran SA | 1,149,000 | 138,756 |
| TransDigm Group Inc.1 | 380,000 | 129,223 |
| Parker-Hannifin Corp. | 820,000 | 122,295 |
| | | 4,144,318 |
| Real estate 3.10% | | |
| Simon Property Group, Inc. REIT | 8,359,000 | 1,404,228 |
| Crown Castle International Corp. REIT | 5,822,802 | 632,531 |
| Equinix, Inc. REIT | 1,125,000 | 396,630 |
| American Tower Corp. REIT | 2,478,000 | 391,995 |
| Iron Mountain Inc. REIT | 10,166,200 | 329,487 |
| Digital Realty Trust, Inc. REIT | 2,891,000 | 308,036 |
| AGNC Investment Corp. REIT | 8,363,000 | 146,687 |
| Ventas, Inc. REIT | 2,464,400 | 144,389 |
| Sun Communities, Inc. REIT | 1,000,000 | 101,710 |
| Public Storage REIT | 359,000 | 72,665 |
| Gaming and Leisure Properties, Inc. REIT | 560,000 | 18,094 |
| | | 3,946,452 |
| Utilities 0.87% | | |
| Public Service Enterprise Group Inc. | 11,650,439 | 606,405 |
| DTE Energy Co. | 2,311,000 | 254,903 |
| Dominion Energy, Inc. | 1,500,000 | 107,190 |
| Pinnacle West Capital Corp. | 1,000,000 | 85,200 |
| CMS Energy Corp. | 997,900 | 49,546 |
| | | 1,103,244 |
| Total common stocks (cost: $56,010,157,000) | | 75,061,177 |
American Balanced Fund — Page 4 of 33
Preferred securities 0.00%
Financials 0.00% | Shares | Value
(000) |
| CoBank, ACB, Class E, noncumulative3 | 7,440 | $4,501 |
| Total preferred securities (cost: $5,208,000) | | 4,501 |
Convertible stocks 0.08%
Real estate 0.08% | | |
| Crown Castle International Corp. REIT, Series A, 6.875% convertible preferred 2020 | 100,000 | 105,225 |
| Total convertible stocks (cost: $105,498,000) | | 105,225 |
Bonds, notes & other debt instruments 35.01%
Corporate bonds & notes 13.00%
Financials 3.90% | Principal amount
(000) | |
| ACE INA Holdings Inc. 2.30% 2020 | $7,635 | 7,528 |
| ACE INA Holdings Inc. 2.875% 2022 | 22,180 | 22,003 |
| ACE INA Holdings Inc. 3.35% 2026 | 5,180 | 5,075 |
| American Express Co. 2.20% 2020 | 29,000 | 28,484 |
| American Express Co. 3.375% 2021 | 25,000 | 25,053 |
| American Express Co. 3.00% 2024 | 37,500 | 35,998 |
| American International Group, Inc. 4.20% 2028 | 14,285 | 13,817 |
| AXA Equitable Holdings, Inc. 3.90% 20233 | 8,105 | 8,012 |
| AXA SA, Series B, junior subordinated 6.379% (undated)3,5 | 2,000 | 1,980 |
| Bank of America Corp. 2.625% 2020 | 20,000 | 19,792 |
| Bank of America Corp. 2.738% 2022 (3-month USD-LIBOR + 0.37% on 1/23/2021)5 | 38,000 | 37,433 |
| Bank of America Corp. 2.816% 2023 (3-month USD-LIBOR + 0.93% on 7/21/2022)5 | 30,500 | 29,515 |
| Bank of America Corp. 3.004% 2023 (3-month USD-LIBOR + 0.79% on 12/20/2022)5 | 23,550 | 22,876 |
| Bank of America Corp. 3.124% 2023 (3-month USD-LIBOR + 1.16% on 1/20/2022)5 | 28,000 | 27,539 |
| Bank of America Corp. 3.55% 2024 (3-month USD-LIBOR + 0.78% on 3/5/2023)5 | 201,704 | 199,368 |
| Bank of America Corp. 3.248% 2027 | 11,250 | 10,415 |
| Bank of America Corp. 3.419% 2028 (3-month USD-LIBOR + 1.04% on 12/20/2027)5 | 4,090 | 3,827 |
| Bank of America Corp. 3.593% 2028 (3-month USD-LIBOR + 1.37% on 7/21/2027)5 | 16,000 | 15,198 |
| Bank of America Corp. 3.97% 2029 (3-month USD-LIBOR + 1.07% on 3/5/2028)5 | 20,000 | 19,474 |
| Bank of America Corp. 4.271% 2029 (3-month USD-LIBOR + 1.31% on 7/23/2028)5 | 47,795 | 47,655 |
| Bank of Nova Scotia 2.50% 2021 | 31,500 | 31,112 |
| BB&T Corp. 2.45% 2020 | 37,000 | 36,750 |
| BB&T Corp. 2.625% 2022 | 22,500 | 22,096 |
| BB&T Corp. 2.75% 2022 | 22,887 | 22,515 |
| Berkshire Hathaway Finance Corp. 1.30% 2019 | 15,320 | 15,161 |
| Berkshire Hathaway Finance Corp. 4.20% 2048 | 31,575 | 31,498 |
| Berkshire Hathaway Inc. 2.75% 2023 | 5,000 | 4,911 |
| BNP Paribas 3.50% 20233 | 93,825 | 91,046 |
| BNP Paribas 3.375% 20253 | 48,228 | 45,466 |
| BNP Paribas 4.375% 20253 | 5,700 | 5,549 |
| BNP Paribas 4.375% 20263 | 6,350 | 6,123 |
| Capital One Financial Corp. 3.45% 2021 | 103,000 | 102,842 |
| Capital One Financial Corp. 3.20% 2023 | 20,000 | 19,480 |
| Capital One Financial Corp. 3.20% 2025 | 20,000 | 18,704 |
| Capital One Financial Corp. 4.25% 2025 | 45,000 | 44,747 |
| Carlyle Investment Management (1-month USD-LIBOR + 2.00%) 4.436% 20192,3,6,7,8 | 302 | 302 |
| Carlyle Investment Management (1-month USD-LIBOR + 2.00%) 4.436% 20192,3,6,7,8 | 230 | 230 |
| Charles Schwab Corp. 3.45% 2026 | 1,616 | 1,604 |
| Citigroup Inc. 2.35% 2021 | 20,500 | 19,926 |
| Citigroup Inc. 2.90% 2021 | 28,000 | 27,565 |
American Balanced Fund — Page 5 of 33
Bonds, notes & other debt instruments (continued)
Corporate bonds & notes (continued)
Financials (continued) | Principal amount
(000) | Value
(000) |
| Citigroup Inc. 2.876% 2023 (3-month USD-LIBOR + 0.95% on 7/24/2022)5 | $95,492 | $92,459 |
| Citigroup Inc. 3.142% 2023 (3-month USD-LIBOR + 0.722% on 1/4/2022)5 | 20,700 | 20,346 |
| Citigroup Inc. 3.875% 2023 | 38,183 | 38,333 |
| Citigroup Inc. 3.20% 2026 | 27,000 | 24,960 |
| Citigroup Inc. 4.65% 2048 | 12,160 | 11,948 |
| CME Group Inc. 3.75% 2028 | 25,175 | 25,558 |
| CME Group Inc. 5.30% 2043 | 3,135 | 3,672 |
| CME Group Inc. 4.15% 2048 | 12,000 | 12,203 |
| Commonwealth Bank of Australia 2.25% 20203 | 6,250 | 6,195 |
| Cooperatieve Rabobank UA 2.75% 2023 | 30,750 | 29,766 |
| Crédit Agricole SA 2.375% 20213 | 6,645 | 6,461 |
| Crédit Agricole SA 3.375% 20223 | 20,125 | 19,809 |
| Crédit Agricole SA 4.375% 20253 | 14,825 | 14,372 |
| Credit Suisse Group AG 3.80% 2022 | 6,802 | 6,758 |
| Credit Suisse Group AG 2.997% 2023 (3-month USD-LIBOR + 1.20% on 12/14/2022)3,5 | 22,600 | 21,524 |
| Credit Suisse Group AG 3.80% 2023 | 15,350 | 15,077 |
| Credit Suisse Group AG 3.869% 2029 (3-month USD-LIBOR + 1.41% on 1/12/2028)3,5 | 12,300 | 11,471 |
| Danske Bank AS 2.00% 20213 | 20,120 | 19,045 |
| Danske Bank AS 2.70% 20223 | 47,600 | 45,626 |
| Deutsche Bank AG 2.70% 2020 | 20,000 | 19,457 |
| Deutsche Bank AG 3.375% 2021 | 4,500 | 4,345 |
| Deutsche Bank AG 3.95% 2023 | 111,000 | 104,893 |
| Discover Financial Services 10.25% 2019 | 4,334 | 4,481 |
| Discover Financial Services 4.65% 2028 | 59,000 | 57,621 |
| DNB ASA 2.375% 20213 | 10,000 | 9,764 |
| Ford Motor Credit Co. 3.81% 2024 | 64,467 | 59,557 |
| General Motors Financial Co. 4.20% 2021 | 31,500 | 31,505 |
| General Motors Financial Co. 4.20% 2021 | 23,000 | 22,997 |
| General Motors Financial Co. 3.45% 2022 | 21,750 | 21,049 |
| General Motors Financial Co. 4.15% 2023 | 32,147 | 31,353 |
| General Motors Financial Co. 4.30% 2025 | 8,175 | 7,759 |
| Goldman Sachs Group, Inc. 2.55% 2019 | 11,000 | 10,933 |
| Goldman Sachs Group, Inc. (3-month USD-LIBOR + 1.36%) 3.850% 20218 | 25,782 | 25,982 |
| Goldman Sachs Group, Inc. 5.25% 2021 | 20,000 | 20,768 |
| Goldman Sachs Group, Inc. 3.00% 2022 | 75,000 | 72,664 |
| Goldman Sachs Group, Inc. 5.75% 2022 | 20,000 | 20,949 |
| Goldman Sachs Group, Inc. 2.905% 2023 (3-month USD-LIBOR + 0.99% on 7/24/2022)5 | 97,544 | 92,977 |
| Goldman Sachs Group, Inc. 2.908% 20235 | 9,727 | 9,345 |
| Goldman Sachs Group, Inc. 3.20% 2023 | 71,450 | 69,366 |
| Goldman Sachs Group, Inc. 3.85% 2024 | 5,975 | 5,845 |
| Goldman Sachs Group, Inc. 4.00% 2024 | 5,135 | 5,070 |
| Goldman Sachs Group, Inc. 3.691% 2028 (3-month USD-LIBOR + 1.51% on 6/5/2027)5 | 10,000 | 9,309 |
| Goldman Sachs Group, Inc. 4.223% 2029 (3-month USD-LIBOR + 1.301% on 5/1/2028)5 | 5,005 | 4,829 |
| Groupe BPCE SA 2.75% 20233 | 10,050 | 9,645 |
| Groupe BPCE SA 5.70% 20233 | 13,830 | 14,346 |
| Groupe BPCE SA 4.625% 20243 | 34,250 | 33,717 |
| Groupe BPCE SA 5.15% 20243 | 54,250 | 54,536 |
| HSBC Holdings PLC 2.65% 2022 | 35,000 | 33,968 |
| HSBC Holdings PLC 3.262% 2023 (3-month USD-LIBOR + 1.055% on 3/13/2022)5 | 50,500 | 49,442 |
| HSBC Holdings PLC 3.64% 20248 | 11,250 | 10,964 |
| HSBC Holdings PLC 3.95% 2024 (3-month USD-LIBOR + 0.987% on 5/18/2023)5 | 19,400 | 19,306 |
| HSBC Holdings PLC 4.25% 2024 | 8,000 | 7,948 |
| HSBC Holdings PLC 4.583% 2029 (3-month USD-LIBOR + 1.535% on 6/19/2028)5 | 25,500 | 25,320 |
| Intesa Sanpaolo SpA 3.125% 20223 | 26,260 | 24,299 |
American Balanced Fund — Page 6 of 33
Bonds, notes & other debt instruments (continued)
Corporate bonds & notes (continued)
Financials (continued) | Principal amount
(000) | Value
(000) |
| Intesa Sanpaolo SpA 3.375% 20233 | $32,980 | $30,578 |
| Intesa Sanpaolo SpA 5.017% 20243 | 110,010 | 99,659 |
| Intesa Sanpaolo SpA 5.25% 2024 | 12,600 | 12,317 |
| Intesa Sanpaolo SpA 5.71% 20263 | 33,743 | 30,989 |
| Intesa Sanpaolo SpA 3.875% 20273 | 53,123 | 45,801 |
| Intesa Sanpaolo SpA 3.875% 20283 | 32,320 | 27,669 |
| Jefferies Financial Group Inc. 5.50% 2023 | 830 | 846 |
| JPMorgan Chase & Co. 2.25% 2020 | 14,585 | 14,440 |
| JPMorgan Chase & Co. 2.55% 2020 | 12,625 | 12,486 |
| JPMorgan Chase & Co. 2.55% 2021 | 10,000 | 9,862 |
| JPMorgan Chase & Co. 3.25% 2022 | 10,000 | 9,925 |
| JPMorgan Chase & Co. 2.70% 2023 | 27,600 | 26,525 |
| JPMorgan Chase & Co. 3.559% 2024 (3-month USD-LIBOR + 0.73% on 4/23/2023)5 | 37,400 | 37,137 |
| JPMorgan Chase & Co. 3.797% 2024 (3-month USD-LIBOR + 0.89% on 7/23/2023)5 | 9,250 | 9,272 |
| JPMorgan Chase & Co. 3.875% 2024 | 25,000 | 24,665 |
| JPMorgan Chase & Co. 4.023% 2024 (3-month USD-LIBOR + 1.00% on 12/5/2023)5 | 85,188 | 85,965 |
| JPMorgan Chase & Co. 4.203% 2029 (3-month USD-LIBOR + 1.26% on 7/23/2028)5 | 32,500 | 32,459 |
| JPMorgan Chase & Co. 4.452% 2029 (3-month USD-LIBOR + 1.33% on 12/5/2028)5 | 12,275 | 12,508 |
JPMorgan Chase & Co., Series Z, junior subordinated 5.30% (undated)
(3-month USD-LIBOR + 3.80% on 5/1/2020)5 | 35,000 | 34,650 |
JPMorgan Chase & Co., Series S, junior subordinated, perpetual, 6.75% (undated)
(3-month USD-LIBOR + 3.78% on 2/1/2024)5 | 25,000 | 25,862 |
| JPMorgan Chase Bank NA (3-month USD-LIBOR + 0.34%) 2.848% 20218 | 28,050 | 27,799 |
| Keybank National Association 2.50% 2019 | 17,000 | 16,898 |
| Lloyds Banking Group PLC 3.00% 2022 | 30,000 | 29,041 |
| Lloyds Banking Group PLC 2.907% 2023 (3-month USD-LIBOR + 0.81% on 11/7/2022)5 | 67,300 | 63,693 |
| Lloyds Banking Group PLC 4.45% 2025 | 12,400 | 12,335 |
| Lloyds Banking Group PLC 4.582% 2025 | 14,750 | 13,991 |
| Lloyds Banking Group PLC 3.75% 2027 | 10,000 | 9,207 |
| Lloyds Banking Group PLC 4.375% 2028 | 10,025 | 9,534 |
| Metropolitan Life Global Funding I 2.30% 20193 | 10,120 | 10,103 |
| Metropolitan Life Global Funding I 2.50% 20203 | 46,300 | 45,750 |
| Metropolitan Life Global Funding I 1.95% 20213 | 15,500 | 14,970 |
| Mitsubishi UFJ Financial Group, Inc. 2.665% 2022 | 30,500 | 29,654 |
| Mitsubishi UFJ Financial Group, Inc. 2.998% 2022 | 18,300 | 18,051 |
| Mizuho Financial Group, Ltd. 3.549% 2023 | 31,500 | 31,450 |
| Morgan Stanley 2.50% 2021 | 15,125 | 14,826 |
| Morgan Stanley 3.125% 2023 | 53,142 | 51,925 |
| Morgan Stanley 3.70% 2024 | 2,100 | 2,067 |
| Morgan Stanley 3.737% 2024 (3-month USD-LIBOR + 0.847% on 4/24/2023)5 | 119,400 | 118,605 |
| Morgan Stanley 4.00% 2025 | 8,950 | 8,841 |
| Morgan Stanley 3.125% 2026 | 5,582 | 5,157 |
| Morgan Stanley 3.875% 2026 | 47,995 | 46,878 |
| Morgan Stanley 3.625% 2027 | 9,875 | 9,400 |
| Morgan Stanley 3.772% 2029 (3-month USD-LIBOR + 1.14% on 1/24/2028)5 | 19,418 | 18,611 |
| Morgan Stanley, Series F, 3.875% 2024 | 550 | 548 |
| National Australia Bank Ltd. 1.375% 2019 | 10,200 | 10,117 |
| National Australia Bank Ltd. 1.875% 2021 | 10,200 | 9,820 |
| National Australia Bank Ltd. 2.50% 2022 | 29,500 | 28,644 |
| National Australia Bank Ltd. 2.875% 2023 | 23,725 | 23,008 |
| Nationwide Mutual Insurance Co. (3-month USD-LIBOR + 2.29%) 5.078% 20243,8 | 8,150 | 8,116 |
| New York Life Global Funding 1.70% 20213 | 15,000 | 14,461 |
| New York Life Global Funding 2.35% 20263 | 11,890 | 10,925 |
| Nordea Bank AB 2.50% 20203 | 14,825 | 14,621 |
American Balanced Fund — Page 7 of 33
Bonds, notes & other debt instruments (continued)
Corporate bonds & notes (continued)
Financials (continued) | Principal amount
(000) | Value
(000) |
| Nordea Bank AB 2.25% 20213 | $8,800 | $8,582 |
| PNC Bank 1.45% 2019 | 33,375 | 33,091 |
| PNC Bank 2.40% 2019 | 14,800 | 14,714 |
| PNC Bank 2.60% 2020 | 30,000 | 29,739 |
| PNC Bank 2.55% 2021 | 17,000 | 16,591 |
| PNC Bank 3.50% 2023 | 25,327 | 25,391 |
| PNC Financial Services Group, Inc. 3.90% 2024 | 20,000 | 19,851 |
| Prudential Financial, Inc. 3.50% 2024 | 23,600 | 23,757 |
| Rabobank Nederland 2.75% 2022 | 23,500 | 23,048 |
| Rabobank Nederland 4.375% 2025 | 22,650 | 22,287 |
| Santander Holdings USA, Inc. 4.45% 2021 | 25,000 | 25,449 |
| Santander Holdings USA, Inc. 3.70% 2022 | 28,500 | 28,010 |
| Santander Holdings USA, Inc. 3.40% 2023 | 31,500 | 30,298 |
| Skandinaviska Enskilda Banken AB 1.875% 2021 | 23,790 | 22,877 |
| Skandinaviska Enskilda Banken AB 2.80% 2022 | 9,960 | 9,763 |
| Sumitomo Mitsui Banking Corp. 3.102% 2023 | 52,500 | 51,526 |
| Synchrony Bank 3.65% 2021 | 47,625 | 46,623 |
| Synchrony Financial 3.75% 2021 | 19,821 | 19,301 |
| Travelers Companies, Inc. 4.00% 2047 | 13,520 | 13,029 |
| UBS Group AG 4.125% 20253 | 28,250 | 28,094 |
| UniCredit SpA 3.75% 20223 | 64,869 | 62,498 |
| UniCredit SpA 4.625% 20273 | 10,000 | 9,170 |
| UniCredit SpA 5.861% 20323,5 | 31,850 | 28,063 |
| Unum Group 3.875% 2025 | 5,045 | 4,931 |
| US Bancorp 2.35% 2020 | 25,000 | 24,842 |
| US Bancorp 2.625% 2022 | 16,225 | 15,952 |
| US Bancorp 2.85% 2023 | 38,000 | 37,371 |
| US Bancorp 3.40% 2023 | 62,775 | 62,836 |
| US Bancorp 2.375% 2026 | 25,000 | 22,835 |
| US Bank NA 1.40% 2019 | 5,465 | 5,440 |
| US Bank NA 2.125% 2019 | 30,000 | 29,792 |
| Wells Fargo & Co. 2.55% 2020 | 2,740 | 2,702 |
| Wells Fargo & Co. 2.10% 2021 | 25,600 | 24,809 |
| Wells Fargo & Co. 2.50% 2021 | 43,000 | 42,321 |
| Wells Fargo & Co. 4.60% 2021 | 25,000 | 25,608 |
| Wells Fargo & Co. 3.069% 2023 | 60,000 | 58,470 |
| Wells Fargo & Co. 3.55% 2023 | 58,150 | 57,973 |
| Wells Fargo & Co. 3.00% 2026 | 21,000 | 19,597 |
| Wells Fargo & Co. 3.00% 2026 | 14,000 | 12,980 |
| Wells Fargo & Co. 3.584% 2028 (3-month USD-LIBOR + 1.31% on 5/15/2027)5 | 2,755 | 2,649 |
| Westpac Banking Corp. 2.15% 2020 | 28,000 | 27,701 |
| Westpac Banking Corp. 2.75% 2023 | 27,500 | 26,699 |
| | | 4,970,482 |
| Health care 1.77% | | |
| Abbott Laboratories 2.90% 2021 | 28,952 | 28,684 |
| Abbott Laboratories 3.40% 2023 | 8,578 | 8,561 |
| Abbott Laboratories 3.75% 2026 | 11,937 | 11,815 |
| Abbott Laboratories 4.75% 2036 | 4,800 | 5,027 |
| Abbott Laboratories 4.90% 2046 | 3,500 | 3,693 |
| AbbVie Inc. 2.90% 2022 | 37,353 | 36,376 |
| AbbVie Inc. 2.85% 2023 | 14,887 | 14,358 |
| AbbVie Inc. 4.25% 2028 | 23,650 | 23,019 |
| AbbVie Inc. 4.30% 2036 | 4,393 | 3,935 |
American Balanced Fund — Page 8 of 33
Bonds, notes & other debt instruments (continued)
Corporate bonds & notes (continued)
Health care (continued) | Principal amount
(000) | Value
(000) |
| AbbVie Inc. 4.45% 2046 | $27,911 | $24,538 |
| AbbVie Inc. 4.875% 2048 | 14,775 | 13,856 |
| Allergan PLC 3.45% 2022 | 65,422 | 64,467 |
| Allergan PLC 3.80% 2025 | 3,385 | 3,310 |
| Allergan PLC 4.55% 2035 | 7,870 | 7,494 |
| Allergan PLC 4.75% 2045 | 21,404 | 20,419 |
| Allergan, Inc. 5.00% 20213 | 35,099 | 36,135 |
| AmerisourceBergen Corp. 3.25% 2025 | 2,170 | 2,076 |
| AmerisourceBergen Corp. 4.25% 2045 | 2,045 | 1,762 |
| Amgen Inc. 2.70% 2022 | 10,620 | 10,407 |
| Amgen Inc. 4.40% 2045 | 16,000 | 15,059 |
| Anthem, Inc. 2.95% 2022 | 26,430 | 25,798 |
| Anthem, Inc. 4.101% 2028 | 40,000 | 39,303 |
| AstraZeneca PLC 2.375% 2022 | 18,792 | 18,040 |
| AstraZeneca PLC 3.375% 2025 | 42,445 | 41,083 |
| Bayer AG 2.375% 20193 | 8,245 | 8,181 |
| Bayer US Finance II LLC 3.875% 20233 | 44,342 | 43,583 |
| Bayer US Finance II LLC 4.25% 20253 | 71,894 | 70,108 |
| Bayer US Finance II LLC 4.375% 20283 | 2,774 | 2,655 |
| Bayer US Finance II LLC 4.625% 20383 | 11,798 | 10,759 |
| Bayer US Finance II LLC 4.40% 20443 | 13,090 | 11,258 |
| Bayer US Finance II LLC 4.875% 20483 | 12,664 | 11,439 |
| Becton, Dickinson and Co. 2.133% 2019 | 17,750 | 17,649 |
| Becton, Dickinson and Co. 2.404% 2020 | 17,750 | 17,485 |
| Becton, Dickinson and Co. 2.894% 2022 | 39,820 | 38,596 |
| Becton, Dickinson and Co. 3.363% 2024 | 40,505 | 38,949 |
| Boston Scientific Corp. 3.375% 2022 | 20,000 | 19,886 |
| Boston Scientific Corp. 3.85% 2025 | 45,500 | 44,843 |
| Cigna Corp. 3.40% 20213 | 33,775 | 33,718 |
| Cigna Corp. 3.75% 20233 | 40,655 | 40,559 |
| Cigna Corp. 4.125% 20253 | 21,020 | 21,031 |
| Cigna Corp. 4.375% 20283 | 16,800 | 16,937 |
| Cigna Corp. 4.80% 20383 | 40,085 | 39,874 |
| Cigna Corp. 4.90% 20483 | 12,745 | 12,535 |
| CVS Health Corp. 3.35% 2021 | 67,095 | 66,906 |
| CVS Health Corp. 3.70% 2023 | 7,790 | 7,714 |
| CVS Health Corp. 4.10% 2025 | 104,719 | 103,941 |
| CVS Health Corp. 4.30% 2028 | 89,437 | 87,740 |
| CVS Health Corp. 4.78% 2038 | 8,492 | 8,172 |
| CVS Health Corp. 5.05% 2048 | 7,167 | 7,006 |
| Eli Lilly and Co. 3.95% 2047 | 10,000 | 9,816 |
| EMD Finance LLC 2.95% 20223 | 12,850 | 12,669 |
| EMD Finance LLC 3.25% 20253 | 16,200 | 15,566 |
| GlaxoSmithKline PLC 3.625% 2025 | 12,165 | 12,258 |
| HCA Inc. 6.50% 2020 | 9,800 | 10,070 |
| Humana Inc. 3.15% 2022 | 20,000 | 19,610 |
| Johnson & Johnson 2.45% 2026 | 23,360 | 21,969 |
| Medtronic, Inc. 3.50% 2025 | 22,500 | 22,439 |
| Medtronic, Inc. 4.375% 2035 | 12,627 | 12,964 |
| Medtronic, Inc. 4.625% 2045 | 11,095 | 11,675 |
| Mylan Laboratories Inc. 3.15% 2021 | 18,347 | 17,977 |
| Pfizer Inc. 7.20% 2039 | 485 | 672 |
| Roche Holdings, Inc. 2.875% 20213 | 24,400 | 24,263 |
| Roche Holdings, Inc. 1.75% 20223 | 18,330 | 17,598 |
American Balanced Fund — Page 9 of 33
Bonds, notes & other debt instruments (continued)
Corporate bonds & notes (continued)
Health care (continued) | Principal amount
(000) | Value
(000) |
| Roche Holdings, Inc. 3.35% 20243 | $9,000 | $9,035 |
| Roche Holdings, Inc. 3.00% 20253 | 19,000 | 18,444 |
| Shire PLC 2.40% 2021 | 40,634 | 39,316 |
| Shire PLC 2.875% 2023 | 93,763 | 88,726 |
| Shire PLC 3.20% 2026 | 102,800 | 93,231 |
| Takeda Pharmaceutical Co., Ltd. 4.00% 20213 | 30,000 | 30,428 |
| Takeda Pharmaceutical Co., Ltd. 4.40% 20233 | 70,080 | 70,919 |
| Takeda Pharmaceutical Co., Ltd. 5.00% 20283 | 32,500 | 33,277 |
| Teva Pharmaceutical Finance Co. BV 2.20% 2021 | 128,578 | 118,257 |
| Teva Pharmaceutical Finance Co. BV 2.80% 2023 | 158,775 | 136,878 |
| Teva Pharmaceutical Finance Co. BV 3.15% 2026 | 147,999 | 113,198 |
| Thermo Fisher Scientific Inc. 4.15% 2024 | 11,840 | 12,006 |
| WellPoint, Inc. 2.25% 2019 | 15,500 | 15,419 |
| Zimmer Holdings, Inc. 3.15% 2022 | 18,910 | 18,502 |
| Zimmer Holdings, Inc. 4.25% 2035 | 1,197 | 1,083 |
| | | 2,249,004 |
| Energy 1.48% | | |
| Anadarko Petroleum Corp. 4.85% 2021 | 19,615 | 20,093 |
| Anadarko Petroleum Corp. 5.55% 2026 | 13,895 | 14,580 |
| Anadarko Petroleum Corp. 6.60% 2046 | 18,950 | 21,018 |
| BP Capital Markets PLC 4.234% 2028 | 25,000 | 25,765 |
| Canadian Natural Resources Ltd. 2.95% 2023 | 34,865 | 33,355 |
| Canadian Natural Resources Ltd. 3.80% 2024 | 1,720 | 1,698 |
| Canadian Natural Resources Ltd. 4.95% 2047 | 7,500 | 7,231 |
| Cenovus Energy Inc. 3.00% 2022 | 2,000 | 1,900 |
| Cenovus Energy Inc. 3.80% 2023 | 20,710 | 19,999 |
| Cenovus Energy Inc. 4.25% 2027 | 52,985 | 48,368 |
| Cenovus Energy Inc. 5.25% 2037 | 12,500 | 11,054 |
| Cenovus Energy Inc. 5.40% 2047 | 52,450 | 45,482 |
| Chevron Corp. 2.566% 2023 | 13,000 | 12,667 |
| Concho Resources Inc. 4.30% 2028 | 30,935 | 30,338 |
| Concho Resources Inc. 4.85% 2048 | 17,851 | 17,169 |
| Devon Energy Corp. 5.00% 2045 | 6,000 | 5,339 |
| Enbridge Energy Partners, LP 9.875% 2019 | 11,250 | 11,366 |
| Enbridge Energy Partners, LP 4.375% 2020 | 15,730 | 15,917 |
| Enbridge Energy Partners, LP 5.875% 2025 | 21,005 | 22,798 |
| Enbridge Energy Partners, LP 5.50% 2040 | 15,000 | 15,596 |
| Enbridge Energy Partners, LP 7.375% 2045 | 52,240 | 64,989 |
| Enbridge Energy Partners, LP, Series B, 7.50% 2038 | 9,250 | 11,705 |
| Enbridge Inc. 4.00% 2023 | 12,610 | 12,685 |
| Enbridge Inc. 3.70% 2027 | 26,253 | 24,924 |
| Energy Transfer Partners, LP 4.15% 2020 | 11,500 | 11,572 |
| Energy Transfer Partners, LP 4.20% 2023 | 11,190 | 11,039 |
| Energy Transfer Partners, LP 4.75% 2026 | 19,000 | 18,502 |
| Energy Transfer Partners, LP 4.00% 2027 | 16,482 | 15,148 |
| Energy Transfer Partners, LP 4.20% 2027 | 13,373 | 12,501 |
| Energy Transfer Partners, LP 4.95% 2028 | 16,877 | 16,577 |
| Energy Transfer Partners, LP 6.125% 2045 | 11,990 | 11,777 |
| Energy Transfer Partners, LP 5.30% 2047 | 26,430 | 23,402 |
| Energy Transfer Partners, LP 5.40% 2047 | 40,178 | 36,162 |
| Energy Transfer Partners, LP 6.00% 2048 | 33,160 | 32,440 |
| EnLink Midstream Partners, LP 4.15% 2025 | 2,575 | 2,326 |
| EnLink Midstream Partners, LP 5.45% 2047 | 18,515 | 15,056 |
American Balanced Fund — Page 10 of 33
Bonds, notes & other debt instruments (continued)
Corporate bonds & notes (continued)
Energy (continued) | Principal amount
(000) | Value
(000) |
| Enterprise Products Operating LLC 3.90% 2024 | $16,545 | $16,661 |
| Enterprise Products Operating LLC 3.95% 2027 | 550 | 549 |
| EOG Resources, Inc. 4.15% 2026 | 10,220 | 10,510 |
| EQT Corp. 3.00% 2022 | 16,800 | 15,943 |
| EQT Corp. 3.90% 2027 | 15,080 | 13,031 |
| Equinor ASA 3.625% 2028 | 61,530 | 61,537 |
| Exxon Mobil Corp. 2.222% 2021 | 18,000 | 17,746 |
| Exxon Mobil Corp. 2.726% 2023 | 12,000 | 11,807 |
| Exxon Mobil Corp. 4.114% 2046 | 4,080 | 4,167 |
| Halliburton Co. 3.80% 2025 | 4,465 | 4,337 |
| Kinder Morgan Energy Partners, LP 2.65% 2019 | 20,000 | 19,990 |
| Kinder Morgan Energy Partners, LP 9.00% 2019 | 4,395 | 4,414 |
| Kinder Morgan Energy Partners, LP 3.50% 2021 | 8,980 | 8,962 |
| Kinder Morgan Energy Partners, LP 5.40% 2044 | 13,135 | 12,613 |
| Kinder Morgan Energy Partners, LP 5.50% 2044 | 11,321 | 10,995 |
| Kinder Morgan, Inc. 3.05% 2019 | 8,070 | 8,025 |
| Kinder Morgan, Inc. 6.50% 2020 | 10,700 | 11,084 |
| Kinder Morgan, Inc. 4.30% 2028 | 49,630 | 48,815 |
| Kinder Morgan, Inc. 5.30% 2034 | 8,205 | 8,077 |
| Kinder Morgan, Inc. 5.20% 2048 | 25,000 | 24,015 |
| Marathon Oil Corp. 4.40% 2027 | 26,665 | 25,395 |
| MPLX LP 4.125% 2027 | 5,880 | 5,611 |
| MPLX LP 4.50% 2038 | 25,500 | 22,363 |
| Noble Energy, Inc. 3.85% 2028 | 19,650 | 17,823 |
| Noble Energy, Inc. 4.95% 2047 | 13,500 | 11,737 |
| Petróleos Mexicanos 5.375% 2022 | 30,000 | 29,535 |
| Petróleos Mexicanos 4.625% 2023 | 12,000 | 11,292 |
| Petróleos Mexicanos 5.35% 2028 | 15,590 | 13,641 |
| Petróleos Mexicanos 5.625% 2046 | 8,800 | 6,705 |
| Petróleos Mexicanos 6.75% 2047 | 47,957 | 39,775 |
| Petróleos Mexicanos 6.35% 2048 | 88,165 | 70,666 |
| Phillips 66 Partners LP 3.605% 2025 | 1,950 | 1,877 |
| Phillips 66 Partners LP 3.55% 2026 | 3,350 | 3,138 |
| Phillips 66 Partners LP 3.75% 2028 | 8,775 | 8,124 |
| Phillips 66 3.90% 2028 | 24,325 | 23,557 |
| Phillips 66 4.875% 2044 | 40,000 | 39,088 |
| Phillips 66 Partners LP 4.68% 2045 | 6,580 | 5,954 |
| Phillips 66 Partners LP 4.90% 2046 | 5,510 | 5,053 |
| Pioneer Natural Resources Co. 3.45% 2021 | 11,530 | 11,501 |
| Sabine Pass Liquefaction, LLC 5.625% 20235 | 75,500 | 79,613 |
| Sabine Pass Liquefaction, LLC 5.75% 2024 | 50,000 | 52,463 |
| Sabine Pass Liquefaction, LLC 5.875% 2026 | 10,265 | 10,889 |
| Sabine Pass Liquefaction, LLC 4.20% 2028 | 13,155 | 12,614 |
| Schlumberger BV 3.625% 20223 | 11,340 | 11,301 |
| Schlumberger BV 4.00% 20253 | 18,578 | 18,374 |
| Shell International Finance BV 2.25% 2020 | 8,375 | 8,276 |
| Shell International Finance BV 1.875% 2021 | 15,000 | 14,614 |
| Shell International Finance BV 3.50% 2023 | 48,853 | 49,427 |
| Shell International Finance BV 3.875% 2028 | 43,540 | 44,826 |
| Statoil ASA 2.75% 2021 | 5,395 | 5,353 |
| Statoil ASA 3.25% 2024 | 1,690 | 1,684 |
| Statoil ASA 4.25% 2041 | 6,000 | 5,973 |
| TC PipeLines, LP 4.375% 2025 | 6,390 | 6,385 |
| Total Capital SA 3.883% 2028 | 55,000 | 56,627 |
American Balanced Fund — Page 11 of 33
Bonds, notes & other debt instruments (continued)
Corporate bonds & notes (continued)
Energy (continued) | Principal amount
(000) | Value
(000) |
| TransCanada PipeLines Ltd. 4.25% 2028 | $17,075 | $16,953 |
| TransCanada PipeLines Ltd. 4.75% 2038 | 22,400 | 21,681 |
| TransCanada PipeLines Ltd. 5.00% 2043 | 10,000 | 9,929 |
| TransCanada PipeLines Ltd. 4.875% 2048 | 23,500 | 23,011 |
TransCanada PipeLines Ltd., junior subordinated, 5.625% 2075
(3-month USD-LIBOR + 3.528% on 5/20/2025)5 | 6,410 | 5,793 |
| Western Gas Partners LP 3.95% 2025 | 3,730 | 3,521 |
| Western Gas Partners LP 4.65% 2026 | 7,045 | 6,827 |
| Western Gas Partners LP 5.30% 2048 | 20,000 | 17,339 |
| Williams Partners LP 4.50% 2023 | 6,400 | 6,440 |
| Williams Partners LP 4.30% 2024 | 7,870 | 7,851 |
| Woodside Petroleum Ltd. 3.65% 20253 | 12,400 | 11,799 |
| | | 1,878,214 |
| Consumer staples 1.22% | | |
| Altria Group, Inc. 9.25% 2019 | 5,067 | 5,238 |
| Altria Group, Inc. 2.625% 2020 | 14,760 | 14,627 |
| Altria Group, Inc. 9.95% 2038 | 13,500 | 19,766 |
| Altria Group, Inc. 4.50% 2043 | 10,000 | 8,358 |
| Altria Group, Inc. 5.375% 2044 | 6,825 | 6,390 |
| Anheuser-Busch Co./InBev Worldwide 3.65% 20263 | 37,965 | 35,919 |
| Anheuser-Busch Co./InBev Worldwide 4.70% 20363 | 6,725 | 6,280 |
| Anheuser-Busch Co./InBev Worldwide 4.90% 20463 | 8,275 | 7,701 |
| Anheuser-Busch InBev NV 3.30% 2023 | 57,125 | 55,673 |
| Anheuser-Busch InBev NV 3.50% 2024 | 28,585 | 27,959 |
| Anheuser-Busch InBev NV 4.00% 2028 | 69,467 | 66,614 |
| Anheuser-Busch InBev NV 4.60% 2048 | 9,578 | 8,631 |
| British American Tobacco International Finance PLC 3.95% 20253 | 16,500 | 15,446 |
| British American Tobacco PLC 2.297% 2020 | 35,827 | 34,987 |
| British American Tobacco PLC 3.222% 2024 | 124,000 | 114,343 |
| British American Tobacco PLC 3.557% 2027 | 66,150 | 58,864 |
| British American Tobacco PLC 4.39% 2037 | 25,500 | 20,955 |
| British American Tobacco PLC 4.54% 2047 | 40,500 | 32,397 |
| Conagra Brands, Inc. 3.80% 2021 | 45,157 | 45,201 |
| Conagra Brands, Inc. 4.30% 2024 | 71,653 | 71,299 |
| Conagra Brands, Inc. 4.85% 2028 | 16,570 | 16,336 |
| Conagra Brands, Inc. 5.30% 2038 | 23,000 | 21,822 |
| Conagra Brands, Inc. 5.40% 2048 | 14,248 | 13,185 |
| Constellation Brands, Inc. 2.65% 2022 | 43,645 | 41,827 |
| Constellation Brands, Inc. 2.70% 2022 | 6,780 | 6,554 |
| Constellation Brands, Inc. 3.20% 2023 | 30,742 | 29,837 |
| Constellation Brands, Inc. 3.60% 2028 | 10,000 | 9,232 |
| Constellation Brands, Inc. 4.50% 2047 | 3,465 | 3,179 |
| Constellation Brands, Inc. 4.10% 2048 | 22,000 | 18,642 |
| Costco Wholesale Corp. 2.75% 2024 | 57,500 | 55,966 |
| General Mills, Inc. (3-month USD-LIBOR + 0.54%) 2.976% 20218 | 14,250 | 14,034 |
| General Mills, Inc. 3.70% 2023 | 3,120 | 3,105 |
| Imperial Tobacco Finance PLC 3.50% 20233 | 17,000 | 16,526 |
| Keurig Dr Pepper Inc. 4.057% 20233 | 37,500 | 37,382 |
| Keurig Dr Pepper Inc. 4.417% 20253 | 24,162 | 24,094 |
| Keurig Dr Pepper Inc. 4.597% 20283 | 23,096 | 22,979 |
| Keurig Dr Pepper Inc. 4.985% 20383 | 17,945 | 17,275 |
| Keurig Dr Pepper Inc. 5.085% 20483 | 32,576 | 31,134 |
| Kraft Heinz Co. 3.50% 2022 | 23,285 | 23,110 |
American Balanced Fund — Page 12 of 33
Bonds, notes & other debt instruments (continued)
Corporate bonds & notes (continued)
Consumer staples (continued) | Principal amount
(000) | Value
(000) |
| Kraft Heinz Co. 4.375% 2046 | $5,290 | $4,380 |
| Kroger Co. 3.50% 2026 | 16,135 | 15,325 |
| Mead Johnson Nutrition Co. 3.00% 2020 | 6,525 | 6,506 |
| Mead Johnson Nutrition Co. 4.125% 2025 | 3,355 | 3,446 |
| Molson Coors Brewing Co. 1.45% 2019 | 7,465 | 7,390 |
| Molson Coors Brewing Co. 1.90% 2019 | 10,015 | 9,987 |
| Molson Coors Brewing Co. 2.25% 2020 | 8,590 | 8,474 |
| Molson Coors Brewing Co. 2.10% 2021 | 11,385 | 10,983 |
| Molson Coors Brewing Co. 3.00% 2026 | 9,670 | 8,631 |
| Molson Coors Brewing Co. 4.20% 2046 | 10,475 | 8,747 |
| Nestle Holdings, Inc. 3.50% 20253 | 35,000 | 35,203 |
| Pernod Ricard SA 4.45% 20223 | 9,600 | 9,798 |
| Philip Morris International Inc. 2.00% 2020 | 28,010 | 27,662 |
| Philip Morris International Inc. 1.875% 2021 | 6,340 | 6,162 |
| Philip Morris International Inc. 2.375% 2022 | 20,565 | 19,773 |
| Philip Morris International Inc. 2.50% 2022 | 31,500 | 30,289 |
| Philip Morris International Inc. 2.625% 2022 | 13,750 | 13,315 |
| Philip Morris International Inc. 3.25% 2024 | 10,000 | 9,636 |
| Philip Morris International Inc. 3.375% 2025 | 27,395 | 26,655 |
| Philip Morris International Inc. 4.25% 2044 | 6,000 | 5,492 |
| Procter & Gamble Co. 1.70% 2021 | 8,270 | 8,061 |
| Reckitt Benckiser Group PLC 2.375% 20223 | 19,000 | 18,257 |
| Reckitt Benckiser Treasury Services PLC 2.75% 20243 | 8,078 | 7,640 |
| Reynolds American Inc. 3.25% 2022 | 11,420 | 11,091 |
| Reynolds American Inc. 4.00% 2022 | 3,410 | 3,376 |
| Reynolds American Inc. 4.85% 2023 | 12,000 | 12,156 |
| Reynolds American Inc. 4.45% 2025 | 60,115 | 58,070 |
| Reynolds American Inc. 5.70% 2035 | 1,555 | 1,524 |
| Reynolds American Inc. 5.85% 2045 | 32,595 | 30,415 |
| Wal-Mart Stores, Inc. 3.40% 2023 | 30,140 | 30,467 |
| Wal-Mart Stores, Inc. 3.70% 2028 | 20,996 | 21,340 |
| WM. Wrigley Jr. Co. 3.375% 20203 | 22,500 | 22,565 |
| | | 1,555,683 |
| Utilities 1.21% | | |
| Abu Dhabi National Energy Co. PJSC (TAQA) 4.375% 20253 | 25,500 | 25,352 |
| Abu Dhabi National Energy Co. PJSC (TAQA) 4.875% 20303 | 7,000 | 7,031 |
| AEP Transmission Co. LLC 3.75% 2047 | 9,870 | 9,088 |
| AEP Transmission Co. LLC 4.25% 2048 | 12,600 | 12,747 |
| Ameren Corp. 3.65% 2026 | 1,410 | 1,388 |
| Ameren Corp. 3.70% 2047 | 10,000 | 9,156 |
| Ameren Corp. 4.50% 2049 | 13,000 | 13,801 |
| American Electric Power Co., Inc. 2.15% 2020 | 9,800 | 9,607 |
| American Electric Power Co., Inc. 2.95% 2022 | 13,694 | 13,440 |
| Berkshire Hathaway Energy Co. 2.40% 2020 | 4,355 | 4,327 |
| Centerpoint Energy, Inc. 2.50% 2022 | 4,510 | 4,317 |
| CenterPoint Energy, Inc. 3.85% 2024 | 10,915 | 10,980 |
| CMS Energy Corp. 5.05% 2022 | 9,215 | 9,624 |
| Comision Federal de Electricidad 4.75% 20273 | 10,725 | 10,135 |
| Commonwealth Edison Co. 2.55% 2026 | 11,270 | 10,566 |
| Commonwealth Edison Co. 4.35% 2045 | 8,345 | 8,427 |
| Commonwealth Edison Co. 4.00% 2048 | 11,750 | 11,379 |
| Consolidated Edison Co. of New York, Inc. 3.875% 2047 | 9,600 | 8,889 |
| Consolidated Edison Co. of New York, Inc. 4.50% 2058 | 19,825 | 19,256 |
American Balanced Fund — Page 13 of 33
Bonds, notes & other debt instruments (continued)
Corporate bonds & notes (continued)
Utilities (continued) | Principal amount
(000) | Value
(000) |
| Consumers Energy Co. 3.375% 2023 | $1,435 | $1,441 |
| Consumers Energy Co. 3.125% 2024 | 10,520 | 10,397 |
| Consumers Energy Co. 3.25% 2046 | 10,635 | 9,038 |
| Consumers Energy Co. 4.05% 2048 | 27,710 | 27,435 |
| Dominion Resources, Inc. 1.60% 2019 | 3,660 | 3,620 |
| Dominion Resources, Inc. 2.962% 20195 | 11,040 | 11,002 |
| Dominion Resources, Inc. 2.579% 20205 | 7,025 | 6,917 |
| Dominion Resources, Inc. 2.00% 2021 | 6,765 | 6,504 |
| Dominion Resources, Inc. 2.75% 2022 | 36,516 | 35,593 |
| Duke Energy Carolinas, Inc. 3.95% 2028 | 21,375 | 21,935 |
| Duke Energy Carolinas, Inc. 3.70% 2047 | 6,625 | 6,042 |
| Duke Energy Corp. 3.75% 2024 | 24,295 | 24,359 |
| Duke Energy Corp. 2.65% 2026 | 21,250 | 19,389 |
| Duke Energy Florida, LLC 3.20% 2027 | 23,075 | 22,368 |
| Duke Energy Ohio, Inc. 3.70% 2046 | 7,475 | 6,756 |
| Duke Energy Progress Inc. 4.15% 2044 | 26,190 | 25,561 |
| Duke Energy Progress Inc. 3.70% 2046 | 29,270 | 26,544 |
| Duke Energy Progress, LLC 3.375% 2023 | 3,925 | 3,945 |
| EDP Finance BV 3.625% 20243 | 63,525 | 59,596 |
| Electricité de France SA 2.35% 20203 | 4,600 | 4,535 |
| Electricité de France SA 4.875% 20383 | 3,575 | 3,277 |
| Electricité de France SA 6.95% 20393 | 5,275 | 6,161 |
| Electricité de France SA 5.60% 2040 | 1,475 | 1,492 |
| Emera Inc. 6.75% 2076 (3-month USD-LIBOR + 5.44% on 6/15/2026)5 | 11,600 | 11,680 |
| Emera US Finance LP 2.70% 2021 | 6,165 | 6,009 |
| Emera US Finance LP 3.55% 2026 | 17,715 | 16,834 |
| Enel Finance International SA 2.875% 20223 | 13,466 | 12,697 |
| Enel Finance International SA 2.75% 20233 | 53,034 | 48,973 |
| Enel Finance International SA 4.25% 20233 | 35,000 | 34,256 |
| Enel Finance International SA 4.625% 20253 | 35,000 | 33,644 |
| Enel Finance International SA 3.625% 20273 | 29,500 | 26,084 |
| Enel Finance International SA 3.50% 20283 | 26,650 | 22,904 |
| Enel Finance International SA 4.875% 20293 | 30,000 | 28,694 |
| Enersis Américas SA 4.00% 2026 | 4,330 | 4,055 |
| Entergy Corp. 4.00% 2022 | 7,994 | 8,070 |
| Entergy Corp. 2.95% 2026 | 24,040 | 22,228 |
| Entergy Louisiana, LLC 4.20% 2048 | 14,025 | 13,897 |
| Eversource Energy 3.80% 2023 | 10,245 | 10,354 |
| Eversource Energy 2.70% 2026 | 4,085 | 3,830 |
| Exelon Corp. 2.85% 2020 | 15,000 | 14,884 |
| Exelon Corp. 3.497% 20225 | 90,158 | 88,168 |
| Exelon Corp. 3.40% 2026 | 2,840 | 2,706 |
| Exelon Corp. 4.45% 2046 | 2,525 | 2,414 |
| FirstEnergy Corp. 3.90% 2027 | 44,488 | 43,190 |
| FirstEnergy Corp. 4.85% 2047 | 43,720 | 43,972 |
| FirstEnergy Corp., Series B, 4.25% 2023 | 33,180 | 33,739 |
| Great Plains Energy Inc. 4.20% 2047 | 8,400 | 8,139 |
| MidAmerican Energy Holdings Co. 2.40% 2019 | 5,500 | 5,494 |
| MidAmerican Energy Holdings Co. 3.75% 2023 | 20,000 | 20,296 |
| MidAmerican Energy Holdings Co. 3.10% 2027 | 21,335 | 20,800 |
| National Rural Utilities Cooperative Finance Corp. 2.00% 2020 | 14,460 | 14,324 |
| National Rural Utilities Cooperative Finance Corp. 2.30% 2020 | 6,805 | 6,708 |
| National Rural Utilities Cooperative Finance Corp. 3.05% 2027 | 22,000 | 21,116 |
| NiSource Finance Corp. 2.65% 2022 | 14,850 | 14,229 |
American Balanced Fund — Page 14 of 33
Bonds, notes & other debt instruments (continued)
Corporate bonds & notes (continued)
Utilities (continued) | Principal amount
(000) | Value
(000) |
| Northeast Utilities 3.15% 2025 | $8,845 | $8,561 |
| Northern States Power Co. 4.125% 2044 | 18,000 | 18,237 |
| NV Energy, Inc. 6.25% 2020 | 10,168 | 10,686 |
| Pacific Gas and Electric Co. 2.45% 2022 | 6,000 | 5,347 |
| Pacific Gas and Electric Co. 3.25% 2023 | 3,314 | 2,948 |
| Pacific Gas and Electric Co. 3.85% 2023 | 2,552 | 2,297 |
| Pacific Gas and Electric Co. 4.25% 20233 | 6,000 | 5,589 |
| Pacific Gas and Electric Co. 3.40% 2024 | 3,087 | 2,692 |
| Pacific Gas and Electric Co. 3.75% 2024 | 20,000 | 17,840 |
| Pacific Gas and Electric Co. 3.30% 2027 | 18,272 | 15,141 |
| Pacific Gas and Electric Co. 3.30% 2027 | 5,861 | 4,815 |
| Pacific Gas and Electric Co. 4.65% 20283 | 19,122 | 16,930 |
| Pacific Gas and Electric Co. 6.35% 2038 | 5,000 | 4,751 |
| PacifiCorp., First Mortgage Bonds, 3.60% 2024 | 18,405 | 18,591 |
| PacifiCorp., First Mortgage Bonds, 4.125% 2049 | 18,825 | 18,601 |
| Public Service Co. of Colorado 2.25% 2022 | 6,000 | 5,783 |
| Public Service Electric and Gas Co., 3.05% 2024 | 13,425 | 13,130 |
| Public Service Enterprise Group Inc. 1.90% 2021 | 6,810 | 6,652 |
| Public Service Enterprise Group Inc. 2.65% 2022 | 15,075 | 14,517 |
| Public Service Enterprise Group Inc. 2.25% 2026 | 3,875 | 3,546 |
| Puget Energy, Inc. 6.50% 2020 | 5,750 | 6,076 |
| Puget Energy, Inc. 6.00% 2021 | 13,200 | 13,971 |
| Puget Energy, Inc. 5.625% 2022 | 15,427 | 16,348 |
| Puget Energy, Inc. 3.65% 2025 | 9,400 | 9,206 |
| Sierra Pacific Power Co., General and Refunding Mortgage Notes, Series T, 3.375% 2023 | 14,000 | 13,997 |
| South Carolina Electric & Gas Co. 3.50% 2021 | 13,175 | 13,220 |
| South Carolina Electric & Gas Co. 4.25% 2028 | 13,725 | 14,249 |
| South Carolina Electric & Gas Co. 4.10% 2046 | 13,624 | 12,789 |
| Tampa Electric Co. 4.35% 2044 | 11,410 | 11,034 |
| Teco Finance, Inc. 5.15% 2020 | 5,627 | 5,755 |
| Virginia Electric and Power Co. 2.95% 2026 | 8,247 | 7,833 |
| Virginia Electric and Power Co. 3.50% 2027 | 10,000 | 9,871 |
| Virginia Electric and Power Co. 4.60% 2048 | 10,125 | 10,619 |
| Xcel Energy Inc. 4.70% 2020 | 4,845 | 4,903 |
| Xcel Energy Inc. 3.30% 2025 | 5,795 | 5,674 |
| | | 1,540,004 |
| Consumer discretionary 1.08% | | |
| Amazon.com, Inc. 2.40% 2023 | 24,500 | 23,733 |
| Amazon.com, Inc. 2.80% 2024 | 24,500 | 23,830 |
| Amazon.com, Inc. 3.80% 2024 | 35,000 | 35,847 |
| American Honda Finance Corp. 3.50% 2028 | 10,000 | 9,852 |
| Bayerische Motoren Werke AG 3.45% 20233 | 61,070 | 60,658 |
| DaimlerChrysler North America Holding Corp. 2.25% 20193 | 13,000 | 12,918 |
| DaimlerChrysler North America Holding Corp. 2.25% 20203 | 9,780 | 9,649 |
| DaimlerChrysler North America Holding Corp. 2.00% 20213 | 22,525 | 21,680 |
| DaimlerChrysler North America Holding Corp. 3.00% 20213 | 40,000 | 39,575 |
| DaimlerChrysler North America Holding Corp. 3.35% 20233 | 12,800 | 12,632 |
| DaimlerChrysler North America Holding Corp. 3.75% 20283 | 4,198 | 3,956 |
| Ford Motor Credit Co. 2.597% 2019 | 13,000 | 12,859 |
| Ford Motor Credit Co. 2.343% 2020 | 36,275 | 34,908 |
| Ford Motor Credit Co. 3.157% 2020 | 22,186 | 21,745 |
| Ford Motor Credit Co. 3.20% 2021 | 8,300 | 8,046 |
| Ford Motor Credit Co. 3.47% 2021 | 993 | 966 |
American Balanced Fund — Page 15 of 33
Bonds, notes & other debt instruments (continued)
Corporate bonds & notes (continued)
Consumer discretionary (continued) | Principal amount
(000) | Value
(000) |
| Ford Motor Credit Co. 3.813% 2021 | $19,190 | $18,649 |
| Ford Motor Credit Co. 2.979% 2022 | 25,000 | 23,081 |
| Ford Motor Credit Co. 3.219% 2022 | 590 | 554 |
| Ford Motor Credit Co. 3.339% 2022 | 29,703 | 28,057 |
| Ford Motor Credit Co. 3.096% 2023 | 43,286 | 39,166 |
| Ford Motor Credit Co. 4.14% 2023 | 20,000 | 19,027 |
| Ford Motor Credit Co. 4.375% 2023 | 26,189 | 24,831 |
| Ford Motor Credit Co. 3.815% 2027 | 9,367 | 7,922 |
| General Motors Co. 4.875% 2023 | 37,366 | 37,487 |
| General Motors Co. 4.35% 2025 | 20,515 | 19,465 |
| General Motors Co. 6.60% 2036 | 9,435 | 9,216 |
| General Motors Co. 5.40% 2048 | 20,000 | 17,111 |
| General Motors Financial Co. 2.35% 2019 | 18,000 | 17,846 |
| General Motors Financial Co. 2.40% 2019 | 20,435 | 20,360 |
| General Motors Financial Co. 3.70% 2020 | 10,000 | 9,963 |
| General Motors Financial Co. 3.15% 2022 | 7,891 | 7,528 |
| General Motors Financial Co. 3.45% 2022 | 38,500 | 37,332 |
| General Motors Financial Co. 3.25% 2023 | 57,478 | 54,197 |
| General Motors Financial Co. 3.70% 2023 | 52,170 | 49,682 |
| General Motors Financial Co. 3.50% 2024 | 46,510 | 42,378 |
| General Motors Financial Co. 3.95% 2024 | 45,284 | 43,054 |
| General Motors Financial Co. 4.35% 2027 | 11,250 | 10,377 |
| Home Depot, Inc. 1.80% 2020 | 26,005 | 25,634 |
| Home Depot, Inc. 4.40% 2021 | 15,000 | 15,452 |
| Home Depot, Inc. 3.25% 2022 | 20,125 | 20,342 |
| Home Depot, Inc. 5.95% 2041 | 7,500 | 9,232 |
| Home Depot, Inc. 4.25% 2046 | 16,500 | 16,507 |
| Hyundai Capital America 2.00% 20193 | 11,960 | 11,885 |
| Hyundai Capital America 2.55% 20203 | 8,300 | 8,197 |
| Hyundai Capital America 3.45% 20213 | 58,690 | 58,078 |
| Hyundai Capital America 3.75% 20213 | 20,000 | 19,950 |
| Hyundai Capital America 3.25% 20223 | 13,055 | 12,707 |
| Lowe’s Companies, Inc. 2.50% 2026 | 23,310 | 20,725 |
| McDonald’s Corp. 2.625% 2022 | 15,440 | 15,109 |
| McDonald’s Corp. 3.50% 2027 | 6,555 | 6,381 |
| McDonald’s Corp. 3.80% 2028 | 14,775 | 14,543 |
| McDonald’s Corp. 4.875% 2045 | 12,000 | 12,178 |
| Newell Rubbermaid Inc. 3.85% 2023 | 4,770 | 4,704 |
| Nordstrom, Inc. 4.00% 2021 | 6,245 | 6,291 |
| Starbucks Corp. 3.10% 2023 | 22,854 | 22,531 |
| Starbucks Corp. 3.80% 2025 | 9,200 | 9,115 |
| Starbucks Corp. 4.50% 2048 | 13,480 | 12,616 |
| Toyota Motor Credit Corp. 2.25% 2023 | 14,085 | 13,350 |
| Toyota Motor Credit Corp. 3.05% 2028 | 15,800 | 15,273 |
| Volkswagen Group of America Finance, LLC 4.00% 20213 | 67,163 | 67,343 |
| Volkswagen Group of America Finance, LLC 4.25% 20233 | 52,555 | 52,178 |
| Volkswagen Group of America Finance, LLC 4.625% 20253 | 38,225 | 37,859 |
| | | 1,378,317 |
| Communication services 0.66% | | |
| Alphabet Inc. 1.998% 2026 | 17,000 | 15,479 |
| AT&T Inc. (3-month USD-LIBOR + 1.18%) 3.956% 20248 | 36,350 | 35,285 |
| AT&T Inc. 4.10% 2028 | 10,000 | 9,638 |
| British Telecommunications PLC 2.35% 2019 | 13,285 | 13,268 |
American Balanced Fund — Page 16 of 33
Bonds, notes & other debt instruments (continued)
Corporate bonds & notes (continued)
Communication services (continued) | Principal amount
(000) | Value
(000) |
| British Telecommunications PLC 9.625% 20305 | $7,758 | $10,513 |
| CBS Corp. 3.50% 2025 | 15,000 | 14,322 |
| CBS Corp. 4.60% 2045 | 25,000 | 22,316 |
| CCO Holdings LLC and CCO Holdings Capital Corp. 4.50% 2024 | 12,500 | 12,494 |
| CCO Holdings LLC and CCO Holdings Capital Corp. 4.908% 2025 | 10,000 | 9,953 |
| CCO Holdings LLC and CCO Holdings Capital Corp. 6.484% 2045 | 16,350 | 16,929 |
| CCO Holdings LLC and CCO Holdings Capital Corp. 5.375% 2047 | 16,365 | 14,899 |
| Comcast Corp. 3.95% 2025 | 38,738 | 39,248 |
| Comcast Corp. 3.15% 2026 | 11,215 | 10,746 |
| Comcast Corp. 2.35% 2027 | 17,000 | 15,231 |
| Comcast Corp. 4.15% 2028 | 32,414 | 32,973 |
| Comcast Corp. 3.20% 2036 | 7,250 | 6,256 |
| Comcast Corp. 6.45% 2037 | 15,000 | 17,939 |
| Comcast Corp. 3.90% 2038 | 12,750 | 11,840 |
| Comcast Corp. 4.60% 2038 | 39,225 | 39,729 |
| Comcast Corp. 4.60% 2045 | 20,000 | 19,557 |
| Comcast Corp. 4.00% 2048 | 14,000 | 12,808 |
| Comcast Corp. 4.70% 2048 | 41,390 | 42,214 |
| Deutsche Telekom International Finance BV 1.95% 20213 | 10,000 | 9,601 |
| Deutsche Telekom International Finance BV 2.82% 20223 | 45,985 | 45,000 |
| Deutsche Telekom International Finance BV 3.60% 20273 | 37,214 | 35,178 |
| Deutsche Telekom International Finance BV 9.25% 2032 | 6,194 | 8,828 |
| France Télécom 4.125% 2021 | 20,000 | 20,411 |
| NBCUniversal Enterprise, Inc. 5.25% 20493 | 5,730 | 5,816 |
| Orange SA 2.75% 2019 | 5,010 | 5,007 |
| Orange SA 5.50% 2044 | 14,000 | 15,040 |
| Time Warner Inc. 3.80% 2027 | 6,045 | 5,685 |
| Verizon Communications Inc. 3.50% 2024 | 8,500 | 8,415 |
| Verizon Communications Inc. 4.125% 2027 | 26,900 | 26,982 |
| Verizon Communications Inc. 4.50% 2033 | 23,000 | 22,782 |
| Verizon Communications Inc. 4.40% 2034 | 14,875 | 14,391 |
| Verizon Communications Inc. 4.272% 2036 | 47,680 | 44,802 |
| Verizon Communications Inc. 4.125% 2046 | 30,000 | 26,609 |
| Verizon Communications Inc. 4.862% 2046 | 9,750 | 9,631 |
| Vodafone Group PLC 3.75% 2024 | 41,200 | 40,651 |
| Vodafone Group PLC 4.125% 2025 | 33,000 | 32,660 |
| Vodafone Group PLC 4.375% 2028 | 17,500 | 17,019 |
| Vodafone Group PLC 5.00% 2038 | 10,000 | 9,408 |
| Vodafone Group PLC 5.25% 2048 | 10,000 | 9,434 |
| | | 836,987 |
| Industrials 0.58% | | |
| 3M Co. 2.25% 2026 | 10,000 | 9,263 |
| 3M Co. 3.625% 2028 | 9,058 | 9,234 |
| American Airlines, Inc., Series 2013-2, Class A, 4.95% 20247 | 7,775 | 7,900 |
| Continental Airlines, Inc., Series 1999-1, Class A, 6.545% 20207 | 3,017 | 3,025 |
| Continental Airlines, Inc., Series 1999-2, Class A1, 7.256% 20217 | 121 | 123 |
| Continental Airlines, Inc., Series 2001-1, Class A1, 6.703% 20227 | 1,054 | 1,122 |
| Continental Airlines, Inc., Series 2000-2, Class A1, 7.707% 20227 | 363 | 379 |
| Continental Airlines, Inc., Series 2000-1, Class A1, 8.048% 20227 | 1,733 | 1,791 |
| CSX Corp. 3.80% 2028 | 43,025 | 42,319 |
| CSX Corp. 4.25% 2029 | 14,593 | 14,856 |
| CSX Corp. 4.30% 2048 | 19,000 | 18,190 |
| CSX Corp. 4.75% 2048 | 20,000 | 20,367 |
American Balanced Fund — Page 17 of 33
Bonds, notes & other debt instruments (continued)
Corporate bonds & notes (continued)
Industrials (continued) | Principal amount
(000) | Value
(000) |
| ERAC USA Finance Co. 2.70% 20233 | $1,375 | $1,300 |
| FedEx Corp. 4.75% 2045 | 35,000 | 33,164 |
| Fortive Corp. 1.80% 2019 | 924 | 913 |
| Fortive Corp. 2.35% 2021 | 6,505 | 6,346 |
| General Dynamics Corp. 3.375% 2023 | 33,964 | 34,217 |
| General Dynamics Corp. 3.50% 2025 | 19,536 | 19,481 |
| General Electric Capital Corp., Series A, 6.00% 2019 | 2,577 | 2,605 |
| General Electric Co. 2.70% 2022 | 11,000 | 10,216 |
| General Electric Co. 4.125% 2042 | 11,000 | 8,610 |
| Honeywell International Inc. 1.85% 2021 | 17,905 | 17,310 |
| Lockheed Martin Corp. 3.10% 2023 | 4,710 | 4,672 |
| Lockheed Martin Corp. 3.55% 2026 | 18,885 | 18,777 |
| Northrop Grumman Corp. 2.93% 2025 | 56,745 | 53,941 |
| Northrop Grumman Corp. 3.25% 2028 | 23,975 | 22,459 |
| Rockwell Collins, Inc. 1.95% 2019 | 8,465 | 8,404 |
| Rockwell Collins, Inc. 2.80% 2022 | 36,585 | 35,585 |
| Rockwell Collins, Inc. 3.20% 2024 | 17,295 | 16,674 |
| Roper Technologies, Inc. 2.80% 2021 | 9,660 | 9,470 |
| Roper Technologies, Inc. 3.80% 2026 | 8,325 | 8,136 |
| Siemens AG 2.70% 20223 | 51,020 | 50,078 |
| Southwest Airlines Co. 2.75% 2019 | 6,255 | 6,233 |
| Thomson Reuters Corp. 4.30% 2023 | 4,500 | 4,590 |
| Thomson Reuters Corp. 3.35% 2026 | 12,410 | 11,539 |
| Thomson Reuters Corp. 5.65% 2043 | 2,000 | 2,131 |
| Union Pacific Corp. 3.75% 2025 | 24,640 | 24,920 |
| Union Pacific Corp. 3.95% 2028 | 30,000 | 30,038 |
| United Technologies Corp. 3.10% 2022 | 14,783 | 14,487 |
| United Technologies Corp. 3.65% 2023 | 60,837 | 60,659 |
| United Technologies Corp. 3.95% 2025 | 42,127 | 41,880 |
| United Technologies Corp. 3.125% 2027 | 33,000 | 30,552 |
| United Technologies Corp. 4.125% 2028 | 10,480 | 10,427 |
| Waste Management, Inc. 2.90% 2022 | 15,000 | 14,769 |
| | | 743,152 |
| Information technology 0.44% | | |
| Apple Inc. 2.75% 2025 | 31,000 | 29,930 |
| Apple Inc. 2.90% 2027 | 20,000 | 18,863 |
| Apple Inc. 3.00% 2024 | 10,000 | 9,882 |
| Broadcom Ltd. 3.00% 2022 | 66,262 | 63,767 |
| Broadcom Ltd. 2.65% 2023 | 31,000 | 28,875 |
| Broadcom Ltd. 3.625% 2024 | 159,363 | 150,934 |
| Broadcom Ltd. 3.875% 2027 | 47,990 | 43,153 |
| Broadcom Ltd. 3.50% 2028 | 28,198 | 24,491 |
| Intel Corp. 3.70% 2025 | 22,000 | 22,220 |
| Microsoft Corp. 1.55% 2021 | 11,600 | 11,273 |
| Microsoft Corp. 2.40% 2026 | 15,000 | 14,051 |
| Microsoft Corp. 3.30% 2027 | 21,655 | 21,484 |
| Microsoft Corp. 4.20% 2035 | 18,000 | 18,713 |
| Microsoft Corp. 4.10% 2037 | 10,750 | 11,073 |
| Microsoft Corp. 3.70% 2046 | 15,000 | 14,477 |
| Visa Inc. 2.80% 2022 | 23,000 | 22,723 |
| Visa Inc. 3.15% 2025 | 49,000 | 48,220 |
| | | 554,129 |
American Balanced Fund — Page 18 of 33
Bonds, notes & other debt instruments (continued)
Corporate bonds & notes (continued)
Real estate 0.38% | Principal amount
(000) | Value
(000) |
| Alexandria Real Estate Equities, Inc. 3.95% 2028 | $3,970 | $3,844 |
| American Campus Communities, Inc. 3.35% 2020 | 21,070 | 21,003 |
| American Campus Communities, Inc. 3.75% 2023 | 11,715 | 11,641 |
| American Campus Communities, Inc. 4.125% 2024 | 10,965 | 11,025 |
| American Campus Communities, Inc. 3.625% 2027 | 8,932 | 8,416 |
| American Tower Corp. 3.40% 2019 | 13,550 | 13,558 |
| American Tower Corp. 3.55% 2027 | 6,815 | 6,408 |
| American Tower Corp. 3.60% 2028 | 15,000 | 14,050 |
| Brandywine Operating Partnership, LP 3.95% 2023 | 1,639 | 1,632 |
| Corporate Office Properties LP 3.60% 2023 | 6,000 | 5,828 |
| Corporate Office Properties LP 5.25% 2024 | 20,030 | 20,786 |
| Corporate Office Properties LP 5.00% 2025 | 1,235 | 1,260 |
| EPR Properties 4.75% 2026 | 29,600 | 29,342 |
| EPR Properties 4.50% 2027 | 20,125 | 19,441 |
| ERP Operating LP 4.75% 2020 | 12,000 | 12,232 |
| Essex Portfolio LP 3.875% 2024 | 27,215 | 27,321 |
| Essex Portfolio LP 3.50% 2025 | 27,075 | 26,362 |
| Essex Portfolio LP 3.375% 2026 | 2,395 | 2,294 |
| Hospitality Properties Trust 4.25% 2021 | 30,925 | 31,028 |
| Hospitality Properties Trust 5.00% 2022 | 4,350 | 4,446 |
| Hospitality Properties Trust 4.50% 2023 | 21,940 | 22,145 |
| Hospitality Properties Trust 4.95% 2027 | 11,000 | 10,802 |
| Hospitality Properties Trust 3.95% 2028 | 12,610 | 11,392 |
| Prologis, Inc. 4.25% 2023 | 20,000 | 20,666 |
| Public Storage 2.37% 2022 | 8,640 | 8,348 |
| Scentre Group 2.375% 20193 | 14,845 | 14,704 |
| Scentre Group 3.25% 20253 | 1,780 | 1,696 |
| Scentre Group 3.50% 20253 | 10,415 | 10,102 |
| Scentre Group 3.75% 20273 | 13,620 | 13,170 |
| Select Income REIT 3.60% 2020 | 8,000 | 7,962 |
| WEA Finance LLC 2.70% 20193 | 5,395 | 5,372 |
| WEA Finance LLC 3.25% 20203 | 26,437 | 26,402 |
| WEA Finance LLC 3.75% 20243 | 200 | 199 |
| Welltower Inc. 3.95% 2023 | 20,600 | 20,671 |
| Westfield Corp. Ltd. 3.15% 20223 | 35,935 | 35,408 |
| | | 480,956 |
| Materials 0.27% | | |
BHP Billiton Finance Ltd. 6.25% 2075
(USD Semi Annual 30/360 (vs. 3M LIBOR) 5Y + 4.971% on 10/19/2020)3,5 | 3,175 | 3,250 |
| Chevron Phillips Chemical Co. LLC 3.30% 20233 | 9,750 | 9,650 |
| Chevron Phillips Chemical Co. LLC 3.70% 20283 | 25,000 | 24,668 |
| Dow Chemical Co. 4.55% 20253 | 40,434 | 41,212 |
| DowDuPont Inc. 4.205% 2023 | 25,835 | 26,444 |
| DowDuPont Inc. 4.493% 2025 | 55,750 | 57,507 |
| DowDuPont Inc. 4.725% 2028 | 25,835 | 26,846 |
| Eastman Chemical Co. 2.70% 2020 | 6,518 | 6,471 |
| Eastman Chemical Co. 3.80% 2025 | 7,405 | 7,153 |
| Ecolab Inc. 4.35% 2021 | 816 | 839 |
| Ecolab Inc. 5.50% 2041 | 204 | 236 |
| Ecolab Inc. 3.95% 2047 | 1,664 | 1,568 |
| Georgia-Pacific Corp. 2.539% 20193 | 21,000 | 20,844 |
| Holcim Ltd. 5.15% 20233 | 17,000 | 17,523 |
| International Paper Co. 7.30% 2039 | 7,835 | 9,271 |
American Balanced Fund — Page 19 of 33
Bonds, notes & other debt instruments (continued)
Corporate bonds & notes (continued)
Materials (continued) | Principal amount
(000) | Value
(000) |
| Mosaic Co. 3.25% 2022 | $19,000 | $18,569 |
| Mosaic Co. 4.05% 2027 | 17,940 | 17,056 |
| Sherwin-Williams Co. 2.25% 2020 | 19,000 | 18,713 |
| Sherwin-Williams Co. 2.75% 2022 | 8,730 | 8,457 |
| Sherwin-Williams Co. 3.125% 2024 | 4,260 | 4,072 |
| Sherwin-Williams Co. 3.45% 2027 | 10,930 | 10,213 |
| Westlake Chemical Corp. 4.375% 2047 | 23,435 | 19,739 |
| | | 350,301 |
| Bonds & notes of governments & government agency outside the U.S. 0.01% | | |
| PT Indonesia Asahan Aluminium Tbk 5.23% 20213 | 2,492 | 2,528 |
| PT Indonesia Asahan Aluminium Tbk 6.757% 20483 | 10,101 | 10,379 |
| | | 12,907 |
| Total corporate bonds & notes | | 16,550,136 |
U.S. Treasury bonds & notes 12.79%
U.S. Treasury 10.59% | | |
| U.S. Treasury 1.25% 2019 | 25,000 | 24,899 |
| U.S. Treasury 1.875% 2019 | 100,000 | 99,301 |
| U.S. Treasury 1.25% 2020 | 120,000 | 118,279 |
| U.S. Treasury 1.375% 2020 | 443,000 | 436,665 |
| U.S. Treasury 1.50% 2020 | 101,000 | 99,550 |
| U.S. Treasury 1.625% 2020 | 25,000 | 24,726 |
| U.S. Treasury 2.75% 2020 | 45,000 | 45,181 |
| U.S. Treasury 1.125% 2021 | 187,250 | 180,820 |
| U.S. Treasury 1.25% 2021 | 100,900 | 98,291 |
| U.S. Treasury 1.375% 2021 | 162,000 | 158,347 |
| U.S. Treasury 1.375% 2021 | 101,350 | 98,891 |
| U.S. Treasury 1.75% 2021 | 69,250 | 67,881 |
| U.S. Treasury 2.00% 2021 | 75,000 | 74,015 |
| U.S. Treasury 2.25% 2021 | 97,270 | 96,772 |
| U.S. Treasury 2.375% 2021 | 166,984 | 166,660 |
| U.S. Treasury 2.750% 2021 | 30,000 | 30,220 |
| U.S. Treasury 1.875% 2022 | 100,000 | 98,182 |
| U.S. Treasury 1.875% 2022 | 77,000 | 75,446 |
| U.S. Treasury 1.875% 2022 | 75,195 | 73,602 |
| U.S. Treasury 2.00% 2022 | 180,000 | 176,825 |
| U.S. Treasury 2.00% 2022 | 35,000 | 34,525 |
| U.S. Treasury 2.125% 2022 | 220,000 | 217,015 |
| U.S. Treasury 1.375% 2023 | 100,000 | 95,082 |
| U.S. Treasury 1.375% 2023 | 36,935 | 35,175 |
| U.S. Treasury 1.625% 2023 | 36,000 | 34,723 |
| U.S. Treasury 2.375% 2023 | 40,000 | 39,824 |
| U.S. Treasury 2.50% 2023 | 131,046 | 131,086 |
| U.S. Treasury 2.625% 2023 | 750,725 | 754,771 |
| U.S. Treasury 2.75% 2023 | 180,200 | 182,157 |
| U.S. Treasury 2.75% 2023 | 20,100 | 20,311 |
| U.S. Treasury 2.875% 2023 | 1,468,522 | 1,494,397 |
| U.S. Treasury 2.00% 2024 | 59,750 | 58,189 |
| U.S. Treasury 2.125% 2024 | 100,000 | 97,848 |
| U.S. Treasury 2.125% 2024 | 88,500 | 86,775 |
| U.S. Treasury 2.25% 2024 | 670,750 | 659,428 |
| U.S. Treasury 2.25% 2024 | 50,000 | 49,365 |
American Balanced Fund — Page 20 of 33
Bonds, notes & other debt instruments (continued)
U.S. Treasury bonds & notes (continued)
U.S. Treasury (continued) | Principal amount
(000) | Value
(000) |
| U.S. Treasury 2.00% 2025 | $30,000 | $29,027 |
| U.S. Treasury 2.125% 2025 | 25,000 | 24,334 |
| U.S. Treasury 2.50% 2025 | 521,243 | 519,351 |
| U.S. Treasury 2.625% 2025 | 471,224 | 472,402 |
| U.S. Treasury 2.625% 2025 | 62,796 | 62,992 |
| U.S. Treasury 2.75% 2025 | 305,266 | 308,319 |
| U.S. Treasury 2.75% 2025 | 10,765 | 10,875 |
| U.S. Treasury 2.875% 2025 | 440,059 | 447,760 |
| U.S. Treasury 2.875% 2025 | 331,426 | 337,408 |
| U.S. Treasury 3.00% 2025 | 735,000 | 754,095 |
| U.S. Treasury 3.00% 2025 | 600,000 | 615,468 |
| U.S. Treasury 2.00% 2026 | 72,620 | 69,330 |
| U.S. Treasury 2.25% 2027 | 80,250 | 77,944 |
| U.S. Treasury 2.375% 2027 | 4,350 | 4,262 |
| U.S. Treasury 2.75% 2028 | 10,941 | 11,008 |
| U.S. Treasury 2.875% 2028 | 600,000 | 609,888 |
| U.S. Treasury 2.875% 2028 | 156,768 | 159,305 |
| U.S. Treasury 3.125% 2028 | 624,390 | 648,423 |
| U.S. Treasury 5.375% 2031 | 20,000 | 25,453 |
| U.S. Treasury 2.75% 2042 | 32,950 | 31,580 |
| U.S. Treasury 2.875% 2043 | 36,410 | 35,600 |
| U.S. Treasury 3.125% 2043 | 48,025 | 49,056 |
| U.S. Treasury 3.125% 2044 | 39,797 | 40,665 |
| U.S. Treasury 3.625% 2044 | 25,000 | 27,730 |
| U.S. Treasury 2.50% 2045 | 115,000 | 104,320 |
| U.S. Treasury 3.00% 2045 | 25,000 | 24,977 |
| U.S. Treasury 3.00% 2045 | 25,000 | 24,976 |
| U.S. Treasury 2.50% 20469 | 52,120 | 47,065 |
| U.S. Treasury 2.875% 2046 | 225,000 | 219,082 |
| U.S. Treasury 2.75% 20479 | 333,000 | 315,840 |
| U.S. Treasury 3.00% 2047 | 60,062 | 59,892 |
| U.S. Treasury 3.00% 20489 | 669,573 | 667,437 |
| U.S. Treasury 3.00% 2048 | 4,047 | 4,031 |
| U.S. Treasury 3.125% 20489 | 150,676 | 153,753 |
| U.S. Treasury 3.375% 2048 | 233,990 | 250,552 |
| | | 13,479,424 |
| U.S. Treasury inflation-protected securities 2.20% | | |
| U.S. Treasury Inflation-Protected Security 2.125% 201910 | 58,890 | 58,790 |
| U.S. Treasury Inflation-Protected Security 0.125% 202110 | 106,693 | 103,784 |
| U.S. Treasury Inflation-Protected Security 0.625% 202310 | 585,367 | 576,235 |
| U.S. Treasury Inflation-Protected Security 0.125% 202410 | 103,301 | 99,131 |
| U.S. Treasury Inflation-Protected Security 0.625% 202410 | 356,063 | 350,720 |
| U.S. Treasury Inflation-Protected Security 0.375% 202510 | 171,144 | 165,086 |
| U.S. Treasury Inflation-Protected Security 2.375% 202510 | 67,076 | 72,514 |
| U.S. Treasury Inflation-Protected Security 0.125% 202610 | 168,790 | 158,505 |
| U.S. Treasury Inflation-Protected Security 0.375% 202710 | 233,705 | 222,043 |
| U.S. Treasury Inflation-Protected Security 0.375% 202710 | 39,282 | 37,336 |
| U.S. Treasury Inflation-Protected Security 0.50% 202810 | 308,881 | 294,936 |
| U.S. Treasury Inflation-Protected Security 0.75% 202810 | 151,108 | 148,001 |
| U.S. Treasury Inflation-Protected Security 1.75% 202810 | 32,469 | 34,501 |
| U.S. Treasury Inflation-Protected Security 0.75% 204210 | 54,292 | 49,361 |
| U.S. Treasury Inflation-Protected Security 1.375% 204410 | 128,520 | 133,069 |
| U.S. Treasury Inflation-Protected Security 1.00% 204610 | 75,708 | 71,905 |
American Balanced Fund — Page 21 of 33
Bonds, notes & other debt instruments (continued)
U.S. Treasury bonds & notes (continued)
U.S. Treasury inflation-protected securities (continued) | Principal amount
(000) | Value
(000) |
| U.S. Treasury Inflation-Protected Security 0.875% 204710 | $125,719 | $115,591 |
| U.S. Treasury Inflation-Protected Security 1.00% 204810 | 139,827 | 106,808 |
| | | 2,798,316 |
| Total U.S. Treasury bonds & notes | | 16,277,740 |
| Mortgage-backed obligations 7.57% | | |
| Arroyo Mortgage Trust, Series 2018-1, Class A1, 3.763% 20483,7,8 | 9,695 | 9,696 |
| Cascade Funding Mortgage Trust, Series 2018-RM2, Class A, 4.00% 20682,3,7 | 14,647 | 14,723 |
| CHL Mortgage Pass-Through Trust, Series 2003-56, Class 6A1, 4.846% 20337,8 | 983 | 1,008 |
| Citigroup Commercial Mortgage Trust, Series 2015-GC29, Class AAB, 2.984% 20487 | 3,370 | 3,350 |
| Commercial Mortgage Trust, Series 2015-PC1, Class A5, 3.902% 20507 | 15,265 | 15,600 |
Connecticut Avenue Securities, Series 2014-C02, Class 1M1,
(1-month USD-LIBOR + 0.95%) 3.456% 20247,8 | 49 | 49 |
| Connecticut Avenue Securities, Series 2014-C01, Class M1, (1-month USD-LIBOR + 1.60%) 4.106% 20243,7,8 | 182 | 183 |
| CS First Boston Mortgage Securities Corp., Series 2002-34, Class IA1, 7.50% 20327 | 313 | 345 |
| CS First Boston Mortgage Securities Corp., Series 2002-30, Class IA1, 7.50% 20327 | 144 | 161 |
| CS First Boston Mortgage Securities Corp., Series 2004-5, Class IVA1, 6.00% 20347 | 1,782 | 1,818 |
| CSAIL Commercial Mortgage Trust, Series 2015-C4, Class ASB, 3.6167% 20487 | 5,600 | 5,667 |
| DBUBS Mortgage Trust, Series 2011-LC1A, Class A3, 5.002% 20463,7 | 9,500 | 9,778 |
| Fannie Mae 5.50% 20337 | 1,807 | 1,946 |
| Fannie Mae 5.50% 20337 | 1,621 | 1,748 |
| Fannie Mae 5.50% 20337 | 199 | 214 |
| Fannie Mae 3.50% 20347,11 | 2,000 | 2,025 |
| Fannie Mae 4.00% 20347,11 | 100,000 | 102,332 |
| Fannie Mae 5.00% 20357 | 636 | 671 |
| Fannie Mae 6.50% 20357 | 1,716 | 1,944 |
| Fannie Mae 3.00% 20367 | 86,973 | 86,160 |
| Fannie Mae 6.00% 20367 | 497 | 540 |
| Fannie Mae 3.00% 20377 | 79,773 | 79,028 |
| Fannie Mae 3.00% 20377 | 42,547 | 42,150 |
| Fannie Mae 3.00% 20377 | 33,995 | 33,677 |
| Fannie Mae 6.00% 20377 | 4,726 | 5,148 |
| Fannie Mae 6.50% 20377 | 1,107 | 1,250 |
| Fannie Mae 6.50% 20377 | 668 | 742 |
| Fannie Mae 6.50% 20387 | 1,501 | 1,701 |
| Fannie Mae 5.50% 20397 | 45 | 49 |
| Fannie Mae 4.50% 20407 | 8,166 | 8,561 |
| Fannie Mae 4.50% 20407 | 6,392 | 6,701 |
| Fannie Mae 4.50% 20407 | 4,428 | 4,642 |
| Fannie Mae 5.00% 20407 | 3,526 | 3,746 |
| Fannie Mae 5.00% 20407 | 2,281 | 2,423 |
| Fannie Mae 5.00% 20407 | 943 | 1,001 |
| Fannie Mae 5.00% 20407 | 801 | 851 |
| Fannie Mae 4.00% 20417 | 8,729 | 8,982 |
| Fannie Mae 4.00% 20417 | 6,858 | 7,057 |
| Fannie Mae 4.00% 20417 | 5,453 | 5,612 |
| Fannie Mae 4.50% 20417 | 5,731 | 6,009 |
| Fannie Mae 5.00% 20417 | 1,336 | 1,420 |
| Fannie Mae 5.00% 20417 | 1,260 | 1,339 |
| Fannie Mae 5.00% 20417 | 1,020 | 1,084 |
| Fannie Mae 5.00% 20417 | 906 | 963 |
| Fannie Mae 5.00% 20417 | 830 | 878 |
| Fannie Mae 5.00% 20417 | 789 | 838 |
American Balanced Fund — Page 22 of 33
Bonds, notes & other debt instruments (continued)
Mortgage-backed obligations (continued) | Principal amount
(000) | Value
(000) |
| Fannie Mae 5.00% 20417 | $775 | $823 |
| Fannie Mae 5.00% 20417 | 530 | 563 |
| Fannie Mae 5.00% 20417 | 393 | 413 |
| Fannie Mae 5.00% 20417 | 317 | 336 |
| Fannie Mae 5.00% 20417 | 269 | 286 |
| Fannie Mae 5.00% 20417 | 165 | 176 |
| Fannie Mae 5.00% 20417 | 128 | 134 |
| Fannie Mae 5.00% 20417 | 95 | 101 |
| Fannie Mae 5.00% 20417 | 93 | 98 |
| Fannie Mae 5.00% 20417 | 63 | 66 |
| Fannie Mae 5.00% 20417 | 19 | 20 |
| Fannie Mae 5.00% 20417 | 12 | 13 |
| Fannie Mae 3.50% 20427 | 16,034 | 16,169 |
| Fannie Mae 4.00% 20427 | 2,125 | 2,186 |
| Fannie Mae 4.00% 20427 | 1,486 | 1,529 |
| Fannie Mae 5.00% 20427 | 245 | 257 |
| Fannie Mae 3.50% 20437 | 19,883 | 20,051 |
| Fannie Mae 3.50% 20437 | 13,576 | 13,690 |
| Fannie Mae 3.50% 20437 | 9,989 | 10,049 |
| Fannie Mae 3.50% 20437 | 4,395 | 4,423 |
| Fannie Mae 3.50% 20437 | 1,838 | 1,850 |
| Fannie Mae 3.50% 20437 | 1,308 | 1,319 |
| Fannie Mae 4.00% 20437 | 12,284 | 12,583 |
| Fannie Mae 4.00% 20437 | 447 | 462 |
| Fannie Mae 4.00% 20437 | 315 | 326 |
| Fannie Mae 4.00% 20437 | 286 | 295 |
| Fannie Mae 4.50% 20437 | 9,860 | 10,277 |
| Fannie Mae 3.50% 20447 | 66,414 | 66,706 |
| Fannie Mae 3.50% 20457 | 44,922 | 45,113 |
| Fannie Mae 3.50% 20457 | 16,233 | 16,319 |
| Fannie Mae 3.50% 20457 | 11,873 | 11,919 |
| Fannie Mae 4.00% 20457 | 55,894 | 57,505 |
| Fannie Mae 4.00% 20457 | 30,668 | 31,552 |
| Fannie Mae 4.00% 20457 | 27,477 | 28,256 |
| Fannie Mae 4.00% 20457 | 22,525 | 23,174 |
| Fannie Mae 3.00% 20467 | 171,850 | 167,845 |
| Fannie Mae 3.50% 20467 | 79,337 | 79,683 |
| Fannie Mae 3.50% 20467 | 39,182 | 39,290 |
| Fannie Mae 3.50% 20467 | 23,832 | 23,943 |
| Fannie Mae 3.50% 20467 | 20,389 | 20,465 |
| Fannie Mae 3.50% 20467 | 17,369 | 17,415 |
| Fannie Mae 3.50% 20467 | 16,386 | 16,457 |
| Fannie Mae 3.50% 20467 | 12,295 | 12,339 |
| Fannie Mae 4.00% 20467 | 61,893 | 63,240 |
| Fannie Mae 4.00% 20467 | 35,256 | 36,000 |
| Fannie Mae 4.00% 20467 | 27,851 | 28,432 |
| Fannie Mae 4.00% 20467 | 3,818 | 3,914 |
| Fannie Mae 4.00% 20467 | 3,811 | 3,890 |
| Fannie Mae 4.00% 20467 | 2,439 | 2,497 |
| Fannie Mae 3.50% 20477 | 101,477 | 101,548 |
| Fannie Mae 3.50% 20477 | 82,165 | 82,536 |
| Fannie Mae 3.50% 20477 | 66,165 | 66,211 |
| Fannie Mae 3.50% 20477 | 42,575 | 42,604 |
| Fannie Mae 3.50% 20477 | 20,299 | 20,313 |
| Fannie Mae 3.50% 20477 | 19,132 | 19,145 |
American Balanced Fund — Page 23 of 33
Bonds, notes & other debt instruments (continued)
Mortgage-backed obligations (continued) | Principal amount
(000) | Value
(000) |
| Fannie Mae 3.50% 20477 | $3,093 | $3,103 |
| Fannie Mae 3.50% 20477 | 2,806 | 2,808 |
| Fannie Mae 3.50% 20477 | 2,001 | 2,007 |
| Fannie Mae 4.00% 20477 | 69,626 | 71,048 |
| Fannie Mae 4.00% 20477 | 57,309 | 58,531 |
| Fannie Mae 4.00% 20477 | 51,244 | 52,291 |
| Fannie Mae 4.00% 20477 | 45,577 | 46,508 |
| Fannie Mae 4.00% 20477 | 35,394 | 36,282 |
| Fannie Mae 4.00% 20477 | 17,889 | 18,254 |
| Fannie Mae 4.00% 20477 | 10,486 | 10,700 |
| Fannie Mae 4.00% 20477 | 9,028 | 9,212 |
| Fannie Mae 4.00% 20477 | 7,955 | 8,117 |
| Fannie Mae 4.00% 20477 | 7,358 | 7,510 |
| Fannie Mae 4.50% 20477 | 15,659 | 16,242 |
| Fannie Mae 6.50% 20477 | 105 | 109 |
| Fannie Mae 6.50% 20477 | 60 | 62 |
| Fannie Mae 7.00% 20477 | 97 | 107 |
| Fannie Mae 7.00% 20477 | 49 | 54 |
| Fannie Mae 7.00% 20477 | 25 | 27 |
| Fannie Mae 7.00% 20477 | 9 | 10 |
| Fannie Mae 3.50% 20487 | 314,235 | 314,464 |
| Fannie Mae 3.50% 20487 | 87,252 | 87,312 |
| Fannie Mae 3.50% 20487 | 59,389 | 59,504 |
| Fannie Mae 3.50% 20487 | 45,592 | 45,624 |
| Fannie Mae 3.50% 20487 | 40,957 | 40,985 |
| Fannie Mae 3.50% 20487 | 33,858 | 33,882 |
| Fannie Mae 3.50% 20487 | 24,103 | 24,135 |
| Fannie Mae 3.50% 20487 | 20,603 | 20,617 |
| Fannie Mae 3.50% 20487 | 18,994 | 19,031 |
| Fannie Mae 3.50% 20487 | 16,694 | 16,706 |
| Fannie Mae 3.50% 20487 | 12,961 | 12,986 |
| Fannie Mae 3.50% 20487 | 9,126 | 9,133 |
| Fannie Mae 3.50% 20487 | 4,869 | 4,877 |
| Fannie Mae 4.00% 20487 | 166,181 | 169,569 |
| Fannie Mae 4.00% 20487 | 129,871 | 132,519 |
| Fannie Mae 4.00% 20487 | 69,529 | 70,991 |
| Fannie Mae 4.00% 20487 | 20,472 | 20,890 |
| Fannie Mae 4.00% 20487 | 12,058 | 12,303 |
| Fannie Mae 4.00% 20487 | 11,000 | 11,224 |
| Fannie Mae 4.00% 20487 | 10,138 | 10,345 |
| Fannie Mae 4.00% 20487 | 9,863 | 10,064 |
| Fannie Mae 4.00% 20487 | 8,266 | 8,435 |
| Fannie Mae 4.00% 20487 | 7,783 | 7,942 |
| Fannie Mae 4.00% 20487 | 6,000 | 6,122 |
| Fannie Mae 4.00% 20487 | 4,835 | 4,933 |
| Fannie Mae 4.00% 20487 | 4,000 | 4,082 |
| Fannie Mae 4.00% 20487 | 2,000 | 2,041 |
| Fannie Mae 4.00% 20487 | 1,381 | 1,409 |
| Fannie Mae 4.00% 20487 | 1,000 | 1,020 |
| Fannie Mae 4.00% 20487 | 746 | 761 |
| Fannie Mae 4.00% 20487 | 500 | 510 |
| Fannie Mae 4.00% 20487 | 435 | 444 |
| Fannie Mae 4.00% 20487 | 405 | 413 |
| Fannie Mae 4.00% 20487 | 300 | 306 |
| Fannie Mae 4.00% 20487 | 266 | 272 |
American Balanced Fund — Page 24 of 33
Bonds, notes & other debt instruments (continued)
Mortgage-backed obligations (continued) | Principal amount
(000) | Value
(000) |
| Fannie Mae 4.00% 20487 | $105 | $107 |
| Fannie Mae 4.50% 20487 | 249,314 | 258,588 |
| Fannie Mae 4.50% 20487 | 108,144 | 112,167 |
| Fannie Mae 4.50% 20487 | 75,791 | 78,610 |
| Fannie Mae 4.50% 20487 | 5,561 | 5,768 |
| Fannie Mae 4.50% 20487 | —12 | —12 |
| Fannie Mae 3.50% 20497,11 | 54,000 | 54,012 |
| Fannie Mae 4.50% 20497,11 | 126,500 | 131,073 |
| Fannie Mae 3.50% 20577 | 56,640 | 56,416 |
| Fannie Mae 3.50% 20587 | 62,807 | 62,558 |
| Fannie Mae, Series 2001-4, Class NA, 9.073% 20257,8 | 1 | 1 |
| Fannie Mae, Series 2001-T10, Class A1, 7.00% 20417 | 176 | 201 |
| Fannie Mae, Series 2012-M9, Class A2, Multi Family, 2.482% 20227 | 17,512 | 17,347 |
| Fannie Mae, Series 2012-M5, Class A2, Multi Family, 2.715% 20227 | 13,372 | 13,297 |
| Fannie Mae, Series 2014-M1, Class A2, Multi Family, 3.214% 20237,8 | 14,926 | 15,152 |
| Fannie Mae, Series 2013-M14, Class A2, Multi Family, 3.329% 20237,8 | 18,707 | 19,185 |
| Fannie Mae, Series 2014-M2, Class A2, Multi Family, 3.513% 20237,8 | 16,240 | 16,639 |
| Fannie Mae, Series 2014-M9, Class A2, Multi Family, 3.103% 20247,8 | 16,865 | 17,000 |
| Fannie Mae, Series 2014-M3, Class A2, Multi Family, 3.46% 20247,8 | 18,000 | 18,453 |
| Fannie Mae, Series 2017-M3, Class A2, Multi Family, 2.485% 20267,8 | 38,665 | 36,602 |
| Fannie Mae, Series 2017-M7, Class A2, Multi Family, 2.961% 20277,8 | 22,406 | 21,859 |
| Fannie Mae, Series 2006-43, Class JO, principal only, 0% 20367 | 772 | 659 |
| Flagstar Mortgage Trust, Series 2018-3INV, Class A3, 4.00% 20483,7,8 | 46,804 | 46,969 |
| Freddie Mac 6.50% 20277 | 341 | 371 |
| Freddie Mac 6.50% 20277 | 203 | 220 |
| Freddie Mac 6.50% 20277 | 41 | 44 |
| Freddie Mac 6.50% 20287 | 241 | 273 |
| Freddie Mac 3.00% 20337 | 21,908 | 21,837 |
| Freddie Mac 3.00% 20337 | 5,484 | 5,466 |
| Freddie Mac 3.50% 20337 | 76,661 | 77,632 |
| Freddie Mac 3.00% 20377 | 45,562 | 45,085 |
| Freddie Mac 3.00% 20377 | 35,158 | 34,790 |
| Freddie Mac 5.50% 20377 | 297 | 317 |
| Freddie Mac 5.50% 20377 | 34 | 37 |
| Freddie Mac 5.50% 20387 | 125 | 134 |
| Freddie Mac 5.50% 20387 | 51 | 55 |
| Freddie Mac 6.00% 20387 | 918 | 999 |
| Freddie Mac 5.50% 20397 | 197 | 211 |
| Freddie Mac 4.50% 20407 | 7,490 | 7,849 |
| Freddie Mac 4.50% 20407 | 589 | 615 |
| Freddie Mac 4.50% 20417 | 1,473 | 1,537 |
| Freddie Mac 4.50% 20417 | 1,022 | 1,070 |
| Freddie Mac 4.50% 20417 | 481 | 501 |
| Freddie Mac 4.50% 20417 | 442 | 463 |
| Freddie Mac 4.50% 20417 | 109 | 113 |
| Freddie Mac 4.50% 20417 | 50 | 52 |
| Freddie Mac 5.00% 20417 | 366 | 387 |
| Freddie Mac 3.50% 20427 | 1,326 | 1,332 |
| Freddie Mac 4.00% 20427 | 10,500 | 10,808 |
| Freddie Mac 3.50% 20437 | 1,107 | 1,115 |
| Freddie Mac 4.00% 20437 | 720 | 739 |
| Freddie Mac 4.00% 20437 | 629 | 647 |
| Freddie Mac 4.00% 20437 | 346 | 357 |
| Freddie Mac 3.50% 20447 | 25,522 | 25,726 |
| Freddie Mac 4.00% 20447 | 11,876 | 12,144 |
American Balanced Fund — Page 25 of 33
Bonds, notes & other debt instruments (continued)
Mortgage-backed obligations (continued) | Principal amount
(000) | Value
(000) |
| Freddie Mac 4.00% 20447 | $4,540 | $4,669 |
| Freddie Mac 3.203% 20457,8 | 4,731 | 4,766 |
| Freddie Mac 3.50% 20457 | 4,388 | 4,406 |
| Freddie Mac 3.50% 20457 | 274 | 275 |
| Freddie Mac 3.50% 20457 | 22 | 22 |
| Freddie Mac 4.00% 20457 | 29,612 | 30,500 |
| Freddie Mac 4.00% 20457 | 16,917 | 17,424 |
| Freddie Mac 4.00% 20457 | 10,449 | 10,734 |
| Freddie Mac 4.00% 20457 | 10,210 | 10,489 |
| Freddie Mac 4.00% 20457 | 4,549 | 4,647 |
| Freddie Mac 3.00% 20467 | 28,765 | 28,285 |
| Freddie Mac 3.50% 20467 | 45,861 | 45,944 |
| Freddie Mac 3.50% 20467 | 39,265 | 39,318 |
| Freddie Mac 3.50% 20467 | 16,485 | 16,522 |
| Freddie Mac 3.50% 20467 | 12,325 | 12,349 |
| Freddie Mac 3.50% 20467 | 11,396 | 11,428 |
| Freddie Mac 3.50% 20467 | 9,922 | 9,954 |
| Freddie Mac 3.50% 20467 | 6,121 | 6,132 |
| Freddie Mac 3.50% 20467 | 4,794 | 4,812 |
| Freddie Mac 3.50% 20467 | 311 | 312 |
| Freddie Mac 3.50% 20467 | 52 | 52 |
| Freddie Mac 3.50% 20467 | 36 | 37 |
| Freddie Mac 4.00% 20467 | 43,848 | 44,731 |
| Freddie Mac 4.00% 20467 | 24,284 | 24,872 |
| Freddie Mac 4.00% 20467 | 19,251 | 19,662 |
| Freddie Mac 4.00% 20467 | 13,863 | 14,160 |
| Freddie Mac 4.00% 20467 | 7,461 | 7,653 |
| Freddie Mac 4.00% 20467 | 3,015 | 3,079 |
| Freddie Mac 4.00% 20467 | 1,955 | 2,005 |
| Freddie Mac 4.50% 20467 | 2,794 | 2,898 |
| Freddie Mac 4.50% 20467 | 1,448 | 1,502 |
| Freddie Mac 3.50% 20477 | 243,692 | 243,787 |
| Freddie Mac 3.50% 20477 | 118,785 | 118,894 |
| Freddie Mac 3.50% 20477 | 102,474 | 102,513 |
| Freddie Mac 3.50% 20477 | 93,327 | 93,364 |
| Freddie Mac 3.50% 20477 | 64,806 | 64,844 |
| Freddie Mac 3.50% 20477 | 55,908 | 55,942 |
| Freddie Mac 3.50% 20477 | 46,334 | 46,371 |
| Freddie Mac 3.50% 20477 | 23,780 | 23,789 |
| Freddie Mac 3.50% 20477 | 23,642 | 23,651 |
| Freddie Mac 3.50% 20477 | 12,720 | 12,771 |
| Freddie Mac 3.50% 20477 | 603 | 605 |
| Freddie Mac 4.00% 20477 | 119,070 | 121,645 |
| Freddie Mac 4.00% 20477 | 64,305 | 65,634 |
| Freddie Mac 4.00% 20477 | 45,382 | 46,320 |
| Freddie Mac 4.00% 20477 | 44,837 | 45,753 |
| Freddie Mac 4.00% 20477 | 13,894 | 14,223 |
| Freddie Mac 4.00% 20477 | 6,980 | 7,131 |
| Freddie Mac 4.50% 20477 | 17,427 | 18,064 |
| Freddie Mac 4.50% 20477 | 9,342 | 9,689 |
| Freddie Mac 3.50% 20487 | 116,854 | 116,892 |
| Freddie Mac 3.50% 20487 | 93,715 | 93,747 |
| Freddie Mac 3.50% 20487 | 89,915 | 89,941 |
| Freddie Mac 3.50% 20487 | 35,851 | 35,860 |
| Freddie Mac 3.50% 20487 | 31,051 | 31,062 |
American Balanced Fund — Page 26 of 33
Bonds, notes & other debt instruments (continued)
Mortgage-backed obligations (continued) | Principal amount
(000) | Value
(000) |
| Freddie Mac 3.50% 20487 | $12,280 | $12,296 |
| Freddie Mac 4.00% 20487 | 248,047 | 253,039 |
| Freddie Mac 4.00% 20487 | 177,618 | 181,193 |
| Freddie Mac 4.00% 20487 | 94,040 | 95,933 |
| Freddie Mac 4.00% 20487 | 57,892 | 59,058 |
| Freddie Mac 4.00% 20487 | 30,856 | 31,484 |
| Freddie Mac 4.00% 20487 | 17,883 | 18,244 |
| Freddie Mac 4.00% 20487 | 2,390 | 2,438 |
| Freddie Mac 4.00% 20487 | 1,542 | 1,573 |
| Freddie Mac 4.50% 20487 | 12,587 | 13,045 |
| Freddie Mac 4.50% 20497 | 43,000 | 44,529 |
| Freddie Mac 4.753% 20407,8 | 43 | 45 |
| Freddie Mac, Series 2014-DN2, Class M2, (1-month USD-LIBOR + 1.65%) 4.156% 20247,8 | 4,306 | 4,339 |
| Freddie Mac, Series 2014-HQ2, Class M2, (1-month USD-LIBOR + 2.20%) 4.706% 20247,8 | 7,157 | 7,310 |
| Freddie Mac, Series 2014-HQ1, Class M2, (1-month USD-LIBOR + 2.50%) 5.006% 20247,8 | 297 | 298 |
| Freddie Mac, Series 2015-HQ2, Class M2, (1-month USD-LIBOR + 1.95%) 4.456% 20257,8 | 3,205 | 3,256 |
| Freddie Mac, Series T-041, Class 3A, 5.487% 20327,8 | 1,287 | 1,373 |
| Freddie Mac, Series 3318, Class JT, 5.50% 20377 | 2,112 | 2,268 |
| Freddie Mac, Series KS01, Class A1, Multi Family, 1.693% 20227 | 1,499 | 1,476 |
| Freddie Mac, Series K019, Class A2, Multi Family, 2.272% 20227 | 16,000 | 15,741 |
| Freddie Mac, Series K021, Class A2, Multi Family, 2.396% 20227 | 16,555 | 16,316 |
| Freddie Mac, Series K723, Class A2, Multi Family, 2.454% 20237 | 17,125 | 16,775 |
| Freddie Mac, Series KS01, Class A2, Multi Family, 2.522% 20237 | 1,075 | 1,060 |
| Freddie Mac, Series K034, Class A1, Multi Family, 2.669% 20237 | 5,016 | 5,007 |
| Freddie Mac, Series K725, Class A2, Multi Family, 3.002% 20247 | 44,445 | 44,533 |
| Freddie Mac, Series K044, Class A2, Multi Family, 2.811% 20257 | 13,505 | 13,339 |
| Freddie Mac, Series K733, Class A2, Multi Family, 3.75% 20257,8 | 71,500 | 74,149 |
| Freddie Mac, Series K057, Class A2, Multi Family, 2.57% 20267 | 37,740 | 36,300 |
| Freddie Mac, Series K066, Class A2, Multi Family, 3.117% 20277 | 28,540 | 28,286 |
| Freddie Mac, Series K067, Class A2, Multi Family, 3.194% 20277 | 49,815 | 49,594 |
| Freddie Mac, Series K069, Class A2, Multi Family, 3.187% 20277,8 | 20,520 | 20,379 |
| Freddie Mac, Series K070, Class A2, Multi Family, 3.303% 20277,8 | 44,290 | 44,333 |
| Freddie Mac, Series K063, Class A2, Multi Family, 3.43% 20277 | 17,500 | 17,756 |
| Freddie Mac, Series K072, Class A2, Multi Family, 3.444% 20277 | 15,040 | 15,213 |
| Freddie Mac, Series K073, Class A2, Multi Family, 3.35% 20287 | 24,286 | 24,388 |
| Freddie Mac, Series K075, Class A2, Multi Family, 3.65% 20287,8 | 19,920 | 20,465 |
| Freddie Mac, Series K085, Class A2, Multi Family, 3.75% 20287,8 | 19,250 | 20,366 |
| Freddie Mac, Series K077, Class A2, Multi Family, 3.85% 20287 | 13,160 | 13,720 |
| Freddie Mac, Series K076, Class A2, Multi Family, 3.90% 20287 | 98,604 | 103,173 |
| Freddie Mac, Series K080, Class A2, Multi Family, 3.926% 20287,8 | 70,530 | 73,942 |
| Freddie Mac, Series 3156, Class PO, principal only, 0% 20367 | 2,077 | 1,776 |
| Freddie Mac Seasoned Credit Risk Transfer Trust, Series 2017-2, Class HA, 2.50% 20567 | 78,360 | 77,037 |
| Freddie Mac Seasoned Credit Risk Transfer Trust, Series 2017-3, Class HA, 2.50% 20567 | 46,294 | 45,971 |
| Freddie Mac Seasoned Credit Risk Transfer Trust, Series 2017-1, Class HA, 2.75% 20567,8 | 34,852 | 33,927 |
| Freddie Mac Seasoned Credit Risk Transfer Trust, Series 2017-2, Class MA, 3.00% 20567 | 74,434 | 71,894 |
| Freddie Mac Seasoned Credit Risk Transfer Trust, Series 2017-1, Class MA, 3.00% 20567 | 9,495 | 9,371 |
| Freddie Mac Seasoned Credit Risk Transfer Trust, Series 2017-4, Class HT, 2.50% 20577,8 | 15,502 | 15,106 |
| Freddie Mac Seasoned Credit Risk Transfer Trust, Series 2018-2, Class MT, 3.50% 20577 | 28,895 | 28,590 |
| Freddie Mac Seasoned Credit Risk Transfer Trust, Series 2017-4, Class MT, 3.50% 20577 | 12,062 | 11,985 |
| Freddie Mac Seasoned Loan Structured Transaction, Series 2018-2, Class A1, 3.50% 20287,8 | 16,314 | 16,040 |
| Government National Mortgage Assn. 6.00% 20387 | 3,326 | 3,613 |
| Government National Mortgage Assn. 4.00% 20417 | 7,927 | 8,175 |
| Government National Mortgage Assn. 4.00% 20447 | 125 | 129 |
| Government National Mortgage Assn. 4.50% 20457 | 10,384 | 10,894 |
| Government National Mortgage Assn. 4.50% 20457 | 244 | 256 |
American Balanced Fund — Page 27 of 33
Bonds, notes & other debt instruments (continued)
Mortgage-backed obligations (continued) | Principal amount
(000) | Value
(000) |
| Government National Mortgage Assn. 3.00% 20467 | $98,040 | $96,639 |
| Government National Mortgage Assn. 4.00% 20477 | 109,062 | 111,814 |
| Government National Mortgage Assn. 4.00% 20477 | 63,629 | 65,253 |
| Government National Mortgage Assn. 4.00% 20477 | 12,990 | 13,318 |
| Government National Mortgage Assn. 4.00% 20477 | 10,571 | 10,838 |
| Government National Mortgage Assn. 3.50% 20487 | 124,858 | 125,807 |
| Government National Mortgage Assn. 3.50% 20487 | 87,276 | 87,939 |
| Government National Mortgage Assn. 3.50% 20487 | 84,083 | 84,722 |
| Government National Mortgage Assn. 3.50% 20487 | 56,308 | 56,736 |
| Government National Mortgage Assn. 4.00% 20487 | 296,820 | 304,310 |
| Government National Mortgage Assn. 4.00% 20487 | 82,489 | 84,570 |
| Government National Mortgage Assn. 4.00% 20487 | 3,621 | 3,713 |
| Government National Mortgage Assn. 4.50% 20487 | 227,852 | 235,995 |
| Government National Mortgage Assn. 4.50% 20487 | 71,722 | 74,297 |
| Government National Mortgage Assn. 4.50% 20487 | 37,581 | 38,933 |
| Government National Mortgage Assn. 4.50% 20487 | 34,917 | 36,170 |
| Government National Mortgage Assn. 3.50% 20497,11 | 9,470 | 9,535 |
| Government National Mortgage Assn. 5.10% 20617 | 353 | 356 |
| GS Mortgage Securities Corp. II, Series 2015-GS1, Class AAB, 3.553% 20487 | 5,000 | 5,080 |
| J.P. Morgan Chase Commercial Mortgage Securities Trust, Series 2006-LDP9, Class AM, 5.372% 20477 | 4,515 | 4,521 |
| L.A. Arena Funding, LLC, Series 1, Class A, 7.656% 20263,7 | 4,395 | 4,709 |
| LB-UBS Commercial Mortgage Trust, Series 2007-C6, Class AM, 6.114% 20407,8 | 569 | 569 |
| Mello Warehouse Securitization Trust, 2018-W1, Class A (1-month USD-LIBOR + 0.85%) 3.356% 20513,7,8 | 13,525 | 13,555 |
| Morgan Stanley Bank of America Merrill Lynch Trust, Series 2015-C27, Class ASB, 3.557% 20477 | 4,000 | 4,072 |
| Morgan Stanley Bank of America Merrill Lynch Trust, Series 2015-C22, Class ASB, 3.04% 20487 | 3,380 | 3,372 |
| Morgan Stanley Capital I Trust, Series 2014-CPT, Class A, 3.35% 20293,7 | 6,355 | 6,375 |
| Royal Bank of Canada 1.875% 20207 | 18,000 | 17,813 |
| Sequoia Mortgage Trust, Series 2018-CH1, Class A1, 4.00% 20483,7,8 | 30,735 | 31,092 |
| Towd Point Mortgage Trust, Series 2017-1, Class A1, 2.75% 20563,7,8 | 44,711 | 43,910 |
| Wells Fargo Mortgage-backed Securities Trust, Series 2005-AR10, Class IIA6, 4.513% 20357,8 | 3,218 | 3,320 |
| Westpac Banking Corp. 2.25% 20203,7 | 12,500 | 12,379 |
| | | 9,637,677 |
| Asset-backed obligations 0.78% | | |
| Aesop Funding LLC, Series 2013-2A, Class A, 2.97% 20203,7 | 5,512 | 5,509 |
| Aesop Funding LLC, Series 2015-1, Class A, 2.50% 20213,7 | 15,000 | 14,862 |
| Aesop Funding LLC, Series 2015-2A, Class A, 2.63% 20213,7 | 1,150 | 1,138 |
| AmeriCredit Automobile Receivables Trust, Series 2016-3, Class B, 1.80% 20217 | 1,020 | 1,009 |
| AmeriCredit Automobile Receivables Trust, Series 2016-1, Class C, 2.89% 20227 | 4,875 | 4,860 |
Angel Oak Capital Advisors LLC, CLO, Series 2013-9A, Class A1R,
(3-month USD-LIBOR + 1.01%) 3.479% 20253,7,8 | 9,471 | 9,448 |
| Cabela’s Master Credit Card Trust, Series 2016-1, Class A1, 1.78% 20227 | 19,600 | 19,488 |
| Capital One Multi-Asset Execution Trust, Series 2017-A1, Class A1, 2.00% 20237 | 40,000 | 39,570 |
| Citibank Credit Card Issuance Trust, Series 2014-A6, Class A6, 2.15% 20217 | 16,725 | 16,658 |
| CLI Funding V LLC, Series 2013-2A, Class Note, 3.22% 20283,7 | 436 | 432 |
| CPS Auto Receivables Trust, Series 2017-B, Class A, 1.75% 20203,7 | 1,037 | 1,036 |
| CPS Auto Receivables Trust, Series 2015-A, Class B, 2.79% 20213,7 | 263 | 263 |
| CPS Auto Receivables Trust, Series 2016-A, Class C, 3.80% 20213,7 | 10,269 | 10,285 |
| CPS Auto Receivables Trust, Series 2015-A, Class C, 4.00% 20213,7 | 960 | 964 |
| CWABS, Inc., Series 2004-BC1, Class M1, (1-month USD-LIBOR + 0.50%) 3.256% 20347,8 | 1,686 | 1,672 |
| Discover Card Execution Note Trust, Series 2014-A4, Class A4, 2.12% 20217 | 7,595 | 7,567 |
| Drive Auto Receivables Trust, Series 2016-CA, Class C, 3.02% 20213,7 | 9,379 | 9,374 |
| Drive Auto Receivables Trust, Series 2015-AA, Class C, 3.06% 20213,7 | 172 | 172 |
| Drive Auto Receivables Trust, Series 2015-DA, Class C, 3.38% 20213,7 | 2,907 | 2,907 |
| Drive Auto Receivables Trust, Series 2016-AA, Class C, 3.91% 20213,7 | 1,688 | 1,691 |
American Balanced Fund — Page 28 of 33
Bonds, notes & other debt instruments (continued)
Asset-backed obligations (continued) | Principal amount
(000) | Value
(000) |
| Drive Auto Receivables Trust, Series 2017-1, Class C, 2.84% 20227 | $7,175 | $7,167 |
| Drive Auto Receivables Trust, Series 2017-AA, Class C, 2.98% 20223,7 | 10,301 | 10,292 |
| Drive Auto Receivables Trust, Series 2017-2, Class C, 2.75% 20237 | 7,150 | 7,136 |
| Enterprise Fleet Financing LLC, Series 2016-2, Class A2, 1.74% 20223,7 | 2,206 | 2,198 |
| Enterprise Fleet Financing LLC, Series 2017-1, Class A2, 2.13% 20223,7 | 3,749 | 3,727 |
| Enterprise Fleet Financing LLC, Series 2017-1, Class A3, 2.60% 20223,7 | 7,345 | 7,299 |
| Fin. Auth., Student Loan Rev. Ref. Bonds, Series 2015-B-1, (1-month USD-LIBOR + 0.75%) 3.256% 20307,8 | 5,959 | 5,953 |
| First Investors Auto Owner Trust, Series 2014-2A, Class C, 2.70% 20203,7 | 1,904 | 1,904 |
| Ford Credit Auto Owner Trust, Series 2015-1 Class A, 2.12% 20263,7 | 8,500 | 8,415 |
| Ford Credit Auto Owner Trust, Series 2014-2A, 2.31% 20263,7 | 8,880 | 8,819 |
| Ford Credit Auto Owner Trust, Series 2016-1, Class A, 2.31% 20273,7 | 35,370 | 34,902 |
| Ford Credit Auto Owner Trust, Series 2015-2, Class A, 2.44% 20273,7 | 33,450 | 33,181 |
| Ford Credit Auto Owner Trust, Series 2017-1, Class A, 2.62% 20283,7 | 37,335 | 36,814 |
| Ford Credit Auto Owner Trust, Series 2018-2, Class A, 3.47% 20303,7 | 64,300 | 64,953 |
| Ford Credit Auto Owner Trust, Series 2018-1, Class A, 3.19% 20313,7 | 149,970 | 149,024 |
| Ford Credit Floorplan Master Owner Trust, Series 2016-3, Class A1, 1.55% 20217 | 22,500 | 22,328 |
| Ford Credit Floorplan Master Owner Trust, Series 2015-2, Class A1, 1.98% 20227 | 14,390 | 14,237 |
| Global SC Finance II SRL, Series 2017-1A, Class A, 3.85% 20373,7 | 16,588 | 16,624 |
| Hertz Vehicle Financing LLC, Rental Car Asset-Backed Notes, Series 2015-3A, Class A, 2.67% 20213,7 | 5,505 | 5,429 |
| Hertz Vehicle Financing LLC, Rental Car Asset-Backed Notes, Series 2015-1, Class A, 2.73% 20213,7 | 9,113 | 9,039 |
| Hertz Vehicle Financing LLC, Rental Car Asset-Backed Notes, Series 2018-1A, Class A, 3.29% 20243,7 | 23,825 | 23,641 |
| Santander Drive Auto Receivables Trust, Series 2015-2, Class C, 2.44% 20217 | 2,785 | 2,782 |
| Santander Drive Auto Receivables Trust, Series 2016-2, Class C, 2.66% 20217 | 9,155 | 9,122 |
| Santander Drive Auto Receivables Trust, Series 2015-5, Class C, 2.74% 20217 | 1,503 | 1,502 |
| Santander Drive Auto Receivables Trust, Series 2015-3, Class C, 2.74% 20217 | 38 | 38 |
| Santander Drive Auto Receivables Trust, Series 2015-4, Class C, 2.97% 20217 | 4,731 | 4,730 |
| Santander Drive Auto Receivables Trust, Series 2017-1, Class C, 2.58% 20227 | 10,762 | 10,704 |
| Santander Drive Auto Receivables Trust, Series 2016-1, Class C, 3.09% 20227 | 2,625 | 2,625 |
| SMB Private Education Loan Trust, Series 2015-A, Class A2A, 2.49% 20273,7 | 1,493 | 1,473 |
Social Professional Loan Program LLC, Series 2015-C, Class A1,
(1-month USD-LIBOR + 1.05%) 3.556% 20353,7,8 | 1,894 | 1,907 |
| Social Professional Loan Program LLC, Series 2015-D, Class A2, 2.72% 20363,7 | 3,299 | 3,246 |
| South Carolina Student Loan Corp., Series 2014-1, Class A1, (1-month USD-LIBOR + 0.75%) 3.099% 20307,8 | 3,897 | 3,909 |
| South Carolina Student Loan Corp., Series 2014-1, Class A2, (1-month USD-LIBOR + 1.00%) 3.349% 20337,8 | 12,240 | 12,417 |
| Symphony Ltd., CLO, Series 2013-12A, Class AR, (3-month USD-LIBOR + 1.03%) 3.466% 20253,7,8 | 45,052 | 44,910 |
| Synchrony Credfit Card Master Note Trust, Series 2018-A1, Class A1, 3.38% 20247 | 43,980 | 44,399 |
| TAL Advantage V LLC, Series 2013-2A, Class A, 3.55% 20383,7 | 1,473 | 1,467 |
| TAL Advantage V LLC, Series 2014-3A, Class A, 3.27% 20393,7 | 515 | 509 |
| TAL Advantage V LLC, Series 2014-2A, Class A2, 3.33% 20393,7 | 11,294 | 11,210 |
| TAL Advantage V LLC, Series 2014-1A, Class A, 3.51% 20393,7 | 2,666 | 2,653 |
| Triton Container Finance LLC, Series 2017-1A, Class A, 3.52% 20423,7 | 20,802 | 20,537 |
| Triton Container Finance LLC, Series 2017-2A, Class A, 3.62% 20423,7 | 17,978 | 17,666 |
| Verizon Owner Trust, Series 2016-2A, Class A, 1.68% 20213,7 | 14,511 | 14,429 |
| Verizon Owner Trust, Series 2017-2A, Class A, 1.92% 20213,7 | 44,210 | 43,767 |
| Verizon Owner Trust, Series 2017-1A, Class A, 2.06% 20213,7 | 48,825 | 48,470 |
| World Financial Network Credit Card Master Note Trust, Series 2018-A, Class A, 3.07% 20247 | 33,000 | 32,919 |
| World Financial Network Credit Card Master Note Trust, Series 2018-B, Class A, 3.46% 20257 | 31,590 | 31,939 |
| | | 991,317 |
| Bonds & notes of governments & government agencies outside the U.S. 0.38% | | |
| CPPIB Capital Inc. 1.25% 20193 | 23,300 | 23,056 |
| CPPIB Capital Inc. 2.375% 20213 | 26,000 | 25,846 |
| CPPIB Capital Inc. 2.25% 20223 | 25,714 | 25,319 |
| CPPIB Capital Inc. 2.75% 20273 | 26,400 | 25,494 |
| Israel (State of) 3.15% 2023 | 35,000 | 34,948 |
American Balanced Fund — Page 29 of 33
Bonds, notes & other debt instruments (continued)
Bonds & notes of governments & government agencies outside the U.S. (continued) | Principal amount
(000) | Value
(000) |
| Japan Finance Organization for Municipalities 2.125% 20193 | $10,000 | $9,989 |
| Manitoba (Province of) 3.05% 2024 | 13,500 | 13,568 |
| Portuguese Republic 5.125% 2024 | 128,585 | 134,921 |
| Qatar (State of) 3.875% 20233 | 29,400 | 29,780 |
| Qatar (State of) 4.50% 20283 | 14,975 | 15,667 |
| Qatar (State of) 5.103% 20483 | 10,000 | 10,526 |
| Quebec (Province of) 2.375% 2022 | 51,867 | 51,290 |
| Quebec (Province of) 2.75% 2027 | 26,000 | 25,110 |
| Saudi Arabia (Kingdom of) 4.00% 20253 | 42,305 | 42,022 |
| Saudi Arabia (Kingdom of) 3.625% 20283 | 17,150 | 16,261 |
| | | 483,797 |
Municipals 0.25%
Illinois 0.18% | | |
| G.O. Bonds, Pension Funding Series 2003, 4.95% 2023 | 5,810 | 5,902 |
| G.O. Bonds, Pension Funding Series 2003, 5.10% 20337 | 222,845 | 212,812 |
| G.O. Bonds, Pension Funding Series 2013, 5.877% 2019 | 11,840 | 11,893 |
| | | 230,607 |
| California 0.03% | | |
City of Industry, Public Facs. Auth., Tax Allocation Rev. Ref. Bonds (Civic - Recreational-Industrial Redev.
Project No. 1), Series 2015-A, Assured Guaranty Municipal insured, 3.821% 2022 | 11,640 | 11,892 |
| Dept. of Veterans Affairs, Veterans G.O. Rev. Ref. Bonds, Series 2015-CM, AMT, 2.45% 2031 | 1,490 | 1,460 |
| Los Angeles Community College Dist. (County of Los Angeles), G.O. Build America Bonds, 2008 Election, Series 2010-E, 6.60% 2042 | 15,000 | 20,665 |
| | | 34,017 |
| Florida 0.02% | | |
| Board of Administration Fin. Corp., Rev. Bonds, Series 2016-A, 2.638% 2021 | 16,500 | 16,441 |
| Hurricane Catastrophe Fund Fin. Corp., Rev. Bonds, Series 2013-A, 2.995% 2020 | 4,000 | 4,006 |
| | | 20,447 |
| New Jersey 0.01% | | |
Econ. Dev. Auth., School Facs. Construction Rev. Ref. Bonds, Series 2013-I,
(SIFMA Municipal Swap Index + 1.60%) 3.31% 20288 | 5,000 | 4,936 |
| Econ. Dev. Auth., School Facs. Construction Rev. Ref. Bonds, Series 2015-YY, 4.447% 2020 | 12,000 | 12,186 |
| | | 17,122 |
| Michigan 0.01% | | |
| City of Detroit, Sewage Disposal System Rev. Ref. Bonds, Series 2006-D, Assured Guaranty Municipal insured, (3-month USD-LIBOR + 0.60%) 2.205% 20328 | 5,000 | 4,780 |
Fin. Auth., Local Government Loan Program Rev. Bonds (City of Detroit Fin. Recovery
Income Tax Local Project), Series 2014-F-2, 4.60% 2022 | 7,910 | 8,080 |
| | | 12,860 |
| New York 0.00% | | |
| Utility Debt Securitization Auth., Restructuring Bonds, Series 2013-T-1, 2.042% 2021 | 1,414 | 1,410 |
| Utility Debt Securitization Auth., Restructuring Bonds, Series 2013-T-4, 3.435% 2025 | 2,625 | 2,633 |
| | | 4,043 |
American Balanced Fund — Page 30 of 33
Bonds, notes & other debt instruments (continued)
Municipals (continued)
South Dakota 0.00% | Principal amount
(000) | Value
(000) |
| Housing Dev. Auth., Homeownership Mortgage Bonds, Series 2013-E, AMT, 4.00% 2044 | $380 | $391 |
| Housing Dev. Auth., Homeownership Mortgage Bonds, Series 2014-F, 4.00% 2034 | 675 | 682 |
| Housing Dev. Auth., Homeownership Mortgage Bonds, Series 2015-D, 4.00% 2045 | 2,370 | 2,458 |
| | | 3,531 |
| Connecticut 0.00% | | |
| Housing Fin. Auth., Housing Mortgage Fin. Program Bonds, Series 2014-A-1, 4.00% 2044 | 1,030 | 1,062 |
| Maine 0.00% | | |
| Housing Auth., Mortgage Purchase Rev. Ref. Bonds, Series 2014-A-1, AMT, 3.25% 2043 | 405 | 411 |
| Iowa 0.00% | | |
Fin. Auth., Single Family Mortgage Bonds (Mortgage-Backed Securities Program),
Series 2013-1, 2.15% 20437 | 443 | 401 |
| | | 324,501 |
| Federal agency bonds & notes 0.24% | | |
| Fannie Mae 2.00% 2022 | 30,000 | 29,566 |
| Fannie Mae 2.125% 20269 | 45,510 | 43,541 |
| Fannie Mae 6.25% 2029 | 4,000 | 5,129 |
| Federal Home Loan Bank 2.375% 2020 | 200,000 | 199,562 |
| Federal Home Loan Bank 5.50% 2036 | 600 | 776 |
| Private Export Funding Corp. 3.55% 2024 | 25,897 | 26,939 |
| | | 305,513 |
| Total bonds, notes & other debt instruments (cost: $44,907,559,000) | | 44,570,681 |
| Short-term securities 5.65% | | |
| Apple Inc. 2.33%–2.41%due 1/9/2019–1/24/20193 | 22,700 | 22,685 |
| Chevron Corp. 2.46%–2.48%due 1/23/2019–2/4/20193 | 200,000 | 199,644 |
| Coca-Cola Co. 2.32%due 1/11/20193 | 25,000 | 24,981 |
| Emerson Electric Co. 2.50%due 1/22/20193 | 52,100 | 52,022 |
| Fannie Mae 2.23%due 1/7/2019 | 10,500 | 10,496 |
| Federal Home Loan Bank 2.25%–2.40%due 1/10/2019–3/11/2019 | 1,572,500 | 1,567,615 |
| General Dynamics Corp. 2.52%due 1/8/20193 | 50,000 | 49,973 |
| Jupiter Securitization Co., LLC 2.63%due 2/13/20193 | 100,000 | 99,681 |
| Merck & Co. Inc. 2.34%–2.38%due 1/24/2019–1/28/20193 | 109,800 | 109,603 |
| National Rural Utilities Cooperative Finance Corp. 2.50%due 1/29/2019 | 4,100 | 4,092 |
| Paccar Financial Corp. 2.50%due 1/29/2019 | 700 | 699 |
| Pfizer Inc. 2.31%due 1/16/20193 | 50,000 | 49,945 |
| Procter & Gamble Co. 2.42%due 1/28/20193 | 65,100 | 64,973 |
| Simon Property Group, LP 2.31%due 1/7/20193 | 20,000 | 19,991 |
| U.S. Treasury Bills 1.98%–2.44%due 1/15/2019–5/23/2019 | 4,923,700 | 4,901,550 |
| Wal-Mart Stores, Inc. 2.42%due 1/7/20193 | 19,700 | 19,691 |
| Total short-term securities (cost: $7,198,041,000) | | 7,197,641 |
| Total investment securities99.70% (cost: $108,226,463,000) | | 126,939,225 |
| Other assets less liabilities 0.30% | | 376,921 |
| Net assets100.00% | | $127,316,146 |
American Balanced Fund — Page 31 of 33
Futures contracts
| Contracts | Type | Number of
contracts | Expiration | Notional
amount13
(000) | Value at
12/31/201814
(000) | Unrealized
appreciation
(depreciation)
at 12/31/2018
(000) |
| 2 Year U.S. Treasury Note Futures | Long | 24,870 | April 2019 | $4,974,000 | $5,280,212 | $17,287 |
| 5 Year U.S. Treasury Note Futures | Long | 15,118 | April 2019 | 1,511,800 | 1,733,846 | 20,590 |
| 10 Year U.S. Treasury Note Futures | Long | 8,165 | March 2019 | 816,500 | 996,258 | 14,965 |
| 10 Year Ultra U.S. Treasury Note Futures | Short | 1,862 | March 2019 | (186,200) | (242,206) | (7,599) |
| 30 Year Ultra U.S. Treasury Bond Futures | Long | 194 | March 2019 | 19,400 | 31,167 | 1,633 |
| | | | | | | $46,876 |
Swap contracts
Interest rate swaps
| Receive | Pay | Expiration
date | Notional
(000) | Value at
12/31/2018
(000) | Upfront
payments/
receipts
(000) | Unrealized
depreciation
at 12/31/2018
(000) |
| U.S. EFFR | 2.4435% | 12/20/2023 | $152,945 | $(1,174) | $— | $(1,174) |
| U.S. EFFR | 2.45375% | 12/20/2023 | 1,370,053 | (11,178) | — | (11,178) |
| U.S. EFFR | 2.4225% | 12/24/2023 | 627,445 | (4,202) | — | (4,202) |
| | | | | | $— | $(16,554) |
The following footnotes apply to either the individual securities noted or one or more of the securities aggregated and listed as a single line item.
| 1 | Security did not produce income during the last 12 months. |
| 2 | Valued under fair value procedures adopted by authority of the board of trustees. The total value of all such securities was $1,299,622,000, which represented 1.02% of the net assets of the fund. This amount includes $1,284,367,000 related to certain securities trading outside the U.S. whose values were adjusted as a result of significant market movements following the close of local trading. |
| 3 | Acquired in a transaction exempt from registration under Rule 144A or Section 4(2) of the Securities Act of 1933. May be resold in the U.S. in transactions exempt from registration, normally to qualified institutional buyers. The total value of all such securities was $5,010,400,000, which represented 3.94% of the net assets of the fund. |
| 4 | Represents an affiliated company as defined under the Investment Company Act of 1940. |
| 5 | Step bond; coupon rate may change at a later date. |
| 6 | Value determined using significant unobservable inputs. |
| 7 | Principal payments may be made periodically. Therefore, the effective maturity date may be earlier than the stated maturity date. |
| 8 | Coupon rate may change periodically. |
| 9 | All or a portion of this security was pledged as collateral. The total value of pledged collateral was $77,660,000, which represented .06% of the net assets of the fund. |
| 10 | Index-linked bond whose principal amount moves with a government price index. |
| 11 | Purchased on a TBA basis. |
| 12 | Amount less than one thousand. |
| 13 | Notional amount is calculated based on the number of contracts and notional contract size. |
| 14 | Value is calculated based on the notional amount and current market price. |
American Balanced Fund — Page 32 of 33
| Key to abbreviations and symbol |
| ADR = American Depositary Receipts |
| AMT = Alternative Minimum Tax |
| Auth. = Authority |
| CAD = Canadian dollars |
| CLO = Collateralized Loan Obligations |
| Dept. = Department |
| Dev. = Development |
| Dist. = District |
| Econ. = Economic |
| EFFR = Effective Federal Funds Rate |
| Facs. = Facilities |
| Fin. = Finance |
| G.O. = General Obligation |
| LIBOR = London Interbank Offered Rate |
| Redev. = Redevelopment |
| Ref. = Refunding |
| Rev. = Revenue |
| SIFMA = Securities Industry and Financial Markets Association |
| TBA = To-be-announced |
| USD/$ = U.S. dollars |
Additional financial disclosures are included in the fund’s current shareholder report and should be read in conjunction with this report.
Investments are not FDIC-insured, nor are they deposits of or guaranteed by a bank or any other entity, so they may lose value.
Investors should carefully consider investment objectives, risks, charges and expenses. This and other important information is contained in the fund prospectus and summary prospectus, which can be obtained from your financial professional and should be read carefully before investing. You may also call American Funds Service Company (AFS) at (800) 421-4225 or visit the American Funds website at americanfunds.com. Fund shares offered through American Funds Distributors, Inc.
All Capital Group trademarks referenced are registered trademarks owned by The Capital Group Companies, Inc. or an affiliated company. All other company and product names mentioned are the trademarks or registered trademarks of their respective companies.
©2019 Capital Group. All rights reserved.
| MFGEFPX-011-0219O-S66093 | American Balanced Fund — Page 33 of 33 |
REPORT OF INDEPENDENT REGISTERED PUBLIC ACCOUNTING FIRM ON INVESTMENT PORTFOLIO
To the Shareholders and Board of Trustees of American Balanced Fund:
Opinion on the Investment Portfolio
We have audited the accompanying investment portfolio of American Balanced Fund (the “Fund”), as of December 31, 2018, and the related notes (“investment portfolio”) (included in Item 6 of this Form N-CSR). In our opinion, the investment portfolio presents fairly, in all material respects, the investments in securities of the Fund as of December 31, 2018, in conformity with accounting principles generally accepted in the United States of America.
Basis for Opinion
The investment portfolio is the responsibility of the Fund’s management. Our responsibility is to express an opinion on the investment portfolio based on our audit. We are a public accounting firm registered with the Public Company Accounting Oversight Board (United States) (PCAOB) and are required to be independent with respect to the Fund in accordance with the U.S. federal securities laws and the applicable rules and regulations of the Securities and Exchange Commission and the PCAOB.
We conducted our audit in accordance with the standards of the PCAOB. Those standards require that we plan and perform the audit to obtain reasonable assurance about whether the investment portfolio is free of material misstatement, whether due to error or fraud. The Fund is not required to have, nor were we engaged to perform, an audit of its internal control over financial reporting. As part of our audit we are required to obtain an understanding of internal control over financial reporting but not for the purpose of expressing an opinion on the effectiveness of the Fund's internal control over financial reporting. Accordingly, we express no such opinion.
Our audit included performing procedures to assess the risks of material misstatement of the investment portfolio, whether due to error or fraud, and performing procedures that respond to those risks. Such procedures included examining, on a test basis, evidence regarding the amounts and disclosures in the investment portfolio. Our audit also included evaluating the accounting principles used and significant estimates made by management, as well as evaluating the overall presentation of the investment portfolio. We believe that our audit provides a reasonable basis for our opinion.
DELOITTE & TOUCHE LLP
Costa Mesa, California
February 8, 2019
We have served as the auditor of one or more American Funds investment companies since 1956.
ITEM 7 – Disclosure of Proxy Voting Policies and Procedures for Closed-End Management Investment Companies
Not applicable to this Registrant, insofar as the Registrant is not a closed-end management investment company.
ITEM 8 – Portfolio Managers of Closed-End Management Investment Companies
Not applicable to this Registrant, insofar as the Registrant is not a closed-end management investment company.
ITEM 9 – Purchases of Equity Securities by Closed-End Management Investment Company and Affiliated Purchasers
Not applicable to this Registrant, insofar as the Registrant is not a closed-end management investment company.
ITEM 10 – Submission of Matters to a Vote of Security Holders
There have been no material changes to the procedures by which shareholders may recommend nominees to the Registrant’s board of trustees since the Registrant last submitted a proxy statement to its shareholders. The procedures are as follows. The Registrant has a nominating and governance committee comprised solely of persons who are not considered ‘‘interested persons’’ of the Registrant within the meaning of the Investment Company Act of 1940, as amended. The committee periodically reviews such issues as the board’s composition, responsibilities, committees, compensation and other relevant issues, and recommends any appropriate changes to the full board of trustees. While the committee normally is able to identify from its own resources an ample number of qualified candidates, it will consider shareholder suggestions of persons to be considered as nominees to fill future vacancies on the board. Such suggestions must be sent in writing to the nominating and governance committee of the Registrant, c/o the Registrant’s Secretary, and must be accompanied by complete biographical and occupational data on the prospective nominee, along with a written consent of the prospective nominee for consideration of his or her name by the nominating and governance committee.
ITEM 11 – Controls and Procedures
| (a) | The Registrant’s Principal Executive Officer and Principal Financial Officer have concluded, based on their evaluation of the Registrant’s disclosure controls and procedures (as such term is defined in Rule 30a-3 under the Investment Company Act of 1940), that such controls and procedures are adequate and reasonably designed to achieve the purposes described in paragraph (c) of such rule. |
| | |
| (b) | Effective May 28, 2018, the American Balanced Fund’s investment adviser implemented a new fixed income order management, trading, and compliance system. In connection with introducing this new system, additional automated and manual controls were implemented and some existing controls were modified. None of these changes were in response to any identified deficiency or weakness in the American Balanced Fund’s internal control over financial reporting. |
ITEM 12 – Exhibits
| (a)(1) | The Code of Ethics that is the subject of the disclosure required by Item 2 is attached as an exhibit hereto. |
| | |
| (a)(2) | The certifications required by Rule 30a-2 of the Investment Company Act of 1940 and Sections 302 and 906 of the Sarbanes-Oxley Act of 2002 are attached as exhibits hereto. |
SIGNATURES
Pursuant to the requirements of the Securities Exchange Act of 1934 and the Investment Company Act of 1940, the Registrant has duly caused this report to be signed on its behalf by the undersigned, thereunto duly authorized.
| | AMERICAN BALANCED FUND |
| | |
| | By/s/ Donald H. Rolfe |
| | Donald H. Rolfe, Executive Vice President and Principal Executive Officer |
| | |
| | Date: February 28, 2019 |
Pursuant to the requirements of the Securities Exchange Act of 1934 and the Investment Company Act of 1940, this report has been signed below by the following persons on behalf of the Registrant and in the capacities and on the dates indicated.
| By/s/ Donald H. Rolfe |
Donald H. Rolfe, Executive Vice President and Principal Executive Officer |
| |
| Date: February 28, 2019 |
| By/s/ Hong T. Le |
Hong T. Le, Treasurer and Principal Financial Officer |
| |
| Date: February 28, 2019 |