UNITED STATES
SECURITIES AND EXCHANGE COMMISSION
Washington, D.C. 20549
FORM N-CSR
Certified Shareholder Report of
Registered Management Investment Companies
Investment Company Act File Number: 811-00066
American Balanced Fund
(Exact Name of Registrant as Specified in Charter)
6455 Irvine Center Drive
Irvine, California 92618
(Address of Principal Executive Offices)
Registrant's telephone number, including area code: (213) 486-9200
Date of fiscal year end: December 31
Date of reporting period: December 31, 2015
Michael W. Stockton
American Balanced Fund
333 South Hope Street
Los Angeles, California 90071
(Name and Address of Agent for Service)
ITEM 1 – Reports to Stockholders

Invest in a balanced fund that
has stood the test of time.
Special feature page 6
| | | |
 | | American Balanced Fund®
Annual report
for the year ended
December 31, 2015 |
American Balanced Fund seeks conservation of capital, current income and long-term growth of capital and income.
This fund is one of more than 40 offered by one of the nation’s largest mutual fund families, American Funds, from Capital Group. For more than 80 years, Capital has invested with a long-term focus based on thorough research and attention to risk.
Fund results shown in this report, unless otherwise indicated, are for Class A shares at net asset value. If a sales charge (maximum 5.75%) had been deducted, the results would have been lower. Results are for past periods and are not predictive of results for future periods. Current and future results may be lower or higher than those shown. Share prices and returns will vary, so investors may lose money. Investing for short periods makes losses more likely. Investments are not FDIC-insured, nor are they deposits of or guaranteed by a bank or any other entity, so they may lose value. For current information and month-end results, visit americanfunds.com.
See page 4 for Class A share results with relevant sales charges deducted. For other share class results, visit americanfunds.com and americanfundsretirement.com.
Investment results assume all distributions are reinvested and reflect applicable fees and expenses. When applicable, investment results reflect fee waivers, without which results would have been lower. Visit americanfunds.com for more information.
The fund’s 30-day yield for Class A shares as of January 31, 2016, calculated in accordance with the U.S. Securities and Exchange Commission (SEC) formula, was 1.62%. The fund’s 12-month distribution rate for Class A shares as of that date was 1.56%. Both reflect the 5.75% maximum sales charge. The SEC yield reflects the rate at which the fund is earning income on its current portfolio of securities while the distribution rate reflects the fund’s past dividends paid to shareholders. Accordingly, the fund’s SEC yield and distribution rate may differ.
The return of principal for bond funds and for funds with significant underlying bond holdings is not guaranteed. Fund shares are subject to the same interest rate, inflation and credit risks associated with the underlying bond holdings. Refer to the fund prospectus and the Risk Factors section of this report for more information on these and other risks associated with investing in the fund.

Special feature
Fellow investors:
The year 2015 was a push-and-pull experience for many investors as bouts of market volatility surfaced now and again to temper periods of growth — exactly the type of market that people anticipate when they choose to invest in a balanced fund.
American Balanced Fund (AMBAL) served its shareholders well, gaining 1.72% during that uncertain 12-month timeframe, ended December 31, 2015. In comparison, the 60% S&P 500/40% Barclays U.S. Aggregate Index and the Lipper Balanced Funds Index — two broad benchmark measures for balanced funds — trailed with returns of 1.28% and –0.42%, respectively.
Of course, we, like most of our shareholders, are long-term investors. From that perspective, we are pleased to report that AMBAL’s five-, 10-year and lifetime results were 9.83%, 6.83% and 10.70%, respectively, and that they continue to outpace the long-term results of both the balanced fund index and the 60%/40% blend. (See “Results at a glance” below.)
This should be good news to our many shareholders, particularly those saving for retirement by investing in AMBAL through their employer’s retirement plan. AMBAL remains ranked as one of the top balanced funds available in retirement plans today, according to Pensions & Investments magazine. Additionally, the fund is listed as one of the most popular funds for retirement savers by Kiplinger, which has called AMBAL “a reliable performer.”
2015 market review
January set the stage for what would be a bumpy experience for investors in 2015. Despite a slow but steadily growing U.S. economy, with promising indicators, concerns over oil prices and a global economic slowdown led investors into a volatile start for the year.
Results at a glance
For periods ended December 31, 2015, with all distributions reinvested
| | | Cumulative | | |
| | | total returns | | Average annual total returns |
| | | | | | | | | | | Lifetime |
| | | 1 year | | 5 years | | 10 years | | (since 7/26/75)1 |
| | | | | | | | | |
| AMBAL (Class A shares) | | | 1.72 | % | | | 9.83 | % | | | 6.83 | % | | | 10.70 | % |
| 60% S&P 500/40% Barclays U.S. Aggregate Index2,3 | | | 1.28 | | | | 8.95 | | | | 6.48 | | | | 10.16 | |
| Lipper Balanced Funds Index4 | | | –0.42 | | | | 6.98 | | | | 5.43 | | | | 9.79 | |
The market indexes shown in this report are unmanaged and, therefore, have no expenses. Investors cannot invest directly in an index.
| 1 | Date Capital Research and Management Company began managing the fund. |
| 2 | Blends the S&P 500 Composite Index with the Barclays U.S. Aggregate Index by weighting their total returns at 60% and 40%, respectively. Results assume the blend is rebalanced monthly. |
| 3 | The Barclays U.S. Aggregate Index did not exist until December 31, 1975. For the period between July 31, 1975, and December 31, 1975, Barclays Government/Credit Bond Index results were used. The Barclays indexes are based on July 31, 1975, index value. |
| 4 | Lipper indexes track the largest mutual funds (no more than 30), represented by one share class per fund, in the corresponding Lipper category. |
Another critical contributor to AMBAL’s positive results in 2015 was a defensive asset allocation intended to protect our shareholders in the event of increased volatility. We believe this will continue to prove a wise move.
Shortly thereafter, starting in February, the equity market again began to find its footing. The Dow Jones Industrial Average (DJIA), a measure of the stock market, set new records on several occasions until closing at 18,312 on May 19, 2015, its highest point ever.
Three months later, in late August, the Dow dropped 14% below that record high. While some experts pointed to economic troubles in China as the primary reason behind the drop, and we believe there is some validity to that, we viewed this as a very normal market correction — one for which we were prepared. It is rare to be six years into a bull market without a significant correction. And typically, every few years, the market incurs some sort of adjustment to bring valuations back to reasonable levels.
We are pleased with how AMBAL weathered that downturn. By proactively adjusting our asset allocation to be more defensive than it was last year, our conservative fixed-income portfolio was in a position to benefit from a late-summer rally in the bond market that helped to cushion negative effects from the market drop on the overall fund.
Throughout most of 2015, bond investors balanced expectations for an interest rate hike with worries over the path and pace of any additional increases down the road. Finally, in December, the Federal Reserve announced an increase of 25 basis points to the federal funds interest rate — the first increase from near-zero rates since 2006.
The move was undoubtedly an expression of confidence in the U.S. economy. To help settle investors further, Federal Reserve Board Chair, Janet Yellen, stressed that future increases would be “gradual” and based on inflation.
AMBAL highlights
Throughout a year of uncertainty, AMBAL’s goals remained constant: To protect investor capital (that is, minimize losses in an adverse market environment), while seeking to generate income and provide growth over time.
We pursue those goals prudently, as always, through careful investment selection. The fund invests primarily in blue-chip equities and investment-grade (rated BBB/Baa and above) fixed-income securities with a U.S. emphasis.
A number of sectors in the S&P 500 Composite Index advanced in 2015, led by a 10.11% rise in consumer discretionary. Health care, consumer staples and information technology made more modest gains of 6.89%, 6.60% and 5.92%, respectively. But for the second year in a row, energy proved the worst performing sector at –21.18%, as plunging crude oil prices continued to take their toll.
While AMBAL’s portfolio maintained a lower exposure to energy companies than the S&P 500, select investments, such as Royal Dutch Shell (–33.81%), proved a drag on returns. However, these were not enough to hold the fund back from outpacing its benchmarks.
Results were bolstered, in part, by holdings of consumer discretionary companies that were greater than those of the S&P 500. In fact, Amazon (+117.78%) and Home Depot (+25.99%) were among the fund’s top contributors to this year’s return. Amazon, a detractor for the fund last year, continued to beat quarterly earnings expectations throughout 2015, supported by increased transparency on its various online retail and cloud computing services. Home Depot, too, had better-than-expected earnings for the year.
In addition, strong returns from Microsoft (+19.44%) lifted AMBAL’s results among information technology companies. [Read the article beginning on page 6 for more details on our investment in Microsoft.] And our investment selection among consumer staples companies, such as Philip Morris International (+7.93%), was additive to the fund.
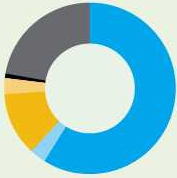
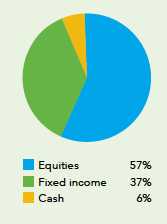
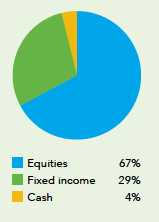
Another critical contributor to AMBAL’s positive results in 2015 was a defensive asset allocation intended to protect our shareholders in the event of increased volatility. We believe this will continue to prove a wise move. In December 2014, the allocation was set at 67% equities, 28% fixed income and 5% cash — a noticeable difference from the year prior when the equity portion was near the maximum of 75% in order to enable investors to benefit from the market’s growth potential. Throughout 2015, we further dialed back the equity portion of the portfolio. By year-end, it was just
below 61%, and we expect to reduce it further in 2016.
In an effort to further protect the fund against potential unrest caused by market concerns over liquidity, the fixed-income portion of the portfolio includes U.S. Treasuries and mortgage-backed securities that offer plenty of liquidity, including Ginnie Mae and Fannie Mae bonds.
Thank you for your support
This year marks the 40th anniversary of the fund under Capital Research and Management Company. We welcome our many new shareholders and wish to assure all of our investors that we will continue to follow our prudent, research-driven approach to investing that has characterized American Balanced Fund for four decades. We look forward to reporting to you again in six months’ time.
Sincerely,

Gregory D. Johnson
Vice Chairman of the Board
and President
February 11, 2016
For current information about the fund, visit americanfunds.com.
The New Geography of Investing®
While most of the companies that AMBAL invests in are based in the U.S., many do business on a global basis. For example, approximately 1% of the companies are based in developing countries, but a meaningful portion of their revenues may come from emerging markets. This is why it’s important to have active management supported by a global research operation when investing in today’s markets.
Equity portion breakdown by domicile (%)

| | Region | | Fund | | | Index |
 | United States | | | 95 | % | | | 100 | % |
 | Canada | | | 1 | | | | — | |
 | Europe | | | 3 | | | | — | |
 | Japan | | | — | * | | | — | |
 | Asia-Pacific ex. Japan | | | — | | | | — | |
 | Emerging markets | | | 1 | | | | — | |
| | Total | | | 100 | % | | | 100 | % |
*Figure is less than 1%.
Equity portion breakdown by revenue (%)
| | Region | | Fund | | | Index |
| United States | | | 59 | % | | | 62 | % |
| Canada | | | 3 | | | | 2 | |
| Europe | | | 12 | | | | 13 | |
| Japan | | | 3 | | | | 3 | |
| Asia-Pacific ex. Japan | | | 1 | | | | 1 | |
| Emerging markets | | | 22 | | | | 19 | |
| | Total | | | 100 | % | | | 100 | % |
Compared with the S&P 500 as a percent of net assets. All figures include convertible securities.
Source: Capital Group (as of December 31, 2015).
The value of a long-term perspective
Fund results shown are for Class A shares and reflect deduction of the maximum sales charge of 5.75% on the $10,000 investment.¹ Thus, the net amount invested was $9,425.2 Results are for past periods and are not predictive of results for future periods. Current and future results may be lower or higher than those shown. Share prices and returns will vary, so investors may lose money. For current information and month-end results, visit americanfunds.com.
The results shown are before taxes on fund distributions and sale of fund shares.
| 1 | As outlined in the prospectus, the sales charge is reduced for accounts (and aggregated investments) of $25,000 or more and is eliminated for purchases of $1 million or more. There is no sales charge on dividends or capital gain distributions that are reinvested in additional shares. |
| 2 | The maximum initial sales charge was 8.50% prior to July 1, 1988. |
| 3 | The market indexes are unmanaged and, therefore, have no expenses. Investors cannot invest directly in an index. |
| 4 | Results of the Lipper Balanced Funds Index do not reflect any sales charges. |
| 5 | Barclays U.S. Aggregate Index represents the U.S. investment-grade fixed-rate bond market. For the period July 31, 1975, to December 31, 1975, Barclays Government/ Credit Bond Index was used. |
| 6 | For the period July 26, 1975 (when Capital Research and Management Company became the fund’s investment adviser) through December 31, 1975. |

How a $10,000 investment has grown
This chart shows how a hypothetical $10,000 investment in American Balanced Fund grew from July 26, 1975 — when Capital Research and Management Company became the fund’s investment adviser — to December 31, 2015. As you can see, the investment grew to $574,022 with all distributions reinvested. The fund’s year-by-year results appear under the chart. You can use this table to estimate how the value of your own holdings has grown.

Celebrating 40 years of change balanced with consistency.

Five of AMBAL’s portfolio managers share their thoughts on the fund.
 |  |  |  |  |
| | | | | |
| Greg Johnson | Hilda Applbaum | John Smet | Jim Mulally | Mike Kerr |
“Change must always be balanced with some degree of consistency.”
Ron D. Burton, American businessman

Standing the test of time
This year, American Balanced Fund (AMBAL) celebrates 40 years with Capital Research and Management Company (CRMC), the investment adviser for American Funds.
Over four decades and seven market cycles, investors have observed historic market highs and some sobering corrections as the Dow Jones Industrial Index gradually rose from 852 in December 1975 to 17,425 in December 2015.
Through it all, the portfolio managers of AMBAL have sought opportunity in change, while working within a framework intended to preserve consistency in results over time and instill peace of mind for investors.
Aligning with shareholder objectives
“Change can be a good thing. But it tends to make people nervous. Our investors want to grow their wealth and generate some income without losing sleep over volatility,” says Greg Johnson, president and portfolio manager of AMBAL.
During the 40 years of CRMC’s management, AMBAL has earned an average annual return of 10.70%. By comparison, the Lipper Balanced Funds Index, a broad measure of balanced funds, returned 9.79%. The difference in these returns, when compounded over many years, can be substantial to an investor, especially one who is about to retire.
“AMBAL provides an easy, hopefully painless way for someone to have a thoughtful investment profile,” explains portfolio manager Hilda Applbaum. “I believe that everyone’s core investments should be either in a balanced fund or managed like one in order to address his or her long-term needs for capital growth, capital preservation and income.”
According to portfolio manager John Smet, “Three tools make all the difference: careful stock selection, a high-quality bond portfolio and flexible asset allocation. I believe that these are what have provided AMBAL shareholders with good returns over time with less volatility and less downside.”
Balancing change with consistency
The fund’s primary way of adding value for shareholders is through individual stock selection. AMBAL’s portfolio managers have built the fund’s portfolio one company at a time, basing each decision on belief in the company’s long-term business prospects. Such convictions are developed over time through extensive research and a value-driven approach to investing. This is known as The Capital SystemSM of investing.
The Capital System combines individual accountability with teamwork. Each of the American Funds is divided into smaller portions that are managed independently by a diverse team of investment professionals. A group of investment analysts also manages one portion of the fund known as the research portfolio.
“Capital spends a great deal of time thinking about the mix of portfolio managers in any given fund,” says Hilda. “Obviously the prospectus dictates how we proceed, but everyone brings their own investment style, background, history and successes to the process. This has allowed for a certain dampening of volatility over time and has shown to improve the diversification of the portfolio.”
“The Capital System is central to how we invest,” says portfolio manager

Jim Mulally. “That won’t ever change. And yet, the system does allow for change in effective ways. For example, it’s designed to smoothly facilitate the redistribution of managers without disrupting the fund. AMBAL used to have two fixed-income managers and we recently added two more.”
The fund also has five equity managers and one balanced manager who invests in both equities and fixed-income securities.
“We’ve had a balanced manager in AMBAL for decades,” says Hilda. “I currently serve in that role and I get to think about relative value in a way that’s different from the other managers. An equity-only manager generally focuses on their primary directive: ‘What are the best investments I can make?’ If the equity manager is concerned about the market or valuations, he or she can consider holding more cash. Similarly, the fixed-income manager may make the cash versus bond decision. But the balanced manager is charged with the equity versus fixed-income decision, based on an assessment of relative value, which can enable me to provide a unique perspective on different issues.”
American Funds shareholders can benefit from the breadth of experience that each of the portfolio managers brings to the fund(s) in which they participate. These professionals average 27 years of investment experience, including 22 years at American Funds, reflecting a career commitment to the long-term investment approach that the company follows.
They are supported by an extensive global research effort that is the backbone of The Capital System. Investment opportunities are identified with a fundamental, bottom-up approach that takes into consideration the company’s financials, management, dividends, revenue growth and competition, amongst other factors.
Portfolio manager Mike Kerr offers some additional perspective: “From about 1985 to 1995, when the active style of money management that we follow was in its heyday, I felt there was a tremendous level of competition from other financial companies that approached investment research exactly the way we did and still do today — with a long-term focus. But now, active management is far less universal and it seems much of the competition has become shorter term oriented and less focused on the fundamentals, sometimes locking themselves into a certain style that is difficult to change as the world and markets change. Our approach to research, which has become more and more unique, enables us to identify individual companies that offer promise even if their industry is out of favor.”
Providing a cushion against volatility
Within AMBAL, the role of fixed income remains constant — to provide income, even when yields are low, as they have been recently — and also act as a buffer when the stock market is down.
“There are periods when stocks do poorly and bonds do well,” clarifies John. “AMBAL has a high-quality portfolio that we think will do well in a period when stocks go down. Bonds are there to be a counter-weight to equities and smooth-out the ride for our investors. That hasn’t changed.”
What has changed, he points out, are the instruments. “Forty years ago,” says John,

1975
AMBAL’s origin actually hails back to 1932. Founded as Commonwealth Investment Company and managed by North American Securities Company, the fund likely appealed to investors who had learned a hard lesson from the stock market crash of 1929, when the Dow Jones Industrial Average fell 84%.
The fund grew over the next 43 years as more and more investors sought to reduce volatility by having a portfolio that held both stocks and bonds.
In 1975, CRMC acquired the fund from then-manager American Express, renaming it American Balanced Fund (AMBAL).
“Change can be a good thing. But it tends to make people nervous. Our investors want to grow their wealth and generate some income without losing sleep over volatility.”
Greg Johnson, president and portfolio manager

| 1985 | | |
| | | |
| 10th anniversary | | |
| | | |
| Top-10 holdings | | |
| Southwestern Bell | 2.8 | % |
| Pacific Telesis | 2.6 | |
| Procter & Gamble | 2.6 | |
| Rohm and Haas | 2.3 | |
| Lucky Stores | 2.3 | |
| Eastman Kodak | 2.3 | |
| Aetna Co. | 2.0 | |
| American Information Technologies | 1.8 | |
| Duke Power Company | 1.7 | |
| Sears Holdings Corp. | 1.6 | |
| | | |
| Top-3 sectors | | |
| Services | 16.6 | % |
| Capital equipment | 11.3 | |
| Energy | 8.6 | |
Year-end asset allocation
Net assets: $148,220*

| 1995 | | |
| | | |
| 20th anniversary | | |
| | | |
| Top-10 holdings | | |
| Phillips Petroleum | 2.0 | % |
| Wal-Mart | 2.0 | |
| 3M | 1.7 | |
| Philip Morris International | 1.6 | |
| Dupont | 1.4 | |
| Allstate | 1.4 | |
| Warner-Lambert | 1.3 | |
| Merck | 1.2 | |
| Ford Motor | 1.1 | |
| CSX | 1.1 | |
| | | |
| Top-3 sectors | | |
| Finance | 13.6 | % |
| Services | 10.9 | |
| Consumer goods | 9.6 | |
Year-end asset allocation

Net assets: $3,047,513*

| 2005 | | |
| | | |
| 30th anniversary | | |
| | | |
| Top-10 holdings | | |
| ExxonMobil | 1.7 | % |
| Microsoft | 1.7 | |
| Altria | 1.6 | |
| Wal-Mart | 1.6 | |
| Citigroup | 1.6 | |
| IBM | 1.5 | |
| General Electric | 1.4 | |
| Royal Dutch Shell | 1.3 | |
| Berkshire Hathaway | 1.3 | |
| BellSouth | 1.2 | |
| | | |
| Top-3 sectors | | |
| Financials | 11.4 | % |
| Information technology | 11.2 | |
| Health care | 8.5 | |
Year-end asset allocation
Net assets: $51,946,551*

| 2015 | | |
| | | |
| 40th anniversary | | |
| | | |
| Top-10 holdings | | |
| Microsoft | 4.0 | % |
| Philip Morris International | 2.6 | |
| Amazon | 2.4 | |
| Comcast | 2.3 | |
| Wells Fargo | 2.1 | |
| Home Depot | 2.1 | |
| Berkshire Hathaway | 1.9 | |
| Coca-Cola | 1.9 | |
| JPMorgan Chase | 1.7 | |
| Lockheed Martin | 1.6 | |
| | | |
| Top-3 sectors | | |
| Financials | 10.8 | % |
| Consumer discretionary | 9.9 | |
| Information technology | 9.8 | |
Year-end asset allocation

Net assets: $84,567,034*
All data shown is as of December 31 of the year indicated.
*Dollars in thousands.

“there weren’t asset-backed securities or commercial mortgage-backed securities.” He also explains that the transparency of how markets trade has evolved over time.
“Today, we have multiple screens where we can see, second-by-second, the prices of Treasury securities. We can transact larger volumes with lower cost. You just didn’t have that kind of technology for trading back in the ’70s or ’80s.”
Appropriately, the holdings in the fixed-income portfolio of AMBAL also change to keep up with — and, hopefully, ahead of — the times. For example, government regulation has prompted many banks around the world to cut back on their bond trading business because it isn’t as lucrative as it once was. This could lead to more volatility in the bond markets going forward. In response, the fixed-income portion of AMBAL is now positioned with a fairly liquid portfolio that the managers believe can help them take advantage of market opportunities as they arise.
Guiding the decisions of the fixed-income portfolio managers, and their ability to analyze individual securities, is our research effort that has evolved over the decades to more fully leverage the power of The Capital System. Jim explains, “Our commitment to research keeps getting stronger and stronger. That’s not just our own internal credit research but also tapping the company’s equity research, which in my opinion is one of the biggest strengths of our fixed-income group. We get a full perspective from people who are looking at companies in different ways.”
Providing additional perspective are two research groups that were recently formed at CRMC. The Portfolio Strategy Group (PSG) provides discipline to the portfolio through defining investment themes that help portfolio managers make more informed, and consistent decisions. It establishes broad, strategic parameters that act as a guide in the construction of AMBAL’s fixed-income portfolio. The Risk and Quantitative Solutions Group (RQS) is a team of risk analysts that uses computer modeling to help portfolio managers better understand the risk within a fund, both now and under different scenarios in the future.
“The RQS Group has become an extremely important part of what we do as investors,” says John. “In the case of AMBAL, they help us fully understand the risks we are taking in our bond portfolio and how fixed income interacts with the equity portfolio.”
Jim agrees, “These changes to our fixed-income group have definitely contributed to AMBAL’s superior long-term investment results.”
Harnessing change through asset allocation
“Markets have a lot of emotion in them. And that manifests itself in continual change. Emotion can drive the valuations of companies and stocks to extremes … in both directions,” says Mike. “While we always adhere to The Capital System of investing, we do have the flexibility to change the way in which we invest for AMBAL, adjusting the emphasis in our portfolio — the ratio of equities to bonds — depending on where we think we are in the market cycle and where we believe the value is.”
He points out that other balanced funds have the ability to adjust their allocations, but few do and not to the extent that AMBAL has.
“At any given time, we seek an optimal balance for AMBAL,” says Greg. “By
How AMBAL is managed
Portfolio managers
AMBAL’s 10 portfolio managers have an average of 30 years of investment experience.* Each is assigned a portion of the overall assets to manage independently, bringing to bear their own personal investment style and highest conviction ideas.
| Hilda L. Applbaum | 29 years |
| Andrew F. Barth | 31 years |
| Alan N. Berro | 30 years |
| Gregory D. Johnson | 22 years |
| Michael T. Kerr | 32 years |
| Jeffrey T. Lager | 21 years |
| James R. Mulally | 40 years |
| Dina N. Perry | 38 years |
| Wesley K.-S. Phoa | 22 years |
| John H. Smet | 34 years |
Investment analysts
The analysts also invest in their strongest convictions through the research portfolio, which is coordinated by Justin Toner.
| * | List of investment professionals and their years of experience are as of the prospectus dated March 1, 2016 (unaudited). |
design, equities can account for as much as 75% and no less than 50% of the AMBAL portfolio.” In 2013, the fund was 74% invested in equities to enable shareholders to benefit from strong growth potential in the equity market.” Currently, the fund is just above 60% equities, a significant move to protect investors in a volatile environment where the direction of the equity market is less clear.
“AMBAL is not a static portfolio,” says Jim. “In the past few years we’ve been active in changing the mix between stocks and bonds — and we’ve proven that this can be a strength. I think a lot of investors are uncomfortable with the idea of doing this themselves, adjusting the mix within their own investment portfolios. It’s reassuring to have professionals that they can trust make those decisions.”
Looking ahead
The importance of balanced investing is a clear concept when one considers how short-term fluctuations can prompt knee-jerk reactions from investors who often have long-term investment goals.
“I think people’s natural predispositions would have some investors act much more risk adverse than is good for their long-term objectives. And there are others who are highly risk tolerant, probably too much so,” says Hilda. “The best way to meet long-term objectives is having a more balanced approach to both risk and return.
“The celebration of AMBAL’s 40th anniversary with Capital is a testament to that approach. Sure, at any time you can point to a fund that may seem better, sexier or momentarily more significant. But times change. The real measure of success, in my mind, is longevity.”
Mike summarizes, “We design our funds to stand the test of time. That’s the American Funds brand. And it’s all due to our core philosophy for managing money: The Capital System. I believe AMBAL will continue to help investors pursue their goals in the decades to come. It will have a 50th anniversary with us at Capital and it will have a 75th anniversary.” ■

Paul Benjamin
Investment analyst
Information technology
Inside the research portfolio
Investment analyst Paul Benjamin describes the importance of the research portfolio to AMBAL and, in turn, to its shareholders.
“It’s worth noting that AMBAL analysts hold no more than two or three stocks at a time. At other firms, where an analyst might recommend six or more stocks, it can be harder to communicate conviction for one particular holding.
“But it’s our research portfolio that provides a real distinction that you just don’t see elsewhere. The ability to actually invest in a portion of the fund creates a critical partnership between analysts and portfolio managers. So when I tell our portfolio managers, ‘Hey, I think you really should take a look at Microsoft,’ and they see that it’s 55% of my research portfolio, that sends a real message. My confidence may inspire them to invest in it as well.”
Today, Microsoft is AMBAL’s largest position.
“We’ve invested in Microsoft for a long time, at first because we saw it as a company with really good assets. But it was in 2013, when the company brought in some visionary new management, supported by a world-class board of directors, that we really built up our position.”
And it’s turned out to be a very good decision. “This year, the company turned around its consumer business — Windows 10 is a very good operating system and their Surface products (tablet and notebook) are selling well. But the biggest attraction for Microsoft lies within their growing enterprise business as an application and infrastructure cloud vendor.
“That part of the industry is undergoing a massive structural change, the kind that only happens every 25 to 30 years. We are 100% convinced that the cloud is the next generation of IT — it’s the future and it’s happening now. This year, Microsoft’s Office 365 will likely pass Salesforce.com as the largest cloud application and their Azure product grew 130%, solidifying its position as the second-largest infrastructure cloud vendor.”
AMBAL may be well-positioned to pursue long-term investment opportunities in this growing area as it is heavily invested in not only Microsoft but Amazon, which is still, by far, the largest infrastructure cloud vendor in the industry.

Summary investment portfolio December 31, 2015
| Investment mix by security type | Percent of net assets |
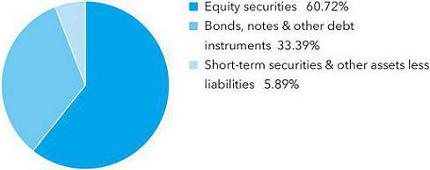
| Common stocks 60.72% | | Shares | | | Value
(000) | |
| Financials 10.76% | | | | | | | | |
| Wells Fargo & Co. | | | 32,477,000 | | | $ | 1,765,450 | |
| Berkshire Hathaway Inc., Class A1 | | | 8,179 | | | | 1,617,806 | |
| JPMorgan Chase & Co. | | | 21,561,000 | | | | 1,423,673 | |
| ACE Ltd. | | | 4,815,000 | | | | 562,633 | |
| Citigroup Inc. | | | 10,500,000 | | | | 543,375 | |
| SunTrust Banks, Inc. | | | 12,500,000 | | | | 535,500 | |
| Other securities | | | | | | | 2,654,615 | |
| | | | | | | | 9,103,052 | |
| | | | | | | | | |
| Consumer discretionary 9.88% | | | | | | | | |
| Amazon.com, Inc.1 | | | 2,954,000 | | | | 1,996,579 | |
| Comcast Corp., Class A | | | 34,370,000 | | | | 1,939,499 | |
| Home Depot, Inc. | | | 13,309,349 | | | | 1,760,161 | |
| Twenty-First Century Fox, Inc., Class A | | | 31,102,306 | | | | 844,739 | |
| Other securities | | | | | | | 1,812,754 | |
| | | | | | | | 8,353,732 | |
| | | | | | | | | |
| Information technology 9.79% | | | | | | | | |
| Microsoft Corp. | | | 61,250,000 | | | | 3,398,150 | |
| Intel Corp. | | | 19,005,100 | | | | 654,726 | |
| Avago Technologies Ltd. | | | 4,124,500 | | | | 598,671 | |
| ASML Holding NV (New York registered) | | | 4,944,401 | | | | 438,915 | |
| ASML Holding NV2 | | | 1,723,143 | | | | 153,560 | |
| Texas Instruments Inc. | | | 9,282,000 | | | | 508,746 | |
| VeriSign, Inc.1 | | | 5,400,000 | | | | 471,744 | |
| TE Connectivity Ltd. | | | 6,655,000 | | | | 429,980 | |
| Other securities | | | | | | | 1,626,045 | |
| | | | | | | | 8,280,537 | |
| | | | | | | | | |
| Consumer staples 8.18% | | | | | | | | |
| Philip Morris International Inc. | | | 24,692,000 | | | | 2,170,674 | |
| Coca-Cola Co. | | | 37,468,000 | | | | 1,609,625 | |
| Procter & Gamble Co. | | | 10,060,000 | | | | 798,865 | |
| Kraft Heinz Co. | | | 9,986,850 | | | | 726,643 | |
| Mondelez International, Inc. | | | 10,000,000 | | | | 448,400 | |
| Other securities | | | | | | | 1,160,045 | |
| | | | | | | | 6,914,252 | |
| | | | | | | | | |
| Health care 6.37% | | | | | | | | |
| UnitedHealth Group Inc. | | | 9,132,500 | | | | 1,074,347 | |
| Merck & Co., Inc. | | | 19,132,406 | | | | 1,010,574 | |
| Express Scripts Holding Co.1 | | | 7,590,000 | | | | 663,442 | |
| Johnson & Johnson | | | 5,610,000 | | | | 576,259 | |
| Bristol-Myers Squibb Co. | | | 7,140,000 | | | | 491,161 | |
| | | Shares | | | Value
(000) | |
| Medtronic PLC | | | 5,851,000 | | | $ | 450,059 | |
| Pfizer Inc. | | | 13,240,000 | | | | 427,387 | |
| Other securities | | | | | | | 694,022 | |
| | | | | | | | 5,387,251 | |
| | | | | | | | | |
| Industrials 6.04% | | | | | | | | |
| Lockheed Martin Corp. | | | 6,194,037 | | | | 1,345,035 | |
| Boeing Co. | | | 8,302,000 | | | | 1,200,386 | |
| General Electric Co. | | | 21,500,000 | | | | 669,725 | |
| Other securities | | | | | | | 1,888,761 | |
| | | | | | | | 5,103,907 | |
| | | | | | | | | |
| Energy 3.87% | | | | | | | | |
| ConocoPhillips | | | 12,010,000 | | | | 560,747 | |
| Royal Dutch Shell PLC, Class B (ADR) | | | 9,868,000 | | | | 454,323 | |
| Royal Dutch Shell PLC, Class B2 | | | 4,000,000 | | | | 91,337 | |
| Chevron Corp. | | | 5,444,755 | | | | 489,810 | |
| Other securities | | | | | | | 1,674,094 | |
| | | | | | | | 3,270,311 | |
| | | | | | | | | |
| Materials 2.23% | | | | | | | | |
| E.I. du Pont de Nemours and Co. | | | 10,807,388 | | | | 719,772 | |
| Praxair, Inc. | | | 5,580,407 | | | | 571,434 | |
| Other securities | | | | | | | 598,244 | |
| | | | | | | | 1,889,450 | |
| | | | | | | | | |
| Other 0.31% | | | | | | | | |
| Other securities | | | | | | | 263,471 | |
| | | | | | | | | |
| Miscellaneous 3.29% | | | | | | | | |
| Other common stocks in initial period of acquisition | | | | | | | 2,781,628 | |
| | | | | | | | | |
| Total common stocks (cost: $33,736,116,000) | | | | | | | 51,347,591 | |
| | | | | | | | | |
| Preferred securities 0.00% | | | | | | | | |
| Financials 0.00% | | | | | | | | |
| Other securities | | | | | | | 4,908 | |
| | | | | | | | | |
| Total preferred securities (cost: $5,208,000) | | | | | | | 4,908 | |
| | | | | | | | | |
| Bonds, notes & other debt instruments 33.39% | Principal amount
(000) | | | | | |
| U.S. Treasury bonds & notes 11.55% | | | | | | | | |
| U.S. Treasury 8.74% | | | | | | | | |
| U.S. Treasury 0.625% 20183 | | $ | 780,000 | | | | 770,429 | |
| U.S. Treasury 1.25% 2020 | | | 617,000 | | | | 607,696 | |
| U.S. Treasury 1.375% 2020 | | | 1,232,875 | | | | 1,211,546 | |
| U.S. Treasury 1.50% 2020 | | | 543,025 | | | | 538,675 | |
| U.S. Treasury 1.625% 2020 | | | 692,750 | | | | 688,850 | |
| U.S. Treasury 1.75% 2022 | | | 510,500 | | | | 500,510 | |
| U.S. Treasury 2.00% 2025 | | | 432,518 | | | | 421,731 | |
| U.S. Treasury 0.63%–5.50% 2016–2045 | | | 2,644,242 | | | | 2,652,493 | |
| | | | | | | | 7,391,930 | |
| | | | | | | | | |
| U.S. Treasury inflation-protected securities 2.81% | | | | | | | | |
| U.S. Treasury Inflation-Protected Security 0.625% 20244 | | | 498,045 | | | | 492,802 | |
| U.S. Treasury Inflation-Protected Security 0.375% 20254 | | | 491,741 | | | | 476,347 | |
| U.S. Treasury Inflation-Protected Securities 0.13%–2.50% 2016–20454 | | | 1,449,650 | | | | 1,402,695 | |
| | | | | | | | 2,371,844 | |
| | | | | | | | | |
| Total U.S. Treasury bonds & notes | | | | | | | 9,763,774 | |
| Bonds, notes & other debt instruments (continued) | Principal amount
(000) | | | | Value
(000) | |
| Corporate bonds & notes 10.97% | | | | | | | | |
| Financials 3.12% | | | | | | | | |
| Berkshire Hathaway Inc. 2.00%–2.90% 2016–2020 | | $ | 48,840 | | | $ | 49,643 | |
| JPMorgan Chase & Co. 1.35%–3.88% 2017–2025 | | | 176,835 | | | | 175,510 | |
| JPMorgan Chase & Co., junior subordinated 5.30%-7.90% (undated) | | | 60,000 | | | | 62,237 | |
| Wells Fargo & Co. 1.25%–4.90% 2016–2045 | | | 130,935 | | | | 133,686 | |
| Other securities | | | | | | | 2,215,968 | |
| | | | | | | | 2,637,044 | |
| | | | | | | | | |
| Health care 1.68% | | | | | | | | |
| UnitedHealth Group Inc. 1.40%–6.00% 2017–2025 | | | 97,050 | | | | 102,309 | |
| Other securities | | | | | | | 1,316,463 | |
| | | | | | | | 1,418,772 | |
| | | | | | | | | |
| Consumer discretionary 1.31% | | | | | | | | |
| 21st Century Fox America, Inc. 3.70% 20255 | | | 11,920 | | | | 11,923 | |
| Amazon.com, Inc. 3.80%–4.95% 2024–2044 | | | 97,075 | | | | 102,112 | |
| Comcast Corp. 3.38%–6.45% 2017–2045 | | | 73,465 | | | | 79,267 | |
| Home Depot, Inc. 3.35%–5.95% 2021–2041 | | | 25,850 | | | | 29,312 | |
| Other securities | | | | | | | 885,112 | |
| | | | | | | | 1,107,726 | |
| | | | | | | | | |
| Consumer staples 0.93% | | | | | | | | |
| Coca-Cola Co. 1.80% 2016 | | | 17,500 | | | | 17,611 | |
| Philip Morris International Inc. 3.25%–4.25% 2024–2044 | | | 65,130 | | | | 65,582 | |
| Other securities | | | | | | | 705,279 | |
| | | | | | | | 788,472 | |
| | | | | | | | | |
| Information technology 0.52% | | | | | | | | |
| Microsoft Corp. 2.65%–4.45% 2022–2045 | | | 75,785 | | | | 76,779 | |
| Other securities | | | | | | | 363,308 | |
| | | | | | | | 440,087 | |
| | | | | | | | | |
| Industrials 0.44% | | | | | | | | |
| Lockheed Martin Corp. 3.10%–4.70% 2023–2046 | | | 71,250 | | | | 72,215 | |
| Other securities | | | | | | | 301,270 | |
| | | | | | | | 373,485 | |
| | | | | | | | | |
| Other corporate bonds & notes 2.97% | | | | | | | | |
| Other securities | | | | | | | 2,514,714 | |
| | | | | | | | | |
| Total corporate bonds & notes | | | | | | | 9,280,300 | |
| | | | | | | | | |
| Mortgage-backed obligations 7.60% | | | | | | | | |
| Fannie Mae 0%–11.00% 2017–20476,7,8 | | | 1,855,516 | | | | 1,940,272 | |
| Freddie Mac 0%–6.50% 2020–20466,7,8 | | | 978,369 | | | | 1,016,501 | |
| Government National Mortgage Assn. 3.50%–10.00% 2021–20617,8 | | | 1,600,151 | | | | 1,698,557 | |
| Other securities | | | | | | | 1,772,674 | |
| | | | | | | | 6,428,004 | |
| | | | | | | | | |
| Federal agency bonds & notes 1.17% | | | | | | | | |
| Fannie Mae 0.38%–6.25% 2016–2029 | | | 299,185 | | | | 301,295 | |
| Federal Home Loan Bank 0.38%–5.50% 2016–2036 | | | 161,365 | | | | 163,364 | |
| Freddie Mac 0.50%–2.50% 2016–2022 | | | 356,705 | | | | 356,552 | |
| Other securities | | | | | | | 171,132 | |
| | | | | | | | 992,343 | |
| | | | | | | | | |
| Other bonds & notes 1.94% | | | | | | | | |
| Other securities | | | | | | | 1,632,516 | |
| | | | | | | | | |
| Miscellaneous 0.16% | | | | | | | | |
| Other bonds & notes in initial period of acquisition | | | | | | | 137,093 | |
| | | | | | | | | |
| Total bonds, notes & other debt instruments (cost: $28,295,404,000) | | | | | | | 28,234,030 | |
| Short-term securities 6.90% | Principal amount
(000) | | | | Value
(000) | |
| Fannie Mae 0.17%–0.33% due 1/4/2016–4/27/2016 | | $ | 553,306 | | | $ | 553,034 | |
| Federal Home Loan Bank 0.10%–0.57% due 1/8/2016–6/27/2016 | | | 3,371,299 | | | | 3,369,366 | |
| Freddie Mac 0.15%–0.51% due 1/4/2016–5/18/2016 | | | 648,800 | | | | 648,488 | |
| U.S. Treasury Bills 0.19%–0.55% due 3/17/2016–6/9/2016 | | | 390,000 | | | | 389,658 | |
| Wells Fargo Bank, N.A. 0.48% due 5/4/2016–5/16/2016 | | | 75,000 | | | | 75,051 | |
| Other securities | | | | | | | 801,272 | |
| | | | | | | | | |
| Total short-term securities (cost: $5,836,376,000) | | | | | | | 5,836,869 | |
| Total investment securities 101.01% (cost: $67,873,104,000) | | | | | | | 85,423,398 | |
| Other assets less liabilities (1.01)% | | | | | | | (856,364 | ) |
| | | | | | | | | |
| Net assets 100.00% | | | | | | $ | 84,567,034 | |
This summary investment portfolio is designed to streamline the report and help investors better focus on the fund’s principal holdings. See the inside back cover for details on how to obtain a complete schedule of portfolio holdings.
As permitted by U.S. Securities and Exchange Commission regulations, “Miscellaneous” securities include holdings in their first year of acquisition that have not previously been publicly disclosed.
“Other securities” includes all issues that are not disclosed separately in the summary investment portfolio.
The following footnotes apply to either the individual securities noted or one or more of the securities aggregated and listed as a single line item.
| 1 | Security did not produce income during the last 12 months. |
| 2 | Valued under fair value procedures adopted by authority of the board of trustees. The total value of all such securities, including those in “Miscellaneous” and “Other securities,” was $819,807,000, which represented .97% of the net assets of the fund. This amount includes $749,293,000 related to certain securities trading outside the U.S. whose values were adjusted as a result of significant market movements following the close of local trading. |
| 3 | A portion of this security was pledged as collateral. The total value of pledged collateral was $1,482,000, which represented less than .01% of the net assets of the fund. |
| 4 | Index-linked bond whose principal amount moves with a government price index. |
| 5 | Acquired in a transaction exempt from registration under Rule 144A or Section 4(2) of the Securities Act of 1933. May be resold in the U.S. in transactions exempt from registration, normally to qualified institutional buyers. The total value of all such securities, including those in “Other securities,” was $3,292,096,000, which represented 3.89% of the net assets of the fund. |
| 6 | Coupon rate may change periodically. |
| 7 | Principal payments may be made periodically. Therefore, the effective maturity date may be earlier than the stated maturity date. |
| 8 | Purchased on a TBA basis. |
Key to abbreviations
ADR = American Depositary Receipts
TBA = To-be-announced
See Notes to Financial Statements
Financial statements
| Statement of assets and liabilities | | | | | | |
| at December 31, 2015 | | (dollars in thousands) | |
| | | | | | | | | |
| Assets: | | | | | | | | |
| Investment securities, at value (cost: $67,873,104) | | | | | | $ | 85,423,398 | |
| Cash | | | | | | | 926 | |
| Receivables for: | | | | | | | | |
| Sales of investments | | $ | 1,437,237 | | | | | |
| Sales of fund’s shares | | | 297,432 | | | | | |
| Dividends and interest | | | 233,838 | | | | | |
| Other | | | 2,060 | | | | 1,970,567 | |
| | | | | | | | 87,394,891 | |
| Liabilities: | | | | | | | | |
| Payables for: | | | | | | | | |
| Purchases of investments | | | 2,461,081 | | | | | |
| Repurchases of fund’s shares | | | 320,124 | | | | | |
| Investment advisory services | | | 16,523 | | | | | |
| Services provided by related parties | | | 24,523 | | | | | |
| Trustees’ deferred compensation | | | 3,641 | | | | | |
| Other | | | 1,965 | | | | 2,827,857 | |
| Net assets at December 31, 2015 | | | | | | $ | 84,567,034 | |
| | | | | | | | | |
| Net assets consist of: | | | | | | | | |
| Capital paid in on shares of beneficial interest | | | | | | $ | 66,349,452 | |
| Undistributed net investment income | | | | | | | 195,437 | |
| Undistributed net realized gain | | | | | | | 472,650 | |
| Net unrealized appreciation | | | | | | | 17,549,495 | |
| Net assets at December 31, 2015 | | | | | | $ | 84,567,034 | |
(dollars and shares in thousands, except per-share amounts)
Shares of beneficial interest issued and outstanding (no stated par value) —
unlimited shares authorized (3,551,239 total shares outstanding)
| | | | | | Shares | | | Net asset value | |
| | | Net assets | | | outstanding | | | per share | |
| Class A | | $ | 49,214,662 | | | | 2,064,975 | | | $ | 23.83 | |
| Class B | | | 279,402 | | | | 11,735 | | | | 23.81 | |
| Class C | | | 6,173,373 | | | | 260,422 | | | | 23.71 | |
| Class F-1 | | | 3,367,274 | | | | 141,382 | | | | 23.82 | |
| Class F-2 | | | 2,634,338 | | | | 110,589 | | | | 23.82 | |
| Class 529-A | | | 2,861,098 | | | | 120,224 | | | | 23.80 | |
| Class 529-B | | | 38,822 | | | | 1,627 | | | | 23.87 | |
| Class 529-C | | | 905,035 | | | | 38,052 | | | | 23.79 | |
| Class 529-E | | | 141,770 | | | | 5,960 | | | | 23.79 | |
| Class 529-F-1 | | | 116,580 | | | | 4,902 | | | | 23.78 | |
| Class R-1 | | | 150,946 | | | | 6,374 | | | | 23.68 | |
| Class R-2 | | | 1,219,609 | | | | 51,463 | | | | 23.70 | |
| Class R-2E | | | 2,574 | | | | 108 | | | | 23.77 | |
| Class R-3 | | | 3,169,590 | | | | 133,606 | | | | 23.72 | |
| Class R-4 | | | 4,431,151 | | | | 186,219 | | | | 23.80 | |
| Class R-5E | | | 9 | | | | — | * | | | 23.82 | |
| Class R-5 | | | 2,571,202 | | | | 107,801 | | | | 23.85 | |
| Class R-6 | | | 7,289,599 | | | | 305,800 | | | | 23.84 | |
*Amount less than one thousand.
See Notes to Financial Statements
| Statement of operations | | | | | | |
| for the year ended December 31, 2015 | | (dollars in thousands) | |
| | | | |
| Investment income: | | | | | | | | |
| Income: | | | | | | | | |
| Dividends (net of non-U.S. taxes of $8,684) | | $ | 1,268,238 | | | | | |
| Interest | | | 604,480 | | | $ | 1,872,718 | |
| Fees and expenses*: | | | | | | | | |
| Investment advisory services | | | 189,337 | | | | | |
| Distribution services | | | 241,786 | | | | | |
| Transfer agent services | | | 74,051 | | | | | |
| Administrative services | | | 21,619 | | | | | |
| Reports to shareholders | | | 2,349 | | | | | |
| Registration statement and prospectus | | | 3,087 | | | | | |
| Trustees’ compensation | | | 401 | | | | | |
| Auditing and legal | | | 773 | | | | | |
| Custodian | | | 451 | | | | | |
| Other | | | 3,822 | | | | 537,676 | |
| Net investment income | | | | | | | 1,335,042 | |
| | | | | | | | | |
| Net realized gain and unrealized depreciation: | | | | | | | | |
| Net realized gain (loss) on: | | | | | | | | |
| Investments (net of non-U.S. taxes of $590) | | | 3,728,765 | | | | | |
| Currency transactions | | | (4,321 | ) | | | 3,724,444 | |
| Net unrealized depreciation on: | | | | | | | | |
| Investments | | | (3,734,057 | ) | | | | |
| Currency translations | | | (96 | ) | | | (3,734,153 | ) |
| Net realized gain and unrealized depreciation | | | | | | | (9,709 | ) |
| | | | | | | | | |
| Net increase in net assets resulting from operations | | | | | | $ | 1,325,333 | |
*Additional information related to class-specific fees and expenses is included in the Notes to Financial Statements.
Statements of changes in net assets
(dollars in thousands)
| | | Year ended December 31 | |
| | | 2015 | | | 2014 | |
| Operations: | | | | | | | | |
| Net investment income | | $ | 1,335,042 | | | $ | 1,155,746 | |
| Net realized gain | | | 3,724,444 | | | | 4,941,354 | |
| Net unrealized (depreciation) appreciation | | | (3,734,153 | ) | | | 271,527 | |
| Net increase in net assets resulting from operations | | | 1,325,333 | | | | 6,368,627 | |
| | | | | | | | | |
| Dividends and distributions paid to shareholders: | | | | | | | | |
| Dividends from net investment income | | | (1,276,612 | ) | | | (1,089,310 | ) |
| Distributions from net realized gain on investments | | | (3,176,474 | ) | | | (4,365,643 | ) |
| Total dividends and distributions paid to shareholders | | | (4,453,086 | ) | | | (5,454,953 | ) |
| | | | | | | | | |
| Net capital share transactions | | | 8,031,108 | | | | 7,862,108 | |
| | | | | | | | | |
| Total increase in net assets | | | 4,903,355 | | | | 8,775,782 | |
| | | | | | | | | |
| Net assets: | | | | | | | | |
| Beginning of year | | | 79,663,679 | | | | 70,887,897 | |
| End of year (including undistributed net investment income: $195,437 and $122,668, respectively) | | $ | 84,567,034 | | | $ | 79,663,679 | |
See Notes to Financial Statements
Notes to financial statements
1. Organization
American Balanced Fund (the “fund”) is registered under the Investment Company Act of 1940 as an open-end, diversified management investment company. The fund seeks conservation of capital, current income, and long-term growth of capital and income.
The fund has 18 share classes consisting of five retail share classes (Classes A, B and C, as well as two F share classes, F-1 and F-2), five 529 college savings plan share classes (Classes 529-A, 529-B, 529-C, 529-E and 529-F-1) and eight retirement plan share classes (Classes R-1, R-2, R2-E, R-3, R-4, R-5E, R-5 and R-6). The 529 college savings plan share classes can be used to save for college education. The retirement plan share classes are generally offered only through eligible employer-sponsored retirement plans. The fund’s share classes are described further in the following table:
| Share class | | Initial sales charge | | Contingent deferred sales charge upon redemption | | Conversion feature | |
| Classes A and 529-A | | Up to 5.75% | | None (except 1% for certain redemptions within one year of purchase without an initial sales charge) | | None | |
| Classes B and 529-B* | | None | | Declines from 5% to 0% for redemptions within six years of purchase | | Classes B and 529-B convert to Classes A and 529-A, respectively, after eight years | |
| Class C | | None | | 1% for redemptions within one year of purchase | | Class C converts to Class F-1 after 10 years | |
| Class 529-C | | None | | 1% for redemptions within one year of purchase | | None | |
| Class 529-E | | None | | None | | None | |
| Classes F-1, F-2 and 529-F-1 | | None | | None | | None | |
| Classes R-1, R-2, R-2E, R-3, R-4, R-5E, R-5 and R-6 | | None | | None | | None | |
*Class B and 529-B shares of the fund are not available for purchase.
On November 20, 2015, the fund made an additional retirement plan share class (Class R-5E) available for sale pursuant to an amendment to its registration statement filed with the U.S. Securities and Exchange Commission. Refer to the fund’s prospectus for more details.
Holders of all share classes have equal pro rata rights to the assets, dividends and liquidation proceeds of the fund. Each share class has identical voting rights, except for the exclusive right to vote on matters affecting only its class. Share classes have different fees and expenses (“class-specific fees and expenses”), primarily due to different arrangements for distribution, transfer agent and administrative services. Differences in class-specific fees and expenses will result in differences in net investment income and, therefore, the payment of different per-share dividends by each share class.
2. Significant accounting policies
The fund is an investment company that applies the accounting and reporting guidance issued in Topic 946 by the U.S. Financial Accounting Standards Board. The fund’s financial statements have been prepared to comply with U.S. generally accepted accounting principles (“U.S. GAAP”). These principles require the fund’s investment adviser to make estimates and assumptions that affect reported amounts and disclosures. Actual results could differ from those estimates. Subsequent events, if any, have been evaluated through the date of issuance in the preparation of the financial statements. The fund follows the significant accounting policies described in this section, as well as the valuation policies described in the next section on valuation.
Security transactions and related investment income — Security transactions are recorded by the fund as of the date the trades are executed with brokers. Realized gains and losses from security transactions are determined based on the specific identified cost of the securities. In the event a security is purchased with a delayed payment date, the fund will segregate liquid assets sufficient to meet its payment obligations. Dividend income is recognized on the ex-dividend date and interest income is recognized on an accrual basis. Market discounts, premiums and original issue discounts on fixed-income securities are amortized daily over the expected life of the security.
Class allocations — Income, fees and expenses (other than class-specific fees and expenses) and realized and unrealized gains and losses are allocated daily among the various share classes based on their relative net assets. Class-specific fees and expenses, such as distribution, transfer agent and administrative services, are charged directly to the respective share class.
Dividends and distributions to shareholders — Dividends and distributions to shareholders are recorded on the ex-dividend date.
Currency translation — Assets and liabilities, including investment securities, denominated in currencies other than U.S. dollars are translated into U.S. dollars at the exchange rates supplied by one or more pricing vendors on the valuation date. Purchases and sales of investment securities and income and expenses are translated into U.S. dollars at the exchange rates on the dates of such transactions. The effects of changes in exchange rates on investment securities are included with the net realized gain or loss and net unrealized appreciation or depreciation on investments in the fund’s statement of operations. The realized gain or loss and unrealized appreciation or depreciation resulting from all other transactions denominated in currencies other than U.S. dollars are disclosed separately.
3. Valuation
Capital Research and Management Company (“CRMC”), the fund’s investment adviser, values the fund’s investments at fair value as defined by U.S. GAAP. The net asset value of each share class of the fund is generally determined as of approximately 4:00 p.m. New York time each day the New York Stock Exchange is open.
Methods and inputs — The fund’s investment adviser uses the following methods and inputs to establish the fair value of the fund’s assets and liabilities. Use of particular methods and inputs may vary over time based on availability and relevance as market and economic conditions evolve.
Equity securities are generally valued at the official closing price of, or the last reported sale price on, the exchange or market on which such securities are traded, as of the close of business on the day the securities are being valued or, lacking any sales, at the last available bid price. Prices for each security are taken from the principal exchange or market on which the security trades.
Fixed-income securities, including short-term securities, are generally valued at prices obtained from one or more pricing vendors. Vendors value such securities based on one or more of the inputs described in the following table. The table provides examples of inputs that are commonly relevant for valuing particular classes of fixed-income securities in which the fund is authorized to invest. However, these classifications are not exclusive, and any of the inputs may be used to value any other class of fixed-income security.
| Fixed-income class | | Examples of standard inputs |
| All | | Benchmark yields, transactions, bids, offers, quotations from dealers and trading systems, new issues, spreads and other relationships observed in the markets among comparable securities; and proprietary pricing models such as yield measures calculated using factors such as cash flows, financial or collateral performance and other reference data (collectively referred to as “standard inputs”) |
| Corporate bonds & notes; convertible securities | | Standard inputs and underlying equity of the issuer |
| Bonds & notes of governments & government agencies | | Standard inputs and interest rate volatilities |
| Mortgage-backed; asset-backed obligations | | Standard inputs and cash flows, prepayment information, default rates, delinquency and loss assumptions, collateral characteristics, credit enhancements and specific deal information |
| Municipal securities | | Standard inputs and, for certain distressed securities, cash flows or liquidation values using a net present value calculation based on inputs that include, but are not limited to, financial statements and debt contracts |
When the fund’s investment adviser deems it appropriate to do so (such as when vendor prices are unavailable or deemed to be not representative), fixed-income securities will be valued in good faith at the mean quoted bid and ask prices that are reasonably and timely available (or bid prices, if ask prices are not available) or at prices for securities of comparable maturity, quality and type.
Securities with both fixed-income and equity characteristics, or equity securities traded principally among fixed-income dealers, are generally valued in the manner described above for either equity or fixed-income securities, depending on which method is deemed most appropriate by the fund’s investment adviser.
Securities and other assets for which representative market quotations are not readily available or are considered unreliable by the fund’s investment adviser are fair valued as determined in good faith under fair valuation guidelines adopted by authority of the fund’s board of trustees as further described. The investment adviser follows fair valuation guidelines, consistent with U.S. Securities and Exchange Commission rules and guidance, to consider relevant principles and factors when making fair value determinations. The investment adviser considers relevant indications of value that are reasonably and timely available to it in determining the fair value to be assigned to a particular security, such as the type and cost of the security; contractual or legal restrictions on resale of the security; relevant financial or business developments of the issuer; actively traded similar or related securities; conversion or exchange rights on the security; related corporate actions; significant events occurring after the close of trading in the security; and changes in overall market conditions. In
addition, the closing prices of equity securities that trade in markets outside U.S. time zones may be adjusted to reflect significant events that occur after the close of local trading but before the net asset value of each share class of the fund is determined. Fair valuations and valuations of investments that are not actively trading involve judgment and may differ materially from valuations that would have been used had greater market activity occurred.
Processes and structure — The fund’s board of trustees has delegated authority to the fund’s investment adviser to make fair value determinations, subject to board oversight. The investment adviser has established a Joint Fair Valuation Committee (the “Fair Valuation Committee”) to administer, implement and oversee the fair valuation process, and to make fair value decisions. The Fair Valuation Committee regularly reviews its own fair value decisions, as well as decisions made under its standing instructions to the investment adviser’s valuation teams. The Fair Valuation Committee reviews changes in fair value measurements from period to period and may, as deemed appropriate, update the fair valuation guidelines to better reflect the results of back testing and address new or evolving issues. The Fair Valuation Committee reports any changes to the fair valuation guidelines to the board of trustees with supplemental information to support the changes. The fund’s board and audit committee also regularly review reports that describe fair value determinations and methods.
The fund’s investment adviser has also established a Fixed-Income Pricing Review Group to administer and oversee the fixed-income valuation process, including the use of fixed-income pricing vendors. This group regularly reviews pricing vendor information and market data. Pricing decisions, processes and controls over security valuation are also subject to additional internal reviews, including an annual control self-evaluation program facilitated by the investment adviser’s compliance group.
Classifications — The fund’s investment adviser classifies the fund’s assets and liabilities into three levels based on the inputs used to value the assets or liabilities. Level 1 values are based on quoted prices in active markets for identical securities. Level 2 values are based on significant observable market inputs, such as quoted prices for similar securities and quoted prices in inactive markets. Certain securities trading outside the U.S. may transfer between Level 1 and Level 2 due to valuation adjustments resulting from significant market movements following the close of local trading. Level 3 values are based on significant unobservable inputs that reflect the investment adviser’s determination of assumptions that market participants might reasonably use in valuing the securities. The valuation levels are not necessarily an indication of the risk or liquidity associated with the underlying investment. For example, U.S. government securities are reflected as Level 2 because the inputs used to determine fair value may not always be quoted prices in an active market. The following table presents the fund’s valuation levels as of December 31, 2015 (dollars in thousands):
| | | Investment securities | |
| | | Level 1 | | | Level 2 | | | Level 3 | | | Total | |
| Assets: | | | | | | | | | | | | | | | | |
| Common stocks: | | | | | | | | | | | | | | | | |
| Financials | | $ | 8,969,946 | | | $ | 133,106 | | | $ | — | | | $ | 9,103,052 | |
| Consumer discretionary | | | 8,353,732 | | | | — | | | | — | | | | 8,353,732 | |
| Information technology | | | 8,126,977 | | | | 153,560 | | | | — | | | | 8,280,537 | |
| Consumer staples | | | 6,903,700 | | | | 10,552 | | | | — | | | | 6,914,252 | |
| Health care | | | 5,249,457 | | | | 137,794 | | | | — | | | | 5,387,251 | |
| Industrials | | | 5,103,907 | | | | — | | | | — | | | | 5,103,907 | |
| Energy | | | 2,978,165 | | | | 292,146 | | | | — | | | | 3,270,311 | |
| Materials | | | 1,889,450 | | | | — | | | | — | | | | 1,889,450 | |
| Other | | | 233,851 | | | | 29,620 | | | | — | | | | 263,471 | |
| Miscellaneous | | | 2,774,321 | | | | 7,307 | | | | — | | | | 2,781,628 | |
| Preferred securities | | | — | | | | 4,908 | | | | — | | | | 4,908 | |
| Bonds, notes & other debt instruments: | | | | | | | | | | | | | | | | |
| U.S. Treasury bonds & notes | | | — | | | | 9,763,774 | | | | — | | | | 9,763,774 | |
| Corporate bonds & notes | | | — | | | | 9,280,300 | | | | — | | | | 9,280,300 | |
| Mortgage-backed obligations | | | — | | | | 6,428,004 | | | | — | | | | 6,428,004 | |
| Federal agency bonds & notes | | | — | | | | 992,343 | | | | — | | | | 992,343 | |
| Other | | | — | | | | 1,632,516 | | | | — | | | | 1,632,516 | |
| Miscellaneous | | | — | | | | 137,093 | | | | — | | | | 137,093 | |
| Short-term securities | | | — | | | | 5,836,869 | | | | — | | | | 5,836,869 | |
| Total | | $ | 50,583,506 | | | $ | 34,839,892 | | | $ | — | | | $ | 85,423,398 | |
4. Risk factors
Investing in the fund may involve certain risks including, but not limited to, those described below.
Market conditions — The prices of, and the income generated by, the common stocks, bonds and other securities held by the fund may decline — sometimes rapidly or unpredictably — due to various factors, including events or conditions affecting the general economy or
particular industries; overall market changes; local, regional or global political, social or economic instability; governmental or governmental agency responses to economic conditions; and currency exchange rate, interest rate and commodity price fluctuations.
Issuer risks — The prices of, and the income generated by, securities held by the fund may decline in response to various factors directly related to the issuers of such securities, including reduced demand for an issuer’s goods or services, poor management performance and strategic initiatives such as mergers, acquisitions or dispositions and the market response to any such initiatives.
Investing in growth-oriented stocks — Growth-oriented common stocks and other equity-type securities (such as preferred stocks, convertible preferred stocks and convertible bonds) may involve larger price swings and greater potential for loss than other types of investments.
Investing in income-oriented stocks — Income provided by the fund may be reduced by changes in the dividend policies of, and the capital resources available for dividend payments at, the companies in which the fund invests.
Investing in debt instruments — The prices of, and the income generated by, bonds and other debt securities held by the fund may be affected by changing interest rates and by changes in the effective maturities and credit ratings of these securities.
Rising interest rates will generally cause the prices of bonds and other debt securities to fall. Falling interest rates may cause an issuer to redeem, call or refinance a debt security before its stated maturity, which may result in the fund having to reinvest the proceeds in lower yielding securities. Longer maturity debt securities generally have greater sensitivity to changes in interest rates and may be subject to greater price fluctuations than shorter maturity debt securities.
Bonds and other debt securities are also subject to credit risk, which is the possibility that the credit strength of an issuer will weaken and/or an issuer of a debt security will fail to make timely payments of principal or interest and the security will go into default. Lower quality debt securities generally have higher rates of interest and may be subject to greater price fluctuations than higher quality debt securities. Credit risk is gauged, in part, by the credit ratings of the debt securities in which the fund invests. However, ratings are only the opinions of the rating agencies issuing them and are not guarantees as to credit quality or an evaluation of market risk. The fund’s investment adviser relies on its own credit analysts to research issuers and issues in seeking to mitigate various credit and default risks.
Investing in securities backed by the U.S. government — Securities backed by the U.S. Treasury or the full faith and credit of the U.S. government are guaranteed only as to the timely payment of interest and principal when held to maturity. Accordingly, the current market values for these securities will fluctuate with changes in interest rates. Securities issued by government-sponsored entities and federal agencies and instrumentalities that are not backed by the full faith and credit of the U.S. government are neither issued nor guaranteed by the U.S. government.
Investing in mortgage-related and other asset-backed securities — Mortgage-related securities, such as mortgage-backed securities, and other asset-backed securities, include debt obligations that represent interests in pools of mortgages or other income-bearing assets, such as consumer loans or receivables. Such securities often involve risks that are different from or more acute than the risks associated with investing in other types of debt securities. Mortgage-backed and other asset-backed securities are subject to changes in the payment patterns of borrowers of the underlying debt. When interest rates fall, borrowers are more likely to refinance or prepay their debt before its stated maturity. This may result in the fund having to reinvest the proceeds in lower yielding securities, effectively reducing the fund’s income. Conversely, if interest rates rise and borrowers repay their debt more slowly than expected, the time in which the mortgage-backed and other asset-backed securities are paid off could be extended, reducing the fund’s cash available for reinvestment in higher yielding securities.
Thinly traded securities — There may be little trading in the secondary market for particular bonds or other debt securities, which may make them more difficult to value, acquire or sell.
Investing outside the U.S. — Securities of issuers domiciled outside the U.S., or with significant operations or revenues outside the U.S., may lose value because of adverse political, social, economic or market developments (including social instability, regional conflicts, terrorism and war) in the countries or regions in which the issuers operate or generate revenue. These securities may also lose value due to changes in foreign currency exchange rates against the U.S. dollar and/or currencies of other countries. Issuers of these securities may be more susceptible to actions of foreign governments, such as the imposition of price controls or punitive taxes, that could adversely impact revenues. Securities markets in certain countries may be more volatile and/or less liquid than those in the U.S. Investments outside the U.S. may also be subject to different accounting practices and different regulatory, legal and reporting standards and practices, and may be more difficult to value, than those in the U.S. In addition, the value of investments outside the U.S. may be reduced by foreign taxes, including foreign withholding taxes on interest and dividends. Further, there may be increased risks of delayed settlement of securities purchased or sold by the fund. The risks of investing outside the U.S. may be heightened in connection with investments in emerging markets.
Management — The investment adviser to the fund actively manages the fund’s investments. Consequently, the fund is subject to the risk that the methods and analyses employed by the investment adviser in this process may not produce the desired results. This could cause the fund to lose value or its investment results to lag relevant benchmarks or other funds with similar objectives.
5. Certain investment techniques
Index-linked bonds — The fund has invested in index-linked bonds, which are fixed-income securities whose principal value is periodically adjusted to a government price index. Over the life of an index-linked bond, interest is paid on the adjusted principal value. Increases or decreases in the principal value of index-linked bonds are recorded as interest income in the fund’s statement of operations.
Mortgage dollar rolls — The fund has entered into mortgage dollar roll transactions in which the fund sells a mortgage-backed security to a counterparty and simultaneously enters into an agreement with the same counterparty to buy back a similar security on a specific future date at a predetermined price. Mortgage dollar rolls are accounted for as purchase and sale transactions, which may increase the fund’s portfolio turnover rate.
Collateral — The fund participates in a collateral program due to its use of future delivery contracts. The program calls for the fund to either receive or pledge collateral based on the net gain or loss of unsettled contracts by certain counterparties. The purpose of the collateral is to cover potential losses that could occur in the event that either party cannot meet its contractual obligations.
6. Taxation and distributions
Federal income taxation — The fund complies with the requirements under Subchapter M of the Internal Revenue Code applicable to mutual funds and intends to distribute substantially all of its net taxable income and net capital gains each year. The fund is not subject to income taxes to the extent such distributions are made. Therefore, no federal income tax provision is required.
As of and during the period ended December 31, 2015, the fund did not have a liability for any unrecognized tax benefits. The fund recognizes interest and penalties, if any, related to unrecognized tax benefits as income tax expense in the statement of operations. During the period, the fund did not incur any interest or penalties.
The fund is not subject to examination by U.S. federal tax authorities for tax years before 2012 and by state tax authorities for tax years before 2011.
Non-U.S. taxation — Dividend and interest income are recorded net of non-U.S. taxes paid. The fund may file withholding tax reclaims in certain jurisdictions to recover a portion of amounts previously withheld. As a result of rulings from European courts, the fund filed for additional reclaims related to prior years. These reclaims are recorded when the amount is known and there are no significant uncertainties on collectability.
Distributions — Distributions paid to shareholders are based on net investment income and net realized gains determined on a tax basis, which may differ from net investment income and net realized gains for financial reporting purposes. These differences are due primarily to different treatment for items such as currency gains and losses; short-term capital gains and losses; capital losses related to sales of certain securities within 30 days of purchase; and paydowns on fixed-income securities. The fiscal year in which amounts are distributed may differ from the year in which the net investment income and net realized gains are recorded by the fund for financial reporting purposes. The fund may also designate a portion of the amount paid to redeeming shareholders as a distribution for tax purposes.
During the year ended December 31, 2015, the fund reclassified $100,000 from undistributed net investment income to capital paid in on shares of beneficial interest, $14,439,000 from undistributed net realized gain to undistributed net investment income and $239,467,000 from undistributed net realized gain to capital paid in on shares of beneficial interest to align financial reporting with tax reporting.
As of December 31, 2015, the tax-basis components of distributable earnings, unrealized appreciation (depreciation) and cost of investment securities were as follows (dollars in thousands):
| Undistributed ordinary income | | $ | 198,549 | |
| Undistributed long-term capital gains | | | 574,040 | |
| Gross unrealized appreciation on investment securities | | | 19,001,879 | |
| Gross unrealized depreciation on investment securities | | | (1,553,316 | ) |
| Net unrealized appreciation on investment securities | | | 17,448,563 | |
| Cost of investment securities | | | 67,974,835 | |
The tax character of distributions paid to shareholders was as follows (dollars in thousands):
| | | Year ended December 31, 2015 | | | Year ended December 31, 2014 | |
| Share class | | Ordinary
income | | | Long-term
capital gains | | | Total
dividends and
distributions paid | | | Ordinary
income | | | Long-term
capital gains | | | Total
dividends and
distributions
paid | |
| Class A | | $ | 780,804 | | | $ | 1,850,230 | | | $ | 2,631,034 | | | $ | 682,770 | | | $ | 2,574,901 | | | $ | 3,257,671 | |
| Class B | | | 2,887 | | | | 11,278 | | | | 14,165 | | | | 4,570 | | | | 30,111 | | | | 34,681 | |
| Class C | | | 49,142 | | | | 230,739 | | | | 279,881 | | | | 39,424 | | | | 306,922 | | | | 346,346 | |
| Class F-1 | | | 49,755 | | | | 125,871 | | | | 175,626 | | | | 40,381 | | | | 156,238 | | | | 196,619 | |
| Class F-2 | | | 40,892 | | | | 94,983 | | | | 135,875 | | | | 23,275 | | | | 100,875 | | | | 124,150 | |
| Class 529-A | | | 43,528 | | | | 108,092 | | | | 151,620 | | | | 39,082 | | | | 155,378 | | | | 194,460 | |
| Class 529-B | | | 334 | | | | 1,564 | | | | 1,898 | | | | 507 | | | | 4,036 | | | | 4,543 | |
| Class 529-C | | | 6,846 | | | | 34,327 | | | | 41,173 | | | | 5,839 | | | | 49,737 | | | | 55,576 | |
| Class 529-E | | | 1,830 | | | | 5,378 | | | | 7,208 | | | | 1,657 | | | | 7,925 | | | | 9,582 | |
| Class 529-F-1 | | | 2,010 | | | | 4,397 | | | | 6,407 | | | | 1,791 | | | | 6,088 | | | | 7,879 | |
| Class R-1 | | | 1,296 | | | | 5,762 | | | | 7,058 | | | | 1,139 | | | | 8,714 | | | | 9,853 | |
| Class R-2 | | | 11,109 | | | | 46,871 | | | | 57,980 | | | | 10,014 | | | | 72,266 | | | | 82,280 | |
| Class R-2E1 | | | 10 | | | | 81 | | | | 91 | | | | — | 2 | | | 1 | | | | 1 | |
| Class R-3 | | | 41,432 | | | | 121,458 | | | | 162,890 | | | | 38,877 | | | | 183,868 | | | | 222,745 | |
| Class R-4 | | | 71,022 | | | | 169,504 | | | | 240,526 | | | | 63,239 | | | | 242,446 | | | | 305,685 | |
| Class R-5E3 | | | — | 2 | | | — | 2 | | | — | 2 | | | | | | | | | | | | |
| Class R-5 | | | 48,877 | | | | 98,335 | | | | 147,212 | | | | 45,017 | | | | 146,814 | | | | 191,831 | |
| Class R-6 | | | 124,838 | | | | 267,604 | | | | 392,442 | | | | 91,728 | | | | 319,323 | | | | 411,051 | |
| Total | | $ | 1,276,612 | | | $ | 3,176,474 | | | $ | 4,453,086 | | | $ | 1,089,310 | | | $ | 4,365,643 | | | $ | 5,454,953 | |
| 1 | Class R-2E shares were offered beginning August 29, 2014. |
| 2 | Amount less than one thousand. |
| 3 | Class R-5E shares were offered beginning November 20, 2015. |
7. Fees and transactions with related parties
CRMC, the fund’s investment adviser, is the parent company of American Funds Distributors,® Inc. (“AFD”), the principal underwriter of the fund’s shares, and American Funds Service Company® (“AFS”), the fund’s transfer agent. CRMC, AFD and AFS are considered related parties to the fund.
Investment advisory services — The fund has an investment advisory and service agreement with CRMC that provides for monthly fees accrued daily. At the beginning of the year, these fees were based on a series of decreasing annual rates beginning with 0.420% on the first $500 million of daily net assets and decreasing to 0.210% on such assets in excess of $71 billion. On December 11, 2014, the fund’s board of trustees approved an amended investment advisory and service agreement effective February 1, 2015, decreasing the annual rates on daily net assets in excess of $89 billion to 0.207%. For the year ended December 31, 2015, the investment advisory services fee was $189,337,000, which was equivalent to an annualized rate of 0.230% of average daily net assets.
Class-specific fees and expenses — Expenses that are specific to individual share classes are accrued directly to the respective share class. The principal class-specific fees and expenses are further described below:
Distribution services — The fund has plans of distribution for all share classes, except Class F-2, R-5E, R-5 and R-6 shares. Under the plans, the board of trustees approves certain categories of expenses that are used to finance activities primarily intended to sell fund shares and service existing accounts. The plans provide for payments, based on an annualized percentage of average daily net assets, ranging from 0.25% to 1.00% as noted in this section. In some cases, the board of trustees has limited the amounts that may be paid to less than the maximum allowed by the plans. All share classes with a plan may use up to 0.25% of average daily net assets to pay service fees, or to compensate AFD for paying service fees, to firms that have entered into agreements with AFD to provide certain shareholder services. The remaining amounts available to be paid under each plan are paid to dealers to compensate them for their sales activities.
For Class A and 529-A shares, distribution-related expenses include the reimbursement of dealer and wholesaler commissions paid by AFD for certain shares sold without a sales charge. These share classes reimburse AFD for amounts billed within the prior 15 months but
only to the extent that the overall annual expense limit of 0.25% is not exceeded. As of December 31, 2015, there were no unreimbursed expenses subject to reimbursement for Class A or 529-A shares.
| Share class | | Currently approved limits | | Plan limits |
| Class A | | | 0.25 | % | | | 0.25 | % |
| Class 529-A | | | 0.25 | | | | 0.50 | |
| Classes B and 529-B | | | 1.00 | | | | 1.00 | |
| Classes C, 529-C and R-1 | | | 1.00 | | | | 1.00 | |
| Class R-2 | | | 0.75 | | | | 1.00 | |
| Class R-2E | | | 0.60 | | | | 0.85 | |
| Classes 529-E and R-3 | | | 0.50 | | | | 0.75 | |
| Classes F-1, 529-F-1 and R-4 | | | 0.25 | | | | 0.50 | |
Transfer agent services — The fund has a shareholder services agreement with AFS under which the fund compensates AFS for providing transfer agent services to each of the fund’s share classes. These services include recordkeeping, shareholder communications and transaction processing. In addition, the fund reimburses AFS for amounts paid to third parties for performing transfer agent services on behalf of fund shareholders.
Administrative services — The fund has an administrative services agreement with CRMC under which the fund compensates CRMC for providing administrative services to Class A, C, F, 529 and R shares. These services include, but are not limited to, coordinating, monitoring, assisting and overseeing third parties that provide services to fund shareholders. Under the agreement, Class A shares pay an annual fee of 0.01% and Class C, F, 529 and R shares pay an annual fee of 0.05% of their respective average daily net assets.
529 plan services — Each 529 share class is subject to service fees to compensate the Virginia College Savings Plan (“Virginia529”) for its oversight and administration of the 529 college savings plan. The quarterly fee is based on a series of decreasing annual rates beginning with 0.10% on the first $30 billion of the net assets invested in Class 529 shares of the American Funds and decreasing to 0.05% on such assets in excess of $70 billion. The fee for any given calendar quarter is accrued and calculated on the basis of the average net assets of Class 529 shares of the American Funds for the last month of the prior calendar quarter. The fee is included in other expenses in the fund’s statement of operations. Virginia529 is not considered a related party to the fund.
For the year ended December 31, 2015, class-specific expenses under the agreements were as follows (dollars in thousands):
| | | | Distribution | | | Transfer agent | | | Administrative | | | 529 plan | |
| Share class | | | services | | | services | | | services | | | services | |
| Class A | | | | $116,439 | | | | $45,521 | | | | $4,823 | | | | Not applicable | |
| Class B | | | | 3,923 | | | | 369 | | | | Not applicable | | | | Not applicable | |
| Class C | | | | 58,199 | | | | 5,355 | | | | 2,917 | | | | Not applicable | |
| Class F-1 | | | | 7,840 | | | | 3,480 | | | | 1,571 | | | | Not applicable | |
| Class F-2 | | | | Not applicable | | | | 2,327 | | | | 1,101 | | | | Not applicable | |
| Class 529-A | | | | 6,441 | | | | 2,195 | | | | 1,432 | | | | $2,536 | |
| Class 529-B | | | | 543 | | | | 49 | | | | 27 | | | | 49 | |
| Class 529-C | | | | 9,045 | | | | 735 | | | | 456 | | | | 807 | |
| Class 529-E | | | | 711 | | | | 66 | | | | 72 | | | | 127 | |
| Class 529-F-1 | | | | — | | | | 90 | | | | 58 | | | | 102 | |
| Class R-1 | | | | 1,560 | | | | 146 | | | | 78 | | | | Not applicable | |
| Class R-2 | | | | 9,438 | | | | 3,665 | | | | 633 | | | | Not applicable | |
| Class R-2E | | | | 1 | | | | — | * | | | — | * | | | Not applicable | |
| Class R-3 | | | | 16,303 | | | | 4,533 | | | | 1,632 | | | | Not applicable | |
| Class R-4 | | | | 11,343 | | | | 4,251 | | | | 2,270 | | | | Not applicable | |
| Class R-5E† | | | | Not applicable | | | | — | * | | | — | * | | | Not applicable | |
| Class R-5 | | | | Not applicable | | | | 1,234 | | | | 1,319 | | | | Not applicable | |
| Class R-6 | | | | Not applicable | | | | 35 | | | | 3,230 | | | | Not applicable | |
| Total class-specific expenses | | | | $241,786 | | | | $74,051 | | | | $21,619 | | | | $3,621 | |
| * | Amount less than one thousand. |
| † | Class R-5E shares were offered beginning November 20, 2015. |
Trustees’ deferred compensation — Trustees who are unaffiliated with CRMC may elect to defer the cash payment of part or all of their compensation. These deferred amounts, which remain as liabilities of the fund, are treated as if invested in shares of the fund or other American Funds. These amounts represent general, unsecured liabilities of the fund and vary according to the total returns of the selected funds. Trustees’ compensation of $401,000 in the fund’s statement of operations includes $346,000 in current fees (either paid in cash or deferred) and a net increase of $55,000 in the value of the deferred amounts.
Affiliated officers and trustees — Officers and certain trustees of the fund are or may be considered to be affiliated with CRMC, AFD and AFS. No affiliated officers or trustees received any compensation directly from the fund.
8. Capital share transactions
Capital share transactions in the fund were as follows (dollars and shares in thousands):
| | | Sales1 | | | Reinvestments of
dividends and distributions | | | Repurchases1 | | | Net increase
(decrease) | |
| Share class | | Amount | | | Shares | | | Amount | | | Shares | | | Amount | | | Shares | | | Amount | | | Shares | |
| | | | | | | | | | | | | | | | | | | | | | | | | | |
| Year ended December 31, 2015 | | | | | | | | | | | | | | | | | | | | | | | | | |
| | | | | | | | | | | | | | | | | | | | | | | | | | | | | | | | | |
| Class A | | $ | 7,043,352 | | | | 285,127 | | | $ | 2,591,527 | | | | 108,336 | | | $ | (5,519,559 | ) | | | (223,746 | ) | | $ | 4,115,320 | | | | 169,717 | |
| Class B | | | 6,906 | | | | 280 | | | | 14,048 | | | | 587 | | | | (273,144 | ) | | | (11,047 | ) | | | (252,190 | ) | | | (10,180 | ) |
| Class C | | | 1,825,914 | | | | 74,298 | | | | 275,693 | | | | 11,615 | | | | (1,272,632 | ) | | | (51,788 | ) | | | 828,975 | | | | 34,125 | |
| Class F-1 | | | 992,383 | | | | 40,137 | | | | 171,126 | | | | 7,161 | | | | (511,293 | ) | | | (20,753 | ) | | | 652,216 | | | | 26,545 | |
| Class F-2 | | | 1,189,017 | | | | 48,224 | | | | 130,153 | | | | 5,448 | | | | (458,772 | ) | | | (18,638 | ) | | | 860,398 | | | | 35,034 | |
| Class 529-A | | | 359,270 | | | | 14,560 | | | | 151,586 | | | | 6,345 | | | | (374,996 | ) | | | (15,207 | ) | | | 135,860 | | | | 5,698 | |
| Class 529-B | | | 2,004 | | | | 81 | | | | 1,898 | | | | 79 | | | | (36,444 | ) | | | (1,472 | ) | | | (32,542 | ) | | | (1,312 | ) |
| Class 529-C | | | 135,252 | | | | 5,487 | | | | 41,160 | | | | 1,728 | | | | (142,426 | ) | | | (5,785 | ) | | | 33,986 | | | | 1,430 | |
| Class 529-E | | | 17,938 | | | | 727 | | | | 7,205 | | | | 302 | | | | (22,337 | ) | | | (908 | ) | | | 2,806 | | | | 121 | |
| Class 529-F-1 | | | 23,632 | | | | 957 | | | | 6,406 | | | | 268 | | | | (20,026 | ) | | | (812 | ) | | | 10,012 | | | | 413 | |
| Class R-1 | | | 37,207 | | | | 1,513 | | | | 7,024 | | | | 296 | | | | (45,485 | ) | | | (1,852 | ) | | | (1,254 | ) | | | (43 | ) |
| Class R-2 | | | 284,265 | | | | 11,573 | | | | 57,906 | | | | 2,438 | | | | (384,208 | ) | | | (15,663 | ) | | | (42,037 | ) | | | (1,652 | ) |
| Class R-2E | | | 2,576 | | | | 104 | | | | 91 | | | | 4 | | | | (4 | ) | | | — | 2 | | | 2,663 | | | | 108 | |
| Class R-3 | | | 744,649 | | | | 30,283 | | | | 162,704 | | | | 6,834 | | | | (934,158 | ) | | | (38,030 | ) | | | (26,805 | ) | | | (913 | ) |
| Class R-4 | | | 977,391 | | | | 39,555 | | | | 240,507 | | | | 10,065 | | | | (1,002,730 | ) | | | (40,800 | ) | | | 215,168 | | | | 8,820 | |
| Class R-5E3 | | | 10 | | | | — | 2 | | | — | | | | — | | | | — | | | | — | | | | 10 | | | | — | 2 |
| Class R-5 | | | 512,901 | | | | 20,723 | | | | 147,202 | | | | 6,142 | | | | (607,400 | ) | | | (24,674 | ) | | | 52,703 | | | | 2,191 | |
| Class R-6 | | | 2,504,254 | | | | 101,426 | | | | 392,442 | | | | 16,404 | | | | (1,420,877 | ) | | | (57,415 | ) | | | 1,475,819 | | | | 60,415 | |
| Total net increase (decrease) | | $ | 16,658,921 | | | | 675,055 | | | $ | 4,398,678 | | | | 184,052 | | | $ | (13,026,491 | ) | | | (528,590 | ) | | $ | 8,031,108 | | | | 330,517 | |
| | | | | | | | | | | | | | | | | | | | | | | | | | | | | | | | | |
| Year ended December 31, 2014 | | | | | | | | | | | | | | | | | | | | | | | | | |
| | | | | | | | | | | | | | | | | | | | | | | | | | | | | | | | | |
| Class A | | $ | 5,744,075 | | | | 229,172 | | | $ | 3,208,616 | | | | 128,744 | | | $ | (5,334,850 | ) | | | (212,761 | ) | | $ | 3,617,841 | | | | 145,155 | |
| Class B | | | 11,642 | | | | 468 | | | | 34,382 | | | | 1,383 | | | | (339,367 | ) | | | (13,639 | ) | | | (293,343 | ) | | | (11,788 | ) |
| Class C | | | 1,264,417 | | | | 50,711 | | | | 340,638 | | | | 13,740 | | | | (1,346,464 | ) | | | (54,047 | ) | | | 258,591 | | | | 10,404 | |
| Class F-1 | | | 1,131,467 | | | | 45,255 | | | | 191,675 | | | | 7,698 | | | | (991,786 | ) | | | (39,337 | ) | | | 331,356 | | | | 13,616 | |
| Class F-2 | | | 1,221,630 | | | | 48,341 | | | | 117,423 | | | | 4,710 | | | | (225,168 | ) | | | (8,954 | ) | | | 1,113,885 | | | | 44,097 | |
| Class 529-A | | | 349,840 | | | | 13,993 | | | | 194,398 | | | | 7,813 | | | | (347,878 | ) | | | (13,849 | ) | | | 196,360 | | | | 7,957 | |
| Class 529-B | | | 3,128 | | | | 125 | | | | 4,542 | | | | 183 | | | | (44,288 | ) | | | (1,773 | ) | | | (36,618 | ) | | | (1,465 | ) |
| Class 529-C | | | 127,469 | | | | 5,097 | | | | 55,560 | | | | 2,235 | | | | (130,776 | ) | | | (5,210 | ) | | | 52,253 | | | | 2,122 | |
| Class 529-E | | | 18,259 | | | | 729 | | | | 9,582 | | | | 386 | | | | (19,879 | ) | | | (791 | ) | | | 7,962 | | | | 324 | |
| Class 529-F-1 | | | 21,845 | | | | 874 | | | | 7,877 | | | | 317 | | | | (21,674 | ) | | | (865 | ) | | | 8,048 | | | | 326 | |
| Class R-1 | | | 33,513 | | | | 1,347 | | | | 9,788 | | | | 395 | | | | (37,993 | ) | | | (1,530 | ) | | | 5,308 | | | | 212 | |
| Class R-2 | | | 282,068 | | | | 11,333 | | | | 82,235 | | | | 3,318 | | | | (378,716 | ) | | | (15,212 | ) | | | (14,413 | ) | | | (561 | ) |
| Class R-2E4 | | | 10 | | | | — | 2 | | | — | | | | — | | | | — | | | | — | | | | 10 | | | | — | 2 |
| Class R-3 | | | 774,249 | | | | 31,058 | | | | 222,561 | | | | 8,971 | | | | (939,199 | ) | | | (37,601 | ) | | | 57,611 | | | | 2,428 | |
| Class R-4 | | | 1,019,955 | | | | 40,816 | | | | 305,651 | | | | 12,284 | | | | (990,090 | ) | | | (39,478 | ) | | | 335,516 | | | | 13,622 | |
| Class R-5 | | | 698,623 | | | | 27,924 | | | | 191,801 | | | | 7,691 | | | | (800,550 | ) | | | (32,002 | ) | | | 89,874 | | | | 3,613 | |
| Class R-6 | | | 2,191,350 | | | | 87,519 | | | | 411,051 | | | | 16,488 | | | | (470,534 | ) | | | (18,714 | ) | | | 2,131,867 | | | | 85,293 | |
| Total net increase (decrease) | | $ | 14,893,540 | | | | 594,762 | | | $ | 5,387,780 | | | | 216,356 | | | $ | (12,419,212 | ) | | | (495,763 | ) | | $ | 7,862,108 | | | | 315,355 | |
| 1 | Includes exchanges between share classes of the fund. |
| 2 | Amount less than one thousand. |
| 3 | Class R-5E shares were offered beginning November 20, 2015. |
| 4 | Class R-2E shares were offered beginning August 29, 2014. |
9. Investment transactions
The fund made purchases and sales of investment securities, excluding short-term securities and U.S. government obligations, if any, of $53,704,193,000 and $52,546,794,000, respectively, during the year ended December 31, 2015.
Financial highlights
| | | | | | Income (loss) from
investment operations1 | | | Dividends and distributions | | | | | | | | | | | | | | | | | | | | | |
| | | Net asset
value,
beginning
of period | | | Net
investment
income | | | Net gains
(losses) on
securities (both
realized and
unrealized) | | | Total from
investment
operations | | | Dividends
(from net
investment
income) | | | Distributions
(from capital
gains) | | | Total
dividends
and
distributions | | | Net asset
value,
end
of period | | | Total
return2 | | | Net assets,
end of period
(in millions) | | | Ratio of
expenses to
average
net assets | | | Ratio of
net income
to average
net assets | |
| Class A: | | | | | | | | | | | | | | | | | | | | | | | | | | | | | | | | | | | | | | | | | | | | | | | | |
| Year ended 12/31/2015 | | $ | 24.75 | | | $ | .42 | | | $ | — | 3 | | $ | .42 | | | $ | (.40 | ) | | $ | (.94 | ) | | $ | (1.34 | ) | | $ | 23.83 | | | | 1.72 | % | | $ | 49,215 | | | | .58 | % | | | 1.69 | % |
| Year ended 12/31/2014 | | | 24.42 | | | | .41 | | | | 1.75 | | | | 2.16 | | | | (.39 | ) | | | (1.44 | ) | | | (1.83 | ) | | | 24.75 | | | | 8.85 | | | | 46,917 | | | | .59 | | | | 1.62 | |
| Year ended 12/31/2013 | | | 20.40 | | | | .36 | | | | 4.04 | | | | 4.40 | | | | (.38 | ) | | | — | | | | (.38 | ) | | | 24.42 | | | | 21.73 | | | | 42,735 | | | | .61 | | | | 1.62 | |
| Year ended 12/31/2012 | | | 18.21 | | | | .38 | | | | 2.19 | | | | 2.57 | | | | (.38 | ) | | | — | | | | (.38 | ) | | | 20.40 | | | | 14.19 | | | | 34,272 | | | | .63 | | | | 1.94 | |
| Year ended 12/31/2011 | | | 17.93 | | | | .36 | | | | .32 | | | | .68 | | | | (.40 | ) | | | — | | | | (.40 | ) | | | 18.21 | | | | 3.82 | | | | 30,716 | | | | .62 | | | | 1.97 | |
| Class B: | | | | | | | | | | | | | | | | | | | | | | | | | | | | | | | | | | | | | | | | | | | | | | | | |
| Year ended 12/31/2015 | | | 24.71 | | | | .23 | | | | — | 3 | | | .23 | | | | (.19 | ) | | | (.94 | ) | | | (1.13 | ) | | | 23.81 | | | | .96 | | | | 279 | | | | 1.33 | | | | .93 | |
| Year ended 12/31/2014 | | | 24.37 | | | | .22 | | | | 1.74 | | | | 1.96 | | | | (.18 | ) | | | (1.44 | ) | | | (1.62 | ) | | | 24.71 | | | | 8.05 | | | | 541 | | | | 1.34 | | | | .87 | |
| Year ended 12/31/2013 | | | 20.35 | | | | .19 | | | | 4.03 | | | | 4.22 | | | | (.20 | ) | | | — | | | | (.20 | ) | | | 24.37 | | | | 20.81 | | | | 821 | | | | 1.36 | | | | .86 | |
| Year ended 12/31/2012 | | | 18.16 | | | | .23 | | | | 2.19 | | | | 2.42 | | | | (.23 | ) | | | — | | | | (.23 | ) | | | 20.35 | | | | 13.35 | | | | 1,123 | | | | 1.38 | | | | 1.17 | |
| Year ended 12/31/2011 | | | 17.87 | | | | .22 | | | | .33 | | | | .55 | | | | (.26 | ) | | | — | | | | (.26 | ) | | | 18.16 | | | | 3.08 | | | | 1,745 | | | | 1.38 | | | | 1.21 | |
| Class C: | | | | | | | | | | | | | | | | | | | | | | | | | | | | | | | | | | | | | | | | | | | | | | | | |
| Year ended 12/31/2015 | | | 24.63 | | | | .22 | | | | .01 | | | | .23 | | | | (.21 | ) | | | (.94 | ) | | | (1.15 | ) | | | 23.71 | | | | .93 | | | | 6,173 | | | | 1.38 | | | | .90 | |
| Year ended 12/31/2014 | | | 24.30 | | | | .21 | | | | 1.75 | | | | 1.96 | | | | (.19 | ) | | | (1.44 | ) | | | (1.63 | ) | | | 24.63 | | | | 8.03 | | | | 5,574 | | | | 1.39 | | | | .83 | |
| Year ended 12/31/2013 | | | 20.31 | | | | .19 | | | | 4.00 | | | | 4.19 | | | | (.20 | ) | | | — | | | | (.20 | ) | | | 24.30 | | | | 20.72 | | | | 5,247 | | | | 1.41 | | | | .83 | |
| Year ended 12/31/2012 | | | 18.13 | | | | .22 | | | | 2.18 | | | | 2.40 | | | | (.22 | ) | | | — | | | | (.22 | ) | | | 20.31 | | | | 13.30 | | | | 4,334 | | | | 1.42 | | | | 1.14 | |
| Year ended 12/31/2011 | | | 17.85 | | | | .21 | | | | .32 | | | | .53 | | | | (.25 | ) | | | — | | | | (.25 | ) | | | 18.13 | | | | 3.00 | | | | 4,247 | | | | 1.42 | | | | 1.17 | |
| Class F-1: | | | | | | | | | | | | | | | | | | | | | | | | | | | | | | | | | | | | | | | | | | | | | | | | |
| Year ended 12/31/2015 | | | 24.74 | | | | .40 | | | | .01 | | | | .41 | | | | (.39 | ) | | | (.94 | ) | | | (1.33 | ) | | | 23.82 | | | | 1.67 | | | | 3,367 | | | | .65 | | | | 1.63 | |
| Year ended 12/31/2014 | | | 24.41 | | | | .39 | | | | 1.75 | | | | 2.14 | | | | (.37 | ) | | | (1.44 | ) | | | (1.81 | ) | | | 24.74 | | | | 8.80 | | | | 2,841 | | | | .65 | | | | 1.57 | |
| Year ended 12/31/2013 | | | 20.39 | | | | .36 | | | | 4.03 | | | | 4.39 | | | | (.37 | ) | | | — | | | | (.37 | ) | | | 24.41 | | | | 21.70 | | | | 2,471 | | | | .66 | | | | 1.58 | |
| Year ended 12/31/2012 | | | 18.21 | | | | .38 | | | | 2.18 | | | | 2.56 | | | | (.38 | ) | | | — | | | | (.38 | ) | | | 20.39 | | | | 14.13 | | | | 1,500 | | | | .64 | | | | 1.94 | |
| Year ended 12/31/2011 | | | 17.92 | | | | .36 | | | | .33 | | | | .69 | | | | (.40 | ) | | | — | | | | (.40 | ) | | | 18.21 | | | | 3.87 | | | | 1,014 | | | | .63 | | | | 1.96 | |
| Class F-2: | | | | | | | | | | | | | | | | | | | | | | | | | | | | | | | | | | | | | | | | | | | | | | | | |
| Year ended 12/31/2015 | | | 24.74 | | | | .47 | | | | — | 3 | | | .47 | | | | (.45 | ) | | | (.94 | ) | | | (1.39 | ) | | | 23.82 | | | | 1.92 | | | | 2,634 | | | | .39 | | | | 1.89 | |
| Year ended 12/31/2014 | | | 24.41 | | | | .46 | | | | 1.75 | | | | 2.21 | | | | (.44 | ) | | | (1.44 | ) | | | (1.88 | ) | | | 24.74 | | | | 9.08 | | | | 1,869 | | | | .39 | | | | 1.83 | |
| Year ended 12/31/2013 | | | 20.39 | | | | .41 | | | | 4.04 | | | | 4.45 | | | | (.43 | ) | | | — | | | | (.43 | ) | | | 24.41 | | | | 21.99 | | | | 768 | | | | .41 | | | | 1.83 | |
| Year ended 12/31/2012 | | | 18.21 | | | | .43 | | | | 2.18 | | | | 2.61 | | | | (.43 | ) | | | — | | | | (.43 | ) | | | 20.39 | | | | 14.40 | | | | 419 | | | | .40 | | | | 2.18 | |
| Year ended 12/31/2011 | | | 17.92 | | | | .40 | | | | .33 | | | | .73 | | | | (.44 | ) | | | — | | | | (.44 | ) | | | 18.21 | | | | 4.12 | | | | 277 | | | | .40 | | | | 2.19 | |
| Class 529-A: | | | | | | | | | | | | | | | | | | | | | | | | | | | | | | | | | | | | | | | | | | | | | | | | |
| Year ended 12/31/2015 | | | 24.72 | | | | .39 | | | | .01 | | | | .40 | | | | (.38 | ) | | | (.94 | ) | | | (1.32 | ) | | | 23.80 | | | | 1.63 | | | | 2,861 | | | | .68 | | | | 1.60 | |
| Year ended 12/31/2014 | | | 24.39 | | | | .38 | | | | 1.75 | | | | 2.13 | | | | (.36 | ) | | | (1.44 | ) | | | (1.80 | ) | | | 24.72 | | | | 8.76 | | | | 2,831 | | | | .68 | | | | 1.53 | |
| Year ended 12/31/2013 | | | 20.38 | | | | .34 | | | | 4.03 | | | | 4.37 | | | | (.36 | ) | | | — | | | | (.36 | ) | | | 24.39 | | | | 21.60 | | | | 2,599 | | | | .70 | | | | 1.53 | |
| Year ended 12/31/2012 | | | 18.19 | | | | .36 | | | | 2.19 | | | | 2.55 | | | | (.36 | ) | | | — | | | | (.36 | ) | | | 20.38 | | | | 14.12 | | | | 2,101 | | | | .71 | | | | 1.86 | |
| Year ended 12/31/2011 | | | 17.91 | | | | .34 | | | | .33 | | | | .67 | | | | (.39 | ) | | | — | | | | (.39 | ) | | | 18.19 | | | | 3.75 | | | | 1,751 | | | | .70 | | | | 1.89 | |
| Class 529-B: | | | | | | | | | | | | | | | | | | | | | | | | | | | | | | | | | | | | | | | | | | | | | | | | |
| Year ended 12/31/2015 | | | 24.76 | | | | .20 | | | | .01 | | | | .21 | | | | (.16 | ) | | | (.94 | ) | | | (1.10 | ) | | | 23.87 | | | | .86 | | | | 39 | | | | 1.46 | | | | .81 | |
| Year ended 12/31/2014 | | | 24.41 | | | | .19 | | | | 1.75 | | | | 1.94 | | | | (.15 | ) | | | (1.44 | ) | | | (1.59 | ) | | | 24.76 | | | | 7.94 | | | | 73 | | | | 1.46 | | | | .75 | |
| Year ended 12/31/2013 | | | 20.39 | | | | .17 | | | | 4.02 | | | | 4.19 | | | | (.17 | ) | | | — | | | | (.17 | ) | | | 24.41 | | | | 20.63 | | | | 108 | | | | 1.49 | | | | .74 | |
| Year ended 12/31/2012 | | | 18.19 | | | | .21 | | | | 2.19 | | | | 2.40 | | | | (.20 | ) | | | — | | | | (.20 | ) | | | 20.39 | | | | 13.24 | | | | 134 | | | | 1.50 | | | | 1.05 | |
| Year ended 12/31/2011 | | | 17.90 | | | | .20 | | | | .33 | | | | .53 | | | | (.24 | ) | | | — | | | | (.24 | ) | | | 18.19 | | | | 2.95 | | | | 180 | | | | 1.49 | | | | 1.09 | |
| | | | | | Income (loss) from
investment operations1 | | | Dividends and distributions | | | | | | | | | | | | | | | | | | | | | |
| | | Net asset
value,
beginning
of period | | | Net
investment
income | | | Net gains
(losses) on
securities (both
realized and
unrealized) | | | Total from
investment
operations | | | Dividends
(from net
investment
income) | | | Distributions
(from capital
gains) | | | Total
dividends
and
distributions | | | Net asset
value,
end
of period | | | Total
return2 | | | Net assets,
end of period
(in millions) | | | Ratio of
expenses to
average
net assets | | | Ratio of
net income
to average
net assets | |
| Class 529-C: | | | | | | | | | | | | | | | | | | | | | | | | | | | | | | | | | | | | | | | | | | | | | | | | |
| Year ended 12/31/2015 | | $ | 24.70 | | | $ | .20 | | | $ | .02 | | | $ | .22 | | | $ | (.19 | ) | | $ | (.94 | ) | | $ | (1.13 | ) | | $ | 23.79 | | | | .88 | % | | $ | 905 | | | | 1.45 | % | | | .83 | % |
| Year ended 12/31/2014 | | | 24.38 | | | | .19 | | | | 1.74 | | | | 1.93 | | | | (.17 | ) | | | (1.44 | ) | | | (1.61 | ) | | | 24.70 | | | | 7.90 | | | | 905 | | | | 1.46 | | | | .76 | |
| Year ended 12/31/2013 | | | 20.37 | | | | .17 | | | | 4.03 | | | | 4.20 | | | | (.19 | ) | | | — | | | | (.19 | ) | | | 24.38 | | | | 20.68 | | | | 841 | | | | 1.48 | | | | .76 | |
| Year ended 12/31/2012 | | | 18.19 | | | | .21 | | | | 2.18 | | | | 2.39 | | | | (.21 | ) | | | — | | | | (.21 | ) | | | 20.37 | | | | 13.19 | | | | 694 | | | | 1.49 | | | | 1.08 | |
| Year ended 12/31/2011 | | | 17.90 | | | | .20 | | | | .33 | | | | .53 | | | | (.24 | ) | | | — | | | | (.24 | ) | | | 18.19 | | | | 3.00 | | | | 607 | | | | 1.48 | | | | 1.11 | |
| Class 529-E: | | | | | | | | | | | | | | | | | | | | | | | | | | | | | | | | | | | | | | | | | | | | | | | | |
| Year ended 12/31/2015 | | | 24.71 | | | | .33 | | | | .01 | | | | .34 | | | | (.32 | ) | | | (.94 | ) | | | (1.26 | ) | | | 23.79 | | | | 1.38 | | | | 142 | | | | .92 | | | | 1.36 | |
| Year ended 12/31/2014 | | | 24.38 | | | | .32 | | | | 1.75 | | | | 2.07 | | | | (.30 | ) | | | (1.44 | ) | | | (1.74 | ) | | | 24.71 | | | | 8.50 | | | | 144 | | | | .93 | | | | 1.28 | |
| Year ended 12/31/2013 | | | 20.37 | | | | .29 | | | | 4.02 | | | | 4.31 | | | | (.30 | ) | | | — | | | | (.30 | ) | | | 24.38 | | | | 21.31 | | | | 134 | | | | .95 | | | | 1.29 | |
| Year ended 12/31/2012 | | | 18.18 | | | | .31 | | | | 2.19 | | | | 2.50 | | | | (.31 | ) | | | — | | | | (.31 | ) | | | 20.37 | | | | 13.84 | | | | 112 | | | | .97 | | | | 1.60 | |
| Year ended 12/31/2011 | | | 17.90 | | | | .30 | | | | .32 | | | | .62 | | | | (.34 | ) | | | — | | | | (.34 | ) | | | 18.18 | | | | 3.47 | | | | 98 | | | | .97 | | | | 1.62 | |
| Class 529-F-1: | | | | | | | | | | | | | | | | | | | | | | | | | | | | | | | | | | | | | | | | | | | | | | | | |
| Year ended 12/31/2015 | | | 24.71 | | | | .45 | | | | (.01 | ) | | | .44 | | | | (.43 | ) | | | (.94 | ) | | | (1.37 | ) | | | 23.78 | | | | 1.82 | | | | 117 | | | | .46 | | | | 1.82 | |
| Year ended 12/31/2014 | | | 24.37 | | | | .44 | | | | 1.76 | | | | 2.20 | | | | (.42 | ) | | | (1.44 | ) | | | (1.86 | ) | | | 24.71 | | | | 9.05 | | | | 111 | | | | .46 | | | | 1.76 | |
| Year ended 12/31/2013 | | | 20.36 | | | | .39 | | | | 4.03 | | | | 4.42 | | | | (.41 | ) | | | — | | | | (.41 | ) | | | 24.37 | | | | 21.88 | | | | 101 | | | | .48 | | | | 1.76 | |
| Year ended 12/31/2012 | | | 18.18 | | | | .41 | | | | 2.18 | | | | 2.59 | | | | (.41 | ) | | | — | | | | (.41 | ) | | | 20.36 | | | | 14.32 | | | | 82 | | | | .49 | | | | 2.09 | |
| Year ended 12/31/2011 | | | 17.90 | | | | .38 | | | | .33 | | | | .71 | | | | (.43 | ) | | | — | | | | (.43 | ) | | | 18.18 | | | | 3.98 | | | | 61 | | | | .48 | | | | 2.11 | |
| Class R-1: | | | | | | | | | | | | | | | | | | | | | | | | | | | | | | | | | | | | | | | | | | | | | | | | |
| Year ended 12/31/2015 | | | 24.61 | | | | .22 | | | | (.01 | ) | | | .21 | | | | (.20 | ) | | | (.94 | ) | | | (1.14 | ) | | | 23.68 | | | | .88 | | | | 151 | | | | 1.38 | | | | .90 | |
| Year ended 12/31/2014 | | | 24.28 | | | | .21 | | | | 1.75 | | | | 1.96 | | | | (.19 | ) | | | (1.44 | ) | | | (1.63 | ) | | | 24.61 | | | | 8.05 | | | | 158 | | | | 1.38 | | | | .83 | |
| Year ended 12/31/2013 | | | 20.29 | | | | .19 | | | | 4.01 | | | | 4.20 | | | | (.21 | ) | | | — | | | | (.21 | ) | | | 24.28 | | | | 20.76 | | | | 151 | | | | 1.39 | | | | .84 | |
| Year ended 12/31/2012 | | | 18.12 | | | | .23 | | | | 2.17 | | | | 2.40 | | | | (.23 | ) | | | — | | | | (.23 | ) | | | 20.29 | | | | 13.28 | | | | 121 | | | | 1.40 | | | | 1.16 | |
| Year ended 12/31/2011 | | | 17.83 | | | | .22 | | | | .33 | | | | .55 | | | | (.26 | ) | | | — | | | | (.26 | ) | | | 18.12 | | | | 3.09 | | | | 126 | | | | 1.40 | | | | 1.19 | |
| Class R-2: | | | | | | | | | | | | | | | | | | | | | | | | | | | | | | | | | | | | | | | | | | | | | | | | |
| Year ended 12/31/2015 | | | 24.62 | | | | .23 | | | | .01 | | | | .24 | | | | (.22 | ) | | | (.94 | ) | | | (1.16 | ) | | | 23.70 | | | | .97 | | | | 1,220 | | | | 1.32 | | | | .95 | |
| Year ended 12/31/2014 | | | 24.30 | | | | .21 | | | | 1.74 | | | | 1.95 | | | | (.19 | ) | | | (1.44 | ) | | | (1.63 | ) | | | 24.62 | | | | 8.03 | | | | 1,308 | | | | 1.36 | | | | .86 | |
| Year ended 12/31/2013 | | | 20.30 | | | | .20 | | | | 4.02 | | | | 4.22 | | | | (.22 | ) | | | — | | | | (.22 | ) | | | 24.30 | | | | 20.87 | | | | 1,304 | | | | 1.34 | | | | .90 | |
| Year ended 12/31/2012 | | | 18.13 | | | | .23 | | | | 2.18 | | | | 2.41 | | | | (.24 | ) | | | — | | | | (.24 | ) | | | 20.30 | | | | 13.31 | | | | 1,158 | | | | 1.37 | | | | 1.20 | |
| Year ended 12/31/2011 | | | 17.85 | | | | .22 | | | | .32 | | | | .54 | | | | (.26 | ) | | | — | | | | (.26 | ) | | | 18.13 | | | | 3.05 | | | | 1,079 | | | | 1.38 | | | | 1.21 | |
| Class R-2E: | | | | | | | | | | | | | | | | | | | | | | | | | | | | | | | | | | | | | | | | | | | | | | | | |
| Year ended 12/31/2015 | | | 24.75 | | | | .29 | | | | .10 | | | | .39 | | | | (.43 | ) | | | (.94 | ) | | | (1.37 | ) | | | 23.77 | | | | 1.60 | | | | 2 | | | | .96 | | | | 1.22 | |
| Period from 8/29/2014 to 12/31/20144,5 | | | 25.81 | | | | .15 | | | | .41 | | | | .56 | | | | (.21 | ) | | | (1.41 | ) | | | (1.62 | ) | | | 24.75 | | | | 2.17 | 6,7 | | | — | 8 | | | .16 | 6,7 | | | .58 | 6,7 |
| Class R-3: | | | | | | | | | | | | | | | | | | | | | | | | | | | | | | | | | | | | | | | | | | | | | | | | |
| Year ended 12/31/2015 | | | 24.65 | | | | .33 | | | | (.01 | ) | | | .32 | | | | (.31 | ) | | | (.94 | ) | | | (1.25 | ) | | | 23.72 | | | | 1.34 | | | | 3,170 | | | | .93 | | | | 1.35 | |
| Year ended 12/31/2014 | | | 24.32 | | | | .32 | | | | 1.75 | | | | 2.07 | | | | (.30 | ) | | | (1.44 | ) | | | (1.74 | ) | | | 24.65 | | | | 8.51 | | | | 3,315 | | | | .94 | | | | 1.28 | |
| Year ended 12/31/2013 | | | 20.32 | | | | .29 | | | | 4.02 | | | | 4.31 | | | | (.31 | ) | | | — | | | | (.31 | ) | | | 24.32 | | | | 21.33 | | | | 3,212 | | | | .94 | | | | 1.30 | |
| Year ended 12/31/2012 | | | 18.14 | | | | .32 | | | | 2.18 | | | | 2.50 | | | | (.32 | ) | | | — | | | | (.32 | ) | | | 20.32 | | | | 13.83 | | | | 2,617 | | | | .95 | | | | 1.62 | |
| Year ended 12/31/2011 | | | 17.86 | | | | .30 | | | | .32 | | | | .62 | | | | (.34 | ) | | | — | | | | (.34 | ) | | | 18.14 | | | | 3.50 | | | | 2,331 | | | | .95 | | | | 1.64 | |
See page 28 for footnotes.
Financial highlights (continued)
| | | | | | Income (loss) from
investment operations1 | | | Dividends and distributions | | | | | | | | | | | | | | | | | | | | | |
| | | Net asset
value,
beginning
of period | | | Net
investment
income | | | Net gains
(losses) on
securities (both
realized and
unrealized) | | | Total from
investment
operations | | | Dividends
(from net
investment
income) | | | Distributions
(from capital
gains) | | | Total
dividends
and
distributions | | | Net asset
value,
end
of period | | | Total
return2 | | | Net assets,
end of period
(in millions) | | | Ratio of
expenses to
average
net assets | | | Ratio of
net income
to average
net assets | |
| Class R-4: | | | | | | | | | | | | | | | | | | | | | | | | | | | | | | | | | | | | | | | | | | | | | | | | |
| Year ended 12/31/2015 | | $ | 24.72 | | | $ | .41 | | | $ | — | 3 | | $ | .41 | | | $ | (.39 | ) | | $ | (.94 | ) | | $ | (1.33 | ) | | $ | 23.80 | | | | 1.67 | % | | $ | 4,431 | | | | .63 | % | | | 1.65 | % |
| Year ended 12/31/2014 | | | 24.38 | | | | .40 | | | | 1.75 | | | | 2.15 | | | | (.37 | ) | | | (1.44 | ) | | | (1.81 | ) | | | 24.72 | | | | 8.85 | | | | 4,385 | | | | .64 | | | | 1.58 | |
| Year ended 12/31/2013 | | | 20.37 | | | | .36 | | | | 4.02 | | | | 4.38 | | | | (.37 | ) | | | — | | | | (.37 | ) | | | 24.38 | | | | 21.68 | | | | 3,994 | | | | .65 | | | | 1.60 | |
| Year ended 12/31/2012 | | | 18.19 | | | | .38 | | | | 2.18 | | | | 2.56 | | | | (.38 | ) | | | — | | | | (.38 | ) | | | 20.37 | | | | 14.14 | | | | 3,006 | | | | .64 | | | | 1.94 | |
| Year ended 12/31/2011 | | | 17.91 | | | | .35 | | | | .33 | | | | .68 | | | | (.40 | ) | | | — | | | | (.40 | ) | | | 18.19 | | | | 3.80 | | | | 2,152 | | | | .65 | | | | 1.94 | |
| Class R-5E: | | | | | | | | | | | | | | | | | | | | | | | | | | | | | | | | | | | | | | | | | | | | | | | | |
| Period from 11/20/2015 to 12/31/20154,9 | | | 25.09 | | | | .05 | | | | (.36 | ) | | | (.31 | ) | | | (.12 | ) | | | (.84 | ) | | | (.96 | ) | | | 23.82 | | | | (1.21 | )7 | | | — | 8 | | | .05 | 7 | | | .20 | 7 |
| Class R-5: | | | | | | | | | | | | | | | | | | | | | | | | | | | | | | | | | | | | | | | | | | | | | | | | |
| Year ended 12/31/2015 | | | 24.77 | | | | .48 | | | | — | 3 | | | .48 | | | | (.46 | ) | | | (.94 | ) | | | (1.40 | ) | | | 23.85 | | | | 1.98 | | | | 2,571 | | | | .34 | | | | 1.94 | |
| Year ended 12/31/2014 | | | 24.43 | | | | .47 | | | | 1.76 | | | | 2.23 | | | | (.45 | ) | | | (1.44 | ) | | | (1.89 | ) | | | 24.77 | | | | 9.16 | | | | 2,616 | | | | .34 | | | | 1.88 | |
| Year ended 12/31/2013 | | | 20.41 | | | | .43 | | | | 4.03 | | | | 4.46 | | | | (.44 | ) | | | — | | | | (.44 | ) | | | 24.43 | | | | 22.04 | | | | 2,492 | | | | .34 | | | | 1.89 | |
| Year ended 12/31/2012 | | | 18.22 | | | | .44 | | | | 2.19 | | | | 2.63 | | | | (.44 | ) | | | — | | | | (.44 | ) | | | 20.41 | | | | 14.51 | | | | 2,050 | | | | .35 | | | | 2.23 | |
| Year ended 12/31/2011 | | | 17.94 | | | | .41 | | | | .32 | | | | .73 | | | | (.45 | ) | | | — | | | | (.45 | ) | | | 18.22 | | | | 4.11 | | | | 1,544 | | | | .35 | | | | 2.24 | |
| Class R-6: | | | | | | | | | | | | | | | | | | | | | | | | | | | | | | | | | | | | | | | | | | | | | | | | |
| Year ended 12/31/2015 | | | 24.76 | | | | .49 | | | | — | 3 | | | .49 | | | | (.47 | ) | | | (.94 | ) | | | (1.41 | ) | | | 23.84 | | | | 2.02 | | | | 7,290 | | | | .29 | | | | 1.99 | |
| Year ended 12/31/2014 | | | 24.42 | | | | .49 | | | | 1.75 | | | | 2.24 | | | | (.46 | ) | | | (1.44 | ) | | | (1.90 | ) | | | 24.76 | | | | 9.22 | | | | 6,076 | | | | .29 | | | | 1.93 | |
| Year ended 12/31/2013 | | | 20.40 | | | | .44 | | | | 4.03 | | | | 4.47 | | | | (.45 | ) | | | — | | | | (.45 | ) | | | 24.42 | | | | 22.12 | | | | 3,910 | | | | .29 | | | | 1.95 | |
| Year ended 12/31/2012 | | | 18.21 | | | | .45 | | | | 2.19 | | | | 2.64 | | | | (.45 | ) | | | — | | | | (.45 | ) | | | 20.40 | | | | 14.57 | | | | 2,151 | | | | .30 | | | | 2.28 | |
| Year ended 12/31/2011 | | | 17.93 | | | | .42 | | | | .32 | | | | .74 | | | | (.46 | ) | | | — | | | | (.46 | ) | | | 18.21 | | | | 4.16 | | | | 1,486 | | | | .30 | | | | 2.30 | |
| | | Year ended December 31 |
| Portfolio turnover rate for all share classes10 | | 2015 | | 2014 | | 2013 | | 2012 | | 2011 |
| Including mortgage dollar roll transactions | | | 82 | % | | | 68 | % | | | 55 | % | | | 54 | % | | | 47 | % |
| Excluding mortgage dollar roll transactions | | | 45 | % | | | 48 | % | | Not available |
| 1 | Based on average shares outstanding. |
| 2 | Total returns exclude any applicable sales charges, including contingent deferred sales charges. |
| 3 | Amount less than $.01. |
| 4 | Based on operations for the period shown and, accordingly, is not representative of a full year. |
| 5 | Class R-2E shares were offered beginning August 29, 2014. |
| 6 | All or a significant portion of assets in this class consisted of seed capital invested by CRMC and/or its affiliates. Certain fees (including, where applicable, fees for distribution services) are not charged or accrued on these seed capital assets. If such fees were paid by the fund on seed capital assets, fund expenses would have been higher and net income and total return would have been lower. |
| 7 | Not annualized. |
| 8 | Amount less than $1 million. |
| 9 | Class R-5E shares were offered beginning November 20, 2015. |
| 10 | Refer to Note 5 for further information on mortgage dollar rolls. |
See Notes to Financial Statements
Report of Independent Registered Public Accounting Firm
To the Shareholders and Board of Trustees of American Balanced Fund:
We have audited the accompanying statement of assets and liabilities of American Balanced Fund (the “Fund”), including the summary investment portfolio, as of December 31, 2015, and the related statement of operations for the year then ended, the statements of changes in net assets for each of the two years in the period then ended, and the financial highlights for each of the periods presented. These financial statements and financial highlights are the responsibility of the Fund’s management. Our responsibility is to express an opinion on these financial statements and financial highlights based on our audits.
We conducted our audits in accordance with the standards of the Public Company Accounting Oversight Board (United States). Those standards require that we plan and perform the audit to obtain reasonable assurance about whether the financial statements and financial highlights are free of material misstatement. The Fund is not required to have, nor were we engaged to perform, an audit of its internal control over financial reporting. Our audits included consideration of internal control over financial reporting as a basis for designing audit procedures that are appropriate in the circumstances, but not for the purpose of expressing an opinion on the effectiveness of the Fund’s internal control over financial reporting. Accordingly, we express no such opinion. An audit also includes examining, on a test basis, evidence supporting the amounts and disclosures in the financial statements, assessing the accounting principles used and significant estimates made by management, as well as evaluating the overall financial statement presentation. Our procedures included confirmation of securities owned as of December 31, 2015, by correspondence with the custodian and brokers; where replies were not received from brokers, we performed other auditing procedures. We believe that our audits provide a reasonable basis for our opinion.
In our opinion, such financial statements and financial highlights referred to above present fairly, in all material respects, the financial position of American Balanced Fund as of December 31, 2015, the results of its operations for the year then ended, the changes in its net assets for each of the two years in the period then ended, and the financial highlights for each of the periods presented, in conformity with accounting principles generally accepted in the United States of America.
Deloitte & Touche LLP
Costa Mesa, California
February 11, 2016
As a fund shareholder, you incur two types of costs: (1) transaction costs, such as initial sales charges on purchase payments and contingent deferred sales charges on redemptions (loads), and (2) ongoing costs, including management fees, distribution and service (12b-1) fees, and other expenses. This example is intended to help you understand your ongoing costs (in dollars) of investing in the fund so you can compare these costs with the ongoing costs of investing in other mutual funds. The example is based on an investment of $1,000 invested at the beginning of the period and held for the entire six-month period (July 1, 2015, through December 31, 2015).
Actual expenses:
The first line of each share class in the table on the following page provides information about actual account values and actual expenses. You may use the information in this line, together with the amount you invested, to estimate the expenses that you paid over the period. Simply divide your account value by $1,000 (for example, an $8,600 account value divided by $1,000 = 8.6), then multiply the result by the number in the first line under the heading entitled “Expenses paid during period” to estimate the expenses you paid on your account during this period.
Hypothetical example for comparison purposes:
The second line of each share class in the table on the following page provides information about hypothetical account values and hypothetical expenses based on the actual expense ratio for the share class and an assumed rate of return of 5.00% per year before expenses, which is not the actual return of the share class. The hypothetical account values and expenses may not be used to estimate the actual ending account balance or expenses you paid for the period. You may use this information to compare the ongoing costs of investing in the fund and other funds. To do so, compare this 5.00% hypothetical example with the 5.00% hypothetical examples that appear in the shareholder reports of the other funds.
Notes:
Retirement plan participants may be subject to certain fees charged by the plan sponsor, and Class F-1, F-2 and 529-F-1 shareholders may be subject to fees charged by financial intermediaries, typically ranging from 0.75% to 1.50% of assets annually depending on services offered. You can estimate the impact of these fees by adding the amount of the fees to the total estimated expenses you paid on your account during the period as calculated above. In addition, your ending account value would be lower by the amount of these fees.
Note that the expenses shown in the table on the following page are meant to highlight your ongoing costs only and do not reflect any transactional costs, such as sales charges (loads). Therefore, the second line of each share class in the table is useful in comparing ongoing costs only and will not help you determine the relative total costs of owning different funds. In addition, if these transactional costs were included, your costs would have been higher.
| | | Beginning | | Ending | | | | | | | |
| | | account value | | account value | | Expenses paid | | Annualized | |
| | | 7/1/2015 | | 12/31/2015 | | during period* | | expense ratio | |
| Class A - actual return | | $ | 1,000.00 | | $ | 1,013.18 | | $ | 2.94 | | | .58 | % |
| Class A - assumed 5% return | | | 1,000.00 | | | 1,022.28 | | | 2.96 | | | .58 | |
| Class B - actual return | | | 1,000.00 | | | 1,009.28 | | | 6.79 | | | 1.34 | |
| Class B - assumed 5% return | | | 1,000.00 | | | 1,018.45 | | | 6.82 | | | 1.34 | |
| Class C - actual return | | | 1,000.00 | | | 1,009.22 | | | 6.99 | | | 1.38 | |
| Class C - assumed 5% return | | | 1,000.00 | | | 1,018.25 | | | 7.02 | | | 1.38 | |
| Class F-1 - actual return | | | 1,000.00 | | | 1,012.80 | | | 3.30 | | | .65 | |
| Class F-1 - assumed 5% return | | | 1,000.00 | | | 1,021.93 | | | 3.31 | | | .65 | |
| Class F-2 - actual return | | | 1,000.00 | | | 1,014.16 | | | 1.98 | | | .39 | |
| Class F-2 - assumed 5% return | | | 1,000.00 | | | 1,023.24 | | | 1.99 | | | .39 | |
| Class 529-A - actual return | | | 1,000.00 | | | 1,012.67 | | | 3.45 | | | .68 | |
| Class 529-A - assumed 5% return | | | 1,000.00 | | | 1,021.78 | | | 3.47 | | | .68 | |
| Class 529-B - actual return | | | 1,000.00 | | | 1,008.87 | | | 7.44 | | | 1.47 | |
| Class 529-B - assumed 5% return | | | 1,000.00 | | | 1,017.80 | | | 7.48 | | | 1.47 | |
| Class 529-C - actual return | | | 1,000.00 | | | 1,009.10 | | | 7.39 | | | 1.46 | |
| Class 529-C - assumed 5% return | | | 1,000.00 | | | 1,017.85 | | | 7.43 | | | 1.46 | |
| Class 529-E - actual return | | | 1,000.00 | | | 1,011.84 | | | 4.67 | | | .92 | |
| Class 529-E - assumed 5% return | | | 1,000.00 | | | 1,020.57 | | | 4.69 | | | .92 | |
| Class 529-F-1 - actual return | | | 1,000.00 | | | 1,013.84 | | | 2.33 | | | .46 | |
| Class 529-F-1 - assumed 5% return | | | 1,000.00 | | | 1,022.89 | | | 2.35 | | | .46 | |
| Class R-1 - actual return | | | 1,000.00 | | | 1,009.10 | | | 6.99 | | | 1.38 | |
| Class R-1 - assumed 5% return | | | 1,000.00 | | | 1,018.25 | | | 7.02 | | | 1.38 | |
| Class R-2 - actual return | | | 1,000.00 | | | 1,009.29 | | | 6.84 | | | 1.35 | |
| Class R-2 - assumed 5% return | | | 1,000.00 | | | 1,018.40 | | | 6.87 | | | 1.35 | |
| Class R-2E - actual return | | | 1,000.00 | | | 1,011.77 | | | 4.92 | | | .97 | |
| Class R-2E - assumed 5% return | | | 1,000.00 | | | 1,020.32 | | | 4.94 | | | .97 | |
| Class R-3 - actual return | | | 1,000.00 | | | 1,011.40 | | | 4.71 | | | .93 | |
| Class R-3 - assumed 5% return | | | 1,000.00 | | | 1,020.52 | | | 4.74 | | | .93 | |
| Class R-4 - actual return | | | 1,000.00 | | | 1,013.31 | | | 3.25 | | | .64 | |
| Class R-4 - assumed 5% return | | | 1,000.00 | | | 1,021.98 | | | 3.26 | | | .64 | |
| Class R-5E - actual return† | | | 1,000.00 | | | 987.93 | | | .48 | | | .43 | |
| Class R-5E - assumed 5% return† | | | 1,000.00 | | | 1,023.04 | | | 2.19 | | | .43 | |
| Class R-5 - actual return | | | 1,000.00 | | | 1,014.41 | | | 1.73 | | | .34 | |
| Class R-5 - assumed 5% return | | | 1,000.00 | | | 1,023.49 | | | 1.73 | | | .34 | |
| Class R-6 - actual return | | | 1,000.00 | | | 1,014.68 | | | 1.47 | | | .29 | |
| Class R-6 - assumed 5% return | | | 1,000.00 | | | 1,023.74 | | | 1.48 | | | .29 | |
| * | The “expenses paid during period” are equal to the “annualized expense ratio,” multiplied by the average account value over the period, multiplied by the number of days in the period, and divided by 365 (to reflect the one-half year period). |
| † | The period for the “annualized expense ratio” and “actual return” line is based on the number of days since the initial sale of the share class on November 20, 2015. The “assumed 5% return” line is based on 184 days. |
We are required to advise you of the federal tax status of certain distributions received by shareholders during the fiscal year. The fund hereby designates the following amounts for the fund’s fiscal year ended December 31, 2015:
| Long-term capital gains | $ | 3,415,942,000 |
| Qualified dividend income | | 100% |
| Corporate dividends received deduction | $ | 1,073,422,000 |
| U.S. government income that may be exempt from state taxation | $ | 89,861,000 |
Individual shareholders should refer to their Form 1099 or other tax information, which was mailed in January 2016, to determine the calendar year amounts to be included on their 2015 tax returns. Shareholders should consult their tax advisors.
Approval of Investment Advisory and Service Agreement
The American Balanced Fund’s board has approved the fund’s Investment Advisory and Service Agreement (the “agreement”) with Capital Research and Management Company (“CRMC”) for an additional one-year term through January 31, 2017. The board approved the agreement following the recommendation of the fund’s Contracts Committee (the “committee”), which is composed of all of the fund’s independent board members. The board and the committee determined that the fund’s advisory fee structure was fair and reasonable in relation to the services provided, and that approving the agreement was in the best interests of the fund and its shareholders.
In reaching this decision, the board and the committee took into account information furnished to them throughout the year and otherwise provided to them, as well as information prepared specifically in connection with their review of the agreement, and were advised by their independent counsel. They considered the following factors, among others, but did not identify any single issue or particular piece of information that, in isolation, was the controlling factor, and each board and committee member did not necessarily attribute the same weight to each factor.
1. Nature, extent and quality of services
The board and the committee considered the depth and quality of CRMC’s investment management process, including its global research capabilities; the experience, capability and integrity of its senior management and other personnel; the low turnover rates of its key personnel; the overall financial strength and stability of CRMC and the Capital Group organization; and the ongoing evolution of CRMC’s organizational structure designed to maintain and strengthen these qualities. The board and the committee also considered the nature, extent and quality of administrative, compliance and shareholder services provided by CRMC to the fund under the agreement and other agreements, as well as the benefits to fund shareholders from investing in a fund that is part of a large family of funds. The board and the committee concluded that the nature, extent and quality of the services provided by CRMC have benefited and should continue to benefit the fund and its shareholders.
2. Investment results
The board and the committee considered the investment results of the fund in light of its objectives of providing conservation of capital, current income and long-term growth of capital and income. They compared the fund’s investment results with those of other funds (including funds that form the basis of the Lipper index for the category in which the fund is included), and data such as relevant market and fund indexes, over various periods through May 31, 2015. This report, including the letter to shareholders and related disclosures, contains certain information about the fund’s investment results. The board and the committee reviewed the fund’s investment results measured against various indexes, including the Lipper Balanced Funds Index, the S&P 500 Index, the Barclays U.S. Aggregate Index and a customized index comprised 60% of the S&P 500 Index and 40% of the Barclays U.S. Aggregate Index (adjusted for Fund expenses). They noted that the investment results of the fund generally exceeded those of these indexes for the lifetime, 20-year, 10-year and 5-year periods, except for the S&P 500 Index. They also noted that the volatility of the fund’s monthly returns for such periods was at or near that of the Lipper Balanced Funds Index and less than that of the S&P 500 Index. The board and the committee concluded that the fund’s investment results have been satisfactory for renewal of the agreement and that CRMC’s record in managing the fund indicated that its continued management should benefit the fund and its shareholders.
3. Advisory fees and total expenses
The board and the committee compared the advisory fees and total expense levels of the fund to those of other relevant funds. They observed that the fund’s advisory fees and expenses generally compared favorably to those of other similar funds included in the Lipper Balanced Funds category. The board and the committee also considered the breakpoint discounts in the fund’s advisory fee structure that reduce the level of fees charged by CRMC to the fund as fund assets increase. In addition, they reviewed information regarding the effective advisory fees charged to non-mutual fund clients by CRMC and its affiliates. They noted that, to the extent there were differences between the advisory fees paid by the fund and the advisory fees paid by those clients, the differences appropriately reflected the investment, operational and regulatory differences between advising the fund and the other clients. The board and the committee concluded that the fund’s cost structure was fair and reasonable in relation to the services provided, and that the fund’s shareholders receive reasonable value in return for the advisory fees and other amounts paid to CRMC by the fund.
4. Ancillary benefits
The board and the committee considered a variety of other benefits that CRMC and its affiliates receive as a result of CRMC’s relationship with the fund and the other American Funds, including fees for administrative services provided to certain share classes; fees paid to CRMC’s affiliated transfer agent; sales charges and distribution fees received and retained by the fund’s principal underwriter, an affiliate of CRMC; and possible ancillary benefits to CRMC and its institutional management affiliates in managing other investment vehicles. The board and the committee reviewed CRMC’s portfolio trading practices, noting the benefits CRMC receives from the research obtained with commissions from portfolio transactions made on behalf of the fund. The board and the committee took these ancillary benefits into account in evaluating the reasonableness of the advisory fees and other amounts paid to CRMC by the fund.
5. Adviser financial information
The board and the committee reviewed information regarding CRMC’s costs of providing services to the American Funds, including personnel, systems and resources of investment, compliance, trading, accounting and other administrative operations. They considered CRMC’s costs and related cost allocation methodology as well as its willingness to invest in technology, infrastructure and staff to maintain and expand services and capabilities, respond to industry and regulatory developments, and attract and retain qualified personnel. They noted information regarding the compensation structure for CRMC’s investment professionals. The board and the committee also compared CRMC’s profitability and compensation data to the reported results and data of several large, publicly held investment management companies. The board and the committee noted the competitiveness and cyclicality of both the mutual fund industry and the capital markets, and the importance in that environment of CRMC’s long-term profitability for maintaining its independence, company culture and management continuity. They further considered the breakpoint discounts in the fund’s advisory fee structure. The board and the committee concluded that the fund’s advisory fee structure reflected a reasonable sharing of benefits between CRMC and the fund’s shareholders.
Board of trustees and other officers
Independent trustees1
| | | Year first | | | | Number of | | |
| | | elected | | | | portfolios3 in fund | | |
| | | a trustee | | | | complex overseen | | Other directorships4 |
| Name and year of birth | | of the fund2 | | Principal occupation(s) during past five years | | by trustee | | held by trustee |
| William H. Baribault, 1945 | | 2012 | | CEO and President, Richard Nixon Foundation; Chairman of the Board and CEO, Oakwood Enterprises (private investment and consulting) | | 81 | | General Finance Corporation |
| Vanessa C. L. Chang, 1952 | | 2012 | | Director, EL & EL Investments (real estate) | | 4 | | Edison International; Transocean Ltd. |
| Linda Griego, 1947 | | 2012 | | President and CEO, Griego Enterprises, Inc. (business management company) | | 7 | | AECOM Technology Corporation; CBS Corporation |
| Leonade D. Jones, 1947 | | 1993 | | Retired; former Treasurer, The Washington Post Company (retired 1996) | | 10 | | None |
| William D. Jones, 1955 | | 2008 | | Real estate developer/owner, President and CEO, CityLink Investment Corporation (acquires, develops and manages real estate ventures in urban communities) and City Scene Management Company (provides commercial asset and property management services) | | 8 | | Sempra Energy |
| James J. Postl, 1946 | | 2007 | | Retired; former President and CEO, Pennzoil-Quaker State Company (automotive products and services) (retired 2002) | | 4 | | Pulte, Inc. |
| Margaret Spellings, 1957 | | 2012 | | President, George W. Bush Foundation; former President and CEO, Margaret Spellings & Company (public policy and strategic consulting); former President, U.S. Chamber Foundation and Senior Advisor to the President and CEO, U.S. Chamber of Commerce | | 82 | | ClubCorp Holdings, Inc. |
Isaac Stein, 1946
Chairman of the Board (Independent and Non-Executive) | | 2004 | | Private investor; former President, Waverley Associates (private investment fund); Chairman Emeritus of the Board of Trustees, Stanford University | | 4 | | Alexza Pharmaceuticals, Inc. |
Interested trustee5,6
| | | Year first | | | | | | |
| | | elected | | | | Number of | | |
| | | a trustee | | Principal occupation(s) during past five years | | portfolios3 in fund | | |
| Name, year of birth and | | or officer | | and positions held with affiliated entities or | | complex overseen | | Other directorships4 |
| position with fund | | of the fund2 | | the principal underwriter of the fund | | by trustee | | held by trustee |
Gregory D. Johnson, 1963
Vice Chairman of the Board and President | | 2003 | | Director, Capital Research and Management Company; Partner — Capital World Investors, Capital Research and Management Company | | 1 | | None |
The fund’s statement of additional information includes further details about fund trustees and is available without charge upon request by calling American Funds Service Company at (800) 421-4225 or by visiting the American Funds website at americanfunds.com. The address for all trustees and officers of the fund is 333 South Hope Street, Los Angeles, CA 90071, Attention: Secretary.
See page 36 for footnotes.
Other officers6
| | | Year first | | |
Name, year of birth and
position with fund | | elected
an officer
of the fund2 | | Principal occupation(s) during past five years and positions held with affiliated entities or the principal underwriter of the fund |
Hilda L. Applbaum, 1961
Senior Vice President | | 1999 | | Partner — Capital World Investors, Capital Research and Management Company |
Jeffrey T. Lager, 1968
Senior Vice President | | 2002 | | Partner — Capital World Investors, Capital Research and Management Company |
James R. Mulally, 1952
Senior Vice President | | 2009 | | Partner — Capital Fixed Income Investors, Capital Research and Management Company |
Paul F. Roye, 1953
Senior Vice President | | 2007 | | Director, Capital Research and Management Company; Senior Vice President — Fund Business Management Group, Capital Research and Management Company |
John H. Smet, 1956
Senior Vice President | | 2000 | | Partner — Capital Fixed Income Investors, Capital Research and Management Company; Director, Capital Research and Management Company |
Paul R. Benjamin, 1979
Vice President | | 2014 | | Partner — Capital World Investors, Capital Research and Management Company |
Alan N. Berro, 1960
Vice President | | 2010 | | Partner — Capital World Investors, Capital Research and Management Company |
Donald H. Rolfe, 1972
Vice President | | 2012 | | Vice President and Senior Counsel — Fund Business Management Group, Capital Research and Management Company |
Richmond A. Wolf, 1970
Vice President | | 2014 | | Partner — Capital World Investors, Capital Research and Management Company |
Michael W. Stockton, 1967
Secretary | | 2014 | | Vice President — Fund Business Management Group, Capital Research and Management Company |
Jeffrey P. Regal, 1971
Treasurer | | 2011 | | Vice President — Investment Operations, Capital Research and Management Company |
Viviane T. Russo, 1981
Assistant Secretary | | 2014 | | Associate — Fund Business Management Group, Capital Research and Management Company |
Dori Laskin, 1951
Assistant Treasurer | | 2011 | | Vice President — Investment Operations, Capital Research and Management Company |
| | | | | |
| 1 | The term independent trustee refers to a trustee who is not an “interested person” of the fund within the meaning of the Investment Company Act of 1940. |
| 2 | Trustees and officers of the fund serve until their resignation, removal or retirement. |
| 3 | Funds managed by Capital Research and Management Company or its affiliates. |
| 4 | This includes all directorships/trusteeships (other than those in the American Funds or other funds managed by Capital Research and Management Company or its affiliates) that are held by each trustee as a trustee or director of a public company or a registered investment company. |
| 5 | The term interested trustee refers to a trustee who is an “interested person” within the meaning of the Investment Company Act of 1940, on the basis of their affiliation with the fund’s investment adviser, Capital Research and Management Company, or affiliated entities (including the fund’s principal underwriter). |
| 6 | All of the directors/trustees and/or officers listed, except Paul R. Benjamin, James R. Mulally and Richmond A. Wolf, are officers and/or directors/trustees of one or more of the other funds for which Capital Research and Management Company serves as investment adviser. |
Office of the fund
6455 Irvine Center Drive Irvine,
CA 92618-4518
Investment adviser
Capital Research and Management Company
333 South Hope Street
Los Angeles, CA 90071-1406
6455 Irvine Center Drive
Irvine, CA 92618-4518
Transfer agent for shareholder accounts
American Funds Service Company
(Write to the address near you.)
P.O. Box 6007
Indianapolis, IN 46206-6007
P.O. Box 2280
Norfolk, VA 23501-2280
Custodian of assets
JPMorgan Chase Bank
270 Park Avenue
New York, NY 10017-2070
Counsel
Morgan, Lewis & Bockius LLP
300 South Grand Avenue, 22nd Floor
Los Angeles, CA 90071-3132
Independent registered public accounting firm
Deloitte & Touche LLP
695 Town Center Drive
Suite 1200
Costa Mesa, CA 92626-7188
Principal underwriter
American Funds Distributors, Inc.
333 South Hope Street
Los Angeles, CA 90071-1406
Investors should carefully consider investment objectives, risks, charges and expenses. This and other important information is contained in the fund prospectus and summary prospectus, which can be obtained from your financial professional and should be read carefully before investing. You may also call American Funds Service Company (AFS) at (800) 421-4225 or visit the American Funds website at americanfunds.com.
“American Funds Proxy Voting Procedures and Principles” — which describes how we vote proxies relating to portfolio securities — is available on the American Funds website or upon request by calling AFS. The fund files its proxy voting record with the U.S. Securities and Exchange Commission (SEC) for the 12 months ended June 30 by August 31. The proxy voting record is available free of charge on the SEC website at sec.gov and on the American Funds website.
A complete December 31, 2015, portfolio of American Balanced Fund’s investments is available free of charge by calling AFS or visiting the SEC website (where it is part of Form N-CSR).
American Balanced Fund files a complete list of its portfolio holdings with the SEC for the first and third quarters of each fiscal year on Form N-Q. This filing is available free of charge on the SEC website. You may also review or, for a fee, copy this filing at the SEC’s Public Reference Room in Washington, D.C. Additional information regarding the operation of the Public Reference Room may be obtained by calling the SEC’s Office of Investor Education and Advocacy at (800) SEC-0330. Additionally, the list of portfolio holdings is available by calling AFS.
This report is for the information of shareholders of American Balanced Fund, but it also may be used as sales literature when preceded or accompanied by the current prospectus or summary prospectus, which gives details about charges, expenses, investment objectives and operating policies of the fund. If used as sales material after March 31, 2016, this report must be accompanied by an American Funds statistical update for the most recently completed calendar quarter.
The American Funds Advantage
Since 1931, American Funds, part of Capital Group, has helped investors pursue long-term investment success. Our consistent approach — in combination with The Capital SystemSM — has resulted in a superior long-term track record.
| | Aligned with investor success |
| | We base our decisions on a long-term perspective, which we believe aligns our goals with the interests of our clients. Our portfolio managers average 27 years of investment experience, including 22 years at our company, reflecting a career commitment to our long-term approach.1 |
| | |
| | The Capital SystemSM |
| | The Capital System combines individual accountability with teamwork. Funds using The Capital System are divided into portions that are managed independently by investment professionals with diverse backgrounds, ages and investment approaches. An extensive global research effort is the backbone of our system. |
| | |
| | Superior long-term track record |
| | Our equity funds have beaten their Lipper peer indexes in 91% of 10-year periods and 95% of 20-year periods. Our fixed-income funds have beaten their Lipper indexes in 58% of 10-year periods and 58% of 20-year periods.2 Our fund management fees have been among the lowest in the industry.3 |
| | |
| | 1 | Portfolio manager experience as of December 31, 2015. |
| | 2 | Based on Class A share results for rolling periods through December 31, 2015. Periods covered are the shorter of the fund’s lifetime or since the comparable Lipper index inception date (except Capital Income Builder and SMALLCAP World Fund, for which the Lipper average was used). |
| | 3 | On average, our management fees were in the lowest quintile 68% of the time, based on the 20-year period ended December 31, 2015, versus comparable Lipper categories, excluding funds of funds. |

ITEM 2 – Code of Ethics
The Registrant has adopted a Code of Ethics that applies to its Principal Executive Officer and Principal Financial Officer. The Registrant undertakes to provide to any person without charge, upon request, a copy of the Code of Ethics. Such request can be made to American Funds Service Company at 800/421-9225 or to the Secretary of the Registrant, 6455 Irvine Center Drive, Irvine, California 92618.
ITEM 3 – Audit Committee Financial Expert
The Registrant’s board has determined that Vanessa C. L. Chang, a member of the Registrant’s audit committee, is an “audit committee financial expert” and "independent," as such terms are defined in this Item. This designation will not increase the designee’s duties, obligations or liability as compared to his or her duties, obligations and liability as a member of the audit committee and of the board, nor will it reduce the responsibility of the other audit committee members. There may be other individuals who, through education or experience, would qualify as "audit committee financial experts" if the board had designated them as such. Most importantly, the board believes each member of the audit committee contributes significantly to the effective oversight of the Registrant’s financial statements and condition.
ITEM 4 – Principal Accountant Fees and Services
| | Registrant: |
| | | a) Audit Fees: |
| | | | 2014 | $106,000 |
| | | | 2015 | $110,000 |
| | | | |
| | | b) Audit-Related Fees: |
| | | | 2014 | $17,000 |
| | | | 2015 | $25,000 |
| | | | The audit-related fees consist of assurance and related services relating to the examination of the Registrant’s investment adviser conducted in accordance with Statement on Standards for Attestation Engagements Number 16 issued by the American Institute of Certified Public Accountants. |
| | | | |
| | | c) Tax Fees: |
| | | | 2014 | $8,000 |
| | | | 2015 | $8,000 |
| | | | The tax fees consist of professional services relating to the preparation of the Registrant’s tax returns including returns relating to the Registrant’s investments in non-U.S. jurisdictions. |
| | | | |
| | | d) All Other Fees: |
| | | | 2014 | None |
| | | | 2015 | None |
| | | | |
| | Adviser and affiliates (includes only fees for non-audit services billed to the adviser and affiliates for engagements that relate directly to the operations and financial reporting of the Registrant and were subject to the pre-approval policies described below): |
| | | a) Audit Fees: |
| | | | Not Applicable |
| | | | |
| | | b) Audit-Related Fees: |
| | | | 2014 | $927,000 |
| | | | 2015 | $1,183,000 |
| | | | The audit-related fees consist of assurance and related services relating to the examination of the Registrant’s transfer agent, principal underwriter and investment adviser conducted in accordance with Statement on Standards for Attestation Engagements Number 16 issued by the American Institute of Certified Public Accountants. |
| | | | |
| | | c) Tax Fees: |
| | | | 2014 | $33,000 |
| | | | 2015 | None |
| | | | The tax fees consist of consulting services relating to the Registrant’s investments. |
| | | | |
| | | d) All Other Fees: |
| | | | 2014 | $3,000 |
| | | | 2015 | $5,000 |
| | | | The other fees consist of subscription services related to an accounting research tool. |
| | | | |
All audit and permissible non-audit services that the Registrant’s audit committee considers compatible with maintaining the independent registered public accounting firm’s independence are required to be pre-approved by the committee. The pre-approval requirement will extend to all non-audit services provided to the Registrant, the investment adviser, and any entity controlling, controlled by, or under common control with the investment adviser that provides ongoing services to the Registrant, if the engagement relates directly to the operations and financial reporting of the Registrant. The committee will not delegate its responsibility to pre-approve these services to the investment adviser. The committee may delegate to one or more committee members the authority to review and pre-approve audit and permissible non-audit services. Actions taken under any such delegation will be reported to the full committee at its next meeting. The pre-approval requirement is waived with respect to non-audit services if certain conditions are met. The pre-approval requirement was not waived for any of the non-audit services listed above provided to the Registrant, adviser and affiliates.
Aggregate non-audit fees paid to the Registrant’s auditors, including fees for all services billed to the Registrant, adviser and affiliates that provide ongoing services to the Registrant, were $1,286,000 for fiscal year 2014 and $1,491,000 for fiscal year 2015. The non-audit services represented by these amounts were brought to the attention of the committee and considered to be compatible with maintaining the auditors’ independence.
ITEM 5 – Audit Committee of Listed Registrants
Not applicable to this Registrant, insofar as the Registrant is not a listed issuer as defined in Rule 10A-3 under the Securities Exchange Act of 1934.
ITEM 6 – Schedule of Investments
American Balanced Fund®
Investment portfolio
December 31, 2015
Common stocks 60.71%
Financials 10.76% | Shares | Value
(000) |
| Wells Fargo & Co. | 32,477,000 | $1,765,450 |
| Berkshire Hathaway Inc., Class A1 | 8,179 | 1,617,806 |
| JPMorgan Chase & Co. | 21,561,000 | 1,423,673 |
| ACE Ltd. | 4,815,000 | 562,633 |
| Citigroup Inc. | 10,500,000 | 543,375 |
| SunTrust Banks, Inc. | 12,500,000 | 535,500 |
| Capital One Financial Corp. | 5,059,000 | 365,159 |
| PNC Financial Services Group, Inc. | 3,275,000 | 312,140 |
| Goldman Sachs Group, Inc. | 1,506,700 | 271,553 |
| American Express Co. | 3,270,000 | 227,428 |
| Weyerhaeuser Co.1 | 7,000,000 | 209,860 |
| U.S. Bancorp | 4,700,000 | 200,549 |
| Chubb Corp. | 1,500,000 | 198,960 |
| BlackRock, Inc. | 550,000 | 187,286 |
| Legal & General Group PLC2 | 30,000,000 | 118,314 |
| Bank of America Corp. | 7,000,000 | 117,810 |
| American Tower Corp. | 1,215,000 | 117,794 |
| Crown Castle International Corp. | 1,190,446 | 102,914 |
| CNO Financial Group, Inc. | 4,904,120 | 93,620 |
| Sumitomo Mitsui Financial Group, Inc. (ADR) | 8,500,000 | 64,515 |
| Iron Mountain Inc. | 1,002,000 | 27,064 |
| Intercontinental Exchange, Inc. | 97,000 | 24,857 |
| HDFC Bank Ltd.2 | 740,000 | 14,792 |
| | | 9,103,052 |
| Consumer discretionary 9.88% | | |
| Amazon.com, Inc.1 | 2,954,000 | 1,996,579 |
| Comcast Corp., Class A | 34,370,000 | 1,939,499 |
| Home Depot, Inc. | 13,309,349 | 1,760,161 |
| Twenty-First Century Fox, Inc., Class A | 31,102,306 | 844,739 |
| VF Corp. | 5,201,000 | 323,762 |
| Walt Disney Co. | 3,070,000 | 322,596 |
| Target Corp. | 2,700,000 | 196,047 |
| Time Warner Inc. | 3,000,000 | 194,010 |
| CBS Corp., Class B | 3,485,000 | 164,248 |
| NIKE, Inc., Class B | 2,190,000 | 136,875 |
| Macy’s, Inc. | 3,700,000 | 129,426 |
| General Motors Co. | 3,500,000 | 119,035 |
| Charter Communications, Inc., Class A1 | 610,000 | 111,691 |
| Hasbro, Inc. | 1,200,000 | 80,832 |
| Liberty Global PLC, Class C1 | 503,500 | 20,528 |
| Gentex Corp. | 856,000 | 13,704 |
| | | 8,353,732 |
American Balanced Fund — Page 1 of 30
Common stocks
Information technology 9.79% | Shares | Value
(000) |
| Microsoft Corp. | 61,250,000 | $3,398,150 |
| Intel Corp. | 19,005,100 | 654,726 |
| Avago Technologies Ltd. | 4,124,500 | 598,671 |
| ASML Holding NV (New York registered) | 4,944,401 | 438,915 |
| ASML Holding NV2 | 1,723,143 | 153,560 |
| Texas Instruments Inc. | 9,282,000 | 508,746 |
| VeriSign, Inc.1 | 5,400,000 | 471,744 |
| TE Connectivity Ltd. | 6,655,000 | 429,980 |
| Taiwan Semiconductor Manufacturing Co., Ltd. (ADR) | 17,650,000 | 401,537 |
| Cisco Systems, Inc. | 11,500,000 | 312,283 |
| Alphabet Inc., Class A1 | 171,000 | 133,040 |
| Alphabet Inc., Class C1 | 171,535 | 130,174 |
| Visa Inc., Class A | 3,292,000 | 255,295 |
| KLA-Tencor Corp. | 2,367,000 | 164,151 |
| Analog Devices, Inc. | 2,700,000 | 149,364 |
| salesforce.com, inc.1 | 905,000 | 70,952 |
| MasterCard Inc., Class A | 95,000 | 9,249 |
| | | 8,280,537 |
| Consumer staples 8.18% | | |
| Philip Morris International Inc. | 24,692,000 | 2,170,674 |
| Coca-Cola Co. | 37,468,000 | 1,609,625 |
| Procter & Gamble Co. | 10,060,000 | 798,865 |
| Kraft Heinz Co. | 9,986,850 | 726,643 |
| Mondelez International, Inc. | 10,000,000 | 448,400 |
| Reynolds American Inc. | 6,401,800 | 295,443 |
| Costco Wholesale Corp. | 1,547,326 | 249,893 |
| Kroger Co. | 5,170,000 | 216,261 |
| Walgreens Boots Alliance, Inc. | 2,500,000 | 212,888 |
| CVS Health Corp. | 1,790,000 | 175,008 |
| British American Tobacco PLC2 | 190,000 | 10,552 |
| | | 6,914,252 |
| Health care 6.37% | | |
| UnitedHealth Group Inc. | 9,132,500 | 1,074,347 |
| Merck & Co., Inc. | 19,132,406 | 1,010,574 |
| Express Scripts Holding Co.1 | 7,590,000 | 663,442 |
| Johnson & Johnson | 5,610,000 | 576,259 |
| Bristol-Myers Squibb Co. | 7,140,000 | 491,161 |
| Medtronic PLC | 5,851,000 | 450,059 |
| Pfizer Inc. | 13,240,000 | 427,387 |
| Thermo Fisher Scientific Inc. | 1,321,000 | 187,384 |
| Roche Holding AG, non-registered shares, non-voting2 | 500,000 | 137,794 |
| Baxalta Inc. | 2,500,000 | 97,575 |
| Abbott Laboratories | 1,980,000 | 88,922 |
| Gilead Sciences, Inc. | 750,000 | 75,892 |
| Amgen Inc. | 434,000 | 70,451 |
| Baxter International Inc. | 502,800 | 19,182 |
| Kite Pharma, Inc.1 | 273,000 | 16,822 |
| | | 5,387,251 |
| Industrials 6.03% | | |
| Lockheed Martin Corp. | 6,194,037 | 1,345,035 |
| Boeing Co. | 8,302,000 | 1,200,386 |
| General Electric Co. | 21,500,000 | 669,725 |
American Balanced Fund — Page 2 of 30
Common stocks
Industrials (continued) | Shares | Value
(000) |
| United Technologies Corp. | 3,010,000 | $289,171 |
| Deere & Co. | 3,710,000 | 282,962 |
| Union Pacific Corp. | 3,125,000 | 244,375 |
| Parker-Hannifin Corp. | 2,500,000 | 242,450 |
| Nielsen Holdings PLC | 5,000,000 | 233,000 |
| Cummins Inc. | 1,822,457 | 160,394 |
| Norfolk Southern Corp. | 1,598,900 | 135,251 |
| Rockwell Automation | 1,000,000 | 102,610 |
| Caterpillar Inc. | 1,300,000 | 88,348 |
| General Dynamics Corp. | 350,000 | 48,076 |
| TransDigm Group Inc.1 | 146,000 | 33,354 |
| Rockwell Collins, Inc. | 311,700 | 28,770 |
| | | 5,103,907 |
| Energy 3.87% | | |
| ConocoPhillips | 12,010,000 | 560,747 |
| Royal Dutch Shell PLC, Class B (ADR) | 9,868,000 | 454,323 |
| Royal Dutch Shell PLC, Class B2 | 4,000,000 | 91,337 |
| Chevron Corp. | 5,444,755 | 489,810 |
| Enbridge Inc. | 11,690,000 | 387,991 |
| Noble Energy, Inc. | 10,178,229 | 335,169 |
| Baker Hughes Inc. | 4,036,764 | 186,297 |
| Phillips 66 | 2,180,000 | 178,324 |
| Concho Resources Inc.1 | 1,559,000 | 144,769 |
| BP PLC2 | 26,000,000 | 135,484 |
| TOTAL SA2 | 1,466,797 | 65,325 |
| TOTAL SA (ADR) | 821,656 | 36,933 |
| Weatherford International PLC1 | 9,000,000 | 75,510 |
| Suncor Energy Inc. | 2,000,000 | 51,630 |
| Southwestern Energy Co.1 | 5,000,000 | 35,550 |
| Schlumberger Ltd. | 345,000 | 24,064 |
| Kinder Morgan, Inc. | 690,000 | 10,295 |
| Oceaneering International, Inc. | 180,000 | 6,753 |
| | | 3,270,311 |
| Materials 2.23% | | |
| E.I. du Pont de Nemours and Co. | 10,807,388 | 719,772 |
| Praxair, Inc. | 5,580,407 | 571,434 |
| LyondellBasell Industries NV | 2,642,100 | 229,598 |
| Dow Chemical Co. | 3,500,000 | 180,180 |
| Potash Corp. of Saskatchewan Inc. | 6,300,569 | 107,866 |
| Nucor Corp. | 2,000,000 | 80,600 |
| | | 1,889,450 |
| Telecommunication services 0.17% | | |
| AT&T Inc. | 3,366,000 | 115,824 |
| TDC A/S2 | 2,810,000 | 13,940 |
| Verizon Communications Inc. | 252,000 | 11,647 |
| | | 141,411 |
| Utilities 0.14% | | |
| PG&E Corp. | 2,000,000 | 106,380 |
| National Grid PLC2 | 1,140,000 | 15,680 |
| | | 122,060 |
American Balanced Fund — Page 3 of 30
Common stocks
Miscellaneous 3.29% | Shares | Value
(000) |
| Other common stocks in initial period of acquisition | | $2,781,628 |
| Total common stocks (cost: $33,736,116,000) | | 51,347,591 |
Preferred securities 0.01%
Financials 0.01% | | |
| CoBank, ACB, Class E, noncumulative3 | 7,440 | 4,908 |
| Total preferred securities (cost: $5,208,000) | | 4,908 |
Bonds, notes & other debt instruments 33.39%
U.S. Treasury bonds & notes 11.55%
U.S. Treasury 8.74% | Principal amount
(000) | |
| U.S. Treasury 0.625% 2016 | $136,450 | 136,439 |
| U.S. Treasury 1.50% 2016 | 375,000 | 376,789 |
| U.S. Treasury 4.50% 2016 | 58,500 | 58,784 |
| U.S. Treasury 0.625% 20184 | 780,000 | 770,429 |
| U.S. Treasury 1.125% 2018 | 210,000 | 209,687 |
| U.S. Treasury 1.25% 2018 | 255,000 | 254,709 |
| U.S. Treasury 1.50% 2019 | 44,000 | 43,845 |
| U.S. Treasury 1.75% 2019 | 110,000 | 110,782 |
| U.S. Treasury 1.25% 2020 | 617,000 | 607,696 |
| U.S. Treasury 1.375% 2020 | 1,232,875 | 1,211,546 |
| U.S. Treasury 1.375% 2020 | 120,325 | 118,290 |
| U.S. Treasury 1.375% 2020 | 78,000 | 77,071 |
| U.S. Treasury 1.50% 2020 | 543,025 | 538,675 |
| U.S. Treasury 1.625% 2020 | 692,750 | 688,850 |
| U.S. Treasury 1.75% 2022 | 510,500 | 500,510 |
| U.S. Treasury 2.00% 2022 | 179,750 | 178,822 |
| U.S. Treasury 2.00% 2022 | 35,000 | 35,086 |
| U.S. Treasury 2.125% 2022 | 62,250 | 62,588 |
| U.S. Treasury 2.25% 2024 | 75,000 | 74,978 |
| U.S. Treasury 2.00% 2025 | 432,518 | 421,731 |
| U.S. Treasury 2.00% 2025 | 30,000 | 29,325 |
| U.S. Treasury 2.125% 2025 | 129,450 | 127,721 |
| U.S. Treasury 5.50% 2028 | 40,000 | 53,244 |
| U.S. Treasury 5.375% 2031 | 20,000 | 27,128 |
| U.S. Treasury 2.75% 2042 | 32,950 | 31,531 |
| U.S. Treasury 2.875% 2043 | 86,410 | 84,338 |
| U.S. Treasury 3.125% 2043 | 48,025 | 49,275 |
| U.S. Treasury 3.125% 2044 | 39,797 | 40,714 |
| U.S. Treasury 3.625% 2044 | 66,625 | 75,016 |
| U.S. Treasury 2.50% 2045 | 115,000 | 103,293 |
| U.S. Treasury 2.875% 2045 | 110,000 | 106,941 |
| U.S. Treasury 3.00% 2045 | 135,275 | 134,768 |
| U.S. Treasury 3.00% 2045 | 51,435 | 51,329 |
| | | 7,391,930 |
| U.S. Treasury inflation-protected securities 2.81% | | |
| U.S. Treasury Inflation-Protected Security 0.125% 20165 | 88,680 | 88,329 |
| U.S. Treasury Inflation-Protected Security 2.50% 20165 | 119,303 | 121,206 |
| U.S. Treasury Inflation-Protected Security 2.125% 20195 | 55,390 | 58,630 |
| U.S. Treasury Inflation-Protected Security 0.125% 20205 | 156,966 | 155,093 |
American Balanced Fund — Page 4 of 30
Bonds, notes & other debt instruments
U.S. Treasury bonds & notes (continued)
U.S. Treasury inflation-protected securities (continued) | Principal amount
(000) | Value
(000) |
| U.S. Treasury Inflation-Protected Security 0.125% 20245 | $56,344 | $53,563 |
| U.S. Treasury Inflation-Protected Security 0.625% 20245 | 498,045 | 492,802 |
| U.S. Treasury Inflation-Protected Security 0.25% 20255 | 112,969 | 107,888 |
| U.S. Treasury Inflation-Protected Security 0.375% 20255 | 491,741 | 476,347 |
| U.S. Treasury Inflation-Protected Security 2.375% 20255 | 63,089 | 71,787 |
| U.S. Treasury Inflation-Protected Security 1.75% 20285 | 30,540 | 33,399 |
| U.S. Treasury Inflation-Protected Security 0.75% 20425 | 130,746 | 115,072 |
| U.S. Treasury Inflation-Protected Security 0.625% 20435 | 3,310 | 2,806 |
| U.S. Treasury Inflation-Protected Security 1.375% 20445 | 293,578 | 299,122 |
| U.S. Treasury Inflation-Protected Security 0.75% 20455 | 338,735 | 295,800 |
| | | 2,371,844 |
| Total U.S. Treasury bonds & notes | | 9,763,774 |
Corporate bonds & notes 10.97%
Financials 3.12% | | |
| ACE INA Holdings Inc. 2.30% 2020 | 7,635 | 7,589 |
| ACE INA Holdings Inc. 2.875% 2022 | 25,665 | 25,509 |
| ACE INA Holdings Inc. 3.15% 2025 | 23,495 | 23,262 |
| ACE INA Holdings Inc. 3.35% 2026 | 8,660 | 8,646 |
| ACE INA Holdings Inc. 4.35% 2045 | 16,170 | 16,474 |
| Alexandria Real Estate Equities, Inc. 4.30% 2026 | 15,720 | 15,541 |
| American Campus Communities, Inc. 3.35% 2020 | 5,815 | 5,815 |
| American Campus Communities, Inc. 3.75% 2023 | 7,915 | 7,801 |
| American Campus Communities, Inc. 4.125% 2024 | 12,175 | 12,112 |
| American Express Co. 6.15% 2017 | 22,800 | 24,419 |
| American Express Credit Co. 1.55% 2017 | 15,465 | 15,463 |
| American International Group, Inc. 2.30% 2019 | 15,000 | 14,887 |
| American International Group, Inc. 3.75% 2025 | 9,100 | 9,042 |
| American International Group, Inc. 3.875% 2035 | 15,000 | 13,272 |
| American Tower Corp. 3.40% 2019 | 13,550 | 13,912 |
| AvalonBay Communities, Inc. 3.625% 2020 | 15,000 | 15,588 |
| AXA SA, Series B, junior subordinated 6.379% (undated)3 | 6,680 | 7,214 |
| Banco Nacional de Comercio Exterior SNC 4.375% 20253 | 5,000 | 4,950 |
| Bank of America Corp. 3.75% 2016 | 21,955 | 22,233 |
| Bank of America Corp. 2.625% 2020 | 20,000 | 19,779 |
| Bank of America Corp. 5.625% 2020 | 15,500 | 17,240 |
| Bank of America Corp. 3.875% 2025 | 30,600 | 31,128 |
| Bank of America Corp., Series L, 3.625% 2016 | 13,820 | 13,892 |
| Bank of New York Mellon Corp., Series G, 2.50% 2016 | 17,000 | 17,009 |
| Bank of Nova Scotia 4.50% 2025 | 24,000 | 23,939 |
| Barclays Bank PLC 2.50% 2019 | 11,095 | 11,125 |
| Barclays Bank PLC 3.65% 2025 | 35,460 | 34,143 |
| BB&T Corp. 2.45% 2020 | 37,000 | 37,268 |
| Berkshire Hathaway Inc. 2.20% 2016 | 23,000 | 23,197 |
| Berkshire Hathaway Inc. 2.00% 2018 | 16,340 | 16,591 |
| Berkshire Hathaway Inc. 2.90% 2020 | 9,500 | 9,855 |
| BNP Paribas 3.60% 2016 | 13,000 | 13,048 |
| BNP Paribas 4.375% 20253 | 9,700 | 9,520 |
| Boston Properties, Inc. 3.70% 2018 | 20,000 | 20,734 |
| BPCE SA group 5.70% 20233 | 8,000 | 8,423 |
| BPCE SA group 4.00% 2024 | 4,700 | 4,876 |
| BPCE SA group 4.625% 20243 | 7,200 | 7,017 |
| BPCE SA group 5.15% 20243 | 11,355 | 11,471 |
American Balanced Fund — Page 5 of 30
Bonds, notes & other debt instruments
Corporate bonds & notes (continued)
Financials (continued) | Principal amount
(000) | Value
(000) |
| Brandywine Operating Partnership, LP 3.95% 2023 | $1,639 | $1,599 |
| Capital One Financial Corp. 3.20% 2025 | 20,000 | 19,382 |
| Charles Schwab Corp. 3.45% 2026 | 7,985 | 8,131 |
| Citigroup Inc. 3.953% 2016 | 6,050 | 6,134 |
| Citigroup Inc. 8.50% 2019 | 8,416 | 10,061 |
| Citigroup Inc. 2.65% 2020 | 25,000 | 24,846 |
| Citigroup Inc. 4.45% 2027 | 26,680 | 26,581 |
| CME Group Inc. 5.30% 2043 | 3,135 | 3,597 |
| CNA Financial Corp. 6.50% 2016 | 13,500 | 13,903 |
| CNA Financial Corp. 3.95% 2024 | 9,910 | 9,888 |
| Corporate Office Properties LP 5.25% 2024 | 30,030 | 30,773 |
| Corporate Office Properties LP 5.00% 2025 | 6,735 | 6,632 |
| Corporate Office Properties Trust 3.60% 2023 | 12,100 | 11,174 |
| Credit Agricole SA 4.375% 20253 | 13,865 | 13,453 |
| Credit Suisse Group AG 1.70% 2018 | 12,000 | 11,919 |
| Credit Suisse Group AG 3.80% 20223 | 10,000 | 10,011 |
| Credit Suisse Group Funding (Guernsey) Ltd. 4.875% 20453 | 7,000 | 6,930 |
| DDR Corp. 3.50% 2021 | 7,000 | 6,954 |
| DDR Corp. 3.625% 2025 | 15,075 | 14,260 |
| DDR Corp. 4.25% 2026 | 7,370 | 7,204 |
| Developers Diversified Realty Corp. 9.625% 2016 | 1,825 | 1,854 |
| Developers Diversified Realty Corp. 7.875% 2020 | 6,365 | 7,625 |
| Discover Financial Services 4.20% 2023 | 12,715 | 13,012 |
| EPR Properties 4.50% 2025 | 4,460 | 4,251 |
| ERP Operating LP 5.375% 2016 | 13,000 | 13,299 |
| ERP Operating LP 4.75% 2020 | 12,000 | 12,981 |
| Essex Portfolio L.P. 3.875% 2024 | 21,515 | 21,536 |
| Essex Portfolio L.P. 3.50% 2025 | 21,965 | 21,174 |
| Goldman Sachs Group, Inc. 3.625% 2016 | 46,650 | 46,769 |
| Goldman Sachs Group, Inc. 2.90% 2018 | 15,000 | 15,303 |
| Goldman Sachs Group, Inc. 2.55% 2019 | 66,250 | 66,298 |
| Goldman Sachs Group, Inc. 2.60% 2020 | 24,575 | 24,544 |
| Goldman Sachs Group, Inc. 2.75% 2020 | 27,225 | 27,243 |
| Goldman Sachs Group, Inc. 5.25% 2021 | 20,000 | 22,150 |
| Goldman Sachs Group, Inc. 5.75% 2022 | 20,000 | 22,776 |
| Goldman Sachs Group, Inc. 3.85% 2024 | 14,700 | 15,035 |
| Goldman Sachs Group, Inc. 3.50% 2025 | 5,200 | 5,124 |
| Goldman Sachs Group, Inc. 4.75% 2045 | 7,025 | 7,004 |
| HCP, Inc. 5.375% 2021 | 15,000 | 16,359 |
| Hospitality Properties Trust 6.30% 2016 | 12,631 | 12,674 |
| Hospitality Properties Trust 6.70% 2018 | 23,400 | 24,765 |
| Hospitality Properties Trust 5.00% 2022 | 4,350 | 4,474 |
| Hospitality Properties Trust 4.50% 2023 | 16,130 | 16,076 |
| Hospitality Properties Trust 4.50% 2025 | 5,500 | 5,291 |
| HSBC Holdings PLC 4.25% 2024 | 8,000 | 8,051 |
| Intercontinentalexchange, Inc. 2.50% 2018 | 20,000 | 20,186 |
| Intercontinentalexchange, Inc. 2.75% 2020 | 23,185 | 23,205 |
| Intercontinentalexchange, Inc. 3.75% 2025 | 13,175 | 13,236 |
| Intesa Sanpaolo SpA 5.017% 20243 | 26,160 | 25,794 |
| JPMorgan Chase & Co. 1.35% 2017 | 23,520 | 23,477 |
| JPMorgan Chase & Co. 2.25% 2020 | 42,185 | 41,541 |
| JPMorgan Chase & Co. 2.55% 2020 | 71,680 | 71,090 |
| JPMorgan Chase & Co. 3.25% 2022 | 12,000 | 12,089 |
| JPMorgan Chase & Co. 3.875% 2024 | 25,000 | 24,927 |
American Balanced Fund — Page 6 of 30
Bonds, notes & other debt instruments
Corporate bonds & notes (continued)
Financials (continued) | Principal amount
(000) | Value
(000) |
| JPMorgan Chase & Co. 3.125% 2025 | $2,450 | $2,386 |
| JPMorgan Chase & Co., Series Z, junior subordinated 5.30% (undated) | 35,000 | 34,956 |
| JPMorgan Chase & Co., Series S, junior subordinated 6.75% (undated) | 25,000 | 27,281 |
| Keybank National Association 2.50% 2019 | 17,000 | 17,039 |
| Kimco Realty Corp. 5.70% 2017 | 6,180 | 6,495 |
| Kimco Realty Corp. 3.40% 2022 | 15,690 | 15,575 |
| Kimco Realty Corp. 3.125% 2023 | 11,705 | 11,352 |
| Kimco Realty Corp., Series C, 5.783% 2016 | 14,000 | 14,133 |
| Leucadia National Corp. 5.50% 2023 | 830 | 812 |
| Liberty Mutual Group Inc. 4.25% 20233 | 3,000 | 3,055 |
| Lloyds Banking Group PLC 2.30% 2018 | 6,215 | 6,246 |
| Lloyds Banking Group PLC 4.50% 2024 | 17,000 | 17,291 |
| Lloyds Banking Group PLC 3.50% 2025 | 11,200 | 11,261 |
| MetLife Global Funding I 2.30% 20193 | 10,120 | 10,143 |
| MetLife Global Funding I 2.00% 20203 | 6,125 | 6,006 |
| MetLife Global Funding I 2.50% 20203 | 46,300 | 46,088 |
| Metlife, Inc. 3.60% 2024 | 12,375 | 12,720 |
| Metlife, Inc. 3.60% 2025 | 10,395 | 10,488 |
| MetLife, Inc. 4.05% 2045 | 11,285 | 10,481 |
| MetLife, Inc. 5.25% 2049 | 9,700 | 9,894 |
| Morgan Stanley 3.80% 2016 | 5,700 | 5,749 |
| Morgan Stanley 4.00% 2025 | 8,950 | 9,242 |
| Morgan Stanley 4.30% 2045 | 8,765 | 8,391 |
| Nationwide Mutual Insurance Co. 2.802% 20243,6 | 8,150 | 7,898 |
| New York Life Global Funding 2.10% 20193 | 15,000 | 15,030 |
| New York Life Global Funding 1.95% 20203 | 16,000 | 15,700 |
| Nordea Bank AB 2.50% 20203 | 39,175 | 39,003 |
| PNC Bank 2.40% 2019 | 14,800 | 14,866 |
| PNC Bank 2.45% 2020 | 7,285 | 7,260 |
| PNC Bank 2.60% 2020 | 30,000 | 30,019 |
| PNC Financial Services Group, Inc. 3.90% 2024 | 23,800 | 24,422 |
| Prologis, Inc. 4.25% 2023 | 20,000 | 21,079 |
| Prologis, Inc. 3.75% 2025 | 14,770 | 14,681 |
| Prudential Financial, Inc. 2.30% 2018 | 7,595 | 7,655 |
| Prudential Financial, Inc. 3.50% 2024 | 28,600 | 28,793 |
| QBE Insurance Group Ltd. 2.40% 20183 | 19,300 | 19,330 |
| Rabobank Nederland 2.25% 2019 | 15,000 | 15,059 |
| Rabobank Nederland 3.375% 2025 | 7,200 | 7,144 |
| Rabobank Nederland 4.375% 2025 | 20,125 | 20,511 |
| Scentre Group 2.375% 20193 | 14,845 | 14,662 |
| Scentre Group 2.375% 20213 | 20,430 | 19,638 |
| Scentre Group 3.25% 20253 | 10,135 | 9,532 |
| Scentre Group 3.50% 20253 | 33,445 | 32,520 |
| Select Income REIT 3.60% 2020 | 8,000 | 8,063 |
| Select Income REIT 4.50% 2025 | 4,690 | 4,369 |
| Simon Property Group, LP 1.50% 20183 | 13,825 | 13,717 |
| Skandinaviska Enskilda 2.625% 20203 | 22,300 | 22,246 |
| Sumitomo Mitsui Banking Corp. 2.50% 2018 | 12,475 | 12,647 |
| Svenska Handelsbanken AB 2.25% 2019 | 10,000 | 10,019 |
| TD Ameritrade Holding Co. 2.95% 2022 | 12,970 | 12,867 |
| Travelers Property Casualty Corp. 4.30% 2045 | 12,905 | 13,042 |
| UBS Group AG 2.95% 20203 | 20,000 | 19,837 |
| UBS Group AG 4.125% 20253 | 28,250 | 28,137 |
| UDR, Inc. 4.00% 2025 | 3,460 | 3,501 |
American Balanced Fund — Page 7 of 30
Bonds, notes & other debt instruments
Corporate bonds & notes (continued)
Financials (continued) | Principal amount
(000) | Value
(000) |
| Unum Group 5.625% 2020 | $345 | $380 |
| Unum Group 3.875% 2025 | 5,045 | 4,976 |
| US Bancorp. 3.70% 2024 | 18,000 | 18,875 |
| US Bancorp., Series T, 1.65% 2017 | 11,500 | 11,537 |
| US Bancorp., junior subordinated 5.125% (undated) | 7,810 | 7,856 |
| US Bank NA 2.125% 2019 | 30,000 | 30,005 |
| WEA Finance LLC 2.70% 20193 | 5,395 | 5,357 |
| WEA Finance LLC 3.25% 20203 | 32,500 | 32,673 |
| WEA Finance LLC 3.75% 20243 | 22,800 | 22,716 |
| Wells Fargo & Co. 1.25% 2016 | 3,000 | 3,005 |
| Wells Fargo & Co. 3.676% 2016 | 19,000 | 19,238 |
| Wells Fargo & Co. 2.55% 2020 | 28,235 | 28,113 |
| Wells Fargo & Co. 2.60% 2020 | 21,000 | 20,969 |
| Wells Fargo & Co. 4.60% 2021 | 25,000 | 27,272 |
| Wells Fargo & Co. 3.55% 2025 | 13,000 | 13,135 |
| Wells Fargo & Co. 4.90% 2045 | 21,700 | 21,954 |
| Westpac Banking Corp. 2.60% 2020 | 30,000 | 30,023 |
| | | 2,637,044 |
| Health care 1.68% | | |
| AbbVie Inc. 1.75% 2017 | 8,000 | 7,988 |
| AbbVie Inc. 2.50% 2020 | 10,400 | 10,308 |
| AbbVie Inc. 3.20% 2022 | 5,685 | 5,607 |
| AbbVie Inc. 3.60% 2025 | 48,940 | 48,402 |
| AbbVie Inc. 4.50% 2035 | 10,360 | 10,176 |
| AbbVie Inc. 4.40% 2042 | 6,820 | 6,393 |
| AbbVie Inc. 4.70% 2045 | 19,000 | 18,654 |
| Actavis Funding SCS 3.00% 2020 | 26,950 | 26,996 |
| Actavis Funding SCS 3.45% 2022 | 32,390 | 32,486 |
| Actavis Funding SCS 3.85% 2024 | 15,000 | 15,059 |
| Actavis Funding SCS 3.80% 2025 | 25,550 | 25,471 |
| Actavis Funding SCS 4.55% 2035 | 18,870 | 18,399 |
| Actavis Funding SCS 4.75% 2045 | 49,500 | 48,443 |
| AmerisourceBergen Corp. 3.25% 2025 | 2,170 | 2,106 |
| AmerisourceBergen Corp. 4.25% 2045 | 2,045 | 1,886 |
| Amgen Inc. 2.70% 2022 | 21,240 | 20,648 |
| AstraZeneca PLC 3.375% 2025 | 86,820 | 86,379 |
| AstraZeneca PLC 4.375% 2045 | 9,945 | 10,008 |
| Baxalta Inc. 2.875% 20203 | 18,020 | 17,822 |
| Baxalta Inc. 4.00% 20253 | 29,020 | 28,790 |
| Bayer AG 2.375% 20193 | 24,345 | 24,380 |
| Baylor Scott & White Holdings 4.185% 2045 | 7,400 | 7,027 |
| Becton, Dickinson and Co. 3.734% 2024 | 6,270 | 6,339 |
| Biogen Inc. 3.625% 2022 | 19,850 | 20,102 |
| Biogen Inc. 4.05% 2025 | 44,116 | 44,431 |
| Biogen Inc. 5.20% 2045 | 16,554 | 16,621 |
| Boston Scientific Corp. 3.375% 2022 | 38,500 | 38,053 |
| Boston Scientific Corp. 3.85% 2025 | 57,300 | 56,499 |
| Catholic Health Initiatives, Series 2012, 1.60% 2017 | 2,000 | 1,997 |
| Celgene Corp 3.55% 2022 | 29,470 | 29,801 |
| Celgene Corp. 3.625% 2024 | 32,655 | 32,191 |
| Celgene Corp. 3.875% 2025 | 53,465 | 53,401 |
| Celgene Corp. 4.625% 2044 | 17,030 | 16,147 |
| Celgene Corp. 5.00% 2045 | 25,640 | 25,837 |
American Balanced Fund — Page 8 of 30
Bonds, notes & other debt instruments
Corporate bonds & notes (continued)
Health care (continued) | Principal amount
(000) | Value
(000) |
| DENTSPLY International Inc. 2.75% 2016 | $9,830 | $9,904 |
| EMD Finance LLC 2.40% 20203 | 24,900 | 24,266 |
| EMD Finance LLC 2.95% 20223 | 12,850 | 12,424 |
| EMD Finance LLC 3.25% 20253 | 50,700 | 48,132 |
| Express Scripts Inc. 3.125% 2016 | 5,000 | 5,034 |
| Gilead Sciences, Inc. 3.05% 2016 | 11,425 | 11,620 |
| Gilead Sciences, Inc. 2.35% 2020 | 10,000 | 10,014 |
| Gilead Sciences, Inc. 3.25% 2022 | 9,040 | 9,114 |
| Gilead Sciences, Inc. 3.70% 2024 | 9,880 | 10,132 |
| Gilead Sciences, Inc. 3.65% 2026 | 6,020 | 6,081 |
| Gilead Sciences, Inc. 4.60% 2035 | 16,660 | 16,963 |
| Humana Inc. 3.15% 2022 | 20,000 | 19,483 |
| Laboratory Corporation of America Holdings 3.20% 2022 | 7,240 | 7,118 |
| Laboratory Corporation of America Holdings 3.60% 2025 | 8,835 | 8,542 |
| McKesson Corp. 3.796% 2024 | 10,000 | 10,070 |
| Medtronic, Inc. 2.50% 2020 | 14,580 | 14,696 |
| Medtronic, Inc. 3.50% 2025 | 39,900 | 40,420 |
| Medtronic, Inc. 4.375% 2035 | 7,715 | 7,810 |
| Medtronic, Inc. 4.625% 2045 | 8,220 | 8,496 |
| Memorial Sloan-Kettering Cancer Center 4.20% 2055 | 1,500 | 1,444 |
| Pfizer Inc. 7.20% 2039 | 485 | 669 |
| Quest Diagnostics Inc. 4.70% 2045 | 1,340 | 1,211 |
| Roche Holdings, Inc. 2.875% 20213 | 22,000 | 22,313 |
| Roche Holdings, Inc. 3.00% 20253 | 19,000 | 18,806 |
| St. Jude Medical, Inc. 2.80% 2020 | 13,870 | 13,890 |
| Thermo Fisher Scientific Inc. 1.30% 2017 | 15,000 | 14,951 |
| Thermo Fisher Scientific Inc. 2.40% 2019 | 13,375 | 13,383 |
| Thermo Fisher Scientific Inc. 3.30% 2022 | 4,550 | 4,548 |
| Thermo Fisher Scientific Inc. 4.15% 2024 | 11,840 | 12,325 |
| Trinity Health Corp 4.125% 2045 | 3,000 | 2,851 |
| UnitedHealth Group Inc. 1.40% 2017 | 10,000 | 9,974 |
| UnitedHealth Group Inc. 6.00% 2017 | 20,170 | 21,462 |
| UnitedHealth Group Inc. 6.00% 2018 | 35,000 | 38,080 |
| UnitedHealth Group Inc. 3.35% 2022 | 15,405 | 15,773 |
| UnitedHealth Group Inc. 3.75% 2025 | 16,475 | 17,020 |
| WellPoint, Inc. 2.25% 2019 | 15,500 | 15,420 |
| Zimmer Holdings, Inc. 2.70% 2020 | 12,915 | 12,770 |
| Zimmer Holdings, Inc. 3.15% 2022 | 37,265 | 36,687 |
| Zimmer Holdings, Inc. 3.55% 2025 | 22,615 | 22,030 |
| Zimmer Holdings, Inc. 4.25% 2035 | 5,270 | 4,929 |
| Zimmer Holdings, Inc. 4.45% 2045 | 25,000 | 23,070 |
| | | 1,418,772 |
| Consumer discretionary 1.31% | | |
| 21st Century Fox America, Inc. 3.70% 20253 | 11,920 | 11,923 |
| Amazon.com, Inc. 3.80% 2024 | 53,575 | 55,865 |
| Amazon.com, Inc. 4.80% 2034 | 20,000 | 21,112 |
| Amazon.com, Inc. 4.95% 2044 | 23,500 | 25,135 |
| American Honda Finance Corp. 2.25% 2019 | 16,500 | 16,551 |
| American Honda Finance Corp. 2.45% 2020 | 16,100 | 16,143 |
| CBS Corp. 3.50% 2025 | 15,000 | 14,337 |
| CBS Corp. 4.60% 2045 | 25,000 | 21,529 |
| CCO Holdings LLC and CCO Holdings Capital Corp. 4.464% 20223 | 26,720 | 26,657 |
| CCO Holdings LLC and CCO Holdings Capital Corp. 4.908% 20253 | 57,500 | 57,530 |
American Balanced Fund — Page 9 of 30
Bonds, notes & other debt instruments
Corporate bonds & notes (continued)
Consumer discretionary (continued) | Principal amount
(000) | Value
(000) |
| CCO Holdings LLC and CCO Holdings Capital Corp. 6.384% 20353 | $17,125 | $17,321 |
| CCO Holdings LLC and CCO Holdings Capital Corp. 6.484% 20453 | 12,525 | 12,562 |
| Comcast Corp. 6.30% 2017 | 16,750 | 18,229 |
| Comcast Corp. 3.375% 2025 | 19,215 | 19,488 |
| Comcast Corp. 6.45% 2037 | 15,000 | 18,703 |
| Comcast Corp. 4.65% 2042 | 2,500 | 2,550 |
| Comcast Corp. 4.60% 2045 | 20,000 | 20,297 |
| DaimlerChrysler North America Holding Corp. 1.375% 20173 | 15,125 | 14,992 |
| DaimlerChrysler North America Holding Corp. 2.40% 20173 | 12,000 | 12,065 |
| DaimlerChrysler North America Holding Corp. 2.25% 20193 | 13,000 | 12,815 |
| DaimlerChrysler North America Holding Corp. 2.25% 20203 | 24,674 | 24,136 |
| DaimlerChrysler North America Holding Corp. 2.875% 20213 | 14,900 | 14,709 |
| DaimlerChrysler North America Holding Corp. 3.25% 20243 | 7,570 | 7,387 |
| DaimlerChrysler North America Holding Corp. 3.30% 20253 | 8,900 | 8,641 |
| DIRECTV Holdings LLC and DIRECTV Financing Co., Inc. 5.15% 2042 | 7,100 | 6,638 |
| Ford Motor Credit Co. 1.70% 2016 | 17,000 | 17,018 |
| Ford Motor Credit Co. 2.50% 2016 | 13,000 | 13,003 |
| Ford Motor Credit Co. 1.50% 2017 | 8,500 | 8,442 |
| Ford Motor Credit Co. 2.145% 2018 | 15,485 | 15,437 |
| Ford Motor Credit Co. 2.375% 2018 | 8,990 | 8,974 |
| Ford Motor Credit Co. 2.551% 2018 | 9,015 | 8,957 |
| Ford Motor Credit Co. 2.597% 2019 | 26,735 | 26,276 |
| Ford Motor Credit Co. 2.459% 2020 | 18,090 | 17,563 |
| Ford Motor Credit Co. 3.157% 2020 | 30,400 | 30,341 |
| Ford Motor Credit Co. 3.20% 2021 | 9,000 | 8,950 |
| Ford Motor Credit Co. 3.219% 2022 | 16,000 | 15,687 |
| Ford Motor Credit Co. 4.375% 2023 | 15,475 | 15,932 |
| Ford Motor Credit Co. 3.664% 2024 | 10,000 | 9,750 |
| Ford Motor Credit Co. 4.134% 2025 | 28,300 | 28,269 |
| General Motors Co. 4.00% 2025 | 6,075 | 5,777 |
| General Motors Financial Co. 3.10% 2019 | 18,400 | 18,390 |
| General Motors Financial Co. 3.50% 2019 | 4,685 | 4,706 |
| General Motors Financial Co. 3.70% 2020 | 42,325 | 42,504 |
| General Motors Financial Co. 4.375% 2021 | 5,500 | 5,587 |
| General Motors Financial Co. 3.45% 2022 | 52,100 | 50,076 |
| General Motors Financial Co. 4.25% 2023 | 1,500 | 1,486 |
| General Motors Financial Co. 4.30% 2025 | 8,175 | 7,948 |
| Home Depot, Inc. 4.40% 2021 | 15,000 | 16,532 |
| Home Depot, Inc. 3.35% 2025 | 3,350 | 3,429 |
| Home Depot, Inc. 5.95% 2041 | 7,500 | 9,351 |
| Johnson Controls, Inc. 1.40% 2017 | 10,000 | 9,901 |
| McDonald’s Corp. 2.75% 2020 | 12,720 | 12,728 |
| McDonald’s Corp. 3.70% 2026 | 17,905 | 17,932 |
| NBC Universal Enterprise, Inc. 5.25% (undated)3 | 475 | 505 |
| NBCUniversal Media, LLC 2.875% 2016 | 12,000 | 12,059 |
| Nordstrom, Inc. 4.00% 2021 | 6,245 | 6,610 |
| Thomson Reuters Corp. 1.65% 2017 | 4,965 | 4,942 |
| Thomson Reuters Corp. 6.50% 2018 | 20,815 | 22,995 |
| Thomson Reuters Corp. 4.30% 2023 | 4,500 | 4,606 |
| Thomson Reuters Corp. 5.65% 2043 | 2,000 | 2,098 |
| Time Warner Cable Inc. 6.75% 2018 | 20,000 | 21,838 |
| Time Warner Inc. 3.60% 2025 | 66,100 | 64,504 |
| Time Warner Inc. 3.875% 2026 | 25,000 | 24,846 |
American Balanced Fund — Page 10 of 30
Bonds, notes & other debt instruments
Corporate bonds & notes (continued)
Consumer discretionary (continued) | Principal amount
(000) | Value
(000) |
| Toyota Motor Credit Corp. 2.15% 2020 | $18,500 | $18,514 |
| Volkswagen International Finance NV 2.375% 20173 | 16,000 | 15,948 |
| | | 1,107,726 |
| Energy 1.30% | | |
| Anadarko Petroleum Corp. 5.95% 2016 | 14,500 | 14,902 |
| Anadarko Petroleum Corp. 6.45% 2036 | 685 | 662 |
| APT Pipelines Ltd. 4.20% 20253 | 27,300 | 25,701 |
| BG Energy Capital PLC 2.875% 20163 | 8,325 | 8,416 |
| Canadian Natural Resources Ltd. 5.70% 2017 | 11,925 | 12,183 |
| Canadian Natural Resources Ltd. 3.80% 2024 | 1,720 | 1,522 |
| Cenovus Energy Inc. 3.00% 2022 | 2,000 | 1,777 |
| Cenovus Energy Inc. 3.80% 2023 | 20,710 | 18,791 |
| Chevron Corp. 2.419% 2020 | 23,000 | 22,901 |
| Chevron Corp. 3.326% 2025 | 13,700 | 13,816 |
| Devon Energy Corp. 2.25% 2018 | 12,060 | 11,017 |
| Devon Energy Corp. 5.00% 2045 | 25,840 | 19,648 |
| Diamond Offshore Drilling, Inc. 4.875% 2043 | 36,530 | 22,313 |
| Ecopetrol SA 5.375% 2026 | 13,385 | 11,427 |
| Enbridge Energy Partners, LP 9.875% 2019 | 11,250 | 12,823 |
| Enbridge Energy Partners, LP 4.375% 2020 | 15,730 | 15,367 |
| Enbridge Energy Partners, LP 4.20% 2021 | 300 | 287 |
| Enbridge Energy Partners, LP 5.875% 2025 | 48,445 | 46,780 |
| Enbridge Energy Partners, LP 5.50% 2040 | 15,000 | 11,500 |
| Enbridge Energy Partners, LP 7.375% 2045 | 19,575 | 18,808 |
| Enbridge Energy Partners, LP, Series B, 6.50% 2018 | 17,370 | 18,210 |
| Enbridge Energy Partners, LP, Series B, 7.50% 2038 | 12,250 | 11,729 |
| Enbridge Inc. 5.60% 2017 | 10,000 | 10,289 |
| Enbridge Inc. 4.00% 2023 | 45,000 | 39,878 |
| Energy Transfer Partners, LP 4.15% 2020 | 11,500 | 10,624 |
| Energy Transfer Partners, LP 4.75% 2026 | 20,600 | 17,765 |
| Energy Transfer Partners, LP 6.125% 2045 | 14,990 | 12,233 |
| EnLink Midstream Partners, LP 4.40% 2024 | 16,245 | 12,890 |
| EnLink Midstream Partners, LP 4.15% 2025 | 37,740 | 29,102 |
| EnLink Midstream Partners, LP 5.05% 2045 | 9,405 | 5,848 |
| Ensco PLC 5.20% 2025 | 8,370 | 5,969 |
| Enterprise Products Operating LLC 5.20% 2020 | 6,355 | 6,675 |
| Enterprise Products Operating LLC 3.90% 2024 | 16,545 | 15,469 |
| Enterprise Products Operating LLC 3.70% 2026 | 3,140 | 2,825 |
| Enterprise Products Operating LLC 4.90% 2046 | 11,905 | 9,761 |
| Exxon Mobil Corp. 1.912% 2020 | 18,000 | 17,867 |
| Halliburton Co. 3.375% 2022 | 12,525 | 12,339 |
| Halliburton Co. 3.80% 2025 | 34,090 | 33,256 |
| Halliburton Co. 5.00% 2045 | 26,970 | 26,703 |
| Kinder Morgan Energy Partners, LP 6.00% 2017 | 18,000 | 18,216 |
| Kinder Morgan Energy Partners, LP 2.65% 2019 | 20,000 | 18,505 |
| Kinder Morgan Energy Partners, LP 9.00% 2019 | 4,395 | 4,731 |
| Kinder Morgan Energy Partners, LP 3.50% 2021 | 3,980 | 3,568 |
| Kinder Morgan Energy Partners, LP 4.15% 2022 | 12,855 | 11,442 |
| Kinder Morgan Energy Partners, LP 4.25% 2024 | 10,545 | 8,993 |
| Kinder Morgan Energy Partners, LP 5.40% 2044 | 13,135 | 9,957 |
| Kinder Morgan Energy Partners, LP 5.50% 2044 | 4,571 | 3,576 |
| Kinder Morgan, Inc. 3.05% 2019 | 17,150 | 15,893 |
| Kinder Morgan, Inc. 4.30% 2025 | 19,285 | 16,702 |
American Balanced Fund — Page 11 of 30
Bonds, notes & other debt instruments
Corporate bonds & notes (continued)
Energy (continued) | Principal amount
(000) | Value
(000) |
| Kinder Morgan, Inc. 5.30% 2034 | $8,205 | $6,480 |
| Kinder Morgan, Inc. 5.55% 2045 | 10,500 | 8,225 |
| Noble Corp PLC 5.95% 2025 | 8,745 | 6,045 |
| Petróleos Mexicanos 3.50% 2023 | 22,000 | 19,250 |
| Petróleos Mexicanos 5.50% 2044 | 6,800 | 5,150 |
| Petróleos Mexicanos 5.625% 20463 | 25,290 | 19,447 |
| Phillips 66 Partners LP 3.605% 2025 | 5,380 | 4,733 |
| Pioneer Natural Resources Co. 3.45% 2021 | 11,530 | 10,663 |
| Pioneer Natural Resources Co. 4.45% 2026 | 6,370 | 5,748 |
| Schlumberger BV 3.00% 20203 | 14,535 | 14,366 |
| Schlumberger BV 3.625% 20223 | 40,865 | 40,448 |
| Schlumberger BV 4.00% 20253 | 29,240 | 28,928 |
| Shell International Finance BV 2.25% 2020 | 57,450 | 56,653 |
| Southwestern Energy Co. 4.95% 2025 | 12,055 | 7,610 |
| Spectra Energy Partners, LP 4.75% 2024 | 7,030 | 6,824 |
| Statoil ASA 3.125% 2017 | 16,500 | 16,931 |
| Statoil ASA 2.75% 2021 | 5,395 | 5,370 |
| Statoil ASA 3.25% 2024 | 1,690 | 1,662 |
| Statoil ASA 4.25% 2041 | 6,000 | 5,677 |
| StatoilHydro ASA 1.80% 2016 | 16,000 | 16,099 |
| TC PipeLines, LP 4.375% 2025 | 20,235 | 17,806 |
| TransCanada PipeLines Ltd. 5.00% 2043 | 22,000 | 20,308 |
| TransCanada PipeLines Ltd., junior subordinated 5.625% 2075 | 6,410 | 5,951 |
| Transocean Inc. 7.13% 2021 | 7,050 | 4,574 |
| Western Gas Partners LP 3.95% 2025 | 3,730 | 3,139 |
| Williams Partners LP 4.50% 2023 | 12,400 | 10,060 |
| Williams Partners LP 4.30% 2024 | 16,170 | 12,841 |
| Williams Partners LP 3.90% 2025 | 12,000 | 9,038 |
| Williams Partners LP 4.00% 2025 | 4,800 | 3,601 |
| Williams Partners LP 5.40% 2044 | 1,915 | 1,287 |
| Williams Partners LP 5.10% 2045 | 13,795 | 9,104 |
| Woodside Petroleum Ltd. 3.65% 20253 | 12,400 | 11,012 |
| | | 1,096,686 |
| Consumer staples 0.93% | | |
| Altria Group, Inc. 9.25% 2019 | 5,067 | 6,209 |
| Altria Group, Inc. 2.625% 2020 | 14,760 | 14,801 |
| Altria Group, Inc. 2.95% 2023 | 12,000 | 11,698 |
| Altria Group, Inc. 4.00% 2024 | 7,400 | 7,680 |
| Altria Group, Inc. 9.95% 2038 | 13,500 | 21,705 |
| Altria Group, Inc. 4.50% 2043 | 13,700 | 13,044 |
| Altria Group, Inc. 5.375% 2044 | 16,245 | 17,536 |
| Anheuser-Busch InBev NV 7.75% 2019 | 20,000 | 23,132 |
| British American Tobacco International Finance PLC 2.125% 20173 | 16,000 | 16,106 |
| British American Tobacco International Finance PLC 9.50% 20183 | 11,955 | 14,280 |
| British American Tobacco International Finance PLC 3.50% 20223 | 17,905 | 18,392 |
| British American Tobacco International Finance PLC 3.95% 20253 | 16,500 | 17,019 |
| Coca-Cola Co. 1.80% 2016 | 17,500 | 17,611 |
| CVS Caremark Corp. 2.25% 2019 | 10,960 | 10,959 |
| CVS Caremark Corp. 3.875% 2025 | 8,815 | 9,015 |
| CVS Caremark Corp. 5.125% 2045 | 13,300 | 14,065 |
| General Mills, Inc. 2.20% 2019 | 9,235 | 9,246 |
| Imperial Tobacco Finance PLC 2.05% 20183 | 16,000 | 15,937 |
| Imperial Tobacco Finance PLC 3.50% 20233 | 17,000 | 16,685 |
American Balanced Fund — Page 12 of 30
Bonds, notes & other debt instruments
Corporate bonds & notes (continued)
Consumer staples (continued) | Principal amount
(000) | Value
(000) |
| Kraft Foods Inc. 2.25% 2017 | $4,725 | $4,761 |
| Kraft Foods Inc. 3.50% 2022 | 23,285 | 23,581 |
| Kroger Co. 5.00% 2042 | 2,500 | 2,567 |
| Kroger Co. 5.15% 2043 | 6,800 | 7,150 |
| Mead Johnson Nutrition Co. 3.00% 2020 | 6,525 | 6,533 |
| Mead Johnson Nutrition Co. 4.125% 2025 | 5,415 | 5,469 |
| PepsiCo, Inc. 7.90% 2018 | 15,000 | 17,585 |
| Pernod Ricard SA 2.95% 20173 | 35,500 | 35,952 |
| Pernod Ricard SA 4.45% 20223 | 9,600 | 9,969 |
| Philip Morris International Inc. 3.25% 2024 | 24,300 | 24,477 |
| Philip Morris International Inc. 3.375% 2025 | 34,830 | 35,295 |
| Philip Morris International Inc. 4.25% 2044 | 6,000 | 5,810 |
| Reynolds American Inc. 2.30% 2018 | 5,900 | 5,941 |
| Reynolds American Inc. 3.25% 2022 | 11,420 | 11,315 |
| Reynolds American Inc. 4.00% 2022 | 6,695 | 6,974 |
| Reynolds American Inc. 4.85% 2023 | 12,000 | 12,854 |
| Reynolds American Inc. 4.45% 2025 | 34,365 | 36,028 |
| Reynolds American Inc. 5.70% 2035 | 1,555 | 1,709 |
| Reynolds American Inc. 6.15% 2043 | 1,975 | 2,246 |
| Reynolds American Inc. 5.85% 2045 | 63,065 | 70,323 |
| SABMiller Holdings Inc. 2.45% 20173 | 20,245 | 20,404 |
| SABMiller Holdings Inc. 2.20% 20183 | 18,700 | 18,667 |
| The JM Smucker Co. 2.50% 2020 | 3,315 | 3,295 |
| The JM Smucker Co. 3.00% 2022 | 4,985 | 4,967 |
| The JM Smucker Co. 3.50% 2025 | 21,040 | 20,985 |
| The JM Smucker Co. 4.375% 2045 | 12,885 | 12,587 |
| Tyson Foods, Inc. 3.95% 2024 | 10,420 | 10,718 |
| Walgreens Boots Alliance, Inc. 3.30% 2021 | 20,000 | 19,649 |
| Walgreens Boots Alliance, Inc. 3.80% 2024 | 21,335 | 20,753 |
| Wal-Mart Stores, Inc. 2.80% 2016 | 19,000 | 19,105 |
| Wal-Mart Stores, Inc. 3.30% 2024 | 12,295 | 12,710 |
| WM. Wrigley Jr. Co 3.375% 20203 | 22,500 | 22,973 |
| | | 788,472 |
| Utilities 0.91% | | |
| Alabama Power Co. 2.80% 2025 | 3,555 | 3,436 |
| Ameren Corp. 3.65% 2026 | 5,965 | 5,956 |
| American Electric Power Co. 2.95% 2022 | 16,090 | 15,927 |
| Berkshire Hathaway Energy Co. 2.40% 2020 | 13,643 | 13,529 |
| Berkshire Hathaway Energy Co. 3.50% 2025 | 5,615 | 5,579 |
| CenterPoint Energy Resources Corp. 4.50% 2021 | 8,751 | 9,199 |
| CMS Energy Corp. 8.75% 2019 | 6,647 | 7,955 |
| CMS Energy Corp. 5.05% 2022 | 9,215 | 10,041 |
| CMS Energy Corp. 3.875% 2024 | 14,310 | 14,558 |
| CMS Energy Corp. 3.60% 2025 | 1,595 | 1,589 |
| Comision Federal de Electricidad 6.125% 20453 | 3,000 | 2,753 |
| Commonwealth Edison Company 4.35% 2045 | 8,345 | 8,414 |
| Consumers Energy Co. 3.375% 2023 | 1,435 | 1,469 |
| Consumers Energy Co., First Mortgage Bonds, 3.125% 2024 | 10,520 | 10,513 |
| Dominion Gas Holdings LLC 2.50% 2019 | 17,885 | 17,878 |
| Dominion Gas Holdings LLC 2.80% 2020 | 11,725 | 11,772 |
| Dominion Gas Holdings LLC 3.60% 2024 | 13,178 | 13,067 |
| Duke Energy Corp. 3.95% 2023 | 7,000 | 7,221 |
| Duke Energy Corp. 3.75% 2024 | 69,025 | 70,108 |
American Balanced Fund — Page 13 of 30
Bonds, notes & other debt instruments
Corporate bonds & notes (continued)
Utilities (continued) | Principal amount
(000) | Value
(000) |
| Duke Energy Progress Inc. 4.15% 2044 | $26,190 | $25,642 |
| E.ON International Finance BV 5.80% 20183 | 24,450 | 26,345 |
| Electricité de France SA 2.35% 20203 | 21,000 | 20,700 |
| Electricité de France SA 3.625% 20253 | 36,545 | 35,817 |
| Electricité de France SA 6.95% 20393 | 9,000 | 11,091 |
| Entergy Corp. 4.70% 2017 | 9,600 | 9,846 |
| Exelon Corp. 2.85% 2020 | 15,000 | 14,938 |
| MidAmerican Energy Co. 2.40% 2019 | 5,500 | 5,546 |
| MidAmerican Energy Holdings Co. 5.75% 2018 | 15,300 | 16,539 |
| MidAmerican Energy Holdings Co. 3.75% 2023 | 20,000 | 20,560 |
| National Rural Utilities Cooperative Finance Corp. 10.375% 2018 | 8,450 | 10,314 |
| National Rural Utilities Cooperative Finance Corp. 2.15% 2019 | 18,000 | 18,054 |
| National Rural Utilities Cooperative Finance Corp. 2.00% 2020 | 14,460 | 14,224 |
| National Rural Utilities Cooperative Finance Corp. 2.30% 2020 | 13,600 | 13,484 |
| National Rural Utilities Cooperative Finance Corp. 3.25% 2025 | 18,270 | 18,219 |
| Niagara Mohawk Power Corp. 3.508% 20243 | 6,375 | 6,409 |
| Northeast Utilities 1.60% 2018 | 10,000 | 9,900 |
| Northeast Utilities 3.15% 2025 | 8,845 | 8,655 |
| Northern States Power Co. 4.125% 2044 | 18,000 | 17,900 |
| NV Energy, Inc 6.25% 2020 | 10,168 | 11,564 |
| Ohio Power Co., Series G, 6.60% 2033 | 165 | 200 |
| Pacific Gas and Electric Co. 3.25% 2023 | 6,742 | 6,771 |
| Pacific Gas and Electric Co. 3.85% 2023 | 21,430 | 22,307 |
| Pacific Gas and Electric Co. 3.40% 2024 | 3,369 | 3,389 |
| Pacific Gas and Electric Co. 3.75% 2024 | 20,000 | 20,645 |
| Pacific Gas and Electric Co. 4.75% 2044 | 4,930 | 5,143 |
| Pacific Gas and Electric Co. 4.30% 2045 | 3,170 | 3,142 |
| PacifiCorp., First Mortgage Bonds, 5.65% 2018 | 2,465 | 2,688 |
| PacifiCorp., First Mortgage Bonds, 3.60% 2024 | 18,405 | 19,041 |
| PacifiCorp. 3.35% 2025 | 7,800 | 7,877 |
| PG&E Corp. 2.40% 2019 | 9,380 | 9,369 |
| Public Service Electric and Gas Co., 2.375% 2023 | 2,075 | 1,990 |
| Public Service Electric and Gas Co., 3.05% 2024 | 13,425 | 13,397 |
| Puget Energy Inc. 3.65% 2025 | 9,400 | 9,130 |
| Puget Sound Energy, Inc., First Lien, 6.50% 2020 | 5,750 | 6,595 |
| Puget Sound Energy, Inc., First Lien, 6.00% 2021 | 8,400 | 9,477 |
| Puget Sound Energy, Inc., First Lien, 5.625% 2022 | 14,950 | 16,616 |
| Sierra Pacific Power Co., General and Refunding Mortgage Notes, Series T, 3.375% 2023 | 14,000 | 14,181 |
| Southern California Edison Co. 1.845% 20227 | 14,323 | 14,197 |
| Tampa Electric Co. 4.35% 2044 | 11,410 | 11,223 |
| Teco Finance, Inc. 5.15% 2020 | 5,627 | 6,049 |
| Tri-State Generation and Transmission Assn. Inc., Pass Through Trust, Series 2003-A, 6.04% 20183,7 | 1,360 | 1,415 |
| Virginia Electric and Power Co. 3.10% 2025 | 7,230 | 7,173 |
| Virginia Electric and Power Co., Series B, 5.95% 2017 | 8,000 | 8,601 |
| Xcel Energy Inc. 4.70% 2020 | 4,845 | 5,213 |
| Xcel Energy Inc. 3.30% 2025 | 455 | 446 |
| | | 772,986 |
| Information technology 0.52% | | |
| Harris Corp. 3.832% 2025 | 2,615 | 2,581 |
| Harris Corp. 4.854% 2035 | 17,195 | 16,971 |
| Hewlett-Packard Co. 4.40% 20223 | 28,000 | 27,936 |
| Intel Corp. 3.70% 2025 | 33,500 | 34,697 |
| Intel Corp. 4.90% 2045 | 14,540 | 15,407 |
American Balanced Fund — Page 14 of 30
Bonds, notes & other debt instruments
Corporate bonds & notes (continued)
Information technology (continued) | Principal amount
(000) | Value
(000) |
| International Business Machines Corp. 1.95% 2016 | $35,000 | $35,213 |
| KLA-Tencor Corp. 4.65% 2024 | 10,000 | 10,084 |
| Microsoft Corp. 2.65% 2022 | 18,000 | 18,001 |
| Microsoft Corp. 3.125% 2025 | 28,300 | 28,500 |
| Microsoft Corp. 4.20% 2035 | 18,000 | 18,404 |
| Microsoft Corp. 4.45% 2045 | 11,485 | 11,874 |
| Oracle Corp. 2.375% 2019 | 17,500 | 17,782 |
| Oracle Corp. 2.80% 2021 | 6,100 | 6,184 |
| Oracle Corp. 2.50% 2022 | 18,500 | 18,185 |
| Oracle Corp. 2.95% 2025 | 19,800 | 19,355 |
| QUALCOMM Inc. 3.45% 2025 | 16,400 | 15,751 |
| Visa Inc. 2.80% 2022 | 23,000 | 23,063 |
| Visa Inc. 3.15% 2025 | 49,000 | 49,165 |
| Visa Inc. 4.15% 2035 | 29,500 | 29,840 |
| Visa Inc. 4.30% 2045 | 35,605 | 36,179 |
| Xerox Corp. 2.75% 2019 | 5,000 | 4,915 |
| | | 440,087 |
| Telecommunication services 0.47% | | |
| AT&T Inc. 2.40% 2016 | 18,000 | 18,122 |
| AT&T Inc. 3.00% 2022 | 30,000 | 29,226 |
| AT&T Inc. 3.40% 2025 | 46,529 | 44,813 |
| AT&T Inc. 4.50% 2035 | 21,760 | 20,190 |
| AT&T Inc. 4.80% 2044 | 6,800 | 6,253 |
| AT&T Inc. 4.35% 2045 | 5,000 | 4,314 |
| British Telecommunications PLC 2.35% 2019 | 13,285 | 13,331 |
| Deutsche Telekom International Finance BV 9.25% 2032 | 9,719 | 14,288 |
| France Télécom 4.125% 2021 | 20,000 | 21,201 |
| France Télécom 9.00% 2031 | 1,625 | 2,299 |
| Orange SA 2.75% 2019 | 14,870 | 15,093 |
| Orange SA 5.50% 2044 | 14,000 | 14,896 |
| Telefónica Emisiones, SAU 3.992% 2016 | 18,000 | 18,050 |
| Telefónica Emisiones, SAU 3.192% 2018 | 15,000 | 15,301 |
| Verizon Communications Inc. 3.00% 2021 | 5,674 | 5,667 |
| Verizon Communications Inc. 5.15% 2023 | 3,326 | 3,663 |
| Verizon Communications Inc. 4.272% 2036 | 74,149 | 67,144 |
| Verizon Communications Inc. 6.25% 2037 | 20,000 | 22,520 |
| Verizon Communications Inc. 4.522% 2048 | 70,385 | 63,193 |
| | | 399,564 |
| Industrials 0.44% | | |
| American Airlines, Inc., Series 2013-2, Class A, 4.95% 20247 | 10,125 | 10,764 |
| Atlas Copco AB 5.60% 20173 | 15,905 | 16,656 |
| Canadian National Railway Co. 1.45% 2016 | 8,900 | 8,919 |
| Continental Airlines, Inc., Series 1998-1, Class A, 6.648% 20197 | 2,259 | 2,316 |
| Continental Airlines, Inc., Series 1997-4, Class A, 6.90% 20197 | 1,689 | 1,725 |
| Continental Airlines, Inc., Series 1999-1, Class A, 6.545% 20207 | 5,174 | 5,507 |
| Continental Airlines, Inc., Series 2001-1, Class A-1, 6.703% 20227 | 3,406 | 3,530 |
| Danaher Corp. 2.30% 2016 | 16,795 | 16,890 |
| ERAC USA Finance Co. 2.80% 20183 | 9,900 | 9,973 |
| FedEx Corp. 4.75% 2045 | 65,685 | 65,292 |
| General Electric Capital Corp. 0.964% 20163 | 26,908 | 26,921 |
| General Electric Capital Corp. 2.95% 2016 | 5,305 | 5,340 |
| General Electric Capital Corp. 2.342% 20203 | 18,286 | 18,164 |
American Balanced Fund — Page 15 of 30
Bonds, notes & other debt instruments
Corporate bonds & notes (continued)
Industrials (continued) | Principal amount
(000) | Value
(000) |
| General Electric Capital Corp., Series A, 6.00% 2019 | $2,577 | $2,921 |
| General Electric Co. 5.25% 2017 | 11,000 | 11,749 |
| General Electric Co. 2.70% 2022 | 11,000 | 10,971 |
| General Electric Co. 4.125% 2042 | 11,000 | 10,770 |
| Lockheed Martin Corp. 3.10% 2023 | 4,710 | 4,715 |
| Lockheed Martin Corp. 3.55% 2026 | 48,050 | 48,396 |
| Lockheed Martin Corp. 4.70% 2046 | 18,490 | 19,104 |
| Southwest Airlines Co. 2.75% 2019 | 6,255 | 6,312 |
| Union Pacific Corp. 5.70% 2018 | 11,150 | 12,274 |
| United Technologies Corp. 3.10% 2022 | 30,000 | 30,573 |
| Waste Management, Inc. 2.60% 2016 | 8,890 | 8,953 |
| Waste Management, Inc. 2.90% 2022 | 15,000 | 14,750 |
| | | 373,485 |
| Materials 0.29% | | |
| Agrium Inc. 4.125% 2035 | 7,820 | 6,673 |
| BHP Billiton Finance Ltd. 6.25% 20753 | 3,175 | 3,116 |
| BHP Billiton Finance Ltd. 6.75% 20753 | 26,325 | 25,469 |
| Chevron Phillips Chemical Company LLC 2.45% 20203 | 16,880 | 16,685 |
| CRH America, Inc. 3.875% 20253 | 7,700 | 7,666 |
| Eastman Chemical Co. 2.70% 2020 | 21,000 | 20,821 |
| Eastman Chemical Co. 3.80% 2025 | 9,800 | 9,515 |
| Ecolab Inc. 3.00% 2016 | 9,410 | 9,548 |
| Ecolab Inc. 4.35% 2021 | 1,000 | 1,069 |
| Ecolab Inc. 5.50% 2041 | 1,500 | 1,639 |
| Georgia-Pacific Corp. 2.539% 20193 | 21,000 | 20,905 |
| Glencore Funding LLC 2.875% 20203 | 9,800 | 7,651 |
| Holcim Ltd. 5.15% 20233 | 12,500 | 13,400 |
| International Paper Co. 3.65% 2024 | 8,500 | 8,335 |
| International Paper Co. 7.30% 2039 | 8,425 | 9,626 |
| Monsanto Co. 3.375% 2024 | 10,000 | 9,559 |
| Monsanto Co. 4.40% 2044 | 13,090 | 10,882 |
| Mosaic Co. 5.625% 2043 | 4,000 | 3,847 |
| Packaging Corp. of America 4.50% 2023 | 610 | 642 |
| Praxair, Inc. 1.05% 2017 | 16,000 | 15,863 |
| Praxair, Inc. 2.25% 2020 | 13,990 | 13,957 |
| Rio Tinto Finance (USA) Ltd. 1.625% 2017 | 16,000 | 15,777 |
| Rohm and Haas Co. 6.00% 2017 | 5,003 | 5,327 |
| Xstrata Canada Financial Corp. 2.70% 20173 | 8,200 | 7,506 |
| | | 245,478 |
| Total corporate bonds & notes | | 9,280,300 |
| Mortgage-backed obligations 7.60% | | |
| Australia & New Zealand Banking Group Ltd. 2.40% 20163,7 | 750 | 758 |
| Aventura Mall Trust, Series A, 3.867% 20323,6,7 | 20,700 | 21,632 |
| Banc of America Commercial Mortgage Inc., Series 2006-3, Class A-4, 5.889% 20446,7 | 6,239 | 6,274 |
| Banc of America Commercial Mortgage Inc., Series 2006-4, Class A-4, 5.634% 20467 | 1,604 | 1,617 |
| Banc of America Commercial Mortgage Inc., Series 2007-3, Class A-4, 5.558% 20496,7 | 11,552 | 11,883 |
| Banc of America Commercial Mortgage Inc., Series 2007-2, Class A-M, 5.629% 20496,7 | 4,100 | 4,236 |
| Banc of America Commercial Mortgage Inc., Series 2007-4, Class A-M, 6.002% 20516,7 | 1,250 | 1,308 |
| Banc of America Commercial Mortgage Inc., Series 2008-1, Class A-4, 6.424% 20516,7 | 23,702 | 25,124 |
| Bank of America Merrill Lynch Large Loan Inc., Series 2015-200P, Class A, 3.218% 20333,7 | 11,150 | 11,077 |
| Bank of Montreal 2.625% 20173,7 | 650 | 651 |
American Balanced Fund — Page 16 of 30
Bonds, notes & other debt instruments
Mortgage-backed obligations (continued) | Principal amount
(000) | Value
(000) |
| Bank of Montreal 1.95% 20173,7 | $250 | $252 |
| Bank of Nova Scotia 2.15% 20163,7 | 350 | 352 |
| Bank of Nova Scotia 1.75% 20173,7 | 65,625 | 66,026 |
| Bank of Nova Scotia 1.95% 20173,7 | 200 | 202 |
| Bank of Nova Scotia 2.125% 20197 | 16,225 | 16,224 |
| Barclays Bank PLC 2.25% 20173,7 | 2,850 | 2,884 |
| Bear Stearns Commercial Mortgage Securities Inc., Series 2005-PW10, Class AM, 5.449% 20406,7 | 1,366 | 1,365 |
| Bear Stearns Commercial Mortgage Securities Trust, Series 2006-T22, Class A1A, 5.62% 20386,7 | 4,764 | 4,778 |
| Bear Stearns Commercial Mortgage Securities Trust, Series 2007-PW17, Class A-1-A, 5.65% 20506,7 | 1,766 | 1,856 |
| Bear Stearns Commercial Mortgage Securities Trust, Series 2007-PW17, Class A-4, 5.694% 20506,7 | 9,377 | 9,787 |
| Bear Stearns Commercial Mortgage Securities Trust, Series 2007-PW18, Class A-M, 6.084% 20506,7 | 6,425 | 6,838 |
| Bellemeade Re Ltd., Series 2015-1-A, Class M-1, 2.922% 20252,3,6,7 | 30,753 | 30,741 |
| Caisse Centrale Desjardins 1.60% 20173,7 | 600 | 602 |
| Canadian Imperial Bank of Commerce 2.75% 20163,7 | 400 | 400 |
| CHL Mortgage Pass-Through Trust, Series 2003-56, Class 6-A-1, 2.814% 20336,7 | 2,243 | 2,262 |
| Citigroup Commercial Mortgage Trust, Series 2015-GC-29, Class AAB, 2.984% 20487 | 5,010 | 4,974 |
| Citigroup Commercial Mortgage Trust, Series 2015-GC31, Class A-4, 3.762% 20487 | 6,100 | 6,254 |
| Citigroup Commercial Mortgage Trust, Series 2006-C5, Class A-4, 5.431% 20497 | 6,289 | 6,376 |
| Citigroup Commercial Mortgage Trust, Series 2015-GC-33, Class A-4, 3.778% 20587 | 10,000 | 10,251 |
| Citigroup-Deutsche Bank Commercial Mortgage Trust, Series 2006-CD3, Class A-5, 5.617% 20487 | 16,506 | 16,733 |
| COMM Mortgage Trust Series 2014-277P, Class A, 3.611% 20493,6,7 | 31,500 | 32,139 |
| Commercial Mortgage Trust, Series 2015-3BP, Class A, 3.178% 20353,7 | 9,700 | 9,548 |
| Commercial Mortgage Trust, Series 2006-C8, Class A1A, 5.292% 20467 | 17,603 | 18,014 |
| Commercial Mortgage Trust, Series 2015-CR-27, Class ASB, 3.404% 20487 | 4,920 | 4,967 |
| Commercial Mortgage Trust, Series 2015-CCRE-26, Class C, 4.496% 20486,7 | 5,040 | 4,684 |
| Commercial Mortgage Trust, Series 2007-C9, Class A-1-A, 5.989% 20496,7 | 880 | 917 |
| Commercial Mortgage Trust, Series 2015-PC1, Class A-5, 3.902% 20507 | 15,265 | 15,789 |
| Commercial Mortgage Trust, Series 2015-LC-23, Class ASB, 3.598% 20537 | 19,241 | 19,729 |
| Commonwealth Bank of Australia 0.75% 20163,7 | 13,750 | 13,751 |
| Commonwealth Bank of Australia 2.25% 20173,7 | 675 | 682 |
| Commonwealth Bank of Australia 1.875% 20183,7 | 5,700 | 5,691 |
| Commonwealth Bank of Australia 2.00% 20193,7 | 23,500 | 23,446 |
| Connecticut Avenue Securities, Series 2013-C01, Class M-1, 2.422% 20233,6,7 | 584 | 589 |
| Connecticut Avenue Securities, Series 2014-C01, Class M-1, 2.022% 20243,6,7 | 1,319 | 1,321 |
| Connecticut Avenue Securities, Series 2015-C01, Class 1-M-1, 1.922% 20256,7 | 2,380 | 2,382 |
| Core Industrial Trust, Series 2015-CALW, Class A, 3.04% 20343,7 | 47,140 | 46,942 |
| Credit Mutuel-CIC Home Loan SFH 1.50% 20173,7 | 800 | 798 |
| Credit Suisse Group AG 2.60% 20163,7 | 700 | 704 |
| CS First Boston Mortgage Securities Corp., Series 2014-ICE, Class A, 1.131% 20273,6,7 | 5,215 | 5,182 |
| CS First Boston Mortgage Securities Corp., Series 2002-34, Class I-A-1, 7.50% 20327 | 618 | 662 |
| CS First Boston Mortgage Securities Corp., Series 2002-30, Class I-A-1, 7.50% 20327 | 420 | 455 |
| CS First Boston Mortgage Securities Corp., Series 2003-21, Class V-A-1, 6.50% 20337 | 579 | 620 |
| CS First Boston Mortgage Securities Corp., Series 2003-29, Class V-A-1, 7.00% 20337 | 991 | 1,053 |
| CS First Boston Mortgage Securities Corp., Series 2004-5, Class IV-A-1, 6.00% 20347 | 2,974 | 3,061 |
| CS First Boston Mortgage Securities Corp., Series 2006-C4, Class A1A, 5.46% 20397 | 8,539 | 8,702 |
| CS First Boston Mortgage Securities Corp., Series 2007-C3, Class A-1-A-1, 5.699% 20396,7 | 14,627 | 15,177 |
| CS First Boston Mortgage Securities Corp., Series 2007-C5, Class A4, 5.695% 20406,7 | 17,641 | 18,244 |
| CSAIL Commercial Mortgage Trust, Series 2015-C-4, Class ASB, 3.6167% 20487 | 12,800 | 13,152 |
| DBUBS Mortgage Trust, Series 2011-LC2A, Class A-2, 3.386% 20443,7 | 13,904 | 13,955 |
| DBUBS Mortgage Trust, Series 2011-LC1A, Class A1, 3.742% 20463,7 | 3,353 | 3,363 |
| DBUBS Mortgage Trust, Series 2011-LC1A, Class A3, 5.002% 20463,7 | 9,500 | 10,494 |
| DNB ASA 1.45% 20193,7 | 925 | 919 |
EQTY 2014-INNS Mortgage Trust Commercial Mortgage Pass-Through Certificates,
Series 2014-A, 1.045% 20313,6,7 | 9,329 | 9,217 |
| Fannie Mae 11.00% 20187 | 13 | 14 |
American Balanced Fund — Page 17 of 30
Bonds, notes & other debt instruments
Mortgage-backed obligations (continued) | Principal amount
(000) | Value
(000) |
| Fannie Mae 4.50% 20257 | $4,760 | $5,144 |
| Fannie Mae 4.50% 20257 | 4,049 | 4,321 |
| Fannie Mae 2.50% 20277 | 29,272 | 29,748 |
| Fannie Mae 2.50% 20277 | 28,090 | 28,547 |
| Fannie Mae 2.50% 20277 | 2,029 | 2,056 |
| Fannie Mae 2.50% 20277 | 1,851 | 1,881 |
| Fannie Mae 2.50% 20277 | 1,413 | 1,426 |
| Fannie Mae 2.50% 20277 | 1,004 | 1,020 |
| Fannie Mae 2.50% 20277 | 873 | 887 |
| Fannie Mae 2.50% 20277 | 866 | 880 |
| Fannie Mae 2.50% 20287 | 22,415 | 22,780 |
| Fannie Mae 2.50% 20287 | 5,284 | 5,370 |
| Fannie Mae 2.50% 20287 | 2,656 | 2,686 |
| Fannie Mae 2.50% 20287 | 2,416 | 2,448 |
| Fannie Mae 2.50% 20287 | 2,296 | 2,326 |
| Fannie Mae 2.50% 20287 | 1,512 | 1,537 |
| Fannie Mae 2.50% 20287 | 943 | 955 |
| Fannie Mae 2.50% 20287 | 747 | 757 |
| Fannie Mae 2.50% 20287 | 364 | 369 |
| Fannie Mae 5.50% 20337 | 3,548 | 3,969 |
| Fannie Mae 5.50% 20337 | 3,189 | 3,562 |
| Fannie Mae 5.50% 20337 | 368 | 411 |
| Fannie Mae 4.50% 20347 | 12,759 | 13,836 |
| Fannie Mae 3.00% 20357 | 38,990 | 39,768 |
| Fannie Mae 3.00% 20357 | 35,215 | 35,900 |
| Fannie Mae 3.00% 20357 | 27,986 | 28,530 |
| Fannie Mae 3.50% 20357 | 79,742 | 83,296 |
| Fannie Mae 3.50% 20357 | 63,714 | 66,389 |
| Fannie Mae 3.50% 20357 | 47,925 | 49,971 |
| Fannie Mae 3.50% 20357 | 41,184 | 42,945 |
| Fannie Mae 3.50% 20357 | 13,271 | 13,863 |
| Fannie Mae 3.50% 20357 | 637 | 664 |
| Fannie Mae 5.00% 20357 | 1,297 | 1,436 |
| Fannie Mae 5.50% 20357 | 1,464 | 1,637 |
| Fannie Mae 5.50% 20357 | 835 | 940 |
| Fannie Mae 6.50% 20357 | 3,123 | 3,680 |
| Fannie Mae 5.50% 20367 | 311 | 348 |
| Fannie Mae 5.50% 20367 | 283 | 317 |
| Fannie Mae 6.00% 20367 | 974 | 1,102 |
| Fannie Mae 6.00% 20377 | 11,921 | 13,528 |
| Fannie Mae 6.50% 20377 | 2,442 | 2,790 |
| Fannie Mae 6.50% 20377 | 2,059 | 2,250 |
| Fannie Mae 6.50% 20377 | 1,352 | 1,531 |
| Fannie Mae 7.00% 20377 | 616 | 681 |
| Fannie Mae 7.00% 20377 | 480 | 530 |
| Fannie Mae 7.00% 20377 | 324 | 358 |
| Fannie Mae 5.50% 20387 | 658 | 735 |
| Fannie Mae 6.50% 20387 | 3,468 | 3,979 |
| Fannie Mae 5.50% 20397 | 110 | 123 |
| Fannie Mae 6.00% 20397 | 16,369 | 18,485 |
| Fannie Mae 4.00% 20407 | 3,908 | 4,166 |
| Fannie Mae 4.50% 20407 | 19,690 | 21,314 |
| Fannie Mae 4.50% 20407 | 16,162 | 17,495 |
| Fannie Mae 4.50% 20407 | 12,680 | 13,725 |
| Fannie Mae 5.00% 20407 | 14,695 | 16,222 |
American Balanced Fund — Page 18 of 30
Bonds, notes & other debt instruments
Mortgage-backed obligations (continued) | Principal amount
(000) | Value
(000) |
| Fannie Mae 5.00% 20407 | $3,110 | $3,442 |
| Fannie Mae 5.00% 20407 | 1,810 | 1,998 |
| Fannie Mae 5.00% 20407 | 1,322 | 1,456 |
| Fannie Mae 4.00% 20417 | 14,481 | 15,420 |
| Fannie Mae 4.00% 20417 | 10,869 | 11,573 |
| Fannie Mae 4.00% 20417 | 10,870 | 11,532 |
| Fannie Mae 4.00% 20417 | 6,551 | 6,984 |
| Fannie Mae 4.00% 20417 | 4,011 | 4,277 |
| Fannie Mae 4.00% 20417 | 3,120 | 3,315 |
| Fannie Mae 4.00% 20417 | 2,074 | 2,216 |
| Fannie Mae 4.50% 20417 | 8,780 | 9,505 |
| Fannie Mae 5.00% 20417 | 2,796 | 3,088 |
| Fannie Mae 5.00% 20417 | 2,529 | 2,793 |
| Fannie Mae 5.00% 20417 | 2,281 | 2,520 |
| Fannie Mae 5.00% 20417 | 2,050 | 2,265 |
| Fannie Mae 5.00% 20417 | 2,027 | 2,236 |
| Fannie Mae 5.00% 20417 | 1,787 | 1,974 |
| Fannie Mae 5.00% 20417 | 1,350 | 1,491 |
| Fannie Mae 5.00% 20417 | 996 | 1,099 |
| Fannie Mae 5.00% 20417 | 594 | 659 |
| Fannie Mae 5.00% 20417 | 593 | 652 |
| Fannie Mae 5.00% 20417 | 538 | 593 |
| Fannie Mae 5.00% 20417 | 300 | 331 |
| Fannie Mae 5.00% 20417 | 295 | 326 |
| Fannie Mae 5.00% 20417 | 181 | 199 |
| Fannie Mae 5.00% 20417 | 144 | 158 |
| Fannie Mae 5.00% 20417 | 116 | 127 |
| Fannie Mae 5.00% 20417 | 46 | 50 |
| Fannie Mae 5.00% 20417 | 39 | 43 |
| Fannie Mae 5.00% 20417 | 34 | 37 |
| Fannie Mae 4.00% 20427 | 31,874 | 33,984 |
| Fannie Mae 4.00% 20427 | 15,965 | 16,999 |
| Fannie Mae 4.00% 20427 | 10,770 | 11,482 |
| Fannie Mae 4.00% 20427 | 10,330 | 11,044 |
| Fannie Mae 4.00% 20427 | 8,665 | 9,227 |
| Fannie Mae 4.00% 20427 | 3,605 | 3,833 |
| Fannie Mae 4.00% 20427 | 2,689 | 2,859 |
| Fannie Mae 5.00% 20427 | 513 | 564 |
| Fannie Mae 5.00% 20427 | 500 | 550 |
| Fannie Mae 3.00% 20437 | 34,277 | 34,350 |
| Fannie Mae 3.00% 20437 | 33,680 | 33,753 |
| Fannie Mae 3.00% 20437 | 19,599 | 19,661 |
| Fannie Mae 3.00% 20437 | 18,926 | 18,964 |
| Fannie Mae 3.00% 20437 | 18,262 | 18,297 |
| Fannie Mae 3.00% 20437 | 15,480 | 15,510 |
| Fannie Mae 3.00% 20437 | 15,071 | 15,101 |
| Fannie Mae 3.00% 20437 | 14,764 | 14,825 |
| Fannie Mae 3.00% 20437 | 12,039 | 12,062 |
| Fannie Mae 3.00% 20437 | 10,204 | 10,227 |
| Fannie Mae 3.00% 20437 | 7,707 | 7,722 |
| Fannie Mae 3.00% 20437 | 4,327 | 4,336 |
| Fannie Mae 3.00% 20437 | 4,295 | 4,305 |
| Fannie Mae 3.00% 20437 | 4,229 | 4,238 |
| Fannie Mae 3.00% 20437 | 4,214 | 4,223 |
| Fannie Mae 3.50% 20437 | 38,017 | 39,274 |
American Balanced Fund — Page 19 of 30
Bonds, notes & other debt instruments
Mortgage-backed obligations (continued) | Principal amount
(000) | Value
(000) |
| Fannie Mae 3.50% 20437 | $23,093 | $23,857 |
| Fannie Mae 3.50% 20437 | 16,829 | 17,385 |
| Fannie Mae 3.50% 20437 | 6,240 | 6,446 |
| Fannie Mae 3.50% 20437 | 2,855 | 2,951 |
| Fannie Mae 4.00% 20437 | 16,342 | 17,441 |
| Fannie Mae 4.00% 20437 | 9,733 | 10,362 |
| Fannie Mae 4.00% 20437 | 4,220 | 4,485 |
| Fannie Mae 4.00% 20437 | 3,098 | 3,311 |
| Fannie Mae 4.00% 20437 | 3,011 | 3,218 |
| Fannie Mae 4.00% 20437 | 1,006 | 1,074 |
| Fannie Mae 4.00% 20437 | 607 | 650 |
| Fannie Mae 4.00% 20437 | 561 | 599 |
| Fannie Mae 4.00% 20437 | 552 | 590 |
| Fannie Mae 4.00% 20437 | 471 | 504 |
| Fannie Mae 4.00% 20437 | 406 | 433 |
| Fannie Mae 4.50% 20437 | 19,112 | 20,654 |
| Fannie Mae 4.50% 20437 | 11,917 | 12,874 |
| Fannie Mae 3.50% 20447 | 39,294 | 40,570 |
| Fannie Mae 3.50% 20447 | 23,713 | 24,483 |
| Fannie Mae 3.50% 20447 | 23,502 | 24,265 |
| Fannie Mae 4.00% 20457 | 95,195 | 101,374 |
| Fannie Mae 4.00% 20457 | 26,481 | 28,200 |
| Fannie Mae 4.00% 20457 | 19,371 | 20,629 |
| Fannie Mae 3.00% 20467,8 | 39,000 | 42,050 |
| Fannie Mae 3.00% 20467,8 | 2,230 | 2,229 |
| Fannie Mae 4.00% 20467,8 | 181,106 | 191,254 |
| Fannie Mae 4.00% 20467,8 | 105,730 | 111,861 |
| Fannie Mae 6.50% 20477 | 311 | 348 |
| Fannie Mae 6.50% 20477 | 121 | 135 |
| Fannie Mae 6.50% 20477 | 81 | 91 |
| Fannie Mae 7.00% 20477 | 267 | 303 |
| Fannie Mae 7.00% 20477 | 240 | 272 |
| Fannie Mae 7.00% 20477 | 130 | 147 |
| Fannie Mae 7.00% 20477 | 106 | 120 |
| Fannie Mae 7.00% 20477 | 89 | 101 |
| Fannie Mae 7.00% 20477 | 13 | 15 |
| Fannie Mae, Series 2014-M6, Class FA, multifamily 0.484% 20176,7 | 9,908 | 9,898 |
| Fannie Mae, Series 2012-M8, multifamily 1.52% 20197 | 12,502 | 12,541 |
| Fannie Mae, Series 2012-M14, Class A2, multifamily 2.301% 20226,7 | 8,570 | 8,433 |
| Fannie Mae, Series 2012-M9, Class A2, multifamily 2.482% 20227 | 21,843 | 21,798 |
| Fannie Mae, Series 2012-M5, Class A2, multifamily 2.715% 20227 | 14,000 | 14,164 |
| Fannie Mae, Series 2014-M1, multifamily 3.311% 20236,7 | 16,000 | 16,564 |
| Fannie Mae, Series 2013-M14, Class A2, multifamily 3.329% 20236,7 | 19,245 | 20,080 |
| Fannie Mae, Series 2014-M2, Class A2, multifamily 3.513% 20236,7 | 16,585 | 17,494 |
| Fannie Mae, Series 2014-M9, multifamily 3.103% 20246,7 | 16,865 | 17,186 |
| Fannie Mae, Series 2014-M3, Class A2, multifamily 3.475% 20246,7 | 18,000 | 18,799 |
| Fannie Mae, Series 2001-4, Class NA, 9.736% 20256,7 | 9 | 10 |
| Fannie Mae, Series 2001-20, Class D, 10.956% 20316,7 | 1 | 1 |
| Fannie Mae, Series 2006-43, Class JO, principal only, 0% 20367 | 1,492 | 1,297 |
| Fannie Mae, Series 2001-T10, Class A-1, 7.00% 20417 | 265 | 312 |
| Fannie Mae, Series 2001-50, Class BA, 7.00% 20417 | 185 | 211 |
| Fannie Mae, Series 2002-W3, Class A-5, 7.50% 20417 | 342 | 397 |
| Fannie Mae, Series 2002-W1, Class 2A, 6.335% 20426,7 | 373 | 429 |
| Freddie Mac 5.00% 20237 | 3,371 | 3,626 |
| Freddie Mac 5.00% 20237 | 2,361 | 2,539 |
American Balanced Fund — Page 20 of 30
Bonds, notes & other debt instruments
Mortgage-backed obligations (continued) | Principal amount
(000) | Value
(000) |
| Freddie Mac 5.00% 20237 | $1,383 | $1,487 |
| Freddie Mac 5.00% 20237 | 672 | 724 |
| Freddie Mac 5.00% 20237 | 669 | 720 |
| Freddie Mac 5.00% 20237 | 606 | 651 |
| Freddie Mac 5.00% 20247 | 4,425 | 4,785 |
| Freddie Mac 6.00% 20267 | 1,741 | 1,957 |
| Freddie Mac 6.00% 20267 | 1,474 | 1,657 |
| Freddie Mac 6.00% 20267 | 1,283 | 1,443 |
| Freddie Mac 6.50% 20277 | 602 | 681 |
| Freddie Mac 6.50% 20277 | 309 | 350 |
| Freddie Mac 6.50% 20277 | 128 | 146 |
| Freddie Mac 6.50% 20287 | 391 | 443 |
| Freddie Mac 3.00% 20347 | 65,279 | 66,752 |
| Freddie Mac 3.00% 20357 | 19,277 | 19,690 |
| Freddie Mac 3.00% 20357 | 4,016 | 4,102 |
| Freddie Mac 3.00% 20357 | 3,897 | 3,972 |
| Freddie Mac 3.50% 20357 | 59,852 | 62,429 |
| Freddie Mac 3.50% 20357 | 54,175 | 56,546 |
| Freddie Mac 3.50% 20357 | 39,909 | 41,658 |
| Freddie Mac 3.50% 20357 | 39,002 | 40,715 |
| Freddie Mac 3.50% 20357 | 26,429 | 27,551 |
| Freddie Mac 3.50% 20357 | 13,294 | 13,865 |
| Freddie Mac 3.50% 20357 | 12,393 | 12,927 |
| Freddie Mac 3.50% 20357 | 9,941 | 10,369 |
| Freddie Mac 5.50% 20377 | 375 | 417 |
| Freddie Mac 5.50% 20377 | 81 | 89 |
| Freddie Mac 5.50% 20387 | 278 | 309 |
| Freddie Mac 5.50% 20387 | 111 | 123 |
| Freddie Mac 6.00% 20387 | 1,814 | 2,044 |
| Freddie Mac 6.00% 20387 | 270 | 305 |
| Freddie Mac 5.50% 20397 | 409 | 455 |
| Freddie Mac 2.722% 20406,7 | 80 | 85 |
| Freddie Mac 4.50% 20407 | 15,050 | 16,242 |
| Freddie Mac 4.50% 20407 | 742 | 801 |
| Freddie Mac 4.50% 20417 | 2,048 | 2,212 |
| Freddie Mac 4.50% 20417 | 1,943 | 2,094 |
| Freddie Mac 4.50% 20417 | 843 | 912 |
| Freddie Mac 4.50% 20417 | 549 | 592 |
| Freddie Mac 4.50% 20417 | 375 | 404 |
| Freddie Mac 4.50% 20417 | 117 | 126 |
| Freddie Mac 5.00% 20417 | 757 | 833 |
| Freddie Mac 4.00% 20437 | 2,711 | 2,882 |
| Freddie Mac 4.00% 20437 | 1,119 | 1,189 |
| Freddie Mac 4.00% 20437 | 1,002 | 1,066 |
| Freddie Mac 4.00% 20437 | 804 | 857 |
| Freddie Mac 4.00% 20437 | 501 | 536 |
| Freddie Mac 4.00% 20457 | 95,137 | 101,232 |
| Freddie Mac 4.00% 20457 | 14,442 | 15,354 |
| Freddie Mac 3.50% 20467,8 | 100,000 | 102,914 |
| Freddie Mac 4.00% 20467,8 | 100,000 | 105,621 |
| Freddie Mac, Series K714, Class A2, multifamily 3.034% 20206,7 | 7,825 | 8,096 |
| Freddie Mac, Series K716, Class A2, multifamily 3.13% 20217 | 7,560 | 7,832 |
| Freddie Mac, Series KS01, Class A1, multifamily 1.693% 20227 | 2,908 | 2,893 |
| Freddie Mac, Series K019, Class A2, multifamily 2.272% 20227 | 16,000 | 15,847 |
| Freddie Mac, Series K021, Class A2, multifamily 2.396% 20227 | 16,555 | 16,463 |
American Balanced Fund — Page 21 of 30
Bonds, notes & other debt instruments
Mortgage-backed obligations (continued) | Principal amount
(000) | Value
(000) |
| Freddie Mac, Series K025, Class A2, multifamily 2.682% 20227 | $15,904 | $16,038 |
| Freddie Mac, Series K718, Class A2, multifamily 2.791% 20227 | 8,135 | 8,263 |
| Freddie Mac, Series K721, Class A2, multifamily 3.090% 20227 | 28,000 | 28,816 |
| Freddie Mac, Series 2013-DN2, Class M-1, 1.872% 20236,7 | 6,992 | 6,996 |
| Freddie Mac, Series KS01, Class A2, multifamily 2.522% 20237 | 1,075 | 1,079 |
| Freddie Mac, Series K034, Class A1, multifamily 2.669% 20237 | 7,908 | 8,095 |
| Freddie Mac, Series K036, Class A2, multifamily 3.527% 20236,7 | 16,500 | 17,396 |
| Freddie Mac, Series 2013-DN1, Class M-1, 3.822% 20236,7 | 9,257 | 9,473 |
| Freddie Mac, Series 2014-DN2, Class M-1, 1.272% 20246,7 | 3,295 | 3,293 |
| Freddie Mac, Series 2014-DN1, Class M-1, 1.422% 20246,7 | 6,716 | 6,714 |
| Freddie Mac, Series 2014-HQ2, Class M-1, 1.872% 20246,7 | 13,633 | 13,673 |
| Freddie Mac, Series 2014-DN2, Class M-2, 2.072% 20246,7 | 11,535 | 11,325 |
| Freddie Mac, Series 2014-HQ1, Class M-1, 2.072% 20246,7 | 8,993 | 9,018 |
| Freddie Mac, Series 2014-HQ3, Class M-1, 2.072% 20246,7 | 6,534 | 6,550 |
| Freddie Mac, Series 2014-HQ2, Class M-2, 2.622% 20246,7 | 21,320 | 21,020 |
| Freddie Mac, Series 2014-DN4, Class M-2, 2.822% 20246,7 | 8,480 | 8,531 |
| Freddie Mac, Series 2014-HQ1, Class M-2, 2.922% 20246,7 | 11,100 | 11,152 |
| Freddie Mac, Series K043, Class A2, multifamily 3.062% 20247 | 36,400 | 36,725 |
| Freddie Mac, Series K040, Class A2, multifamily 3.241% 20247 | 13,416 | 13,816 |
| Freddie Mac, Series 2015-HQ2, Class M-1, 1.522% 20256,7 | 3,300 | 3,296 |
| Freddie Mac, Series 2015-DN1, Class M-1, 1.672% 20256,7 | 4,227 | 4,234 |
| Freddie Mac, Series 2015-HQ2, Class M-2, 2.372% 20256,7 | 11,200 | 10,946 |
| Freddie Mac, Series K044, Class A2, multifamily 2.811% 20257 | 13,505 | 13,343 |
| Freddie Mac, Series K048, Class A2, multifamily 3.284% 20256,7 | 34,275 | 35,239 |
| Freddie Mac, Series K047, Class A2, multifamily 3.329% 20257 | 20,000 | 20,555 |
| Freddie Mac, Series K050, Class A2, multifamily 3.334% 20256,7 | 11,440 | 11,746 |
| Freddie Mac, Series 2015-HQA-2, Class M-1, 1.572% 20286,7 | 2,825 | 2,826 |
| Freddie Mac, Series T-041, Class 3-A, 6.040% 20326,7 | 1,802 | 2,050 |
| Freddie Mac, Series 3156, Class PO, principal only, 0% 20367 | 3,813 | 3,537 |
| Freddie Mac, Series 3146, Class PO, principal only, 0% 20367 | 2,510 | 2,330 |
| Freddie Mac, Series 3318, Class JT, 5.50% 20377 | 4,401 | 4,863 |
| GMAC Commercial Mortgage Securities, Inc., Series 2006-C1, Class AM, 5.29% 20456,7 | 6,299 | 6,293 |
| Government National Mortgage Assn. 10.00% 20217 | 99 | 112 |
| Government National Mortgage Assn. 6.00% 20387 | 10,633 | 11,983 |
| Government National Mortgage Assn. 6.50% 20387 | 5,362 | 6,136 |
| Government National Mortgage Assn. 4.00% 20397 | 2,131 | 2,262 |
| Government National Mortgage Assn. 4.00% 20397 | 1,994 | 2,116 |
| Government National Mortgage Assn. 4.00% 20397 | 1,257 | 1,335 |
| Government National Mortgage Assn. 4.00% 20407 | 15,539 | 16,774 |
| Government National Mortgage Assn. 4.00% 20407 | 11,378 | 12,142 |
| Government National Mortgage Assn. 4.00% 20407 | 3,605 | 3,830 |
| Government National Mortgage Assn. 4.00% 20407 | 3,344 | 3,610 |
| Government National Mortgage Assn. 4.00% 20407 | 3,248 | 3,491 |
| Government National Mortgage Assn. 4.00% 20407 | 1,917 | 2,036 |
| Government National Mortgage Assn. 4.00% 20407 | 1,709 | 1,815 |
| Government National Mortgage Assn. 4.00% 20417 | 25,102 | 26,660 |
| Government National Mortgage Assn. 4.00% 20417 | 3,240 | 3,441 |
| Government National Mortgage Assn. 4.00% 20417 | 1,964 | 2,087 |
| Government National Mortgage Assn. 4.00% 20417 | 393 | 417 |
| Government National Mortgage Assn. 4.50% 20437 | 3,665 | 3,944 |
| Government National Mortgage Assn. 4.00% 20447 | 268 | 286 |
| Government National Mortgage Assn. 3.50% 20457 | 237,685 | 248,133 |
| Government National Mortgage Assn. 3.50% 20457 | 65,835 | 68,729 |
| Government National Mortgage Assn. 3.50% 20457 | 50,397 | 52,613 |
| Government National Mortgage Assn. 4.00% 20457 | 336,133 | 357,234 |
American Balanced Fund — Page 22 of 30
Bonds, notes & other debt instruments
Mortgage-backed obligations (continued) | Principal amount
(000) | Value
(000) |
| Government National Mortgage Assn. 4.00% 20457 | $156,649 | $166,649 |
| Government National Mortgage Assn. 4.00% 20457 | 131,944 | 140,346 |
| Government National Mortgage Assn. 4.00% 20457 | 11,779 | 12,543 |
| Government National Mortgage Assn. 4.50% 20457 | 85,405 | 91,949 |
| Government National Mortgage Assn. 4.50% 20457 | 77,004 | 82,768 |
| Government National Mortgage Assn. 4.50% 20457 | 57,070 | 61,411 |
| Government National Mortgage Assn. 4.50% 20457 | 55,881 | 60,132 |
| Government National Mortgage Assn. 3.50% 20467,8 | 30,900 | 32,204 |
| Government National Mortgage Assn. 4.00% 20467,8 | 204,875 | 217,530 |
| Government National Mortgage Assn. 5.104% 20617 | 1,746 | 1,839 |
| Greenwich Capital Commercial Funding Corp., Series 2006-GG7, Class A-4, 5.826% 20386,7 | 16,327 | 16,405 |
| Greenwich Capital Commercial Funding Corp., Series 2006-GG7, Class A-1-A, 6.021% 20386,7 | 364 | 367 |
| Greenwich Capital Commercial Funding Corp., Series 2007-GG9, Class A-1-A, 5.426% 20397 | 3,981 | 4,090 |
| Greenwich Capital Commercial Funding Corp., Series 2007-GG9, Class A-4, 5.444% 20397 | 32,668 | 33,418 |
| Greenwich Capital Commercial Funding Corp., Series 2007-GG11, Class A-1-A, 5.704% 20497 | 33,774 | 35,400 |
| GS Mortgage Securities Corp. II, Series 2006-GG8, Class A-4, 5.56% 20397 | 9,966 | 10,115 |
| GS Mortgage Securities Corp. II, Series 2011-GC3, Class A-2, 3.645% 20443,7 | 694 | 693 |
| GS Mortgage Securities Corp. II, Series 2007-GG10, Class A-1-A, 5.988% 20456,7 | 3,013 | 3,136 |
| GS Mortgage Securities Corp. II, Series 2015-GC-34, Class AAB, 3.278% 20487 | 5,300 | 5,323 |
| GS Mortgage Securities Corp. II, Series 2015-GS-1, Class AAB, 3.553% 20487 | 8,700 | 8,905 |
| Hilton USA Trust, Series 2013-HLF-AFX, 2.662% 20303,7 | 14,110 | 14,075 |
| Hilton USA Trust, Series 2013-HLF-BFX, 3.367% 20303,7 | 4,325 | 4,299 |
| Hilton USA Trust, Series 2013-HLF, CFX, 3.714% 20303,7 | 1,250 | 1,241 |
| J.P. Morgan Chase Commercial Mortgage Securities Corp., Series 2006-LDP6, Class A-1-A, 5.471% 20436,7 | 2,993 | 3,003 |
| J.P. Morgan Chase Commercial Mortgage Securities Corp., Series 2006-CB15, Class A-1-A, 5.811% 20436,7 | 1,362 | 1,373 |
| J.P. Morgan Chase Commercial Mortgage Securities Corp., Series 2006-CB15, Class A-4, 5.814% 20436,7 | 4,509 | 4,516 |
| J.P. Morgan Chase Commercial Mortgage Securities Corp., Series 2006-LDP7, Class A-4, 5.911% 20456,7 | 11,635 | 11,682 |
| J.P. Morgan Chase Commercial Mortgage Securities Corp., Series 2011-C4, Class A-2, 3.341% 20463,7 | 9,172 | 9,183 |
| J.P. Morgan Chase Commercial Mortgage Securities Corp., Series 2011-C3A, Class A-2, 3.673% 20463,7 | 3,999 | 4,033 |
| J.P. Morgan Chase Commercial Mortgage Securities Corp., Series 2007-CB18, Class A-1-A, 5.431% 20476,7 | 5,074 | 5,191 |
| J.P. Morgan Chase Commercial Mortgage Securities Corp., Series 2007-LDPX, Class A-1-A, 5.439% 20497 | 5,703 | 5,883 |
| J.P. Morgan Chase Commercial Mortgage Securities Corp., Series 2007-CB19, Class A-4, 5.695% 20496,7 | 31,772 | 32,798 |
| J.P. Morgan Chase Commercial Mortgage Securities Corp., Series 2007-CB19, Class A-1-A, 5.883% 20496,7 | 46,442 | 48,481 |
| J.P. Morgan Chase Commercial Mortgage Securities Corp., Series 2007-C1, Class A-4, 5.716% 20517 | 19,199 | 20,074 |
| J.P. Morgan Chase Commercial Mortgage Securities Corp., Series 2007-LD12, Class A-1-A, 5.85% 20516,7 | 14,008 | 14,680 |
| J.P. Morgan Chase Commercial Mortgage Securities Trust, Series 2006-LDP8, Class A-4, 5.399% 20457 | 28,919 | 29,099 |
| J.P. Morgan Chase Commercial Mortgage Securities Trust, Series 2006-LDP9, Class A-3, 5.336% 20477 | 9,578 | 9,762 |
| J.P. Morgan Chase Commercial Mortgage Securities Trust, Series 2006-LDP9, Class A-M, 5.372% 20477 | 15,596 | 15,871 |
| JPMBB Commercial Mortgage Securities Trust, Series 2015-C-32, Class ASB, 3.358% 20487 | 1,845 | 1,864 |
| JPMBB Commercial Mortgage Securities Trust, Series 2015-C-33, Class ASB, 3.5623% 20487 | 13,500 | 13,776 |
| L.A. Arena Funding, LLC, Series 1, Class A, 7.656% 20263,7 | 9,549 | 10,609 |
| LB Commercial Mortgage Trust, Series 2007-C3, Class A-1-A, multifamily 6.052% 20446,7 | 6,410 | 6,646 |
| LB-UBS Commercial Mortgage Trust, Series 2006-C3, Class A1A, 5.641% 20396,7 | 7,006 | 7,009 |
| LB-UBS Commercial Mortgage Trust, Series 2007-C2, Class A-1-A, 5.387% 20407 | 41,848 | 43,064 |
| LB-UBS Commercial Mortgage Trust, Series 2007-C2, Class A-3, 5.43% 20407 | 27,986 | 28,743 |
| LB-UBS Commercial Mortgage Trust, Series 2007-C2, Class A-M, 5.493% 20406,7 | 2,675 | 2,741 |
| LB-UBS Commercial Mortgage Trust, Series 2007-C6, Class A-M, 6.114% 20406,7 | 24,060 | 25,154 |
| LB-UBS Commercial Mortgage Trust, Series 2007-C7, Class A-M, 6.156% 20456,7 | 11,575 | 12,399 |
| Merrill Lynch Mortgage Trust, Series 2006-C2, Class A1A, 5.739% 20436,7 | 1,309 | 1,324 |
| Merrill Lynch Mortgage Trust, Series 2007-C1, Class A-4, 5.837% 20506,7 | 8,000 | 8,261 |
| ML-CFC Commercial Mortgage Trust, Series 2006-2, Class A-1-A, 5.88% 20466,7 | 8,724 | 8,792 |
| ML-CFC Commercial Mortgage Trust, Series 2007-8, Class A-3, 5.877% 20496,7 | 10,000 | 10,431 |
| Morgan Stanley Bank of America Merrill Lynch Trust, Series 2015-C-27, Class ASB, 3.557% 20477 | 11,345 | 11,611 |
| Morgan Stanley Bank of America Merrill Lynch Trust, Series 2015-C-22, Class ASB, 3.04% 20487 | 5,020 | 5,020 |
| Morgan Stanley Bank of America Merrill Lynch Trust, Series 2015-C-26, Class ASB, 3.323% 20487 | 10,000 | 10,055 |
American Balanced Fund — Page 23 of 30
Bonds, notes & other debt instruments
Mortgage-backed obligations (continued) | Principal amount
(000) | Value
(000) |
| Morgan Stanley Bank of America Merrill Lynch Trust, Series 2015-C-25, Class ASB, 3.383% 20487 | $4,500 | $4,573 |
| Morgan Stanley Bank of America Merrill Lynch Trust, Series 2015-C-24, Class A-4, 3.732% 20487 | 20,245 | 20,691 |
| Morgan Stanley Bank of America Merrill Lynch Trust, Series 2015-C-25, Class C, 4.529% 20486,7 | 4,950 | 4,653 |
| Morgan Stanley Capital I Trust, Series 2014-CPT, Class A, 3.35% 20293,7 | 14,570 | 14,894 |
| Morgan Stanley Capital I Trust, Series 2006-IQ12, Class A1A, 5.319% 20437 | 22,493 | 22,953 |
| Morgan Stanley Capital I Trust, Series 2007-IQ13, Class A-M, 5.406% 20447 | 4,500 | 4,623 |
| Morgan Stanley Capital I Trust, Series 2007-IQ15, Class A-4, 5.917% 20496,7 | 20,304 | 21,112 |
| National Australia Bank 2.00% 20173,7 | 500 | 504 |
| National Australia Bank 1.25% 20183,7 | 14,120 | 13,992 |
| National Australia Bank 2.00% 20193,7 | 4,925 | 4,924 |
| National Australia Bank 2.125% 20193,7 | 11,000 | 10,963 |
| National Bank of Canada 2.20% 20163,7 | 600 | 606 |
| Nordea Eiendomskreditt AS 2.125% 20173,7 | 700 | 705 |
| Royal Bank of Canada 1.125% 20177 | 1,000 | 1,001 |
| Royal Bank of Canada 2.00% 20197 | 3,550 | 3,560 |
| Royal Bank of Canada 2.20% 20197 | 37,700 | 37,766 |
| Royal Bank of Canada 1.875% 20207 | 31,650 | 31,111 |
| Royal Bank of Canada 2.10% 20207 | 5,000 | 4,923 |
| Sparebank 1 Boligkreditt AS 2.625% 20163,7 | 400 | 402 |
| Sparebank 1 Boligkreditt AS 2.30% 20173,7 | 750 | 759 |
| Swedbank AB 2.125% 20163,7 | 525 | 528 |
| Swedbank AB 2.95% 20163,7 | 300 | 301 |
| Swedbank AB 1.375% 20183,7 | 925 | 916 |
| Toronto-Dominion Bank 1.625% 20163,7 | 400 | 402 |
| Toronto-Dominion Bank 1.50% 20173,7 | 65,000 | 65,126 |
| UBS AG 0.75% 20163,7 | 925 | 925 |
| Wachovia Bank Commercial Mortgage Trust, Series 2007-C30, Class A-5, 5.342% 20437 | 14,000 | 14,329 |
| Wachovia Bank Commercial Mortgage Trust, Series 2006-C25, Class A1A, 5.899% 20436,7 | 31,845 | 32,106 |
| Wachovia Bank Commercial Mortgage Trust, Series 2006-C27, Class A1A, 5.749% 20456,7 | 3,772 | 3,805 |
| Wachovia Bank Commercial Mortgage Trust, Series 2007-C31, Class A-5, 5.50% 20477 | 10,000 | 10,289 |
| Wachovia Bank Commercial Mortgage Trust, Series 2007-C32, Class A-3, 5.713% 20496,7 | 31,635 | 32,439 |
| Wachovia Bank Commercial Mortgage Trust, Series 2007-C33, Class A-M, 5.952% 20516,7 | 17,000 | 17,873 |
| Wells Fargo Commercial Mortgage Trust, Series 2015-SG-1, Class A-4, 3.789% 20477 | 14,550 | 14,998 |
| Wells Fargo Commercial Mortgage Trust, Series 2015-NXS-1, Class ASB, 2.934% 20487 | 4,505 | 4,474 |
| Wells Fargo Commercial Mortgage Trust, Series 2015-C-31, Class ASB, 3.487% 20487 | 2,700 | 2,737 |
| Wells Fargo Commercial Mortgage Trust, Series 2015-NXS-42, Class ASB, 3.522% 20487 | 10,775 | 11,025 |
| Wells Fargo Commercial Mortgage Trust, Series 2015-NXS-2, Class A-5, 3.767% 20587 | 7,635 | 7,838 |
| Wells Fargo Mortgage-backed Securities Trust, Series 2005-AR10, Class II-A-6, 2.738% 20356,7 | 7,622 | 7,713 |
| Westpac Banking Corp. 2.45% 20163,7 | 575 | 582 |
| Westpac Banking Corp. 1.25% 20173,7 | 800 | 793 |
| Westpac Banking Corp. 1.375% 20183,7 | 3,325 | 3,288 |
| Westpac Banking Corp. 1.85% 20183,7 | 8,300 | 8,287 |
| Westpac Banking Corp. 2.00% 20193,7 | 28,300 | 28,120 |
| Westpac Banking Corp. 2.25% 20203,7 | 12,500 | 12,358 |
| Westpac Banking Corp. 2.00% 20213,7 | 10,825 | 10,706 |
| | | 6,428,004 |
| Asset-backed obligations 1.53% | | |
| Aesop Funding LLC, Series 2013-2A, Class A, 2.97% 20203,7 | 16,535 | 16,494 |
| Aesop Funding LLC, Series 2015-1, Class A, 2.50% 20213,7 | 55,500 | 55,374 |
| Aesop Funding LLC, Series 2014-2A, Class A, 2.50% 20213,7 | 18,500 | 18,372 |
| Aesop Funding LLC, Series 2015-2-A, Class A, 2.63% 20213,7 | 11,665 | 11,533 |
| Ally Auto Receivables Trust, Series 2014-1, Class A3, 0.97% 20187 | 9,080 | 9,060 |
| Ally Master Owner Trust, Series 2014-4, Class A1, 0.73% 20196,7 | 10,000 | 9,976 |
| Ally Master Owner Trust, Series 2014-1, Class A1, 0.80% 20196,7 | 6,985 | 6,977 |
American Balanced Fund — Page 24 of 30
Bonds, notes & other debt instruments
Asset-backed obligations (continued) | Principal amount
(000) | Value
(000) |
| Ally Master Owner Trust, Series 2014-1, Class A2, 1.29% 20197 | $7,675 | $7,658 |
| American Express Credit Account Master Trust, Series 2014-4, Class A, 1.43% 20207 | 28,610 | 28,558 |
| AmeriCredit Automobile Receivables Trust, Series 2014-4, Class A-2-A, 0.72% 20187 | 7,475 | 7,463 |
| AmeriCredit Automobile Receivables Trust, Series 2012-4, Class C, 1.93% 20187 | 710 | 711 |
| AmeriCredit Automobile Receivables Trust, Series 2012-1, Class C-2, 2.67% 20187 | 1,023 | 1,024 |
| AmeriCredit Automobile Receivables Trust, Series 2014-3, Class A-3, 1.15% 20197 | 6,300 | 6,274 |
| AmeriCredit Automobile Receivables Trust, Series 2015-1, Class A-3, 1.26% 20197 | 11,125 | 11,071 |
| AmeriCredit Automobile Receivables Trust, Series 2014-4, Class A-3, 1.27% 20197 | 8,705 | 8,677 |
| Appalachian Consumer Rate Relief Funding LLC, Series 2013-1, Class A-2, 3.77% 20317 | 1,310 | 1,415 |
| ARI Fleet Lease Trust, Series 2014-A, Class A-2, 0.81% 20223,7 | 1,245 | 1,243 |
| Bank of the West Auto Trust, Series 2014-1, Class A-2, 0.69% 20173,7 | 4,608 | 4,608 |
| Bank of the West Auto Trust, Series 2014-1, Class A-3, 1.09% 20193,7 | 5,580 | 5,559 |
| Capital One Multi-asset Execution Trust, Series 2014-A5, Class A, 1.48% 20207 | 15,110 | 15,115 |
Carlyle Global Market Strategies Commodities Fund, Series 2015-1A,
Class A, 2.012% 20202,3,6,7 | 5,750 | 5,745 |
| Carlyle Global Market Strategies Commodities Fund, Series 2014-1A, Class A, 2.22% 20212,3,6,7 | 12,145 | 12,144 |
| CarMaxAuto Owner Trust, Series 2014-1, Class A-3, 0.79% 20187 | 9,569 | 9,546 |
| CarMaxAuto Owner Trust, Series 2014-4, Class A-3, 1.25% 20197 | 12,600 | 12,554 |
| Chase Issuance Trust, Series 2014-A7, Class A, 1.38% 20197 | 22,000 | 21,940 |
| Chesapeake Funding LLC, Series 2014-1-A, Class A, 0.689% 20263,6,7 | 13,066 | 13,050 |
| Chrysler Capital Auto Receivables Trust, Series 2014-A-A, Class A-3, 0.83% 20183,7 | 3,829 | 3,824 |
| Chrysler Capital Auto Receivables Trust, Series 2015-A, Class A-3, 1.22% 20193,7 | 26,435 | 26,334 |
| Chrysler Capital Auto Receivables Trust, Series 2014-A-A, Class A-4, 1.31% 20193,7 | 4,150 | 4,146 |
| Citi Held For Issuance, Series 2015-PM-2, Class A, 2.35% 20223,7 | 16,175 | 16,132 |
| Citi Held For Issuance, Series 2015-PM-3, Class A, 2.60% 20223,7 | 5,155 | 5,152 |
| Citi Held For Issuance, Series 2015-PM-3, Class B, 4.45% 20223,7 | 2,590 | 2,582 |
| Citibank Credit Card Issuance Trust, Series 2008-A-2, Class A2, 1.57% 20206,7 | 8,000 | 8,122 |
| Citibank Credit Card Issuance Trust, Series 2014-A6, Class A6, 2.15% 20217 | 16,725 | 16,799 |
| Consumer Credit Origination Loan Trust, Series 2015-1, Class A, 2.82% 20213,7 | 3,476 | 3,499 |
| CPS Auto Receivables Trust, Series 2015-A, Class A, 1.53% 20193,7 | 2,643 | 2,634 |
| CPS Auto Receivables Trust, Series 2015-C, Class A, 1.77% 20193,7 | 5,368 | 5,352 |
| CPS Auto Receivables Trust, Series 2015-A, Class B, 2.79% 20213,7 | 1,250 | 1,249 |
| CPS Auto Receivables Trust, Series 2015-A, Class C, 4.00% 20213,7 | 960 | 959 |
| CWABS, Inc., Series 2004-BC1, Class M-1, 1.172% 20346,7 | 2,349 | 2,262 |
| Dell Equipment Finance Trust, Series 2014-1, Class A2, 0.64% 20163,7 | 991 | 990 |
| Discover Card Execution Note Trust, Series 2014-A4, Class A4, 2.12% 20217 | 20,680 | 20,719 |
| Discover Card Execution Note Trust, Series 2015-A2, Class A, 1.90% 20227 | 18,500 | 18,269 |
| DRB Prime Student Loan Trust, Series 2015-D, Class A-3, 2.50% 20363,7 | 3,945 | 3,936 |
| Drive Auto Receivables Trust, Series 2015-DA, Class A-2-A, 1.23% 20183,7 | 3,195 | 3,191 |
| Drive Auto Receivables Trust, Series 2015-AA, Class B, 2.28% 20193,7 | 6,000 | 6,043 |
| Drive Auto Receivables Trust, Series 2015-B-A, Class C, 2.76% 20213,7 | 20,720 | 20,577 |
| Drive Auto Receivables Trust, Series 2015-CA, Class C, 3.01% 20213,7 | 5,910 | 5,852 |
| Drive Auto Receivables Trust, Series 2015-AA, Class C, 3.06% 20213,7 | 9,500 | 9,516 |
| Drive Auto Receivables Trust, Series 2015-DA, Class C, 3.38% 20213,7 | 18,790 | 18,681 |
| Drivetime Auto Owner Trust, Series 2015-3-A, Class A, 1.66% 20193,7 | 9,742 | 9,717 |
| Enterprise Fleet Financing LLC, Series 2014-1, Class A2, 0.87% 20193,7 | 6,063 | 6,051 |
| Enterprise Fleet Financing LLC, Series 2014-1, Class A3, 1.38% 20193,7 | 5,000 | 4,996 |
| Enterprise Fleet Financing LLC, Series 2014-2, Class A2, 1.05% 20203,7 | 9,655 | 9,617 |
| Enterprise Fleet Financing LLC, Series 2015-1, Class A2, 1.30% 20203,7 | 19,000 | 18,937 |
| Fifth Third Auto Trust, Series 2014-3, Class A3, 0.96% 20197 | 7,555 | 7,531 |
| Ford Credit Auto Lease Trust, Series 2014-B, Class A3, 0.89% 20177 | 10,060 | 10,049 |
| Ford Credit Auto Owner Trust, Series 2014-A-A3, 0.79% 20187 | 7,623 | 7,619 |
| Ford Credit Auto Owner Trust, Series 2014-B-A3, 0.90% 20187 | 10,440 | 10,419 |
| Ford Credit Auto Owner Trust, Series 2014-1-A, 2.26% 20253,7 | 4,250 | 4,289 |
| Ford Credit Auto Owner Trust, Series 2015-1 Class A, 2.12% 20263,7 | 19,800 | 19,634 |
American Balanced Fund — Page 25 of 30
Bonds, notes & other debt instruments
Asset-backed obligations (continued) | Principal amount
(000) | Value
(000) |
| Ford Credit Auto Owner Trust, Series 2014-2-A, 2.31% 20263,7 | $26,380 | $26,333 |
| Ford Credit Auto Owner Trust, Series 2015-2, Class A, 2.44% 20273,7 | 51,470 | 51,251 |
| Ford Credit Floorplan Master Owner Trust, Series 2015-1, Class A-1, 1.42% 20207 | 18,860 | 18,723 |
| Ford Credit Floorplan Master Owner Trust, Series 2015-2, Class A-1, 1.98% 20227 | 14,390 | 14,320 |
| Henderson Receivables LLC, Series 2006-4-A, Class A-1, 0.531% 20413,6,7 | 5,769 | 5,583 |
| Henderson Receivables LLC, Series 2006-3-A, Class A-1, 0.531% 20413,6,7 | 5,008 | 4,797 |
| Henderson Receivables LLC, Series 2015-2A, Class A, 3.87% 20583,7 | 3,871 | 3,848 |
| Henderson Receivables LLC, Series 2015-1A, Class A, 3.26% 20723,7 | 7,305 | 7,098 |
| Henderson Receivables LLC, Series 2014-2A, Class A, 3.61% 20733,7 | 7,204 | 7,239 |
| Henderson Receivables LLC, Series 2014-3A, Class A, 3.50% 20773,7 | 2,865 | 2,862 |
| Hertz Fleet Lease Funding LP, Series 2014-1-A, 0.693% 20283,6,7 | 13,132 | 13,139 |
| Hertz Vehicle Financing LLC, Rental Car Asset-backed Notes, Series 2013-1A, Class A-1, 1.12% 20173,7 | 16,000 | 15,981 |
| Hertz Vehicle Financing LLC, Rental Car Asset-backed Notes, Series 2013-1A, Class A-2, 1.83% 20193,7 | 23,840 | 23,667 |
| Hertz Vehicle Financing LLC, Rental Car Asset-backed Notes, Series 2015-3A, Class A, 2.67% 20213,7 | 18,085 | 17,884 |
| Hertz Vehicle Financing LLC, Rental Car Asset-backed Notes, Series 2015-1, Class A, 2.73% 20213,7 | 31,211 | 30,958 |
| Hertz Vehicle Financing LLC, Rental Car Asset-backed Notes, Series 2015-1, Class A, 3.52% 20213,7 | 1,263 | 1,248 |
| Hilton Grand Vacation Trust, Series 2014-AA, Class A, 1.77% 20263,7 | 3,693 | 3,626 |
| Honda Auto Receivables Owner Trust, Series 2015-1, Class A-2, 0.70% 20177 | 6,573 | 6,567 |
| Honda Auto Receivables Owner Trust, Series 2014-3, Class A-3, 0.88% 20187 | 13,315 | 13,284 |
| Honda Auto Receivables Owner Trust, Series 2014-4, Class A-3, 0.99% 20187 | 11,560 | 11,530 |
| Hyundai Auto Receivables Trust, Series 2013-B, Class A4, 1.01% 20197 | 10,500 | 10,492 |
| MarketPlace Loan Trust, Series 2015-AV-1, Class A, 4.00% 20213,7 | 7,514 | 7,454 |
| Mercedes-Benz Auto Receivables Trust, Series 2014-1, Class A3, 0.87% 20187 | 12,750 | 12,714 |
| Mississippi Higher Education Assistance Corp., Series 2014-1, Class A1, 1.102% 20356,7 | 4,750 | 4,606 |
| Navient Student Loan Trust, Series 2015-A, Class A-1, 0.831% 20213,6,7 | 3,493 | 3,486 |
| Navient Student Loan Trust, Series 2014-AA, Class A-1, 0.811% 20223,6,7 | 2,240 | 2,238 |
| Navient Student Loan Trust, Series 2015-2, Class A-3, 0.992% 20406,7 | 2,725 | 2,584 |
| New Residential Advance Receivables Trust, Series 2015-T-4, Class A-T-4, 3.1956% 20473,7 | 8,000 | 7,983 |
| Ocwen Master Advance Receivable Trust, Series 2015-1, Class AT-1, 2.5365% 20463,7 | 4,384 | 4,386 |
| Ocwen Master Advance Receivable Trust, Series 2015-T-3, Class AT-3, 3.211% 20473,7 | 6,000 | 5,989 |
| Onemain Financial Issuance Trust, Series 2015-2-A, Class A, 2.57% 20253,7 | 6,000 | 6,032 |
| RAMP Trust, Series 2003-RZ4, Class A-7, 4.79% 20336,7 | 249 | 258 |
| RAMP Trust, Series 2003-RS11, Class A-I-7, 4.828% 20337 | 801 | 828 |
| Residential Asset Securities Corp. Trust, Series 2003-KS8, Class A-I-6, 4.83% 20337 | 426 | 442 |
| Santander Drive Auto Receivables Trust, Series 2012-4, Class C, 2.94% 20177 | 1,751 | 1,759 |
| Santander Drive Auto Receivables Trust, Series 2014-5, Class A-2, 0.72% 20187 | 3,283 | 3,279 |
| Santander Drive Auto Receivables Trust, Series 2014-3, Class A3, 0.81% 20187 | 13,145 | 13,133 |
| Santander Drive Auto Receivables Trust, Series 2014-4, Class A3, 1.08% 20187 | 12,975 | 12,969 |
| Santander Drive Auto Receivables Trust, Series 2013-3, Class B, 1.19% 20187 | 10,329 | 10,326 |
| Santander Drive Auto Receivables Trust, Series 2014-1, Class B, 1.59% 20187 | 8,155 | 8,153 |
| Santander Drive Auto Receivables Trust, Series 2012-6, Class C, 1.94% 20187 | 15,406 | 15,428 |
| Santander Drive Auto Receivables Trust, Series 2012-3, Class C, 3.01% 20187 | 428 | 430 |
| Santander Drive Auto Receivables Trust, Series 2012-2, Class C, 3.20% 20187 | 221 | 221 |
| Santander Drive Auto Receivables Trust, Series 2014-5, Class A-3, 1.15% 20197 | 15,175 | 15,153 |
| Santander Drive Auto Receivables Trust, Series 2013-3, Class C, 1.81% 20197 | 9,425 | 9,417 |
| Santander Drive Auto Receivables Trust, Series 2014-4, Class B, 1.82% 20197 | 7,255 | 7,263 |
| Santander Drive Auto Receivables Trust, Series 2013-2, Class C, 1.95% 20197 | 9,489 | 9,509 |
| Santander Drive Auto Receivables Trust, Series 2014-2, Class C, 2.33% 20197 | 5,000 | 5,009 |
| Santander Drive Auto Receivables Trust, Series 2013-A, Class C, 3.12% 20193,7 | 1,040 | 1,052 |
| Santander Drive Auto Receivables Trust, Series 2015-5, Class B, 1.96% 20207 | 4,500 | 4,463 |
| Santander Drive Auto Receivables Trust, Series 2014-1, Class C, 2.36% 20207 | 11,496 | 11,517 |
| Santander Drive Auto Receivables Trust, Series 2013-4, Class C, 3.25% 20207 | 1,275 | 1,291 |
| Santander Drive Auto Receivables Trust, Series 2015-2, Class C, 2.44% 20217 | 15,310 | 15,154 |
| Santander Drive Auto Receivables Trust, Series 2015-5, Class C, 2.74% 20217 | 17,985 | 17,852 |
| Santander Drive Auto Receivables Trust, Series 2015-3, Class C, 2.74% 20217 | 125 | 124 |
American Balanced Fund — Page 26 of 30
Bonds, notes & other debt instruments
Asset-backed obligations (continued) | Principal amount
(000) | Value
(000) |
| Santander Drive Auto Receivables Trust, Series 2015-4, Class C, 2.97% 20217 | $7,100 | $7,095 |
| SLM Private Credit Student Loan Trust, Series 2008-1, Class A-3, 0.82% 20176,7 | 4,041 | 4,037 |
| SLM Private Credit Student Loan Trust, Series 2014-A, Class A-1, 0.931% 20223,6,7 | 2,562 | 2,557 |
| SMB Private Education Loan Trust, Series 2015-A, Class A-2-A, 2.49% 20273,7 | 2,100 | 2,052 |
| Social Professional Loan Program LLC, Series 2015-C, Class A-1, 1.47% 20353,6,7 | 7,598 | 7,449 |
| Social Professional Loan Program LLC, Series 2015-D, Class A-2, 2.72% 20363,7 | 27,000 | 26,920 |
| Solarcity LMC Series LLC, Series 2015-1, Class A, 4.18% 20452,3,7 | 7,413 | 7,092 |
| South Carolina Student Loan Corp., Series 2014-1, Class A1, 0.994% 20306,7 | 4,550 | 4,410 |
| South Carolina Student Loan Corp., Series 2014-1, Class A2, 1.244% 20336,7 | 12,240 | 11,775 |
| South Carolina Student Loan Corp., Series 2014-1, Class B, 1.744% 20356,7 | 3,350 | 2,980 |
| SpringCastle America Funding LLC, Series 2014-AA, Class A, 2.70% 20233,7 | 5,120 | 5,111 |
| Toyota Auto Receivables Owner Trust, Series 2014-B, Class A3, 0.76% 20187 | 4,850 | 4,844 |
| Trade Maps Ltd., 2013-1-A-A, 0.993% 20183,6,7 | 12,320 | 12,245 |
| Trade Maps Ltd., 2013-1-A-B, 1.543% 20183,6,7 | 2,220 | 2,189 |
| USAA Auto Owner Trust, Series 2014-1, Class A-3, 0.58% 20177 | 4,544 | 4,542 |
| Utility Debt Securitization Auth., Series 2013-T, 2.042% 20217 | 3,510 | 3,515 |
| Utility Debt Securitization Auth., Series 2013-T, 3.435% 20257 | 2,625 | 2,723 |
| Volkswagen Auto Loan Enhanced Trust, Series 2014-2, Class A-3 0.95% 20197 | 37,000 | 36,469 |
| Westlake Automobile Receivables Trust, Series 2015-1-A, Class A-2, 1.17% 20183,7 | 4,011 | 4,002 |
| World Financial Network Credit Card Master Note Trust, Series 2015-A, Class A, 0.811% 20226,7 | 2,625 | 2,611 |
| World Omni Auto Receivables Trust, Series 2014-B, Class A-3, 1.14% 20207 | 8,990 | 8,956 |
| | | 1,294,326 |
| Federal agency bonds & notes 1.17% | | |
| CoBank, ACB 1.112% 20223,6 | 25,105 | 23,787 |
| Export-Import Bank of the United States-Guaranteed, Ethiopian Leasing 2012 LLC 2.646% 20267 | 6,221 | 6,256 |
| Export-Import Bank of the United States-Guaranteed, VCK Lease SA 2.591% 20267 | 3,639 | 3,660 |
| Fannie Mae 0.375% 2016 | 64,125 | 64,021 |
| Fannie Mae 0.50% 2016 | 94,090 | 94,089 |
| Fannie Mae 0.625% 2016 | 62,975 | 62,935 |
| Fannie Mae 2.625% 2024 | 73,995 | 74,836 |
| Fannie Mae 6.25% 2029 | 4,000 | 5,414 |
| Federal Farm Credit Banks 0.401% 20176 | 31,250 | 31,250 |
| Federal Farm Credit Banks 0.477% 20176 | 23,143 | 23,130 |
| Federal Home Loan Bank 0.375% 2016 | 21,230 | 21,217 |
| Federal Home Loan Bank 0.50% 2016 | 35,895 | 35,862 |
| Federal Home Loan Bank 2.125% 2016 | 61,140 | 61,528 |
| Federal Home Loan Bank 1.875% 2020 | 25,660 | 25,864 |
| Federal Home Loan Bank 3.375% 2023 | 16,840 | 18,111 |
| Federal Home Loan Bank 5.50% 2036 | 600 | 782 |
| Freddie Mac 0.50% 2016 | 114,105 | 114,048 |
| Freddie Mac 2.50% 2016 | 83,400 | 84,026 |
| Freddie Mac 0.75% 2018 | 132,200 | 131,088 |
| Freddie Mac 2.375% 2022 | 27,000 | 27,390 |
| Japan Finance Organization for Municipalities 2.125% 20193 | 10,000 | 10,061 |
| Private Export Funding Corp. 2.80% 2022 | 3,125 | 3,237 |
| Private Export Funding Corp. 3.55% 2024 | 25,897 | 27,870 |
| Tennessee Valley Authority, Series B, 3.50% 2042 | 14,750 | 13,682 |
| U.S. Department of Housing and Urban Development, Series 2015-A-16, 3.50% 2030 | 3,750 | 3,757 |
| United States Agency for International Development, Jordan (Kingdom of) 2.503% 2020 | 5,800 | 5,988 |
| United States Agency for International Development, Jordan (Kingdom of) 3.00% 2025 | 3,000 | 3,029 |
| United States Agency for International Development, Ukraine, 1.844% 2019 | 8,665 | 8,725 |
United States Government-Guaranteed Certificates of Participation,
Overseas Private Investment Corp, 3.49% 20297 | 802 | 824 |
American Balanced Fund — Page 27 of 30
Bonds, notes & other debt instruments
Federal agency bonds & notes (continued) | Principal amount
(000) | Value
(000) |
United States Government-Guaranteed Certificates of Participation,
Overseas Private Investment Corp, 3.82% 20327 | $4,164 | $4,406 |
United States Government-Guaranteed Certificates of Participation,
Overseas Private Investment Corp, 2.94% 20337 | 1,500 | 1,470 |
| | | 992,343 |
| Bonds & notes of governments & government agencies outside the U.S. 0.26% | | |
| Caisse d’Amortissement de la Dette Sociale 1.125% 20173 | 9,205 | 9,213 |
| Caisse d’Amortissement de la Dette Sociale 3.375% 20243 | 10,000 | 10,608 |
| Europe Government Agency-Guaranteed, Dexia Credit Local 1.25% 20163 | 2,300 | 2,304 |
| FMS Wertmanagement 1.625% 2018 | 5,000 | 5,018 |
| Instituto de Credito Oficial 1.125% 20163 | 9,000 | 8,997 |
| Inter-American Development Bank 4.375% 2044 | 1,800 | 2,126 |
| International Bank for Reconstruction and Development 8.25% 2016 | 1,050 | 1,101 |
| Israeli Government 3.15% 2023 | 35,000 | 35,724 |
| Landwirtschaftliche Rentenbank 1.75% 2019 | 8,880 | 8,915 |
| Province of Manitoba 3.05% 2024 | 13,500 | 13,695 |
| Province of Ontario 3.20% 2024 | 10,000 | 10,289 |
| Spanish Government 4.00% 20183 | 54,950 | 57,430 |
| Swedish Export Credit Corp. 2.875% 20233 | 3,000 | 2,974 |
| United Mexican States Government Global 3.60% 2025 | 32,600 | 31,850 |
| United Mexican States Government Global 5.55% 2045 | 15,000 | 15,431 |
| | | 215,675 |
| Municipals 0.15% | | |
State of California, Infrastructure and Econ. Dev. Bank, Rev. Ref. Bonds (J. Paul Getty Trust),
Series 2011-A-2, 0.29% 2038 (put 2017)6 | 2,400 | 2,398 |
| State of California, Los Angeles Community College Dist. (County of Los Angeles), G.O. Build America Bonds, 2008 Election, Series 2010-E, 6.60% 2042 | 15,000 | 20,560 |
| State of California, Regents of the University of California, General Rev. Bonds, Series 2014-AN, 4.765% 2044 | 2,250 | 2,293 |
State of Connecticut, Housing Fin. Auth., Housing Mortgage Fin. Program Bonds,
Series 2014-A-1, 4.00% 2044 | 1,880 | 2,004 |
State of Connecticut, Housing Fin. Auth., Housing Mortgage Fin. Program Bonds,
Series 2014-C-1, 4.00% 2044 | 2,345 | 2,526 |
State of Connecticut, Housing Fin. Auth., Housing Mortgage Fin. Program Rev. Ref. Bonds,
Series 2013-B-2, 4.00% 2032 | 1,725 | 1,829 |
| State of Florida, Housing Fin. Corp., Homeowner Mortgage Rev. Bonds, Series 2011-C, 4.50% 2030 | 235 | 248 |
| State of Florida, Hurricane Catastrophe Fund Fin. Corp., Rev. Bonds, Series 2013-A, 2.995% 2020 | 4,000 | 4,060 |
| State of Georgia, Housing and Fin. Auth., Single-family Mortgage Bonds, Series 2013-A, 3.00% 2043 | 290 | 294 |
| State of Illinois, Housing Dev. Auth., Housing Rev. Bonds, Series 2013-A, 2.45% 20437 | 1,154 | 1,108 |
State of Iowa, Fin. Auth., Single-family Mortgage Bonds (Mortgage-backed Securities Program),
Series 2013-1, 2.15% 20437 | 767 | 709 |
| State of Kentucky, Housing Corp., Housing Rev. Bonds, Series 2013-D, 3.50% 2033 | 1,310 | 1,373 |
| State of Maine, Housing Auth., Mortgage Purchase Rev. Ref. Bonds, Series 2014-A-1, AMT, 3.25% 2043 | 855 | 876 |
| State of Maine, Housing Auth., Mortgage Purchase Rev. Ref. Bonds, Series 2014-C-1, AMT, 3.50% 2044 | 870 | 924 |
| State of Maryland, Community Dev. Administration, Dept. of Housing and Community Dev., Residential Rev. Bonds, Series 2014-B, AMT, 3.25% 2044 | 3,825 | 4,008 |
| State of Maryland, Community Dev. Administration, Dept. of Housing and Community Dev., Residential Rev. Ref. Bonds, Series 2014-E, 2.857% 2040 | 3,590 | 3,562 |
| State of Massachusetts, Housing Fin. Agcy., Single-family Housing Rev. Bonds, Series 167, 4.00% 2043 | 600 | 636 |
| State of Michigan, City of Detroit, Sewage Disposal System Rev. Ref. Bonds, Series 2006-D, Assured Guaranty Municipal insured, 0.818% 20326 | 5,000 | 4,515 |
| State of Minnesota, Housing Fin. Agcy., Homeownership Fin. Bonds (GNMA and FNMA Pass-Through Program), Series 2012-B, 2.25% 20427 | 1,257 | 1,211 |
American Balanced Fund — Page 28 of 30
Bonds, notes & other debt instruments
Municipals (continued) | Principal amount
(000) | Value
(000) |
| State of Minnesota, Housing Fin. Agcy., Homeownership Fin. Bonds (GNMA and FNMA Pass-Through Program), Series 2013-A, 2.35% 20437 | $1,347 | $1,300 |
| State of Minnesota, Housing Fin. Agcy., Residential Housing Fin. Bonds, Series 2013-A, AMT, 3.00% 2031 | 320 | 325 |
| State of Minnesota, Housing Fin. Agcy., Residential Housing Fin. Bonds, Series 2014-B, 4.00% 2038 | 1,310 | 1,397 |
| State of Minnesota, Housing Fin. Agcy., Residential Housing Fin. Bonds, Series 2014-C, AMT, 4.00% 2045 | 9,465 | 10,113 |
| State of Mississippi, Home Corp., Single-family Mortgage Rev. Bonds, Series 2009-A-2, 5.00% 2039 | 395 | 424 |
| State of Missouri, Housing Dev. Commission, Single-family Mortgage Rev. Bonds (Special Homeownership Loan Program), Series 2014-A, 4.00% 2041 | 1,475 | 1,576 |
| State of Nebraska, Investment Fin. Auth., Single-family Housing Rev. Bonds, Series 2013-E, 3.00% 2043 | 325 | 330 |
| State of Nebraska, Investment Fin. Auth., Single-family Housing Rev. Bonds, Series 2013-E, 3.00% 2043 | 465 | 477 |
State of New Jersey, Transportation Trust Fund Auth., Transportation System Rev. Ref. Bonds,
Series 2013-B, 1.758% 2018 | 15,250 | 14,989 |
| State of New Mexico, Mortgage Fin. Auth., Single-family Mortgage Program Rev. Ref. Bonds, Series 2012-B-1, Class I, AMT, 3.75% 2043 | 670 | 691 |
| State of Oklahoma, Housing Fin. Agcy., Single-family Mortgage Rev. Bonds (Homeownership Loan Program), Series 2012-A, 5.00% 2043 | 870 | 945 |
| Territory of Puerto Rico, Electric Power Auth., Power Rev. Ref. Bonds, Series UU, Assured Guaranty Municipal insured, 0.738% 20296 | 10,200 | 7,357 |
Territory of Puerto Rico, Highways and Transportation Auth., Transportation Rev. Ref. Bonds, Series 2007-N,
Assured Guaranty insured, 5.25% 2034 | 1,140 | 1,149 |
Territory of Puerto Rico, Highways and Transportation Auth., Transportation Rev. Ref. Bonds, Series 2007-N,
Assured Guaranty insured, 5.25% 2036 | 2,700 | 2,708 |
| State of South Carolina, Housing Fin. Auth., Mortgage Rev. Ref. Bonds, AMT, 4.00% 2041 | 4,490 | 4,840 |
| State of South Dakota, Housing Dev. Auth., Homeownership Mortgage Bonds, Series 2014-F, 4.00% 2034 | 1,490 | 1,549 |
State of South Dakota, Housing Dev. Auth., Homeownership Mortgage Bonds,
Series 2013-E, AMT, 4.00% 2044 | 755 | 787 |
| State of Tennessee, Housing Dev. Agcy., Residential Fin. Program Bonds, Series 2013-2-A, AMT, 4.00% 2043 | 870 | 926 |
State of Washington, Energy Northwest, Columbia Generating Station Electric Rev. Bonds,
Series 2012-E, 2.197% 2019 | 14,500 | 14,601 |
| State of Washington, Housing Fin. Commission, Single-family Program Bonds, Series 2014-1-N, 3.00% 2037 | 660 | 677 |
| State of Washington, Housing Fin. Commission, Single-family Program Rev. Ref. Bonds, Series 2013-1-N, 3.00% 2043 | 215 | 220 |
| | | 122,515 |
| Miscellaneous 0.16% | | |
| Other bonds & notes in initial period of acquisition | | 137,093 |
| Total bonds, notes & other debt instruments (cost: $28,295,404,000) | | 28,234,030 |
| Short-term securities 6.90% | | |
| Abbott Laboratories 0.19% due 1/25/20163 | 45,000 | 44,993 |
| Apple Inc. 0.15%–0.20% due 1/11/2016–1/20/20163 | 79,100 | 79,091 |
| CAFCO, LLC 0.28% due 2/22/2016 | 25,000 | 24,991 |
| Caterpillar Financial Services Corp. 0.46% due 2/19/2016 | 50,000 | 49,973 |
| Chevron Corp. 0.25% due 2/5/20163 | 20,000 | 19,993 |
| Ciesco LLC 0.50% due 5/3/2016 | 75,000 | 74,886 |
| Fannie Mae 0.17%–0.33% due 1/4/2016–4/27/2016 | 553,306 | 553,034 |
| Federal Farm Credit Banks 0.22%–0.40% due 2/11/2016–7/1/2016 | 127,500 | 127,350 |
| Federal Home Loan Bank 0.10%–0.57% due 1/8/2016–6/27/2016 | 3,371,299 | 3,369,366 |
| Freddie Mac 0.15%–0.51% due 1/4/2016–5/18/2016 | 648,800 | 648,488 |
| GE Capital Treasury Services (U.S.) LLC 0.43% due 2/17/2016 | 50,000 | 49,976 |
| Intel Corp. 0.40% due 2/25/2016 | 66,100 | 66,061 |
| John Deere Financial Ltd. 0.19% due 1/21/20163 | 24,000 | 23,996 |
| Pfizer Inc 0.18%–0.31% due 1/7/2016–2/22/20163 | 100,000 | 99,975 |
American Balanced Fund — Page 29 of 30
| Short-term securities | Principal amount
(000) | Value
(000) |
| Qualcomm Inc. 0.18% due 1/6/20163 | $60,000 | $59,997 |
| Regents of the University of California 0.18% due 1/25/2016 | 50,000 | 49,992 |
| U.S. Treasury Bills 0.19%–0.55% due 3/17/2016–6/9/2016 | 390,000 | 389,658 |
| Walt Disney Co. 0.19% due 1/13/20163 | 30,000 | 29,998 |
| Wells Fargo Bank, N.A. 0.48% due 5/4/2016–5/16/2016 | 75,000 | 75,051 |
| Total short-term securities (cost: $5,836,376,000) | | 5,836,869 |
| Total investment securities 101.01% (cost: $67,873,104,000) | | 85,423,398 |
| Other assets less liabilities (1.01)% | | (852,197) |
| Net assets 100.00% | | $84,571,201 |
As permitted by U.S. Securities and Exchange Commission regulations, “Miscellaneous” securities include holdings in their first year of acquisition that have not previously been publicly disclosed.
| 1 | Security did not produce income during the last 12 months. |
| 2 | Valued under fair value procedures adopted by authority of the board of trustees. The total value of all such securities, including those in “Miscellaneous,“ was $819,807,000, which represented .97% of the net assets of the fund. This amount includes $749,293,000 related to certain securities trading outside the U.S. whose values were adjusted as a result of significant market movements following the close of local trading. |
| 3 | Acquired in a transaction exempt from registration under Rule 144A or Section 4(2) of the Securities Act of 1933. May be resold in the U.S. in transactions exempt from registration, normally to qualified institutional buyers. The total value of all such securities was $3,292,096,000, which represented 3.89% of the net assets of the fund. |
| 4 | A portion of this security was pledged as collateral. The total value of pledged collateral was $1,482,000, which represented less than .01% of the net assets of the fund. |
| 5 | Index-linked bond whose principal amount moves with a government price index. |
| 6 | Coupon rate may change periodically. |
| 7 | Principal payments may be made periodically. Therefore, the effective maturity date may be earlier than the stated maturity date. |
| 8 | Purchased on a TBA basis. |
| Key to abbreviations |
| ADR = American Depositary Receipts |
| TBA = To-be-announced |
| Agcy. = Agency |
| AMT = Alternative Minimum Tax |
| Auth. = Authority |
| Dept. = Department |
| Dev. = Development |
| Dist. = District |
| Econ. = Economic |
| Fin. = Finance |
| G.O. = General Obligation |
| Ref. = Refunding |
| Rev. = Revenue |
Investments are not FDIC-insured, nor are they deposits of or guaranteed by a bank or any other entity, so they may lose value.
Investors should carefully consider investment objectives, risks, charges and expenses. This and other important information is contained in the fund prospectus and summary prospectus, which can be obtained from your financial professional and should be read carefully before investing. You may also call American Funds Service Company (AFS) at (800) 421-4225 or visit the American Funds website at americanfunds.com.
| MFGEFPX-011-0216O-S49184 | American Balanced Fund — Page 30 of 30 |
REPORT OF INDEPENDENT REGISTERED PUBLIC ACCOUNTING FIRM
To the Shareholders and Board of Trustees of
American Balanced Fund:
We have audited the accompanying statement of assets and liabilities of American Balanced Fund (the “Fund”), including the summary schedule of investments, as of December 31, 2015, and the related statements of operations for the year then ended, the statements of changes in net assets for each of the two years in the period then ended (collectively, the “financial statements”), the financial highlights for each of the five years in the period then ended (the financial statements and financial highlights are included in Item 1 of this Form N-CSR), and the schedule of investments in securities as of December 31, 2015 (included in Item 6 of this Form N-CSR). These financial statements, financial highlights, and schedule of investments in securities are the responsibility of the Fund’s management. Our responsibility is to express an opinion on these financial statements, financial highlights, and schedule of investments in securities based on our audits.
We conducted our audits in accordance with the standards of the Public Company Accounting Oversight Board (United States). Those standards require that we plan and perform the audit to obtain reasonable assurance about whether the financial statements, financial highlights, and schedule of investments in securities are free of material misstatement. An audit includes examining, on a test basis, evidence supporting the amounts and disclosures in the financial statements and schedule of investments in securities, assessing the accounting principles used and significant estimates made by management, as well as evaluating the overall financial statement presentation. Our procedures included confirmation of securities owned as of December 31, 2015, by correspondence with the custodian and brokers; where replies were not received from brokers, we performed other auditing procedures. We believe that our audits provide a reasonable basis for our opinion.
In our opinion, the financial statements, financial highlights, and schedule of investments in securities referred to above present fairly, in all material respects, the financial position of American Balanced Fund as of December 31, 2015, and the results of its operations for the year then ended, the changes in its net assets for each of the two years in the period then ended, and the financial highlights for each of the five years in the period then ended, in conformity with accounting principles generally accepted in the United States of America.
DELOITTE & TOUCHE LLP
Costa Mesa, California
February 11, 2016
ITEM 7 – Disclosure of Proxy Voting Policies and Procedures for Closed-End Management Investment Companies
Not applicable to this Registrant, insofar as the Registrant is not a closed-end management investment company.
ITEM 8 – Portfolio Managers of Closed-End Management Investment Companies
Not applicable to this Registrant, insofar as the Registrant is not a closed-end management investment company.
ITEM 9 – Purchases of Equity Securities by Closed-End Management Investment Company and Affiliated Purchasers
Not applicable to this Registrant, insofar as the Registrant is not a closed-end management investment company.
ITEM 10 – Submission of Matters to a Vote of Security Holders
There have been no material changes to the procedures by which shareholders may recommend nominees to the Registrant’s board of trustees since the Registrant last submitted a proxy statement to its shareholders. The procedures are as follows. The Registrant has a nominating and governance committee comprised solely of persons who are not considered ‘‘interested persons’’ of the Registrant within the meaning of the Investment Company Act of 1940, as amended. The committee periodically reviews such issues as the board’s composition, responsibilities, committees, compensation and other relevant issues, and recommends any appropriate changes to the full board of trustees. While the committee normally is able to identify from its own resources an ample number of qualified candidates, it will consider shareholder suggestions of persons to be considered as nominees to fill future vacancies on the board. Such suggestions must be sent in writing to the nominating and governance committee of the Registrant, c/o the Registrant’s Secretary, and must be accompanied by complete biographical and occupational data on the prospective nominee, along with a written consent of the prospective nominee for consideration of his or her name by the nominating and governance committee.
ITEM 11 – Controls and Procedures
| (a) | The Registrant’s Principal Executive Officer and Principal Financial Officer have concluded, based on their evaluation of the Registrant’s disclosure controls and procedures (as such term is defined in Rule 30a-3 under the Investment Company Act of 1940), that such controls and procedures are adequate and reasonably designed to achieve the purposes described in paragraph (c) of such rule. |
| | |
| (b) | There were no changes in the Registrant’s internal controls over financial reporting (as defined in Rule 30a-3(d) under the Investment Company Act of 1940) that occurred during the Registrant’s second fiscal quarter of the period covered by this report that has materially affected, or is reasonably likely to materially affect, the Registrant’s internal control over financial reporting. |
ITEM 12 – Exhibits
| (a)(1) | The Code of Ethics that is the subject of the disclosure required by Item 2 is attached as an exhibit hereto. |
| | |
| (a)(2) | The certifications required by Rule 30a-2 of the Investment Company Act of 1940 and Sections 302 and 906 of the Sarbanes-Oxley Act of 2002 are attached as exhibits hereto. |
SIGNATURES
Pursuant to the requirements of the Securities Exchange Act of 1934 and the Investment Company Act of 1940, the Registrant has duly caused this report to be signed on its behalf by the undersigned, thereunto duly authorized.
| | AMERICAN BALANCED FUND |
| | |
| | By /s/ Gregory D. Johnson |
| | Gregory D. Johnson, Vice Chairman, President and Principal Executive Officer |
| | |
| | Date: February 29, 2016 |
Pursuant to the requirements of the Securities Exchange Act of 1934 and the Investment Company Act of 1940, this report has been signed below by the following persons on behalf of the Registrant and in the capacities and on the dates indicated.
| By /s/ Gregory D. Johnson |
| Gregory D. Johnson, Vice Chairman, President and Principal Executive Officer |
| |
| Date: February 29, 2016 |
| By /s/ Jeffrey P. Regal |
Jeffrey P. Regal, Treasurer and Principal Financial Officer |
| |
| Date: February 29, 2016 |
