UNITED STATES
SECURITIES AND EXCHANGE COMMISSION
Washington, D.C. 20549
FORM N-CSR
Certified Shareholder Report of
Registered Management Investment Companies
Investment Company Act File Number: 811-00066
American Balanced Fund
(Exact Name of Registrant as Specified in Charter)
One Market, Steuart Tower
Suite 2000
San Francisco, California 94105
(Address of Principal Executive Offices)
Registrant's telephone number, including area code: (415) 421-9360
Date of fiscal year end: December 31
Date of reporting period: December 31, 2013
Patrick F. Quan
American Balanced Fund
One Market, Steuart Tower
Suite 2000
San Francisco, California 94105
(Name and Address of Agent for Service)
Copies to:
Michael Glazer
Bingham McCutchen LLP
355 South Grand Avenue, Suite 4400
Los Angeles, California 90071
(Counsel for the Registrant)
ITEM 1 – Reports to Stockholders

Invest in a balanced
fund for growth potential
with lower volatility.
Special feature page 6
 | | American Balanced Fund®
Annual report
for the year ended
December 31, 2013 |
American Balanced Fund seeks conservation of capital, current income, and long-term growth of both capital and income.
This fund is one of more than 40 offered by one of the nation’s largest mutual fund families, American Funds, from Capital Group. For more than 80 years, Capital has invested with a long-term focus based on thorough research and attention to risk.
Fund results shown in this report, unless otherwise indicated, are for Class A shares at net asset value. If a sales charge (maximum 5.75%) had been deducted, the results would have been lower. Results are for past periods and are not predictive of results for future periods. Current and future results may be lower or higher than those shown. Share prices and returns will vary, so investors may lose money. Investing for short periods makes losses more likely. Investments are not FDIC-insured, nor are they deposits of or guaranteed by a bank or any other entity, so they may lose value. For current information and month-end results, visit americanfunds.com.
See page 4 for Class A share results with relevant sales charges deducted. For other share class results, visit americanfunds.com and americanfundsretirement.com.
Investment results assume all distributions are reinvested and reflect applicable fees and expenses. When applicable, investment results reflect fee waivers, without which results would have been lower. Visit americanfunds.com for more information.
The fund’s 30-day yield for Class A shares as of January 31, 2014, calculated in accordance with the U.S. Securities and Exchange Commission (SEC) formula, was 1.53%. The fund’s 12-month distribution rate for Class A shares as of that date was 1.50%. Both reflect the 5.75% maximum sales charge. The SEC yield reflects the rate at which the fund is earning income on its current portfolio of securities while the distribution rate reflects the fund’s past dividends paid to shareholders. Accordingly, the fund’s SEC yield and distribution rate may differ.
The return of principal for bond funds and for funds with significant underlying bond holdings is not guaranteed. Fund shares are subject to the same interest rate, inflation and credit risks associated with the underlying bond holdings. Refer to the fund prospectus and the Risk Factors section of this report for more information on these and other risks associated with investing in the fund.

Special feature
Fellow investors:
The U.S. stock market posted strong gains for the fiscal year ended December 31, 2013, reaching new all-time highs as investors were encouraged by the domestic economy’s gradual improvement and a continuation of high corporate profits overall. However, some concerns remained at year-end about the pace of economic growth, the relatively high unemployment rate and the direction of fiscal and monetary policy. Equities, as measured by the unmanaged Standard & Poor’s 500 Composite Index, gained 32.4% during the year. U.S. investment-grade fixed-income securities, as measured by the unmanaged Barclays U.S. Aggregate Index, fell 2.0% amid concerns about the impending reduction of monetary stimulus by the Federal Reserve.
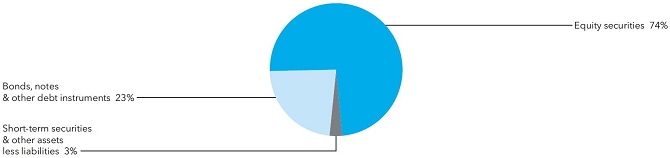
In a period that favored equities over fixed income, American Balanced Fund gained 21.7%, exceeding the 16.4% return of the Lipper Balanced Funds Index, a measure of the fund’s peer group. The percentage of the fund invested in equities was relatively high compared with its historical average allocation of 65% in stocks and 35% in bonds and cash. As of December 31, 2013, the portfolio held 74% in stocks and 26% in bonds and cash — reflecting the portfolio managers’ decision to invest more heavily than usual in equity markets.
American Balanced Fund also has outpaced its peers over longer time periods. For the five years ended December 31, the fund posted an average annual total return of 14.6%, exceeding the 12.6% return of the Lipper Balanced Funds Index. For the 10-year period, the fund’s average annual total return of 7.0% outpaced the 6.2% of the Lipper index. Over the 38 years that Capital Research and Management Company has been its investment adviser, the fund realized an average annual total return of 11.0%, compared with 10.1% for the Lipper index.
Market review
A late-year rally in the stock market helped fuel the largest annual gains since the 1990s as the U.S. economy continued to grow, with third-quarter GDP revised sharply upward to 4.1%. The housing market solidified its recovery as prices continued to rise amid low inventories, despite the headwind of rising mortgage rates. Housing starts hit their highest level in nearly six years in November, signaling continued growth for the sector. Furthermore, the national unemployment rate fell to 7%, down from 7.8% a year previous.
The U.S. bond market declined for the first time since 1999 as improving economic data and waning support for central bank stimulus pushed interest rates higher. The yield on the benchmark 10-year Treasury note rose more than 100 basis points to just above 3% — its highest level since July 2011. Much of that increase occurred from May to September when the Fed repeatedly signaled its intention to reduce its asset-purchase program. U.S. investment-grade corporate bonds (rated BBB/Baa and above) fell 1.5% amid the ongoing interest-rate risk.

Portfolio highlights
Not only did the fund benefit from the portfolio managers’ decision to increase its exposure to equities, but their selection of equities within that part of the portfolio further bolstered returns. Investments in the industrials and consumer discretionary sectors made the strongest contributions to the fund’s results during the year. Shares of aerospace company Boeing (the fifth-largest holding) continued to recover from battery problems with its new Dreamliner planes and uncertainty about government spending cuts. Boeing is benefiting significantly from increased demand among airlines for more fuel-efficient planes and the ongoing increase in air traffic. Meanwhile, the fund’s largest equity holding, online retailer Amazon, reported continued growth in the number of retail users as well as in its cloud-computing services business, which is becoming an increasingly valuable part of the company. For more on how the investment analysts who cover these and other companies conduct their research and collaborate with the fund’s portfolio managers, please see the special feature starting on page 6.
Among other top 10 holdings in the fund, American Express gained nearly 60% as the financial services company showed an increase in card-member spending across regions and strong expense control. Texas Instruments, whose shares rose more than 40%, continued to benefit from the chip maker’s decision to phase out its digital business and focus more on the analog market, reducing its capital expenditures significantly and expanding operating margins. But shares of Philip Morris International lagged the market as the cigarette company reduced its earnings outlook for the first time since going public in 2008, primarily as a result of weakening demand in Europe and Asia. However, we remain optimistic about both the underlying business prospects at Philip Morris and our investment in the company.
While fixed-income investments lagged equities over the year, high-quality bonds retained an important role within the portfolio, helping to provide income and mitigate volatility. The short duration of the fund’s fixed-income holdings was helpful in an environment of rising yields. Within the holdings of investment-grade securities, the portfolio managers retained a preference for corporate bonds over mortgage bonds; this positioning added value over the year. However, investments in U.S. Treasuries detracted.
Fixed-income investing remains an important part of our balanced approach and the fund’s bond portfolio holds a broad spectrum of high-quality investments. We will continue to follow the prudent, research-driven approach to investing that has characterized American Balanced Fund throughout its extensive history. We would also like to thank all of our new and long-time investors for their support.
Cordially,

Gregory D. Johnson
Vice Chairman of the Board and President
February 10, 2014
For current information about the fund, visit americanfunds.com.
History of American Balanced Fund
A historical view of the comparative total returns of stocks, bonds, the 60%/40% S&P/BC Index, the Lipper Balanced Funds Index and AMBAL.
Stocks, bonds and balance (July 26, 1975, to December 31, 2013)
Total
returns (through December 31) | | U.S.
stocks | | U.S.
bonds | | 60%/40%
S&P/BC Index | | Lipper
Balanced
Funds Index | | American
Balanced
Fund |
| | | | | | | | | | | |
| 1975 (from July 26) | | | 3.1 | % | | | 5.6 | % | | | 4.2 | % | | | 3.4 | % | | | 5.6 | % |
| 1976 | | | 23.9 | | | | 15.6 | | | | 20.7 | | | | 26.0 | | | | 26.0 | |
| 1977 | | | -7.2 | | | | 3.0 | | | | -3.1 | | | | -0.7 | | | | 0.7 | |
| 1978 | | | 6.6 | | | | 1.4 | | | | 4.7 | | | | 4.8 | | | | 6.2 | |
| 1979 | | | 18.6 | | | | 1.9 | | | | 11.8 | | | | 14.7 | | | | 7.6 | |
| 1980 | | | 32.5 | | | | 2.7 | | | | 20.4 | | | | 19.7 | | | | 14.4 | |
| 1981 | | | -4.9 | | | | 6.2 | | | | -0.5 | | | | 1.9 | | | | 4.4 | |
| 1982 | | | 21.5 | | | | 32.6 | | | | 26.2 | | | | 30.6 | | | | 29.4 | |
| 1983 | | | 22.6 | | | | 8.4 | | | | 16.8 | | | | 17.4 | | | | 16.1 | |
| 1984 | | | 6.3 | | | | 15.1 | | | | 10.0 | | | | 7.5 | | | | 9.4 | |
| 1985 | | | 31.7 | | | | 22.1 | | | | 27.9 | | | | 29.8 | | | | 29.1 | |
| 1986 | | | 18.7 | | | | 15.3 | | | | 17.6 | | | | 18.4 | | | | 16.9 | |
| 1987 | | | 5.3 | | | | 2.8 | | | | 5.6 | | | | 4.1 | | | | 4.0 | |
| 1988 | | | 16.6 | | | | 7.9 | | | | 13.1 | | | | 11.2 | | | | 12.9 | |
| 1989 | | | 31.6 | | | | 14.5 | | | | 24.7 | | | | 19.7 | | | | 21.5 | |
| 1990 | | | -3.1 | | | | 9.0 | | | | 1.8 | | | | 0.7 | | | | -1.6 | |
| 1991 | | | 30.4 | | | | 16.0 | | | | 24.7 | | | | 25.8 | | | | 24.7 | |
| 1992 | | | 7.6 | | | | 7.4 | | | | 7.6 | | | | 7.5 | | | | 9.5 | |
| 1993 | | | 10.1 | | | | 9.7 | | | | 10.0 | | | | 12.0 | | | �� | 11.3 | |
| 1994 | | | 1.3 | | | | -2.9 | | | | -0.3 | | | | -2.0 | | | | 0.3 | |
| 1995 | | | 37.5 | | | | 18.5 | | | | 29.6 | | | | 24.9 | | | | 27.1 | |
| 1996 | | | 22.9 | | | | 3.6 | | | | 15.0 | | | | 13.1 | | | | 13.2 | |
| 1997 | | | 33.4 | | | | 9.7 | | | | 23.6 | | | | 20.3 | | | | 21.0 | |
| 1998 | | | 28.6 | | | | 8.7 | | | | 21.0 | | | | 15.1 | | | | 11.1 | |
| 1999 | | | 21.0 | | | | -0.8 | | | | 12.0 | | | | 9.0 | | | | 3.5 | |
| 2000 | | | -9.1 | | | | 11.6 | | | | -1.0 | | | | 2.4 | | | | 15.9 | |
| 2001 | | | -11.9 | | | | 8.4 | | | | -3.7 | | | | -3.2 | | | | 8.2 | |
| 2002 | | | -22.1 | | | | 10.3 | | | | -9.8 | | | | -10.7 | | | | -6.3 | |
| 2003 | | | 28.7 | | | | 4.1 | | | | 18.5 | | | | 19.9 | | | | 22.8 | |
| 2004 | | | 10.9 | | | | 4.3 | | | | 8.3 | | | | 9.0 | | | | 8.9 | |
| 2005 | | | 4.9 | | | | 2.4 | | | | 4.0 | | | | 5.2 | | | | 3.1 | |
| 2006 | | | 15.8 | | | | 4.3 | | | | 11.1 | | | | 11.6 | | | | 11.8 | |
| 2007 | | | 5.5 | | | | 7.0 | | | | 6.2 | | | | 6.5 | | | | 6.6 | |
| 2008 | | | -37.0 | | | | 5.2 | | | | -22.1 | | | | -26.2 | | | | -25.7 | |
| 2009 | | | 26.5 | | | | 5.9 | | | | 18.4 | | | | 23.4 | | | | 21.1 | |
| 2010 | | | 15.1 | | | | 6.5 | | | | 12.1 | | | | 11.9 | | | | 13.0 | |
| 2011 | | | 2.1 | | | | 7.8 | | | | 4.7 | | | | 0.7 | | | | 3.8 | |
| 2012 | | | 16.0 | | | | 4.2 | | | | 11.3 | | | | 11.9 | | | | 14.2 | |
| 2013 | | | 32.4 | | | | -2.0 | | | | 17.5 | | | | 16.4 | | | | 21.7 | |
| | | | | | | | | | | | | | | | | | | | | |
| Average annual total returns | | | 11.5 | % | | | 8.0 | % | | | 10.4 | % | | | 10.1 | % | | | 11.0 | % |
| Volatility | | | 15.1 | % | | | 5.5 | % | | | 9.8 | % | | | 10.2 | % | | | 9.8 | % |
Figures assume reinvestment of all distributions.
Sources: Stocks — S&P 500; Bonds — Barclays U.S. Aggregate Index. Barclays U.S. Aggregate Index represents the U.S. investment-grade fixed-rate bond market. For the period July 31, 1975, to December 31, 1975, Barclays Government/Credit Bond Index was used.
The 60%/40% S&P/BC Index blends the S&P 500 with the Barclays U.S. Aggregate Index by weighting their total returns at 60% and 40%, respectively. The portfolio is rebalanced monthly.
The market indexes are unmanaged and, therefore, have no expenses.
The Lipper Balanced Funds Index is an equally weighted index of the 30 largest U.S. balanced funds.
Capital Research and Management Company became the fund’s investment adviser on July 26, 1975.
Volatility is calculated using annualized standard deviation (based on monthly returns), a measure of how returns over time have varied from the mean; a lower number signifies lower volatility.
The value of a long-term perspective
Fund results shown are for Class A shares and reflect deduction of the maximum sales charge of 5.75% on the $10,000 investment.¹ Thus, the net amount invested was $9,425.² Results are for past periods and are not predictive of results for future periods. Current and future results may be lower or higher than those shown. Share prices and returns will vary, so investors may lose money. For current information and month-end results, visit americanfunds.com.
The results shown are before taxes on fund distributions and sale of fund shares.
| 1 | As outlined in the prospectus, the sales charge is reduced for accounts (and aggregated investments) of $25,000 or more and is eliminated for purchases of $1 million or more. There is no sales charge on dividends or capital gain distributions that are reinvested in additional shares. |
| 2 | The maximum initial sales charge was 8.5% prior to July 1, 1988. |
| 3 | The market indexes are unmanaged and, therefore, have no expenses. |
| 4 | Results of the Lipper Balanced Funds Index do not reflect any sales charges. |
| 5 | Barclays U.S. Aggregate Index represents the U.S. investment-grade fixed-rate bond market. For the period July 31, 1975, to December 1, 1975, Barclays Government/Credit Bond Index was used. |
| 6 | For the period July 26, 1975 (when Capital Research and Management Company became the fund’s investment adviser) through December 31, 1975. |
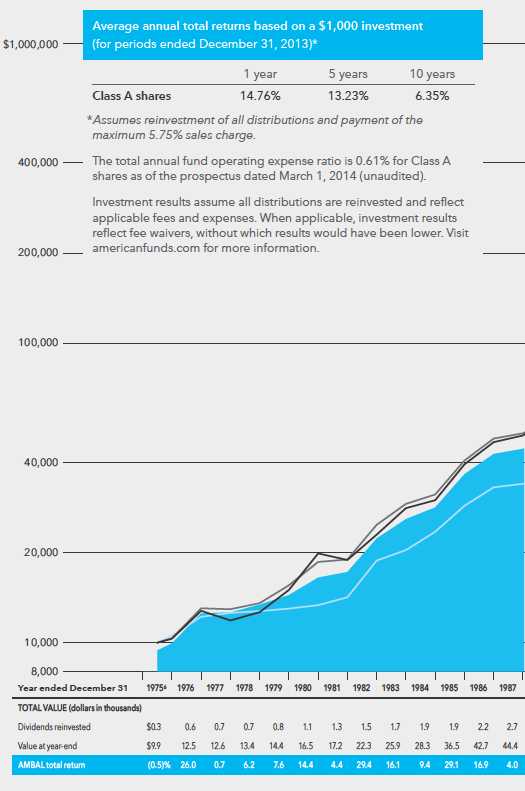
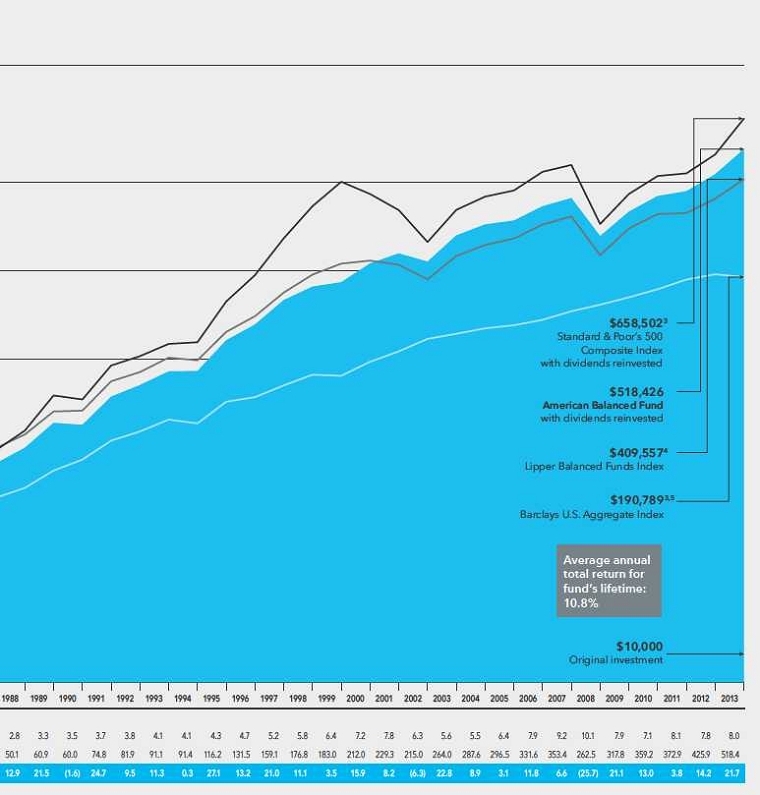
How a $10,000 investment has grown
This chart shows how a hypothetical $10,000 investment in American Balanced Fund grew from July 26, 1975 — when Capital Research and Management Company became the fund’s investment adviser — to December 31, 2013. As you can see, the investment grew to $518,426 with all distributions reinvested. The fund’s year-by-year results appear under the chart. You can use this table to estimate how the value of your own holdings has grown.
Building blocks of success:
Research and collaboration help
balance growth and stability.


Greg Johnson | | 
Rich Wolf |
We made a conscious decision to move more of the fund’s assets into equities over the past year or two and it has added a lot of value for our investors.
Greg Johnson, president and portfolio manager
As the U.S. economy continues to improve and the stock market hits new highs, investors have benefited from the strong returns of many mutual funds. American Balanced Fund (AMBAL) is no exception, but there is much more than meets the eye that goes into finding the best opportunities for the fund and generating solid, long-term returns for its investors.
Research is at the core of the fund’s success, and many of the ideas start with the analysts who cover various industries to find the best companies in which to invest. The analysts collaborate closely with each other as well as with the fund’s portfolio managers when making investment decisions. Analysts also can put their ideas to the test in the research portfolio, which made up approximately 17% of AMBAL’s equity assets at fiscal year-end.
Collaboration is also essential — among the investment analysts and portfolio managers as well as the equity and fixed-income managers. They are all in regular communication with each other about the fund’s holdings and how much of the portfolio should be split between stocks and bonds. In the current market environment, the fund is near its high of 75% invested in equities, providing the potential for higher returns with lower volatility through fixed-income investments.
“We made a conscious decision to move more of the fund’s assets into equities over the past year or two and it has added a lot of value for our investors,” says Greg Johnson, vice chairman and president of AMBAL, which historically has had closer to 65% invested in equities. “They are investing in a high-quality balanced fund where we make the asset allocation decision for them. We’ve done a good job of that this past year by reducing the allocation to bonds and increasing the investment in equities, where most of the opportunity has been.”
A closer look at the research portfolio
One of the keys to AMBAL’s success over the years has been the research portfolio, where analysts can invest in their strongest convictions. On average, the 22 or so analysts who contribute to the research portfolio hold about three companies each, so it consists of only their best investment ideas for the fund.
Analyst Rich Wolf, who coordinates the research portfolio when he is not covering the medical technology and real estate industries, says the small number of participants in the group makes for a more concentrated research portfolio compared to other funds. “The philosophical approach behind the research portfolio has been to invest in only the highest-conviction, blue-chip, growth-and-income companies,” says Rich. “We work hard to make sure it stays that way and that there is not too much deviation in how many companies analysts invest in. I monitor the turnover closely — we don’t want it to be too high but we also don’t want the research portfolio to become stale. I’m constantly probing and pushing the analysts to make sure their investments are the right size in the portfolio, which is especially important with AMBAL because it is so concentrated.”
While the decision of what companies analysts invest in is ultimately up to them, Rich follows what they are doing closely and tests their conviction along the way. Depending on how their holdings do and the strength of the analysts’ convictions, he may ask some of them to add to or trim certain positions to ensure the research portfolio remains an accurate representation of their best ideas. In many instances, Rich will have to facilitate transactions by making cash from the sale of one holding available to buy another one. The attitude among the analysts is very cooperative when it comes to doing what is best for the research portfolio, Rich says, leading to a more team-oriented approach within the group.
Two of the largest holdings in the research portfolio — and the fund as a whole — are Boeing and Chevron. Both companies have been sizeable holdings for quite some time, but the analysts who cover them each had to test their own convictions and make somewhat contrarian decisions to add to their positions at a time when many in the market had doubts about the immediate future of Boeing and Chevron.

Justin Toner | | 
Frank Hu |
The philosophical approach behind the research portfolio has been to invest in only the highest conviction, blue-chip, growth-and-income companies.
Rich Wolf, investment analyst
In the case of Boeing, the aerospace company was having problems with the batteries in its new Dreamliner airplanes and also dealing with the uncertainty of the government sequestration, or automatic spending cuts. As a result, shares of Boeing declined and analyst Justin Toner saw this as a buying opportunity to add to his position in the company. “I felt that there was too much pessimism in the market at the time,” recalls Justin. “Boeing had gone through so much in developing the Dreamliner that I knew the company would identify a solution to the battery problem and implement it. Sure enough, it did and the problem was resolved.”
Justin’s conviction in the company remains as strong as ever, primarily based on the growing demand for more planes as air traffic increases. Airlines have been especially attracted to Boeing’s next generation of planes in no small part because they will be at least 20% more fuel efficient than many operators’ current fleets. The combination of increased air traffic and more fuel-efficient planes has led to quite a backlog of orders for Boeing. “Things are looking great for the company,” states Justin, who estimates that it has a backlog of $345 billion in orders stretching into the next decade. “Boeing is able to take a lower risk approach to developing planes and may be able to increase profits without having to lower prices.”
Meanwhile, analyst Frank Hu saw an opportunity to add to the fund’s long-standing investment in Chevron. At the time, much of the industry was focused on the booming natural gas business, but Frank was also optimistic about oil prices rebounding, which boded well for Chevron. He liked the fact that the company was more focused on producing oil rather than gas because oil prices were likely to increase and gas prices decline. “The returns on Chevron’s underlying business looked much better than some of its peers, which are more focused on gas,” explains Frank. “Because of our long-standing relationship and ongoing discussions with management, we believed that they were also on the right trajectory in terms of capital discipline.”
While Chevron’s valuation was more attractive than many of its peers at the time, Frank also felt the company had a better dividend policy that rewarded shareholders rather than using its cash to make share buybacks and large acquisitions. “Chevron has continued to increase its dividend even as capital expenditures have risen because the company wanted to signal to the market that there will be even more to come once it is done with its current slate of projects,” he says. Most of Chevron’s current focus is on operating the giant Tengiz oil field in Kazakhstan and developing major liquefied natural gas projects in Australia, in addition to deep-water operations in the Gulf of Mexico and off the coast of Nigeria, as well as new oil developments in the Permian Basin of Texas.
Working with the portfolio managers
In addition to researching companies and investing in them in the research portfolio, the analysts work closely with AMBAL’s portfolio managers to help them make the best investment decisions possible for the fund. Most of the time the portfolio managers will invest based on the analysts’ recommendations and consult closely with them on the companies they cover, but there are times when opinions can differ.
Greg, who tends to have a more concentrated portfolio of 12 to 15 stocks, says that while he is not overly focused on what the analysts own and do not own, he still works closely with them when investing. “It’s very much a team approach and I collaborate with the analysts, but I also like to generate some of my own ideas,” he says. “At the end of the day, most of what I own is also owned by the analysts. I very much value the fundamental analysis they are doing.”
Both Frank and Justin say they have a good dialogue with Greg and the other portfolio managers, even if each manager has a unique approach and style. Greg, who owns shares of Boeing and Chevron, has a close relationship with both analysts, whose offices are just
We have a very good research team; even if I don’t follow their advice, I always listen to them.
Dina Perry, equity portfolio manager

How the fund is managed
American Balanced Fund’s eight portfolio managers have a median of 30 years of investment experience.* The knowledge and wisdom they have accumulated over the years have helped them manage your fund through many different stock market cycles.

Portfolio managers
| Eugene P. Stein | James R. Mulally | Dina N. Perry | John H. Smet |
| 43 years | 38 years | 36 years | 32 years |
| | | | |
| Alan N. Berro | Hilda L. Applbaum | Gregory D. Johnson | Jeffrey T. Lager |
| 28 years | 27 years | 20 years | 19 years |
*As of the prospectus dated March 1, 2014 (unaudited).
Investment analysts
The portfolio managers invest broadly across several industries and tap the knowledge of the investment analysts when making an investment decision about a company. The analysts are able to invest in their strongest convictions in the research portfolio, which is coordinated by Rich Wolf.
 | |  |
Dina Perry | |
John Smet |
When stocks go down, we want to provide investors with positive returns from the bonds held in the fund.
John Smet, fixed-income portfolio manager
down the hall from his. “The dialogue varies with the portfolio managers depending on who it is and where they are, so you have to find ways to make your case,” says Frank, adding that portfolio managers will often join him on research trips, which can prove a fruitful venue for productive exchanges. “That’s a good time to get to know them in an informal setting where they can ask a lot of questions that they may feel reluctant to ask on a call.”
Portfolio manager Dina Perry says she often follows analysts’ recommendations, but tends to focus on investments in undervalued securities with a low price-to-earnings ratio or contrarian ideas. Examples include media company Time Warner, which the analyst likes but does not hold in the research portfolio, and drug maker Pfizer, which the analyst likes and holds. “We have a very good research team; even if I don’t follow their advice, I always listen to them,” she says. “You might not necessarily buy the same stock, but it is often in the same neighborhood.”
Dina and Greg also bring complementary styles and backgrounds to the portfolio manager team, which strives for just that sort of diversity. As a former economist, Dina says she tends to focus on cyclical companies that are more sensitive to the economy, such as industrials. One of her largest holdings is industrial conglomerate General Electric, which she has added to on the analyst’s recommendation. “The company is misunderstood in a way,” she says. “But I believe there is a lot of room for restructuring at GE and that it has great potential.” While Dina is more of a value investor who focuses on cyclical companies, Greg tends to be more growth-oriented. Because of his analyst background, he also tends to invest in more consumer-related companies like the ones he used to cover, such as Amazon and Home Depot.
The other six managers on AMBAL each bring a different set of backgrounds and styles to the fund, but there is still a strong sense of teamwork among them. “It’s a great combination of letting them do what their convictions tell them with the overlay of a collaborative approach,” says Greg, who in his role as principal investment officer makes sure that dynamic does not change. “I don’t tell the other managers how to do their job — they are free to make their own decisions within their portfolios — but it is a team approach in the sense that we meet to talk about our investments and share ideas.”
The fund’s fixed-income approach
Just as important as the dynamic among the equity portfolio managers is their relationship with the fund’s fixed-income managers. Managers in each group work together to achieve the right balance between stocks and bonds in the portfolio, depending on the changing market environment.
As principal investment officer for AMBAL, Greg consults closely with John Smet and the other fixed-income managers on the fund to determine the best allocation of stocks and bonds. “It’s a very consultative process where we periodically review the relative attractiveness between the asset classes,” Greg explains, noting the current mix has greatly benefited the fund’s results over the past couple of years. John adds that they also take cues from portfolio managers who are able to invest in both equities and fixed income when making asset allocation decisions for the fund.
“The role of fixed income in AMBAL is to generate yield and provide a measure of stability in the fund,” says John. To achieve that objective, the fund focuses on higher quality credits such as U.S. Treasuries and not as much on high-yield bonds or emerging markets debt. “When stocks go down, we want to provide investors with positive returns from the bonds held in the fund,” he explains. “In other words, the fixed-income portfolio should complement the equity portfolio. That’s why we often describe AMBAL as a ‘fund for all seasons’ — it has the potential to do well in any environment.” ¢
| Summary investment portfolio December 31, 2013 | |
| Investment mix by security type | Percent of net assets |
| Common stocks 73.77% | | Shares | | | Value
(000) | | | Percent of
net assets | |
| Financials 14.08% | | | | | | | | | | | | |
| Wells Fargo & Co. | | | 42,215,000 | | | $ | 1,916,561 | | | | 2.70 | % |
| American Express Co. | | | 16,224,000 | | | | 1,472,004 | | | | 2.08 | |
| Berkshire Hathaway Inc., Class A1 | | | 6,500 | | | | 1,156,350 | | | | 1.63 | |
| Goldman Sachs Group, Inc. | | | 4,196,700 | | | | 743,907 | | | | 1.05 | |
| JPMorgan Chase & Co. | | | 11,921,000 | | | | 697,140 | | | | .98 | |
| ACE Ltd. | | | 5,650,000 | | | | 584,945 | | | | .83 | |
| Citigroup Inc. | | | 9,500,000 | | | | 495,045 | | | | .70 | |
| Weyerhaeuser Co.1 | | | 12,815,242 | | | | 404,577 | | | | .57 | |
| Other securities | | | | | | | 2,510,051 | | | | 3.54 | |
| | | | | | | | 9,980,580 | | | | 14.08 | |
| | | | | | | | | | | | | |
| Consumer discretionary 11.75% | | | | | | | | | | | | |
| Amazon.com, Inc.1 | | | 5,668,000 | | | | 2,260,342 | | | | 3.19 | |
| Home Depot, Inc. | | | 25,580,000 | | | | 2,106,257 | | | | 2.97 | |
| Comcast Corp., Class A | | | 20,310,000 | | | | 1,055,409 | | | | 1.49 | |
| Walt Disney Co. | | | 8,000,000 | | | | 611,200 | | | | .86 | |
| VF Corp. | | | 7,000,000 | | | | 436,380 | | | | .62 | |
| Other securities | | | | | | | 1,858,350 | | | | 2.62 | |
| | | | | | | | 8,327,938 | | | | 11.75 | |
| | | | | | | | | | | | | |
| Industrials 11.21% | | | | | | | | | | | | |
| Boeing Co. | | | 14,025,000 | | | | 1,914,272 | | | | 2.70 | |
| Union Pacific Corp. | | | 5,795,000 | | | | 973,560 | | | | 1.37 | |
| Lockheed Martin Corp. | | | 6,392,037 | | | | 950,240 | | | | 1.34 | |
| General Electric Co. | | | 29,600,000 | | | | 829,688 | | | | 1.17 | |
| Parker-Hannifin Corp. | | | 4,100,000 | | | | 527,424 | | | | .74 | |
| Deere & Co. | | | 5,640,000 | | | | 515,101 | | | | .73 | |
| Caterpillar Inc. | | | 5,300,000 | | | | 481,293 | | | | .68 | |
| Cummins Inc. | | | 3,077,200 | | | | 433,793 | | | | .61 | |
| United Technologies Corp. | | | 3,680,000 | | | | 418,784 | | | | .59 | |
| Other securities | | | | | | | 903,231 | | | | 1.28 | |
| | | | | | | | 7,947,386 | | | | 11.21 | |
| | | | | | | | | | | | | |
| Information technology 8.58% | | | | | | | | | | | | |
| Microsoft Corp. | | | 52,450,000 | | | | 1,963,203 | | | | 2.77 | |
| Texas Instruments Inc. | | | 25,365,000 | | | | 1,113,777 | | | | 1.57 | |
| ASML Holding NV (New York registered) | | | 3,812,080 | | | | 357,192 | | | | | |
| ASML Holding NV | | | 1,470,405 | | | | 137,634 | | | | .70 | |
| Google Inc., Class A1 | | | 415,000 | | | | 465,095 | | | | .66 | |
| TE Connectivity Ltd. | | | 6,905,000 | | | | 380,535 | | | | .54 | |
| Taiwan Semiconductor Manufacturing Co. Ltd. (ADR) | | | 21,800,000 | | | | 380,192 | | | | .53 | |
| Other securities | | | | | | | 1,285,557 | | | | 1.81 | |
| | | | | | | | 6,083,185 | | | | 8.58 | |
| | Shares | | | Value
(000) | | | Percent of
net assets | |
| Health care 7.62% | | | | | | | | | | | | |
| Merck & Co., Inc. | | | 25,730,000 | | | $ | 1,287,786 | | | | 1.82 | % |
| Bristol-Myers Squibb Co. | | | 17,240,000 | | | | 916,306 | | | | 1.29 | |
| UnitedHealth Group Inc. | | | 9,295,000 | | | | 699,913 | | | | .99 | |
| Pfizer Inc. | | | 22,320,000 | | | | 683,662 | | | | .96 | |
| Gilead Sciences, Inc.1 | | | 7,440,000 | | | | 559,116 | | | | .79 | |
| Johnson & Johnson | | | 5,200,000 | | | | 476,268 | | | | .67 | |
| Other securities | | | | | | | 780,637 | | | | 1.10 | |
| | | | | | | | 5,403,688 | | | | 7.62 | |
| | | | | | | | | | | | | |
| Consumer staples 7.03% | | | | | | | | | | | | |
| Philip Morris International Inc. | | | 13,200,000 | | | | 1,150,116 | | | | 1.62 | |
| Procter & Gamble Co. | | | 10,130,000 | | | | 824,683 | | | | 1.16 | |
| PepsiCo, Inc. | | | 9,693,800 | | | | 804,004 | | | | 1.14 | |
| Nestlé SA | | | 8,880,000 | | | | 650,035 | | | | | |
| Nestlé SA (ADR) | | | 1,000,000 | | | | 73,590 | | | | 1.02 | |
| Costco Wholesale Corp. | | | 5,677,326 | | | | 675,658 | | | | .95 | |
| Other securities | | | | | | | 801,325 | | | | 1.14 | |
| | | | | | | | 4,979,411 | | | | 7.03 | |
| | | | | | | | | | | | | |
| Energy 5.72% | | | | | | | | | | | | |
| Royal Dutch Shell PLC, Class B (ADR) | | | 9,158,000 | | | | 687,857 | | | | .97 | |
| Chevron Corp. | | | 4,817,000 | | | | 601,692 | | | | .85 | |
| Enbridge Inc. | | | 10,222,600 | | | | 446,523 | | | | .63 | |
| Kinder Morgan, Inc. | | | 11,070,000 | | | | 398,520 | | | | .56 | |
| Other securities | | | | | | | 1,921,031 | | | | 2.71 | |
| | | | | | | | 4,055,623 | | | | 5.72 | |
| | | | | | | | | | | | | |
| Materials 3.09% | | | | | | | | | | | | |
| Dow Chemical Co. | | | 12,980,000 | | | | 576,312 | | | | .81 | |
| E.I. du Pont de Nemours and Co. | | | 6,750,000 | | | | 438,547 | | | | .62 | |
| Other securities | | | | | | | 1,175,410 | | | | 1.66 | |
| | | | | | | | 2,190,269 | | | | 3.09 | |
| | | | | | | | | | | | | |
| Other 1.35% | | | | | | | | | | | | |
| Other securities | | | | | | | 955,264 | | | | 1.35 | |
| | | | | | | | | | | | | |
| Miscellaneous 3.34% | | | | | | | | | | | | |
| Other common stocks in initial period of acquisition | | | | | | | 2,369,792 | | | | 3.34 | |
| | | | | | | | | | | | | |
| Total common stocks (cost: $31,404,220,000) | | | | | | | 52,293,136 | | | | 73.77 | |
| | | | | | | | | | | | | |
| Preferred stocks 0.03% | | | | | | | | | | | | |
| Miscellaneous 0.03% | | | | | | | | | | | | |
| Other preferred stocks in initial period of acquisition | | | | | | | 19,799 | | | | .03 | |
| | | | | | | | | | | | | |
| Total preferred stocks (cost: $21,000,000) | | | | | | | 19,799 | | | | .03 | |
| | | | | | | | | | | | |
| Bonds, notes & other debt instruments 23.03% | | Principal amount
(000) | | | | | | | | | |
| Corporate bonds & notes 8.54% | | | | | | | | | | | | |
| Financials 2.75% | | | | | | | | | | | | |
| Goldman Sachs Group, Inc. 2.90%–5.75% 2016–2023 | | $ | 160,400 | | | | 167,508 | | | | .24 | |
| Wells Fargo & Co. 1.25%–4.60% 2016–2021 | | | 93,500 | | | | 97,523 | | | | .14 | |
| JPMorgan Chase & Co. 1.625%–3.45% 2016–2023 | | | 74,500 | | | | 73,374 | | | | .10 | |
| Berkshire Hathaway Inc. 2.00%–2.90% 2016–2020 | | | 60,840 | | | | 61,468 | | | | .09 | |
| American Express Co. 6.15% 2017 | | | 22,800 | | | | 26,316 | | | | .04 | |
| Other securities | | | | | | | 1,522,325 | | | | 2.14 | |
| | | | | | | | 1,948,514 | | | | 2.75 | |
| | | | | | | | | | | | | |
| Consumer staples 1.13% | | | | | | | | | | | | |
| PepsiCo, Inc. 2.50%–7.90% 2015–2018 | | | 47,000 | | | | 51,802 | | | | .07 | |
| Philip Morris International Inc. 1.875%–3.60% 2019–2023 | | | 42,695 | | | | 40,398 | | | | .06 | |
| Procter & Gamble Co. 1.45% 2016 | | | 13,460 | | | | 13,664 | | | | .02 | |
| Other securities | | | | | | | 692,261 | | | | .98 | |
| | | | | | | | 798,125 | | | | 1.13 | |
| Bonds, notes & other debt instruments (continued) | | Principal amount
(000) | | | | Value
(000) | | | | Percent of
net assets | |
| Energy 1.04% | | | | | | | | | | | | |
| Shell International Finance BV 1.125%–2.00% 2017–2018 | | $ | 38,715 | | | $ | 38,457 | | | | .05 | % |
| Other securities | | | | | | | 697,166 | | | | .99 | |
| | | | | | | | 735,623 | | | | 1.04 | |
| | | | | | | | | | | | | |
| Industrials 0.78% | | | | | | | | | | | | |
| General Electric Co. 0.85%–6.00% 2014–20422 | | | 216,105 | | | | 220,214 | | | | .31 | |
| Union Pacific Corp. 3.646%–5.70% 2018–20243 | | | 31,950 | | | | 33,318 | | | | .05 | |
| Boeing Company 0.95% 2018 | | | 12,000 | | | | 11,513 | | | | .02 | |
| Other securities | | | | | | | 290,612 | | | | .40 | |
| | | | | | | | 555,657 | | | | .78 | |
| | | | | | | | �� | | | | | |
| Consumer discretionary 0.70% | | | | | | | | | | | | |
| Comcast Corp. 5.30%–6.95% 2014–2037 | | | 67,750 | | | | 77,771 | | | | .11 | |
| Home Depot, Inc. 4.40%–5.95% 2021–2041 | | | 30,000 | | | | 33,624 | | | | .05 | |
| Other securities | | | | | | | 385,005 | | | | .54 | |
| | | | | | | | 496,400 | | | | .70 | |
| | | | | | | | | | | | | |
| Health care 0.61% | | | | | | | | | | | | |
| UnitedHealth Group Inc. 6.00% 2017–2018 | | | 57,170 | | | | 65,909 | | | | .09 | |
| Other securities | | | | | | | 365,630 | | | | .52 | |
| | | | | | | | 431,539 | | | | .61 | |
| | | | | | | | | | | | | |
| Other corporate bonds & notes 1.53% | | | | | | | | | | | | |
| Other securities | | | | | | | 1,089,666 | | | | 1.53 | |
| | | | | | | | | | | | | |
| Total corporate bonds & notes | | | | | | | 6,055,524 | | | | 8.54 | |
| | | | | | | | | | | | | |
| U.S. Treasury bonds & notes 6.96% | | | | | | | | | | | | |
| U.S. Treasury 5.73% | | | | | | | | | | | | |
| 0.25% 2014 | | | 455,714 | | | | 456,097 | | | | | |
| 0.75% 2014 | | | 435,715 | | | | 437,009 | | | | 5.73 | |
| 1.625% 2022 | | | 439,250 | | | | 395,909 | | | | | |
| 0.625%–6.375% 2014–2043 | | | 2,683,133 | | | | 2,776,617 | | | | | |
| | | | | | | | 4,065,632 | | | | 5.73 | |
| | | | | | | | | | | | | |
| U.S. Treasury inflation-protected securities4 1.23% | | | | | | | | | | | | |
| 0.125%–2.375% 2015–2043 | | | 888,276 | | | | 869,005 | | | | 1.23 | |
| | | | | | | | | | | | | |
| Total U.S. Treasury bonds & notes | | | | | | | 4,934,637 | | | | 6.96 | |
| | | | | | | | | | | | | |
| Mortgage-backed obligations5 5.99% | | | | | | | | | | | | |
| Fannie Mae 0%–11.009% 2018–20472 | | | 2,446,015 | | | | 2,492,203 | | | | 3.52 | |
| Freddie Mac 0%–6.611% 2023–20432 | | | 198,833 | | | | 209,512 | | | | .29 | |
| Other securities | | | | | | | 1,546,830 | | | | 2.18 | |
| | | | | | | | 4,248,545 | | | | 5.99 | |
| | | | | | | | | | | | | |
| Federal agency bonds & notes 1.18% | | | | | | | | | | | | |
| Freddie Mac 0.546%–3.531% 2015–20232,5 | | | 500,763 | | | | 495,458 | | | | .70 | |
| Fannie Mae 0.50%–6.25% 2016–20292,5 | | | 245,080 | | | | 242,835 | | | | .34 | |
| Federal Home Loan Bank 0.625%–3.375% 2016–2023 | | | 58,360 | | | | 57,231 | | | | .08 | |
| Other securities | | | | | | | 43,137 | | | | .06 | |
| | | | | | | | 838,661 | | | | 1.18 | |
| | | | | | | | | | | | | |
| Other 0.28% | | | | | | | | | | | | |
| Other securities | | | | | | | 190,654 | | | | .28 | |
| | | | | | | | | | | | | |
| Miscellaneous 0.08% | | | | | | | | | | | | |
| Other bonds, notes & other debt instruments in initial period of acquisition | | | | | | | 56,712 | | | | .08 | |
| | | | | | | | | | | | | |
| Total bonds, notes & other debt instruments (cost: $16,200,683,000) | | | | | | | 16,324,733 | | | | 23.03 | |
| Short-term securities 3.15% | | Principal amount
(000) | | | Value
(000) | | | Percent of
net assets | |
| Federal Home Loan Bank 0.055%–0.16% due 1/22–9/16/2014 | | $ | 715,662 | | | $ | 715,441 | | | | 1.01 | % |
| Freddie Mac 0.065%–0.19% due 1/21–9/16/2014 | | | 623,900 | | | | 623,612 | | | | .88 | |
| Fannie Mae 0.10%–0.13% due 4/23–8/1/2014 | | | 155,000 | | | | 154,942 | | | | .22 | |
| U.S. Treasury Bills 0.095%–0.133% due 5/15–8/21/2014 | | | 127,500 | | | | 127,450 | | | | .18 | |
| General Electric Capital Corp. 0.05%–0.17% due 1/2–2/12/2014 | | | 112,500 | | | | 112,494 | | | | .16 | |
| Jupiter Securitization Co., LLC 0.24% due 1/14/20143 | | | 40,000 | | | | 39,997 | | | | | |
| Chariot Funding, LLC 0.30% due 2/21/20143 | | | 10,300 | | | | 10,298 | | | | .07 | |
| Pfizer Inc 0.11% due 3/10/20143 | | | 31,000 | | | | 30,996 | | | | .04 | |
| Wells Fargo & Co. 0.22% due 6/17/2014 | | | 30,000 | | | | 29,958 | | | | .04 | |
| Other securities | | | | | | | 392,566 | | | | .55 | |
| | | | | | | | | | | | | |
| Total short-term securities (cost: $2,237,621,000) | | | | | | | 2,237,754 | | | | 3.15 | |
| Total investment securities (cost: $49,863,524,000) | | | | | | | 70,875,422 | | | | 99.98 | |
| Other assets less liabilities | | | | | | | 12,475 | | | | .02 | |
| | | | | | | | | | | | | |
| Net assets | | | | | | $ | 70,887,897 | | | | 100.00 | % |
This summary investment portfolio is designed to streamline the report and help investors better focus on the fund’s principal holdings. See the inside back cover for details on how to obtain a complete schedule of portfolio holdings.
As permitted by U.S. Securities and Exchange Commission regulations, “Miscellaneous” securities include holdings in their first year of acquisition that have not previously been publicly disclosed.
“Other securities” includes all issues that are not disclosed separately in the summary investment portfolio, including securities which were valued under fair value procedures adopted by authority of the board of trustees. The total value of all such securities was $14,397,000, which represented .02% of the net assets of the fund.
The following footnotes apply to either the individual securities noted or one or more of the securities aggregated and listed as a single line item.
| 1 | Security did not produce income during the last 12 months. |
| 2 | Coupon rate may change periodically. |
| 3 | Acquired in a transaction exempt from registration under Rule 144A or section 4(2) of the Securities Act of 1933. May be resold in the U.S. in transactions exempt from registration, normally to qualified institutional buyers. The total value of all such securities, including those in “Other securities,” was $1,570,045,000, which represented 2.21% of the net assets of the fund. |
| 4 | Index-linked bond whose principal amount moves with a government price index. |
| 5 | Principal payments may be made periodically. Therefore, the effective maturity date may be earlier than the stated maturity date. |
Key to abbreviation
ADR = American Depositary Receipts
See Notes to Financial Statements
Financial statements
Statement of assets and liabilities
at December 31, 2013 | | (dollars in thousands) |
| | | |
| Assets: | | | | | | | | |
| Investment securities, at value (cost: $49,863,524) | | | | | | $ | 70,875,422 | |
| Cash | | | | | | | 69 | |
| Receivables for: | | | | | | | | |
| Sales of investments | | $ | 946,475 | | | | | |
| Sales of fund’s shares | | | 124,749 | | | | | |
| Dividends and interest | | | 200,890 | | | | 1,272,114 | |
| | | | | | | | 72,147,605 | |
| Liabilities: | | | | | | | | |
| Payables for: | | | | | | | | |
| Purchases of investments | | | 1,007,810 | | | | | |
| Repurchases of fund’s shares | | | 206,271 | | | | | |
| Investment advisory services | | | 13,842 | | | | | |
| Services provided by related parties | | | 26,931 | | | | | |
| Trustees’ deferred compensation | | | 3,929 | | | | | |
| Other | | | 925 | | | | 1,259,708 | |
| Net assets at December 31, 2013 | | | | | | $ | 70,887,897 | |
| | | | | | | | | |
| Net assets consist of: | | | | | | | | |
| Capital paid in on shares of beneficial interest | | | | | | $ | 49,886,096 | |
| Undistributed net investment income | | | | | | | 45,929 | |
| Accumulated net realized loss | | | | | | | (56,249 | ) |
| Net unrealized appreciation | | | | | | | 21,012,121 | |
| Net assets at December 31, 2013 | | | | | | $ | 70,887,897 | |
(dollars and shares in thousands, except per-share amounts)
Shares of beneficial interest issued and outstanding (no stated par value) —
unlimited shares authorized (2,905,367 total shares outstanding)
| | | Net assets | | | Shares
outstanding | | | Net asset value
per share |
| Class A | | $ | 42,735,112 | | | | 1,750,103 | | | $ | 24.42 | |
| Class B | | | 821,201 | | | | 33,703 | | | | 24.37 | |
| Class C | | | 5,247,215 | | | | 215,893 | | | | 24.30 | |
| Class F-1 | | | 2,470,486 | | | | 101,221 | | | | 24.41 | |
| Class F-2 | | | 767,879 | | | | 31,458 | | | | 24.41 | |
| Class 529-A | | | 2,598,881 | | | | 106,569 | | | | 24.39 | |
| Class 529-B | | | 107,512 | | | | 4,404 | | | | 24.41 | |
| Class 529-C | | | 840,943 | | | | 34,500 | | | | 24.38 | |
| Class 529-E | | | 134,445 | | | | 5,515 | | | | 24.38 | |
| Class 529-F-1 | | | 101,469 | | | | 4,163 | | | | 24.37 | |
| Class R-1 | | | 150,682 | | | | 6,205 | | | | 24.28 | |
| Class R-2 | | | 1,304,133 | | | | 53,676 | | | | 24.30 | |
| Class R-3 | | | 3,212,299 | | | | 132,091 | | | | 24.32 | |
| Class R-4 | | | 3,993,621 | | | | 163,777 | | | | 24.38 | |
| Class R-5 | | | 2,492,202 | | | | 101,997 | | | | 24.43 | |
| Class R-6 | | | 3,909,817 | | | | 160,092 | | | | 24.42 | |
See Notes to Financial Statements
Statement of operations
for the year ended December 31, 2013 | (dollars in thousands) |
| Investment income: | | | | | | | | |
| Income: | | | | | | | | |
| Dividends (net of non-U.S. taxes of $14,327) | | $ | 1,022,038 | | | | | |
| Interest | | | 398,305 | | | $ | 1,420,343 | |
| Fees and expenses*: | | | | | | | | |
| Investment advisory services | | | 149,567 | | | | | |
| Distribution services | | | 203,713 | | | | | |
| Transfer agent services | | | 72,308 | | | | | |
| Administrative services | | | 15,844 | | | | | |
| Reports to shareholders | | | 2,265 | | | | | |
| Registration statement and prospectus | | | 973 | | | | | |
| Trustees’ compensation | | | 1,065 | | | | | |
| Auditing and legal | | | 146 | | | | | |
| Custodian | | | 571 | | | | | |
| Other | | | 3,663 | | | | 450,115 | |
| Net investment income | | | | | | | 970,228 | |
| | | | | | | | | |
| Net realized gain and unrealized appreciation on investments and currency: | | | | | | | | |
| Net realized gain (loss) on: | | | | | | | | |
| Investments | | | 1,873,952 | | | | | |
| Currency transactions | | | (872 | ) | | | 1,873,080 | |
| Net unrealized appreciation on: | | | | | | | | |
| Investments | | | 9,504,390 | | | | | |
| Currency translations | | | 185 | | | | 9,504,575 | |
| Net realized gain and unrealized appreciation on investments and currency | | | | | | | 11,377,655 | |
| | | | | | | | | |
| Net increase in net assets resulting from operations | | | | | | $ | 12,347,883 | |
*Additional information related to class-specific fees and expenses is included in the Notes to Financial Statements.
| Statements of changes in net assets | |
| | (dollars in thousands) |
| | | Year ended December 31 | |
| | | | 2013 | | | | 2012 | |
| Operations: | | | | | | | | |
| Net investment income | | $ | 970,228 | | | $ | 978,422 | |
| Net realized gain on investments and currency transactions | | | 1,873,080 | | | | 2,101,912 | |
| Net unrealized appreciation on investments and currency translations | | | 9,504,575 | | | | 3,852,666 | |
| Net increase in net assets resulting from operations | | | 12,347,883 | | | | 6,933,000 | |
| | | | | | | | | |
| Dividends paid to shareholders from net investment income | | | (1,016,591 | ) | | | (977,344 | ) |
| | | | | | | | | |
| Net capital share transactions | | | 3,682,825 | | | | 503,635 | |
| | | | | | | | | |
| Total increase in net assets | | | 15,014,117 | | | | 6,459,291 | |
| | | | | | | | | |
| Net assets: | | | | | | | | |
| Beginning of year | | | 55,873,780 | | | | 49,414,489 | |
End of year (including undistributed net investment income:
$45,929 and $79,783, respectively) | | $ | 70,887,897 | | | $ | 55,873,780 | |
See Notes to Financial Statements
Notes to financial statements
1. Organization
American Balanced Fund (the “fund”) is registered under the Investment Company Act of 1940 as an open-end, diversified management investment company. The fund seeks conservation of capital, current income and long-term growth of both capital and income.
The fund has 16 share classes consisting of five retail share classes (Classes A, B and C, as well as two F share classes, F-1 and F-2), five 529 college savings plan share classes (Classes 529-A, 529-B, 529-C, 529-E and 529-F-1) and six retirement plan share classes (Classes R-1, R-2, R-3, R-4, R-5 and R-6). The 529 college savings plan share classes can be used to save for college education. The retirement plan share classes are generally offered only through eligible employer-sponsored retirement plans. The fund’s share classes are further described:
| Share class | | Initial sales charge | | Contingent deferred sales
charge upon redemption | | Conversion feature |
| Classes A and 529-A | | Up to 5.75% | | None (except 1% for certain redemptions within one year of purchase without an initial sales charge) | | None |
| Classes B and 529-B* | | None | | Declines from 5% to 0% for redemptions within six years of purchase | | Classes B and 529-B convert to Classes A and 529-A, respectively, after eight years |
| Class C | | None | | 1% for redemptions within one year of purchase | | Class C converts to Class F-1 after 10 years |
| Class 529-C | | None | | 1% for redemptions within one year of purchase | | None |
| Class 529-E | | None | | None | | None |
| Classes F-1, F-2 and 529-F-1 | | None | | None | | None |
| Classes R-1, R-2, R-3, R-4, R-5 and R-6 | | None | | None | | None |
*Class B and 529-B shares of the fund are not available for purchase.
Holders of all share classes have equal pro rata rights to assets, dividends and liquidation proceeds. Each share class has identical voting rights, except for the exclusive right to vote on matters affecting only its class. Share classes have different fees and expenses (“class-specific fees and expenses”), primarily due to different arrangements for distribution, administrative and shareholder services. Differences in class-specific fees and expenses will result in differences in net investment income and, therefore, the payment of different per-share dividends by each share class.
2. Significant accounting policies
The financial statements have been prepared to comply with accounting principles generally accepted in the United States of America. These principles require management to make estimates and assumptions that affect reported amounts and disclosures. Actual results could differ from those estimates. The fund follows the significant accounting policies described in this section, as well as the valuation policies described in the next section on valuation.
Security transactions and related investment income — Security transactions are recorded by the fund as of the date the trades are executed with brokers. Realized gains and losses from security transactions are determined based on the specific identified cost of the securities. In the event a security is purchased with a delayed payment date, the fund will segregate liquid assets sufficient to meet its payment obligations. Dividend income is recognized on the ex-dividend date and interest income is recognized on an accrual basis. Market discounts, premiums and original issue discounts on fixed-income securities are amortized daily over the expected life of the security.
Class allocations — Income, fees and expenses (other than class-specific fees and expenses) and realized and unrealized gains and losses are allocated daily among the various share classes based on their relative net assets. Class-specific fees and expenses, such as distribution, administrative and shareholder services, are charged directly to the respective share class.
Dividends and distributions to shareholders — Dividends and distributions to shareholders are recorded on the ex-dividend date.
Currency translation — Assets and liabilities, including investment securities, denominated in currencies other than U.S. dollars are translated into U.S. dollars at the exchange rates supplied by one or more pricing vendors on the valuation date. Purchases and sales of investment securities and income and expenses are translated into U.S. dollars at the exchange rates on the dates of such transactions. The effects of changes in exchange rates on investment securities are included with the net realized gain or loss and net unrealized appreciation or depreciation on investments in the fund’s statement of operations. The realized gain or loss and unrealized appreciation or depreciation resulting from all other transactions denominated in currencies other than U.S. dollars are disclosed separately.
3. Valuation
Capital Research and Management Company (“CRMC”), the fund’s investment adviser, values the fund’s investments at fair value as defined by accounting principles generally accepted in the United States of America. The net asset value of each share class of the fund is generally determined as of approximately 4:00 p.m. New York time each day the New York Stock Exchange is open.
Methods and inputs — The fund’s investment adviser uses the following methods and inputs to establish the fair value of the fund’s assets and liabilities. Use of particular methods and inputs may vary over time based on availability and relevance as market and economic conditions evolve.
Equity securities are generally valued at the official closing price of, or the last reported sale price on, the exchange or market on which such securities are traded, as of the close of business on the day the securities are being valued or, lacking any sales, at the last available bid price. Prices for each security are taken from the principal exchange or market on which the security trades.
Fixed-income securities, including short-term securities purchased with more than 60 days left to maturity, are generally valued at prices obtained from one or more pricing vendors. Vendors value such securities based on one or more of the inputs described in the following table. The table provides examples of inputs that are commonly relevant for valuing particular classes of fixed-income securities in which the fund is authorized to invest. However, these classifications are not exclusive, and any of the inputs may be used to value any other class of fixed-income security.
| Fixed-income class | | Examples of standard inputs |
| All | | Benchmark yields, transactions, bids, offers, quotations from dealers and trading systems, new issues, spreads and other relationships observed in the markets among comparable securities; and proprietary pricing models such as yield measures calculated using factors such as cash flows, financial or collateral performance and other reference data (collectively referred to as “standard inputs”) |
| Corporate bonds & notes; convertible securities | | Standard inputs and underlying equity of the issuer |
| Bonds & notes of governments & government agencies | | Standard inputs and interest rate volatilities |
| Mortgage-backed; asset-backed obligations | | Standard inputs and cash flows, prepayment information, default rates, delinquency and loss assumptions, collateral characteristics, credit enhancements and specific deal information |
| Municipal securities | | Standard inputs and, for certain distressed securities, cash flows or liquidation values using a net present value calculation based on inputs that include, but are not limited to, financial statements and debt contracts |
When the fund’s investment adviser deems it appropriate to do so (such as when vendor prices are unavailable or not deemed to be representative), fixed-income securities will be valued in good faith at the mean quoted bid and ask prices that are reasonably and timely available (or bid prices, if ask prices are not available) or at prices for securities of comparable maturity, quality and type.
Securities with both fixed-income and equity characteristics, or equity securities traded principally among fixed-income dealers, are generally valued in the manner described for either equity or fixed-income securities, depending on which method is deemed most appropriate by the fund’s investment adviser. Short-term securities purchased within 60 days to maturity are valued at amortized cost, which approximates fair value. The value of short-term securities originally purchased with maturities greater than 60 days is determined based on an amortized value to par when they reach 60 days.
Securities and other assets for which representative market quotations are not readily available or are considered unreliable by the fund’s investment adviser are fair valued as determined in good faith under fair valuation guidelines adopted by authority of the fund’s board of trustees as further described. The investment adviser follows fair valuation guidelines, consistent with U.S. Securities and Exchange Commission rules and guidance, to consider relevant principles and factors when making fair value determinations. The
investment adviser considers relevant indications of value that are reasonably and timely available to it in determining the fair value to be assigned to a particular security, such as the type and cost of the security; contractual or legal restrictions on resale of the security; relevant financial or business developments of the issuer; actively traded similar or related securities; conversion or exchange rights on the security; related corporate actions; significant events occurring after the close of trading in the security; and changes in overall market conditions. In addition, the closing prices of equity securities that trade in markets outside U.S. time zones may be adjusted to reflect significant events that occur after the close of local trading but before the net asset value of each share class of the fund is determined. Fair valuations and valuations of investments that are not actively trading involve judgment and may differ materially from valuations that would have been used had greater market activity occurred.
Processes and structure — The fund’s board of trustees has delegated authority to the fund’s investment adviser to make fair value determinations, subject to board oversight. The investment adviser has established a Joint Fair Valuation Committee (the “Fair Valuation Committee”) to administer, implement and oversee the fair valuation process, and to make fair value decisions. The Fair Valuation Committee regularly reviews its own fair value decisions, as well as decisions made under its standing instructions to the investment adviser’s valuation teams. The Fair Valuation Committee reviews changes in fair value measurements from period to period and may, as deemed appropriate, update the fair valuation guidelines to better reflect the results of back testing and address new or evolving issues. The Fair Valuation Committee reports any changes to the fair valuation guidelines to the board of trustees with supplemental information to support the changes. The fund’s board and audit committee also regularly review reports that describe fair value determinations and methods.
The fund’s investment adviser has also established a Fixed-Income Pricing Review Group to administer and oversee the fixed-income valuation process, including the use of fixed-income pricing vendors. This group regularly reviews pricing vendor information and market data. Pricing decisions, processes and controls over security valuation are also subject to additional internal reviews, including an annual control self-evaluation program facilitated by the investment adviser’s compliance group.
Classifications — The fund’s investment adviser classifies the fund’s assets and liabilities into three levels based on the inputs used to value the assets or liabilities. Level 1 values are based on quoted prices in active markets for identical securities. Level 2 values are based on significant observable market inputs, such as quoted prices for similar securities and quoted prices in inactive markets. Certain securities trading outside the U.S. may transfer between Level 1 and Level 2 due to valuation adjustments resulting from significant market movements following the close of local trading. Level 3 values are based on significant unobservable inputs that reflect the investment adviser’s determination of assumptions that market participants might reasonably use in valuing the securities. The valuation levels are not necessarily an indication of the risk or liquidity associated with the underlying investment. For example, U.S. government securities are reflected as Level 2 because the inputs used to determine fair value may not always be quoted prices in an active market. The following table presents the fund’s valuation levels as of December 31, 2013 (dollars in thousands):
| | | Investment securities | |
| | | Level 1* | | | Level 2 | | | Level 3 | | | Total | |
| Assets: | | | | | | | | | | | | | | | | |
| Common stocks: | | | | | | | | | | | | | | | | |
| Financials | | $ | 9,980,580 | | | $ | — | | | $ | — | | | $ | 9,980,580 | |
| Consumer discretionary | | | 8,327,938 | | | | — | | | | — | | | | 8,327,938 | |
| Industrials | | | 7,947,386 | | | | — | | | | — | | | | 7,947,386 | |
| Information technology | | | 6,083,185 | | | | — | | | | — | | | | 6,083,185 | |
| Health care | | | 5,403,688 | | | | — | | | | — | | | | 5,403,688 | |
| Consumer staples | | | 4,979,411 | | | | — | | | | — | | | | 4,979,411 | |
| Energy | | | 4,055,623 | | | | — | | | | — | | | | 4,055,623 | |
| Materials | | | 2,190,269 | | | | — | | | | — | | | | 2,190,269 | |
| Other | | | 955,264 | | | | — | | | | — | | | | 955,264 | |
| Miscellaneous | | | 2,369,792 | | | | — | | | | — | | | | 2,369,792 | |
| Preferred stocks | | | 19,799 | | | | — | | | | — | | | | 19,799 | |
| Bonds, notes & other debt instruments: | | | | | | | | | | | | | | | | |
| Corporate bonds & notes | | | — | | | | 6,055,524 | | | | — | | | | 6,055,524 | |
| U.S. Treasury bonds & notes | | | — | | | | 4,934,637 | | | | — | | | | 4,934,637 | |
| Mortgage-backed obligations | | | — | | | | 4,248,545 | | | | — | | | | 4,248,545 | |
| Federal agency bonds & notes | | | — | | | | 838,661 | | | | — | | | | 838,661 | |
| Other | | | — | | | | 190,654 | | | | — | | | | 190,654 | |
| Miscellaneous | | | — | | | | 56,712 | | | | — | | | | 56,712 | |
| Short-term securities | | | — | | | | 2,237,754 | | | | — | | | | 2,237,754 | |
| Total | | $ | 52,312,935 | | | $ | 18,562,487 | | | $ | — | | | $ | 70,875,422 | |
| * | Securities with a value of $1,107,260,000, which represented 1.56% of the net assets of the fund, transferred from Level 2 to Level 1 since the prior fiscal year-end, primarily due to a lack of significant market movements following the close of local trading. |
4. Risk factors
Investing in the fund may involve certain risks including, but not limited to, those described below.
Market conditions — The prices of, and the income generated by, the common stocks, bonds and other securities held by the fund may decline due to market conditions and other factors, including those directly involving the issuers of securities held by the fund.
Investing in growth-oriented stocks — Growth-oriented stocks may involve larger price swings and greater potential for loss than other types of investments.
Investing in income-oriented stocks — Income provided by the fund may be reduced by changes in the dividend policies of, and the capital resources available at, the companies in which the fund invests.
Investing in bonds — Rising interest rates will generally cause the prices of bonds and other debt securities to fall. Longer maturity debt securities may be subject to greater price fluctuations than shorter maturity debt securities. In addition, falling interest rates may cause an issuer to redeem, call or refinance a debt security before its stated maturity, which may result in the fund having to reinvest the proceeds in lower yielding securities.
Bonds and other debt securities are subject to credit risk, which is the possibility that the credit strength of an issuer will weaken and/ or an issuer of a debt security will fail to make timely payments of principal or interest and the security will go into default. Lower quality debt securities generally have higher rates of interest and may be subject to greater price fluctuations than higher quality debt securities. Credit risk is gauged, in part, by the credit ratings of the debt securities in which the fund invests. However, ratings are only the opinions of the rating agencies issuing them and are not guarantees as to credit quality or an evaluation of market risk. The fund’s investment adviser relies on its own credit analysts to research issuers and issues in seeking to mitigate various credit and default risks.
Investing in securities backed by the U.S. government — Securities backed by the U.S. Treasury or the full faith and credit of the U.S. government are guaranteed only as to the timely payment of interest and principal when held to maturity. Accordingly, the current market values for these securities will fluctuate with changes in interest rates. Securities issued by government-sponsored entities and federal agencies and instrumentalities that are not backed by the full faith and credit of the U.S. government are neither issued nor guaranteed by the U.S. government.
Investing in mortgage-backed and asset-backed securities — Many types of bonds and other debt securities, including mortgage-backed securities, are subject to prepayment risk as well as the risks associated with investing in debt securities in general. If interest rates fall and the loans underlying these securities are prepaid faster than expected, the fund may have to reinvest the prepaid principal in lower yielding securities, thus reducing the fund’s income. Conversely, if interest rates increase and the loans underlying the securities are prepaid slower than expected, the time in which the securities are paid off could be extended. This may reduce the fund’s cash for potential reinvestment in higher yielding securities.
Thinly traded securities — There may be little trading in the secondary market for particular bonds or other debt securities, which may make them more difficult to value, acquire or sell.
Investing outside the U.S. — Securities of issuers domiciled outside the U.S., or with significant operations outside the U.S., may lose value because of adverse political, social, economic or market developments in the countries or regions in which the issuers operate. These securities may also lose value due to changes in foreign currency exchange rates against the U.S. dollar and/or currencies of other countries. Securities markets in certain countries may be more volatile and/or less liquid than those in the U.S. Investments outside the U.S. may also be subject to different settlement and accounting practices and different regulatory, legal and reporting standards, and may be more difficult to value, than those in the U.S. The risks of investing outside the U.S. may be heightened in connection with investments in emerging markets.
Management — The investment adviser to the fund actively manages the fund’s investments. Consequently, the fund is subject to the risk that the methods and analyses employed by the investment adviser in this process may not produce the desired results. This could cause the fund to lose value or its investment results to lag relevant benchmarks or other funds with similar objectives.
5. Certain investment techniques
Mortgage dollar rolls — The fund has entered into mortgage dollar roll transactions in which the fund sells a mortgage-backed security to a counterparty and simultaneously enters into an agreement with the same counterparty to buy back a similar security on a specific future date at a predetermined price. Mortgage dollar rolls are accounted for as purchase and sale transactions, which may increase the fund’s portfolio turnover rate.
6. Taxation and distributions
Federal income taxation — The fund complies with the requirements under Subchapter M of the Internal Revenue Code applicable to mutual funds and intends to distribute substantially all of its net taxable income and net capital gains each year. The fund is not subject to income taxes to the extent such distributions are made. Therefore, no federal income tax provision is required.
As of and during the period ended December 31, 2013, the fund did not have a liability for any unrecognized tax benefits. The fund recognizes interest and penalties, if any, related to unrecognized tax benefits as income tax expense in the statement of operations. During the period, the fund did not incur any interest or penalties.
The fund is not subject to examination by U.S. federal tax authorities for tax years before 2010 and by state tax authorities for tax years before 2009.
Non-U.S. taxation — Dividend and interest income are recorded net of non-U.S. taxes paid.
Distributions — Distributions paid to shareholders are based on net investment income and net realized gains determined on a tax basis, which may differ from net investment income and net realized gains for financial reporting purposes. These differences are due primarily to different treatment for items such as currency gains and losses; short-term capital gains and losses; capital losses related to sales of certain securities within 30 days of purchase; deferred expenses; paydowns on fixed-income securities; and net capital losses. The fiscal year in which amounts are distributed may differ from the year in which the net investment income and net realized gains are recorded by the fund for financial reporting purposes.
During the year ended December 31, 2013, the fund reclassified $12,584,000 from accumulated net realized loss to undistributed net investment income and $75,000 from undistributed net investment income to capital paid in on shares of beneficial interest to align financial reporting with tax reporting. The fund also utilized capital loss carryforward of $1,810,298,000.
As of December 31, 2013, the tax basis components of distributable earnings, unrealized appreciation (depreciation) and cost of investment securities were as follows (dollars in thousands):
| Undistributed ordinary income | | $ | 50,640 | |
| Undistributed long-term capital gains | | | 80,439 | |
| Gross unrealized appreciation on investment securities | | | 21,384,358 | |
| Gross unrealized depreciation on investment securities | | | (509,949 | ) |
| Net unrealized appreciation on investment securities | | | 20,874,409 | |
| Cost of investment securities | | | 50,001,013 | |
Tax-basis distributions paid to shareholders from ordinary income were as follows (dollars in thousands):
| | | Year ended December 31 | |
| Share class | | 2013 | | | 2012 | |
| Class A | | $ | 652,292 | | | $ | 641,065 | |
| Class B | | | 8,009 | | | | 15,571 | |
| Class C | | | 43,012 | | | | 49,332 | |
| Class F-1 | | | 33,091 | | | | 25,793 | |
| Class F-2 | | | 11,288 | | | | 7,506 | |
| Class 529-A | | | 37,869 | | | | 36,800 | |
| Class 529-B | | | 894 | | | | 1,576 | |
| Class 529-C | | | 6,380 | | | | 7,193 | |
| Class 529-E | | | 1,684 | | | | 1,725 | |
| Class 529-F-1 | | | 1,669 | | | | 1,528 | |
| Class R-1 | | | 1,279 | | | | 1,506 | |
| Class R-2 | | | 12,038 | | | | 13,722 | |
| Class R-3 | | | 40,498 | | | | 41,191 | |
| Class R-4 | | | 61,020 | | | | 50,016 | |
| Class R-5 | | | 45,056 | | | | 40,820 | |
| Class R-6 | | | 60,512 | | | | 42,000 | |
| Total | | $ | 1,016,591 | | | $ | 977,344 | |
7. Fees and transactions with related parties
CRMC, the fund’s investment adviser, is the parent company of American Funds Distributors,® Inc. (“AFD”), the principal underwriter of the fund’s shares, and American Funds Service Company® (“AFS”), the fund’s transfer agent. CRMC, AFD and AFS are considered related parties to the fund.
Investment advisory services — The fund has an investment advisory and service agreement with CRMC that provides for monthly fees accrued daily. These fees are based on a series of decreasing annual rates beginning with 0.420% on the first $500 million of daily net assets and decreasing to 0.210% on such assets in excess of $71 billion. For the year ended December 31, 2013, the investment advisory services fee was $149,567,000, which was equivalent to an annualized rate of 0.236% of average daily net assets.
Class-specific fees and expenses — Expenses that are specific to individual share classes are accrued directly to the respective share class. The principal class-specific fees and expenses are described below:
| | Distribution services — The fund has plans of distribution for all share classes, except Class F-2, R-5 and R-6 shares. Under the plans, the board of trustees approves certain categories of expenses that are used to finance activities primarily intended to sell fund shares and service existing accounts. The plans provide for payments, based on an annualized percentage of average daily net assets, ranging from 0.25% to 1.00% as noted in this section. In some cases, the board of trustees has limited the amounts that may be paid to less than the maximum allowed by the plans. All share classes with a plan may use up to 0.25% of average daily net assets to pay service fees, or to compensate AFD for paying service fees, to firms that have entered into agreements with AFD to provide certain shareholder services. The remaining amounts available to be paid under each plan are paid to dealers to compensate them for their sales activities. |
| | |
| | For Class A and 529-A shares, distribution-related expenses include the reimbursement of dealer and wholesaler commissions paid by AFD for certain shares sold without a sales charge. These share classes reimburse AFD for amounts billed within the prior 15 months but only to the extent that the overall annual expense limit of 0.25% is not exceeded. As of December 31, 2013, there were no unreimbursed expenses subject to reimbursement for Class A or 529-A shares. |
| Share class | | Currently approved limits | | Plan limits |
| Class A | | | 0.25 | % | | | 0.25 | % |
| Class 529-A | | | 0.25 | | | | 0.50 | |
| Classes B and 529-B | | | 1.00 | | | | 1.00 | |
| Classes C, 529-C and R-1 | | | 1.00 | | | | 1.00 | |
| Class R-2 | | | 0.75 | | | | 1.00 | |
| Classes 529-E and R-3 | | | 0.50 | | | | 0.75 | |
| Classes F-1, 529-F-1 and R-4 | | | 0.25 | | | | 0.50 | |
Transfer agent services — The fund has a shareholder services agreement with AFS under which the fund compensates AFS for providing transfer agent services to each of the fund’s share classes. These services include recordkeeping, shareholder communications and transaction processing. In addition, the fund reimburses AFS for amounts paid to third parties for performing transfer agent services on behalf of fund shareholders.
Administrative services — The fund has an administrative services agreement with CRMC under which the fund compensates CRMC for providing administrative services to Class A, C, F, 529 and R shares. These services include, but are not limited to, coordinating, monitoring, assisting and overseeing third parties that provide services to fund shareholders. Under the agreement, Class A shares pay an annual fee of 0.01% and Class C, F, 529 and R shares pay an annual fee of 0.05% of their respective average daily net assets.
529 plan services — Each 529 share class is subject to service fees to compensate the Commonwealth of Virginia for the maintenance of the 529 college savings plan. The quarterly fee is based on a series of decreasing annual rates beginning with 0.10% on the first $30 billion of the net assets invested in Class 529 shares of the American Funds and decreasing to 0.06% on such assets between $120 billion and $150 billion. The fee for any given calendar quarter is accrued and calculated on the basis of the average net assets of Class 529 shares of the American Funds for the last month of the prior calendar quarter. The fee is included in other expenses in the fund’s statement of operations. The Commonwealth of Virginia is not considered a related party.
For the year ended December 31, 2013, class-specific expenses under the agreements were as follows (dollars in thousands):
| Share class | | Distribution
services | | Transfer agent
services | | Administrative
services | | 529 plan
services |
| Class A | | | $92,619 | | | | $46,248 | | | | $3,853 | | | | Not applicable |
| Class B | | | 9,415 | | | | 1,173 | | | | Not applicable | | | | Not applicable |
| Class C | | | 47,783 | | | | 5,639 | | | | 2,396 | | | | Not applicable |
| Class F-1 | | | 4,844 | | | | 2,267 | | | | 971 | | | | Not applicable |
| Class F-2 | | | Not applicable | | | | 685 | | | | 290 | | | | Not applicable |
| Class 529-A | | | 5,231 | | | | 2,120 | | | | 1,179 | | | | $2,307 |
| Class 529-B | | | 1,199 | | | | 123 | | | | 60 | | | | 118 |
| Class 529-C | | | 7,657 | | | | 732 | | | | 385 | | | | 754 |
| Class 529-E | | | 618 | | | | 78 | | | | 62 | | | | 122 |
| Class 529-F-1 | | | — | | | | 82 | | | | 46 | | | | 89 |
| Class R-1 | | | 1,389 | | | | 143 | | | | 70 | | | | Not applicable |
| Class R-2 | | | 9,244 | | | | 3,755 | | | | 622 | | | | Not applicable |
| Class R-3 | | | 14,652 | | | | 4,418 | | | | 1,472 | | | | Not applicable |
| Class R-4 | | | 9,062 | | | | 3,679 | | | | 1,815 | | | | Not applicable |
| Class R-5 | | | Not applicable | | | | 1,150 | | | | 1,147 | | | | Not applicable |
| Class R-6 | | | Not applicable | | | | 16 | | | | 1,476 | | | | Not applicable |
| Total class-specific expenses | | | $203,713 | | | | $72,308 | | | | $15,844 | | | | $3,390 |
Trustees’ deferred compensation — Trustees who are unaffiliated with CRMC may elect to defer the cash payment of part or all of their compensation. These deferred amounts, which remain as liabilities of the fund, are treated as if invested in shares of the fund or other American Funds. These amounts represent general, unsecured liabilities of the fund and vary according to the total returns of the selected funds. Trustees’ compensation of $1,065,000 in the fund’s statement of operations includes $408,000 in current fees (either paid in cash or deferred)and a net increase of $657,000 in the value of the deferred amounts.
Affiliated officers and trustees — Officers and certain trustees of the fund are or may be considered to be affiliated with CRMC, AFD and AFS. No affiliated officers or trustees received any compensation directly from the fund.
8. Capital share transactions
Capital share transactions in the fund were as follows (dollars and shares in thousands):
| | | Sales* | | | Reinvestments of
dividends | | | Repurchases* | | | Net increase
(decrease) | |
| Share class | | | Amount | | | | Shares | | | | Amount | | | | Shares | | | | Amount | | | | Shares | | | | Amount | | | | Shares | |
| | | | | | | | | | | | | | | | | | | | | | | | | | | | | | | | | |
| Year ended December 31, 2013 | | | | | | | | | | | | | | | | | | | | | | | | |
| | | | | | | | | | | | | | | | | | | | | | | | | | | | | | | | | |
| Class A | | $ | 5,771,710 | | | | 257,019 | | | $ | 638,399 | | | | 28,228 | | | $ | (4,829,974 | ) | | | (215,037 | ) | | $ | 1,580,135 | | | | 70,210 | |
| Class B | | | 28,456 | | | | 1,275 | | | | 7,915 | | | | 353 | | | | (512,404 | ) | | | (23,120 | ) | | | (476,033 | ) | | | (21,492 | ) |
| Class C | | | 1,085,377 | | | | 48,422 | | | | 41,910 | | | | 1,864 | | | | (1,071,709 | ) | | | (47,809 | ) | | | 55,578 | | | | 2,477 | |
| Class F-1 | | | 953,519 | | | | 42,210 | | | | 32,319 | | | | 1,425 | | | | (359,799 | ) | | | (15,964 | ) | | | 626,039 | | | | 27,671 | |
| Class F-2 | | | 339,973 | | | | 15,053 | | | | 9,980 | | | | 440 | | | | (103,614 | ) | | | (4,571 | ) | | | 246,339 | | | | 10,922 | |
| Class 529-A | | | 353,333 | | | | 15,775 | | | | 37,862 | | | | 1,677 | | | | (314,364 | ) | | | (14,003 | ) | | | 76,831 | | | | 3,449 | |
| Class 529-B | | | 4,298 | | | | 192 | | | | 894 | | | | 40 | | | | (54,165 | ) | | | (2,423 | ) | | | (48,973 | ) | | | (2,191 | ) |
| Class 529-C | | | 125,242 | | | | 5,596 | | | | 6,377 | | | | 283 | | | | (122,695 | ) | | | (5,469 | ) | | | 8,924 | | | | 410 | |
| Class 529-E | | | 18,834 | | | | 840 | | | | 1,684 | | | | 75 | | | | (20,477 | ) | | | (909 | ) | | | 41 | | | | 6 | |
| Class 529-F-1 | | | 20,468 | | | | 910 | | | | 1,669 | | | | 74 | | | | (18,738 | ) | | | (840 | ) | | | 3,399 | | | | 144 | |
| Class R-1 | | | 45,246 | | | | 2,057 | | | | 1,273 | | | | 57 | | | | (41,530 | ) | | | (1,868 | ) | | | 4,989 | | | | 246 | |
| Class R-2 | | | 305,186 | | | | 13,736 | | | | 12,032 | | | | 536 | | | | (392,794 | ) | | | (17,617 | ) | | | (75,576 | ) | | | (3,345 | ) |
| Class R-3 | | | 809,579 | | | | 36,322 | | | | 40,465 | | | | 1,798 | | | | (780,292 | ) | | | (34,843 | ) | | | 69,752 | | | | 3,277 | |
| Class R-4 | | | 1,267,150 | | | | 57,206 | | | | 61,018 | | | | 2,703 | | | | (984,030 | ) | | | (43,663 | ) | | | 344,138 | | | | 16,246 | |
| Class R-5 | | | 551,314 | | | | 24,580 | | | | 45,053 | | | | 1,991 | | | | (561,872 | ) | | | (24,996 | ) | | | 34,495 | | | | 1,575 | |
| Class R-6 | | | 1,519,961 | | | | 67,390 | | | | 60,512 | | | | 2,664 | | | | (347,726 | ) | | | (15,363 | ) | | | 1,232,747 | | | | 54,691 | |
| Total net increase (decrease) | | $ | 13,199,646 | | | | 588,583 | | | $ | 999,362 | | | | 44,208 | | | $ | (10,516,183 | ) | | | (468,495 | ) | | $ | 3,682,825 | | | | 164,296 | |
| | | | | | | | | | | | | | | | | | | | | | | | | | | | | | | | | |
| Year ended December 31, 2012 | | | | | | | | | | | | | | | | | | | | | | | | |
| | | | | | | | | | | | | | | | | | | | | | | | | | | | | | | | | |
| Class A | | $ | 4,502,559 | | | | 229,859 | | | $ | 625,483 | | | | 31,607 | | | $ | (5,268,947 | ) | | | (268,065 | ) | | $ | (140,905 | ) | | | (6,599 | ) |
| Class B | | | 39,307 | | | | 2,022 | | | | 15,320 | | | | 779 | | | | (849,109 | ) | | | (43,720 | ) | | | (794,482 | ) | | | (40,919 | ) |
| Class C | | | 578,325 | | | | 29,628 | | | | 47,737 | | | | 2,424 | | | | (1,029,078 | ) | | | (52,881 | ) | | | (403,016 | ) | | | (20,829 | ) |
| Class F-1 | | | 617,641 | | | | 31,605 | | | | 25,155 | | | | 1,270 | | | | (295,386 | ) | | | (15,008 | ) | | | 347,410 | | | | 17,867 | |
| Class F-2 | | | 158,930 | | | | 8,048 | | | | 6,627 | | | | 334 | | | | (60,218 | ) | | | (3,069 | ) | | | 105,339 | | | | 5,313 | |
| Class 529-A | | | 361,529 | | | | 18,494 | | | | 36,792 | | | | 1,861 | | | | (265,372 | ) | | | (13,499 | ) | | | 132,949 | | | | 6,856 | |
| Class 529-B | | | 7,203 | | | | 371 | | | | 1,576 | | | | 80 | | | | (72,927 | ) | | | (3,741 | ) | | | (64,148 | ) | | | (3,290 | ) |
| Class 529-C | | | 120,563 | | | | 6,172 | | | | 7,190 | | | | 364 | | | | (113,974 | ) | | | (5,819 | ) | | | 13,779 | | | | 717 | |
| Class 529-E | | | 18,181 | | | | 928 | | | | 1,725 | | | | 87 | | | | (18,106 | ) | | | (922 | ) | | | 1,800 | | | | 93 | |
| Class 529-F-1 | | | 24,921 | | | | 1,272 | | | | 1,528 | | | | 77 | | | | (13,584 | ) | | | (691 | ) | | | 12,865 | | | | 658 | |
| Class R-1 | | | 30,006 | | | | 1,542 | | | | 1,501 | | | | 76 | | | | (51,190 | ) | | | (2,611 | ) | | | (19,683 | ) | | | (993 | ) |
| Class R-2 | | | 313,814 | | | | 16,118 | | | | 13,712 | | | | 697 | | | | (376,195 | ) | | | (19,303 | ) | | | (48,669 | ) | | | (2,488 | ) |
| Class R-3 | | | 708,104 | | | | 36,294 | | | | 41,160 | | | | 2,087 | | | | (744,628 | ) | | | (38,062 | ) | | | 4,636 | | | | 319 | |
| Class R-4 | | | 1,214,962 | | | | 61,671 | | | | 50,012 | | | | 2,526 | | | | (687,947 | ) | | | (34,977 | ) | | | 577,027 | | | | 29,220 | |
| Class R-5 | | | 674,969 | | | | 34,246 | | | | 40,816 | | | | 2,058 | | | | (408,465 | ) | | | (20,625 | ) | | | 307,320 | | | | 15,679 | |
| Class R-6 | | | 646,120 | | | | 32,698 | | | | 42,000 | | | | 2,119 | | | | (216,707 | ) | | | (10,974 | ) | | | 471,413 | | | | 23,843 | |
| Total net increase (decrease) | | $ | 10,017,134 | | | | 510,968 | | | $ | 958,334 | | | | 48,446 | | | $ | (10,471,833 | ) | | | (533,967 | ) | | $ | 503,635 | | | | 25,447 | |
| * Includes exchanges between share classes of the fund. |
| | |
9. Investment transactions
The fund made purchases and sales of investment securities, excluding short-term securities and U.S. government obligations, if any, of $30,417,500,000 and $27,578,579,000, respectively, during the year ended December 31, 2013.
Financial highlights
| | | | | | Income from
investment operations1 | | | | | | | | | | | | | | | | | | | |
| | | Net asset
value,
beginning
of period | | | Net
investment
income2 | | | Net gains
on securities
(both
realized and
unrealized) | | | Total from
investment
operations | | | Dividends
(from net
investment
income) | | | Net asset
value, end
of period | | | Total
return3 | | | Net assets,
end of period
(in millions) | | | Ratio of
expenses
to average
net assets | | | Ratio of
net income
to average
net assets2 | |
| Class A: | | | | | | | | | | | | | | | | | | | | | | | | | | | | | | | | | | | | | | | | |
| Year ended 12/31/2013 | | $ | 20.40 | | | $ | .36 | | | $ | 4.04 | | | $ | 4.40 | | | $ | (.38 | ) | | $ | 24.42 | | | | 21.73 | % | | $ | 42,735 | | | | .61 | % | | | 1.62 | % |
| Year ended 12/31/2012 | | | 18.21 | | | | .38 | | | | 2.19 | | | | 2.57 | | | | (.38 | ) | | | 20.40 | | | | 14.19 | | | | 34,272 | | | | .63 | | | | 1.94 | |
| Year ended 12/31/2011 | | | 17.93 | | | | .36 | | | | .32 | | | | .68 | | | | (.40 | ) | | | 18.21 | | | | 3.82 | | | | 30,716 | | | | .62 | | | | 1.97 | |
| Year ended 12/31/2010 | | | 16.21 | | | | .40 | | | | 1.68 | | | | 2.08 | | | | (.36 | ) | | | 17.93 | | | | 13.02 | | | | 31,409 | | | | .63 | | | | 2.42 | |
| Year ended 12/31/2009 | | | 13.78 | | | | .40 | | | | 2.44 | | | | 2.84 | | | | (.41 | ) | | | 16.21 | | | | 21.08 | | | | 29,675 | | | | .67 | | | | 2.80 | |
| Class B: | | | | | | | | | | | | | | | | | | | | | | | | | | | | | | | | | | | | | | | | |
| Year ended 12/31/2013 | | | 20.35 | | | | .19 | | | | 4.03 | | | | 4.22 | | | | (.20 | ) | | | 24.37 | | | | 20.81 | | | | 821 | | | | 1.36 | | | | .86 | |
| Year ended 12/31/2012 | | | 18.16 | | | | .23 | | | | 2.19 | | | | 2.42 | | | | (.23 | ) | | | 20.35 | | | | 13.35 | | | | 1,123 | | | | 1.38 | | | | 1.17 | |
| Year ended 12/31/2011 | | | 17.87 | | | | .22 | | | | .33 | | | | .55 | | | | (.26 | ) | | | 18.16 | | | | 3.08 | | | | 1,745 | | | | 1.38 | | | | 1.21 | |
| Year ended 12/31/2010 | | | 16.16 | | | | .28 | | | | 1.66 | | | | 1.94 | | | | (.23 | ) | | | 17.87 | | | | 12.12 | | | | 2,573 | | | | 1.38 | | | | 1.66 | |
| Year ended 12/31/2009 | | | 13.73 | | | | .29 | | | | 2.44 | | | | 2.73 | | | | (.30 | ) | | | 16.16 | | | | 20.24 | | | | 3,305 | | | | 1.43 | | | | 2.06 | |
| Class C: | | | | | | | | | | | | | | | | | | | | | | | | | | | | | | | | | | | | | | | | |
| Year ended 12/31/2013 | | | 20.31 | | | | .19 | | | | 4.00 | | | | 4.19 | | | | (.20 | ) | | | 24.30 | | | | 20.72 | | | | 5,247 | | | | 1.41 | | | | .83 | |
| Year ended 12/31/2012 | | | 18.13 | | | | .22 | | | | 2.18 | | | | 2.40 | | | | (.22 | ) | | | 20.31 | | | | 13.30 | | | | 4,334 | | | | 1.42 | | | | 1.14 | |
| Year ended 12/31/2011 | | | 17.85 | | | | .21 | | | | .32 | | | | .53 | | | | (.25 | ) | | | 18.13 | | | | 3.00 | | | | 4,247 | | | | 1.42 | | | | 1.17 | |
| Year ended 12/31/2010 | | | 16.14 | | | | .27 | | | | 1.67 | | | | 1.94 | | | | (.23 | ) | | | 17.85 | | | | 12.11 | | | | 4,576 | | | | 1.43 | | | | 1.61 | |
| Year ended 12/31/2009 | | | 13.72 | | | | .29 | | | | 2.43 | | | | 2.72 | | | | (.30 | ) | | | 16.14 | | | | 20.16 | | | | 4,429 | | | | 1.45 | | | | 2.02 | |
| Class F-1: | | | | | | | | | | | | | | | | | | | | | | | | | | | | | | | | | | | | | | | | |
| Year ended 12/31/2013 | | | 20.39 | | | | .36 | | | | 4.03 | | | | 4.39 | | | | (.37 | ) | | | 24.41 | | | | 21.70 | | | | 2,471 | | | | .66 | | | | 1.58 | |
| Year ended 12/31/2012 | | | 18.21 | | | | .38 | | | | 2.18 | | | | 2.56 | | | | (.38 | ) | | | 20.39 | | | | 14.13 | | | | 1,500 | | | | .64 | | | | 1.94 | |
| Year ended 12/31/2011 | | | 17.92 | | | | .36 | | | | .33 | | | | .69 | | | | (.40 | ) | | | 18.21 | | | | 3.87 | | | | 1,014 | | | | .63 | | | | 1.96 | |
| Year ended 12/31/2010 | | | 16.21 | | | | .40 | | | | 1.67 | | | | 2.07 | | | | (.36 | ) | | | 17.92 | | | | 12.95 | | | | 895 | | | | .63 | | | | 2.41 | |
| Year ended 12/31/2009 | | | 13.78 | | | | .41 | | | | 2.44 | | | | 2.85 | | | | (.42 | ) | | | 16.21 | | | | 21.13 | | | | 885 | | | | .64 | | | | 2.85 | |
| Class F-2: | | | | | | | | | | | | | | | | | | | | | | | | | | | | | | | | | | | | | | | | |
| Year ended 12/31/2013 | | | 20.39 | | | | .41 | | | | 4.04 | | | | 4.45 | | | | (.43 | ) | | | 24.41 | | | | 21.99 | | | | 768 | | | | .41 | | | | 1.83 | |
| Year ended 12/31/2012 | | | 18.21 | | | | .43 | | | | 2.18 | | | | 2.61 | | | | (.43 | ) | | | 20.39 | | | | 14.40 | | | | 419 | | | | .40 | | | | 2.18 | |
| Year ended 12/31/2011 | | | 17.92 | | | | .40 | | | | .33 | | | | .73 | | | | (.44 | ) | | | 18.21 | | | | 4.12 | | | | 277 | | | | .40 | | | | 2.19 | |
| Year ended 12/31/2010 | | | 16.21 | | | | .44 | | | | 1.67 | | | | 2.11 | | | | (.40 | ) | | | 17.92 | | | | 13.21 | | | | 228 | | | | .40 | | | | 2.63 | |
| Year ended 12/31/2009 | | | 13.78 | | | | .43 | | | | 2.45 | | | | 2.88 | | | | (.45 | ) | | | 16.21 | | | | 21.41 | | | | 164 | | | | .41 | | | | 2.87 | |
| Class 529-A: | | | | | | | | | | | | | | | | | | | | | | | | | | | | | | | | | | | | | | | | |
| Year ended 12/31/2013 | | | 20.38 | | | | .34 | | | | 4.03 | | | | 4.37 | | | | (.36 | ) | | | 24.39 | | | | 21.60 | | | | 2,599 | | | | .70 | | | | 1.53 | |
| Year ended 12/31/2012 | | | 18.19 | | | | .36 | | | | 2.19 | | | | 2.55 | | | | (.36 | ) | | | 20.38 | | | | 14.12 | | | | 2,101 | | | | .71 | | | | 1.86 | |
| Year ended 12/31/2011 | | | 17.91 | | | | .34 | | | | .33 | | | | .67 | | | | (.39 | ) | | | 18.19 | | | | 3.75 | | | | 1,751 | | | | .70 | | | | 1.89 | |
| Year ended 12/31/2010 | | | 16.19 | | | | .39 | | | | 1.68 | | | | 2.07 | | | | (.35 | ) | | | 17.91 | | | | 12.97 | | | | 1,589 | | | | .69 | | | | 2.35 | |
| Year ended 12/31/2009 | | | 13.77 | | | | .39 | | | | 2.43 | | | | 2.82 | | | | (.40 | ) | | | 16.19 | | | | 20.97 | | | | 1,291 | | | | .73 | | | | 2.73 | |
| Class 529-B: | | | | | | | | | | | | | | | | | | | | | | | | | | | | | | | | | | | | | | | | |
| Year ended 12/31/2013 | | | 20.39 | | | | .17 | | | | 4.02 | | | | 4.19 | | | | (.17 | ) | | | 24.41 | | | | 20.63 | | | | 108 | | | | 1.49 | | | | .74 | |
| Year ended 12/31/2012 | | | 18.19 | | | | .21 | | | | 2.19 | | | | 2.40 | | | | (.20 | ) | | | 20.39 | | | | 13.24 | | | | 134 | | | | 1.50 | | | | 1.05 | |
| Year ended 12/31/2011 | | | 17.90 | | | | .20 | | | | .33 | | | | .53 | | | | (.24 | ) | | | 18.19 | | | | 2.95 | | | | 180 | | | | 1.49 | | | | 1.09 | |
| Year ended 12/31/2010 | | | 16.19 | | | | .26 | | | | 1.66 | | | | 1.92 | | | | (.21 | ) | | | 17.90 | | | | 11.99 | | | | 244 | | | | 1.48 | | | | 1.56 | |
| Year ended 12/31/2009 | | | 13.76 | | | | .28 | | | | 2.44 | | | | 2.72 | | | | (.29 | ) | | | 16.19 | | | | 20.09 | | | | 284 | | | | 1.53 | | | | 1.95 | |
| Class 529-C: | | | | | | | | | | | | | | | | | | | | | | | | | | | | | | | | | | | | | | | | |
| Year ended 12/31/2013 | | | 20.37 | | | | .17 | | | | 4.03 | | | | 4.20 | | | | (.19 | ) | | | 24.38 | | | | 20.68 | | | | 841 | | | | 1.48 | | | | .76 | |
| Year ended 12/31/2012 | | | 18.19 | | | | .21 | | | | 2.18 | | | | 2.39 | | | | (.21 | ) | | | 20.37 | | | | 13.19 | | | | 694 | | | | 1.49 | | | | 1.08 | |
| Year ended 12/31/2011 | | | 17.90 | | | | .20 | | | | .33 | | | | .53 | | | | (.24 | ) | | | 18.19 | | | | 3.00 | | | | 607 | | | | 1.48 | | | | 1.11 | |
| Year ended 12/31/2010 | | | 16.19 | | | | .26 | | | | 1.67 | | | | 1.93 | | | | (.22 | ) | | | 17.90 | | | | 12.03 | | | | 583 | | | | 1.48 | | | | 1.57 | |
| Year ended 12/31/2009 | | | 13.76 | | | | .28 | | | | 2.44 | | | | 2.72 | | | | (.29 | ) | | | 16.19 | | | | 20.10 | | | | 507 | | | | 1.52 | | | | 1.94 | |
| Class 529-E: | | | | | | | | | | | | | | | | | | | | | | | | | | | | | | | | | | | | | | | | |
| Year ended 12/31/2013 | | | 20.37 | | | | .29 | | | | 4.02 | | | | 4.31 | | | | (.30 | ) | | | 24.38 | | | | 21.31 | | | | 134 | | | | .95 | | | | 1.29 | |
| Year ended 12/31/2012 | | | 18.18 | | | | .31 | | | | 2.19 | | | | 2.50 | | | | (.31 | ) | | | 20.37 | | | | 13.84 | | | | 112 | | | | .97 | | | | 1.60 | |
| Year ended 12/31/2011 | | | 17.90 | | | | .30 | | | | .32 | | | | .62 | | | | (.34 | ) | | | 18.18 | | | | 3.47 | | | | 98 | | | | .97 | | | | 1.62 | |
| Year ended 12/31/2010 | | | 16.19 | | | | .35 | | | | 1.66 | | | | 2.01 | | | | (.30 | ) | | | 17.90 | | | | 12.59 | | | | 92 | | | | .97 | | | | 2.07 | |
| Year ended 12/31/2009 | | | 13.76 | | | | .35 | | | | 2.44 | | | | 2.79 | | | | (.36 | ) | | | 16.19 | | | | 20.71 | | | | 80 | | | | 1.02 | | | | 2.45 | |
| | | | | | Income from
investment operations1 | | | | | | | | | | | | | | | | | | | |
| | | Net asset
value,
beginning
of period | | | Net
investment
income2 | | | Net gains
on securities
(both
realized and
unrealized) | | | Total from
investment
operations | | | Dividends
(from net
investment
income) | | | Net asset
value, end
of period | | | Total
return | | | Net assets,
end of period
(in millions) | | | Ratio of
expenses
to average
net assets | | | Ratio of
net income
to average
net assets2 | |
| Class 529-F-1: | | | | | | | | | | | | | | | | | | | | | | | | | | | | | | | | | | | | | | | | |
| Year ended 12/31/2013 | | $ | 20.36 | | | $ | .39 | | | $ | 4.03 | | | $ | 4.42 | | | $ | (.41 | ) | | $ | 24.37 | | | | 21.88 | % | | $ | 101 | | | | .48 | % | | | 1.76 | % |
| Year ended 12/31/2012 | | | 18.18 | | | | .41 | | | | 2.18 | | | | 2.59 | | | | (.41 | ) | | | 20.36 | | | | 14.32 | | | | 82 | | | | .49 | | | | 2.09 | |
| Year ended 12/31/2011 | | | 17.90 | | | | .38 | | | | .33 | | | | .71 | | | | (.43 | ) | | | 18.18 | | | | 3.98 | | | | 61 | | | | .48 | | | | 2.11 | |
| Year ended 12/31/2010 | | | 16.19 | | | | .43 | | | | 1.67 | | | | 2.10 | | | | (.39 | ) | | | 17.90 | | | | 13.15 | | | | 57 | | | | .47 | | | | 2.57 | |
| Year ended 12/31/2009 | | | 13.76 | | | | .42 | | | | 2.44 | | | | 2.86 | | | | (.43 | ) | | | 16.19 | | | | 21.31 | | | | 42 | | | | .52 | | | | 2.93 | |
| Class R-1: | | | | | | | | | | | | | | | | | | | | | | | | | | | | | | | | | | | | | | | | |
| Year ended 12/31/2013 | | | 20.29 | | | | .19 | | | | 4.01 | | | | 4.20 | | | | (.21 | ) | | | 24.28 | | | | 20.76 | | | | 151 | | | | 1.39 | | | | .84 | |
| Year ended 12/31/2012 | | | 18.12 | | | | .23 | | | | 2.17 | | | | 2.40 | | | | (.23 | ) | | | 20.29 | | | | 13.28 | | | | 121 | | | | 1.40 | | | | 1.16 | |
| Year ended 12/31/2011 | | | 17.83 | | | | .22 | | | | .33 | | | | .55 | | | | (.26 | ) | | | 18.12 | | | | 3.09 | | | | 126 | | | | 1.40 | | | | 1.19 | |
| Year ended 12/31/2010 | | | 16.13 | | | | .27 | | | | 1.66 | | | | 1.93 | | | | (.23 | ) | | | 17.83 | | | | 12.10 | | | | 135 | | | | 1.40 | | | | 1.65 | |
| Year ended 12/31/2009 | | | 13.71 | | | | .29 | | | | 2.43 | | | | 2.72 | | | | (.30 | ) | | | 16.13 | | | | 20.22 | | | | 120 | | | | 1.43 | | | | 2.03 | |
| Class R-2: | | | | | | | | | | | | | | | | | | | | | | | | | | | | | | | | | | | | | | | | |
| Year ended 12/31/2013 | | | 20.30 | | | | .20 | | | | 4.02 | | | | 4.22 | | | | (.22 | ) | | | 24.30 | | | | 20.87 | | | | 1,304 | | | | 1.34 | | | | .90 | |
| Year ended 12/31/2012 | | | 18.13 | | | | .23 | | | | 2.18 | | | | 2.41 | | | | (.24 | ) | | | 20.30 | | | | 13.31 | | | | 1,158 | | | | 1.37 | | | | 1.20 | |
| Year ended 12/31/2011 | | | 17.85 | | | | .22 | | | | .32 | | | | .54 | | | | (.26 | ) | | | 18.13 | | | | 3.05 | | | | 1,079 | | | | 1.38 | | | | 1.21 | |
| Year ended 12/31/2010 | | | 16.14 | | | | .27 | | | | 1.67 | | | | 1.94 | | | | (.23 | ) | | | 17.85 | | | | 12.14 | | | | 1,128 | | | | 1.40 | | | | 1.64 | |
| Year ended 12/31/2009 | | | 13.72 | | | | .29 | | | | 2.43 | | | | 2.72 | | | | (.30 | ) | | | 16.14 | | | | 20.14 | | | | 1,054 | | | | 1.47 | | | | 1.99 | |
| Class R-3: | | | | | | | | | | | | | | | | | | | | | | | | | | | | | | | | | | | | | | | | |
| Year ended 12/31/2013 | | | 20.32 | | | | .29 | | | | 4.02 | | | | 4.31 | | | | (.31 | ) | | | 24.32 | | | | 21.33 | | | | 3,212 | | | | .94 | | | | 1.30 | |
| Year ended 12/31/2012 | | | 18.14 | | | | .32 | | | | 2.18 | | | | 2.50 | | | | (.32 | ) | | | 20.32 | | | | 13.83 | | | | 2,617 | | | | .95 | | | | 1.62 | |
| Year ended 12/31/2011 | | | 17.86 | | | | .30 | | | | .32 | | | | .62 | | | | (.34 | ) | | | 18.14 | | | | 3.50 | | | | 2,331 | | | | .95 | | | | 1.64 | |
| Year ended 12/31/2010 | | | 16.15 | | | | .35 | | | | 1.67 | | | | 2.02 | | | | (.31 | ) | | | 17.86 | | | | 12.64 | | | | 2,408 | | | | .94 | | | | 2.10 | |
| Year ended 12/31/2009 | | | 13.73 | | | | .36 | | | | 2.43 | | | | 2.79 | | | | (.37 | ) | | | 16.15 | | | | 20.73 | | | | 2,326 | | | | .97 | | | | 2.49 | |
| Class R-4: | | | | | | | | | | | | | | | | | | | | | | | | | | | | | | | | | | | | | | | | |
| Year ended 12/31/2013 | | | 20.37 | | | | .36 | | | | 4.02 | | | | 4.38 | | | | (.37 | ) | | | 24.38 | | | | 21.68 | | | | 3,994 | | | | .65 | | | | 1.60 | |
| Year ended 12/31/2012 | | | 18.19 | | | | .38 | | | | 2.18 | | | | 2.56 | | | | (.38 | ) | | | 20.37 | | | | 14.14 | | | | 3,006 | | | | .64 | | | | 1.94 | |
| Year ended 12/31/2011 | | | 17.91 | | | | .35 | | | | .33 | | | | .68 | | | | (.40 | ) | | | 18.19 | | | | 3.80 | | | | 2,152 | | | | .65 | | | | 1.94 | |
| Year ended 12/31/2010 | | | 16.19 | | | | .40 | | | | 1.68 | | | | 2.08 | | | | (.36 | ) | | | 17.91 | | | | 13.01 | | | | 2,007 | | | | .65 | | | | 2.39 | |
| Year ended 12/31/2009 | | | 13.76 | | | | .40 | | | | 2.44 | | | | 2.84 | | | | (.41 | ) | | | 16.19 | | | | 21.09 | | | | 1,736 | | | | .67 | | | | 2.75 | |
| Class R-5: | | | | | | | | | | | | | | | | | | | | | | | | | | | | | | | | | | | | | | | | |
| Year ended 12/31/2013 | | | 20.41 | | | | .43 | | | | 4.03 | | | | 4.46 | | | | (.44 | ) | | | 24.43 | | | | 22.04 | | | | 2,492 | | | | .34 | | | | 1.89 | |
| Year ended 12/31/2012 | | | 18.22 | | | | .44 | | | | 2.19 | | | | 2.63 | | | | (.44 | ) | | | 20.41 | | | | 14.51 | | | | 2,050 | | | | .35 | | | | 2.23 | |
| Year ended 12/31/2011 | | | 17.94 | | | | .41 | | | | .32 | | | | .73 | | | | (.45 | ) | | | 18.22 | | | | 4.11 | | | | 1,544 | | | | .35 | | | | 2.24 | |
| Year ended 12/31/2010 | | | 16.22 | | | | .45 | | | | 1.68 | | | | 2.13 | | | | (.41 | ) | | | 17.94 | | | | 13.32 | | | | 1,545 | | | | .35 | | | | 2.69 | |
| Year ended 12/31/2009 | | | 13.79 | | | | .45 | | | | 2.43 | | | | 2.88 | | | | (.45 | ) | | | 16.22 | | | | 21.44 | | | | 1,332 | | | | .37 | | | | 3.19 | |
| Class R-6: | | | | | | | | | | | | | | | | | | | | | | | | | | | | | | | | | | | | | | | | |
| Year ended 12/31/2013 | | | 20.40 | | | | .44 | | | | 4.03 | | | | 4.47 | | | | (.45 | ) | | | 24.42 | | | | 22.12 | | | | 3,910 | | | | .29 | | | | 1.95 | |
| Year ended 12/31/2012 | | | 18.21 | | | | .45 | | | | 2.19 | | | | 2.64 | | | | (.45 | ) | | | 20.40 | | | | 14.57 | | | | 2,151 | | | | .30 | | | | 2.28 | |
| Year ended 12/31/2011 | | | 17.93 | | | | .42 | | | | .32 | | | | .74 | | | | (.46 | ) | | | 18.21 | | | | 4.16 | | | | 1,486 | | | | .30 | | | | 2.30 | |
| Year ended 12/31/2010 | | | 16.21 | | | | .46 | | | | 1.67 | | | | 2.13 | | | | (.41 | ) | | | 17.93 | | | | 13.38 | | | | 1,063 | | | | .30 | | | | 2.75 | |
| Period from 5/1/2009 to 12/31/20094,5 | | | 13.64 | | | | .30 | | | | 2.61 | | | | 2.91 | | | | (.34 | ) | | | 16.21 | | | | 21.52 | | | | 590 | | | | .33 | 6 | | | 2.94 | 6 |
| | | Year ended December 31 | |
| | | 2013 | | 2012 | | 2011 | | 2010 | | 2009 |
| Portfolio turnover rate for all share classes | | | 55 | % | | | 54 | % | | | 47 | % | | | 37 | % | | | 46 | % |
| 1 | Based on average shares outstanding. |
| 2 | For the year ended December 31, 2010, this column reflects the impact of a corporate action event that resulted in a one-time increase to net investment income. If the corporate action event had not occurred, the Class A net investment income per share and ratio of net income to average net assets would have been lower by $.04 and .25 percentage points, respectively. The impact to the other share classes would have been similar. |
| 3 | Total returns exclude any applicable sales charges, including contingent deferred sales charges. |
| 4 | Based on operations for the period shown and, accordingly, is not representative of a full year. |
| 5 | Class R-6 shares were offered beginning May 1, 2009. |
| 6 | Annualized. |
See Notes to Financial Statements
Report of Independent Registered Public Accounting Firm
To the Shareholders and Board of Trustees of American Balanced Fund:
We have audited the accompanying statement of assets and liabilities of American Balanced Fund (the “Fund”), including the summary investment portfolio, as of December 31, 2013, and the related statement of operations for the year then ended, the statements of changes in net assets for each of the two years in the period then ended, and the financial highlights for each of the periods presented. These financial statements and financial highlights are the responsibility of the Fund’s management. Our responsibility is to express an opinion on these financial statements and financial highlights based on our audits.
We conducted our audits in accordance with the standards of the Public Company Accounting Oversight Board (United States). Those standards require that we plan and perform the audit to obtain reasonable assurance about whether the financial statements and financial highlights are free of material misstatement. The Fund is not required to have, nor were we engaged to perform, an audit of its internal control over financial reporting. Our audits included consideration of internal control over financial reporting as a basis for designing audit procedures that are appropriate in the circumstances, but not for the purpose of expressing an opinion on the effectiveness of the Fund’s internal control over financial reporting. Accordingly, we express no such opinion. An audit also includes examining, on a test basis, evidence supporting the amounts and disclosures in the financial statements, assessing the accounting principles used and significant estimates made by management, as well as evaluating the overall financial statement presentation. Our procedures included confirmation of securities owned as of December 31, 2013, by correspondence with the custodian and brokers; where replies were not received from brokers, we performed other auditing procedures. We believe that our audits provide a reasonable basis for our opinion.
In our opinion, such financial statements and financial highlights referred to above present fairly, in all material respects, the financial position of American Balanced Fund as of December 31, 2013, the results of its operations for the year then ended, the changes in its net assets for each of the two years in the period then ended, and the financial highlights for each of the periods presented, in conformity with accounting principles generally accepted in the United States of America.
Deloitte & Touche LLP
Costa Mesa, California
February 10, 2014
We are required to advise you of the federal tax status of certain distributions received by shareholders during the fiscal year. The fund hereby designates the following amounts for the fund’s fiscal year ended December 31, 2013:
| Qualified dividend income | | | 100% |
| Corporate dividends received deduction | | | $862,237,000 |
| U.S. government income that may be exempt from state taxation | | | $60,183,000 |
Individual shareholders should refer to their Form 1099 or other tax information, which was mailed in January 2014, to determine the calendar year amounts to be included on their 2013 tax returns. Shareholders should consult their tax advisors.
As a fund shareholder, you incur two types of costs: (1) transaction costs, such as initial sales charges on purchase payments and contingent deferred sales charges on redemptions (loads), and (2) ongoing costs, including management fees, distribution and service (12b-1) fees, and other expenses. This example is intended to help you understand your ongoing costs (in dollars) of investing in the fund so you can compare these costs with the ongoing costs of investing in other mutual funds. The example is based on an investment of $1,000 invested at the beginning of the period and held for the entire six-month period (July 1, 2013, through December 31, 2013).
Actual expenses:
The first line of each share class in the table on the following page provides information about actual account values and actual expenses. You may use the information in this line, together with the amount you invested, to estimate the expenses that you paid over the period. Simply divide your account value by $1,000 (for example, an $8,600 account value divided by $1,000 = 8.6), then multiply the result by the number in the first line under the heading entitled “Expenses paid during period” to estimate the expenses you paid on your account during this period.
Hypothetical example for comparison purposes:
The second line of each share class in the table on the following page provides information about hypothetical account values and hypothetical expenses based on the actual expense ratio for the share class and an assumed rate of return of 5.00% per year before expenses, which is not the actual return of the share class. The hypothetical account values and expenses may not be used to estimate the actual ending account balance or expenses you paid for the period. You may use this information to compare the ongoing costs of investing in the fund and other funds. To do so, compare this 5.00% hypothetical example with the 5.00% hypothetical examples that appear in the shareholder reports of the other funds.
Notes:
There are some account fees that are charged to certain types of accounts, such as individual retirement accounts and 529 college savings plan accounts (generally, a $10 fee is charged to set up the account and an additional $10 fee is charged to the account annually), that would increase the amount of expenses paid on your account. In addition, retirement plan participants may be subject to certain fees charged by the plan sponsor, and Class F-1, F-2 and 529-F-1 shareholders may be subject to fees charged by financial intermediaries, typically ranging from 0.75% to 1.50% of assets annually depending on services offered. You can estimate the impact of these fees by adding the amount of the fees to the total estimated expenses you paid on your account during the period as calculated above. In addition, your ending account value would be lower by the amount of these fees.
Note that the expenses shown in the table on the following page are meant to highlight your ongoing costs only and do not reflect any transactional costs, such as sales charges (loads). Therefore, the second line of each share class in the table is useful in comparing ongoing costs only and will not help you determine the relative total costs of owning different funds. In addition, if these transactional costs were included, your costs would have been higher.
| | | Beginning
account value
7/1/2013 | | Ending
account value
12/31/2013 | | Expenses paid
during period* | | Annualized
expense ratio | |
| Class A — actual return | | $ | 1,000.00 | | $ | 1,115.02 | | $ | 3.25 | | | .61 | % |
| Class A — assumed 5% return | | | 1,000.00 | | | 1,022.13 | | | 3.11 | | | .61 | |
| Class B — actual return | | | 1,000.00 | | | 1,110.83 | | | 7.18 | | | 1.35 | |
| Class B — assumed 5% return | | | 1,000.00 | | | 1,018.40 | | | 6.87 | | | 1.35 | |
| Class C — actual return | | | 1,000.00 | | | 1,110.19 | | | 7.45 | | | 1.40 | |
| Class C — assumed 5% return | | | 1,000.00 | | | 1,018.15 | | | 7.12 | | | 1.40 | |
| Class F-1 — actual return | | | 1,000.00 | | | 1,114.80 | | | 3.52 | | | .66 | |
| Class F-1 — assumed 5% return | | | 1,000.00 | | | 1,021.88 | | | 3.36 | | | .66 | |
| Class F-2 — actual return | | | 1,000.00 | | | 1,116.20 | | | 2.19 | | | .41 | |
| Class F-2 — assumed 5% return | | | 1,000.00 | | | 1,023.14 | | | 2.09 | | | .41 | |
| Class 529-A — actual return | | | 1,000.00 | | | 1,114.65 | | | 3.73 | | | .70 | |
| Class 529-A — assumed 5% return | | | 1,000.00 | | | 1,021.68 | | | 3.57 | | | .70 | |
| Class 529-B — actual return | | | 1,000.00 | | | 1,109.90 | | | 7.87 | | | 1.48 | |
| Class 529-B — assumed 5% return | | | 1,000.00 | | | 1,017.74 | | | 7.53 | | | 1.48 | |
| Class 529-C — actual return | | | 1,000.00 | | | 1,110.39 | | | 7.82 | | | 1.47 | |
| Class 529-C — assumed 5% return | | | 1,000.00 | | | 1,017.80 | | | 7.48 | | | 1.47 | |
| Class 529-E — actual return | | | 1,000.00 | | | 1,113.31 | | | 5.06 | | | .95 | |
| Class 529-E — assumed 5% return | | | 1,000.00 | | | 1,020.42 | | | 4.84 | | | .95 | |
| Class 529-F-1 — actual return | | | 1,000.00 | | | 1,115.51 | | | 2.51 | | | .47 | |
| Class 529-F-1 — assumed 5% return | | | 1,000.00 | | | 1,022.84 | | | 2.40 | | | .47 | |
| Class R-1 — actual return | | | 1,000.00 | | | 1,110.32 | | | 7.39 | | | 1.39 | |
| Class R-1 — assumed 5% return | | | 1,000.00 | | | 1,018.20 | | | 7.07 | | | 1.39 | |
| Class R-2 — actual return | | | 1,000.00 | | | 1,111.04 | | | 7.13 | | | 1.34 | |
| Class R-2 — assumed 5% return | | | 1,000.00 | | | 1,018.45 | | | 6.82 | | | 1.34 | |
| Class R-3 — actual return | | | 1,000.00 | | | 1,113.20 | | | 5.01 | | | .94 | |
| Class R-3 — assumed 5% return | | | 1,000.00 | | | 1,020.47 | | | 4.79 | | | .94 | |
| Class R-4 — actual return | | | 1,000.00 | | | 1,114.48 | | | 3.41 | | | .64 | |
| Class R-4 — assumed 5% return | | | 1,000.00 | | | 1,021.98 | | | 3.26 | | | .64 | |
| Class R-5 — actual return | | | 1,000.00 | | | 1,116.43 | | | 1.81 | | | .34 | |
| Class R-5 — assumed 5% return | | | 1,000.00 | | | 1,023.49 | | | 1.73 | | | .34 | |
| Class R-6 — actual return | | | 1,000.00 | | | 1,116.78 | | | 1.55 | | | .29 | |
| Class R-6 — assumed 5% return | | | 1,000.00 | | | 1,023.74 | | | 1.48 | | | .29 | |
| * | The “expenses paid during period” are equal to the “annualized expense ratio,” multiplied by the average account value over the period, multiplied by the number of days in the period, and divided by 365 (to reflect the one-half year period). |
Approval of Investment Advisory and Service Agreement
The fund’s board has approved the fund’s Investment Advisory and Service Agreement (the “agreement”) with Capital Research and Management Company (“CRMC”) for an additional one-year term through December 31, 2014. The board approved the agreement following the recommendation of the fund’s Contracts Committee (the “committee”), which is composed of all of the fund’s independent board members. The board and the committee determined that the fund’s advisory fee structure was fair and reasonable in relation to the services provided and that approving the agreement was in the best interests of the fund and its shareholders.
In reaching this decision, the board and the committee took into account information furnished to them throughout the year and otherwise provided to them, as well as information prepared specifically in connection with their review of the agreement and were advised by their independent counsel. They considered the following factors, among others, but did not identify any single issue or particular piece of information that, in isolation, was the controlling factor, and each board and committee member did not necessarily attribute the same weight to each factor.
1. Nature, extent and quality of services
The board and the committee considered the depth and quality of CRMC’s investment management process, including its global research capabilities; the experience, capability and integrity of its senior management and other personnel; the low turnover rates of its key personnel; the overall financial strength and stability of its organization; and the ongoing evolution of CRMC’s organizational structure designed to maintain and strengthen these qualities. The board and the committee also considered the nature, extent and quality of administrative, compliance and shareholder services provided by CRMC to the fund under the agreement and other agreements, as well as the benefits to fund shareholders from investing in a fund that is part of a large family of funds. The board and the committee concluded that the nature, extent and quality of the services provided by CRMC have benefited and should continue to benefit the fund and its shareholders.
2. Investment results
The board and the committee considered the investment results of the fund in light of its objectives of providing conservation of capital, current income and long-term growth of capital and income. They compared the fund’s investment results with those of other relevant funds (including funds that form the basis of the Lipper index for the category in which the fund is included), and data such as relevant market and fund indexes, over various periods through June 30, 2013. This report, including the letter to shareholders and related disclosures, contains certain information about the fund’s investment results. The board and the committee reviewed the fund’s investment results measured against various indexes, including the Lipper Balanced Funds Index, the S&P 500 Index, the Barclays U.S. Aggregate Index and a customized index comprised 60% of the S&P 500 Index and 40% of the Barclays U.S. Aggregate Index. They noted that the investment results of the fund generally exceeded those of these indexes for the lifetime, 20-year, 10-year, 5-year and shorter periods, except for the Lipper Balanced Funds Index and the S&P 500 Index where comparisons were mixed. They also noted that the volatility of the fund’s monthly returns for such periods was at or near that of the Lipper Balanced Funds Index and less than that of the S&P 500 Index. The board and the committee concluded that the fund’s investment results have been satisfactory and that CRMC’s record in managing the fund indicated that its continued management should benefit the fund and its shareholders.
3. Advisory fees and total expenses
The board and the committee compared the advisory fees and total expense levels of the fund to those of other relevant funds. They observed that the fund’s advisory fees and expenses generally compared favorably to those of other similar funds included in the Lipper Balanced Funds category. The board and the committee also considered the breakpoint discounts in the fund’s advisory fee structure that reduce the level of fees charged by CRMC to the fund as fund assets increase. In addition, they reviewed information regarding the effective advisory fees charged to non-mutual fund clients by CRMC and its affiliates. They noted that, to the extent there were differences between the advisory fees paid by the fund and the advisory fees paid by those clients, the differences appropriately reflected the investment, operational and regulatory differences between advising the fund and the other clients. The board and the committee concluded that the fund’s cost structure was fair and reasonable in relation to the services provided, and that the fund’s shareholders receive reasonable value in return for the advisory fees and other amounts paid to CRMC by the fund.
4. Ancillary benefits
The board and the committee considered a variety of other benefits that CRMC and its affiliates receive as a result of CRMC’s relationship with the fund and the other American Funds, including fees for administrative services provided to certain share classes; fees paid to CRMC’s affiliated transfer agent; sales charges and distribution fees received and retained by the fund’s principal underwriter, an affiliate of CRMC; and possible ancillary benefits to CRMC and its institutional management affiliates in managing other investment vehicles. The board and the committee reviewed CRMC’s portfolio trading practices, noting that while CRMC receives the benefit of research provided by broker-dealers executing portfolio transactions on behalf of the fund, it does not obtain third-party research or other services in return for allocating brokerage to such broker-dealers. The board and the committee took these ancillary benefits into account in evaluating the reasonableness of the advisory fees and other amounts paid to CRMC by the fund.
5. Adviser financial information
The board and the committee reviewed information regarding CRMC’s costs of providing services to the American Funds, including personnel, systems and resources of investment, compliance, trading, accounting and other administrative operations. They considered CRMC’s costs and willingness to invest in technology, infrastructure and staff to maintain and expand services and capabilities, respond to industry and regulatory developments, and attract and retain qualified personnel. They noted information regarding the compensation structure for CRMC’s investment professionals. The board and the committee also compared CRMC’s profitability and compensation data to the reported results and data of several large, publicly-held investment management companies. The board and the committee noted the competitiveness and cyclicality of both the mutual fund industry and the capital markets, and the importance in that environment of CRMC’s long-term profitability for maintaining its independence, company culture and management continuity. They further considered the breakpoint discounts in the fund’s advisory fee structure. The board and the committee concluded that the fund’s advisory fee structure reflected a reasonable sharing of benefits between CRMC and the fund’s shareholders.
Board of trustees and other officers
“Independent” trustees1
| Name and age | | Year first
elected
a trustee
of the fund2 | | Principal occupation(s) during past five years | | Number of
portfolios in fund
complex overseen
by trustee | | Other directorships3
held by trustee |
| William H. Baribault, 68 | | 2012 | | Chairman of the Board and CEO, Oakwood Enterprises (private investment and consulting) | | 69 | | None |
| Vanessa C. L. Chang, 61 | | 2012 | | Director, EL & EL Investments (real estate) | | 7 | | Edison International;
Transocean Ltd. |
| Linda Griego, 66 | | 2012 | | President and CEO, Griego Enterprises, Inc. (business management company); President, Zapgo Entertainment LLC (television production company focused on programming for the Latino market) | | 4 | | AECOM Technology
Corporation; CBS Corporation |
| Leonade D. Jones, 66 | | 1993 | | Retired; former Treasurer, The Washington Post Company (1987–1996) | | 10 | | None |
| William D. Jones, 58 | | 2008 | | Real estate developer/owner, President and CEO, CityLink Investment Corporation (acquires, develops and manages real estate ventures in selected urban communities) and City Scene Management Company (provides commercial asset and property management services) | | 8 | | Sempra Energy |
| James J. Postl, 68 | | 2007 | | Retired; former President and CEO, Pennzoil-Quaker State Company (automotive products and services) (1998–2002) | | 4 | | Pulte, Inc. |
| Margaret Spellings, 56 | | 2012 | | President, George W. Bush Foundation; former President and CEO, Margaret Spellings & Company (public policy and strategic consulting); former President, U.S. Chamber Foundation and Senior Advisor to the President and CEO, U.S. Chamber of Commerce; former U.S. Secretary of Education, U.S. Department of Education | | 69 | | None |
Isaac Stein, 67
Chairman of the Board
(Independent and Non-Executive) | | 2004 | | President, Waverley Associates (private investment fund); Chairman Emeritus of the Board of Trustees, Stanford University | | 4 | | Alexza Pharmaceuticals, Inc.;
Maxygen, Inc. |
“Interested” trustee4,5
Name, age and
position with fund | | Year first
elected
a trustee
or officer
of the fund2 | | Principal occupation(s) during past five years
and positions held with affiliated entities or
the principal underwriter of the fund | | Number of
portfolios in fund
complex overseen
by trustee | | Other directorships3
held by trustee |
Gregory D. Johnson, 50
Vice Chairman of the Board
and President | | 2003 | | Senior Vice President — Capital World Investors, Capital Research and Management Company | | 1 | | None |
The fund’s statement of additional information includes further details about fund trustees and is available without charge upon request by calling American Funds Service Company at (800) 421-4225 or by visiting the American Funds website at americanfunds.com. The address for all trustees and officers of the fund is 333 South Hope Street, Los Angeles, CA 90071, Attention: Secretary.
Other officers5
Name, age and
position with fund | | Year first
elected
an officer
of the fund2 | | Principal occupation(s) during past five years and positions held with affiliated entities
or the principal underwriter of the fund |
Hilda L. Applbaum, 53
Senior Vice President | | 1999 | | Senior Vice President — Capital World Investors, Capital Research and Management Company |
Jeffrey T. Lager, 45
Senior Vice President | | 2002 | | Senior Vice President — Capital World Investors, Capital Research and Management Company; Director, American Funds Service Company6 |
James R. Mulally, 61
Senior Vice President | | 2009 | | Senior Vice President — Capital Fixed Income Investors, Capital Research and Management Company |
Paul F. Roye, 60
Senior Vice President | | 2007 | | Senior Vice President — Fund Business Management Group, Capital Research and Management Company; Chief Legal Officer, Capital Research and Management Company; Director, American Funds Service Company6 |
John H. Smet, 57
Senior Vice President | | 2000 | | Director, Capital Research and Management Company; Senior Vice President — Capital Fixed Income Investors, Capital Research and Management Company |
Alan N. Berro, 53
Vice President | | 2010 | | Senior Vice President — Capital World Investors, Capital Research and Management Company |
Donald H. Rolfe, 41
Vice President | | 2012 | | Chief Compliance Officer, Capital Research Company;6 Chief Compliance Officer, Capital Research and Management Company; Vice President and Senior Counsel — Fund Business Management Group, Capital Research and Management Company |
Patrick F. Quan, 55
Secretary | | 1986 | | Vice President — Fund Business Management Group, Capital Research and Management Company |
Jeffrey P. Regal, 42
Treasurer | | 2011 | | Vice President — Fund Business Management Group, Capital Research and Management Company |
Julie E. Lawton, 40
Assistant Secretary | | 2009 | | Assistant Vice President — Fund Business Management Group, Capital Research and Management Company |
Dori Laskin, 62
Assistant Treasurer | | 2011 | | Vice President — Fund Business Management Group, Capital Research and Management Company |
Ari M. Vinocor, 39
Assistant Treasurer | | 2012 | | Vice President — Fund Business Management Group, Capital Research and Management Company |
| 1 | The term “independent” trustee refers to a trustee who is not an “interested person” of the fund within the meaning of the Investment Company Act of 1940. |
| 2 | Trustees and officers of the fund serve until their resignation, removal or retirement. |
| 3 | This includes all directorships (other than those in the American Funds or other funds managed by Capital Research and Management Company or its affiliates) that are held by each trustee as a trustee or director of a public company or a registered investment company. |
| 4 | “Interested persons” within the meaning of the Investment Company Act of 1940, on the basis of their affiliation with the fund’s investment adviser, Capital Research and Management Company, or affiliated entities (including the fund’s principal underwriter). |
| 5 | All of the officers listed, except James R. Mulally, are officers and/or directors/trustees of one or more of the other funds for which Capital Research and Management Company serves as investment adviser. |
| 6 | Company affiliated with Capital Research and Management Company. |
Office of the fund
One Market
Steuart Tower, Suite 2000
San Francisco, CA 94105-1409
Investment adviser
Capital Research and Management Company
333 South Hope Street
Los Angeles, CA 90071-1406
6455 Irvine Center Drive
Irvine, CA 92618-4518
Transfer agent for shareholder accounts
American Funds Service Company
(Write to the address near you.)
P.O. Box 6007
Indianapolis, IN 46206-6007
P.O. Box 2280
Norfolk, VA 23501-2280
Custodian of assets
JPMorgan Chase Bank
270 Park Avenue
New York, NY 10017-2070
Counsel
Bingham McCutchen LLP
355 South Grand Avenue, Suite 4400
Los Angeles, CA 90071-3106
Independent registered public accounting firm
Deloitte & Touche LLP
695 Town Center Drive
Suite 1200
Costa Mesa, CA 92626-7188
Principal underwriter
American Funds Distributors, Inc.
333 South Hope Street
Los Angeles, CA 90071-1406
Investors should carefully consider investment objectives, risks, charges and expenses. This and other important information is contained in the fund prospectus and summary prospectus, which can be obtained from your financial professional and should be read carefully before investing. You may also call American Funds Service Company (AFS) at (800) 421-4225 or visit the American Funds website at americanfunds.com.
“American Funds Proxy Voting Procedures and Principles” — which describes how we vote proxies relating to portfolio securities — is available on the American Funds website or upon request by calling AFS. The fund files its proxy voting record with the U.S. Securities and Exchange Commission (SEC) for the 12 months ended June 30 by August 31. The proxy voting record is available free of charge on the SEC website at sec.gov and on the American Funds website.
A complete December 31, 2013, portfolio of American Balanced Fund’s investments is available free of charge by calling AFS or visiting the SEC website (where it is part of Form N-CSR).
American Balanced Fund files a complete list of its portfolio holdings with the SEC for the first and third quarters of each fiscal year on Form N-Q. This filing is available free of charge on the SEC website. You may also review or, for a fee, copy this filing at the SEC’s Public Reference Room in Washington, D.C. Additional information regarding the operation of the Public Reference Room may be obtained by calling the SEC’s Office of Investor Education and Advocacy at (800) SEC-0330. Additionally, the list of portfolio holdings is available by calling AFS.
This report is for the information of shareholders of American Balanced Fund, but it also may be used as sales literature when preceded or accompanied by the current prospectus or summary prospectus, which gives details about charges, expenses, investment objectives and operating policies of the fund. If used as sales material after March 31, 2014, this report must be accompanied by an American Funds statistical update for the most recently completed calendar quarter.
The American Funds Advantage
Since 1931, American Funds, part of Capital Group, has helped investors pursue long-term investment success. Our consistent approach — in combination with The Capital SystemSM — has resulted in a superior long-term track record.
Aligned with investor success
We base our decisions on a long-term perspective, which we believe aligns our goals with the interests of our clients. Our portfolio managers average 25 years of investment experience, including 20 years at our company, reflecting a career commitment to our long-term approach.1
The Capital SystemSM
Our investment process, The Capital System, combines individual accountability with teamwork. Each fund is divided into portions that are managed independently by investment professionals with diverse backgrounds, ages and investment approaches. An extensive global research effort is the backbone of our system.
Superior long-term track record
Our equity funds have beaten their Lipper peer indexes in 90% of 10-year periods and 96% of 20-year periods. Our fixed-income funds have beaten their Lipper indexes in 58% of 10-year periods and 63% of 20-year periods.2 Our fund management fees have been among the lowest in the industry.3
| 1 | Portfolio manager experience as of December 31, 2012. |
| 2 | Based on Class A share results for rolling periods through December 31, 2012. Periods covered are the shorter of the fund’s lifetime or since the comparable Lipper index inception date. |
| 3 | Based on management fees for the 20-year period ended December 31, 2012, versus comparable Lipper categories, excluding funds of funds. |

ITEM 2 – Code of Ethics
The Registrant has adopted a Code of Ethics that applies to its Principal Executive Officer and Principal Financial Officer. The Registrant undertakes to provide to any person without charge, upon request, a copy of the Code of Ethics. Such request can be made to American Funds Service Company at 800/421-9225 or to the Secretary of the Registrant, One Market, Steuart Tower, Suite 2000, San Francisco, California 94105.
ITEM 3 – Audit Committee Financial Expert
The Registrant’s board has determined that Vanessa C. L. Chang, a member of the Registrant’s audit committee, is an “audit committee financial expert” and "independent," as such terms are defined in this Item. This designation will not increase the designee’s duties, obligations or liability as compared to his or her duties, obligations and liability as a member of the audit committee and of the board, nor will it reduce the responsibility of the other audit committee members. There may be other individuals who, through education or experience, would qualify as "audit committee financial experts" if the board had designated them as such. Most importantly, the board believes each member of the audit committee contributes significantly to the effective oversight of the Registrant’s financial statements and condition.
ITEM 4 – Principal Accountant Fees and Services
| | Registrant: |
| | | a) Audit Fees: |
| | | | 2012 | $88,000 |
| | | | 2013 | $100,000 |
| | | | |
| | | b) Audit-Related Fees: |
| | | | 2012 | $17,000 |
| | | | 2013 | $25,000 |
| | | | The audit-related fees consist of assurance and related services relating to the examination of the Registrant’s investment adviser conducted in accordance with Statement on Standards for Attestation Engagements Number 16 issued by the American Institute of Certified Public Accountants. |
| | | | |
| | | c) Tax Fees: |
| | | | 2012 | $7,000 |
| | | | 2013 | None |
| | | | The tax fees consist of professional services relating to the preparation of the Registrant’s tax returns including returns relating to the Registrant’s investments in non-U.S. jurisdictions. |
| | | | |
| | | d) All Other Fees: |
| | | | 2012 | None |
| | | | 2013 | None |
| | | | |
| | Adviser and affiliates (includes only fees for non-audit services billed to the adviser and affiliates for engagements that relate directly to the operations and financial reporting of the Registrant and were subject to the pre-approval policies described below): |
| | | a) Audit Fees: |
| | | | Not Applicable |
| | | | |
| | | b) Audit-Related Fees: |
| | | | 2012 | $1,055,000 |
| | | | 2013 | $1,020,000 |
| | | | The audit-related fees consist of assurance and related services relating to the examination of the Registrant’s transfer agent, principal underwriter and investment adviser conducted in accordance with Statement on Standards for Attestation Engagements Number 16 issued by the American Institute of Certified Public Accountants. |
| | | | |
| | | c) Tax Fees: |
| | | | 2012 | $34,000 |
| | | | 2013 | $10,000 |
| | | | The tax fees consist of consulting services relating to the Registrant’s investments. |
| | | | |
| | | d) All Other Fees: |
| | | | 2012 | $2,000 |
| | | | 2013 | $3,000 |
| | | | The other fees consist of subscription services related to an accounting research tool. |
All audit and permissible non-audit services that the Registrant’s audit committee considers compatible with maintaining the independent registered public accounting firm’s independence are required to be pre-approved by the committee. The pre-approval requirement will extend to all non-audit services provided to the Registrant, the investment adviser, and any entity controlling, controlled by, or under common control with the investment adviser that provides ongoing services to the Registrant, if the engagement relates directly to the operations and financial reporting of the Registrant. The committee will not delegate its responsibility to pre-approve these services to the investment adviser. The committee may delegate to one or more committee members the authority to review and pre-approve audit and permissible non-audit services. Actions taken under any such delegation will be reported to the full committee at its next meeting. The pre-approval requirement is waived with respect to non-audit services if certain conditions are met. The pre-approval requirement was not waived for any of the non-audit services listed above provided to the Registrant, adviser and affiliates.
Aggregate non-audit fees paid to the Registrant’s auditors, including fees for all services billed to the Registrant, adviser and affiliates that provide ongoing services to the Registrant, were $1,585,000 for fiscal year 2012 and $1,471,000 for fiscal year 2013. The non-audit services represented by these amounts were brought to the attention of the committee and considered to be compatible with maintaining the auditors’ independence.
ITEM 5 – Audit Committee of Listed Registrants
Not applicable to this Registrant, insofar as the Registrant is not a listed issuer as defined in Rule 10A-3 under the Securities Exchange Act of 1934.
ITEM 6 – Schedule of Investments
 | American Balanced Fund® Investment portfolio December 31, 2013 |
| Common stocks 73.77% | | |
| | | Value |
| Financials 14.08% | Shares | (000) |
| | | |
| Wells Fargo & Co. | 42,215,000 | $ 1,916,561 |
| American Express Co. | 16,224,000 | 1,472,004 |
| Berkshire Hathaway Inc., Class A1 | 6,500 | 1,156,350 |
| Goldman Sachs Group, Inc. | 4,196,700 | 743,907 |
| JPMorgan Chase & Co. | 11,921,000 | 697,140 |
| ACE Ltd. | 5,650,000 | 584,945 |
| Citigroup Inc. | 9,500,000 | 495,045 |
| Weyerhaeuser Co.1 | 12,815,242 | 404,577 |
| Moody’s Corp. | 4,400,000 | 345,268 |
| SunTrust Banks, Inc. | 9,000,000 | 331,290 |
| BlackRock, Inc. | 1,000,000 | 316,470 |
| American Tower Corp. | 3,350,000 | 267,397 |
| U.S. Bancorp | 6,590,000 | 266,236 |
| Arch Capital Group Ltd.1 | 3,890,000 | 232,194 |
| Capital One Financial Corp. | 2,110,000 | 161,647 |
| Chubb Corp. | 1,500,000 | 144,945 |
| Bank of America Corp. | 8,000,000 | 124,560 |
| Allstate Corp. | 2,250,000 | 122,715 |
| Progressive Corp. | 3,130,000 | 85,355 |
| T. Rowe Price Group, Inc. | 720,000 | 60,314 |
| HDFC Bank Ltd. (ADR) | 1,500,000 | 51,660 |
| | | 9,980,580 |
| Consumer discretionary 11.75% | | |
| | | |
| Amazon.com, Inc.1 | 5,668,000 | 2,260,342 |
| Home Depot, Inc. | 25,580,000 | 2,106,257 |
| Comcast Corp., Class A | 20,310,000 | 1,055,409 |
| Walt Disney Co. | 8,000,000 | 611,200 |
| VF Corp. | 7,000,000 | 436,380 |
| Time Warner Inc. | 5,000,000 | 348,600 |
| General Motors Co.1 | 7,500,000 | 306,525 |
| DIRECTV1 | 3,070,000 | 212,106 |
| NIKE, Inc., Class B | 2,554,442 | 200,881 |
| Starbucks Corp. | 2,500,000 | 195,975 |
| Las Vegas Sands Corp. | 2,382,623 | 187,917 |
| Macy’s, Inc. | 3,500,000 | 186,900 |
| Johnson Controls, Inc. | 2,445,000 | 125,429 |
| CBS Corp., Class B | 1,475,000 | 94,017 |
| | | 8,327,938 |
| Industrials 11.21% | | |
| | | |
| Boeing Co. | 14,025,000 | 1,914,272 |
| Union Pacific Corp. | 5,795,000 | 973,560 |
| Lockheed Martin Corp. | 6,392,037 | 950,240 |
| Common stocks | | |
| | | Value |
| Industrials (continued) | Shares | (000) |
| | | |
| General Electric Co. | 29,600,000 | $ 829,688 |
| Parker-Hannifin Corp. | 4,100,000 | 527,424 |
| Deere & Co. | 5,640,000 | 515,101 |
| Caterpillar Inc. | 5,300,000 | 481,293 |
| Cummins Inc. | 3,077,200 | 433,793 |
| United Technologies Corp. | 3,680,000 | 418,784 |
| Honeywell International Inc. | 2,100,000 | 191,877 |
| Canadian Pacific Railway Ltd. | 1,200,000 | 181,483 |
| General Dynamics Corp. | 1,865,000 | 178,201 |
| Northrop Grumman Corp. | 1,250,000 | 143,263 |
| Emerson Electric Co. | 1,495,000 | 104,919 |
| Rockwell Collins, Inc. | 1,400,000 | 103,488 |
| | | 7,947,386 |
| Information technology 8.58% | | |
| | | |
| Microsoft Corp. | 52,450,000 | 1,963,203 |
| Texas Instruments Inc. | 25,365,000 | 1,113,777 |
| ASML Holding NV (New York registered) | 3,812,080 | 357,192 |
| ASML Holding NV | 1,470,405 | 137,634 |
| Google Inc., Class A1 | 415,000 | 465,095 |
| TE Connectivity Ltd. | 6,905,000 | 380,535 |
| Taiwan Semiconductor Manufacturing Co. Ltd. (ADR) | 21,800,000 | 380,192 |
| Analog Devices, Inc. | 4,415,256 | 224,869 |
| Maxim Integrated Products, Inc. | 7,920,000 | 221,047 |
| VeriSign, Inc.1 | 3,600,000 | 215,208 |
| Avago Technologies Ltd. | 3,474,000 | 183,740 |
| Cisco Systems, Inc. | 6,500,000 | 145,925 |
| salesforce.com, inc.1 | 2,390,000 | 131,904 |
| Paychex, Inc. | 2,477,000 | 112,778 |
| Rackspace Hosting, Inc.1 | 1,280,000 | 50,086 |
| | | 6,083,185 |
| Health care 7.62% | | |
| | | |
| Merck & Co., Inc. | 25,730,000 | 1,287,786 |
| Bristol-Myers Squibb Co. | 17,240,000 | 916,306 |
| UnitedHealth Group Inc. | 9,295,000 | 699,913 |
| Pfizer Inc. | 22,320,000 | 683,662 |
| Gilead Sciences, Inc.1 | 7,440,000 | 559,116 |
| Johnson & Johnson | 5,200,000 | 476,268 |
| Baxter International Inc. | 3,345,000 | 232,645 |
| Roche Holding AG | 800,000 | 223,485 |
| Quest Diagnostics Inc. | 3,250,000 | 174,005 |
| Express Scripts Holding Co.1 | 1,515,000 | 106,414 |
| Teva Pharmaceutical Industries Ltd. (ADR) | 1,100,000 | 44,088 |
| | | 5,403,688 |
| Consumer staples 7.03% | | |
| | | |
| Philip Morris International Inc. | 13,200,000 | 1,150,116 |
| Procter & Gamble Co. | 10,130,000 | 824,683 |
| PepsiCo, Inc. | 9,693,800 | 804,004 |
| Nestlé SA | 8,880,000 | 650,035 |
| Nestlé SA (ADR) | 1,000,000 | 73,590 |
| Costco Wholesale Corp. | 5,677,326 | 675,658 |
| Kimberly-Clark Corp. | 2,795,000 | 291,966 |
| Common stocks | | |
| | | Value |
| Consumer staples (continued) | Shares | (000) |
| | | |
| Wal-Mart Stores, Inc. | 2,100,000 | $ 165,249 |
| Unilever NV (New York registered) | 3,635,000 | 146,236 |
| Coca-Cola Co. | 2,580,000 | 106,580 |
| Colgate-Palmolive Co. | 1,400,000 | 91,294 |
| | | 4,979,411 |
| Energy 5.72% | | |
| | | |
| Royal Dutch Shell PLC, Class B (ADR) | 9,158,000 | 687,857 |
| Chevron Corp. | 4,817,000 | 601,692 |
| Enbridge Inc. | 10,222,600 | 446,523 |
| Kinder Morgan, Inc. | 11,070,000 | 398,520 |
| Occidental Petroleum Corp. | 3,000,000 | 285,300 |
| ConocoPhillips | 4,000,000 | 282,600 |
| Transocean Ltd. | 5,700,000 | 281,694 |
| Concho Resources Inc.1 | 2,180,000 | 235,440 |
| Southwestern Energy Co.1 | 4,395,000 | 172,855 |
| Baker Hughes Inc. | 3,000,000 | 165,780 |
| CONSOL Energy Inc. | 4,000,000 | 152,160 |
| Technip SA | 1,000,000 | 96,106 |
| Suncor Energy Inc. | 2,000,000 | 70,115 |
| Petróleo Brasileiro SA — Petrobras, ordinary nominative (ADR) | 5,000,000 | 68,900 |
| TOTAL SA (ADR) | 800,000 | 49,016 |
| Cabot Oil & Gas Corp. | 1,093,100 | 42,369 |
| Cimarex Energy Co. | 178,209 | 18,696 |
| | | 4,055,623 |
| Materials 3.09% | | |
| | | |
| Dow Chemical Co. | 12,980,000 | 576,312 |
| E.I. du Pont de Nemours and Co. | 6,750,000 | 438,547 |
| Mosaic Co. | 6,600,000 | 311,982 |
| Nucor Corp. | 4,500,000 | 240,210 |
| Monsanto Co. | 1,700,000 | 198,135 |
| Potash Corp. of Saskatchewan Inc. | 5,500,000 | 181,280 |
| Steel Dynamics, Inc. | 5,179,668 | 101,211 |
| Alcoa Inc. | 8,500,000 | 90,355 |
| Cliffs Natural Resources Inc. | 1,993,000 | 52,237 |
| | | 2,190,269 |
| Utilities 0.91% | | |
| | | |
| PG&E Corp. | 6,810,000 | 274,307 |
| Duke Energy Corp. | 1,693,333 | 116,857 |
| FirstEnergy Corp. | 2,796,100 | 92,215 |
| Exelon Corp. | 3,250,000 | 89,018 |
| Edison International | 1,500,000 | 69,450 |
| | | 641,847 |
| Telecommunication services 0.44% | | |
| | | |
| AT&T Inc. | 5,420,000 | 190,567 |
| Verizon Communications Inc. | 2,500,000 | 122,850 |
| | | 313,417 |
| Miscellaneous 3.34% | | |
| | | |
| Other common stocks in initial period of acquisition | | 2,369,792 |
| Total common stocks (cost: $31,404,220,000) | | 52,293,136 |
| Preferred stocks 0.03% | | |
| | | Value |
| Miscellaneous 0.03% | | (000) |
| | | |
| Other preferred stocks in initial period of acquisition | | $19,799 |
| Total preferred stocks (cost: $21,000,000) | | 19,799 |
| Bonds, notes & other debt instruments 23.03% | | |
| Corporate bonds & notes 8.54% | Principal amount | |
| Financials 2.75% | (000) | |
| | | |
| Goldman Sachs Group, Inc. 3.625% 2016 | $46,650 | 48,980 |
| Goldman Sachs Group, Inc. 2.90% 2018 | 53,750 | 54,731 |
| Goldman Sachs Group, Inc. 5.25% 2021 | 20,000 | 21,903 |
| Goldman Sachs Group, Inc. 5.75% 2022 | 20,000 | 22,520 |
| Goldman Sachs Group, Inc. 3.625% 2023 | 20,000 | 19,374 |
| Wells Fargo & Co. 1.25% 2016 | 47,000 | 47,375 |
| Wells Fargo & Co. 3.676% 2016 | 19,000 | 20,241 |
| Wells Fargo & Co. 2.15% 2019 | 2,500 | 2,494 |
| Wells Fargo & Co. 4.60% 2021 | 25,000 | 27,413 |
| Ford Motor Credit Co. 1.70% 2016 | 17,000 | 17,203 |
| Ford Motor Credit Co. 2.50% 2016 | 13,000 | 13,343 |
| Ford Motor Credit Co. 1.50% 2017 | 8,500 | 8,502 |
| Ford Motor Credit Co. 2.375% 2018 | 38,250 | 38,651 |
| Ford Motor Credit Co. 4.375% 2023 | 18,000 | 18,103 |
| Bank of America Corp., Series L, 3.625% 2016 | 13,820 | 14,546 |
| Bank of America Corp. 3.75% 2016 | 21,955 | 23,353 |
| Bank of America Corp. 5.75% 2017 | 13,650 | 15,543 |
| Bank of America Corp. 5.625% 2020 | 15,500 | 17,716 |
| Bank of America Corp. 5.00% 2021 | 7,750 | 8,471 |
| Bank of America Corp. 3.30% 2023 | 8,000 | 7,573 |
| Bank of America Corp. 4.10% 2023 | 5,000 | 5,023 |
| Westfield Group 5.75% 20152 | 16,250 | 17,535 |
| Westfield Group 5.70% 20162 | 23,430 | 26,172 |
| Westfield Group 7.125% 20182 | 15,750 | 18,710 |
| Westfield Group 4.625% 20212 | 25,000 | 26,391 |
| Prologis, Inc. 5.625% 2015 | 10,425 | 11,090 |
| Prologis, Inc. 3.35% 2021 | 11,800 | 11,462 |
| Prologis, Inc. 4.25% 2023 | 57,745 | 57,064 |
| Citigroup Inc. 4.587% 2015 | 20,950 | 22,398 |
| Citigroup Inc. 3.953% 2016 | 13,050 | 13,891 |
| Citigroup Inc. 2.50% 2018 | 15,000 | 15,085 |
| Citigroup Inc. 8.50% 2019 | 8,416 | 10,792 |
| Citigroup Inc. 3.875% 2023 | 17,000 | 16,718 |
| JPMorgan Chase & Co. 3.45% 2016 | 15,000 | 15,740 |
| JPMorgan Chase & Co. 1.625% 2018 | 34,500 | 33,801 |
| JPMorgan Chase & Co. 3.25% 2022 | 12,000 | 11,504 |
| JPMorgan Chase & Co. 3.20% 2023 | 13,000 | 12,329 |
| Berkshire Hathaway Inc. 2.20% 2016 | 23,000 | 23,770 |
| Berkshire Hathaway Inc. 2.00% 2018 | 16,340 | 16,359 |
| Berkshire Hathaway Inc. 2.90% 2020 | 21,500 | 21,339 |
| Hospitality Properties Trust 6.30% 2016 | 12,631 | 13,641 |
| Hospitality Properties Trust 6.70% 2018 | 23,400 | 26,263 |
| Hospitality Properties Trust 5.00% 2022 | 4,350 | 4,422 |
| Hospitality Properties Trust 4.50% 2023 | 16,130 | 15,585 |
| Morgan Stanley, Series F, 2.875% 2014 | 18,000 | 18,024 |
| Morgan Stanley 1.75% 2016 | 25,000 | 25,348 |
| Bonds, notes & other debt instruments | | |
| | Principal amount | Value |
| Corporate bonds & notes — Financials (continued) | (000) | (000) |
| | | |
| Morgan Stanley 3.80% 2016 | $ 8,700 | $ 9,208 |
| Morgan Stanley 3.75% 2023 | 5,000 | 4,867 |
| American International Group, Inc. 4.875% 2016 | 6,000 | 6,594 |
| American International Group, Inc. 3.375% 2020 | 28,000 | 28,172 |
| American International Group, Inc. 4.125% 2024 | 21,250 | 21,135 |
| BNP Paribas 3.60% 2016 | 19,000 | 20,013 |
| BNP Paribas 2.40% 2018 | 20,000 | 20,054 |
| BNP Paribas 5.00% 2021 | 12,750 | 13,990 |
| Corporate Office Properties Trust 3.60% 2023 | 12,100 | 10,971 |
| Corporate Office Properties LP 5.25% 2024 | 40,500 | 41,151 |
| Kimco Realty Corp., Series C, 4.82% 2014 | 13,000 | 13,223 |
| Kimco Realty Corp., Series C, 5.783% 2016 | 14,000 | 15,343 |
| Kimco Realty Corp. 5.70% 2017 | 6,180 | 6,908 |
| Kimco Realty Corp. 3.125% 2023 | 15,705 | 14,287 |
| CNA Financial Corp. 5.85% 2014 | 25,000 | 26,191 |
| CNA Financial Corp. 6.50% 2016 | 16,000 | 18,004 |
| ERP Operating LP 5.375% 2016 | 25,000 | 27,579 |
| ERP Operating LP 4.75% 2020 | 12,000 | 12,941 |
| Barclays Bank PLC 2.375% 2014 | 20,000 | 20,011 |
| Barclays Bank PLC 5.125% 2020 | 18,000 | 19,964 |
| Developers Diversified Realty Corp. 7.875% 2020 | 6,365 | 7,865 |
| DDR Corp. 3.50% 2021 | 29,000 | 28,237 |
| Rabobank Nederland/FI 4.625% 2023 | 35,495 | 35,757 |
| ACE INA Holdings Inc. 5.875% 2014 | 20,000 | 20,492 |
| ACE INA Holdings Inc. 2.60% 2015 | 12,665 | 13,109 |
| Intercontinentalexchange, Inc. 2.50% 2018 | 26,000 | 26,207 |
| Intercontinentalexchange, Inc. 4.00% 2023 | 6,000 | 6,038 |
| AvalonBay Communities, Inc. 3.625% 2020 | 19,000 | 19,213 |
| AvalonBay Communities, Inc. 2.85% 2023 | 12,550 | 11,311 |
| Monumental Global Funding III 0.444% 20142,3 | 29,000 | 29,003 |
| Bank of New York Mellon Corp., Series G, 2.50% 2016 | 17,000 | 17,546 |
| Bank of New York Mellon Corp. 2.10% 2019 | 5,000 | 4,959 |
| Bank of New York Mellon Corp. 3.95% 2025 | 5,000 | 4,952 |
| American Express Co. 6.15% 2017 | 22,800 | 26,316 |
| American Tower Corp. 4.625% 2015 | 10,000 | 10,463 |
| American Tower Corp. 3.40% 2019 | 13,550 | 13,803 |
| CME Group Inc. 5.30% 2043 | 21,600 | 22,610 |
| Simon Property Group, LP 6.75% 2014 | 8,495 | 8,555 |
| Simon Property Group, LP 1.50% 20182 | 13,825 | 13,437 |
| Prudential Financial, Inc. 2.30% 2018 | 7,595 | 7,554 |
| Prudential Holdings, LLC, Series C, 8.695% 20232,4 | 11,007 | 14,027 |
| Boston Properties, Inc. 3.70% 2018 | 20,000 | 21,110 |
| Bank of Nova Scotia 2.55% 2017 | 20,000 | 20,750 |
| US Bancorp., Series T, 1.65% 2017 | 19,500 | 19,549 |
| UBS AG 2.25% 2014 | 18,500 | 18,524 |
| ANZ National (International) Ltd. 3.125% 20152 | 16,500 | 17,108 |
| Discover Financial Services 4.20% 2023 | 16,955 | 16,729 |
| BB&T Corp., Series C, 1.60% 2017 | 16,750 | 16,608 |
| MetLife Global Funding I 2.50% 20152 | 16,000 | 16,486 |
| QBE Insurance Group Ltd. 2.40% 20182 | 17,000 | 16,341 |
| HCP, Inc. 5.375% 2021 | 15,000 | 16,333 |
| Toyota Motor Credit Corp. 0.875% 2015 | 16,000 | 16,104 |
| Westpac Banking Corp. 3.00% 2015 | 15,300 | 15,964 |
| New York Life Global Funding 2.10% 20192 | 15,000 | 14,843 |
| Bonds, notes & other debt instruments | | |
| | Principal amount | Value |
| Corporate bonds & notes — Financials (continued) | (000) | (000) |
| | | |
| Sumitomo Mitsui Banking Corp. 2.50% 2018 | $12,475 | $ 12,538 |
| Toronto-Dominion Bank 2.375% 2016 | 12,000 | 12,466 |
| Santander Issuances, SA Unipersonal 6.50% 20192,3 | 11,500 | 11,764 |
| Liberty Mutual Group Inc. 4.25% 20232 | 10,500 | 10,142 |
| Nationwide Mutual Insurance Co. 5.81% 20242,3 | 8,150 | 8,282 |
| Lloyds Banking Group PLC 2.30% 2018 | 7,430 | 7,415 |
| AXA SA, Series B, junior subordinated 6.379% (undated)2,3 | 6,680 | 6,563 |
| PNC Financial Services Group, Inc. 2.854% 2022 | 5,975 | 5,551 |
| Genworth Holdings, Inc. 4.90% 2023 | 5,000 | 4,999 |
| BPCE SA group 2.50% 2018 | 4,925 | 4,902 |
| Regions Financial Corp. 7.75% 2014 | 3,664 | 3,867 |
| Brandywine Operating Partnership, LP 3.95% 2023 | 1,639 | 1,537 |
| Leucadia National Corp. 5.50% 2023 | 1,110 | 1,110 |
| Unum Group 5.625% 2020 | 345 | 378 |
| | | 1,948,514 |
| Consumer staples 1.13% | | |
| | | |
| Altria Group, Inc. 9.25% 2019 | 5,067 | 6,679 |
| Altria Group, Inc. 2.95% 2023 | 12,000 | 10,902 |
| Altria Group, Inc. 4.00% 2024 | 7,400 | 7,235 |
| Altria Group, Inc. 9.95% 2038 | 13,500 | 20,597 |
| Altria Group, Inc. 4.25% 2042 | 20,000 | 17,072 |
| Altria Group, Inc. 4.50% 2043 | 30,000 | 26,514 |
| Altria Group, Inc. 5.375% 2044 | 23,500 | 23,603 |
| Anheuser-Busch InBev NV 3.625% 2015 | 33,000 | 34,335 |
| Anheuser-Busch InBev NV 4.125% 2015 | 16,500 | 17,125 |
| Anheuser-Busch InBev NV 1.375% 2017 | 16,000 | 15,974 |
| Anheuser-Busch InBev NV 7.75% 2019 | 20,000 | 24,988 |
| SABMiller Holdings Inc. 2.45% 20172 | 20,245 | 20,739 |
| SABMiller Holdings Inc. 2.20% 20182 | 26,700 | 26,674 |
| SABMiller Holdings Inc. 3.75% 20222 | 7,900 | 7,932 |
| SABMiller Holdings Inc. 4.95% 20422 | 16,430 | 16,323 |
| Kraft Foods Inc. 2.25% 2017 | 12,725 | 12,891 |
| Kraft Foods Inc. 5.375% 2020 | 10,472 | 11,817 |
| Kraft Foods Inc. 3.50% 2022 | 23,285 | 22,701 |
| Kraft Foods Inc. 6.50% 2040 | 20,000 | 23,329 |
| Coca-Cola Co. 1.50% 2015 | 18,970 | 19,337 |
| Coca-Cola Co. 1.80% 2016 | 17,500 | 18,008 |
| Coca-Cola Co. 3.20% 2023 | 28,650 | 27,566 |
| PepsiCo, Inc. 3.10% 2015 | 17,000 | 17,471 |
| PepsiCo, Inc. 2.50% 2016 | 15,000 | 15,571 |
| PepsiCo, Inc. 7.90% 2018 | 15,000 | 18,760 |
| Pernod Ricard SA 2.95% 20172 | 35,500 | 36,676 |
| Pernod Ricard SA 4.45% 20222 | 9,600 | 9,714 |
| Philip Morris International Inc. 1.875% 2019 | 5,605 | 5,481 |
| Philip Morris International Inc. 2.625% 2023 | 16,000 | 14,495 |
| Philip Morris International Inc. 3.60% 2023 | 21,090 | 20,422 |
| CVS Caremark Corp. 2.25% 2018 | 12,000 | 12,004 |
| CVS Caremark Corp. 4.00% 2023 | 13,300 | 13,277 |
| CVS Caremark Corp. 5.30% 2043 | 12,765 | 13,204 |
| Wal-Mart Stores, Inc. 2.875% 2015 | 11,700 | 12,071 |
| Wal-Mart Stores, Inc. 2.80% 2016 | 25,000 | 26,197 |
| Reynolds American Inc. 3.25% 2022 | 11,420 | 10,529 |
| Reynolds American Inc. 4.85% 2023 | 18,835 | 19,450 |
| Bonds, notes & other debt instruments | | |
| | Principal amount | Value |
| Corporate bonds & notes — Consumer staples (continued) | (000) | (000) |
| | | |
| Reynolds American Inc. 6.15% 2043 | $ 5,350 | $ 5,778 |
| British American Tobacco International Finance PLC 2.125% 20172 | 16,000 | 16,187 |
| British American Tobacco International Finance PLC 9.50% 20182 | 11,955 | 15,752 |
| Imperial Tobacco Finance PLC 2.05% 20182 | 16,000 | 15,829 |
| Imperial Tobacco Finance PLC 3.50% 20232 | 17,000 | 15,860 |
| WM. Wrigley Jr. Co 2.40% 20182 | 300 | 298 |
| WM. Wrigley Jr. Co 3.375% 20202 | 30,670 | 30,328 |
| Kraft Foods Inc. 6.75% 2014 | 16,180 | 16,306 |
| Procter & Gamble Co. 1.45% 2016 | 13,460 | 13,664 |
| ConAgra Foods, Inc. 1.90% 2018 | 4,220 | 4,145 |
| ConAgra Foods, Inc. 3.20% 2023 | 6,800 | 6,315 |
| | | 798,125 |
| Energy 1.04% | | |
| | | |
| StatoilHydro ASA 2.90% 2014 | 13,285 | 13,555 |
| StatoilHydro ASA 1.80% 2016 | 16,000 | 16,367 |
| Statoil ASA 3.125% 2017 | 16,500 | 17,328 |
| StatoilHydro ASA 2.65% 2024 | 7,000 | 6,316 |
| Statoil ASA 3.70% 2024 | 23,200 | 23,042 |
| Statoil ASA 4.25% 2041 | 6,000 | 5,501 |
| Kinder Morgan Energy Partners, LP 6.00% 2017 | 24,610 | 27,603 |
| Kinder Morgan Energy Partners, LP 2.65% 2019 | 20,000 | 19,791 |
| Kinder Morgan Energy Partners, LP 4.15% 2022 | 12,855 | 12,765 |
| Kinder Morgan Energy Partners, LP 3.45% 2023 | 4,000 | 3,717 |
| Kinder Morgan Energy Partners, LP 3.50% 2023 | 6,500 | 5,970 |
| Total Capital SA 3.00% 2015 | 17,000 | 17,615 |
| Total Capital Canada Ltd. 1.45% 2018 | 10,940 | 10,821 |
| Total Capital International 2.125% 2018 | 14,500 | 14,565 |
| Total Capital International 3.70% 2024 | 16,000 | 15,826 |
| Enbridge Inc. 5.60% 2017 | 10,000 | 11,084 |
| Enbridge Inc. 4.00% 2023 | 45,000 | 44,209 |
| Enterprise Products Operating LLC 1.25% 2015 | 10,000 | 10,070 |
| Enterprise Products Operating LLC 5.20% 2020 | 6,355 | 7,071 |
| Enterprise Products Operating LLC 3.35% 2023 | 36,430 | 34,617 |
| Enbridge Energy Partners, LP, Series B, 6.50% 2018 | 12,250 | 14,264 |
| Enbridge Energy Partners, LP 4.20% 2021 | 300 | 302 |
| Enbridge Energy Partners, LP, Series B, 7.50% 2038 | 12,250 | 14,366 |
| Enbridge Energy Partners, LP 5.50% 2040 | 15,000 | 14,503 |
| Devon Energy Corp. 1.875% 2017 | 9,315 | 9,387 |
| Devon Energy Corp. 2.25% 2018 | 11,855 | 11,738 |
| Devon Energy Corp. 3.25% 2022 | 22,500 | 21,462 |
| Shell International Finance BV 1.125% 2017 | 21,000 | 20,720 |
| Shell International Finance BV 2.00% 2018 | 17,715 | 17,737 |
| TransCanada PipeLines Ltd. 0.875% 2015 | 13,000 | 13,042 |
| TransCanada PipeLines Ltd. 5.00% 2043 | 22,000 | 21,685 |
| Spectra Energy Partners, LP 4.75% 2024 | 27,000 | 27,534 |
| Spectra Energy Partners, LP 5.95% 2043 | 2,000 | 2,138 |
| Cenovus Energy Inc. 3.00% 2022 | 7,395 | 6,937 |
| Cenovus Energy Inc. 3.80% 2023 | 23,000 | 22,430 |
| Anadarko Petroleum Corp. 5.95% 2016 | 20,500 | 22,851 |
| Anadarko Petroleum Corp. 6.45% 2036 | 3,700 | 4,156 |
| Williams Partners L.P. 4.125% 2020 | 13,500 | 13,844 |
| Williams Partners L.P. 4.50% 2023 | 12,400 | 12,320 |
| BG Energy Capital PLC 2.50% 20152 | 7,200 | 7,434 |
| Bonds, notes & other debt instruments | | |
| | Principal amount | Value |
| Corporate bonds & notes — Energy (continued) | (000) | (000) |
| | | |
| BG Energy Capital PLC 2.875% 20162 | $12,325 | $ 12,874 |
| Halliburton Co. 2.00% 2018 | 20,000 | 19,859 |
| Petróleos Mexicanos 3.50% 2018 | 18,000 | 18,517 |
| Transocean Inc. 6.375% 2021 | 13,050 | 14,669 |
| Transocean Inc. 3.80% 2022 | 4,000 | 3,793 |
| Marathon Oil Corp. 0.90% 2015 | 16,000 | 16,021 |
| ConocoPhillips 1.05% 2017 | 16,000 | 15,621 |
| Canadian Natural Resources Ltd. 5.70% 2017 | 11,925 | 13,407 |
| Chevron Corp. 3.191% 2023 | 12,000 | 11,524 |
| Schlumberger Investment SA 3.65% 2023 | 9,395 | 9,317 |
| Diamond Offshore Drilling, Inc. 4.875% 2043 | 3,400 | 3,338 |
| | | 735,623 |
| Industrials 0.78% | | |
| | | |
| General Electric Capital Corp. 0.873% 20143 | 50,000 | 50,083 |
| General Electric Co. 0.85% 2015 | 19,500 | 19,600 |
| General Electric Capital Corp. 1.00% 2015 | 13,700 | 13,816 |
| General Electric Capital Corp., Series A, 2.25% 2015 | 21,500 | 22,168 |
| General Electric Capital Corp. 2.95% 2016 | 9,305 | 9,747 |
| General Electric Capital Corp. 2.30% 2017 | 26,100 | 26,839 |
| General Electric Corp. 5.25% 2017 | 16,000 | 18,120 |
| General Electric Capital Corp., Series A, 6.00% 2019 | 15,000 | 17,611 |
| General Electric Co. 2.70% 2022 | 16,000 | 14,981 |
| General Electric Capital Corp. 3.10% 2023 | 18,000 | 17,084 |
| General Electric Co. 4.125% 2042 | 11,000 | 10,165 |
| United Technologies Corp. 1.80% 2017 | 8,435 | 8,569 |
| United Technologies Corp. 3.10% 2022 | 30,000 | 29,343 |
| United Technologies Corp. 4.50% 2042 | 35,460 | 34,443 |
| Burlington Northern Santa Fe LLC 7.00% 2014 | 31,850 | 32,010 |
| Burlington Northern Santa Fe LLC 4.10% 2021 | 7,000 | 7,193 |
| Burlington Northern Santa Fe LLC 3.00% 2023 | 21,300 | 19,843 |
| Burlington Northern Santa Fe LLC 3.85% 2023 | 6,000 | 5,904 |
| Union Pacific Corp. 5.70% 2018 | 13,150 | 15,146 |
| Union Pacific Corp. 3.646% 20242 | 18,800 | 18,172 |
| Continental Airlines, Inc., Series 1997-1, Class A, 7.461% 20164 | 1,581 | 1,634 |
| Continental Airlines, Inc., Series 1998-1, Class A, 6.648% 20194 | 5,035 | 5,366 |
| Continental Airlines, Inc., Series 1997-4, Class A, 6.90% 20194 | 3,370 | 3,616 |
| Continental Airlines, Inc., Series 1999-1, Class A, 6.545% 20204 | 6,264 | 6,857 |
| Continental Airlines, Inc., Series 2001-1, Class A-1, 6.703% 20224 | 6,425 | 7,052 |
| Waste Management, Inc. 2.60% 2016 | 8,890 | 9,181 |
| Waste Management, Inc. 2.90% 2022 | 15,000 | 13,901 |
| American Airlines, Inc., Series 2013-2, Class A, 4.95% 20242,4 | 21,817 | 22,962 |
| Danaher Corp. 2.30% 2016 | 16,795 | 17,343 |
| Atlas Copco AB 5.60% 20172 | 14,000 | 15,666 |
| Canadian National Railway Co. 4.95% 2014 | 6,000 | 6,009 |
| Canadian National Railway Co. 1.45% 2016 | 8,900 | 8,969 |
| Boeing Company 0.95% 2018 | 12,000 | 11,513 |
| Volvo Treasury AB 5.95% 20152 | 9,460 | 10,014 |
| ERAC USA Finance Co. 2.80% 20182 | 9,900 | 10,010 |
| Norfolk Southern Corp. 5.75% 2016 | 7,615 | 8,323 |
| CSX Corp. 6.25% 2015 | 5,990 | 6,404 |
| | | 555,657 |
| Bonds, notes & other debt instruments | | |
| Corporate bonds & notes (continued) | Principal amount | Value |
| Consumer discretionary 0.70% | (000) | (000) |
| | | |
| Comcast Corp. 5.30% 2014 | $15,000 | $ 15,022 |
| Comcast Corp. 6.30% 2017 | 16,750 | 19,517 |
| Comcast Corp. 6.45% 2037 | 15,000 | 17,412 |
| Comcast Corp. 6.95% 2037 | 21,000 | 25,820 |
| Time Warner Inc. 5.875% 2016 | 14,210 | 16,041 |
| Time Warner Inc. 4.05% 2023 | 12,535 | 12,503 |
| Time Warner Inc. 6.25% 2041 | 15,000 | 16,661 |
| Time Warner Inc. 5.35% 2043 | 7,555 | 7,653 |
| Thomson Reuters Corp. 6.50% 2018 | 20,815 | 24,147 |
| Thomson Reuters Corp. 4.30% 2023 | 14,440 | 14,507 |
| Thomson Reuters Corp. 5.65% 2043 | 10,570 | 10,764 |
| DaimlerChrysler North America Holding Corp. 1.30% 20152 | 16,000 | 16,100 |
| DaimlerChrysler North America Holding Corp. 2.40% 20172 | 25,000 | 25,400 |
| Volkswagen International Finance NV 0.858% 20142,3 | 17,000 | 17,019 |
| Volkswagen International Finance NV 2.375% 20172 | 20,000 | 20,558 |
| Home Depot, Inc. 4.40% 2021 | 15,000 | 16,204 |
| Home Depot, Inc. 5.95% 2041 | 15,000 | 17,420 |
| Cox Communications, Inc. 5.45% 2014 | 4,956 | 5,180 |
| Cox Communications, Inc. 2.95% 20232 | 32,000 | 27,973 |
| Time Warner Cable Inc. 6.75% 2018 | 28,590 | 32,079 |
| Walt Disney Co. 0.875% 2014 | 15,500 | 15,574 |
| Walt Disney Co. 1.10% 2017 | 14,255 | 14,054 |
| News America Inc. 3.00% 2022 | 6,000 | 5,642 |
| News America Inc. 5.40% 20432 | 22,000 | 22,281 |
| NBCUniversal Media, LLC 2.875% 2016 | 16,000 | 16,663 |
| NBC Universal Enterprise, Inc. 5.25% (undated)2 | 475 | 473 |
| Nordstrom, Inc. 6.75% 2014 | 10,000 | 10,258 |
| Nordstrom, Inc. 4.00% 2021 | 6,245 | 6,479 |
| Viacom Inc. 4.25% 2023 | 15,100 | 15,074 |
| Dollar General Corp. 3.25% 2023 | 11,629 | 10,701 |
| RCI Banque 3.50% 20182 | 9,815 | 10,041 |
| Macy’s Retail Holdings, Inc. 7.875% 20153 | 4,699 | 5,180 |
| Carnival Corp. 3.95% 2020 | 5,000 | 5,008 |
| Starbucks Corp. 2.00% 2018 | 1,000 | 992 |
| | | 496,400 |
| Health care 0.61% | | |
| | | |
| Cardinal Health, Inc. 4.00% 2015 | 37,100 | 38,842 |
| Cardinal Health, Inc. 5.80% 2016 | 17,500 | 19,563 |
| Cardinal Health, Inc. 4.625% 2020 | 14,500 | 15,655 |
| Cardinal Health, Inc. 3.20% 2022 | 11,850 | 11,265 |
| UnitedHealth Group Inc. 6.00% 2017 | 22,170 | 25,453 |
| UnitedHealth Group Inc. 6.00% 2018 | 35,000 | 40,456 |
| Medco Health Solutions, Inc. 2.75% 2015 | 10,095 | 10,425 |
| Express Scripts Inc. 3.125% 2016 | 23,000 | 24,018 |
| Express Scripts Inc. 3.90% 2022 | 3,645 | 3,650 |
| Express Scripts Inc. 6.125% 2041 | 15,000 | 16,877 |
| Thermo Fisher Scientific Inc. 1.30% 2017 | 15,000 | 14,945 |
| Thermo Fisher Scientific Inc. 2.40% 2019 | 23,375 | 23,172 |
| Thermo Fisher Scientific Inc. 4.15% 2024 | 5,000 | 4,954 |
| Amgen Inc. 2.50% 2016 | 13,340 | 13,815 |
| Amgen Inc. 5.375% 2043 | 25,000 | 25,674 |
| AbbVie Inc. 1.75% 2017 | 16,000 | 15,981 |
| Bonds, notes & other debt instruments | | |
| | Principal amount | Value |
| Corporate bonds & notes — Health care (continued) | (000) | (000) |
| | | |
| AbbVie Inc. 2.90% 2022 | $ 1,300 | $ 1,215 |
| AbbVie Inc. 4.40% 2042 | 22,200 | 20,710 |
| Humana Inc. 3.15% 2022 | 20,000 | 18,521 |
| GlaxoSmithKline Capital Inc. 1.50% 2017 | 17,500 | 17,515 |
| Novartis Capital Corp. 2.90% 2015 | 16,000 | 16,539 |
| Coventry Health Care, Inc. 6.30% 2014 | 11,955 | 12,377 |
| Gilead Sciences, Inc. 3.05% 2016 | 11,425 | 12,071 |
| Baxter International Inc. 3.20% 2023 | 11,000 | 10,513 |
| DENTSPLY International Inc. 2.75% 2016 | 9,830 | 10,120 |
| Roche Holdings, Inc. 7.00% 20392 | 4,000 | 5,274 |
| Catholic Health Initiatives, Series 2012, 1.60% 2017 | 2,000 | 1,939 |
| | | 431,539 |
| Telecommunication services 0.57% | | |
| | | |
| Verizon Communications Inc. 3.00% 2016 | 34,000 | 35,473 |
| Verizon Communications Inc. 5.15% 2023 | 63,250 | 67,934 |
| Verizon Communications Inc. 6.25% 2037 | 20,000 | 22,168 |
| Verizon Communications Inc. 6.55% 2043 | 72,815 | 85,209 |
| Telefónica Emisiones, SAU 3.992% 2016 | 18,000 | 18,951 |
| Telefónica Emisiones, SAU 3.192% 2018 | 16,000 | 16,304 |
| Telefónica Emisiones, SAU 4.57% 2023 | 14,500 | 14,303 |
| Telecom Italia Capital SA 6.999% 2018 | 4,992 | 5,554 |
| Telecom Italia Capital SA 7.175% 2019 | 33,500 | 37,771 |
| SBC Communications Inc. 5.10% 2014 | 15,000 | 15,481 |
| AT&T Inc. 2.40% 2016 | 18,000 | 18,521 |
| AT&T Inc. 4.30% 2042 | 2,500 | 2,121 |
| Deutsche Telekom International Finance BV 4.875% 2014 | 15,500 | 15,831 |
| Deutsche Telekom International Finance BV 9.25% 2032 | 9,719 | 14,401 |
| Deutsche Telekom International Finance BV 4.875% 20422 | 620 | 592 |
| France Télécom 4.375% 2014 | 10,000 | 10,190 |
| France Télécom 4.125% 2021 | 20,000 | 20,254 |
| | | 401,058 |
| Materials 0.42% | | |
| | | |
| Xstrata Canada Financial Corp. 2.70% 20172,3 | 10,000 | 10,118 |
| Glencore Xstrata LLC 2.50% 20192 | 21,000 | 20,347 |
| Xstrata Canada Financial Corp. 4.95% 20212 | 19,000 | 19,251 |
| Glencore Xstrata LLC 4.125% 20232 | 15,000 | 14,022 |
| Rio Tinto Finance (USA) Ltd. 2.25% 2016 | 15,000 | 15,447 |
| Rio Tinto Finance (USA) Ltd. 1.625% 2017 | 16,000 | 16,001 |
| Rio Tinto Finance (USA) Ltd. 2.25% 2018 | 12,850 | 12,795 |
| BHP Billiton Finance (USA) Ltd. 3.85% 2023 | 5,000 | 5,023 |
| BHP Billiton Finance (USA) Ltd. 5.00% 2043 | 33,075 | 33,637 |
| E.I. du Pont de Nemours and Co. 0.666% 20143 | 25,000 | 25,028 |
| Newcrest Finance Pty Ltd. 4.45% 20212 | 15,125 | 12,585 |
| Newcrest Finance Pty Ltd. 4.20% 20222 | 13,735 | 10,978 |
| Teck Resources Ltd. 4.75% 2022 | 10,055 | 10,154 |
| Teck Resources Ltd. 5.40% 2043 | 12,405 | 11,318 |
| Mosaic Co. 4.25% 2023 | 4,600 | 4,545 |
| Mosaic Co. 5.625% 2043 | 12,905 | 13,095 |
| Praxair, Inc. 1.05% 2017 | 16,000 | 15,554 |
| Ecolab Inc. 3.00% 2016 | 12,365 | 12,963 |
| Holcim Ltd. 5.15% 20232 | 12,500 | 12,839 |
| International Paper Co. 7.30% 2039 | 8,425 | 10,405 |
| Bonds, notes & other debt instruments | | |
| | Principal amount | Value |
| Corporate bonds & notes — Materials (continued) | (000) | (000) |
| | | |
| Cliffs Natural Resources Inc. 4.875% 2021 | $ 9,310 | $ 9,057 |
| Rohm and Haas Co. 6.00% 2017 | 5,003 | 5,678 |
| Packaging Corp. of America 4.50% 2023 | 610 | 612 |
| | | 301,452 |
| Utilities 0.39% | | |
| | | |
| MidAmerican Energy Holdings Co., Series D, 5.00% 2014 | 18,000 | 18,094 |
| PacifiCorp., First Mortgage Bonds, 5.65% 2018 | 2,465 | 2,833 |
| MidAmerican Energy Holdings Co. 5.75% 2018 | 15,300 | 17,474 |
| Sierra Pacific Power Co., General and Refunding Mortgage Notes, Series T, 3.375% 2023 | 14,000 | 13,523 |
| MidAmerican Energy Holdings Co. 3.75% 20232 | 7,700 | 7,512 |
| MidAmerican Energy Holdings Co. 5.95% 2037 | 6,125 | 6,704 |
| MidAmerican Energy Holdings Co. 5.15% 20432 | 25,500 | 25,718 |
| Pacific Gas and Electric Co. 3.25% 2023 | 4,100 | 3,891 |
| Pacific Gas and Electric Co. 3.85% 2023 | 16,000 | 15,920 |
| Pacific Gas and Electric Co. 5.125% 2043 | 13,150 | 13,583 |
| E.ON International Finance BV 5.80% 20182 | 24,450 | 28,004 |
| CenterPoint Energy Resources Corp. 4.50% 2021 | 18,751 | 20,006 |
| National Rural Utilities Cooperative Finance Corp. 10.375% 2018 | 8,450 | 11,434 |
| National Rural Utilities Cooperative Finance Corp. 3.40% 2023 | 8,000 | 7,744 |
| American Electric Power Co. 2.95% 2022 | 16,090 | 14,885 |
| Ohio Power Co., Series G, 6.60% 2033 | 125 | 145 |
| Ohio Power Co., Series H, 6.60% 2033 | 40 | 46 |
| Electricité de France SA 6.95% 20392 | 12,000 | 14,664 |
| Virginia Electric and Power Co., Series B, 5.95% 2017 | 10,000 | 11,536 |
| Iberdrola Finance Ireland 3.80% 20142 | 11,000 | 11,223 |
| Entergy Corp. 4.70% 2017 | 9,600 | 10,326 |
| Niagara Mohawk Power 3.553% 20142 | 10,000 | 10,218 |
| Duke Energy Corp. 3.95% 2023 | 7,000 | 7,004 |
| Tri-State Generation and Transmission Assn. Inc., Pass Through Trust, Series 2003-A, 6.04% 20182,4 | 2,381 | 2,519 |
| CMS Energy Corp. 8.75% 2019 | 850 | 1,076 |
| CMS Energy Corp. 5.05% 2022 | 1,000 | 1,080 |
| | | 277,162 |
| Information technology 0.15% | | |
| | | |
| International Business Machines Corp. 1.95% 2016 | 52,500 | 53,966 |
| International Business Machines Corp. 2.00% 2016 | 17,000 | 17,456 |
| International Business Machines Corp. 1.625% 2020 | 17,000 | 15,946 |
| Oracle Corp. 2.375% 2019 | 17,500 | 17,668 |
| Xerox Corp. 2.75% 2019 | 5,000 | 4,958 |
| | | 109,994 |
| Total corporate bonds & notes | | 6,055,524 |
| U.S. Treasury bonds & notes 6.96% | | |
| U.S. Treasury 5.73% | | |
| | | |
| U.S. Treasury 0.25% 2014 | 455,714 | 456,097 |
| U.S. Treasury 0.75% 2014 | 435,715 | 437,009 |
| U.S. Treasury 1.875% 2014 | 194,100 | 195,234 |
| U.S. Treasury 1.875% 2014 | 25,000 | 25,072 |
| U.S. Treasury 2.625% 2014 | 353,571 | 357,984 |
| U.S. Treasury 2.625% 2014 | 150,000 | 152,182 |
| U.S. Treasury 0.625% 2016 | 217,500 | 217,543 |
| Bonds, notes & other debt instruments | | |
| | Principal amount | Value |
| U.S. Treasury bonds & notes — U.S. Treasury (continued) | (000) | (000) |
| | | |
| U.S. Treasury 2.00% 2016 | $135,000 | $ 139,451 |
| U.S. Treasury 4.50% 2016 | 58,500 | 63,564 |
| U.S. Treasury 4.625% 2017 | 68,750 | 76,686 |
| U.S. Treasury 2.625% 2018 | 45,500 | 47,740 |
| U.S. Treasury 1.125% 2019 | 47,750 | 45,816 |
| U.S. Treasury 1.625% 2022 | 439,250 | 395,909 |
| U.S. Treasury 1.75% 2023 | 34,075 | 30,660 |
| U.S. Treasury 2.50% 2023 | 390,600 | 374,425 |
| U.S. Treasury 6.25% 2023 | 86,000 | 110,339 |
| U.S. Treasury 6.375% 2027 | 149,500 | 198,122 |
| U.S. Treasury 5.50% 2028 | 106,750 | 131,320 |
| U.S. Treasury 5.25% 2029 | 15,000 | 18,016 |
| U.S. Treasury 5.375% 2031 | 100,000 | 122,266 |
| U.S. Treasury 4.50% 2036 | 104,882 | 116,352 |
| U.S. Treasury 3.75% 2041 | 46,000 | 44,677 |
| U.S. Treasury 3.125% 2043 | 278,250 | 237,294 |
| U.S. Treasury 3.625% 2043 | 76,405 | 71,874 |
| | | 4,065,632 |
| U.S. Treasury inflation-protected securities5 1.23% | | |
| | | |
| U.S. Treasury Inflation-Protected Security 1.875% 2015 | 108,071 | 113,981 |
| U.S. Treasury Inflation-Protected Security 0.125% 2017 | 174,816 | 179,768 |
| U.S. Treasury Inflation-Protected Security 0.125% 2018 | 78,812 | 80,400 |
| U.S. Treasury Inflation-Protected Security 2.125% 2019 | 54,394 | 60,765 |
| U.S. Treasury Inflation-Protected Security 0.375% 2023 | 234,450 | 225,964 |
| U.S. Treasury Inflation-Protected Security 2.375% 2025 | 61,955 | 71,218 |
| U.S. Treasury Inflation-Protected Security 0.75% 2042 | 51,823 | 41,648 |
| U.S. Treasury Inflation-Protected Security 0.625% 2043 | 123,955 | 95,261 |
| | | 869,005 |
| Total U.S. Treasury bonds & notes | | 4,934,637 |
| Mortgage-backed obligations4 5.99% | | |
| | | |
| Fannie Mae 11.00% 2018 | 82 | 90 |
| Fannie Mae 4.50% 2025 | 8,298 | 8,850 |
| Fannie Mae 4.50% 2025 | 8,197 | 8,741 |
| Fannie Mae, Series 2001-4, Class NA, 10.65% 20253 | 29 | 32 |
| Fannie Mae 2.50% 2026 | 8,349 | 8,307 |
| Fannie Mae 2.50% 2027 | 39,780 | 39,518 |
| Fannie Mae 2.50% 2027 | 37,672 | 37,424 |
| Fannie Mae 2.50% 2027 | 2,684 | 2,661 |
| Fannie Mae 2.50% 2027 | 2,396 | 2,375 |
| Fannie Mae 2.50% 2027 | 2,198 | 2,178 |
| Fannie Mae 2.50% 2027 | 1,324 | 1,312 |
| Fannie Mae 2.50% 2027 | 1,079 | 1,070 |
| Fannie Mae 2.50% 2027 | 1,068 | 1,058 |
| Fannie Mae 3.00% 2027 | 56,912 | 58,249 |
| Fannie Mae 3.00% 2027 | 48,184 | 49,317 |
| Fannie Mae 3.00% 2027 | 26,096 | 26,710 |
| Fannie Mae 2.50% 2028 | 120,812 | 119,743 |
| Fannie Mae 2.50% 2028 | 81,611 | 80,897 |
| Fannie Mae 2.50% 2028 | 32,579 | 32,294 |
| Fannie Mae 2.50% 2028 | 29,476 | 29,215 |
| Bonds, notes & other debt instruments | | |
| | Principal amount | Value |
| Mortgage-backed obligations4 (continued) | (000) | (000) |
| | | |
| Fannie Mae 2.50% 2028 | $ 28,780 | $ 28,591 |
| Fannie Mae 2.50% 2028 | 19,124 | 18,955 |
| Fannie Mae 2.50% 2028 | 13,214 | 13,097 |
| Fannie Mae 2.50% 2028 | 9,478 | 9,394 |
| Fannie Mae 2.50% 2028 | 6,987 | 6,941 |
| Fannie Mae 2.50% 2028 | 3,022 | 3,000 |
| Fannie Mae 2.50% 2028 | 2,969 | 2,947 |
| Fannie Mae 2.50% 2028 | 2,886 | 2,865 |
| Fannie Mae 2.50% 2028 | 2,871 | 2,845 |
| Fannie Mae 2.50% 2028 | 1,987 | 1,970 |
| Fannie Mae 2.50% 2028 | 1,211 | 1,202 |
| Fannie Mae 2.50% 2028 | 962 | 955 |
| Fannie Mae 2.50% 2028 | 530 | 526 |
| Fannie Mae 3.00% 2028 | 101,778 | 104,166 |
| Fannie Mae, Series 2001-20, Class D, 11.009% 20313 | 21 | 22 |
| Fannie Mae 5.50% 2033 | 5,951 | 6,553 |
| Fannie Mae 5.50% 2033 | 5,248 | 5,781 |
| Fannie Mae 5.50% 2033 | 612 | 673 |
| Fannie Mae 4.50% 2034 | 22,134 | 23,580 |
| Fannie Mae 5.00% 2035 | 2,397 | 2,621 |
| Fannie Mae 5.50% 2035 | 2,583 | 2,847 |
| Fannie Mae 5.50% 2035 | 1,398 | 1,540 |
| Fannie Mae 6.50% 2035 | 4,739 | 5,350 |
| Fannie Mae, Series 2006-43, Class JO, principal only, 0% 2036 | 2,531 | 2,323 |
| Fannie Mae 5.50% 2036 | 575 | 633 |
| Fannie Mae 5.50% 2036 | 507 | 557 |
| Fannie Mae, Series 2006-49, Class PA, 6.00% 2036 | 4,735 | 5,226 |
| Fannie Mae 6.00% 2036 | 1,681 | 1,860 |
| Fannie Mae 2.233% 20373 | 5,709 | 6,065 |
| Fannie Mae 6.00% 2037 | 20,938 | 23,266 |
| Fannie Mae 6.50% 2037 | 5,117 | 5,651 |
| Fannie Mae 6.50% 2037 | 4,790 | 5,240 |
| Fannie Mae 6.50% 2037 | 2,461 | 2,693 |
| Fannie Mae 7.00% 2037 | 1,171 | 1,318 |
| Fannie Mae 7.00% 2037 | 1,096 | 1,234 |
| Fannie Mae 7.00% 2037 | 571 | 643 |
| Fannie Mae 5.50% 2038 | 1,295 | 1,424 |
| Fannie Mae 6.50% 2038 | 6,851 | 7,503 |
| Fannie Mae 4.50% 2039 | 28,742 | 30,504 |
| Fannie Mae 6.00% 2039 | 34,107 | 37,795 |
| Fannie Mae 4.00% 2040 | 28,026 | 28,915 |
| Fannie Mae 4.00% 2040 | 23,355 | 24,080 |
| Fannie Mae 4.00% 2040 | 4,861 | 5,019 |
| Fannie Mae 4.194% 20403 | 2,815 | 2,983 |
| Fannie Mae 4.395% 20403 | 1,755 | 1,865 |
| Fannie Mae 4.50% 2040 | 30,488 | 32,373 |
| Fannie Mae 4.50% 2040 | 26,319 | 27,934 |
| Fannie Mae 4.50% 2040 | 19,933 | 21,164 |
| Fannie Mae 4.50% 2040 | 16,347 | 17,359 |
| Fannie Mae 5.00% 2040 | 24,667 | 26,991 |
| Fannie Mae 5.00% 2040 | 4,134 | 4,508 |
| Fannie Mae 5.00% 2040 | 3,087 | 3,357 |
| Fannie Mae 5.00% 2040 | 2,933 | 3,202 |
| Fannie Mae 3.556% 20413 | 17,225 | 17,906 |
| Bonds, notes & other debt instruments | | |
| | Principal amount | Value |
| Mortgage-backed obligations4 (continued) | (000) | (000) |
| | | |
| Fannie Mae 4.00% 2041 | $19,039 | $19,648 |
| Fannie Mae 4.00% 2041 | 16,181 | 16,697 |
| Fannie Mae 4.00% 2041 | 14,660 | 15,128 |
| Fannie Mae 4.00% 2041 | 14,444 | 14,902 |
| Fannie Mae 4.00% 2041 | 9,222 | 9,503 |
| Fannie Mae 4.00% 2041 | 8,428 | 8,702 |
| Fannie Mae 4.00% 2041 | 4,936 | 5,097 |
| Fannie Mae 4.00% 2041 | 4,075 | 4,208 |
| Fannie Mae 4.00% 2041 | 2,809 | 2,901 |
| Fannie Mae 4.50% 2041 | 44,783 | 47,541 |
| Fannie Mae 4.50% 2041 | 12,011 | 12,750 |
| Fannie Mae 4.50% 2041 | 11,692 | 12,419 |
| Fannie Mae 4.50% 2041 | 9,186 | 9,754 |
| Fannie Mae 5.00% 2041 | 5,359 | 5,857 |
| Fannie Mae 5.00% 2041 | 4,847 | 5,296 |
| Fannie Mae 5.00% 2041 | 4,514 | 4,932 |
| Fannie Mae 5.00% 2041 | 3,369 | 3,682 |
| Fannie Mae 5.00% 2041 | 3,177 | 3,474 |
| Fannie Mae 5.00% 2041 | 2,969 | 3,247 |
| Fannie Mae 5.00% 2041 | 2,309 | 2,525 |
| Fannie Mae 5.00% 2041 | 1,895 | 2,072 |
| Fannie Mae 5.00% 2041 | 961 | 1,044 |
| Fannie Mae 5.00% 2041 | 882 | 964 |
| Fannie Mae 5.00% 2041 | 814 | 889 |
| Fannie Mae 5.00% 2041 | 419 | 458 |
| Fannie Mae 5.00% 2041 | 392 | 428 |
| Fannie Mae 5.00% 2041 | 377 | 413 |
| Fannie Mae 5.00% 2041 | 254 | 278 |
| Fannie Mae 5.00% 2041 | 160 | 175 |
| Fannie Mae 5.00% 2041 | 117 | 127 |
| Fannie Mae 5.00% 2041 | 73 | 80 |
| Fannie Mae 5.00% 2041 | 41 | 44 |
| Fannie Mae, Series 2001-T10, Class A-1, 7.00% 2041 | 331 | 386 |
| Fannie Mae, Series 2001-50, Class BA, 7.00% 2041 | 258 | 291 |
| Fannie Mae, Series 2002-W3, Class A-5, 7.50% 2041 | 430 | 504 |
| Fannie Mae 3.50% 2042 | 26,832 | 26,691 |
| Fannie Mae 3.50% 2042 | 7,520 | 7,487 |
| Fannie Mae 4.00% 2042 | 42,381 | 43,754 |
| Fannie Mae 4.00% 2042 | 34,220 | 35,312 |
| Fannie Mae 4.00% 2042 | 31,578 | 32,585 |
| Fannie Mae 4.00% 2042 | 19,424 | 20,046 |
| Fannie Mae 4.00% 2042 | 18,394 | 18,951 |
| Fannie Mae 4.00% 2042 | 13,828 | 14,277 |
| Fannie Mae 4.00% 2042 | 11,898 | 12,275 |
| Fannie Mae 4.00% 2042 | 11,826 | 12,215 |
| Fannie Mae 4.00% 2042 | 11,308 | 11,670 |
| Fannie Mae 4.00% 2042 | 5,915 | 6,098 |
| Fannie Mae 4.00% 2042 | 3,244 | 3,346 |
| Fannie Mae 4.00% 2042 | 3,137 | 3,234 |
| Fannie Mae 5.00% 2042 | 666 | 725 |
| Fannie Mae 5.00% 2042 | 515 | 559 |
| Fannie Mae, Series 2002-W1, Class 2A, 6.68% 20423 | 490 | 572 |
| Fannie Mae 3.00% 2043 | 40,189 | 38,274 |
| Fannie Mae 3.00% 2043 | 23,280 | 22,169 |
| Bonds, notes & other debt instruments | | |
| | Principal amount | Value |
| Mortgage-backed obligations4 (continued) | (000) | (000) |
| | | |
| Fannie Mae 3.00% 2043 | $ 11,877 | $ 11,312 |
| Fannie Mae 3.00% 2043 | 6,632 | 6,308 |
| Fannie Mae 3.00% 2043 | 4,494 | 4,274 |
| Fannie Mae 3.00% 2043 | 4,201 | 3,996 |
| Fannie Mae 3.50% 2043 | 58,459 | 58,242 |
| Fannie Mae 3.50% 2043 | 52,976 | 52,696 |
| Fannie Mae 3.50% 2043 | 32,717 | 32,546 |
| Fannie Mae 3.50% 2043 | 21,972 | 21,891 |
| Fannie Mae 3.50% 2043 | 21,250 | 21,138 |
| Fannie Mae 3.50% 2043 | 11,156 | 11,115 |
| Fannie Mae 3.50% 2043 | 9,674 | 9,638 |
| Fannie Mae 3.50% 2043 | 9,564 | 9,529 |
| Fannie Mae 3.50% 2043 | 7,556 | 7,517 |
| Fannie Mae 4.00% 2043 | 89,805 | 92,680 |
| Fannie Mae 4.00% 2043 | 73,063 | 75,463 |
| Fannie Mae 4.00% 2043 | 62,843 | 64,856 |
| Fannie Mae 4.00% 2043 | 21,629 | 22,330 |
| Fannie Mae 4.00% 2043 | 11,783 | 12,160 |
| Fannie Mae 4.00% 2043 | 10,204 | 10,530 |
| Fannie Mae 4.00% 2043 | 6,624 | 6,835 |
| Fannie Mae 4.00% 2043 | 5,103 | 5,268 |
| Fannie Mae 4.00% 2043 | 3,680 | 3,801 |
| Fannie Mae 4.00% 2043 | 1,162 | 1,200 |
| Fannie Mae 4.00% 2043 | 835 | 862 |
| Fannie Mae 4.00% 2043 | 683 | 706 |
| Fannie Mae 4.00% 2043 | 681 | 703 |
| Fannie Mae 4.00% 2043 | 658 | 680 |
| Fannie Mae 4.00% 2043 | 539 | 558 |
| Fannie Mae 4.00% 2043 | 490 | 506 |
| Fannie Mae 4.00% 2043 | 163 | 168 |
| Fannie Mae 4.50% 2043 | 32,694 | 34,758 |
| Fannie Mae 4.50% 2043 | 29,520 | 31,371 |
| Fannie Mae 4.50% 2043 | 20,301 | 21,579 |
| Fannie Mae 4.50% 2043 | 8,003 | 8,508 |
| Fannie Mae 3.00% 2044 | 218,850 | 207,822 |
| Fannie Mae 6.50% 2047 | 695 | 761 |
| Fannie Mae 6.50% 2047 | 529 | 579 |
| Fannie Mae 6.50% 2047 | 278 | 305 |
| Fannie Mae 6.50% 2047 | 132 | 144 |
| Fannie Mae 7.00% 2047 | 520 | 575 |
| Fannie Mae 7.00% 2047 | 480 | 531 |
| Fannie Mae 7.00% 2047 | 292 | 323 |
| Fannie Mae 7.00% 2047 | 271 | 300 |
| Fannie Mae 7.00% 2047 | 144 | 160 |
| Fannie Mae 7.00% 2047 | 126 | 139 |
| Fannie Mae 7.00% 2047 | 90 | 100 |
| Fannie Mae 7.00% 2047 | 28 | 31 |
| Government National Mortgage Assn. 10.00% 2021 | 187 | 205 |
| Government National Mortgage Assn. 6.00% 2038 | 19,620 | 21,746 |
| Government National Mortgage Assn. 6.50% 2038 | 9,573 | 10,739 |
| Government National Mortgage Assn. 4.00% 2039 | 3,097 | 3,228 |
| Government National Mortgage Assn. 4.00% 2039 | 3,075 | 3,205 |
| Government National Mortgage Assn. 4.00% 2039 | 1,998 | 2,082 |
| Government National Mortgage Assn. 4.00% 2040 | 19,131 | 20,048 |
| Bonds, notes & other debt instruments | | |
| | Principal amount | Value |
| Mortgage-backed obligations4 (continued) | (000) | (000) |
| | | |
| Government National Mortgage Assn. 4.00% 2040 | $ 15,888 | $ 16,562 |
| Government National Mortgage Assn. 4.00% 2040 | 5,264 | 5,488 |
| Government National Mortgage Assn. 4.00% 2040 | 4,894 | 5,121 |
| Government National Mortgage Assn. 4.00% 2040 | 4,751 | 4,977 |
| Government National Mortgage Assn. 4.00% 2040 | 3,143 | 3,276 |
| Government National Mortgage Assn. 4.00% 2040 | 2,072 | 2,160 |
| Government National Mortgage Assn. 4.00% 2041 | 37,453 | 39,057 |
| Government National Mortgage Assn. 4.00% 2041 | 4,944 | 5,153 |
| Government National Mortgage Assn. 4.00% 2041 | 2,757 | 2,874 |
| Government National Mortgage Assn. 4.00% 2041 | 679 | 708 |
| Government National Mortgage Assn. 4.00% 2043 | 158,007 | 164,566 |
| Government National Mortgage Assn. 4.00% 2043 | 32,928 | 34,327 |
| Government National Mortgage Assn. 4.00% 2043 | 21,647 | 22,565 |
| Government National Mortgage Assn. 4.50% 2043 | 69,270 | 74,184 |
| Freddie Mac, Series 2013-DN2, Class M-1, 1.618% 20233 | 9,097 | 9,143 |
| Freddie Mac, Series 2013-DN1, Class M-1, 3.565% 20233 | 11,273 | 11,622 |
| Freddie Mac 4.50% 2023 | 108 | 114 |
| Freddie Mac 5.00% 2023 | 6,071 | 6,491 |
| Freddie Mac 5.00% 2023 | 4,273 | 4,568 |
| Freddie Mac 5.00% 2023 | 2,385 | 2,549 |
| Freddie Mac 5.00% 2023 | 1,193 | 1,277 |
| Freddie Mac 5.00% 2023 | 1,094 | 1,169 |
| Freddie Mac 5.00% 2023 | 963 | 1,030 |
| Freddie Mac 5.00% 2024 | 8,240 | 8,910 |
| Freddie Mac 6.00% 2026 | 3,168 | 3,472 |
| Freddie Mac 6.00% 2026 | 2,474 | 2,712 |
| Freddie Mac 6.00% 2026 | 2,062 | 2,260 |
| Freddie Mac 4.50% 2027 | 616 | 663 |
| Freddie Mac 6.50% 2027 | 1,410 | 1,559 |
| Freddie Mac 6.50% 2027 | 413 | 457 |
| Freddie Mac 6.50% 2027 | 385 | 426 |
| Freddie Mac 6.50% 2028 | 804 | 890 |
| Freddie Mac 4.50% 2029 | 582 | 624 |
| Freddie Mac 4.50% 2031 | 658 | 709 |
| Freddie Mac, Series T-041, Class 3-A, 6.611% 20323 | 2,242 | 2,542 |
| Freddie Mac, Series 3061, Class PN, 5.50% 2035 | 3,847 | 4,207 |
| Freddie Mac, Series 3156, Class PO, principal only, 0% 2036 | 6,012 | 5,533 |
| Freddie Mac, Series 3146, Class PO, principal only, 0% 2036 | 4,268 | 3,952 |
| Freddie Mac, Series 3233, Class PA, 6.00% 2036 | 10,996 | 12,181 |
| Freddie Mac, Series 3318, Class JT, 5.50% 2037 | 8,293 | 9,021 |
| Freddie Mac, Series 3312, Class PA, 5.50% 2037 | 8,056 | 8,764 |
| Freddie Mac, Series 3272, Class PA, 6.00% 2037 | 6,392 | 7,040 |
| Freddie Mac 6.00% 2038 | 3,724 | 4,112 |
| Freddie Mac 6.00% 2038 | 600 | 662 |
| Freddie Mac 4.50% 2040 | 24,229 | 25,713 |
| Freddie Mac 4.50% 2040 | 1,090 | 1,156 |
| Freddie Mac 4.50% 2041 | 2,610 | 2,771 |
| Freddie Mac 4.50% 2041 | 2,550 | 2,707 |
| Freddie Mac 4.50% 2041 | 1,169 | 1,241 |
| Freddie Mac 4.50% 2041 | 898 | 952 |
| Freddie Mac 4.50% 2041 | 839 | 890 |
| Freddie Mac 4.50% 2041 | 542 | 574 |
| Freddie Mac 4.00% 2043 | 46,481 | 47,912 |
| Freddie Mac 4.00% 2043 | 1,927 | 1,986 |
| Bonds, notes & other debt instruments | | |
| | Principal amount | Value |
| Mortgage-backed obligations4 (continued) | (000) | (000) |
| | | |
| Freddie Mac 4.00% 2043 | $ 1,341 | $ 1,382 |
| Freddie Mac 4.00% 2043 | 1,160 | 1,196 |
| Freddie Mac 4.00% 2043 | 933 | 964 |
| Freddie Mac 4.00% 2043 | 777 | 801 |
| Freddie Mac 4.00% 2043 | 588 | 608 |
| J.P. Morgan Chase Commercial Mortgage Securities Corp., Series 2005-CIBC12, Class A-3B, 5.289% 20373 | 10,306 | 10,314 |
| J.P. Morgan Chase Commercial Mortgage Securities Corp., Series 2005-LDP4, Class A-SB, 4.824% 2042 | 5,583 | 5,671 |
| J.P. Morgan Chase Commercial Mortgage Securities Corp., Series 2006-CB15, Class A-4, 5.81% 20433 | 5,654 | 6,108 |
| J.P. Morgan Chase Commercial Mortgage Securities Corp., Series 2006-LDP7, Class A-4, 5.863% 20453 | 16,835 | 18,406 |
| J.P. Morgan Chase Commercial Mortgage Securities Corp., Series 2011-C4, Class A-2, 3.341% 20462 | 15,005 | 15,662 |
| J.P. Morgan Chase Commercial Mortgage Securities Corp., Series 2011-C3A, Class A-2, 3.673% 20462 | 40,900 | 42,925 |
| J.P. Morgan Chase Commercial Mortgage Securities Corp., Series 2007-CB19, Class A-4, 5.706% 20493 | 32,990 | 36,688 |
| J.P. Morgan Chase Commercial Mortgage Securities Corp., Series 2007-C1, Class A-4, 5.716% 2051 | 19,517 | 21,462 |
| J.P. Morgan Chase Commercial Mortgage Securities Corp., Series 2007-LD12, Class A-1-A, 5.85% 20513 | 8,470 | 9,521 |
| Wachovia Bank Commercial Mortgage Trust, Series 2005-C16, Class A-PB, 4.692% 2041 | 5,198 | 5,214 |
| Wachovia Bank Commercial Mortgage Trust, Series 2007-C30, Class A-5, 5.342% 2043 | 14,000 | 15,416 |
| Wachovia Bank Commercial Mortgage Trust, Series 2006-C25, Class A1A, 5.719% 20433 | 26,846 | 29,390 |
| Wachovia Bank Commercial Mortgage Trust, Series 2007-C31, Class A-5, 5.50% 2047 | 10,000 | 11,070 |
| Wachovia Bank Commercial Mortgage Trust, Series 2007-C32, Class A-3, 5.733% 20493 | 27,635 | 30,636 |
| Wachovia Bank Commercial Mortgage Trust, Series 2007-C33, Class A-M, 5.924% 20513 | 17,000 | 18,814 |
| Greenwich Capital Commercial Funding Corp., Series 2006-GG7, Class A-4, 5.82% 20383 | 22,349 | 24,435 |
| Greenwich Capital Commercial Funding Corp., Series 2007-GG9, Class A-4, 5.444% 2039 | 38,708 | 42,576 |
| Greenwich Capital Commercial Funding Corp., Series 2007-GG11, Class A-1-A, 5.704% 2049 | 34,139 | 38,520 |
| Banc of America Commercial Mortgage Inc., Series 2006-3, Class A-4, 5.889% 20443 | 6,961 | 7,582 |
| Banc of America Commercial Mortgage Inc., Series 2005-5, Class A-4, 5.115% 20453 | 6,788 | 7,181 |
| Banc of America Commercial Mortgage Inc., Series 2006-1, Class A1A, 5.378% 20453 | 24,707 | 26,627 |
| Banc of America Commercial Mortgage Inc., Series 2006-4, Class A-4, 5.634% 2046 | 2,000 | 2,171 |
| Banc of America Commercial Mortgage Inc., Series 2007-2, Class A-M, 5.633% 20493 | 4,100 | 4,563 |
| Banc of America Commercial Mortgage Inc., Series 2007-3, Class A-4, 5.649% 20493 | 13,569 | 15,013 |
| Banc of America Commercial Mortgage Inc., Series 2008-1, Class A-4, 6.207% 20513 | 30,000 | 34,270 |
| J.P. Morgan Chase Commercial Mortgage Securities Trust, Series 2006-LDP8, Class A-4, 5.399% 2045 | 32,860 | 35,836 |
| J.P. Morgan Chase Commercial Mortgage Securities Trust, Series 2006-LDP9, Class A-3, 5.336% 2047 | 10,055 | 11,022 |
| J.P. Morgan Chase Commercial Mortgage Securities Trust, Series 2006-LDP9, Class A-M, 5.372% 2047 | 10,596 | 11,222 |
| LB-UBS Commercial Mortgage Trust, Series 2007-C2, Class A-3, 5.43% 2040 | 28,561 | 31,505 |
| LB-UBS Commercial Mortgage Trust, Series 2007-C6, Class A-M, 6.114% 20403 | 8,715 | 9,577 |
| LB-UBS Commercial Mortgage Trust, Series 2007-C7, Class A-M, 6.164% 20453 | 11,575 | 13,251 |
| CS First Boston Mortgage Securities Corp., Series 2002-34, Class I-A-1, 7.50% 2032 | 837 | 891 |
| CS First Boston Mortgage Securities Corp., Series 2002-30, Class I-A-1, 7.50% 2032 | 525 | 571 |
| CS First Boston Mortgage Securities Corp., Series 2003-21, Class V-A-1, 6.50% 2033 | 709 | 763 |
| CS First Boston Mortgage Securities Corp., Series 2003-29, Class V-A-1, 7.00% 2033 | 1,266 | 1,392 |
| CS First Boston Mortgage Securities Corp., Series 2004-5, Class IV-A-1, 6.00% 2034 | 4,230 | 4,481 |
| CS First Boston Mortgage Securities Corp., Series 2007-C3, Class A-1-A-1, 5.683% 20393 | 8,414 | 9,207 |
| CS First Boston Mortgage Securities Corp., Series 2007-C5, Class A4, 5.695% 20403 | 18,360 | 20,311 |
| Citigroup-Deutsche Bank Commercial Mortgage Trust, Series 2005-CD1, Class A-4, 5.218% 20443 | 9,250 | 9,814 |
| Citigroup-Deutsche Bank Commercial Mortgage Trust, Series 2006-CD3, Class A-5, 5.617% 2048 | 23,965 | 26,176 |
| Hilton USA Trust, Series 2013-HLF, AFX, 2.662% 20302 | 31,252 | 30,997 |
| Hilton USA Trust, Series 2013-HLF, BFX, 3.367% 20302 | 4,000 | 3,998 |
| LB-UBS Commercial Mortgage Trust, Series 2006-C3, Class A1A, 5.641% 20393 | 8,203 | 8,895 |
| LB-UBS Commercial Mortgage Trust, Series 2007-C2, Class A-1-A, 5.387% 2040 | 23,192 | 25,634 |
| Morgan Stanley Capital I Trust, Series 2007-IQ13, Class A-M, 5.406% 2044 | 4,500 | 4,900 |
| Morgan Stanley Capital I Trust, Series 2007-IQ15, Class A-4, 5.91% 20493 | 24,313 | 27,165 |
| Aventura Mall Trust 3.743% 20322,3 | 24,780 | 25,463 |
| Bear Stearns Commercial Mortgage Securities Trust, Series 2007-PW17, Class A-4, 5.694% 20503 | 9,665 | 10,837 |
| Bear Stearns Commercial Mortgage Securities Trust, Series 2007-PW18, Class A-4, 5.70% 2050 | 6,250 | 7,035 |
| Bonds, notes & other debt instruments | | |
| | Principal amount | Value |
| Mortgage-backed obligations4 (continued) | (000) | (000) |
| | | |
| Bear Stearns Commercial Mortgage Securities Trust, Series 2007-PW18, Class A-M, 6.084% 20503 | $ 6,425 | $ 7,301 |
| DBUBS Mortgage Trust, Series 2011-LC1A, Class A1, 3.742% 20462 | 13,652 | 14,329 |
| DBUBS Mortgage Trust, Series 2011-LC1A, Class A3, 5.002% 20462 | 9,500 | 10,496 |
| Morgan Stanley Capital I Trust, Series 2006-IQ12, Class A1A, 5.319% 2043 | 22,695 | 24,817 |
| Commercial Mortgage Trust, Series 2006-C8, Class A1A, 5.292% 2046 | 20,019 | 21,975 |
| ML-CFC Commercial Mortgage Trust, Series 2006-2, Class A-1-A, 5.884% 20463 | 9,726 | 10,688 |
| ML-CFC Commercial Mortgage Trust, Series 2007-8, Class A-3, 5.894% 20493 | 10,000 | 11,171 |
| Bear Stearns Commercial Mortgage Securities Inc., Series 2005-PW10, Class AM, 5.449% 20403 | 20,000 | 21,377 |
| Commonwealth Bank of Australia 0.75% 20172 | 13,000 | 13,013 |
| Commonwealth Bank of Australia 1.875% 20182 | 5,700 | 5,608 |
| Bank of Montreal 2.85% 20152 | 17,000 | 17,581 |
| National Australia Bank 1.25% 20182 | 13,450 | 13,138 |
| National Australia Bank 2.00% 20192 | 3,800 | 3,747 |
| L.A. Arena Funding, LLC, Series 1, Class A, 7.656% 20262 | 14,283 | 16,263 |
| GE Commercial Mortgage Corp., Series 2005-C4, Class A-3A, 5.31% 20453 | 14,389 | 14,431 |
| GS Mortgage Securities Corp. II, Series 2006-GG8, Class A-4, 5.56% 2039 | 11,880 | 13,051 |
| Wells Fargo Mortgage-backed Securities Trust, Series 2005-AR10, Class II-A-6, 2.616% 20353 | 12,353 | 12,489 |
| Westpac Banking Corp. 1.85% 20182 | 7,000 | 6,879 |
| Westpac Banking Corp. 1.375% 20192 | 2,375 | 2,304 |
| Commercial Mortgage Trust, Series 2013-LC13, Class A-5, 4.205% 2046 | 8,620 | 8,901 |
| Merrill Lynch Mortgage Trust, Series 2007-C1, Class A-4, 5.858% 20503 | 8,000 | 8,880 |
| LB Commercial Mortgage Trust, Series 2007-C3, Class A-1-A, multifamily 5.839% 20443 | 7,316 | 8,131 |
| Citigroup Commercial Mortgage Trust, Series 2013-CG15, Class A-4, 4.371% 2046 | 6,637 | 6,929 |
| Norddeutsche Landesbank 2.00% 20192 | 5,400 | 5,338 |
| CHL Mortgage Pass-Through Trust, Series 2003-56, Class 6-A-1, 2.686% 20333 | 3,064 | 3,017 |
| Northern Rock PLC 5.625% 20172 | 2,025 | 2,297 |
| Barclays Bank PLC 2.25% 20172 | 2,225 | 2,296 |
| Royal Bank of Canada 2.00% 2019 | 2,300 | 2,290 |
| Sparebank 1 Boligkreditt AS 1.75% 20202 | 2,400 | 2,280 |
| American General Mortgage Loan Trust, Series 2010-1A, Class A-1, 5.15% 20582,3 | 1,368 | 1,384 |
| Connecticut Avenue Securities, Series 2013-C01, Class M-1, 2.165% 20232,3 | 975 | 980 |
| | | 4,248,545 |
| Federal agency bonds & notes 1.18% | | |
| | | |
| Freddie Mac 1.75% 2015 | 22,425 | 22,951 |
| Freddie Mac 2.50% 2016 | 83,400 | 87,294 |
| Freddie Mac 1.00% 2017 | 114,000 | 113,388 |
| Freddie Mac 0.75% 2018 | 25,000 | 24,326 |
| Freddie Mac, Series K711, Class A2, multifamily 1.73% 20194 | 20,000 | 19,383 |
| Freddie Mac, Series K712, Class A2, multifamily 1.869% 20194 | 13,765 | 13,291 |
| Freddie Mac, Series K710, Class A2, multifamily 1.883% 20194 | 16,115 | 15,818 |
| Freddie Mac, Series K709, Class A2, multifamily 2.086% 20194 | 10,300 | 10,210 |
| Freddie Mac, Series KGRP, Class A, multifamily 0.546% 20203,4 | 9,200 | 9,217 |
| Freddie Mac, Series KF02, Class A-3, multifamily 0.795% 20203,4 | 4,167 | 4,174 |
| Freddie Mac 1.375% 2020 | 27,000 | 25,325 |
| Freddie Mac, Series KS01, Class A1, multifamily 1.693% 20224 | 5,644 | 5,561 |
| Freddie Mac, Series K019, Class A2, multifamily 2.272% 20224 | 16,000 | 14,876 |
| Freddie Mac, Series K023, Class A2, multifamily 2.307% 20224 | 17,995 | 16,601 |
| Freddie Mac, Series K021, Class A2, multifamily 2.396% 20224 | 16,555 | 15,468 |
| Freddie Mac, Series K025, Class A2, multifamily 2.682% 20224 | 15,904 | 15,087 |
| Freddie Mac, Series K030, Class A1, multifamily 2.779% 20224 | 18,718 | 19,132 |
| Freddie Mac, Series K035, Class A1, multifamily 2.615% 20234 | 7,050 | 7,070 |
| Freddie Mac, Series K027, Class A2, multifamily 2.637% 20234 | 14,500 | 13,625 |
| Freddie Mac, Series K034, Class A-1, multifamily 2.669% 20234 | 17,450 | 17,563 |
| Bonds, notes & other debt instruments | | |
| | Principal amount | Value |
| Federal agency bonds & notes (continued) | (000) | (000) |
| | | |
| Freddie Mac, Series K028, Class A2, multifamily 3.111% 20234 | $19,600 | $ 19,119 |
| Freddie Mac, Series K034, Class A-2, multifamily 3.531% 20233,4 | 5,975 | 5,979 |
| Fannie Mae 0.50% 2016 | 70,500 | 70,516 |
| Fannie Mae 1.875% 2018 | 61,960 | 62,281 |
| Fannie Mae, Series 2012-M8, multifamily 1.52% 20194 | 16,665 | 16,621 |
| Fannie Mae, Series 2012-M17, Class A2, multifamily 2.184% 20224 | 18,500 | 16,883 |
| Fannie Mae, Series 2012-M14, Class A2, multifamily 2.301% 20223,4 | 8,570 | 7,888 |
| Fannie Mae, Series 2012-M9, Class A2, multifamily 2.482% 20224 | 21,843 | 20,582 |
| Fannie Mae, Series 2012-M5, Class A2, multifamily 2.715% 20224 | 14,000 | 13,467 |
| Fannie Mae, Series 2013-M14, Class A2, multifamily 3.329% 20233,4 | 24,642 | 24,093 |
| Fannie Mae 6.25% 2029 | 8,400 | 10,504 |
| Federal Home Loan Bank 0.625% 2016 | 15,860 | 15,781 |
| Federal Home Loan Bank 1.875% 2020 | 25,660 | 24,790 |
| Federal Home Loan Bank 3.375% 2023 | 16,840 | 16,660 |
| CoBank, ACB 0.843% 20222,3 | 23,425 | 21,685 |
| Tennessee Valley Authority, Series A, 3.875% 2021 | 5,000 | 5,277 |
| Tennessee Valley Authority, Series B, 3.50% 2042 | 5,750 | 4,538 |
| United States Agency for International Development, Jordan (Kingdom of) 2.503% 2020 | 5,800 | 5,681 |
| United States Government-Guaranteed Certificates of Participation, | | |
| Overseas Private Investment Corp, 3.82% 20324 | 4,285 | 4,266 |
| United States Government-Guaranteed Certificates of Participation, | | |
| Overseas Private Investment Corp, 0% 2016 | 866 | 866 |
| United States Government-Guaranteed Certificates of Participation, | | |
| Overseas Private Investment Corp, 3.49% 20294,6 | 845 | 824 |
| | | 838,661 |
| Bonds & notes of governments & government agencies outside the U.S. 0.12% | | |
| | | |
| Israeli Government 3.15% 2023 | 35,000 | 33,525 |
| Polish Government 5.25% 2014 | 2,500 | 2,502 |
| Polish Government 6.375% 2019 | 14,350 | 16,807 |
| France Government Agency-Guaranteed, Société Finance 2.875% 20142 | 10,460 | 10,649 |
| Latvia (Republic of) 2.75% 2020 | 10,500 | 10,067 |
| FMS Wertmanagement 1.625% 2018 | 5,000 | 4,931 |
| Swedish Export Credit Corp. 2.875% 20232 | 3,000 | 2,942 |
| Europe Government Agency-Guaranteed, Dexia Credit Local 1.25% 20162 | 2,300 | 2,299 |
| | | 83,722 |
| Asset-backed obligations4 0.11% | | |
| | | |
| Aesop Funding LLC, Series 2013-2A, Class A, 2.97% 20202 | 20,535 | 20,917 |
| Hertz Vehicle Financing LLC, Rental Car Asset-backed Notes, Series 2013-1A, Class A-1, 1.12% 20172 | 16,000 | 15,977 |
| Trade Maps Ltd., 2013-1-A-A, 0.87% 20182,3,6 | 11,320 | 11,341 |
| Trade Maps Ltd., 2013-1-A-B, 1.42% 20182,3,6 | 2,220 | 2,232 |
| Morgan Stanley ABS Capital I Inc., Series 2004-NC3, Class M-1, 0.96% 20343 | 9,810 | 9,113 |
| Utility Debt Securitization Auth., Series 2013-T, 2.042% 2021 | 3,510 | 3,478 |
| Utility Debt Securitization Auth., Series 2013-T, 3.435% 2025 | 2,625 | 2,589 |
| RAMP Trust, Series 2003-RZ4, Class A-7, 4.79% 20333 | 1,129 | 1,190 |
| RAMP Trust, Series 2003-RS11, Class A-I-7, 4.828% 2033 | 1,764 | 1,796 |
| CWABS, Inc., Series 2004-BC1, Class M-1, 0.915% 20343 | 2,803 | 2,659 |
| Residential Asset Securities Corp. Trust, Series 2003-KS8, Class A-I-6, 4.83% 2033 | 1,471 | 1,526 |
| Appalachian Consumer Rate Relief Funding LLC, Series 2013-1, Class A-2, 3.77% 2031 | 1,310 | 1,277 |
| | | 74,095 |
| Bonds, notes & other debt instruments | | |
| | Principal amount | Value |
| Municipals 0.05% | (000) | (000) |
| | | |
| State of California, Los Angeles Community College District (County of Los Angeles), | | |
| General Obligation Build America Bonds, 2008 Election, Series 2010-E, 6.60% 2042 | $ 15,000 | $ 18,653 |
| State of Washington, Energy Northwest, Columbia Generating Station Electric Revenue Bonds, | | |
| Series 2012-E, 2.197% 2019 | 14,500 | 14,184 |
| | | 32,837 |
| Miscellaneous 0.08% | | |
| | | |
| Other bonds, notes & other debt instruments in initial period of acquisition | | 56,712 |
| Total bonds, notes & other debt instruments (cost: $16,200,683,000) | | 16,324,733 |
| Short-term securities 3.15% | | |
| | | |
| Federal Home Loan Bank 0.055%–0.16% due 1/22–9/16/2014 | 715,662 | 715,441 |
| Freddie Mac 0.065%–0.19% due 1/21–9/16/2014 | 623,900 | 623,612 |
| Fannie Mae 0.10%–0.13% due 4/23–8/1/2014 | 155,000 | 154,942 |
| U.S. Treasury Bills 0.095%–0.133% due 5/15–8/21/2014 | 127,500 | 127,450 |
| Coca-Cola Co. 0.11%–0.14% due 1/23–4/21/20142 | 116,800 | 116,785 |
| General Electric Capital Corp. 0.05%–0.17% due 1/2–2/12/2014 | 112,500 | 112,494 |
| ExxonMobil Corp. 0.08% due 1/22/2014 | 68,800 | 68,794 |
| Jupiter Securitization Co., LLC 0.24% due 1/14/20142 | 40,000 | 39,997 |
| Chariot Funding, LLC 0.30% due 2/21/20142 | 10,300 | 10,298 |
| IBM Corp. 0.05% due 1/22/20142 | 50,000 | 49,998 |
| Walt Disney Co. 0.07% due 2/28/20142 | 50,000 | 49,994 |
| National Rural Utilities Cooperative Finance Corp. 0.10% due 1/31/2014 | 47,000 | 46,996 |
| Abbott Laboratories 0.13% due 1/6/20142 | 45,000 | 45,000 |
| Pfizer Inc 0.11% due 3/10/20142 | 31,000 | 30,996 |
| Wells Fargo & Co. 0.22% due 6/17/2014 | 30,000 | 29,958 |
| Paccar Financial Corp. 0.05% due 1/29/2014 | 15,000 | 14,999 |
| Total short-term securities (cost: $2,237,621,000) | | 2,237,754 |
| Total investment securities (cost: $49,863,524,000) | | 70,875,422 |
| Other assets less liabilities | | 12,475 |
| Net assets | | $70,887,897 |
As permitted by U.S. Securities and Exchange Commission regulations, “Miscellaneous” securities include holdings in their first year of acquisition that have not previously been publicly disclosed.
| 1 | Security did not produce income during the last 12 months. |
| 2 | Acquired in a transaction exempt from registration under Rule 144A or section 4(2) of the Securities Act of 1933. May be resold in the U.S. in transactions exempt from registration, normally to qualified institutional buyers. The total value of all such securities was $1,570,045,000, which represented 2.21% of the net assets of the fund. |
| 3 | Coupon rate may change periodically. |
| 4 | Principal payments may be made periodically. Therefore, the effective maturity date may be earlier than the stated maturity date. |
| 5 | Index-linked bond whose principal amount moves with a government price index. |
| 6 | Valued under fair value procedures adopted by authority of the board of trustees. The total value of all such securities was $14,397,000, which represented .02% of the net assets of the fund. |
Key to abbreviation
ADR = American Depositary Receipts
Investments are not FDIC-insured, nor are they deposits of or guaranteed by a bank or any other entity, so they may lose value.
Investors should carefully consider investment objectives, risks, charges and expenses. This and other important information is contained in the fund prospectus and summary prospectus, which can be obtained from your financial professional and should be read carefully before investing. You may also call American Funds Service Company (AFS) at (800) 421-4225 or visit the American Funds website at americanfunds.com.
MFGEFPX-011-0214O-S37690
REPORT OF INDEPENDENT REGISTERED PUBLIC ACCOUNTING FIRM ON INVESTMENT PORTFOLIO
To the Shareholders and Board of Trustees of
American Balanced Fund:
We have audited, in accordance with the standards of the Public Company Accounting Oversight Board (United States), the financial statements of American Balanced Fund (the “Fund”) as of December 31, 2013, and for the year then ended and have issued our report thereon dated February 10, 2014, which report and financial statements are included in Item 1 of this Certified Shareholder Report on Form N-CSR. Our audit also included the Fund’s investment portfolio (the “Schedule”) as of December 31, 2013, appearing in Item 6 of this Form N-CSR. This Schedule is the responsibility of the Fund’s management. Our responsibility is to express an opinion based on our audit. In our opinion, the Schedule referred to above, when considered in relation to the basic financial statements taken as a whole of the Fund referred to above, presents fairly, in all material respects, the information set forth therein.
DELOITTE & TOUCHE LLP
Costa Mesa, California
February 10, 2014
ITEM 7 – Disclosure of Proxy Voting Policies and Procedures for Closed-End Management Investment Companies
Not applicable to this Registrant, insofar as the Registrant is not a closed-end management investment company.
ITEM 8 – Portfolio Managers of Closed-End Management Investment Companies
Not applicable to this Registrant, insofar as the Registrant is not a closed-end management investment company.
ITEM 9 – Purchases of Equity Securities by Closed-End Management Investment Company and Affiliated Purchasers
Not applicable to this Registrant, insofar as the Registrant is not a closed-end management investment company.
ITEM 10 – Submission of Matters to a Vote of Security Holders
There have been no material changes to the procedures by which shareholders may recommend nominees to the Registrant’s board of trustees since the Registrant last submitted a proxy statement to its shareholders. The procedures are as follows. The Registrant has a nominating and governance committee comprised solely of persons who are not considered ‘‘interested persons’’ of the Registrant within the meaning of the Investment Company Act of 1940, as amended. The committee periodically reviews such issues as the board’s composition, responsibilities, committees, compensation and other relevant issues, and recommends any appropriate changes to the full board of trustees. While the committee normally is able to identify from its own resources an ample number of qualified candidates, it will consider shareholder suggestions of persons to be considered as nominees to fill future vacancies on the board. Such suggestions must be sent in writing to the nominating and governance committee of the Registrant, c/o the Registrant’s Secretary, and must be accompanied by complete biographical and occupational data on the prospective nominee, along with a written consent of the prospective nominee for consideration of his or her name by the nominating and governance committee.
ITEM 11 – Controls and Procedures
| (a) | The Registrant’s Principal Executive Officer and Principal Financial Officer have concluded, based on their evaluation of the Registrant’s disclosure controls and procedures (as such term is defined in Rule 30a-3 under the Investment Company Act of 1940), that such controls and procedures are adequate and reasonably designed to achieve the purposes described in paragraph (c) of such rule. |
| | |
| (b) | There were no changes in the Registrant’s internal controls over financial reporting (as defined in Rule 30a-3(d) under the Investment Company Act of 1940) that occurred during the Registrant’s second fiscal quarter of the period covered by this report that has materially affected, or is reasonably likely to materially affect, the Registrant’s internal control over financial reporting. |
ITEM 12 – Exhibits
| (a)(1) | The Code of Ethics that is the subject of the disclosure required by Item 2 is attached as an exhibit hereto. |
| | |
| (a)(2) | The certifications required by Rule 30a-2 of the Investment Company Act of 1940 and Sections 302 and 906 of the Sarbanes-Oxley Act of 2002 are attached as exhibits hereto. |
SIGNATURES
Pursuant to the requirements of the Securities Exchange Act of 1934 and the Investment Company Act of 1940, the Registrant has duly caused this report to be signed on its behalf by the undersigned, thereunto duly authorized.
| | AMERICAN BALANCED FUND |
| | |
| | By /s/ Gregory D. Johnson |
| | Gregory D. Johnson, Vice Chairman, President and Principal Executive Officer |
| | |
| | Date: February 28, 2014 |
Pursuant to the requirements of the Securities Exchange Act of 1934 and the Investment Company Act of 1940, this report has been signed below by the following persons on behalf of the Registrant and in the capacities and on the dates indicated.
| By /s/ Gregory D. Johnson |
| Gregory D. Johnson, Vice Chairman, President and Principal Executive Officer |
| |
| Date: February 28, 2014 |
| By /s/ Jeffrey P. Regal |
Jeffrey P. Regal, Treasurer and Principal Financial Officer |
| |
| Date: February 28, 2014 |