united states
securities and exchange commission
washington, d.c. 20549
form n-csr
certified shareholder report of registered management
investment companies
Investment Company Act file number 811-01528
Bruce Fund, Inc.
(Exact name of registrant as specified in charter)
20 North Wacker Drive, Suite 2414 Chicago, IL 60606
(Address of principal executive offices) (Zip code)
R. Jeffrey Bruce
Bruce & Co.
20 North Wacker Drive, Suite 2414
Chicago, IL 60606
(Name and address of agent for service)
Registrant's telephone number, including area code: 312-236-9160
Date of fiscal year end: 6/30
Date of reporting period: 12/31/21
Form N-CSR is to be used by management investment companies to file reports with the Commission not later than 10 days after the transmission to stockholders of any report that is required to be transmitted to stockholders under Rule 30e-1 under the Investment Company Act of 1940 (17 CFR 270.30e-1). The Commission may use the information provided on Form N-CSR in its regulatory, disclosure review, inspection and policymaking roles.
A registrant is required to disclose the information specified by Form N-CSR, and the Commission will make this information public. A registrant is not required to respond to the collection of information contained in Form N-CSR unless the Form displays a currently valid Office of Management and Budget ("OMB") control number. Please direct comments concerning the accuracy of the information collection burden estimate and any suggestions for reducing the burden to Secretary, Securities and Exchange Commission, 450 Fifth Street, NW, Washington, DC 20549-0609. The OMB has reviewed this collection of information under the clearance requirements of 44 U.S.C. § 3507.
Item 1. Reports to Stockholders.
2021
BRUCE FUND, INC.
SEMI-ANNUAL
REPORT
Report to Shareholders
December 31, 2021
20 North Wacker Drive • Suite 2414 • Chicago, Illinois 60606 • (312) 236-9160
Management’s Discussion of Fund Performance (Unaudited)
The Bruce Fund (the “Fund”) shares produced a total return of 7.15% for the six months ended December 31, 2021, compared to a total return of 11.67% for the S&P 500® Index for the same period. Stock markets continued to advance in the period and the Fund lagged the broader Index. Government bond prices in the portfolio advanced in the six month period while our corporate bonds had small declines. The Fund’s equities contributed the rest of the gains in the period.
Monetary measures taken over the last decade have encouraged risk and excess. We believe market will reprice that risk and we foresee a difficult period. The Fund is trying to be austere in addressing the risks. Given the excessive debt levels, the geopolitical, economic and policy uncertainties, we feel caution is warranted. Valuations for some companies show reasonable long term opportunities but the market overall is historically expensive and any further change in sentiment will expose the lofty multiples so we believe a more conservative posture is warranted.
Management continues to screen investment opportunities for their long-term capital appreciation potential versus the risks that investment might present. The bonds as well as the stocks in the portfolio encompass significant investment risks, which are again outlined in the prospectus.
Shareholders are invited to use the toll-free number (800) 872-7823 to obtain any Fund information (including the proxy voting record), or you can visit www.thebrucefund.com, to obtain the same.
Investment Results (Unaudited)
Average Annual Total Returns for the Periods Ended December 31, 2021
| Fund/Index | Six Months | 1 Year | 5 Year | 10 Year |
| Bruce Fund | 7.15% | 17.40% | 11.70% | 10.51% |
| S&P 500® Index* | 11.67% | 28.71% | 18.47% | 16.55% |
The net expense ratio as of the most recent prospectus dated October 28, 2021 was 0.68%, which represented the fiscal year ended June 30, 2021. Additional information pertaining to the Fund’s expense ratios as of December 31, 2021 can be found in the financial highlights.
The performance quoted represents past performance, which does not guarantee future results. The investment return and principal value of an investment will fluctuate so that an investor’s shares, when redeemed, may be worth more or less than their original cost. The returns shown do not reflect deduction of taxes that a shareholder would pay on Fund distributions or the redemption of Fund shares. Current performance of the Fund may be lower or higher than the performance quoted. The Fund’s investment objectives, risks, charges and expenses must be considered carefully before investing. Performance data current to the most recent month end may be obtained by calling l-800-872-7823. Total returns for periods less than one year are not annualized.
| * | The S&P 500® Index (the “Index”) is an unmanaged index that assumes reinvestment of all distributions and excludes the effect of taxes and fees. The Index is a widely recognized unmanaged index of equity prices and is representative of a broader market and range of securities than is found in the Fund’s portfolio. Individuals cannot invest directly in the Index; however, an individual can invest in exchange-traded funds or other investment vehicles that attempt to track the performance of a benchmark index. |
The Fund is distributed by Ultimus Fund Distributors, LLC, member FINRA/SIPC.
Fund Holdings (Unaudited)
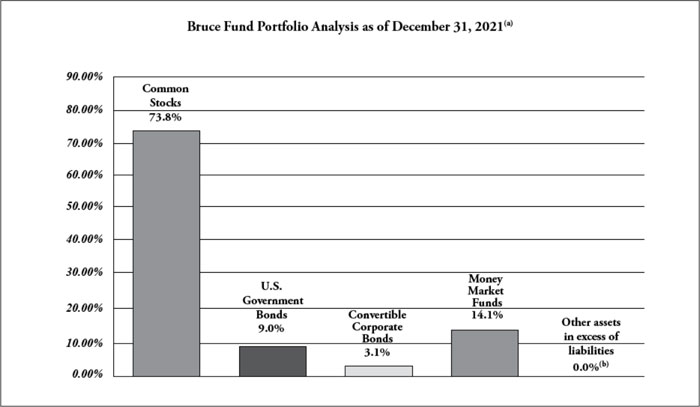
| (a) | As a percent of net assets. |
| (b) | Rounds to less than 0.05%. |
Investment Objective
The investment objective of the Bruce Fund is long-term capital appreciation.
Availability of Portfolio Schedule (Unaudited)
This Fund files its complete schedule of portfolio holdings with the Securities and Exchange Commission (“SEC”) for the first and third quarters of each fiscal year as an exhibit to its reports on Form N-PORT. The Fund’s Form N-PORT reports are available on the SEC’s website at www.sec.gov or on the Fund’s website at www.thebrucefund.com.
| Bruce Fund |
| Schedule of Investments (Unaudited) |
| December 31, 2021 |
| | | Shares/ | | | | |
| | | Principal | | | | |
| | | Amount | | | Fair Value | |
| COMMON STOCKS — 73.8% | | | | | | | | |
| Communications — 0.9% | | | | | | | | |
| Actua Corp.(a)(b)(c) | | | 130,000 | | | $ | 1,300 | |
| Sirius XM Holdings, Inc. | | | 857,843 | | | | 5,447,303 | |
| | | | | | | | 5,448,603 | |
| Energy — 0.1% | | | | | | | | |
| Flotek Industries, Inc.(c) | | | 390,671 | | | | 441,458 | |
| PetroQuest Energy, Inc.(a)(b)(c) | | | 2,834,246 | | | | 56,685 | |
| | | | | | | | 498,143 | |
| Financials — 5.4% | | | | | | | | |
| Allstate Corp. (The) | | | 280,000 | | | | 32,942,000 | |
| | | | | | | | | |
| Health Care — 29.8% | | | | | | | | |
| Abbott Laboratories | | | 164,500 | | | | 23,151,730 | |
| AbbVie, Inc. | | | 280,000 | | | | 37,911,999 | |
| Acorda Therapeutics, Inc.(c) | | | 19,494 | | | | 46,591 | |
| Amryt Pharma PLC - ADR (United Kingdom)(c) | | | 315,182 | | | | 3,403,966 | |
| Bausch Health Cos., Inc. (Canada)(c) | | | 1,250,000 | | | | 34,512,500 | |
| EDAP TMS SA - ADR (France)(c) | | | 529,794 | | | | 3,173,466 | |
| Fate Therapeutics, Inc.(c) | | | 57,000 | | | | 3,335,070 | |
| IGM Biosciences, Inc.(c) | | | 55,000 | | | | 1,613,150 | |
| MannKind Corp.(c) | | | 395,073 | | | | 1,726,469 | |
| Merck & Co., Inc. | | | 300,000 | | | | 22,992,000 | |
| Organon & Co. | | | 30,000 | | | | 913,500 | |
| Paratek Pharmaceuticals, Inc.(c) | | | 1,313,312 | | | | 5,896,771 | |
| Pfizer, Inc. | | | 500,000 | | | | 29,525,000 | |
| Supernus Pharmaceuticals, Inc.(c) | | | 402,105 | | | | 11,725,382 | |
| Viatris, Inc. | | | 55,835 | | | | 755,448 | |
| | | | | | | | 180,683,042 | |
| Industrials — 9.7% | | | | | | | | |
| AMERCO | | | 68,000 | | | | 49,383,640 | |
| General Electric, Co. | | | 100,000 | | | | 9,447,000 | |
| | | | | | | | 58,830,640 | |
| Materials — 1.1% | | | | | | | | |
| Ashland Global Holdings, Inc. | | | 25,000 | | | | 2,691,500 | |
| Newmont Corp. | | | 65,600 | | | | 4,068,512 | |
| | | | | | | | 6,760,012 | |
See accompanying notes which are an integral part of these financial statements.
| Bruce Fund |
| Schedule of Investments (Unaudited) (continued) |
| December 31, 2021 |
| | | Shares/ | | | | |
| | | Principal | | | | |
| | | Amount | | | Fair Value | |
| COMMON STOCKS — (continued) | | | | | | | | |
| Technology — 4.5% | | | | | | | | |
| Apple, Inc. | | | 155,000 | | | $ | 27,523,350 | |
| | | | | | | | | |
| Utilities — 22.3% | | | | | | | | |
| Avista Corp. | | | 200,000 | | | | 8,498,000 | |
| CMS Energy Corp. | | | 450,000 | | | | 29,272,500 | |
| Duke Energy Corp. | | | 275,000 | | | | 28,847,500 | |
| NextEra Energy, Inc. | | | 450,000 | | | | 42,012,000 | |
| Xcel Energy, Inc. | | | 400,000 | | | | 27,080,000 | |
| | | | | | | | 135,710,000 | |
| Total Common Stocks (Cost $195,905,869) | | | | | | | 448,395,790 | |
| | | | | | | | | |
| U.S. GOVERNMENT BONDS — 9.0% | | | | | | | | |
| U.S. Treasury “Strips”, 0.00%, 8/15/2029 | | $ | 15,000,000 | | | | 13,507,815 | |
| U.S. Treasury “Strips”, 0.00%, 2/15/2036 | | | 20,000,000 | | | | 16,202,361 | |
| U.S. Treasury “Strips”, 0.00%, 2/15/2041 | | | 10,000,000 | | | | 7,066,347 | |
| U.S. Treasury “Strips”, 0.00%, 5/15/2049 | | | 30,000,000 | | | | 17,922,014 | |
| Total U.S. Government Bonds (Cost $43,104,373) | | | | | | | 54,698,537 | |
| | | | | | | | | |
| CONVERTIBLE CORPORATE BONDS — 3.1% | | | | | | | | |
| | | | | | | | | |
| Health Care — 3.1% | | | | | | | | |
| Acorda Therapeutics, Inc., 6.00%, 12/1/2024 | | | 5,000,000 | | | | 4,075,000 | |
| Novavax, Inc., 3.75%, 2/1/2023 | | | 600,000 | | | | 827,625 | |
| Paratek Pharmaceuticals, Inc., 4.75%, 5/1/2024 | | | 15,000,000 | | | | 13,840,500 | |
| Synergy Pharmaceuticals, Inc., 7.50%, 11/1/2019 (a)(b)(d)(e) | | | 1,500,000 | | | | 150 | |
| Total Convertible Corporate Bonds (Cost $20,050,206) | | | | | | | 18,743,275 | |
See accompanying notes which are an integral part of these financial statements.
| Bruce Fund |
| Schedule of Investments (Unaudited) (continued) |
| December 31, 2021 |
| | | Shares/ | | | | |
| | | Principal | | | | |
| | | Amount | | | Fair Value | |
| MONEY MARKET FUNDS — 14.1% | | | | | | | | |
| Morgan Stanley Institutional Liquidity Government Portfolio, Institutional Class, 0.03%(f) | | | 85,466,770 | | | $ | 85,466,770 | |
| Total Money Market Funds (Cost $85,466,770) | | | | | | | 85,466,770 | |
| | | | | | | | | |
| Total Investments — 100.0% (Cost $344,527,218) | | | | | | | 607,304,372 | |
| Other Assets in Excess of Liabilities — 0.0%(g) | | | | | | | 136,797 | |
| NET ASSETS — 100.0% | | | | | | $ | 607,441,169 | |
| (a) | Security is currently being valued according to the fair value procedures approved by the Board of Directors. |
| (b) | Illiquid security. The total fair value of these securities as of December 31, 2021 was $58,135, representing 0.0% of net assets. |
| (c) | Non-income producing security. |
| (d) | Security exempt from registration under Rule 144A or Section 4(2) of the Securities Act of 1933. The security may be resold in transactions exempt from registration, normally to qualified institutional buyers. The total fair value of these securities as December 31, 2021 was $150, representing 0.0% of net assets. |
| (f) | Rate disclosed is the seven day effective yield as of December 31, 2021. |
| (g) | Rounds to less than 0.05%. |
ADR – American Depositary Receipt
See accompanying notes which are an integral part of these financial statements.
| Bruce Fund |
| Statement of Assets and Liabilities (Unaudited) |
| December 31, 2021 |
| Assets | | | |
| Investments in securities, at market value (cost $344,527,218) | | $ | 607,304,372 | |
| Dividends and interest receivable | | | 781,691 | |
| Receivable for fund shares sold | | | 38,406 | |
| Prepaid expenses | | | 18,897 | |
| Total Assets | | | 608,143,366 | |
| Liabilities | | | | |
| Payable for fund shares redeemed | | | 324,580 | |
| Accrued investment advisory fees | | | 266,498 | |
| Payable to Administrator | | | 47,231 | |
| Payable to trustees | | | 2,017 | |
| Other accrued expenses | | | 61,871 | |
| Total Liabilities | | | 702,197 | |
| Net Assets | | $ | 607,441,169 | |
| Net Assets consist of | | | | |
| Capital stock (906,281 shares of $1 par value capital stock issued and outstanding) | | | 906,281 | |
| Paid-in capital | | | 333,519,669 | |
| Accumulated earnings | | | 273,015,219 | |
| Net Assets | | $ | 607,441,169 | |
| Shares outstanding: 2,000,000 shares authorized | | | 906,281 | |
| Net asset value, offering and redemption price per share | | $ | 670.26 | |
See accompanying notes which are an integral part of these financial statements.
| Bruce Fund |
| Statement of Operations (Unaudited) |
| For the Six Months Ended December 31, 2021 |
| Investment Income | | | |
| Dividend income | | $ | 4,287,273 | |
| Interest income | | | 1,545,034 | |
| Total investment income | | | 5,832,307 | |
| Expenses | | | | |
| Investment advisory | | | 1,592,611 | |
| Administration | | | 143,043 | |
| Transfer agent | | | 69,287 | |
| Fund accounting | | | 52,724 | |
| Audit and tax preparation | | | 30,857 | |
| Custodian | | | 25,783 | |
| Registration | | | 17,505 | |
| Postage | | | 15,112 | |
| Printing | | | 10,542 | |
| Director | | | 2,017 | |
| Insurance | | | 767 | |
| Other | | | 5,051 | |
| Net operating expenses | | | 1,965,299 | |
| Net investment income | | | 3,867,008 | |
| Net Realized and Change in Unrealized Gain (Loss) on Investments | | | | |
| Net realized gain on investment securities | | | 19,210,857 | |
| Change in unrealized appreciation (depreciation) on investment securities | | | 18,182,657 | |
| Net realized and change in unrealized gain on investments | | | 37,393,514 | |
| Net increase in net assets resulting from operations | | $ | 41,260,522 | |
See accompanying notes which are an integral part of these financial statements.
| Bruce Fund |
| Statements of Changes in Net Assets |
| | | For the | | | | |
| | | Six Months Ended | | | For the | |
| | | December 31, 2021 | | | Year Ended | |
| | | (Unaudited) | | | June 30, 2021 | |
| Increase (Decrease) in Net Assets due to: | | | | | | | | |
| Operations | | | | | | | | |
| Net investment income | | $ | 3,867,008 | | | $ | 10,264,907 | |
| Net realized gain on investment securities | | | 19,210,857 | | | | 42,598,603 | |
| Change in unrealized appreciation (depreciation) on investment securities | | | 18,182,657 | | | | 88,356,876 | |
| Net increase in net assets resulting from operations | | | 41,260,522 | | | | 141,220,386 | |
| Distributions to Shareholders from | | | | | | | | |
| Earnings | | | (51,809,263 | ) | | | (31,169,503 | ) |
| Total distributions | | | (51,809,263 | ) | | | (31,169,503 | ) |
| Capital Transactions | | | | | | | | |
| Proceeds from shares sold | | | 3,645,130 | | | | 6,559,187 | |
| Reinvestment of distributions | | | 48,313,681 | | | | 29,240,117 | |
| Amount paid for shares redeemed | | | (24,110,435 | ) | | | (56,909,560 | ) |
| Net increase (decrease) in net assets resulting from capital transactions | | | 27,848,376 | | | | (21,110,256 | ) |
| Total Increase in Net Assets | | | 17,299,635 | | | | 88,940,627 | |
| Net Assets | | | | | | | | |
| Beginning of period | | | 590,141,534 | | | | 501,200,907 | |
| End of period | | $ | 607,441,169 | | | $ | 590,141,534 | |
| Share Transactions | | | | | | | | |
| Shares sold | | | 5,242 | | | | 10,146 | |
| Shares issued in reinvestment of distributions | | | 73,479 | | | | 47,167 | |
| Shares redeemed | | | (34,650 | ) | | | (90,226 | ) |
| Net increase (decrease) in shares outstanding | | | 44,071 | | | | (32,913 | ) |
See accompanying notes which are an integral part of these financial statements.
| Bruce Fund |
| Financial Highlights |
Selected data for each share of capital stock outstanding through each period is presented below
| | | For the | | | | | | | | | | | | | | | | |
| | | Six Months | | | | | | | | | | | | | | | | |
| | | Ended | | | | | | | | | | | | | | | | |
| | | December 31, | | | | | | | | | | | | | | | | |
| | | 2021 | | | For the Year Ended June 30, | |
| | | (Unaudited) | | | 2021 | | | 2020 | | | 2019 | | | 2018 | | | 2017 | |
| Selected Per Share Data | | | | | | | | | | | | | | | | | | |
| Net asset value, beginning of period | | $ | 684.45 | | | $ | 559.92 | | | $ | 555.00 | | | $ | 522.54 | | | $ | 522.91 | | | $ | 535.76 | |
| Investment operations: | | | | | | | | | | | | | | | | | | | | | | | | |
| Net investment income | | | 4.78 | | | | 12.24 | | | | 13.36 | | | | 11.64 | | | | 12.71 | | | | 10.67 | |
| Net realized and unrealized gain | | | 43.00 | | | | 148.70 | | | | 3.58 | | | | 33.09 | | | | 8.52 | | | | 6.89 | |
| Total from investment operations | | | 47.78 | | | | 160.94 | | | | 16.94 | | | | 44.73 | | | | 21.23 | | | | 17.56 | |
| Less distributions to shareholders from: | | | | | | | | | | | | | | | | | | | | | | | | |
| Net investment income | | | (9.75 | ) | | | (13.58 | ) | | | (12.02 | ) | | | (12.27 | ) | | | (11.69 | ) | | | (10.08 | ) |
| Net realized gains | | | (52.22 | ) | | | (22.83 | ) | | | — | | | | — | | | | (9.91 | ) | | | (20.33 | ) |
| Total distributions | | | (61.97 | ) | | | (36.41 | ) | | | (12.02 | ) | | | (12.27 | ) | | | (21.60 | ) | | | (30.41 | ) |
| Net asset value, end of period | | $ | 670.26 | | | $ | 684.45 | | | $ | 559.92 | | | $ | 555.00 | | | $ | 522.54 | | | $ | 522.91 | |
| Total Return(a) | | | 7.15 | % (b) | | | 29.42 | % | | | 2.96 | % | | | 8.81 | % | | | 4.01 | % | | | 3.74 | % |
| Ratios and Supplemental Data: | | | | | | | | | | | | | | | | | | | | | | | | |
| Net assets, end of period ($ millions) | | $ | 607.44 | | | $ | 590.14 | | | $ | 501.20 | | | $ | 520.58 | | | $ | 533.96 | | | $ | 575.20 | |
| Ratio of expenses to average net assets | | | 0.65 | % (c) | | | 0.66 | % | | | 0.67 | % | | | 0.67 | % | | | 0.67 | % | | | 0.67 | % |
| Ratio of net investment income to average net assets | | | 1.29 | % (c) | | | 1.84 | % | | | 2.28 | % | | | 2.08 | % | | | 2.31 | % | | | 2.04 | % |
| Portfolio turnover rate | | | 1 | % (b) | | | 4 | % | | | 15 | % | | | 7 | % | | | 20 | % | | | 5 | % |
| | | | | | | | | | | | | | | | | | | | | | | | | |
| (a) | Total return represents the rate that the investor would have earned or lost on an investment in the Fund, assuming reinvestment of distributions. |
See accompanying notes which are an integral part of these financial statements.
| Bruce Fund |
| Notes to the Financial Statements (Unaudited) |
| December 31, 2021 |
NOTE A – ORGANIZATION
Bruce Fund, Inc. (the “Fund”) is a Maryland corporation incorporated on June 20, 1967. The Fund is registered under the Investment Company Act of 1940, as amended (“1940 Act”), as an open end diversified management investment company and the Fund’s primary investment objective is long-term capital appreciation. The investment adviser to the Fund is Bruce and Co., Inc. (the “Adviser”).
NOTE B – SUMMARY OF SIGNIFICANT ACCOUNTING POLICIES
Basis of Preparation – The Fund is an investment company and follows accounting and reporting guidance under Financial Accounting Standards Board Accounting Standards Codification (“ASC”) Topic 946, “Financial Services-Investment Companies”. The following is a summary of significant accounting policies followed by the Fund in preparation of its financial statements. These policies are in conformity with the generally accepted accounting principles in the United States of America (“GAAP”).
Estimates – The preparation of financial statements in conformity with GAAP requires management to make estimates and assumptions that affect the reported amounts of assets and liabilities and disclosure of contingent assets and liabilities at the date of the financial statements and the reported amounts of increases and decreases in net assets from operations during the reporting period. Actual results could differ from those estimates.
Securities Valuation – All investments in securities are recorded at their fair value as described in Note C.
Federal Income Taxes – The Fund makes no provision for federal income or excise tax. The Fund has qualified and intends to qualify each year as a regulated investment company (“RIC”) under subchapter M of the Internal Revenue Code of 1986, as amended, by complying with the requirements applicable to RICs and by distributing substantially all of its taxable income. The Fund also intends to distribute sufficient net investment income and net capital gains, if any, so that it will not be subject to excise tax on undistributed income and gains. If the required amount of net investment income or gains is not distributed, the Fund could incur a tax expense.
As of and during the six months ended December 31, 2021, the Fund did not have a liability for any unrecognized tax benefits. The Fund recognizes interest and penalties, if any, related to unrecognized tax benefits as income tax expense in the statement of operations. During the period, the Fund did not incur any interest or penalties.
Security Transactions and Related Income – Investment transactions are accounted for no later than the first calculation of the Net Asset Value (“NAV”) on the business day following the trade date. For financial reporting purposes, however, security transactions are accounted for on the trade date on the last business day of the reporting period. The specific identification method is used for determining gains or losses for financial statements
| Bruce Fund |
| Notes to the Financial Statements (Unaudited) (continued) |
| December 31, 2021 |
and income tax purposes. Dividend income is recorded on the ex-dividend date and interest income is recorded on an accrual basis. Discounts and premiums on securities purchased are accreted or amortized using the effective interest method. Withholding taxes on foreign dividends have been provided for in accordance with the Fund’s understanding of the applicable country’s tax rules and rates. The ability of issuers of debt securities held by the Fund to meet their obligations may be affected by economic and political development in the relevant specific country or region.
Distributions – Distributions to shareholders, which are determined in accordance with income tax regulations, are recorded on the ex-dividend date. The Fund intends to distribute substantially all of its net investment income as dividends and distributions to its shareholders on at least an annual basis. The Fund intends to distribute its net realized long-term capital gains and its net realized short-term capital gains at least once a year. The treatment for financial reporting purposes of distributions made to shareholders during the year from net investment income or net realized capital gains may differ from their ultimate treatment for federal income tax purposes. These differences are caused primarily by differences in the timing of the recognition of certain components of income, expenses or realized capital gain for federal income tax purposes. Where such differences are permanent in nature, they are reclassified in the components of the net assets based on their ultimate characterization for federal income tax purposes. Any such reclassifications will have no effect on net assets, results of operations or net asset values per share of the Fund.
NOTE C – SUMMARY OF SECURITIES VALUATION AND FAIR VALUE MEASUREMENTS
In accordance with Accounting Standards Codification 820, “Fair Value Measurements and Disclosures” (“ASC 820”), fair value is defined as the price that the Fund would receive upon selling an investment in an orderly transaction to an independent buyer in the principal or most advantageous market of the investment. ASC 820 established a three-tier hierarchy to maximize the use of the observable market data and minimize the use of unobservable inputs and to establish classification of the fair value measurements for disclosure purposes. Inputs refer broadly to the assumptions that market participants would use in pricing the asset or liability, including assumptions about risk (the risk inherent in a particular valuation technique used to measure fair value such as pricing model and/or the risk inherent in the inputs to the valuation technique). Inputs may be observable or unobservable. Observable inputs are inputs that reflect the assumptions market participants would use in pricing the asset or liability, developed based on market data obtained from sources independent of the reporting entity. Unobservable inputs are inputs that reflect the reporting entity’s own
| Bruce Fund |
| Notes to the Financial Statements (Unaudited) (continued) |
| December 31, 2021 |
assumptions about the assumptions market participants would use in pricing the asset or liability, developed based on the best information available in the circumstances. The three-tier hierarchy of inputs is summarized in the three broad levels listed below:
| ● | Level 1 – unadjusted quoted prices in active markets for identical investments and/ or registered investment companies where the value per share is determined and published and is the basis for current transactions for identical assets or liabilities at the valuation date |
| ● | Level 2 – other significant observable inputs (including, but not limited to, quoted prices for an identical security in an inactive market, quoted prices for similar securities, interest rates, prepayment speeds, credit risk, etc.) |
| ● | Level 3 – significant unobservable inputs (including the Fund’s own assumptions in determining fair value of investments based on the best information available) |
The inputs used to measure fair value may fall into different levels of the fair value hierarchy. In such cases, for disclosure purposes, the level in the fair value hierarchy within which the fair value measurement falls in its entirety, is determined based on the lowest level input that is significant to the fair value measurement in its entirety.
Equity securities, including common stocks, convertible preferred stocks, and American Depositary Receipts (ADR’s), are generally valued by using market quotations, but may be valued on the basis of prices furnished by a pricing service when the Adviser believes such prices more accurately reflect the fair value of such securities. Securities that are traded on any stock exchange are generally valued by the pricing service at the last quoted sale price. Lacking a last sale price, an exchange traded security is generally valued by the pricing service at its last bid price. Securities traded in the NASDAQ over-the-counter market are generally valued by the pricing service at the NASDAQ Official Closing Price. When using market quotations or close prices provided by the pricing service and when the market is considered active, the security will be classified as a Level 1 security. Sometimes, an equity security owned by the Fund will be valued by the pricing service with factors other than market quotations or when the market is considered inactive. When this happens, the security will be classified as a Level 2 security.
When market quotations are not readily available, when the Adviser determines that the market quotation or the price provided by the pricing service does not accurately reflect the current fair value, or when restricted or illiquid securities are being valued, such securities are valued as determined by the Adviser, in conformity with guidelines adopted by and subject to review by the Board of Directors (the “Board”). These securities are generally categorized as Level 3 securities.
Investments in mutual funds, including money market mutual funds, are generally priced at the ending NAV provided by the service agent of the funds. These securities will be categorized as Level 1 securities.
| Bruce Fund |
| Notes to the Financial Statements (Unaudited) (continued) |
| December 31, 2021 |
Fixed income securities, including corporate bonds, convertible corporate bonds, U.S. government bonds, and U.S. municipal bonds are generally categorized as Level 2 securities and valued on the basis of prices furnished by a pricing service. A pricing service uses various inputs and techniques, which include broker-dealer quotations, live trading levels, recently executed transactions in securities of the issuer or comparable issuers, and option adjusted spread models that include base curve and spread curve inputs. Adjustments to individual bonds can be applied to recognize trading differences compared to other bonds issued by the same issuer. The broker-dealer quotations received are supported by credit analysis of the issuer that takes into consideration credit quality assessments, daily trading activity, and the activity of the underlying equities, listed bonds and sector-specific trends. To the extent that these inputs are observable, the fixed income securities are categorized as Level 2 securities. If the Adviser decides that a price provided by the pricing service does not accurately reflect the fair value of the securities, when prices are not readily available from a pricing service, or when restricted or illiquid securities are being valued, securities are valued at fair value as determined in good faith by the Adviser, in conformity with guidelines adopted by and subject to review of the Board. These securities are generally categorized as Level 3 securities.
The following is a summary of the inputs used to value the Fund’s investments as of December 31, 2021, based on the three levels defined previously:
| | | Level 1 | | | Level 2 | | | Level 3 | | | Total | |
| Common Stocks | | | | | | | | | | | | | | | | |
| Communication Services | | $ | 5,447,303 | | | $ | — | | | $ | 1,300 | | | $ | 5,448,603 | |
| Energy | | | 441,458 | | | | — | | | | 56,685 | | | | 498,143 | |
| Financials | | | 32,942,000 | | | | — | | | | — | | | | 32,942,000 | |
| Health Care | | | 180,683,042 | | | | — | | | | — | | | | 180,683,042 | |
| Industrials | | | 58,830,640 | | | | — | | | | — | | | | 58,830,640 | |
| Materials | | | 6,760,012 | | | | — | | | | — | | | | 6,760,012 | |
| Technology | | | 27,523,350 | | | | — | | | | — | | | | 27,523,350 | |
| Utilities | | | 135,710,000 | | | | — | | | | — | | | | 135,710,000 | |
| U.S. Government Bonds | | | | | | | | | | | | | | | | |
| U.S. Treasury Strips | | | — | | | | 54,698,537 | | | | — | | | | 54,698,537 | |
| Convertible Corporate Bonds | | | | | | | | | | | | | | | | |
| Health Care | | | — | | | | 18,743,125 | | | | 150 | | | | 18,743,275 | |
| Money Market Funds | | | 85,466,770 | | | | — | | | | — | | | | 85,466,770 | |
| Total | | $ | 533,804,575 | | | $ | 73,441,662 | | | $ | 58,135 | | | $ | 607,304,372 | |
| Bruce Fund |
| Notes to the Financial Statements (Unaudited) (continued) |
| December 31, 2021 |
In the absence of a listed price quote, or in the case of a supplied price quote which is deemed to be unrepresentative of the actual market price, the Adviser shall use any or all of the following criteria to value Level 3 securities:
| ● | Price given by pricing service |
| ● | Last quoted bid & asked price |
| ● | Third party bid & asked price |
The significant unobservable inputs that may be used in the fair value measurement of the Fund’s investments in common stock, corporate bonds and convertible corporate bonds for which market quotations are not readily available include: broker quotes, discounts from the most recent trade or “stale price” and estimates from trustees (in bankruptcies) on disbursements. A change in the assumption used for each of the inputs listed above may indicate a directionally similar change in the fair value of the investment.
The following provides quantitative information about the Fund’s significant Level 3 fair value measurements as of December 31, 2021:
| Quantitative Information about Significant Level 3 Fair Value Measurements |
| | | Fair Value at | | | | | | | |
| | | December 31, | | | Valuation | | | | |
| Asset Category | | 2021 | | | Techniques | | Unobservable Input(s) | | Range |
| Common Stocks | | $ | 57,985 | | | Asset Liquidation Analysis | | Liquidation Proceeds | | N/A |
| Convertible Corporate Bonds | | | 150 | | | Asset Liquidation Analysis | | Liquidation Proceeds | | N/A |
Following is a reconciliation of assets in which significant unobservable inputs (Level 3) were used in determining fair value for the Fund:
| | | | | | | | | | | | Change in | |
| | | | | | | | | | | | unrealized | |
| | | Balance as of | | | Realized gain | | | Amortization/ | | | appreciation | |
| | | June 30, 2021 | | | (loss) | | | Accretion | | | (depreciation) | |
| Common Stock | | $ | 63,185 | | | $ | — | | | $ | — | | | $ | (5,200 | ) |
| Convertible Corporate Bonds | | | 150 | | | | — | | | | — | | | | 70,308 | |
| Total | | $ | 63,335 | | | $ | — | | | $ | — | | | $ | 65,108 | |
| Bruce Fund |
| Notes to the Financial Statements (Unaudited) (continued) |
| December 31, 2021 |
| | | | | | | | | | | | | | | | | | Balance | |
| | | | | | | | | | | | | | | | | | as of | |
| | | | | | | | | | | | Transfer in | | | Transfer out | | | December | |
| | | Purchases | | | Sales | | | Settlements | | | Level 3*(a) | | | Level 3*(b) | | | 31, 2021 | |
| Common Stock | | $ | — | | | $ | — | | | $ | — | | | $ | — | | | $ | — | | | $ | 57,985 | |
| Convertible Corporate Bonds | | | — | | | | — | | | | (70,308 | ) | | | — | | | | — | | | | 150 | |
| Total | | $ | — | | | $ | — | | | $ | (70,308 | ) | | $ | — | | | $ | — | | | $ | 58,135 | |
| * | The amount of transfers in and/or out are reflected at the reporting period end. |
| (a) | Transfers in relate primarily to securities for which observable inputs became unavailable during the period. Therefore, the securities were valued at fair value by the Adviser, in conformity with guidelines adopted by and subject to review by the Board, and are categorized as Level 3 inputs as of December 31, 2021. |
| (b) | Transfers out relate primarily to securities for which observable inputs became available during the period, and as of December 31, 2021, the Fund was able to obtain quotes from its pricing service. These quotes represent Level 2 inputs, which is the level of the fair value hierarchy in which these securities are included as of December 31, 2021. |
The total change in unrealized appreciation included in the Statement of Operations attributable to Level 3 investments still held at December 31, 2021 was as follows:
| | | Total Change in | |
| | | Unrealized Appreciation | |
| | | (Depreciation) | |
| Common Stock | | $ | (5,200 | ) |
| Convertible Corporate Bonds | | | 70,308 | |
| Corporate Bonds | | | — | |
| Total | | $ | 65,108 | |
NOTE D – PURCHASES AND SALES OF SECURITIES
For the six months ended December 31, 2021, cost of purchases and proceeds from maturities and sales of securities, other than short-term investments and short-term U.S. Government obligations were as follows:
| | | | | | U.S. | |
| | | | | | Government | |
| | | Other | | | Obligations | |
| Purchases | | $ | 3,019,806 | | | $ | — | |
| Sales | | $ | 27,939,529 | | | $ | — | |
| Bruce Fund |
| Notes to the Financial Statements (Unaudited) (continued) |
| December 31, 2021 |
NOTE E – RELATED PARTIES
Bruce & Co., Inc., an Illinois corporation, is the investment adviser of the Fund and furnishes investment advice. In addition, it provides office space and facilities and pays the cost of all prospectuses and financial reports (other than those mailed to current shareholders). Compensation to the Adviser for its services under the Investment Advisory Contract is paid monthly based on the following:
| Annual Percentage Fee | | Applied to Average Net Assets of Fund |
| 1.00% | | Up to $20,000,000; plus |
| 0.60% | | $20,000,000 to $100,000,000; plus |
| 0.50% | | over $100,000,000 |
At December 31, 2021, Robert B. Bruce was the beneficial owner of 22,226 Fund shares, R. Jeffrey Bruce was the beneficial owner of 27,836 Fund shares, Robert DeBartolo was the beneficial owner of 28 Fund shares, and W. Martin Johnson was the beneficial owner of 5 Fund shares. Robert B. Bruce, Robert DeBartolo, and W. Martin Johnson are directors of the Fund; both Robert B. Bruce and R. Jeffrey Bruce are officers of the Fund and are officers, directors and owners of the Adviser.
Ultimus Fund Solutions, LLC (“Ultimus”) provides administration, fund accounting and transfer agency services to the Fund. The Fund pays Ultimus fees in accordance with the agreements for such services. In addition, the Fund pays out-of-pocket expenses including, but not limited to, postage, supplies and certain costs related to the pricing of the Fund’s portfolio securities.
Under the terms of a Distribution Agreement with the Trust, Ultimus Fund Distributors, LLC (the “Distributor”) serves as the principal underwriter to the Fund. The Distributor is a wholly-owned subsidiary of Ultimus. The Distributor is compensated by the Adviser (not the Fund) for acting as principal underwriter.
NOTE F – FEDERAL INCOME TAXES
At December 31, 2021, the breakdown of net unrealized appreciation and tax cost of investments for federal income tax purpose is as follows:
| Gross Unrealized Appreciation | | $ | 267,253,463 | |
| Gross Unrealized Depreciation | | | (4,631,172 | ) |
| Net Unrealized Appreciation on Investments | | $ | 262,622,291 | |
| Tax Cost | | $ | 344,682,081 | |
| Bruce Fund |
| Notes to the Financial Statements (Unaudited) (continued) |
| December 31, 2021 |
At June 30, 2021, the Fund’s most recent fiscal year end, the components of distributable earnings (accumulated losses) on a tax basis were as follows:
| Undistributed Ordinary Income | | $ | 5,905,641 | |
| Undistributed Long-Term Capital Gains | | | 33,218,685 | |
| Accumulated Capital and Other Losses | | | — | |
| Unrealized Appreciation | | | 244,439,634 | |
| Total | | $ | 283,563,960 | |
The tax character of distributions paid during the fiscal year ended June 30, 2021 was as follows:
| Distributions paid from: | | | |
| Ordinary Income | | $ | 12,416,260 | |
| Long-Term Capital Gain | | | 18,753,243 | |
| Total | | $ | 31,169,503 | |
NOTE G – RESTRICTED SECURITIES
The Fund has acquired several securities, the sale of which is restricted, through private placement. At December 31, 2021, the aggregate market value of such securities listed below amounted to $150, or 0.0% of the Fund’s net assets. 100% of the restricted securities are valued according to fair value procedures approved by the Board. It is possible that the estimated value may differ significantly from the amount that might ultimately be realized in the near term, and the difference could be material.
The chart below shows the restricted securities held by the Fund as of December 31, 2021:
| | | Acquisition | | Principal | | | | | | | |
| Issuer Description | | Date | | Amount | | | Cost | | | Value | |
| Convertible Corporate Bonds | | | | �� | | | | | | | | | | |
| Synergy Pharmaceuticals, Inc., 7.50%, 11/1/19 | | 3/4/15 | | $ | 1,500,000 | | | $ | 702,290 | | | $ | 150 | |
NOTE H – SECTOR RISK
If the Fund has significant investments in the securities of issuers within a particular sector, any development affecting that sector will have a greater impact on the value of the net assets of the Fund than would be the case if the Fund did not have significant investments in that sector. In addition, this may increase the risk of loss in the Fund and increase the volatility of the Fund’s NAV per share. For instance, economic or market factors, regulatory changes or other developments may negatively impact all companies in a particular sector, and therefore the value of the Fund’s portfolio will be adversely affected. As of December 31, 2021, the Fund had 32.9% of the value of its net assets invested in stocks within the Health Care sector.
| Bruce Fund |
| Notes to the Financial Statements (Unaudited) (continued) |
| December 31, 2021 |
NOTE I – COMMITMENTS AND CONTINGENCIES
The Fund indemnifies its officers and Board for certain liabilities that may arise from their performance of their duties to the Fund. Additionally, in the normal course of business, the Fund enters into contracts that contain a variety of representations and warranties which provide general indemnifications. The Fund’s maximum exposure under these arrangements is unknown, as this would involve future claims that may be made against the Fund that have not yet occurred.
NOTE J – SUBSEQUENT EVENTS
In accordance with GAAP, management has evaluated subsequent events through the date these financial statements were issued. Based upon this evaluation, management has determined there were no items requiring adjustment of the financial statements or additional disclosure.
| Shareholder Expense Example (Unaudited) |
As a shareholder of the Fund, you incur ongoing costs, including management fees and other Fund expenses. This example is intended to help you understand your ongoing costs (in dollars) of investing in the Fund and to compare these costs with the ongoing costs of investing in other mutual funds. The example is based on an investment of $1,000 invested at the beginning of the period (July 1, 2021) and held for the entire period (through December 31, 2021).
Actual Expenses
The first line of the table below provides information about actual account values and actual expenses. You may use the information in this line, together with the amount you invested, to estimate the expenses that you paid over the period. Simply divide your account value by $1,000 (for example, an $8,600 account value divided by $1,000 = $8.60), then multiply the result by the number in the first line under the heading entitled “Expenses Paid During the Period” to estimate the expenses you paid on your account during this period.
Hypothetical Example for Comparison Purposes
The second line of the table below provides information about hypothetical account values and hypothetical expenses based on the Fund’s actual expense ratio and an assumed rate of return of 5% per year before expenses, which is not the Fund’s actual return. The hypothetical account values and expenses may not be used to estimate the actual ending account balance or expenses you paid for the period. You may use this information to compare the ongoing costs of investing in the Fund and other funds. To do so, compare this 5% hypothetical example with the 5% hypothetical examples that appear in the shareholder reports of the other funds.
Please note that the expenses shown in the table are meant to highlight your ongoing costs only and do not reflect any transactional costs, such as redemption fees. Therefore, the second line of the table is useful in comparing ongoing costs only, and will not help you determine the relative total costs of owning different funds.
| | | | | | | Expenses |
| | | Beginning | | Ending | | Paid During |
| | | Account Value, | | Account Value, | | the Period(a) |
| | | | | | | July 1 - |
| | | July 1, 2021 | | December 31, 2021 | | December 31, 2021 |
| Actual | | $1,000.00 | | $1,071.50 | | $3.39 |
| Hypothetical(b) | | $1,000.00 | | $1,021.93 | | $3.31 |
| (a) | Expenses are equal to the Fund’s six month annualized expense ratio of 0.65%, multiplied by the average account value over the period, multiplied by (184/365) (to reflect the partial year period). |
| (b) | Assumes a 5% return before expenses. |
| Approval of Management Agreement (Unaudited) |
At a meeting held on December 10, 2021, the Board of Directors (the “Board” or “Directors”) met to review and discuss the Investment Advisory Contract of the Company with Bruce & Company, Inc. (the “Adviser”).
As a rubric for its review, the Independent Directors considered:
| 1. | The nature, quality and extent of the services provided in relation to the fee paid. |
| 2. | The Adviser’s cost in providing the services/Adviser’s net earnings as a result of providing these services/profitability of the Fund to Adviser. |
| 3. | The extent to which the Adviser realizes economies of scale as the Fund grows larger. |
| 4. | The volume of orders which the Adviser must process. |
| 5. | Any possible “fall-out” benefits to the Adviser or to the Adviser’s other advisory clients as a result of the Adviser’s affiliation with the Fund. |
| 6. | Comparative fee structures, and whether the fee is excessive. |
| 7. | Specific business operations of the Adviser, financial condition, adequate capital resources to perform its duties. |
| 8. | Administration services provided by the Adviser. |
| 9. | Cost to the Adviser of services and estimated profitability of the Fund to the Adviser, discuss methodology to calculate such profitability |
| 10. | Economies of scale reflected in advisory fee. |
| 11. | Fall-out benefits received by the Adviser; discussion of soft dollar benefits received. |
| 12. | Discussion of the reasons for any underperformance, peer group or benchmark index. |
| 13. | Comparison of advisory fee and expense ratio to peer group, discussion of any significant differences. |
After the review, Director Johnson and DeBartolo made the following comments and discussion points:
| 1. | The fees for the services provided seem reasonable and appropriate for the services. |
| 2. | The Adviser’s costs also appear to be appropriate, with the Adviser bearing a good amount of operational costs and thus keeping the overall costs to operate the Fund low. |
| 3. | The Directors believe that the Adviser, over time, has addressed economies of scale appropriately for a Fund of its size. |
| 4. | For the last several years, the volume in overall Fund activity has not been volatile. Fees seem to reflect that and are appropriate. |
| 5. | The Adviser has been diligent to ensure that the Fund has provided no undue compensation or benefits to anyone. |
| Approval of Management Agreement (Unaudited) (continued) |
| 6. | Upon review of other like funds, the Adviser’s fee structure seems to be fair in comparison to other peer group funds and the overall percentage has declined over the past few years. The percentage of fees is among the lowest reported. |
| 7. | The Adviser maintains a low overall cost of operation and fund adviser maintains an adequate posture. |
| 8. | Administrative services are adequate for the operation of the Fund. The selected Administrator seems to be operating smoothly with modern supports. |
| 9. | Methodology in calculation seems to be consistent with industry standards. |
| 10. | Fee is on a sliding scale. |
| 11. | There is no indication of any soft dollar benefits received by the Adviser. The Adviser is straightforward and this is not the business practice of the Adviser. |
| 12. | Historically the Fund has performed better in difficult market conditions, thus a longer-term assessment is necessary. That said, short-term performance has been good. The Directors also believe that the fund structure will adequately address any upcoming market conditions. |
| 13. | Expense ratio of the Fund has always been among the lowest in comparison with competitors and remains so. |
The Independent Directors of the Board determined that the Adviser had fully and adequately carried out the terms and conditions of its contract with the Fund. The Board expressed satisfaction with the Fund’s performance, management’s control of expenses and the rate of the management fee for the Fund and the overall level of services provided to the Fund by the Adviser and by unanimous motion voted to renew the Bruce & Co. Investment Advisory contract.
| Liquidity Risk Management Program (Unaudited) |
The Fund has adopted and implemented a written liquidity risk management program (the “Program”) as required by Rule 22e-4 (the “Liquidity Rule”) under the 1940 Act. The Program is reasonably designed to assess and manage the Fund’s liquidity risk, taking into consideration, among other factors, the Fund’s investment strategy and the liquidity of its portfolio investments during normal and reasonably foreseeable stressed conditions; its short and long-term cash flow projections; and its cash holdings and access to other funding sources. The Fund’s Board approved the appointment of the Liquidity Program Administrator, comprising certain employees of the Adviser. The Liquidity Program Administrator maintains Program oversight and reports to the Board on at least an annual basis regarding the Program’s operational effectiveness through a written report (the “Report”). The Program’s most recent Report, which was presented to the Board for consideration at its meeting held on August 4, 2021, outlined the operation of the Program and the adequacy and effectiveness of the Program’s implementation. During the review period, the Fund’s holdings in securities that are deemed illiquid assets decreased from approximately 2% - 3% to 0% of its assets. Also, during the review period the Fund held adequate levels of cash and highly liquid investments to meet shareholder redemption activities in accordance with applicable requirements. The Report concluded that (i) the Program is reasonably designed to prevent violation of the Liquidity Rule and (ii) the Program has been effectively implemented.
The following is a description of the Fund’s policies regarding disclosure of nonpublic personal information that you provide to the Fund or that the Fund collects from other sources. In the event that you hold shares of the Fund through a broker-dealer or other financial intermediary, the privacy policy of your financial intermediary would govern how your nonpublic personal information would be shared with unaffiliated third parties.
Categories of Information the Fund Collects. The Fund collects the following nonpublic personal information about you:
| ● | Information the Fund receives from you on or in applications or other forms, correspondence, or conversations (such as your name, address, phone number, social security number, assets, income and date of birth); and |
| ● | Information about your transactions with the Fund, or others (such as your account number and balance, payment history, parties to transactions, cost basis information, and other financial information). |
Categories of Information the Fund Discloses. The Fund does not disclose any nonpublic personal information about its current or former shareholders to unaffiliated third parties, except as required or permitted by law. The Fund is permitted by law to disclose all of the information it collects, as described above, to its service providers (such as the Fund’s custodian, administrator and transfer agent) to process your transactions and otherwise provide services to you.
Confidentiality and Security. The Fund restricts access to your nonpublic personal formation to those persons who require such information to provide products or services to you. The Fund maintains physical, electronic and procedural safeguards that comply with federal standards to guard your nonpublic personal information.
Disposal of Information. The Fund, through its transfer agent, has taken steps to reasonably ensure that the privacy of your nonpublic personal information is maintained at all times, including in connection with the disposal of information that is no longer required to be maintained by the Fund. Such steps shall include whenever possible, shredding paper documents and records prior to disposal, requiring off-site storage vendors to shred documents maintained in such locations prior to disposal, and erasing and/or obliterating any data contained on electronic media in such a manner that the information can no longer be read or reconstructed.
This page is intentionally left blank.
A description of the policies and procedures that the Fund uses to determine how to vote proxies relating to portfolio securities and information regarding how the Fund voted those proxies during the most recent twelve month period ended June 30, are available (1) without charge upon request by calling the Fund at (800) 872-7823 and (2) in Fund documents filed with the Securities and Exchange Commission (“SEC”) on the SEC’s website at www.sec.gov.
BRUCE FUND
OFFICERS AND DIRECTORS
Robert B. Bruce
President and Treasurer
R. Jeffrey Bruce
Vice President and Secretary
Robert DeBartolo
Director
W. Martin Johnson
Director
Investment Adviser
Bruce and Co., Inc.
Chicago, Illinois
Custodian
Huntington National Bank
Columbus, Ohio
Administrator, Transfer Agent and Fund Accountant
Ultimus Fund Solutions, LLC
Cincinnati, Ohio
Distributor
Ultimus Fund Distributors, LLC
Cincinnati, Ohio
Counsel
Klevatt & Associates
Chicago, Illinois
Independent Registered Public Accounting Firm
Grant Thornton LLP
Chicago, Illinois
This report is intended only for the information of shareholders or those who have received the Fund’s prospectus which contains information about the Fund’s management fees and expenses. Please read the prospectus carefully before investing.
Distributed by Ultimus Fund Distributors, LLC, Member FINRA/SIPC
Bruce-SAR-21
(b) Not applicable.
Item 2. Code of Ethics.
Not applicable
Item 3. Audit Committee Financial Expert.
Not applicable
Item 4. Principal Accountant Fees and Services.
Not applicable
Item 5. Audit Committee of Listed Companies.
Not applicable
Item 6. Schedule of Investments.
Not applicable – schedule filed with Item 1.
Item 7. Disclosure of Proxy Voting Policies and Procedures for Closed-End Management Investment Companies.
Not Applicable - Applies to closed-end funds only.
Item 8. Portfolio Managers of Closed-End Management Investment Companies.
Not applicable - Applies to closed-end funds only.
Item 9. Purchases of Equity Securities by Closed-End Management Investment Company and Affiliated Purchasers.
Not applicable - Applies to closed-end funds only.
Item 10. Submission of Matters to a Vote of Security Holders.
Not Applicable - The registrant has not adopted procedures by which shareholders may recommend nominees to the registrant’s board of directors.
Item 11. Controls and Procedures.
(a) The registrant’s Principal Executive Officer and Principal Financial Officer have concluded that the registrant’s disclosure controls and procedures (as defined in Rule 30a-3(c) under the Act) are effective in design and operation and are sufficient to form the basis of the certifications required by Rule 30a-2 under the Act, based on their evaluation of these disclosure controls and procedures within 90 days of the filing of this report on Form N-CSR.
(b) There were no changes in the registrant’s internal control over financial reporting (as defined in Rule 30a-3(d) under the Act (17 CFR 270.30a-3(d))) that occurred during the period covered by this report that have materially affected or are reasonably likely to materially affect, the registrant’s internal control over financial reporting.
Item 12. Disclosure of Securities Lending Activities for Closed-End Investment Companies.
Not Applicable.
Item 13. Exhibits.
(a)(1) Not applicable – Filed with Annual Report
(a)(3) Not Applicable – there were no written solicitations to purchase securities under Rule 23c-1
during the period.
SIGNATURES
Pursuant to the requirements of the Securities Exchange Act of 1934 and the Investment Company Act of 1940, the registrant has duly caused this report to be signed on its behalf by the undersigned, thereunto duly authorized.
| By | /s/ Robert B. Bruce |
| | Robert B. Bruce, President |
Pursuant to the requirements of the Securities Exchange Act of 1934 and the Investment Company Act of 1940, this report has been signed below by the following persons on behalf of the registrant and in the capacities and on the dates indicated.
| By | /s/ Robert B. Bruce |
| | Robert B. Bruce, President |
| By | /s/ R. Jeffrey Bruce |
| | R. Jeffery Bruce, Principal Accounting Officer |