UNITED STATES
SECURITIES AND EXCHANGE COMMISSION
Washington, D.C. 20549
FORM N-CSR
CERTIFIED SHAREHOLDER REPORT OF REGISTERED MANAGEMENT INVESTMENT COMPANIES
Investment Company Act file number: 811-00558
THE HARTFORD MUTUAL FUNDS II, INC.
(Exact name of registrant as specified in charter)
P. O. Box 2999, Hartford, Connecticut 06104-2999
(Address of Principal Executive Offices)
Edward P. Macdonald, Esquire
Life Law Unit
The Hartford Financial Services Group, Inc.
200 Hopmeadow Street
Simsbury, Connecticut 06089
(Name and Address of Agent for Service)
Registrant’s telephone number, including area code: (860) 843-9934
Date of fiscal year end: October 31st
Date of reporting period: November 1, 2008 — October 31, 2009
Form N-CSR is to be used by management investment companies to file reports with the Commission not later than 10 days after the transmission to stockholders of any report that is required to be transmitted to stockholders under Rule 30e-1 under the Investment Company Act of 1940 (17 CFR 270.30e-1). The Commission may use the information provided on Form N-CSR in its regulatory, disclosure review, inspection, and policymaking roles.
A registrant is required to disclose the information specified by Form N-CSR, and the Commission will make this information public. A registrant is not required to respond to the collection of information contained in Form N-CSR unless the Form displays a currently valid Office of Management and Budget (“OMB”) control number. Please direct comments concerning the accuracy of the information collection burden estimate and any suggestions for reducing the burden to Secretary, Securities and Exchange Commission, 450 Fifth Street, NW, Washington, DC 20549-0609. The OMB has reviewed this collection of information under the clearance requirements of 44 U.S.C. § 3507.
Item 1. Reports to Stockholders.
The Hartford Growth Fund
Table of Contents
| | | | | |
| Manager Discussions (Unaudited) | | | 2 | |
| | |
| Financial Statements | | | | |
| | |
| | | 4 | |
| | |
| | | 6 | |
| | |
| | | 7 | |
| | |
| | | 8 | |
| | |
| | | 9 | |
| | |
| | | 10 | |
| | |
| | | 22 | |
| | |
| | | 24 | |
| | |
| | | 25 | |
| | |
| | | 27 | |
| | |
| | | 27 | |
| | |
| | | 28 | |
| | |
| | | 29 | |
| | |
| | | 30 | |
| | | |
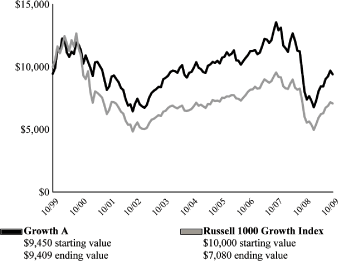
The Hartford Growth Fund inception 06/08/1949
(subadvised by Wellington Management Company, LLP) | | Investment objective — Seeks long-term capital appreciation. |
Performance Overview(1) 10/31/99 - 10/31/09
Growth of a $10,000 investment in Class A which includes Sales Charge
Russell 1000 Growth Index is an unmanaged index which measures the performance of those Russell 1000 Index companies with higher price-to-book ratios and higher forecasted growth values.
You cannot invest directly in an index.
The value of shares will fluctuate so that, when redeemed, shares may be worth more or less than their original cost. The chart and table do not reflect the deduction of taxes that a shareholder would pay on fund distributions or the redemption of fund shares.
Performance information may reflect historical or current expense waivers/reimbursements from the investment adviser, without which performance would have been lower. For information on current expense waivers/reimbursements, please see the prospectus.
Average Annual Total Returns(2,3,4,5) (as of 10/31/09)
| | | | | | | | | | | | | |
| | | 1 | | 5 | | 10 |
| | | Year | | Year | | Year |
| Growth A# | | | 17.08 | % | | | -0.42 | % | | | -0.04 | % |
| Growth A## | | | 10.64 | % | | | -1.54 | % | | | -0.61 | % |
| Growth B# | | | 16.58 | % | | | -1.09 | % | | NA | * |
| Growth B## | | | 11.58 | % | | | -1.43 | % | | NA | * |
| Growth C# | | | 16.23 | % | | | -1.12 | % | | | -0.74 | % |
| Growth C## | | | 15.23 | % | | | -1.12 | % | | | -0.74 | % |
| Growth I# | | | 17.45 | % | | | -0.19 | % | | NA | |
| Growth L# | | | 17.24 | % | | | -0.19 | % | | | 0.15 | % |
| Growth L## | | | 11.68 | % | | | -1.15 | % | | | -0.33 | % |
| Growth R3# | | | 16.69 | % | | | -0.38 | % | | NA | |
| Growth R4# | | | 17.09 | % | | | -0.18 | % | | NA | |
| Growth R5# | | | 17.50 | % | | | -0.02 | % | | NA | |
| Growth Y# | | | 17.62 | % | | | 0.05 | % | | NA | |
| Russell 1000 Growth Index | | | 17.51 | % | | | 1.27 | % | | | -3.39 | % |
| | |
| # | | Without sales charge |
| |
| ## | | With sales charge |
| |
| NA | | Not Applicable |
| |
| * | | 10 year returns are not applicable for Class B because after 8 years Class B converts to Class A. |
PAST PERFORMANCE IS NOT INDICATIVE OF FUTURE RESULTS.
| (1) | | Growth of a $10,000 investment in Classes B, C, I, L, R3, R4, R5 and Y shares will vary from results seen above due to differences in the expenses charged to these share classes. |
| |
| (2) | | Classes A, B, C and Y shares were offered beginning on 2/19/02. Performance prior to that date for Class A is that of the fund’s Class L shares and for Classes B and C is that of the fund’s Classes M and N shares, respectively, which had lower operating expenses. Performance prior to 2/19/02 would have been lower if Classes A, B and C shares expenses were applied during that period. (Classes M and N shares are no longer offered.) Class I shares commenced operations on 8/31/06. Performance prior to 8/31/06 reflects Class A performance. Classes R3, R4 and R5 shares commenced operations on 12/22/06. Performance prior to 12/22/06 reflects Class Y performance. The Fund’s performance information prior to 4/1/01 reflects when the Fund was managed by a previous investment adviser. |
| |
| (3) | | The initial investment in Classes A and L shares reflects the maximum sales charge and Classes B and C reflect CDSC. |
| |
| (4) | | Total returns presented above were calculated using the Fund’s net asset value available to shareholders for sale or redemption of Fund shares on 10/31/09, which excludes investment transactions as of this date. |
| |
| (5) | | Effective 9/30/09, Class B shares of The Hartford Mutual Funds are closed to new investments. |
| | | |
Portfolio Managers | | |
Andrew J. Shilling, CFA | | John A. Boselli, CFA |
| Senior Vice President, Partner | | Director, Partner |
How did the Fund perform?
The Class A shares of The Hartford Growth Fund returned 17.08%, before sales charge, for the twelve-month period ended October 31, 2009 underperforming its benchmark, the Russell 1000 Growth Index, which returned 17.51% for the same period. The Fund outperformed the 15.35% return of the average fund in the Large-Cap Growth Funds peer group, a group of funds with investment strategies similar to those of the Fund.
2
Why did the Fund perform this way?
Broad U.S. equity markets rose during the period, but the overall results masks two significantly different market environments. From the beginning of November through early March stocks fell sharply reflecting deepening economic worries and concerns over the U.S. government’s increasing involvement in the economy. From early March through October stocks rallied as investors came to believe that a Depression-like scenario was less likely.
Though all sectors of the Russell 1000 Growth Index had a positive return for the period, performance varied across sectors, with relative strength in Information Technology (+31%), Consumer Discretionary (+25%), and Materials (+21%) and relative weakness in Health Care (+7%), Utilities (+9%), and Industrials (+9%) in aggregate. Growth stocks (+18%) significantly outperformed Value stocks (+5%), as measured by the Russell 1000 Growth and Russell 1000 Value indices.
The Fund’s underperformance versus its benchmark was primarily due to security selection. Weaker results from our selection of Consumer Discretionary, Information Technology, and Materials stocks detracted from performance versus the benchmark, though this was partially offset by the Fund’s very strong selection in Industrials. The Fund benefitted from its sector positioning, which is a fallout of the bottom-up (i.e. stock by stock fundamental research) stock selection process. In particular, underweight (i.e. the Fund’s sector position was less than the benchmark position) positions in Health Care and Consumer Staples, in addition to an overweight (i.e. the Fund’s sector position was greater than the benchmark position) position in Information Technology helped relative (i.e. performance of the Fund as measured against the benchmark) results.
Apollo Group (Consumer Discretionary), Marsh & McLennan (Financials), and Covidien (Health Care) were the top detractors from relative performance during the period. For-profit education provider Apollo Group, which operates the University of Phoenix in addition to other institutions, saw share price weakness due to criticisms of the company’s academic quality, assessment, recruiting, and financial aid procedures. Marsh & McLennan’s share price stagnated over the period as earnings were hampered by adverse foreign exchange movements, lower investment income, and recession-related weaker growth. Covidien continues to transition into a stand-alone global healthcare products company following its spinout from Tyco, providing health care products for use in clinical and home settings. Its stock price suffered during the period due to concerns that restructuring would result in below-consensus earnings as well as fears that foreign exchange volatility would hurt earnings. Insurer MetLife (Financials) and digital advertising company Focus Media (Consumer Discretionary) were top detractors from absolute (i.e. total return) performance.
Top contributors to absolute and benchmark-relative returns were Goldman Sachs (Financials), NetApp (Information Technology), and Wal-Mart Stores (Consumer Staples). Shares of leading investment bank Goldman Sachs moved higher as investors were attracted to the firm’s relatively clean balance sheet, and improved competitive positioning within investment banking industry. Investors also rewarded the company for repaying its TARP funds. Shares of NetApp, a network storage equipment manufacturer, rose throughout the period as the company expanded its operating margins through improved cost controls and positioned itself to benefit from better macroeconomic conditions and information technology spending. Shares of Wal-Mart, the world’s largest retailer stagnated during the period as investors favored companies that they believe may benefit more from a rebound in consumer spending. We eliminated our position in Wal-Mart early in the period, which contributed to relative outperformance. Schlumberger (Energy) was also a top contributor to absolute returns.
What is the outlook?
It is increasingly clear that the U.S. is emerging from a deep recession. The rate of increase in unemployment has slowed, industrial production leading indicators are pointing to an expansion, and the housing market has shown some signs of stabilization. The government continues to reshape the financial playing field through stimulus packages, massive loans to impaired private sector companies, and other programs, all taken with an eye towards thawing credit markets and placing a floor on housing price declines and a ceiling on housing inventory. These moves should continue to help mitigate some of the negative economic pressures, and while the outlook remains uncertain, the equity market’s improved performance since its March lows show investors are anticipating a recovery.
In this environment we continue to focus our efforts on stock-by-stock fundamental research, picking one stock at a time based upon the attractiveness of each company’s fundamentals and valuation. As a result of this bottom up stock selection, our largest overweight positions versus the benchmark were Financials, Consumer Discretionary, and Industrials sectors. The Consumer Staples, Health Care, and Utilities sectors were the Fund’s largest underweight positions at the end of the period.
Diversification by Industry
as of October 31, 2009
| | | | | |
| | | Percentage of |
| Industry (Sector) | | Net Assets |
| Automobiles & Components (Consumer Discretionary) | | | 2.0 | % |
| Banks (Financials) | | | 4.6 | |
| Capital Goods (Industrials) | | | 13.9 | |
| Consumer Durables & Apparel (Consumer Discretionary) | | | 2.1 | |
| Consumer Services (Consumer Discretionary) | | | 3.7 | |
| Diversified Financials (Financials) | | | 6.4 | |
| Energy (Energy) | | | 9.7 | |
| Health Care Equipment & Services (Health Care) | | | 1.0 | |
| Insurance (Financials) | | | 4.2 | |
| Materials (Materials) | | | 3.5 | |
| Media (Consumer Discretionary) | | | 1.1 | |
| Pharmaceuticals, Biotechnology & Life Sciences (Health Care) | | | 0.8 | |
| Retailing (Consumer Discretionary) | | | 9.3 | |
| Semiconductors & Semiconductor Equipment (Information Technology) | | | 3.2 | |
| Software & Services (Information Technology) | | | 17.4 | |
| Technology Hardware & Equipment (Information Technology) | | | 14.7 | |
| Transportation (Industrials) | | | 1.9 | |
| Short-Term Investments | | | 0.5 | |
| Other Assets and Liabilities | | | — | |
| | | | | |
Total | | | 100.0 | % |
| | | | | |
3
The Hartford Growth Fund
Schedule of Investments
October 31, 2009
(000’s Omitted)
| | | | | | | | | |
| Shares or Principal Amount | | | Market Value ╪ | |
| COMMON STOCKS - 99.5% | | | | |
| | | | | Automobiles & Components - 2.0% | | | | |
| | 252 | | | Harley-Davidson, Inc. | | $ | 6,270 | |
| | 266 | | | Johnson Controls, Inc. | | | 6,369 | |
| | | | | | | | |
| | | | | | | | 12,639 | |
| | | | | | | | |
| | | | | Banks - 4.6% | | | | |
| | 316 | | | Itau Unibanco Banco Multiplo S.A. ADR | | | 6,042 | |
| | 394 | | | SunTrust Banks, Inc. | | | 7,521 | |
| | 607 | | | Wells Fargo & Co. | | | 16,711 | |
| | | | | | | | |
| | | | | | | | 30,274 | |
| | | | | | | | |
| | | | | Capital Goods - 13.9% | | | | |
| | 261 | | | ABB Ltd. ADR | | | 4,830 | |
| | 175 | | | Boeing Co. | | | 8,361 | |
| | 28 | | | Caterpillar, Inc. | | | 1,560 | |
| | 166 | | | Cummins, Inc. | | | 7,128 | |
| | 77 | | | Eaton Corp. | | | 4,677 | |
| | 86 | | | Fluor Corp. | | | 3,802 | |
| | 193 | | | General Dynamics Corp. | | | 12,124 | |
| | 208 | | | Illinois Tool Works, Inc. | | | 9,564 | |
| | 358 | | | PACCAR, Inc. | | | 13,400 | |
| | 143 | | | Precision Castparts Corp. | | | 13,613 | |
| | 76 | | | Siemens AG ADR | | | 6,884 | |
| | 81 | | | Vestas Wind Systems A/S • | | | 5,654 | |
| | | | | | | | |
| | | | | | | | 91,597 | |
| | | | | | | | |
| | | | | Consumer Durables & Apparel - 2.1% | | | | |
| | 423 | | | Coach, Inc. | | | 13,961 | |
| | | | | | | | |
| | |
| | | | | Consumer Services - 3.7% | | | | |
| | 162 | | | Apollo Group, Inc. Class A • | | | 9,228 | |
| | 435 | | | International Game Technology | | | 7,754 | |
| | 827 | | | MGM Mirage, Inc. • | | | 7,662 | |
| | | | | | | | |
| | | | | | | | 24,644 | |
| | | | | | | | |
| | | | | Diversified Financials - 6.4% | | | | |
| | 449 | | | Bank of America Corp. | | | 6,547 | |
| | 78 | | | Goldman Sachs Group, Inc. | | | 13,326 | |
| | 90 | | | JP Morgan Chase & Co. | | | 3,774 | |
| | 460 | | | Moody’s Corp. | | | 10,885 | |
| | 474 | | | UBS AG | | | 7,899 | |
| | | | | | | | |
| | | | | | | | 42,431 | |
| | | | | | | | |
| | | | | Energy - 9.7% | | | | |
| | 171 | | | Consol Energy, Inc. | | | 7,318 | |
| | 336 | | | Halliburton Co. | | | 9,811 | |
| | 178 | | | Hess Corp. | | | 9,717 | |
| | 246 | | | National Oilwell Varco, Inc. • | | | 10,087 | |
| | 103 | | | Petroleo Brasileiro S.A. ADR | | | 4,763 | |
| | 268 | | | Schlumberger Ltd. | | | 16,663 | |
| | 70 | | | Transocean, Inc. • | | | 5,853 | |
| | | | | | | | |
| | | | | | | | 64,212 | |
| | | | | | | | |
| | | | | Health Care Equipment & Services - 1.0% | | | | |
| | 156 | | | Covidien plc | | | 6,589 | |
| | | | | | | | |
| | |
| | | | | Insurance - 4.2% | | | | |
| | 899 | | | Lincoln National Corp. | | | 21,425 | |
| | 256 | | | Marsh & McLennan Cos., Inc. | | | 5,995 | |
| | | | | | | | |
| | | | | | | | 27,420 | |
| | | | | | | | |
| | | | | Materials - 3.5% | | | | |
| | 168 | | | Barrick Gold Corp. | | | 6,043 | |
| | 121 | | | BHP Billiton Ltd. ADR | | | 7,920 | |
| | 73 | | | Freeport-McMoRan Copper & Gold, Inc. | | | 5,319 | |
| | 87 | | | Mosaic Co. | | | 4,058 | |
| | | | | | | | |
| | | | | | | | 23,340 | |
| | | | | | | | |
| | | | | Media - 1.1% | | | |
| | 258 | | | Viacom, Inc. Class B • | | $ | 7,131 | |
| | | | | | | | |
| | | | | | | | | |
| | | | | Pharmaceuticals, Biotechnology & Life Sciences - 0.8% | | | | |
| | 103 | | | Teva Pharmaceutical Industries Ltd. ADR | | | 5,205 | |
| | | | | | | | |
| | | | | | | | | |
| | | | | Retailing - 9.3% | | | | |
| | 80 | | | Amazon.com, Inc. • | | | 9,562 | |
| | 325 | | | Best Buy Co., Inc. | | | 12,410 | |
| | 422 | | | Lowe’s Co., Inc. | | | 8,257 | |
| | 514 | | | Staples, Inc. | | | 11,160 | |
| | 211 | | | Target Corp. | | | 10,223 | |
| | 275 | | | TJX Cos., Inc. | | | 10,279 | |
| | | | | | | | |
| | | | | | | | 61,891 | |
| | | | | | | | |
| | | | | Semiconductors & Semiconductor Equipment - 3.2% | | | | |
| | 322 | | | Altera Corp. | | | 6,374 | |
| | 243 | | | Analog Devices, Inc. | | | 6,233 | |
| | 370 | | | Texas Instruments, Inc. | | | 8,679 | |
| | | | | | | | |
| | | | | | | | 21,286 | |
| | | | | | | | |
| | | | | Software & Services - 17.4% | | | | |
| | 154 | | | Accenture plc | | | 5,718 | |
| | 159 | | | BMC Software, Inc. • | | | 5,909 | |
| | 36 | | | Google, Inc. • | | | 19,392 | |
| | 40 | | | Mastercard, Inc. | | | 8,752 | |
| | 186 | | | McAfee, Inc. • | | | 7,794 | |
| | 505 | | | Microsoft Corp. | | | 14,015 | |
| | 915 | | | Oracle Corp. | | | 19,313 | |
| | 507 | | | VeriSign, Inc. • | | | 11,555 | |
| | 88 | | | Visa, Inc. | | | 6,681 | |
| | 439 | | | Western Union Co. | | | 7,983 | |
| | 510 | | | Yahoo!, Inc. • | | | 8,103 | |
| | | | | | | | |
| | | | | | | | 115,215 | |
| | | | | | | | |
| | | | | Technology Hardware & Equipment - 14.7% | | | | |
| | 126 | | | Apple, Inc. • | | | 23,763 | |
| | 1,138 | | | Cisco Systems, Inc. • | | | 25,993 | |
| | 314 | | | EMC Corp. • | | | 5,174 | |
| | 399 | | | Juniper Networks, Inc. • | | | 10,190 | |
| | 589 | | | NetApp, Inc. • | | | 15,932 | |
| | | | | | | | |
| | 366 | | | Qualcomm, Inc. | | | 15,164 | |
| | | | | | | | |
| | | | | | | | 96,216 | |
| | | | | | | | |
| | | | | Transportation - 1.9% | | | | |
| | 173 | | | FedEx Corp. | | | 12,610 | |
| | | | | | | | |
| | | | | | | | | |
| | | | | Total common stocks
(cost $594,566) | | $ | 656,661 | |
| | | | | | | | | |
| | | | | Total long-term investments
(cost $594,566) | | $ | 656,661 | |
| | | | | | | | |
| | |
| SHORT-TERM INVESTMENTS - 0.5% | | | | |
| | | | | Repurchase Agreements - 0.5% | | | | |
| | | | | Banc of America Securities TriParty Joint Repurchase Agreement (maturing on 11/02/2009 in the amount of $123, collateralized by GNMA 5.00%, 2039, value of $125) | | | | |
| $ | 123 | | | 0.08%, 10/30/2009 | | $ | 123 | |
The accompanying notes are an integral part of these financial statements.
4
| | | | | | | | | | | | | |
| Shares or Principal Amount | | | | | | | Market Value ╪ | |
| SHORT-TERM INVESTMENTS - 0.5% — (continued) | | | | | | | | |
| | | | | Repurchase Agreements - 0.5% — (continued) | | | | | | | | |
| | | | | BNP Paribas Securities Corp. TriParty Joint Repurchase Agreement (maturing on 11/02/2009 in the amount of $718, collateralized by FHLMC 4.00% - 7.00%, 2011 - 2039, FNMA 4.00% - 7.00%, 2017 - 2047, value of $733) | | | | | | | | |
| $ | 718 | | | 0.08%, 10/30/2009 | | | | | | $ | 718 | |
| | | | | Deutsche Bank Securities TriParty Joint Repurchase Agreement (maturing on 11/02/2009 in the amount of $800, collateralized by FHLMC 6.00%, 2036, FNMA 7.00%, 2038, value of $816) | | | | | | | | |
| | 800 | | | 0.08%, 10/30/2009 | | | | | | | 800 | |
| | | | | UBS Securities, Inc. Joint Repurchase Agreement (maturing on 11/02/2009 in the amount of $8, collateralized by U.S. Treasury Note 2.75%, 2013, value of $8) | | | | | | | | |
| | 8 | | | 0.05%, 10/30/2009 | | | | | | | 8 | |
| | | | | UBS Securities, Inc. TriParty Joint Repurchase Agreement (maturing on 11/02/2009 in the amount of $1,386, collateralized by FNMA 4.00% - 7.50%, 2016 - 2048, value of $1,414) | | | | | | | | |
| | 1,386 | | | 0.07%, 10/30/2009 | | | | | | | 1,386 | |
| | | | | | | | | | | | |
| | | | | | | | | | | | 3,035 | |
| | | | | | | | | | | | |
| | | | | Total short-term investments
(cost $3,035) | | | | | | $ | 3,035 | |
| | | | | | | | | | | | |
| | | | | Total investments
(cost $597,601) ▲ | | | 100.0 | % | | $ | 659,696 | |
| | | | | Other assets and liabilities | | | — | % | | | 197 | |
| | | | | | | | | | | |
| | | | | Total net assets | | | 100.0 | % | | $ | 659,893 | |
| | | | | | | | | | | |
| | |
| Note: | | Percentage of investments as shown is the ratio of the total market value to total net assets. Market value of investments in foreign securities represents 8.3% of total net assets at October 31, 2009. |
| |
| | | Foreign securities that are principally traded on certain foreign markets are adjusted daily pursuant to a third party pricing service methodology approved by the Board of Directors in order to reflect an adjustment for factors occurring after the close of the foreign market but before the close of the New York Stock Exchange. |
| |
| ▲ | | At October 31, 2009, the cost of securities for federal income tax purposes was $613,857 and the aggregate gross unrealized appreciation and depreciation based on that cost were: |
| | | | | |
| Unrealized Appreciation | | $ | 81,328 | |
| Unrealized Depreciation | | | (35,489 | ) |
| | | | |
| Net Unrealized Appreciation | | $ | 45,839 | |
| | | | |
| | |
| • | | Currently non-income producing. |
| |
| ╪ | | See Significant Accounting Policies of accompanying Notes to Financial Statements regarding valuation of securities. |
The accompanying notes are an integral part of these financial statements.
5
The Hartford Growth Fund
Investment Valuation Hierarchy Level Summary
October 31, 2009
(000’s Omitted)
| | | | | | | | | | | | | | | | | |
| | | Total | | | Level 1 | | | Level 2 | | | Level 3 | |
Assets: | | | | | | | | | | | | | | | | |
| Common Stocks ‡ | | $ | 656,661 | | | $ | 643,108 | | | $ | 13,553 | | | $ | — | |
| Short-Term Investments | | | 3,035 | | | | — | | | | 3,035 | | | | — | |
| | | | | | | | | | | | | |
| Total | | $ | 659,696 | | | $ | 643,108 | | | $ | 16,588 | | | $ | — | |
| | | | | | | | | | | | | |
| | |
| ‡ | | The Fund has all or primarily all of these equity securities categorized in a single level. Refer to the Schedule of Investments for further industry breakout. |
The accompanying notes are an integral part of these financial statements.
6
The Hartford Growth Fund
Statement of Assets and Liabilities
October 31, 2009
(000’s Omitted)
| | | | | |
Assets: | | | | |
| Investments in securities, at market value (cost $597,601) | | $ | 659,696 | |
| Cash | | | — | |
| Receivables: | | | | |
| Fund shares sold | | | 803 | |
| Dividends and interest | | | 648 | |
| Other assets | | | 70 | |
| | | | |
| Total assets | | | 661,217 | |
| | | | |
Liabilities: | | | | |
| Payables: | | | | |
| Fund shares redeemed | | | 1,048 | |
| Investment management fees | | | 84 | |
| Distribution fees | | | 30 | |
| Accrued expenses | | | 162 | |
| | | | |
| Total liabilities | | | 1,324 | |
| | | | |
| Net assets | | $ | 659,893 | |
| | | | |
Summary of Net Assets: | | | | |
| Capital stock and paid-in-capital | | | 783,781 | |
| Accumulated undistributed net investment income | | | 1,251 | |
| Accumulated net realized loss on investments and foreign currency transactions | | | (187,242 | ) |
| Unrealized appreciation of investments and the translation of assets and liabilities denominated in foreign currency | | | 62,103 | |
| | | | |
| Net assets | | $ | 659,893 | |
| | | | |
| | | | | |
| Shares authorized | | | 27,000,000 | |
| | | | |
| Par value | | $ | 0.0001 | |
| | | | |
Class A: Net asset value per share/Maximum offering price per share | | $ | 13.57/$14.36 | |
| | | | |
| Shares outstanding | | | 19,218 | |
| | | | |
| Net assets | | $ | 260,833 | |
| | | | |
Class B: Net asset value per share | | $ | 11.46 | |
| | | | |
| Shares outstanding | | | 1,686 | |
| | | | |
| Net assets | | $ | 19,319 | |
| | | | |
Class C: Net asset value per share | | $ | 11.46 | |
| | | | |
| Shares outstanding | | | 3,894 | |
| | | | |
| Net assets | | $ | 44,604 | |
| | | | |
Class I: Net asset value per share | | $ | 13.73 | |
| | | | |
| Shares outstanding | �� | | 3,964 | |
| | | | |
| Net assets | | $ | 54,433 | |
| | | | |
Class L: Net asset value per share/Maximum offering price per share | | $ | 13.87/$14.56 | |
| | | | |
| Shares outstanding | | | 12,826 | |
| | | | |
| Net assets | | $ | 177,922 | |
| | | | |
Class R3: Net asset value per share | | $ | 13.84 | |
| | | | |
| Shares outstanding | | | 12 | |
| | | | |
| Net assets | | $ | 163 | |
| | | | |
Class R4: Net asset value per share | | $ | 13.98 | |
| | | | |
| Shares outstanding | | | 182 | |
| | | | |
| Net assets | | $ | 2,541 | |
| | | | |
Class R5: Net asset value per share | | $ | 14.10 | |
| | | | |
| Shares outstanding | | | 6 | |
| | | | |
| Net assets | | $ | 91 | |
| | | | |
Class Y: Net asset value per share | | $ | 14.15 | |
| | | | |
| Shares outstanding | | | 7,067 | |
| | | | |
| Net assets | | $ | 99,987 | |
| | | | |
The accompanying notes are an integral part of these financial statements.
7
The Hartford Growth Fund
Statement of Operations
For the Year Ended October 31, 2009
(000’s Omitted)
| | | | | |
Investment Income: | | | | |
| Dividends | | $ | 8,983 | |
| Interest | | | 20 | |
| Securities lending | | | 43 | |
| Less: Foreign tax withheld | | | (158 | ) |
| | | | |
| Total investment income | | | 8,888 | |
| | | | |
| | | | | |
Expenses: | | | | |
| Investment management fees | | | 4,875 | |
| Administrative services fees | | | 3 | |
| Transfer agent fees | | | 1,286 | |
| Distribution fees | | | | |
| Class A | | | 691 | |
| Class B | | | 184 | |
| Class C | | | 425 | |
| Class L | | | 405 | |
| Class R3 | | | — | |
| Class R4 | | | 5 | |
| Custodian fees | | | 17 | |
| Accounting services fees | | | 78 | |
| Registration and filing fees | | | 135 | |
| Board of Directors’ fees | | | 19 | |
| Audit fees | | | 23 | |
| Other expenses | | | 235 | |
| | | | |
| Total expenses (before waivers and fees paid indirectly) | | | 8,381 | |
| Expense waivers | | | (522 | ) |
| Transfer agent fee waivers | | | (237 | ) |
| Commission recapture | | | (63 | ) |
| Custodian fee offset | | | — | |
| | | | |
| Total waivers and fees paid indirectly | | | (822 | ) |
| | | | |
| Total expenses, net | | | 7,559 | |
| | | | |
Net Investment Income | | | 1,329 | |
| | | | |
Net Realized Loss on Investments and Foreign Currency Transactions: | | | | |
| Net realized loss on investments in securities | | | (160,090 | ) |
| Net realized loss on forward foreign currency contracts | | | (132 | ) |
| Net realized gain on other foreign currency transactions | | | 117 | |
| | | | |
Net Realized Loss on Investments and Foreign Currency Transactions | | | (160,105 | ) |
| | | | |
Net Changes in Unrealized Appreciation of Investments and Foreign Currency Transactions: | | | | |
| Net unrealized appreciation of investments | | | 262,575 | |
| Net unrealized appreciation on translation of other assets and liabilities in foreign currencies | | | 9 | |
| | | | |
Net Changes in Unrealized Appreciation of Investments and Foreign Currency Transactions | | | 262,584 | |
| | | | |
Net Gain on Investments and Foreign Currency Transactions | | | 102,479 | |
| | | | |
Net Increase in Net Assets Resulting from Operations | | $ | 103,808 | |
| | | | |
The accompanying notes are an integral part of these financial statements.
8
Statement of Changes in Net Assets
(000’s Omitted)
| | | | | | | | | |
| | | For the | | | For the | |
| | | Year Ended | | | Year Ended | |
| | | October 31, 2009 | | | October 31, 2008 | |
Operations: | | | | | | | | |
| Net investment income (loss) | | $ | 1,329 | | | $ | (2,106 | ) |
| Net realized loss on investments and foreign currency transactions | | | (160,105 | ) | | | (25,396 | ) |
| Net unrealized appreciation (depreciation) of investments and foreign currency transactions | | | 262,584 | | | | (446,193 | ) |
| | | | | | | |
Net Increase (Decrease) In Net Assets Resulting From Operations | | | 103,808 | | | | (473,695 | ) |
| | | | | | | |
Distributions to Shareholders: | | | | | | | | |
| From net realized gain on investments | | | | | | | | |
| Class A | | | — | | | | (46,494 | ) |
| Class B | | | — | | | | (3,520 | ) |
| Class C | | | — | | | | (7,327 | ) |
| Class I | | | — | | | | (2,683 | ) |
| Class L | | | — | | | | (23,556 | ) |
| Class R3 | | | — | | | | (1 | ) |
| Class R4 | | | — | | | | (21 | ) |
| Class R5 | | | — | | | | (5 | ) |
| Class Y | | | — | | | | (7,436 | ) |
| | | | | | | |
| Total distributions | | | — | | | | (91,043 | ) |
| | | | | | | |
Capital Share Transactions: | | | | | | | | |
| Class A | | | (79,462 | ) | | | (60,581 | ) |
| Class B | | | (3,364 | ) | | | (2,634 | ) |
| Class C | | | (8,149 | ) | | | 3,207 | |
| Class I | | | (750 | ) | | | 35,310 | |
| Class L | | | (18,332 | ) | | | (7,346 | ) |
| Class R3 | | | 85 | | | | 67 | |
| Class R4 | | | 786 | | | | 1,850 | |
| Class R5 | | | 27 | | | | 31 | |
| Class Y | | | (29,680 | ) | | | 72,600 | |
| | | | | | | |
| Net increase (decrease) from capital share transactions | | | (138,839 | ) | | | 42,504 | |
| | | | | | | |
Net Decrease In Net Assets | | | (35,031 | ) | | | (522,234 | ) |
Net Assets: | | | | | | | | |
| Beginning of period | | | 694,924 | | | | 1,217,158 | |
| | | | | | | |
| End of period | | $ | 659,893 | | | $ | 694,924 | |
| | | | | | | |
| Accumulated undistributed (distribution in excess of) net investment income (loss) | | $ | 1,251 | | | $ | — | |
| | | | | | | |
The accompanying notes are an integral part of these financial statements.
9
The Hartford Growth Fund
Notes to Financial Statements
October 31, 2009
(000’s Omitted)
| 1. | | Organization: |
| |
| | | The Hartford Mutual Funds II, Inc. (“Company”) is an open-end management investment company comprised of six portfolios. Financial statements for The Hartford Growth Fund (the “Fund”), a series of the Company, are included in this report. |
| |
| | | The Company is organized under the laws of the State of Maryland and is registered with the Securities and Exchange Commission (“SEC”) under the Investment Company Act of 1940, as amended (“1940 Act”). The Fund is a diversified open-end management investment company. |
| |
| | | Class A shares are sold with a front-end sales charge of up to 5.50%. Class B shares were sold with a contingent deferred sales charge which is assessed on the lesser of the per share net asset value (“NAV”) of the shares at the time of redemption or the original purchase price, and declines from up to 5.00% to zero depending on the period of time the shares are held (See note below regarding the closing of Class B shares). Class C shares are sold with a contingent deferred sales charge of up to 1.00% on shares redeemed within twelve months of purchase. Class I shares are sold without sales charges to certain eligible investors through advisory fee-based wrap programs. Class L shares are sold with a sales charge of up to 4.75%. Classes R3, R4, R5 shares, which are offered to employer-sponsored retirement plans, and Class Y shares, which are sold to certain eligible institutional investors, are sold without a sales charge. All classes of shares have identical voting, redemption, dividend, liquidation and other rights and the same terms and conditions, with the exceptions that each class may have different expenses, which may affect performance, and that Class B shares automatically convert to Class A shares after 8 years. |
| |
| | | Effective September 30, 2009, no new or additional investments are allowed in Class B shares of The Hartford Mutual Funds (including investments through any systematic investment plan). After September 30, 2009, existing shareholders of Class B shares may continue to hold their Class B shares, exchange their Class B shares for Class B shares of another Hartford Mutual Fund (as permitted by existing exchange privileges), or redeem their Class B shares as described in the Fund’s prospectus. Reinstatement privileges with respect to Class B shares will continue under the current policy. For investors electing to reinvest capital gains and dividends, any such capital gains or dividends on Class B shares will continue to be reinvested in Class B shares of the Fund. For Class B shares outstanding as of September 30, 2009, all Class B share attributes, including the 12b-1 fee, contingent deferred sales charge schedule, and conversion to Class A shares remain unchanged. |
| 2. | | Significant Accounting Policies: |
| |
| | | The following is a summary of significant accounting policies of the Fund, which are in accordance with U.S. Generally Accepted Accounting Principles (“GAAP”). |
| | a) | | Security Transactions and Investment Income — Security transactions are recorded on the trade date (the date the order to buy or sell is executed). Security gains and losses are determined on the basis of identified cost. |
| | | | Dividend income is accrued as of the ex-dividend date, except that certain dividends for foreign securities where the ex-dividend date may have passed are recorded as soon as the Fund is informed of the dividend in the exercise of reasonable diligence. Interest income, including amortization of premium and accretion of discounts, is accrued on a daily basis. |
| | b) | | Security Valuation — The Fund generally uses market prices in valuing portfolio securities. If market prices are not readily available or are deemed unreliable, the Fund will use the fair value of the security as determined in good faith under policies and procedures established by and under the supervision of the Fund’s Board of Directors. Market prices may be deemed unreliable, for example, if a security is thinly traded or if an event has occurred after the close of the security’s primary market, but before the close of the New York Stock Exchange (the “Exchange”) (generally 4:00 p.m. Eastern Time, referred to as the “Valuation Time”) that is expected to affect the value of the portfolio security. The circumstances in which the Fund may use fair value pricing include, among others: (i) the occurrence of events that are |
10
significant to a particular issuer, such as mergers, restructuring or defaults; (ii) the occurrence of events that are significant to an entire market, such as natural disasters in a particular region or governmental actions; (iii) trading restrictions on securities; (iv) thinly traded securities and (v) market events such as trading halts and early market closings. In addition, with respect to the valuation of stocks primarily traded on foreign markets, the Fund uses a fair value pricing service approved by the Fund’s Board of Directors, which employs quantitative models that evaluate changes in the value of foreign market proxies (e.g., futures contracts, American Depositary Receipts, exchange traded funds (“ETF’s”)) after the close of the foreign markets but before the Valuation Time. Securities that are primarily traded on foreign markets may trade on days that are not business days of the Fund. The value of the foreign securities in which the Fund invests may change on days when a shareholder will not be able to purchase or redeem shares of the Fund. Fair value pricing is subjective in nature and the use of fair value pricing by the Fund may cause the NAV of its shares to differ significantly from the NAV that would have been calculated using market prices at the close of the exchange on which a portfolio security is primarily traded but before the close of the Exchange. There can be no assurance that the Fund could obtain the fair value assigned to a security if the Fund were to sell the security at approximately the time at which the Fund determines its NAV.
Exchange-traded equity securities are valued at the last reported sale price on the exchange or market on which the security is primarily traded (the “Primary Market”) at the Valuation Time. If the security did not trade on the Primary Market, it may be valued at the Valuation Time at the last reported sale price on another exchange where it trades. The value of an equity security not traded on any exchange but traded on the Nasdaq Stock Market, Inc. (“Nasdaq”) or another over-the-counter market shall be valued at the last reported sale price or official closing price on the exchange or market on which the security is traded as of the Valuation Time.
Foreign-denominated assets, including investment securities, and liabilities are translated from the local currency into U.S. dollars using exchange rates obtained from an independent third party as of the Fund’s Valuation Time.
Financial instruments for which prices are not available from an independent pricing service are valued using market quotations obtained from one or more dealers that make markets in securities in accordance with procedures established by the Fund’s Board of Directors.
Forward foreign currency contracts represent agreements to exchange currencies on specific future dates at predetermined rates. Forward foreign currency contracts are valued using foreign currency exchange rates and forward rates on the Valuation Date from an independent pricing service.
Other derivative or contractual type instruments shall be valued using market prices if such instruments trade on an exchange or market. If such instruments do not trade on an exchange or market, such instruments shall be valued at a price at which the counterparty to such contract would repurchase the instrument. In the event that the counterparty cannot provide a price, such valuation may be determined in accordance with procedures established by the Fund’s Board of Directors.
Various inputs are used in determining the value of the Fund’s investment. These inputs are summarized into three broad hierarchy levels. This hierarchy is based on whether the valuation inputs are observable or unobservable. These levels are:
| | • | | Level 1 — Quoted prices in active markets for identical securities. Level 1 may include exchange-traded instruments such as domestic equities, some foreign equities, options, futures, mutual funds, ETF’s, and rights and warrants. |
| | • | | Level 2 — Observable inputs other than Level 1 prices, such as quoted prices for similar securities; quoted prices in markets that are not active; or other inputs that are observable or can be corroborated by observable market data for substantially the full term of the security. Level 2 may include debt securities that are traded less frequently than exchange-traded instruments and that are valued using third party pricing services, foreign equities, whose value is determined using a multi-factor regression model with inputs that are observable in the market; and money market instruments, which are carried at amortized cost. |
11
The Hartford Growth Fund
Notes to Financial Statements — (continued)
October 31, 2009
(000’s Omitted)
| | • | | Level 3 — Significant unobservable inputs that are supported by little or no market activity. Level 3 includes financial instruments whose values are determined using broker quotes or require significant management judgment or estimation. This category may include broker quoted securities and securities where trading has been halted or there are certain restrictions on trading. While these securities are priced using unobservable inputs, the valuation of these securities reflects the best available data and management believes the prices are a reasonable representation of exit price. |
| | | | Individual securities within any of the above mentioned asset classes may be assigned a different hierarchical level than those presented above, as individual circumstances dictate. |
| |
| | | | During the year ended October 31, 2009, the Fund held no Level 3 securities, therefore no reconciliation of Level 3 securities is presented. |
| |
| | | | Refer to the Investment Valuation Hierarchy Level Summary found following the Schedule of Investments. |
| |
| | c) | | Foreign Currency Transactions — Assets and liabilities denominated in currencies other than U.S. dollars are translated into U.S. dollars at the exchange rates in effect on the valuation date. Purchases and sales of investment securities and income and expenses are translated into U.S. dollars at the exchange rates on the dates of such transactions. |
| |
| | | | The Fund does not isolate that portion of portfolio security valuation resulting from fluctuations in the foreign currency exchange rates from the fluctuations arising from changes in the market prices of securities held. Exchange rate fluctuations are included with the net realized and unrealized gain or loss on investments in the accompanying financial statements. |
| |
| | | | Net realized foreign exchange gains or losses arise from sales of foreign currencies and the difference between asset and liability amounts initially stated in foreign currencies and the U.S. dollar value of the amounts actually received or paid. Net unrealized foreign exchange gains or losses arise from changes in the value of other assets and liabilities at the end of the reporting period, resulting from changes in the exchange rates. |
| |
| | d) | | Joint Trading Account — Pursuant to an exemptive order issued by the SEC, the Fund may transfer uninvested cash balances into a joint trading account managed by Wellington Management Company, LLP (“Wellington”). These balances may be invested in one or more repurchase agreements and/or short-term money market instruments. |
| |
| | e) | | Repurchase Agreements — A repurchase agreement is an agreement by which the seller of a security agrees to repurchase the security sold at a mutually agreed upon time and price. At the time the Fund enters into a repurchase agreement, the value of the underlying collateral security(ies), including accrued interest, will be equal to or exceed the value of the repurchase agreement. To minimize counterparty risk, the securities that serve to collateralize the repurchase agreement are held by the Fund’s custodian in book entry or physical form in the custodial account of the Fund or in a third party custodial account. Repurchase agreements are valued at cost plus accrued interest. The Fund, as shown on the Schedule of Investments, had outstanding repurchase agreements as of October 31, 2009. |
| |
| | f) | | Securities Lending — The Fund may lend its securities to certain qualified brokers who pay the Fund negotiated lender fees. The loans are fully collateralized at all times with cash and/or U.S. Government Securities and/or repurchase agreements. The cash collateral is then invested in short-term money market instruments. The repurchase agreements are fully collateralized by U.S. Government Securities. The adequacy of the collateral for securities on loan is monitored on a daily basis. For instances where the market value of collateral falls below the market value of the securities out on loan, such collateral is supplemented on the following business day. |
| |
| | | | While securities are on loan, the Fund is subject to the following risks: 1) that the borrower may default on the loan and that the collateral could be inadequate in the event the borrower defaults, 2) that the earnings on the collateral invested may not be sufficient to pay fees incurred in connection with the loan, 3) that the principal value of the collateral |
12
| | | | invested may decline and may not be sufficient to pay back the borrower for the amount of the collateral posted, 4) that the borrower may use the loaned securities to cover a short sale which may place downward pressure on the market prices of the loaned securities, 5) that return of loaned securities could be delayed and could interfere with portfolio management decisions and 6) that any efforts to recall the securities for purposes of voting a proxy may not be effective. The Fund had no securities out on loan as of October 31, 2009. |
| |
| | g) | | Forward Foreign Currency Contracts — The Fund may enter into forward foreign currency contracts that obligate the Fund to purchase or sell currencies at specified future dates. Forward foreign currency contracts may be used to hedge against adverse fluctuations in exchange rates between currencies. |
| |
| | | | Forward foreign currency contracts involve elements of market risk in excess of the amount reflected in the Statement of Assets and Liabilities. In addition, risks may arise upon entering into these contracts from the potential inability of the counterparties to meet the terms of the contracts and from unanticipated movements in the value of the foreign currencies relative to the U.S. dollar. The Fund had no outstanding forward foreign currency contracts as of October 31, 2009. |
| |
| | h) | | Fund Share Valuation and Dividend Distributions to Shareholders — Orders for the Fund’s shares are executed in accordance with the investment instructions of the shareholders. The NAV of the Fund’s shares is determined as of the close of each business day of the Exchange. The NAV is determined separately for each class of the Fund by dividing the Fund’s net assets attributable to that class by the number of shares of the class outstanding. Orders for the purchase of the Fund’s shares prior to the close of the Exchange on any day on which the Exchange is open for business are priced at the NAV determined as of the close of the Exchange. Orders after the close of the Exchange, or on a day on which the Exchange and/or the Fund is not open for business, are priced at the next determined NAV. |
| |
| | | | The Fund intends to distribute substantially all of its net investment income and net realized capital gains to shareholders no less frequently than once a year. Normally, dividends from net investment income of the Fund are declared and paid annually. Unless shareholders specify otherwise, all dividends will be automatically reinvested in additional full or fractional shares of the Fund. |
| |
| | | | Distributions from net investment income, realized capital gains and capital are determined in accordance with federal income tax regulations, which may differ from U.S. GAAP with respect to character and timing. These differences may include but are not limited to losses deferred due to wash sale adjustments, foreign currency gains and losses, adjustments related to Passive Foreign Investment Companies (“PFICs”), Real Estate Investment Trusts (“REITs”), Regulated Investment Companies (“RICs”), certain derivatives and partnerships. Permanent book and federal income tax basis differences relating to shareholder distributions will result in reclassifications to certain of the Fund’s capital accounts (see Federal Income Taxes: Reclassification of Capital Accounts footnote). |
| |
| | i) | | Use of Estimates — The preparation of financial statements in conformity with U.S. GAAP requires management to make estimates and assumptions that affect the reported amounts of assets and liabilities as of the date of the financial statements and the reported amounts of income and expenses during the period. Operating results in the future could vary from the amounts derived from management’s estimates. |
| |
| | j) | | Additional Derivative Instrument(s) Information |
| |
| | | | The volume of derivative activity was minimal during the year ended October 31, 2009. |
13
The Hartford Growth Fund
Notes to Financial Statements — (continued)
October 31, 2009
(000’s Omitted)
Realized Gain/Loss and Change in Unrealized Appreciation (Depreciation) on Derivative Instruments for the year ended October 31, 2009:
Amount of Realized Gain or (Loss) on Derivatives Recognized in Income
| | | | | | | | | | | | | | | | | | | | | | | | | |
| | | | | | | | | | | | | | | Forward | | | | | | | |
| | | | | | | Purchased | | | | | | | Currency | | | | | | | |
| Risk Exposure Category | | Written Options | | | Options | | | Futures | | | Contracts | | | Swaps | | | Total | |
| Foreign exchange contracts | | $ | — | | | $ | — | | | $ | — | | | $ | (132 | ) | | $ | — | | | $ | (132 | ) |
| | | | | | | | | | | | | | | | | | | |
| Total | | $ | — | | | $ | — | | | $ | — | | | $ | (132 | ) | | $ | — | | | $ | (132 | ) |
| | | | | | | | | | | | | | | | | | | |
| | k) | | Indemnifications — Under the Company’s organizational documents, the Company shall indemnify its officers and directors to the full extent required or permitted under Maryland General Corporation Law and the federal securities law. In addition, the Company, on behalf of the Fund, may enter into contracts that contain a variety of indemnifications. The Company’s maximum exposure under these arrangements is unknown. However, the Company has not had prior claims or losses pursuant to these contracts and expects the risk of loss to be remote. |
| | a) | | Federal Income Taxes — For federal income tax purposes, the Fund intends to continue to qualify as a RIC under Subchapter M of the Internal Revenue Code (“IRC”) by distributing substantially all of its taxable net investment income and net realized capital gains to its shareholders and otherwise complying with the requirements of regulated investment companies. The Fund has distributed substantially all of its income and capital gains in prior years and intends to distribute substantially all of its income and capital gains during the calendar year ending December 31, 2009. Accordingly, no provision for federal income or excise taxes has been made in the accompanying financial statements. Distributions from short-term capital gains are treated as ordinary income distributions for federal income tax purposes. |
| | b) | | Net Investment Income (Loss), Realized Gains and (Losses) — Net investment income (loss) and net realized gains (losses) may differ for financial statement and tax purposes primarily because of losses deferred due to wash sale adjustments, foreign currency gains and losses, adjustments related to PFICs, REITs, RICs, certain derivatives and partnerships. The character of distributions made during the year from net investment income or realized gains may differ from their ultimate characterization for federal income tax purposes. Also, due to the timing of dividend distributions, the fiscal year in which amounts are distributed may differ from the year that the income or realized gains (losses) were recorded by the Fund. |
| | c) | | Distributions and Components of Distributable Earnings — The tax character of distributions paid by the Fund for the periods indicated is as follows (as adjusted for dividends payable): |
| | | | | | | | | |
| | | For the Year Ended | | For the Year Ended |
| | | October 31, 2009 | | October 31, 2008 |
| Ordinary Income | | $ | — | | | $ | 9,424 | |
| Long-Term Capital Gains * | | | — | | | | 81,619 | |
| | |
| * | | The Fund designates these distributions as long-term capital gain dividends pursuant to IRC code Sec. 852(b)(3)(C). |
14
As of October 31, 2009, the Fund’s components of distributable earnings (deficit) on a tax basis were as follows:
| | | | | |
| | | Amount | |
| Undistributed Ordinary Income | | $ | 1,251 | |
| Accumulated Capital Losses * | | | (170,986 | ) |
| Unrealized Appreciation † | | | 45,847 | |
| | | | |
| Total Accumulated Deficit | | $ | (123,888 | ) |
| | | | |
| | |
| * | | The Fund has capital loss carryforwards that are identified in the Capital Loss Carryforward note that follows. |
| |
| † | | The differences between book-basis and tax-basis unrealized appreciation (depreciation) may be attributable to the losses deferred due to wash sale adjustments, foreign currency gains and losses, adjustments related to PFICs, REITs, RICs, certain derivatives and partnerships. |
| | d) | | Reclassification of Capital Accounts — The Fund may record reclassifications in its capital accounts. These reclassifications have no impact on the total net assets of the Fund. The reclassifications are a result of permanent differences between GAAP and tax accounting for such items as net operating losses that reduce distribution requirements. Adjustments are made to reflect the impact these items have on current and future distributions to shareholders. Therefore, the source of the Fund’s distributions may be shown in the accompanying Statement of Changes in Net Assets as from net investment income, from net realized gains on investments or from capital depending on the type of book and tax differences that exist. For the year ended October 31, 2009, the Fund recorded reclassifications to decrease accumulated undistributed net investment income by $78 and increase accumulated net realized gain on investments by $78. |
| |
| | e) | | Capital Loss Carryforward — At October 31, 2009 (tax-year-end), the Fund had capital loss carryforwards for U.S. federal income tax purposes of approximately: |
| | | | | |
| Year of Expiration | | Amount | |
| 2016 | | $ | 21,260 | |
| 2017 | | | 149,726 | |
| | | | |
Total | | $ | 170,986 | |
| | | | |
| | f) | | Accounting for Uncertainty in Income Taxes — Management has evaluated all open tax years and has determined there is no impact to the Fund’s financial statements related to uncertain tax positions. Generally, tax authorities can examine all tax returns filed for the last three years. |
| | a) | | Investment Management Agreement — Hartford Investment Financial Services, LLC (“HIFSCO”) serves as investment manager to the Fund pursuant to an Investment Management Agreement with the Company. As investment manager, HIFSCO has overall investment supervisory responsibility for the Fund. In addition, HIFSCO provides administrative personnel, services, equipment, facilities and office space for proper operation of the Fund. HIFSCO has contracted with Wellington for the provision of day-to-day investment management services to the Fund in accordance with the Fund’s investment objective and policies. The Fund pays a fee to HIFSCO, a portion of which may be used to compensate Wellington. |
15
The Hartford Growth Fund
Notes to Financial Statements — (continued)
October 31, 2009
(000’s Omitted)
The schedule below reflects the rates of compensation paid to HIFSCO for investment management services rendered during the year ended October 31, 2009; the rates are accrued daily and paid monthly:
| | | | | |
| Average Daily Net Assets | | Annual Fee |
| On first $100 million | | | 0.9000 | % |
| On next $150 million | | | 0.8000 | % |
| On next $4.75 billion | | | 0.7000 | % |
| On next $5 billion | | | 0.6975 | % |
| Over $10 billion | | | 0.6950 | % |
| | b) | | Accounting Services Agreement — Pursuant to the Fund Accounting Agreement between Hartford Life Insurance Company (“HLIC”) and the Fund, HLIC provides accounting services to the Fund and receives monthly compensation on the Fund’s average net assets. The Fund’s accounting services fees are accrued daily and paid monthly. |
| | | | | |
| Average Daily Net Assets | | Annual Fee |
| On first $5 billion | | | 0.012 | % |
| Over $5 billion | | | 0.010 | % |
| | c) | | Operating Expenses — Allocable expenses incurred by the Company are allocated to each Fund and allocated to classes within the Fund in proportion to the average daily net assets of the Fund and each class, except where allocation of certain expenses is more fairly made directly to the Fund or to specific classes within a Fund. During the year ended October 31, 2009, HIFSCO has contractually limited the total operating expenses of this Fund, exclusive of taxes, interest expense, brokerage commissions, certain distribution expenses and extraordinary expenses as follows: |
| | | | | | | | | | | | | | | | | | | | | | | | | | | | | | | | | |
| Class A | | Class B | | Class C | | Class I | | Class L | | Class R3 | | Class R4 | | Class R5 | | Class Y |
| 1.30% | | | 2.05 | % | | | 2.05 | % | | | 1.05 | % | | | 1.42 | % | | | 1.55 | % | | | 1.25 | % | | | 0.95 | % | | | 0.95 | % |
| | d) | | Fees Paid Indirectly — The Fund has entered into agreements with State Street Global Markets, LLC and Russell Implementation Services Inc. to partially recapture non-discounted trade commissions. Such rebates are used to pay a portion of the Fund’s expenses. In addition, the Fund’s custodian bank has also agreed to reduce its fees when the Fund maintains cash on deposit in a non-interest-bearing custody account. For the year ended October 31, 2009, these amounts are included in the Statement of Operations. |
| |
| | | | The ratio of expenses to average net assets in the accompanying financial highlights excludes the reduction in expenses related to fees paid indirectly. Had the fees paid indirectly been included, the annualized expense ratio for the periods listed below would have been as follows: |
| | | | | | | | | | | | | | | | | | | | | |
| | | Year Ended | | Year Ended | | Year Ended | | Year Ended | | Year Ended |
| | | October 31, | | October 31, | | October 31, | | October 31, | | October 31, |
| | | 2009 | | 2008 | | 2007 | | 2006 | | 2005 |
| Class A Shares | | | 1.23 | % | | | 1.27 | % | | | 1.27 | % | | | 1.31 | % | | | 1.31 | % |
| Class B Shares | | | 1.68 | | | | 1.91 | | | | 2.08 | | | | 2.08 | | | | 2.13 | |
| Class C Shares | | | 2.04 | | | | 1.97 | | | | 1.98 | | | | 2.00 | | | | 2.03 | |
| Class I Shares | | | 0.93 | | | | 0.89 | | | | 0.90 | | | | 0.91 | * | | | | |
| Class L Shares | | | 1.06 | | | | 1.03 | | | | 1.04 | | | | 1.03 | | | | 1.04 | |
| Class R3 Shares | | | 1.54 | | | | 1.55 | | | | 1.57 | † | | | | | | | | |
| Class R4 Shares | | | 1.22 | | | | 1.20 | | | | 1.18 | † | | | | | | | | |
| Class R5 Shares | | | 0.94 | | | | 0.92 | | | | 0.91 | † | | | | | | | | |
| Class Y Shares | | | 0.83 | | | | 0.80 | | | | 0.81 | | | | 0.81 | | | | 0.83 | |
| | |
| * | | From August 31, 2006 (commencement of operations), through October 31, 2006. |
| |
| † | | From December 22, 2006 (commencement of operations), through October 31, 2007. |
16
| | e) | | Distribution and Service Plan for Class A, B, C, L, R3 and R4 Shares — HIFSCO is the principal underwriter and distributor of the Fund. HIFSCO is engaged in distribution activities, which include marketing and distribution of shares through broker-dealers, financing distribution costs and maintaining financial books and records. For the year ended October 31, 2009, HIFSCO received front-end load sales charges of $411 and contingent deferred sales charges of $49 from the Fund. |
| |
| | | | The Fund has adopted a Distribution and Service Plan in accordance with Rule 12b-1 of the Investment Company Act of 1940, as amended, to compensate the distributor (HIFSCO) for activities intended to result in the sale and distribution of Classes A, B, C, L, R3 and R4 shares and for providing services for shareholders. The Rule 12b-1 plan applicable to Class A shares of the Fund provides for payment of a Rule 12b-1 fee of up to 0.35% of average daily net assets; however, the Board of Directors has currently authorized 12b-1 payments of up to 0.25%. Some or all of the fee may be used for shareholder servicing expenses with the remainder used for distribution expenses. Some or the entire Rule 12b-1 fee for Class B shares may be remitted to broker-dealers for distribution and/or shareholder account services. Under the Class B Plan, the Fund pays the distributor 1.00% of the average daily net assets of Class B shares that are outstanding for 8 years or less, 0.25% of which is a fee for services provided to existing shareholders with the remainder used for distribution expenses. After eight years, Class B shares convert to Class A shares. Upon conversion to Class A shares, the Class A plan described above will apply to those shares. Under the Class C Plan, the Fund pays the Distributor 1.00% of the average daily net assets of Class C shares outstanding, 0.25% of which is intended as a fee for services provided to existing shareholders with the remainder used for distribution expenses. For Class C shares, some or the entire fee may be remitted to broker-dealers for distribution and/or shareholder account services. Class L has a distribution fee of 0.25%. Class R3 shares have a distribution fee of 0.50% and Class R4 shares have a distribution fee of 0.25%. For Classes R3 and R4 shares, some or the entire fee may be remitted to broker dealers for distribution and/or shareholder account services. The Fund’s 12b-1 fees are accrued daily and paid monthly. |
| |
| | | | For the year ended October 31, 2009, total sales commissions paid to affiliated brokers/dealers of The Hartford for distributing the Fund’s shares were $74. These commissions are in turn paid to sales representatives of the broker/dealers. |
| |
| | f) | | Other Related Party Transactions — Certain officers of the Fund are directors and/or officers of HIFSCO and/or The Hartford or its subsidiaries. For the year ended October 31, 2009, a portion of the Fund’s chief compliance officer’s salary was paid by all the investment companies in the Hartford fund complex. The portion allocated to the Fund was in the amount of $2. Hartford Administrative Services Company (“HASCO”), an indirect wholly owned subsidiary of The Hartford, provides transfer agent services to the Fund. HASCO has contractually agreed to reimburse any portion of the transfer agency fees over 0.30% of average daily net assets per fiscal year for all classes. HASCO was compensated $1,063 for providing such services. These fees are accrued daily and paid monthly. |
| |
| | | | Administrative services fees are paid to HASCO for third-party recordkeeping services that are payable as a percentage of net assets in the amount of 0.20%, 0.15% and 0.10% for Classes R3, R4 and R5 shares, respectively. The total administrative services fees are shown on the Statement of Operations. These fees are accrued daily and paid monthly. |
17
The Hartford Growth Fund
Notes to Financial Statements — (continued)
October 31, 2009
(000’s Omitted)
| | g) | | Payments from Affiliate — The total return in the accompanying financial highlights includes payment from affiliates. Had the payment from affiliates been excluded, the total return for the periods listed below would have been as follows: |
| | | | | | | | | |
| | | Impact from | | Total Return |
| | | Payment from | | Excluding |
| | | Affiliate for SEC | | Payment from |
| | | Settlement for the | | Affiliate for the |
| | | Year Ended | | Year Ended |
| | | October 31, 2007 | | October 31, 2007 |
| Class A | | | 0.01 | % | | | 23.90 | % |
| Class B | | | 0.01 | | | | 23.00 | |
| Class C | | | 0.01 | | | | 23.08 | |
| Class I | | | 0.01 | | | | 24.35 | |
| Class L | | | 0.01 | | | | 24.20 | |
| Class Y | | | 0.01 | | | | 24.50 | |
| 5. | | Investment Transactions: |
| |
| | | For the year ended October 31, 2009, the Fund’s aggregate purchases and sales of investment securities (excluding short-term investments) were as follows: |
| | | | | |
| | | Amount |
| Cost of Purchases Excluding U.S. Government Obligations | | | $601,374 | |
| Sales Proceeds Excluding U.S. Government Obligations | | | 709,412 | |
18
| 6. | | Capital Share Transactions: |
| | | The following information is for the year ended October 31, 2009 and the year ended October 31, 2008: |
| | | | | | | | | | | | | | | | | | | | | | | | | | | | | | | | | | | | | | | | | |
| | | For the Year Ended October 31, 2009 | | For the Year Ended October 31, 2008 |
| | | | | | | Shares | | | | | | Shares | | | | | | | | | | Shares | | | | | | Shares | | |
| | | | | | | Issued for | | | | | | Issued | | Net Increase | | | | | | Issued for | | | | | | Issued | | Net Increase |
| | | Shares | | Reinvested | | Shares | | from | | (Decrease) of | | Shares | | Reinvested | | Shares | | from | | (Decrease) of |
| | | Sold | | Dividends | | Redeemed | | Merger | | Shares | | Sold | | Dividends | | Redeemed | | Merger | | Shares |
| Class A | | | | | | | | | | | | | | | | | | | | | | | | | | | | | | | | | | | | | | | | |
| Shares | | | 10,597 | | | | — | | | | (16,584 | ) | | | — | | | | (5,987 | ) | | | 7,001 | | | | 2,200 | | | | (13,530 | ) | | | — | | | | (4,329 | ) |
| Amount | | $ | 113,197 | | | $ | — | | | $ | (192,659 | ) | | $ | — | | | $ | (79,462 | ) | | $ | 113,372 | | | $ | 40,350 | | | $ | (214,303 | ) | | $ | — | | | $ | (60,581 | ) |
| Class B | | | | | | | | | | | | | | | | | | | | | | | | | | | | | | | | | | | | | | | | |
| Shares | | | 165 | | | | — | | | | (507 | ) | | | — | | | | (342 | ) | | | 171 | | | | 209 | | | | (602 | ) | | | — | | | | (222 | ) |
| Amount | | $ | 1,564 | | | $ | — | | | $ | (4,928 | ) | | $ | — | | | $ | (3,364 | ) | | $ | 2,467 | | | $ | 3,267 | | | $ | (8,368 | ) | | $ | — | | | $ | (2,634 | ) |
| Class C | | | | | | | | | | | | | | | | | | | | | | | | | | | | | | | | | | | | | | | | |
| Shares | | | 577 | | | | — | | | | (1,425 | ) | | | — | | | | (848 | ) | | | 924 | | | | 383 | | | | (1,189 | ) | | | — | | | | 118 | |
| Amount | | $ | 5,532 | | | $ | — | | | $ | (13,681 | ) | | $ | — | | | $ | (8,149 | ) | | $ | 13,449 | | | $ | 6,019 | | | $ | (16,261 | ) | | $ | — | | | $ | 3,207 | |
| Class I | | | | | | | | | | | | | | | | | | | | | | | | | | | | | | | | | | | | | | | | |
| Shares | | | 1,305 | | | | — | | | | (1,462 | ) | | | — | | | | (157 | ) | | | 3,121 | | | | 143 | | | | (812 | ) | | | — | | | | 2,452 | |
| Amount | | $ | 16,060 | | | $ | — | | | $ | (16,810 | ) | | $ | — | | | $ | (750 | ) | | $ | 45,587 | | | $ | 2,621 | | | $ | (12,898 | ) | | $ | — | | | $ | 35,310 | |
| Class L | | | | | | | | | | | | | | | | | | | | | | | | | | | | | | | | | | | | | | | | |
| Shares | | | 273 | | | | — | | | | (1,849 | ) | | | — | | | | (1,576 | ) | | | 286 | | | | 1,205 | | | | (2,067 | ) | | | — | | | | (576 | ) |
| Amount | | $ | 3,225 | | | $ | — | | | $ | (21,557 | ) | | $ | — | | | $ | (18,332 | ) | | $ | 4,837 | | | $ | 22,498 | | | $ | (34,681 | ) | | $ | — | | | $ | (7,346 | ) |
| Class R3 | | | | | | | | | | | | | | | | | | | | | | | | | | | | | | | | | | | | | | | | |
| Shares | | | 8 | | | | — | | | | — | | | | — | | | | 8 | | | | 4 | | | | — | | | | (1 | ) | | | — | | | | 3 | |
| Amount | | $ | 91 | | | $ | — | | | $ | (6 | ) | | $ | — | | | $ | 85 | | | $ | 74 | | | $ | 1 | | | $ | (8 | ) | | $ | — | | | $ | 67 | |
| Class R4 | | | | | | | | | | | | | | | | | | | | | | | | | | | | | | | | | | | | | | | | |
| Shares | | | 85 | | | | — | | | | (20 | ) | | | — | | | | 65 | | | | 118 | | | | 1 | | | | (15 | ) | | | — | | | | 104 | |
| Amount | | $ | 1,041 | | | $ | — | | | $ | (255 | ) | | $ | — | | | $ | 786 | | | $ | 2,068 | | | $ | 21 | | | $ | (239 | ) | | $ | — | | | $ | 1,850 | |
| Class R5 | | | | | | | | | | | | | | | | | | | | | | | | | | | | | | | | | | | | | | | | |
| Shares | | | 2 | | | | — | | | | — | | | | — | | | | 2 | | | | 3 | | | | — | | | | (2 | ) | | | — | | | | 1 | |
| Amount | | $ | 28 | | | $ | — | | | $ | (1 | ) | | $ | — | | | $ | 27 | | | $ | 51 | | | $ | 4 | | | $ | (24 | ) | | $ | — | | | $ | 31 | |
| Class Y | | | | | | | | | | | | | | | | | | | | | | | | | | | | | | | | | | | | | | | | |
| Shares | | | 668 | | | | — | | | | (3,249 | ) | | | — | | | | (2,581 | ) | | | 5,427 | | | | 392 | | | | (885 | ) | | | — | | | | 4,934 | |
| Amount | | $ | 7,871 | | | $ | — | | | $ | (37,551 | ) | | $ | — | | | $ | (29,680 | ) | | $ | 78,920 | | | $ | 7,436 | | | $ | (13,756 | ) | | $ | — | | | $ | 72,600 | |
The following reflects the conversion of Class B Shares into Class A Shares (reflected as Class A Shares issued) for the year ended October 31, 2009 and the year ended October 31, 2008:
| | | | | | | | | |
| | | Shares | | Dollars |
| For the Year Ended October 31, 2009 | | | 45 | | | $ | 523 | |
| For the Year Ended October 31, 2008 | | | 39 | | | $ | 663 | |
| 7. | | Line of Credit: |
| |
| | | The Fund is one of several Hartford Funds that participate in a $500 million committed revolving line of credit facility. The facility is to be used for temporary or emergency purposes. Under the arrangement, the Fund is required to own securities having a market value in excess of 300% of the total bank borrowings. The interest rate on borrowings varies depending on the nature of the loan. The facility also requires a fee to be paid based on the amount of the commitment. This fee is allocated to all the Funds participating in the line of credit based on the average net assets of the Funds. During the year ended October 31, 2009, the Fund did not have any borrowings under this facility. |
| |
| 8. | | Industry Classifications: |
| |
| | | Other than the industry classifications “Other Investment Pools and Funds” and “Exchange Traded Funds”, equity industry classifications used in this report are the Global Industry Classification Standard, which was developed by and is the exclusive property and service mark of MSCI, Inc. and Standard & Poor’s. |
19
The Hartford Growth Fund
Notes to Financial Statements — (continued)
October 31, 2009
(000’s Omitted)
| 9. | | Subsequent Events: |
| |
| | | Management has evaluated subsequent events through December 15, 2009, the date of issuance of the Fund’s financial statements, and has determined that no additional items require disclosure. |
20
[This page is intentionally left blank]
21
The Hartford Growth Fund
Financial Highlights
- Selected Per-Share Data (a) -
| | | | | | | | | | | | | | | | | | | | | | | | | | | | | | | | | | | | | | | | | | | | | | | | | |
| | | | | | | Net Asset | | | | | | | | | | Net Realized | | | | | | | | | | | | | | | | | | | | | | Net Increase | | |
| | | | | | | Value at | | | | | | | | | | and Unrealized | | Total from | | Dividends from | | Distributions | | | | | | | | | | (Decrease) in | | Net Asset |
| | | | | | | Beginning of | | Net Investment | | Payments from | | Gain (Loss) on | | Investment | | Net Investment | | from Realized | | Distributions | | Total | | Net Asset | | Value at End |
| Class | | Period | | Income (Loss) | | (to) Affiliate | | Investments | | Operations | | Income | | Capital Gains | | from Capital | | Distributions | | Value | | of Period |
| For the Year Ended October 31, 2009 | | | | | | | | | | | | | | | | | | | | | | | | | | | | | | | | |
| A | | | | | $ | 11.59 | | | $ | 0.02 | | | $ | — | | | $ | 1.96 | | | $ | 1.98 | | | $ | — | | | $ | — | | | $ | — | | | $ | — | | | $ | 1.98 | | | $ | 13.57 | |
| B | | | | | | 9.83 | | | | (0.03 | ) | | | — | | | | 1.66 | | | | 1.63 | | | | — | | | | — | | | | — | | | | — | | | | 1.63 | | | | 11.46 | |
| C | | | | | | 9.86 | | | | (0.07 | ) | | | — | | | | 1.67 | | | | 1.60 | | | | — | | | | — | | | | — | | | | — | | | | 1.60 | | | | 11.46 | |
| I | | | | | | 11.69 | | | | 0.05 | | | | — | | | | 1.99 | | | | 2.04 | | | | — | | | | — | | | | — | | | | — | | | | 2.04 | | | | 13.73 | |
| L | | | | | | 11.83 | | | | 0.04 | | | | — | | | | 2.00 | | | | 2.04 | | | | — | | | | — | | | | — | | | | — | | | | 2.04 | | | | 13.87 | |
| R3 | | | | | | 11.86 | | | | (0.02 | ) | | | — | | | | 2.00 | | | | 1.98 | | | | — | | | | — | | | | — | | | | — | | | | 1.98 | | | | 13.84 | |
| R4 | | | | | | 11.94 | | | | 0.01 | | | | — | | | | 2.03 | | | | 2.04 | | | | — | | | | — | | | | — | | | | — | | | | 2.04 | | | | 13.98 | |
| R5 | | | | | | 12.00 | | | | 0.04 | | | | — | | | | 2.06 | | | | 2.10 | | | | — | | | | — | | | | — | | | | — | | | | 2.10 | | | | 14.10 | |
| Y | | | | | | 12.03 | | | | 0.08 | | | | — | | | | 2.04 | | | | 2.12 | | | | — | | | | — | | | | — | | | | — | | | | 2.12 | | | | 14.15 | |
| | | | | | | | | | | | | | | | | | | | | | | | | | | | | | | | | | | | | | | | | | | | | | | | |
| For the Year Ended October 31, 2008 (e) | | | | | | | | | | | | | | | | | | | | | | | | | | | | | | | | |
| A | | | | | | 21.25 | | | | (0.05 | ) | | | — | | | | (8.03 | ) | | | (8.08 | ) | | | — | | | | (1.58 | ) | | | — | | | | (1.58 | ) | | | (9.66 | ) | | | 11.59 | |
| B | | | | | | 18.39 | | | | (0.13 | ) | | | — | | | | (6.85 | ) | | | (6.98 | ) | | | — | | | | (1.58 | ) | | | — | | | | (1.58 | ) | | | (8.56 | ) | | | 9.83 | |
| C | | | | | | 18.45 | | | | (0.14 | ) | | | — | | | | (6.87 | ) | | | (7.01 | ) | | | — | | | | (1.58 | ) | | | — | | | | (1.58 | ) | | | (8.59 | ) | | | 9.86 | |
| I | | | | | | 21.34 | | | | 0.02 | | | | — | | | | (8.09 | ) | | | (8.07 | ) | | | — | | | | (1.58 | ) | | | — | | | | (1.58 | ) | | | (9.65 | ) | | | 11.69 | |
| L | | | | | | 21.60 | | | | — | | | | — | | | | (8.19 | ) | | | (8.19 | ) | | | — | | | | (1.58 | ) | | | — | | | | (1.58 | ) | | | (9.77 | ) | | | 11.83 | |
| R3 | | | | | | 21.76 | | | | (0.08 | ) | | | — | | | | (8.24 | ) | | | (8.32 | ) | | | — | | | | (1.58 | ) | | | — | | | | (1.58 | ) | | | (9.90 | ) | | | 11.86 | |
| R4 | | | | | | 21.82 | | | | (0.03 | ) | | | — | | | | (8.27 | ) | | | (8.30 | ) | | | — | | | | (1.58 | ) | | | — | | | | (1.58 | ) | | | (9.88 | ) | | | 11.94 | |
| R5 | | | | | | 21.87 | | | | 0.02 | | | | — | | | | (8.31 | ) | | | (8.29 | ) | | | — | | | | (1.58 | ) | | | — | | | | (1.58 | ) | | | (9.87 | ) | | | 12.00 | |
| Y | | | | | | 21.90 | | | | 0.04 | | | | — | | | | (8.33 | ) | | | (8.29 | ) | | | — | | | | (1.58 | ) | | | — | | | | (1.58 | ) | | | (9.87 | ) | | | 12.03 | |
| | | | | | | | | | | | | | | | | | | | | | | | | | | | | | | | | | | | | | | | | | | | | | | | |
| For the Year Ended October 31, 2007 | | | | | | | | | | | | | | | | | | | | | | | | | | | | | | | | |
| A | | | | | | 18.45 | | | | (0.07 | ) | | | — | | | | 4.17 | | | | 4.10 | | | | — | | | | (1.30 | ) | | | — | | | | (1.30 | ) | | | 2.80 | | | | 21.25 | |
| B | | | | | | 16.25 | | | | (0.21 | ) | | | — | | | | 3.65 | | | | 3.44 | | | | — | | | | (1.30 | ) | | | — | | | | (1.30 | ) | | | 2.14 | | | | 18.39 | |
| C | | | | | | 16.29 | | | | (0.19 | ) | | | — | | | | 3.65 | | | | 3.46 | | | | — | | | | (1.30 | ) | | | — | | | | (1.30 | ) | | | 2.16 | | | | 18.45 | |
| I | | | | | | 18.46 | | | | — | | | | — | | | | 4.18 | | | | 4.18 | | | | — | | | | (1.30 | ) | | | — | | | | (1.30 | ) | | | 2.88 | | | | 21.34 | |
| L(g) | | | | | | 18.69 | | | | (0.05 | ) | | | — | | | | 4.26 | | | | 4.21 | | | | — | | | | (1.30 | ) | | | — | | | | (1.30 | ) | | | 2.91 | | | | 21.60 | |
| R3(h) | | | | | | 18.15 | | | | (0.08 | ) | | | — | | | | 3.69 | | | | 3.61 | | | | — | | | | — | | | | — | | | | — | | | | 3.61 | | | | 21.76 | |
| R4(h) | | | | | | 18.15 | | | | (0.01 | ) | | | — | | | | 3.68 | | | | 3.67 | | | | — | | | | — | | | | — | | | | — | | | | 3.67 | | | | 21.82 | |
| R5(h) | | | | | | 18.15 | | | | — | | | | — | | | | 3.72 | | | | 3.72 | | | | — | | | | — | | | | — | | | | — | | | | 3.72 | | | | 21.87 | |
| Y | | | | | | 18.89 | | | | 0.02 | | | | — | | | | 4.29 | | | | 4.31 | | | | — | | | | (1.30 | ) | | | — | | | | (1.30 | ) | | | 3.01 | | | | 21.90 | |
| | | | | | | | | | | | | | | | | | | | | | | | | | | | | | | | | | | | | | | | | | | | | | | | |
| For the Year Ended October 31, 2006 | | | | | | | | | | | | | | | | | | | | | | | | | | | | | | | | |
| A | | | | | | 17.32 | | | | (0.07 | ) | | | — | | | | 1.20 | | | | 1.13 | | | | — | | | | — | | | | — | | | | — | | | | 1.13 | | | | 18.45 | |
| B | | | | | | 15.38 | | | | (0.20 | ) | | | — | | | | 1.07 | | | | 0.87 | | | | — | | | | — | | | | — | | | | — | | | | 0.87 | | | | 16.25 | |
| C | | | | | | 15.40 | | | | (0.18 | ) | | | — | | | | 1.07 | | | | 0.89 | | | | — | | | | — | | | | — | | | | — | | | | 0.89 | | | | 16.29 | |
| I(k) | | | | | | 17.64 | | | | — | | | | — | | | | 0.82 | | | | 0.82 | | | | — | | | | — | | | | — | | | | — | | | | 0.82 | | | | 18.46 | |
| L | | | | | | 17.50 | | | | (0.02 | ) | | | — | | | | 1.21 | | | | 1.19 | | | | — | | | | — | | | | — | | | | — | | | | 1.19 | | | | 18.69 | |
| Y | | | | | | 17.65 | | | | 0.01 | | | | — | | | | 1.23 | | | | 1.24 | | | | — | | | | — | | | | — | | | | — | | | | 1.24 | | | | 18.89 | |
| | | | | | | | | | | | | | | | | | | | | | | | | | | | | | | | | | | | | | | | | | | | | | | | |
| For the Year Ended October 31, 2005 | | | | | | | | | | | | | | | | | | | | | | | | | | | | | | | | |
| A | | | | | | 16.19 | | | | (0.04 | ) | | | — | | | | 1.17 | | | | 1.13 | | | | — | | | | — | | | | — | | | | — | | | | 1.13 | | | | 17.32 | |
| B | | | | | | 14.49 | | | | (0.15 | ) | | | — | | | | 1.04 | | | | 0.89 | | | | — | | | | — | | | | — | | | | — | | | | 0.89 | | | | 15.38 | |
| C | | | | | | 14.50 | | | | (0.13 | ) | | | — | | | | 1.03 | | | | 0.90 | | | | — | | | | — | | | | — | | | | — | | | | 0.90 | | | | 15.40 | |
| L | | | | | | 16.32 | | | | 0.01 | | | | — | | | | 1.17 | | | | 1.18 | | | | — | | | | — | | | | — | | | | — | | | | 1.18 | | | | 17.50 | |
| Y | | | | | | 16.42 | | | | 0.01 | | | | — | | | | 1.22 | | | | 1.23 | | | | — | | | | — | | | | — | | | | — | | | | 1.23 | | | | 17.65 | |
| | |
| (a) | | Information presented relates to a share outstanding throughout the indicated period. |
| |
| (b) | | Assumes initial investment at net asset value at the beginning of each period, reinvestment of all distributions, the complete redemption of the investment at net asset value at the end of each period and no sales charge. Total return would be reduced if sales charges were taken into account. |
| |
| (c) | | Ratios do not include fees paid indirectly (See Expenses in the accompanying Notes to Financial Statements). |
| |
| (d) | | Portfolio turnover rate is calculated on the basis of the Fund as a whole without distinguishing between the classes of shares issued. |
| |
| (e) | | Per share amounts have been calculated using average shares outstanding method. |
| |
| (f) | | Total return without the inclusion of the Payments from (to) Affiliate, can be found in Expenses in the accompanying Notes to Financial Statements. |
| |
| (g) | | Classes H, M and N were merged into Class L on February 9, 2007. |
| |
| (h) | | Commenced operations on December 22, 2006. |
| |
| (i) | | Not annualized. |
| |
| (j) | | Annualized. |
| |
| (k) | | Commenced operations on August 31, 2006. |
22
- Ratios and Supplemental Data -
| | | | | | | | | | | | | | | | | | | | | | | | | | | | | |
| | | | | | | | | | | Ratio of Expenses to Average Net | | Ratio of Expenses to Average Net | | Ratio of Expenses to Average Net | | | | |
| | | | | | | | | | | Assets Before Waivers and | | Assets After Waivers and | | Assets After Waivers and | | Ratio of Net Investment | | |
| | | | | | | Net Assets at End of | | Reimbursements and Including | | Reimbursements and Including | | Reimbursements and Excluding | | Income to Average Net | | Portfolio Turnover |
| Total Return(b) | | | | Period (000’s) | | Expenses not Subject to Cap(c) | | Expenses not Subject to Cap(c) | | Expenses not Subject to Cap(c) | | Assets | | Rate(d) |
| | 17.08 | % | | | | $ | 260,833 | | | | 1.44 | % | | | 1.24 | % | | | 1.24 | % | | | 0.15 | % | | | 94 | % |
| | 16.58 | | | | | | 19,319 | | | | 2.49 | | | | 1.69 | | | | 1.69 | | | | (0.30 | ) | | | — | |
| | 16.23 | | | | | | 44,604 | | | | 2.09 | | | | 2.05 | | | | 2.05 | | | | (0.67 | ) | | | — | |
| | 17.45 | | | | | | 54,433 | | | | 0.94 | | | | 0.94 | | | | 0.94 | | | | 0.43 | | | | — | |
| | 17.24 | | | | | | 177,922 | | | | 1.08 | | | | 1.07 | | | | 1.07 | | | | 0.31 | | | | — | |
| | 16.69 | | | | | | 163 | | | | 1.73 | | | | 1.55 | | | | 1.55 | | | | (0.25 | ) | | | — | |
| | 17.09 | | | | | | 2,541 | | | | 1.23 | | | | 1.23 | | | | 1.23 | | | | 0.12 | | | | — | |
| | 17.50 | | | | | | 91 | | | | 0.96 | | | | 0.95 | | | | 0.95 | | | | 0.39 | | | | — | |
| | 17.62 | | | | | | 99,987 | | | | 0.84 | | | | 0.84 | | | | 0.84 | | | | 0.56 | | | | — | |
| | | | | | | | | | | | | | | | | | | | | | | | | | | | | |
| | (40.77 | ) | | | | | 292,129 | | | | 1.27 | | | | 1.27 | | | | 1.27 | | | | (0.27 | ) | | | 106 | |
| | (41.16 | ) | | | | | 19,936 | | | | 2.24 | | | | 1.91 | | | | 1.91 | | | | (0.91 | ) | | | — | |
| | (41.19 | ) | | | | | 46,757 | | | | 1.97 | | | | 1.97 | | | | 1.97 | | | | (0.96 | ) | | | — | |
| | (40.53 | ) | | | | | 48,174 | | | | 0.89 | | | | 0.89 | | | | 0.89 | | | | 0.14 | | | | — | |
| | (40.61 | ) | | | | | 170,321 | | | | 1.05 | | | | 1.03 | | | | 1.03 | | | | (0.03 | ) | | | — | |
| | (40.93 | ) | | | | | 53 | | | | 1.71 | | | | 1.55 | | | | 1.55 | | | | (0.51 | ) | | | — | |
| | (40.70 | ) | | | | | 1,394 | | | | 1.20 | | | | 1.20 | | | | 1.20 | | | | (0.17 | ) | | | — | |
| | (40.56 | ) | | | | | 51 | | | | 0.92 | | | | 0.92 | | | | 0.92 | | | | 0.09 | | | | — | |
| | (40.50 | ) | | | | | 116,109 | | | | 0.80 | | | | 0.80 | | | | 0.80 | | | | 0.21 | | | | — | |
| | | | | | | | | | | | | | | | | | | | | | | | | | | | | |
| | 23.92 | (f) | | | | | 627,677 | | | | 1.27 | | | | 1.27 | | | | 1.27 | | | | (0.35 | ) | | | 89 | |
| | 23.02 | (f) | | | | | 41,359 | | | | 2.22 | | | | 2.09 | | | | 2.09 | | | | (1.17 | ) | | | — | |
| | 23.10 | (f) | | | | | 85,303 | | | | 1.98 | | | | 1.98 | | | | 1.98 | | | | (1.06 | ) | | | — | |
| | 24.37 | (f) | | | | | 35,626 | | | | 0.91 | | | | 0.91 | | | | 0.91 | | | | 0.02 | | | | — | |
| | 24.22 | (f) | | | | | 323,581 | | | | 1.06 | | | | 1.05 | | | | 1.05 | | | | (0.27 | ) | | | — | |
| | 19.89 | (i) | | | | | 16 | | | | 1.56 | (j) | | | 1.56 | (j) | | | 1.56 | (j) | | | (0.67 | )(j) | | | — | |
| | 20.22 | (i) | | | | | 282 | | | | 1.17 | (j) | | | 1.17 | (j) | | | 1.17 | (j) | | | (0.28 | )(j) | | | — | |
| | 20.50 | (i) | | | | | 63 | | | | 0.90 | (j) | | | 0.90 | (j) | | | 0.90 | (j) | | | (0.01 | )(j) | | | — | |
| | 24.52 | (f) | | | | | 103,251 | | | | 0.81 | | | | 0.81 | | | | 0.81 | | | | 0.10 | | | | — | |
| | | | | | | | | | | | | | | | | | | | | | | | | | | | | |
| | 6.52 | | | | | | 707,000 | | | | 1.34 | | | | 1.33 | | | | 1.33 | | | | (0.38 | ) | | | 92 | |
| | 5.66 | | | | | | 44,064 | | | | 2.22 | | | | 2.09 | | | | 2.09 | | | | (1.14 | ) | | | — | |
| | 5.78 | | | | | | 85,469 | | | | 2.02 | | | | 2.02 | | | | 2.02 | | | | (1.07 | ) | | | — | |
| | 4.65 | (i) | | | | | 1,961 | | | | 0.96 | (j) | | | 0.96 | (j) | | | 0.96 | (j) | | | (0.52 | )(j) | | | — | |
| | 6.80 | | | | | | 274,890 | | | | 1.05 | | | | 1.05 | | | | 1.05 | | | | (0.10 | ) | | | — | |
| | 7.03 | | | | | | 130,594 | | | | 0.83 | | | | 0.83 | | | | 0.83 | | | | 0.08 | | | | — | |
| | | | | | | | | | | | | | | | | | | | | | | | | | | | | |
| | 6.98 | | | | | | 635,057 | | | | 1.40 | | | | 1.33 | | | | 1.33 | | | | (0.30 | ) | | | 77 | |
| | 6.14 | | | | | | 46,251 | | | | 2.27 | | | | 2.15 | | | | 2.15 | | | | (1.09 | ) | | | — | |
| | 6.21 | | | | | | 82,481 | | | | 2.05 | | | | 2.05 | | | | 2.05 | | | | (1.01 | ) | | | — | |
| | 7.23 | | | | | | 295,731 | | | | 1.06 | | | | 1.06 | | | | 1.06 | | | | 0.05 | | | | — | |
| | 7.49 | | | | | | 52,992 | | | | 0.85 | | | | 0.85 | | | | 0.85 | | | | 0.10 | | | | — | |
23
Report of Independent Registered Public Accounting Firm
The Board of Directors and Shareholders of
The Hartford Mutual Funds II, Inc.
We have audited the accompanying statement of assets and liabilities, including the schedule of investments, of The Hartford Growth Fund (one of the portfolios constituting The Hartford Mutual Funds II, Inc. (the Funds)) as of October 31, 2009, and the related statement of operations for the year then ended, the statements of changes in net assets for each of the two years in the period then ended, and the financial highlights for each of the periods indicated therein. These financial statements and financial highlights are the responsibility of the Funds’ management. Our responsibility is to express an opinion on these financial statements and financial highlights based on our audits.
We conducted our audits in accordance with the standards of the Public Company Accounting Oversight Board (United States). Those standards require that we plan and perform the audit to obtain reasonable assurance about whether the financial statements and financial highlights are free of material misstatement. We were not engaged to perform an audit of the Funds’ internal control over financial reporting. Our audits included consideration of internal control over financial reporting as a basis for designing audit procedures that are appropriate in the circumstances, but not for the purpose of expressing an opinion on the effectiveness of the Funds’ internal control over financial reporting. Accordingly, we express no such opinion. An audit also includes examining, on a test basis, evidence supporting the amounts and disclosures in the financial statements and financial highlights, assessing the accounting principles used and significant estimates made by management, and evaluating the overall financial statement presentation. Our procedures included confirmation of securities owned as of October 31, 2009, by correspondence with the custodian. We believe that our audits provide a reasonable basis for our opinion.
In our opinion, the financial statements and financial highlights referred to above present fairly, in all material respects, the financial position of The Hartford Growth Fund of The Hartford Mutual Funds II, Inc. at October 31, 2009, the results of its operations for the year then ended, the changes in its net assets for each of the two years in the period then ended, and the financial highlights for each of the periods indicated therein, in conformity with U.S. generally accepted accounting principles.
Minneapolis, MN
December 15, 2009
24
The Hartford Growth Fund
Directors and Officers (Unaudited)
The Board of Directors appoints officers who are responsible for the day-to-day operations of the Fund and who execute policies formulated by the Directors. Each director serves until his or her death, resignation, or retirement or until the next annual meeting of shareholders is held or until his or her successor is elected and qualifies.
Directors and officers who are employed by or who have a financial interest in The Hartford are considered “interested” persons of the Fund pursuant to the Investment Company Act of 1940, as amended. Each officer and two of the Funds’ directors, as noted in the chart below, are “interested” persons of the Fund. Each director serves as a director for The Hartford Mutual Funds, Inc., The Hartford Mutual Funds II, Inc., The Hartford Income Shares Fund, Inc., Hartford Series Fund, Inc., and Hartford HLS Series Fund II, Inc., which, as of October 31, 2009, collectively consist of 93 funds. Correspondence may be sent to directors and officers c/o Hartford Mutual Funds, P.O. Box 2999, Hartford, Connecticut 06104-2999, except that correspondence to Ms. Fagely may be sent to 500 Bielenberg Drive, Woodbury, Minnesota 55125.
The table below sets forth, for each director and officer, his or her name, year of birth, current position with the Fund and date first elected or appointed to The Hartford Mutual Funds, Inc. (“MF”) and The Hartford Mutual Funds II, Inc. (“MF2”), principal occupation, and, for directors, other directorships held. The Fund’s statement of additional information contains further information on the directors and is available free of charge by calling 1-888-843-7824 or writing to Hartford Mutual Funds, P.O. Box 64387, St. Paul, MN 55164-0387.
Information on the aggregate remuneration paid to the directors of the Fund can be found in the Statement of Operations herein. The Fund pays to The Hartford a portion of the Chief Compliance Officer’s compensation, but does not pay salaries or compensation to any of its other officers or directors who are employed by The Hartford.
Non-Interested Directors
Lynn S. Birdsong (1946) Director since 2003, Co-Chairman of the Investment Committee
Mr. Birdsong is a private investor. Since 1981, Mr. Birdsong has been a partner in Birdsong Company, an advertising specialty firm. Since 2003, Mr. Birdsong has been an independent director of The Japan Fund. From 2003 to March 2005, Mr. Birdsong was an independent director of the Atlantic Whitehall Funds. From 1979 to 2002, Mr. Birdsong was a managing director of Zurich Scudder Investments, an investment management firm. During his employment with Scudder, Mr. Birdsong was an interested director of The Japan Fund.
Robert M. Gavin, Jr. (1940) Director since 2002 (MF) and 1986 (MF2), Chairman of the Board since 2004
Dr. Gavin is an educational consultant. Prior to September 1, 2001, he was President of Cranbrook Education Community and prior to July 1996, he was President of Macalester College, St. Paul, Minnesota.
Duane E. Hill (1945) Director since 2001 (MF) and 2002 (MF2), Chairman of the Nominating Committee
Mr. Hill is Partner of TSG Ventures L.P., a private equity investment company. He has served for over thirty years as a financial services executive in banking, venture capital and private equity.
Sandra S. Jaffee (1941) Director since 2005
Ms. Jaffee served as Chairman (2008-2009) and Chief Executive Officer of Fortent (formerly Searchspace Group), a leading provider of compliance/regulatory technology to financial institutions from August 2005 to August 2009. From August 2004 to August 2005, Ms. Jaffee served as an Entrepreneur in Residence with Warburg Pincus, a private equity firm. From September 1995 to July 2004, Ms. Jaffee served as Executive Vice President at Citigroup, where she was President and Chief Executive Officer of Citibank’s Global Securities Services (1995-2003).
William P. Johnston (1944) Director since 2005, Chairman of the Compliance Committee
In February 2008, Mr. Johnston was elected to the Board of Directors of HCR-ManorCare, Inc. In August 2007, Mr. Johnston was elected to the Board of Directors of LifeCare Holdings, Inc. In July, 2006, Mr. Johnston was elected to the Board of Directors of MultiPlan, Inc. In June 2006, Mr. Johnston was appointed as Senior Advisor to The Carlyle Group, a global private equity investment firm. In May 2006, Mr. Johnston was elected to the Supervisory Board of Fresenius Medical Care AG & Co. KGaA, after its acquisition of Renal Care Group, Inc. in March 2006. Mr. Johnston joined Renal Care Group in November 2002 as a member of the Board of Directors and served as Chairman of the Board from March 2003 through March 2006. From September 1987 to December 2002, Mr. Johnston was with Equitable Securities Corporation (and its successors, SunTrust Equitable Securities and SunTrust Robinson Humphrey) serving in various investment banking and managerial positions, including Managing Director and Head of Investment Banking, Chief Executive Officer and Vice Chairman.
25
The Hartford Growth Fund
Directors and Officers (Unaudited)—(continued)
Phillip O. Peterson (1944) Director since 2002 (MF) and 2000 (MF2), Chairman of the Audit Committee
Mr. Peterson is a mutual fund industry consultant. He was a partner of KPMG LLP (an accounting firm) until July 1999. Mr. Peterson joined William Blair Funds in February 2007 as a member of the Board of Trustees. From January 2004 to April 2005, Mr. Peterson served as Independent President of the Strong Mutual Funds.
Lemma W. Senbet (1946) Director since 2005
Dr. Senbet is the William E. Mayer Chair Professor of Finance at the University of Maryland, Robert H. Smith School of Business. He was chair of the Finance Department during 1998-2006. Previously he was an endowed professor of finance at the University of Wisconsin-Madison. Also, he was director of the Fortis Funds from March 2000-July 2002. Dr. Senbet served the finance profession in various capacities, including as director of the American Finance Association and President of the Western Finance Association. In 2006, Dr. Senbet was inducted Fellow of Financial Management Association International for his career-long distinguished scholarship and professional service.
Interested Directors and Officers
Lowndes A. Smith (1939) Director since 1996 (MF) and 2002 (MF2), Co-Chairman of the Investment Committee
Mr. Smith served as Vice Chairman of The Hartford from February 1997 to January 2002, as President and Chief Executive Officer of Hartford Life, Inc. from February 1997 to January 2002, and as President and Chief Operating Officer of The Hartford Life Insurance Companies from January 1989 to January 2002. Mr. Smith serves as a Director of White Mountains Insurance Group, Ltd., One Beacon Insurance, Symetra Financial and as a Managing Director of Whittington Gray Associates.
John C. Walters* (1962) Director since 2008
Mr. Walters currently serves as President, Chief Executive Officer and Director for Hartford Life, Inc. (“HL, Inc.”). Mr. Walters also serves as President, Chairman of the Board, Chief Executive Officer and Director for Hartford Life Insurance Company (“Hartford Life”), and as Executive Vice President of The Hartford Financial Services Group, Inc. (“The Hartford”). In addition, Mr. Walters is Manager of HL Investment Advisors, LLC (“HL Advisors”). Mr. Walters previously served as Co-Chief Operating Officer of Hartford Life (2007-2008), and as President of the U.S. Wealth Management Division of HL, Inc. (2006-2007). Mr. Walters joined Hartford Life in April 2000 from First Union Securities, the brokerage subsidiary of First Union Corp.
| | | |
| * | | Mr. Walters previously served as President and Chief Executive Officer of the Fund (2007 – 2009). |
Other Officers
Robert M. Arena, Jr. (1968) President and Chief Executive Officer since 2009 (served as Vice President of the Fund (2006 – 2009))
Mr. Arena serves as Executive Vice President of Hartford Life. Additionally, Mr. Arena is Senior Vice President and Director of Hartford Administrative Services Company, (“HASCO”), President, Chief Executive Officer and Manager of Hartford Investment Financial Services, LLC (“HIFSCO”) and President, Chief Executive Officer and Manager of HL Advisors. Prior to joining The Hartford in 2004, he was Senior Vice President in charge of Product Management for American Skandia/Prudential in the individual annuities division.
Tamara L. Fagely (1958) Vice President, Treasurer and Controller since 2002 (MF) 1993 (MF2)
Ms. Fagely has been a Vice President of HASCO since 1998 and Chief Financial Officer since 2006. Currently Ms. Fagely is a Vice President of Hartford Life. In addition, Ms. Fagely is Controller and Chief Financial Officer of HIFSCO. She served as Assistant Vice President of Hartford Life from December 2001 through March 2005.
Brian Ferrell (1962) AML Compliance Officer since 2008
Mr. Ferrell has served as Assistant Vice President and AML Compliance Officer for The Hartford since 2006, and as AML Compliance Officer for HASCO and Hartford Investor Services Company, LLC (“HISC”) since 2008. Prior to joining The Hartford in 2006, Mr. Ferrell held various positions at the U.S. Department of the Treasury (the “Treasury”) from 2001 to 2006, where he served as Chief Counsel for the Treasury’s Financial Crimes Enforcement Network from 2005 – 2006.
Dr. Robert J. Froehlich (1953) Senior Managing Director since 2009
Dr. Froehlich joined The Hartford as Senior Managing Director in September 2009. Prior to joining The Hartford, Dr. Froehlich served as Vice Chairman of Deutsche Asset Management from 1997 – 2009.
26
Thomas D. Jones, III (1965) Vice President and Chief Compliance Officer since 2006
Mr. Jones serves as Chief Compliance Officer for the Hartford Mutual Funds and Vice President and Director of Securities Compliance for The Hartford. He is also Vice President of HIFSCO, HL Advisors, and Hartford Life. Mr. Jones joined The Hartford in 2006 from SEI Investments, where he served as Chief Compliance Officer for its mutual funds and investment advisers. Prior to joining SEI, Mr. Jones was First Vice President and Compliance Director for Merrill Lynch Investment Managers (Americas) (“MLIM”), where he worked from 1992-2004. At MLIM, Mr. Jones was responsible for the compliance oversight of various investment products, including mutual funds, wrap accounts, institutional accounts and alternative investments.
Edward P. Macdonald (1967) Vice President, Secretary and Chief Legal Officer since 2005
Mr. Macdonald serves as Assistant Vice President of Hartford Life and Chief Legal Officer, Secretary and Vice President of HIFSCO. He also serves as Vice President and Secretary of HASCO, and Chief Legal Officer, Secretary and Vice President of HL Advisors. Prior to joining The Hartford in 2005, Mr. Macdonald was Chief Counsel, Investment Management for Prudential Financial (formerly American Skandia Investment Services, Inc.). He joined Prudential in April 1999.
Vernon J. Meyer (1964) Vice President since 2006
Mr. Meyer serves as Senior Vice President of Hartford Life. He also serves as Senior Vice President of HIFSCO and HL Advisors. Mr. Meyer joined The Hartford in 2004 from MassMutual which he joined in 1987.
D. Keith Sloane (1960) Vice President since 2009
Mr. Sloane is a Senior Vice President of Hartford Life. Additionally, Mr. Sloane currently serves as Senior Vice President of HIFSCO, HL Advisors, and HASCO. Prior to joining The Hartford in 2007, Mr. Sloane was Director of product marketing and led the mutual fund business for Wachovia Securities (“Wachovia”) in their investment products group. Mr. Sloane joined Wachovia in 1995.
Jane Wolak (1961) Vice President since 2009
Ms. Wolak currently serves as Vice President of Hartford Life. Ms. Wolak joined Hartford Life as Vice President, Retail Product Services in May 2007. She is also Vice President of HASCO. Previously, Ms. Wolak was with Sun Life Financial where she held the position of Vice President, Service Center Operations from 2001 — 2007.
HOW TO OBTAIN A COPY OF THE FUND’S PROXY VOTING POLICIES AND VOTING RECORDS
A description of the policies and procedures that the Fund uses to determine how to vote proxies relating to portfolio securities and a record of how the Fund voted any proxies for the twelve-month period ended June 30, 2009 is available (1) without charge, upon request, by calling 888-843-7824 and (2) on the Securities and Exchange Commission’s website at http://www.sec.gov.
QUARTERLY PORTFOLIO HOLDINGS INFORMATION
The Fund files a complete schedule of portfolio holdings with the Commission for the first and third quarters of each fiscal year on Form N-Q. The Fund’s Forms are available (1) without charge, upon request, by calling 888-843-7824 and (2) on the Securities and Exchange Commission’s website at http://www.sec.gov. The Form N-Q may be reviewed and copied at the Commission’s Public Reference Room in Washington, DC. Information on the operation of the Public Reference Room may be obtained by calling 1-800-SEC-0330.
27
The Hartford Growth Fund
Federal Tax Information (Unaudited)
The Fund made no capital gain or income distributions for the fiscal year ended October 31, 2009.
28
The Hartford Growth Fund
Expense Example (Unaudited)
Your Fund’s Expenses
As a shareholder of the Fund, you incur two types of costs: (1) transaction costs, including sales charges (loads) on purchase payments and contingent deferred sales charges (CDSC) (2) ongoing costs including management fees; distribution fees; and other fund expenses. This example is intended to help you understand your ongoing costs (in dollars) of investing in the Fund and to compare these costs with the ongoing costs of investing in other mutual funds. The example is based on an investment of $1,000 invested at the beginning of the period and held for the period of April 30, 2009 through October 31, 2009.
Actual Expenses
The first set of columns of the table below provides information about actual account values and actual expenses. You may use the information in this column, together with the amount you invested, to estimate the expenses that you paid over the period. Simply divide your account value by $1,000 (for example, an $8,600 account value divided by $1,000 = 8.6), then multiply the result by the number in the line under the heading entitled “Expenses Paid During Period” to estimate the expenses you paid on your account during this period.
Hypothetical Example for Comparison Purposes
The second set of columns of the table below provides information about hypothetical account values and hypothetical expenses based on the Fund’s actual expense ratio and an assumed rate of return of 5% per year before expenses, which is not the Fund’s actual return. The hypothetical account values and expenses may not be used to estimate the actual ending account balance or expenses you paid for the period. You may use this information to compare the ongoing costs of investing in the Fund and other funds. To do so, compare this 5% hypothetical example with the 5% hypothetical examples that appear in the shareholder reports of the other funds.
Please note that the expenses shown in the table are meant to highlight your ongoing costs only and do not reflect any transactional costs, such as sales charges (loads) and CDSC. Therefore, the second set of columns of the table is useful in comparing ongoing costs only, and will not help you determine the relative total costs of owning different funds. In addition, if these transactional costs were included, your costs would be higher. Expenses are equal to the Fund’s annualized expense ratios multiplied by average account value over the period, multiplied by 184/365 (to reflect the one-half year period).
| | | | | | | | | | | | | | | | | | | | | | | | | | | | | | | | | | | | | |
| | | Actual return | | Hypothetical (5% return before expenses) | | | | | | | | |
| | | | | | | | | | | Expenses paid | | | | | | | | | | Expenses paid | | | | | | Days in | | |
| | | | | | | | | | | during the period | | | | | | | | | | during the period | | | | | | the | | Days |
| | | Beginning | | Ending Account | | April 30, 2009 | | Beginning | | Ending Account | | April 30, | | Annualized | | current | | in the |
| | | Account Value | | Value | | through | | Account Value | | Value | | 2009 through | | expense | | 1/2 | | full |
| | | April 30, 2009 | | October 31, 2009 | | October 31, 2009 | | April 30, 2009 | | October 31, 2009 | | October 31, 2009 | | ratio | | year | | year |
| Class A | | $ | 1,000.00 | | | $ | 1,168.80 | | | $ | 7.05 | | | $ | 1,000.00 | | | $ | 1,018.70 | | | $ | 6.56 | | | | 1.29 | % | | | 184 | | | | 365 | |
| Class B | | $ | 1,000.00 | | | $ | 1,165.80 | | | $ | 9.55 | | | $ | 1,000.00 | | | $ | 1,016.38 | | | $ | 8.89 | | | | 1.75 | | | | 184 | | | | 365 | |
| Class C | | $ | 1,000.00 | | | $ | 1,164.60 | | | $ | 11.18 | | | $ | 1,000.00 | | | $ | 1,014.87 | | | $ | 10.41 | | | | 2.05 | | | | 184 | | | | 365 | |
| Class I | | $ | 1,000.00 | | | $ | 1,170.50 | | | $ | 4.98 | | | $ | 1,000.00 | | | $ | 1,020.62 | | | $ | 4.63 | | | | 0.91 | | | | 184 | | | | 365 | |
| Class L | | $ | 1,000.00 | | | $ | 1,169.50 | | | $ | 5.74 | | | $ | 1,000.00 | | | $ | 1,019.91 | | | $ | 5.35 | | | | 1.05 | | | | 184 | | | | 365 | |
| Class R3 | | $ | 1,000.00 | | | $ | 1,166.90 | | | $ | 8.47 | | | $ | 1,000.00 | | | $ | 1,017.39 | | | $ | 7.88 | | | | 1.55 | | | | 184 | | | | 365 | |
| Class R4 | | $ | 1,000.00 | | | $ | 1,168.90 | | | $ | 6.67 | | | $ | 1,000.00 | | | $ | 1,019.06 | | | $ | 6.21 | | | | 1.22 | | | | 184 | | | | 365 | |
| Class R5 | | $ | 1,000.00 | | | $ | 1,171.10 | | | $ | 5.20 | | | $ | 1,000.00 | | | $ | 1,020.42 | | | $ | 4.84 | | | | 0.95 | | | | 184 | | | | 365 | |
| Class Y | | $ | 1,000.00 | | | $ | 1,171.40 | | | $ | 4.43 | | | $ | 1,000.00 | | | $ | 1,021.12 | | | $ | 4.13 | | | | 0.81 | | | | 184 | | | | 365 | |
29
The Hartford Growth Fund
Approval of Investment Management and Investment Sub-Advisory Agreements (Unaudited)
Section 15(c) of the Investment Company Act of 1940, as amended (the “1940 Act”), requires that each mutual fund’s board of directors, including a majority of those directors who are not “interested persons” of the mutual fund, as defined in the 1940 Act (the “Independent Directors”), annually review and consider the continuation of the mutual fund’s investment advisory and sub-advisory agreements. At its meeting held on August 4-5, 2009, the Board of Directors (the “Board”) of The Hartford Growth Fund (the “Fund”), including each of the Independent Directors, unanimously voted to approve the continuation of the investment management agreement for the Fund with Hartford Investment Financial Services, LLC (“HIFSCO”) and the continuation of the investment sub-advisory agreement between HIFSCO and the Fund’s sub-adviser Wellington Management Company, LLP (“Sub-adviser,” and together with HIFSCO, “Advisers”) (collectively, the “Agreements”).
In the months preceding the August 4-5, 2009 meeting, the Board requested, received, and reviewed written responses from the Advisers to questions posed to them on behalf of the Independent Directors and supporting materials relating to those questions and responses. The Board considered information furnished to the Board at its meetings throughout the year, as well as information specifically prepared in connection with the annual approval of the Agreements at the Board’s meetings held on June 23-24, 2009 and August 4-5, 2009. Information provided to the Board at its meetings throughout the year, included, among other things, reports on Fund performance, legal and compliance matters, sales and marketing activity, shareholder services, and the other services provided to the Fund by the Advisers, and their affiliates. In addition, the Board received in-person presentations by Fund officers and representatives of HIFSCO at the Board’s meetings on June 23-24, 2009 and August 4-5, 2009 concerning the Agreements.
The Independent Directors, advised by independent legal counsel, engaged two service providers to assist them with evaluating the Agreements with respect to the Fund. Lipper Inc. (“Lipper”), an independent provider of investment company data, was retained to provide the Board with reports on how the Fund’s contractual management fees, actual management fees, other non-management fees, overall expense ratios and investment performance compared to those of mutual funds with similar investment objectives. The Independent Directors also engaged an independent financial services consulting firm (the “Consultant”) to assist them in evaluating the Fund’s management fees, sub-advisory fees, other non-management fees, overall expense ratios and investment performance. In addition, the Consultant reviewed the profitability calculations utilized by HIFSCO in connection with the continuation of the investment management agreement.
In determining to continue the Agreements for the Fund, the members of the Board reviewed and evaluated information and factors they believed to be relevant and appropriate in light of the information that the Board deemed necessary and appropriate and through the exercise of their reasonable business judgment. While individual members of the Board may have weighed certain factors differently, the Board’s determination to continue the Agreements was based on a comprehensive consideration of all information provided to the Board throughout the year and specifically with respect to the continuation of the Agreements. A more detailed discussion of the factors the Board considered with respect to its approval of the Agreements is provided below.
Nature, Extent And Quality Of Services Provided by the Advisers
The Board requested and considered information concerning the nature, extent, and quality of the services provided to the Fund by the Advisers. The Board considered, among other things, the terms of the Agreements and the range of services provided by the Advisers. In this regard, the Board considered information provided to it by HIFSCO concerning the Agreements, which were amended and restated to more completely reflect the services provided to the Fund, but did not result in a material amendment to the Fund’s prior contractual arrangement. The Board considered the Advisers’ professional personnel who provide services to the Fund, including each Adviser’s ability and experience in attracting and retaining qualified personnel to service the Fund. The Board considered each Adviser’s reputation and overall financial strength, as well as its willingness to consider and implement organizational and operational changes designed to improve services to the Fund. In addition, the Board considered the quality of each Adviser’s communications with the Board and responsiveness to Board inquiries.
The Board also requested and evaluated information concerning each Adviser’s regulatory and compliance environment. In this regard, the Board requested and reviewed information on each Adviser’s compliance policies and procedures, compliance history, and a report from the Fund’s Chief Compliance Officer on each Adviser’s compliance with applicable laws and regulations, including responses to regulatory developments and compliance issues raised by regulators. The Board also noted the Advisers’ support of the Fund’s compliance control structure, particularly the resources devoted by the Advisers in support of the Fund’s obligations pursuant to Rule 38a-1 under the 1940 Act.
30
With respect to HIFSCO, the Board noted that under the Agreements, HIFSCO is responsible for the management of the Fund, including overseeing fund operations and service providers and provides administration services to the Fund as well as investment advisory services in connection with selecting, monitoring and supervising the Sub-adviser. The Board considered HIFSCO’s constant monitoring of people, process and performance, including its ongoing commitment to review and rationalize The Hartford Fund Family’s product line-up. The Board considered that HIFSCO or its affiliates are responsible for providing the Fund’s officers and paying their salaries and expenses.
With respect to the Sub-adviser, who provides day-to-day portfolio management services, the Board considered the quality of the Fund’s portfolio managers, the Sub-adviser’s other investment personnel, its investment philosophy and process, investment research capabilities and resources, performance record, trade execution capabilities and experience. The Board considered the experience of the Fund’s portfolio managers, the number of accounts managed by the portfolio managers, and the Sub-adviser’s method for compensating the portfolio managers.
Based on these considerations, the Board concluded that it was satisfied with the nature, extent and quality of the services provided to the Fund by HIFSCO and the Sub-adviser.
Performance of the Fund and the Advisers
The Board considered the investment performance of the Fund. In this regard, the Board reviewed the performance of the Fund over different time periods presented in the materials and evaluated HIFSCO’s analysis of the Fund’s performance for these time periods. The Board considered information and materials provided to the Board by the Advisers concerning Fund performance, as well as information from Lipper comparing the investment performance of the Fund to an appropriate universe of peer funds.
The Board considered the detailed investment analytics reports provided by The Hartford’s Investment Advisory Group throughout the year. These reports include, among other things, information on the Fund’s gross and net returns, the Fund’s investment performance relative to an appropriate benchmark and peer group, various statistics concerning the Fund’s portfolio, and a narrative summary of various factors affecting Fund performance. The Board considered the Advisers’ cooperation with the Investment Committee, which assists the Board in evaluating the performance of the Fund at periodic meetings throughout the year. The Board also considered the analysis provided by the Consultant relating to the Fund’s performance track record.
In light of all the considerations noted above, the Board concluded that it had continued confidence in HIFSCO’s and the Sub-adviser’s overall capabilities to manage the Fund.
Costs of the Services and Profitability of the Advisers
The Board reviewed information regarding HIFSCO’s cost to provide investment management and related services to the Fund and HIFSCO’s profitability, both overall and for the Fund, on a pre-tax basis without regard to distribution expenses. The Board also requested and reviewed information about the profitability to HIFSCO and its affiliates from all services provided to the Fund and all aspects of their relationship with the Fund. The Board also requested and received information relating to the operations and profitability of the Sub-adviser.
The Board considered the Consultant’s review of the profitability calculations utilized by HIFSCO in connection with the continuation of the investment management agreement. In this regard, the Consultant reported that The Hartford’s process for calculating and reporting Fund profitability is reasonable, sound and well within common industry practice.
Based on these considerations, the Board concluded that the profits anticipated to be realized by the Advisers and their affiliates from their relationships with the Fund would not be excessive.
Comparison of Fees and Services Provided by the Advisers
The Board considered comparative information with respect to the investment management fees to be paid by the Fund to HIFSCO, the investment sub-advisory fees to be paid by HIFSCO to the Sub-adviser, and the total expense ratios of the Fund. In this regard, the Board requested and reviewed information from HIFSCO and the Sub-adviser relating to the management and sub-advisory fees, and total operating expenses for the Fund. The Board also reviewed information from Lipper comparing the
31
The Hartford Growth Fund
Approval of Investment Management and Investment Sub-Advisory Agreements (Unaudited) — (continued)
Fund’s contractual management fees, actual management fees and overall expense ratios, relative to a group of funds selected by Lipper, in consultation with the Consultant (“Expense Group”), and a broader universe of funds selected by Lipper (“Expense Universe”). The Board considered that as of November 1, 2009, transfer agency fees in excess of the transfer agency expense limitation amount (currently 0.30%) will be reimbursed by Hartford Administrative Services Company (“HASCO”) prior to the application of the Fund’s expense limitation by HIFSCO.
While the Board recognized that comparisons between the Fund and peer funds are imprecise, given the differing service levels and characteristics of mutual funds and the different business models and cost structures of the Advisers, the comparative information provided by Lipper assisted the Board in evaluating the reasonableness of the Fund’s management fees and total operating expenses. In addition, the Board considered the analysis and recommendations of the Consultant relating to the Fund’s management and sub-advisory fees and total operating expenses.
Based on these considerations, the Board concluded that the Fund’s fees and total operating expenses, in conjunction with the information about quality of services, profitability, economies of scale, and other matters discussed, were reasonable in light of the services provided.
Economies of Scale
The Board requested and considered information regarding the Advisers’ realization of economies of scale with respect to the Fund, and whether the fee levels reflect these economies of scale for the benefit of the Fund’s investors. With respect to HIFSCO, the Board considered representations from HIFSCO that it is difficult to anticipate whether and the extent to which economies may be realized by HIFSCO as assets grow over time. The Board reviewed the breakpoints in the advisory fee schedule for the Fund, which reduces fees as Fund assets grow over time. The Board recognized that a fund with assets beyond the last breakpoint level will continue to benefit from economies of scale, because additional assets are charged the lowest breakpoint fee, resulting in lower overall effective management fee rates. The Board also considered that expense limitations and fee waivers that reduce the Fund’s expenses at all asset levels can have the same effect as breakpoints in sharing economies of scale with shareholders, and that a schedule that reaches a lower breakpoint quickly provides shareholders with the benefit of anticipated or potential economies of scale.
The Board reviewed and evaluated materials from Lipper showing how management fee schedules of peer funds reflect economies of scale for the benefit of investors as a peer fund’s assets hypothetically increase over time. Based on information provided by HIFSCO, Lipper, and the Consultant, the Board recognized that there is no uniform methodology for establishing breakpoints, or uniform pattern in asset levels that trigger breakpoints or the amounts of breakpoints triggered.
After considering all of the information available to it, the Board concluded that it was satisfied with the extent to which economies of scale would be shared for the benefit of the Fund’s shareholders, based on currently available information and the effective advisory fees and expense ratios for the Fund at its current and reasonably anticipated asset levels. The Board noted, however, that it would continue to monitor future growth in Fund assets and the appropriateness of additional breakpoints.
Other Benefits
The Board considered other benefits to the Advisers and their affiliates from their relationships with the Fund.
The Board reviewed information noting that Hartford Life, Inc. (“Hartford Life”) an affiliate of HIFSCO, receives fees for fund accounting and related services from the Fund, and the Board considered information on expected profits to Hartford Life or its affiliates for such services. The Board also considered that HASCO, the Fund’s transfer agent and an affiliate of HIFSCO, receives transfer agency compensation from the Fund, and the Board reviewed information on the expected profitability of the Fund’s transfer agency function to HASCO. The Board noted that HASCO is a recognized leader in providing high quality services to Fund shareholders and has received six consecutive mutual fund Dalbar service awards. The Board considered information provided by HASCO indicating that the transfer agent fees charged by HASCO to the Fund were fair and reasonable based on publicly available information.
32
The Board also considered that, as principal underwriter of the Fund, HIFSCO receives 12b-1 fees from the Fund and receives all or a portion of the sales charges on sales or redemptions of certain classes of shares. The Board also noted that certain affiliates of HIFSCO distribute shares of the Fund and receive compensation in that connection.
The Board considered benefits to the Sub-adviser from its use of the Fund’s brokerage commissions to obtain soft dollar research, and representations from HIFSCO and the Sub-adviser that the Sub-adviser would not make any revenue-sharing payments or any other type of distribution payments to HIFSCO or its affiliates.
The Board considered the benefits to shareholders of being part of the Hartford family of funds, including the right to exchange investments between the same class of funds without a sales charge, the ability to reinvest Fund dividends into other funds in the family, and the ability to combine holdings in the Fund with holdings in other funds to obtain a reduced sales charge. The Board considered HIFSCO’s efforts to provide investors in the family with a broad range of investment styles and asset classes and its entrepreneurial risk in initiating new funds to expand these opportunities for shareholders.
* * * *
Based upon its review of these various factors, among others, the Board concluded that it is in the best interests of the Fund and its shareholders for the Board to approve the Agreements for an additional year. In reaching this decision, the Board did not assign relative weights to the factors discussed above or deem any one or group of them to be controlling in and of themselves. In connection with their deliberations, the Independent Directors met separately in executive session on several occasions, with independent legal counsel, to review the relevant materials and consider their responsibilities under relevant laws and regulations.
33
This information is written in connection with the promotion or marketing of the matter(s) addressed in this material. The information cannot be used or relied upon for the purpose of avoiding IRS penalties. These materials are not intended to provide tax, accounting or legal advice. As with all matters of a tax or legal nature, you should consult your own tax or legal counsel for advice.
You should carefully consider investment objectives, risks, and charges and expenses of The Hartford Mutual Funds before investing. This and other information can be found in the Fund’s prospectus, which can be obtained from your investment representative or by calling 888-843-7824. Please read it carefully before you invest or send money.
The Hartford Mutual Funds are underwritten and distributed by Hartford Investment Financial Services, LLC.
“The Hartford” is The Hartford Financial Services Group, Inc., and its subsidiaries.
Mutual fund inception dates range from 1949 to date. The Hartford Mutual Funds are not a subsidiary of The Hartford but are underwritten, distributed by, and advised by subsidiaries of The Hartford. Investments in The Hartford Mutual Funds are not guaranteed by The Hartford or any other entity.
MFAR-19 12/09 MUT 8759 Printed in U.S.A. © 2009 The Hartford, Hartford, CT 06117
The Hartford Growth Opportunities Fund
Table of Contents
| | | | | |
| Manager Discussions (Unaudited) | | | 2 | |
| | |
| Financial Statements | | | | |
| | |
| | | 4 | |
| | |
| | | 6 | |
| | |
| | | 7 | |
| | |
| | | 8 | |
| | |
| | | 9 | |
| | |
| | | 10 | |
| | |
| | | 22 | |
| | |
| | | 24 | |
| | |
| | | 25 | |
| | |
| | | 27 | |
| | |
| | | 27 | |
| | |
| | | 28 | |
| | |
| | | 29 | |
| | |
| | | 30 | |
| | | |
The Hartford Growth Opportunities Fund inception 03/31/1963
(subadvised by Wellington Management Company, LLP) | | Investment objective — Seeks capital appreciation. |
Performance Overview(1) 10/31/99 – 10/31/09
Growth of a $10,000 investment in Class A which includes Sales Charge
Russell 1000 Growth Index is an unmanaged index which measures the performance of those Russell 1000 Index companies with higher price-to-book ratios and higher forecasted growth values.
Russell 3000 Growth Index is an unmanaged index that measures the performance of those Russell 3000 Index companies with higher price-to-book ratios and higher forecasted growth values.
You cannot invest directly in an index.
The value of shares will fluctuate so that, when redeemed, shares may be worth more or less than their original cost. The chart and table do not reflect the deduction of taxes that a shareholder would pay on fund distributions or the redemption of fund shares.
Performance information may reflect historical or current expense waivers/reimbursements from the investment adviser, without which performance would have been lower. For information on current expense waivers/reimbursements, please see the prospectus.
Average Annual Total Returns(2,3,4,5) (as of 10/31/09)
| | | | | | | | | | | | | |
| | | 1 | | 5 | | 10 |
| | | Year | | Year | | Year |
| |
| Growth Opportunities A# | | | 11.24 | % | | | 3.03 | % | | | 2.87 | % |
| Growth Opportunities A## | | | 5.12 | % | | | 1.87 | % | | | 2.29 | % |
| Growth Opportunities B# | | | 10.62 | % | | | 2.26 | % | | NA | * |
| Growth Opportunities B## | | | 5.62 | % | | | 1.96 | % | | NA | * |
| Growth Opportunities C# | | | 10.39 | % | | | 2.26 | % | | | 2.14 | % |
| Growth Opportunities C## | | | 9.39 | % | | | 2.26 | % | | | 2.14 | % |
| Growth Opportunities I# | | | 11.58 | % | | | 3.29 | % | | NA | |
| Growth Opportunities L# | | | 11.51 | % | | | 3.27 | % | | | 3.08 | % |
| Growth Opportunities L## | | | 6.22 | % | | | 2.27 | % | | | 2.58 | % |
| Growth Opportunities R3# | | | 10.95 | % | | | 3.08 | % | | NA | |
| Growth Opportunities R4# | | | 11.36 | % | | | 3.30 | % | | NA | |
| Growth Opportunities R5# | | | 11.62 | % | | | 3.45 | % | | NA | |
| Growth Opportunities Y# | | | 11.81 | % | | | 3.52 | % | | NA | |
| Russell 1000 Growth Index | | | 17.51 | % | | | 1.27 | % | | | -3.39 | % |
| Russell 3000 Growth Index | | | 17.04 | % | | | 1.26 | % | | | -3.14 | % |
| | |
| # | | Without sales charge |
| |
| ## | | With sales charge |
| |
| NA | | Not Applicable |
| |
| * | | 10 year returns are not applicable for Class B because after 8 years Class B converts to Class A. |
PAST PERFORMANCE IS NOT INDICATIVE OF FUTURE RESULTS.
| (1) | | Growth of a $10,000 investment in Classes B, C, I, L, R3, R4, R5 and Y shares will vary from results seen above due to differences in the expenses charged to these share classes. |
| |
| (2) | | Classes A, B, C and Y shares were offered beginning on 2/19/02. Performance prior to that date for Class A is that of the fund’s Class L shares and for Classes B and C is that of the fund’s Classes M and N shares, respectively, which had lower operating expenses. Performance prior to 2/19/02 would have been lower if Classes A, B and C shares expenses were applied during that period. (Classes M and N shares are no longer offered.) Class I shares commenced operations on 8/31/06. Performance prior to 8/31/06 reflects Class A performance. Classes R3, R4 and R5 shares commenced operations on 12/22/06. Performance prior to 12/22/06 reflects Class Y performance. The Fund’s performance information prior to 4/1/01 reflects when the Fund was managed by a previous investment adviser. |
| |
| (3) | | The initial investment in Classes A and L shares reflects the maximum sales charge and Classes B and C reflect CDSC. |
| |
| (4) | | Total returns presented above were calculated using the Fund’s net asset value available to shareholders for sale or redemption of Fund shares on 10/31/09, which excludes investment transactions as of this date. |
| |
| (5) | | Effective 9/30/09, Class B shares of The Hartford Mutual Funds are closed to new investments. |
| | | |
Portfolio Managers | | |
Michael T. Carmen, CFA, CPA | | Mario E. Abularach, CFA, CMT |
| Senior Vice President, Partner | | Vice President |
How did the Fund perform?
The Class A shares of The Hartford Growth Opportunities Fund returned 11.24%, before sales charge, for the twelve-month period ended October 31, 2009, underperforming the benchmark, the Russell 3000 Growth Index, which returned 17.04% for the same period. The Fund also underperformed the 15.96% return of the average fund in the Lipper
2
Multi-Cap Growth Funds peer group, a group of funds with investment strategies similar to those of the Fund.
Why did the Fund perform this way?
The period was marked by two distinct episodes. The first was a freefall of global equity markets from October through March. This was characterized by uncertainty over the U.S. government stimulus package, tight global credit and liquidity conditions, a collapse of global industrial production, and sharp increases in unemployment. The second episode of increased investor risk appetite and rising equity markets started in March with nascent signs of a bottoming in the fortunes of the financial industry, coupled with aggressive intervention by the Federal Reserve (Fed) in the capital markets, and better-than-expected corporate profits due to cost cutting. Signs of economic stabilization overshadowed concerns about high unemployment and weak home prices.
In this environment, mid cap stocks (+18.2%) outperformed small (+6.5%) and large cap stocks (+9.8%) during the period, as measured by the S&P MidCap 400, Russell 2000 and S&P 500 Indexes, respectively. Growth (+17%) significantly outperformed Value (+4.6%), as measured by the Russell 3000 Growth and Russell 3000 Value indexes, respectively. All ten sectors of the Russell 3000 Growth Index had positive returns, with Information Technology, Consumer Discretionary, and Materials leading the way while Health Care, Industrials, and Financials lagged the most.
The Fund underperformed primarily due to weak security selection in Information Technology, Health Care, and Consumer Discretionary. Sector weight positioning, the result of bottom-up (i.e. stock by stock fundamental research) stock selection decisions, also detracted from relative (i.e. performance of the Fund as measured against the benchmark) performance due to an overweight (i.e. the Fund’s sector position was greater than the benchmark position) position in Financials and an underweight (i.e. the Fund’s sector position was less than the benchmark position) in Information Technology. A modest cash position also detracted slightly from relative performance.
Top detractors from relative performance during the period included HUGHES Telematics (Information Technology), General Electric (Industrials), and Focus Media (Consumer Discretionary). Shares of HUGHES Telematics, an after-market provider of next generation telematics for the automobile industry, declined due to concerns over slowing industry sales. U.S. conglomerate General Electric’s stock price declined as the company cut its dividend, lost its AAA credit rating, and investors grew increasingly concerned about its finance segment. Shares of Focus Media, a Chinese digital advertising and media company, declined following disappointing quarterly profits. The company’s management reduced guidance due to severe macro headwinds and slowing online advertising spending trends. We eliminated our positions in General Electric and Focus Media during the period.
The largest contributors to relative and absolute (i.e. total return) performance included Goldman Sachs (Financials), Schering-Plough (Health Care) and Red Hat (Information Technology). Shares of Goldman Sachs, a U.S. investment bank and bank holding company, benefited from the firm’s relatively healthy balance sheet, strong trading results, and improved competitive positioning within the investment banking industry. Investors were also pleased that the firm repaid its TARP funds during the period. Global health care company Schering-Plough’s stock jumped after the company announced a definitive merger agreement with Merck. Red Hat’s shares rose as it posted better-than-expected results on growing revenue, climbing market share, and higher margins in a tight information technology spending environment.
What is the outlook?
It is increasingly clear that the U.S. is emerging from a deep recession. The rate of increase in unemployment has slowed, industrial production leading indicators are pointing to an expansion, and the housing market has shown some signs of stabilization. The government continues to reshape the financial playing field through stimulus packages, massive loans to impaired private sector companies, and other programs all taken with an eye towards thawing the credit markets and placing a floor on the house price declines and a ceiling on housing inventory.
We see investment opportunities across multiple sectors and continue to focus our research efforts on identifying stocks of companies whose future growth is underpriced. At the end of the period, our bottom-up decisions resulted in overweights in the Consumer Discretionary, Financials, and Energy sectors and underweights in the Consumer Staples, Industrials, and Health Care sectors relative to the Russell 3000 Growth Index.
Diversification by Industry
as of October 31, 2009
| | | | | |
| | | Percentage of |
| Industry (Sector) | | Net Assets |
| | | |
| Automobiles & Components (Consumer Discretionary) | | | 1.1 | % |
| Banks (Financials) | | | 2.3 | |
| Capital Goods (Industrials) | | | 5.2 | |
| Consumer Durables & Apparel (Consumer Discretionary) | | | 3.3 | |
| Consumer Services (Consumer Discretionary) | | | 1.9 | |
| Diversified Financials (Financials) | | | 6.1 | |
| Energy (Energy) | | | 7.0 | |
| Food, Beverage & Tobacco (Consumer Staples) | | | 1.2 | |
| Health Care Equipment & Services (Health Care) | | | 5.4 | |
| Household & Personal Products (Consumer Staples) | | | 0.6 | |
| Insurance (Financials) | | | 1.6 | |
| Materials (Materials) | | | 3.5 | |
| Media (Consumer Discretionary) | | | 1.0 | |
| Pharmaceuticals, Biotechnology & Life Sciences (Health Care) | | | 7.1 | |
| Real Estate (Financials) | | | 1.1 | |
| Retailing (Consumer Discretionary) | | | 10.7 | |
| Semiconductors & Semiconductor Equipment (Information Technology) | | | 4.6 | |
| Software & Services (Information Technology) | | | 14.1 | |
| Technology Hardware & Equipment (Information Technology) | | | 10.5 | |
| Telecommunication Services (Services) | | | 1.0 | |
| Transportation (Industrials) | | | 1.6 | |
| Short-Term Investments | | | 8.3 | |
| Other Assets and Liabilities | | | 0.8 | |
| | | | | |
Total | | | 100.0 | % |
| | | | | |
3
The Hartford Growth Opportunities Fund
Schedule of Investments
October 31, 2009
(000’s Omitted)
| | | | | | | | | |
| Shares or Principal Amount | | | Market Value ╪ | |
| COMMON STOCKS - 90.9% | | | | |
| | | | | Automobiles & Components - 1.1% | | | | |
| | 2,949 | | | Ford Motor Co. • | | $ | 20,646 | |
| | | | | | | | |
| | |
| | | | | Banks - 2.3% | | | | |
| | 1,362 | | | Itau Unibanco Banco Multiplo S.A. ADR | | | 26,071 | |
| | 714 | | | Wells Fargo & Co. | | | 19,657 | |
| | | | | | | | |
| | | | | | | | 45,728 | |
| | | | | | | | |
| | | | | Capital Goods - 5.2% | | | | |
| | 393 | | | Boeing Co. | | | 18,790 | |
| | 447 | | | Illinois Tool Works, Inc. | | | 20,512 | |
| | 935 | | | Ingersoll-Rand plc | | | 29,534 | |
| | 1,277 | | | Masco Corp. | | | 14,999 | |
| | 318 | | | Parker-Hannifin Corp. | | | 16,820 | |
| | | | | | | | |
| | | | | | | | 100,655 | |
| | | | | | | | |
| | | | | Consumer Durables & Apparel - 3.3% | | | | |
| | 906 | | | Coach, Inc. | | | 29,877 | |
| | 1,288 | | | Jarden Corp. | | | 35,291 | |
| | | | | | | | |
| | | | | | | | 65,168 | |
| | | | | | | | |
| | | | | Consumer Services - 1.9% | | | | |
| | 389 | | | Apollo Group, Inc. Class A • | | | 22,201 | |
| | 1,643 | | | MGM Mirage, Inc. • | | | 15,232 | |
| | | | | | | | |
| | | | | | | | 37,433 | |
| | | | | | | | |
| | | | | Diversified Financials - 6.1% | | | | |
| | 613 | | | Ameriprise Financial, Inc. | | | 21,249 | |
| | 145 | | | Goldman Sachs Group, Inc. | | | 24,606 | |
| | 1,147 | | | Invesco Ltd. | | | 24,249 | |
| | 590 | | | Julius Baer Group Ltd. | | | 22,197 | |
| | 1,603 | | | UBS AG | | | 26,730 | |
| | | | | | | | |
| | | | | | | | 119,031 | |
| | | | | | | | |
| | | | | Energy - 7.0% | | | | |
| | 455 | | | Baker Hughes, Inc. | | | 19,155 | |
| | 211 | | | Canadian Natural Resources Ltd. ADR | | | 13,658 | |
| | 231 | | | Devon Energy Corp. | | | 14,942 | |
| | 349 | | | Hess Corp. | | | 19,121 | |
| | 569 | | | National Oilwell Varco, Inc. • | | | 23,315 | |
| | 296 | | | Occidental Petroleum Corp. | | | 22,483 | |
| | 710 | | | Suncor Energy, Inc. | | | 23,431 | |
| | | | | | | | |
| | | | | | | | 136,105 | |
| | | | | | | | |
| | | | | Food, Beverage & Tobacco - 1.2% | | | | |
| | 209 | | | Coca-Cola Enterprises, Inc. | | | 3,986 | |
| | 695 | | | Dr. Pepper Snapple Group • | | | 18,932 | |
| | | | | | | | |
| | | | | | | | 22,918 | |
| | | | | | | | |
| | | | | Health Care Equipment & Services - 5.4% | | | | |
| | 256 | | | Beckman Coulter, Inc. | | | 16,499 | |
| | 491 | | | Covidien plc | | | 20,668 | |
| | 317 | | | Edwards Lifesciences Corp. • | | | 24,398 | |
| | 1,253 | | | Hologic, Inc. • | | | 18,517 | |
| | 103 | | | Intuitive Surgical, Inc. • | | | 25,350 | |
| | | | | | | | |
| | | | | | | | 105,432 | |
| | | | | | | | |
| | | | | Household & Personal Products - 0.6% | | | | |
| | 257 | | | Estee Lauder Co., Inc. | | | 10,935 | |
| | | | | | | | |
| | |
| | | | | Insurance - 1.6% | | | | |
| | 493 | | | Allstate Corp. | | | 14,578 | |
| | 672 | | | Marsh & McLennan Cos., Inc. | | | 15,765 | |
| | | | | | | | |
| | | | | | | | 30,343 | |
| | | | | | | | |
| | | | | Materials - 3.5% | | | | |
| | 419 | | | Mosaic Co. | | | 19,571 | |
| | 321 | | | Potash Corp. of Saskatchewan, Inc. | | | 29,773 | |
| | 1,338 | | | Xstrata plc | | | 19,266 | |
| | | | | | | | |
| | | | | | | | 68,610 | |
| | | | | | | | |
| | | | | Media - 1.0% | | | | |
| | 616 | | | DreamWorks Animation SKG, Inc. • | | | 19,715 | |
| | | | | | | | |
| | | | | | | | | |
| | | | | Pharmaceuticals, Biotechnology & Life Sciences - 7.1% | | | | |
| | 555 | | | Alkermes, Inc. • | | | 4,419 | |
| | 824 | | | Amylin Pharmaceuticals, Inc. • | | | 9,097 | |
| | 541 | | | Auxilium Pharmaceuticals, Inc. • | | | 17,004 | |
| | 1,201 | | | Daiichi Sankyo Co., Ltd. | | | 23,461 | |
| | 650 | | | Elan Corp. plc ADR • | | | 3,541 | |
| | 1,761 | | | Pfizer, Inc. | | | 29,983 | |
| | 528 | | | Teva Pharmaceutical Industries Ltd. ADR | | | 26,658 | |
| | 529 | | | Thermo Fisher Scientific, Inc. • | | | 23,814 | |
| | | | | | | | |
| | | | | | | | 137,977 | |
| | | | | | | | |
| | | | | Real Estate - 1.1% | | | | |
| | 4,059 | | | Wharf Holdings Ltd. | | | 21,931 | |
| | | | | | | | |
| | | | | | | | | |
| | | | | Retailing - 10.7% | | | | |
| | 570 | | | Advance Automotive Parts, Inc. | | | 21,246 | |
| | 163 | | | Amazon.com, Inc. • | | | 19,366 | |
| | 925 | | | Best Buy Co., Inc. | | | 35,324 | |
| | 254 | | | Dufry Group | | | 16,035 | |
| | 1,595 | | | Gap, Inc. | | | 34,029 | |
| | 439 | | | Kohl’s Corp. • | | | 25,125 | |
| | 1,419 | | | Staples, Inc. | | | 30,782 | |
| | 830 | | | Urban Outfitters, Inc. • | | | 26,051 | |
| | | | | | | | |
| | | | | | | | 207,958 | |
| | | | | | | | |
| | | | | Semiconductors & Semiconductor Equipment - 4.6% | | | | |
| | 1,524 | | | Marvell Technology Group Ltd. • | | | 20,913 | |
| | 1,322 | | | Maxim Integrated Products, Inc. | | | 22,034 | |
| | 1,631 | | | NVIDIA Corp. • | | | 19,509 | |
| | 1,147 | | | Texas Instruments, Inc. | | | 26,900 | |
| | | | | | | | |
| | | | | | | | 89,356 | |
| | | | | | | | |
| | | | | Software & Services - 14.1% | | | | |
| | 489 | | | Accenture plc | | | 18,143 | |
| | 902 | | | Adobe Systems, Inc. • | | | 29,724 | |
| | 755 | | | BMC Software, Inc. • | | | 28,063 | |
| | 72 | | | Google, Inc. • | | | 38,386 | |
| | 574 | | | McAfee, Inc. • | | | 24,041 | |
| | 779 | | | Microsoft Corp. | | | 21,607 | |
| | 1,855 | | | Oracle Corp. | | | 39,147 | |
| | 937 | | | Red Hat, Inc. • | | | 24,189 | |
| | 216 | | | Visa, Inc. | | | 16,326 | |
| | 1,088 | | | Western Union Co. | | | 19,763 | |
| | 904 | | | Yahoo!, Inc. • | | | 14,377 | |
| | | | | | | | |
| | | | | | | | 273,766 | |
| | | | | | | | |
| | | | | Technology Hardware & Equipment - 10.5% | | | | |
| | 368 | | | Apple, Inc. • | | | 69,443 | |
| | 1,636 | | | Cisco Systems, Inc. • | | | 37,383 | |
| | 2,081 | | | Hughes Telematics, Inc. • | | | 6,192 | |
| | 829 | | | Juniper Networks, Inc. • | | | 21,137 | |
| | 1,143 | | | SanDisk Corp. • | | | 23,401 | |
| | 1,946 | | | Seagate Technology | | | 27,145 | |
| | 575 | | | Western Digital Corp. • | | | 19,359 | |
| | | | | | | | |
| | | | | | | | 204,060 | |
| | | | | | | | |
| | | | | Telecommunication Services - 1.0% | | | | |
| | 539 | | | American Tower Corp. Class A • | | | 19,861 | |
| | | | | | | | |
The accompanying notes are an integral part of these financial statements.
4
| | | | | | | | | | | | | |
| Shares or Principal Amount | | | | | | | Market Value ╪ | |
| COMMON STOCKS - 90.9% — (continued) | | | | | | | | |
| | | | | Transportation - 1.6% | | | | | | | | |
| | 443 | | | FedEx Corp. | | | | | | $ | 32,165 | |
| | | | | | | | | | | | |
| | |
| | | | | Total common stocks
(cost $1,604,013) | | | | | | $ | 1,769,793 | |
| | | | | | | | | | | | |
| | |
| | | | | Total long-term investments
(cost $1,604,013) | | | | | | $ | 1,769,793 | |
| | | | | | | | | | | | |
| | | | | | | | | | | | | |
| SHORT-TERM INVESTMENTS - 8.3% | | | | | | | | |
| | | | | Repurchase Agreements - 8.3% | | | | | | | | |
| | | | | Banc of America Securities TriParty Joint Repurchase Agreement (maturing on 11/02/2009 in the amount of $6,518, collateralized by GNMA 5.00%, 2039, value of $6,649) | | | | | | | | |
| $ | 6,518 | | | 0.08%, 10/30/2009 | | | | | | $ | 6,518 | |
| | | | | BNP Paribas Securities Corp. TriParty Joint Repurchase Agreement (maturing on 11/02/2009 in the amount of $38,187, collateralized by FHLMC 4.00% - 7.00%, 2011 - 2039, FNMA 4.00% - 7.00%, 2017 - - 2047, value of $38,950) | | | | | | | | |
| | 38,186 | | | 0.08%, 10/30/2009 | | | | | | | 38,186 | |
| | | | | Deutsche Bank Securities TriParty Joint Repurchase Agreement (maturing on 11/02/2009 in the amount of $42,539, collateralized by FHLMC 6.00%, 2036, FNMA 7.00%, 2038, value of $43,389) | | | | | | | | |
| | 42,539 | | | 0.08%, 10/30/2009 | | | | | | | 42,539 | |
| | | | | UBS Securities, Inc. Joint Repurchase Agreement (maturing on 11/02/2009 in the amount of $431, collateralized by U.S. Treasury Note 2.75%, 2013, value of $436) | | | | | | | | |
| | 431 | | | 0.05%, 10/30/2009 | | | | | | | 431 | |
| | | | | UBS Securities, Inc. TriParty Joint Repurchase Agreement (maturing on 11/02/2009 in the amount of $73,706, collateralized by FNMA 4.00% - 7.50%, 2016 - 2048, value of $75,179) | | | | | | | | |
| | 73,705 | | | 0.07%, 10/30/2009 | | | | | | | 73,705 | |
| | | | | | | | | | | | |
| | | | | | | | | | | | 161,379 | |
| | | | | | | | | | | | |
| | | | | Total short-term investments
(cost $161,379) | | | | | | $ | 161,379 | |
| | | | | | | | | | | | |
| | | | | Total investments
(cost $1,765,392) ▲ | | | 99.2 | % | | $ | 1,931,172 | |
| | | | | Other assets and liabilities | | | 0.8 | % | | | 14,965 | |
| | | | | | | | | | | |
| | | | | Total net assets | | | 100.0 | % | | $ | 1,946,137 | |
| | | | | | | | | | | |
| | |
| Note: | | Percentage of investments as shown is the ratio of the total market value to total net assets. Market value of investments in foreign securities represents 12.9% of total net assets at October 31, 2009. |
| |
| | | Foreign securities that are principally traded on certain foreign markets are adjusted daily pursuant to a third party pricing service methodology approved by the Board of Directors in order to reflect an adjustment for factors occurring after the close of the foreign market but before the close of the New York Stock Exchange. |
| |
| ▲ | | At October 31, 2009, the cost of securities for federal income tax purposes was $1,778,005 and the aggregate gross unrealized appreciation and depreciation based on that cost were: |
| | | | | |
| Unrealized Appreciation | | $ | 256,654 | |
| Unrealized Depreciation | | | (103,487 | ) |
| | | | |
| Net Unrealized Appreciation | | $ | 153,167 | |
| | | | |
| | |
| • | | Currently non-income producing. |
Forward Foreign Currency Contracts Outstanding at October 31, 2009
| | | | | | | | | | | | | | | | | |
| | | | | | | | | | | | | | | Unrealized | |
| | | Market | | | Contract | | | Delivery | | | Appreciation/ | |
| Description | | Value ╪ | | | Amount | | | Date | | | (Depreciation) | |
| Japanese Yen (Sell) | | $ | 2,507 | | | $ | 2,479 | | | | 11/02/09 | | | $ | (28 | ) |
| Japanese Yen (Sell) | | | 6,010 | | | | 5,963 | | | | 11/04/09 | | | | (47 | ) |
| Japanese Yen (Sell) | | | 1,083 | | | | 1,072 | | | | 11/05/09 | | | | (11 | ) |
| | | | | | | | | | | | | | | | |
| | | | | | | | | | | | | | | $ | (86 | ) |
| | | | | | | | | | | | | | | | |
| | |
| ╪ | | See Significant Accounting Policies of accompanying Notes to Financial Statements regarding valuation of securities. |
The accompanying notes are an integral part of these financial statements.
5
The Hartford Growth Opportunities Fund
Investment Valuation Hierarchy Level Summary
October 31, 2009
(000’s Omitted)
| | | | | | | | | | | | | | | | | |
| | | Total | | | Level 1 | | | Level 2 | | | Level 3 | |
Assets: | | | | | | | | | | | | | | | | |
| Common Stocks ‡ | | $ | 1,769,793 | | | $ | 1,662,370 | | | $ | 107,423 | | | $ | — | |
| Short-Term Investments | | | 161,379 | | | | — | | | | 161,379 | | | | — | |
| | | | | | | | | | | | | |
| Total | | $ | 1,931,172 | | | $ | 1,662,370 | | | $ | 268,802 | | | $ | — | |
| | | | | | | | | | | | | |
Liabilities: | | | | | | | | | | | | | | | | |
| Other Financial Instruments * | | $ | 86 | | | $ | — | | | $ | 86 | | | $ | — | |
| | | | | | | | | | | | | |
| | |
| ‡ | | The Fund has all or primarily all of these equity securities categorized in a single level. Refer to the Schedule of Investments for further industry breakout. |
| |
| * | | Other financial instruments are derivative instruments not reflected in the Schedule of Investments, such as futures, forwards and swap contracts, which are valued at the unrealized appreciation/depreciation on the investment. |
Following is a reconciliation of Level 3 assets for which significant unobservable inputs were used to determine fair value:
| | | | | | | | | | | | | | | | | |
| | | Balance as of | | Change in | | | | | | Balance as of |
| | | October 31, | | Unrealized | | | | | | October 31, |
| | | 2008 | | Appreciation | | Net Sales | | 2009 |
| | | |
Assets: | | | | | | | | | | | | | | | | |
| Common Stock | | $ | — | | | $ | 318 | * | | $ | (318 | ) | | $ | — | |
| | | |
| Total | | $ | — | | | $ | 318 | | | $ | (318 | ) | | $ | — | |
| | | |
| | |
| * | | Change in unrealized gains or losses in the current period relating to assets still held at October 31, 2009 was $—. |
The accompanying notes are an integral part of these financial statements.
6
The Hartford Growth Opportunities Fund
Statement of Assets and Liabilities
October 31, 2009
(000’s Omitted)
| | | | | |
Assets: | | | | |
| Investments in securities, at market value (cost $1,765,392) | | $ | 1,931,172 | |
| Cash | | | 1 | |
| Receivables: | | | | |
| Investment securities sold | | | 37,988 | |
| Fund shares sold | | | 6,329 | |
| Dividends and interest | | | 1,695 | |
| Other assets | | | 175 | |
| | | | |
| Total assets | | | 1,977,360 | |
| | | | |
Liabilities: | | | | |
| Unrealized depreciation on forward foreign currency contracts | | | 86 | |
| Payables: | | | | |
| Investment securities purchased | | | 22,008 | |
| Fund shares redeemed | | | 8,206 | |
| Investment management fees | | | 236 | |
| Distribution fees | | | 87 | |
| Accrued expenses | | | 600 | |
| | | | |
| Total liabilities | | | 31,223 | |
| | | | |
| Net assets | | $ | 1,946,137 | |
| | | | |
Summary of Net Assets: | | | | |
| Capital stock and paid-in-capital | | | 2,755,146 | |
| Accumulated undistributed net investment income | | | 1,323 | |
| Accumulated net realized loss on investments and foreign currency transactions | | | (976,143 | ) |
| Unrealized appreciation of investments and the translation of assets and liabilities denominated in foreign currency | | | 165,811 | |
| | | | |
| Net assets | | $ | 1,946,137 | |
| | | | |
| | | | | |
| Shares authorized | | | 23,750,000 | |
| | | | |
| Par value | | $ | 0.0001 | |
| | | | |
Class A: Net asset value per share/Maximum offering price per share | | $ | 20.69/$21.89 | |
| | | | |
| Shares outstanding | | | 36,097 | |
| | | | |
| Net assets | | $ | 746,980 | |
| | | | |
Class B: Net asset value per share | | $ | 16.77 | |
| | | | |
| Shares outstanding | | | 2,169 | |
| | | | |
| Net assets | | $ | 36,371 | |
| | | | |
Class C: Net asset value per share | | $ | 16.78 | |
| | | | |
| Shares outstanding | | | 10,355 | |
| | | | |
| Net assets | | $ | 173,788 | |
| | | | |
Class I: Net asset value per share | | $ | 20.91 | |
| | | | |
| Shares outstanding | | | 17,228 | |
| | | | |
| Net assets | | $ | 360,198 | |
| | | | |
Class L: Net asset value per share/Maximum offering price per share | | $ | 21.21/$22.27 | |
| | | | |
| Shares outstanding | | | 18,896 | |
| | | | |
| Net assets | | $ | 400,716 | |
| | | | |
Class R3: Net asset value per share | | $ | 21.17 | |
| | | | |
| Shares outstanding | | | 400 | |
| | | | |
| Net assets | | $ | 8,468 | |
| | | | |
Class R4: Net asset value per share | | $ | 21.37 | |
| | | | |
| Shares outstanding | | | 1,658 | |
| | | | |
| Net assets | | $ | 35,421 | |
| | | | |
Class R5: Net asset value per share | | $ | 21.52 | |
| | | | |
| Shares outstanding | | | 556 | |
| | | | |
| Net assets | | $ | 11,967 | |
| | | | |
Class Y: Net asset value per share | | $ | 21.59 | |
| | | | |
| Shares outstanding | | | 7,977 | |
| | | | |
| Net assets | | $ | 172,228 | |
| | | | |
The accompanying notes are an integral part of these financial statements.
7
The Hartford Growth Opportunities Fund
Statement of Operations
For the Year Ended October 31, 2009
(000’s Omitted)
| | | | | |
Investment Income: | | | | |
| Dividends | | $ | 24,312 | |
| Interest | | | 96 | |
| Securities lending | | | 155 | |
| Less: Foreign tax withheld | | | (492 | ) |
| | | | |
| Total investment income | | | 24,071 | |
| | | | |
| | | | | |
Expenses: | | | | |
| Investment management fees | | | 13,318 | |
| Administrative services fees | | | 59 | |
| Transfer agent fees | | | 4,789 | |
| Distribution fees | | | | |
| Class A | | | 2,265 | |
| Class B | | | 347 | |
| Class C | | | 1,747 | |
| Class L | | | 916 | |
| Class R3 | | | 34 | |
| Class R4 | | | 65 | |
| Custodian fees | | | 30 | |
| Accounting services fees | | | 222 | |
| Registration and filing fees | | | 287 | |
| Board of Directors’ fees | | | 50 | |
| Audit fees | | | 74 | |
| Other expenses | | | 826 | |
| | | | |
| Total expenses (before waivers and fees paid indirectly) | | | 25,029 | |
| Expense waivers | | | (1,142 | ) |
| Transfer agent fee waivers | | | (1,194 | ) |
| Commission recapture | | | (370 | ) |
| Custodian fee offset | | | — | |
| | | | |
| Total waivers and fees paid indirectly | | | (2,706 | ) |
| | | | |
| Total expenses, net | | | 22,323 | |
| | | | |
Net Investment Income | | | 1,748 | |
| | | | |
Net Realized Loss on Investments and Foreign Currency Transactions: | | | | |
| Net realized loss on investments in securities | | | (585,434 | ) |
| Net realized loss on forward foreign currency contracts | | | (33 | ) |
| Net realized gain on other foreign currency transactions | | | 148 | |
| | | | |
Net Realized Loss on Investments and Foreign Currency Transactions | | | (585,319 | ) |
| | | | |
Net Changes in Unrealized Appreciation of Investments and Foreign Currency Transactions: | | | | |
| Net unrealized appreciation of investments | | | 752,812 | |
| Net unrealized depreciation of forward foreign currency contracts | | | (152 | ) |
| Net unrealized appreciation on translation of other assets and liabilities in foreign currencies | | | 37 | |
| | | | |
Net Changes in Unrealized Appreciation of Investments and Foreign Currency Transactions | | | 752,697 | |
| | | | |
Net Gain on Investments and Foreign Currency Transactions | | | 167,378 | |
| | | | |
Net Increase in Net Assets Resulting from Operations | | $ | 169,126 | |
| | | | |
The accompanying notes are an integral part of these financial statements.
8
The Hartford Growth Opportunities Fund
Statement of Changes in Net Assets
(000’s Omitted)
| | | | | | | | | |
| | | For the | | | For the | |
| | | Year Ended | | | Year Ended | |
| | | October 31, 2009 | | | October 31, 2008 | |
Operations: | | | | | | | | |
| Net investment income (loss) | | $ | 1,748 | | | $ | (3,850 | ) |
| Net realized loss on investments and foreign currency transactions | | | (585,319 | ) | | | (390,240 | ) |
| Net unrealized appreciation (depreciation) of investments and foreign currency transactions | | | 752,697 | | | | (1,006,120 | ) |
| | | | | | | |
Net Increase (Decrease) In Net Assets Resulting From Operations | | | 169,126 | | | | (1,400,210 | ) |
| | | | | | | |
Distributions to Shareholders: | | �� | | | | | | |
| Class I | | | — | | | | (168 | ) |
| Class L | | | — | | | | (256 | ) |
| Class R4 | | | — | | | | (8 | ) |
| Class Y | | | — | | | | (318 | ) |
| From net realized gain on investments | | | | | | | | |
| Class A | | | — | | | | (115,157 | ) |
| Class B | | | — | | | | (7,805 | ) |
| Class C | | | — | | | | (28,975 | ) |
| Class I | | | — | | | | (5,017 | ) |
| Class L | | | — | | | | (88,662 | ) |
| Class R3 | | | — | | | | (36 | ) |
| Class R4 | | | — | | | | (448 | ) |
| Class R5 | | | — | | | | (10 | ) |
| Class Y | | | — | | | | (14,810 | ) |
| | | | | | | |
| Total distributions | | | — | | | | (261,670 | ) |
| | | | | | | |
Capital Share Transactions: | | | | | | | | |
| Class A | | | (460,639 | ) | | | 1,006,012 | |
| Class B | | | (5,031 | ) | | | 19,965 | |
| Class C | | | (41,773 | ) | | | 179,724 | |
| Class I | | | 217,341 | | | | 153,306 | |
| Class L | | | (37,045 | ) | | | 29,100 | |
| Class R3 | | | 2,114 | | | | 7,952 | |
| Class R4 | | | 12,092 | | | | 26,514 | |
| Class R5 | | | 7,524 | | | | 4,678 | |
| Class Y | | | 19,806 | | | | 77,306 | |
| | | | | | | |
| Net increase (decrease) from capital share transactions | | | (285,611 | ) | | | 1,504,557 | |
| | | | | | | |
Net Decrease In Net Assets | | | (116,485 | ) | | | (157,323 | ) |
Net Assets: | | | | | | | | |
| Beginning of period | | | 2,062,622 | | | | 2,219,945 | |
| | | | | | | |
| End of period | | $ | 1,946,137 | | | $ | 2,062,622 | |
| | | | | | | |
| Accumulated undistributed (distribution in excess of) net investment income (loss) | | $ | 1,323 | | | $ | (66 | ) |
| | | | | | | |
The accompanying notes are an integral part of these financial statements.
9
The Hartford Growth Opportunities Fund
Notes to Financial Statements
October 31, 2009
(000’s Omitted)
| 1. | | Organization: |
| |
| | | The Hartford Mutual Funds II, Inc. (“Company”) is an open-end management investment company comprised of six portfolios. Financial statements for The Hartford Growth Opportunities Fund (the “Fund”), a series of the Company, are included in this report. |
| |
| | | The Company is organized under the laws of the State of Maryland and is registered with the Securities and Exchange Commission (“SEC”) under the Investment Company Act of 1940, as amended (“1940 Act”). The Fund is a diversified open-end management investment company. |
| |
| | | Class A shares are sold with a front-end sales charge of up to 5.50%. Class B shares were sold with a contingent deferred sales charge which is assessed on the lesser of the per share net asset value (“NAV”) of the shares at the time of redemption or the original purchase price, and declines from up to 5.00% to zero depending on the period of time the shares are held (See note below regarding the closing of Class B shares). Class C shares are sold with a contingent deferred sales charge of up to 1.00% on shares redeemed within twelve months of purchase. Class I shares are sold without sales charges to certain eligible investors through advisory fee-based wrap programs. Class L shares are sold with a sales charge of up to 4.75%. Classes R3, R4, R5 shares, which are offered to employer-sponsored retirement plans, and Class Y shares, which are sold to certain eligible institutional investors, are sold without a sales charge. All classes of shares have identical voting, redemption, dividend, liquidation and other rights and the same terms and conditions, with the exceptions that each class may have different expenses, which may affect performance, and that Class B shares automatically convert to Class A shares after 8 years. |
| |
| | | Effective September 30, 2009, no new or additional investments are allowed in Class B shares of The Hartford Mutual Funds (including investments through any systematic investment plan). After September 30, 2009, existing shareholders of Class B shares may continue to hold their Class B shares, exchange their Class B shares for Class B shares of another Hartford Mutual Fund (as permitted by existing exchange privileges), or redeem their Class B shares as described in the Fund’s prospectus. Reinstatement privileges with respect to Class B shares will continue under the current policy. For investors electing to reinvest capital gains and dividends, any such capital gains or dividends on Class B shares will continue to be reinvested in Class B shares of the Fund. For Class B shares outstanding as of September 30, 2009, all Class B share attributes, including the 12b-1 fee, contingent deferred sales charge schedule, and conversion to Class A shares remain unchanged. |
| |
| 2. | | Significant Accounting Policies: |
| |
| | | The following is a summary of significant accounting policies of the Fund, which are in accordance with U.S. Generally Accepted Accounting Principles (“GAAP”). |
| | a) | | Security Transactions and Investment Income — Security transactions are recorded on the trade date (the date the order to buy or sell is executed). Security gains and losses are determined on the basis of identified cost. |
| |
| | | | Dividend income is accrued as of the ex-dividend date, except that certain dividends for foreign securities where the ex-dividend date may have passed are recorded as soon as the Fund is informed of the dividend in the exercise of reasonable diligence. Interest income, including amortization of premium and accretion of discounts, is accrued on a daily basis. |
| |
| | b) | | Security Valuation — The Fund generally uses market prices in valuing portfolio securities. If market prices are not readily available or are deemed unreliable, the Fund will use the fair value of the security as determined in good faith under policies and procedures established by and under the supervision of the Fund’s Board of Directors. Market prices may be deemed unreliable, for example, if a security is thinly traded or if an event has occurred after the close of the security’s primary market, but before the close of the New York Stock Exchange (the “Exchange”) (generally 4:00 p.m. Eastern Time, referred to as the “Valuation Time”) that is expected to affect the value of the portfolio security. The |
10
| | | | circumstances in which the Fund may use fair value pricing include, among others: (i) the occurrence of events that are significant to a particular issuer, such as mergers, restructuring or defaults; (ii) the occurrence of events that are significant to an entire market, such as natural disasters in a particular region or governmental actions; (iii) trading restrictions on securities; (iv) thinly traded securities and (v) market events such as trading halts and early market closings. In addition, with respect to the valuation of stocks primarily traded on foreign markets, the Fund uses a fair value pricing service approved by the Fund’s Board of Directors, which employs quantitative models that evaluate changes in the value of foreign market proxies (e.g., futures contracts, American Depositary Receipts, exchange traded funds (“ETF’s”)) after the close of the foreign markets but before the Valuation Time. Securities that are primarily traded on foreign markets may trade on days that are not business days of the Fund. The value of the foreign securities in which the Fund invests may change on days when a shareholder will not be able to purchase or redeem shares of the Fund. Fair value pricing is subjective in nature and the use of fair value pricing by the Fund may cause the NAV of its shares to differ significantly from the NAV that would have been calculated using market prices at the close of the exchange on which a portfolio security is primarily traded but before the close of the Exchange. There can be no assurance that the Fund could obtain the fair value assigned to a security if the Fund were to sell the security at approximately the time at which the Fund determines its NAV. |
| |
| | | | Exchange-traded equity securities are valued at the last reported sale price on the exchange or market on which the security is primarily traded (the “Primary Market”) at the Valuation Time. If the security did not trade on the Primary Market, it may be valued at the Valuation Time at the last reported sale price on another exchange where it trades. The value of an equity security not traded on any exchange but traded on the Nasdaq Stock Market, Inc. (“Nasdaq”) or another over-the-counter market shall be valued at the last reported sale price or official closing price on the exchange or market on which the security is traded as of the Valuation Time. |
| |
| | | | Foreign-denominated assets, including investment securities, and liabilities are translated from the local currency into U.S. dollars using exchange rates obtained from an independent third party as of the Fund’s Valuation Time. |
| |
| | | | Financial instruments for which prices are not available from an independent pricing service are valued using market quotations obtained from one or more dealers that make markets in securities in accordance with procedures established by the Fund’s Board of Directors. |
| |
| | | | Forward foreign currency contracts represent agreements to exchange currencies on specific future dates at predetermined rates. Forward foreign currency contracts are valued using foreign currency exchange rates and forward rates on the Valuation Date from an independent pricing service. |
| |
| | | | Other derivative or contractual type instruments shall be valued using market prices if such instruments trade on an exchange or market. If such instruments do not trade on an exchange or market, such instruments shall be valued at a price at which the counterparty to such contract would repurchase the instrument. In the event that the counterparty cannot provide a price, such valuation may be determined in accordance with procedures established by the Fund’s Board of Directors. |
| |
| | | | Various inputs are used in determining the value of the Fund’s investment. These inputs are summarized into three broad hierarchy levels. This hierarchy is based on whether the valuation inputs are observable or unobservable. These levels are: |
| | • | | Level 1 — Quoted prices in active markets for identical securities. Level 1 may include exchange-traded instruments such as domestic equities, some foreign equities, options, futures, mutual funds, ETF’s, and rights and warrants. |
| |
| | • | | Level 2 — Observable inputs other than Level 1 prices, such as quoted prices for similar securities; quoted prices in markets that are not active; or other inputs that are observable or can be corroborated by observable market data for substantially the full term of the security. Level 2 may include debt securities that are traded less frequently than exchange-traded instruments and that are valued using third party pricing services, foreign |
11
The Hartford Growth Opportunities Fund
Notes to Financial Statements — (continued)
October 31, 2009
(000’s Omitted)
| | | | equities, whose value is determined using a multi-factor regression model with inputs that are observable in the market; and money market instruments, which are carried at amortized cost. |
| |
| | • | | Level 3 — Significant unobservable inputs that are supported by little or no market activity. Level 3 includes financial instruments whose values are determined using broker quotes or require significant management judgment or estimation. This category may include broker quoted securities and securities where trading has been halted or there are certain restrictions on trading. While these securities are priced using unobservable inputs, the valuation of these securities reflects the best available data and management believes the prices are a reasonable representation of exit price. |
| | | | Individual securities within any of the above mentioned asset classes may be assigned a different hierarchical level than those presented above, as individual circumstances dictate. |
| |
| | | | For purposes of the roll forward reconciliation for all Level 3 securities from the beginning of the reporting period to the end of the reporting period, transfers in and transfers out are shown at the beginning of the period fair value. |
| |
| | | | Refer to the Investment Valuation Hierarchy Level Summary and the Level 3 roll forward reconciliation found following the Schedule of Investments. |
| |
| | c) | | Foreign Currency Transactions — Assets and liabilities denominated in currencies other than U.S. dollars are translated into U.S. dollars at the exchange rates in effect on the valuation date. Purchases and sales of investment securities and income and expenses are translated into U.S. dollars at the exchange rates on the dates of such transactions. |
| |
| | | | The Fund does not isolate that portion of portfolio security valuation resulting from fluctuations in the foreign currency exchange rates from the fluctuations arising from changes in the market prices of securities held. Exchange rate fluctuations are included with the net realized and unrealized gain or loss on investments in the accompanying financial statements. |
| |
| | | | Net realized foreign exchange gains or losses arise from sales of foreign currencies and the difference between asset and liability amounts initially stated in foreign currencies and the U.S. dollar value of the amounts actually received or paid. Net unrealized foreign exchange gains or losses arise from changes in the value of other assets and liabilities at the end of the reporting period, resulting from changes in the exchange rates. |
| |
| | d) | | Joint Trading Account — Pursuant to an exemptive order issued by the SEC, the Fund may transfer uninvested cash balances into a joint trading account managed by Wellington Management Company, LLP (“Wellington”). These balances may be invested in one or more repurchase agreements and/or short-term money market instruments. |
| |
| | e) | | Repurchase Agreements — A repurchase agreement is an agreement by which the seller of a security agrees to repurchase the security sold at a mutually agreed upon time and price. At the time the Fund enters into a repurchase agreement, the value of the underlying collateral security(ies), including accrued interest, will be equal to or exceed the value of the repurchase agreement. To minimize counterparty risk, the securities that serve to collateralize the repurchase agreement are held by the Fund’s custodian in book entry or physical form in the custodial account of the Fund or in a third party custodial account. Repurchase agreements are valued at cost plus accrued interest. The Fund, as shown on the Schedule of Investments, had outstanding repurchase agreements as of October 31, 2009. |
| |
| | f) | | Securities Lending — The Fund may lend its securities to certain qualified brokers who pay the Fund negotiated lender fees. The loans are fully collateralized at all times with cash and/or U.S. Government Securities and/or repurchase agreements. The cash collateral is then invested in short-term money market instruments. The repurchase agreements are fully collateralized by U.S. Government Securities. The adequacy of the collateral for securities on loan is monitored on a daily basis. For instances where the market value of collateral falls below the market value of the securities out on loan, such collateral is supplemented on the following business day. |
12
| | | | While securities are on loan, the Fund is subject to the following risks: 1) that the borrower may default on the loan and that the collateral could be inadequate in the event the borrower defaults, 2) that the earnings on the collateral invested may not be sufficient to pay fees incurred in connection with the loan, 3) that the principal value of the collateral invested may decline and may not be sufficient to pay back the borrower for the amount of the collateral posted, 4) that the borrower may use the loaned securities to cover a short sale which may place downward pressure on the market prices of the loaned securities, 5) that return of loaned securities could be delayed and could interfere with portfolio management decisions and 6) that any efforts to recall the securities for purposes of voting a proxy may not be effective. The Fund had no securities out on loan as of October 31, 2009. |
| | g) | | Forward Foreign Currency Contracts — The Fund may enter into forward foreign currency contracts that obligate the Fund to purchase or sell currencies at specified future dates. Forward foreign currency contracts may be used to hedge against adverse fluctuations in exchange rates between currencies. |
| |
| | | | Forward foreign currency contracts involve elements of market risk in excess of the amount reflected in the Statement of Assets and Liabilities. In addition, risks may arise upon entering into these contracts from the potential inability of the counterparties to meet the terms of the contracts and from unanticipated movements in the value of the foreign currencies relative to the U.S. dollar. The Fund had outstanding forward foreign currency contracts as shown on the Schedule of Investments as of October 31, 2009. |
| |
| | h) | | Indexed Securities — The Fund may invest in indexed securities whose values are linked to changes in interest rates, indices, or other underlying instruments. The Fund may use these securities to increase or decrease its exposure to different underlying instruments and to gain exposure to markets that might be difficult to invest in using conventional securities. Indexed securities may be more volatile than their underlying instruments, but any loss is limited to the amount of the original investment and there may be a limit to the potential appreciation of the investment. The Fund had no investments in indexed securities as of October 31, 2009. |
| |
| | i) | | Fund Share Valuation and Dividend Distributions to Shareholders — Orders for the Fund’s shares are executed in accordance with the investment instructions of the shareholders. The NAV of the Fund’s shares is determined as of the close of each business day of the Exchange. The NAV is determined separately for each class of the Fund by dividing the Fund’s net assets attributable to that class by the number of shares of the class outstanding. Orders for the purchase of the Fund’s shares prior to the close of the Exchange on any day on which the Exchange is open for business are priced at the NAV determined as of the close of the Exchange. Orders after the close of the Exchange, or on a day on which the Exchange and/or the Fund is not open for business, are priced at the next determined NAV. |
| |
| | | | The Fund intends to distribute substantially all of its net investment income and net realized capital gains to shareholders no less frequently than once a year. Normally, dividends from net investment income of the Fund are declared and paid annually. Unless shareholders specify otherwise, all dividends will be automatically reinvested in additional full or fractional shares of the Fund. |
| |
| | | | Distributions from net investment income, realized capital gains and capital are determined in accordance with federal income tax regulations, which may differ from U.S. GAAP with respect to character and timing. These differences may include but are not limited to losses deferred due to wash sale adjustments, foreign currency gains and losses, adjustments related to Passive Foreign Investment Companies (“PFICs”), Real Estate Investment Trusts (“REITs”), Regulated Investment Companies (“RICs”), certain derivatives and partnerships. Permanent book and federal income tax basis differences relating to shareholder distributions will result in reclassifications to certain of the Fund’s capital accounts (see Federal Income Taxes: Reclassification of Capital Accounts footnote). |
| |
| | j) | | Illiquid and Restricted Securities — The Fund is permitted to invest up to 15% of its net assets in illiquid securities. “Illiquid Securities” are those that may not be sold or disposed of in the ordinary course of business within seven days, at approximately the price used to determine the Fund’s NAV. The Fund may not be able to sell illiquid securities or other investments when its sub-adviser considers it desirable to do so or may have to sell such securities or investments at a price that is lower than the price that could be obtained if the securities or investments were more liquid. A sale of |
13
The Hartford Growth Opportunities Fund
Notes to Financial Statements — (continued)
October 31, 2009
(000’s Omitted)
| | | | illiquid securities or other investments may require more time and may result in higher dealer discounts and other selling expenses than does the sale of those that are liquid. Illiquid securities and investments also may be more difficult to value, due to the unavailability of reliable market quotations for such securities or investments, and an investment in them may have an adverse impact on the Fund’s NAV. The Fund may also purchase certain restricted securities, commonly known as Rule 144A securities, that can be resold to institutions and which may be determined to be liquid pursuant to policies and guidelines established by the Fund’s Board of Directors. The Fund had no illiquid or restricted securities as of October 31, 2009. |
| |
| | k) | | Use of Estimates — The preparation of financial statements in conformity with U.S. GAAP requires management to make estimates and assumptions that affect the reported amounts of assets and liabilities as of the date of the financial statements and the reported amounts of income and expenses during the period. Operating results in the future could vary from the amounts derived from management’s estimates. |
| |
| | l) | | Additional Derivative Instrument(s) Information |
| |
| | | | Derivative Instrument(s) as of October 31, 2009. |
| | | | | | | | |
| | | Asset Derivatives | | Liability Derivatives |
| Risk Exposure Category | | Statement of Assets and Liabilities Location | | Statement of Assets and Liabilities Location |
| Foreign exchange contracts | | | | Unrealized depreciation on forward
foreign currency contracts | | $ | 86 |
| | | | The volume of derivatives that is presented in the Schedule of Investments is consistent with the derivative activity during the year ended October 31, 2009. |
| |
| | | | Realized Gain/Loss and Change in Unrealized Appreciation (Depreciation) on Derivative Instruments for the year ended October 31, 2009: |
| | | | | | | | | | | | | | | | | | | | | | | | | |
| Amount of Realized Gain or (Loss) on Derivatives Recognized in Income | |
| | | | | | | | | | | | | | | Forward | | | | | | | |
| | | | | | | Purchased | | | | | | | Currency | | | | | | | |
| Risk Exposure Category | | Written Options | | | Options | | | Futures | | | Contracts | | | Swaps | | | Total | |
| Foreign exchange contracts | | $ | — | | | $ | — | | | $ | — | | | $ | (33 | ) | | $ | — | | | $ | (33 | ) |
| | | | | | | | | | | | | | | | | | | |
| Total | | $ | — | | | $ | — | | | $ | — | | | $ | (33 | ) | | $ | — | | | $ | (33 | ) |
| | | | | | | | | | | | | | | | | | | |
| | | | | | | | | | | | | | | | | | | | | | | | | |
| Change in Unrealized Appreciation or (Depreciation) on Derivatives Recognized in Income | |
| | | | | | | | | | | | | | | Forward | | | | | | | |
| | | | | | | Purchased | | | | | | | Currency | | | | | | | |
| Risk Exposure Category | | Written Options | | | Options | | | Futures | | | Contracts | | | Swaps | | | Total | |
| Foreign exchange contracts | | | — | | | | — | | | | — | | | | (152 | ) | | | — | | | $ | (152 | ) |
| | | | | | | | | | | | | | | | | | | |
| Total | | $ | — | | | $ | — | | | $ | — | | | $ | (152 | ) | | $ | — | | | $ | (152 | ) |
| | | | | | | | | | | | | | | | | | | |
| | m) | | Indemnifications — Under the Company’s organizational documents, the Company shall indemnify its officers and directors to the full extent required or permitted under Maryland General Corporation Law and the federal securities law. In addition, the Company, on behalf of the Fund, may enter into contracts that contain a variety of indemnifications. The Company’s maximum exposure under these arrangements is unknown. However, the Company has not had prior claims or losses pursuant to these contracts and expects the risk of loss to be remote. |
| | a) | | Federal Income Taxes — For federal income tax purposes, the Fund intends to continue to qualify as a RIC under Subchapter M of the Internal Revenue Code (“IRC”) by distributing substantially all of its taxable net investment income and net realized capital gains to its shareholders and otherwise complying with the requirements of regulated investment |
14
| | | | companies. The Fund has distributed substantially all of its income and capital gains in prior years and intends to distribute substantially all of its income and capital gains during the calendar year ending December 31, 2009. Accordingly, no provision for federal income or excise taxes has been made in the accompanying financial statements. Distributions from short-term capital gains are treated as ordinary income distributions for federal income tax purposes. |
| |
| | b) | | Net Investment Income (Loss), Realized Gains and (Losses) — Net investment income (loss) and net realized gains (losses) may differ for financial statement and tax purposes primarily because of losses deferred due to wash sale adjustments, foreign currency gains and losses, adjustments related to PFICs, REITs, RICs, certain derivatives and partnerships. The character of distributions made during the year from net investment income or realized gains may differ from their ultimate characterization for federal income tax purposes. Also, due to the timing of dividend distributions, the fiscal year in which amounts are distributed may differ from the year that the income or realized gains (losses) were recorded by the Fund. |
| |
| | c) | | Distributions and Components of Distributable Earnings — The tax character of distributions paid by the Fund for the periods indicated is as follows (as adjusted for dividends payable): |
| | | | | | | | | |
| | | For the Year Ended | | For the Year Ended |
| | | October 31, 2009 | | October 31, 2008 |
| Ordinary Income | | $ | — | | | $ | 161,438 | |
| Long-Term Capital Gains * | | | — | | | | 100,232 | |
| | |
| * | | The Fund designates these distributions as long-term capital gain dividends pursuant to IRC code Sec. 852(b)(3)(C). |
| | | | As of October 31, 2009, the Fund’s components of distributable earnings (deficit) on a tax basis were as follows: |
| | | | | |
| | | Amount | |
| Undistributed Ordinary Income | | $ | 1,265 | |
| Accumulated Capital Losses * | | | (963,530 | ) |
| Unrealized Appreciation † | | | 153,256 | |
| | | | |
| Total Accumulated Deficit | | $ | (809,009 | ) |
| | | | |
| | |
| * | | The Fund has capital loss carryforwards that are identified in the Capital Loss Carryforward note that follows. |
| |
| † | | The differences between book-basis and tax-basis unrealized appreciation (depreciation) may be attributable to the losses deferred due to wash sale adjustments, foreign currency gains and losses, adjustments related to PFICs, REITs, RICs, certain derivatives and partnerships. |
| | d) | | Reclassification of Capital Accounts — The Fund may record reclassifications in its capital accounts. These reclassifications have no impact on the total net assets of the Fund. The reclassifications are a result of permanent differences between GAAP and tax accounting for such items as net operating losses that reduce distribution requirements. Adjustments are made to reflect the impact these items have on current and future distributions to shareholders. Therefore, the source of the Fund’s distributions may be shown in the accompanying Statement of Changes in Net Assets as from net investment income, from net realized gains on investments or from capital depending on the type of book and tax differences that exist. For the year ended October 31, 2009, the Fund recorded reclassifications to decrease accumulated undistributed net investment income by $359, increase accumulated net realized gain on investments by $186, and increase paid-in-capital by $173. |
15
The Hartford Growth Opportunities Fund
Notes to Financial Statements — (continued)
October 31, 2009
(000’s Omitted)
| | e) | | Capital Loss Carryforward — At October 31, 2009 (tax-year-end), the Fund had capital loss carryforwards for U.S. federal income tax purposes of approximately: |
| | | | | |
| Year of Expiration | | Amount | |
| 2016 | | $ | 333,785 | |
| 2017 | | | 629,745 | |
| | | | |
Total | | $ | 963,530 | |
| | | | |
| | f) | | Accounting for Uncertainty in Income Taxes — Management has evaluated all open tax years and has determined there is no impact to the Fund’s financial statements related to uncertain tax positions. Generally, tax authorities can examine all tax returns filed for the last three years. |
| | a) | | Investment Management Agreement — Hartford Investment Financial Services, LLC (“HIFSCO”) serves as investment manager to the Fund pursuant to an Investment Management Agreement with the Company. As investment manager, HIFSCO has overall investment supervisory responsibility for the Fund. In addition, HIFSCO provides administrative personnel, services, equipment, facilities and office space for proper operation of the Fund. HIFSCO has contracted with Wellington for the provision of day-to-day investment management services to the Fund in accordance with the Fund’s investment objective and policies. The Fund pays a fee to HIFSCO, a portion of which may be used to compensate Wellington. |
| |
| | | | The schedule below reflects the rates of compensation paid to HIFSCO for investment management services rendered during the year ended October 31, 2009; the rates are accrued daily and paid monthly: |
| | | | | |
| Average Daily Net Assets | | Annual Fee |
| On first $100 million | | | 0.9000 | % |
| On next $150 million | | | 0.8000 | % |
| On next $4.75 billion | | | 0.7000 | % |
| On next $5 billion | | | 0.6975 | % |
| Over $10 billion | | | 0.6950 | % |
| | b) | | Accounting Services Agreement — Pursuant to the Fund Accounting Agreement between Hartford Life Insurance Company (“HLIC”) and the Fund, HLIC provides accounting services to the Fund and receives monthly compensation on the Fund’s average net assets. The Fund’s accounting services fees are accrued daily and paid monthly. |
| | | | | |
| Average Daily Net Assets | | Annual Fee |
| On first $5 billion | | | 0.012 | % |
| Over $5 billion | | | 0.010 | % |
| | c) | | Operating Expenses — Allocable expenses incurred by the Company are allocated to each Fund and allocated to classes within the Fund in proportion to the average daily net assets of the Fund and each class, except where allocation of certain expenses is more fairly made directly to the Fund or to specific classes within a Fund. During the year ended October 31, 2009, HIFSCO has contractually limited the total operating expenses of this Fund, exclusive of taxes, interest expense, brokerage commissions, certain distribution expenses and extraordinary expenses as follows: |
| | | | | | | | | | | | | | | | | |
| Class A | | Class B | | Class C | | Class I | | Class L | | Class R3 | | Class R4 | | Class R5 | | Class Y |
| 1.36% | | 2.11% | | 2.11% | | 1.11% | | 1.45% | | 1.61% | | 1.31% | | 1.01% | | 0.80% |
| | d) | | Fees Paid Indirectly — The Fund has entered into agreements with State Street Global Markets, LLC and Russell Implementation Services Inc. to partially recapture non-discounted trade commissions. Such rebates are used to pay a |
16
| | | | portion of the Fund’s expenses. In addition, the Fund’s custodian bank has also agreed to reduce its fees when the Fund maintains cash on deposit in a non-interest-bearing custody account. For the year ended October 31, 2009, these amounts are included in the Statement of Operations. |
| |
| | | | The ratio of expenses to average net assets in the accompanying financial highlights excludes the reduction in expenses related to fees paid indirectly. Had the fees paid indirectly been included, the annualized expense ratio for the periods listed below would have been as follows: |
| | | | | | | | | | | | | | | | | | | | | |
| | | Year Ended | | Year Ended | | Year Ended | | Year Ended | | Year Ended |
| | | October 31, | | October 31, | | October 31, | | October 31, | | October 31, |
| | | 2009 | | 2008 | | 2007 | | 2006 | | 2005 |
| Class A Shares | | | 1.22 | % | | | 1.30 | % | | | 1.31 | % | | | 1.18 | % | | | 1.30 | % |
| Class B Shares | | | 1.82 | | | | 2.05 | | | | 2.10 | | | | 2.05 | | | | 2.08 | |
| Class C Shares | | | 2.02 | | | | 1.92 | | | | 1.97 | | | | 2.05 | | | | 2.07 | |
| Class I Shares | | | 0.97 | | | | 0.85 | | | | 0.86 | | | | 1.11 | * | | | | |
| Class L Shares | | | 1.02 | | | | 1.00 | | | | 1.03 | | | | 1.04 | | | | 1.02 | |
| Class R3 Shares | | | 1.53 | | | | 1.51 | | | | 1.57 | † | | | | | | | | |
| Class R4 Shares | | | 1.18 | | | | 1.18 | | | | 1.23 | † | | | | | | | | |
| Class R5 Shares | | | 0.89 | | | | 0.93 | | | | 0.92 | † | | | | | | | | |
| Class Y Shares | | | 0.78 | | | | 0.77 | | | | 0.79 | | | | 0.81 | | | | 0.82 | |
| | |
| * | | From August 31, 2006 (commencement of operations), through October 31, 2006. |
| |
| † | | From December 22, 2006 (commencement of operations), through October 31, 2007. |
| | e) | | Distribution and Service Plan for Class A, B, C, L, R3 and R4 Shares — HIFSCO is the principal underwriter and distributor of the Fund. HIFSCO is engaged in distribution activities, which include marketing and distribution of shares through broker-dealers, financing distribution costs and maintaining financial books and records. For the year ended October 31, 2009, HIFSCO received front-end load sales charges of $1,297 and contingent deferred sales charges of $212 from the Fund. |
| |
| | | | The Fund has adopted a Distribution and Service Plan in accordance with Rule 12b-1 of the Investment Company Act of 1940, as amended, to compensate the distributor (HIFSCO) for activities intended to result in the sale and distribution of Classes A, B, C, L, R3 and R4 shares and for providing services for shareholders. The Rule 12b-1 plan applicable to Class A shares of the Fund provides for payment of a Rule 12b-1 fee of up to 0.35% of average daily net assets; however, the Board of Directors has currently authorized 12b-1 payments of up to 0.25%. Some or all of the fee may be used for shareholder servicing expenses with the remainder used for distribution expenses. Some or the entire Rule 12b-1 fee for Class B shares may be remitted to broker-dealers for distribution and/or shareholder account services. Under the Class B Plan, the Fund pays the distributor 1.00% of the average daily net assets of Class B shares that are outstanding for 8 years or less, 0.25% of which is a fee for services provided to existing shareholders with the remainder used for distribution expenses. After eight years, Class B shares convert to Class A shares. Upon conversion to Class A shares, the Class A plan described above will apply to those shares. Under the Class C Plan, the Fund pays the Distributor 1.00% of the average daily net assets of Class C shares outstanding, 0.25% of which is intended as a fee for services provided to existing shareholders with the remainder used for distribution expenses. For Class C shares, some or the entire fee may be remitted to broker-dealers for distribution and/or shareholder account services. Class L has a distribution fee of 0.25%. Class R3 shares have a distribution fee of 0.50% and Class R4 shares have a distribution fee of 0.25%. For Classes R3 and R4 shares, some or the entire fee may be remitted to broker dealers for distribution and/or shareholder account services. The Fund’s 12b-1 fees are accrued daily and paid monthly. |
| |
| | | | For the year ended October 31, 2009, total sales commissions paid to affiliated brokers/dealers of The Hartford for distributing the Fund’s shares were $165. These commissions are in turn paid to sales representatives of the broker/dealers. |
17
The Hartford Growth Opportunities Fund
Notes to Financial Statements — (continued)
October 31, 2009
(000’s Omitted)
| | f) | | Other Related Party Transactions — Certain officers of the Fund are directors and/or officers of HIFSCO and/or The Hartford or its subsidiaries. For the year ended October 31, 2009, a portion of the Fund’s chief compliance officer’s salary was paid by all the investment companies in the Hartford fund complex. The portion allocated to the Fund was in the amount of $5. Hartford Administrative Services Company (“HASCO”), an indirect wholly owned subsidiary of The Hartford, provides transfer agent services to the Fund. HASCO has contractually agreed to reimburse any portion of the transfer agency fees over 0.30% of average daily net assets per fiscal year for all classes. HASCO was compensated $3,701 for providing such services. These fees are accrued daily and paid monthly. |
| |
| | | | Administrative services fees are paid to HASCO for third-party recordkeeping services that are payable as a percentage of net assets in the amount of 0.20%, 0.15% and 0.10% for Classes R3, R4 and R5 shares, respectively. The total administrative services fees are shown on the Statement of Operations. These fees are accrued daily and paid monthly. |
| | g) | | Payments from Affiliate — The total return in the accompanying financial highlights includes payment from affiliates. Had the payment from affiliates been excluded, the total return for the periods listed below would have been as follows: |
| | | | | | | | | |
| | | Impact from | | Total Return |
| | | Payment from | | Excluding |
| | | Affiliate for SEC | | Payment from |
| | | Settlement for the | | Affiliate for the |
| | | Year Ended | | Year Ended |
| | | October 31, 2007 | | October 31, 2007 |
| Class A | | | 0.03 | % | | | 40.34 | % |
| Class B | | | 0.04 | | | | 39.24 | |
| Class C | | | 0.04 | | | | 39.35 | |
| Class I | | | 0.03 | | | | 40.84 | |
| Class L | | | 0.03 | | | | 40.72 | |
| Class Y | | | 0.03 | | | | 41.02 | |
| 5. | | Investment Transactions: |
| |
| | | For the year ended October 31, 2009, the Fund’s aggregate purchases and sales of investment securities (excluding short-term investments) were as follows: |
| | | | | |
| | | Amount |
| Cost of Purchases Excluding U.S. Government Obligations | | $ | 2,456,793 | |
| Sales Proceeds Excluding U.S. Government Obligations | | | 2,807,450 | |
18
| 6. | | Capital Share Transactions: |
| |
| | | The following information is for the year ended October 31, 2009 and the year ended October 31, 2008: |
| | | | | | | | | | | | | | | | | | | | | | | | | | | | | | | | | | | | | | | | | |
| | | For the Year Ended October 31, 2009 | | For the Year Ended October 31, 2008 |
| | | | | | | Shares | | | | | | Shares | | | | | | | | | | Shares | | | | | | Shares | | |
| | | | | | | Issued for | | | | | | Issued | | Net Increase | | | | | | Issued for | | | | | | Issued | | Net Increase |
| | | Shares | | Reinvested | | Shares | | from | | (Decrease) of | | | | | | Reinvested | | Shares | | from | | (Decrease) of |
| | | Sold | | Dividends | | Redeemed | | Merger | | Shares | | Shares Sold | | Dividends | | Redeemed | | Merger | | Shares |
| Class A | | | | | | | | | | | | | | | | | | | | | | | | | | | | | | | | | | | | | | | | |
| Shares | | | 22,375 | | | | — | | | | (47,862 | ) | | | — | | | | (25,487 | ) | | | 55,432 | | | | 2,211 | | | | (21,951 | ) | | | — | | | | 35,692 | |
| Amount | | $ | 389,494 | | | $ | — | | | $ | (850,133 | ) | | $ | — | | | $ | (460,639 | ) | | $ | 1,510,495 | | | $ | 70,296 | | | $ | (574,779 | ) | | $ | — | | | $ | 1,006,012 | |
| Class B | | | | | | | | | | | | | | | | | | | | | | | | | | | | | | | | | | | | | | | | |
| Shares | | | 299 | | | | — | | | | (648 | ) | | | — | | | | (349 | ) | | | 1,044 | | | | 268 | | | | (544 | ) | | | — | | | | 768 | |
| Amount | | $ | 4,216 | | | $ | — | | | $ | (9,247 | ) | | $ | — | | | $ | (5,031 | ) | | $ | 24,914 | | | $ | 6,998 | | | $ | (11,947 | ) | | $ | — | | | $ | 19,965 | |
| Class C | | | | | | | | | | | | | | | | | | | | | | | | | | | | | | | | | | | | | | | | |
| Shares | | | 2,604 | | | | — | | | | (5,477 | ) | | | — | | | | (2,873 | ) | | | 9,446 | | | | 731 | | | | (3,186 | ) | | | — | | | | 6,991 | |
| Amount | | $ | 37,010 | | | $ | — | | | $ | (78,783 | ) | | $ | — | | | $ | (41,773 | ) | | $ | 228,725 | | | $ | 19,107 | | | $ | (68,108 | ) | | $ | — | | | $ | 179,724 | |
| Class I | | | | | | | | | | | | | | | | | | | | | | | | | | | | | | | | | | | | | | | | |
| Shares | | | 16,997 | | | | — | | | | (6,116 | ) | | | — | | | | 10,881 | | | | 7,590 | | | | 140 | | | | (2,442 | ) | | | — | | | | 5,288 | |
| Amount | | $ | 328,781 | | | $ | — | | | $ | (111,440 | ) | | $ | — | | | $ | 217,341 | | | $ | 209,392 | | | $ | 4,469 | | | $ | (60,555 | ) | | $ | — | | | $ | 153,306 | |
| Class L | | | | | | | | | | | | | | | | | | | | | | | | | | | | | | | | | | | | | | | | |
| Shares | | | 372 | | | | — | | | | (2,423 | ) | | | — | | | | (2,051 | ) | | | 369 | | | | 2,666 | | | | (2,388 | ) | | | — | | | | 647 | |
| Amount | | $ | 6,754 | | | $ | — | | | $ | (43,799 | ) | | $ | — | | | $ | (37,045 | ) | | $ | 10,537 | | | $ | 86,483 | | | $ | (67,920 | ) | | $ | — | | | $ | 29,100 | |
| Class R3 | | | | | | | | | | | | | | | | | | | | | | | | | | | | | | | | | | | | | | | | |
| Shares | | | 272 | | | | — | | | | (154 | ) | | | — | | | | 118 | | | | 337 | | | | 1 | | | | (64 | ) | | | — | | | | 274 | |
| Amount | | $ | 4,932 | | | $ | — | | | $ | (2,818 | ) | | $ | — | | | $ | 2,114 | | | $ | 9,476 | | | $ | 36 | | | $ | (1,560 | ) | | $ | — | | | $ | 7,952 | |
| Class R4 | | | | | | | | | | | | | | | | | | | | | | | | | | | | | | | | | | | | | | | | |
| Shares | | | 838 | | | | — | | | | (177 | ) | | | — | | | | 661 | | | | 961 | | | | 14 | | | | (65 | ) | | | — | | | | 910 | |
| Amount | | $ | 15,433 | | | $ | — | | | $ | (3,341 | ) | | $ | — | | | $ | 12,092 | | | $ | 27,725 | | | $ | 457 | | | $ | (1,668 | ) | | $ | — | | | $ | 26,514 | |
| Class R5 | | | | | | | | | | | | | | | | | | | | | | | | | | | | | | | | | | | | | | | | |
| Shares | | | 466 | | | | — | | | | (74 | ) | | | — | | | | 392 | | | | 183 | | | | — | | | | (21 | ) | | | — | | | | 162 | |
| Amount | | $ | 8,977 | | | $ | — | | | $ | (1,453 | ) | | $ | — | | | $ | 7,524 | | | $ | 5,224 | | | $ | 11 | | | $ | (557 | ) | | $ | — | | | $ | 4,678 | |
| Class Y | | | | | | | | | | | | | | | | | | | | | | | | | | | | | | | | | | | | | | | | |
| Shares | | | 3,091 | | | | — | | | | (2,002 | ) | | | — | | | | 1,089 | | | | 3,868 | | | | 428 | | | | (910 | ) | | | — | | | | 3,386 | |
| Amount | | $ | 54,480 | | | $ | — | | | $ | (34,674 | ) | | $ | — | | | $ | 19,806 | | | $ | 91,223 | | | $ | 14,117 | | | $ | (28,034 | ) | | $ | — | | | $ | 77,306 | |
| | | The following reflects the conversion of Class B Shares into Class A Shares (reflected as Class A Shares issued) for the year ended October 31, 2009 and the year ended October 31, 2008: |
| | | | | | | | | |
| | | Shares | | Dollars |
| For the Year Ended October 31, 2009 | | | 29 | | | $ | 526 | |
| For the Year Ended October 31, 2008 | | | 35 | | | $ | 993 | |
| 7. | | Line of Credit: |
| |
| | | The Fund is one of several Hartford Funds that participate in a $500 million committed revolving line of credit facility. The facility is to be used for temporary or emergency purposes. Under the arrangement, the Fund is required to own securities having a market value in excess of 300% of the total bank borrowings. The interest rate on borrowings varies depending on the nature of the loan. The facility also requires a fee to be paid based on the amount of the commitment. This fee is allocated to all the Funds participating in the line of credit based on the average net assets of the Funds. During the year ended October 31, 2009, the Fund did not have any borrowings under this facility. |
19
The Hartford Growth Opportunities Fund
Notes to Financial Statements — (continued)
October 31, 2009
(000’s Omitted)
| 8. | | Industry Classifications: |
| |
| | | Other than the industry classifications “Other Investment Pools and Funds” and “Exchange Traded Funds”, equity industry classifications used in this report are the Global Industry Classification Standard, which was developed by and is the exclusive property and service mark of MSCI, Inc. and Standard & Poor’s. |
| 9. | | Subsequent Events: |
| |
| | | Management has evaluated subsequent events through December 15, 2009, the date of issuance of the Fund’s financial statements, and has determined that no additional items require disclosure. |
20
[This page is intentionally left blank]
21
The Hartford Growth Opportunities Fund
Financial Highlights
- Selected Per-Share Data (a) -
| | | | | | | | | | | | | | | | | | | | | | | | | | | | | | | | | | | | | | | | | | | | | |
| | | Net Asset | | | | | | | | | | Net Realized | | | | | | | | | | | | | | | | | | | | | | Net Increase | | |
| | | Value at | | | | | | | | | | and Unrealized | | Total from | | Dividends from | | Distributions | | | | | | | | | | (Decrease) in | | Net Asset |
| | | Beginning of | | Net Investment | | Payments from | | Gain (Loss) on | | Investment | | Net Investment | | from Realized | | Distributions | | Total | | Net Asset | | Value at End |
| Class | | Period | | Income (Loss) | | (to) Affiliate | | Investments | | Operations | | Income | | Capital Gains | | from Capital | | Distributions | | Value | | of Period |
| For the Year Ended October 31, 2009 | | | | | | | | | | | | | | | | | | | | | | | | | | | | | | | | | | | | |
| A | | $ | 18.60 | | | $ | 0.02 | | | $ | — | | | $ | 2.07 | | | $ | 2.09 | | | $ | — | | | $ | — | | | $ | — | | | $ | — | | | $ | 2.09 | | | $ | 20.69 | |
| B | | | 15.16 | | | | (0.09 | ) | | | — | | | | 1.70 | | | | 1.61 | | | | — | | | | — | | | | — | | | | — | | | | 1.61 | | | | 16.77 | |
| C | | | 15.21 | | | | (0.13 | ) | | | — | | | | 1.70 | | | | 1.57 | | | | — | | | | — | | | | — | | | | — | | | | 1.57 | | | | 16.78 | |
| I | | | 18.74 | | | | 0.02 | | | | — | | | | 2.15 | | | | 2.17 | | | | — | | | | — | | | | — | | | | — | | | | 2.17 | | | | 20.91 | |
| L | | | 19.02 | | | | 0.05 | | | | — | | | | 2.14 | | | | 2.19 | | | | — | | | | — | | | | — | | | | — | | | | 2.19 | | | | 21.21 | |
| R3 | | | 19.08 | | | | (0.04 | ) | | | — | | | | 2.13 | | | | 2.09 | | | | — | | | | — | | | | — | | | | — | | | | 2.09 | | | | 21.17 | |
| R4 | | | 19.19 | | | | 0.01 | | | | — | | | | 2.17 | | | | 2.18 | | | | — | | | | — | | | | — | | | | — | | | | 2.18 | | | | 21.37 | |
| R5 | | | 19.28 | | | | 0.02 | | | | — | | | | 2.22 | | | | 2.24 | | | | — | | | | — | | | | — | | | | — | | | | 2.24 | | | | 21.52 | |
| Y | | | 19.31 | | | | 0.10 | | | | — | | | | 2.18 | | | | 2.28 | | | | — | | | | — | | | | — | | | | — | | | | 2.28 | | | | 21.59 | |
| | | | | | | | | | | | | | | | | | | | | | | | | | | | | | | | | | | | | | | | | | | | | |
| For the Year Ended October 31, 2008 (e) | | | | | | | | | | | | | | | | | | | | | | | | | | | | | | | | | | | | |
| A | | | 38.24 | | | | (0.05 | ) | | | — | | | | (15.21 | ) | | | (15.26 | ) | | | — | | | | (4.38 | ) | | | — | | | | (4.38 | ) | | | (19.64 | ) | | | 18.60 | |
| B | | | 32.23 | | | | (0.22 | ) | | | — | | | | (12.47 | ) | | | (12.69 | ) | | | — | | | | (4.38 | ) | | | — | | | | (4.38 | ) | | | (17.07 | ) | | | 15.16 | |
| C | | | 32.27 | | | | (0.19 | ) | | | — | | | | (12.49 | ) | | | (12.68 | ) | | | — | | | | (4.38 | ) | | | — | | | | (4.38 | ) | | | (17.06 | ) | | | 15.21 | |
| I | | | 38.39 | | | | 0.07 | | | | — | | | | (15.25 | ) | | | (15.18 | ) | | | (0.09 | ) | | | (4.38 | ) | | | — | | | | (4.47 | ) | | | (19.65 | ) | | | 18.74 | |
| L | | | 38.91 | | | | 0.03 | | | | — | | | | (15.53 | ) | | | (15.50 | ) | | | (0.01 | ) | | | (4.38 | ) | | | — | | | | (4.39 | ) | | | (19.89 | ) | | | 19.02 | |
| R3 | | | 39.18 | | | | (0.11 | ) | | | — | | | | (15.61 | ) | | | (15.72 | ) | | | — | | | | (4.38 | ) | | | — | | | | (4.38 | ) | | | (20.10 | ) | | | 19.08 | |
| R4 | | | 39.33 | | | | (0.02 | ) | | | — | | | | (15.68 | ) | | | (15.70 | ) | | | (0.06 | ) | | | (4.38 | ) | | | — | | | | (4.44 | ) | | | (20.14 | ) | | | 19.19 | |
| R5 | | | 39.39 | | | | 0.06 | | | | — | | | | (15.72 | ) | | | (15.66 | ) | | | (0.07 | ) | | | (4.38 | ) | | | — | | | | (4.45 | ) | | | (20.11 | ) | | | 19.28 | |
| Y | | | 39.43 | | | | 0.10 | | | | — | | | | (15.76 | ) | | | (15.66 | ) | | | (0.08 | ) | | | (4.38 | ) | | | — | | | | (4.46 | ) | | | (20.12 | ) | | | 19.31 | |
| | | | | | | | | | | | | | | | | | | | | | | | | | | | | | | | | | | | | | | | | | | | | |
| For the Year Ended October 31, 2007 | | | | | | | | | | | | | | | | | | | | | | | | | | | | | | | | | | | | |
| A | | | 29.33 | | | | (0.03 | ) | | | 0.01 | | | | 11.05 | | | | 11.03 | | | | — | | | | (2.12 | ) | | | — | | | | (2.12 | ) | | | 8.91 | | | | 38.24 | |
| B | | | 25.23 | | | | (0.20 | ) | | | 0.01 | | | | 9.31 | | | | 9.12 | | | | — | | | | (2.12 | ) | | | — | | | | (2.12 | ) | | | 7.00 | | | | 32.23 | |
| C | | | 25.24 | | | | (0.10 | ) | | | — | | | | 9.25 | | | | 9.15 | | | | — | | | | (2.12 | ) | | | — | | | | (2.12 | ) | | | 7.03 | | | | 32.27 | |
| I | | | 29.34 | | | | 0.01 | | | | — | | | | 11.16 | | | | 11.17 | | | | — | | | | (2.12 | ) | | | — | | | | (2.12 | ) | | | 9.05 | | | | 38.39 | |
| L(g) | | | 29.73 | | | | 0.04 | | | | 0.01 | | | | 11.25 | | | | 11.30 | | | | — | | | | (2.12 | ) | | | — | | | | (2.12 | ) | | | 9.18 | | | | 38.91 | |
| R3(h) | | | 29.39 | | | | (0.08 | ) | | | — | | | | 9.87 | | | | 9.79 | | | | — | | | | — | | | | — | | | | — | | | | 9.79 | | | | 39.18 | |
| R4(h) | | | 29.39 | | | | (0.01 | ) | | | — | | | | 9.95 | | | | 9.94 | | | | — | | | | — | | | | — | | | | — | | | | 9.94 | | | | 39.33 | |
| R5(h) | | | 29.39 | | | | — | | | | — | | | | 10.00 | | | | 10.00 | | | | — | | | | — | | | | — | | | | — | | | | 10.00 | | | | 39.39 | |
| Y(g) | | | 30.04 | | | | 0.15 | | | | 0.01 | | | | 11.35 | | | | 11.51 | | | | — | | | | (2.12 | ) | | | — | | | | (2.12 | ) | | | 9.39 | | | | 39.43 | |
| | | | | | | | | | | | | | | | | | | | | | | | | | | | | | | | | | | | | | | | | | | | | |
| For the Year Ended October 31, 2006 | | | | | | | | | | | | | | | | | | | | | | | | | | | | | | | | | | | | |
| A | | | 27.84 | | | | (0.07 | ) | | | — | | | | 3.59 | | | | 3.52 | | | | — | | | | (2.03 | ) | | | — | | | | (2.03 | ) | | | 1.49 | | | | 29.33 | |
| B | | | 24.42 | | | | (0.25 | ) | | | — | | | | 3.09 | | | | 2.84 | | | | — | | | | (2.03 | ) | | | — | | | | (2.03 | ) | | | 0.81 | | | | 25.23 | |
| C | | | 24.42 | | | | (0.23 | ) | | | — | | | | 3.08 | | | | 2.85 | | | | — | | | | (2.03 | ) | | | — | | | | (2.03 | ) | | | 0.82 | | | | 25.24 | |
| I(k) | | | 27.95 | | | | (0.01 | ) | | | — | | | | 1.40 | | | | 1.39 | | | | — | | | | — | | | | — | | | | — | | | | 1.39 | | | | 29.34 | |
| L | | | 28.17 | | | | (0.06 | ) | | | — | | | | 3.65 | | | | 3.59 | | | | — | | | | (2.03 | ) | | | — | | | | (2.03 | ) | | | 1.56 | | | | 29.73 | |
| Y | | | 28.37 | | | | 0.02 | | | | — | | | | 3.68 | | | | 3.70 | | | | — | | | | (2.03 | ) | | | — | | | | (2.03 | ) | | | 1.67 | | | | 30.04 | |
| | | | | | | | | | | | | | | | | | | | | | | | | | | | | | | | | | | | | | | | | | | | | |
| For the Year Ended October 31, 2005 | | | | | | | | | | | | | | | | | | | | | | | | | | | | | | | | | | | | |
| A | | | 23.49 | | | | (0.06 | ) | | | — | | | | 4.41 | | | | 4.35 | | | | — | | | | — | | | | — | | | | — | | | | 4.35 | | | | 27.84 | |
| B | | | 20.77 | | | | (0.25 | ) | | | — | | | | 3.90 | | | | 3.65 | | | | — | | | | — | | | | — | | | | — | | | | 3.65 | | | | 24.42 | |
| C | | | 20.77 | | | | (0.25 | ) | | | — | | | | 3.90 | | | | 3.65 | | | | — | | | | — | | | | — | | | | — | | | | 3.65 | | | | 24.42 | |
| L | | | 23.71 | | | | (0.06 | ) | | | — | | | | 4.52 | | | | 4.46 | | | | — | | | | — | | | | — | | | | — | | | | 4.46 | | | | 28.17 | |
| Y | | | 23.82 | | | | — | | | | — | | | | 4.55 | | | | 4.55 | | | | — | | | | — | | | | — | | | | — | | | | 4.55 | | | | 28.37 | |
| | |
| (a) | | Information presented relates to a share outstanding throughout the indicated period. |
| |
| (b) | | Assumes initial investment at net asset value at the beginning of each period, reinvestment of all distributions, the complete redemption of the investment at net asset value at the end of each period and no sales charge. Total return would be reduced if sales charges were taken into account. |
| |
| (c) | | Ratios do not include fees paid indirectly (See Expenses in the accompanying Notes to Financial Statements). |
| |
| (d) | | Portfolio turnover rate is calculated on the basis of the Fund as a whole without distinguishing between the classes of shares issued. |
| |
| (e) | | Per share amounts have been calculated using average shares outstanding method. |
| |
| (f) | | Total return without the inclusion of the Payments from (to) Affiliate, can be found in Expenses in the accompanying Notes to Financial Statements. |
| |
| (g) | | Classes H, M and N were merged into Class L and Class Z was merged into Class Y on February 9, 2007. |
| |
| (h) | | Commenced operations on December 22, 2006. |
| |
| (i) | | Not annualized. |
| |
| (j) | | Annualized. |
| |
| (k) | | Commenced operations on August 31, 2006. |
22
- Ratios and Supplemental Data -
| | | | | | | | | | | | | | | | | | | | | | | | | |
| | | | | | | | | | | | | | | Ratio of Expenses to Average | | | | | | | | |
| | | | | | | Ratio of Expenses to Average | | Ratio of Expenses to Average | | Net Assets After Waivers and | | | | |
| | | | | | | Net Assets Before Waivers and | | Net Assets After Waivers and | | Reimbursements and | | Ratio of Net | | |
| | | Net Assets at End of | | Reimbursements and Including | | Reimbursements and Including | | Excluding Expenses not | | Investment Income to | | Portfolio |
| Total Return(b) | | Period (000’s) | | Expenses not Subject to Cap(c) | | Expenses not Subject to Cap(c) | | Subject to Cap(c) | | Average Net Assets | | Turnover Rate(d) |
| 11.24% | | $ | 746,980 | | | | 1.47 | % | | | 1.24 | % | | | 1.24 | % | | | 0.11 | % | | | 137 | % |
| 10.62 | | | 36,371 | | | | 2.36 | | | | 1.84 | | | | 1.84 | | | | (0.53 | ) | | | — | |
| 10.32 | | | 173,788 | | | | 2.04 | | | | 2.04 | | | | 2.04 | | | | (0.72 | ) | | | — | |
| 11.58 | | | 360,198 | | | | 0.99 | | | | 0.99 | | | | 0.99 | | | | 0.23 | | | | — | |
| 11.51 | | | 400,716 | | | | 1.05 | | | | 1.04 | | | | 1.04 | | | | 0.27 | | | | — | |
| 10.95 | | | 8,468 | | | �� | 1.55 | | | | 1.55 | | | | 1.55 | | | | (0.28 | ) | | | — | |
| 11.36 | | | 35,421 | | | | 1.21 | | | | 1.21 | | | | 1.21 | | | | 0.05 | | | | — | |
| 11.62 | | | 11,967 | | | | 0.92 | | | | 0.92 | | | | 0.92 | | | | 0.20 | | | | — | |
| 11.81 | | | 172,228 | | | | 0.80 | | | | 0.80 | | | | 0.80 | | | | 0.50 | | | | — | |
| | | | | | | | | | | | | | | | | | | | | | | | | |
| (44.66) | | | 1,145,281 | | | | 1.31 | | | | 1.31 | | | | 1.31 | | | | (0.19 | ) | | | 142 | |
| (45.07) | | | 38,167 | | | | 2.13 | | | | 2.05 | | | | 2.05 | | | | (0.93 | ) | | | — | |
| (44.97) | | | 201,128 | | | | 1.93 | | | | 1.93 | | | | 1.93 | | | | (0.81 | ) | | | — | |
| (44.35) | | | 118,918 | | | | 0.86 | | | | 0.86 | | | | 0.86 | | | | 0.25 | | | | — | |
| (44.50) | | | 398,391 | | | | 1.02 | | | | 1.01 | | | | 1.01 | | | | 0.11 | | | | — | |
| (44.77) | | | 5,391 | | | | 1.52 | | | | 1.52 | | | | 1.52 | | | | (0.39 | ) | | | — | |
| (44.60) | | | 19,129 | | | | 1.19 | | | | 1.19 | | | | 1.19 | | | | (0.08 | ) | | | — | |
| (44.41) | | | 3,169 | | | | 0.93 | | | | 0.93 | | | | 0.93 | | | | 0.22 | | | | — | |
| (44.38) | | | 133,048 | | | | 0.78 | | | | 0.78 | | | | 0.78 | | | | 0.34 | | | | — | |
| | | | | | | | | | | | | | | | | | | | | | | | | |
| 40.39 (f) | | | 989,969 | | | | 1.42 | | | | 1.31 | | | | 1.31 | | | | (0.12 | ) | | | 120 | |
| 39.29 (f) | | | 56,396 | | | | 2.18 | | | | 2.11 | | | | 2.11 | | | | (0.88 | ) | | | — | |
| 39.40 (f) | | | 201,274 | | | | 1.98 | | | | 1.98 | | | | 1.98 | | | | (0.82 | ) | | | — | |
| 40.89 (f) | | | 40,678 | | | | 0.86 | | | | 0.86 | | | | 0.86 | | | | 0.09 | | | | — | |
| 40.77 (f) | | | 789,757 | | | | 1.05 | | | | 1.04 | | | | 1.04 | | | | 0.12 | | | | — | |
| 33.31 (i) | | | 322 | | | | 1.58 | (j) | | | 1.58 | (j) | | | 1.58 | (j) | | | (0.69) | (j) | | | — | |
| 33.82 (i) | | | 3,402 | | | | 1.23 | (j) | | | 1.23 | (j) | | | 1.23 | (j) | | | (0.18) | (j) | | | — | |
| 34.03 (i) | | | 81 | | | | 0.92 | (j) | | | 0.92 | (j) | | | 0.92 | (j) | | | 0.01 | (j) | | | — | |
| 41.07 (f) | | | 138,065 | | | | 0.80 | | | | 0.80 | | | | 0.80 | | | | 0.53 | | | | — | |
| | | | | | | | | | | | | | | | | | | | | | | | | |
| 13.35 | | | 420,220 | | | | 1.60 | | | | 1.20 | | | | 1.20 | | | | (0.31 | ) | | | 131 | |
| 12.36 | | | 33,670 | | | | 2.26 | | | | 2.08 | | | | 2.08 | | | | (1.18 | ) | | | — | |
| 12.40 | | | 47,366 | | | | 2.09 | | | | 2.07 | | | | 2.07 | | | | (1.17 | ) | | | — | |
| 4.97 (i) | | | 74 | | | | 1.15 | (j) | | | 1.11 | (j) | | | 1.11 | (j) | | | (0.43) | (j) | | | — | |
| 13.45 | | | 570,541 | | | | 1.07 | | | | 1.07 | | | | 1.07 | | | | (0.18 | ) | | | — | |
| 13.76 | | | 73,685 | | | | 0.85 | | | | 0.83 | | | | 0.83 | | | | 0.08 | | | | — | |
| | | | | | | | | | | | | | | | | | | | | | | | | |
| 18.52 | | | 222,682 | | | | 1.54 | | | | 1.36 | | | | 1.36 | | | | (0.45 | ) | | | 156 | |
| 17.57 | | | 20,002 | | | | 2.39 | | | | 2.15 | | | | 2.15 | | | | (1.27 | ) | | | — | |
| 17.57 | | | 18,842 | | | | 2.13 | | | | 2.13 | | | | 2.13 | | | | (1.26 | ) | | | — | |
| 18.81 | | | 556,462 | | | | 1.09 | | | | 1.09 | | | | 1.09 | | | | (0.22 | ) | | | — | |
| 19.10 | | | 28,441 | | | | 0.88 | | | | 0.88 | | | | 0.88 | | | | — | | | | — | |
23
Report of Independent Registered Public Accounting Firm
The Board of Directors and Shareholders of
The Hartford Mutual Funds II, Inc.
We have audited the accompanying statement of assets and liabilities, including the schedule of investments, of The Hartford Growth Opportunities Fund (one of the portfolios constituting The Hartford Mutual Funds II, Inc. (the Funds)) as of October 31, 2009, and the related statement of operations for the year then ended, the statements of changes in net assets for each of the two years in the period then ended, and the financial highlights for each of the periods indicated therein. These financial statements and financial highlights are the responsibility of the Funds’ management. Our responsibility is to express an opinion on these financial statements and financial highlights based on our audits.
We conducted our audits in accordance with the standards of the Public Company Accounting Oversight Board (United States). Those standards require that we plan and perform the audit to obtain reasonable assurance about whether the financial statements and financial highlights are free of material misstatement. We were not engaged to perform an audit of the Funds’ internal control over financial reporting. Our audits included consideration of internal control over financial reporting as a basis for designing audit procedures that are appropriate in the circumstances, but not for the purpose of expressing an opinion on the effectiveness of the Funds’ internal control over financial reporting. Accordingly, we express no such opinion. An audit also includes examining, on a test basis, evidence supporting the amounts and disclosures in the financial statements and financial highlights, assessing the accounting principles used and significant estimates made by management, and evaluating the overall financial statement presentation. Our procedures included confirmation of securities owned as of October 31, 2009, by correspondence with the custodian and brokers or by other appropriate auditing procedures where replies from brokers were not received. We believe that our audits provide a reasonable basis for our opinion.
In our opinion, the financial statements and financial highlights referred to above present fairly, in all material respects, the financial position of The Hartford Growth Opportunities Fund of The Hartford Mutual Funds II, Inc. at October 31, 2009, the results of its operations for the year then ended, the changes in its net assets for each of the two years in the period then ended, and the financial highlights for each of the periods indicated therein, in conformity with U.S. generally accepted accounting principles.
Minneapolis, MN
December 15, 2009
24
The Hartford Growth Opportunities Fund
Directors and Officers (Unaudited)
The Board of Directors appoints officers who are responsible for the day-to-day operations of the Fund and who execute policies formulated by the Directors. Each director serves until his or her death, resignation, or retirement or until the next annual meeting of shareholders is held or until his or her successor is elected and qualifies.
Directors and officers who are employed by or who have a financial interest in The Hartford are considered “interested” persons of the Fund pursuant to the Investment Company Act of 1940, as amended. Each officer and two of the Funds’ directors, as noted in the chart below, are “interested” persons of the Fund. Each director serves as a director for The Hartford Mutual Funds, Inc., The Hartford Mutual Funds II, Inc., The Hartford Income Shares Fund, Inc., Hartford Series Fund, Inc., and Hartford HLS Series Fund II, Inc., which, as of October 31, 2009, collectively consist of 93 funds. Correspondence may be sent to directors and officers c/o Hartford Mutual Funds, P.O. Box 2999, Hartford, Connecticut 06104-2999, except that correspondence to Ms. Fagely may be sent to 500 Bielenberg Drive, Woodbury, Minnesota 55125.
The table below sets forth, for each director and officer, his or her name, year of birth, current position with the Fund and date first elected or appointed to The Hartford Mutual Funds, Inc. (“MF”) and The Hartford Mutual Funds II, Inc. (“MF2”), principal occupation, and, for directors, other directorships held. The Fund’s statement of additional information contains further information on the directors and is available free of charge by calling 1-888-843-7824 or writing to Hartford Mutual Funds, P.O. Box 64387, St. Paul, MN 55164-0387.
Information on the aggregate remuneration paid to the directors of the Fund can be found in the Statement of Operations herein. The Fund pays to The Hartford a portion of the Chief Compliance Officer’s compensation, but does not pay salaries or compensation to any of its other officers or directors who are employed by The Hartford.
Non-Interested Directors
Lynn S. Birdsong (1946) Director since 2003, Co-Chairman of the Investment Committee
Mr. Birdsong is a private investor. Since 1981, Mr. Birdsong has been a partner in Birdsong Company, an advertising specialty firm. Since 2003, Mr. Birdsong has been an independent director of The Japan Fund. From 2003 to March 2005, Mr. Birdsong was an independent director of the Atlantic Whitehall Funds. From 1979 to 2002, Mr. Birdsong was a managing director of Zurich Scudder Investments, an investment management firm. During his employment with Scudder, Mr. Birdsong was an interested director of The Japan Fund.
Robert M. Gavin, Jr. (1940) Director since 2002 (MF) and 1986 (MF2), Chairman of the Board since 2004
Dr. Gavin is an educational consultant. Prior to September 1, 2001, he was President of Cranbrook Education Community and prior to July 1996, he was President of Macalester College, St. Paul, Minnesota.
Duane E. Hill (1945) Director since 2001 (MF) and 2002 (MF2), Chairman of the Nominating Committee
Mr. Hill is Partner of TSG Ventures L.P., a private equity investment company. He has served for over thirty years as a financial services executive in banking, venture capital and private equity.
Sandra S. Jaffee (1941) Director since 2005
Ms. Jaffee served as Chairman (2008-2009) and Chief Executive Officer of Fortent (formerly Searchspace Group), a leading provider of compliance/regulatory technology to financial institutions from August 2005 to August 2009. From August 2004 to August 2005, Ms. Jaffee served as an Entrepreneur in Residence with Warburg Pincus, a private equity firm. From September 1995 to July 2004, Ms. Jaffee served as Executive Vice President at Citigroup, where she was President and Chief Executive Officer of Citibank’s Global Securities Services (1995-2003).
William P. Johnston (1944) Director since 2005, Chairman of the Compliance Committee
In February 2008, Mr. Johnston was elected to the Board of Directors of HCR-ManorCare, Inc. In August 2007, Mr. Johnston was elected to the Board of Directors of LifeCare Holdings, Inc. In July, 2006, Mr. Johnston was elected to the Board of Directors of MultiPlan, Inc. In June 2006, Mr. Johnston was appointed as Senior Advisor to The Carlyle Group, a global private equity investment firm. In May 2006, Mr. Johnston was elected to the Supervisory Board of Fresenius Medical Care AG & Co. KGaA, after its acquisition of Renal Care Group, Inc. in March 2006. Mr. Johnston joined Renal Care Group in November 2002 as a member of the Board of Directors and served as Chairman of the Board from March 2003 through March 2006. From September 1987 to December 2002, Mr. Johnston was with Equitable Securities Corporation (and its successors, SunTrust Equitable Securities and SunTrust Robinson Humphrey) serving in various investment banking and managerial positions, including Managing Director and Head of Investment Banking, Chief Executive Officer and Vice Chairman.
25
The Hartford Growth Opportunities Fund
Directors and Officers (Unaudited) — (continued)
Phillip O. Peterson (1944) Director since 2002 (MF) and 2000 (MF2), Chairman of the Audit Committee
Mr. Peterson is a mutual fund industry consultant. He was a partner of KPMG LLP (an accounting firm) until July 1999. Mr. Peterson joined William Blair Funds in February 2007 as a member of the Board of Trustees. From January 2004 to April 2005, Mr. Peterson served as Independent President of the Strong Mutual Funds.
Lemma W. Senbet (1946) Director since 2005
Dr. Senbet is the William E. Mayer Chair Professor of Finance at the University of Maryland, Robert H. Smith School of Business. He was chair of the Finance Department during 1998-2006. Previously he was an endowed professor of finance at the University of Wisconsin-Madison. Also, he was director of the Fortis Funds from March 2000-July 2002. Dr. Senbet served the finance profession in various capacities, including as director of the American Finance Association and President of the Western Finance Association. In 2006, Dr. Senbet was inducted Fellow of Financial Management Association International for his career-long distinguished scholarship and professional service.
Interested Directors and Officers
Lowndes A. Smith (1939) Director since 1996 (MF) and 2002 (MF2), Co-Chairman of the Investment Committee
Mr. Smith served as Vice Chairman of The Hartford from February 1997 to January 2002, as President and Chief Executive Officer of Hartford Life, Inc. from February 1997 to January 2002, and as President and Chief Operating Officer of The Hartford Life Insurance Companies from January 1989 to January 2002. Mr. Smith serves as a Director of White Mountains Insurance Group, Ltd., One Beacon Insurance, Symetra Financial and as a Managing Director of Whittington Gray Associates.
John C. Walters* (1962) Director since 2008
Mr. Walters currently serves as President, Chief Executive Officer and Director for Hartford Life, Inc. (“HL, Inc.”). Mr. Walters also serves as President, Chairman of the Board, Chief Executive Officer and Director for Hartford Life Insurance Company (“Hartford Life”), and as Executive Vice President of The Hartford Financial Services Group, Inc. (“The Hartford”). In addition, Mr. Walters is Manager of HL Investment Advisors, LLC (“HL Advisors”). Mr. Walters previously served as Co-Chief Operating Officer of Hartford Life (2007-2008), and as President of the U.S. Wealth Management Division of HL, Inc. (2006-2007). Mr. Walters joined Hartford Life in April 2000 from First Union Securities, the brokerage subsidiary of First Union Corp.
| | |
| * | | Mr. Walters previously served as President and Chief Executive Officer of the Fund (2007 – 2009). |
Other Officers
Robert M. Arena, Jr. (1968) President and Chief Executive Officer since 2009 (served as Vice President of the Fund (2006 – 2009))
Mr. Arena serves as Executive Vice President of Hartford Life. Additionally, Mr. Arena is Senior Vice President and Director of Hartford Administrative Services Company, (“HASCO”), President, Chief Executive Officer and Manager of Hartford Investment Financial Services, LLC (“HIFSCO”) and President, Chief Executive Officer and Manager of HL Advisors. Prior to joining The Hartford in 2004, he was Senior Vice President in charge of Product Management for American Skandia/Prudential in the individual annuities division.
Tamara L. Fagely (1958) Vice President, Treasurer and Controller since 2002 (MF) 1993 (MF2)
Ms. Fagely has been a Vice President of HASCO since 1998 and Chief Financial Officer since 2006. Currently Ms. Fagely is a Vice President of Hartford Life. In addition, Ms. Fagely is Controller and Chief Financial Officer of HIFSCO. She served as Assistant Vice President of Hartford Life from December 2001 through March 2005.
Brian Ferrell (1962) AML Compliance Officer since 2008
Mr. Ferrell has served as Assistant Vice President and AML Compliance Officer for The Hartford since 2006, and as AML Compliance Officer for HASCO and Hartford Investor Services Company, LLC (“HISC”) since 2008. Prior to joining The Hartford in 2006, Mr. Ferrell held various positions at the U.S. Department of the Treasury (the “Treasury”) from 2001 to 2006, where he served as Chief Counsel for the Treasury’s Financial Crimes Enforcement Network from 2005 – 2006.
Dr. Robert J. Froehlich (1953) Senior Managing Director since 2009
Dr. Froehlich joined The Hartford as Senior Managing Director in September 2009. Prior to joining The Hartford, Dr. Froehlich served as Vice Chairman of Deutsche Asset Management from 1997 – 2009.
26
Thomas D. Jones, III (1965) Vice President and Chief Compliance Officer since 2006
Mr. Jones serves as Chief Compliance Officer for the Hartford Mutual Funds and Vice President and Director of Securities Compliance for The Hartford. He is also Vice President of HIFSCO, HL Advisors, and Hartford Life. Mr. Jones joined The Hartford in 2006 from SEI Investments, where he served as Chief Compliance Officer for its mutual funds and investment advisers. Prior to joining SEI, Mr. Jones was First Vice President and Compliance Director for Merrill Lynch Investment Managers (Americas) (“MLIM”), where he worked from 1992-2004. At MLIM, Mr. Jones was responsible for the compliance oversight of various investment products, including mutual funds, wrap accounts, institutional accounts and alternative investments.
Edward P. Macdonald (1967) Vice President, Secretary and Chief Legal Officer since 2005
Mr. Macdonald serves as Assistant Vice President of Hartford Life and Chief Legal Officer, Secretary and Vice President of HIFSCO. He also serves as Vice President and Secretary of HASCO, and Chief Legal Officer, Secretary and Vice President of HL Advisors. Prior to joining The Hartford in 2005, Mr. Macdonald was Chief Counsel, Investment Management for Prudential Financial (formerly American Skandia Investment Services, Inc.). He joined Prudential in April 1999.
Vernon J. Meyer (1964) Vice President since 2006
Mr. Meyer serves as Senior Vice President of Hartford Life. He also serves as Senior Vice President of HIFSCO and HL Advisors. Mr. Meyer joined The Hartford in 2004 from MassMutual which he joined in 1987.
D. Keith Sloane (1960) Vice President since 2009
Mr. Sloane is a Senior Vice President of Hartford Life. Additionally, Mr. Sloane currently serves as Senior Vice President of HIFSCO, HL Advisors, and HASCO. Prior to joining The Hartford in 2007, Mr. Sloane was Director of product marketing and led the mutual fund business for Wachovia Securities (“Wachovia”) in their investment products group. Mr. Sloane joined Wachovia in 1995.
Jane Wolak (1961) Vice President since 2009
Ms. Wolak currently serves as Vice President of Hartford Life. Ms. Wolak joined Hartford Life as Vice President, Retail Product Services in May 2007. She is also Vice President of HASCO. Previously, Ms. Wolak was with Sun Life Financial where she held the position of Vice President, Service Center Operations from 2001 — 2007.
HOW TO OBTAIN A COPY OF THE FUND’S PROXY VOTING POLICIES AND VOTING RECORDS
A description of the policies and procedures that the Fund uses to determine how to vote proxies relating to portfolio securities and a record of how the Fund voted any proxies for the twelve-month period ended June 30, 2009 is available (1) without charge, upon request, by calling 888-843-7824 and (2) on the Securities and Exchange Commission’s website at http://www.sec.gov.
QUARTERLY PORTFOLIO HOLDINGS INFORMATION
The Fund files a complete schedule of portfolio holdings with the Commission for the first and third quarters of each fiscal year on Form N-Q. The Fund’s Forms are available (1) without charge, upon request, by calling 888-843-7824 and (2) on the Securities and Exchange Commission’s website at http://www.sec.gov. The Form N-Q may be reviewed and copied at the Commission’s Public Reference Room in Washington, DC. Information on the operation of the Public Reference Room may be obtained by calling 1-800-SEC-0330.
27
The Hartford Growth Opportunities Fund
Federal Tax Information (Unaudited)
The Fund made no capital gain or income distributions for the fiscal year ended October 31, 2009.
28
The Hartford Growth Opportunities Fund
Expense Example (Unaudited)
Your Fund’s Expenses
As a shareholder of the Fund, you incur two types of costs: (1) transaction costs, including sales charges (loads) on purchase payments and contingent deferred sales charges (CDSC) (2) ongoing costs including management fees; distribution fees; and other fund expenses. This example is intended to help you understand your ongoing costs (in dollars) of investing in the Fund and to compare these costs with the ongoing costs of investing in other mutual funds. The example is based on an investment of $1,000 invested at the beginning of the period and held for the period of April 30, 2009 through October 31, 2009.
Actual Expenses
The first set of columns of the table below provides information about actual account values and actual expenses. You may use the information in this column, together with the amount you invested, to estimate the expenses that you paid over the period. Simply divide your account value by $1,000 (for example, an $8,600 account value divided by $1,000 = 8.6), then multiply the result by the number in the line under the heading entitled “Expenses Paid During Period” to estimate the expenses you paid on your account during this period.
Hypothetical Example for Comparison Purposes
The second set of columns of the table below provides information about hypothetical account values and hypothetical expenses based on the Fund’s actual expense ratio and an assumed rate of return of 5% per year before expenses, which is not the Fund’s actual return. The hypothetical account values and expenses may not be used to estimate the actual ending account balance or expenses you paid for the period. You may use this information to compare the ongoing costs of investing in the Fund and other funds. To do so, compare this 5% hypothetical example with the 5% hypothetical examples that appear in the shareholder reports of the other funds.
Please note that the expenses shown in the table are meant to highlight your ongoing costs only and do not reflect any transactional costs, such as sales charges (loads) and CDSC. Therefore, the second set of columns of the table is useful in comparing ongoing costs only, and will not help you determine the relative total costs of owning different funds. In addition, if these transactional costs were included, your costs would be higher. Expenses are equal to the Fund’s annualized expense ratios multiplied by average account value over the period, multiplied by 184/365 (to reflect the one-half year period).
| | | | | | | | | | | | | | | | | | | | | | | | | | | | | | | | | | | | | | |
| | | Actual return | | | | Hypothetical (5% return before expenses) | | | | | | | | | | | |
| | | | | | | | | | | Expenses paid | | | | | | | | | | | | Expenses paid | | | | | | | Days in | | | | |
| | | | | | | | | | | during the period | | | | | | | | | | | | during the period | | | | | | | the | | | Days | |
| | | Beginning | | | Ending Account | | | April 30, 2009 | | | | Beginning | | | Ending Account | | | April 30, | | | Annualized | | | current | | | in the | |
| | | Account Value | | | Value | | | through | | | | Account Value | | | Value | | | 2009 through | | | expense | | | 1/2 | | | full | |
| | | April 30, 2009 | | | October 31, 2009 | | | October 31, 2009 | | | | April 30, 2009 | | | October 31, 2009 | | | October 31, 2009 | | | ratio | | | year | | | year | |
| Class A | | $ | 1,000.00 | | | $ | 1,193.90 | | | $ | 6.97 | | | | $ | 1,000.00 | | | $ | 1,018.85 | | | $ | 6.41 | | | | 1.26 | % | | | 184 | | | | 365 | |
| Class B | | $ | 1,000.00 | | | $ | 1,191.10 | | | $ | 10.38 | | | | $ | 1,000.00 | | | $ | 1,015.73 | | | $ | 9.55 | | | | 1.88 | | | | 184 | | | | 365 | |
| Class C | | $ | 1,000.00 | | | $ | 1,189.20 | | | $ | 11.15 | | | | $ | 1,000.00 | | | $ | 1,015.02 | | | $ | 10.26 | | | | 2.02 | | | | 184 | | | | 365 | |
| Class I | | $ | 1,000.00 | | | $ | 1,196.20 | | | $ | 5.59 | | | | $ | 1,000.00 | | | $ | 1,020.11 | | | $ | 5.14 | | | | 1.01 | | | | 184 | | | | 365 | |
| Class L | | $ | 1,000.00 | | | $ | 1,195.60 | | | $ | 5.76 | | | | $ | 1,000.00 | | | $ | 1,019.96 | | | $ | 5.30 | | | | 1.04 | | | | 184 | | | | 365 | |
| Class R3 | | $ | 1,000.00 | | | $ | 1,192.70 | | | $ | 8.57 | | | | $ | 1,000.00 | | | $ | 1,017.39 | | | $ | 7.88 | | | | 1.55 | | | | 184 | | | | 365 | |
| Class R4 | | $ | 1,000.00 | | | $ | 1,195.20 | | | $ | 6.70 | | | | $ | 1,000.00 | | | $ | 1,019.11 | | | $ | 6.16 | | | | 1.21 | | | | 184 | | | | 365 | |
| Class R5 | | $ | 1,000.00 | | | $ | 1,196.20 | | | $ | 5.04 | | | | $ | 1,000.00 | | | $ | 1,020.62 | | | $ | 4.63 | | | | 0.91 | | | | 184 | | | | 365 | |
| Class Y | | $ | 1,000.00 | | | $ | 1,197.40 | | | $ | 4.43 | | | | $ | 1,000.00 | | | $ | 1,021.17 | | | $ | 4.08 | | | | 0.80 | | | | 184 | | | | 365 | |
29
The Hartford Growth Opportunities Fund
Approval of Investment Management and Investment Sub-Advisory Agreements (Unaudited)
Section 15(c) of the Investment Company Act of 1940, as amended (the “1940 Act”), requires that each mutual fund’s board of directors, including a majority of those directors who are not “interested persons” of the mutual fund, as defined in the 1940 Act (the “Independent Directors”), annually review and consider the continuation of the mutual fund’s investment advisory and sub-advisory agreements. At its meeting held on August 4-5, 2009, the Board of Directors (the “Board”) of The Hartford Growth Opportunities Fund (the “Fund”), including each of the Independent Directors, unanimously voted to approve the continuation of the investment management agreement for the Fund with Hartford Investment Financial Services, LLC (“HIFSCO”) and the continuation of the investment sub-advisory agreement between HIFSCO and the Fund’s sub-adviser Wellington Management Company, LLP (“Sub-adviser,” and together with HIFSCO, “Advisers”) (collectively, the “Agreements”).
In the months preceding the August 4-5, 2009 meeting, the Board requested, received, and reviewed written responses from the Advisers to questions posed to them on behalf of the Independent Directors and supporting materials relating to those questions and responses. The Board considered information furnished to the Board at its meetings throughout the year, as well as information specifically prepared in connection with the annual approval of the Agreements at the Board’s meetings held on June 23-24, 2009 and August 4-5, 2009. Information provided to the Board at its meetings throughout the year, included, among other things, reports on Fund performance, legal and compliance matters, sales and marketing activity, shareholder services, and the other services provided to the Fund by the Advisers, and their affiliates. In addition, the Board received in-person presentations by Fund officers and representatives of HIFSCO at the Board’s meetings on June 23-24, 2009 and August 4-5, 2009 concerning the Agreements.
The Independent Directors, advised by independent legal counsel, engaged two service providers to assist them with evaluating the Agreements with respect to the Fund. Lipper Inc. (“Lipper”), an independent provider of investment company data, was retained to provide the Board with reports on how the Fund’s contractual management fees, actual management fees, other non-management fees, overall expense ratios and investment performance compared to those of mutual funds with similar investment objectives. The Independent Directors also engaged an independent financial services consulting firm (the “Consultant”) to assist them in evaluating the Fund’s management fees, sub-advisory fees, other non-management fees, overall expense ratios and investment performance. In addition, the Consultant reviewed the profitability calculations utilized by HIFSCO in connection with the continuation of the investment management agreement.
In determining to continue the Agreements for the Fund, the members of the Board reviewed and evaluated information and factors they believed to be relevant and appropriate in light of the information that the Board deemed necessary and appropriate and through the exercise of their reasonable business judgment. While individual members of the Board may have weighed certain factors differently, the Board’s determination to continue the Agreements was based on a comprehensive consideration of all information provided to the Board throughout the year and specifically with respect to the continuation of the Agreements. A more detailed discussion of the factors the Board considered with respect to its approval of the Agreements is provided below.
Nature, Extent And Quality Of Services Provided by the Advisers
The Board requested and considered information concerning the nature, extent, and quality of the services provided to the Fund by the Advisers. The Board considered, among other things, the terms of the Agreements and the range of services provided by the Advisers. In this regard, the Board considered information provided to it by HIFSCO concerning the Agreements, which were amended and restated to more completely reflect the services provided to the Fund, but did not result in a material amendment to the Fund’s prior contractual arrangement. The Board considered the Advisers’ professional personnel who provide services to the Fund, including each Adviser’s ability and experience in attracting and retaining qualified personnel to service the Fund. The Board considered each Adviser’s reputation and overall financial strength, as well as its willingness to consider and implement organizational and operational changes designed to improve services to the Fund. In addition, the Board considered the quality of each Adviser’s communications with the Board and responsiveness to Board inquiries.
The Board also requested and evaluated information concerning each Adviser’s regulatory and compliance environment. In this regard, the Board requested and reviewed information on each Adviser’s compliance policies and procedures, compliance history, and a report from the Fund’s Chief Compliance Officer on each Adviser’s compliance with applicable laws and regulations, including responses to regulatory developments and compliance issues raised by regulators. The Board also noted the Advisers’ support of the Fund’s compliance control structure, particularly the resources devoted by the Advisers in support of the Fund’s obligations pursuant to Rule 38a-1 under the 1940 Act.
30
With respect to HIFSCO, the Board noted that under the Agreements, HIFSCO is responsible for the management of the Fund, including overseeing fund operations and service providers and provides administration services to the Fund as well as investment advisory services in connection with selecting, monitoring and supervising the Sub-adviser. The Board considered HIFSCO’s constant monitoring of people, process and performance, including its ongoing commitment to review and rationalize The Hartford Fund Family’s product line-up. The Board considered that HIFSCO or its affiliates are responsible for providing the Fund’s officers and paying their salaries and expenses.
With respect to the Sub-adviser, who provides day-to-day portfolio management services, the Board considered the quality of the Fund’s portfolio managers, the Sub-adviser’s other investment personnel, its investment philosophy and process, investment research capabilities and resources, performance record, trade execution capabilities and experience. The Board considered the experience of the Fund’s portfolio managers, the number of accounts managed by the portfolio managers, and the Sub-adviser’s method for compensating the portfolio managers.
Based on these considerations, the Board concluded that it was satisfied with the nature, extent and quality of the services provided to the Fund by HIFSCO and the Sub-adviser.
Performance of the Fund and the Advisers
The Board considered the investment performance of the Fund. In this regard, the Board reviewed the performance of the Fund over different time periods presented in the materials and evaluated HIFSCO’s analysis of the Fund’s performance for these time periods. The Board considered information and materials provided to the Board by the Advisers concerning Fund performance, as well as information from Lipper comparing the investment performance of the Fund to an appropriate universe of peer funds.
The Board considered the detailed investment analytics reports provided by The Hartford’s Investment Advisory Group throughout the year. These reports include, among other things, information on the Fund’s gross and net returns, the Fund’s investment performance relative to an appropriate benchmark and peer group, various statistics concerning the Fund’s portfolio, and a narrative summary of various factors affecting Fund performance. The Board considered the Advisers’ cooperation with the Investment Committee, which assists the Board in evaluating the performance of the Fund at periodic meetings throughout the year. The Board also considered the analysis provided by the Consultant relating to the Fund’s performance track record.
In light of all the considerations noted above, the Board concluded that it had continued confidence in HIFSCO’s and the Sub-adviser’s overall capabilities to manage the Fund.
Costs of the Services and Profitability of the Advisers
The Board reviewed information regarding HIFSCO’s cost to provide investment management and related services to the Fund and HIFSCO’s profitability, both overall and for the Fund, on a pre-tax basis without regard to distribution expenses. The Board also requested and reviewed information about the profitability to HIFSCO and its affiliates from all services provided to the Fund and all aspects of their relationship with the Fund. The Board also requested and received information relating to the operations and profitability of the Sub-adviser.
The Board considered the Consultant’s review of the profitability calculations utilized by HIFSCO in connection with the continuation of the investment management agreement. In this regard, the Consultant reported that The Hartford’s process for calculating and reporting Fund profitability is reasonable, sound and well within common industry practice.
Based on these considerations, the Board concluded that the profits anticipated to be realized by the Advisers and their affiliates from their relationships with the Fund would not be excessive.
Comparison of Fees and Services Provided by the Advisers
The Board considered comparative information with respect to the investment management fees to be paid by the Fund to HIFSCO, the investment sub-advisory fees to be paid by HIFSCO to the Sub-adviser, and the total expense ratios of the Fund. In this regard, the Board requested and reviewed information from HIFSCO and the Sub-adviser relating to the management and sub-advisory fees, and total operating expenses for the Fund. The Board also reviewed information from Lipper comparing the
31
The Hartford Growth Opportunities Fund
Approval of Investment Management and Investment Sub-Advisory Agreements (Unaudited) — (continued)
Fund’s contractual management fees, actual management fees and overall expense ratios, relative to a group of funds selected by Lipper, in consultation with the Consultant (“Expense Group”), and a broader universe of funds selected by Lipper (“Expense Universe”). The Board considered that as of November 1, 2009, transfer agency fees in excess of the transfer agency expense limitation amount (currently 0.30%) will be reimbursed by Hartford Administrative Services Company (“HASCO”) prior to the application of the Fund’s expense limitation by HIFSCO.
While the Board recognized that comparisons between the Fund and peer funds are imprecise, given the differing service levels and characteristics of mutual funds and the different business models and cost structures of the Advisers, the comparative information provided by Lipper assisted the Board in evaluating the reasonableness of the Fund’s management fees and total operating expenses. In addition, the Board considered the analysis and recommendations of the Consultant relating to the Fund’s management and sub-advisory fees and total operating expenses.
Based on these considerations, the Board concluded that the Fund’s fees and total operating expenses, in conjunction with the information about quality of services, profitability, economies of scale, and other matters discussed, were reasonable in light of the services provided.
Economies of Scale
The Board requested and considered information regarding the Advisers’ realization of economies of scale with respect to the Fund, and whether the fee levels reflect these economies of scale for the benefit of the Fund’s investors. With respect to HIFSCO, the Board considered representations from HIFSCO that it is difficult to anticipate whether and the extent to which economies may be realized by HIFSCO as assets grow over time. The Board reviewed the breakpoints in the advisory fee schedule for the Fund, which reduces fees as Fund assets grow over time. The Board recognized that a fund with assets beyond the last breakpoint level will continue to benefit from economies of scale, because additional assets are charged the lowest breakpoint fee, resulting in lower overall effective management fee rates. The Board also considered that expense limitations and fee waivers that reduce the Fund’s expenses at all asset levels can have the same effect as breakpoints in sharing economies of scale with shareholders, and that a schedule that reaches a lower breakpoint quickly provides shareholders with the benefit of anticipated or potential economies of scale.
The Board reviewed and evaluated materials from Lipper showing how management fee schedules of peer funds reflect economies of scale for the benefit of investors as a peer fund’s assets hypothetically increase over time. Based on information provided by HIFSCO, Lipper, and the Consultant, the Board recognized that there is no uniform methodology for establishing breakpoints, or uniform pattern in asset levels that trigger breakpoints or the amounts of breakpoints triggered.
After considering all of the information available to it, the Board concluded that it was satisfied with the extent to which economies of scale would be shared for the benefit of the Fund’s shareholders, based on currently available information and the effective advisory fees and expense ratios for the Fund at its current and reasonably anticipated asset levels. The Board noted, however, that it would continue to monitor future growth in Fund assets and the appropriateness of additional breakpoints.
Other Benefits
The Board considered other benefits to the Advisers and their affiliates from their relationships with the Fund.
The Board reviewed information noting that Hartford Life, Inc. (“Hartford Life”) an affiliate of HIFSCO, receives fees for fund accounting and related services from the Fund, and the Board considered information on expected profits to Hartford Life or its affiliates for such services. The Board also considered that HASCO, the Fund’s transfer agent and an affiliate of HIFSCO, receives transfer agency compensation from the Fund, and the Board reviewed information on the expected profitability of the Fund’s transfer agency function to HASCO. The Board noted that HASCO is a recognized leader in providing high quality services to Fund shareholders and has received six consecutive mutual fund Dalbar service awards. The Board considered information provided by HASCO indicating that the transfer agent fees charged by HASCO to the Fund were fair and reasonable based on publicly available information.
The Board also considered that, as principal underwriter of the Fund, HIFSCO receives 12b-1 fees from the Fund and receives all or a portion of the sales charges on sales or redemptions of certain classes of shares. The Board also noted that certain affiliates of HIFSCO distribute shares of the Fund and receive compensation in that connection.
32
The Board considered benefits to the Sub-adviser from its use of the Fund’s brokerage commissions to obtain soft dollar research, and representations from HIFSCO and the Sub-adviser that the Sub-adviser would not make any revenue-sharing payments or any other type of distribution payments to HIFSCO or its affiliates.
The Board considered the benefits to shareholders of being part of the Hartford family of funds, including the right to exchange investments between the same class of funds without a sales charge, the ability to reinvest Fund dividends into other funds in the family, and the ability to combine holdings in the Fund with holdings in other funds to obtain a reduced sales charge. The Board considered HIFSCO’s efforts to provide investors in the family with a broad range of investment styles and asset classes and its entrepreneurial risk in initiating new funds to expand these opportunities for shareholders.
* * * *
Based upon its review of these various factors, among others, the Board concluded that it is in the best interests of the Fund and its shareholders for the Board to approve the Agreements for an additional year. In reaching this decision, the Board did not assign relative weights to the factors discussed above or deem any one or group of them to be controlling in and of themselves. In connection with their deliberations, the Independent Directors met separately in executive session on several occasions, with independent legal counsel, to review the relevant materials and consider their responsibilities under relevant laws and regulations.
33
This information is written in connection with the promotion or marketing of the matter(s) addressed in this material. The information cannot be used or relied upon for the purpose of avoiding IRS penalties. These materials are not intended to provide tax, accounting or legal advice. As with all matters of a tax or legal nature, you should consult your own tax or legal counsel for advice.
You should carefully consider investment objectives, risks, and charges and expenses of The Hartford Mutual Funds before investing. This and other information can be found in the Fund’s prospectus, which can be obtained from your investment representative or by calling 888-843-7824. Please read it carefully before you invest or send money.
The Hartford Mutual Funds are underwritten and distributed by Hartford Investment Financial Services, LLC.
“The Hartford” is The Hartford Financial Services Group, Inc., and its subsidiaries.
Mutual fund inception dates range from 1949 to date. The Hartford Mutual Funds are not a subsidiary of The Hartford but are underwritten, distributed by, and advised by subsidiaries of The Hartford. Investments in The Hartford Mutual Funds are not guaranteed by The Hartford or any other entity.
MFAR-20 12/09 MUT 8759 Printed in U.S.A. © 2009 The Hartford, Hartford, CT 06117
The Hartford SmallCap Growth Fund
Table of Contents
| | | | | |
| Manager Discussions (Unaudited) | | | 2 | |
| |
| Financial Statements | | | | |
| |
| | | 5 | |
| |
| | | 10 | |
| |
| | | 11 | |
| |
| | | 12 | |
| |
| | | 13 | |
| |
| | | 14 | |
| |
| | | 26 | |
| |
| | | 28 | |
| |
| | | 29 | |
| |
| | | 31 | |
| |
| | | 31 | |
| |
| | | 32 | |
| |
| | | 33 | |
| |
| | | 34 | |
| | | |
| The Hartford SmallCap Growth Fund inception 01/04/1988 |
(subadvised by Wellington Management Company, LLP
Hartford Investment Management Company) | | Investment objective — Seeks long-term capital appreciation. |
Performance Overview(1) 10/31/99 – 10/31/09
Growth of a $10,000 investment in Class A which includes Sales Charge
Russell 2000 Growth Index is an unmanaged index of those Russell 2000 Index growth companies with higher price-to-book ratios and higher forecasted growth values.
You cannot invest directly in an index.
The value of shares will fluctuate so that, when redeemed, shares may be worth more or less than their original cost. The chart and table do not reflect the deduction of taxes that a shareholder would pay on fund distributions or the redemption of fund shares.
Performance information may reflect historical or current expense waivers/reimbursements from the investment adviser, without which performance would have been lower. For information on current expense waivers/reimbursements, please see the prospectus.
Average Annual Total Returns(2,3,4,5) (as of 10/31/09)
| | | | | | | | | | | | | |
| | | 1 | | 5 | | 10 |
| | | Year | | Year | | Year |
| |
| SmallCap Growth A# | | | 10.72 | % | | | -1.41 | % | | | -0.27 | % |
| SmallCap Growth A## | | | 4.63 | % | | | -2.52 | % | | | -0.83 | % |
| SmallCap Growth B# | | | 10.23 | % | | | -2.02 | % | | NA | * |
| SmallCap Growth B## | | | 5.23 | % | | | -2.36 | % | | NA | * |
| SmallCap Growth C# | | | 9.79 | % | | | -2.21 | % | | | -0.99 | % |
| SmallCap Growth C## | | | 8.79 | % | | | -2.21 | % | | | -0.99 | % |
| SmallCap Growth I# | | | 10.63 | % | | | -1.36 | % | | NA | |
| SmallCap Growth L# | | | 10.42 | % | | | -1.32 | % | | | -0.22 | % |
| SmallCap Growth L## | | | 5.17 | % | | | -2.27 | % | | | -0.71 | % |
| SmallCap Growth R3# | | | 10.22 | % | | | -1.42 | % | | NA | |
| SmallCap Growth R4# | | | 10.38 | % | | | -1.31 | % | | NA | |
| SmallCap Growth R5# | | | 10.69 | % | | | -1.14 | % | | NA | |
| SmallCap Growth Y# | | | 10.67 | % | | | -1.11 | % | | NA | |
| Russell 2000 Growth Index | | | 11.34 | % | | | 0.95 | % | | | 0.12 | % |
| | |
| # | | Without sales charge |
| |
| ## | | With sales charge |
| |
| NA | | Not Applicable |
| |
| * | | 10 year returns are not applicable for Class B because after 8 years Class B converts to Class A. |
PAST PERFORMANCE IS NOT INDICATIVE OF FUTURE RESULTS.
| (1) | | Growth of a $10,000 investment in Classes B, C, I, L, R3, R4, R5 and Y shares will vary from results seen above due to differences in the expenses charged to these share classes. |
| |
| (2) | | Classes A, B, C and Y shares were offered beginning on 2/19/02. Performance prior to that date for Class A is that of the fund’s Class L shares and for Classes B and C is that of the fund’s Classes M and N shares, respectively, which had lower operating expenses. Performance prior to 2/19/02 would have been lower if Classes A, B and C shares expenses were applied during that period. (Classes M and N shares are no longer offered.) Class I shares commenced operations on 8/31/06. Performance prior to 8/31/06 reflects Class A performance. Classes R3, R4 and R5 shares commenced operations on 12/22/06. Performance prior to 12/22/06 reflects Class Y performance. The Fund’s performance information prior to 4/1/01 relfects when the Fund was managed by a previous investment adviser. |
| |
| (3) | | The initial investment in Classes A and L shares reflects the maximum sales charge and Classes B and C reflect CDSC. |
| |
| (4) | | Total returns presented above were calculated using the Fund’s net asset value available to shareholders for sale or redemption of Fund shares on 10/31/09, which excludes investment transactions as of this date. |
| |
| (5) | | Effective 9/30/09, Class B shares of The Hartford Mutual Funds are closed to new investments. |
| | | | | | | |
Portfolio Managers | | | | | | |
| Wellington Management Company, LLP | | Hartford Investment Management Company |
David J. Elliot, CFA | | Mammen Chally, CFA | | Hugh Whelan, CFA | | Kurt Cubbage, CFA |
| Vice President | | Vice President | | Managing Director | | Vice President |
2
How did the Fund perform?
The Class A shares of The Hartford SmallCap Growth Fund returned 10.72%, before sales charge, for the twelve-month period ended October 31, 2009, underperforming its benchmark, the Russell 2000 Growth Index, which returned 11.34% for the same period. The Fund also underperformed the 13.14% return of the average fund in the Lipper Small-Cap Growth Funds peer group, a group of funds with investment strategies similar to those of the Fund.
Why did the Fund perform this way?
Broad U.S. equity markets rose during the period, but this overall increase masks two significantly different market environments. From November through early March stocks fell sharply, reflecting deepening economic worries and concerns over the U.S. government’s increasing involvement in the economy. Beginning in early March stocks rallied through September as investors came to believe that a Depression-like scenario was less likely.
In this environment, small cap stocks (+6%) underperformed both large cap (+10%) and mid cap (+18%) stocks as measured by the Russell 2000, S&P 500, and S&P MidCap 400 Indexes, respectively. The change in sentiment provided a tailwind for growth stocks (+18%) while value stocks (+5%) lagged, as measured by the Russell 1000 Growth and Russell 1000 Value Indexes, respectively. Seven of the ten sectors in the Russell 2000 Growth Index had positive returns during the period. The Consumer Discretionary (+32%) and Information Technology (+30%) sectors performed best, while Industrials (-5%), Financials (-5%), and Energy (-4%) were the only sectors to post declines.
Security selection had a positive effect on relative (i.e. performance of the Fund as measured against the benchmark) returns. In particular, stock selection was strongest in Industrials, Financials and Information Technology and weakest in Health Care, Consumer Discretionary, and Materials. However, sector allocation had a negative impact on relative returns which helped cause the underperformance.
The top detractors from benchmark-relative performance were Human Genome Sciences (Health Care) and Medicines Company (Health Care). Shares of biopharmaceutical company Human Genome Sciences soared after the company announced encouraging news about Benlysta, a potential treatment for lupus. We exited our position early in the period; not holding the position as the price appreciated hurt benchmark-relative returns. Specialty pharmaceutical company Medicines Company’s shares fell as the company discontinued Phase III clinical trials for the development of its experimental blood clotting treatment. Top detractors from absolute (i.e. total return) returns included Steris (Health Care) and Celera (Health Care).
The top contributors to relative performance were CV Therapeutics (Health Care), Starent Networks (Information Technology), and Salix Pharmaceutical (Health Care). Shares of U.S.-based pharmaceutical company CV Therapeutics rose as physician interest in one of its primary drugs increased following a recent label expansion. In addition, competitive takeover bids from Astellas Pharma and Gilead Sciences helped drive strong price appreciation. However, the Fund eliminated its position during the period. Mobile infrastructure company Starent Networks benefited from an announcement that Cisco Systems would acquire Starent Networks, driving its share price higher. Shares of U.S.-based specialty pharmaceutical company Salix Pharmaceutical rose as the company announced the successful outcome of two Phase 3 trials to evaluate the efficacy and safety of rifaximin in the treatment of patients with non-constipation irritable bowel syndrome. Another notable contributor to absolute returns was Rosetta Resources (Energy).
What is the outlook?
As the deterioration in macroeconomic data began to stabilize during the first half of the year, investors removed the worst-case depression scenario from their outlook, propelling stock prices higher. Government intervention helped to stabilize the financial sector, resulting in tightening credit spreads (i.e. short and long term interest rates moving closer together) and greater flexibility for companies to raise both debt and equity financing. While recent economic releases point to an improvement from the dire outlook of early 2009, the U.S. economy is by no means out of the woods. Consumer and corporate debt levels remain high, unemployment now exceeds 10%, and the government’s unprecedented monetary and fiscal stimulus has raised the specter of inflation down the road.
The Fund focuses on stock selection as the key driver of returns and uses proprietary fundamental and quantitative research in a disciplined framework to build a portfolio of the most attractive stocks. The Fund ended the period most overweight (i.e. the Fund’s sector position was greater than the benchmark position) Energy, Financials, and Utilities and most underweight (i.e. the Fund’s sector position was less than the benchmark position) Consumer Discretionary, Health Care, and Information Technology.
At October 31, 2009, 77% of the Fund’s assets were managed by Wellington Company, LLP and 23% of the assets were managed by Hartford Investment Management Company.
3
Diversification by Industry
as of October 31, 2009
| | | | | |
| | | Percentage of |
| Industry (Sector) | | Net Assets |
| Automobiles & Components (Consumer Discretionary) | | | 0.4 | % |
| Banks (Financials) | | | 2.2 | |
| Capital Goods (Industrials) | | | 7.9 | |
| Commercial & Professional Services (Industrials) | | | 4.1 | |
| Consumer Durables & Apparel (Consumer Discretionary) | | | 4.9 | |
| Consumer Services (Consumer Discretionary) | | | 3.0 | |
| Diversified Financials (Financials) | | | 1.6 | |
| Energy (Energy) | | | 5.3 | |
| Food & Staples Retailing (Consumer Staples) | | | 0.7 | |
| Food, Beverage & Tobacco (Consumer Staples) | | | 1.3 | |
| Health Care Equipment & Services (Health Care) | | | 10.9 | |
| Household & Personal Products (Consumer Staples) | | | 2.1 | |
| Insurance (Financials) | | | 1.9 | |
| Materials (Materials) | | | 2.1 | |
| Media (Consumer Discretionary) | | | 1.2 | |
| Other Investment Pools and Funds (Financials) | | | 0.9 | |
| Pharmaceuticals, Biotechnology & Life Sciences (Health Care) | | | 10.6 | |
| Real Estate (Financials) | | | 1.1 | |
| Retailing (Consumer Discretionary) | | | 5.5 | |
| Semiconductors & Semiconductor Equipment (Information Technology) | | | 4.4 | |
| Software & Services (Information Technology) | | | 16.4 | |
| Technology Hardware & Equipment (Information Technology) | | | 5.1 | |
| Telecommunication Services (Services) | | | 2.2 | |
| Transportation (Industrials) | | | 2.0 | |
| Utilities (Utilities) | | | 1.0 | |
| Short-Term Investments | | | 1.2 | |
| Other Assets and Liabilities | | | — | |
| | | | | |
Total | | | 100.0 | % |
| | | | | |
4
The Hartford SmallCap Growth Fund
Schedule of Investments
October 31, 2009
(000’s Omitted)
| | | | | | | | | |
| Shares or Principal Amount | | | Market Value ╪ | |
| COMMON STOCKS - 97.9% | | | | |
| | | | | Automobiles & Components - 0.4% | | | | |
| | 60 | | | Amerigon, Inc. • | | $ | 387 | |
| | 15 | | | Cooper Tire & Rubber Co. | | | 226 | |
| | 5 | | | Standard Motor Products | | | 39 | |
| | | | | | | | |
| | | | | | | | 652 | |
| | | | | | | | |
| | | | | Banks - 2.2% | | | | |
| | 23 | | | Columbia Banking Systems, Inc. | | | 337 | |
| | 23 | | | Danvers Bancorp, Inc. | | | 319 | |
| | 34 | | | Flushing Financial Corp. | | | 383 | |
| | 16 | | | International Bancshares Corp. | | | 244 | |
| | 106 | | | National Penn Bancshares, Inc. | | | 593 | |
| | 31 | | | Ocwen Financial Corp. • | | | 342 | |
| | 25 | | | Signature Bank • | | | 795 | |
| | 12 | | | Southside Bancshares, Inc. | | | 241 | |
| | 24 | | | Western Alliance Bancorp. • | | | 105 | |
| | | | | | | | |
| | | | | | | | 3,359 | |
| | | | | | | | |
| | | | | Capital Goods - 7.9% | | | | |
| | 17 | | | A.O. Smith Corp. | | | 678 | |
| | 12 | | | Aaon, Inc. | | | 210 | |
| | 20 | | | Acuity Brands, Inc. | | | 627 | |
| | 41 | | | Advanced Battery Technologies, Inc. • | | | 139 | |
| | 33 | | | Applied Signal Technology | | | 683 | |
| | 3 | | | AZZ, Inc. • | | | 95 | |
| | 12 | | | Beacon Roofing Supply, Inc. • | | | 167 | |
| | 28 | | | Belden, Inc. | | | 633 | |
| | 27 | | | Ceradyne, Inc. • | | | 440 | |
| | 42 | | | Chart Industries, Inc. • | | | 821 | |
| | 8 | | | China Fire & Security Group • | | | 119 | |
| | 5 | | | Cubic Corp. | | | 170 | |
| | 29 | | | DynCorp International, Inc. • | | | 493 | |
| | 8 | | | EMCOR Group, Inc. • | | | 197 | |
| | 28 | | | Esterline Technologies Corp. • | | | 1,179 | |
| | 65 | | | GrafTech International Ltd. • | | | 875 | |
| | 54 | | | GT Solar International, Inc. • | | | 281 | |
| | 3 | | | Heico Corp. | | | 105 | |
| | 6 | | | Joy Global, Inc. | | | 307 | |
| | 9 | | | Lennox International, Inc. | | | 310 | |
| | 7 | | | Lindsay Corp. | | | 230 | |
| | 3 | | | Middleby Corp. • | | | 130 | |
| | 21 | | | Moog, Inc. Class A • | | | 534 | |
| | 3 | | | Nordson Corp. | | | 153 | |
| | 9 | | | Orbital Sciences Corp. • | | | 114 | |
| | 8 | | | Orion Marine Group, Inc. • | | | 156 | |
| | 17 | | | Polypore International, Inc. • | | | 182 | |
| | 20 | | | Powell Industries, Inc. • | | | 739 | |
| | 4 | | | Simpson Manufacturing Co., Inc. | | | 96 | |
| | 20 | | | Teledyne Technologies, Inc. • | | | 698 | |
| | 14 | | | TransDigm Group, Inc. | | | 533 | |
| | 4 | | | Watsco, Inc. | | | 201 | |
| | 6 | | | Woodward Governor Co. | | | 144 | |
| | | | | | | | |
| | | | | | | | 12,439 | |
| | | | | | | | |
| | | | | Commercial & Professional Services - 4.1% | | | | |
| | 77 | | | APAC TeleServices, Inc. • | | | 497 | |
| | 20 | | | Brink’s Co. | | | 472 | |
| | 7 | | | Consolidated Graphics, Inc. • | | | 141 | |
| | 26 | | | Deluxe Corp. | | | 367 | |
| | 2 | | | Healthcare Services Group, Inc. | | | 32 | |
| | 17 | | | Herman Miller, Inc. | | | 263 | |
| | 7 | | | HNI Corp. | | | 175 | |
| | 31 | | | Knoll, Inc. | | | 305 | |
| | 11 | | | Manpower, Inc. | | | 539 | |
| | 23 | | | Resources Connection, Inc. • | | | 402 | |
| | 51 | | | Sykes Enterprises, Inc. • | | | 1,211 | |
| | 8 | | | Tetra Tech, Inc. • | | | 218 | |
| | 40 | | | Watson Wyatt Worldwide, Inc. | | | 1,728 | |
| | | | | | | | |
| | | | | | | | 6,350 | |
| | | | | | | | |
| | | | | Consumer Durables & Apparel - 4.9% | | | | |
| | 51 | | | Carter’s, Inc. • | | | 1,198 | |
| | 2 | | | Deckers Outdoor Corp. • | | | 144 | |
| | 8 | | | Fossil, Inc. • | | | 218 | |
| | 32 | | | Iconix Brand Group, Inc. • | | | 373 | |
| | 82 | | | Liz Claiborne, Inc. | | | 468 | |
| | 5 | | | Lululemon Athletica, Inc. • | | | 129 | |
| | 2 | | | Oxford Industries, Inc. | | | 41 | |
| | 3 | | | Polaris Industries, Inc. | | | 139 | |
| | 108 | | | Smith & Wesson Holding Corp. • | | | 459 | |
| | 4 | | | Steven Madden Ltd. • | | | 166 | |
| | 12 | | | Sturm Ruger & Co., Inc. | | | 124 | |
| | 11 | | | Tempur-Pedic International, Inc. • | | | 220 | |
| | 46 | | | True Religion Apparel, Inc. • | | | 1,194 | |
| | 35 | | | Tupperware Brands Corp. | | | 1,578 | |
| | 5 | | | Under Armour, Inc. Class A • | | | 133 | |
| | 17 | | | Warnaco Group, Inc. • | | | 702 | |
| | 6 | | | Wolverine World Wide, Inc. | | | 163 | |
| | | | | | | | |
| | | | | | | | 7,449 | |
| | | | | | | | |
| | | | | Consumer Services - 3.0% | | | | |
| | 37 | | | Bally Technologies, Inc. • | | | 1,473 | |
| | 5 | | | Buffalo Wild Wings, Inc. • | | | 189 | |
| | 2 | | | Capella Education Co. • | | | 136 | |
| | 13 | | | Cheesecake Factory, Inc. • | | | 240 | |
| | 9 | | | Corinthian Colleges, Inc. • | | | 146 | |
| | 13 | | | ITT Educational Services, Inc. • | | | 1,196 | |
| | 7 | | | Lincoln Educational Services Corp. • | | | 138 | |
| | 31 | | | P. F. Chang’s China Bistro, Inc. • | | | 902 | |
| | 9 | | | Shuffle Master, Inc. • | | | 68 | |
| | | | | | | | |
| | | | | | | | 4,488 | |
| | | | | | | | |
| | | | | Diversified Financials - 1.6% | | | | |
| | 37 | | | Ezcorp, Inc. • | | | 475 | |
| | 6 | | | First Cash Financial Services, Inc. • | | | 101 | |
| | 74 | | | GFI Group, Inc. | | | 380 | |
| | 13 | | | Knight Capital Group, Inc. • | | | 218 | |
| | 64 | | | MF Global Ltd. • | | | 453 | |
| | 47 | | | optionsXpress Holdings, Inc. | | | 741 | |
| | | | | | | | |
| | | | | | | | 2,368 | |
| | | | | | | | |
| | | | | Energy - 5.3% | | | | |
| | 36 | | | Arena Resources, Inc. • | | | 1,326 | |
| | 12 | | | Cal Dive International, Inc. • | | | 95 | |
| | 4 | | | Carbo Ceramics, Inc. | | | 247 | |
| | 91 | | | Complete Production Services, Inc. • | | | 869 | |
| | 4 | | | Dril-Quip, Inc. • | | | 171 | |
| | 7 | | | James River Coal Co. • | | | 139 | |
| | 3 | | | Lufkin Industries, Inc. | | | 155 | |
| | 7 | | | Matrix Service Co. • | | | 58 | |
| | 101 | | | McMoRan Exploration Co. • | | | 778 | |
| | 3 | | | NATCO Group, Inc. • | | | 136 | |
| | 7 | | | Overseas Shipholding Group, Inc. | | | 263 | |
| | 118 | | | Rosetta Resources, Inc. • | | | 1,598 | |
| | 24 | | | St. Mary Land & Exploration Co. | | | 823 | |
| | 52 | | | Union Drilling, Inc. • | | | 394 | |
| | 84 | | | Vaalco Energy, Inc. | | | 359 | |
| | 30 | | | W&T Offshore, Inc. | | | 352 | |
The accompanying notes are an integral part of these financial statements.
5
The Hartford SmallCap Growth Fund
Schedule of Investments — (continued)
October 31, 2009
(000’s Omitted)
| | | | | | | | | |
| Shares or Principal Amount | | | Market Value ╪ | |
| COMMON STOCKS - 97.9% — (continued) | | | | |
| | | | | Energy - 5.3% — (continued) | | | | |
| | 11 | | | Willbros Group, Inc. • | | $ | 139 | |
| | 5 | | | World Fuel Services Corp. | | | 255 | |
| | | | | | | | |
| | | | | | | | 8,157 | |
| | | | | | | | |
| | | | | Food & Staples Retailing - 0.7% | | | | |
| | 21 | | | BJ’s Wholesale Club, Inc. • | | | 739 | |
| | 6 | | | Casey’s General Stores, Inc. | | | 198 | |
| | 6 | | | United Natural Foods, Inc. • | | | 157 | |
| | | | | | | | |
| | | | | | | | 1,094 | |
| | | | | | | | |
| | | | | Food, Beverage & Tobacco - 1.3% | | | | |
| | 5 | | | American Italian Pasta Co. • | | | 122 | |
| | 104 | | | Darling International, Inc. • | | | 720 | |
| | 3 | | | Diamond Foods, Inc. | | | 98 | |
| | 2 | | | J&J Snack Foods Corp. | | | 68 | |
| | 4 | | | Lancaster Colony Corp. | | | 195 | |
| | 4 | | | Sanderson Farms, Inc. | | | 164 | |
| | 41 | | | Zhongpin, Inc. • | | | 551 | |
| | | | | | | | |
| | | | | | | | 1,918 | |
| | | | | | | | |
| | | | | Health Care Equipment & Services - 10.9% | | | | |
| | 5 | | | Abaxis, Inc. • | | | 118 | |
| | 18 | | | Align Technology, Inc. • | | | 286 | |
| | 3 | | | Amedisys, Inc. • | | | 134 | |
| | 62 | | | American Medical Systems Holdings • | | | 958 | |
| | 62 | | | Angiodynamics, Inc. • | | | 936 | |
| | 5 | | | Athenahealth, Inc. • | | | 179 | |
| | 9 | | | Beckman Coulter, Inc. | | | 553 | |
| | 10 | | | Bioscrip, Inc. • | | | 76 | |
| | 6 | | | Catalyst Health Solutions • | | | 187 | |
| | 14 | | | Clarient, Inc. • | | | 44 | |
| | 10 | | | Community Health Systems, Inc. • | | | 313 | |
| | 38 | | | Corvel Corp. • | | | 1,086 | |
| | 69 | | | Cyberonics, Inc. • | | | 1,001 | |
| | 76 | | | Dexcom, Inc. • | | | 520 | |
| | 41 | | | Eclipsys Corp. • | | | 761 | |
| | 4 | | | Emergency Medical Services • | | | 196 | |
| | 3 | | | Haemonetics Corp. • | | | 157 | |
| | 19 | | | Hanger Orthopedic Group, Inc. • | | | 262 | |
| | 55 | | | HealthSouth Corp. • | | | 799 | |
| | 81 | | | Healthspring, Inc. • | | | 1,166 | |
| | 4 | | | HMS Holdings Corp. • | | | 179 | |
| | 2 | | | ICU Medical, Inc. • | | | 53 | |
| | 7 | | | Immucor, Inc. • | | | 121 | |
| | — | | | Landauer, Inc. | | | 9 | |
| | 26 | | | LifePoint Hospitals, Inc. • | | | 745 | |
| | 40 | | | Masimo Corp. • | | | 1,069 | |
| | 11 | | | MedAssets, Inc. • | | | 234 | |
| | 5 | | | Meridian Bioscience, Inc. | | | 113 | |
| | 7 | | | NuVasive, Inc. • | | | 241 | |
| | 30 | | | Orthofix International N.V. • | | | 963 | |
| | 7 | | | Palomar Medical Technologies, Inc. • | | | 71 | |
| | 7 | | | PharMerica Corp. • | | | 105 | |
| | 6 | | | Providence Service Corp. • | | | 80 | |
| | 12 | | | PSS World Medical, Inc. • | | | 250 | |
| | 6 | | | Psychiatric Solutions, Inc. • | | | 122 | |
| | 3 | | | Quality Systems | | | 213 | |
| | 4 | | | Rehabcare Group, Inc. • | | | 68 | |
| | 6 | | | Sirona Dental Systems, Inc. • | | | 158 | |
| | 9 | | | STERIS Corp. | | | 255 | |
| | 36 | | | Symmetry Medical, Inc. • | | | 290 | |
| | 7 | | | Thoratec Corp. • | | | 179 | |
| | 14 | | | Triple-S Management Corp., Class B • | | | 239 | |
| | 20 | | | U.S. Physical Therapy, Inc. • | | | 279 | |
| | 15 | | | Volcano Corp. • | | | 214 | |
| | 38 | | | Zoll Medical Corp. • | | | 734 | |
| | | | | | | | |
| | | | | | | | 16,716 | |
| | | | | | | | |
| | | | | Household & Personal Products - 2.1% | | | | |
| | 36 | | | American Oriental Bioengineering, Inc. • | | | 144 | |
| | 65 | | | Bare Escentuals, Inc. • | | | 816 | |
| | 2 | | | Chattem, Inc. • | | | 145 | |
| | 4 | | | Female Health Co. • | | | 17 | |
| | 8 | | | Medifast, Inc. • | | | 167 | |
| | 81 | | | Nu Skin Enterprises, Inc. Class A | | | 1,851 | |
| | 1 | | | Usana Health Sciences, Inc. • | | | 17 | |
| | | | | | | | |
| | | | | | | | 3,157 | |
| | | | | | | | |
| | | | | Insurance - 1.9% | | | | |
| | 29 | | | Allied World Assurance Holdings Ltd. | | | 1,302 | |
| | 52 | | | Amerisafe, Inc. • | | | 970 | |
| | 13 | | | Axis Capital Holdings Ltd. | | | 373 | |
| | 6 | | | Platinum Underwriters Holdings Ltd. | | | 225 | |
| | 2 | | | RLI Corp. | | | 111 | |
| | | | | | | | |
| | | | | | | | 2,981 | |
| | | | | | | | |
| | | | | Materials - 2.1% | | | | |
| | 3 | | | Clearwater Paper Corp. • | | | 125 | |
| | 5 | | | Koppers Holdings, Inc. | | | 118 | |
| | 5 | | | LSB Industries, Inc. • | | | 63 | |
| | 2 | | | Newmarket Corp. | | | 220 | |
| | 15 | | | Rock Tenn Co. Class A | | | 641 | |
| | 31 | | | Silgan Holdings, Inc. | | | 1,666 | |
| | 1 | | | Stepan Co. | | | 66 | |
| | 13 | | | Stillwater Mining Co. • | | | 78 | |
| | 5 | | | W.R. Grace & Co. • | | | 119 | |
| | | | | | | | |
| | | | | | | | 3,096 | |
| | | | | | | | |
| | | | | Media - 1.2% | | | | |
| | 63 | | | Arbitron, Inc. | | | 1,368 | |
| | 70 | | | LodgeNet Interactive Corp. • | | | 341 | |
| | 11 | | | Valassis Communications, Inc. • | | | 196 | |
| | | | | | | | |
| | | | | | | | 1,905 | |
| | | | | | | | |
| | | | | Pharmaceuticals, Biotechnology & Life Sciences - 10.6% | | | | |
| | 124 | | | Alkermes, Inc. • | | | 988 | |
| | 133 | | | Arena Pharmaceuticals, Inc. • | | | 468 | |
| | 4 | | | Bio-Rad Laboratories, Inc. Class A • | | | 366 | |
| | 32 | | | Bruker Corp. • | | | 343 | |
| | 105 | | | Celera Corp. • | | | 652 | |
| | 52 | | | Cepheid, Inc. • | | | 693 | |
| | 89 | | | Cubist Pharmaceuticals, Inc. • | | | 1,506 | |
| | 23 | | | Cypress Bioscience • | | | 140 | |
| | 192 | | | Cytokinetics, Inc. • | | | 611 | |
| | 5 | | | Emergent Biosolutions, Inc. • | | | 76 | |
| | 12 | | | Enzon, Inc. • | | | 102 | |
| | 12 | | | Exelixis, Inc. • | | | 75 | |
| | 4 | | | Genomic Health, Inc. • | | | 66 | |
| | 7 | | | Hi-Technology Pharmacal Co., Inc. • | | | 136 | |
| | 20 | | | Human Genome Sciences, Inc. • | | | 374 | |
| | 11 | | | Impax Laboratories, Inc. • | | | 98 | |
| | 69 | | | Inspire Pharmaceuticals, Inc. • | | | 309 | |
| | 12 | | | Isis Pharmaceuticals, Inc. • | | | 150 | |
| | 9 | | | Martek Biosciences Corp. • | | | 159 | |
| | 79 | | | Medicines Co. • | | | 565 | |
| | 8 | | | Medicis Pharmaceutical Corp. Class A | | | 170 | |
The accompanying notes are an integral part of these financial statements.
6
| | | | | | | | | |
| Shares or Principal Amount | | | Market Value ╪ | |
| COMMON STOCKS - 97.9% — (continued) | | | | |
| | | | | Pharmaceuticals, Biotechnology & Life Sciences - 10.6% — (continued) | | | | |
| | 17 | | | Nektar Therapeutics • | | $ | 136 | |
| | 38 | | | Onyx Pharmaceuticals, Inc. • | | | 1,005 | |
| | 23 | | | OSI Pharmaceuticals, Inc. • | | | 747 | |
| | 31 | | | PDL Biopharma, Inc. | | | 258 | |
| | 32 | | | Pharmasset, Inc. • | | | 599 | |
| | 19 | | | Questcor Pharmaceuticals • | | | 86 | |
| | 72 | | | Regeneron Pharmaceuticals, Inc. • | | | 1,132 | |
| | 54 | | | Rigel Pharmaceuticals, Inc. • | | | 347 | |
| | 97 | | | Salix Pharmaceuticals Ltd. • | | | 1,786 | |
| | 20 | | | Sciclone Pharmaceuticals, Inc. • | | | 49 | |
| | 118 | | | Seattle Genetics, Inc. • | | | 1,070 | |
| | 16 | | | VIVUS, Inc. • | | | 125 | |
| | 15 | | | Watson Pharmaceuticals, Inc. • | | | 499 | |
| | 23 | | | Xenoport, Inc. • | | | 388 | |
| | | | | | | | |
| | | | | | | | 16,274 | |
| | | | | | | | |
| | | | | Real Estate - 1.1% | | | | |
| | 11 | | | American Capital Agency Corp. | | | 296 | |
| | 65 | | | Anworth Mortgage Asset Corp. | | | 460 | |
| | 3 | | �� | Equity Lifestyle Properties, Inc. | | | 157 | |
| | 5 | | | LTC Properties, Inc. | | | 130 | |
| | 39 | | | MFA Mortgage Investments, Inc. | | | 287 | |
| | 3 | | | PS Business Parks, Inc. | | | 163 | |
| | 5 | | | Tanger Factory Outlet Center | | | 200 | |
| | | | | | | | |
| | | | | | | | 1,693 | |
| | | | | | | | |
| | | | | Retailing - 5.5% | | | | |
| | 12 | | | 99 Cents Only Stores • | | | 131 | |
| | 42 | | | Big Lots, Inc. • | | | 1,047 | |
| | 3 | | | Blue Nile, Inc. • | | | 164 | |
| | 5 | | | Cato Corp. • | | | 98 | |
| | 26 | | | Citi Trends, Inc. • | | | 682 | |
| | 2 | | | Core-Mark Holding Co., Inc. • | | | 58 | |
| | 28 | | | Gymboree Corp. • | | | 1,202 | |
| | 18 | | | Hot Topic, Inc. • | | | 137 | |
| | 10 | | | J. Crew Group, Inc. • | | | 400 | |
| | 23 | | | Joseph A. Bank Clothiers, Inc. • | | | 933 | |
| | 9 | | | Kirklands, Inc. • | | | 108 | |
| | 6 | | | Lumber Liquidators, Inc. • | | | 138 | |
| | 10 | | | Netflix, Inc. • | | | 540 | |
| | 28 | | | Nutri/System, Inc. | | | 592 | |
| | 47 | | | Overstock.com, Inc. • | | | 662 | |
| | 9 | | | PetMed Express, Inc • | | | 135 | |
| | 32 | | | Shutterfly, Inc. • | | | 445 | |
| | 4 | | | The Buckle, Inc. | | | 115 | |
| | 5 | | | Tractor Supply Co. • | | | 228 | |
| | 154 | | | Wet Seal, Inc. Class A • | | | 490 | |
| | | | | | | | |
| | | | | | | | 8,305 | |
| | | | | | | | |
| | | | | Semiconductors & Semiconductor Equipment - 4.4% | | | | |
| | 23 | | | Amkor Technology, Inc. • | | | 129 | |
| | 38 | | | Atheros Communications, Inc. • | | | 930 | |
| | 7 | | | FEI Co. • | | | 157 | |
| | 5 | | | Hittite Microwave Corp. • | | | 184 | |
| | 8 | | | Microsemi Corp. • | | | 107 | |
| | 65 | | | MIPS Technologies, Inc. Class A • | | | 258 | |
| | 4 | | | Netlogic Microsystems, Inc. • | | | 138 | |
| | 3 | | | NVE Corp. • | | | 98 | |
| | 92 | | | ON Semiconductor Corp. • | | | 618 | |
| | 80 | | | PMC — Sierra, Inc. • | | | 682 | |
| | 256 | | | RF Micro Devices, Inc. • | | | 1,018 | |
| | 9 | | | Semtech Corp. • | | | 133 | |
| | 167 | | | Skyworks Solutions, Inc. • | | | 1,742 | |
| | 26 | | | Tessera Technologies, Inc. • | | | 573 | |
| | | | | | | | |
| | | | | | | | 6,767 | |
| | | | | | | | |
| | | | | Software & Services - 16.4% | | | | |
| | 15 | | | Acxiom Corp. • | | | 169 | |
| | 5 | | | Advent Software, Inc. • | | | 173 | |
| | 38 | | | ArcSight, Inc. • | | | 951 | |
| | 13 | | | Ariba, Inc. • | | | 154 | |
| | 171 | | | Art Technology Group, Inc. • | | | 706 | |
| | 53 | | | AsiaInfo Holdings, Inc. • | | | 1,169 | |
| | 6 | | | Blackbaud, Inc. | | | 135 | |
| | 4 | | | Blackboard, Inc. • | | | 136 | |
| | 47 | | | Commvault Systems, Inc. • | | | 920 | |
| | 6 | | | Concur Technologies, Inc. • | | | 197 | |
| | 33 | | | Constant Contact, Inc. • | | | 550 | |
| | 38 | | | CSG Systems International, Inc. • | | | 616 | |
| | 9 | | | CyberSource Corp. • | | | 146 | |
| | 9 | | | DealerTrack Holdings, Inc. • | | | 142 | |
| | 4 | | | Digital River, Inc. • | | | 81 | |
| | 53 | | | Earthlink, Inc. | | | 431 | |
| | 9 | | | Gartner, Inc. Class A • | | | 162 | |
| | 13 | | | Global Cash Access, Inc. • | | | 83 | |
| | 6 | | | i2 Technologies, Inc. • | | | 94 | |
| | 67 | | | Informatica Corp. • | | | 1,423 | |
| | 49 | | | j2 Global Communications, Inc. • | | | 1,009 | |
| | 14 | | | Jack Henry & Associates, Inc. | | | 323 | |
| | 35 | | | JDA Software Group, Inc. • | | | 687 | |
| | 21 | | | Lawson Software, Inc. • | | | 130 | |
| | 4 | | | Manhattan Associates, Inc. • | | | 97 | |
| �� | 28 | | | Mercadolibre, Inc. • | | | 1,003 | |
| | 40 | | | Net 1 UEPS Technologies, Inc. • | | | 696 | |
| | 5 | | | North American Equity | | | 45 | |
| | 90 | | | Parametric Technology Corp. • | | | 1,349 | |
| | 5 | | | Pegasystems, Inc. | | | 155 | |
| | 28 | | | Quest Software, Inc. • | | | 471 | |
| | 53 | | | Rackspace Hosting, Inc. • | | | 894 | |
| | 33 | | | Red Hat, Inc. • | | | 852 | |
| | 17 | | | RightNow Technologies, Inc. • | | | 258 | |
| | 12 | | | S1 Corp. • | | | 70 | |
| | 169 | | | Sapient Corp. • | | | 1,374 | |
| | 9 | | | Smith Micro Software, Inc. • | | | 81 | |
| | 11 | | | Sohu.com, Inc. • | | | 595 | |
| | 40 | | | Solera Holdings, Inc. | | | 1,280 | |
| | 10 | | | SonicWALL, Inc. • | | | 76 | |
| | 9 | | | SuccessFactors, Inc. • | | | 134 | |
| | 9 | | | Sybase, Inc. • | | | 364 | |
| | 4 | | | Syntel, Inc. | | | 135 | |
| | 5 | | | Taleo Corp. Class A • | | | 117 | |
| | 50 | | | TeleCommunication Systems, Inc. Class A • | | | 442 | |
| | 9 | | | TeleTech Holdings, Inc. • | | | 153 | |
| | 110 | | | Tibco Software, Inc. • | | | 959 | |
| | 63 | | | TiVo, Inc. • | | | 680 | |
| | 100 | | | United Online, Inc. | | | 797 | |
| | 15 | | | Valueclick, Inc. • | | | 149 | |
| | 10 | | | Websense, Inc. • | | | 166 | |
| | 43 | | | Wright Express Corp. • | | | 1,193 | |
| | | | | | | | |
| | | | | | | | 25,172 | |
| | | | | | | | |
| | | | | Technology Hardware & Equipment - 5.1% | | | | |
| | 82 | | | 3Com Corp. • | | | 424 | |
The accompanying notes are an integral part of these financial statements.
7
The Hartford SmallCap Growth Fund
Schedule of Investments — (continued)
October 31, 2009
(000’s Omitted)
| | | | | | | | | |
| Shares or Principal Amount | | | Market Value ╪ | |
| COMMON STOCKS - 97.9% — (continued) | | | | |
| | | | | Technology Hardware & Equipment - 5.1% — (continued) | | | | |
| | 5 | | | Acme Packet, Inc. • | | $ | 50 | |
| | 6 | | | ADTRAN, Inc. | | | 138 | |
| | 51 | | | Arris Group, Inc. • | | | 520 | |
| | 46 | | | Benchmark Electronics, Inc. • | | | 769 | |
| | 5 | | | Blue Coat Systems, Inc. • | | | 117 | |
| | 18 | | | Brightpoint, Inc. • | | | 129 | |
| | 5 | | | Checkpoint Systems, Inc. • | | | 64 | |
| | 2 | | | Cogent, Inc. • | | | 15 | |
| | 4 | | | Comtech Telecommunications Corp. • | | | 128 | |
| | 3 | | | Harmonic, Inc. • | | | 17 | |
| | 19 | | | Interdigital, Inc. • | | | 395 | |
| | 25 | | | Multi-Fineline Electronix, Inc. • | | | 689 | |
| | 62 | | | Netezza Corp. • | | | 568 | |
| | 23 | | | Novatel Wireless, Inc. • | | | 201 | |
| | 1 | | | Osi Systems, Inc. • | | | 21 | |
| | 10 | | | Palm, Inc. • | | | 121 | |
| | 8 | | | Plantronics, Inc. | | | 201 | |
| | 33 | | | Polycom, Inc. • | | | 717 | |
| | 55 | | | QLogic Corp. • | | | 963 | |
| | 68 | | | Riverbed Technology, Inc. • | | | 1,392 | |
| | 7 | | | Starent Networks Corp. • | | | 228 | |
| | | | | | | | |
| | | | | | | | 7,867 | |
| | | | | | | | |
| | | | | Telecommunication Services - 2.2% | | | | |
| | 20 | | | AboveNet, Inc. • | | | 944 | |
| | 28 | | | Atlantic Tele-Network, Inc. • | | | 1,261 | |
| | 33 | | | Centennial Cellular Corp. Class A • | | | 277 | |
| | 28 | | | Cincinnati Bell, Inc. • | | | 85 | |
| | 4 | | | Consolidated Communications Holdings, Inc. | | | 50 | |
| | 3 | | | Iowa Telecommunications Services, Inc. | | | 36 | |
| | 9 | | | Neutral Tandem, Inc. • | | | 180 | |
| | 13 | | | NTELOS Holdings Corp. | | | 201 | |
| | 14 | | | PAETEC Holding Corp. • | | | 44 | |
| | 2 | | | Premiere Global Services, Inc. • | | | 14 | |
| | 19 | | | Syniverse Holdings, Inc. • | | | 322 | |
| | 4 | | | Virgin Mobile USA, Inc. • | | | 15 | |
| | | | | | | | |
| | | | | | | | 3,429 | |
| | | | | | | | |
| | | | | Transportation - 2.0% | | | | |
| | 16 | | | Avis Budget Group, Inc. • | | | 138 | |
| | 17 | | | Hawaiian Holdings, Inc. • | | | 122 | |
| | 33 | | | Hub Group, Inc. • | | | 820 | |
| | 14 | | | Knight Transportation, Inc. | | | 223 | |
| | 21 | | | Marten Transport Ltd. • | | | 361 | |
| | 16 | | | Old Dominion Freight Line, Inc. • | | | 403 | |
| | 16 | | | Saia, Inc. • | | | 240 | |
| | 43 | | | Werner Enterprises, Inc. | | | 797 | |
| | | | | | | | |
| | | | | | | | 3,104 | |
| | | | | | | | |
| | | | | Utilities - 1.0% | | | | |
| | 42 | | | China Natural Gas • | | | 495 | |
| | 6 | | | New Jersey Resources Corp. | | | 216 | |
| | 28 | | | UniSource Energy Corp. | | | 814 | |
| | | | | | | | |
| | | | | | | | 1,525 | |
| | | | | | | | |
| | | | | Total common stocks
(cost $149,292) | | $ | 150,265 | |
| | | | | | | | |
| | | | | | | | | |
| EXCHANGE TRADED FUNDS - 0.9% | | | | |
| | | | | Other Investment Pools and Funds - 0.9% | | | | |
| | 22 | | | iShares Russell 2000 Growth Index Fund | | $ | 1,338 | |
| | | | | | | | |
| | | | | Total exchange traded funds
(cost $1,477) | | $ | 1,338 | |
| | | | | | | | |
| | | | | | | | | |
| | | | | Total long-term investments
(cost $150,769) | | $ | 151,603 | |
| | | | | | | | |
| | | | | | | | | |
| SHORT-TERM INVESTMENTS - 1.2% | | | | |
| | | | | Repurchase Agreements - 1.2% | | | | |
| | | | | Banc of America Securities TriParty Join Repurchase Agreement (maturing on 11/02/2009 in the amount of $52, collateralized by GNMA 5.00%, 2039, value of $53) | | | | |
| $ | 52 | | | 0.08%, 10/30/2009 | | $ | 52 | |
| | | | | BNP Paribas Securities Corp. Repurchase Agreement (maturing on 11/02/2009 in the amount of $271, collateralized by U.S. Treasury Bond 5.25% - 7.88%, 2021 - 2029, value of $281) | | | | |
| | 271 | | | 0.06%, 10/30/2009 | | | 271 | |
| | | | | BNP Paribas Securities Corp. TriParty Joint Repurchase Agreement (maturing on 11/02/2009 in the amount of $304, collateralized by FHLMC 4.00% - 7.00%, 2011 - 2039, FNMA 4.00% - 7.00%, 2017 - 2047, value of $310) | | | | |
| | 304 | | | 0.08%, 10/30/2009 | | | 304 | |
| | | | | Deutsche Bank Securities TriParty Joint Repurchase Agreement (maturing on 11/02/2009 in the amount of $338, collateralized by FHLMC 6.00%, 2036, FNMA 7.00%, 2038, value of $345) | | | | |
| | 338 | | | 0.08%, 10/30/2009 | | | 338 | |
| | | | | RBS Greenwich Capital Markets TriParty Joint Repurchase Agreement (maturing on 11/02/2009 in the amount of $137, collateralized by U.S. Treasury Bond 5.00%, 2037, U.S. Treasury Note 3.13% - 4.63%, 2013 - 2017, value of $139) | | | | |
| | 137 | | | 0.06%, 10/30/2009 | | | 137 | |
| | | | | UBS Securities, Inc. Joint Repurchase Agreement (maturing on 11/02/2009 in the amount of $3, collateralized by U.S. Treasury Note 2.75%, 2013, value of $3) | | | | |
| | 3 | | | 0.05%, 10/30/2009 | | | 3 | |
| | | | | UBS Securities, Inc. Repurchase Agreement (maturing on 11/02/2009 in the amount of $125, collateralized by U.S. Treasury Note 1.50%, 2010, value of $127) | | | | |
| | 125 | | | 0.04%, 10/30/2009 | | | 125 | |
| | | | | UBS Securities, Inc. TriParty Joint Repurchase Agreement (maturing on 11/02/2009 in the amount of $586, collateralized by FNMA 4.00% - 7.50%, 2016 - 2048, value of $598) | | | | |
| | 586 | | | 0.07%, 10/30/2009 | | | 586 | |
| | | | | | | | |
| | | | | | | | 1,816 | |
| | | | | | | | |
The accompanying notes are an integral part of these financial statements.
8
| | | | | | | | | | | | | |
| Shares or Principal Amount | | | | | | | Market Value ╪ | |
| SHORT-TERM INVESTMENTS - 1.2% — (continued) | | | | | | | | |
| | | | | U.S. Treasury Bills - 0.0% | | | | | | | | |
| $ | 75 | | | 0.07%, 1/14/2010 □o | | | | | | $ | 75 | |
| | | | | | | | | | | | |
| |
| | | | | Total short-term investments
(cost $1,891) | | | | | | $ | 1,891 | |
| | | | | | | | | | | | |
| |
| | | | | Total investments
(cost $152,660) ▲ | | | 100.0 | % | | $ | 153,494 | |
| | | | | Other assets and liabilities | | | — | % | | | (6 | ) |
| | | | | | | | | | | |
| | | | | Total net assets | | | 100.0 | % | | $ | 153,488 | |
| | | | | | | | | | | |
| | |
| Note: | | Percentage of investments as shown is the ratio of the total market value to total net assets. Market value of investments in foreign securities represents 1.9% of total net assets at October 31, 2009. |
| |
| | | Foreign securities that are principally traded on certain foreign markets are adjusted daily pursuant to a third party pricing service methodology approved by the Board of Directors in order to reflect an adjustment for factors occurring after the close of the foreign market but before the close of the New York Stock Exchange. |
| |
| ▲ | | At October 31, 2009, the cost of securities for federal income tax purposes was $154,781 and the aggregate gross unrealized appreciation and depreciation based on that cost were: |
| | | | | |
| Unrealized Appreciation | | $ | 20,723 | |
| Unrealized Depreciation | | | (22,010 | ) |
| | | | |
| Net Unrealized Depreciation | | $ | (1,287 | ) |
| | | | |
| | |
| • | | Currently non-income producing. |
| |
| o | | The interest rate disclosed for these securities represents the effective yield on the date of the acquisition. |
| |
| □ | | Security pledged as initial margin deposit for open futures contracts at October 31, 2009. |
Futures Contracts Outstanding at October 31, 2009
| | | | | | | | | | | | | |
| | | | | | | | | | | Unrealized |
| | | Number of | | | | Expiration | | Appreciation/ |
| Description | | Contracts* | | Position | | Month | | (Depreciation) |
| Russell 2000 Mini | | | 9 | | | Long | | Dec 2009 | | $ | (16 | ) |
| | | | | | | | | | | |
| | |
| * | | The number of contracts does not omit 000’s. |
| |
| ╪ | | See Significant Accounting Policies of accompanying Notes to Financial Statements regarding valuation of securities. |
The accompanying notes are an integral part of these financial statements.
9
The Hartford SmallCap Growth Fund
Investment Valuation Hierarchy Level Summary
October 31, 2009
(000’s Omitted)
| | | | | | | | | | | | | | | | | |
| | | Total | | | Level 1 | | | Level 2 | | | Level 3 | |
Assets: | | | | | | | | | | | | | | | | |
| Common Stocks ‡ | | $ | 150,265 | | | $ | 150,265 | | | $ | — | | | $ | — | |
| Exchange Traded Funds | | | 1,338 | | | | 1,338 | | | | — | | | | — | |
| Short-Term Investments | | | 1,891 | | | | — | | | | 1,891 | | | | — | |
| | | | | | | | | | | | | |
| Total | | $ | 153,494 | | | $ | 151,603 | | | $ | 1,891 | | | $ | — | |
| | | | | | | | | | | | | |
Liabilities: | | | | | | | | | | | | | | | | |
| Other Financial Instruments * | | $ | 16 | | | $ | 16 | | | $ | — | | | $ | — | |
| | | | | | | | | | | | | |
| | |
| ‡ | | The Fund has all or primarily all of these equity securities categorized in a single level. Refer to the Schedule of Investments for further industry breakout. |
| |
| * | | Other financial instruments are derivative instruments not reflected in the Schedule of Investments, such as futures, forwards and swap contracts, which are valued at the unrealized appreciation/depreciation on the investment. |
The accompanying notes are an integral part of these financial statements.
10
The Hartford SmallCap Growth Fund
Statement of Assets and Liabilities
October 31, 2009
(000’s Omitted)
| | | | | |
Assets: | | | | |
| Investments in securities, at market value (cost $152,660) | | $ | 153,494 | |
| Cash | | | 1 | |
| Receivables: | | | | |
| Investment securities sold | | | 912 | |
| Fund shares sold | | | 45 | |
| Dividends and interest | | | 40 | |
| Other assets | | | 77 | |
| | | | |
| Total assets | | | 154,569 | |
| | | | |
Liabilities: | | | | |
| Payables: | | | | |
| Investment securities purchased | | | 792 | |
| Fund shares redeemed | | | 182 | |
| Investment management fees | | | 23 | |
| Distribution fees | | | 8 | |
| Variation margin | | | 13 | |
| Accrued expenses | | | 63 | |
| | | | |
| Total liabilities | | | 1,081 | |
| | | | |
| Net assets | | $ | 153,488 | |
| | | | |
Summary of Net Assets: | | | | |
| Capital stock and paid-in-capital | | | 260,703 | |
| Accumulated undistributed net investment income | | | — | |
| Accumulated net realized loss on investments | | | (108,033 | ) |
| Unrealized appreciation of investments | | | 818 | |
| | | | |
| Net assets | | $ | 153,488 | |
| | | | |
| | | | | |
| Shares authorized | | | 27,000,000 | |
| | | | |
| Par value | | $ | 0.0001 | |
| | | | |
Class A: Net asset value per share/Maximum offering price per share | | $ | 20.45/$21.64 | |
| | | | |
| Shares outstanding | | | 2,202 | |
| | | | |
| Net assets | | $ | 45,036 | |
| | | | |
Class B: Net asset value per share | | $ | 17.78 | |
| | | | |
| Shares outstanding | | | 452 | |
| | | | |
| Net assets | | $ | 8,042 | |
| | | | |
Class C: Net asset value per share | | $ | 17.60 | |
| | | | |
| Shares outstanding | | | 557 | |
| | | | |
| Net assets | | $ | 9,800 | |
| | | | |
Class I: Net asset value per share | | $ | 20.50 | |
| | | | |
| Shares outstanding | | | 217 | |
| | | | |
| Net assets | | $ | 4,456 | |
| | | | |
Class L: Net asset value per share/Maximum offering price per share | | $ | 20.56/$21.59 | |
| | | | |
| Shares outstanding | | | 3,634 | |
| | | | |
| Net assets | | $ | 74,731 | |
| | | | |
Class R3: Net asset value per share | | $ | 20.71 | |
| | | | |
| Shares outstanding | | | 9 | |
| | | | |
| Net assets | | $ | 192 | |
| | | | |
Class R4: Net asset value per share | | $ | 20.84 | |
| | | | |
| Shares outstanding | | | 90 | |
| | | | |
| Net assets | | $ | 1,868 | |
| | | | |
Class R5: Net asset value per share | | $ | 21.02 | |
| | | | |
| Shares outstanding | | | 63 | |
| | | | |
| Net assets | | $ | 1,321 | |
| | | | |
Class Y: Net asset value per share | | $ | 21.06 | |
| | | | |
| Shares outstanding | | | 382 | |
| | | | |
| Net assets | | $ | 8,042 | |
| | | | |
The accompanying notes are an integral part of these financial statements.
11
The Hartford SmallCap Growth Fund
Statement of Operations
For the Year Ended October 31, 2009
(000’s Omitted)
| | | | | |
Investment Income: | | | | |
| Dividends | | $ | 1,143 | |
| Interest | | | 6 | |
| Securities lending | | | 13 | |
| Less: Foreign tax withheld | | | — | |
| | | | |
| Total investment income | | | 1,162 | |
| | | | |
| | | | | |
Expenses: | | | | |
| Investment management fees | | | 1,231 | |
| Administrative services fees | | | 3 | |
| Transfer agent fees | | | 398 | |
| Distribution fees | | | | |
| Class A | | | 104 | |
| Class B | | | 76 | |
| Class C | | | 92 | |
| Class L | | | 171 | |
| Class R3 | | | 1 | |
| Class R4 | | | 4 | |
| Custodian fees | | | 32 | |
| Accounting services fees | | | 23 | |
| Registration and filing fees | | | 92 | |
| Board of Directors’ fees | | | 6 | |
| Audit fees | | | 10 | |
| Other expenses | | | 48 | |
| | | | |
| Total expenses (before waivers and fees paid indirectly) | | | 2,291 | |
| Expense waivers | | | (333 | ) |
| Transfer agent fee waivers | | | (213 | ) |
| Commission recapture | | | (7 | ) |
| Custodian fee offset | | | — | |
| | | | |
| Total waivers and fees paid indirectly | | | (553 | ) |
| | | | |
| Total expenses, net | | | 1,738 | |
| | | | |
Net Investment Loss | | | (576 | ) |
| | | | |
Net Realized Loss on Investments and Other Financial Instruments: | | | | |
| Net realized loss on investments in securities | | | (57,488 | ) |
| Net realized gain on futures | | | 165 | |
| Net realized gain on forward foreign currency contracts | | | — | |
| Net realized gain on other foreign currency transactions | | | — | |
| | | | |
Net Realized Loss on Investments and Other Financial Instruments | | | (57,323 | ) |
| | | | |
Net Changes in Unrealized Appreciation of Investments and Other Financial Instruments: | | | | |
| Net unrealized appreciation of investments | | | 67,697 | |
| Net unrealized appreciation of futures | | | 68 | |
| | | | |
Net Changes in Unrealized Appreciation of Investments and Other Financial Instruments | | | 67,765 | |
| | | | |
Net Gain on Investments and Other Financial Instruments | | | 10,442 | |
| | | | |
Net Increase in Net Assets Resulting from Operations | | $ | 9,866 | |
| | | | |
The accompanying notes are an integral part of these financial statements.
12
The Hartford SmallCap Growth Fund
Statement of Changes in Net Assets
(000’s Omitted)
| | | | | | | | | |
| | | For the | | | For the | |
| | | Year Ended | | | Year Ended | |
| | | October 31, 2009 | | | October 31, 2008 | |
Operations: | | | | | | | | |
| Net investment loss | | $ | (576 | ) | | $ | (780 | ) |
| Net realized loss on investments and other financial instruments | | | (57,323 | ) | | | (43,655 | ) |
| Net unrealized appreciation (depreciation) of investments and other financial instruments | | | 67,765 | | | | (92,739 | ) |
| | | | | | | |
Net Increase (Decrease) In Net Assets Resulting From Operations | | | 9,866 | | | | (137,174 | ) |
| | | | | | | |
Distributions to Shareholders: | | | | | | | | |
| From net realized gain on investments | | | | | | | | |
| Class A | | | — | | | | (16,120 | ) |
| Class B | | | — | | | | (1,911 | ) |
| Class C | | | — | | | | (2,577 | ) |
| Class I | | | — | | | | (439 | ) |
| Class L | | | — | | | | (13,612 | ) |
| Class R3 | | | — | | | | (1 | ) |
| Class R4 | | | — | | | | (30 | ) |
| Class R5 | | | — | | | | (1 | ) |
| Class Y | | | — | | | | (4,586 | ) |
| | | | | | | |
| Total distributions | | | — | | | | (39,277 | ) |
| | | | | | | |
Capital Share Transactions: | | | | | | | | |
| Class A | | | (36,969 | ) | | | (13,623 | ) |
| Class B | | | (1,246 | ) | | | (790 | ) |
| Class C | | | (1,470 | ) | | | (2,987 | ) |
| Class I | | | 863 | | | | 795 | |
| Class L | | | (6,555 | ) | | | (593 | ) |
| Class R3 | | | 131 | | | | 4 | |
| Class R4 | | | 395 | | | | 1,542 | |
| Class R5 | | | 1,006 | | | | 55 | |
| Class Y | | | (19,339 | ) | | | 6,509 | |
| | | | | | | |
| Net decrease from capital share transactions | | | (63,184 | ) | | | (9,088 | ) |
| | | | | | | |
Net Decrease In Net Assets | | | (53,318 | ) | | | (185,539 | ) |
Net Assets: | | | | | | | | |
| Beginning of period | | | 206,806 | | | | 392,345 | |
| | | | | | | |
| End of period | | $ | 153,488 | | | $ | 206,806 | |
| | | | | | | |
| Accumulated undistributed (distribution in excess of) net investment income (loss) | | $ | — | | | $ | — | |
| | | | | | | |
The accompanying notes are an integral part of these financial statements.
13
The Hartford SmallCap Growth Fund
Notes to Financial Statements
October 31, 2009
(000’s Omitted)
| 1. | | Organization: |
| |
| | | The Hartford Mutual Funds II, Inc. (“Company”) is an open-end management investment company comprised of six portfolios. Financial statements for The Hartford SmallCap Growth Fund (the “Fund”), a series of the Company, are included in this report. |
| |
| | | The Company is organized under the laws of the State of Maryland and is registered with the Securities and Exchange Commission (“SEC”) under the Investment Company Act of 1940, as amended (“1940 Act”). The Fund is a diversified open-end management investment company. |
| |
| | | Class A shares are sold with a front-end sales charge of up to 5.50%. Class B shares were sold with a contingent deferred sales charge which is assessed on the lesser of the per share net asset value (“NAV”) of the shares at the time of redemption or the original purchase price, and declines from up to 5.00% to zero depending on the period of time the shares are held (See note below regarding the closing of Class B shares). Class C shares are sold with a contingent deferred sales charge of up to 1.00% on shares redeemed within twelve months of purchase. Class I shares are sold without sales charges to certain eligible investors through advisory fee-based wrap programs. Class L shares are sold with a sales charge of up to 4.75%. Classes R3, R4, R5 shares, which are offered to employer-sponsored retirement plans, and Class Y shares, which are sold to certain eligible institutional investors, are sold without a sales charge. All classes of shares have identical voting, redemption, dividend, liquidation and other rights and the same terms and conditions, with the exceptions that each class may have different expenses, which may affect performance, and except that Class B shares automatically convert to Class A shares after 8 years. |
| |
| | | Effective September 30, 2009, no new or additional investments are allowed in Class B shares of The Hartford Mutual Funds (including investments through any systematic investment plan). After September 30, 2009, existing shareholders of Class B shares may continue to hold their Class B shares, exchange their Class B shares for Class B shares of another Hartford Mutual Fund (as permitted by existing exchange privileges), or redeem their Class B shares as described in the Fund’s prospectus. Reinstatement privileges with respect to Class B shares will continue under the current policy. For investors electing to reinvest capital gains and dividends, any such capital gains or dividends on Class B shares will continue to be reinvested in Class B shares of the Fund. For Class B shares outstanding as of September 30, 2009, all Class B share attributes, including the 12b-1 fee, contingent deferred sales charge schedule, and conversion to Class A shares remain unchanged. |
| 2. | | Significant Accounting Policies: |
| |
| | | The following is a summary of significant accounting policies of the Fund, which are in accordance with U.S. Generally Accepted Accounting Principles (“GAAP”). |
| | a) | | Security Transactions and Investment Income — Security transactions are recorded on the trade date (the date the order to buy or sell is executed). Security gains and losses are determined on the basis of identified cost. |
| |
| | | | Dividend income is accrued as of the ex-dividend date, except that certain dividends for foreign securities where the ex-dividend date may have passed are recorded as soon as the Fund is informed of the dividend in the exercise of reasonable diligence. Interest income, including amortization of premium and accretion of discounts, is accrued on a daily basis. |
| |
| | b) | | Security Valuation — The Fund generally uses market prices in valuing portfolio securities. If market prices are not readily available or are deemed unreliable, the Fund will use the fair value of the security as determined in good faith under policies and procedures established by and under the supervision of the Fund’s Board of Directors. Market prices may be deemed unreliable, for example, if a security is thinly traded or if an event has occurred after the close of the security’s primary market, but before the close of the New York Stock Exchange (the “Exchange”) (generally 4:00 p.m. Eastern Time, referred to as the “Valuation Time”) that is expected to affect the value of the portfolio security. The circumstances in which the Fund may use fair value pricing include, among others: (i) the occurrence of events that are |
14
| | | | significant to a particular issuer, such as mergers, restructuring or defaults; (ii) the occurrence of events that are significant to an entire market, such as natural disasters in a particular region or governmental actions; (iii) trading restrictions on securities; (iv) thinly traded securities and (v) market events such as trading halts and early market closings. In addition, with respect to the valuation of stocks primarily traded on foreign markets, the Fund uses a fair value pricing service approved by the Fund’s Board of Directors, which employs quantitative models that evaluate changes in the value of foreign market proxies (e.g., futures contracts, American Depositary Receipts, exchange traded funds (“ETF’s”)) after the close of the foreign markets but before the Valuation Time. Securities that are primarily traded on foreign markets may trade on days that are not business days of the Fund. The value of the foreign securities in which the Fund invests may change on days when a shareholder will not be able to purchase or redeem shares of the Fund. Fair value pricing is subjective in nature and the use of fair value pricing by the Fund may cause the NAV of its shares to differ significantly from the NAV that would have been calculated using market prices at the close of the exchange on which a portfolio security is primarily traded but before the close of the Exchange. There can be no assurance that the Fund could obtain the fair value assigned to a security if the Fund were to sell the security at approximately the time at which the Fund determines its NAV. |
| |
| | | | Exchange-traded equity securities are valued at the last reported sale price on the exchange or market on which the security is primarily traded (the “Primary Market”) at the Valuation Time. If the security did not trade on the Primary Market, it may be valued at the Valuation Time at the last reported sale price on another exchange where it trades. The value of an equity security not traded on any exchange but traded on the Nasdaq Stock Market, Inc. (“Nasdaq”) or another over-the-counter market shall be valued at the last reported sale price or official closing price on the exchange or market on which the security is traded as of the Valuation Time. |
| |
| | | | Debt securities (other than short-term obligations) held by the Fund are valued using bid prices or using valuations based on a matrix system (which considers factors such as security prices, yield, maturity and ratings) as provided by independent pricing services. Securities for which prices are not available from an independent pricing service may be valued using market quotations obtained from one or more dealers that make markets in the securities in accordance with procedures established by the Fund’s Board of Directors. Generally, the Fund may use fair valuation in regard to debt securities when the Fund holds defaulted or distressed securities or securities in a company in which a reorganization is pending. Short-term investments with a maturity of more than 60 days when purchased are valued based on market quotations until the remaining days to maturity become less than 61 days. Investments that mature in 60 days or less are generally valued at amortized cost, which approximates market value. |
| |
| | | | Foreign-denominated assets, including investment securities, and liabilities are translated from the local currency into U.S. dollars using exchange rates obtained from an independent third party as of the Fund’s Valuation Time. |
| |
| | | | Options contracts on securities, currencies, indices, futures contracts, commodities and other instruments shall be valued at their last reported sale price at the Valuation Time on the Primary Market on which the instrument is primarily traded. If the instrument did not trade on the Primary Market, it may be valued at the most recent sale price at the Valuation Time on another exchange or market where it did trade. If it is not possible to determine the last reported sale price on the Primary Market or another exchange or market at the Valuation Time, the value of the security shall be taken to be the most recent mean between bid and asked prices on such exchange or market at the Valuation Time. Absent both bid and asked prices on such exchange, the bid price may be used. |
| |
| | | | Futures contracts are valued at the most recent settlement price reported by an exchange on which, over time, they are traded most extensively. If a settlement price is not available, futures contracts will be valued at the most recent trade price as of the Valuation Time. If there were no trades, the contract shall be valued at the mean of the closing bid and asked prices as of the Valuation Time. |
| |
| | | | Financial instruments for which prices are not available from an independent pricing service are valued using market quotations obtained from one or more dealers that make markets in securities in accordance with procedures established by the Fund’s Board of Directors. |
15
The Hartford SmallCap Growth Fund
Notes to Financial Statements — (continued)
October 31, 2009
(000’s Omitted)
| | | | Forward foreign currency contracts represent agreements to exchange currencies on specific future dates at predetermined rates. Forward foreign currency contracts are valued using foreign currency exchange rates and forward rates on the Valuation Date from an independent pricing service. |
| |
| | | | Other derivative or contractual type instruments shall be valued using market prices if such instruments trade on an exchange or market. If such instruments do not trade on an exchange or market, such instruments shall be valued at a price at which the counterparty to such contract would repurchase the instrument. In the event that the counterparty cannot provide a price, such valuation may be determined in accordance with procedures established by the Fund’s Board of Directors. |
| |
| | | | Various inputs are used in determining the value of the Fund’s investment. These inputs are summarized into three broad hierarchy levels. This hierarchy is based on whether the valuation inputs are observable or unobservable. These levels are: |
| | • | | Level 1 — Quoted prices in active markets for identical securities. Level 1 may include exchange-traded instruments such as domestic equities, some foreign equities, options, futures, mutual funds, ETF’s, and rights and warrants. |
| |
| | • | | Level 2 — Observable inputs other than Level 1 prices, such as quoted prices for similar securities; quoted prices in markets that are not active; or other inputs that are observable or can be corroborated by observable market data for substantially the full term of the security. Level 2 may include debt securities that are traded less frequently than exchange-traded instruments and that are valued using third party pricing services, foreign equities, whose value is determined using a multi-factor regression model with inputs that are observable in the market; and money market instruments, which are carried at amortized cost. |
| |
| | • | | Level 3 — Significant unobservable inputs that are supported by little or no market activity. Level 3 includes financial instruments whose values are determined using broker quotes or require significant management judgment or estimation. This category may include broker quoted securities and securities where trading has been halted or there are certain restrictions on trading. While these securities are priced using unobservable inputs, the valuation of these securities reflects the best available data and management believes the prices are a reasonable representation of exit price. |
| | | | Individual securities within any of the above mentioned asset classes may be assigned a different hierarchical level than those presented above, as individual circumstances dictate. |
| |
| | | | During the year ended October 31, 2009, the Fund held no Level 3 securities, therefore no reconciliation of Level 3 securities is presented. |
| |
| | | | Refer to the Investment Valuation Hierarchy Level Summary found following the Schedule of Investments. |
| |
| | c) | | Foreign Currency Transactions — Assets and liabilities denominated in currencies other than U.S. dollars are translated into U.S. dollars at the exchange rates in effect on the valuation date. Purchases and sales of investment securities and income and expenses are translated into U.S. dollars at the exchange rates on the dates of such transactions. |
| |
| | | | The Fund does not isolate that portion of portfolio security valuation resulting from fluctuations in the foreign currency exchange rates from the fluctuations arising from changes in the market prices of securities held. Exchange rate fluctuations are included with the net realized and unrealized gain or loss on investments in the accompanying financial statements. |
| |
| | | | Net realized foreign exchange gains or losses arise from sales of foreign currencies and the difference between asset and liability amounts initially stated in foreign currencies and the U.S. dollar value of the amounts actually received or paid. Net unrealized foreign exchange gains or losses arise from changes in the value of other assets and liabilities at the end of the reporting period, resulting from changes in the exchange rates. |
16
| | d) | | Joint Trading Account — Pursuant to an exemptive order issued by the SEC, the Fund may transfer uninvested cash balances into a joint trading account managed by Hartford Investment Management Company (“Hartford Investment Management”) or Wellington Management Company, LLP (“Wellington”). These balances may be invested in one or more repurchase agreements and/or short-term money market instruments. |
| |
| | e) | | Repurchase Agreements — A repurchase agreement is an agreement by which the seller of a security agrees to repurchase the security sold at a mutually agreed upon time and price. At the time the Fund enters into a repurchase agreement, the value of the underlying collateral security(ies), including accrued interest, will be equal to or exceed the value of the repurchase agreement. To minimize counterparty risk, the securities that serve to collateralize the repurchase agreement are held by the Fund’s custodian in book entry or physical form in the custodial account of the Fund or in a third party custodial account. Repurchase agreements are valued at cost plus accrued interest. The Fund, as shown on the Schedule of Investments, had outstanding repurchase agreements as of October 31, 2009. |
| |
| | f) | | Securities Lending — The Fund may lend its securities to certain qualified brokers who pay the Fund negotiated lender fees. The loans are fully collateralized at all times with cash and/or U.S. Government Securities and/or repurchase agreements. The cash collateral is then invested in short-term money market instruments. The repurchase agreements are fully collateralized by U.S. Government Securities. The adequacy of the collateral for securities on loan is monitored on a daily basis. For instances where the market value of collateral falls below the market value of the securities out on loan, such collateral is supplemented on the following business day. |
| |
| | | | While securities are on loan, the Fund is subject to the following risks: 1) that the borrower may default on the loan and that the collateral could be inadequate in the event the borrower defaults, 2) that the earnings on the collateral invested may not be sufficient to pay fees incurred in connection with the loan, 3) that the principal value of the collateral invested may decline and may not be sufficient to pay back the borrower for the amount of the collateral posted, 4) that the borrower may use the loaned securities to cover a short sale which may place downward pressure on the market prices of the loaned securities, 5) that return of loaned securities could be delayed and could interfere with portfolio management decisions and 6) that any efforts to recall the securities for purposes of voting a proxy may not be effective. The Fund had no securities out on loan as of October 31, 2009. |
| |
| | g) | | Forward Foreign Currency Contracts — The Fund may enter into forward foreign currency contracts that obligate the Fund to purchase or sell currencies at specified future dates. Forward foreign currency contracts may be used to hedge against adverse fluctuations in exchange rates between currencies. |
| |
| | | | Forward foreign currency contracts involve elements of market risk in excess of the amount reflected in the Statement of Assets and Liabilities. In addition, risks may arise upon entering into these contracts from the potential inability of the counterparties to meet the terms of the contracts and from unanticipated movements in the value of the foreign currencies relative to the U.S. dollar. The Fund had no outstanding forward foreign currency contracts as of October 31, 2009. |
| |
| | h) | | Indexed Securities — The Fund may invest in indexed securities whose values are linked to changes in interest rates, indices, or other underlying instruments. The Fund may use these securities to increase or decrease its exposure to different underlying instruments and to gain exposure to markets that might be difficult to invest in using conventional securities. Indexed securities may be more volatile than their underlying instruments, but any loss is limited to the amount of the original investment and there may be a limit to the potential appreciation of the investment. The Fund had investments in indexed securities as of October 31, 2009, as shown on the Schedule of Investments under Exchange Traded Funds. |
| |
| | i) | | Fund Share Valuation and Dividend Distributions to Shareholders — Orders for the Fund’s shares are executed in accordance with the investment instructions of the shareholders. The NAV of the Fund’s shares is determined as of the close of each business day of the Exchange. The NAV is determined separately for each class of the Fund by dividing the Fund’s net assets attributable to that class by the number of shares of the class outstanding. Orders for the purchase of the Fund’s shares prior to the close of the Exchange on any day on which the Exchange is open for business are priced at the |
17
The Hartford SmallCap Growth Fund
Notes to Financial Statements — (continued)
October 31, 2009
(000’s Omitted)
| | | | NAV determined as of the close of the Exchange. Orders after the close of the Exchange, or on a day on which the Exchange and/or the Fund is not open for business, are priced at the next determined NAV. |
| |
| | | | The Fund intends to distribute substantially all of its net investment income and net realized capital gains to shareholders no less frequently than once a year. Normally, dividends from net investment income of the Fund are declared and paid annually. Unless shareholders specify otherwise, all dividends will be automatically reinvested in additional full or fractional shares of the Fund. |
| |
| | | | Distributions from net investment income, realized capital gains and capital are determined in accordance with federal income tax regulations, which may differ from U.S. GAAP with respect to character and timing. These differences may include but are not limited to losses deferred due to wash sale adjustments, foreign currency gains and losses, adjustments related to Passive Foreign Investment Companies (“PFICs”), Real Estate Investment Trusts (“REITs”), Regulated Investment Companies (“RICs”), certain derivatives and partnerships. Permanent book and federal income tax basis differences relating to shareholder distributions will result in reclassifications to certain of the Fund’s capital accounts (see Federal Income Taxes: Reclassification of Capital Accounts footnote). |
| |
| | j) | | Use of Estimates — The preparation of financial statements in conformity with U.S. GAAP requires management to make estimates and assumptions that affect the reported amounts of assets and liabilities as of the date of the financial statements and the reported amounts of income and expenses during the period. Operating results in the future could vary from the amounts derived from management’s estimates. |
| |
| | k) | | Additional Derivative Instrument(s) Information |
| |
| | | | Derivative Instrument(s) as of October 31, 2009. |
| | | | | | | | | | | | | |
| | | Asset Derivatives | | | Liability Derivatives | |
| Risk Exposure Category | | Statement of Assets and Liabilities Location | | | Statement of Assets and Liabilities Location | |
| Equity contracts | | | | | | Summary of Net Assets — Unrealized | | | | |
| | | | | | | depreciation | | $ | 16 | |
| | | | The volume of derivatives that is presented in the Schedule of Investments is consistent with the derivative activity during the year ended October 31, 2009. |
| |
| | | | Realized Gain/Loss and Change in Unrealized Appreciation (Depreciation) on Derivative Instruments for the year ended October 31, 2009: |
| | | | | | | | | | | | | | | | | | | | | | | | | |
| Amount of Realized Gain or (Loss) on Derivatives Recognized in Income | |
| | | | | | | | | | | | | | | Forward | | | | | | | |
| | | | | | | Purchased | | | | | | | Currency | | | | | | | |
| Risk Exposure Category | | Written Options | | | Options | | | Futures | | | Contracts | | | Swaps | | | Total | |
| Foreign exchange contracts | | $ | — | | | $ | — | | | $ | — | | | $ | — | | | $ | — | | | $ | — | |
| Equity contracts | | | — | | | | — | | | | 165 | | | | — | | | | — | | | | 165 | |
| | | | | | | | | | | | | | | | | | | |
| Total | | $ | — | | | $ | — | | | $ | 165 | | | $ | — | | | $ | — | | | $ | 165 | |
| | | | | | | | | | | | | | | | | | | |
| | | | | | | | | | | | | | | | | | | | | | | | | |
| Change in Unrealized Appreciation or (Depreciation) on Derivatives Recognized in Income | |
| | | | | | | | | | | | | | | Forward | | | | | | | |
| | | | | | | Purchased | | | | | | | Currency | | | | | | | |
| Risk Exposure Category | | Written Options | | | Options | | | Futures | | | Contracts | | | Swaps | | | Total | |
| Equity contracts | | | — | | | | — | | | | 68 | | | | — | | | | — | | | $ | 68 | |
| | | | | | | | | | | | | | | | | | | |
| Total | | $ | — | | | $ | — | | | $ | 68 | | | $ | — | | | $ | — | | | $ | 68 | |
| | | | | | | | | | | | | | | | | | | |
18
| | l) | | Indemnifications — Under the Company’s organizational documents, the Company shall indemnify its officers and directors to the full extent required or permitted under Maryland General Corporation Law and the federal securities law. In addition, the Company, on behalf of the Fund, may enter into contracts that contain a variety of indemnifications. The Company’s maximum exposure under these arrangements is unknown. However, the Company has not had prior claims or losses pursuant to these contracts and expects the risk of loss to be remote. |
| | | | Futures and Options Transactions — The Fund is subject to equity price risk, interest rate risk and foreign currency exchange rate risk in the normal course of pursuing its investment objectives. The Fund may invest in futures and options contracts in order to gain exposure to or hedge against changes in the value of equities, interest rates or foreign currencies. A futures contract is an agreement between two parties to buy and sell a security at a set price on a future date. When the Fund enters into such futures contracts, it is required to deposit with a futures commission merchant an amount of “initial margin” of cash, commercial paper or U.S. Treasury Bills. Subsequent payments, called variation margin, to and from the broker, are made on a daily basis as the price of the underlying asset fluctuates, making the long and short positions in the futures contract more or less valuable (i.e., mark-to-market), which results in an unrealized gain or loss to the Fund. |
| |
| | | | At any time prior to the expiration of the futures contract, the Fund may close the position by taking an opposite position, which would effectively terminate the position in the futures contract. A final determination of variation margin is then made, additional cash is required to be paid by or released to the Fund and the Fund realizes a gain or loss. |
| |
| | | | The use of futures contracts involves elements of market risk, which may exceed the amounts recognized in the Statement of Assets and Liabilities. Changes in the value of the futures contracts may decrease the effectiveness of the Fund’s strategy and potentially result in loss. With futures, there is minimal counterparty risk to the Fund since futures are exchange traded through a clearing house. The clearing house requires sufficient collateral to cover margins. The Fund, as shown on the Schedule of Investments, had outstanding futures contracts as of October 31, 2009. |
| |
| | | | An option contract is a contract sold by one party to another party that offers the buyer the right, but not the obligation, to buy (call) or sell (put) a security or other financial asset at an agreed-upon price during a specific period of time or on a specific date. The premium paid by the Fund for the purchase of a call or put option is included in the Fund’s Statement of Assets and Liabilities as an investment and subsequently “marked-to-market” through net unrealized appreciation (depreciation) of options to reflect the current market value of the option as of the end of the reporting period. |
| |
| | | | The Fund may write (sell) covered options. “Covered” means that so long as the Fund is obligated as the writer of an option, it will own either the underlying securities or currency or an option to purchase the same underlying securities or currency having an expiration date of the covered option and an exercise price equal to or less than the exercise price of the covered option, or will pledge cash or other liquid securities having a value equal to or greater than the fluctuating market value of the option securities or currencies. The Fund receives a premium for writing a call or put option, which is recorded on the Fund’s Statement of Assets and Liabilities and subsequently “marked-to-market” through net unrealized appreciation (depreciation) of options. There is a risk of loss from a change in the value of such options, which may exceed the related premiums received. The maximum amount of loss with respect to the Fund’s written put option is the cost of buying the underlying security or currency from the counterparty. The maximum loss may be offset by proceeds received from selling the underlying securities. As of October 31, 2009, there were no outstanding purchased or written option contracts. |
| | a) | | Federal Income Taxes — For federal income tax purposes, the Fund intends to continue to qualify as a RIC under Subchapter M of the Internal Revenue Code (“IRC”) by distributing substantially all of its taxable net investment income and net realized capital gains to its shareholders and otherwise complying with the requirements of regulated investment companies. The Fund has distributed substantially all of its income and capital gains in prior years and intends to |
19
The Hartford SmallCap Growth Fund
Notes to Financial Statements — (continued)
October 31, 2009
(000’s Omitted)
| | | | distribute substantially all of its income and capital gains during the calendar year ending December 31, 2009. Accordingly, no provision for federal income or excise taxes has been made in the accompanying financial statements. Distributions from short-term capital gains are treated as ordinary income distributions for federal income tax purposes. |
| |
| | b) | | Net Investment Income (Loss), Realized Gains and (Losses) — Net investment income (loss) and net realized gains (losses) may differ for financial statement and tax purposes primarily because of losses deferred due to wash sale adjustments, foreign currency gains and losses, adjustments related to PFICs, REITs, RICs, certain derivatives and partnerships. The character of distributions made during the year from net investment income or realized gains may differ from their ultimate characterization for federal income tax purposes. Also, due to the timing of dividend distributions, the fiscal year in which amounts are distributed may differ from the year that the income or realized gains (losses) were recorded by the Fund. |
| |
| | c) | | Distributions and Components of Distributable Earnings — The tax character of distributions paid by the Fund for the periods indicated is as follows (as adjusted for dividends payable): |
| | | | | | | | | |
| | | For the Year Ended | | For the Year Ended |
| | | October 31, 2009 | | October 31, 2008 |
| Ordinary Income | | $ | — | | | $ | 5,569 | |
| Long-Term Capital Gains * | | | — | | | | 33,708 | |
| | |
| * | | The Fund designates these distributions as long-term capital gain dividends pursuant to IRC code Sec. 852(b)(3)(C). |
| |
| | | As of October 31, 2009, the Fund’s components of distributable earnings (deficit) on a tax basis were as follows: |
| | | | | |
| | | Amount | |
| Accumulated Capital Losses * | | $ | (105,928 | ) |
| Unrealized Depreciation † | | | (1,287 | ) |
| | | | |
| Total Accumulated Deficit | | $ | (107,215 | ) |
| | | | |
| | |
| * | | The Fund has capital loss carryforwards that are identified in the Capital Loss Carryforward note that follows. |
| |
| † | | The differences between book-basis and tax-basis unrealized appreciation (depreciation) may be attributable to the losses deferred due to wash sale adjustments, foreign currency gains and losses, adjustments related to PFICs, REITs, RICs, certain derivatives and partnerships. |
| | d) | | Reclassification of Capital Accounts — The Fund may record reclassifications in its capital accounts. These reclassifications have no impact on the total net assets of the Fund. The reclassifications are a result of permanent differences between GAAP and tax accounting for such items as net operating losses that reduce distribution requirements. Adjustments are made to reflect the impact these items have on current and future distributions to shareholders. Therefore, the source of the Fund’s distributions may be shown in the accompanying Statement of Changes in Net Assets as from net investment income, from net realized gains on investments or from capital depending on the type of book and tax differences that exist. For the year ended October 31, 2009, the Fund recorded reclassifications to increase accumulated undistributed net investment income by $576, increase accumulated net realized gain on investments by $109, and decrease paid-in-capital by $685. |
| | e) | | Capital Loss Carryforward — At October 31, 2009 (tax-year-end), the Fund had capital loss carryforwards for U.S. federal income tax purposes of approximately: |
| | | | | |
| Year of Expiration | | Amount | |
| 2016 | | $ | 46,989 | |
| 2017 | | | 58,939 | |
| | | | |
Total | | $ | 105,928 | |
| | | | |
20
| | f) | | Accounting for Uncertainty in Income Taxes — Management has evaluated all open tax years and has determined there is no impact to the Fund’s financial statements related to uncertain tax positions. Generally, tax authorities can examine all tax returns filed for the last three years. |
| | a) | | Investment Management Agreement — Hartford Investment Financial Services, LLC (“HIFSCO”) serves as investment manager to the Fund pursuant to an Investment Management Agreement with the Company. As investment manager, HIFSCO has overall investment supervisory responsibility for the Fund. In addition, HIFSCO provides administrative personnel, services, equipment, facilities and office space for proper operation of the Fund. HIFSCO has contracted with Hartford Investment Management and Wellington for the provision of day-to-day investment management services to the Fund in accordance with the Fund’s investment objective and policies. The Fund pays a fee to HIFSCO, a portion of which may be used to compensate Hartford Investment Management and Wellington. |
| |
| | | | The schedule below reflects the rates of compensation paid to HIFSCO for investment management services rendered during the year ended October 31, 2009; the rates are accrued daily and paid monthly: |
| | | | | |
| Average Daily Net Assets | | Annual Fee |
| On first $100 million | | | 0.90 | % |
| On next $150 million | | | 0.80 | % |
| On next $250 million | | | 0.70 | % |
| On next $4.5 billion | | | 0.65 | % |
| On next $5 billion | | | 0.63 | % |
| Over $10 billion | | | 0.62 | % |
| | b) | | Accounting Services Agreement — Pursuant to the Fund Accounting Agreement between Hartford Life Insurance Company (“HLIC”) and the Fund, HLIC provides accounting services to the Fund and receives monthly compensation on the Fund’s average net assets. The Fund’s accounting services fees are accrued daily and paid monthly. |
| | | | | |
| Average Daily Net Assets | | Annual Fee |
| On first $5 billion | | | 0.016 | % |
| On next $5 billion | | | 0.014 | % |
| Over $10 billion | | | 0.012 | % |
| | c) | | Operating Expenses — Allocable expenses incurred by the Company are allocated to each Fund and allocated to classes within the Fund in proportion to the average daily net assets of the Fund and each class, except where allocation of certain expenses is more fairly made directly to the Fund or to specific classes within a Fund. During the year ended October 31, 2009, HIFSCO has contractually limited the total operating expenses of this Fund, exclusive of taxes, interest expense, brokerage commissions, certain distribution expenses and extraordinary expenses as follows: |
| | | | | | | | | | | | | | | | | |
| Class A | | Class B | | Class C | | Class I | | Class L | | Class R3 | | Class R4 | | Class R5 | | Class Y |
| 1.40% | | 2.15% | | 2.15% | | 1.15% | | 1.25% | | 1.65% | | 1.35% | | 1.05% | | 1.05% |
| | d) | | Fees Paid Indirectly — The Fund has entered into agreements with State Street Global Markets, LLC and Russell Implementation Services Inc. to partially recapture non-discounted trade commissions. Such rebates are used to pay a portion of the Fund’s expenses. In addition, the Fund’s custodian bank has also agreed to reduce its fees when the Fund maintains cash on deposit in a non-interest-bearing custody account. For the year ended October 31, 2009, these amounts are included in the Statement of Operations. |
21
The Hartford SmallCap Growth Fund
Notes to Financial Statements — (continued)
October 31, 2009
(000’s Omitted)
| | | | The ratio of expenses to average net assets in the accompanying financial highlights excludes the reduction in expenses related to fees paid indirectly. Had the fees paid indirectly been included, the annualized expense ratio for the periods listed below would have been as follows: |
| | | | | | | | | | | | | | | | | | | | | |
| | | Year Ended | | Year Ended | | Year Ended | | Year Ended | | Year Ended |
| | | October 31, | | October 31, | | October 31, | | October 31, | | October 31, |
| | | 2009 | | 2008 | | 2007 | | 2006 | | 2005 |
| Class A Shares | | | 1.07 | % | | | 1.20 | % | | | 1.30 | % | | | 1.34 | % | | | 1.38 | % |
| Class B Shares | | | 1.49 | | | | 1.83 | | | | 2.00 | | | | 2.00 | | | | 2.13 | |
| Class C Shares | | | 1.86 | | | | 2.10 | | | | 2.14 | | | | 2.13 | | | | 2.13 | |
| Class I Shares | | | 1.08 | | | | 1.15 | | | | 1.15 | | | | 1.15 | * | | | | |
| Class L Shares | | | 1.24 | | | | 1.12 | | | | 1.15 | | | | 1.13 | | | | 1.20 | |
| Class R3 Shares | | | 1.64 | | | | 1.46 | | | | 1.65 | † | | | | | | | | |
| Class R4 Shares | | | 1.34 | | | | 1.28 | | | | 1.35 | † | | | | | | | | |
| Class R5 Shares | | | 1.04 | | | | 1.03 | | | | 1.05 | † | | | | | | | | |
| Class Y Shares | | | 1.02 | | | | 0.89 | | | | 0.93 | | | | 0.90 | | | | 0.97 | |
| | |
| * | | From August 31, 2006 (commencement of operations), through October 31, 2006. |
| |
| † | | From December 22, 2006 (commencement of operations), through October 31, 2007. |
| | e) | | Distribution and Service Plan for Class A, B, C, L, R3 and R4 Shares — HIFSCO is the principal underwriter and distributor of the Fund. HIFSCO is engaged in distribution activities, which include marketing and distribution of shares through broker-dealers, financing distribution costs and maintaining financial books and records. For the year ended October 31, 2009, HIFSCO received front-end load sales charges of $168 and contingent deferred sales charges of $19 from the Fund. |
| |
| | | | The Fund has adopted a Distribution and Service Plan in accordance with Rule 12b-1 of the Investment Company Act of 1940, as amended, to compensate the distributor (HIFSCO) for activities intended to result in the sale and distribution of Classes A, B, C, L, R3 and R4 shares and for providing services for shareholders. The Rule 12b-1 plan applicable to Class A shares of the Fund provides for payment of a Rule 12b-1 fee of up to 0.35% of average daily net assets; however, the Board of Directors has currently authorized 12b-1 payments of up to 0.25%. Some or all of the fee may be used for shareholder servicing expenses with the remainder used for distribution expenses. Some or the entire Rule 12b-1 fee for Class B shares may be remitted to broker-dealers for distribution and/or shareholder account services. Under the Class B Plan, the Fund pays the distributor 1.00% of the average daily net assets of Class B shares that are outstanding for 8 years or less, 0.25% of which is a fee for services provided to existing shareholders with the remainder used for distribution expenses. After eight years, Class B shares convert to Class A shares. Upon conversion to Class A shares, the Class A plan described above will apply to those shares. Under the Class C Plan, the Fund pays the Distributor 1.00% of the average daily net assets of Class C shares outstanding, 0.25% of which is intended as a fee for services provided to existing shareholders with the remainder used for distribution expenses. For Class C shares, some or the entire fee may be remitted to broker-dealers for distribution and/or shareholder account services. Class L has a distribution fee of 0.25%. Class R3 shares have a distribution fee of 0.50% and Class R4 shares have a distribution fee of 0.25%. For Classes R3 and R4 shares, some or the entire fee may be remitted to broker dealers for distribution and/or shareholder account services. The Fund’s 12b-1 fees are accrued daily and paid monthly. |
| |
| | | | For the year ended October 31, 2009, total sales commissions paid to affiliated brokers/dealers of The Hartford for distributing the Fund’s shares were $47. These commissions are in turn paid to sales representatives of the broker/dealers. |
| |
| | f) | | Other Related Party Transactions — Certain officers of the Fund are directors and/or officers of HIFSCO and/or The Hartford or its subsidiaries. For the year ended October 31, 2009, a portion of the Fund’s chief compliance officer’s salary was paid by all the investment companies in the Hartford fund complex. The portion allocated to the Fund rounds to zero. Hartford Administrative Services Company (“HASCO”), an indirect wholly owned subsidiary of The Hartford, provides transfer agent services to the Fund. HASCO has contractually agreed to reimburse any portion of the transfer |
22
| | | | agency fees over 0.30% of average daily net assets per fiscal year for all classes. HASCO was compensated $166 for providing such services. These fees are accrued daily and paid monthly. |
| |
| | | | Administrative services fees are paid to HASCO for third-party recordkeeping services that are payable as a percentage of net assets in the amount of 0.20%, 0.15% and 0.10% for Classes R3, R4 and R5 shares, respectively. The total administrative services fees are shown on the Statement of Operations. These fees are accrued daily and paid monthly. |
| |
| | g) | | Payments from Affiliate — The total return in the accompanying financial highlights includes payment from affiliates. Had the payment from affiliates been excluded, the total return for the periods listed below would have been as follows: |
| | | | | | | | | |
| | | Impact from | | Total Return |
| | | Payment from | | Excluding |
| | | Affiliate for | | Payment from |
| | | SEC Settlement | | Affiliate for |
| | | for the Year | | the Year |
| | | Ended | | Ended |
| | | October 31, | | October 31, |
| | | 2007 | | 2007 |
| Class A | | | 0.01 | % | | | 7.17 | % |
| Class B | | | 0.01 | | | | 6.43 | |
| Class C | | | 0.01 | | | | 6.33 | |
| Class I | | | 0.01 | | | | 7.36 | |
| Class L | | | 0.01 | | | | 7.40 | |
| Class Y | | | 0.01 | | | | 7.60 | |
| 6. | | Investment Transactions: |
| |
| | | For the year ended October 31, 2009, the Fund’s aggregate purchases and sales of investment securities (excluding short-term investments) were as follows: |
| | | | | |
| | | Amount |
| Cost of Purchases Excluding U.S. Government Obligations | | $ | 119,291 | |
| Sales Proceeds Excluding U.S. Government Obligations | | | 176,776 | |
23
The Hartford SmallCap Growth Fund
Notes to Financial Statements — (continued)
October 31, 2009
(000’s Omitted)
| 7. | | Capital Share Transactions: |
| |
| | | The following information is for the year ended October 31, 2009 and the year ended October 31, 2008: |
| | | | | | | | | | | | | | | | | | | | | | | | | | | | | | | | | | | | | | | | | |
| | | For the Year Ended October 31, 2009 | | For the Year Ended October 31, 2008 |
| | | | | | | Shares | | | | | | Shares | | | | | | | | | | Shares | | | | | | Shares | | |
| | | | | | | Issued for | | | | | | Issued | | Net Increase | | | | | | Issued for | | | | | | Issued | | Net Increase |
| | | Shares | | Reinvested | | Shares | | from | | (Decrease) of | | Shares | | Reinvested | | Shares | | from | | (Decrease) of |
| | | Sold | | Dividends | | Redeemed | | Merger | | Shares | | Sold | | Dividends | | Redeemed | | Merger | | Shares |
| Class A | | | | | | | | | | | | | | | | | | | | | | | | | | | | | | | | | | | | | | | | |
| Shares | | | 442 | | | | — | | | | (2,477 | ) | | | — | | | | (2,035 | ) | | | 899 | | | | 556 | | | | (2,047 | ) | | | — | | | | (592 | ) |
| Amount | | $ | 7,726 | | | $ | — | | | $ | (44,695 | ) | | $ | — | | | $ | (36,969 | ) | | $ | 22,336 | | | $ | 15,454 | | | $ | (51,413 | ) | | $ | — | | | $ | (13,623 | ) |
| Class B | | | | | | | | | | | | | | | | | | | | | | | | | | | | | | | | | | | | | | | | |
| Shares | | | 40 | | | | — | | | | (124 | ) | | | — | | | | (84 | ) | | | 59 | | | | 74 | | | | (177 | ) | | | — | | | | (44 | ) |
| Amount | | $ | 630 | | | $ | — | | | $ | (1,876 | ) | | $ | — | | | $ | (1,246 | ) | | $ | 1,314 | | | $ | 1,809 | | | $ | (3,913 | ) | | $ | — | | | $ | (790 | ) |
| Class C | | | | | | | | | | | | | | | | | | | | | | | | | | | | | | | | | | | | | | | | |
| Shares | | | 121 | | | | — | | | | (217 | ) | | | — | | | | (96 | ) | | | 106 | | | | 98 | | | | (348 | ) | | | — | | | | (144 | ) |
| Amount | | $ | 1,807 | | | $ | — | | | $ | (3,277 | ) | | $ | — | | | $ | (1,470 | ) | | $ | 2,375 | | | $ | 2,399 | | | $ | (7,761 | ) | | $ | — | | | $ | (2,987 | ) |
| Class I | | | | | | | | | | | | | | | | | | | | | | | | | | | | | | | | | | | | | | | | |
| Shares | | | 114 | | | | — | | | | (67 | ) | | | — | | | | 47 | | | | 105 | | | | 14 | | | | (86 | ) | | | — | | | | 33 | |
| Amount | | $ | 2,031 | | | $ | — | | | $ | (1,168 | ) | | $ | — | | | $ | 863 | | | $ | 2,604 | | | $ | 407 | | | $ | (2,216 | ) | | $ | — | | | $ | 795 | |
| Class L | | | | | | | | | | | | | | | | | | | | | | | | | | | | | | | | | | | | | | | | |
| Shares | | | 125 | | | | — | | | | (495 | ) | | | — | | | | (370 | ) | | | 123 | | | | 480 | | | | (676 | ) | | | — | | | | (73 | ) |
| Amount | | $ | 2,190 | | | $ | — | | | $ | (8,745 | ) | | $ | — | | | $ | (6,555 | ) | | $ | 3,116 | | | $ | 13,446 | | | $ | (17,155 | ) | | $ | — | | | $ | (593 | ) |
| Class R3 | | | | | | | | | | | | | | | | | | | | | | | | | | | | | | | | | | | | | | | | |
| Shares | | | 10 | | | | — | | | | (1 | ) | | | — | | | | 9 | | | | — | | | | — | | | | — | | | | — | | | | — | |
| Amount | | $ | 156 | | | $ | — | | | $ | (25 | ) | | $ | — | | | $ | 131 | | | $ | 3 | | | $ | 1 | | | $ | — | | | $ | — | | | $ | 4 | |
| Class R4 | | | | | | | | | | | | | | | | | | | | | | | | | | | | | | | | | | | | | | | | |
| Shares | | | 44 | | | | — | | | | (23 | ) | | | — | | | | 21 | | | | 77 | | | | 1 | | | | (18 | ) | | | — | | | | 60 | |
| Amount | | $ | 845 | | | $ | — | | | $ | (450 | ) | | $ | — | | | $ | 395 | | | $ | 1,985 | | | $ | 30 | | | $ | (473 | ) | | $ | — | | | $ | 1,542 | |
| Class R5 | | | | | | | | | | | | | | | | | | | | | | | | | | | | | | | | | | | | | | | | |
| Shares | | | 66 | | | | — | | | | (5 | ) | | | — | | | | 61 | | | | 2 | | | | — | | | | — | | | | — | | | | 2 | |
| Amount | | $ | 1,100 | | | $ | — | | | $ | (94 | ) | | $ | — | | | $ | 1,006 | | | $ | 65 | | | $ | 1 | | | $ | (11 | ) | | $ | — | | | $ | 55 | |
| Class Y | | | | | | | | | | | | | | | | | | | | | | | | | | | | | | | | | | | | | | | | |
| Shares | | | 178 | | | | — | | | | (1,391 | ) | | | — | | | | (1,213 | ) | | | 484 | | | | 161 | | | | (402 | ) | | | — | | | | 243 | |
| Amount | | $ | 3,178 | | | $ | — | | | $ | (22,517 | ) | | $ | — | | | $ | (19,339 | ) | | $ | 12,562 | | | $ | 4,585 | | | $ | (10,638 | ) | | $ | — | | | $ | 6,509 | |
| | | The following reflects the conversion of Class B Shares into Class A Shares (reflected as Class A Shares issued) for the year ended October 31, 2009 and the year ended October 31, 2008: |
| | | | | | | | | |
| | | Shares | | Dollars |
| For the Year Ended October 31, 2009 | | | 11 | | | $ | 191 | |
| For the Year Ended October 31, 2008 | | | 10 | | | $ | 265 | |
| 8. | | Line of Credit: |
| |
| | | The Fund is one of several Hartford Funds that participate in a $500 million committed revolving line of credit facility. The facility is to be used for temporary or emergency purposes. Under the arrangement, the Fund is required to own securities having a market value in excess of 300% of the total bank borrowings. The interest rate on borrowings varies depending on the nature of the loan. The facility also requires a fee to be paid based on the amount of the commitment. This fee is allocated to all the Funds participating in the line of credit based on the average net assets of the Funds. During the year ended October 31, 2009, the Fund did not have any borrowings under this facility. |
24
| 9. | | Industry Classifications: |
| |
| | | Other than the industry classifications “Other Investment Pools and Funds” and “Exchange Traded Funds”, equity industry classifications used in this report are the Global Industry Classification Standard, which was developed by and is the exclusive property and service mark of MSCI, Inc. and Standard & Poor’s. |
| |
| 10. | | Subsequent Events: |
| |
| | | Management has evaluated subsequent events through December 15, 2009, the date of issuance of the Fund’s financial statements, and has determined that no additional items require disclosure. |
25
The Hartford SmallCap Growth Fund
Financial Highlights
- Selected Per-Share Data (a) -
| | | | | | | | | | | | | | | | | | | | | | | | | | | | | | | | | | | | | | | | | | | | | |
| | | Net Asset | | | | | | | | | | Net Realized | | | | | | | | | | | | | | | | | | | | | | Net Increase | | |
| | | Value at | | | | | | | | | | and Unrealized | | Total from | | Dividends from | | Distributions | | | | | | | | | | (Decrease) in | | Net Asset |
| | | Beginning of | | Net Investment | | Payments from | | Gain (Loss) on | | Investment | | Net Investment | | from Realized | | Distributions | | Total | | Net Asset | | Value at End |
| Class | | Period | | Income (Loss) | | (to) Affiliate | | Investments | | Operations | | Income | | Capital Gains | | from Capital | | Distributions | | Value | | of Period |
| For the Year Ended October 31, 2009 | | | | | | | | | | | | | | | | | | | | | | | | | | | | | | | | | | | | |
| A | | $ | 18.47 | | | $ | (0.05 | ) | | $ | — | | | $ | 2.03 | | | $ | 1.98 | | | $ | — | | | $ | — | | | $ | — | | | $ | — | | | $ | 1.98 | | | $ | 20.45 | |
| B | | | 16.13 | | | | (0.11 | ) | | | — | | | | 1.76 | | | | 1.65 | | | | — | | | | — | | | | — | | | | — | | | | 1.65 | | | | 17.78 | |
| C | | | 16.03 | | | | (0.17 | ) | | | — | | | | 1.74 | | | | 1.57 | | | | — | | | | — | | | | — | | | | — | | | | 1.57 | | | | 17.60 | |
| I | | | 18.53 | | | | (0.05 | ) | | | — | | | | 2.02 | | | | 1.97 | | | | — | | | | — | | | | — | | | | — | | | | 1.97 | | | | 20.50 | |
| L | | | 18.62 | | | | (0.08 | ) | | | — | | | | 2.02 | | | | 1.94 | | | | — | | | | — | | | | — | | | | — | | | | 1.94 | | | | 20.56 | |
| R3 | | | 18.79 | | | | (0.11 | ) | | | — | | | | 2.03 | | | | 1.92 | | | | — | | | | — | | | | — | | | | — | | | | 1.92 | | | | 20.71 | |
| R4 | | | 18.88 | | | | (0.09 | ) | | | — | | | | 2.05 | | | | 1.96 | | | | — | | | | — | | | | — | | | | — | | | | 1.96 | | | | 20.84 | |
| R5 | | | 18.99 | | | | (0.05 | ) | | | — | | | | 2.08 | | | | 2.03 | | | | — | | | | — | | | | — | | | | — | | | | 2.03 | | | | 21.02 | |
| Y | | | 19.03 | | | | 0.01 | | | | — | | | | 2.02 | | | | 2.03 | | | | — | | | | — | | | | — | | | | — | | | | 2.03 | | | | 21.06 | |
| | | | | | | | | | | | | | | | | | | | | | | | | | | | | | | | | | | | | | | | | | | | | |
| For the Year Ended October 31, 2008 | | | | | | | | | | | | | | | | | | | | | | | | | | | | | | | | | | | | |
| A | | | 33.57 | | | | (0.07 | ) | | | — | | | | (11.68 | ) | | | (11.75 | ) | | | — | | | | (3.35 | ) | | | — | | | | (3.35 | ) | | | (15.10 | ) | | | 18.47 | |
| B | | | 29.93 | | | | (0.21 | ) | | | — | | | | (10.24 | ) | | | (10.45 | ) | | | — | | | | (3.35 | ) | | | — | | | | (3.35 | ) | | | (13.80 | ) | | | 16.13 | |
| C | | | 29.85 | | | | (0.29 | ) | | | — | | | | (10.18 | ) | | | (10.47 | ) | | | — | | | | (3.35 | ) | | | — | | | | (3.35 | ) | | | (13.82 | ) | | | 16.03 | |
| I | | | 33.64 | | | | (0.04 | ) | | | — | | | | (11.72 | ) | | | (11.76 | ) | | | — | | | | (3.35 | ) | | | — | | | | (3.35 | ) | | | (15.11 | ) | | | 18.53 | |
| L | | | 33.78 | | | | (0.05 | ) | | | — | | | | (11.76 | ) | | | (11.81 | ) | | | — | | | | (3.35 | ) | | | — | | | | (3.35 | ) | | | (15.16 | ) | | | 18.62 | |
| R3 | | | 34.16 | | | | (0.12 | ) | | | — | | | | (11.90 | ) | | | (12.02 | ) | | | — | | | | (3.35 | ) | | | — | | | | (3.35 | ) | | | (15.37 | ) | | | 18.79 | |
| R4 | | | 34.26 | | | | (0.06 | ) | | | — | | | | (11.97 | ) | | | (12.03 | ) | | | — | | | | (3.35 | ) | | | — | | | | (3.35 | ) | | | (15.38 | ) | | | 18.88 | |
| R5 | | | 34.34 | | | | (0.02 | ) | | | — | | | | (11.98 | ) | | | (12.00 | ) | | | — | | | | (3.35 | ) | | | — | | | | (3.35 | ) | | | (15.35 | ) | | | 18.99 | |
| Y | | | 34.38 | | | | 0.02 | | | | — | | | | (12.02 | ) | | | (12.00 | ) | | | — | | | | (3.35 | ) | | | — | | | | (3.35 | ) | | | (15.35 | ) | | | 19.03 | |
| | | | | | | | | | | | | | | | | | | | | | | | | | | | | | | | | | | | | | | | | | | | | |
| For the Year Ended October 31, 2007 | | | | | | | | | | | | | | | | | | | | | | | | | | | | | | | | | | | | |
| A | | | 31.32 | | | | (0.13 | ) | | | — | | | | 2.38 | | | | 2.25 | | | | — | | | | — | | | | — | | | | — | | | | 2.25 | | | | 33.57 | |
| B | | | 28.12 | | | | (0.31 | ) | | | — | | | | 2.12 | | | | 1.81 | | | | — | | | | — | | | | — | | | | — | | | | 1.81 | | | | 29.93 | |
| C | | | 28.07 | | | | (0.35 | ) | | | — | | | | 2.13 | | | | 1.78 | | | | — | | | | — | | | | — | | | | — | | | | 1.78 | | | | 29.85 | |
| I | | | 31.33 | | | | (0.03 | ) | | | — | | | | 2.34 | | | | 2.31 | | | | — | | | | — | | | | — | | | | — | | | | 2.31 | | | | 33.64 | |
| L(f) | | | 31.45 | | | | (0.13 | ) | | | — | | | | 2.46 | | | | 2.33 | | | | — | | | | — | | | | — | | | | — | | | | 2.33 | | | | 33.78 | |
| R3(g) | | | 32.34 | | | | (0.19 | ) | | | — | | | | 2.01 | | | | 1.82 | | | | — | | | | — | | | | — | | | | — | | | | 1.82 | | | | 34.16 | |
| R4(g) | | | 32.34 | | | | (0.02 | ) | | | — | | | | 1.94 | | | | 1.92 | | | | — | | | | — | | | | — | | | | — | | | | 1.92 | | | | 34.26 | |
| R5(g) | | | 32.34 | | | | (0.01 | ) | | | — | | | | 2.01 | | | | 2.00 | | | | — | | | | — | | | | — | | | | — | | | | 2.00 | | | | 34.34 | |
| Y | | | 31.95 | | | | 0.02 | | | | — | | | | 2.41 | | | | 2.43 | | | | — | | | | — | | | | — | | | | — | | | | 2.43 | | | | 34.38 | |
| | | | | | | | | | | | | | | | | | | | | | | | | | | | | | | | | | | | | | | | | | | | | |
| For the Year Ended October 31, 2006 | | | | | | | | | | | | | | | | | | | | | | | | | | | | | | | | | | | | |
| A | | | 28.30 | | | | (0.06 | ) | | | — | | | | 3.08 | | | | 3.02 | | | | — | | | | — | | | | — | | | | — | | | | 3.02 | | | | 31.32 | |
| B | | | 25.57 | | | | (0.26 | ) | | | — | | | | 2.81 | | | | 2.55 | | | | — | | | | — | | | | — | | | | — | | | | 2.55 | | | | 28.12 | |
| C | | | 25.56 | | | | (0.27 | ) | | | — | | | | 2.78 | | | | 2.51 | | | | — | | | | — | | | | — | | | | — | | | | 2.51 | | | | 28.07 | |
| I(j) | | | 28.90 | | | | (0.01 | ) | | | — | | | | 2.44 | | | | 2.43 | | | | — | | | | — | | | | — | | | | — | | | | 2.43 | | | | 31.33 | |
| L | | | 28.36 | | | | (0.02 | ) | | | — | | | | 3.11 | | | | 3.09 | | | | — | | | | — | | | | — | | | | — | | | | 3.09 | | | | 31.45 | |
| Y | | | 28.74 | | | | 0.04 | | | | — | | | | 3.17 | | | | 3.21 | | | | — | | | | — | | | | — | | | | — | | | | 3.21 | | | | 31.95 | |
| | | | | | | | | | | | | | | | | | | | | | | | | | | | | | | | | | | | | | | | | | | | | |
| For the Year Ended October 31, 2005 | | | | | | | | | | | | | | | | | | | | | | | | | | | | | | | | | | | | |
| A | | | 24.60 | | | | (0.15 | ) | | | — | | | | 3.85 | | | | 3.70 | | | | — | | | | — | | | | — | | | | — | | | | 3.70 | | | | 28.30 | |
| B | | | 22.39 | | | | (0.32 | ) | | | — | | | | 3.50 | | | | 3.18 | | | | — | | | | — | | | | — | | | | — | | | | 3.18 | | | | 25.57 | |
| C | | | 22.39 | | | | (0.28 | ) | | | — | | | | 3.45 | | | | 3.17 | | | | — | | | | — | | | | — | | | | — | | | | 3.17 | | | | 25.56 | |
| L | | | 24.60 | | | | (0.13 | ) | | | — | | | | 3.89 | | | | 3.76 | | | | — | | | | — | | | | — | | | | — | | | | 3.76 | | | | 28.36 | |
| Y | | | 24.88 | | | | (0.04 | ) | | | — | | | | 3.90 | | | | 3.86 | | | | — | | | | — | | | | — | | | | — | | | | 3.86 | | | | 28.74 | |
| | |
| (a) | | Information presented relates to a share outstanding throughout the indicated period. |
| |
| (b) | | Assumes initial investment at net asset value at the beginning of each period, reinvestment of all distributions, the complete redemption of the investment at net asset value at the end of each period and no sales charge. Total return would be reduced if sales charges were taken into account. |
| |
| (c) | | Ratios do not include fees paid indirectly (See Expenses in the accompanying Notes to Financial Statements). |
| |
| (d) | | Portfolio turnover rate is calculated on the basis of the Fund as a whole without distinguishing between the classes of shares issued. |
| |
| (e) | | Total return without the inclusion of the Payments from (to) Affiliate, can be found in Expenses in the accompanying Notes to Financial Statements. |
| |
| (f) | | Classes H, M and N were merged into Class L on February 9, 2007. |
| |
| (g) | | Commenced operations on December 22, 2006. |
| |
| (h) | | Not annualized. |
| |
| (i) | | Annualized. |
| |
| (j) | | Commenced operations on August 31, 2006. |
26
- Ratios and Supplemental Data -
| | | | | | | | | | | | | | | | | | | | | | | | | | | |
| | | | | | | | | Ratio of Expenses to Average | | Ratio of Expenses to Average | | Ratio of Expenses to Average | | | | |
| | | | | | | | | Net Assets Before Waivers and | | Net Assets After Waivers and | | Net Assets After Waivers and | | Ratio of Net Investment | | Portfolio |
| | | | | Net Assets at End of | | Reimbursements and Including | | Reimbursements and Including | | Reimbursements and Excluding | | Income to Average Net | | Turnover |
| Total Return(b) | | Period (000’s) | | Expenses not Subject to Cap(c) | | Expenses not Subject to Cap(c) | | Expenses not Subject to Cap(c) | | Assets | | Rate(d) |
| | 10.72 | % | | $ | 45,036 | | | | 1.89 | % | | | 1.07 | % | | | 1.07 | % | | | (0.26 | )% | | | 84 | % |
| | 10.23 | | | | 8,042 | | | | 2.97 | | | | 1.50 | | | | 1.50 | | | | (0.68 | ) | | | — | |
| | 9.79 | | | | 9,800 | | | | 2.60 | | | | 1.87 | | | | 1.87 | | | | (1.05 | ) | | | — | |
| | 10.63 | | | | 4,456 | | | | 1.37 | | | | 1.08 | | | | 1.08 | | | | (0.28 | ) | | | — | |
| | 10.42 | | | | 74,731 | | | | 1.27 | | | | 1.25 | | | | 1.25 | | | | (0.44 | ) | | | — | |
| | 10.22 | | | | 192 | | | | 1.85 | | | | 1.65 | | | | 1.65 | | | | (0.91 | ) | | | — | |
| | 10.38 | | | | 1,868 | | | | 1.42 | | | | 1.35 | | | | 1.35 | | | | (0.54 | ) | | | — | |
| | 10.69 | | | | 1,321 | | | | 1.12 | | | | 1.05 | | | | 1.05 | | | | (0.34 | ) | | | — | |
| | 10.67 | | | | 8,042 | | | | 1.02 | | | | 1.02 | | | | 1.02 | | | | 0.04 | | | | — | |
| | | | | | | | | | | | | | | | | | | | | | | | | | | |
| | (38.35 | ) | | | 78,279 | | | | 1.64 | | | | 1.20 | | | | 1.20 | | | | (0.25 | ) | | | 103 | |
| | (38.71 | ) | | | 8,645 | | | | 2.51 | | | | 1.83 | | | | 1.83 | | | | (0.88 | ) | | | — | |
| | (38.90 | ) | | | 10,472 | | | | 2.25 | | | | 2.10 | | | | 2.10 | | | | (1.14 | ) | | | — | |
| | (38.29 | ) | | | 3,159 | | | | 1.17 | | | | 1.15 | | | | 1.15 | | | | (0.21 | ) | | | — | |
| | (38.28 | ) | | | 74,539 | | | | 1.14 | | | | 1.12 | | | | 1.12 | | | | (0.17 | ) | | | — | |
| | (38.49 | ) | | | 9 | | | | 2.08 | | | | 1.46 | | | | 1.46 | | | | (0.52 | ) | | | — | |
| | (38.40 | ) | | | 1,298 | | | | 1.28 | | | | 1.28 | | | | 1.28 | | | | (0.39 | ) | | | — | |
| | (38.20 | ) | | | 44 | | | | 1.03 | | | | 1.03 | | | | 1.03 | | | | (0.14 | ) | | | — | |
| | (38.15 | ) | | | 30,361 | | | | 0.89 | | | | 0.89 | | | | 0.89 | | | | 0.06 | | | | — | |
| | | | | | | | | | | | | | | | | | | | | | | | | | | |
| | 7.18 | (e) | | | 162,102 | | | | 1.62 | | | | 1.31 | | | | 1.31 | | | | (0.26 | ) | | | 105 | |
| | 6.44 | (e) | | | 17,352 | | | | 2.42 | | | | 2.00 | | | | 2.00 | | | | (0.95 | ) | | | — | |
| | 6.34 | (e) | | | 23,778 | | | | 2.21 | | | | 2.15 | | | | 2.15 | | | | (1.10 | ) | | | — | |
| | 7.37 | (e) | | | 4,614 | | | | 1.21 | | | | 1.15 | | | | 1.15 | | | | (0.17 | ) | | | — | |
| | 7.41 | (e) | | | 137,702 | | | | 1.17 | | | | 1.15 | | | | 1.15 | | | | (0.37 | ) | | | — | |
| | 5.63 | (h) | | | 11 | | | | 1 .69 | (i) | | | 1 .65 | (i) | | | 1 .65 | (i) | | | (0 .65 | )(i) | | | — | |
| | 5.94 | (h) | | | 309 | | | | 1 .40 | (i) | | | 1 .35 | (i) | | | 1 .35 | (i) | | | (0 .43 | )(i) | | | — | |
| | 6.18 | (h) | | | 11 | | | | 1 .09 | (i) | | | 1 .05 | (i) | | | 1 .05 | (i) | | | (0 .05 | )(i) | | | — | |
| | 7.61 | (e) | | | 46,466 | | | | 0.93 | | | | 0.93 | | | | 0.93 | | | | 0.12 | | | | — | |
| | | | | | | | | | | | | | | | | | | | | | | | | | | |
| | 10.67 | | | | 228,776 | | | | 1.56 | | | | 1.36 | | | | 1.36 | | | | (0.30 | ) | | | 86 | |
| | 9.97 | | | | 19,078 | | | | 2.39 | | | | 2.02 | | | | 2.02 | | | | (0.95 | ) | | | — | |
| | 9.82 | | | | 24,070 | | | | 2.25 | | | | 2.15 | | | | 2.15 | | | | (1.08 | ) | | | — | |
| | 8.41 | (h) | | | 239 | | | | 1 .28 | (i) | | | 1 .15 | (i) | | | 1 .15 | (i) | | | (0 .43 | )(i) | | | — | |
| | 10.90 | | | | 118,452 | | | | 1.15 | | | | 1.15 | | | | 1.15 | | | | (0.08 | ) | | | — | |
| | 11.17 | | | | 107,906 | | | | 0.92 | | | | 0.92 | | | | 0.92 | | | | 0.15 | | | | — | |
| | | | | | | | | | | | | | | | | | | | | | | | | | | |
| | 15.04 | | | | 66,403 | | | | 1.62 | | | | 1.40 | | | | 1.40 | | | | (0.65 | ) | | | 81 | |
| | 14.20 | | | | 16,230 | | | | 2.51 | | | | 2.15 | | | | 2.15 | | | | (1.40 | ) | | | — | |
| | 14.16 | | | | 15,668 | | | | 2.33 | | | | 2.15 | | | | 2.15 | | | | (1.40 | ) | | | — | |
| | 15.28 | | | | 119,114 | | | | 1.21 | | | | 1.21 | | | | 1.21 | | | | (0.46 | ) | | | — | |
| | 15.52 | | | | 55,933 | | | | 0.98 | | | | 0.98 | | | | 0.98 | | | | (0.23 | ) | | | — | |
27
Report of Independent Registered Public Accounting Firm
The Board of Directors and Shareholders of
The Hartford Mutual Funds II, Inc.
We have audited the accompanying statement of assets and liabilities, including the schedule of investments, of The Hartford SmallCap Growth Fund (one of the portfolios constituting The Hartford Mutual Funds II, Inc. (the Funds)) as of October 31, 2009, and the related statement of operations for the year then ended, the statements of changes in net assets for each of the two years in the period then ended, and the financial highlights for each of the periods indicated therein. These financial statements and financial highlights are the responsibility of the Funds’ management. Our responsibility is to express an opinion on these financial statements and financial highlights based on our audits.
We conducted our audits in accordance with the standards of the Public Company Accounting Oversight Board (United States). Those standards require that we plan and perform the audit to obtain reasonable assurance about whether the financial statements and financial highlights are free of material misstatement. We were not engaged to perform an audit of the Funds’ internal control over financial reporting. Our audits included consideration of internal control over financial reporting as a basis for designing audit procedures that are appropriate in the circumstances, but not for the purpose of expressing an opinion on the effectiveness of the Funds’ internal control over financial reporting. Accordingly, we express no such opinion. An audit also includes examining, on a test basis, evidence supporting the amounts and disclosures in the financial statements and financial highlights, assessing the accounting principles used and significant estimates made by management, and evaluating the overall financial statement presentation. Our procedures included confirmation of securities owned as of October 31, 2009, by correspondence with the custodian and brokers or by other appropriate auditing procedures where replies from brokers were not received. We believe that our audits provide a reasonable basis for our opinion.
In our opinion, the financial statements and financial highlights referred to above present fairly, in all material respects, the financial position of The Hartford SmallCap Growth Fund of The Hartford Mutual Funds II, Inc. at October 31, 2009, the results of its operations for the year then ended, the changes in its net assets for each of the two years in the period then ended, and the financial highlights for each of the periods indicated therein, in conformity with U.S. generally accepted accounting principles.
Minneapolis, MN
December 15, 2009
28
The Hartford SmallCap Growth Fund
Directors and Officers (Unaudited)
The Board of Directors appoints officers who are responsible for the day-to-day operations of the Fund and who execute policies formulated by the Directors. Each director serves until his or her death, resignation, or retirement or until the next annual meeting of shareholders is held or until his or her successor is elected and qualifies.
Directors and officers who are employed by or who have a financial interest in The Hartford are considered “interested” persons of the Fund pursuant to the Investment Company Act of 1940, as amended. Each officer and two of the Funds’ directors, as noted in the chart below, are “interested” persons of the Fund. Each director serves as a director for The Hartford Mutual Funds, Inc., The Hartford Mutual Funds II, Inc., The Hartford Income Shares Fund, Inc., Hartford Series Fund, Inc., and Hartford HLS Series Fund II, Inc., which, as of October 31, 2009, collectively consist of 93 funds. Correspondence may be sent to directors and officers c/o Hartford Mutual Funds, P.O. Box 2999, Hartford, Connecticut 06104-2999, except that correspondence to Ms. Fagely may be sent to 500 Bielenberg Drive, Woodbury, Minnesota 55125.
The table below sets forth, for each director and officer, his or her name, year of birth, current position with the Fund and date first elected or appointed to The Hartford Mutual Funds, Inc. (“MF”) and The Hartford Mutual Funds II, Inc. (“MF2”), principal occupation, and, for directors, other directorships held. The Fund’s statement of additional information contains further information on the directors and is available free of charge by calling 1-888-843-7824 or writing to Hartford Mutual Funds, P.O. Box 64387, St. Paul, MN 55164-0387.
Information on the aggregate remuneration paid to the directors of the Fund can be found in the Statement of Operations herein. The Fund pays to The Hartford a portion of the Chief Compliance Officer’s compensation, but does not pay salaries or compensation to any of its other officers or directors who are employed by The Hartford.
Non-Interested Directors
Lynn S. Birdsong (1946) Director since 2003, Co-Chairman of the Investment Committee
Mr. Birdsong is a private investor. Since 1981, Mr. Birdsong has been a partner in Birdsong Company, an advertising specialty firm. Since 2003, Mr. Birdsong has been an independent director of The Japan Fund. From 2003 to March 2005, Mr. Birdsong was an independent director of the Atlantic Whitehall Funds. From 1979 to 2002, Mr. Birdsong was a managing director of Zurich Scudder Investments, an investment management firm. During his employment with Scudder, Mr. Birdsong was an interested director of The Japan Fund.
Robert M. Gavin, Jr. (1940) Director since 2002 (MF) and 1986 (MF2), Chairman of the Board since 2004
Dr. Gavin is an educational consultant. Prior to September 1, 2001, he was President of Cranbrook Education Community and prior to July 1996, he was President of Macalester College, St. Paul, Minnesota.
Duane E. Hill (1945) Director since 2001 (MF) and 2002 (MF2), Chairman of the Nominating Committee
Mr. Hill is Partner of TSG Ventures L.P., a private equity investment company. He has served for over thirty years as a financial services executive in banking, venture capital and private equity.
Sandra S. Jaffee (1941) Director since 2005
Ms. Jaffee served as Chairman (2008-2009) and Chief Executive Officer of Fortent (formerly Searchspace Group), a leading provider of compliance/regulatory technology to financial institutions from August 2005 to August 2009. From August 2004 to August 2005, Ms. Jaffee served as an Entrepreneur in Residence with Warburg Pincus, a private equity firm. From September 1995 to July 2004, Ms. Jaffee served as Executive Vice President at Citigroup, where she was President and Chief Executive Officer of Citibank’s Global Securities Services (1995-2003).
William P. Johnston (1944) Director since 2005, Chairman of the Compliance Committee
In February 2008, Mr. Johnston was elected to the Board of Directors of HCR-ManorCare, Inc. In August 2007, Mr. Johnston was elected to the Board of Directors of LifeCare Holdings, Inc. In July, 2006, Mr. Johnston was elected to the Board of Directors of MultiPlan, Inc. In June 2006, Mr. Johnston was appointed as Senior Advisor to The Carlyle Group, a global private equity investment firm. In May 2006, Mr. Johnston was elected to the Supervisory Board of Fresenius Medical Care AG & Co. KGaA, after its acquisition of Renal Care Group, Inc. in March 2006. Mr. Johnston joined Renal Care Group in November 2002 as a member of the Board of Directors and served as Chairman of the Board from March 2003 through March 2006. From September 1987 to December 2002, Mr. Johnston was with Equitable Securities Corporation (and its successors, SunTrust Equitable Securities and SunTrust Robinson Humphrey) serving in various investment banking and managerial positions, including Managing Director and Head of Investment Banking, Chief Executive Officer and Vice Chairman.
29
The Hartford SmallCap Growth Fund
Directors and Officers (Unaudited) — (continued)
Phillip O. Peterson (1944) Director since 2002 (MF) and 2000 (MF2), Chairman of the Audit Committee
Mr. Peterson is a mutual fund industry consultant. He was a partner of KPMG LLP (an accounting firm) until July 1999. Mr. Peterson joined William Blair Funds in February 2007 as a member of the Board of Trustees. From January 2004 to April 2005, Mr. Peterson served as Independent President of the Strong Mutual Funds.
Lemma W. Senbet (1946) Director since 2005
Dr. Senbet is the William E. Mayer Chair Professor of Finance at the University of Maryland, Robert H. Smith School of Business. He was chair of the Finance Department during 1998-2006. Previously he was an endowed professor of finance at the University of Wisconsin-Madison. Also, he was director of the Fortis Funds from March 2000-July 2002. Dr. Senbet served the finance profession in various capacities, including as director of the American Finance Association and President of the Western Finance Association. In 2006, Dr. Senbet was inducted Fellow of Financial Management Association International for his career-long distinguished scholarship and professional service.
Interested Directors and Officers
Lowndes A. Smith (1939) Director since 1996 (MF) and 2002 (MF2), Co-Chairman of the Investment Committee
Mr. Smith served as Vice Chairman of The Hartford from February 1997 to January 2002, as President and Chief Executive Officer of Hartford Life, Inc. from February 1997 to January 2002, and as President and Chief Operating Officer of The Hartford Life Insurance Companies from January 1989 to January 2002. Mr. Smith serves as a Director of White Mountains Insurance Group, Ltd., One Beacon Insurance, Symetra Financial and as a Managing Director of Whittington Gray Associates.
John C. Walters* (1962) Director since 2008
Mr. Walters currently serves as President, Chief Executive Officer and Director for Hartford Life, Inc. (“HL, Inc.”). Mr. Walters also serves as President, Chairman of the Board, Chief Executive Officer and Director for Hartford Life Insurance Company (“Hartford Life”), and as Executive Vice President of The Hartford Financial Services Group, Inc. (“The Hartford”). In addition, Mr. Walters is Manager of HL Investment Advisors, LLC (“HL Advisors”). Mr. Walters previously served as Co-Chief Operating Officer of Hartford Life (2007-2008), and as President of the U.S. Wealth Management Division of HL, Inc. (2006-2007). Mr. Walters joined Hartford Life in April 2000 from First Union Securities, the brokerage subsidiary of First Union Corp.
| | | |
| * | | Mr. Walters previously served as President and Chief Executive Officer of the Fund (2007 – 2009). |
Other Officers
Robert M. Arena, Jr. (1968) President and Chief Executive Officer since 2009
(served as Vice President of the Fund (2006 — 2009))
Mr. Arena serves as Executive Vice President of Hartford Life. Additionally, Mr. Arena is Senior Vice President and Director of Hartford Administrative Services Company, (“HASCO”), President, Chief Executive Officer and Manager of Hartford Investment Financial Services, LLC (“HIFSCO”) and President, Chief Executive Officer and Manager of HL Advisors. Prior to joining The Hartford in 2004, he was Senior Vice President in charge of Product Management for American Skandia/Prudential in the individual annuities division.
Tamara L. Fagely (1958) Vice President, Treasurer and Controller since 2002 (MF) 1993 (MF2)
Ms. Fagely has been a Vice President of HASCO since 1998 and Chief Financial Officer since 2006. Currently Ms. Fagely is a Vice President of Hartford Life. In addition, Ms. Fagely is Controller and Chief Financial Officer of HIFSCO. She served as Assistant Vice President of Hartford Life from December 2001 through March 2005.
Brian Ferrell (1962) AML Compliance Officer since 2008
Mr. Ferrell has served as Assistant Vice President and AML Compliance Officer for The Hartford since 2006, and as AML Compliance Officer for HASCO and Hartford Investor Services Company, LLC (“HISC”) since 2008. Prior to joining The Hartford in 2006, Mr. Ferrell held various positions at the U.S. Department of the Treasury (the “Treasury”) from 2001 to 2006, where he served as Chief Counsel for the Treasury’s Financial Crimes Enforcement Network from 2005 – 2006.
Dr. Robert J. Froehlich (1953) Senior Managing Director since 2009
Dr. Froehlich joined The Hartford as Senior Managing Director in September 2009. Prior to joining The Hartford, Dr. Froehlich served as Vice Chairman of Deutsche Asset Management from 1997 – 2009.
30
Thomas D. Jones, III (1965) Vice President and Chief Compliance Officer since 2006
Mr. Jones serves as Chief Compliance Officer for the Hartford Mutual Funds and Vice President and Director of Securities Compliance for The Hartford. He is also Vice President of HIFSCO, HL Advisors, and Hartford Life. Mr. Jones joined The Hartford in 2006 from SEI Investments, where he served as Chief Compliance Officer for its mutual funds and investment advisers. Prior to joining SEI, Mr. Jones was First Vice President and Compliance Director for Merrill Lynch Investment Managers (Americas) (“MLIM”), where he worked from 1992-2004. At MLIM, Mr. Jones was responsible for the compliance oversight of various investment products, including mutual funds, wrap accounts, institutional accounts and alternative investments.
Edward P. Macdonald (1967) Vice President, Secretary and Chief Legal Officer since 2005
Mr. Macdonald serves as Assistant Vice President of Hartford Life and Chief Legal Officer, Secretary and Vice President of HIFSCO. He also serves as Vice President and Secretary of HASCO, and Chief Legal Officer, Secretary and Vice President of HL Advisors. Prior to joining The Hartford in 2005, Mr. Macdonald was Chief Counsel, Investment Management for Prudential Financial (formerly American Skandia Investment Services, Inc.). He joined Prudential in April 1999.
Vernon J. Meyer (1964) Vice President since 2006
Mr. Meyer serves as Senior Vice President of Hartford Life. He also serves as Senior Vice President of HIFSCO and HL Advisors. Mr. Meyer joined The Hartford in 2004 from MassMutual which he joined in 1987.
D. Keith Sloane (1960) Vice President since 2009
Mr. Sloane is a Senior Vice President of Hartford Life. Additionally, Mr. Sloane currently serves as Senior Vice President of HIFSCO, HL Advisors, and HASCO. Prior to joining The Hartford in 2007, Mr. Sloane was Director of product marketing and led the mutual fund business for Wachovia Securities (“Wachovia”) in their investment products group. Mr. Sloane joined Wachovia in 1995.
Jane Wolak (1961) Vice President since 2009
Ms. Wolak currently serves as Vice President of Hartford Life. Ms. Wolak joined Hartford Life as Vice President, Retail Product Services in May 2007. She is also Vice President of HASCO. Previously, Ms. Wolak was with Sun Life Financial where she held the position of Vice President, Service Center Operations from 2001 — 2007.
HOW TO OBTAIN A COPY OF THE FUND’S PROXY VOTING POLICIES AND VOTING RECORDS
A description of the policies and procedures that the Fund uses to determine how to vote proxies relating to portfolio securities and a record of how the Fund voted any proxies for the twelve-month period ended June 30, 2009 is available (1) without charge, upon request, by calling 888-843-7824 and (2) on the Securities and Exchange Commission’s website at http://www.sec.gov.
QUARTERLY PORTFOLIO HOLDINGS INFORMATION
The Fund files a complete schedule of portfolio holdings with the Commission for the first and third quarters of each fiscal year on Form N-Q. The Fund’s Forms are available (1) without charge, upon request, by calling 888-843-7824 and (2) on the Securities and Exchange Commission’s website at http://www.sec.gov. The Form N-Q may be reviewed and copied at the Commission’s Public Reference Room in Washington, DC. Information on the operation of the Public Reference Room may be obtained by calling 1-800-SEC-0330.
31
The Hartford SmallCap Growth Fund
Federal Tax Information (Unaudited)
The Fund made no capital gain or income distributions for the fiscal year ended October 31, 2009.
32
The Hartford SmallCap Growth Fund
Expense Example (Unaudited)
Your Fund’s Expenses
As a shareholder of the Fund, you incur two types of costs: (1) transaction costs, including sales charges (loads) on purchase payments and contingent deferred sales charges (CDSC) (2) ongoing costs including management fees; distribution fees; and other fund expenses. This example is intended to help you understand your ongoing costs (in dollars) of investing in the Fund and to compare these costs with the ongoing costs of investing in other mutual funds. The example is based on an investment of $1,000 invested at the beginning of the period and held for the period of April 30, 2009 through October 31, 2009.
Actual Expenses
The first set of columns of the table below provides information about actual account values and actual expenses. You may use the information in this column, together with the amount you invested, to estimate the expenses that you paid over the period. Simply divide your account value by $1,000 (for example, an $8,600 account value divided by $1,000 = 8.6), then multiply the result by the number in the line under the heading entitled “Expenses Paid During Period” to estimate the expenses you paid on your account during this period.
Hypothetical Example for Comparison Purposes
The second set of columns of the table below provides information about hypothetical account values and hypothetical expenses based on the Fund’s actual expense ratio and an assumed rate of return of 5% per year before expenses, which is not the Fund’s actual return. The hypothetical account values and expenses may not be used to estimate the actual ending account balance or expenses you paid for the period. You may use this information to compare the ongoing costs of investing in the Fund and other funds. To do so, compare this 5% hypothetical example with the 5% hypothetical examples that appear in the shareholder reports of the other funds.
Please note that the expenses shown in the table are meant to highlight your ongoing costs only and do not reflect any transactional costs, such as sales charges (loads) and CDSC. Therefore, the second set of columns of the table is useful in comparing ongoing costs only, and will not help you determine the relative total costs of owning different funds. In addition, if these transactional costs were included, your costs would be higher. Expenses are equal to the Fund’s annualized expense ratios multiplied by average account value over the period, multiplied by 184/365 (to reflect the one-half year period).
| | | | | | | | | | | | | | | | | | | | | | | | | | | | | | | | | | | | | | |
| | | Actual return | | | Hypothetical (5% return before expenses) | | | | | | | | |
| | | | | | | | | | | Expenses paid | | | | | | | | | | | Expenses paid | | | | | | Days in | | |
| | | | | | | | | | | during the period | | | | | | | | | | | during the period | | | | | | the | | Days |
| | | Beginning | | Ending Account | | April 30, 2009 | | | Beginning | | Ending Account | | April 30, | | Annualized | | current | | in the |
| | | Account Value | | Value | | through | | | Account Value | | Value | | 2009 through | | expense | | 1/2 | | full |
| | | April 30, 2009 | | October 31, 2009 | | October 31, 2009 | | | April 30, 2009 | | October 31, 2009 | | October 31, 2009 | | ratio | | year | | year |
| Class A | | $ | 1,000.00 | | | $ | 1,171.20 | | | $ | 6.46 | | | | $ | 1,000.00 | | | $ | 1,019.26 | | | $ | 6.01 | | | | 1.18 | % | | | 184 | | | | 365 | |
| Class B | | $ | 1,000.00 | | | $ | 1,168.20 | | | $ | 8.80 | | | | $ | 1,000.00 | | | $ | 1,017.09 | | | $ | 8.19 | | | | 1.61 | | | | 184 | | | | 365 | |
| Class C | | $ | 1,000.00 | | | $ | 1,165.60 | | | $ | 10.64 | | | | $ | 1,000.00 | | | $ | 1,015.38 | | | $ | 9.91 | | | | 1.95 | | | | 184 | | | | 365 | |
| Class I | | $ | 1,000.00 | | | $ | 1,170.80 | | | $ | 6.13 | | | | $ | 1,000.00 | | | $ | 1,019.56 | | | $ | 5.70 | | | | 1.12 | | | | 184 | | | | 365 | |
| Class L | | $ | 1,000.00 | | | $ | 1,170.20 | | | $ | 6.84 | | | | $ | 1,000.00 | | | $ | 1,018.90 | | | $ | 6.36 | | | | 1.25 | | | | 184 | | | | 365 | |
| Class R3 | | $ | 1,000.00 | | | $ | 1,168.10 | | | $ | 9.13 | | | | $ | 1,000.00 | | | $ | 1,016.79 | | | $ | 8.49 | | | | 1.67 | | | | 184 | | | | 365 | |
| Class R4 | | $ | 1,000.00 | | | $ | 1,170.10 | | | $ | 7.38 | | | | $ | 1,000.00 | | | $ | 1,018.40 | | | $ | 6.87 | | | | 1.35 | | | | 184 | | | | 365 | |
| Class R5 | | $ | 1,000.00 | | | $ | 1,171.70 | | | $ | 5.75 | | | | $ | 1,000.00 | | | $ | 1,019.91 | | | $ | 5.35 | | | | 1.05 | | | | 184 | | | | 365 | |
| Class Y | | $ | 1,000.00 | | | $ | 1,171.30 | | | $ | 5.42 | | | | $ | 1,000.00 | | | $ | 1,020.21 | | | $ | 5.04 | | | | 0.99 | | | | 184 | | | | 365 | |
33
The Hartford SmallCap Growth Fund
Approval of Investment Management and Investment Sub-Advisory Agreements (Unaudited)
Section 15(c) of the Investment Company Act of 1940, as amended (the “1940 Act”), requires that each mutual fund’s board of directors, including a majority of those directors who are not “interested persons” of the mutual fund, as defined in the 1940 Act (the “Independent Directors”), annually review and consider the continuation of the mutual fund’s investment advisory and sub-advisory agreements. At its meeting held on August 4-5, 2009, the Board of Directors (the “Board”) of The Hartford SmallCap Growth Fund (the “Fund”), including each of the Independent Directors, unanimously voted to approve the continuation of the investment management agreement for the Fund with Hartford Investment Financial Services, LLC (“HIFSCO”) and the continuation of the investment sub-advisory agreements between HIFSCO and the Fund’s sub-advisers Wellington Management Company, LLP (“Wellington”) and Hartford Investment Management Company (“HIMCO”, together with Wellington, “Sub-advisers,” and together with HIFSCO, “Advisers”) (collectively, the “Agreements”).
In the months preceding the August 4-5, 2009 meeting, the Board requested, received, and reviewed written responses from the Advisers to questions posed to them on behalf of the Independent Directors and supporting materials relating to those questions and responses. The Board considered information furnished to the Board at its meetings throughout the year, as well as information specifically prepared in connection with the annual approval of the Agreements at the Board’s meetings held on June 23-24, 2009 and August 4-5, 2009. Information provided to the Board at its meetings throughout the year, included, among other things, reports on Fund performance, legal and compliance matters, sales and marketing activity, shareholder services, and the other services provided to the Fund by the Advisers, and their affiliates. In addition, the Board received in-person presentations by Fund officers and representatives of HIFSCO at the Board’s meetings on June 23-24, 2009 and August 4-5, 2009 concerning the Agreements.
The Independent Directors, advised by independent legal counsel, engaged two service providers to assist them with evaluating the Agreements with respect to the Fund. Lipper Inc. (“Lipper”), an independent provider of investment company data, was retained to provide the Board with reports on how the Fund’s contractual management fees, actual management fees, other non-management fees, overall expense ratios and investment performance compared to those of mutual funds with similar investment objectives. The Independent Directors also engaged an independent financial services consulting firm (the “Consultant”) to assist them in evaluating the Fund’s management fees, sub-advisory fees, other non-management fees, overall expense ratios and investment performance. In addition, the Consultant reviewed the profitability calculations utilized by HIFSCO in connection with the continuation of the investment management agreement.
In determining to continue the Agreements for the Fund, the members of the Board reviewed and evaluated information and factors they believed to be relevant and appropriate in light of the information that the Board deemed necessary and appropriate and through the exercise of their reasonable business judgment. While individual members of the Board may have weighed certain factors differently, the Board’s determination to continue the Agreements was based on a comprehensive consideration of all information provided to the Board throughout the year and specifically with respect to the continuation of the Agreements. A more detailed discussion of the factors the Board considered with respect to its approval of the Agreements is provided below.
Nature, Extent And Quality Of Services Provided by the Advisers
The Board requested and considered information concerning the nature, extent, and quality of the services provided to the Fund by the Advisers. The Board considered, among other things, the terms of the Agreements and the range of services provided by the Advisers. In this regard, the Board considered information provided to it by HIFSCO concerning the Agreements, which were amended and restated to more completely reflect the services provided to the Fund, but did not result in a material amendment to the Fund’s prior contractual arrangement. The Board considered the Advisers’ professional personnel who provide services to the Fund, including each Adviser’s ability and experience in attracting and retaining qualified personnel to service the Fund. The Board considered each Adviser’s reputation and overall financial strength, as well as its willingness to consider and implement organizational and operational changes designed to improve services to the Fund. In addition, the Board considered the quality of each Adviser’s communications with the Board and responsiveness to Board inquiries.
The Board also requested and evaluated information concerning each Adviser’s regulatory and compliance environment. In this regard, the Board requested and reviewed information on each Adviser’s compliance policies and procedures, compliance history, and a report from the Fund’s Chief Compliance Officer on each Adviser’s compliance with applicable laws and regulations, including responses to regulatory developments and compliance issues raised by regulators. The Board also noted the Advisers’ support of the Fund’s compliance control structure, particularly the resources devoted by the Advisers in support of the Fund’s obligations pursuant to Rule 38a-1 under the 1940 Act.
34
With respect to HIFSCO, the Board noted that under the Agreements, HIFSCO is responsible for the management of the Fund, including overseeing fund operations and service providers and provides administration services to the Fund as well as investment advisory services in connection with selecting, monitoring and supervising the Sub-advisers. The Board considered HIFSCO’s constant monitoring of people, process and performance, including its ongoing commitment to review and rationalize The Hartford Fund Family’s product line-up. The Board considered that HIFSCO or its affiliates are responsible for providing the Fund’s officers and paying their salaries and expenses.
With respect to the Sub-advisers, who provide day-to-day portfolio management services, the Board considered the quality of the Fund’s portfolio managers, the Sub-advisers’ other investment personnel, their investment philosophy and process, investment research capabilities and resources, performance record, trade execution capabilities and experience. The Board considered the experience of the Fund’s portfolio managers, the number of accounts managed by the portfolio managers, and the Sub-advisers’ method for compensating the portfolio managers.
Based on these considerations, the Board concluded that it was satisfied with the nature, extent and quality of the services provided to the Fund by HIFSCO and the Sub-advisers.
Performance of the Fund and the Advisers
The Board considered the investment performance of the Fund. In this regard, the Board reviewed the performance of the Fund over different time periods presented in the materials and evaluated HIFSCO’s analysis of the Fund’s performance for these time periods. The Board considered information and materials provided to the Board by the Advisers concerning Fund performance, as well as information from Lipper comparing the investment performance of the Fund to an appropriate universe of peer funds.
The Board considered the detailed investment analytics reports provided by The Hartford’s Investment Advisory Group throughout the year. These reports include, among other things, information on the Fund’s gross and net returns, the Fund’s investment performance relative to an appropriate benchmark and peer group, various statistics concerning the Fund’s portfolio, and a narrative summary of various factors affecting Fund performance. The Board considered the Advisers’ cooperation with the Investment Committee, which assists the Board in evaluating the performance of the Fund at periodic meetings throughout the year. The Board also considered the analysis provided by the Consultant relating to the Fund’s performance track record. The Board considered information indicating that the Fund had underperformed relative to its peers and benchmark for certain periods, and HIFSCO’s initiatives over the course of the year to address performance issues.
In light of all the considerations noted above, the Board concluded that it had continued confidence in HIFSCO’s and the Sub-advisers’ overall capabilities to manage the Fund.
Costs of the Services and Profitability of the Advisers
The Board reviewed information regarding HIFSCO’s cost to provide investment management and related services to the Fund and HIFSCO’s profitability, both overall and for the Fund, on a pre-tax basis without regard to distribution expenses. The Board also requested and reviewed information about the profitability to HIFSCO and its affiliates from all services provided to the Fund and all aspects of their relationship with the Fund. The Board also requested and received information relating to the operations and profitability of Wellington. With respect to HIMCO, the Board noted that the fees payable to HIMCO are equal to its estimated costs in providing the sub-advisory services. Accordingly, the costs and profitability for HIMCO and HIFSCO were considered in the aggregate.
The Board considered the Consultant’s review of the profitability calculations utilized by HIFSCO in connection with the continuation of the investment management agreement. In this regard, the Consultant reported that The Hartford’s process for calculating and reporting Fund profitability is reasonable, sound and well within common industry practice.
Based on these considerations, the Board concluded that the profits anticipated to be realized by the Advisers and their affiliates from their relationships with the Fund would not be excessive.
35
The Hartford SmallCap Growth Fund
Approval of Investment Management and Investment Sub-Advisory Agreements (Unaudited) — (continued)
Comparison of Fees and Services Provided by the Advisers
The Board considered comparative information with respect to the investment management fees to be paid by the Fund to HIFSCO, the investment sub-advisory fees to be paid by HIFSCO to the Sub-advisers, and the total expense ratios of the Fund. In this regard, the Board requested and reviewed information from HIFSCO and the Sub-advisers relating to the management and sub-advisory fees, and total operating expenses for the Fund. The Board also reviewed information from Lipper comparing the Fund’s contractual management fees, actual management fees and overall expense ratios, relative to a group of funds selected by Lipper, in consultation with the Consultant (“Expense Group”), and a broader universe of funds selected by Lipper (“Expense Universe”). The Board considered that as of November 1, 2009, transfer agency fees in excess of the transfer agency expense limitation amount (currently 0.30%) will be reimbursed by Hartford Administrative Services Company (“HASCO”) prior to the application of the Fund’s expense limitation by HIFSCO.
While the Board recognized that comparisons between the Fund and peer funds are imprecise, given the differing service levels and characteristics of mutual funds and the different business models and cost structures of the Advisers, the comparative information provided by Lipper assisted the Board in evaluating the reasonableness of the Fund’s management fees and total operating expenses. In addition, the Board considered the analysis and recommendations of the Consultant relating to the Fund’s management and sub-advisory fees and total operating expenses.
Based on these considerations, the Board concluded that the Fund’s fees and total operating expenses, in conjunction with the information about quality of services, profitability, economies of scale, and other matters discussed, were reasonable in light of the services provided.
Economies of Scale
The Board requested and considered information regarding the Advisers’ realization of economies of scale with respect to the Fund, and whether the fee levels reflect these economies of scale for the benefit of the Fund’s investors. With respect to HIFSCO, the Board considered representations from HIFSCO that it is difficult to anticipate whether and the extent to which economies may be realized by HIFSCO as assets grow over time. The Board reviewed the breakpoints in the advisory fee schedule for the Fund, which reduces fees as Fund assets grow over time. The Board recognized that a fund with assets beyond the last breakpoint level will continue to benefit from economies of scale, because additional assets are charged the lowest breakpoint fee, resulting in lower overall effective management fee rates. The Board also considered that expense limitations and fee waivers that reduce the Fund’s expenses at all asset levels can have the same effect as breakpoints in sharing economies of scale with shareholders, and that a schedule that reaches a lower breakpoint quickly provides shareholders with the benefit of anticipated or potential economies of scale.
The Board reviewed and evaluated materials from Lipper showing how management fee schedules of peer funds reflect economies of scale for the benefit of investors as a peer fund’s assets hypothetically increase over time. Based on information provided by HIFSCO, Lipper, and the Consultant, the Board recognized that there is no uniform methodology for establishing breakpoints, or uniform pattern in asset levels that trigger breakpoints or the amounts of breakpoints triggered.
After considering all of the information available to it, the Board concluded that it was satisfied with the extent to which economies of scale would be shared for the benefit of the Fund’s shareholders, based on currently available information and the effective advisory fees and expense ratios for the Fund at its current and reasonably anticipated asset levels. The Board noted, however, that it would continue to monitor future growth in Fund assets and the appropriateness of additional breakpoints.
Other Benefits
The Board considered other benefits to the Advisers and their affiliates from their relationships with the Fund.
The Board reviewed information noting that Hartford Life, Inc. (“Hartford Life”) an affiliate of HIFSCO, receives fees for fund accounting and related services from the Fund, and the Board considered information on expected profits to Hartford Life or its affiliates for such services. The Board also considered that HASCO, the Fund’s transfer agent and an affiliate of HIFSCO, receives transfer agency compensation from the Fund, and the Board reviewed information on the expected profitability of the Fund’s transfer agency function to HASCO. The Board noted that HASCO is a recognized leader in providing high quality
36
services to Fund shareholders and has received six consecutive mutual fund Dalbar service awards. The Board considered information provided by HASCO indicating that the transfer agent fees charged by HASCO to the Fund were fair and reasonable based on publicly available information.
The Board also considered that, as principal underwriter of the Fund, HIFSCO receives 12b-1 fees from the Fund and receives all or a portion of the sales charges on sales or redemptions of certain classes of shares. The Board also noted that certain affiliates of HIFSCO distribute shares of the Fund and receive compensation in that connection.
The Board considered benefits to Wellington from its use of the Fund’s brokerage commissions to obtain soft dollar research, and representations from HIFSCO and Wellington that Wellington would not make any revenue-sharing payments or any other type of distribution payments to HIFSCO or its affiliates. With respect to HIMCO, the Board considered any benefits to HIMCO from any use of the Fund’s brokerage commissions to obtain soft dollar research.
The Board considered the benefits to shareholders of being part of the Hartford family of funds, including the right to exchange investments between the same class of funds without a sales charge, the ability to reinvest Fund dividends into other funds in the family, and the ability to combine holdings in the Fund with holdings in other funds to obtain a reduced sales charge. The Board considered HIFSCO’s efforts to provide investors in the family with a broad range of investment styles and asset classes and its entrepreneurial risk in initiating new funds to expand these opportunities for shareholders.
* * * *
Based upon its review of these various factors, among others, the Board concluded that it is in the best interests of the Fund and its shareholders for the Board to approve the Agreements for an additional year. In reaching this decision, the Board did not assign relative weights to the factors discussed above or deem any one or group of them to be controlling in and of themselves. In connection with their deliberations, the Independent Directors met separately in executive session on several occasions, with independent legal counsel, to review the relevant materials and consider their responsibilities under relevant laws and regulations.
37
This information is written in connection with the promotion or marketing of the matter(s) addressed in this material. The information cannot be used or relied upon for the purpose of avoiding IRS penalties. These materials are not intended to provide tax, accounting or legal advice. As with all matters of a tax or legal nature, you should consult your own tax or legal counsel for advice.
You should carefully consider investment objectives, risks, and charges and expenses of The Hartford Mutual Funds before investing. This and other information can be found in the Fund’s prospectus, which can be obtained from your investment representative or by calling 888-843-7824. Please read it carefully before you invest or send money.
The Hartford Mutual Funds are underwritten and distributed by Hartford Investment Financial Services, LLC.
“The Hartford” is The Hartford Financial Services Group, Inc., and its subsidiaries.
Mutual fund inception dates range from 1949 to date. The Hartford Mutual Funds are not a subsidiary of The Hartford but are underwritten, distributed by, and advised by subsidiaries of The Hartford. Investments in The Hartford Mutual Funds are not guaranteed by The Hartford or any other entity.
MFAR-35 12/09 MUT 8759 Printed in U.S.A. © 2009 The Hartford, Hartford, CT 06117
The Hartford Tax-Free National Fund
Table of Contents
| | | | | |
| Manager Discussions (Unaudited) | | | 2 | |
| |
| Financial Statements | | | | |
| |
| | | 5 | |
| |
| | | 12 | |
| |
| | | 13 | |
| |
| | | 14 | |
| |
| | | 15 | |
| |
| | | 16 | |
| |
| | | 26 | |
| |
| | | 28 | |
| |
| | | 29 | |
| |
| | | 31 | |
| |
| | | 31 | |
| |
| | | 32 | |
| |
| | | 33 | |
| |
| | | 34 | |
| |
| | | 35 | |
| | | |
| The Hartford Tax-Free National Fund inception 06/02/1986 | | |
| (subadvised by Hartford Investment Management Company) | | Investment objective — Seeks to provide current income exempt from federal income tax. |
Performance Overview(1) 10/31/99 – 10/31/09
Growth of a $10,000 investment in Class A which includes Sales Charge
Barclays Capital Municipal Bond Index is an unmanaged index of municipal bonds with maturities greater than two years.
You cannot invest directly in an index.
The value of shares will fluctuate so that, when redeemed, shares may be worth more or less than their original cost. The chart and table do not reflect the deduction of taxes that a shareholder would pay on fund distributions or the redemption of fund shares.
Performance information may reflect historical or current expense waivers/reimbursements from the investment adviser, without which performance would have been lower. For information on current expense waivers/reimbursements, please see the prospectus.
Average Annual Total Returns(2,3,4,5) (as of 10/31/09)
| | | | | | | | | | | | | |
| | | 1 | | 5 | | 10 |
| | | Year | | Year | | Year |
| |
| Tax-Free National A# | | | 10.48 | % | | | 0.40 | % | | | 3.60 | % |
| Tax-Free National A## | | | 5.51 | % | | | -0.52 | % | | | 3.12 | % |
| Tax-Free National B# | | | 9.62 | % | | | -0.35 | % | | | NA | * |
| Tax-Free National B## | | | 4.62 | % | | | -0.68 | % | | | NA | * |
| Tax-Free National C# | | | 9.72 | % | | | -0.34 | % | | | 2.78 | % |
| Tax-Free National C## | | | 8.72 | % | | | -0.34 | % | | | 2.78 | % |
| Tax-Free National I# | | | 10.74 | % | | | 0.56 | % | | NA |
| Tax-Free National L# | | | 10.58 | % | | | 0.40 | % | | | 3.53 | % |
| Tax-Free National L## | | | 5.60 | % | | | -0.52 | % | | | 3.06 | % |
| Tax-Free National Y# | | | 10.79 | % | | | 0.57 | % | | NA |
| Barclays Capital Municipal Bond Index | | | 13.60 | % | | | 4.16 | % | | | 5.66 | % |
| | |
| # | | Without sales charge |
| |
| ## | | With sales charge |
| |
| NA | | Not Applicable |
| |
| * | | 10 year returns are not applicable for Class B because after 8 years Class B converts to Class A. |
PAST PERFORMANCE IS NOT INDICATIVE OF FUTURE RESULTS.
| (1) | | Growth of a $10,000 investment in Classes B, C, I, L and Y shares will vary from results seen above due to differences in the expenses charged to these share classes. |
| (2) | | The initial investment in Classes A and L shares reflects the maximum sales charge and Classes B and C reflect CDSC. |
| (3) | | Total returns presented above were calculated using the Fund’s net asset value available to shareholders for sale or redemption of Fund shares on 10/31/09, which excludes investment transactions as of this date. |
| (4) | | Classes A, B, C and Y shares were offered beginning on 2/19/02. Performance prior to that date for Class A is that of the fund’s Class E shares and for Classes B and C is that of the fund’s Classes M and N shares, respectively, which had lower operating expenses. Performance prior to 2/19/02 would have been lower if Classes A, B and C shares expenses were applied during that period. (Classes E, M and N shares are no longer offered.) Class I shares commenced operations on 5/31/07. Performance prior to 5/31/07 reflects Class A performance. The Fund’s performance information prior to 4/1/01 reflects when the Fund was managed by a previous investment adviser. |
| (5) | | Effective 9/30/09, Class B shares of The Hartford Mutual Funds are closed to new investments. |
Portfolio Managers
Christopher Bade
Vice President
How did the Fund perform?
The Class A shares of The Hartford Tax-Free National Fund returned 10.48%, before sales charge, for the twelve-month period ended October 31, 2009. In comparison, its benchmark, the Barclays Capital Municipal Bond Index returned 13.60%, while the average return of the Lipper General Municipal Debt Funds category, a group of funds with investment strategies similar to those of the Fund, was 13.86%.
Why did the Fund perform this way?
Like most fixed income markets, the municipal market recovered dramatically over the twelve-month period ended October 31, 2009, after ending last fiscal year in a relative free fall. Performance over the period
2
was driven by a significant demand/supply imbalance leading to price appreciation as credit spreads tightened (i.e. short and long term interest rates moving closer together) and the municipal curve flattened (yield difference decreased between long and short-term maturities). Demand was strong over this period, particularly from retail investors and retail buyers of municipal mutual funds that were drawn to the market given the “cheap” municipal pricing versus other taxable benchmarks, attractive incremental yield (for additional risk), possibility of higher federal taxes going forward, and the low historical default rates of municipal credits even during recessionary times.
Total municipal issuance for the period was down approximately 6% year-over-year. However, tax-exempt supply was down more than 11% due to the introduction of Build America Bonds (BABs), which are taxable bonds created under the 2009 stimulus package that allow municipal issuers to access a broader investor base and derive savings through a direct subsidy from the federal government. After a slow start, BAB issuance picked up substantially later in the year with the total amount at about $51 billion thus far in 2009, culminating in October where BAB issuance accounted for more than 30% of total municipal issuance volume.
The primary drivers of the Fund’s underperformance over the period relative (i.e. performance of the Fund as measured against the benchmark) to the benchmark were curve positioning (the Fund was long vs. the benchmark) and an overweight (i.e. the Fund’s sector position was greater than the benchmark position) to non-investment grade bonds which significantly underperformed early in the period. An allocation to Non-Rated Long-Term Care Facilities and Special Assessment Bonds also hurt performance as those issues continued to suffer from the housing recession and general economic downturn. Land Secured Bonds continued to be negatively impacted by stalled housing developments and increasing delinquencies/foreclosures.
Beginning in 2009, the Fund generally outperformed the benchmark as non-investment grade bonds rallied, credit spreads tightened, and the municipal curve flattened. The Fund’s benchmark overweight position to lower rated Health Care and Education Bonds also helped performance in 2009 as credit spreads tightened significantly in these sectors. An allocation to investment grade Tobacco Bonds also contributed positively to performance over the period. However, the Fund’s relative outperformance in 2009 versus the benchmark was not enough to recover all of the losses from the first two months of the Fund’s fiscal year.
The Fund generally maintains an overweight to lower rated bonds and longer maturity bonds in order to meet its objective of maximizing yield. However, over the period the Fund lowered its non-investment grade allocation to reduce credit risk and volatility (compared to the benchmark) and in anticipation of continued fundamental weakness in municipals into 2010.
What is your Outlook?
Following the powerful rally in the municipal market, we remain selective on new purchases as municipal yields have hit historic lows, credit spreads have tightened considerably and pricing is not as cheap as it once was. We expect further credit stress and “headline” risk in the municipal market as state and local governments continue to address declining revenues and severe budget imbalances. Although we expect fundamental conditions to worsen with more credit downgrades and negative headlines, the default experience for all municipal bonds has been historically low during all economic cycles. Downgrades and defaults may be more substantial for lower rated municipals, but they should still be relatively low compared to other taxable investments.
We believe municipal bonds still represent good value based on the relative cheapness of the asset class (30-year municipal/treasury ratio remains above 95%), the expectation of higher federal taxes going forward and increasing demand from the growing baby boomer population facing retirement. We will continue to look for opportunities further out in the term structure of the curve (20+ years) where the supply and demand imbalance is most acute given the BAB phenomenon.
Distribution by Credit Quality
as of October 31, 2009
| | | | | |
| | | Percentage of |
| | | Long Term |
| Rating | | Holdings |
| AAA | | | 8.6 | % |
| AA | | | 25.0 | |
| A | | | 29.4 | |
| BBB | | | 14.8 | |
| BB | | | 2.8 | |
| B | | | 1.5 | |
| Not Rated | | | 17.9 | |
| | | | | |
Total | | | 100.0 | % |
| | | | | |
Diversification by Industry
as of October 31, 2009
| | | | | |
| | | Percentage of |
| Industry | | Net Assets |
| Airport Revenues | | | 3.3 | % |
| General Obligations | | | 14.6 | |
| Health Care/Services | | | 16.8 | |
| Higher Education (Univ., Dorms, etc.) | | | 16.4 | |
| Housing (HFA’S, etc.) | | | 4.0 | |
| Industrial | | | 1.8 | |
| Miscellaneous | | | 5.1 | |
| Prerefunded | | | 6.3 | |
| Public Facilities | | | 1.7 | |
| Special Tax Assessment | | | 6.4 | |
| Tax Allocation | | | 5.1 | |
| Transportation | | | 4.6 | |
| Utilities — Electric | | | 6.4 | |
| Utilities — Water and Sewer | | | 5.6 | |
| Short-Term Investments | | | 1.2 | |
| Other Assets and Liabilities | | | 0.7 | |
| | | | | |
Total | | | 100.0 | % |
| | | | | |
3
Distribution by State
as of October 31, 2009
| | | | | |
| | | Percentage of |
| State | | Net Assets |
| Alabama | | | 0.8 | % |
| Alaska | | | 0.5 | |
| Arizona | | | 2.4 | |
| California | | | 16.1 | |
| Colorado | | | 3.9 | |
| Delaware | | | 0.7 | |
| District of Columbia | | | 2.6 | |
| Florida | | | 7.5 | |
| Georgia | | | 3.1 | |
| Idaho | | | 0.7 | |
| Illinois | | | 5.5 | |
| Indiana | | | 1.4 | |
| Louisiana | | | 1.6 | |
| Michigan | | | 4.0 | |
| Minnesota | | | 6.9 | |
| Missouri | | | 1.0 | |
| Nebraska | | | 1.0 | |
| New Hampshire | | | 0.3 | |
| New Jersey | | | 1.3 | |
| New Mexico | | | 0.6 | |
| New York | | | 8.3 | |
| North Carolina | | | 0.3 | |
| Ohio | | | 1.9 | |
| Other U.S. Territories | | | 1.2 | |
| Pennsylvania | | | 3.1 | |
| Rhode Island | | | 1.0 | |
| South Carolina | | | 0.5 | |
| South Dakota | | | 0.9 | |
| Tennessee | | | 0.0 | |
| Texas | | | 9.9 | |
| Virginia | | | 1.1 | |
| Washington | | | 3.7 | |
| Wisconsin | | | 3.0 | |
| Wyoming | | | 1.3 | |
| Short-Term Investments | | | 1.2 | |
| Other Assets and Liabilities | | | 0.7 | |
| | | | | |
Total | | | 100.0 | % |
| | | | | |
4
The Hartford Tax-Free National Fund
Schedule of Investments
October 31, 2009
(000’s Omitted)
| | | | | | | | | |
| Shares or Principal Amount | | | Market Value ╪ | |
| MUNICIPAL BONDS - 98.1% | | | | |
| | | | | Alabama - 0.8% | | | | |
| | | | | Huntsville, AL, GO | | | | |
| $ | 1,855 | | | 5.25%, 05/01/2022 ‡ | | $ | 1,987 | |
| | | | | | | | |
| | | | | Alaska - 0.5% | | | | |
| | | | | Alaska Municipal Bond Bank Auth GO | | | | |
| | 375 | | | 5.75%, 09/01/2033 | | | 389 | |
| | | | | Anchorage, AK, GO | | | | |
| | 610 | | | 5.25%, 08/01/2028 | | | 658 | |
| | | | | | | | |
| | | | | | | | 1,047 | |
| | | | | | | | |
| | | | | Arizona - 2.4% | | | | |
| | | | | Arizona Sundance Community Fac Dist, Special Assess Rev #2 | | | | |
| | 363 | | | 7.13%, 07/01/2027 § | | | 339 | |
| | | | | Estrella Mountain Ranch Community GO | | | | |
| | 265 | | | 6.20%, 07/15/2032 ⌂ | | | 244 | |
| | | | | Pima County, AZ, Charter Schools Proj | | | | |
| | 990 | | | 5.75%, 07/01/2016 | | | 940 | |
| | | | | Pima County, AZ, Noah Webster Basic School | | | | |
| | 1,000 | | | 5.60%, 12/15/2019 | | | 899 | |
| | | | | Salt River Proj Arizona Agricultural | | | | |
| | 3,000 | | | 5.00%, 01/01/2034 | | | 3,155 | |
| | | | | Vistancia, AZ, Community Fac Dist GO | | | | |
| | 200 | | | 6.75%, 07/15/2022 | | | 206 | |
| | | | | | | | |
| | | | | | | | 5,783 | |
| | | | | | | | |
| | | | | California - 16.1% | | | | |
| | | | | Aliso Viejo, CA, Community Fac Dist Special Tax | | | | |
| | 500 | | | 6.00%, 09/01/2038 | | | 405 | |
| | | | | Beaumont, CA, FA Improvement Area #8 | | | | |
| | 250 | | | 5.05%, 09/01/2037 ⌂ | | | 173 | |
| | | | | Beaumont, CA, FA Local Agency Rev Ser A | | | | |
| | 50 | | | 7.25%, 09/01/2020 | | | 54 | |
| | | | | Big Bear Municipal Water Dist, Ref Lake Improvements | | | | |
| | 250 | | | 5.00%, 11/01/2024 | | | 222 | |
| | | | | Burbank, CA, FA Rev South San Fernando Redev Proj | | | | |
| | 350 | | | 5.50%, 12/01/2023 | | | 320 | |
| | | | | California Educational Fac Auth, Dominican University | | | | |
| | 300 | | | 5.00%, 12/01/2025 | | | 263 | |
| | | | | California Educational Fac Auth, Golden Gate University | | | | |
| | 455 | | | 5.00%, 10/01/2025 | | | 357 | |
| | | | | California Educational Fac Auth, La Verne University | | | | |
| | 180 | | | 5.00%, 06/01/2031 | | | 152 | |
| | | | | California Educational Fac Auth, Pitzer College | | | | |
| | 630 | | | 5.00%, 04/01/2030 | | | 624 | |
| | | | | California Educational Fac Auth, Woodbury University | | | | |
| | 200 | | | 5.00%, 01/01/2025 | | | 159 | |
| | | | | California Health Fac FA, Catholic Healthcare West | | | | |
| | 250 | | | 5.25%, 07/01/2023 | | | 252 | |
| | | | | California Municipal FA, University Students Coop Assoc | | | | |
| | 250 | | | 4.75%, 04/01/2027 | | | 204 | |
| | | | | California Public Works Board Lease Rev | | | | |
| | 1,000 | | | 5.75%, 10/01/2030 | | | 981 | |
| | | | | California Public Works Board, Dept of Health Services Richmond Lab | | | | |
| | 300 | | | 5.00%, 11/01/2030 | | | 262 | |
| | | | | California Public Works Board, Dept of Mental Health Patton | | | | |
| | 200 | | | 5.38%, 04/01/2028 | | | 190 | |
| | | | | California State Dept of Water Resources Supply Rev | | | | |
| | 500 | | | 5.00%, 05/01/2022 | | | 529 | |
| | | | | California State Enterprise Auth, Sewer FA Rev AMT | | | | |
| | 500 | | | 5.30%, 09/01/2047 | | | 471 | |
| | | | | California State GO | | | | |
| | 3,515 | | | 6.50%, 04/01/2033 | | | 3,943 | |
| | | | | California State Public Works Board | | | | |
| | 170 | | | 6.13%, 04/01/2029 | | | 175 | |
| | 2,000 | | | 6.25%, 04/01/2034 | | | 2,051 | |
| | | | | California Statewide Community DA, California Baptist University | | | | |
| | 1,000 | | | 5.50%, 11/01/2038 | | | 764 | |
| | | | | California Statewide Community DA, CHF- Irvine, LLC | | | | |
| | 700 | | | 5.75%, 05/15/2032 | | | 679 | |
| | | | | California Statewide Community DA, Drew School | | | | |
| | 750 | | | 5.30%, 10/01/2037 | | | 532 | |
| | | | | California Statewide Community DA, Enloe Medical Center | | | | |
| | 500 | | | 5.50%, 08/15/2023 | | | 517 | |
| | | | | California Statewide Community DA, Health Services Rev | | | | |
| | 250 | | | 6.00%, 10/01/2023 | | | 258 | |
| | | | | California Statewide Community DA, Huntington Park Rev | | | | |
| | 600 | | | 5.15%, 07/01/2030 | | | 428 | |
| | | | | California Statewide Community DA, Thomas Jefferson School of Law | | | | |
| | 500 | | | 7.25%, 10/01/2032 | | | 507 | |
| | | | | California Statewide Community DA, Windrush School | | | | |
| | 250 | | | 5.50%, 07/01/2037 | | | 188 | |
| | | | | Capistrano, CA, USD Community Fac Dist Special Tax #90-2 Talega (Prerefunded with State and Local Gov’t Securities) | | | | |
| | 250 | | | 5.90%, 09/01/2020 | | | 291 | |
| | | | | Carlsbad, CA, Special Tax | | | | |
| | 260 | | | 6.05%, 09/01/2028 | | | 232 | |
| | | | | Chula Vista, CA, IDR Daily San Diego Gas | | | | |
| | 300 | | | 5.30%, 07/01/2021 | | | 329 | |
| | | | | Contra Costa County, CA, Public FA Tax Allocation | | | | |
| | 70 | | | 5.63%, 08/01/2033 | | | 68 | |
| | | | | Corona, CA, Redev Agency Tax Allocation | | | | |
| | 300 | | | 4.50%, 11/01/2032 ‡ | | | 265 | |
| | | | | El Dorado Irrigation Dist | | | | |
| | 300 | | | 5.38%, 08/01/2024 | | | 325 | |
The accompanying notes are an integral part of these financial statements.
5
The Hartford Tax-Free National Fund
Schedule of Investments — (continued)
October 31, 2009
(000’s Omitted)
| | | | | | | | | |
| Shares or Principal Amount | | | Market Value ╪ | |
| MUNICIPAL BONDS - 98.1% — (continued) | | | | |
| | | | | California - 16.1% — (continued) | | | | |
| | | | | Fontana, CA, Redev Agency Tax Allocation Ref, Jurupa Hills Redev Proj | | | | |
| $ | 400 | | | 5.50%, 10/01/2027 | | $ | 400 | |
| | | | | Huntington Park, CA, Public FA Rev Ref | | | | |
| | 400 | | | 5.25%, 09/01/2019 | | | 418 | |
| | | | | Indio, CA, Public Improvement Act Special Assessment #2002-3 GO | | | | |
| | 95 | | | 6.35%, 09/02/2027 | | | 89 | |
| | | | | Kern County, CA, Tobacco Securitization Agency | | | | |
| | 975 | | | 6.00%, 06/01/2029 | | | 922 | |
| | | | | Lathrop, CA, FA Rev Water Supply Proj | | | | |
| | 1,000 | | | 6.00%, 06/01/2035 | | | 922 | |
| | | | | Los Alamitos California University | | | | |
| | 500 | | | 5.50%, 08/01/2033 | | | 533 | |
| | | | | Madera, CA, Redev Agency Tax Rev | | | | |
| | 750 | | | 5.25%, 09/01/2030 | | | 712 | |
| | | | | Modesto, CA, Irrigation Dist | | | | |
| | 500 | | | 5.50%, 07/01/2035 | | | 512 | |
| | | | | Morongo Band of Mission Indians Enterprise Rev | | | | |
| | 2,655 | | | 6.50%, 03/01/2028 § | | | 2,257 | |
| | | | | Oceanside, CA, Community Development Committee, Downtown Redev Proj | | | | |
| | 300 | | | 5.70%, 09/01/2025 | | | 288 | |
| | | | | Palm Springs, CA, Community Redev Agency | | | | |
| | 535 | | | 5.50%, 09/01/2023 | | | 540 | |
| | | | | Port of Oakland | | | | |
| | 2,540 | | | 5.75%, 11/01/2022 | | | 2,546 | |
| | | | | Port of Oakland (Prerefunded with State & Local Gov’t Securities) | | | | |
| | 20 | | | 5.75%, 11/01/2022 | | | 20 | |
| | | | | Rancho Mirage, CA, Joint Powers FA Rev, Eisenhower Medical Center | | | | |
| | 500 | | | 5.00%, 07/01/2038 | | | 452 | |
| | | | | Riverside County, CA, Public FA Tax Allocation, Jurupa Desert & Interstate 215 | | | | |
| | 200 | | | 4.50%, 10/01/2037 | | | 148 | |
| | | | | Roseville, CA, FA Special Tax Rev | | | | |
| | 500 | | | 5.00%, 09/01/2033 | | | 369 | |
| | | | | Roseville, CA, Special Tax Dist Westpark | | | | |
| | 200 | | | 5.25%, 09/01/2025 | | | 169 | |
| | | | | Sacramento, CA, FA Lease Rev MBIA AMT | | | | |
| | 339 | | | 0.53%, 07/15/2027 ∆ | | | 295 | |
| | | | | San Bernardino Community College Dist | | | | |
| | 500 | | | 6.38%, 08/01/2026 | | | 582 | |
| | | | | San Diego Public Fac FA Water Rev | | | | |
| | 500 | | | 5.25%, 08/01/2038 | | | 517 | |
| | | | | San Diego, CA, Redev Agency Tax Allocation, North Park Redev Proj | | | | |
| | 175 | | | 5.30%, 09/01/2016 | | | 176 | |
| | | | | San Diego, CA, Redev Agency, Centre City Sub Pkg | | | | |
| | 200 | | | 5.25%, 09/01/2026 | | | 186 | |
| | | | | San Francisco City & County Redev Agency | | | | |
| | 1,120 | | | 6.50%, 08/01/2032 | | | 1,167 | |
| | | | | San Manuel, CA, Entertainment Auth Public Improvement | | | | |
| | 1,000 | | | 4.50%, 12/01/2016 ⌂ | | | 885 | |
| | | | | Santa Cruz County, CA, Redev Agency | | | | |
| | 665 | | | 6.63%, 09/01/2029 | | | 718 | |
| | | | | Santa Margarita, CA, Water Dist Special Tax Community Fac Dist | | | | |
| | 200 | | | 6.00%, 09/01/2030 | | | 233 | |
| | | | | Sierra View, CA, Local Health Care Dist | | | | |
| | 1,000 | | | 5.25%, 07/01/2032 | | | 912 | |
| | | | | Southern California Public Power Auth | | | | |
| | 500 | | | 5.00%, 07/01/2023 | | | 540 | |
| | | | | Temecula, CA, Redev Agency Tax Allocation Rev | | | | |
| | 250 | | | 5.63%, 12/15/2038 | | | 203 | |
| | | | | Torrance, CA, USD | | | | |
| | 1,500 | | | 5.50%, 08/01/2025 | | | 1,660 | |
| | | | | Tuolumne Wind Proj Auth Rev | | | | |
| | 1,000 | | | 5.88%, 01/01/2029 | | | 1,050 | |
| | | | | Turlock, CA, Health Fac Rev, Emanuel Medical Center | | | | |
| | 500 | | | 5.13%, 10/15/2037 | | | 408 | |
| | | | | Ventura County, CA, Certificates of Participation | | | | |
| | 1,250 | | | 5.63%, 08/15/2027 | | | 1,305 | |
| | | | | Washington Township, CA, Health Care Dist Rev | | | | |
| | 500 | | | 5.00%, 07/01/2037 | | | 451 | |
| | | | | | | | |
| | | | | | | | 39,755 | |
| | | | | | | | |
| | | | | Colorado - 3.9% | | | | |
| | | | | Adams County, CO | | | | |
| | 1,000 | | | 5.13%, 12/01/2029 | | | 1,039 | |
| | | | | Antelope Heights Metro Dist GO | | | | |
| | 1,125 | | | 5.00%, 12/01/2037 | | | 811 | |
| | | | | Bromley Park, CO, Metro Dist #2 GO | | | | |
| | 2,000 | | | 5.13%, 12/01/2037 ⌂ | | | 1,765 | |
| | | | | Colorado E-470 Public Highway Auth Rev | | | | |
| | 1,125 | | | 5.50%, 09/01/2024 | | | 1,075 | |
| | | | | Colorado Educational & Cultural Fac Auth, Charter School Banning Lewis | | | | |
| | 990 | | | 6.13%, 12/15/2035 § | | | 886 | |
| | | | | Denver, CO, Rendezvous Residential Metro Dist GO | | | | |
| | 600 | | | 5.38%, 12/01/2021 | | | 473 | |
| | | | | Ebert Metropolitan Dist GO | | | | |
| | 3,000 | | | 5.35%, 12/01/2037 | | | 2,357 | |
| | | | | Reata, CO, North Metro Dist GO | | | | |
| | 1,000 | | | 5.50%, 12/01/2032 ⌂ | | | 672 | |
| | | | | University of Colorado Enterprise Rev | | | | |
| | 600 | | | 5.75%, 06/01/2028 | | | 677 | |
| | | | | | | | |
| | | | | | | | 9,755 | |
| | | | | | | | |
| | | | | Delaware - 0.7% | | | | |
| | | | | Delaware Transportation Auth | | | | |
| | 1,180 | | | 5.00%, 07/01/2025 | | | 1,303 | |
| | | | | New Castle County, DE, DA | | | | |
| | 500 | | | 5.00%, 07/15/2033 | | | 530 | |
| | | | | | | | |
| | | | | | | | 1,833 | |
| | | | | | | | |
| | | | | District of Columbia - 2.6% | | | | |
| | | | | Dist of Columbia University Rev | | | | |
| | 3,000 | | | 5.25%, 04/01/2034 | | | 3,130 | |
| | | | | Metropolitan Washington DC Airport Auth | | | | |
| | 2,500 | | | 5.50%, 10/01/2027 | | | 2,547 | |
The accompanying notes are an integral part of these financial statements.
6
| | | | | | | | | |
| Shares or Principal Amount | | | Market Value ╪ | |
| MUNICIPAL BONDS - 98.1% — (continued) | | | | |
| | | | | District of Columbia - 2.6% — (continued) | | | | |
| | | | | Washington DC Metropolitan Area Transit | | | | |
| $ | 1,000 | | | 5.13%, 07/01/2032 | | $ | 1,049 | |
| | | | | | | | |
| | | | | | | | 6,726 | |
| | | | | | | | |
| | | | | Florida - 7.5% | | | | |
| | | | | Amelia Walk Community Development | | | | |
| | 975 | | | 5.50%, 05/01/2037 ⌂ | | | 477 | |
| | | | | Bellalgo, FL, Education Fac Benefits Dist Capital | | | | |
| | 845 | | | 5.85%, 05/01/2022 | | | 688 | |
| | | | | Clearwater Water and Sewer Rev | | | | |
| | 2,500 | | | 5.25%, 12/01/2039 | | | 2,537 | |
| | | | | Colonial Country Club Community Development Dist, Capital Improvement Rev | | | | |
| | 470 | | | 6.40%, 05/01/2033 | | | 485 | |
| | | | | Florida Village Community Development | | | | |
| | 985 | | | 6.50%, 05/01/2033 | | | 1,001 | |
| | | | | Florida Village Community Development Dist No 8 | | | | |
| | 1,140 | | | 6.38%, 05/01/2038 | | | 989 | |
| | | | | Jacksonville, FL, Econ Development Community Health Care Facilities | | | | |
| | 3,000 | | | 6.25%, 09/01/2027 | | | 2,778 | |
| | | | | Lee County, FL, Industrial Development Auth | | | | |
| | 1,500 | | | 5.25%, 06/15/2027 | | | 1,164 | |
| | | | | Miami-Dade County, FL, Aviation Rev | | | | |
| | 1,645 | | | 5.50%, 10/01/2036 | | | 1,662 | |
| | | | | Miami-Dade County, FL, Educational Facilities Auth | | | | |
| | 2,000 | | | 5.75%, 04/01/2028 | | | 2,079 | |
| | | | | Palm Beach County, FL, Health FA Rev Waterford Proj | | | | |
| | 3,300 | | | 5.75%, 11/15/2026 | | | 3,028 | |
| | | | | River Bend Community Development Dist, Capital Improvement Rev | | | | |
| | 970 | | | 0.00%, 11/01/2015 • | | | 601 | |
| | | | | Rolling Hills Community Development Dist | | | | |
| | 65 | | | 5.45%, 05/01/2037 ⌂ | | | 46 | |
| | | | | Tolomato, FL, Community Development Dist | | | | |
| | 1,200 | | | 6.65%, 05/01/2040 | | | 875 | |
| | | | | University Square Community Development | | | | |
| | 495 | | | 5.88%, 05/01/2038 | | | 361 | |
| | | | | | | | |
| | | | | | | | 18,771 | |
| | | | | | | | |
| | | | | Georgia - 3.1% | | | | |
| | | | | Atlanta Water & Wastewater Rev | | | | |
| | 1,500 | | | 6.00%, 11/01/2022 | | | 1,618 | |
| | | | | Dekalb County, GA, DA | | | | |
| | 1,000 | | | 6.00%, 07/01/2034 | | | 1,090 | |
| | | | | Fulton County, GA, School Dist GO | | | | |
| | 1,105 | | | 5.38%, 01/01/2018 | | | 1,286 | |
| | | | | Fulton County, GA, Water & Sewer Rev FGIC | | | | |
| | 35 | | | 6.38%, 01/01/2014 | | | 35 | |
| | | | | Fulton County, GA, Water & Sewer Rev FGIC Part (Prerefunded with State and Local Gov’t Securities) | | | | |
| | 1,765 | | | 6.38%, 01/01/2014 | | | 1,948 | |
| | | | | Georgia Municipal Electric Auth, Power Rev | | | | |
| | 945 | | | 6.50%, 01/01/2017 | | | 1,075 | |
| | | | | Georgia Municipal Electric Auth, Power Rev (Prerefunded with US Gov’t Securities) | | | | |
| | 55 | | | 6.50%, 01/01/2017 | | | 65 | |
| | | | | Marietta, GA, DA | | | | |
| | 1,000 | | | 7.00%, 06/15/2030 | | | 932 | |
| | | | | | | | |
| | | | | | | | 8,049 | |
| | | | | | | | |
| | | | | Idaho - 0.7% | | | | |
| | | | | Idaho Board Bank Auth | | | | |
| | 1,470 | | | 5.63%, 09/15/2026 | | | 1,684 | |
| | | | | | | | |
| | | | | Illinois - 5.5% | | | | |
| | | | | Bolingbrook, IL, Sales Tax Rev | | | | |
| | 445 | | | 6.25%, 01/01/2024 | | | 209 | |
| | | | | Chicago, IL, Tax Increment Allocation Jr Lien Pilsen Redev B | | | | |
| | 1,000 | | | 6.75%, 06/01/2022 ⌂ | | | 943 | |
| | | | | Hampshire, IL, Special Service Area #13, Tuscany Woods Proj | | | | |
| | 1,800 | | | 5.75%, 03/01/2037 ⌂ | | | 935 | |
| | | | | Hampshire, IL, Special Service Area #16, Prairie Ridge Proj | | | | |
| | 800 | | | 6.00%, 03/01/2046 | | | 573 | |
| | | | | Huntley, IL, Special Service Area #9 | | | | |
| | 1,500 | | | 5.10%, 03/01/2028 | | | 1,523 | |
| | | | | Illinois Education FA, Augustana College Ser A | | | | |
| | 1,000 | | | 5.70%, 10/01/2032 | | | 1,017 | |
| | | | | Illinois FA Rev | | | | |
| | 800 | | | 5.25%, 11/01/2039 | | | 814 | |
| | 2,930 | | | 5.38%, 07/01/2033 - 08/15/2039 | | | 2,918 | |
| | 310 | | | 6.25%, 02/01/2033 | | | 322 | |
| | | | | Plano, IL, Lakewood Springs Proj Special Services Area | | | | |
| | 497 | | | 6.10%, 03/01/2035 | | | 390 | |
| | | | | Round Lake, IL, Special Tax Rev | | | | |
| | 960 | | | 4.70%, 03/01/2033 | | | 945 | |
| | | | | Round Lake, IL, Special Tax Rev (Prerefunded with State and Local Gov’t Securities) | | | | |
| | 494 | | | 6.70%, 03/01/2033 | | | 569 | |
| | | | | Springfield, IL, Water Rev | | | | |
| | 500 | | | 5.25%, 03/01/2026 | | | 535 | |
| | | | | Wauconda, IL, Special Service Area #1 Special Tax Liberty Lakes Proj | | | | |
| | 1,000 | | | 6.63%, 03/01/2033 | | | 875 | |
| | | | | Yorkville, IL, United City Special Service Area Tax Raintree Village Proj | | | | |
| | 939 | | | 6.88%, 03/01/2033 | | | 893 | |
| | | | | | | | |
| | | | | | | | 13,461 | |
| | | | | | | | |
| | | | | Indiana - 1.4% | | | | |
| | | | | Indiana FA Hospital Rev | | | | |
| | 2,000 | | | 6.75%, 03/01/2035 | | | 2,086 | |
| | | | | Indiana Municipal Power Agency | | | | |
| | 500 | | | 5.75%, 01/01/2034 | | | 519 | |
| | | | | University of Southern Indiana | | | | |
| | 1,070 | | | 5.00%, 10/01/2022 - 10/01/2023 | | | 1,121 | |
| | | | | | | | |
| | | | | | | | 3,726 | |
| | | | | | | | |
| | | | | Louisiana - 1.6% | | | | |
| | | | | Louisiana Public Fac Auth | | | | |
| | 2,500 | | | 6.75%, 07/01/2039 | | | 2,716 | |
The accompanying notes are an integral part of these financial statements.
7
The Hartford Tax-Free National Fund
Schedule of Investments — (continued)
October 31, 2009
(000’s Omitted)
| | | | | | | | | |
| Shares or Principal Amount | | | Market Value ╪ | |
| MUNICIPAL BONDS - 98.1% — (continued) | | | | |
| | | | | Louisiana - 1.6% — (continued) | | | | |
| | | | | Louisiana Public Fac Auth, Oschner Clinic Foundation Proj (Prerefunded with US Gov’t Securities) | | | | |
| $ | 500 | | | 5.50%, 05/15/2027 | | $ | 567 | |
| | | | | Louisiana Public Fac Auth, Susla Fac, Inc. | | | | |
| | 1,000 | | | 5.75%, 07/01/2039 ⌂ | | | 714 | |
| | | | | | | | |
| | | | | | | | 3,997 | |
| | | | | | | | |
| | | | | Michigan - 4.0% | | | | |
| | | | | Detroit, MI, GO | | | | |
| | 3,500 | | | 5.00%, 04/01/2016 | | | 3,174 | |
| | | | | Detroit, MI, Water Supply System Ref Rev FGIC | | | | |
| | 1,750 | | | 6.50%, 07/01/2015 | | | 1,937 | |
| | | | | Grand Valley State University | | | | |
| | 1,500 | | | 5.50%, 12/01/2027 | | | 1,587 | |
| | | | | Michigan Hospital FA, Rev Ref Henry Ford Health System (Prerefunded with State and Local Gov’t Securities) | | | | |
| | 500 | | | 5.63%, 03/01/2017 | | | 568 | |
| | | | | Michigan State Hospital FA, McLaren Health Care | | | | |
| | 2,000 | | | 5.63%, 05/15/2028 | | | 2,011 | |
| | | | | Michigan Tobacco Settlement FA Ser A | | | | |
| | 1,000 | | | 6.00%, 06/01/2048 | | | 766 | |
| | | | | | | | |
| | | | | | | | 10,043 | |
| | | | | | | | |
| | | | | Minnesota - 6.9% | | | | |
| | | | | Baytown Township, MN | | | | |
| | 250 | | | 7.00%, 08/01/2038 | | | 220 | |
| | | | | Becker, MN, ISD #726 GO FSA (Prerefunded by Crossover Bond) | | | | |
| | 1,300 | | | 6.00%, 02/01/2017 | | | 1,316 | |
| | | | | Brainerd, MN, ISD #181 GO FGIC | | | | |
| | 500 | | | 5.38%, 02/01/2016 | | | 541 | |
| | | | | Chaska, MN, Electric Rev Ref Generating Fac | | | | |
| | 500 | | | 5.00%, 10/01/2030 | | | 512 | |
| | | | | Duluth, MN, Econ DA Health Care Fac Rev Benedictine Health System St Mary’s (Prerefunded with State & Local Gov’t Securities) | | | | |
| | 1,130 | | | 5.50%, 02/15/2023 | | | 1,297 | |
| | | | | Falcon Heights, MN, Lease Rev | | | | |
| | 225 | | | 6.00%, 11/01/2037 | | | 177 | |
| | | | | Golden Valley, MN, Calvary Center Apts Proj AMT | | | | |
| | 500 | | | 4.85%, 12/20/2041 | | | 446 | |
| | | | | Minneapolis & St Paul, MN, Airport Commission FGIC AMT | | | | |
| | 1,000 | | | 5.63%, 01/01/2018 | | | 1,015 | |
| | | | | Minneapolis, MN, Housing Rev | | | | |
| | 400 | | | 5.00%, 10/01/2037 | | | 265 | |
| | | | | Minneapolis, MN, Multifamily Housing Rev AMT | | | | |
| | 350 | | | 5.40%, 04/01/2028 | | | 278 | |
| | | | | Minneapolis, MN, Parking Assessment GO | | | | |
| | 250 | | | 5.00%, 12/01/2020 | | | 267 | |
| | | | | Minneapolis, MN, Tax Increment Grant Park Proj | | | | |
| | 350 | | | 5.35%, 02/01/2030 | | | 280 | |
| | | | | Minnesota Agricultural Society, State Fair Rev | | | | |
| | 835 | | | 5.13%, 09/15/2023 | | | 855 | |
| | | | | Minnesota Agriculture and Econ Development Healthcare Fac, Benedictine Health (Prerefunded with US Gov’t Securities) | | | | |
| | 1,000 | | | 5.25%, 02/15/2014 | | | 1,023 | |
| | | | | Minnesota Intermediate School Dist Lease Rev | | | | |
| | 372 | | | 5.30%, 11/01/2032 | | | 386 | |
| | | | | Ramsey, MN, Lease Rev Pact Charter School Proj | | | | |
| | 750 | | | 6.50%, 12/01/2022 | | | 681 | |
| | | | | Renville County, MN, Housing & Redev Auth, Health & Human Services | | | | |
| | 360 | | | 4.60%, 02/01/2027 | | | 326 | |
| | | | | Rosemount, MN, ISD #196 GO MBIA | | | | |
| | 1,950 | | | 5.70%, 04/01/2015 ο | | | 1,641 | |
| | | | | St Paul, MN, Housing & Redev Auth, Achieve Language Academy | | | | |
| | 800 | | | 6.75%, 12/01/2022 | | | 763 | |
| | | | | St Paul, MN, Housing & Redev Auth, Hmong Academy Proj | | | | |
| | 1,000 | | | 6.00%, 09/01/2036 | | | 765 | |
| | | | | St Paul, MN, Housing & Redev Auth, Hope Community Academy Proj | | | | |
| | 450 | | | 6.25%, 12/01/2019 | | | 402 | |
| | | | | St Paul, MN, Housing & Redev Auth, Lease Rev | | | | |
| | 860 | | | 6.00%, 12/01/2018 | | | 799 | |
| | | | | St Paul, MN, PA Lease Rev | | | | |
| | 500 | | | 5.00%, 12/01/2019 | | | 525 | |
| | | | | Stillwater, MN, Multifamily Housing Rev AMT | | | | |
| | 400 | | | 5.38%, 02/01/2032 | | | 292 | |
| | | | | University of Minnesota (Prerefunded with State & Local Gov’t Securities) | | | | |
| | 1,000 | | | 5.75%, 07/01/2018 | | | 1,223 | |
| | | | | Waconia, MN, Health Care Fac Rev, Ridgeview Medical Center Proj (Prerefunded with State & Local Gov’t Securities) | | | | |
| | 1,000 | | | 6.10%, 01/01/2019 | | | 1,009 | |
| | | | | Willmar, MN, Rice Memorial Hospital Proj FSA | | | | |
| | 250 | | | 5.00%, 02/01/2025 | | | 258 | |
| | | | | | | | |
| | | | | | | | 17,562 | |
| | | | | | | | |
| | | | | Missouri - 1.0% | | | | |
| | | | | Branson Hills, MO, Infrastructure Fac | | | | |
| | 650 | | | 5.50%, 04/01/2027 | | | 525 | |
| | | | | Lees Summit, MO, Industrial DA, Kensington Farms Improvement Proj | | | | |
| | 1,000 | | | 5.75%, 03/01/2029 | | | 795 | |
| | | | | St Louis, MO, Industrial DA, Confluence Academy Proj | | | | |
| | 550 | | | 5.35%, 06/15/2032 | | | 404 | |
| | | | | Stone Canyon, MO, Community Improvement Proj | | | | |
| | 1,000 | | | 5.75%, 04/01/2027 | | | 773 | |
| | | | | | | | |
| | | | | | | | 2,497 | |
| | | | | | | | |
The accompanying notes are an integral part of these financial statements.
8
| | | | | | | | | |
| Shares or Principal Amount | | | Market Value ╪ | |
| MUNICIPAL BONDS - 98.1% — (continued) | | | | |
| | | | | Nebraska - 1.0% | | | | |
| | | | | Nebraska Public Power Dist Rev | | | | |
| $ | 2,500 | | | 5.00%, 01/01/2033 | | $ | 2,532 | |
| | | | | | | | |
| |
| | | | | New Hampshire - 0.3% | | | | |
| | | | | New Hampshire Health & Education Fac, Elliot Hospital | | | | |
| | 715 | | | 5.60%, 10/01/2022 | | | 724 | |
| | | | | | | | |
| |
| | | | | New Jersey - 1.3% | | | | |
| | | | | New Jersey Health Care Facilities FA Rev | | | | |
| | 2,145 | | | 5.75%, 10/01/2031 | | | 2,256 | |
| | | | | Tobacco Settlement Financing Corp, NJ | | | | |
| | 1,500 | | | 5.00%, 06/01/2041 | | | 1,008 | |
| | | | | | | | |
| | | | | | | | 3,264 | |
| | | | | | | | |
| | | | | New Mexico - 0.6% | | | | |
| | | | | Cabezon, NM, Public Improvement Dist | | | | |
| | 665 | | | 5.20%, 09/01/2015 | | | 604 | |
| | | | | New Mexico Hospital Equipment Loan Council | | | | |
| | 1,040 | | | 5.00%, 08/01/2039 | | | 1,021 | |
| | | | | | | | |
| | | | | | | | 1,625 | |
| | | | | | | | |
| | | | | New York - 8.3% | | | | |
| | | | | Albany, NY, IDA Civic Fac Rev | | | | |
| | 250 | | | 5.00%, 07/01/2037 | | | 219 | |
| | | | | Cattaraugus County, NY, IDR St Bonaventure University | | | | |
| | 175 | | | 5.10%, 05/01/2031 | | | 146 | |
| | | | | Chemung County, NY, IDA Civic Fac Rev, Arnot Ogden Medical Center | | | | |
| | 125 | | | 5.00%, 11/01/2034 | | | 111 | |
| | | | | Erie County, NY, IDA Applied Tech Charter School Proj | | | | |
| | 800 | | | 6.75%, 06/01/2025 | | | 748 | |
| | | | | Erie County, NY, IDA Global Concepts Charter School Proj | | | | |
| | 495 | | | 6.25%, 10/01/2037 | | | 404 | |
| | | | | Genesee County, NY, IDA United Memorial Medical Center Proj | | | | |
| | 160 | | | 5.00%, 12/01/2032 | | | 115 | |
| | | | | Madison County, NY, IDA Civic Fac Rev Oneida Health System | | | | |
| | 250 | | | 5.50%, 02/01/2032 | | | 227 | |
| | | | | Nassau County, NY, IDA Continuing Care Retirement, Amsterdam at Harborside, Ser A | | | | |
| | 1,500 | | | 6.50%, 01/01/2027 | | | 1,338 | |
| | | | | New York City Health & Hospital Corp | | | | |
| | 500 | | | 5.50%, 02/15/2023 | | | 536 | |
| | | | | New York Dorm Auth, Brooklyn Law School | | | | |
| | 250 | | | 5.50%, 07/01/2019 | | | 260 | |
| | | | | New York Dorm Auth, Fordham University FGIC | | | | |
| | 80 | | | 5.00%, 07/01/2020 | | | 83 | |
| | | | | New York Dorm Auth, Mount St Mary College | | | | |
| | 400 | | | 5.00%, 07/01/2027 | | | 365 | |
| | | | | New York Dorm Auth, Rochester University | | | | |
| | 135 | | | 5.25%, 07/01/2022 | | | 140 | |
| | | | | New York Dorm Auth, State University Dorm Fac (Prerefunded with US Gov’t Securities) | | | | |
| | 450 | | | 5.00%, 07/01/2032 | | | 496 | |
| | | | | New York Dorm Auth, Upstate Community College | | | | |
| | 250 | | | 5.25%, 07/01/2021 | | | 263 | |
| | | | | New York Dorm Auth, Winthrop South Nassau University | | | | |
| | 200 | | | 5.50%, 07/01/2023 | | | 201 | |
| | | | | New York Energy Research & DA, Elec Fac Rev Adj Long Island Lighting Co Proj | | | | |
| | 250 | | | 5.30%, 08/01/2025 | | | 251 | |
| | | | | New York Environmental Fac Corp | | | | |
| | 450 | | | 5.00%, 07/15/2026 | | | 468 | |
| | | | | New York Metropolitan Transportation Auth | | | | |
| | 450 | | | 5.13%, 11/15/2031 | | | 455 | |
| | | | | New York State Dormitory Auth, Rev Non St | | | | |
| | 2,000 | | | 5.38%, 03/01/2029 | | | 2,119 | |
| | | | | New York Tobacco Settlement FA | | | | |
| | 400 | | | 5.50%, 06/01/2022 | | | 420 | |
| | | | | New York, NY, GO | | | | |
| | 45 | | | 5.75%, 03/01/2019 | | | 49 | |
| | 1,000 | | | 6.25%, 10/15/2028 | | | 1,160 | |
| | | | | New York, NY, IDA American Airlines JFK International Airport AMT | | | | |
| | 860 | | | 7.13%, 08/01/2011 | | | 859 | |
| | 1,400 | | | 8.00%, 08/01/2012 | | | 1,398 | |
| | | | | New York, NY, IDA Civic Fac Rev, YMCA of Greater NY Proj | | | | |
| | 250 | | | 5.25%, 08/01/2021 | | | 252 | |
| | | | | New York, NY, Transitional FA Future Tax Secured | | | | |
| | 450 | | | 5.00%, 08/01/2023 | | | 467 | |
| | | | | Otsego County, NY, IDA Civic Fac Rev Hartwick College Proj | | | | |
| | 200 | | | 6.00%, 07/01/2011 | | | 201 | |
| | | | | Rensselaer County, NY, Industrial Improvements | | | | |
| | 200 | | | 5.00%, 01/01/2036 | | | 202 | |
| | | | | Seneca Nation Indians Capital Improvement Special Tax | | | | |
| | 1,160 | | | 5.00%, 12/01/2023 § | | | 950 | |
| | | | | St Lawrence, NY, IDA Civic Fac Rev, Clarkson University Proj | | | | |
| | 450 | | | 5.00%, 07/01/2023 | | | 452 | |
| | | | | Suffolk County, NY, Jeffersons Ferry Proj | | | | |
| | 500 | | | 5.00%, 11/01/2028 | | | 435 | |
| | | | | TSACS, Inc, NY, Tobacco Settlement | | | | |
| | 500 | | | 5.13%, 06/01/2042 | | | 372 | |
| | | | | Ulster County, NY, IDA Kingston Regional Senior Living Proj | | | | |
| | 4,475 | | | 6.00%, 09/15/2027 | | | 3,698 | |
| | | | | Westchester County, NY, IDA Continuing Care Retirement, Kendal on Hudson Proj | | | | |
| | 500 | | | 6.38%, 01/01/2024 | | | 496 | |
| | | | | | | | |
| | | | | | | | 20,356 | |
| | | | | | | | |
| | | | | North Carolina - 0.3% | | | | |
| | | | | Mecklenburg County, NC | | | | |
| | 795 | | | 5.00%, 02/01/2024 | | | 851 | |
| | | | | | | | |
The accompanying notes are an integral part of these financial statements.
9
The Hartford Tax-Free National Fund
Schedule of Investments — (continued)
October 31, 2009
(000’s Omitted)
| | | | | | | | | |
| Shares or Principal Amount | | | Market Value ╪ | |
MUNICIPAL BONDS - 98.1% — (continued) | | | | |
| | | | | Ohio - 1.9% | | | | |
| | | | | Cuyahoga Community College | | | | |
| $ | 1,200 | | | 5.00%, 08/01/2027 | | $ | 1,270 | |
| | | | | Hamilton, OH, School Dist Improvement | | | | |
| | 1,270 | | | 6.15%, 12/01/2016 | | | 1,537 | |
| | | | | Ohio State Higher Educational Facilities Rev | | | | |
| | 2,000 | | | 5.50%, 12/01/2036 | | | 2,065 | |
| | | | | | | | |
| | | | | | | | 4,872 | |
| | | | | | | | |
| | | | | Other U.S. Territories - 1.2% | | | | |
| | | | | Guam Government | | | | |
| | 565 | | | 5.75%, 12/01/2034 | | | 574 | |
| | | | | Puerto Rico Commonwealth | | | | |
| | 1,430 | | | 5.50%, 07/01/2032 | | | 1,390 | |
| | | | | Puerto Rico Housing FA | | | | |
| | 1,000 | | | 5.13%, 12/01/2027 | | | 1,012 | |
| | | | | University Virgin Islands | | | | |
| | 270 | | | 5.13%, 12/01/2022 | | | 271 | |
| | 225 | | | 5.25%, 12/01/2023 - 12/01/2024 | | | 227 | |
| | | | | | | | |
| | | | | | | | 3,474 | |
| | | | | | | | |
| | | | | Pennsylvania - 3.1% | | | | |
| | | | | Chester County, PA | | | | |
| | 1,000 | | | 5.00%, 07/15/2029 | | | 1,088 | |
| | | | | Montgomery County, PA, IDA Whitemarsh Continuing Care Proj | | | | |
| | 800 | | | 6.13%, 02/01/2028 | | | 590 | |
| | | | | Pennsylvania State Higher Educational FA Rev | | | | |
| | 2,145 | | | 5.75%, 07/01/2028 | | | 2,050 | |
| | | | | Pennsylvania Turnpike Commission | | | | |
| | 665 | | | 6.00%, 06/01/2028 | | | 752 | |
| | | | | Philadelphia, PA, Municipal Auth | | | | |
| | 750 | | | 6.38%, 04/01/2029 | | | 789 | |
| | 1,000 | | | 6.50%, 04/01/2034 | | | 1,053 | |
| | | | | Scranton, PA, Parking Auth | | | | |
| | 1,825 | | | 5.25%, 06/01/2034 | | | 1,676 | |
| | | | | | | | |
| | | | | | | | 7,998 | |
| | | | | | | | |
| | | | | Rhode Island - 1.0% | | | | |
| | | | | Central Falls, RI, Detention FA Fac Rev | | | | |
| | 890 | | | 6.75%, 01/15/2013 | | | 868 | |
| | | | | Tobacco Settlement Financing Corp | | | | |
| | 2,000 | | | 6.25%, 06/01/2042 | | | 1,818 | |
| | | | | | | | |
| | | | | | | | 2,686 | |
| | | | | | | | |
| | | | | South Carolina - 0.5% | | | | |
| | | | | South Carolina Jobs Econ DA Rev | | | | |
| | 2,000 | | | 4.70%, 04/01/2035 | | | 1,387 | |
| | | | | | | | |
| |
| | | | | South Dakota - 0.9% | | | | |
| | | | | South Dakota Housing DA | | | | |
| | 1,985 | | | 6.13%, 05/01/2033 | | | 2,128 | |
| | | | | | | | |
| |
| | | | | Tennessee - 0.0% | | | | |
| | | | | McMinn County, TN, IDA PCR Calhoun Newsprint Co Proj | | | | |
| | 500 | | | 0.00%, 03/01/2016 Ω | | | 70 | |
| | | | | | | | |
| |
| | | | | Texas - 9.9% | | | | |
| | | | | Corpus Christi, TX, ISD | | | | |
| | 1,525 | | | 5.00%, 08/15/2026 | | | 1,640 | |
| | | | | Dallas Fort Worth, TX, International Airport | | | | |
| | 2,000 | | | 6.00%, 11/01/2028 - 11/01/2032 | | | 2,001 | |
| | | | | Harris County, TX, Cultural Education Fac Baylor CLG Medicine | | | | |
| | 2,145 | | | 5.63%, 11/15/2032 | | | 1,944 | |
| | | | | Houston, TX, Airport System Rev | | | | |
| | 1,070 | | | 5.50%, 07/01/2034 | | | 1,119 | |
| | 1,500 | | | 6.75%, 07/01/2021 | | | 1,410 | |
| | | | | Houston, TX, Utility Systems Rev | | | | |
| | 2,000 | | | 6.00%, 11/15/2036 | | | 2,222 | |
| | | | | La Vernia Texas Higher Education | | | | |
| | 2,000 | | | 6.38%, 08/15/2044 ☼ | | | 1,985 | |
| | | | | Lower Colorado River Auth Rev | | | | |
| | 2,000 | | | 7.25%, 05/15/2037 | | | 2,204 | |
| | | | | Mc Lennan County, TX, Public Fac | | | | |
| | 2,000 | | | 6.63%, 06/01/2035 | | | 2,183 | |
| | | | | North Texas Tollway Auth | | | | |
| | 4,000 | | | 6.00%, 01/01/2025 | | | 4,251 | |
| | | | | Tarrant County, TX, Cultural Education Facilities | | | | |
| | 1,000 | | | 6.25%, 11/15/2029 | | | 1,066 | |
| | | | | Travis County, TX, Health Fac, Querencia Barton Creek Project | | | | |
| | 1,000 | | | 5.65%, 11/15/2035 | | | 790 | |
| | | | | Tyler, TX, ISD | | | | |
| | 2,000 | | | 5.00%, 02/15/2028 | | | 2,105 | |
| | | | | | | | |
| | | | | | | | 24,920 | |
| | | | | | | | |
| | | | | Virginia - 1.1% | | | | |
| | | | | Peninsula, VA, Turn Center Community Dev DA | | | | |
| | 700 | | | 6.45%, 09/01/2037 | | | 605 | |
| | | | | Virginia State Residential Auth | | | | |
| | 500 | | | 5.00%, 11/01/2024 | | | 557 | |
| | | | | Virginia Tobacco Settlement Funding Corp (Prerefunded with US Gov’t Securities) | | | | |
| | 1,455 | | | 5.50%, 06/01/2026 | | | 1,618 | |
| | | | | | | | |
| | | | | | | | 2,780 | |
| | | | | | | | |
| | | | | Washington - 3.7% | | | | |
| | | | | FYI Properties Lease Rev | | | | |
| | 2,285 | | | 5.50%, 06/01/2034 | | | 2,425 | |
| | | | | King County, WA, ISD #210 GO | | | | |
| | 670 | | | 5.00%, 06/01/2019 | | | 707 | |
| | | | | Washington State Health Care FA Rev | | | | |
| | 2,500 | | | 5.63%, 10/01/2038 | | | 2,554 | |
| | 2,400 | | | 6.13%, 08/15/2037 | | | 2,446 | |
| | 835 | | | 6.50%, 11/15/2033 | | | 881 | |
| | | | | | | | |
| | | | | | | | 9,013 | |
| | | | | | | | |
| | | | | Wisconsin - 3.0% | | | | |
| | | | | Badger Tobacco Asset Securitization Corp of WI (Prerefunded with US Gov’t Securities) | | | | |
| | 2,165 | | | 6.13%, 06/01/2027 | | | 2,346 | |
| | 1,000 | | | 6.38%, 06/01/2032 | | | 1,120 | |
| | | | | Wisconsin State General Fund | | | | |
| | 125 | | | 5.75%, 05/01/2033 | | | 137 | |
| | 865 | | | 6.00%, 05/01/2036 | | | 957 | |
| | | | | Wisconsin State Health & Educational FA Rev | | | | |
| | 2,500 | | | 5.50%, 08/15/2023 | | | 2,503 | |
| | | | | | | | |
| | | | | | | | 7,063 | |
| | | | | | | | |
The accompanying notes are an integral part of these financial statements.
10
| | | | | | | | | | | | | |
| Shares or Principal Amount | | | | | | | Market Value ╪ | |
| MUNICIPAL BONDS - 98.1% — (continued) | | | | | | | | |
| | | | | Wyoming - 1.3% | | | | | | | | |
| | | | | Campbell County, WY, Solid Waste Facilities | | | | | | | | |
| $ | 3,000 | | | 5.75%, 07/15/2039 | | | | | | $ | 3,152 | |
| | | | | | | | | | | |
| |
| | | | | Total municipal bonds
(cost $250,475) | | | | | | $ | 245,571 | |
| | | | | | | | | | | |
| |
| | | | | Total long-term investments
(cost $250,475) | | | | | | $ | 245,571 | |
| | | | | | | | | | | |
| |
| SHORT-TERM INVESTMENTS - 1.2% | | | | | | | | |
| | | | | Investment Pools and Funds - 1.2% | | | | | | | | |
| $ | 3,106 | | | State Street Bank Tax Free Money Market Fund | | | | | | | | |
| | | | | | | | | | | $ | 3,106 | |
| | | | | | | | | | | |
| | | | | Total short-term investments
(cost $3,106) | | | | | | $ | 3,106 | |
| | | | | | | | | | | |
| | | | | Total investments
(cost $253,581) ▲ | | | 99 .3 | % | | $ | 248,677 | |
| | | | | Other assets and liabilities | | | 0 .7 | % | | | 1,643 | |
| | | | | | | | | | | |
| | | | | Total net assets | | | 100 .0 | % | | $ | 250,320 | |
| | | | | | | | | | | |
| | |
| Note: | | Percentage of investments as shown is the ratio of the total market value to total net assets. |
| ▲ | | At October 31, 2009, the cost of securities for federal income tax purposes was $253,581 and the aggregate gross unrealized appreciation and depreciation based on that cost were: |
| | | | | |
| Unrealized Appreciation | | $ | 9,837 | |
| Unrealized Depreciation | | | (14,741 | ) |
| | | | |
| Net Unrealized Depreciation | | $ | (4,904 | ) |
| | | | |
| o | | The interest rate disclosed for these securities represents the effective yield on the date of the acquisition. |
| |
| • | | Currently non-income producing. For long-term debt securities, items identified are in default as to payment of interest and/or principal. |
| |
| ‡ | | This security, or a portion of this security, has been segregated to cover funding requirements on investment transactions settling in the future. |
| |
| Δ | | Variable rate securities; the rate reported is the coupon rate in effect at October 31, 2009. |
| |
| ■ | | Securities issued within terms of a private placement memorandum, exempt from registration under Rule 144A under the Securities Act of 1933, as amended, and may be sold only to qualified institutional buyers. Pursuant to guidelines adopted by the Board of Directors, these issues are determined to be liquid. The aggregate value of these securities at October 31, 2009, was $4,432, which represents 1.77% of total net assets. |
| ☼ | | The cost of securities purchased on a when-issued or delayed delivery basis at October 31, 2009 was $1,993. |
| Ω | | Debt security in default due to bankruptcy. |
| ⌂ | | The following securities are considered illiquid. Illiquid securities are often purchased in private placement transactions, are often not registered under the Securities Act of 1933 and may have contractual restrictions on resale. A security may also be considered illiquid if the security lacks a readily available market or if its valuation has not changed for a certain period of time. |
| | | | | | | | | | | | | |
| Period | | | Shares/ | | | | | | |
| Acquired | | | Par | | | Security | | Cost Basis | |
| | 06/2006 | | | $ | 975 | | | Amelia Walk Community Development, 5.50%, 05/01/2037 | | $ | 975 | |
| | 11/2006 | | | $ | 250 | | | Beaumont, CA, FA Improvement Area #8, 5.05%, 09/01/2037 | | | 250 | |
| | 07/2007 | | | $ | 2,000 | | | Bromley Park, CO, Metro Dist #2 GO, 5.13%, 12/01/2037 | | | 2,024 | |
| | 07/2004 | | | $ | 1,000 | | | Chicago, IL, Tax Increment Allocation Jr Lien Pilsen Redev B, 6.75%, 06/01/2022 | | | 1,000 | |
| | 11/2007 | | | $ | 265 | | | Estrella Mountain Ranch Community GO, 6.20%, 07/15/2032 | | | 265 | |
| | 05/2007 | | | $ | 1,800 | | | Hampshire, IL, Special Service Area #13, Tuscany Woods Proj, 5.75%, 03/01/2037 | | | 1,800 | |
| | 07/2007 | | | $ | 1,000 | | | Louisiana Public Fac Auth, Susla Fac, Inc., 5.75%, 07/01/2039 - 144A | | | 1,006 | |
| | 04/2007 | | | $ | 1,000 | | | Reata, CO, North Metro Dist GO, 5.50%, 12/01/2032 - 144A | | | 1,000 | |
| | 11/2006 | | | $ | 65 | | | Rolling Hills Community Development Dist, 5.45%, 05/01/2037 | | | 65 | |
| | 11/2004 | | | $ | 1,000 | | | San Manuel, CA, Entertainment Auth Public Improvement, 4.50%, 12/01/2016 - 144A | | | 1,000 | |
The aggregate value of these securities at October 31, 2009 was $6,854 which represents 2.74% of total net assets.
| | | | | |
| AMT | | — | | Alternative Minimum Tax |
| DA | | — | | Development Authority |
| FA | | — | | Finance Authority |
| FGIC | | — | | Financial Guaranty Insurance Company |
| FSA | | — | | Financial Security Assurance |
| GO | | — | | General Obligations |
| IDA | | — | | Industrial Development Authority Bond |
| IDR | | — | | Industrial Development Revenue Bond |
| ISD | | — | | Independent School District |
| MBIA | | — | | Municipal Bond Insurance Association |
| PA | | — | | Port Authority |
| PCR | | — | | Pollution Control Revenue Bond |
| USD | | — | | United School District |
| ╪ | | See Significant Accounting Policies of accompanying Notes to Financial Statements regarding valuation of securities. |
The accompanying notes are an integral part of these financial statements.
11
The Hartford Tax-Free National Fund
Investment Valuation Hierarchy Level Summary
October 31, 2009
(000’s Omitted)
| | | | | | | | | | | | | | | | | |
| | | Total | | | Level 1 | | | Level 2 | | | Level 3 | |
Assets: | | | | | | | | | | | | | | | | |
| Municipal Bonds | | $ | 245,571 | | | $ | — | | | $ | 245,571 | | | $ | — | |
| Short-Term Investments | | | 3,106 | | | | 3,106 | | | | — | | | | | |
| | | | | | | | | | | | | |
| Total | | $ | 248,677 | | | $ | 3,106 | | | $ | 245,571 | | | $ | — | |
| | | | | | | | | | | | | |
The accompanying notes are an integral part of these financial statements.
12
The Hartford Tax-Free National Fund
Statement of Assets and Liabilities
October 31, 2009
(000’s Omitted)
| | | | | |
Assets: | | | | |
| Investments in securities, at market value (cost $253,581) | | $ | 248,677 | |
| Receivables: | | | | |
| Fund shares sold | | | 294 | |
| Dividends and interest | | | 4,278 | |
| Other assets | | | 74 | |
| | | | |
| Total assets | | | 253,323 | |
| | | | |
Liabilities: | | | | |
| Payables: | | | | |
| Investment securities purchased | | | 1,993 | |
| Fund shares redeemed | | | 759 | |
| Investment management fees | | | 20 | |
| Dividends | | | 185 | |
| Distribution fees | | | 15 | |
| Accrued expenses | | | 31 | |
| | | | |
| Total liabilities | | | 3,003 | |
| | | | |
| Net assets | | $ | 250,320 | |
| | | | |
Summary of Net Assets: | | | | |
| Capital stock and paid-in-capital | | | 298,249 | |
| Accumulated undistributed net investment income | | | 103 | |
| Accumulated net realized loss on investments | | | (43,128 | ) |
| Unrealized depreciation of investments | | | (4,904 | ) |
| | | | |
| Net assets | | $ | 250,320 | |
| | | | |
| | | | | |
| Shares authorized | | | 19,300,000 | |
| | | | |
| Par value | | $ | 0.0001 | |
| | | | |
Class A: Net asset value per share/Maximum offering price per share | | $ | 9.11/$9.54 | |
| | | | |
| Shares outstanding | | | 16,645 | |
| | | | |
| Net assets | | $ | 151,639 | |
| | | | |
Class B: Net asset value per share | | $ | 9.04 | |
| | | | |
| Shares outstanding | | | 954 | |
| | | | |
| Net assets | | $ | 8,623 | |
| | | | |
Class C: Net asset value per share | | $ | 9.07 | |
| | | | |
| Shares outstanding | | | 4,714 | |
| | | | |
| Net assets | | $ | 42,730 | |
| | | | |
Class I: Net asset value per share | | $ | 9.13 | |
| | | | |
| Shares outstanding | | | 756 | |
| | | | |
| Net assets | | $ | 6,899 | |
| | | | |
Class L: Net asset value per share/Maximum offering price per share | | $ | 9.08/$9.51 | |
| | | | |
| Shares outstanding | | | 792 | |
| | | | |
| Net assets | | $ | 7,190 | |
| | | | |
Class Y: Net asset value per share | | $ | 9.09 | |
| | | | |
| Shares outstanding | | | 3,657 | |
| | | | |
| Net assets | | $ | 33,239 | |
| | | | |
The accompanying notes are an integral part of these financial statements.
13
The Hartford Tax-Free National Fund
Statement of Operations
For the Year Ended October 31, 2009
(000’s Omitted)
| | | | | |
Investment Income: | | | | |
| Interest | | $ | 12,448 | |
| | | | |
| Total investment income | | | 12,448 | |
| | | | |
| | | | | |
Expenses: | | | | |
| Investment management fees | | | 1,066 | |
| Transfer agent fees | | | 102 | |
| Distribution fees | | | | |
| Class A | | | 330 | |
| Class B | | | 73 | |
| Class C | | | 338 | |
| Class L | | | 16 | |
| Custodian fees | | | 6 | |
| Accounting services fees | | | 30 | |
| Registration and filing fees | | | 92 | |
| Board of Directors’ fees | | | 8 | |
| Audit fees | | | 11 | |
| Other expenses | | | 41 | |
| | | | |
| Total expenses (before waivers and fees paid indirectly) | | | 2,113 | |
| Expense waivers | | | (83 | ) |
| Custodian fee offset | | | (1 | ) |
| | | | |
| Total waivers and fees paid indirectly | | | (84 | ) |
| | | | |
| Total expenses, net | | | 2,029 | |
| | | | |
Net Investment Income | | | 10,419 | |
| | | | |
Net Realized Loss on Investments: | | | | |
| Net realized loss on investments in securities | | | (16,622 | ) |
| | | | |
Net Realized Loss on Investments | | | (16,622 | ) |
| | | | |
Net Changes in Unrealized Appreciation of Investments: | | | | |
| Net unrealized appreciation of investments | | | 30,505 | |
| | | | |
Net Changes in Unrealized Appreciation of Investments | | | 30,505 | |
| | | | |
Net Gain on Investments | | | 13,883 | |
| | | | |
Net Increase in Net Assets Resulting from Operations | | $ | 24,302 | |
| | | | |
The accompanying notes are an integral part of these financial statements.
14
The Hartford Tax-Free National Fund
Statement of Changes in Net Assets
(000’s Omitted)
| | | | | | | | | |
| | | For the | | | For the | |
| | | Year Ended | | | Year Ended | |
| | | October 31, 2009 | | | October 31, 2008 | |
Operations: | | | | | | | | |
| Net investment income | | $ | 10,419 | | | $ | 9,111 | |
| Net realized loss on investments | | | (16,622 | ) | | | (17,046 | ) |
| Net unrealized appreciation (depreciation) of investments | | | 30,505 | | | | (27,659 | ) |
| | | | | | | |
Net Increase (Decrease) In Net Assets Resulting From Operations | | | 24,302 | | | | (35,594 | ) |
| | | | | | | |
Distributions to Shareholders: | | | | | | | | |
| From net investment income | | | | | | | | |
| Class A | | | (6,616 | ) | | | (6,270 | ) |
| Class B | | | (315 | ) | | | (254 | ) |
| Class C | | | (1,444 | ) | | | (1,058 | ) |
| Class I | | | (298 | ) | | | (196 | ) |
| Class L | | | (333 | ) | | | (354 | ) |
| Class Y | | | (1,464 | ) | | | (1,129 | ) |
| | | | | | | |
| Total distributions | | | (10,470 | ) | | | (9,261 | ) |
| | | | | | | |
Capital Share Transactions: | | | | | | | | |
| Class A | | | 29,626 | * | | | 28,033 | |
| Class B | | | 2,903 | † | | | (241 | ) |
| Class C | | | 13,317 | ‡ | | | 11,034 | |
| Class I | | | 1,831 | | | | 2,133 | |
| Class L | | | 1,016 | § | | | (1,058 | ) |
| Class Y | | | 13,063 | ** | | | (3,239 | ) |
| | | | | | | |
| Net increase from capital share transactions | | | 61,756 | | | | 36,662 | |
| | | | | | | |
Net Increase (Decrease) In Net Assets | | | 75,588 | | | | (8,193 | ) |
Net Assets: | | | | | | | | |
| Beginning of period | | | 174,732 | | | | 182,925 | |
| | | | | | | |
| End of period | | $ | 250,320 | | | $ | 174,732 | |
| | | | | | | |
| Accumulated undistributed (distribution in excess of) net investment income (loss) | | $ | 103 | | | $ | 154 | |
| | | | | | | |
| | |
| * | | Includes merger activity in the amount of $38,488. |
| |
| † | | Includes merger activity in the amount of $3,184. |
| |
| ‡ | | Includes merger activity in the amount of $9,178. |
| |
| § | | Includes merger activity in the amount of $2,261. |
| |
| ** | | Includes merger activity in the amount of $15,883. |
The accompanying notes are an integral part of these financial statements.
15
The Hartford Tax-Free National Fund
Notes to Financial Statements
October 31, 2009
(000’s Omitted)
| | | The Hartford Mutual Funds II, Inc. (“Company”) is an open-end management investment company comprised of six portfolios. Financial statements for The Hartford Tax-Free National Fund (the “Fund”), a series of the Company, are included in this report. |
| | | The Company is organized under the laws of the State of Maryland and is registered with the Securities and Exchange Commission (“SEC”) under the Investment Company Act of 1940, as amended (“1940 Act”). The Fund is a diversified open-end management investment company. |
| | | Class A shares are sold with a front-end sales charge of up to 4.50%. Class B shares were sold with a contingent deferred sales charge which is assessed on the lesser of the per share net asset value (“NAV”) of the shares at the time of redemption or the original purchase price, and declines from up to 5.00% to zero depending on the period of time the shares are held (See note below regarding the closing of Class B shares). Class C shares are sold with a contingent deferred sales charge of up to 1.00% on shares redeemed within twelve months of purchase. Class I shares are sold without sales charges to certain eligible investors through advisory fee-based wrap programs. Class L shares are sold with a sales charge of up to 4.50%. Class Y shares, which are sold to certain eligible institutional investors, are sold without a sales charge. All classes of shares have identical voting, redemption, dividend, liquidation and other rights and the same terms and conditions, with the exceptions that each class may have different expenses, which may affect performance, and that Class B shares automatically convert to Class A shares after 8 years. |
| | | Effective September 30, 2009, no new or additional investments are allowed in Class B shares of The Hartford Mutual Funds (including investments through any systematic investment plan). After September 30, 2009, existing shareholders of Class B shares may continue to hold their Class B shares, exchange their Class B shares for Class B shares of another Hartford Mutual Fund (as permitted by existing exchange privileges), or redeem their Class B shares as described in the Fund’s prospectus. Reinstatement privileges with respect to Class B shares will continue under the current policy. For investors electing to reinvest capital gains and dividends, any such capital gains or dividends on Class B shares will continue to be reinvested in Class B shares of the Fund. For Class B shares outstanding as of September 30, 2009, all Class B share attributes, including the 12b-1 fee, contingent deferred sales charge schedule, and conversion to Class A shares remain unchanged. |
| 2. | | Significant Accounting Policies: |
| | | The following is a summary of significant accounting policies of the Fund, which are in accordance with U.S. Generally Accepted Accounting Principles (“GAAP”). |
| | a) | | Security Transactions and Investment Income — Security transactions are recorded on the trade date (the date the order to buy or sell is executed). Security gains and losses are determined on the basis of identified cost. |
| | | | Interest income, including amortization of premium and accretion of discounts, is accrued on a daily basis. |
| | b) | | Security Valuation — The Fund generally uses market prices in valuing portfolio securities. If market prices are not readily available or are deemed unreliable, the Fund will use the fair value of the security as determined in good faith under policies and procedures established by and under the supervision of the Fund’s Board of Directors. Market prices may be deemed unreliable, for example, if a security is thinly traded or if an event has occurred after the close of the security’s primary market, but before the close of the New York Stock Exchange (the “Exchange”) (generally 4:00 p.m. Eastern Time, referred to as the “Valuation Time”) that is expected to affect the value of the portfolio security. The circumstances in which the Fund may use fair value pricing include, among others: (i) the occurrence of events that are significant to a particular issuer, such as mergers, restructuring or defaults; (ii) the occurrence of events that are significant to an entire market, such as natural disasters in a particular region or governmental actions; (iii) trading restrictions on securities; (iv) thinly traded securities and (v) market events such as trading halts and early market |
16
| | | | closings. Securities that are primarily traded on foreign markets may trade on days that are not business days of the Fund. The value of the foreign securities in which the Fund invests may change on days when a shareholder will not be able to purchase or redeem shares of the Fund. Fair value pricing is subjective in nature and the use of fair value pricing by the Fund may cause the NAV of its shares to differ significantly from the NAV that would have been calculated using market prices at the close of the exchange on which a portfolio security is primarily traded but before the Valuation Time. There can be no assurance that the Fund could obtain the fair value assigned to a security if the Fund were to sell the security at approximately the time at which the Fund determines its NAV. |
| | | | Debt securities (other than short-term obligations) held by the Fund are valued using bid prices or using valuations based on a matrix system (which considers factors such as security prices, yield, maturity and ratings) as provided by independent pricing services. Securities for which prices are not available from an independent pricing service may be valued using market quotations obtained from one or more dealers that make markets in the securities in accordance with procedures established by the Fund’s Board of Directors. Generally, the Fund may use fair valuation in regard to debt securities when the Fund holds defaulted or distressed securities or securities in a company in which a reorganization is pending. Short-term investments with a maturity of more than 60 days when purchased are valued based on market quotations until the remaining days to maturity become less than 61 days. Investments that mature in 60 days or less are generally valued at amortized cost, which approximates market value. |
| | | | Financial instruments for which prices are not available from an independent pricing service are valued using market quotations obtained from one or more dealers that make markets in securities in accordance with procedures established by the Fund’s Board of Directors. |
| | | | Other derivative or contractual type instruments shall be valued using market prices if such instruments trade on an exchange or market. If such instruments do not trade on an exchange or market, such instruments shall be valued at a price at which the counterparty to such contract would repurchase the instrument. In the event that the counterparty cannot provide a price, such valuation may be determined in accordance with procedures established by the Fund’s Board of Directors. |
| | | | Investments in open-end mutual funds are valued at the respective NAV of each open-end mutual fund on the valuation date. |
| | | | Various inputs are used in determining the value of the Fund’s investment. These inputs are summarized into three broad hierarchy levels. This hierarchy is based on whether the valuation inputs are observable or unobservable. These levels are: |
| | • | | Level 1 — Quoted prices in active markets for identical securities. Level 1 may include exchange-traded instruments such as domestic equities, some foreign equities, options, futures, mutual funds, ETF’s, and rights and warrants. |
| | • | | Level 2 — Observable inputs other than Level 1 prices, such as quoted prices for similar securities; quoted prices in markets that are not active; or other inputs that are observable or can be corroborated by observable market data for substantially the full term of the security. Level 2 may include debt securities that are traded less frequently than exchange-traded instruments and that are valued using third party pricing services, foreign equities, whose value is determined using a multi-factor regression model with inputs that are observable in the market; and money market instruments, which are carried at amortized cost. |
| | • | | Level 3 — Significant unobservable inputs that are supported by little or no market activity. Level 3 includes financial instruments whose values are determined using broker quotes or require significant management judgment or estimation. This category may include broker quoted securities and securities where trading has been halted or there are certain restrictions on trading. While these securities are priced using unobservable inputs, the valuation of these securities reflects the best available data and management believes the prices are a reasonable representation of exit price. |
17
The Hartford Tax-Free National Fund
Notes to Financial Statements — (continued)
October 31, 2009
(000’s Omitted)
| | | | Individual securities within any of the above mentioned asset classes may be assigned a different hierarchical level than those presented above, as individual circumstances dictate. |
| | | | During the year ended October 31, 2009, the Fund held no Level 3 securities, therefore no reconciliation of Level 3 securities is presented. |
| | | | Refer to the Investment Valuation Hierarchy Level Summary found following the Schedule of Investments. |
| | c) | | Fund Share Valuation and Dividend Distributions to Shareholders — Orders for the Fund’s shares are executed in accordance with the investment instructions of the shareholders. The NAV of the Fund’s shares is determined as of the close of each business day of the Exchange. The NAV is determined separately for each class of the Fund by dividing the Fund’s net assets attributable to that class by the number of shares of the class outstanding. Orders for the purchase of the Fund’s shares prior to the close of the Exchange on any day on which the Exchange is open for business are priced at the NAV determined as of the close of the Exchange. Orders after the close of the Exchange, or on a day on which the Exchange and/or the Fund is not open for business, are priced at the next determined NAV. |
| | | | The Fund intends to distribute substantially all of its net investment income and net realized capital gains to shareholders no less frequently than once a year. Normally, dividends from net investment income of the Fund are declared daily and paid monthly. Dividends are paid on shares beginning on the business day after the day when the funds used to purchase the shares are collected by the transfer agent for the Fund. Unless shareholders specify otherwise, all dividends will be automatically reinvested in additional full or fractional shares of the Fund. |
| | | | Distributions from net investment income, realized capital gains and capital are determined in accordance with federal income tax regulations, which may differ from U.S. GAAP with respect to character and timing. These differences may include but are not limited to losses deferred due to wash sale adjustments, foreign currency gains and losses, adjustments related to Passive Foreign Investment Companies (“PFICs”), Real Estate Investment Trusts (“REITs”), Regulated Investment Companies (“RICs”), certain derivatives and partnerships. Permanent book and federal income tax basis differences relating to shareholder distributions will result in reclassifications to certain of the Fund’s capital accounts (see Federal Income Taxes: Reclassification of Capital Accounts footnote). |
| | d) | | Illiquid and Restricted Securities — The Fund is permitted to invest up to 15% of its net assets in illiquid securities. “Illiquid Securities” are those that may not be sold or disposed of in the ordinary course of business within seven days, at approximately the price used to determine the Fund’s NAV. The Fund may not be able to sell illiquid securities or other investments when its sub-adviser considers it desirable to do so or may have to sell such securities or investments at a price that is lower than the price that could be obtained if the securities or investments were more liquid. A sale of illiquid securities or other investments may require more time and may result in higher dealer discounts and other selling expenses than does the sale of those that are liquid. Illiquid securities and investments also may be more difficult to value, due to the unavailability of reliable market quotations for such securities or investments, and an investment in them may have an adverse impact on the Fund’s NAV. The Fund may also purchase certain restricted securities, commonly known as Rule 144A securities, that can be resold to institutions and which may be determined to be liquid pursuant to policies and guidelines established by the Fund’s Board of Directors. The Fund, as shown on the Schedule of Investments, had illiquid and/or restricted securities as of October 31, 2009. |
| | e) | | Securities Purchased on a When-Issued or Delayed-Delivery Basis — Delivery and payment for securities that have been purchased by the Fund on a forward commitment, or when-issued or delayed-delivery basis, take place beyond the customary settlement period. During this period, such securities are subject to market fluctuations, and the Fund identifies securities segregated in its records with value at least equal to the amount of the commitment. The Fund, as shown on the Schedule of Investments, had when-issued or delayed delivery securities as of October 31, 2009. |
| |
| | f) | | Credit Risk — Credit risk depends largely on the perceived financial health of bond issuers. In general, the credit rating is inversely related to the credit risk of the issuer. Higher rated bonds generally are deemed to have less credit risk, while |
18
| | | | lower or unrated bonds are deemed to have higher risk of default. The share price, yield and total return of a Fund which holds securities with higher credit risk may fluctuate more than with less aggressive bond funds. |
| | g) | | Prepayment Risks — Certain debt securities allow for prepayment of principal without penalty. Securities subject to prepayment risk generally offer less potential for gains when interest rates decline, and may offer a greater potential for loss when interest rates rise. In addition, with respect to securities, rising interest rates may cause prepayments to occur at a slower than expected rate, thereby effectively lengthening the maturity of the security and making the security more sensitive to interest rate changes. The potential for the value of a debt security to increase in response to interest rate declines is limited. For certain securities, the actual maturity may be less than the stated maturity shown in the Schedule of Investments. As a result, the timing of income recognition relating to these securities may vary based upon the actual maturity. |
| | h) | | Use of Estimates — The preparation of financial statements in conformity with U.S. GAAP requires management to make estimates and assumptions that affect the reported amounts of assets and liabilities as of the date of the financial statements and the reported amounts of income and expenses during the period. Operating results in the future could vary from the amounts derived from management’s estimates. |
| | i) | | Indemnifications — Under the Company’s organizational documents, the Company shall indemnify its officers and directors to the full extent required or permitted under Maryland General Corporation Law and the federal securities law. In addition, the Company, on behalf of the Fund, may enter into contracts that contain a variety of indemnifications. The Company’s maximum exposure under these arrangements is unknown. However, the Company has not had prior claims or losses pursuant to these contracts and expects the risk of loss to be remote. |
| | a) | | Federal Income Taxes — For federal income tax purposes, the Fund intends to continue to qualify as a RIC under Subchapter M of the Internal Revenue Code (“IRC”) by distributing substantially all of its taxable net investment income and net realized capital gains to its shareholders and otherwise complying with the requirements of regulated investment companies. The Fund has distributed substantially all of its income and capital gains in prior years and intends to distribute substantially all of its income and capital gains during the calendar year ending December 31, 2009. Accordingly, no provision for federal income or excise taxes has been made in the accompanying financial statements. Distributions from short-term capital gains are treated as ordinary income distributions for federal income tax purposes. |
| | b) | | Net Investment Income (Loss), Realized Gains and (Losses) — Net investment income (loss) and net realized gains (losses) may differ for financial statement and tax purposes primarily because of losses deferred due to wash sale adjustments, foreign currency gains and losses, adjustments related to PFICs, REITs, RICs, certain derivatives and partnerships. The character of distributions made during the year from net investment income or realized gains may differ from their ultimate characterization for federal income tax purposes. Also, due to the timing of dividend distributions, the fiscal year in which amounts are distributed may differ from the year that the income or realized gains (losses) were recorded by the Fund. |
| | c) | | Distributions and Components of Distributable Earnings — The tax character of distributions paid by the Fund for the periods indicated is as follows (as adjusted for dividends payable): |
| | | | | | | | | |
| | | For the Year Ended | | | For the Year Ended | |
| | | October 31, 2009 | | | October 31, 2008 | |
| Tax Exempt Income † | | $ | 10,453 | | | $ | 9,273 | |
| Ordinary Income | | | 8 | | | | — | |
| † | | The Fund designates these distributions as exempt interest pursuant to IRC Sec. 852(b)(5). |
19
The Hartford Tax-Free National Fund
Notes to Financial Statements — (continued)
October 31, 2009
(000’s Omitted)
| | | | As of October 31, 2009, the Fund’s components of distributable earnings (deficit) on a tax basis were as follows: |
| | | | | |
| | | Amount | |
| Undistributed Ordinary Income | | $ | 307 | |
| Accumulated Capital Losses * | | | (43,128 | ) |
| Unrealized Depreciation † | | | (4,904 | ) |
| | | | |
| Total Accumulated Deficit | | $ | (47,725 | ) |
| | | | |
| | |
| * | | The Fund has capital loss carryforwards that are identified in the Capital Loss Carryforward note that follows. |
| |
| † | | The differences between book-basis and tax-basis unrealized appreciation (depreciation) may be attributable to the losses deferred due to wash sale adjustments, foreign currency gains and losses, adjustments related to PFICs, REITs, RICs, certain derivatives and partnerships. |
| | d) | | Reclassification of Capital Accounts — The Fund may record reclassifications in its capital accounts. These reclassifications have no impact on the total net assets of the Fund. The reclassifications are a result of permanent differences between GAAP and tax accounting for such items as net operating losses that reduce distribution requirements. Adjustments are made to reflect the impact these items have on current and future distributions to shareholders. Therefore, the source of the Fund’s distributions may be shown in the accompanying Statement of Changes in Net Assets as from net investment income, from net realized gains on investments or from capital depending on the type of book and tax differences that exist. For the year ended October 31, 2009, the Fund had no reclassifications. |
| |
| | e) | | Capital Loss Carryforward — At October 31, 2009 (tax-year-end), the Fund had capital loss carryforwards for U.S. federal income tax purposes of approximately: |
| | | | | |
| Year of Expiration | | Amount | |
| 2013 | | $ | 5 | |
| 2014 | | | 433 | |
| 2015 | | | 2,885 | |
| 2016 | | | 23,184 | |
| 2017 | | | 16,621 | |
| | | | |
Total | | $ | 43,128 | |
| | | | |
| | | | As a result of current or past mergers in the Fund, certain provisions in the Internal Revenue Code may limit the future utilization of capital losses. |
| |
| | f) | | Accounting for Uncertainty in Income Taxes — Management has evaluated all open tax years and has determined there is no impact to the Fund’s financial statements related to uncertain tax positions. Generally, tax authorities can examine all tax returns filed for the last three years. |
| | a) | | Investment Management Agreement — Hartford Investment Financial Services, LLC (“HIFSCO”) serves as investment manager to the Fund pursuant to an Investment Management Agreement with the Company. As investment manager, HIFSCO has overall investment supervisory responsibility for the Fund. In addition, HIFSCO provides administrative personnel, services, equipment, facilities and office space for proper operation of the Fund. HIFSCO has contracted with Hartford Investment Management for the provision of day-to-day investment management services to the Fund in accordance with the Fund’s investment objective and policies. The Fund pays a fee to HIFSCO, a portion of which may be used to compensate Hartford Investment Management. |
20
| | | | The schedule below reflects the rates of compensation paid to HIFSCO for investment management services rendered during the year ended October 31, 2009; the rates are accrued daily and paid monthly: |
| | | | | |
| Average Daily Net Assets | | Annual Fee | |
| On first $500 million | | | 0.50 | % |
| On next $4.5 billion | | | 0.45 | % |
| On next $5 billion | | | 0.43 | % |
| Over $10 billion | | | 0.42 | % |
| | b) | | Accounting Services Agreement — Pursuant to the Fund Accounting Agreement between Hartford Life Insurance Company (“HLIC”) and the Fund, HLIC provides accounting services to the Fund and receives monthly compensation on the Fund’s average net assets. The Fund’s accounting services fees are accrued daily and paid monthly. |
| | | | | |
| Average Daily Net Assets | | Annual Fee | |
| On first $5 billion | | | 0.014 | % |
| On next $5 billion | | | 0.012 | % |
| Over $10 billion | | | 0.010 | % |
| | c) | | Operating Expenses — Allocable expenses incurred by the Company are allocated to each Fund and allocated to classes within the Fund in proportion to the average daily net assets of the Fund and each class, except where allocation of certain expenses is more fairly made directly to the Fund or to specific classes within a Fund. During the year ended October 31, 2009, HIFSCO has contractually limited the total operating expenses of this Fund, exclusive of taxes, interest expense, brokerage commissions, certain distribution expenses and extraordinary expenses as follows: |
| | | | | | | | | | | |
| Class A | | Class B | | Class C | | Class I | | Class L | | Class Y |
| 0.85% | | 1.60% | | 1.60% | | 0.60% | | 0.80% | | 0.60% |
| | d) | | Fees Paid Indirectly — The Fund’s custodian bank has agreed to reduce its fees when the Fund maintains cash on deposit in the non-interest-bearing custody account. For the year ended October 31, 2009, this amount is included in the Statement of Operations. |
| |
| | | | The ratio of expenses to average net assets in the accompanying financial highlights excludes the reduction in expenses related to fees paid indirectly. Had the fees paid indirectly been included, the annualized expense ratio for the periods listed below would have been as follows: |
| | | | | | | | | | | | | | | | | | | | | |
| | | Year Ended | | | Year Ended | | | Year Ended | | | Year Ended | | | Year Ended | |
| | | October 31, | | | October 31, | | | October 31, | | | October 31, | | | October 31, | |
| | | 2009 | | | 2008 | | | 2007 | | | 2006 | | | 2005 | |
| Class A Shares | | | 0.85 | % | | | 0.85 | % | | | 0.85 | % | | | 1.00 | % | | | 1.00 | % |
| Class B Shares | | | 1.60 | | | | 1.60 | | | | 1.60 | | | | 1.75 | | | | 1.75 | |
| Class C Shares | | | 1.60 | | | | 1.60 | | | | 1.60 | | | | 1.75 | | | | 1.75 | |
| Class I Shares | | | 0.60 | | | | 0.60 | | | | 0.60 | * | | | | | | | | |
| Class L Shares | | | 0.80 | | | | 0.80 | | | | 0.86 | | | | 1.05 | | | | 1.05 | |
| Class Y Shares | | | 0.59 | | | | 0.60 | | | | 0.64 | | | | 0.89 | | | | 0.95 | |
| | |
| * | | From May 31, 2007 (commencement of operations), through October 31, 2007. |
| | e) | | Distribution and Service Plan for Class A, B, C and L Shares — HIFSCO is the principal underwriter and distributor of the Fund. HIFSCO is engaged in distribution activities, which include marketing and distribution of shares through broker-dealers, financing distribution costs and maintaining financial books and records. For the year ended October 31, 2009, HIFSCO received front-end load sales charges of $699 and contingent deferred sales charges of $58 from the Fund. |
21
The Hartford Tax-Free National Fund
Notes to Financial Statements — (continued)
October 31, 2009
(000’s Omitted)
| | | | The Fund has adopted a Distribution and Service Plan in accordance with Rule 12b-1 of the Investment Company Act of 1940, as amended, to compensate the distributor (HIFSCO) for activities intended to result in the sale and distribution of Classes A, B, C and L shares and for providing services for shareholders. The Rule 12b-1 plan applicable to Class A shares of the Fund provides for payment of a Rule 12b-1 fee of up to 0.35% of average daily net assets; however, the Board of Directors has currently authorized 12b-1 payments of up to 0.25%. Some or all of the fee may be used for shareholder servicing expenses with the remainder used for distribution expenses. Some or the entire Rule 12b-1 fee for Class B shares may be remitted to broker-dealers for distribution and/or shareholder account services. Under the Class B Plan, the Fund pays the distributor 1.00% of the average daily net assets of Class B shares that are outstanding for 8 years or less, 0.25% of which is a fee for services provided to existing shareholders with the remainder used for distribution expenses. After eight years, Class B shares convert to Class A shares. Upon conversion to Class A shares, the Class A plan described above will apply to those shares. Under the Class C Plan, the Fund pays the Distributor 1.00% of the average daily net assets of Class C shares outstanding, 0.25% of which is intended as a fee for services provided to existing shareholders with the remainder used for distribution expenses. For Class C shares, some or the entire fee may be remitted to broker-dealers for distribution and/or shareholder account services. Class L has a distribution fee of 0.25%. The Fund’s 12b-1 fees are accrued daily and paid monthly. |
| | | | For the year ended October 31, 2009, total sales commissions paid to affiliated brokers/dealers of The Hartford for distributing the Fund’s shares were $17. These commissions are in turn paid to sales representatives of the broker/dealers. |
| | f) | | Other Related Party Transactions — Certain officers of the Fund are directors and/or officers of HIFSCO and/or The Hartford or its subsidiaries. For the year ended October 31, 2009, a portion of the Fund’s chief compliance officer’s salary was paid by all the investment companies in the Hartford fund complex. The portion allocated to the Fund was in the amount of $1. Hartford Administrative Services Company (“HASCO”), an indirect wholly owned subsidiary of The Hartford, provides transfer agent services to the Fund. HASCO has contractually agreed to reimburse any portion of the transfer agency fees over 0.30% of average daily net assets per fiscal year for all classes. HASCO was compensated $101 for providing such services. These fees are accrued daily and paid monthly. |
| | | As of October 31, 2009, affiliates of The Hartford had ownership of shares in the Fund as follows: |
| 6. | | Investment Transactions: |
| | | For the year ended October 31, 2009, the Fund’s aggregate purchases and sales of investment securities (excluding short-term investments) were as follows: |
| | | | | |
| | | Amount | |
| Cost of Purchases Excluding U.S. Government Obligations | | $ | 158,630 | |
| Sales Proceeds Excluding U.S. Government Obligations | | | 78,768 | |
22
| 7. | | Capital Share Transactions: |
| | | The following information is for the year ended October 31, 2009 and the year ended October 31, 2008: |
| | | | | | | | | | | | | | | | | | | | | | | | | | | | | | | | | | | | | | | | | |
| | | For the Year Ended October 31, 2009 | | | For the Year Ended October 31, 2008 | |
| | | | | | | Shares | | | | | | | Shares | | | | | | | | | | | Shares | | | | | | | Shares | | | | |
| | | | | | | Issued for | | | | | | | Issued | | | Net Increase | | | | | | | Issued for | | | | | | | Issued | | | Net Increase | |
| | | Shares | | | Reinvested | | | Shares | | | from | | | (Decrease) of | | | Shares | | | Reinvested | | | Shares | | | from | | | (Decrease) of | |
| | | Sold | | | Dividends | | | Redeemed | | | Merger | | | Shares | | | Sold | | | Dividends | | | Redeemed | | | Merger | | | Shares | |
| Class A | | | | | | | | | | | | | | | | | | | | | | | | | | | | | | | | | | | | | | | | |
| Shares | | | 6,305 | | | | 624 | | | | (7,862 | ) | | | 4,486 | | | | 3,553 | | | | 8,255 | | | | 448 | | | | (6,223 | ) | | | — | | | | 2,480 | |
| Amount | | $ | 53,944 | | | $ | 5,410 | | | $ | (68,216 | ) | | $ | 38,488 | | | $ | 29,626 | | | $ | 85,062 | | | $ | 4,507 | | | $ | (61,536 | ) | | $ | — | | | $ | 28,033 | |
| Class B | | | | | | | | | | | | | | | | | | | | | | | | | | | | | | | | | | | | | | | | |
| Shares | | | 260 | | | | 30 | | | | (319 | ) | | | 376 | | | | 347 | | | | 161 | | | | 21 | | | | (208 | ) | | | — | | | | (26 | ) |
| Amount | | $ | 2,192 | | | $ | 260 | | | $ | (2,733 | ) | | $ | 3,184 | | | $ | 2,903 | | | $ | 1,637 | | | $ | 207 | | | $ | (2,085 | ) | | $ | — | | | $ | (241 | ) |
| Class C | | | | | | | | | | | | | | | | | | | | | | | | | | | | | | | | | | | | | | | | |
| Shares | | | 1,966 | | | | 119 | | | | (1,599 | ) | | | 1,073 | | | | 1,559 | | | | 1,781 | | | | 78 | | | | (778 | ) | | | — | | | | 1,081 | |
| Amount | | $ | 16,764 | | | $ | 1,028 | | | $ | (13,653 | ) | | $ | 9,178 | | | $ | 13,317 | | | $ | 18,098 | | | $ | 777 | | | $ | (7,841 | ) | | $ | — | | | $ | 11,034 | |
| Class I | | | | | | | | | | | | | | | | | | | | | | | | | | | | | | | | | | | | | | | | |
| Shares | | | 327 | | | | 31 | | | | (144 | ) | | | — | | | | 214 | | | | 337 | | | | 17 | | | | (134 | ) | | | — | | | | 220 | |
| Amount | | $ | 2,843 | | | $ | 271 | | | $ | (1,283 | ) | | $ | — | | | $ | 1,831 | | | $ | 3,285 | | | $ | 174 | | | $ | (1,326 | ) | | $ | — | | | $ | 2,133 | |
| Class L | | | | | | | | | | | | | | | | | | | | | | | | | | | | | | | | | | | | | | | | |
| Shares | | | 29 | | | | 30 | | | | (205 | ) | | | 268 | | | | 122 | | | | 7 | | | | 26 | | | | (136 | ) | | | — | | | | (103 | ) |
| Amount | | $ | 248 | | | $ | 256 | | | $ | (1,749 | ) | | $ | 2,261 | | | $ | 1,016 | | | $ | 71 | | | $ | 265 | | | $ | (1,394 | ) | | $ | — | | | $ | (1,058 | ) |
| Class Y | | | | | | | | | | | | | | | | | | | | | | | | | | | | | | | | | | | | | | | | |
| Shares | | | 11 | | | | 123 | | | | (464 | ) | | | 1,879 | | | | 1,549 | | | | 18 | | | | 78 | | | | (408 | ) | | | — | | | | (312 | ) |
| Amount | | $ | 89 | | | $ | 1,067 | | | $ | (3,976 | ) | | $ | 15,883 | | | $ | 13,063 | | | $ | 179 | | | $ | 788 | | | $ | (4,206 | ) | | $ | — | | | $ | (3,239 | ) |
| | | The following reflects the conversion of Class B Shares into Class A Shares (reflected as Class A Shares issued) for the year ended October 31, 2009 and the year ended October 31, 2008: |
| | | | | | | | | |
| | | Shares | | | Dollars | |
| For the Year Ended October 31, 2009 | | | 11 | | | $ | 93 | |
| For the Year Ended October 31, 2008 | | | 8 | | | $ | 86 | |
| | | The Fund is one of several Hartford Funds that participate in a $500 million committed revolving line of credit facility. The facility is to be used for temporary or emergency purposes. Under the arrangement, the Fund is required to own securities having a market value in excess of 300% of the total bank borrowings. The interest rate on borrowings varies depending on the nature of the loan. The facility also requires a fee to be paid based on the amount of the commitment. This fee is allocated to all the Funds participating in the line of credit based on the average net assets of the Funds. During the year ended October 31, 2009, the Fund did not have any borrowings under this facility. |
| | | Reorganization of The Hartford Tax-Free Minnesota Fund and The Hartford Tax-Free New York Fund with and into the Fund: At a Special Meeting of Shareholders held on January 13, 2009, the shareholders of each of The Hartford Tax-Free Minnesota Fund (“Target Fund #1”) and The Hartford Tax-Free New York Fund (“Target Fund #2”) approved a proposed Plan of Reorganization providing for the acquisition of all the assets and liabilities of The Hartford Tax-Free Minnesota Fund and The Hartford Tax-Free New York Fund by the Fund (“Acquiring Fund”). |
| | | Under the terms of the Plan of Reorganization, and pursuant to the approval by shareholders of The Hartford Tax-Free Minnesota Fund and The Hartford Tax-Free New York Fund, the assets and liabilities were acquired by the Fund on February 20, 2009 (“Merger Date”). The Fund acquired the assets and liabilites of The Hartford Tax-Free Minnesota Fund and The Hartford Tax-Free New York Fund in exchange for shares in the Fund, which were distributed pro rata to The Hartford Tax- |
23
The Hartford Tax-Free National Fund
Notes to Financial Statements — (continued)
October 31, 2009
(000’s Omitted)
Free Minnesota Fund and The Hartford Tax-Free New York Fund shareholders on February 20, 2009, in complete liquidation of The Hartford Tax-Free Minnesota Fund and The Hartford Tax-Free New York Fund.
These mergers were accomplished by tax free exchanges as detailed below:
| | | | | | | | | | | | | | | | | | | | | | | | | | | | | |
| | | | | | | | | | | | | | | | | | | Acquiring | | | Net assets of | | | | |
| | | | | | | | | | | | | | | | | | | Fund shares | | | Acquiring | | | Net assets of | |
| | | Net assets of | | | Net assets of | | | | | | | | | | | issued to the | | | Fund | | | Acquiring | |
| | | Target Fund | | | Target Fund | | | Target Fund | | | Target Fund | | | Target | | | immediately | | | Fund | |
| | | #1 on Merger | | | #2 on Merger | | | #1 shares | | | #2 shares | | | Funds’ | | | before | | | immediately | |
| | | Date | | | Date | | | exchanged | | | exchanged | | | shareholders | | | merger | | | after merger | |
| Class A | | $ | 6,120 | | | $ | 10,757 | | | | 696 | | | $ | 1,251 | | | | 1,993 | | | $ | 108,155 | | | $ | 125,032 | |
| Class B | | | 767 | | | | 1,399 | | | | 87 | | | | 163 | | | | 258 | | | | 5,435 | | | | 7,601 | |
| Class C | | | 1,212 | | | | 2,123 | | | | 137 | | | | 247 | | | | 396 | | | | 27,379 | | | | 30,714 | |
| Class I | | | N/A | | | | N/A | | | | N/A | | | | N/A | | | | N/A | | | | 4,878 | | | | 4,878 | |
| Class L | | | 2,261 | | | | N/A | | | | 256 | | | | N/A | | | | 268 | | | | 5,196 | | | | 7,457 | |
| Class Y | | | 15,883 | | | | N/A | | | | 1,804 | | | | N/A | | | | 1,879 | | | | 16,778 | | | | 32,661 | |
| | | | | | | | | | | | | | | | | | | | | | |
| Total | | $ | 26,243 | | | $ | 14,279 | | | | 2,980 | | | $ | 1,661 | | | | 4,794 | | | $ | 167,821 | | | $ | 208,343 | |
The Hartford Tax-Free Minnesota Fund and The Hartford Tax-Free New York Fund had the following unrealized depreciation, accumulated net realized losses and capital stock as of February 20, 2009.
| | | | | | | | | | | | | |
| | | | | | | Accumulated Net | | | | |
| Fund | | Unrealized Depreciation | | | Realized Losses | | | Capital Stock | |
| Target Fund #1 | | $ | (2,504 | ) | | $ | (1,224 | ) | | $ | 29,971 | |
| Target Fund #2 | | $ | (2,298 | ) | | $ | (249 | ) | | $ | 16,826 | |
Reorganization of The Hartford Tax-Free California Fund into the Fund: At a Special Meeting of Shareholders held on July 16, 2009, the shareholders of The Hartford Tax-Free California Fund (“Target Fund #3”) approved a proposed Plan of Reorganization providing for the acquisition of all the assets and liabilities of The Hartford Tax-Free California Fund by the Fund (“Acquiring Fund”).
Under the terms of the Plan of Reorganization, and pursuant to the approval by shareholders of The Hartford Tax-Free California Fund, the assets and liabilities were acquired by the Fund on July 24, 2009 (“Merger Date”). The Fund acquired the assets and liabilities of The Hartford Tax-Free California Fund in exchange for shares in the Fund, which were distributed pro rata to The Hartford Tax-Free California Fund shareholders on July 24, 2009, in complete liquidation of The Hartford Tax-Free California Fund.
24
This merger was accomplished by tax free exchange as detailed below:
| | | | | | | | | | | | | | | | | | | | | |
| | | | | | | | | | | | | | | | | | | Net assets of | |
| | | | | | | | | | | Acquiring Fund | | | Net assets of | | | Acquiring | |
| | | Net assets of Target | | | | | | | shares issued to the | | | Acquiring Fund | | | Fund | |
| | | Fund #3 on Merger | | | Target Fund #3 | | | Target Fund’s | | | immediately before | | | immediately | |
| | | Date | | | shares exchanged | | | shareholders | | | merger | | | after merger | |
| Class A | | $ | 21,611 | | | | 2,671 | | | | 2,493 | | | $ | 136,784 | | | $ | 158,395 | |
| Class B | | | 1,018 | | | | 126 | | | | 118 | | | | 7,243 | | | | 8,261 | |
| Class C | | | 5,843 | | | | 721 | | | | 677 | | | | 34,930 | | | | 40,773 | |
| Class I | | | N/A | | | | N/A | | | | N/A | | | | 5,981 | | | | 5,981 | |
| Class L | | | N/A | | | | N/A | | | | N/A | | | | 6,955 | | | | 6,955 | |
| Class Y | | | N/A | | | | N/A | | | | N/A | | | | 32,045 | | | | 32,045 | |
| | | | | | | | | | | | | | | | |
| Total | | $ | 28,472 | | | | 3,518 | | | | 3,288 | | | $ | 223,938 | | | $ | 252,410 | |
The Hartford Tax-Free California Fund had the following unrealized depreciation, accumulated net realized losses and capital stock as of July 24, 2009.
| | | | | | | | | | | | | |
| | | | | | | Accumulated Net | | | | |
| Fund | | Unrealized Depreciation | | | Realized Gains (Losses) | | | Capital Stock | |
| Target Fund #3 | | $ | (3,584 | ) | | $ | (6,863 | ) | | $ | 38,919 | |
| | | Management has evaluated subsequent events through December 15, 2009, the date of issuance of the Fund’s financial statements, and has determined that no additional items require disclosure. |
25
The Hartford Tax-Free National Fund
Financial Highlights
- Selected Per-Share Data (a) -
| | | | | | | | | | | | | | | | | | | | | | | | | | | | | | | | | | | | | | | | | | | | | |
| | | Net Asset | | | | | | | | | | Net Realized | | | | | | | | | | | | | | | | | | | | | | Net Increase | | |
| | | Value at | | | | | | | | | | and Unrealized | | Total from | | Dividends from | | Distributions | | | | | | | | | | (Decrease) in | | Net Asset |
| | | Beginning of | | Net Investment | | Payments from | | Gain (Loss) on | | Investment | | Net Investment | | from Realized | | Distributions | | Total | | Net Asset | | Value at End |
| Class | | Period | | Income (Loss) | | (to) Affiliate | | Investments | | Operations | | Income | | Capital Gains | | from Capital | | Distributions | | Value | | of Period |
| For the Year Ended October 31, 2009 | | | | | | | | | | | | | | | | | | | | | | | | | | | | | | | | | | | | |
| A | | $ | 8.67 | | | $ | 0.43 | | | $ | — | | | $ | 0.44 | | | $ | 0.87 | | | $ | (0.43 | ) | | $ | — | | | $ | — | | | $ | (0.43 | ) | | $ | 0.44 | | | $ | 9.11 | |
| B | | | 8.61 | | | | 0.36 | | | | — | | | | 0.44 | | | | 0.80 | | | | (0.37 | ) | | | — | | | | — | | | | (0.37 | ) | | | 0.43 | | | | 9.04 | |
| C | | | 8.63 | | | | 0.37 | | | | — | | | | 0.44 | | | | 0.81 | | | | (0.37 | ) | | | — | | | | — | | | | (0.37 | ) | | | 0.44 | | | | 9.07 | |
| I | | | 8.69 | | | | 0.45 | | | | — | | | | 0.45 | | | | 0.90 | | | | (0.46 | ) | | | — | | | | — | | | | (0.46 | ) | | | 0.44 | | | | 9.13 | |
| L | | | 8.64 | | | | 0.48 | | | | — | | | | 0.40 | | | | 0.88 | | | | (0.44 | ) | | | — | | | | — | | | | (0.44 | ) | | | 0.44 | | | | 9.08 | |
| Y | | | 8.65 | | | | 0.45 | | | | — | | | | 0.45 | | | | 0.90 | | | | (0.46 | ) | | | — | | | | — | | | | (0.46 | ) | | | 0.44 | | | | 9.09 | |
| | | | | | | | | | | | | | | | | | | | | | | | | | | | | | | | | | | | | | | | | | | | | |
| For the Year Ended October 31, 2008(e) | | | | | | | | | | | | | | | | | | | | | | | | | | | | | | | | | | | | |
| A | | | 10.88 | | | | 0.48 | | | | — | | | | (2.21 | ) | | | (1.73 | ) | | | (0.48 | ) | | | — | | | | — | | | | (0.48 | ) | | | (2.21 | ) | | | 8.67 | |
| B | | | 10.80 | | | | 0.39 | | | | — | | | | (2.17 | ) | | | (1.78 | ) | | | (0.41 | ) | | | — | | | | — | | | | (0.41 | ) | | | (2.19 | ) | | | 8.61 | |
| C | | | 10.83 | | | | 0.39 | | | | — | | | | (2.18 | ) | | | (1.79 | ) | | | (0.41 | ) | | | — | | | | — | | | | (0.41 | ) | | | (2.20 | ) | | | 8.63 | |
| I | | | 10.90 | | | | 0.48 | | | | — | | | | (2.18 | ) | | | (1.70 | ) | | | (0.51 | ) | | | — | | | | — | | | | (0.51 | ) | | | (2.21 | ) | | | 8.69 | |
| L | | | 10.85 | | | | 0.48 | | | | — | | | | (2.20 | ) | | | (1.72 | ) | | | (0.49 | ) | | | — | | | | — | | | | (0.49 | ) | | | (2.21 | ) | | | 8.64 | |
| Y | | | 10.86 | | | | 0.50 | | | | — | | | | (2.20 | ) | | | (1.70 | ) | | | (0.51 | ) | | | — | | | | — | | | | (0.51 | ) | | | (2.21 | ) | | | 8.65 | |
| | | | | | | | | | | | | | | | | | | | | | | | | | | | | | | | | | | | | | | | | | | | | |
| For the Year Ended October 31, 2007 | | | | | | | | | | | | | | | | | | | | | | | | | | | | | | | | | | | | |
| A | | | 11.34 | | | | 0.47 | | | | — | | | | (0.44 | ) | | | 0.03 | | | | (0.46 | ) | | | (0.03 | ) | | | — | | | | (0.49 | ) | | | (0.46 | ) | | | 10.88 | |
| B | | | 11.26 | | | | 0.38 | | | | — | | | | (0.43 | ) | | | (0.05 | ) | | | (0.38 | ) | | | (0.03 | ) | | | — | | | | (0.41 | ) | | | (0.46 | ) | | | 10.80 | |
| C | | | 11.29 | | | | 0.38 | | | | — | | | | (0.43 | ) | | | (0.05 | ) | | | (0.38 | ) | | | (0.03 | ) | | | — | | | | (0.41 | ) | | | (0.46 | ) | | | 10.83 | |
| I(f) | | | 11.17 | | | | 0.21 | | | | — | | | | (0.27 | ) | | | (0.06 | ) | | | (0.21 | ) | | | — | | | | — | | | | (0.21 | ) | | | (0.27 | ) | | | 10.90 | |
| L(i) | | | 11.31 | | | | 0.48 | | | | — | | | | (0.45 | ) | | | 0.03 | | | | (0.46 | ) | | | (0.03 | ) | | | — | | | | (0.49 | ) | | | (0.46 | ) | | | 10.85 | |
| Y(i) | | | 11.32 | | | | 0.51 | | | | — | | | | (0.46 | ) | | | 0.05 | | | | (0.48 | ) | | | (0.03 | ) | | | — | | | | (0.51 | ) | | | (0.46 | ) | | | 10.86 | |
| | | | | | | | | | | | | | | | | | | | | | | | | | | | | | | | | | | | | | | | | | | | | |
| For the Year Ended October 31, 2006 | | | | | | | | | | | | | | | | | | | | | | | | | | | | | | | | | | | | |
| A | | | 11.13 | | | | 0.45 | | | | — | | | | 0.29 | | | | 0.74 | | | | (0.45 | ) | | | (0.08 | ) | | | — | | | | (0.53 | ) | | | 0.21 | | | | 11.34 | |
| B | | | 11.06 | | | | 0.37 | | | | — | | | | 0.28 | | | | 0.65 | | | | (0.37 | ) | | | (0.08 | ) | | | — | | | | (0.45 | ) | | | 0.20 | | | | 11.26 | |
| C | | | 11.09 | | | | 0.37 | | | | — | | | | 0.28 | | | | 0.65 | | | | (0.37 | ) | | | (0.08 | ) | | | — | | | | (0.45 | ) | | | 0.20 | | | | 11.29 | |
| L | | | 11.10 | | | | 0.44 | | | | — | | | | 0.29 | | | | 0.73 | | | | (0.44 | ) | | | (0.08 | ) | | | — | | | | (0.52 | ) | | | 0.21 | | | | 11.31 | |
| Y | | | 11.11 | | | | 0.46 | | | | — | | | | 0.29 | | | | 0.75 | | | | (0.46 | ) | | | (0.08 | ) | | | — | | | | (0.54 | ) | | | 0.21 | | | | 11.32 | |
| | | | | | | | | | | | | | | | | | | | | | | | | | | | | | | | | | | | | | | | | | | | | |
| For the Year Ended October 31, 2005(e) | | | | | | | | | | | | | | | | | | | | | | | | | | | | | | | | | | | | |
| A | | | 11.22 | | | | 0.43 | | | | — | | | | (0.09 | ) | | | 0.34 | | | | (0.43 | ) | | | — | | | | — | | | | (0.43 | ) | | | (0.09 | ) | | | 11.13 | |
| B | | | 11.15 | | | | 0.35 | | | | — | | | | (0.09 | ) | | | 0.26 | | | | (0.35 | ) | | | — | | | | — | | | | (0.35 | ) | | | (0.09 | ) | | | 11.06 | |
| C | | | 11.18 | | | | 0.35 | | | | — | | | | (0.09 | ) | | | 0.26 | | | | (0.35 | ) | | | — | | | | — | | | | (0.35 | ) | | | (0.09 | ) | | | 11.09 | |
| L | | | 11.19 | | | | 0.43 | | | | — | | | | (0.09 | ) | | | 0.34 | | | | (0.43 | ) | | | — | | | | — | | | | (0.43 | ) | | | (0.09 | ) | | | 11.10 | |
| Y | | | 11.20 | | | | 0.45 | | | | — | | | | (0.10 | ) | | | 0.35 | | | | (0.44 | ) | | | — | | | | — | | | | (0.44 | ) | | | (0.09 | ) | | | 11.11 | |
| | |
| (a) | | Information presented relates to a share outstanding throughout the indicated period. |
| |
| (b) | | Assumes initial investment at net asset value at the beginning of each period, reinvestment of all distributions, the complete redemption of the investment at net asset value at the end of each period and no sales charge. Total return would be reduced if sales charges were taken into account. |
| |
| (c) | | Ratios do not include fees paid indirectly (See Expenses in the accompanying Notes to Financial Statements). |
| |
| (d) | | Portfolio turnover rate is calculated on the basis of the Fund as a whole without distinguishing between the classes of shares issued. |
| |
| (e) | | Per share amounts have been calculated using average shares outstanding method. |
| |
| (f) | | Commenced operations on May 31, 2007. |
| |
| (g) | | Not annualized. |
| |
| (h) | | Annualized. |
| |
| (i) | | Classes H, M and N were merged into Class L and Class E was merged into Class Y on February 9, 2007. |
26
- Ratios and Supplemental Data -
| | | | | | | | | | | | | | | | | | | | | | | | | | | |
| | | | | | | | Ratio of Expenses to Average | | Ratio of Expenses to Average | | Ratio of Expenses to Average | | Ratio of Net | | | |
| | | | | | | | Net Assets Before Waivers and | | Net Assets After Waivers and | | Net Assets After Waivers and | | Investment Income | | | |
| | | | Net Assets at End of | | Reimbursements and Including | | Reimbursements and Including | | Reimbursements and Excluding | | to Average Net | | Portfolio | |
| Total Return(b) | | | Period (000’s) | | Expenses not Subject to Cap(c) | | Expenses not Subject to Cap(c) | | Expenses not Subject to Cap(c) | | Assets | | Turnover Rate(d) | |
| 10 .48 | % | | $ | 151,639 | | | | 0.89 | % | | | 0.85 | % | | | 0.85 | % | | | 4.96 | % | | | 46 | % | |
| 9 .62 | | | | 8,623 | | | | 1.70 | | | | 1.60 | | | | 1.60 | | | | 4.21 | | | | — | | |
| 9 .72 | | | | 42,730 | | | | 1.65 | | | | 1.60 | | | | 1.60 | | | | 4.23 | | | | — | | |
| 10 .74 | | | | 6,899 | | | | 0.65 | | | | 0.60 | | | | 0.60 | | | | 5.24 | | | | — | | |
| 10 .58 | | | | 7,190 | | | | 0.84 | | | | 0.80 | | | | 0.80 | | | | 5.65 | | | | — | | |
| 10 .79 | | | | 33,239 | | | | 0.59 | | | | 0.59 | | | | 0.59 | | | | 5.22 | | | | — | | |
| | | | | | | | | | | | | | | | | | | | | | | | | | | |
| (16 .40 | ) | | | 113,542 | | | | 0.94 | | | | 0.85 | | | | 0.85 | | | | 4.63 | | | | 77 | | |
| (16 .97 | ) | | | 5,223 | | | | 1.75 | | | | 1.60 | | | | 1.60 | | | | 3.87 | | | | — | | |
| (17 .02 | ) | | | 27,234 | | | | 1.70 | | | | 1.60 | | | | 1.60 | | | | 3.89 | | | | — | | |
| (16 .16 | ) | | | 4,705 | | | | 0.66 | | | | 0.60 | | | | 0.60 | | | | 4.89 | | | | — | | |
| (16 .41 | ) | | | 5,790 | | | | 0.90 | | | | 0.80 | | | | 0.80 | | | | 4.67 | | | | — | | |
| (16 .22 | ) | | | 18,238 | | | | 0.65 | | | | 0.60 | | | | 0.60 | | | | 4.87 | | | | — | | |
| | | | | | | | | | | | | | | | | | | | | | | | | | | |
| 0 .30 | | | | 115,459 | | | | 1.15 | | | | 0.85 | | | | 0.85 | | | | 4.20 | | | | 43 | | |
| (0 .45 | ) | | | 6,839 | | | | 1.95 | | | | 1.60 | | | | 1.60 | | | | 3.43 | | | | — | | |
| (0 .45 | ) | | | 22,467 | | | | 1.90 | | | | 1.60 | | | | 1.60 | | | | 3.45 | | | | — | | |
| (0 .54) | )(g) | | | 3,505 | | | | 0 .87 | (h) | | | 0 .60 | (h) | | | 0 .60 | (h) | | | 4 .81 | (h) | | | — | | |
| 0 .28 | | | | 8,380 | | | | 1.10 | | | | 0.86 | | | | 0.86 | | | | 4.31 | | | | — | | |
| 0 .48 | | | | 26,275 | | | | 0.85 | | | | 0.65 | | | | 0.65 | | | | 4.78 | | | | — | | |
| | | | | | | | | | | | | | | | | | | | | | | | | | | |
| 6 .82 | | | | 71,876 | | | | 1.22 | | | | 1.00 | | | | 1.00 | | | | 4.06 | | | | 14 | | |
| 5 .97 | | | | 6,746 | | | | 2.00 | | | | 1.75 | | | | 1.75 | | | | 3.31 | | | | — | | |
| 5 .95 | | | | 12,889 | | | | 1.97 | | | | 1.75 | | | | 1.75 | | | | 3.31 | | | | — | | |
| 6 .77 | | | | 7,606 | | | | 1.14 | | | | 1.05 | | | | 1.05 | | | | 4.01 | | | | — | | |
| 6 .91 | | | | 11 | | | | 0.91 | | | | 0.89 | | | | 0.89 | | | | 4.17 | | | | — | | |
| | | | | | | | | | | | | | | | | | | | | | | | | | | |
| 3 .10 | | | | 46,163 | | | | 1.26 | | | | 1.00 | | | | 1.00 | | | | 3.88 | | | | 22 | | |
| 2 .36 | | | | 6,889 | | | | 2.03 | | | | 1.75 | | | | 1.75 | | | | 3.13 | | | | — | | |
| 2 .35 | | | | 8,496 | | | | 1.99 | | | | 1.75 | | | | 1.75 | | | | 3.13 | | | | — | | |
| 3 .06 | | | | 7,958 | | | | 1.16 | | | | 1.05 | | | | 1.05 | | | | 3.83 | | | | — | | |
| 3 .20 | | | | 10 | | | | 0.95 | | | | 0.95 | | | | 0.95 | | | | 4.04 | | | | — | | |
27
Report of Independent Registered Public Accounting Firm
The Board of Directors and Shareholders of
The Hartford Mutual Funds II, Inc.
We have audited the accompanying statement of assets and liabilities, including the schedule of investments, of The Hartford Tax-Free National Fund (one of the portfolios constituting The Hartford Mutual Funds II, Inc. (the Funds)) as of October 31, 2009, and the related statement of operations for the year then ended, the statements of changes in net assets for each of the two years in the period then ended, and the financial highlights for each of the periods indicated therein. These financial statements and financial highlights are the responsibility of the Funds’ management. Our responsibility is to express an opinion on these financial statements and financial highlights based on our audits.
We conducted our audits in accordance with the standards of the Public Company Accounting Oversight Board (United States). Those standards require that we plan and perform the audit to obtain reasonable assurance about whether the financial statements and financial highlights are free of material misstatement. We were not engaged to perform an audit of the Funds’ internal control over financial reporting. Our audits included consideration of internal control over financial reporting as a basis for designing audit procedures that are appropriate in the circumstances, but not for the purpose of expressing an opinion on the effectiveness of the Funds’ internal control over financial reporting. Accordingly, we express no such opinion. An audit also includes examining, on a test basis, evidence supporting the amounts and disclosures in the financial statements and financial highlights, assessing the accounting principles used and significant estimates made by management, and evaluating the overall financial statement presentation. Our procedures included confirmation of securities owned as of October 31, 2009, by correspondence with the custodian and brokers or by other appropriate auditing procedures where replies from brokers were not received. We believe that our audits provide a reasonable basis for our opinion.
In our opinion, the financial statements and financial highlights referred to above present fairly, in all material respects, the financial position of The Hartford Tax-Free National Fund of The Hartford Mutual Funds II, Inc. at October 31, 2009, the results of its operations for the year then ended, the changes in its net assets for each of the two years in the period then ended, and the financial highlights for each of the periods indicated therein, in conformity with U.S. generally accepted accounting principles.
Minneapolis, MN
December 15, 2009
28
The Hartford Tax-Free National Fund
Directors and Officers (Unaudited)
The Board of Directors appoints officers who are responsible for the day-to-day operations of the Fund and who execute policies formulated by the Directors. Each director serves until his or her death, resignation, or retirement or until the next annual meeting of shareholders is held or until his or her successor is elected and qualifies.
Directors and officers who are employed by or who have a financial interest in The Hartford are considered “interested” persons of the Fund pursuant to the Investment Company Act of 1940, as amended. Each officer and two of the Funds’ directors, as noted in the chart below, are “interested” persons of the Fund. Each director serves as a director for The Hartford Mutual Funds, Inc., The Hartford Mutual Funds II, Inc., The Hartford Income Shares Fund, Inc., Hartford Series Fund, Inc., and Hartford HLS Series Fund II, Inc., which, as of October 31, 2009, collectively consist of 93 funds. Correspondence may be sent to directors and officers c/o Hartford Mutual Funds, P.O. Box 2999, Hartford, Connecticut 06104-2999, except that correspondence to Ms. Fagely may be sent to 500 Bielenberg Drive, Woodbury, Minnesota 55125.
The table below sets forth, for each director and officer, his or her name, year of birth, current position with the Fund and date first elected or appointed to The Hartford Mutual Funds, Inc. (“MF”) and The Hartford Mutual Funds II, Inc. (“MF2”), principal occupation, and, for directors, other directorships held. The Fund’s statement of additional information contains further information on the directors and is available free of charge by calling 1-888-843-7824 or writing to Hartford Mutual Funds, P.O. Box 64387, St. Paul, MN 55164-0387.
Information on the aggregate remuneration paid to the directors of the Fund can be found in the Statement of Operations herein. The Fund pays to The Hartford a portion of the Chief Compliance Officer’s compensation, but does not pay salaries or compensation to any of its other officers or directors who are employed by The Hartford.
Non-Interested Directors
Lynn S. Birdsong (1946) Director since 2003, Co-Chairman of the Investment Committee
Mr. Birdsong is a private investor. Since 1981, Mr. Birdsong has been a partner in Birdsong Company, an advertising specialty firm. Since 2003, Mr. Birdsong has been an independent director of The Japan Fund. From 2003 to March 2005, Mr. Birdsong was an independent director of the Atlantic Whitehall Funds. From 1979 to 2002, Mr. Birdsong was a managing director of Zurich Scudder Investments, an investment management firm. During his employment with Scudder, Mr. Birdsong was an interested director of The Japan Fund.
Robert M. Gavin, Jr. (1940) Director since 2002 (MF) and 1986 (MF2), Chairman of the Board since 2004
Dr. Gavin is an educational consultant. Prior to September 1, 2001, he was President of Cranbrook Education Community and prior to July 1996, he was President of Macalester College, St. Paul, Minnesota.
Duane E. Hill (1945) Director since 2001 (MF) and 2002 (MF2), Chairman of the Nominating Committee
Mr. Hill is Partner of TSG Ventures L.P., a private equity investment company. He has served for over thirty years as a financial services executive in banking, venture capital and private equity.
Sandra S. Jaffee (1941) Director since 2005
Ms. Jaffee served as Chairman (2008-2009) and Chief Executive Officer of Fortent (formerly Searchspace Group), a leading provider of compliance/regulatory technology to financial institutions from August 2005 to August 2009. From August 2004 to August 2005, Ms. Jaffee served as an Entrepreneur in Residence with Warburg Pincus, a private equity firm. From September 1995 to July 2004, Ms. Jaffee served as Executive Vice President at Citigroup, where she was President and Chief Executive Officer of Citibank’s Global Securities Services (1995-2003).
William P. Johnston (1944) Director since 2005, Chairman of the Compliance Committee
In February 2008, Mr. Johnston was elected to the Board of Directors of HCR-ManorCare, Inc. In August 2007, Mr. Johnston was elected to the Board of Directors of LifeCare Holdings, Inc. In July, 2006, Mr. Johnston was elected to the Board of Directors of MultiPlan, Inc. In June 2006, Mr. Johnston was appointed as Senior Advisor to The Carlyle Group, a global private equity investment firm. In May 2006, Mr. Johnston was elected to the Supervisory Board of Fresenius Medical Care AG & Co. KGaA, after its acquisition of Renal Care Group, Inc. in March 2006. Mr. Johnston joined Renal Care Group in November 2002 as a member of the Board of Directors and served as Chairman of the Board from March 2003 through March 2006. From September 1987 to December 2002, Mr. Johnston was with Equitable Securities Corporation (and its successors, SunTrust Equitable Securities and SunTrust Robinson Humphrey) serving in various investment banking and managerial positions, including Managing Director and Head of Investment Banking, Chief Executive Officer and Vice Chairman.
29
The Hartford Tax-Free National Fund
Directors and Officers (Unaudited) — (continued)
Phillip O. Peterson (1944) Director since 2002 (MF) and 2000 (MF2), Chairman of the Audit Committee
Mr. Peterson is a mutual fund industry consultant. He was a partner of KPMG LLP (an accounting firm) until July 1999. Mr. Peterson joined William Blair Funds in February 2007 as a member of the Board of Trustees. From January 2004 to April 2005, Mr. Peterson served as Independent President of the Strong Mutual Funds.
Lemma W. Senbet (1946) Director since 2005
Dr. Senbet is the William E. Mayer Chair Professor of Finance at the University of Maryland, Robert H. Smith School of Business. He was chair of the Finance Department during 1998-2006. Previously he was an endowed professor of finance at the University of Wisconsin-Madison. Also, he was director of the Fortis Funds from March 2000-July 2002. Dr. Senbet served the finance profession in various capacities, including as director of the American Finance Association and President of the Western Finance Association. In 2006, Dr. Senbet was inducted Fellow of Financial Management Association International for his career-long distinguished scholarship and professional service.
Interested Directors and Officers
Lowndes A. Smith (1939) Director since 1996 (MF) and 2002 (MF2), Co-Chairman of the Investment Committee
Mr. Smith served as Vice Chairman of The Hartford from February 1997 to January 2002, as President and Chief Executive Officer of Hartford Life, Inc. from February 1997 to January 2002, and as President and Chief Operating Officer of The Hartford Life Insurance Companies from January 1989 to January 2002. Mr. Smith serves as a Director of White Mountains Insurance Group, Ltd., One Beacon Insurance, Symetra Financial and as a Managing Director of Whittington Gray Associates.
John C. Walters* (1962) Director since 2008
Mr. Walters currently serves as President, Chief Executive Officer and Director for Hartford Life, Inc. (“HL, Inc.”). Mr. Walters also serves as President, Chairman of the Board, Chief Executive Officer and Director for Hartford Life Insurance Company (“Hartford Life”), and as Executive Vice President of The Hartford Financial Services Group, Inc. (“The Hartford”). In addition, Mr. Walters is Manager of HL Investment Advisors, LLC (“HL Advisors”). Mr. Walters previously served as Co-Chief Operating Officer of Hartford Life (2007-2008), and as President of the U.S. Wealth Management Division of HL, Inc. (2006-2007). Mr. Walters joined Hartford Life in April 2000 from First Union Securities, the brokerage subsidiary of First Union Corp.
| | | |
| * | | Mr. Walters previously served as President and Chief Executive Officer of the Fund (2007 — 2009). |
Other Officers
Robert M. Arena, Jr. (1968) President and Chief Executive Officer since 2009 (served as Vice President of the Fund (2006 — 2009))
Mr. Arena serves as Executive Vice President of Hartford Life. Additionally, Mr. Arena is Senior Vice President and Director of Hartford Administrative Services Company, (“HASCO”), President, Chief Executive Officer and Manager of Hartford Investment Financial Services, LLC (“HIFSCO”) and President, Chief Executive Officer and Manager of HL Advisors. Prior to joining The Hartford in 2004, he was Senior Vice President in charge of Product Management for American Skandia/Prudential in the individual annuities division.
Tamara L. Fagely (1958) Vice President, Treasurer and Controller since 2002 (MF) 1993 (MF2)
Ms. Fagely has been a Vice President of HASCO since 1998 and Chief Financial Officer since 2006. Currently Ms. Fagely is a Vice President of Hartford Life. In addition, Ms. Fagely is Controller and Chief Financial Officer of HIFSCO. She served as Assistant Vice President of Hartford Life from December 2001 through March 2005.
Brian Ferrell (1962) AML Compliance Officer since 2008
Mr. Ferrell has served as Assistant Vice President and AML Compliance Officer for The Hartford since 2006, and as AML Compliance Officer for HASCO and Hartford Investor Services Company, LLC (“HISC”) since 2008. Prior to joining The Hartford in 2006, Mr. Ferrell held various positions at the U.S. Department of the Treasury (the “Treasury”) from 2001 to 2006, where he served as Chief Counsel for the Treasury’s Financial Crimes Enforcement Network from 2005 — 2006.
Dr. Robert J. Froehlich (1953) Senior Managing Director since 2009
Dr. Froehlich joined The Hartford as Senior Managing Director in September 2009. Prior to joining The Hartford, Dr. Froehlich served as Vice Chairman of Deutsche Asset Management from 1997 — 2009.
30
Thomas D. Jones, III (1965) Vice President and Chief Compliance Officer since 2006
Mr. Jones serves as Chief Compliance Officer for the Hartford Mutual Funds and Vice President and Director of Securities Compliance for The Hartford. He is also Vice President of HIFSCO, HL Advisors, and Hartford Life. Mr. Jones joined The Hartford in 2006 from SEI Investments, where he served as Chief Compliance Officer for its mutual funds and investment advisers. Prior to joining SEI, Mr. Jones was First Vice President and Compliance Director for Merrill Lynch Investment Managers (Americas) (“MLIM”), where he worked from 1992-2004. At MLIM, Mr. Jones was responsible for the compliance oversight of various investment products, including mutual funds, wrap accounts, institutional accounts and alternative investments.
Edward P. Macdonald (1967) Vice President, Secretary and Chief Legal Officer since 2005
Mr. Macdonald serves as Assistant Vice President of Hartford Life and Chief Legal Officer, Secretary and Vice President of HIFSCO. He also serves as Vice President and Secretary of HASCO, and Chief Legal Officer, Secretary and Vice President of HL Advisors. Prior to joining The Hartford in 2005, Mr. Macdonald was Chief Counsel, Investment Management for Prudential Financial (formerly American Skandia Investment Services, Inc.). He joined Prudential in April 1999.
Vernon J. Meyer (1964) Vice President since 2006
Mr. Meyer serves as Senior Vice President of Hartford Life. He also serves as Senior Vice President of HIFSCO and HL Advisors. Mr. Meyer joined The Hartford in 2004 from MassMutual which he joined in 1987.
D. Keith Sloane (1960) Vice President since 2009
Mr. Sloane is a Senior Vice President of Hartford Life. Additionally, Mr. Sloane currently serves as Senior Vice President of HIFSCO, HL Advisors, and HASCO. Prior to joining The Hartford in 2007, Mr. Sloane was Director of product marketing and led the mutual fund business for Wachovia Securities (“Wachovia”) in their investment products group. Mr. Sloane joined Wachovia in 1995.
Jane Wolak (1961) Vice President since 2009
Ms. Wolak currently serves as Vice President of Hartford Life. Ms. Wolak joined Hartford Life as Vice President, Retail Product Services in May 2007. She is also Vice President of HASCO. Previously, Ms. Wolak was with Sun Life Financial where she held the position of Vice President, Service Center Operations from 2001 — 2007.
HOW TO OBTAIN A COPY OF THE FUND’S PROXY VOTING POLICIES AND VOTING RECORDS
A description of the policies and procedures that the Fund uses to determine how to vote proxies relating to portfolio securities and a record of how the Fund voted any proxies for the twelve-month period ended June 30, 2009 is available (1) without charge, upon request, by calling 888-843-7824 and (2) on the Securities and Exchange Commission’s website at http://www.sec.gov.
QUARTERLY PORTFOLIO HOLDINGS INFORMATION
The Fund files a complete schedule of portfolio holdings with the Commission for the first and third quarters of each fiscal year on Form N-Q. The Fund’s Forms are available (1) without charge, upon request, by calling 888-843-7824 and (2) on the Securities and Exchange Commission’s website at http://www.sec.gov. The Form N-Q may be reviewed and copied at the Commission’s Public Reference Room in Washington, DC. Information on the operation of the Public Reference Room may be obtained by calling 1-800-SEC-0330.
31
The Hartford Tax-Free National Fund
Federal Tax Information (Unaudited)
The information set forth below is for the Fund’s fiscal year as required by federal tax law. Shareholders, however, must report distributions on a calendar year basis for income tax purposes which may include distributions of two fiscal years of the Fund. Accordingly, the information needed by shareholders for income tax purposes will be sent to them in early 2010. Shareholders may wish to consult a tax advisor on how to report distributions for state and local purposes.
Detailed below are the per share distributions made for the fiscal year ended October 31, 2009.
| | | | | | | | | | | |
| | | | | Tax-Exempt | | |
| | | Income | | Income | | Total |
| Class A | | 0.000* | | | 0.434 | | | | 0.434 | |
| Class B | | 0.000* | | | 0.370 | | | | 0.370 | |
| Class C | | 0.000* | | | 0.370 | | | | 0.370 | |
| Class I | | 0.000* | | | 0.456 | | | | 0.456 | |
| Class L | | 0.000* | | | 0.438 | | | | 0.438 | |
| Class Y | | 0.000* | | | 0.456 | | | | 0.456 | |
| | |
| * | | Per share distribution amounts are less than 0.0005. |
The Fund also designates as distributions of long-term gains, to the extent necessary to fully distribute such capital gains, earnings and profits distributed to shareholders on the redemption of shares.
32
The Hartford Tax-Free National Fund
Expense Example (Unaudited)
Your Fund’s Expenses
As a shareholder of the Fund, you incur two types of costs: (1) transaction costs, including sales charges (loads) on purchase payments and contingent deferred sales charges (CDSC) (2) ongoing costs including management fees; distribution fees; and other fund expenses. This example is intended to help you understand your ongoing costs (in dollars) of investing in the Fund and to compare these costs with the ongoing costs of investing in other mutual funds. The example is based on an investment of $1,000 invested at the beginning of the period and held for the period of April 30, 2009 through October 31, 2009.
Actual Expenses
The first set of columns of the table below provides information about actual account values and actual expenses. You may use the information in this column, together with the amount you invested, to estimate the expenses that you paid over the period. Simply divide your account value by $1,000 (for example, an $8,600 account value divided by $1,000 = 8.6), then multiply the result by the number in the line under the heading entitled “Expenses Paid During Period” to estimate the expenses you paid on your account during this period.
Hypothetical Example for Comparison Purposes
The second set of columns of the table below provides information about hypothetical account values and hypothetical expenses based on the Fund’s actual expense ratio and an assumed rate of return of 5% per year before expenses, which is not the Fund’s actual return. The hypothetical account values and expenses may not be used to estimate the actual ending account balance or expenses you paid for the period. You may use this information to compare the ongoing costs of investing in the Fund and other funds. To do so, compare this 5% hypothetical example with the 5% hypothetical examples that appear in the shareholder reports of the other funds.
Please note that the expenses shown in the table are meant to highlight your ongoing costs only and do not reflect any transactional costs, such as sales charges (loads) and CDSC. Therefore, the second set of columns of the table is useful in comparing ongoing costs only, and will not help you determine the relative total costs of owning different funds. In addition, if these transactional costs were included, your costs would be higher. Expenses are equal to the Fund’s annualized expense ratios multiplied by average account value over the period, multiplied by 184/365 (to reflect the one-half year period).
| | | | | | | | | | | | | | | | | | | | | | | | | | | | | | | | | | | | | | |
| | | Actual return | | | Hypothetical (5% return before expenses) | | | | | | | | |
| | | | | | | | | | | Expenses paid | | | | | | | | | | | Expenses paid | | | | | | Days in | | |
| | | | | | | | | | | during the period | | | | | | | | | | | during the period | | | | | | the | | Days |
| | | Beginning | | Ending Account | | April 30, 2009 | | | Beginning | | Ending Account | | April 30, | | Annualized | | current | | in the |
| | | Account Value | | Value | | through | | | Account Value | | Value | | 2009 through | | expense | | 1/2 | | full |
| | | April 30, 2009 | | October 31, 2009 | | October 31, 2009 | | | April 30, 2009 | | October 31, 2009 | | October 31, 2009 | | ratio | | year | | year |
| Class A | | $ | 1,000.00 | | | $ | 1,091.40 | | | $ | 4.48 | | | | $ | 1,000.00 | | | $ | 1,020.92 | | | $ | 4.33 | | | | 0.85 | % | | | 184 | | | | 365 | |
| Class B | | $ | 1,000.00 | | | $ | 1,086.80 | | | $ | 8.42 | | | | $ | 1,000.00 | | | $ | 1,017.14 | | | $ | 8.13 | | | | 1.60 | | | | 184 | | | | 365 | |
| Class C | | $ | 1,000.00 | | | $ | 1,087.80 | | | $ | 8.42 | | | | $ | 1,000.00 | | | $ | 1,017.14 | | | $ | 8.13 | | | | 1.60 | | | | 184 | | | | 365 | |
| Class I | | $ | 1,000.00 | | | $ | 1,093.80 | | | $ | 3.17 | | | | $ | 1,000.00 | | | $ | 1,022.18 | | | $ | 3.06 | | | | 0.60 | | | | 184 | | | | 365 | |
| Class L | | $ | 1,000.00 | | | $ | 1,092.00 | | | $ | 4.22 | | | | $ | 1,000.00 | | | $ | 1,021.17 | | | $ | 4.08 | | | | 0.80 | | | | 184 | | | | 365 | |
| Class Y | | $ | 1,000.00 | | | $ | 1,093.00 | | | $ | 3.06 | | | | $ | 1,000.00 | | | $ | 1,022.28 | | | $ | 2.96 | | | | 0.58 | | | | 184 | | | | 365 | |
33
The Hartford Tax-Free National Fund
Shareholder Meeting Results
The following proposals were addressed and approved during the period at special meetings of shareholders of the Funds noted below held on January 13, 2009.
Proposal to approve a Plan of Reorganization for the acquisition of all of the assets and liabilities of The Hartford Tax-Free New York Fund (“Tax-Free New York Fund”) by The Hartford Tax-Free National Fund (the “Acquiring Fund”) solely in exchange for shares of the Acquiring Fund, followed by the complete liquidation of the Tax-Free New York Fund.
| | | | | | | | | | | | | |
| Fund Name | | For | | Against | | Abstain |
| The Hartford Tax-Free New York Fund | | | 1,253,726.345 | | | | 150,430.149 | | | | 54,689.355 | |
Proposal to approve a Plan of Reorganization for the acquisition of all of the assets and liabilities of The Hartford Tax-Free Minnesota Fund (“Tax-Free Minnesota Fund”) by The Hartford Tax-Free National Fund (the “Acquiring Fund”) solely in exchange for shares of the Acquiring Fund, followed by the complete liquidation of the Tax-Free Minnesota Fund
| | | | | | | | | | | | | |
| Fund Name | | For | | Against | | Abstain |
| The Hartford Tax-Free Minnesota Fund | | | 1,550,518.675 | | | | 291,788.184 | | | | 193,973.153 | |
The following proposal was addressed and approved during the period at a special meeting of shareholders of The Hartford Tax-Free California Fund held on July 16, 2009.
Proposal to approve a Plan of Reorganization providing for the acquisition of all of the assets and liabilities of The Hartford Tax-Free California Fund (the “Acquired Fund”) by The Hartford Tax-Free National Fund (the “Acquiring Fund”) solely in exchange for shares of the Acquiring Fund, followed by the complete liquidation of the Acquired Fund.
| | | | | | | | | | | | | |
| Fund Name | | For | | Against | | Abstain |
| The Hartford Tax-Free California Fund | | | 1,889,485.19 | | | | 171,136.67 | | | | 177,420.11 | |
34
The Hartford Tax-Free National Fund
Approval of Investment Management and Investment Sub-Advisory Agreements (Unaudited)
Section 15(c) of the Investment Company Act of 1940, as amended (the “1940 Act”), requires that each mutual fund’s board of directors, including a majority of those directors who are not “interested persons” of the mutual fund, as defined in the 1940 Act (the “Independent Directors”), annually review and consider the continuation of the mutual fund’s investment advisory and sub-advisory agreements. At its meeting held on August 4-5, 2009, the Board of Directors (the “Board”) of The Hartford Tax-Free National Fund (the “Fund”), including each of the Independent Directors, unanimously voted to approve the continuation of the investment management agreement for the Fund with Hartford Investment Financial Services, LLC (“HIFSCO”) and the continuation of the investment sub-advisory agreement between HIFSCO and the Fund’s sub-adviser Hartford Investment Management Company (“Sub-adviser,” and together with HIFSCO, “Advisers”) (collectively, the “Agreements”).
In the months preceding the August 4-5, 2009 meeting, the Board requested, received, and reviewed written responses from the Advisers to questions posed to them on behalf of the Independent Directors and supporting materials relating to those questions and responses. The Board considered information furnished to the Board at its meetings throughout the year, as well as information specifically prepared in connection with the annual approval of the Agreements at the Board’s meetings held on June 23-24, 2009 and August 4-5, 2009. Information provided to the Board at its meetings throughout the year, included, among other things, reports on Fund performance, legal and compliance matters, sales and marketing activity, shareholder services, and the other services provided to the Fund by the Advisers, and their affiliates. In addition, the Board received in-person presentations by Fund officers and representatives of HIFSCO at the Board’s meetings on June 23-24, 2009 and August 4-5, 2009 concerning the Agreements.
The Independent Directors, advised by independent legal counsel, engaged two service providers to assist them with evaluating the Agreements with respect to the Fund. Lipper Inc. (“Lipper”), an independent provider of investment company data, was retained to provide the Board with reports on how the Fund’s contractual management fees, actual management fees, other non-management fees, overall expense ratios and investment performance compared to those of mutual funds with similar investment objectives. The Independent Directors also engaged an independent financial services consulting firm (the “Consultant”) to assist them in evaluating the Fund’s management fees, sub-advisory fees, other non-management fees, overall expense ratios and investment performance. In addition, the Consultant reviewed the profitability calculations utilized by HIFSCO in connection with the continuation of the investment management agreement.
In determining to continue the Agreements for the Fund, the members of the Board reviewed and evaluated information and factors they believed to be relevant and appropriate in light of the information that the Board deemed necessary and appropriate and through the exercise of their reasonable business judgment. While individual members of the Board may have weighed certain factors differently, the Board’s determination to continue the Agreements was based on a comprehensive consideration of all information provided to the Board throughout the year and specifically with respect to the continuation of the Agreements. A more detailed discussion of the factors the Board considered with respect to its approval of the Agreements is provided below.
Nature, Extent And Quality Of Services Provided by the Advisers
The Board requested and considered information concerning the nature, extent, and quality of the services provided to the Fund by the Advisers. The Board considered, among other things, the terms of the Agreements and the range of services provided by the Advisers. In this regard, the Board considered information provided to it by HIFSCO concerning the Agreements, which were amended and restated to more completely reflect the services provided to the Fund, but did not result in a material amendment to the Fund’s prior contractual arrangement. The Board considered the Advisers’ professional personnel who provide services to the Fund, including each Adviser’s ability and experience in attracting and retaining qualified personnel to service the Fund. The Board considered each Adviser’s reputation and overall financial strength, as well as its willingness to consider and implement organizational and operational changes designed to improve services to the Fund. In addition, the Board considered the quality of each Adviser’s communications with the Board and responsiveness to Board inquiries.
The Board also requested and evaluated information concerning each Adviser’s regulatory and compliance environment. In this regard, the Board requested and reviewed information on each Adviser’s compliance policies and procedures, compliance history, and a report from the Fund’s Chief Compliance Officer on each Adviser’s compliance with applicable laws and regulations, including responses to regulatory developments and compliance issues raised by regulators. The Board also noted the Advisers’ support of the Fund’s compliance control structure, particularly the resources devoted by the Advisers in support of the Fund’s obligations pursuant to Rule 38a-1 under the 1940 Act.
35
The Hartford Tax-Free National Fund
Approval of Investment Management and Investment Sub-Advisory Agreements (Unaudited) — (continued)
With respect to HIFSCO, the Board noted that under the Agreements, HIFSCO is responsible for the management of the Fund, including overseeing fund operations and service providers and provides administration services to the Fund as well as investment advisory services in connection with selecting, monitoring and supervising the Sub-adviser. The Board considered HIFSCO’s constant monitoring of people, process and performance, including its ongoing commitment to review and rationalize The Hartford Fund Family’s product line-up. The Board considered that HIFSCO or its affiliates are responsible for providing the Fund’s officers and paying their salaries and expenses.
With respect to the Sub-adviser, who provides day-to-day portfolio management services, the Board considered the quality of the Fund’s portfolio managers, the Sub-adviser’s other investment personnel, its investment philosophy and process, investment research capabilities and resources, performance record, trade execution capabilities and experience. The Board considered the experience of the Fund’s portfolio managers, the number of accounts managed by the portfolio managers, and the Sub-adviser’s method for compensating the portfolio managers.
Based on these considerations, the Board concluded that it was satisfied with the nature, extent and quality of the services provided to the Fund by HIFSCO and the Sub-adviser.
Performance of the Fund and the Advisers
The Board considered the investment performance of the Fund. In this regard, the Board reviewed the performance of the Fund over different time periods presented in the materials and evaluated HIFSCO’s analysis of the Fund’s performance for these time periods. The Board considered information and materials provided to the Board by the Advisers concerning Fund performance, as well as information from Lipper comparing the investment performance of the Fund to an appropriate universe of peer funds.
The Board considered the detailed investment analytics reports provided by The Hartford’s Investment Advisory Group throughout the year. These reports include, among other things, information on the Fund’s gross and net returns, the Fund’s investment performance relative to an appropriate benchmark and peer group, various statistics concerning the Fund’s portfolio, and a narrative summary of various factors affecting Fund performance. The Board considered the Advisers’ cooperation with the Investment Committee, which assists the Board in evaluating the performance of the Fund at periodic meetings throughout the year. The Board also considered the analysis provided by the Consultant relating to the Fund’s performance track record. The Board considered information indicating that the Fund had underperformed relative to its peers and benchmark for certain periods, and HIFSCO’s initiatives over the course of the year to address performance issues.
In light of all the considerations noted above, the Board concluded that it had continued confidence in HIFSCO’s and the Sub-adviser’s overall capabilities to manage the Fund.
Costs of the Services and Profitability of the Advisers
The Board reviewed information regarding HIFSCO’s cost to provide investment management and related services to the Fund and HIFSCO’s profitability, both overall and for the Fund, on a pre-tax basis without regard to distribution expenses. The Board also requested and reviewed information about the profitability to HIFSCO and its affiliates from all services provided to the Fund and all aspects of their relationship with the Fund. The Board noted that the fees payable to the Sub-adviser are equal to its estimated costs in providing sub-advisory services. Accordingly, the costs and profitability for the Sub-adviser and HIFSCO were considered in the aggregate.
The Board considered the Consultant’s review of the profitability calculations utilized by HIFSCO in connection with the continuation of the investment management agreement. In this regard, the Consultant reported that The Hartford’s process for calculating and reporting Fund profitability is reasonable, sound and well within common industry practice.
Based on these considerations, the Board concluded that the profits anticipated to be realized by the Advisers and their affiliates from their relationships with the Fund would not be excessive.
Comparison of Fees and Services Provided by the Advisers
The Board considered comparative information with respect to the investment management fees to be paid by the Fund to HIFSCO, the investment sub-advisory fees to be paid by HIFSCO to the Sub-adviser, and the total expense ratios of the Fund. In
36
this regard, the Board requested and reviewed information from HIFSCO and the Sub-adviser relating to the management and sub-advisory fees, and total operating expenses for the Fund. The Board also reviewed information from Lipper comparing the Fund’s contractual management fees, actual management fees and overall expense ratios, relative to a group of funds selected by Lipper, in consultation with the Consultant (“Expense Group”), and a broader universe of funds selected by Lipper (“Expense Universe”). The Board considered that as of November 1, 2009, transfer agency fees in excess of the transfer agency expense limitation amount (currently 0.30%) will be reimbursed by Hartford Administrative Services Company (“HASCO”) prior to the application of the Fund’s expense limitation by HIFSCO.
While the Board recognized that comparisons between the Fund and peer funds are imprecise, given the differing service levels and characteristics of mutual funds and the different business models and cost structures of the Advisers, the comparative information provided by Lipper assisted the Board in evaluating the reasonableness of the Fund’s management fees and total operating expenses. In addition, the Board considered the analysis and recommendations of the Consultant relating to the Fund’s management and sub-advisory fees and total operating expenses.
Based on these considerations, the Board concluded that the Fund’s fees and total operating expenses, in conjunction with the information about quality of services, profitability, economies of scale, and other matters discussed, were reasonable in light of the services provided.
Economies of Scale
The Board requested and considered information regarding the Advisers’ realization of economies of scale with respect to the Fund, and whether the fee levels reflect these economies of scale for the benefit of the Fund’s investors. With respect to HIFSCO, the Board considered representations from HIFSCO that it is difficult to anticipate whether and the extent to which economies may be realized by HIFSCO as assets grow over time. The Board reviewed the breakpoints in the advisory fee schedule for the Fund, which reduces fees as Fund assets grow over time. The Board recognized that a fund with assets beyond the last breakpoint level will continue to benefit from economies of scale, because additional assets are charged the lowest breakpoint fee, resulting in lower overall effective management fee rates. The Board also considered that expense limitations and fee waivers that reduce the Fund’s expenses at all asset levels can have the same effect as breakpoints in sharing economies of scale with shareholders, and that a schedule that reaches a lower breakpoint quickly provides shareholders with the benefit of anticipated or potential economies of scale.
The Board reviewed and evaluated materials from Lipper showing how management fee schedules of peer funds reflect economies of scale for the benefit of investors as a peer fund’s assets hypothetically increase over time. Based on information provided by HIFSCO, Lipper, and the Consultant, the Board recognized that there is no uniform methodology for establishing breakpoints, or uniform pattern in asset levels that trigger breakpoints or the amounts of breakpoints triggered.
After considering all of the information available to it, the Board concluded that it was satisfied with the extent to which economies of scale would be shared for the benefit of the Fund’s shareholders, based on currently available information and the effective advisory fees and expense ratios for the Fund at its current and reasonably anticipated asset levels. The Board noted, however, that it would continue to monitor future growth in Fund assets and the appropriateness of additional breakpoints.
Other Benefits
The Board considered other benefits to the Advisers and their affiliates from their relationships with the Fund.
The Board reviewed information noting that Hartford Life, Inc. (“Hartford Life”) an affiliate of HIFSCO, receives fees for fund accounting and related services from the Fund, and the Board considered information on expected profits to Hartford Life or its affiliates for such services. The Board also considered that HASCO, the Fund’s transfer agent and an affiliate of HIFSCO, receives transfer agency compensation from the Fund, and the Board reviewed information on the expected profitability of the Fund’s transfer agency function to HASCO. The Board noted that HASCO is a recognized leader in providing high quality services to Fund shareholders and has received six consecutive mutual fund Dalbar service awards. The Board considered information provided by HASCO indicating that the transfer agent fees charged by HASCO to the Fund were fair and reasonable based on publicly available information.
37
The Hartford Tax-Free National Fund
Approval of Investment Management and Investment Sub-Advisory Agreements (Unaudited) — (continued)
The Board also considered that, as principal underwriter of the Fund, HIFSCO receives 12b-1 fees from the Fund and receives all or a portion of the sales charges on sales or redemptions of certain classes of shares. The Board also noted that certain affiliates of HIFSCO distribute shares of the Fund and receive compensation in that connection.
The Board considered any benefits to the Sub-adviser from any use of the Fund’s brokerage commissions to obtain soft dollar research.
The Board considered the benefits to shareholders of being part of the Hartford family of funds, including the right to exchange investments between the same class of funds without a sales charge, the ability to reinvest Fund dividends into other funds in the family, and the ability to combine holdings in the Fund with holdings in other funds to obtain a reduced sales charge. The Board considered HIFSCO’s efforts to provide investors in the family with a broad range of investment styles and asset classes and its entrepreneurial risk in initiating new funds to expand these opportunities for shareholders.
* * * *
Based upon its review of these various factors, among others, the Board concluded that it is in the best interests of the Fund and its shareholders for the Board to approve the Agreements for an additional year. In reaching this decision, the Board did not assign relative weights to the factors discussed above or deem any one or group of them to be controlling in and of themselves. In connection with their deliberations, the Independent Directors met separately in executive session on several occasions, with independent legal counsel, to review the relevant materials and consider their responsibilities under relevant laws and regulations.
38
This information is written in connection with the promotion or marketing of the matter(s) addressed in this material. The information cannot be used or relied upon for the purpose of avoiding IRS penalties. These materials are not intended to provide tax, accounting or legal advice. As with all matters of a tax or legal nature, you should consult your own tax or legal counsel for advice.
You should carefully consider investment objectives, risks, and charges and expenses of The Hartford Mutual Funds before investing. This and other information can be found in the Fund’s prospectus, which can be obtained from your investment representative or by calling 888-843-7824. Please read it carefully before you invest or send money.
The Hartford Mutual Funds are underwritten and distributed by Hartford Investment Financial Services, LLC.
“The Hartford” is The Hartford Financial Services Group, Inc., and its subsidiaries.
Mutual fund inception dates range from 1949 to date. The Hartford Mutual Funds are not a subsidiary of The Hartford but are underwritten, distributed by, and advised by subsidiaries of The Hartford. Investments in The Hartford Mutual Funds are not guaranteed by The Hartford or any other entity.
MFAR-47 12/09 MUT 8759 Printed in U.S.A. © 2009 The Hartford, Hartford, CT 06117
39
The Hartford U.S. Government Securities Fund
Table of Contents
| | | | | |
| Manager Discussion (Unaudited) | | | 2 | |
| |
| Financial Statements | | | | |
| |
| | | 4 | |
| |
| | | 7 | |
| |
| | | 8 | |
| |
| | | 9 | |
| |
| | | 10 | |
| |
| | | 11 | |
| |
| | | 24 | |
| |
| | | 26 | |
| |
| | | 27 | |
| |
| | | 29 | |
| |
| | | 29 | |
| |
| | | 30 | |
| |
| | | 31 | |
| |
| | | 32 | |
| | | |
| The Hartford U.S. Government Securities Fund inception 02/28/1973 | | |
| (subadvised by Hartford Investment Management Company) | | Investment objective — Seeks to provide current income while maintaining preservation of capital consistent with prudent investment risk. |
Performance Overview(1) 10/31/99 — 10/31/09
Growth of a $10,000 investment in Class A which includes Sales Charge
Barclays Capital U.S. Government Index is an unmanaged index of government bonds with maturities of one year or more.
You cannot invest directly in an index.
The value of shares will fluctuate so that, when redeemed, shares may be worth more or less than their original cost. The chart and table do not reflect the deduction of taxes that a shareholder would pay on fund distributions or the redemption of fund shares.
Performance information may reflect historical or current expense waivers/reimbursements from the investment adviser, without which performance would have been lower. For information on current expense waivers/reimbursements, please see the prospectus.
Average Annual Total Returns(2,3,4,5) (as of 10/31/09)
| | | | | | | | | | | | | |
| | | 1 | | | 5 | | | 10 | |
| | | Year | | | Year | | | Year | |
| |
| U.S. Government Securities A# | | | 4.91 | % | | | 2.74 | % | | | 4.64 | % |
| U.S. Government Securities A## | | | 0.19 | % | | | 1.80 | % | | | 4.16 | % |
| U.S. Government Securities B# | | | 4.17 | % | | | 1.97 | % | | NA | * |
| U.S. Government Securities B## | | | -0.83 | % | | | 1.63 | % | | NA | * |
| U.S. Government Securities C# | | | 4.16 | % | | | 1.97 | % | | | 3.82 | % |
| U.S. Government Securities C## | | | 3.16 | % | | | 1.97 | % | | | 3.82 | % |
| U.S. Government Securities L# | | | 5.06 | % | | | 2.81 | % | | | 4.65 | % |
| U.S. Government Securities L## | | | 0.33 | % | | | 1.86 | % | | | 4.17 | % |
| U.S. Government Securities Y# | | | 5.28 | % | | | 3.06 | % | | NA | |
| Barclays Capital U.S. Government Index | | | 7.05 | % | | | 5.02 | % | | | 6.19 | % |
| | |
| # | | Without sales charge |
| |
| ## | | With sales charge |
| |
| NA | | Not Applicable |
| |
| * | | 10 year returns are not applicable for Class B because after 8 years Class B converts to Class A. |
PAST PERFORMANCE IS NOT INDICATIVE OF FUTURE RESULTS.
| (1) | | Growth of a $10,000 investment in Classes B, C, L and Y shares will vary from results seen above due to differences in the expenses charged to these share classes. |
| |
| (2) | | Classes A, B, C and Y shares were offered beginning on 2/19/02. Performance prior to that date for Class A is that of the Fund’s Class E shares and for Classes B and C is that of the Fund’s Classes M and N shares, respectively, which had lower operating expenses. Performance prior to 2/19/02 would have been lower if Classes A, B and C shares expenses were applied during that period. (Classes E, M and N shares are no longer offered.) The Fund’s performance information prior to 4/1/01 reflects when the Fund was managed by a previous investment adviser. |
| |
| (3) | | The initial investment in Classes A and L shares reflects the maximum sales charge and Classes B and C reflect CDSC. |
| |
| (4) | | Total returns presented above were calculated using the Fund’s net asset value available to shareholders for sale or redemption of Fund shares on 10/31/09, which excludes investment transactions as of this date. |
| |
| (5) | | Effective 9/30/09, Class B shares of The Hartford Mutual Funds are closed to new investments. |
| | | |
| Portfolio Managers | | |
| John Hendricks | | Russell M. Regenauer, CFA |
| Senior Vice President | | Senior Vice President |
How did the Fund perform?
The Class A shares of The Hartford U.S. Government Securities Fund returned 4.91%, before sales charge, for the twelve-month period ended October 31, 2009. In comparison, its benchmark, the Barclays Capital U.S. Government Index returned 7.05%, while the average return of the Lipper General U.S. Government Securities Funds category, a group of funds with investment strategies similar to those of the Fund, was 10.03%.
Why did the Fund perform this way?
The markets have recovered dramatically in 2009, after ending 2008 in relative free fall. Treasury rates rallied significantly in the
2
final quarter of 2008, while spreads in other capital markets gapped wider (i.e. short and long term interest rates moving farther apart). There were widespread concerns over this period that the deteriorating conditions in the financial system would propel the economy into severe recession or even depression.
The Federal Reserve (the Fed) and U.S. Department of the Treasury undertook unprecedented steps to stem the dislocations in the Capital Markets. They did this through rebuilding the capital position of many financial firms, providing liquidity to markets in new ways, and increasing demand for structured products. The Troubled Asset Relief Program, along with other various funding programs, helped recapitalize many institutions. The Fed announced a program to purchase Treasury and Agency guaranteed Mortgage-Backed Securities. The Fed and the Treasury also implemented the Term Asset-Backed Securities Loan Facility and Public Private Investment Program programs to promote demand for securities. These programs, combined with fiscal policies, have successfully stemmed the market’s fall.
Over the same period, the Fund was focused on reducing risk by reducing allocations to certain sectors, especially to structured products which are not included in the benchmark. During the first half of the period, the Fund reduced its allocations to Mortgage Backed Securities (MBS) and Commercial Mortgage Backed Securities (CMBS). The CMBS and ABS allocations detracted from performance. Once Government programs kicked in, and moderate improvements took hold the allocation to Agency MBS was increased.
The Fund’s allocation to MBS underperformed at the end of 2008 but was a positive contributor to performance in 2009 and an overall positive for the twelve-month period. The convexity effect of MBS was primarily responsible for the Funds underperformance relative to duration (i.e. sensitivity to changes in interest rates) positioning. MBS exhibits negative convexity because, when interest rates fall, prepayment risk increases, and when interest rates rise, default risk increases (for those mortgage holders who have variable interest rate loans). This causes MBS to rise slower when interest rates fall and to fall faster when interest rates rise.
The Fund’s underweight (i.e. the Fund’s sector position was less than the benchmark position) to Treasury securities detracted from performance at the end of 2008, but similar to MBS generally added to performance in 2009.
What is your outlook?
The federal government remains committed to supporting the economic and capital markets recovery. The Obama administration is rumored to be discussing even further fiscal support for these markets. The Fed, while acknowledging it will need to eventually reduce the money supply, used the caveat that monetary policy will remain ‘accommodative’ for an extended period of time. We do not expect higher inflation to be a problem in the next 12-24 months. However, we do anticipate the Fed’s purchase program of Agency MBS to end in the first quarter of 2010. As such, we expect spreads in that sector to widen.
We expect the housing market to decline by another 10-15% due to the large number of delinquent loans still outstanding. Consumer behavior will be the key to determining the pace of recovery. The equity market rally in particular has seemed to aid in the recovery of consumer confidence.
On August 5, 2009, the Board of Directors of The Hartford Mutual Funds II, Inc. approved on behalf of The Hartford U.S. Government Securities Fund (“U.S. Government Securities”) and the Board of Directors of The Hartford Mutual Funds, Inc. approved on behalf of The Hartford Inflation Plus Fund (“Inflation Plus”), a Form of Agreement and Plan of Reorganization that provides for the reorganization of U.S. Government Securities, a series of The Hartford Mutual Funds II, Inc., into Inflation Plus, a series of The Hartford Mutual Funds, Inc. (“Reorganization”). The Reorganization does not require shareholder approval. The Reorganization is expected to occur on or about the close of business on February 19, 2010, or on such other date as the officers of the Hartford Mutual Funds determine.
Distribution by Credit Quality
as of October 31, 2009
| | | | | |
| | | Percentage of |
| | | Long Term |
| Rating | | Holdings |
| AAA | | | 98 .8 | % |
| BBB | | | 0 .5 | |
| BB | | | 0 .3 | |
| CCC | | | 0 .3 | |
| Not Rated | | | 0 .1 | |
| | | | | |
Total | | | 100.0 | % |
| | | | | |
Diversification by Security Type
as of October 31, 2009
| | | | | |
| | | Percentage of |
| Category | | Net Assets |
| Asset & Commercial Mortgage Backed Securities | | | 2.9 | % |
| Call Options Purchased | | | 0.0 | |
| Put Options Purchased | | | 0.0 | |
| U.S. Government Agencies | | | 74.1 | |
| U.S. Government Securities | | | 18.7 | |
| Short-Term Investments | | | 6.8 | |
| Other Assets and Liabilities | | | (2.5 | ) |
| | | | | |
Total | | | 100.0 | % |
| | | | | |
3
The Hartford U.S. Government Securities Fund
Schedule of Investments
October 31, 2009
(000’s Omitted)
| | | | | | | | | |
| Shares or Principal Amount | | | | | Market Value ╪ | |
| ASSET & COMMERCIAL MORTGAGE BACKED SECURITIES -2.9% | | | | |
| | | | | Finance and Insurance - 2.9% | | | | |
| | | | | Bayview Commercial Asset Trust | | | | |
| $ | 11,684 | | | 7.00%, 07/25/2037 ⌂► | | $ | 908 | |
| | 6,435 | | | 7.50%, 09/25/2037 ⌂► | | | 516 | |
| | | | | CBA Commercial Small Balance Commercial Mortgage | | | | |
| | 370 | | | 6.09%, 07/25/2039 ⌂Δ | | | 213 | |
| | 390 | | | 6.50%, 07/25/2039 ⌂Δ | | | 152 | |
| | 7,871 | | | 7.25%, 07/25/2039 ⌂► | | | 669 | |
| | | | | Countrywide Asset-Backed Certificates | | | | |
| | 1,743 | | | 5.76%, 06/25/2035 | | | 474 | |
| | 1,757 | | | 5.80%, 07/25/2034 | | | 572 | |
| | | | | Lehman XS Trust | | | | |
| | 1,558 | | | 6.50%, 05/25/2037 ⌂Δ | | | 843 | |
| | | | | Nationstar Home Equity Loan Trust | | | | |
| | 33 | | | 0.00%, 03/25/2037 ⌂• | | | — | |
| | | | | North Street Referenced Linked Notes | | | | |
| | 500 | | | 1.33%, 04/28/2011 ⌂†Δ | | | 54 | |
| | | | | Renaissance Home Equity Loan Trust | | | | |
| | 1,430 | | | 7.00%, 09/25/2037 | | | 214 | |
| | 1,080 | | | 7.50%, 04/25/2037 - 06/25/2037 | | | 16 | |
| | | | | Spirit Master Funding LLC | | | | |
| | 1,862 | | | 5.76%, 03/20/2024 ■ | | | 949 | |
| | | | | Wamu Commercial Mortgage Securities Trust | | | | |
| | 3,000 | | | 6.31%, 03/23/2045 ■ΔΨ | | | 1,012 | |
| | | | | | | | |
| | | | | | | | 6,592 | |
| | | | | | | | |
| | | | | | | | | |
| | | | | Total asset & commercial mortgage backed Securities
(cost $16,448) | | $ | 6,592 | |
| | | | | | | | |
| | | | | | | | | |
| U.S GOVERNMENT AGENCIES - 74.1% | | | | |
| | | | | Federal Home Loan Mortgage Corporation - 10.8% | | | | |
| $ | 12,500 | | | 3.80%, 03/09/2016 | | $ | 12,691 | |
| | 11,797 | | | 6.00%, 03/01/2032 - 04/01/2037 | | | 12,345 | |
| | 41 | | | 7.00%, 09/01/2029 - 05/01/2031 | | | 45 | |
| | 64 | | | 9.00%, 09/01/2022 | | | 73 | |
| | 28 | | | 11.50%, 09/01/2015 - 01/01/2019 | | | 28 | |
| | | | | | | | |
| | | | | | | | 25,182 | |
| | | | | | | | |
| | | | | Federal National Mortgage Association - 55.7% | | | | |
| | 18,000 | | | 1.00%, 11/23/2011 | | | 17,993 | |
| | 52,459 | | | 5.00%, 07/01/2037 | | | 54,655 | |
| | 6,139 | | | 5.47%, 03/01/2036 Δ | | | 6,493 | |
| | 8,544 | | | 5.50%, 08/01/2015 - 05/01/2036 | | | 9,009 | |
| | 1,163 | | | 6.00%, 06/01/2016 - 07/01/2031 | | | 1,252 | |
| | 34,882 | | | 6.50%, 01/18/2012 - 03/01/2038 | | | 37,477 | |
| | 17 | | | 7.50%, 01/01/2030 | | | 19 | |
| | 12 | | | 8.00%, 01/01/2025 | | | 14 | |
| | 31 | | | 8.50%, 01/01/2022 | | | 35 | |
| | 7 | | | 9.75%, 07/01/2020 | | | 8 | |
| | 25 | | | 10.00%, 01/01/2020 | | | 28 | |
| | 9 | | | 10.50%, 02/01/2012 - 12/01/2018 | | | 10 | |
| | 67 | | | 11.00%, 09/01/2015 - 08/01/2020 | | | 71 | |
| | 1 | | | 11.25%, 04/01/2013 | | | 1 | |
| | 2 | | | 11.50%, 07/01/2015 | | | 2 | |
| | 9 | | | 12.00%, 09/01/2014 | | | 10 | |
| | 26 | | | 12.50%, 10/01/2015 | | | 28 | |
| | | | | | | | |
| | | | | | | | 127,105 | |
| | | | | | | | |
| | | | | Government National Mortgage Association - 1.5% | | | | |
| | 242 | | | 6.00%, 03/20/2034 | | | 260 | |
| | 2,936 | | | 6.50%, 05/16/2031 - 05/15/2032 | | | 3,176 | |
| | 17 | | | 7.00%, 06/20/2030 - 08/20/2030 | | | 19 | |
| | 65 | | | 8.00%, 10/15/2022 | | | 74 | |
| | 217 | | | 9.50%, 09/15/2016 - 11/15/2019 | | | 244 | |
| | 7 | | | 11.00%, 12/20/2015 - 12/20/2018 | | | 8 | |
| | | | | | | | |
| | | | | | | | 3,781 | |
| | | | | | | | |
| | | | | Other Government Agencies - 6.1% | | | | |
| | | | | Small Business Administration | | | | |
| | | | | Participation Certificates: | | | | |
| | 853 | | | 5.35%, 02/01/2026 | | | 919 | |
| | 1,856 | | | 5.66%, 07/01/2022 | | | 1,991 | |
| | 1,486 | | | 5.70%, 08/01/2026 | | | 1,624 | |
| | 823 | | | 5.78%, 12/01/2021 | | | 883 | |
| | 1,984 | | | 5.98%, 02/01/2022 | | | 2,140 | |
| | 1,861 | | | 6.07%, 07/01/2026 | | | 2,038 | |
| | 1,905 | | | 6.14%, 01/01/2022 | | | 2,061 | |
| | 2,054 | | | 6.22%, 12/01/2028 | | | 2,266 | |
| | | | | | | | |
| | | | | | | | 13,922 | |
| | | | | | | | |
| | | | | Total U.S government agencies | | | | |
| | | | | (cost $164,224) | | $ | 169,990 | |
| | | | | | | | |
| | | | | | | | | |
| U.S GOVERNMENT SECURITIES - 18.7% | | | | |
| | | | | U.S Treasury Securities - 18.7% | | | | |
| | | | | U.S Treasury Notes - 18.7% | | | | |
| $ | 10,850 | | | 2.38%, 08/31/2014 - 10/31/2014 | | $ | 10,888 | |
| | 11,000 | | | 2.75%, 02/28/2013 | | | 11,413 | |
| | 445 | | | 3.13%, 05/15/2019 | | | 436 | |
| | 8,590 | | | 3.75%, 11/15/2018 | | | 8,856 | |
| | 9,000 | | | 4.50%, 08/15/2039 | | | 9,402 | |
| | 1,729 | | | 4.50%, 05/15/2017 | | | 1,894 | |
| | | | | | | | |
| | | | | | | | 42,889 | |
| | | | | | | | |
| | | | | Total U.S government securities | | | | |
| | | | | (cost $43,300) | | $ | 42,889 | |
| | | | | | | | |
| |
| Contracts | | | | | | | |
| CALL OPTIONS PURCHASED - 0.0% | | | | |
| | | | | Long Call Index Option Contract - 0.0% | | | | |
| | | | | U.S. 5 Year Note Option | | | | |
| | — | | | Expiration: November, 2009, Exercise Price: | | | | |
| | | | | $117.00 Θ | | $ | 71 | |
| | | | | | | | |
| | | | | | | | | |
| | | | | Total call options purchased
(cost $53) | | $ | 71 | |
| | | | | | | | |
| | | | | | | | | |
| PUT OPTIONS PURCHASED - 0.0% | | | | |
| | | | | Long Put Future Option Contract - 0.0% | | | | |
| | | | | U.S. 10 Year Note Option | | | | |
| | — | | | Expiration: February, 2010, Exercise Price: | | | | |
| | | | | $110.00 | | $ | 120 | |
| | | | | | | | |
| | | | | | | | | |
| | | | | Total put options purchased
(cost $173) | | $ | 120 | |
| | | | | | | | |
| | | | | | | | | |
| | | | | Total long-term investments
(cost $224,198) | | $ | 219,662 | |
| | | | | | | | |
The accompanying notes are an integral part of these financial statements.
4
| | | | | | | | | | | | | |
| Shares or Principal Amount | | | | | | | Market Value ╪ | |
| SHORT-TERM INVESTMENTS - 6.8% | | | | | | | | |
| | | | | Investment Pools and Funds - 3.9% | | | | | | | | |
| | 9,000 | | | JP Morgan U.S. Government Money Market Fund | | | | | | $ | 9,000 | |
| | — | | | State Street Bank U.S. Government Money Market Fund | | | | | | | — | |
| | — | | | Wells Fargo Advantage Government Money Market Fund | | | | | | | — | |
| | | | | | | | | | | | |
| | | | | | | | | | | | 9,000 | |
| | | | | | | | | | | | |
| | | | | Repurchase Agreements - 2.3% | | | | | | | | |
| | | | | BNP Paribas Securities Corp. Repurchase Agreement (maturing on 11/02/2009 in the amount of $2,673, collateralized by U.S. Treasury Bond 5.25% - 7.88%, 2021 - 2029, value of $2,768) | | | | | | | | |
| $ | 2,673 | | | 0.06%, 10/30/2009 | | | | | | | 2,673 | |
| | | | | RBS Greenwich Capital Markets TriParty Joint Repurchase Agreement (maturing on 11/02/2009 in the amount of $1,344, collateralized by U.S. Treasury Bond 5.00%, 2037, U.S. Treasury Note 3.13% - 4.63%, 2013 - 2017, value of $1,371) | | | | | | | | |
| | 1,344 | | | 0.06%, 10/30/2009 | | | | | | | 1,344 | |
| | | | | UBS Securities, Inc. Repurchase Agreement (maturing on 11/02/2009 in the amount of $1,231, collateralized by U.S. Treasury Note 1.50%, 2010, value of $1,248) | | | | | | | | |
| | 1,231 | | | 0.04%, 10/30/2009 | | | | | | | 1,231 | |
| | | | | | | | | | | | |
| | | | | | | | | | | | 5,248 | |
| | | | | | | | | | | | |
| | | | | U.S. Treasury Bills - 0.6% | | | | | | | | |
| | 1,250 | | | 0.07%, 1/14/2010 □o | | | | | | | 1,250 | |
| | | | | | | | | | | | |
| | | | | Total short-term investments
(cost $15,498) | | | | | | $ | 15,498 | |
| | | | | | | | | | | | |
| |
| | | | | Total investments
(cost $239,696) ▲ | | | 102.5 | % | | $ | 235,160 | |
| | | | | Other assets and liabilities | | | (2.5 | )% | | | (5,639 | ) |
| | | | | | | | | | | |
| | | | | Total net assets | | | 100.0 | % | | $ | 229,521 | |
| | | | | | | | | | | |
| | |
| Note: | | Percentage of investments as shown is the ratio of the total market value to total net assets. |
| |
| ▲ | | At October 31, 2009, the cost of securities for federal income tax purposes was $239,740 and the aggregate gross unrealized appreciation and depreciation based on that cost were: |
| | | | | |
| Unrealized Appreciation | | $ | 6,292 | |
| Unrealized Depreciation | | | (10,872 | ) |
| | | | |
| Net Unrealized Depreciation | | $ | (4,580 | ) |
| | | | |
| | |
| † | | The aggregate value of securities valued in good faith at fair value as determined under policies and procedures established by and under the supervision of the Fund’s Board of Directors at October 31, 2009, was $54, which represents 0.02% of total net assets. |
| |
| • | | Currently non-income producing. For long-term debt securities, items identified are in default as to payment of interest and/or principal. |
| |
| Δ | | Variable rate securities; the rate reported is the coupon rate in effect at October 31, 2009. |
| |
| ■ | | Securities issued within terms of a private placement memorandum, exempt from registration under Rule 144A under the Securities Act of 1933, as amended, and may be sold only to qualified institutional buyers. Pursuant to guidelines adopted by the Board of Directors, these issues are determined to be liquid. The aggregate value of these securities at October 31, 2009, was $1,961, which represents 0.85% of total net assets. |
| |
| ► | | The interest rates disclosed for interest only strips represent effective yields based upon estimated future cash flows at October 31, 2009. |
| |
| o | | The interest rate disclosed for these securities represents the effective yield on the date of the acquisition. |
| |
| Ψ | | The company is in bankruptcy. The investment held by the fund is current with respect to interest payments. |
| |
| o | | Security pledged as initial margin deposit for open futures contracts at October 31, 2009. |
Futures Contracts Outstanding at October 31, 2009
| | | | | | | | | | | | | | | | | |
| | | | | | | | | | | | | | | Unrealized | |
| | | Number of | | | | | | | Expiration | | | Appreciation/ | |
| Description | | Contracts* | | | Position | | | Month | | | (Depreciation) | |
| U.S. Long Bond | | | 220 | | | Long | | Dec 2009 | | $ | (294 | ) |
| | | | | | | | | | | | | | | | |
| | |
| * | | The number of contracts does not omit 000’s. |
| |
| Θ | | At October 31, 2009, these securities were designated to cover open call options written as follows: |
| | | | | | | | | | | | | | | | | |
| | | | | | | | | | | | | | | Unrealized | |
| Issuer/ Exercise Price/ | | Number of | | | Market | | | Premiums | | | Appreciation | |
| Expiration Date | | Contracts* | | | Value ╪ | | | Received | | | (Depreciation) | |
| U.S. 5 Year Note Option, $118.00, Nov, 2009 | | | 238 | | | $ | 15 | | | $ | 11 | | | $ | (4 | ) |
| | | | | | | | | | | | | | |
| | |
| * | | The number of contracts does not omit 000’s. |
| |
| ⌂ | | The following securities are considered illiquid. Illiquid securities are often purchased in private placement transactions, are often not registered under the Securities Act of 1933 and may have contractual restrictions on resale. A security may also be considered illiquid if the security lacks a readily available market or if its valuation has not changed for a certain period of time. |
| | | | | | | | | | | | | |
| Period | | Shares/ | | | | |
| Acquired | | Par | | Security | | Cost Basis |
| |
| | 05/2007 - 02/2009 | | | $ | 11,684 | | | Bayview Commercial Asset Trust, 7.00%, 07/25/2037 - 144A | | $ | 1,593 | |
| | 08/2007 | | | $ | 6,435 | | | Bayview Commercial Asset Trust, 7.50%, 09/25/2037 - 144A | | | 879 | |
The accompanying notes are an integral part of these financial statements.
5
The Hartford U.S. Government Securities Fund
Schedule of Investments — (continued)
October 31, 2009
(000’s Omitted)
| | | | | | | | | | | | | |
| Period | | Shares/ | | | | |
| Acquired | | Par | | Security | | Cost Basis |
| |
| | 05/2007 | | | $ | 370 | | | CBA Commercial Small Balance Commercial Mortgage, 6.09%, 07/25/2039 - 144A | | | 370 | |
| | 05/2007 | | | $ | 390 | | | CBA Commercial Small Balance Commercial Mortgage, 6.50%, 07/25/2039 - 144A | | | 390 | |
| | 05/2007 | | | $ | 7,871 | | | CBA Commercial Small Balance Commercial Mortgage, 7.25%, 07/25/2039 - 144A | | | 652 | |
| | 10/2007 | | | $ | 1,558 | | | Lehman XS Trust, 6.50%, 05/25/2037 | | | 1,547 | |
| | 04/2007 | | | $ | 33 | | | Nationstar Home Equity Loan Trust, 0.00%, 03/25/2037 - 144A | | | 33 | |
| | 11/2006 | | | $ | 500 | | | North Street Referenced Linked Notes, 1.33%, 04/28/2011 - 144A | | | 483 | |
| | |
| | | The aggregate value of these securities at October 31, 2009 was $3,355 which represents 1.46% of total net assets. |
| |
| ╪ | | See Significant Accounting Policies of accompanying Notes to Financial Statements regarding valuation of securities. |
The accompanying notes are an integral part of these financial statements.
6
The Hartford U.S. Government Securities Fund
Investment Valuation Hierarchy Level Summary
October 31, 2009
(000’s Omitted)
| | | | | | | | | | | | | | | | | |
| | | Total | | | Level 1 | | | Level 2 | | | Level 3 | |
Assets: | | | | | | | | | | | | | | | | |
| Asset & Commercial Mortgage Backed Securities | | $ | 6,592 | | | $ | — | | | $ | 1,073 | | | $ | 5,519 | |
| Call Options Purchased | | | 71 | | | | 71 | | | | — | | | | — | |
| Put Options Purchased | | | 120 | | | | 120 | | | | — | | | | — | |
| U.S. Government Agencies | | | 169,990 | | | | — | | | | 169,990 | | | | — | |
| U.S. Government Securities | | | 42,889 | | | | 9,402 | | | | 33,487 | | | | — | |
| Short-Term Investments | | | 15,498 | | | | 9,000 | | | | 6,498 | | | | — | |
| | | | | | | | | | | | | |
| Total | | $ | 235,160 | | | $ | 18,593 | | | $ | 211,048 | | | $ | 5,519 | |
| | | | | | | | | | | | | |
Liabilities: | | | | | | | | | | | | | | | | |
| Other Financial Instruments * | | $ | 298 | | | $ | 298 | | | $ | — | | | $ | — | |
| | | | | | | | | | | | | |
| | |
| * | | Other financial instruments are derivative instruments not reflected in the Schedule of Investments, such as futures, forwards and swap contracts, which are valued at the unrealized appreciation/depreciation on the investment. |
| | | | | | | | | | | | | | | | | | | | | | | | | |
| | | Balance as of | | | | | | Change in | | | | | | Transfers In | | Balance as of |
| | | October 31, | | Realized Gain | | Unrealized | | | | | | and/or Out of | | October 31, |
| | | 2008 | | (Loss) | | Appreciation | | Net Sales | | Level 3 | | 2009 |
| | | |
Assets: | | | | | | | | | | | | | | | | | | | | | | | | |
| Asset & Commercial Mortgage Backed Securities | | $ | 9,111 | | | $ | (3,172 | ) | | $ | 460 | * | | $ | (605 | ) | | $ | (275 | ) | | $ | 5,519 | |
| | | |
| Total | | $ | 9,111 | | | $ | (3,172 | ) | | $ | 460 | | | $ | (605 | ) | | $ | (275 | ) | | $ | 5,519 | |
| | | |
| | |
| * | | Change in unrealized gains or losses in the current period relating to assets still held at October 31, 2009 was $(1,817). |
The accompanying notes are an integral part of these financial statements.
7
The Hartford U.S. Government Securities Fund
Statement of Assets and Liabilities
October 31, 2009
(000’s Omitted)
| | | | | |
Assets: | | | | |
| Investments in securities, at market value (cost $239,696) | | $ | 235,160 | |
| Cash | | | 2 | |
| Receivables: | | | | |
| Investment securities sold | | | 67 | |
| Fund shares sold | | | 60 | |
| Dividends and interest | | | 1,325 | |
| Variation margin | | | 504 | |
| Other assets | | | 60 | |
| | | | |
| Total assets | | | 237,178 | |
| | | | |
Liabilities: | | | | |
| Payables: | | | | |
| Investment securities purchased | | | 6,861 | |
| Fund shares redeemed | | | 488 | |
| Investment management fees | | | 21 | |
| Dividends | | | 99 | |
| Distribution fees | | | 13 | |
| Variation margin | | | 104 | |
| Accrued expenses | | | 55 | |
| Written options (proceeds $11) | | | 15 | |
| Other liabilities | | | 1 | |
| | | | |
| Total liabilities | | | 7,657 | |
| | | | |
| Net assets | | $ | 229,521 | |
| | | | |
Summary of Net Assets: | | | | |
| Capital stock and paid-in-capital | | | 252,449 | |
| Accumulated undistributed net investment income | | | 62 | |
| Accumulated net realized loss on investments and foreign currency transactions | | | (18,156 | ) |
| Unrealized depreciation of investments | | | (4,834 | ) |
| | | | |
| Net assets | | $ | 229,521 | |
| | | | |
| | | | | |
| Shares authorized | | | 19,250,000 | |
| | | | |
| Par value | | $ | 0.0001 | |
| | | | |
Class A: Net asset value per share/Maximum offering price per share | | $ | 8.91/$9.33 | |
| | | | |
| Shares outstanding | | | 10,347 | |
| | | | |
| Net assets | | $ | 92,141 | |
| | | | |
Class B: Net asset value per share | | $ | 8.86 | |
| | | | |
| Shares outstanding | | | 2,120 | |
| | | | |
| Net assets | | $ | 18,777 | |
| | | | |
Class C: Net asset value per share | | $ | 8.86 | |
| | | | |
| Shares outstanding | | | 3,297 | |
| | | | |
| Net assets | | $ | 29,196 | |
| | | | |
Class L: Net asset value per share/Maximum offering price per share | | $ | 8.89/$9.31 | |
| | | | |
| Shares outstanding | | | 2,931 | |
| | | | |
| Net assets | | $ | 26,051 | |
| | | | |
Class Y: Net asset value per share | | $ | 8.92 | |
| | | | |
| Shares outstanding | | | 7,107 | |
| | | | |
| Net assets | | $ | 63,356 | |
| | | | |
The accompanying notes are an integral part of these financial statements.
8
The Hartford U.S. Government Securities Fund
Statement of Operations
For the Year Ended October 31, 2009
(000’s Omitted)
| | | | | |
Investment Income: | | | | |
| Interest | | $ | 10,994 | |
| Securities lending | | | 82 | |
| | | | |
| Total investment income | | | 11,076 | |
| | | | |
| | | | | |
Expenses: | | | | |
| Investment management fees | | | 1,483 | |
| Transfer agent fees | | | 330 | |
| Distribution fees | | | | |
| Class A | | | 283 | |
| Class B | | | 212 | |
| Class C | | | 414 | |
| Class L | | | 68 | |
| Custodian fees | | | 7 | |
| Accounting services fees | | | 43 | |
| Registration and filing fees | | | 89 | |
| Board of Directors’ fees | | | 9 | |
| Audit fees | | | 16 | |
| Other expenses | | | 84 | |
| | | | |
| Total expenses (before waivers and fees paid indirectly) | | | 3,038 | |
| Expense waivers | | | (141 | ) |
| Transfer agent fee waivers | | | (2 | ) |
| Custodian fee offset | | | — | |
| | | | |
| Total waivers and fees paid indirectly | | | (143 | ) |
| | | | |
| Total expenses, net | | | 2,895 | |
| | | | |
Net Investment Income | | | 8,181 | |
| | | | |
Net Realized Loss on Investments, Other Financial Instruments and Foreign Currency Transactions: | | | | |
| Net realized loss on investments in securities | | | (2,656 | ) |
| Net realized loss on futures | | | (396 | ) |
| Net realized loss on written options | | | (618 | ) |
| Net realized loss on forward foreign currency contracts | | | (62 | ) |
| Net realized gain on other foreign currency transactions | | | 25 | |
| | | | |
Net Realized Loss on Investments, Other Financial Instruments and Foreign Currency Transactions | | | (3,707 | ) |
| | | | |
Net Changes in Unrealized Appreciation of Investments and Other Financial Instruments: | | | | |
| Net unrealized appreciation of investments | | | 7,785 | |
| Net unrealized depreciation of futures | | | (560 | ) |
| Net unrealized depreciation of written options | | | (4 | ) |
| | | | |
Net Changes in Unrealized Appreciation of Investments and Other Financial Instruments | | | 7,221 | |
| | | | |
Net Gain on Investments, Other Financial Instruments and Foreign Currency Transactions | | | 3,514 | |
| | | | |
Net Increase in Net Assets Resulting from Operations | | $ | 11,695 | |
| | | | |
The accompanying notes are an integral part of these financial statements.
9
The Hartford U.S. Government Securities Fund
Statement of Changes in Net Assets
(000’s Omitted)
| | | | | | | | | |
| | | For the | | | For the | |
| | | Year Ended | | | Year Ended | |
| | | October 31, 2009 | | | October 31, 2008 | |
Operations: | | | | | | | | |
| Net investment income | | $ | 8,181 | | | $ | 9,495 | |
| Net realized gain (loss) on investments, other financial instruments and foreign currency transactions | | | (3,707 | ) | | | 3,336 | |
| Net unrealized appreciation (depreciation) of investments and other financial instruments | | | 7,221 | | | | (11,609 | ) |
| | | | | | | |
Net Increase In Net Assets Resulting From Operations | | | 11,695 | | | | 1,222 | |
| | | | | | | |
Distributions to Shareholders: | | | | | | | | |
| From net investment income | | | | | | | | |
| Class A | | | (3,626 | ) | | | (3,002 | ) |
| Class B | | | (529 | ) | | | (578 | ) |
| Class C | | | (1,016 | ) | | | (866 | ) |
| Class L | | | (915 | ) | | | (1,387 | ) |
| Class Y | | | (2,392 | ) | | | (3,692 | ) |
| | | | | | | |
| Total distributions | | | (8,478 | ) | | | (9,525 | ) |
| | | | | | | |
Capital Share Transactions: | | | | | | | | |
| Class A | | | (9,560 | ) | | | 49,246 | |
| Class B | | | (533 | ) | | | 5,850 | |
| Class C | | | (12,781 | ) | | | 28,453 | |
| Class L | | | (1,885 | ) | | | (3,261 | ) |
| Class Y | | | (6,802 | ) | | | (7,446 | ) |
| | | | | | | |
| Net increase (decrease) from capital share transactions | | | (31,561 | ) | | | 72,842 | |
| | | | | | | |
Net Increase (Decrease) In Net Assets | | | (28,344 | ) | | | 64,539 | |
Net Assets: | | | | | | | | |
| Beginning of period | | | 257,865 | | | | 193,326 | |
| | | | | | | |
| End of period | | $ | 229,521 | | | $ | 257,865 | |
| | | | | | | |
| Accumulated undistributed (distribution in excess of) net investment income (loss) | | $ | 62 | | | $ | 120 | |
| | | | | | | |
The accompanying notes are an integral part of these financial statements.
10
The Hartford U.S. Government Securities Fund
Notes to Financial Statements
October 31, 2009
(000’s Omitted)
| | | The Hartford Mutual Funds II, Inc. (“Company”) is an open-end management investment company comprised of six portfolios. Financial statements for The Hartford U.S. Government Securities Fund (the “Fund”), a series of the Company, are included in this report. |
| | | The Company is organized under the laws of the State of Maryland and is registered with the Securities and Exchange Commission (“SEC”) under the Investment Company Act of 1940, as amended (“1940 Act”). The Fund is a diversified open-end management investment company. |
| | | Class A shares are sold with a front-end sales charge of up to 4.50%. Class B shares were sold with a contingent deferred sales charge which is assessed on the lesser of the per share net asset value (“NAV”) of the shares at the time of redemption or the original purchase price, and declines from up to 5.00% to zero depending on the period of time the shares are held (See note below regarding the closing of Class B shares). Class C shares are sold with a contingent deferred sales charge of up to 1.00% on shares redeemed within twelve months of purchase. Class L shares are sold with a sales charge of up to 4.50%. Class Y shares, which are sold to certain eligible institutional investors, are sold without a sales charge. All classes of shares have identical voting, redemption, dividend, liquidation and other rights and the same terms and conditions, with the exceptions that each class may have different expenses, which may affect performance, and that Class B shares automatically convert to Class A shares after 8 years. |
| | | Effective September 30, 2009, no new or additional investments are allowed in Class B shares of The Hartford Mutual Funds (including investments through any systematic investment plan). After September 30, 2009, existing shareholders of Class B shares may continue to hold their Class B shares, exchange their Class B shares for Class B shares of another Hartford Mutual Fund (as permitted by existing exchange privileges), or redeem their Class B shares as described in the Fund’s prospectus. Reinstatement privileges with respect to Class B shares will continue under the current policy. For investors electing to reinvest capital gains and dividends, any such capital gains or dividends on Class B shares will continue to be reinvested in Class B shares of the Fund. For Class B shares outstanding as of September 30, 2009, all Class B share attributes, including the 12b-1 fee, contingent deferred sales charge schedule, and conversion to Class A shares remain unchanged. |
| 2. | | Significant Accounting Policies: |
| | | The following is a summary of significant accounting policies of the Fund, which are in accordance with U.S. Generally Accepted Accounting Principles (“GAAP”). |
| | a) | | Security Transactions and Investment Income — Security transactions are recorded on the trade date (the date the order to buy or sell is executed). Security gains and losses are determined on the basis of identified cost. |
| |
| | | | Interest income, including amortization of premium and accretion of discounts, is accrued on a daily basis. |
| |
| | b) | | Security Valuation — The Fund generally uses market prices in valuing portfolio securities. If market prices are not readily available or are deemed unreliable, the Fund will use the fair value of the security as determined in good faith under policies and procedures established by and under the supervision of the Fund’s Board of Directors. Market prices may be deemed unreliable, for example, if a security is thinly traded or if an event has occurred after the close of the security’s primary market, but before the close of the New York Stock Exchange (the “Exchange”) (generally 4:00 p.m. Eastern Time, referred to as the “Valuation Time”) that is expected to affect the value of the portfolio security. The circumstances in which the Fund may use fair value pricing include, among others: (i) the occurrence of events that are significant to a particular issuer, such as mergers, restructuring or defaults; (ii) the occurrence of events that are significant to an entire market, such as natural disasters in a particular region or governmental actions; (iii) trading restrictions on securities; (iv) thinly traded securities and (v) market events such as trading halts and early market |
11
The Hartford U.S. Government Securities Fund
Notes to Financial Statements — (continued)
October 31, 2009
(000’s Omitted)
| | | | closings. Securities that are primarily traded on foreign markets may trade on days that are not business days of the Fund. The value of the foreign securities in which the Fund invests may change on days when a shareholder will not be able to purchase or redeem shares of the Fund. Fair value pricing is subjective in nature and the use of fair value pricing by the Fund may cause the NAV of its shares to differ significantly from the NAV that would have been calculated using market prices at the close of the exchange on which a portfolio security is primarily traded but before the Valuation Time. There can be no assurance that the Fund could obtain the fair value assigned to a security if the Fund were to sell the security at approximately the time at which the Fund determines its NAV. |
| |
| | | | Exchange-traded equity securities are valued at the last reported sale price on the exchange or market on which the security is primarily traded (the “Primary Market”) at the Valuation Time. If the security did not trade on the Primary Market, it may be valued at the Valuation Time at the last reported sale price on another exchange where it trades. The value of an equity security not traded on any exchange but traded on the Nasdaq Stock Market, Inc. (“Nasdaq”) or another over-the-counter market shall be valued at the last reported sale price or official closing price on the exchange or market on which the security is traded as of the Valuation Time. |
| |
| | | | Debt securities (other than short-term obligations) held by the Fund are valued using bid prices or using valuations based on a matrix system (which considers factors such as security prices, yield, maturity and ratings) as provided by independent pricing services. Securities for which prices are not available from an independent pricing service may be valued using market quotations obtained from one or more dealers that make markets in the securities in accordance with procedures established by the Fund’s Board of Directors. Generally, the Fund may use fair valuation in regard to debt securities when the Fund holds defaulted or distressed securities or securities in a company in which a reorganization is pending. Short-term investments with a maturity of more than 60 days when purchased are valued based on market quotations until the remaining days to maturity become less than 61 days. Investments that mature in 60 days or less are generally valued at amortized cost, which approximates market value. |
| |
| | | | Foreign-denominated assets, including investment securities, and liabilities are translated from the local currency into U.S. dollars using exchange rates obtained from an independent third party as of the Fund’s Valuation Time. |
| |
| | | | Options contracts on securities, currencies, indices, futures contracts, commodities and other instruments shall be valued at their last reported sale price at the Valuation Time on the Primary Market on which the instrument is primarily traded. If the instrument did not trade on the Primary Market, it may be valued at the most recent sale price at the Valuation Time on another exchange or market where it did trade. If it is not possible to determine the last reported sale price on the Primary Market or another exchange or market at the Valuation Time, the value of the security shall be taken to be the most recent mean between bid and asked prices on such exchange or market at the Valuation Time. Absent both bid and asked prices on such exchange, the bid price may be used. |
| |
| | | | Futures contracts are valued at the most recent settlement price reported by an exchange on which, over time, they are traded most extensively. If a settlement price is not available, futures contracts will be valued at the most recent trade price as of the Valuation Time. If there were no trades, the contract shall be valued at the mean of the closing bid and asked prices as of the Valuation Time. |
| |
| | | | Financial instruments for which prices are not available from an independent pricing service are valued using market quotations obtained from one or more dealers that make markets in securities in accordance with procedures established by the Fund’s Board of Directors. |
| |
| | | | Forward foreign currency contracts represent agreements to exchange currencies on specific future dates at predetermined rates. Forward foreign currency contracts are valued using foreign currency exchange rates and forward rates on the Valuation Date from an independent pricing service. |
12
| | | | Swaps are valued based on custom valuations furnished by an independent pricing service. Swaps for which prices are not available from an independent pricing service are valued in accordance with procedures established by the Fund’s Board of Directors. |
| |
| | | | Other derivative or contractual type instruments shall be valued using market prices if such instruments trade on an exchange or market. If such instruments do not trade on an exchange or market, such instruments shall be valued at a price at which the counterparty to such contract would repurchase the instrument. In the event that the counterparty cannot provide a price, such valuation may be determined in accordance with procedures established by the Fund’s Board of Directors. |
| |
| | | | Investments in open-end mutual funds are valued at the respective NAV of each open-end mutual fund on the valuation date. |
| |
| | | | Various inputs are used in determining the value of the Fund’s investment. These inputs are summarized into three broad hierarchy levels. This hierarchy is based on whether the valuation inputs are observable or unobservable. These levels are: |
| | • | | Level 1 — Quoted prices in active markets for identical securities. Level 1 may include exchange-traded instruments such as domestic equities, some foreign equities, options, futures, mutual funds, ETF’s, and rights and warrants. |
| |
| | • | | Level 2 — Observable inputs other than Level 1 prices, such as quoted prices for similar securities; quoted prices in markets that are not active; or other inputs that are observable or can be corroborated by observable market data for substantially the full term of the security. Level 2 may include debt securities that are traded less frequently than exchange-traded instruments and that are valued using third party pricing services, foreign equities, whose value is determined using a multi-factor regression model with inputs that are observable in the market; and money market instruments, which are carried at amortized cost. |
| |
| | • | | Level 3 — Significant unobservable inputs that are supported by little or no market activity. Level 3 includes financial instruments whose values are determined using broker quotes or require significant management judgment or estimation. This category may include broker quoted securities and securities where trading has been halted or there are certain restrictions on trading. While these securities are priced using unobservable inputs, the valuation of these securities reflects the best available data and management believes the prices are a reasonable representation of exit price. |
| | | | Individual securities within any of the above mentioned asset classes may be assigned a different hierarchical level than those presented above, as individual circumstances dictate. |
| |
| | | | For purposes of the roll forward reconciliation for all Level 3 securities from the beginning of the reporting period to the end of the reporting period, transfers in and transfers out are shown at the beginning of the period fair value. |
| |
| | | | Refer to the Investment Valuation Hierarchy Level Summary and the Level 3 roll forward reconciliation found following the Schedule of Investments. |
| |
| | c) | | Foreign Currency Transactions — Assets and liabilities denominated in currencies other than U.S. dollars are translated into U.S. dollars at the exchange rates in effect on the valuation date. Purchases and sales of investment securities and income and expenses are translated into U.S. dollars at the exchange rates on the dates of such transactions. |
| |
| | | | The Fund does not isolate that portion of portfolio security valuation resulting from fluctuations in the foreign currency exchange rates from the fluctuations arising from changes in the market prices of securities held. Exchange rate fluctuations are included with the net realized and unrealized gain or loss on investments in the accompanying financial statements. |
13
The Hartford U.S. Government Securities Fund
Notes to Financial Statements — (continued)
October 31, 2009
(000’s Omitted)
| | | | Net realized foreign exchange gains or losses arise from sales of foreign currencies and the difference between asset and liability amounts initially stated in foreign currencies and the U.S. dollar value of the amounts actually received or paid. Net unrealized foreign exchange gains or losses arise from changes in the value of other assets and liabilities at the end of the reporting period, resulting from changes in the exchange rates. |
| |
| | d) | | Joint Trading Account — Pursuant to an exemptive order issued by the SEC, the Fund may transfer uninvested cash balances into a joint trading account managed by Hartford Investment Management Company (“Hartford Investment Management”). These balances may be invested in one or more repurchase agreements and/or short-term money market instruments. |
| |
| | e) | | Repurchase Agreements — A repurchase agreement is an agreement by which the seller of a security agrees to repurchase the security sold at a mutually agreed upon time and price. At the time the Fund enters into a repurchase agreement, the value of the underlying collateral security(ies), including accrued interest, will be equal to or exceed the value of the repurchase agreement. To minimize counterparty risk, the securities that serve to collateralize the repurchase agreement are held by the Fund’s custodian in book entry or physical form in the custodial account of the Fund or in a third party custodial account. Repurchase agreements are valued at cost plus accrued interest. The Fund, as shown on the Schedule of Investments, had outstanding repurchase agreements as of October 31, 2009. |
| |
| | f) | | Securities Lending — The Fund may lend its securities to certain qualified brokers who pay the Fund negotiated lender fees. The loans are fully collateralized at all times with cash and/or U.S. Government Securities and/or repurchase agreements. The cash collateral is then invested in short-term money market instruments. The repurchase agreements are fully collateralized by U.S. Government Securities. The adequacy of the collateral for securities on loan is monitored on a daily basis. For instances where the market value of collateral falls below the market value of the securities out on loan, such collateral is supplemented on the following business day. |
| |
| | | | While securities are on loan, the Fund is subject to the following risks: 1) that the borrower may default on the loan and that the collateral could be inadequate in the event the borrower defaults, 2) that the earnings on the collateral invested may not be sufficient to pay fees incurred in connection with the loan, 3) that the principal value of the collateral invested may decline and may not be sufficient to pay back the borrower for the amount of the collateral posted, 4) that the borrower may use the loaned securities to cover a short sale which may place downward pressure on the market prices of the loaned securities, 5) that return of loaned securities could be delayed and could interfere with portfolio management decisions and 6) that any efforts to recall the securities for purposes of voting a proxy may not be effective. The Fund had no securities out on loan as of October 31, 2009. |
| |
| | g) | | Forward Foreign Currency Contracts — The Fund may enter into forward foreign currency contracts that obligate the Fund to purchase or sell currencies at specified future dates. Forward foreign currency contracts may be used to hedge against adverse fluctuations in exchange rates between currencies. |
| |
| | | | Forward foreign currency contracts involve elements of market risk in excess of the amount reflected in the Statement of Assets and Liabilities. In addition, risks may arise upon entering into these contracts from the potential inability of the counterparties to meet the terms of the contracts and from unanticipated movements in the value of the foreign currencies relative to the U.S. dollar. The Fund had no outstanding forward foreign currency contracts as of October 31, 2009. |
| |
| | h) | | Indexed Securities — The Fund may invest in indexed securities whose values are linked to changes in interest rates, indices, or other underlying instruments. The Fund may use these securities to increase or decrease its exposure to different underlying instruments and to gain exposure to markets that might be difficult to invest in using conventional securities. Indexed securities may be more volatile than their underlying instruments, but any loss is limited to the amount of the original investment and there may be a limit to the potential appreciation of the investment. The Fund had no investments in indexed securities as of October 31, 2009. |
| |
| | i) | | Fund Share Valuation and Dividend Distributions to Shareholders — Orders for the Fund’s shares are executed in accordance with the investment instructions of the shareholders. The NAV of the Fund’s shares is determined as of the |
14
| | | | close of each business day of the Exchange. The NAV is determined separately for each class of the Fund by dividing the Fund’s net assets attributable to that class by the number of shares of the class outstanding. Orders for the purchase of the Fund’s shares prior to the close of the Exchange on any day on which the Exchange is open for business are priced at the NAV determined as of the close of the Exchange. Orders after the close of the Exchange, or on a day on which the Exchange and/or the Fund is not open for business, are priced at the next determined NAV. |
| |
| | | | The Fund intends to distribute substantially all of its net investment income and net realized capital gains to shareholders no less frequently than once a year. Normally, dividends from net investment income of the Fund are declared daily and paid monthly. Dividends are paid on shares beginning on the business day after the day when the funds used to purchase the shares are collected by the transfer agent for the Fund. Unless shareholders specify otherwise, all dividends will be automatically reinvested in additional full or fractional shares of the Fund. |
| |
| | | | Distributions from net investment income, realized capital gains and capital are determined in accordance with federal income tax regulations, which may differ from U.S. GAAP with respect to character and timing. These differences may include but are not limited to losses deferred due to wash sale adjustments, foreign currency gains and losses, adjustments related to Passive Foreign Investment Companies (“PFICs”), Real Estate Investment Trusts (“REITs”), Regulated Investment Companies (“RICs”), certain derivatives and partnerships. Permanent book and federal income tax basis differences relating to shareholder distributions will result in reclassifications to certain of the Fund’s capital accounts (see Federal Income Taxes: Reclassification of Capital Accounts footnote). |
| |
| | j) | | Illiquid and Restricted Securities — The Fund is permitted to invest up to 15% of its net assets in illiquid securities. “Illiquid Securities” are those that may not be sold or disposed of in the ordinary course of business within seven days, at approximately the price used to determine the Fund’s NAV. The Fund may not be able to sell illiquid securities or other investments when its sub-adviser considers it desirable to do so or may have to sell such securities or investments at a price that is lower than the price that could be obtained if the securities or investments were more liquid. A sale of illiquid securities or other investments may require more time and may result in higher dealer discounts and other selling expenses than does the sale of those that are liquid. Illiquid securities and investments also may be more difficult to value, due to the unavailability of reliable market quotations for such securities or investments, and an investment in them may have an adverse impact on the Fund’s NAV. The Fund may also purchase certain restricted securities, commonly known as Rule 144A securities, that can be resold to institutions and which may be determined to be liquid pursuant to policies and guidelines established by the Fund’s Board of Directors. The Fund, as shown on the Schedule of Investments, had illiquid and/or restricted securities as of October 31, 2009. |
| |
| | k) | | Securities Purchased on a When-Issued or Delayed-Delivery Basis — Delivery and payment for securities that have been purchased by the Fund on a forward commitment, or when-issued or delayed-delivery basis, take place beyond the customary settlement period. During this period, such securities are subject to market fluctuations, and the Fund identifies securities segregated in its records with value at least equal to the amount of the commitment. As of October 31, 2009, the Fund had no outstanding when-issued or delayed delivery securities. |
| |
| | l) | | Credit Risk — Credit risk depends largely on the perceived financial health of bond issuers. In general, the credit rating is inversely related to the credit risk of the issuer. Higher rated bonds generally are deemed to have less credit risk, while lower or unrated bonds are deemed to have higher risk of default. The share price, yield and total return of a Fund which holds securities with higher credit risk may fluctuate more than with less aggressive bond funds. |
| |
| | m) | | Prepayment Risks — Certain debt securities allow for prepayment of principal without penalty. Securities subject to prepayment risk generally offer less potential for gains when interest rates decline, and may offer a greater potential for loss when interest rates rise. In addition, with respect to securities, rising interest rates may cause prepayments to occur at a slower than expected rate, thereby effectively lengthening the maturity of the security and making the security more sensitive to interest rate changes. The potential for the value of a debt security to increase in response to interest rate declines is limited. For certain securities, the actual maturity may be less than the stated maturity shown in the Schedule of Investments. As a result, the timing of income recognition relating to these securities may vary based upon the actual maturity. |
15
The Hartford U.S. Government Securities Fund
Notes to Financial Statements — (continued)
October 31, 2009
(000’s Omitted)
| | n) | | Use of Estimates — The preparation of financial statements in conformity with U.S. GAAP requires management to make estimates and assumptions that affect the reported amounts of assets and liabilities as of the date of the financial statements and the reported amounts of income and expenses during the period. Operating results in the future could vary from the amounts derived from management’s estimates. |
| |
| | o) | | Additional Derivative Instrument(s) Information |
| |
| | | | Derivative Instrument(s) as of October 31, 2009. |
| | | | | | | | | | | | | | | | | |
| | | Asset Derivatives | | | Liability Derivatives | |
| Risk Exposure Category | | Statement of Assets and Liabilities Location | | | Statement of Assets and Liabilities Location | |
| Interest rate contracts | | | | | | | | | | Summary of Net Assets - Unrealized depreciation | | $ | 294 | |
| Interest rate contracts | | | | | | | | | | Written Options, Market Value | | | 15 | |
| Interest rate contracts | | Investments in securities, at value (Purchased Options), Market Value | | 191 |
| | | | | | | | | |
| | | | | | | | | | | | | | | |
| | | | The ratio of futures market value to net assets as of October 31, 2009, was 10.32%, compared to a monthly twelve-month average ratio of 26.61%. The volume of other derivatives that is presented in the Schedule of Investments is consistent with the derivative activity during the year ended October 31, 2009. |
| |
| | | | Realized Gain/Loss and Change in Unrealized Appreciation (Depreciation) on Derivative Instruments for the year ended October 31, 2009: |
| | | | | | | | | | | | | | | | | | | | | | | | | |
| Amount of Realized Gain or (Loss) on Derivatives Recognized in Income | |
| | | | | | | | | | | | | | | Forward | | | | | | | |
| | | | | | | Purchased | | | | | | | Currency | | | | | | | |
| Risk Exposure Category | | Written Options | | | Options | | | Futures | | | Contracts | | | Swaps | | | Total | |
| Interest rate contracts | | $ | (618 | ) | | $ | 982 | | | $ | (396 | ) | | $ | — | | | $ | — | | | $ | (32 | ) |
| Foreign exchange contracts | | | — | | | | — | | | | — | | | | (62 | ) | | | — | | | | (62 | ) |
| | | | | | | | | | | | | | | | | | | |
| Total | | $ | (618 | ) | | $ | 982 | | | $ | (396 | ) | | $ | (62 | ) | | $ | — | | | $ | (94 | ) |
| | | | | | | | | | | | | | | | | | | |
| | | | | | | | | | | | | | | | | | | | | | | | | |
| Change in Unrealized Appreciation or (Depreciation) on Derivatives Recognized in Income | |
| | | | | | | | | | | | | | | Forward | | | | | | | |
| | | | | | | Purchased | | | | | | | Currency | | | | | | | |
| Risk Exposure Category | | Written Options | | | Options | | | Futures | | | Contracts | | | Swaps | | | Total | |
| Interest rate contracts | | | (4 | ) | | | (35 | ) | | | (560 | ) | | | — | | | | — | | | $ | (599 | ) |
| | | | | | | | | | | | | | | | | | | |
| Total | | $ | (4 | ) | | $ | (35 | ) | | $ | (560 | ) | | $ | — | | | $ | — | | | $ | (599 | ) |
| | | | | | | | | | | | | | | | | | | |
| | p) | | Indemnifications — Under the Company’s organizational documents, the Company shall indemnify its officers and directors to the full extent required or permitted under Maryland General Corporation Law and the federal securities law. In addition, the Company, on behalf of the Fund, may enter into contracts that contain a variety of indemnifications. The Company’s maximum exposure under these arrangements is unknown. However, the Company has not had prior claims or losses pursuant to these contracts and expects the risk of loss to be remote. |
| | | | Futures and Options Transactions — The Fund is subject to equity price risk, interest rate risk and foreign currency exchange rate risk in the normal course of pursuing its investment objectives. The Fund may invest in futures and options contracts in order to gain exposure to or hedge against changes in the value of equities, interest rates or foreign currencies. A futures contract is an agreement between two parties to buy and sell a security at a set price on a future date. When the Fund enters into such futures contracts, it is required to deposit with a futures commission merchant an |
16
| | | | amount of “initial margin” of cash, commercial paper or U.S. Treasury Bills. Subsequent payments, called variation margin, to and from the broker, are made on a daily basis as the price of the underlying asset fluctuates, making the long and short positions in the futures contract more or less valuable (i.e., mark-to-market), which results in an unrealized gain or loss to the Fund. |
| |
| | | | At any time prior to the expiration of the futures contract, the Fund may close the position by taking an opposite position, which would effectively terminate the position in the futures contract. A final determination of variation margin is then made, additional cash is required to be paid by or released to the Fund and the Fund realizes a gain or loss. |
| |
| | | | The use of futures contracts involves elements of market risk, which may exceed the amounts recognized in the Statement of Assets and Liabilities. Changes in the value of the futures contracts may decrease the effectiveness of the Fund’s strategy and potentially result in loss. With futures, there is minimal counterparty risk to the Fund since futures are exchange traded through a clearing house. The clearing house requires sufficient collateral to cover margins. The Fund, as shown on the Schedule of Investments, had outstanding futures contracts as of October 31, 2009. |
| |
| | | | An option contract is a contract sold by one party to another party that offers the buyer the right, but not the obligation, to buy (call) or sell (put) a security or other financial asset at an agreed-upon price during a specific period of time or on a specific date. The premium paid by the Fund for the purchase of a call or put option is included in the Fund’s Statement of Assets and Liabilities as an investment and subsequently “marked-to-market” through net unrealized appreciation (depreciation) of options to reflect the current market value of the option as of the end of the reporting period. |
| |
| | | | The Fund may write (sell) covered options. “Covered” means that so long as the Fund is obligated as the writer of an option, it will own either the underlying securities or currency or an option to purchase the same underlying securities or currency having an expiration date of the covered option and an exercise price equal to or less than the exercise price of the covered option, or will pledge cash or other liquid securities having a value equal to or greater than the fluctuating market value of the option securities or currencies. The Fund receives a premium for writing a call or put option, which is recorded on the Fund’s Statement of Assets and Liabilities and subsequently “marked-to-market” through net unrealized appreciation (depreciation) of options. There is a risk of loss from a change in the value of such options, which may exceed the related premiums received. The maximum amount of loss with respect to the Fund’s written put option is the cost of buying the underlying security or currency from the counterparty. The maximum loss may be offset by proceeds received from selling the underlying securities. The Fund, as shown on the Schedule of Investments, had outstanding purchased option contracts as of October 31, 2009. Transactions involving written option contracts during the year ended October 31, 2009, are summarized below: |
| | | | | | | | | |
| Options Contract Activity During the Year Ended October 31, 2009 | | | | | | |
| Call Options Written During the Period | | Number of Contracts* | | | Premium Amounts | |
| Beginning of the period | | | — | | | $ | — | |
| Written | | | 8,992 | | | | 4,476 | |
| Expired | | | (471 | ) | | | (10 | ) |
| Closed | | | (8,283 | ) | | | (4,455 | ) |
| Exercised | | | — | | | | — | |
| | | | | | | |
| End of Period | | | 238 | | | $ | 11 | |
| | | | | | | |
| | | | | | | | | |
| Put Options Written During the Period | | Number of Contracts* | | | Premium Amounts | |
| Beginning of the period | | | — | | | $ | — | |
| Written | | | 7,150 | | | | 5,831 | |
| Expired | | | (930 | ) | | | (161 | ) |
| Closed | | | (6,220 | ) | | | (5,670 | ) |
| Exercised | | | — | | | | — | |
| | | | | | | |
| End of Period | | | — | | | $ | — | |
| | | | | | | |
| | |
| * | | The number of contracts does not omit 000’s. |
17
The Hartford U.S. Government Securities Fund
Notes to Financial Statements — (continued)
October 31, 2009
(000’s Omitted)
| | a) | | Federal Income Taxes — For federal income tax purposes, the Fund intends to continue to qualify as a RIC under Subchapter M of the Internal Revenue Code (“IRC”) by distributing substantially all of its taxable net investment income and net realized capital gains to its shareholders and otherwise complying with the requirements of regulated investment companies. The Fund has distributed substantially all of its income and capital gains in prior years and intends to distribute substantially all of its income and capital gains during the calendar year ending December 31, 2009. Accordingly, no provision for federal income or excise taxes has been made in the accompanying financial statements. Distributions from short-term capital gains are treated as ordinary income distributions for federal income tax purposes. |
| |
| | b) | | Net Investment Income (Loss), Realized Gains and (Losses) — Net investment income (loss) and net realized gains (losses) may differ for financial statement and tax purposes primarily because of losses deferred due to wash sale adjustments, foreign currency gains and losses, adjustments related to PFICs, REITs, RICs, certain derivatives and partnerships. The character of distributions made during the year from net investment income or realized gains may differ from their ultimate characterization for federal income tax purposes. Also, due to the timing of dividend distributions, the fiscal year in which amounts are distributed may differ from the year that the income or realized gains (losses) were recorded by the Fund. |
| |
| | c) | | Distributions and Components of Distributable Earnings — The tax character of distributions paid by the Fund for the periods indicated is as follows (as adjusted for dividends payable): |
| | | | | | | | | |
| | | For the Year Ended | | For the Year Ended |
| | | October 31, 2009 | | October 31, 2008 |
| Ordinary Income | | $ | 8,507 | | | $ | 9,551 | |
As of October 31, 2009, the Fund’s components of distributable earnings (deficit) on a tax basis were as follows:
| | | | | |
| | | Amount | |
| Undistributed Ordinary Income | | $ | 161 | |
| Accumulated Capital Losses * | | | (18,411 | ) |
| Unrealized Depreciation † | | | (4,579 | ) |
| | | | |
| Total Accumulated Deficit | | $ | (22,829 | ) |
| | | | |
| | |
| * | | The Fund has capital loss carryforwards that are identified in the Capital Loss Carryforward note that follows. |
| |
| † | | The differences between book-basis and tax-basis unrealized appreciation (depreciation) may be attributable to the losses deferred due to wash sale adjustments, foreign currency gains and losses, adjustments related to PFICs, REITs, RICs, certain derivatives and partnerships. |
| | d) | | Reclassification of Capital Accounts — The Fund may record reclassifications in its capital accounts. These reclassifications have no impact on the total net assets of the Fund. The reclassifications are a result of permanent differences between GAAP and tax accounting for such items as net operating losses that reduce distribution requirements. Adjustments are made to reflect the impact these items have on current and future distributions to shareholders. Therefore, the source of the Fund’s distributions may be shown in the accompanying Statement of Changes in Net Assets as from net investment income, from net realized gains on investments or from capital depending on the type of book and tax differences that exist. For the year ended October 31, 2009, the Fund recorded reclassifications to increase accumulated undistributed net investment income by $239, increase accumulated net realized gain on investments by $2,206, and decrease paid-in-capital by $2,445. |
18
| | e) | | Capital Loss Carryforward — At October 31, 2009 (tax-year-end), the Fund had capital loss carryforwards for U.S. federal income tax purposes of approximately: |
| | | | | |
| Year of Expiration | | Amount | |
| 2011 | | $ | 672 | |
| 2012 | | | 3,591 | |
| 2013 | | | 2,517 | |
| 2014 | | | 6,198 | |
| 2015 | | | 880 | |
| 2017 | | | 4,553 | |
| | | | |
Total | | $ | 18,411 | |
| | | | |
| | | | As of October 31, 2009, the Fund had $2,445 in expired capital loss carryforwards. |
| | f) | | Accounting for Uncertainty in Income Taxes — Management has evaluated all open tax years and has determined there is no impact to the Fund’s financial statements related to uncertain tax positions. Generally, tax authorities can examine all tax returns filed for the last three years. |
| | a) | | Investment Management Agreement — Hartford Investment Financial Services, LLC (“HIFSCO”) serves as investment manager to the Fund pursuant to an Investment Management Agreement with the Company. As investment manager, HIFSCO has overall investment supervisory responsibility for the Fund. In addition, HIFSCO provides administrative personnel, services, equipment, facilities and office space for proper operation of the Fund. HIFSCO has contracted with Hartford Investment Management for the provision of day-to-day investment management services to the Fund in accordance with the Fund’s investment objective and policies. The Fund pays a fee to HIFSCO, a portion of which may be used to compensate Hartford Investment Management. |
| | | | The schedule below reflects the rates of compensation paid to HIFSCO for investment management services rendered during the year ended October 31, 2009; the rates are accrued daily and paid monthly: |
| | | | | |
| Average Daily Net Assets | | Annual Fee |
| On first $500 million | | | 0.55 | % |
| On next $4.5 billion | | | 0.50 | % |
| On next $5 billion | | | 0.48 | % |
| Over $10 billion | | | 0.47 | % |
| | b) | | Accounting Services Agreement — Pursuant to the Fund Accounting Agreement between Hartford Life Insurance Company (“HLIC”) and the Fund, HLIC provides accounting services to the Fund and receives monthly compensation on the Fund’s average net assets. The Fund’s accounting services fees are accrued daily and paid monthly. |
| | | | | |
| Average Daily Net Assets | | Annual Fee |
| On first $5 billion | | | 0.016 | % |
| On next $5 billion | | | 0.014 | % |
| Over $10 billion | | | 0.012 | % |
19
The Hartford U.S. Government Securities Fund
Notes to Financial Statements — (continued)
October 31, 2009
(000’s Omitted)
| | c) | | Operating Expenses — Allocable expenses incurred by the Company are allocated to each Fund and allocated to classes within the Fund in proportion to the average daily net assets of the Fund and each class, except where allocation of certain expenses is more fairly made directly to the Fund or to specific classes within a Fund. During the year ended October 31, 2009, HIFSCO has permanently limited the total operating expenses of this Fund, exclusive of taxes, interest expense, brokerage commissions, certain distribution expenses and extraordinary expenses as follows: |
| | | | | | | | | |
| Class A | | Class B | | Class C | | Class L | | Class Y |
| 1.00% | | 1.75% | | 1.75% | | 1.00% | | 0.75% |
| | d) | | Fees Paid Indirectly — The Fund’s custodian bank has agreed to reduce its fees when the Fund maintains cash on deposit in the non-interest-bearing custody account. For the year ended October 31, 2009, this amount is included in the Statement of Operations. |
| | | | The ratio of expenses to average net assets in the accompanying financial highlights excludes the reduction in expenses related to fees paid indirectly. Had the fees paid indirectly been included, the annualized expense ratio for the periods listed below would have been as follows: |
| | | | | | | | | | | | | | | | | | | | | |
| | | Year Ended | | Year Ended | | Year Ended | | Year Ended | | Year Ended |
| | | October 31, | | October 31, | | October 31, | | October 31, | | October 31, |
| | | 2009 | | 2008 | | 2007 | | 2006 | | 2005 |
| Class A Shares | | | 1.00 | % | | | 1.00 | % | | | 1.00 | % | | | 1.15 | % | | | 1.15 | % |
| Class B Shares | | | 1.74 | | | | 1.68 | | | | 1.71 | | | | 1.90 | | | | 1.90 | |
| Class C Shares | | | 1.75 | | | | 1.75 | | | | 1.75 | | | | 1.90 | | | | 1.90 | |
| Class L Shares | | | 0.88 | | | | 0.87 | | | | 0.91 | | | | 1.08 | | | | 1.08 | |
| Class Y Shares | | | 0.65 | | | | 0.64 | | | | 0.68 | | | | 0.83 | | | | 0.86 | |
| | e) | | Distribution and Service Plan for Class A, B, C and L Shares — HIFSCO is the principal underwriter and distributor of the Fund. HIFSCO is engaged in distribution activities, which include marketing and distribution of shares through broker-dealers, financing distribution costs and maintaining financial books and records. For the year ended October 31, 2009, HIFSCO received front-end load sales charges of $538 and contingent deferred sales charges of $96 from the Fund. |
| | | | The Fund has adopted a Distribution and Service Plan in accordance with Rule 12b-1 of the Investment Company Act of 1940, as amended, to compensate the distributor (HIFSCO) for activities intended to result in the sale and distribution of Classes A, B, C and L shares and for providing services for shareholders. The Rule 12b-1 plan applicable to Class A shares of the Fund provides for payment of a Rule 12b-1 fee of up to 0.35% of average daily net assets; however, the Board of Directors has currently authorized 12b-1 payments of up to 0.25%. Some or all of the fee may be used for shareholder servicing expenses with the remainder used for distribution expenses. Some or the entire Rule 12b-1 fee for Class B shares may be remitted to broker-dealers for distribution and/or shareholder account services. Under the Class B Plan, the Fund pays the distributor 1.00% of the average daily net assets of Class B shares that are outstanding for 8 years or less, 0.25% of which is a fee for services provided to existing shareholders with the remainder used for distribution expenses. After eight years, Class B shares convert to Class A shares. Upon conversion to Class A shares, the Class A plan described above will apply to those shares. Under the Class C Plan, the Fund pays the Distributor 1.00% of the average daily net assets of Class C shares outstanding, 0.25% of which is intended as a fee for services provided to existing shareholders with the remainder used for distribution expenses. For Class C shares, some or the entire fee may be remitted to broker-dealers for distribution and/or shareholder account services. Class L has a distribution fee of 0.25%. The Fund’s 12b-1 fees are accrued daily and paid monthly. |
| | | | For the year ended October 31, 2009, total sales commissions paid to affiliated brokers/dealers of The Hartford for distributing the Fund’s shares were $30. These commissions are in turn paid to sales representatives of the broker/dealers. |
20
| | f) | | Other Related Party Transactions — Certain officers of the Fund are directors and/or officers of HIFSCO and/or The Hartford or its subsidiaries. For the year ended October 31, 2009, a portion of the Fund’s chief compliance officer’s salary was paid by all the investment companies in the Hartford fund complex. The portion allocated to the Fund was in the amount of $1. Hartford Administrative Services Company (“HASCO”), an indirect wholly owned subsidiary of The Hartford, provides transfer agent services to the Fund. HASCO has contractually agreed to reimburse any portion of the transfer agency fees over 0.30% of average daily net assets per fiscal year for all classes. HASCO was compensated $323 for providing such services. These fees are accrued daily and paid monthly. |
| 6. | | Investment Transactions: |
| |
| | | For the year ended October 31, 2009, the Fund’s aggregate purchases and sales of investment securities (excluding short-term investments) were as follows: |
| | | | | |
| | | Amount |
| Cost of Purchases Excluding U.S. Government Obligations | | $ | 371,764 | |
| Sales Proceeds Excluding U.S. Government Obligations | | | 372,367 | |
| Cost of Purchases for U.S. Government Obligations | | | 130,638 | |
| Sales Proceeds for U.S. Government Obligations | | | 107,324 | |
| 7. | | Capital Share Transactions: |
| |
| | | The following information is for the year ended October 31, 2009 and the year ended October 31, 2008: |
| | | | | | | | | | | | | | | | | | | | | | | | | | | | | | | | | | | | | | | | | |
| | | For the Year Ended October 31, 2009 | | For the Year Ended October 31, 2008 |
| | | | | | | Shares | | | | | | Shares | | | | | | | | | | Shares | | | | | | Shares | | |
| | | | | | | Issued for | | | | | | Issued | | Net Increase | | | | | | Issued for | | | | | | Issued | | Net Increase |
| | | Shares | | Reinvested | | Shares | | from | | (Decrease) of | | Shares | | Reinvested | | Shares | | from | | (Decrease) of |
| | | Sold | | Dividends | | Redeemed | | Merger | | Shares | | Sold | | Dividends | | Redeemed | | Merger | | Shares |
| Class A | | | | | | | | | | | | | | | | | | | | | | | | | | | | | | | | | | | | | | | | |
| Shares | | | 8,016 | | | | 369 | | | | (9,513 | ) | | | — | | | | (1,128 | ) | | | 9,734 | | | | 299 | | | | (4,562 | ) | | | — | | | | 5,471 | |
| Amount | | $ | 71,736 | | | $ | 3,291 | | | $ | (84,587 | ) | | $ | — | | | $ | (9,560 | ) | | $ | 87,636 | | | $ | 2,693 | | | $ | (41,083 | ) | | $ | — | | | $ | 49,246 | |
| Class B | | | | | | | | | | | | | | | | | | | | | | | | | | | | | | | | | | | | | | | | |
| Shares | | | 1,167 | | | | 52 | | | | (1,288 | ) | | | — | | | | (69 | ) | | | 1,225 | | | | 56 | | | | (626 | ) | | | — | | | | 655 | |
| Amount | | $ | 10,398 | | | $ | 462 | | | $ | (11,393 | ) | | $ | — | | | $ | (533 | ) | | $ | 10,962 | | | $ | 505 | | | $ | (5,617 | ) | | $ | — | | | $ | 5,850 | |
| Class C | | | | | | | | | | | | | | | | | | | | | | | | | | | | | | | | | | | | | | | | |
| Shares | | | 3,449 | | | | 79 | | | | (5,004 | ) | | | — | | | | (1,476 | ) | | | 5,120 | | | | 65 | | | | (2,018 | ) | | | — | | | | 3,167 | |
| Amount | | $ | 30,727 | | | $ | 702 | | | $ | (44,210 | ) | | $ | — | | | $ | (12,781 | ) | | $ | 45,965 | | | $ | 583 | | | $ | (18,095 | ) | | $ | — | | | $ | 28,453 | |
| Class L | | | | | | | | | | | | | | | | | | | | | | | | | | | | | | | | | | | | | | | | |
| Shares | | | 79 | | | | 86 | | | | (377 | ) | | | — | | | | (212 | ) | | | 48 | | | | 127 | | | | (531 | ) | | | — | | | | (356 | ) |
| Amount | | $ | 701 | | | $ | 771 | | | $ | (3,357 | ) | | $ | — | | | $ | (1,885 | ) | | $ | 430 | | | $ | 1,151 | | | $ | (4,842 | ) | | $ | — | | | $ | (3,261 | ) |
| Class Y | | | | | | | | | | | | | | | | | | | | | | | | | | | | | | | | | | | | | | | | |
| Shares | | | 92 | | | | 208 | | | | (1,061 | ) | | | — | | | | (761 | ) | | | 109 | | | | 313 | | | | (1,245 | ) | | | — | | | | (823 | ) |
| Amount | | $ | 823 | | | $ | 1,860 | | | $ | (9,485 | ) | | $ | — | | | $ | (6,802 | ) | | $ | 984 | | | $ | 2,838 | | | $ | (11,268 | ) | | $ | — | | | $ | (7,446 | ) |
| | | The following reflects the conversion of Class B Shares into Class A Shares (reflected as Class A Shares issued) for the year ended October 31, 2009 and the year ended October 31, 2008: |
| | | | | | | | | |
| | | Shares | | Dollars |
| For the Year Ended October 31, 2009 | | | 116 | | | $ | 1,040 | |
| For the Year Ended October 31, 2008 | | | 103 | | | $ | 927 | |
21
The Hartford U.S. Government Securities Fund
Notes to Financial Statements — (continued)
October 31, 2009
(000’s Omitted)
| 8. | | Line of Credit: |
| |
| | | The Fund is one of several Hartford Funds that participate in a $500 million committed revolving line of credit facility. The facility is to be used for temporary or emergency purposes. Under the arrangement, the Fund is required to own securities having a market value in excess of 300% of the total bank borrowings. The interest rate on borrowings varies depending on the nature of the loan. The facility also requires a fee to be paid based on the amount of the commitment. This fee is allocated to all the Funds participating in the line of credit based on the average net assets of the Funds. During the year ended October 31, 2009, the Fund did not have any borrowings under this facility. |
| |
| 9. | | Subsequent Events: |
| |
| | | Reorganization of the Fund with and into The Hartford Inflation Plus Fund: On August 5, 2009, the Board of Directors of the the Company approved on behalf of the Fund and the Board of Directors of The Hartford Mutual Funds, Inc. approved on behalf of The Hartford Inflation Plus Fund, a Form of Agreement and Plan of Reorganization that provides for the reorganization of the Fund into The Hartford Inflation Plus Fund, a series of The Hartford Mutual Funds, Inc. The reorganization does not require shareholder approval. |
| |
| | | Effective September 30, 2009, Classes A, B, C, L and Y of the Fund are no longer sold to new investors or existing shareholders (except through reinvested dividends) nor are they eligible for exchanges from other Hartford Mutual Funds. |
| |
| | | The reorganization is expected to occur on or about the close of business on February 19, 2010 or on such other date as the officers of the Hartford Mutual Funds determine. |
| |
| | | Management has evaluated subsequent events through December 15, 2009, the date of issuance of the Fund’s financial statements, and has determined that no additional items require disclosure. |
22
[This page is intentionally left blank]
23
The Hartford U.S. Government Securities Fund
Financial Highlights
- Selected Per-Share Data (a) -
| | | | | | | | | | | | | | | | | | | | | | | | | | | | | | | | | | | | | | | | | | | | | |
| | | Net Asset | | | | | | | | | | Net Realized | | | | | | | | | | | | | | | | | | | | | | Net Increase | | |
| | | Value at | | | | | | | | | | and Unrealized | | Total from | | Dividends from | | Distributions | | | | | | | | | | (Decrease) in | | Net Asset |
| | | Beginning of | | Net Investment | | Payments from | | Gain (Loss) on | | Investment | | Net Investment | | from Realized | | Distributions | | Total | | Net Asset | | Value at End |
| Class | | Period | | Income (Loss) | | (to) Affiliate | | Investments | | Operations | | Income | | Capital Gains | | from Capital | | Distributions | | Value | | of Period |
| For the Year Ended October 31, 2009 |
| A | | $ | 8.77 | | | $ | 0.28 | | | $ | — | | | $ | 0.15 | | | $ | 0.43 | | | $ | (0.29 | ) | | $ | — | | | $ | — | | | $ | (0.29 | ) | | $ | 0.14 | | | $ | 8.91 | |
| B | | | 8.72 | | | | 0.21 | | | | — | | | | 0.15 | | | | 0.36 | | | | (0.22 | ) | | | — | | | | — | | | | (0.22 | ) | | | 0.14 | | | | 8.86 | |
| C | | | 8.72 | | | | 0.21 | | | | — | | | | 0.15 | | | | 0.36 | | | | (0.22 | ) | | | — | | | | — | | | | (0.22 | ) | | | 0.14 | | | | 8.86 | |
| L | | | 8.75 | | | | 0.29 | | | | — | | | | 0.15 | | | | 0.44 | | | | (0.30 | ) | | | — | | | | — | | | | (0.30 | ) | | | 0.14 | | | | 8.89 | |
| Y | | | 8.78 | | | | 0.31 | | | | — | | | | 0.15 | | | | 0.46 | | | | (0.32 | ) | | | — | | | | — | | | | (0.32 | ) | | | 0.14 | | | | 8.92 | |
| | | | | | | | | | | | | | | | | | | | | | | | | | | | | | | | | | | | | | | | | | | | | |
| For the Year Ended October 31, 2008 (e) |
| A | | | 9.06 | | | | 0.40 | | | | — | | | | (0.28 | ) | | | 0.12 | | | | (0.41 | ) | | | — | | | | — | | | | (0.41 | ) | | | (0.29 | ) | | | 8.77 | |
| B | | | 9.02 | | | | 0.34 | | | | — | | | | (0.29 | ) | | | 0.05 | | | | (0.35 | ) | | | — | | | | — | | | | (0.35 | ) | | | (0.30 | ) | | | 8.72 | |
| C | | | 9.02 | | | | 0.33 | | | | — | | | | (0.28 | ) | | | 0.05 | | | | (0.35 | ) | | | — | | | | — | | | | (0.35 | ) | | | (0.30 | ) | | | 8.72 | |
| L | | | 9.05 | | | | 0.42 | | | | — | | | | (0.29 | ) | | | 0.12 | | | | (0.42 | ) | | | — | | | | — | | | | (0.42 | ) | | | (0.30 | ) | | | 8.75 | |
| Y | | | 9.08 | | | | 0.44 | | | | — | | | | (0.29 | ) | | | 0.15 | | | | (0.45 | ) | | | — | | | | — | | | | (0.45 | ) | | | (0.30 | ) | | | 8.78 | |
| | | | | | | | | | | | | | | | | | | | | | | | | | | | | | | | | | | | | | | | | | | | | |
| For the Year Ended October 31, 2007 |
| A | | | 9.23 | | | | 0.44 | | | | — | | | | (0.17 | ) | | | 0.27 | | | | (0.44 | ) | | | — | | | | — | | | | (0.44 | ) | | | (0.17 | ) | | | 9.06 | |
| B | | | 9.18 | | | | 0.38 | | | | — | | | | (0.17 | ) | | | 0.21 | | | | (0.37 | ) | | | — | | | | — | | | | (0.37 | ) | | | (0.16 | ) | | | 9.02 | |
| C | | | 9.18 | | | | 0.37 | | | | — | | | | (0.16 | ) | | | 0.21 | | | | (0.37 | ) | | | — | | | | — | | | | (0.37 | ) | | | (0.16 | ) | | | 9.02 | |
| L(f) | | | 9.22 | | | | 0.46 | | | | — | | | | (0.18 | ) | | | 0.28 | | | | (0.45 | ) | | | — | | | | — | | | | (0.45 | ) | | | (0.17 | ) | | | 9.05 | |
| Y(f) | | | 9.20 | | | | 0.46 | | | | — | | | | (0.13 | ) | | | 0.33 | | | | (0.45 | ) | | | — | | | | — | | | | (0.45 | ) | | | (0.12 | ) | | | 9.08 | |
| | | | | | | | | | | | | | | | | | | | | | | | | | | | | | | | | | | | | | | | | | | | | |
| For the Year Ended October 31, 2006 (e) |
| A | | | 9.32 | | | | 0.42 | | | | — | | | | (0.08 | ) | | | 0.34 | | | | (0.43 | ) | | | — | | | | — | | | | (0.43 | ) | | | (0.09 | ) | | | 9.23 | |
| B | | | 9.27 | | | | 0.35 | | | | — | | | | (0.08 | ) | | | 0.27 | | | | (0.36 | ) | | | — | | | | — | | | | (0.36 | ) | | | (0.09 | ) | | | 9.18 | |
| C | | | 9.27 | | | | 0.35 | | | | — | | | | (0.08 | ) | | | 0.27 | | | | (0.36 | ) | | | — | | | | — | | | | (0.36 | ) | | | (0.09 | ) | | | 9.18 | |
| L | | | 9.31 | | | | 0.43 | | | | — | | | | (0.08 | ) | | | 0.35 | | | | (0.44 | ) | | | — | | | | — | | | | (0.44 | ) | | | (0.09 | ) | | | 9.22 | |
| Y | | | 9.32 | | | | 0.41 | | | | — | | | | (0.07 | ) | | | 0.34 | | | | (0.46 | ) | | | — | | | | — | | | | (0.46 | ) | | | (0.12 | ) | | | 9.20 | |
| | | | | | | | | | | | | | | | | | | | | | | | | | | | | | | | | | | | | | | | | | | | | |
| For the Year Ended October 31, 2005 |
| A | | | 9.65 | | | | 0.40 | | | | — | | | | (0.32 | ) | | | 0.08 | | | | (0.41 | ) | | | — | | | | — | | | | (0.41 | ) | | | (0.33 | ) | | | 9.32 | |
| B | | | 9.62 | | | | 0.32 | | | | — | | | | (0.34 | ) | | | (0.02 | ) | | | (0.33 | ) | | | — | | | | — | | | | (0.33 | ) | | | (0.35 | ) | | | 9.27 | |
| C | | | 9.61 | | | | 0.32 | | | | — | | | | (0.33 | ) | | | (0.01 | ) | | | (0.33 | ) | | | — | | | | — | | | | (0.33 | ) | | | (0.34 | ) | | | 9.27 | |
| L | | | 9.65 | | | | 0.41 | | | | — | | | | (0.34 | ) | | | 0.07 | | | | (0.41 | ) | | | — | | | | — | | | | (0.41 | ) | | | (0.34 | ) | | | 9.31 | |
| Y | | | 9.66 | | | | 0.41 | | | | — | | | | (0.31 | ) | | | 0.10 | | | | (0.44 | ) | | | — | | | | — | | | | (0.44 | ) | | | (0.34 | ) | | | 9.32 | |
| | |
| (a) | | Information presented relates to a share outstanding throughout the indicated period. |
| |
| (b) | | Assumes initial investment at net asset value at the beginning of each period, reinvestment of all distributions, the complete redemption of the investment at net asset value at the end of each period and no sales charge. Total return would be reduced if sales charges were taken into account. |
| |
| (c) | | Ratios do not include fees paid indirectly (See Expenses in the accompanying Notes to Financial Statements). |
| |
| (d) | | Portfolio turnover rate is calculated on the basis of the Fund as a whole without distinguishing between the classes of shares issued. |
| |
| (e) | | Per share amounts have been calculated using average shares outstanding method. |
| |
| (f) | | Classes H, M and N were merged into Class L and Class E was merged into Class Y on February 9, 2007. |
24
- Ratios and Supplemental Data -
| | | | | | | | | | | | | | | | | | | | | | | | | | | | | |
| | | | | | | | | | | Ratio of Expenses to Average Net | | Ratio of Expenses to Average Net | | Ratio of Expenses to Average Net | | | | |
| | | | | | | | | | | Assets Before Waivers and | | Assets After Waivers and | | Assets After Waivers and | | Ratio of Net Investment | | |
| | | | | | | Net Assets at End of | | Reimbursements and Including | | Reimbursements and Including | | Reimbursements and Excluding | | Income to Average Net | | Portfolio Turnover |
| Total Return(b) | | | | Period (000’s) | | Expenses not Subject to Cap(c) | | Expenses not Subject to Cap(c) | | Expenses not Subject to Cap(c) | | Assets | | Rate(d) |
| | 4.91 | % | | | | $ | 92,141 | | | | 1.07 | % | | | 1.00 | % | | | 1.00 | % | | | 3.10 | % | | | 123 | % |
| | 4.17 | | | | | | 18,777 | | | | 1.95 | | | | 1.74 | | | | 1.74 | | | | 2.37 | | | | — | |
| | 4.16 | | | | | | 29,196 | | | | 1.78 | | | | 1.75 | | | | 1.75 | | | | 2.33 | | | | — | |
| | 5.06 | | | | | | 26,051 | | | | 0.89 | | | | 0.88 | | | | 0.88 | | | | 3.25 | | | | — | |
| | 5.28 | | | | | | 63,356 | | | | 0.65 | | | | 0.65 | | | | 0.65 | | | | 3.48 | | | | — | |
| | | | | | | | | | | | | | | | | | | | | | | | | | | | | |
| | 1.31 | | | | | | 100,574 | | | | 1.09 | | | | 1.00 | | | | 1.00 | | | | 4.50 | | | | 36 | |
| | 0.55 | | | | | | 19,084 | | | | 2.01 | | | | 1.68 | | | | 1.68 | | | | 3.84 | | | | — | |
| | 0.45 | | | | | | 41,624 | | | | 1.77 | | | | 1.75 | | | | 1.75 | | | | 3.73 | | | | — | |
| | 1.33 | | | | | | 27,512 | | | | 0.89 | | | | 0.87 | | | | 0.87 | | | | 4.67 | | | | — | |
| | 1.56 | | | | | | 69,071 | | | | 0.64 | | | | 0.64 | | | | 0.64 | | | | 4.91 | | | | — | |
| | | | | | | | | | | | | | | | | | | | | | | | | | | | | |
| | 3.00 | | | | | | 54,414 | | | | 1.20 | | | | 1.00 | | | | 1.00 | | | | 4.85 | | | | 68 | |
| | 2.38 | | | | | | 13,837 | | | | 2.07 | | | | 1.71 | | | | 1.71 | | | | 4.14 | | | | — | |
| | 2.35 | | | | | | 14,488 | | | | 1.87 | | | | 1.75 | | | | 1.75 | | | | 4.10 | | | | — | |
| | 3.08 | | | | | | 31,681 | | | | 0.93 | | | | 0.91 | | | | 0.91 | | | | 5.02 | | | | — | |
| | 3.72 | | | | | | 78,906 | | | | 0.68 | | | | 0.68 | | | | 0.68 | | | | 5.65 | | | | — | |
| | | | | | | | | | | | | | | | | | | | | | | | | | | | | |
| | 3.77 | | | | | | 45,851 | | | | 1.39 | | | | 1.15 | | | | 1.15 | | | | 4.60 | | | | 158 | |
| | 3.01 | | | | | | 17,011 | | | | 2.20 | | | | 1.91 | | | | 1.91 | | | | 3.84 | | | | — | |
| | 3.01 | | | | | | 9,698 | | | | 2.08 | | | | 1.90 | | | | 1.90 | | | | 3.86 | | | | — | |
| | 3.86 | | | | | | 30,712 | | | | 1.08 | | | | 1.08 | | | | 1.08 | | | | 4.67 | | | | — | |
| | 3.75 | | | | | | 101 | | | | 0.85 | | | | 0.83 | | | | 0.83 | | | | 4.86 | | | | — | |
| | | | | | | | | | | | | | | | | | | | | | | | | | | | | |
| | 0.79 | | | | | | 47,252 | | | | 1.38 | | | | 1.15 | | | | 1.15 | | | | 4.17 | | | | 108 | |
| | (0.17 | ) | | | | | 21,268 | | | | 2.17 | | | | 1.90 | | | | 1.90 | | | | 3.41 | | | | — | |
| | (0.07 | ) | | | | | 9,631 | | | | 2.05 | | | | 1.90 | | | | 1.90 | | | | 3.41 | | | | — | |
| | 0.77 | | | | | | 34,880 | | | | 1.08 | | | | 1.08 | | | | 1.08 | | | | 4.24 | | | | — | |
| | 1.04 | | | | | | 9,244 | | | | 0.86 | | | | 0.86 | | | | 0.86 | | | | 4.52 | | | | — | |
25
Report of Independent Registered Public Accounting Firm
The Board of Directors and Shareholders of
The Hartford Mutual Funds II, Inc.
We have audited the accompanying statement of assets and liabilities, including the schedule of investments, of The Hartford U.S. Government Securities Fund (one of the portfolios constituting The Hartford Mutual Funds II, Inc. (the Funds)) as of October 31, 2009, and the related statement of operations for the year then ended, the statements of changes in net assets for each of the two years in the period then ended, and the financial highlights for each of the periods indicated therein. These financial statements and financial highlights are the responsibility of the Funds’ management. Our responsibility is to express an opinion on these financial statements and financial highlights based on our audits.
We conducted our audits in accordance with the standards of the Public Company Accounting Oversight Board (United States). Those standards require that we plan and perform the audit to obtain reasonable assurance about whether the financial statements and financial highlights are free of material misstatement. We were not engaged to perform an audit of the Funds’ internal control over financial reporting. Our audits included consideration of internal control over financial reporting as a basis for designing audit procedures that are appropriate in the circumstances, but not for the purpose of expressing an opinion on the effectiveness of the Funds’ internal control over financial reporting. Accordingly, we express no such opinion. An audit also includes examining, on a test basis, evidence supporting the amounts and disclosures in the financial statements and financial highlights, assessing the accounting principles used and significant estimates made by management, and evaluating the overall financial statement presentation. Our procedures included confirmation of securities owned as of October 31, 2009, by correspondence with the custodian and brokers or by other appropriate auditing procedures where replies from brokers were not received. We believe that our audits provide a reasonable basis for our opinion.
In our opinion, the financial statements and financial highlights referred to above present fairly, in all material respects, the financial position of The Hartford U.S. Government Securities Fund of The Hartford Mutual Funds II, Inc. at October 31, 2009, the results of its operations for the year then ended, the changes in its net assets for each of the two years in the period then ended, and the financial highlights for each of periods indicated therein, in conformity with U.S. generally accepted accounting principles.
Minneapolis, MN
December 15, 2009
26
The Hartford U.S. Government Securities Fund
Directors and Officers (Unaudited)
The Board of Directors appoints officers who are responsible for the day-to-day operations of the Fund and who execute policies formulated by the Directors. Each director serves until his or her death, resignation, or retirement or until the next annual meeting of shareholders is held or until his or her successor is elected and qualifies.
Directors and officers who are employed by or who have a financial interest in The Hartford are considered “interested” persons of the Fund pursuant to the Investment Company Act of 1940, as amended. Each officer and two of the Funds’ directors, as noted in the chart below, are “interested” persons of the Fund. Each director serves as a director for The Hartford Mutual Funds, Inc., The Hartford Mutual Funds II, Inc., The Hartford Income Shares Fund, Inc., Hartford Series Fund, Inc., and Hartford HLS Series Fund II, Inc., which, as of October 31, 2009, collectively consist of 93 funds. Correspondence may be sent to directors and officers c/o Hartford Mutual Funds, P.O. Box 2999, Hartford, Connecticut 06104-2999, except that correspondence to Ms. Fagely may be sent to 500 Bielenberg Drive, Woodbury, Minnesota 55125.
The table below sets forth, for each director and officer, his or her name, year of birth, current position with the Fund and date first elected or appointed to The Hartford Mutual Funds, Inc. (“MF”) and The Hartford Mutual Funds II, Inc. (“MF2”), principal occupation, and, for directors, other directorships held. The Fund’s statement of additional information contains further information on the directors and is available free of charge by calling 1-888-843-7824 or writing to Hartford Mutual Funds, P.O. Box 64387, St. Paul, MN 55164-0387.
Information on the aggregate remuneration paid to the directors of the Fund can be found in the Statement of Operations herein. The Fund pays to The Hartford a portion of the Chief Compliance Officer’s compensation, but does not pay salaries or compensation to any of its other officers or directors who are employed by The Hartford.
Non-Interested Directors
Lynn S. Birdsong (1946) Director since 2003, Co-Chairman of the Investment Committee
Mr. Birdsong is a private investor. Since 1981, Mr. Birdsong has been a partner in Birdsong Company, an advertising specialty firm. Since 2003, Mr. Birdsong has been an independent director of The Japan Fund. From 2003 to March 2005, Mr. Birdsong was an independent director of the Atlantic Whitehall Funds. From 1979 to 2002, Mr. Birdsong was a managing director of Zurich Scudder Investments, an investment management firm. During his employment with Scudder, Mr. Birdsong was an interested director of The Japan Fund.
Robert M. Gavin, Jr. (1940) Director since 2002 (MF) and 1986 (MF2), Chairman of the Board since 2004
Dr. Gavin is an educational consultant. Prior to September 1, 2001, he was President of Cranbrook Education Community and prior to July 1996, he was President of Macalester College, St. Paul, Minnesota.
Duane E. Hill (1945) Director since 2001 (MF) and 2002 (MF2), Chairman of the Nominating Committee
Mr. Hill is Partner of TSG Ventures L.P., a private equity investment company. He has served for over thirty years as a financial services executive in banking, venture capital and private equity.
Sandra S. Jaffee (1941) Director since 2005
Ms. Jaffee served as Chairman (2008-2009) and Chief Executive Officer of Fortent (formerly Searchspace Group), a leading provider of compliance/regulatory technology to financial institutions from August 2005 to August 2009. From August 2004 to August 2005, Ms. Jaffee served as an Entrepreneur in Residence with Warburg Pincus, a private equity firm. From September 1995 to July 2004, Ms. Jaffee served as Executive Vice President at Citigroup, where she was President and Chief Executive Officer of Citibank’s Global Securities Services (1995-2003).
William P. Johnston (1944) Director since 2005, Chairman of the Compliance Committee
In February 2008, Mr. Johnston was elected to the Board of Directors of HCR-ManorCare, Inc. In August 2007, Mr. Johnston was elected to the Board of Directors of LifeCare Holdings, Inc. In July, 2006, Mr. Johnston was elected to the Board of Directors of MultiPlan, Inc. In June 2006, Mr. Johnston was appointed as Senior Advisor to The Carlyle Group, a global private equity investment firm. In May 2006, Mr. Johnston was elected to the Supervisory Board of Fresenius Medical Care AG & Co. KGaA, after its acquisition of Renal Care Group, Inc. in March 2006. Mr. Johnston joined Renal Care Group in November 2002 as a member of the Board of Directors and served as Chairman of the Board from March 2003 through March 2006. From September 1987 to December 2002, Mr. Johnston was with Equitable Securities Corporation (and its successors, SunTrust Equitable Securities and SunTrust Robinson Humphrey) serving in various investment banking and managerial positions, including Managing Director and Head of Investment Banking, Chief Executive Officer and Vice Chairman.
27
The Hartford U.S. Government Securities Fund
Directors and Officers (Unaudited) — (continued)
Phillip O. Peterson (1944) Director since 2002 (MF) and 2000 (MF2), Chairman of the Audit Committee
Mr. Peterson is a mutual fund industry consultant. He was a partner of KPMG LLP (an accounting firm) until July 1999. Mr. Peterson joined William Blair Funds in February 2007 as a member of the Board of Trustees. From January 2004 to April 2005, Mr. Peterson served as Independent President of the Strong Mutual Funds.
Lemma W. Senbet (1946) Director since 2005
Dr. Senbet is the William E. Mayer Chair Professor of Finance at the University of Maryland, Robert H. Smith School of Business. He was chair of the Finance Department during 1998-2006. Previously he was an endowed professor of finance at the University of Wisconsin-Madison. Also, he was director of the Fortis Funds from March 2000-July 2002. Dr. Senbet served the finance profession in various capacities, including as director of the American Finance Association and President of the Western Finance Association. In 2006, Dr. Senbet was inducted Fellow of Financial Management Association International for his career-long distinguished scholarship and professional service.
Interested Directors and Officers
Lowndes A. Smith (1939) Director since 1996 (MF) and 2002 (MF2), Co-Chairman of the Investment Committee
Mr. Smith served as Vice Chairman of The Hartford from February 1997 to January 2002, as President and Chief Executive Officer of Hartford Life, Inc. from February 1997 to January 2002, and as President and Chief Operating Officer of The Hartford Life Insurance Companies from January 1989 to January 2002. Mr. Smith serves as a Director of White Mountains Insurance Group, Ltd., One Beacon Insurance, Symetra Financial and as a Managing Director of Whittington Gray Associates.
John C. Walters* (1962) Director since 2008
Mr. Walters currently serves as President, Chief Executive Officer and Director for Hartford Life, Inc. (“HL, Inc.”). Mr. Walters also serves as President, Chairman of the Board, Chief Executive Officer and Director for Hartford Life Insurance Company (“Hartford Life”), and as Executive Vice President of The Hartford Financial Services Group, Inc. (“The Hartford”). In addition, Mr. Walters is Manager of HL Investment Advisors, LLC (“HL Advisors”). Mr. Walters previously served as Co-Chief Operating Officer of Hartford Life (2007-2008), and as President of the U.S. Wealth Management Division of HL, Inc. (2006-2007). Mr. Walters joined Hartford Life in April 2000 from First Union Securities, the brokerage subsidiary of First Union Corp.
| | |
| |
| * | | Mr. Walters previously served as President and Chief Executive Officer of the Fund (2007 – 2009). |
Other Officers
Robert M. Arena, Jr. (1968) President and Chief Executive Officer since 2009 (served as Vice President of the Fund (2006 – 2009))
Mr. Arena serves as Executive Vice President of Hartford Life. Additionally, Mr. Arena is Senior Vice President and Director of Hartford Administrative Services Company, (“HASCO”), President, Chief Executive Officer and Manager of Hartford Investment Financial Services, LLC (“HIFSCO”) and President, Chief Executive Officer and Manager of HL Advisors. Prior to joining The Hartford in 2004, he was Senior Vice President in charge of Product Management for American Skandia/Prudential in the individual annuities division.
Tamara L. Fagely (1958) Vice President, Treasurer and Controller since 2002 (MF) 1993 (MF2)
Ms. Fagely has been a Vice President of HASCO since 1998 and Chief Financial Officer since 2006. Currently Ms. Fagely is a Vice President of Hartford Life. In addition, Ms. Fagely is Controller and Chief Financial Officer of HIFSCO. She served as Assistant Vice President of Hartford Life from December 2001 through March 2005.
Brian Ferrell (1962) AML Compliance Officer since 2008
Mr. Ferrell has served as Assistant Vice President and AML Compliance Officer for The Hartford since 2006, and as AML Compliance Officer for HASCO and Hartford Investor Services Company, LLC (“HISC”) since 2008. Prior to joining The Hartford in 2006, Mr. Ferrell held various positions at the U.S. Department of the Treasury (the “Treasury”) from 2001 to 2006, where he served as Chief Counsel for the Treasury’s Financial Crimes Enforcement Network from 2005 – 2006.
Dr. Robert J. Froehlich (1953) Senior Managing Director since 2009
Dr. Froehlich joined The Hartford as Senior Managing Director in September 2009. Prior to joining The Hartford, Dr. Froehlich served as Vice Chairman of Deutsche Asset Management from 1997 – 2009.
28
Thomas D. Jones, III (1965) Vice President and Chief Compliance Officer since 2006
Mr. Jones serves as Chief Compliance Officer for the Hartford Mutual Funds and Vice President and Director of Securities Compliance for The Hartford. He is also Vice President of HIFSCO, HL Advisors, and Hartford Life. Mr. Jones joined The Hartford in 2006 from SEI Investments, where he served as Chief Compliance Officer for its mutual funds and investment advisers. Prior to joining SEI, Mr. Jones was First Vice President and Compliance Director for Merrill Lynch Investment Managers (Americas) (“MLIM”), where he worked from 1992-2004. At MLIM, Mr. Jones was responsible for the compliance oversight of various investment products, including mutual funds, wrap accounts, institutional accounts and alternative investments.
Edward P. Macdonald (1967) Vice President, Secretary and Chief Legal Officer since 2005
Mr. Macdonald serves as Assistant Vice President of Hartford Life and Chief Legal Officer, Secretary and Vice President of HIFSCO. He also serves as Vice President and Secretary of HASCO, and Chief Legal Officer, Secretary and Vice President of HL Advisors. Prior to joining The Hartford in 2005, Mr. Macdonald was Chief Counsel, Investment Management for Prudential Financial (formerly American Skandia Investment Services, Inc.). He joined Prudential in April 1999.
Vernon J. Meyer (1964) Vice President since 2006
Mr. Meyer serves as Senior Vice President of Hartford Life. He also serves as Senior Vice President of HIFSCO and HL Advisors. Mr. Meyer joined The Hartford in 2004 from MassMutual which he joined in 1987.
D. Keith Sloane (1960) Vice President since 2009
Mr. Sloane is a Senior Vice President of Hartford Life. Additionally, Mr. Sloane currently serves as Senior Vice President of HIFSCO, HL Advisors, and HASCO. Prior to joining The Hartford in 2007, Mr. Sloane was Director of product marketing and led the mutual fund business for Wachovia Securities (“Wachovia”) in their investment products group. Mr. Sloane joined Wachovia in 1995.
Jane Wolak (1961) Vice President since 2009
Ms. Wolak currently serves as Vice President of Hartford Life. Ms. Wolak joined Hartford Life as Vice President, Retail Product Services in May 2007. She is also Vice President of HASCO. Previously, Ms. Wolak was with Sun Life Financial where she held the position of Vice President, Service Center Operations from 2001 – 2007.
HOW TO OBTAIN A COPY OF THE FUND’S PROXY VOTING POLICIES AND VOTING RECORDS
A description of the policies and procedures that the Fund uses to determine how to vote proxies relating to portfolio securities and a record of how the Fund voted any proxies for the twelve-month period ended June 30, 2009 is available (1) without charge, upon request, by calling 888-843-7824 and (2) on the Securities and Exchange Commission’s website at http://www.sec.gov.
QUARTERLY PORTFOLIO HOLDINGS INFORMATION
The Fund files a complete schedule of portfolio holdings with the Commission for the first and third quarters of each fiscal year on Form N-Q. The Fund’s Forms are available (1) without charge, upon request, by calling 888-843-7824 and (2) on the Securities and Exchange Commission’s website at http://www.sec.gov. The Form N-Q may be reviewed and copied at the Commission’s Public Reference Room in Washington, DC. Information on the operation of the Public Reference Room may be obtained by calling 1-800-SEC-0330.
29
The Hartford U.S. Government Securities Fund
Federal Tax Information (Unaudited)
The information set forth below is for the Fund’s fiscal year as required by federal tax law. Shareholders, however, must report distributions on a calendar year basis for income tax purposes which may include distributions of two fiscal years of the Fund. Accordingly, the information needed by shareholders for income tax purposes will be sent to them in early 2010. Shareholders may wish to consult a tax advisor on how to report distributions for state and local purposes.
The income received from federal obligations is as follows:
| | | | | |
| U.S. Treasury* | | | 12.00 | % |
| Other Direct Federal Obligations* | | | 3.00 | % |
| Other Securities | | | 85.00 | % |
| | | | | |
| Total | | | 100.00 | % |
| | | | | |
| | | | | |
| QII† | | | 100.00 | % |
| | |
| * | | The income received from federal obligations. |
| |
| † | | Applicable for non-resident foreign shareholders only. This is the percentage of ordinary income distribution that is designated as interest-related dividends under Internal Revenue Code Section 871(k)(1)(C). |
Detailed below are the per share distributions made for the fiscal year ended October 31, 2009.
| | | | | | | | | | | | | | | | | |
| | | | | | | Short-Term | | Long-Term | | |
| | | Income | | Capital Gain | | Capital Gain | | Total |
| Class A | | | 0.287 | | | | N/A | | | | N/A | | | | 0.287 | |
| Class B | | | 0.221 | | | | N/A | | | | N/A | | | | 0.221 | |
| Class C | | | 0.220 | | | | N/A | | | | N/A | | | | 0.220 | |
| Class L | | | 0.299 | | | | N/A | | | | N/A | | | | 0.299 | |
| Class Y | | | 0.319 | | | | N/A | | | | N/A | | | | 0.319 | |
The Fund also designates as distributions of long-term gains, to the extent necessary to fully distribute such capital gains, earnings and profits distributed to shareholders on the redemption of shares.
30
The Hartford U.S. Government Securities Fund
Expense Example (Unaudited)
Your Fund’s Expenses
As a shareholder of the Fund, you incur two types of costs: (1) transaction costs, including sales charges (loads) on purchase payments and contingent deferred sales charges (CDSC) (2) ongoing costs including management fees; distribution fees; and other fund expenses. This example is intended to help you understand your ongoing costs (in dollars) of investing in the Fund and to compare these costs with the ongoing costs of investing in other mutual funds. The example is based on an investment of $1,000 invested at the beginning of the period and held for the period of April 30, 2009 through October 31, 2009.
Actual Expenses
The first set of columns of the table below provides information about actual account values and actual expenses. You may use the information in this column, together with the amount you invested, to estimate the expenses that you paid over the period. Simply divide your account value by $1,000 (for example, an $8,600 account value divided by $1,000 = 8.6), then multiply the result by the number in the line under the heading entitled “Expenses Paid During Period” to estimate the expenses you paid on your account during this period.
Hypothetical Example for Comparison Purposes
The second set of columns of the table below provides information about hypothetical account values and hypothetical expenses based on the Fund’s actual expense ratio and an assumed rate of return of 5% per year before expenses, which is not the Fund’s actual return. The hypothetical account values and expenses may not be used to estimate the actual ending account balance or expenses you paid for the period. You may use this information to compare the ongoing costs of investing in the Fund and other funds. To do so, compare this 5% hypothetical example with the 5% hypothetical examples that appear in the shareholder reports of the other funds.
Please note that the expenses shown in the table are meant to highlight your ongoing costs only and do not reflect any transactional costs, such as sales charges (loads) and CDSC. Therefore, the second set of columns of the table is useful in comparing ongoing costs only, and will not help you determine the relative total costs of owning different funds. In addition, if these transactional costs were included, your costs would be higher. Expenses are equal to the Fund’s annualized expense ratios multiplied by average account value over the period, multiplied by 184/365 (to reflect the one-half year period).
| | | | | | | | | | | | | | | | | | | | | | | | | | | | | | | | | | | | | | |
| | | Actual return | | | Hypothetical (5% return before expenses) | | | | | | | | |
| | | | | | | | | | | Expenses paid | | | | | | | | | | | Expenses paid | | | | | | Days in | | |
| | | | | | | | | | | during the period | | | | | | | | | | | during the period | | | | | | the | | Days |
| | | Beginning | | Ending Account | | April 30, 2009 | | | Beginning | | Ending Account | | April 30, | | Annualized | | current | | in the |
| | | Account Value | | Value | | through | | | Account Value | | Value | | 2009 through | | expense | | 1/2 | | full |
| | | April 30, 2009 | | October 31, 2009 | | October 31, 2009 | | | April 30, 2009 | | October 31, 2009 | | October 31, 2009 | | ratio | | year | | year |
| Class A | | $ | 1,000.00 | | | $ | 1,014.90 | | | $ | 5.08 | | | | $ | 1,000.00 | | | $ | 1,020.16 | | | $ | 5.09 | | | | 1.00 | % | | | 184 | | | | 365 | |
| Class B | | $ | 1,000.00 | | | $ | 1,010.10 | | | $ | 8.82 | | | | $ | 1,000.00 | | | $ | 1,016.43 | | | $ | 8.84 | | | | 1.74 | | | | 184 | | | | 365 | |
| Class C | | $ | 1,000.00 | | | $ | 1,010.00 | | | $ | 8.87 | | | | $ | 1,000.00 | | | $ | 1,016.38 | | | $ | 8.89 | | | | 1.75 | | | | 184 | | | | 365 | |
| Class L | | $ | 1,000.00 | | | $ | 1,014.40 | | | $ | 4.52 | | | | $ | 1,000.00 | | | $ | 1,020.72 | | | $ | 4.53 | | | | 0.89 | | | | 184 | | | | 365 | |
| Class Y | | $ | 1,000.00 | | | $ | 1,015.50 | | | $ | 3.35 | | | | $ | 1,000.00 | | | $ | 1,021.88 | | | $ | 3.36 | | | | 0.66 | | | | 184 | | | | 365 | |
31
The Hartford U.S. Government Securities Fund
Approval of Investment Management and Investment Sub-Advisory Agreements (Unaudited)
Section 15(c) of the Investment Company Act of 1940, as amended (the “1940 Act”), requires that each mutual fund’s board of directors, including a majority of those directors who are not “interested persons” of the mutual fund, as defined in the 1940 Act (the “Independent Directors”), annually review and consider the continuation of the mutual fund’s investment advisory and sub-advisory agreements. At its meeting held on August 4-5, 2009, the Board of Directors (the “Board”) of The Hartford U.S. Government Securities Fund (the “Fund”), including each of the Independent Directors, unanimously voted to approve the continuation of the investment management agreement for the Fund with Hartford Investment Financial Services, LLC (“HIFSCO”) and the continuation of the investment sub-advisory agreement between HIFSCO and the Fund’s sub-adviser Hartford Investment Management Company (“Sub-adviser,” and together with HIFSCO, “Advisers”) (collectively, the “Agreements”).
In the months preceding the August 4-5, 2009 meeting, the Board requested, received, and reviewed written responses from the Advisers to questions posed to them on behalf of the Independent Directors and supporting materials relating to those questions and responses. The Board considered information furnished to the Board at its meetings throughout the year, as well as information specifically prepared in connection with the annual approval of the Agreements at the Board’s meetings held on June 23-24, 2009 and August 4-5, 2009. Information provided to the Board at its meetings throughout the year, included, among other things, reports on Fund performance, legal and compliance matters, sales and marketing activity, shareholder services, and the other services provided to the Fund by the Advisers, and their affiliates. In addition, the Board received in-person presentations by Fund officers and representatives of HIFSCO at the Board’s meetings on June 23-24, 2009 and August 4-5, 2009 concerning the Agreements.
The Independent Directors, advised by independent legal counsel, engaged two service providers to assist them with evaluating the Agreements with respect to the Fund. Lipper Inc. (“Lipper”), an independent provider of investment company data, was retained to provide the Board with reports on how the Fund’s contractual management fees, actual management fees, other non-management fees, overall expense ratios and investment performance compared to those of mutual funds with similar investment objectives. The Independent Directors also engaged an independent financial services consulting firm (the “Consultant”) to assist them in evaluating the Fund’s management fees, sub-advisory fees, other non-management fees, overall expense ratios and investment performance. In addition, the Consultant reviewed the profitability calculations utilized by HIFSCO in connection with the continuation of the investment management agreement.
In determining to continue the Agreements for the Fund, the members of the Board reviewed and evaluated information and factors they believed to be relevant and appropriate in light of the information that the Board deemed necessary and appropriate and through the exercise of their reasonable business judgment. While individual members of the Board may have weighed certain factors differently, the Board’s determination to continue the Agreements was based on a comprehensive consideration of all information provided to the Board throughout the year and specifically with respect to the continuation of the Agreements. A more detailed discussion of the factors the Board considered with respect to its approval of the Agreements is provided below.
Nature, Extent And Quality Of Services Provided by the Advisers
The Board requested and considered information concerning the nature, extent, and quality of the services provided to the Fund by the Advisers. The Board considered, among other things, the terms of the Agreements and the range of services provided by the Advisers. In this regard, the Board considered information provided to it by HIFSCO concerning the Agreements, which were amended and restated to more completely reflect the services provided to the Fund, but did not result in a material amendment to the Fund’s prior contractual arrangement. The Board considered the Advisers’ professional personnel who provide services to the Fund, including each Adviser’s ability and experience in attracting and retaining qualified personnel to service the Fund. The Board considered each Adviser’s reputation and overall financial strength, as well as its willingness to consider and implement organizational and operational changes designed to improve services to the Fund. In addition, the Board considered the quality of each Adviser’s communications with the Board and responsiveness to Board inquiries.
The Board also requested and evaluated information concerning each Adviser’s regulatory and compliance environment. In this regard, the Board requested and reviewed information on each Adviser’s compliance policies and procedures, compliance history, and a report from the Fund’s Chief Compliance Officer on each Adviser’s compliance with applicable laws and regulations, including responses to regulatory developments and compliance issues raised by regulators. The Board also noted the Advisers’ support of the Fund’s compliance control structure, particularly the resources devoted by the Advisers in support of the Fund’s obligations pursuant to Rule 38a-1 under the 1940 Act.
With respect to HIFSCO, the Board noted that under the Agreements, HIFSCO is responsible for the management of the Fund, including overseeing fund operations and service providers and provides administration services to the Fund as well as investment advisory services in connection with selecting, monitoring and supervising the Sub-adviser. The Board considered HIFSCO’s constant monitoring of people, process and performance, including its ongoing commitment to review and rationalize The Hartford Fund Family’s product line-up. The Board considered that HIFSCO or its affiliates are responsible for providing the Fund’s officers and paying their salaries and expenses.
32
With respect to the Sub-adviser, who provides day-to-day portfolio management services, the Board considered the quality of the Fund’s portfolio managers, the Sub-adviser’s other investment personnel, its investment philosophy and process, investment research capabilities and resources, performance record, trade execution capabilities and experience. The Board considered the experience of the Fund’s portfolio managers, the number of accounts managed by the portfolio managers, and the Sub-adviser’s method for compensating the portfolio managers.
Based on these considerations, the Board concluded that it was satisfied with the nature, extent and quality of the services provided to the Fund by HIFSCO and the Sub-adviser.
Performance of the Fund and the Advisers
The Board considered the investment performance of the Fund. In this regard, the Board reviewed the performance of the Fund over different time periods presented in the materials and evaluated HIFSCO’s analysis of the Fund’s performance for these time periods. The Board considered information and materials provided to the Board by the Advisers concerning Fund performance, as well as information from Lipper comparing the investment performance of the Fund to an appropriate universe of peer funds.
The Board considered the detailed investment analytics reports provided by The Hartford’s Investment Advisory Group throughout the year. These reports include, among other things, information on the Fund’s gross and net returns, the Fund’s investment performance relative to an appropriate benchmark and peer group, various statistics concerning the Fund’s portfolio, and a narrative summary of various factors affecting Fund performance. The Board considered the Advisers’ cooperation with the Investment Committee, which assists the Board in evaluating the performance of the Fund at periodic meetings throughout the year. The Board also considered the analysis provided by the Consultant relating to the Fund’s performance track record. The Board considered information indicating that the Fund has underperformed relative to its peers or benchmark and the causes of the underperformance. The Board noted HIFSCO’s and the Sub-adviser’s plans to address performance going forward.
In light of all the considerations noted above, the Board concluded that it had continued confidence in HIFSCO’s and the Sub-adviser’s overall capabilities to manage the Fund.
Costs of the Services and Profitability of the Advisers
The Board reviewed information regarding HIFSCO’s cost to provide investment management and related services to the Fund and HIFSCO’s profitability, both overall and for the Fund, on a pre-tax basis without regard to distribution expenses. The Board also requested and reviewed information about the profitability to HIFSCO and its affiliates from all services provided to the Fund and all aspects of their relationship with the Fund. The Board noted that the fees payable to the Sub-adviser are equal to its estimated costs in providing sub-advisory services. Accordingly, the costs and profitability for the Sub-adviser and HIFSCO were considered in the aggregate.
The Board considered the Consultant’s review of the profitability calculations utilized by HIFSCO in connection with the continuation of the investment management agreement. In this regard, the Consultant reported that The Hartford’s process for calculating and reporting Fund profitability is reasonable, sound and well within common industry practice.
Based on these considerations, the Board concluded that the profits anticipated to be realized by the Advisers and their affiliates from their relationships with the Fund would not be excessive.
Comparison of Fees and Services Provided by the Advisers
The Board considered comparative information with respect to the investment management fees to be paid by the Fund to HIFSCO, the investment sub-advisory fees to be paid by HIFSCO to the Sub-adviser, and the total expense ratios of the Fund. In this regard, the Board requested and reviewed information from HIFSCO and the Sub-adviser relating to the management and sub-advisory fees, and total operating expenses for the Fund. The Board also reviewed information from Lipper comparing the Fund’s contractual management fees, actual management fees and overall expense ratios, relative to a group of funds selected by Lipper, in consultation with the Consultant (“Expense Group”), and a broader universe of funds selected by Lipper (“Expense Universe”). The Board considered that as of November 1, 2009, transfer agency fees in excess of the transfer agency expense limitation amount (currently 0.30%) will be reimbursed by Hartford Administrative Services Company (“HASCO”) prior to the application of the Fund’s expense limitation by HIFSCO.
While the Board recognized that comparisons between the Fund and peer funds are imprecise, given the differing service levels and characteristics of mutual funds and the different business models and cost structures of the Advisers, the comparative information provided by Lipper assisted the Board in evaluating the reasonableness of the Fund’s management fees and total operating expenses. In
33
The Hartford U.S. Government Securities Fund
Approval of Investment Management and Investment Sub-Advisory Agreements (Unaudited) — (continued)
addition, the Board considered the analysis and recommendations of the Consultant relating to the Fund’s management and sub-advisory fees and total operating expenses.
Based on these considerations, the Board concluded that the Fund’s fees and total operating expenses, in conjunction with the information about quality of services, profitability, economies of scale, and other matters discussed, were reasonable in light of the services provided.
Economies of Scale
The Board requested and considered information regarding the Advisers’ realization of economies of scale with respect to the Fund, and whether the fee levels reflect these economies of scale for the benefit of the Fund’s investors. With respect to HIFSCO, the Board considered representations from HIFSCO that it is difficult to anticipate whether and the extent to which economies may be realized by HIFSCO as assets grow over time. The Board reviewed the breakpoints in the advisory fee schedule for the Fund, which reduces fees as Fund assets grow over time. The Board recognized that a fund with assets beyond the last breakpoint level will continue to benefit from economies of scale, because additional assets are charged the lowest breakpoint fee, resulting in lower overall effective management fee rates. The Board also considered that expense limitations and fee waivers that reduce the Fund’s expenses at all asset levels can have the same effect as breakpoints in sharing economies of scale with shareholders, and that a schedule that reaches a lower breakpoint quickly provides shareholders with the benefit of anticipated or potential economies of scale.
The Board reviewed and evaluated materials from Lipper showing how management fee schedules of peer funds reflect economies of scale for the benefit of investors as a peer fund’s assets hypothetically increase over time. Based on information provided by HIFSCO, Lipper, and the Consultant, the Board recognized that there is no uniform methodology for establishing breakpoints, or uniform pattern in asset levels that trigger breakpoints or the amounts of breakpoints triggered.
After considering all of the information available to it, the Board concluded that it was satisfied with the extent to which economies of scale would be shared for the benefit of the Fund’s shareholders, based on currently available information and the effective advisory fees and expense ratios for the Fund at its current and reasonably anticipated asset levels. The Board noted, however, that it would continue to monitor future growth in Fund assets and the appropriateness of additional breakpoints.
Other Benefits
The Board considered other benefits to the Advisers and their affiliates from their relationships with the Fund.
The Board reviewed information noting that Hartford Life, Inc. (“Hartford Life”) an affiliate of HIFSCO, receives fees for fund accounting and related services from the Fund, and the Board considered information on expected profits to Hartford Life or its affiliates for such services. The Board also considered that HASCO, the Fund’s transfer agent and an affiliate of HIFSCO, receives transfer agency compensation from the Fund, and the Board reviewed information on the expected profitability of the Fund’s transfer agency function to HASCO. The Board noted that HASCO is a recognized leader in providing high quality services to Fund shareholders and has received six consecutive mutual fund Dalbar service awards. The Board considered information provided by HASCO indicating that the transfer agent fees charged by HASCO to the Fund were fair and reasonable based on publicly available information.
The Board also considered that, as principal underwriter of the Fund, HIFSCO receives 12b-1 fees from the Fund and receives all or a portion of the sales charges on sales or redemptions of certain classes of shares. The Board also noted that certain affiliates of HIFSCO distribute shares of the Fund and receive compensation in that connection.
The Board considered any benefits to the Sub-adviser from any use of the Fund’s brokerage commissions to obtain soft dollar research.
The Board considered the benefits to shareholders of being part of the Hartford family of funds, including the right to exchange investments between the same class of funds without a sales charge, the ability to reinvest Fund dividends into other funds in the family, and the ability to combine holdings in the Fund with holdings in other funds to obtain a reduced sales charge. The Board considered HIFSCO’s efforts to provide investors in the family with a broad range of investment styles and asset classes and its entrepreneurial risk in initiating new funds to expand these opportunities for shareholders.
* * * *
Based upon its review of these various factors, among others, the Board concluded that it is in the best interests of the Fund and its shareholders for the Board to approve the Agreements for an additional year. In reaching this decision, the Board did not assign relative weights to the factors discussed above or deem any one or group of them to be controlling in and of themselves. In connection with their deliberations, the Independent Directors met separately in executive session on several occasions, with independent legal counsel, to review the relevant materials and consider their responsibilities under relevant laws and regulations.
34
This information is written in connection with the promotion or marketing of the matter(s) addressed in this material. The information cannot be used or relied upon for the purpose of avoiding IRS penalties. These materials are not intended to provide tax, accounting or legal advice. As with all matters of a tax or legal nature, you should consult your own tax or legal counsel for advice.
You should carefully consider investment objectives, risks, and charges and expenses of The Hartford Mutual Funds before investing. This and other information can be found in the Fund’s prospectus, which can be obtained from your investment representative or by calling 888-843-7824. Please read it carefully before you invest or send money.
The Hartford Mutual Funds are underwritten and distributed by Hartford Investment Financial Services, LLC.
“The Hartford” is The Hartford Financial Services Group, Inc., and its subsidiaries.
Mutual fund inception dates range from 1949 to date. The Hartford Mutual Funds are not a subsidiary of The Hartford but are underwritten, distributed by, and advised by subsidiaries of The Hartford. Investments in The Hartford Mutual Funds are not guaranteed by The Hartford or any other entity.
MFAR-49 12/09 MUT 8759 Printed in U.S.A. © 2009 The Hartford, Hartford, CT 06117
The Hartford Value Opportunities Fund
Table of Contents
| | | | | |
| Manager Discussions (Unaudited) | | | 2 | |
| |
| Financial Statements | | | | |
| |
| | | 4 | |
| |
| | | 7 | |
| |
| | | 8 | |
| |
| | | 9 | |
| |
| | | 10 | |
| |
| | | 11 | |
| |
| | | 22 | |
| |
| | | 24 | |
| |
| | | 25 | |
| |
| | | 27 | |
| |
| | | 27 | |
| |
| | | 28 | |
| |
| | | 29 | |
| |
| | | 30 | |
| | | |
The Hartford Value Opportunities Fund inception 01/02/1996
(subadvised by Wellington Management Company, LLP) | | Investment objective — Seeks capital appreciation. |
Performance Overview(1) 10/31/99-10/31/09
Growth of a $10,000 investment in Class A which includes Sales Charge
Russell 1000 Value Index is an unmanaged index measuring the performance of those Russell 1000 Index companies with lower price-to-book ratios and lowerforecasted growth values.
Russell 3000 Value Index is an unmanaged index measuring the performance of those Russell 3000 Index companies with lower price-to-book ratios and lowerforecasted growth values.
You cannot invest directly in an index.
The value of shares will fluctuate so that, when redeemed, shares may be worth more or less than their original cost. The chart and table do not reflect the deduction of taxes that a shareholder would pay on fund distributions or theredemption of fund shares.
Performance information may reflect historical or current expense waivers/reimbursements from the investment adviser, without which performance would have been lower. For information on current expense waivers/reimbursements, please see the prospectus.
Average Annual Total Returns(2,3,4,5) (as of 10/31/09)
| | | | | | | | | | | | | |
| | | 1 | | 5 | | 10 |
| | | Year | | Year | | Year |
| |
| Value Opportunities A# | | | 26.41 | % | | | -0.20 | % | | | 2.85 | % |
| Value Opportunities A## | | | 19.46 | % | | | -1.32 | % | | | 2.28 | % |
| Value Opportunities B# | | | 25.90 | % | | | -0.80 | % | | NA* |
| Value Opportunities B## | | | 20.90 | % | | | -1.09 | % | | NA* |
| Value Opportunities C# | | | 25.33 | % | | | -0.95 | % | | | 2.09 | % |
| Value Opportunities C## | | | 24.33 | % | | | -0.95 | % | | | 2.09 | % |
| Value Opportunities I# | | | 26.52 | % | | | -0.04 | % | | NA |
| Value Opportunities L# | | | 26.39 | % | | | -0.06 | % | | | 2.93 | % |
| Value Opportunities L## | | | 20.39 | % | | | -1.03 | % | | | 2.43 | % |
| Value Opportunities R3# | | | 25.82 | % | | | -0.27 | % | | NA |
| Value Opportunities R4# | | | 26.23 | % | | | -0.08 | % | | NA |
| Value Opportunities R5# | | | 26.62 | % | | | 0.10 | % | | NA |
| Value Opportunities Y# | | | 26.61 | % | | | 0.19 | % | | NA |
| Russell 1000 Value Index | | | 4.78 | % | | | -0.05 | % | | | 1.70 | % |
| Russell 3000 Value Index | | | 4.56 | % | | | -0.05 | % | | | 2.11 | % |
| | |
| # | | Without sales charge |
| |
| ## | | With sales charge |
| |
| NA | | Not Applicable |
| |
| * | | 10 year returns are not applicable for Class B because after 8 years Class B converts to Class A. |
PAST PERFORMANCE IS NOT INDICATIVE OF FUTURE RESULTS.
| (1) | | Growth of a $10,000 investment in Classes B, C, I, L, R3, R4, R5 and Y shares will vary from results seen above due to differences in the expenses charged to these share classes. |
| |
| (2) | | Classes A, B, C and Y shares were offered beginning on 2/19/02. Performance prior to that date for Class A is that of the fund’s Class L shares and for Classes B and C is that of the fund’s Classes M and N shares, respectively, which had lower operating expenses. Performance prior to 2/19/02 would have been lower if Classes A, B and C shares expenses were applied during that period. (Classes M and N shares are no longer offered.) Class I shares commenced operations on 8/31/06. Performance prior to 8/31/06 reflects Class A performance. Classes R3, R4 and R5 shares commenced operations on 12/22/06. Performance prior to 12/22/06 reflects Class Y performance. The Fund’s performance information prior to 4/1/01 reflects when the Fund was managed by a previous investment adviser. |
| |
| (3) | | The initial investment in Classes A and L shares reflects the maximum sales charge and Classes B and C reflect CDSC. |
| |
| (4) | | Total returns presented above were calculated using the Fund’s net asset value available to shareholders for sale or redemption of Fund shares on 10/31/09, which excludes investment transactions as of this date. |
| |
| (5) | | Effective 9/30/09, Class B shares of The Hartford Mutual Funds are closed to new investments. |
| | | | | |
Portfolio Managers | | | | |
| David R. Fassnacht, CFA | | James N. Mordy | | David W. Palmer, CFA |
| Senior Vice President, Partner | | Senior Vice President, Partner | | Vice President |
2
How did the Fund perform?
The Class A shares of The Hartford Value Opportunities Fund returned 26.41%, before sales charge, for the twelve-month period ended October 31, 2009, outperforming its benchmark, the Russell 3000 Value Index, which returned 4.56% for the same period. The Fund also outperformed the 13.66% return of the average fund in the Lipper Multi-Cap Value Fund peer group, a group of funds with investment strategies similar to those of the Fund.
Why did the Fund perform this way?
The broad U.S. equity markets rose during the period; however, the increase masks two significantly different market environments. From the beginning of November through early March 2009, stocks fell sharply, reflecting deepening economic worries and concerns over the U.S. government’s increasing involvement in the economy. From early March through the end of October 2009, stocks rallied as investors came to believe that a Depression-like scenario was less likely. While volatility in the equity market remains high, as measured by the VIX Index, we have seen an increasing acceptance by investors to embrace risk once again which has contributed to strong equity returns in recent months.
In this environment, mid cap stocks (18.2%) outperformed small (6.5%) and large cap stocks (9.8%), as measured by the S&P MidCap 400, Russell 2000 and S&P 500 Indexes, respectively. Growth stocks (17.0%) significantly outpaced Value stocks (4.6%) during the period, as measured by the Russell 3000 Growth index and Russell 3000 Value index, respectively. Within the Russell 3000 Value index, eight out of ten sectors posted positive returns. Information Technology, Consumer Discretionary and Materials were the strongest positive performers. Financials and Industrials posted negative returns during the period.
Strong stock selection was the primary driver of the Fund’s outperformance versus the benchmark. Security selection was strongest in Financials, Energy and Health Care. Sector allocation, a result of bottom-up (i.e. stock by stock fundamental research) stock selection, also contributed to the Fund’s relative (i.e. performance of the Fund as measured against the benchmark) performance. In particular, the overweight (i.e. the Fund’s sector position was greater than the benchmark position) positions in Information Technology and Financials helped relative returns positively.
The largest contributors to relative performance were TRW Automotive (Consumer Discretionary), Schering-Plough (Health Care), and Marine Harvest (Consumer Staples). Shares of auto parts supplier TRW Automotive advanced due to signs of stabilizing auto sales in the U.S. and Europe. The company amended its bank credit facility to ease covenant restrictions, addressing concerns that the company would violate interest coverage metrics. Shares of global health care company Schering-Plough rose following Merck’s announcement that they would acquire Schering-Plough through a combination of cash and stock. Salmon farming company Marine Harvest’s shares moved significantly higher as the global supply-demand balance tightened and fish prices increased. In addition, Wall Street’s concerns that the company would need to raise equity to repay debt abated as interest coverage metrics improved with rising product prices. In addition, Newfield Exploration was a strong contributor to absolute (i.e. total return) returns during the period.
The largest detractors from relative performance included U.S. Airways (Industrials), Delta Airlines (Industrials) and Capital One Financial (Financials). Shares of U.S. Airways and Delta Airlines fell as demand for air travel declined even faster than aggressive industry capacity cuts and a decline in high-fare business travel also affected revenue-per-seat metrics. Shares of Capital One Financial, a bank focused on the credit card consumer and auto loan markets, declined as delinquent and charged-off loan metrics worsened, and potentially tighter card industry regulation threatened to reduce profitability of the company’s business model. We sold our position in the stock during the period. In addition, our positions in Bank of America (Financials) and General Electric (Industrials) detracted from absolute returns.
What is the outlook?
We believe the strong equity market advance since March has narrowed many of the valuation metrics between stocks perceived as “risky” and “safe”, which had expanded to multi-decade extremes. We trimmed certain holdings into the rally which we believed no longer offer attractive risk-reward ratios. We maintain a positive bias towards economically sensitive companies at this point in the cycle, as consensus forecasts for many portfolio holdings embed an expectation of weak economic recovery which we feel sets up for potential positive revision and multiple expansion.
Against this backdrop, our largest overweights at the end of the period were in Information Technology, Health Care and Materials. Conversely, our largest underweights (i.e. the Fund’s sector position was less than the benchmark position) were in Telecommunication Services, Utilities and Consumer Discretionary.
Diversification by Industry
as of October 31, 2009
| | | | | |
| | | Percentage of |
| Industry (Sector) | | Net Assets |
| Automobiles & Components (Consumer Discretionary) | | | 0.4 | % |
| Banks (Financials) | | | 2.5 | |
| Capital Goods (Industrials) | | | 6.6 | |
| Consumer Durables & Apparel (Consumer Discretionary) | | | 0.6 | |
| Consumer Services (Consumer Discretionary) | | | 0.6 | |
| Diversified Financials (Financials) | | | 9.8 | |
| Energy (Energy) | | | 17.3 | |
| Food & Staples Retailing (Consumer Staples) | | | 2.4 | |
| Food, Beverage & Tobacco (Consumer Staples) | | | 3.2 | |
| Health Care Equipment & Services (Health Care) | | | 4.0 | |
| Insurance (Financials) | | | 11.8 | |
| Materials (Materials) | | | 5.7 | |
| Media (Consumer Discretionary) | | | 3.8 | |
| Pharmaceuticals, Biotechnology & Life Sciences (Health Care) | | | 6.6 | |
| Real Estate (Financials) | | | 1.3 | |
| Retailing (Consumer Discretionary) | | | 1.2 | |
| Semiconductors & Semiconductor Equipment (Information Technology) | | | 0.8 | |
| Software & Services (Information Technology) | | | 2.7 | |
| Technology Hardware & Equipment (Information Technology) | | | 8.4 | |
| Transportation (Industrials) | | | 4.2 | |
| Utilities (Utilities) | | | 3.8 | |
| Short-Term Investments | | | 2.5 | |
| Other Assets and Liabilities | | | (0.2 | ) |
| | | | | |
Total | | | 100.0 | % |
| | | | | |
3
The Hartford Value Opportunities Fund
Schedule of Investments
October 31, 2009
(000’s Omitted)
| | | | | | | |
| Shares or Principal Amount | | | | Market Value ╪ | |
| COMMON STOCKS - 97.7% | | | | |
| | | Automobiles & Components - 0.4% | | | | |
| 29 | | TRW Automotive Holdings Corp. • | | $ | 458 | |
| | | | | | |
| | | | | | | |
| | | Banks - 2.5% | | | | |
| 183 | | Popular, Inc. | | | 395 | |
| 94 | | Wells Fargo & Co. | | | 2,584 | |
| | | | | | |
| | | | | | 2,979 | |
| | | | | | |
| | | Capital Goods - 6.6% | | | | |
| 34 | | AMETEK, Inc. | | | 1,190 | |
| 31 | | Boeing Co. | | | 1,463 | |
| 13 | | Deere & Co. | | | 597 | |
| 37 | | Dover Corp. | | | 1,405 | |
| 10 | | General Dynamics Corp. | | | 639 | |
| 89 | | General Electric Co. | | | 1,275 | |
| 7 | | Lockheed Martin Corp. | | | 454 | |
| 31 | | Pentair, Inc. | | | 902 | |
| | | | | | |
| | | | | | 7,925 | |
| | | | | | |
| | | Consumer Durables & Apparel - 0.6% | | | | |
| 43 | | Toll Brothers, Inc. • | | | 738 | |
| | | | | | |
| | | | | | | |
| | | Consumer Services - 0.6% | | | | |
| 230 | | Thomas Cook Group plc | | | 769 | |
| | | | | | |
| | | | | | | |
| | | Diversified Financials - 9.8% | | | | |
| 68 | | Ameriprise Financial, Inc. | | | 2,368 | |
| 194 | | Bank of America Corp. | | | 2,830 | |
| 17 | | JP Morgan Chase & Co. | | | 698 | |
| 68 | | Oaktree Capital ■ • | | | 2,244 | |
| 111 | | PennantPark Investment Corp. | | | 858 | |
| 78 | | TD Ameritrade Holding Corp. • | | | 1,507 | |
| 68 | | UBS AG | | | 1,134 | |
| 11 | | UBS AG ADR | | | 179 | |
| | | | | | |
| | | | | | 11,818 | |
| | | | | | |
| | | Energy - 17.3% | | | | |
| 9 | | Apache Corp. | | | 866 | |
| 41 | | Baker Hughes, Inc. | | | 1,742 | |
| 17 | | Cameco Corp. | | | 449 | |
| 32 | | Canadian Natural Resources Ltd. ADR | | | 2,057 | |
| 50 | | Consol Energy, Inc. | | | 2,119 | |
| 23 | | Exxon Mobil Corp. | | | 1,655 | |
| 31 | | Halliburton Co. | | | 908 | |
| 59 | | Newfield Exploration Co. • | | | 2,412 | |
| 31 | | Noble Energy, Inc. | | | 2,021 | |
| 17 | | Overseas Shipholding Group, Inc. | | | 679 | |
| 17 | | Peabody Energy Corp. | | | 677 | |
| 40 | | SBM Offshore N.V | | | 757 | |
| 35 | | Total S.A. ADR | | | 2,123 | |
| 59 | | Tsakos Energy Navigation Ltd. | | | 910 | |
| 46 | | Weatherford International Ltd. • | | | 813 | |
| 14 | | XTO Energy, Inc. | | | 561 | |
| | | | | | |
| | | | | | 20,749 | |
| | | | | | |
| | | Food & Staples Retailing - 2.4% | | | | |
| 67 | | Kroger Co. | | | 1,557 | |
| 49 | | Sysco Corp. | | | 1,296 | |
| | | | | | |
| | | | | | 2,853 | |
| | | | | | |
| | | Food, Beverage & Tobacco - 3.2% | | | | |
| 13 | | BRF Brasil Foods S.A. ADR • | | | 643 | |
| 1,103 | | Chaoda Modern Agriculture | | | 852 | |
| — | | Japan Tobacco, Inc. | | | 1,335 | |
| 574 | | Marine Harvest • | | | 417 | |
| 19 | | Unilever N.V. NY Shares ADR | | | 590 | |
| | | | | | |
| | | | | | 3,837 | |
| | | | | | |
| | | Health Care Equipment & Services - 4.0% | | | | |
| 33 | | Cardinal Health, Inc. | | | 944 | |
| 20 | | CIGNA Corp. | | | 543 | |
| 26 | | Covidien plc | | | 1,099 | |
| 34 | | Medtronic, Inc. | | | 1,207 | |
| 38 | | UnitedHealth Group, Inc. | | | 996 | |
| | | | | | |
| | | | | | 4,789 | |
| | | | | | |
| | | Insurance - 11.8% | | | | |
| 56 | | ACE Ltd. | | | 2,867 | |
| 24 | | Everest Re Group Ltd. | | | 2,100 | |
| 87 | | Fidelity National Financial, Inc. | | | 1,183 | |
| 24 | | First American Financial Corp. | | | 733 | |
| 8 | | PartnerRe Ltd. | | | 642 | |
| 39 | | Platinum Underwriters Holdings Ltd. | | | 1,402 | |
| 28 | | Principal Financial Group, Inc. | | | 699 | |
| 46 | | Reinsurance Group of America, Inc. | | | 2,107 | |
| 92 | | Unum Group | | | 1,825 | |
| 2 | | White Mountains Insurance Group Ltd. | | | 568 | |
| | | | | | |
| | | | | | 14,126 | |
| | | | | | |
| | | Materials - 5.7% | | | | |
| 14 | | Barrick Gold Corp. | | | 496 | |
| 14 | | HeidelbergCement AG | | | 856 | |
| 25 | | Mosaic Co. | | | 1,187 | |
| 50 | | Owens-Illinois, Inc. • | | | 1,600 | |
| 295 | | Rexam plc | | | 1,337 | |
| 28 | | Vulcan Materials Co. | | | 1,289 | |
| | | | | | |
| | | | | | 6,765 | |
| | | | | | |
| | | Media - 3.8% | | | | |
| 140 | | Comcast Corp. Class A | | | 2,024 | |
| 131 | | Comcast Corp. Special Class A | | | 1,830 | |
| 54 | | Virgin Media, Inc. | | | 756 | |
| | | | | | |
| | | | | | 4,610 | |
| | | | | | |
| | | Pharmaceuticals, Biotechnology & Life Sciences - 6.6% | | | | |
| 65 | | Alkermes, Inc. • | | | 520 | |
| 32 | | Daiichi Sankyo Co., Ltd. | | | 615 | |
| 22 | | Genzyme Corp. • | | | 1,128 | |
| 155 | | Impax Laboratories, Inc. • | | | 1,376 | |
| 125 | | King Pharmaceuticals, Inc. • | | | 1,263 | |
| 173 | | Pfizer, Inc. | | | 2,941 | |
| | | | | | |
| | | | | | 7,843 | |
| | | | | | |
| | | Real Estate - 1.3% | | | | |
| 42 | | BR Malls Participacoes S.A. • | | | 448 | |
| 127 | | Chimera Investment Corp. | | | 443 | |
| 45 | | Iguatemi Emp de Shopping | | | 664 | |
| | | | | | |
| | | | | | 1,555 | |
| | | | | | |
| | | Retailing - 1.2% | | | | |
| 58 | | Home Depot, Inc. | | | 1,450 | |
| | | | | | |
| | | | | | | |
| | | Semiconductors & Semiconductor Equipment - 0.8% | | | | |
| 32 | | Varian Semiconductor Equipment Associates, Inc. • | | | 903 | |
| | | | | | |
| | | | | | | |
| | | Software & Services - 2.7% | | | | |
| 12 | | CACI International, Inc. Class A • | | | 581 | |
| 95 | | Microsoft Corp. | | | 2,634 | |
| | | | | | |
| | | | | | 3,215 | |
| | | | | | |
The accompanying notes are an integral part of these financial statements.
4
| | | | | | | | | | | | | | | |
| Shares or Principal Amount | | | | | | | Market Value ╪ | |
| COMMON STOCKS - 97.7% — (continued) | | | | | | | | |
| | | | | | | Technology Hardware & Equipment - 8.4% | | | | | | | | |
| | | | 64 | | | Arrow Electronics, Inc. • | | | | | | $ | 1,614 | |
| | | | 27 | | | Avnet, Inc. • | | | | | | | 674 | |
| | | | 114 | | | Cisco Systems, Inc. • | | | | | | | 2,612 | |
| | | | 106 | | | Corning, Inc. | | | | | | | 1,543 | |
| | | | 86 | | | Emulex Corp. • | | | | | | | 867 | |
| | | | 214 | | | Flextronics International Ltd. • | | | | | | | 1,386 | |
| | | | 129 | | | JDS Uniphase Corp. • | | | | | | | 719 | |
| | | | 74 | | | Solar Cayman Ltd. ⌂ • † | | | | | | | 599 | |
| | | | | | | | | | | | | | |
| | | | | | | | | | | | | | 10,014 | |
| | | | | | | | | | | | | | |
| | | | | | | Transportation - 4.2% | | | | | | | | |
| | | | 310 | | | Delta Air Lines, Inc. • | | | | | | | 2,211 | |
| | | | 38 | | | TNT N.V. | | | | | | | 1,010 | |
| | | | 26 | | | United Parcel Service, Inc. Class B | | | | | | | 1,406 | |
| | | | 143 | | | US Airways Group, Inc. • | | | | | | | 439 | |
| | | | | | | | | | | | | | |
| | | | | | | | | | | | | | 5,066 | |
| | | | | | | | | | | | | | |
| | | | | | | Utilities - 3.8% | | | | | | | | |
| | | | 61 | | | Allegheny Energy, Inc. | | | | | | | 1,383 | |
| | | | 29 | | | Entergy Corp. | | | | | | | 2,217 | |
| | | | 9 | | | FirstEnergy Corp. | | | | | | | 403 | |
| | | | 23 | | | Northeast Utilities | | | | | | | 539 | |
| | | | | | | | | | | | | | |
| | | | | | | | | | | | | | 4,542 | |
| | | | | | | | | | | | | | |
| | | | | | | | | | | | | | | |
| | | | | | | Total common stocks
(cost $120,021) | | | | | | $ | 117,004 | |
| | | | | | | | | | | | | | |
| | | | | | | | | | | | | | | |
| | | | | | | Total long-term investments
(cost $120,021) | | | | | | $ | 117,004 | |
| | | | | | | | | | | | | | |
| | | | | | | | | | | | | | | |
| SHORT-TERM INVESTMENTS - 2.5% | | | | | | | | |
| | | | | | | Repurchase Agreements - 2.5% | | | | | | | | |
| | | | | | | Banc of America Securities TriParty Joint Repurchase Agreement (maturing on 11/02/2009 in the amount of $120, collateralized by GNMA 5.00%, 2039, value of $122) | | | | | | | | |
| $ | | | 120 | | | 0.08%, 10/30/2009 | | | | | | $ | 120 | |
| | | | | | | BNP Paribas Securities Corp. TriParty Joint Repurchase Agreement (maturing on 11/02/2009 in the amount of $702, collateralized by FHLMC 4.00% - 7.00%, 2011 - 2039, FNMA 4.00% - 7.00%, 2017 - 2047, value of $716) | | | | | | | | |
| | | | 702 | | | 0.08%, 10/30/2009 | | | | | | | 702 | |
| | | | | | | Deutsche Bank Securities TriParty Joint Repurchase Agreement (maturing on 11/02/2009 in the amount of $782, collateralized by FHLMC 6.00%, 2036, FNMA 7.00%, 2038, value of $797) | | | | | | | | |
| | | | 781 | | | 0.08%, 10/30/2009 | | | | | | | 781 | |
| | | | | | | UBS Securities, Inc. Joint Repurchase Agreement (maturing on 11/02/2009 in the amount of $8, collateralized by U.S. Treasury Note 2.75%, 2013, value of $8) | | | | | | | | |
| | | | 8 | | | 0.05%, 10/30/2009 | | | | | | | 8 | |
| | | | | | | UBS Securities, Inc. TriParty Joint Repurchase Agreement (maturing on 11/02/2009 in the amount of $1,354, collateralized by FNMA 4.00% - 7.50%, 2016 - 2048, value of $1,381) | | | | | | | | |
| | | | 1,354 | | | 0.07%, 10/30/2009 | | | | | | | 1,354 | |
| | | | | | | | | | | | | | |
| | | | | | | | | | | | | | 2,965 | |
| | | | | | | | | | | | | | |
| | | | | | | | | | | | | | | |
| | | | | | | Total short-term investments
(cost $2,965) | | | | | | $ | 2,965 | |
| | | | | | | | | | | | | | |
| | | | | | | Total investments
(cost $122,986) ▲ | | | 100.2 | % | | $ | 119,969 | |
| | | | | | | Other assets and liabilities | | | (0.2 | )% | | | (251 | ) |
| | | | | | | | | | | | | |
| | | | | | | Total net assets | | | 100.0 | % | | $ | 119,718 | |
| | | | | | | | | | | | | |
| | |
| |
| Note: | | Percentage of investments as shown is the ratio of the total market value to total net assets. Market value of investments in foreign securities represents 14.5% of total net assets at October 31, 2009. |
| |
| | | Foreign securities that are principally traded on certain foreign markets are adjusted daily pursuant to a third party pricing service methodology approved by the Board of Directors in order to reflect an adjustment for factors occurring after the close of the foreign market but before the close of the New York Stock Exchange. |
| |
| ▲ | | At October 31, 2009, the cost of securities for federal income tax purposes was $125,094 and the aggregate gross unrealized appreciation and depreciation based on that cost were: |
| | | | | |
| Unrealized Appreciation | | $ | 10,191 | |
| Unrealized Depreciation | | | (15,316 | ) |
| | | | |
| Net Unrealized Depreciation | | $ | (5,125 | ) |
| | | | |
| | |
| † | | The aggregate value of securities valued in good faith at fair value as determined under policies and procedures established by and under the supervision of the Fund’s Board of Directors at October 31, 2009, was $599, which represents 0.50% of total net assets. This amount excludes securities that are principally traded in certain foreign markets and whose prices are adjusted pursuant to a third party pricing service methodology approved by the Board of Directors. |
| |
| • | | Currently non-income producing. |
| |
| ■ | | Securities issued within terms of a private placement memorandum, exempt from registration under Rule 144A under the Securities Act of 1933, as amended, and may be sold only to qualified institutional buyers. Pursuant to guidelines adopted by the Board of Directors, these issues are determined to be liquid. The aggregate value of these securities at October 31, 2009, was $2,244, which represents 1.87% of total net assets. |
The accompanying notes are an integral part of these financial statements.
5
The Hartford Value Opportunities Fund
Schedule of Investments — (continued)
October 31, 2009
(000’s Omitted)
| ⌂ | | The following securities are considered illiquid. Illiquid securities are often purchased in private placement transactions, are often not registered under the Securities Act of 1933 and may have contractual restrictions on resale. A security may also be considered illiquid if the security lacks a readily available market or if its valuation has not changed for a certain period of time. |
| | | | | | | | | | | |
| Period | | Shares/ | | | | |
| Acquired | | Par | | Security | | Cost Basis |
| |
| 03/2007 | | | 74 | | | Solar Cayman Ltd. - 144A | | $ | 978 | |
The aggregate value of these securities at October 31, 2009 was $599 which represents 0.50% of total net assets.
Forward Foreign Currency Contracts Outstanding at October 31, 2009
| | | | | | | | | | | | | | | | | |
| | | | | | | | | | | | | | | Unrealized | |
| | | Market | | | Contract | | | Delivery | | | Appreciation/ | |
| Description | | Value ╪ | | | Amount | | | Date | | | (Depreciation) | |
| Japanese Yen (Buy) | | $ | 149 | | | $ | 147 | | | | 11/02/09 | | | $ | 2 | |
| Japanese Yen (Buy) | | | 191 | | | | 190 | | | | 11/04/09 | | | | 1 | |
| Japanese Yen (Buy) | | | 127 | | | | 126 | | | | 11/05/09 | | | | 1 | |
| | | | | | | | | | | | | | | | |
| | | | | | | | | | | | | | | $ | 4 | |
| | | | | | | | | | | | | | | | |
| | |
| ╪ | | See Significant Accounting Policies of accompanying Notes to Financial Statements regarding valuation of securities. |
The accompanying notes are an integral part of these financial statements.
6
The Hartford Value Opportunities Fund
Investment Valuation Hierarchy Level Summary
October 31, 2009
(000’s Omitted)
| | | | | | | | | | | | | | | | | |
| | | Total | | | Level 1 | | | Level 2 | | | Level 3 | |
Assets: | | | | | | | | | | | | | | | | |
| Common Stocks | | | | | | | | | | | | | | | | |
| Automobiles & Components | | $ | 458 | | | $ | 458 | | | $ | — | | | $ | — | |
| Banks | | | 2,979 | | | | 2,979 | | | | — | | | | — | |
| Capital Goods | | | 7,925 | | | | 7,925 | | | | — | | | | — | |
| Consumer Durables & Apparel | | | 738 | | | | 738 | | | | — | | | | — | |
| Consumer Services | | | 769 | | | | — | | | | 769 | | | | — | |
| Diversified Financials | | | 11,818 | | | | 8,440 | | | | 1,134 | | | | 2,244 | |
| Energy | | | 20,749 | | | | 19,992 | | | | 757 | | | | — | |
| Food & Staples Retailing | | | 2,853 | | | | 2,853 | | | | — | | | | — | |
| Food, Beverage & Tobacco | | | 3,837 | | | | 1,233 | | | | 2,604 | | | | — | |
| Health Care Equipment & Services | | | 4,789 | | | | 4,789 | | | | — | | | | — | |
| Insurance | | | 14,126 | | | | 14,126 | | | | — | | | | — | |
| Materials | | | 6,765 | | | | 4,572 | | | | 2,193 | | | | — | |
| Media | | | 4,610 | | | | 4,610 | | | | — | | | | — | |
| Pharmaceuticals, Biotechnology & Life Sciences | | | 7,843 | | | | 7,228 | | | | 615 | | | | — | |
| Real Estate | | | 1,555 | | | | 1,555 | | | | — | | | | — | |
| Retailing | | | 1,450 | | | | 1,450 | | | | — | | | | — | |
| Semiconductors & Semiconductor Equipment | | | 903 | | | | 903 | | | | — | | | | — | |
| Software & Services | | | 3,215 | | | | 3,215 | | | | — | | | | — | |
| Technology Hardware & Equipment | | | 10,014 | | | | 9,415 | | | | — | | | | 599 | |
| Transportation | | | 5,066 | | | | 4,056 | | | | 1,010 | | | | — | |
| Utilities | | | 4,542 | | | | 4,542 | | | | — | | | | — | |
| | | | | | | | | | | | | |
Total | | | 117,004 | | | | 105,079 | | | | 9,082 | | | | 2,843 | |
| | | | | | | | | | | | | |
| Short-Term Investments | | | 2,965 | | | | — | | | | 2,965 | | | | — | |
| | | | | | | | | | | | | |
Total | | $ | 119,969 | | | $ | 105,079 | | | $ | 12,047 | | | $ | 2,843 | |
| | | | | | | | | | | | | |
| Other Financial Instruments * | | $ | 4 | | | $ | — | | | $ | 4 | | | $ | — | |
| | | | | | | | | | | | | |
| | |
| * | | Other financial instruments are derivative instruments not reflected in the Schedule of Investments, such as futures, forwards and swap contracts, which are valued at the unrealized appreciation/depreciation on the investment. |
Following is a reconciliation of Level 3 assets for which significant unobservable inputs were used to determine fair value:
| | | | | | | | | | | | | | | | | | | | | | | | | |
| | | Balance as of | | | | | | Change in | | | | | | Transfers In | | Balance as of |
| | | October 31, | | Realized Gain | | Unrealized | | | | | | and/or Out of | | October 31, |
| | | 2008 | | (Loss) | | Appreciation | | Net Sales | | Level 3 | | 2009 |
| | | |
Assets: | | | | | | | | | | | | | | | | | | | | | | | | |
| Common Stock | | $ | 4,649 | | | $ | (270 | ) | | $ | 841 | * | | $ | (293 | ) | | $ | (2,084 | ) | | $ | 2,843 | |
| | | |
| Total | | $ | 4,649 | | | $ | (270 | ) | | $ | 841 | | | $ | (293 | ) | | $ | (2,084 | ) | | $ | 2,843 | |
| | | |
| | |
| * | | Change in unrealized gains or losses in the current period relating to assets still held at October 31, 2009 was $841. |
The accompanying notes are an integral part of these financial statements.
7
The Hartford Value Opportunities Fund
Statement of Assets and Liabilities
October 31, 2009
(000’s Omitted)
| | | | | |
Assets: | | | | |
| Investments in securities, at market value (cost $122,986) | | $ | 119,969 | |
| Cash | | | 1 | |
| Unrealized appreciation on forward foreign currency contracts | | | 4 | |
| Receivables: | | | | |
| Investment securities sold | | | 1,625 | |
| Fund shares sold | | | 340 | |
| Dividends and interest | | | 61 | |
| Other assets | | | 65 | |
| | | | |
| Total assets | | | 122,065 | |
| | | | |
Liabilities: | | | | |
| Unrealized depreciation on forward foreign currency contracts | | | — | |
| Payables: | | | | |
| Investment securities purchased | | | 2,079 | |
| Fund shares redeemed | | | 191 | |
| Investment management fees | | | 16 | |
| Distribution fees | | | 7 | |
| Accrued expenses | | | 54 | |
| | | | |
| Total liabilities | | | 2,347 | |
| | | | |
| Net assets | | $ | 119,718 | |
| | | | |
Summary of Net Assets: | | | | |
| Capital stock and paid-in-capital | | | 208,658 | |
| Accumulated undistributed net investment income | | | 495 | |
| Accumulated net realized loss on investments and foreign currency transactions | | | (86,418 | ) |
| Unrealized depreciation of investments | | | (3,017 | ) |
| | | | |
| Net assets | | $ | 119,718 | |
| | | | |
| | | | | |
| Shares authorized | | | 27,000,000 | |
| | | | |
| Par value | | $ | 0.0001 | |
| | | | |
Class A: Net asset value per share/Maximum offering price per share | | $ | 10.19/$10.78 | |
| | | | |
| Shares outstanding | | | 6,631 | |
| | | | |
| Net assets | | $ | 67,577 | |
| | | | |
Class B: Net asset value per share | | $ | 9.21 | |
| | | | |
| Shares outstanding | | | 858 | |
| | | | |
| Net assets | | $ | 7,903 | |
| | | | |
Class C: Net asset value per share | | $ | 9.18 | |
| | | | |
| Shares outstanding | | | 1,106 | |
| | | | |
| Net assets | | $ | 10,158 | |
| | | | |
Class I: Net asset value per share | | $ | 10.09 | |
| | | | |
| Shares outstanding | | | 140 | |
| | | | |
| Net assets | | $ | 1,416 | |
| | | | |
Class L: Net asset value per share/Maximum offering price per share | | $ | 10.20/$10.71 | |
| | | | |
| Shares outstanding | | | 2,071 | |
| | | | |
| Net assets | | $ | 21,122 | |
| | | | |
Class R3: Net asset value per share | | $ | 10.30 | |
| | | | |
| Shares outstanding | | | 76 | |
| | | | |
| Net assets | | $ | 784 | |
| | | | |
Class R4: Net asset value per share | | $ | 10.37 | |
| | | | |
| Shares outstanding | | | 342 | |
| | | | |
| Net assets | | $ | 3,551 | |
| | | | |
Class R5: Net asset value per share | | $ | 10.43 | |
| | | | |
| Shares outstanding | | | 1 | |
| | | | |
| Net assets | | $ | 12 | |
| | | | |
Class Y: Net asset value per share | | $ | 10.47 | |
| | | | |
| Shares outstanding | | | 687 | |
| | | | |
| Net assets | | $ | 7,195 | |
| | | | |
The accompanying notes are an integral part of these financial statements.
8
The Hartford Value Opportunities Fund
Statement of Operations
For the Year Ended October 31, 2009
(000’s Omitted)
| | | | | |
Investment Income: | | | | |
| Dividends | | $ | 1,951 | |
| Interest | | | 3 | |
| Securities lending | | | 4 | |
| Less: Foreign tax withheld | | | (43 | ) |
| | | | |
| Total investment income | | | 1,915 | |
| | | | |
| | | | | |
Expenses: | | | | |
| Investment management fees | | | 811 | |
| Administrative services fees | | | 5 | |
| Transfer agent fees | | | 353 | |
| Distribution fees | | | | |
| Class A | | | 142 | |
| Class B | | | 72 | |
| Class C | | | 95 | |
| Class L | | | 47 | |
| Class R3 | | | 4 | |
| Class R4 | | | 6 | |
| Custodian fees | | | 13 | |
| Accounting services fees | | | 14 | |
| Registration and filing fees | | | 92 | |
| Board of Directors’ fees | | | 5 | |
| Audit fees | | | 10 | |
| Other expenses | | | 40 | |
| | | | |
| Total expenses (before waivers and fees paid indirectly) | | | 1,709 | |
| Expense waivers | | | (259 | ) |
| Transfer agent fee waivers | | | (130 | ) |
| Commission recapture | | | (11 | ) |
| Custodian fee offset | | | — | |
| | | | |
| Total waivers and fees paid indirectly | | | (400 | ) |
| | | | |
| Total expenses, net | | | 1,309 | |
| | | | |
Net Investment Income | | | 606 | |
| | | | |
Net Realized Loss on Investments and Foreign Currency Transactions: | | | | |
| Net realized loss on investments in securities | | | (35,402 | ) |
| Net realized loss on forward foreign currency contracts | | | (228 | ) |
| Net realized gain on other foreign currency transactions | | | 30 | |
| | | | |
Net Realized Loss on Investments and Foreign Currency Transactions | | | (35,600 | ) |
| | | | |
Net Changes in Unrealized Appreciation of Investments and Foreign Currency Transactions: | | | | |
| Net unrealized appreciation of investments | | | 56,229 | |
| Net unrealized appreciation of forward foreign currency contracts | | | 192 | |
| Net unrealized depreciation on translation of other assets and liabilities in foreign currencies | | | (4 | ) |
| | | | |
Net Changes in Unrealized Appreciation of Investments and Foreign Currency Transactions | | | 56,417 | |
| | | | |
Net Gain on Investments and Foreign Currency Transactions | | | 20,817 | |
| | | | |
Net Increase in Net Assets Resulting from Operations | | $ | 21,423 | |
| | | | |
The accompanying notes are an integral part of these financial statements.
9
The Hartford Value Opportunities Fund
Statement of Changes in Net Assets
(000’s Omitted)
| | | | | | | | | |
| | | For the | | | For the | |
| | | Year Ended | | | Year Ended | |
| | | October 31, 2009 | | | October 31, 2008 | |
Operations: | | | | | | | | |
| Net investment income | | $ | 606 | | | $ | 1,208 | |
| Net realized loss on investments and foreign currency transactions | | | (35,600 | ) | | | (50,072 | ) |
| Net unrealized appreciation (depreciation) of investments and foreign currency transactions | | | 56,417 | | | | (72,198 | ) |
| | | | | | | |
Net Increase (Decrease) In Net Assets Resulting From Operations | | | 21,423 | | | | (121,062 | ) |
| | | | | | | |
Distributions to Shareholders: | | | | | | | | |
| From net investment income | | | | | | | | |
| Class A | | | (1,018 | ) | | | (465 | ) |
| Class B | | | (95 | ) | | | — | |
| Class C | | | (73 | ) | | | — | |
| Class I | | | (22 | ) | | | (30 | ) |
| Class L | | | (402 | ) | | | (198 | ) |
| Class R3 | | | (12 | ) | | | (2 | ) |
| Class R4 | | | (41 | ) | | | (7 | ) |
| Class R5 | | | — | | | | — | |
| Class Y | | | (82 | ) | | | (198 | ) |
| From net realized gain on investments | | | | | | | | |
| Class A | | | — | | | | (22,278 | ) |
| Class B | | | — | | | | (3,201 | ) |
| Class C | | | — | | | | (5,032 | ) |
| Class I | | | — | | | | (676 | ) |
| Class L | | | — | | | | (6,052 | ) |
| Class R3 | | | — | | | | (12 | ) |
| Class R4 | | | — | | | | (123 | ) |
| Class R5 | | | — | | | | (1 | ) |
| Class Y | | | — | | | | (3,723 | ) |
| | | | | | | |
| Total distributions | | | (1,745 | ) | | | (41,998 | ) |
| | | | | | | |
Capital Share Transactions: | | | | | | | | |
| Class A | | | (4,136 | ) | | | (11,937 | ) |
| Class B | | | (1,211 | ) | | | (1,845 | ) |
| Class C | | | (2,757 | ) | | | (3,812 | ) |
| Class I | | | 77 | | | | (1,332 | ) |
| Class L | | | (2,335 | ) | | | 897 | |
| Class R3 | | | (44 | ) | | | 916 | |
| Class R4 | | | 1,077 | | | | 2,441 | |
| Class R5 | | | 5 | | | | 1 | |
| Class Y | | | (10,677 | ) | | | 11,298 | |
| | | | | | | |
| Net decrease from capital share transactions | | | (20,001 | ) | | | (3,373 | ) |
| | | | | | | |
Net Decrease In Net Assets | | | (323 | ) | | | (166,433 | ) |
Net Assets: | | | | | | | | |
| Beginning of period | | | 120,041 | | | | 286,474 | |
| | | | | | | |
| End of period | | $ | 119,718 | | | $ | 120,041 | |
| | | | | | | |
| Accumulated undistributed (distribution in excess of) net investment income (loss) | | $ | 495 | | | $ | 1,932 | |
| | | | | | | |
The accompanying notes are an integral part of these financial statements.
10
The Hartford Value Opportunities Fund
Notes to Financial Statements
October 31, 2009
(000’s Omitted)
| 1. | | Organization: |
| |
| | | The Hartford Mutual Funds II, Inc. (“Company”) is an open-end management investment company comprised of six portfolios. Financial statements for The Hartford Value Opportunities Fund (the “Fund”), a series of the Company, are included in this report. |
| |
| | | The Company is organized under the laws of the State of Maryland and is registered with the Securities and Exchange Commission (“SEC”) under the Investment Company Act of 1940, as amended (“1940 Act”). The Fund is a diversified open-end management investment company. |
| |
| | | Class A shares are sold with a front-end sales charge of up to 5.50%. Class B shares were sold with a contingent deferred sales charge which is assessed on the lesser of the per share net asset value (“NAV”) of the shares at the time of redemption or the original purchase price, and declines from up to 5.00% to zero depending on the period of time the shares are held (See note below regarding the closing of Class B shares). Class C shares are sold with a contingent deferred sales charge of up to 1.00% on shares redeemed within twelve months of purchase. Class I shares are sold without sales charges to certain eligible investors through advisory fee-based wrap programs. Class L shares are sold with a sales charge of up to 4.75%. Classes R3, R4, R5 shares, which are offered to employer-sponsored retirement plans, and Class Y shares, which are sold to certain eligible institutional investors, are sold without a sales charge. All classes of shares have identical voting, redemption, dividend, liquidation and other rights and the same terms and conditions, with the exceptions that each class may have different expenses, which may affect performance, and that Class B shares automatically convert to Class A shares after 8 years. |
| |
| | | Effective September 30, 2009, no new or additional investments are allowed in Class B shares of The Hartford Mutual Funds (including investments through any systematic investment plan). After September 30, 2009, existing shareholders of Class B shares may continue to hold their Class B shares, exchange their Class B shares for Class B shares of another Hartford Mutual Fund (as permitted by existing exchange privileges), or redeem their Class B shares as described in the Fund’s prospectus. Reinstatement privileges with respect to Class B shares will continue under the current policy. For investors electing to reinvest capital gains and dividends, any such capital gains or dividends on Class B shares will continue to be reinvested in Class B shares of the Fund. For Class B shares outstanding as of September 30, 2009, all Class B share attributes, including the 12b-1 fee, contingent deferred sales charge schedule, and conversion to Class A shares remain unchanged. |
| |
| 2. | | Significant Accounting Policies: |
| |
| | | The following is a summary of significant accounting policies of the Fund, which are in accordance with U.S. Generally Accepted Accounting Principles (“GAAP”). |
| | a) | | Security Transactions and Investment Income — Security transactions are recorded on the trade date (the date the order to buy or sell is executed). Security gains and losses are determined on the basis of identified cost. |
| |
| | | | Dividend income is accrued as of the ex-dividend date, except that certain dividends for foreign securities where the ex-dividend date may have passed are recorded as soon as the Fund is informed of the dividend in the exercise of reasonable diligence. Interest income, including amortization of premium and accretion of discounts, is accrued on a daily basis. |
| |
| | b) | | Security Valuation — The Fund generally uses market prices in valuing portfolio securities. If market prices are not readily available or are deemed unreliable, the Fund will use the fair value of the security as determined in good faith under policies and procedures established by and under the supervision of the Fund’s Board of Directors. Market prices may be deemed unreliable, for example, if a security is thinly traded or if an event has occurred after the close of the security’s primary market, but before the close of the New York Stock Exchange (the “Exchange”) (generally 4:00 p.m. Eastern Time, referred to as the “Valuation Time”) that is expected to affect the value of the portfolio security. The circumstances in which the Fund may use fair value pricing include, among others: (i) the occurrence of events that are |
11
The Hartford Value Opportunities Fund
Notes to Financial Statements — (continued)
October 31, 2009
(000’s Omitted)
significant to a particular issuer, such as mergers, restructuring or defaults; (ii) the occurrence of events that are significant to an entire market, such as natural disasters in a particular region or governmental actions; (iii) trading restrictions on securities; (iv) thinly traded securities and (v) market events such as trading halts and early market closings. In addition, with respect to the valuation of stocks primarily traded on foreign markets, the Fund uses a fair value pricing service approved by the Fund’s Board of Directors, which employs quantitative models that evaluate changes in the value of foreign market proxies (e.g., futures contracts, American Depositary Receipts, exchange traded funds (“ETF’s”)) after the close of the foreign markets but before the Valuation Time. Securities that are primarily traded on foreign markets may trade on days that are not business days of the Fund. The value of the foreign securities in which the Fund invests may change on days when a shareholder will not be able to purchase or redeem shares of the Fund. Fair value pricing is subjective in nature and the use of fair value pricing by the Fund may cause the NAV of its shares to differ significantly from the NAV that would have been calculated using market prices at the close of the exchange on which a portfolio security is primarily traded but before the close of the Exchange. There can be no assurance that the Fund could obtain the fair value assigned to a security if the Fund were to sell the security at approximately the time at which the Fund determines its NAV.
Exchange-traded equity securities are valued at the last reported sale price on the exchange or market on which the security is primarily traded (the “Primary Market”) at the Valuation Time. If the security did not trade on the Primary Market, it may be valued at the Valuation Time at the last reported sale price on another exchange where it trades. The value of an equity security not traded on any exchange but traded on the Nasdaq Stock Market, Inc. (“Nasdaq”) or another over-the-counter market shall be valued at the last reported sale price or official closing price on the exchange or market on which the security is traded as of the Valuation Time.
Foreign-denominated assets, including investment securities, and liabilities are translated from the local currency into U.S. dollars using exchange rates obtained from an independent third party as of the Fund’s Valuation Time.
Financial instruments for which prices are not available from an independent pricing service are valued using market quotations obtained from one or more dealers that make markets in securities in accordance with procedures established by the Fund’s Board of Directors.
Forward foreign currency contracts represent agreements to exchange currencies on specific future dates at predetermined rates. Forward foreign currency contracts are valued using foreign currency exchange rates and forward rates on the Valuation Date from an independent pricing service.
Other derivative or contractual type instruments shall be valued using market prices if such instruments trade on an exchange or market. If such instruments do not trade on an exchange or market, such instruments shall be valued at a price at which the counterparty to such contract would repurchase the instrument. In the event that the counterparty cannot provide a price, such valuation may be determined in accordance with procedures established by the Fund’s Board of Directors.
Various inputs are used in determining the value of the Fund’s investment. These inputs are summarized into three broad hierarchy levels. This hierarchy is based on whether the valuation inputs are observable or unobservable. These levels are:
| | • | | Level 1 — Quoted prices in active markets for identical securities. Level 1 may include exchange-traded instruments such as domestic equities, some foreign equities, options, futures, mutual funds, ETF’s, and rights and warrants. |
| |
| | • | | Level 2 — Observable inputs other than Level 1 prices, such as quoted prices for similar securities; quoted prices in markets that are not active; or other inputs that are observable or can be corroborated by observable market data for substantially the full term of the security. Level 2 may include debt securities that are traded less frequently than exchange-traded instruments and that are valued using third party pricing services, foreign equities, whose value is determined using a multi-factor regression model with inputs that are observable in the market; and money market instruments, which are carried at amortized cost. |
12
| | • | | Level 3 — Significant unobservable inputs that are supported by little or no market activity. Level 3 includes financial instruments whose values are determined using broker quotes or require significant management judgment or estimation. This category may include broker quoted securities and securities where trading has been halted or there are certain restrictions on trading. While these securities are priced using unobservable inputs, the valuation of these securities reflects the best available data and management believes the prices are a reasonable representation of exit price. |
| | | | Individual securities within any of the above mentioned asset classes may be assigned a different hierarchical level than those presented above, as individual circumstances dictate. |
| |
| | | | For purposes of the roll forward reconciliation for all Level 3 securities from the beginning of the reporting period to the end of the reporting period, transfers in and transfers out are shown at the beginning of the period fair value. |
| |
| | | | Refer to the Investment Valuation Hierarchy Level Summary and the Level 3 roll forward reconciliation found following the Schedule of Investments. |
| |
| | c) | | Foreign Currency Transactions — Assets and liabilities denominated in currencies other than U.S. dollars are translated into U.S. dollars at the exchange rates in effect on the valuation date. Purchases and sales of investment securities and income and expenses are translated into U.S. dollars at the exchange rates on the dates of such transactions. |
| |
| | | | The Fund does not isolate that portion of portfolio security valuation resulting from fluctuations in the foreign currency exchange rates from the fluctuations arising from changes in the market prices of securities held. Exchange rate fluctuations are included with the net realized and unrealized gain or loss on investments in the accompanying financial statements. |
| |
| | | | Net realized foreign exchange gains or losses arise from sales of foreign currencies and the difference between asset and liability amounts initially stated in foreign currencies and the U.S. dollar value of the amounts actually received or paid. Net unrealized foreign exchange gains or losses arise from changes in the value of other assets and liabilities at the end of the reporting period, resulting from changes in the exchange rates. |
| |
| | d) | | Joint Trading Account — Pursuant to an exemptive order issued by the SEC, the Fund may transfer uninvested cash balances into a joint trading account managed by Wellington Management Company, LLP (“Wellington”). These balances may be invested in one or more repurchase agreements and/or short-term money market instruments. |
| |
| | e) | | Repurchase Agreements — A repurchase agreement is an agreement by which the seller of a security agrees to repurchase the security sold at a mutually agreed upon time and price. At the time the Fund enters into a repurchase agreement, the value of the underlying collateral security(ies), including accrued interest, will be equal to or exceed the value of the repurchase agreement. To minimize counterparty risk, the securities that serve to collateralize the repurchase agreement are held by the Fund’s custodian in book entry or physical form in the custodial account of the Fund or in a third party custodial account. Repurchase agreements are valued at cost plus accrued interest. The Fund, as shown on the Schedule of Investments, had outstanding repurchase agreements as of October 31, 2009. |
| |
| | f) | | Securities Lending — The Fund may lend its securities to certain qualified brokers who pay the Fund negotiated lender fees. The loans are fully collateralized at all times with cash and/or U.S. Government Securities and/or repurchase agreements. The cash collateral is then invested in short-term money market instruments. The repurchase agreements are fully collateralized by U.S. Government Securities. The adequacy of the collateral for securities on loan is monitored on a daily basis. For instances where the market value of collateral falls below the market value of the securities out on loan, such collateral is supplemented on the following business day. |
| |
| | | | While securities are on loan, the Fund is subject to the following risks: 1) that the borrower may default on the loan and that the collateral could be inadequate in the event the borrower defaults, 2) that the earnings on the collateral invested may not be sufficient to pay fees incurred in connection with the loan, 3) that the principal value of the collateral |
13
The Hartford Value Opportunities Fund
Notes to Financial Statements — (continued)
October 31, 2009
(000’s Omitted)
| | | | invested may decline and may not be sufficient to pay back the borrower for the amount of the collateral posted, 4) that the borrower may use the loaned securities to cover a short sale which may place downward pressure on the market prices of the loaned securities, 5) that return of loaned securities could be delayed and could interfere with portfolio management decisions and 6) that any efforts to recall the securities for purposes of voting a proxy may not be effective. The Fund had no securities out on loan as of October 31, 2009. |
| |
| | g) | | Forward Foreign Currency Contracts — The Fund may enter into forward foreign currency contracts that obligate the Fund to purchase or sell currencies at specified future dates. Forward foreign currency contracts may be used to hedge against adverse fluctuations in exchange rates between currencies. |
| |
| | | | Forward foreign currency contracts involve elements of market risk in excess of the amount reflected in the Statement of Assets and Liabilities. In addition, risks may arise upon entering into these contracts from the potential inability of the counterparties to meet the terms of the contracts and from unanticipated movements in the value of the foreign currencies relative to the U.S. dollar. The Fund had outstanding forward foreign currency contracts as shown on the Schedule of Investments as of October 31, 2009. |
| |
| | h) | | Indexed Securities — The Fund may invest in indexed securities whose values are linked to changes in interest rates, indices, or other underlying instruments. The Fund may use these securities to increase or decrease its exposure to different underlying instruments and to gain exposure to markets that might be difficult to invest in using conventional securities. Indexed securities may be more volatile than their underlying instruments, but any loss is limited to the amount of the original investment and there may be a limit to the potential appreciation of the investment. The Fund had no investments in indexed securities as of October 31, 2009. |
| |
| | i) | | Fund Share Valuation and Dividend Distributions to Shareholders — Orders for the Fund’s shares are executed in accordance with the investment instructions of the shareholders. The NAV of the Fund’s shares is determined as of the close of each business day of the Exchange. The NAV is determined separately for each class of the Fund by dividing the Fund’s net assets attributable to that class by the number of shares of the class outstanding. Orders for the purchase of the Fund’s shares prior to the close of the Exchange on any day on which the Exchange is open for business are priced at the NAV determined as of the close of the Exchange. Orders after the close of the Exchange, or on a day on which the Exchange and/or the Fund is not open for business, are priced at the next determined NAV. |
| |
| | | | The Fund intends to distribute substantially all of its net investment income and net realized capital gains to shareholders no less frequently than once a year. Normally, dividends from net investment income of the Fund are declared and paid annually. Unless shareholders specify otherwise, all dividends will be automatically reinvested in additional full or fractional shares of the Fund. |
| |
| | | | Distributions from net investment income, realized capital gains and capital are determined in accordance with federal income tax regulations, which may differ from U.S. GAAP with respect to character and timing. These differences may include but are not limited to losses deferred due to wash sale adjustments, foreign currency gains and losses, adjustments related to Passive Foreign Investment Companies (“PFICs”), Real Estate Investment Trusts (“REITs”), Regulated Investment Companies (“RICs”), certain derivatives and partnerships. Permanent book and federal income tax basis differences relating to shareholder distributions will result in reclassifications to certain of the Fund’s capital accounts (see Federal Income Taxes: Reclassification of Capital Accounts footnote). |
| |
| | j) | | Illiquid and Restricted Securities — The Fund is permitted to invest up to 15% of its net assets in illiquid securities. “Illiquid Securities” are those that may not be sold or disposed of in the ordinary course of business within seven days, at approximately the price used to determine the Fund’s NAV. The Fund may not be able to sell illiquid securities or other investments when its sub-adviser considers it desirable to do so or may have to sell such securities or investments at a price that is lower than the price that could be obtained if the securities or investments were more liquid. A sale of illiquid securities or other investments may require more time and may result in higher dealer discounts and other selling expenses than does the sale of those that are liquid. Illiquid securities and investments also may be more difficult to value, due to the unavailability of reliable market quotations for such securities or investments, and an investment in |
14
| | | | them may have an adverse impact on the Fund’s NAV. The Fund may also purchase certain restricted securities, commonly known as Rule 144A securities, that can be resold to institutions and which may be determined to be liquid pursuant to policies and guidelines established by the Fund’s Board of Directors. The Fund, as shown on the Schedule of Investments, had illiquid and/or restricted securities as of October 31, 2009. |
| |
| | k) | | Use of Estimates — The preparation of financial statements in conformity with U.S. GAAP requires management to make estimates and assumptions that affect the reported amounts of assets and liabilities as of the date of the financial statements and the reported amounts of income and expenses during the period. Operating results in the future could vary from the amounts derived from management’s estimates. |
| |
| | l) | | Additional Derivative Instrument(s) Information |
| |
| | | | Derivative Instrument(s) as of October 31, 2009. |
| | | | | | | | | | | | | |
| | | Asset Derivatives | | | Liability Derivatives |
| Risk Exposure Category | | Statement of Assets and Liabilities Location | | | Statement of Assets and Liabilities Location |
| Foreign exchange contracts | | Unrealized appreciation on forward | | $ | 4 | | | | | |
| | | foreign currency contracts | | | | | | | | |
The volume of derivatives that is presented in the Schedule of Investments is consistent with the derivative activity during the year ended October 31, 2009.
Realized Gain/Loss and Change in Unrealized Appreciation (Depreciation) on Derivative Instruments for the year ended October 31, 2009:
| | | | | | | | | | | | | | | | | | | | | | | | | |
| Amount of Realized Gain or (Loss) on Derivatives Recognized in Income | |
| | | | | | | | | | | | | | | Forward | | | | | | | |
| | | | | | | Purchased | | | | | | | Currency | | | | | | | |
| Risk Exposure Category | | Written Options | | | Options | | | Futures | | | Contracts | | | Swaps | | | Total | |
| Foreign exchange contracts | | $ | — | | | $ | — | | | $ | — | | | $ | (228 | ) | | $ | — | | | $ | (228 | ) |
| | | | | | | | | | | | | | | | | | | |
| Total | | $ | — | | | $ | — | | | $ | — | | | $ | (228 | ) | | $ | — | | | $ | (228 | ) |
| | | | | | | | | | | | | | | | | | | |
| | | | | | | | | | | | | | | | | | | | | | | | | |
| Change in Unrealized Appreciation or (Depreciation) on Derivatives Recognized in Income |
| | | | | | | | | | | | | | | Forward | | | | |
| | | | | | | Purchased | | | | | | Currency | | | | |
| Risk Exposure Category | | Written Options | | Options | | Futures | | Contracts | | Swaps | | Total |
| Foreign exchange contracts | | | | — | | | | — | | | | — | | | | 192 | | | | — | | $ | | 192 |
| | | | | | | | | | | | | |
| Total | | $ | | — | | $ | | — | | $ | | — | | $ | | 192 | | $ | | — | | $ | | 192 |
| | | | | | | | | | | | | |
| | m) | | Indemnifications — Under the Company’s organizational documents, the Company shall indemnify its officers and directors to the full extent required or permitted under Maryland General Corporation Law and the federal securities law. In addition, the Company, on behalf of the Fund, may enter into contracts that contain a variety of indemnifications. The Company’s maximum exposure under these arrangements is unknown. However, the Company has not had prior claims or losses pursuant to these contracts and expects the risk of loss to be remote. |
| | a) | | Federal Income Taxes — For federal income tax purposes, the Fund intends to continue to qualify as a RIC under Subchapter M of the Internal Revenue Code (“IRC”) by distributing substantially all of its taxable net investment income and net realized capital gains to its shareholders and otherwise complying with the requirements of regulated investment companies. The Fund has distributed substantially all of its income and capital gains in prior years and intends to distribute substantially all of its income and capital gains during the calendar year ending December 31, 2009. Accordingly, no provision for federal income or excise taxes has been made in the accompanying financial statements. Distributions from short-term capital gains are treated as ordinary income distributions for federal income tax purposes. |
15
The Hartford Value Opportunities Fund
Notes to Financial Statements — (continued)
October 31, 2009
(000’s Omitted)
| | b) | | Net Investment Income (Loss), Realized Gains and (Losses) — Net investment income (loss) and net realized gains (losses) may differ for financial statement and tax purposes primarily because of losses deferred due to wash sale adjustments, foreign currency gains and losses, adjustments related to PFICs, REITs, RICs, certain derivatives and partnerships. The character of distributions made during the year from net investment income or realized gains may differ from their ultimate characterization for federal income tax purposes. Also, due to the timing of dividend distributions, the fiscal year in which amounts are distributed may differ from the year that the income or realized gains (losses) were recorded by the Fund. |
| |
| | c) | | Distributions and Components of Distributable Earnings — The tax character of distributions paid by the Fund for the periods indicated is as follows (as adjusted for dividends payable): |
| | | | | | | | | |
| | | For the Year Ended | | For the Year Ended |
| | | October 31, 2009 | | October 31, 2008 |
| Ordinary Income | | $ | | 1,745 | | $ | | 11,033 |
| Long-Term Capital Gains * | | | | — | | | | 30,965 |
| | |
| * | | The Fund designates these distributions as long-term capital gain dividends pursuant to IRC code Sec. 852(b)(3)(C). |
As of October 31, 2009, the Fund’s components of distributable earnings (deficit) on a tax basis were as follows:
| | | | | |
| | | Amount | |
| Undistributed Ordinary Income | | $ | 495 | |
| Accumulated Capital Losses * | | | (84,311 | ) |
| Unrealized Depreciation † | | | (5,124 | ) |
| | | | |
| Total Accumulated Deficit | | $ | (88,940 | ) |
| | | | |
| | |
| * | | The Fund has capital loss carryforwards that are identified in the Capital Loss Carryforward note that follows. |
| |
| † | | The differences between book-basis and tax-basis unrealized appreciation (depreciation) may be attributable to the losses deferred due to wash sale adjustments, foreign currency gains and losses, adjustments related to PFICs, REITs, RICs, certain derivatives and partnerships. |
| | d) | | Reclassification of Capital Accounts — The Fund may record reclassifications in its capital accounts. These reclassifications have no impact on the total net assets of the Fund. The reclassifications are a result of permanent differences between GAAP and tax accounting for such items as net operating losses that reduce distribution requirements. Adjustments are made to reflect the impact these items have on current and future distributions to shareholders. Therefore, the source of the Fund’s distributions may be shown in the accompanying Statement of Changes in Net Assets as from net investment income, from net realized gains on investments or from capital depending on the type of book and tax differences that exist. For the year ended October 31, 2009, the Fund recorded reclassifications to decrease accumulated undistributed net investment income by $298 and increase accumulated net realized gain on investments by $298. |
| |
| | e) | | Capital Loss Carryforward — At October 31, 2009 (tax-year-end), the Fund had capital loss carryforwards for U.S. federal income tax purposes of approximately: |
| | | | | |
| Year of Expiration | | Amount | |
| 2016 | | $ | 49,188 | |
| 2017 | | | 35,123 | |
| | | | |
Total | | $ | 84,311 | |
| | | | |
16
| | f) | | Accounting for Uncertainty in Income Taxes — Management has evaluated all open tax years and has determined there is no impact to the Fund’s financial statements related to uncertain tax positions. Generally, tax authorities can examine all tax returns filed for the last three years. |
| | a) | | Investment Management Agreement — Hartford Investment Financial Services, LLC (“HIFSCO”) serves as investment manager to the Fund pursuant to an Investment Management Agreement with the Company. As investment manager, HIFSCO has overall investment supervisory responsibility for the Fund. In addition, HIFSCO provides administrative personnel, services, equipment, facilities and office space for proper operation of the Fund. HIFSCO has contracted with Wellington for the provision of day-to-day investment management services to the Fund in accordance with the Fund’s investment objective and policies. The Fund pays a fee to HIFSCO, a portion of which may be used to compensate Wellington. |
| |
| | | | The schedule below reflects the rates of compensation paid to HIFSCO for investment management services rendered during the year ended October 31, 2009; the rates are accrued daily and paid monthly: |
| | | | | |
| Average Daily Net Assets | | Annual Fee |
| On first $100 million | | | 0.8000 | % |
| On next $150 million | | | 0.7500 | % |
| On next $4.75 billion | | | 0.7000 | % |
| On next $5 billion | | | 0.6975 | % |
| Over $10 billion | | | 0.6950 | % |
| | b) | | Accounting Services Agreement — Pursuant to the Fund Accounting Agreement between Hartford Life Insurance Company (“HLIC”) and the Fund, HLIC provides accounting services to the Fund and receives monthly compensation on the Fund’s average net assets. The Fund’s accounting services fees are accrued daily and paid monthly. |
| | | | | |
| Average Daily Net Assets | | Annual Fee |
| On first $5 billion | | | 0.014 | % |
| On next $5 billion | | | 0.012 | % |
| Over $10 billion | | | 0.010 | % |
| | c) | | Operating Expenses — Allocable expenses incurred by the Company are allocated to each Fund and allocated to classes within the Fund in proportion to the average daily net assets of the Fund and each class, except where allocation of certain expenses is more fairly made directly to the Fund or to specific classes within a Fund. During the year ended October 31, 2009, HIFSCO has contractually limited the total operating expenses of this Fund, exclusive of taxes, interest expense, brokerage commissions, certain distribution expenses and extraordinary expenses as follows: |
| | | | | | | | | | | | | | | | | | | | | | | | | | | | | | | | | |
| Class A | | Class B | | Class C | | Class I | | Class L | | Class R3 | | Class R4 | | Class R5 | | Class Y |
| 1.35% | | | 2.10 | % | | | 2.10 | % | | | 1.10 | % | | | 1.40 | % | | | 1.60 | % | | | 1.30 | % | | | 1.00 | % | | | 1.00 | % |
| | d) | | Fees Paid Indirectly — The Fund has entered into agreements with State Street Global Markets, LLC and Russell Implementation Services Inc. to partially recapture non-discounted trade commissions. Such rebates are used to pay a portion of the Fund’s expenses. In addition, the Fund’s custodian bank has also agreed to reduce its fees when the Fund maintains cash on deposit in a non-interest-bearing custody account. For the year ended October 31, 2009, these amounts are included in the Statement of Operations. |
17
The Hartford Value Opportunities Fund
Notes to Financial Statements — (continued)
October 31, 2009
(000’s Omitted)
The ratio of expenses to average net assets in the accompanying financial highlights excludes the reduction in expenses related to fees paid indirectly. Had the fees paid indirectly been included, the annualized expense ratio for the periods listed below would have been as follows:
| | | | | | | | | | | | | | | | | | | | | |
| | | Year Ended | | Year Ended | | Year Ended | | Year Ended | | Year Ended |
| | | October 31, | | October 31, | | October 31, | | October 31, | | October 31, |
| | | 2009 | | 2008 | | 2007 | | 2006 | | 2005 |
| Class A Shares | | | 1.19 | % | | | 1.40 | % | | | 1.40 | % | | | 1.39 | % | | | 1.39 | % |
| Class B Shares | | | 1.61 | | | | 1.94 | | | | 2.13 | | | | 2.11 | | | | 2.14 | |
| Class C Shares | | | 1.97 | | | | 2.15 | | | | 2.15 | | | | 2.14 | | | | 2.14 | |
| Class I Shares | | | 1.09 | | | | 1.15 | | | | 1.15 | | | | 1.15 | * | | | | |
| Class L Shares | | | 1.19 | | | | 1.20 | | | | 1.24 | | | | 1.22 | | | | 1.30 | |
| Class R3 Shares | | | 1.59 | | | | 1.65 | | | | 1.65 | † | | | | | | | | |
| Class R4 Shares | | | 1.29 | | | | 1.35 | | | | 1.35 | † | | | | | | | | |
| Class R5 Shares | | | 0.99 | | | | 1.05 | | | | 1.05 | † | | | | | | | | |
| Class Y Shares | | | 0.95 | | | | 0.96 | | | | 0.94 | | | | 0.99 | | | | 1.06 | |
| | |
| * | | From August 31, 2006 (commencement of operations), through October 31, 2006. |
| |
| † | | From December 22, 2006 (commencement of operations), through October 31, 2007. |
| | e) | | Distribution and Service Plan for Class A, B, C, L, R3 and R4 Shares — HIFSCO is the principal underwriter and distributor of the Fund. HIFSCO is engaged in distribution activities, which include marketing and distribution of shares through broker-dealers, financing distribution costs and maintaining financial books and records. For the year ended October 31, 2009, HIFSCO received front-end load sales charges of $195 and contingent deferred sales charges of $20 from the Fund. |
| |
| | | | The Fund has adopted a Distribution and Service Plan in accordance with Rule 12b-1 of the Investment Company Act of 1940, as amended, to compensate the distributor (HIFSCO) for activities intended to result in the sale and distribution of Classes A, B, C, L, R3 and R4 shares and for providing services for shareholders. The Rule 12b-1 plan applicable to Class A shares of the Fund provides for payment of a Rule 12b-1 fee of up to 0.35% of average daily net assets; however, the Board of Directors has currently authorized 12b-1 payments of up to 0.25%. Some or all of the fee may be used for shareholder servicing expenses with the remainder used for distribution expenses. Some or the entire Rule 12b-1 fee for Class B shares may be remitted to broker-dealers for distribution and/or shareholder account services. Under the Class B Plan, the Fund pays the distributor 1.00% of the average daily net assets of Class B shares that are outstanding for 8 years or less, 0.25% of which is a fee for services provided to existing shareholders with the remainder used for distribution expenses. After eight years, Class B shares convert to Class A shares. Upon conversion to Class A shares, the Class A plan described above will apply to those shares. Under the Class C Plan, the Fund pays the Distributor 1.00% of the average daily net assets of Class C shares outstanding, 0.25% of which is intended as a fee for services provided to existing shareholders with the remainder used for distribution expenses. For Class C shares, some or the entire fee may be remitted to broker-dealers for distribution and/or shareholder account services. Class L has a distribution fee of 0.25%. Class R3 shares have a distribution fee of 0.50% and Class R4 shares have a distribution fee of 0.25%. For Classes R3 and R4 shares, some or the entire fee may be remitted to broker dealers for distribution and/or shareholder account services. The Fund’s 12b-1 fees are accrued daily and paid monthly. |
| |
| | | | For the year ended October 31, 2009, total sales commissions paid to affiliated brokers/dealers of The Hartford for distributing the Fund’s shares were $17. These commissions are in turn paid to sales representatives of the broker/dealers. |
| |
| | f) | | Other Related Party Transactions — Certain officers of the Fund are directors and/or officers of HIFSCO and/or The Hartford or its subsidiaries. For the year ended October 31, 2009, a portion of the Fund’s chief compliance officer’s salary was paid by all the investment companies in the Hartford fund complex. The portion allocated to the Fund rounds to zero. Hartford Administrative Services Company (“HASCO”), an indirect wholly owned subsidiary of The Hartford, provides transfer agent services to the Fund. HASCO has contractually agreed to reimburse any portion of the transfer |
18
| | | | agency fees over 0.30% of average daily net assets per fiscal year for all classes. HASCO was compensated $237 for providing such services. These fees are accrued daily and paid monthly. |
| |
| | | | Administrative services fees are paid to HASCO for third-party recordkeeping services that are payable as a percentage of net assets in the amount of 0.20%, 0.15% and 0.10% for Classes R3, R4 and R5 shares, respectively. The total administrative services fees are shown on the Statement of Operations. These fees are accrued daily and paid monthly. |
| |
| | g) | | Payments from Affiliate — The total return in the accompanying financial highlights includes payment from affiliates. Had the payment from affiliates been excluded, the total return for the periods listed below would have been as follows: |
| | | | | | | | | |
| | | Impact from Payment | | Total Return |
| | | from Affiliate for SEC | | Excluding Payment |
| | | Settlement for the | | from Affiliate for the |
| | | Year Ended | | Year Ended |
| | | October 31, 2007 | | October 31, 2007 |
| Class A | | | 0.01 | % | | | 9.72 | % |
| Class B | | | 0.01 | | | | 8.89 | |
| Class C | | | 0.01 | | | | 8.90 | |
| Class I | | | 0.01 | | | | 10.07 | |
| Class L | | | 0.01 | | | | 9.91 | |
| Class Y | | | 0.01 | | | | 10.29 | |
| 5. | | Affiliate Holdings: |
| |
| | | As of October 31, 2009, affiliates of The Hartford had ownership of shares in the Fund as follows: |
| 6. | | Investment Transactions: |
| |
| | | For the year ended October 31, 2009, the Fund’s aggregate purchases and sales of investment securities (excluding short-term investments) were as follows: |
| | | | | |
| | | Amount |
| Cost of Purchases Excluding U.S. Government Obligations | | $ | 91,600 | |
| Sales Proceeds Excluding U.S. Government Obligations | | | 113,734 | |
19
The Hartford Value Opportunities Fund
Notes to Financial Statements — (continued)
October 31, 2009
(000’s Omitted)
7. Capital Share Transactions:
The following information is for the year ended October 31, 2009 and the year ended October 31, 2008:
| | | | | | | | | | | | | | | | | | | | | | | | | | | | | | | | | | | | | | | | | |
| | | For the Year Ended October 31, 2009 | | For the Year Ended October 31, 2008 |
| | | | | | | Shares | | | | | | Shares | | | | | | | | | | Shares | | | | | | Shares | | |
| | | | | | | Issued for | | | | | | Issued | | Net Increase | | | | | | Issued for | | | | | | Issued | | Net Increase |
| | | Shares | | Reinvested | | Shares | | from | | (Decrease) of | | Shares | | Reinvested | | Shares | | from | | (Decrease) of |
| | | Sold | | Dividends | | Redeemed | | Merger | | Shares | | Sold | | Dividends | | Redeemed | | Merger | | Shares |
| Class A | | | | | | | | | | | | | | | | | | | | | | | | | | | | | | | | | | | | | | | | |
| Shares | | | 1,819 | | | | 131 | | | | (2,568 | ) | | | — | | | | (618 | ) | | | 1,660 | | | | 1,489 | | | | (4,544 | ) | | | — | | | | (1,395 | ) |
| Amount | | $ | 15,834 | | | $ | 974 | | | $ | (20,944 | ) | | $ | — | | | $ | (4,136 | ) | | $ | 20,953 | | | $ | 21,647 | | | $ | (54,537 | ) | | $ | — | | | $ | (11,937 | ) |
| Class B | | | | | | | | | | | | | | | | | | | | | | | | | | | | | | | | | | | | | | | | |
| Shares | | | 113 | | | | 14 | | | | (295 | ) | | | — | | | | (168 | ) | | | 115 | | | | 230 | | | | (560 | ) | | | — | | | | (215 | ) |
| Amount | | $ | 865 | | | $ | 92 | | | $ | (2,168 | ) | | $ | — | | | $ | (1,211 | ) | | $ | 1,235 | | | $ | 3,029 | | | $ | (6,109 | ) | | $ | — | | | $ | (1,845 | ) |
| Class C | | | | | | | | | | | | | | | | | | | | | | | | | | | | | | | | | | | | | | | | |
| Shares | | | 174 | | | | 10 | | | | (592 | ) | | | — | | | | (408 | ) | | | 289 | | | | 332 | | | | (1,066 | ) | | | — | | | | (445 | ) |
| Amount | | $ | 1,330 | | | $ | 65 | | | $ | (4,152 | ) | | $ | — | | | $ | (2,757 | ) | | $ | 3,350 | | | $ | 4,356 | | | $ | (11,518 | ) | | $ | — | | | $ | (3,812 | ) |
| Class I | | | | | | | | | | | | | | | | | | | | | | | | | | | | | | | | | | | | | | | | |
| Shares | | | 154 | | | | 3 | | | | (157 | ) | | | — | | | | — | | | | 162 | | | | 47 | | | | (326 | ) | | | — | | | | (117 | ) |
| Amount | | $ | 1,468 | | | $ | 22 | | | $ | (1,413 | ) | | $ | — | | | $ | 77 | | | $ | 1,876 | | | $ | 678 | | | $ | (3,886 | ) | | $ | — | | | $ | (1,332 | ) |
| Class L | | | | | | | | | | | | | | | | | | | | | | | | | | | | | | | | | | | | | | | | |
| Shares | | | 80 | | | | 53 | | | | (411 | ) | | | — | | | | (278 | ) | | | 102 | | | | 421 | | | | (528 | ) | | | — | | | | (5 | ) |
| Amount | | $ | 652 | | | $ | 394 | | | $ | (3,381 | ) | | $ | — | | | $ | (2,335 | ) | | $ | 1,242 | | | $ | 6,147 | | | $ | (6,492 | ) | | $ | — | | | $ | 897 | |
| Class R3 | | | | | | | | | | | | | | | | | | | | | | | | | | | | | | | | | | | | | | | | |
| Shares | | | 54 | | | | 1 | | | | (58 | ) | | | — | | | | (3 | ) | | | 102 | | | | 1 | | | | (31 | ) | | | — | | | | 72 | |
| Amount | | $ | 473 | | | $ | 12 | | | $ | (529 | ) | | $ | — | | | $ | (44 | ) | | $ | 1,284 | | | $ | 14 | | | $ | (382 | ) | | $ | — | | | $ | 916 | |
| Class R4 | | | | | | | | | | | | | | | | | | | | | | | | | | | | | | | | | | | | | | | | |
| Shares | | | 164 | | | | 6 | | | | (52 | ) | | | — | | | | 118 | | | | 215 | | | | 9 | | | | (39 | ) | | | — | | | | 185 | |
| Amount | | $ | 1,484 | | | $ | 40 | | | $ | (447 | ) | | $ | — | | | $ | 1,077 | | | $ | 2,754 | | | $ | 129 | | | $ | (442 | ) | | $ | — | | | $ | 2,441 | |
| Class R5 | | | | | | | | | | | | | | | | | | | | | | | | | | | | | | | | | | | | | | | | |
| Shares | | | — | | | | — | | | | — | | | | — | | | | — | | | | — | | | | — | | | | — | | | | — | | | | — | |
| Amount | | $ | 5 | | | $ | — | | | $ | — | | | $ | — | | | $ | 5 | | | $ | — | | | $ | 1 | | | $ | — | | | $ | — | | | $ | 1 | |
| Class Y | | | | | | | | | | | | | | | | | | | | | | | | | | | | | | | | | | | | | | | | |
| Shares | | | 408 | | | | 11 | | | | (1,925 | ) | | | — | | | | (1,506 | ) | | | 818 | | | | 262 | | | | (309 | ) | | | — | | | | 771 | |
| Amount | | $ | 3,992 | | | $ | 82 | | | $ | (14,751 | ) | | $ | — | | | $ | (10,677 | ) | | $ | 10,413 | | | $ | 3,921 | | | $ | (3,036 | ) | | $ | — | | | $ | 11,298 | |
The following reflects the conversion of Class B Shares into Class A Shares (reflected as Class A Shares issued) for the year ended October 31, 2009 and the year ended October 31, 2008:
| | | | | | | | | |
| | | Shares | | Dollars |
| For the Year Ended October 31, 2009 | | | 28 | | | | $235 | |
| For the Year Ended October 31, 2008 | | | 49 | | | | $598 | |
8. Line of Credit:
The Fund is one of several Hartford Funds that participate in a $500 million committed revolving line of credit facility. The facility is to be used for temporary or emergency purposes. Under the arrangement, the Fund is required to own securities having a market value in excess of 300% of the total bank borrowings. The interest rate on borrowings varies depending on the nature of the loan. The facility also requires a fee to be paid based on the amount of the commitment. This fee is allocated to all the Funds participating in the line of credit based on the average net assets of the Funds. During the year ended October 31, 2009, the Fund did not have any borrowings under this facility.
9. Industry Classifications:
Other than the industry classifications “Other Investment Pools and Funds” and “Exchange Traded Funds”, equity industry classifications used in this report are the Global Industry Classification Standard, which was developed by and is the exclusive property and service mark of MSCI, Inc. and Standard & Poor’s.
20
10. Subsequent Events:
Management has evaluated subsequent events through December 15, 2009, the date of issuance of the Fund’s financial statements, and has determined that no additional items require disclosure.
21
The Hartford Value Opportunities Fund
Financial Highlights
- Selected Per-Share Data (a) -
| | | | | | | | | | | | | | | | | | | | | | | | | | | | | | | | | | | | | | | | | | | | | |
| | | Net Asset | | | | | | | | | | Net Realized | | | | | | | | | | | | | | | | | | | | | | Net Increase | | |
| | | Value at | | | | | | | | | | and Unrealized | | Total from | | Dividends from | | Distributions | | | | | | | | | | (Decrease) in | | Net Asset |
| | | Beginning of | | Net Investment | | Payments from | | Gain (Loss) on | | Investment | | Net Investment | | from Realized | | Distributions | | Total | | Net Asset | | Value at End |
| Class | | Period | | Income (Loss) | | (to) Affiliate | | Investments | | Operations | | Income | | Capital Gains | | from Capital | | Distributions | | Value | | of Period |
| For the Year Ended October 31, 2009 (e) | | | | | | | | | | | | | | | | | | | | | | | | | | | | | | | | | | | | |
| A | | $ | 8.22 | | | $ | 0.06 | | | $ | — | | | $ | 2.06 | | | $ | 2.12 | | | $ | (0.15 | ) | | $ | — | | | $ | — | | | $ | (0.15 | ) | | $ | 1.97 | | | $ | 10.19 | |
| B | | | 7.42 | | | | 0.02 | | | | — | | | | 1.87 | | | | 1.89 | | | | (0.10 | ) | | | — | | | | — | | | | (0.10 | ) | | | 1.79 | | | | 9.21 | |
| C | | | 7.38 | | | | (0.01 | ) | | | — | | | | 1.86 | | | | 1.85 | | | | (0.05 | ) | | | — | | | | — | | | | (0.05 | ) | | | 1.80 | | | | 9.18 | |
| I | | | 8.15 | | | | 0.06 | | | | — | | | | 2.05 | | | | 2.11 | | | | (0.17 | ) | | | — | | | | — | | | | (0.17 | ) | | | 1.94 | | | | 10.09 | |
| L | | | 8.26 | | | | 0.06 | | | | — | | | | 2.06 | | | | 2.12 | | | | (0.18 | ) | | | — | | | | — | | | | (0.18 | ) | | | 1.94 | | | | 10.20 | |
| R3 | | | 8.33 | | | | 0.02 | | | | — | | | | 2.09 | | | | 2.11 | | | | (0.14 | ) | | | — | | | | — | | | | (0.14 | ) | | | 1.97 | | | | 10.30 | |
| R4 | | | 8.39 | | | | 0.04 | | | | — | | | | 2.11 | | | | 2.15 | | | | (0.17 | ) | | | — | | | | — | | | | (0.17 | ) | | | 1.98 | | | | 10.37 | |
| R5 | | | 8.44 | | | | 0.07 | | | | — | | | | 2.12 | | | | 2.19 | | | | (0.20 | ) | | | — | | | | — | | | | (0.20 | ) | | | 1.99 | | | | 10.43 | |
| Y | | | 8.48 | | | | 0.11 | | | | — | | | | 2.08 | | | | 2.19 | | | | (0.20 | ) | | | — | | | | — | | | | (0.20 | ) | | | 1.99 | | | | 10.47 | |
| | | | | | | | | | | | | | | | | | | | | | | | | | | | | | | | | | | | | | | | | | | | | |
| For the Year Ended October 31, 2008 | | | | | | | | | | | | | | | | | | | | | | | | | | | | | | | | | | | | |
| A | | | 18.24 | | | | 0.09 | | | | — | | | | (7.48 | ) | | | (7.39 | ) | | | (0.04 | ) | | | (2.59 | ) | | | — | | | | (2.63 | ) | | | (10.02 | ) | | | 8.22 | |
| B | | | 16.75 | | | | — | | | | — | | | | (6.74 | ) | | | (6.74 | ) | | | — | | | | (2.59 | ) | | | — | | | | (2.59 | ) | | | (9.33 | ) | | | 7.42 | |
| C | | | 16.71 | | | | (0 .03 | ) | | | — | | | | (6.71 | ) | | | (6.74 | ) | | | — | | | | (2.59 | ) | | | — | | | | (2.59 | ) | | | (9.33 | ) | | | 7.38 | |
| I | | | 18.13 | | | | 0.07 | | | | — | | | | (7.37 | ) | | | (7.30 | ) | | | (0.09 | ) | | | (2.59 | ) | | | — | | | | (2.68 | ) | | | (9.98 | ) | | | 8.15 | |
| L | | | 18.31 | | | | 0.10 | | | | — | | | | (7.49 | ) | | | (7.39 | ) | | | (0.07 | ) | | | (2.59 | ) | | | — | | | | (2.66 | ) | | | (10.05 | ) | | | 8.26 | |
| R3 | | | 18.56 | | | | 0.10 | | | | — | | | | (7.64 | ) | | | (7.54 | ) | | | (0.10 | ) | | | (2.59 | ) | | | — | | | | (2.69 | ) | | | (10.23 | ) | | | 8.33 | |
| R4 | | | 18.61 | | | | 0.12 | | | | — | | | | (7.66 | ) | | | (7.54 | ) | | | (0.09 | ) | | | (2.59 | ) | | | — | | | | (2.68 | ) | | | (10.22 | ) | | | 8.39 | |
| R5 | | | 18.66 | | | | 0.10 | | | | — | | | | (7.64 | ) | | | (7.54 | ) | | | (0.09 | ) | | | (2.59 | ) | | | — | | | | (2.68 | ) | | | (10.22 | ) | | | 8.44 | |
| Y | | | 18.73 | | | | 0.12 | | | | — | | | | (7.67 | ) | | | (7.55 | ) | | | (0.11 | ) | | | (2.59 | ) | | | — | | | | (2.70 | ) | | | (10.25 | ) | | | 8.48 | |
| | | | | | | | | | | | | | | | | | | | | | | | | | | | | | | | | | | | | | | | | | | | | |
| For the Year Ended October 31, 2007 | | | | | | | | | | | | | | | | | | | | | | | | | | | | | | | | | | | | |
| A | | | 18.26 | | | | 0.08 | | | | — | | | | 1.56 | | | | 1.64 | | | | (0.14 | ) | | | (1.52 | ) | | | — | | | | (1.66 | ) | | | (0.02 | ) | | | 18.24 | |
| B | | | 16.92 | | | | (0.04 | ) | | | — | | | | 1.43 | | | | 1.39 | | | | (0.04 | ) | | | (1.52 | ) | | | — | | | | (1.56 | ) | | | (0.17 | ) | | | 16.75 | |
| C | | | 16.92 | | | | (0.01 | ) | | | — | | | | 1.40 | | | | 1.39 | | | | (0.08 | ) | | | (1.52 | ) | | | — | | | | (1.60 | ) | | | (0.21 | ) | | | 16.71 | |
| I | | | 18.27 | | | | 0.34 | | | | — | | | | 1.36 | | | | 1.70 | | | | (0.32 | ) | | | (1.52 | ) | | | — | | | | (1.84 | ) | | | (0.14 | ) | | | 18.13 | |
| L(g) | | | 18.29 | | | | 0.09 | | | | — | | | | 1.59 | | | | 1.68 | | | | (0.14 | ) | | | (1.52 | ) | | | — | | | | (1.66 | ) | | | 0.02 | | | | 18.31 | |
| R3(h) | | | 17.74 | | | | — | | | | — | | | | 0.82 | | | | 0.82 | | | | — | | | | — | | | | — | | | | — | | | | 0.82 | | | | 18.56 | |
| R4(h) | | | 17.74 | | | | — | | | | — | | | | 0.87 | | | | 0.87 | | | | — | | | | — | | | | — | | | | — | | | | 0.87 | | | | 18.61 | |
| R5(h) | | | 17.74 | | | | 0.12 | | | | — | | | | 0.80 | | | | 0.92 | | | | — | | | | — | | | | — | | | | — | | | | 0.92 | | | | 18.66 | |
| Y | | | 18.48 | | | | 0.51 | | | | — | | | | 1.26 | | | | 1.77 | | | | — | | | | (1.52 | ) | | | — | | | | (1.52 | ) | | | 0.25 | | | | 18.73 | |
| | | | | | | | | | | | | | | | | | | | | | | | | | | | | | | | | | | | | | | | | | | | | |
| For the Year Ended October 31, 2006 (e) | | | | | | | | | | | | | | | | | | | | | | | | | | | | | | | | | | | | |
| A | | | 15.56 | | | | 0.09 | | | | — | | | | 3.11 | | | | 3.20 | | | | — | | | | (0.50 | ) | | | — | | | | (0.50 | ) | | | 2.70 | | | | 18.26 | |
| B | | | 14.56 | | | | (0.03 | ) | | | — | | | | 2.89 | | | | 2.86 | | | | — | | | | (0.50 | ) | | | — | | | | (0.50 | ) | | | 2.36 | | | | 16.92 | |
| C | | | 14.56 | | | | (0.04 | ) | | | — | | | | 2.90 | | | | 2.86 | | | | — | | | | (0.50 | ) | | | — | | | | (0.50 | ) | | | 2.36 | | | | 16.92 | |
| I(k) | | | 17.12 | | | | 0.01 | | | | — | | | | 1.14 | | | | 1.15 | | | | — | | | | — | | | | — | | | | — | | | | 1.15 | | | | 18.27 | |
| L | | | 15.58 | | | | 0.12 | | | | — | | | | 3.11 | | | | 3.23 | | | | (0.02 | ) | | | (0.50 | ) | | | — | | | | (0.52 | ) | | | 2.71 | | | | 18.29 | |
| Y | | | 15.74 | | | | 0.15 | | | | — | | | | 3.15 | | | | 3.30 | | | | (0.06 | ) | | | (0.50 | ) | | | — | | | | (0.56 | ) | | | 2.74 | | | | 18.48 | |
| | | | | | | | | | | | | | | | | | | | | | | | | | | | | | | | | | | | | | | | | | | | | |
| For the Year Ended October 31, 2005 | | | | | | | | | | | | | | | | | | | | | | | | | | | | | | | | | | | | |
| A | | | 14.06 | | | | 0.03 | | | | — | | | | 1.47 | | | | 1.50 | | | | — | | | | — | | | | — | | | | — | | | | 1.50 | | | | 15.56 | |
| B | | | 13.24 | | | | (0.05 | ) | | | — | | | | 1.37 | | | | 1.32 | | | | — | | | | — | | | | — | | | | — | | | | 1.32 | | | | 14.56 | |
| C | | | 13.25 | | | | (0.05 | ) | | | — | | | | 1.36 | | | | 1.31 | | | | — | | | | — | | | | — | | | | — | | | | 1.31 | | | | 14.56 | |
| L | | | 14.06 | | | | 0.07 | | | | — | | | | 1.45 | | | | 1.52 | | | | — | | | | — | | | | — | | | | — | | | | 1.52 | | | | 15.58 | |
| Y | | | 14.17 | | | | 0.05 | | | | — | | | | 1.52 | | | | 1.57 | | | | — | | | | — | | | | — | | | | — | | | | 1.57 | | | | 15.74 | |
| | |
| (a) | | Information presented relates to a share outstanding throughout the indicated period. |
| |
| (b) | | Assumes initial investment at net asset value at the beginning of each period, reinvestment of all distributions, the complete redemption of the investment at net asset value at the end of each period and no sales charge. Total return would be reduced if sales charges were taken into account. |
| |
| (c) | | Ratios do not include fees paid indirectly (See Expenses in the accompanying Notes to Financial Statements). |
| |
| (d) | | Portfolio turnover rate is calculated on the basis of the Fund as a whole without distinguishing between the classes of shares issued. |
| |
| (e) | | Per share amounts have been calculated using average shares outstanding method. |
| |
| (f) | | Total return without the inclusion of the Payments from (to) Affiliate, can be found in Expenses in the accompanying Notes to Financial Statements. |
| |
| (g) | | Classes H, M and N were merged into Class L on February 9, 2007. |
| |
| (h) | | Commenced operations on December 22, 2006. |
| |
| (i) | | Not annualized. |
| |
| (j) | | Annualized. |
| |
| (k) | | Commenced operations on August 31, 2006. |
22
- Ratios and Supplemental Data -
| | | | | | | | | | | | | | | | | | | | | | | | | | | | | |
| | | | | | | | | | | Ratio of Expenses to Average Net | | Ratio of Expenses to Average Net | | Ratio of Expenses to Average Net | | | | |
| | | | | | | | | | | Assets Before Waivers and | | Assets After Waivers and | | Assets After Waivers and | | Ratio of Net Investment | | |
| | | | | | | Net Assets at End of | | Reimbursements and Including | | Reimbursements and Including | | Reimbursements and Excluding | | Income to Average Net | | Portfolio Turnover |
| Total Return(b) | | | | Period (000’s) | | Expenses not Subject to Cap(c) | | Expenses not Subject to Cap(c) | | Expenses not Subject to Cap(c) | | Assets | | Rate(d) |
| | 26.41 | % | | | | $ | 67,577 | | | | 1.66 | % | | | 1.20 | % | | | 1.20 | % | | | 0.67 | % | | | 90 | % |
| | 25.90 | | | | | | 7,903 | | | | 2.74 | | | | 1.63 | | | | 1.63 | | | | 0.26 | | | | — | |
| | 25.33 | | | | | | 10,158 | | | | 2.39 | | | | 1.98 | | | | 1.98 | | | | (0.07 | ) | | | — | |
| | | | | | | | | | | | | | | | | | | | | | | | | | | | | |
| | 26.68 | | | | | | 1,416 | | | | 1.17 | | | | 1.10 | | | | 1.10 | | | | 0.71 | | | | — | |
| | 26.39 | | | | | | 21,122 | | | | 1.22 | | | | 1.20 | | | | 1.20 | | | | 0.67 | | | | — | |
| | 25.97 | | | | | | 784 | | | | 1.78 | | | | 1.60 | | | | 1.60 | | | | 0.28 | | | | — | |
| | 26.38 | | | | | | 3,551 | | | | 1.36 | | | | 1.30 | | | | 1.30 | | | | 0.50 | | | | — | |
| | 26.77 | | | | | | 12 | | | | 1.12 | | | | 1.00 | | | | 1.00 | | | | 0.77 | | | | — | |
| | 26.76 | | | | | | 7,195 | | | | 0.96 | | | | 0.96 | | | | 0.96 | | | | 1.20 | | | | — | |
| | | | | | | | | | | | | | | | | | | | | | | | | | | | | |
| | (46.75 | ) | | | | | 59,576 | | | | 1.50 | | | | 1.40 | | | | 1.40 | | | | 0.62 | | | | 65 | |
| | (46.99 | ) | | | | | 7,613 | | | | 2.47 | | | | 1.95 | | | | 1.95 | | | | 0.08 | | | | — | |
| | (47.13 | ) | | | | | 11,167 | | | | 2.21 | | | | 2.15 | | | | 2.15 | | | | (0.12 | ) | | | — | |
| | (46.63 | ) | | | | | 1,139 | | | | 1.22 | | | | 1.15 | | | | 1.15 | | | | 0.99 | | | | — | |
| | (46.62 | ) | | | | | 19,403 | | | | 1.21 | | | | 1.20 | | | | 1.20 | | | | 0.82 | | | | — | |
| | (46.93 | ) | | | | | 657 | | | | 1.72 | | | | 1.65 | | | | 1.65 | | | | 0.30 | | | | — | |
| | (46.73 | ) | | | | | 1,877 | | | | 1.37 | | | | 1.35 | | | | 1.35 | | | | 0.66 | | | | — | |
| | (46.57 | ) | | | | | 6 | | | | 1.07 | | | | 1.05 | | | | 1.05 | | | | 0.96 | | | | — | |
| | (46.52 | ) | | | | | 18,603 | | | | 0.97 | | | | 0.97 | | | | 0.97 | | | | 1.01 | | | | — | |
| | | | | | | | | | | | | | | | | | | | | | | | | | | | | |
| | 9.73 | (f) | | | | | 157,671 | | | | 1.48 | | | | 1.40 | | | | 1.40 | | | | 0.48 | | | | 77 | |
| | 8.90 | (f) | | | | | 20,792 | | | | 2.38 | | | | 2.13 | | | | 2.13 | | | | (0.25 | ) | | | — | |
| | 8.91 | (f) | | | | | 32,738 | | | | 2.19 | | | | 2.15 | | | | 2.15 | | | | (0.28 | ) | | | — | |
| | 10.08 | (f) | | | | | 4,659 | | | | 1.22 | | | | 1.15 | | | | 1.15 | | | | 0.61 | | | | — | |
| | 9.92 | (f) | | | | | 43,102 | | | | 1.26 | | | | 1.25 | | | | 1.25 | | | | 0.50 | | | | — | |
| | 4.62 | (i) | | | | | 124 | | | | 1.78 | (j) | | | 1.65 | (j) | | | 1.65 | (j) | | | 0.03 | (j) | | | — | |
| | 4.90 | (i) | | | | | 732 | | | | 1.40 | (j) | | | 1.35 | (j) | | | 1.35 | (j) | | | (0.01 | ) (j) | | | — | |
| | 5.19 | (i) | | | | | 11 | | | | 1.17 | (j) | | | 1.05 | (j) | | | 1.05 | (j) | | | 0.75 | (j) | | | — | |
| | 10.30 | (f) | | | | | 26,645 | | | | 0.94 | | | | 0.94 | | | | 0.94 | | | | 1.19 | | | | — | |
| | | | | | | | | | | | | | | | | | | | | | | | | | | | | |
| | 21.12 | | | | | | 111,324 | | | | 1.52 | | | | 1.40 | | | | 1.40 | | | | 0.51 | | | | 57 | |
| | 20.21 | | | | | | 18,271 | | | | 2.38 | | | | 2.12 | | | | 2.12 | | | | (0.20 | ) | | | — | |
| | 20.20 | | | | | | 22,466 | | | | 2.22 | | | | 2.15 | | | | 2.15 | | | | (0.24 | ) | | | — | |
| | 6.72 | (i) | | | | | 12 | | | | 1.38 | (j) | | | 1.15 | (j) | | | 1.15 | (j) | | | 0.12 | (j) | | | — | |
| | 21.31 | | | | | | 32,983 | | | | 1.23 | | | | 1.23 | | | | 1.23 | | | | 0.68 | | | | — | |
| | 21.55 | | | | | | 102,915 | | | | 1.00 | | | | 1.00 | | | | 1.00 | | | | 0.90 | | | | — | |
| | | | | | | | | | | | | | | | | | | | | | | | | | | | | |
| | 10.67 | | | | | | 66,368 | | | | 1.62 | | | | 1.40 | | | | 1.40 | | | | 0.27 | | | | 38 | |
| | 9.97 | | | | | | 13,560 | | | | 2.51 | | | | 2.15 | | | | 2.15 | | | | (0.47 | ) | | | — | |
| | 9.89 | | | | | | 13,258 | | | | 2.33 | | | | 2.15 | | | | 2.15 | | | | (0.47 | ) | | | — | |
| | 10.81 | | | | | | 27,674 | | | | 1.30 | | | | 1.30 | | | | 1.30 | | | | 0.45 | | | | — | |
| | 11.08 | | | | | | 95,974 | | | | 1.07 | | | | 1.07 | | | | 1.07 | | | | 0.55 | | | | — | |
23
Report of Independent Registered Public Accounting Firm
The Board of Directors and Shareholders of
The Hartford Mutual Funds II, Inc.
We have audited the accompanying statement of assets and liabilities, including the schedule of investments, of The Hartford Value Opportunities Fund (one of the portfolios constituting The Hartford Mutual Funds II, Inc. (the Funds)) as of October 31, 2009, and the related statement of operations for the year then ended, the statements of changes in net assets for each of the two years in the period then ended, and the financial highlights for each of the periods indicated therein. These financial statements and financial highlights are the responsibility of the Funds’ management. Our responsibility is to express an opinion on these financial statements and financial highlights based on our audits.
We conducted our audits in accordance with the standards of the Public Company Accounting Oversight Board (United States). Those standards require that we plan and perform the audit to obtain reasonable assurance about whether the financial statements and financial highlights are free of material misstatement. We were not engaged to perform an audit of the Funds’ internal control over financial reporting. Our audits included consideration of internal control over financial reporting as a basis for designing audit procedures that are appropriate in the circumstances, but not for the purpose of expressing an opinion on the effectiveness of the Funds’ internal control over financial reporting. Accordingly, we express no such opinion. An audit also includes examining, on a test basis, evidence supporting the amounts and disclosures in the financial statements and financial highlights, assessing the accounting principles used and significant estimates made by management, and evaluating the overall financial statement presentation. Our procedures included confirmation of securities owned as of October 31, 2009, by correspondence with the custodian and brokers or by other appropriate auditing procedures where replies from brokers were not received. We believe that our audits provide a reasonable basis for our opinion.
In our opinion, the financial statements and financial highlights referred to above present fairly, in all material respects, the financial position of The Hartford Value Opportunities Fund of The Hartford Mutual Funds II, Inc. at October 31, 2009, the results of its operations for the year then ended, the changes in its net assets, and the financial highlights for each of the periods indicated therein, in conformity with U.S. generally accepted accounting principles.
Minneapolis, MN
December 15, 2009
24
The Hartford Value Opportunities Fund
Directors and Officers (Unaudited)
The Board of Directors appoints officers who are responsible for the day-to-day operations of the Fund and who execute policies formulated by the Directors. Each director serves until his or her death, resignation, or retirement or until the next annual meeting of shareholders is held or until his or her successor is elected and qualifies.
Directors and officers who are employed by or who have a financial interest in The Hartford are considered “interested” persons of the Fund pursuant to the Investment Company Act of 1940, as amended. Each officer and two of the Funds’ directors, as noted in the chart below, are “interested” persons of the Fund. Each director serves as a director for The Hartford Mutual Funds, Inc., The Hartford Mutual Funds II, Inc., The Hartford Income Shares Fund, Inc., Hartford Series Fund, Inc., and Hartford HLS Series Fund II, Inc., which, as of October 31, 2009, collectively consist of 93 funds. Correspondence may be sent to directors and officers c/o Hartford Mutual Funds, P.O. Box 2999, Hartford, Connecticut 06104-2999, except that correspondence to Ms. Fagely may be sent to 500 Bielenberg Drive, Woodbury, Minnesota 55125.
The table below sets forth, for each director and officer, his or her name, year of birth, current position with the Fund and date first elected or appointed to The Hartford Mutual Funds, Inc. (“MF”) and The Hartford Mutual Funds II, Inc. (“MF2”), principal occupation, and, for directors, other directorships held. The Fund’s statement of additional information contains further information on the directors and is available free of charge by calling 1-888-843-7824 or writing to Hartford Mutual Funds, P.O. Box 64387, St. Paul, MN 55164-0387.
Information on the aggregate remuneration paid to the directors of the Fund can be found in the Statement of Operations herein. The Fund pays to The Hartford a portion of the Chief Compliance Officer’s compensation, but does not pay salaries or compensation to any of its other officers or directors who are employed by The Hartford.
Non-Interested Directors
Lynn S. Birdsong (1946) Director since 2003, Co-Chairman of the Investment Committee
Mr. Birdsong is a private investor. Since 1981, Mr. Birdsong has been a partner in Birdsong Company, an advertising specialty firm. Since 2003, Mr. Birdsong has been an independent director of The Japan Fund. From 2003 to March 2005, Mr. Birdsong was an independent director of the Atlantic Whitehall Funds. From 1979 to 2002, Mr. Birdsong was a managing director of Zurich Scudder Investments, an investment management firm. During his employment with Scudder, Mr. Birdsong was an interested director of The Japan Fund.
Robert M. Gavin, Jr. (1940) Director since 2002 (MF) and 1986 (MF2), Chairman of the Board since 2004
Dr. Gavin is an educational consultant. Prior to September 1, 2001, he was President of Cranbrook Education Community and prior to July 1996, he was President of Macalester College, St. Paul, Minnesota.
Duane E. Hill (1945) Director since 2001 (MF) and 2002 (MF2), Chairman of the Nominating Committee
Mr. Hill is Partner of TSG Ventures L.P., a private equity investment company. He has served for over thirty years as a financial services executive in banking, venture capital and private equity.
Sandra S. Jaffee (1941) Director since 2005
Ms. Jaffee served as Chairman (2008-2009) and Chief Executive Officer of Fortent (formerly Searchspace Group), a leading provider of compliance/regulatory technology to financial institutions from August 2005 to August 2009. From August 2004 to August 2005, Ms. Jaffee served as an Entrepreneur in Residence with Warburg Pincus, a private equity firm. From September 1995 to July 2004, Ms. Jaffee served as Executive Vice President at Citigroup, where she was President and Chief Executive Officer of Citibank’s Global Securities Services (1995-2003).
William P. Johnston (1944) Director since 2005, Chairman of the Compliance Committee
In February 2008, Mr. Johnston was elected to the Board of Directors of HCR-ManorCare, Inc. In August 2007, Mr. Johnston was elected to the Board of Directors of LifeCare Holdings, Inc. In July, 2006, Mr. Johnston was elected to the Board of Directors of MultiPlan, Inc. In June 2006, Mr. Johnston was appointed as Senior Advisor to The Carlyle Group, a global private equity investment firm. In May 2006, Mr. Johnston was elected to the Supervisory Board of Fresenius Medical Care AG & Co. KGaA, after its acquisition of Renal Care Group, Inc. in March 2006. Mr. Johnston joined Renal Care Group in November 2002 as a member of the Board of Directors and served as Chairman of the Board from March 2003 through March 2006. From September 1987 to December 2002, Mr. Johnston was with Equitable Securities Corporation (and its successors, SunTrust Equitable Securities and SunTrust Robinson Humphrey) serving in various investment banking and managerial positions, including Managing Director and Head of Investment Banking, Chief Executive Officer and Vice Chairman.
25
The Hartford Value Opportunities Fund
Directors and Officers (Unaudited) — (continued)
Phillip O. Peterson (1944) Director since 2002 (MF) and 2000 (MF2), Chairman of the Audit Committee
Mr. Peterson is a mutual fund industry consultant. He was a partner of KPMG LLP (an accounting firm) until July 1999. Mr. Peterson joined William Blair Funds in February 2007 as a member of the Board of Trustees. From January 2004 to April 2005, Mr. Peterson served as Independent President of the Strong Mutual Funds.
Lemma W. Senbet (1946) Director since 2005
Dr. Senbet is the William E. Mayer Chair Professor of Finance at the University of Maryland, Robert H. Smith School of Business. He was chair of the Finance Department during 1998-2006. Previously he was an endowed professor of finance at the University of Wisconsin-Madison. Also, he was director of the Fortis Funds from March 2000-July 2002. Dr. Senbet served the finance profession in various capacities, including as director of the American Finance Association and President of the Western Finance Association. In 2006, Dr. Senbet was inducted Fellow of Financial Management Association International for his career-long distinguished scholarship and professional service.
Interested Directors and Officers
Lowndes A. Smith (1939) Director since 1996 (MF) and 2002 (MF2), Co-Chairman of the Investment Committee
Mr. Smith served as Vice Chairman of The Hartford from February 1997 to January 2002, as President and Chief Executive Officer of Hartford Life, Inc. from February 1997 to January 2002, and as President and Chief Operating Officer of The Hartford Life Insurance Companies from January 1989 to January 2002. Mr. Smith serves as a Director of White Mountains Insurance Group, Ltd., One Beacon Insurance, Symetra Financial and as a Managing Director of Whittington Gray Associates.
John C. Walters* (1962) Director since 2008
Mr. Walters currently serves as President, Chief Executive Officer and Director for Hartford Life, Inc. (“HL, Inc.”). Mr. Walters also serves as President, Chairman of the Board, Chief Executive Officer and Director for Hartford Life Insurance Company (“Hartford Life”), and as Executive Vice President of The Hartford Financial Services Group, Inc. (“The Hartford”). In addition, Mr. Walters is Manager of HL Investment Advisors, LLC (“HL Advisors”). Mr. Walters previously served as Co-Chief Operating Officer of Hartford Life (2007-2008), and as President of the U.S. Wealth Management Division of HL, Inc. (2006-2007). Mr. Walters joined Hartford Life in April 2000 from First Union Securities, the brokerage subsidiary of First Union Corp.
| * | | Mr. Walters previously served as President and Chief Executive Officer of the Fund (2007 – 2009). |
Other Officers
Robert M. Arena, Jr. (1968) President and Chief Executive Officer since 2009 (served as Vice President of the Fund (2006—2009))
Mr. Arena serves as Executive Vice President of Hartford Life. Additionally, Mr. Arena is Senior Vice President and Director of Hartford Administrative Services Company, (“HASCO”), President, Chief Executive Officer and Manager of Hartford Investment Financial Services, LLC (“HIFSCO”) and President, Chief Executive Officer and Manager of HL Advisors. Prior to joining The Hartford in 2004, he was Senior Vice President in charge of Product Management for American Skandia/Prudential in the individual annuities division.
Tamara L. Fagely (1958) Vice President, Treasurer and Controller since 2002 (MF) 1993 (MF2)
Ms. Fagely has been a Vice President of HASCO since 1998 and Chief Financial Officer since 2006. Currently Ms. Fagely is a Vice President of Hartford Life. In addition, Ms. Fagely is Controller and Chief Financial Officer of HIFSCO. She served as Assistant Vice President of Hartford Life from December 2001 through March 2005.
Brian Ferrell (1962) AML Compliance Officer since 2008
Mr. Ferrell has served as Assistant Vice President and AML Compliance Officer for The Hartford since 2006, and as AML Compliance Officer for HASCO and Hartford Investor Services Company, LLC (“HISC”) since 2008. Prior to joining The Hartford in 2006, Mr. Ferrell held various positions at the U.S. Department of the Treasury (the “Treasury”) from 2001 to 2006, where he served as Chief Counsel for the Treasury’s Financial Crimes Enforcement Network from 2005 – 2006.
Dr. Robert J. Froehlich (1953) Senior Managing Director since 2009
Dr. Froehlich joined The Hartford as Senior Managing Director in September 2009. Prior to joining The Hartford, Dr. Froehlich served as Vice Chairman of Deutsche Asset Management from 1997 – 2009.
26
Thomas D. Jones, III (1965) Vice President and Chief Compliance Officer since 2006
Mr. Jones serves as Chief Compliance Officer for the Hartford Mutual Funds and Vice President and Director of Securities Compliance for The Hartford. He is also Vice President of HIFSCO, HL Advisors, and Hartford Life. Mr. Jones joined The Hartford in 2006 from SEI Investments, where he served as Chief Compliance Officer for its mutual funds and investment advisers. Prior to joining SEI, Mr. Jones was First Vice President and Compliance Director for Merrill Lynch Investment Managers (Americas) (“MLIM”), where he worked from 1992-2004. At MLIM, Mr. Jones was responsible for the compliance oversight of various investment products, including mutual funds, wrap accounts, institutional accounts and alternative investments.
Edward P. Macdonald (1967) Vice President, Secretary and Chief Legal Officer since 2005
Mr. Macdonald serves as Assistant Vice President of Hartford Life and Chief Legal Officer, Secretary and Vice President of HIFSCO. He also serves as Vice President and Secretary of HASCO, and Chief Legal Officer, Secretary and Vice President of HL Advisors. Prior to joining The Hartford in 2005, Mr. Macdonald was Chief Counsel, Investment Management for Prudential Financial (formerly American Skandia Investment Services, Inc.). He joined Prudential in April 1999.
Vernon J. Meyer (1964) Vice President since 2006
Mr. Meyer serves as Senior Vice President of Hartford Life. He also serves as Senior Vice President of HIFSCO and HL Advisors. Mr. Meyer joined The Hartford in 2004 from MassMutual which he joined in 1987.
D. Keith Sloane (1960) Vice President since 2009
Mr. Sloane is a Senior Vice President of Hartford Life. Additionally, Mr. Sloane currently serves as Senior Vice President of HIFSCO, HL Advisors, and HASCO. Prior to joining The Hartford in 2007, Mr. Sloane was Director of product marketing and led the mutual fund business for Wachovia Securities (“Wachovia”) in their investment products group. Mr. Sloane joined Wachovia in 1995.
Jane Wolak (1961) Vice President since 2009
Ms. Wolak currently serves as Vice President of Hartford Life. Ms. Wolak joined Hartford Life as Vice President, Retail Product Services in May 2007. She is also Vice President of HASCO. Previously, Ms. Wolak was with Sun Life Financial where she held the position of Vice President, Service Center Operations from 2001 – 2007.
HOW TO OBTAIN A COPY OF THE FUND’S PROXY VOTING POLICIES AND VOTING RECORDS
A description of the policies and procedures that the Fund uses to determine how to vote proxies relating to portfolio securities and a record of how the Fund voted any proxies for the twelve-month period ended June 30, 2009 is available (1) without charge, upon request, by calling 888-843-7824 and (2) on the Securities and Exchange Commission’s website at http://www.sec.gov.
QUARTERLY PORTFOLIO HOLDINGS INFORMATION
The Fund files a complete schedule of portfolio holdings with the Commission for the first and third quarters of each fiscal year on Form N-Q. The Fund’s Forms are available (1) without charge, upon request, by calling 888-843-7824 and (2) on the Securities and Exchange Commission’s website at http://www.sec.gov . The Form N-Q may be reviewed and copied at the Commission’s Public Reference Room in Washington, DC. Information on the operation of the Public Reference Room may be obtained by calling 1-800-SEC-0330.
27
The Hartford Value Opportunities Fund
Federal Tax Information (Unaudited)
The information set forth below is for the Fund’s fiscal year as required by federal tax law. Shareholders, however, must report distributions on a calendar year basis for income tax purposes which may include distributions of two fiscal years of the Fund. Accordingly, the information needed by shareholders for income tax purposes will be sent to them in early 2010. Shareholders may wish to consult a tax advisor on how to report distributions for state and local purposes.
| | |
| * | | Income distributions, taxable as dividend income which qualify for deduction by corporations. |
| |
| † | | For the fiscal year ended October 31, 2009, certain dividends paid by the Fund may be subject to a maximum tax rate of 15%, as provided for by the Jobs and Growth Tax Relief Reconciliation Act of 2003. The Fund intends to designate ordinary distributions declared as taxed at a maximum rate of 15%. |
Detailed below are the per share distributions made for the fiscal year ended October 31, 2009.
| | | | | | | | | | | | | | | | | |
| | | | | | | Short-Term | | Long-Term | | |
| | | Income | | Capital Gain | | Capital Gain | | Total |
| Class A | | | 0.146 | | | | N/A | | | | N/A | | | | 0.146 | |
| Class B | | | 0.096 | | | | N/A | | | | N/A | | | | 0.096 | |
| Class C | | | 0.051 | | | | N/A | | | | N/A | | | | 0.051 | |
| Class I | | | 0.170 | | | | N/A | | | | N/A | | | | 0.170 | |
| Class L | | | 0.175 | | | | N/A | | | | N/A | | | | 0.175 | |
| Class R3 | | | 0.141 | | | | N/A | | | | N/A | | | | 0.141 | |
| Class R4 | | | 0.170 | | | | N/A | | | | N/A | | | | 0.170 | |
| Class R5 | | | 0.196 | | | | N/A | | | | N/A | | | | 0.196 | |
| Class Y | | | 0.203 | | | | N/A | | | | N/A | | | | 0.203 | |
The Fund also designates as distributions of long-term gains, to the extent necessary to fully distribute such capital gains, earnings and profits distributed to shareholders on the redemption of shares.
28
The Hartford Value Opportunities Fund
Expense Example (Unaudited)
Your Fund’s Expenses
As a shareholder of the Fund, you incur two types of costs: (1) transaction costs, including sales charges (loads) on purchase payments and contingent deferred sales charges (CDSC) (2) ongoing costs including management fees; distribution fees; and other fund expenses. This example is intended to help you understand your ongoing costs (in dollars) of investing in the Fund and to compare these costs with the ongoing costs of investing in other mutual funds. The example is based on an investment of $1,000 invested at the beginning of the period and held for the period of April 30, 2009 through October 31, 2009.
Actual Expenses
The first set of columns of the table below provides information about actual account values and actual expenses. You may use the information in this column, together with the amount you invested, to estimate the expenses that you paid over the period. Simply divide your account value by $1,000 (for example, an $8,600 account value divided by $1,000 = 8.6), then multiply the result by the number in the line under the heading entitled “Expenses Paid During Period” to estimate the expenses you paid on your account during this period.
Hypothetical Example for Comparison Purposes
The second set of columns of the table below provides information about hypothetical account values and hypothetical expenses based on the Fund’s actual expense ratio and an assumed rate of return of 5% per year before expenses, which is not the Fund’s actual return. The hypothetical account values and expenses may not be used to estimate the actual ending account balance or expenses you paid for the period. You may use this information to compare the ongoing costs of investing in the Fund and other funds. To do so, compare this 5% hypothetical example with the 5% hypothetical examples that appear in the shareholder reports of the other funds.
Please note that the expenses shown in the table are meant to highlight your ongoing costs only and do not reflect any transactional costs, such as sales charges (loads) and CDSC. Therefore, the second set of columns of the table is useful in comparing ongoing costs only, and will not help you determine the relative total costs of owning different funds. In addition, if these transactional costs were included, your costs would be higher. Expenses are equal to the Fund’s annualized expense ratios multiplied by average account value over the period, multiplied by 184/365 (to reflect the one-half year period).
| | | | | | | | | | | | | | | | | | | | | | | | | | | | | | | | | | | | | | |
| | | Actual return | | | Hypothetical (5% return before expenses) | | | | | | | | |
| | | | | | | | | | | Expenses paid | | | | | | | | | | | Expenses paid | | | | | | Days in | | |
| | | | | | | | | | | during the period | | | | | | | | | | | during the period | | | | | | the | | Days |
| | | Beginning | | Ending Account | | April 30, 2009 | | | Beginning | | Ending Account | | April 30, | | Annualized | | current | | in the |
| | | Account Value | | Value | | through | | | Account Value | | Value | | 2009 through | | expense | | 1/2 | | full |
| | | April 30, 2009 | | October 31, 2009 | | October 31, 2009 | | | April 30, 2009 | | October 31, 2009 | | October 31, 2009 | | ratio | | year | | year |
| Class A | | $ | 1,000.00 | | | $ | 1,248.80 | | | $ | 7.20 | | | | $ | 1,000.00 | | | $ | 1,018.80 | | | $ | 6.46 | | | | 1.27 | % | | | 184 | | | | 365 | |
| Class B | | $ | 1,000.00 | | | $ | 1,246.30 | | | $ | 9.80 | | | | $ | 1,000.00 | | | $ | 1,016.48 | | | $ | 8.79 | | | | 1.73 | | | | 184 | | | | 365 | |
| Class C | | $ | 1,000.00 | | | $ | 1,243.90 | | | $ | 11.42 | | | | $ | 1,000.00 | | | $ | 1,015.02 | | | $ | 10.26 | | | | 2.02 | | | | 184 | | | | 365 | |
| Class I | | $ | 1,000.00 | | | $ | 1,251.90 | | | $ | 6.24 | | | | $ | 1,000.00 | | | $ | 1,019.66 | | | $ | 5.60 | | | | 1.10 | | | | 184 | | | | 365 | |
| Class L | | $ | 1,000.00 | | | $ | 1,250.00 | | | $ | 6.52 | | | | $ | 1,000.00 | | | $ | 1,019.41 | | | $ | 5.85 | | | | 1.15 | | | | 184 | | | | 365 | |
| Class R3 | | $ | 1,000.00 | | | $ | 1,247.00 | | | $ | 9.06 | | | | $ | 1,000.00 | | | $ | 1,017.14 | | | $ | 8.13 | | | | 1.60 | | | | 184 | | | | 365 | |
| Class R4 | | $ | 1,000.00 | | | $ | 1,249.40 | | | $ | 7.37 | | | | $ | 1,000.00 | | | $ | 1,018.65 | | | $ | 6.61 | | | | 1.30 | | | | 184 | | | | 365 | |
| Class R5 | | $ | 1,000.00 | | | $ | 1,252.10 | | | $ | 5.68 | | | | $ | 1,000.00 | | | $ | 1,020.16 | | | $ | 5.09 | | | | 1.00 | | | | 184 | | | | 365 | |
| Class Y | | $ | 1,000.00 | | | $ | 1,252.40 | | | $ | 5.22 | | | | $ | 1,000.00 | | | $ | 1,020.57 | | | $ | 4.69 | | | | 0.92 | | | | 184 | | | | 365 | |
29
The Hartford Value Opportunities Fund
Approval of Investment Management and Investment Sub-Advisory Agreements (Unaudited)
Section 15(c) of the Investment Company Act of 1940, as amended (the “1940 Act”), requires that each mutual fund’s board of directors, including a majority of those directors who are not “interested persons” of the mutual fund, as defined in the 1940 Act (the “Independent Directors”), annually review and consider the continuation of the mutual fund’s investment advisory and sub-advisory agreements. At its meeting held on August 4-5, 2009, the Board of Directors (the “Board”) of The Hartford Value Opportunities Fund (the “Fund”), including each of the Independent Directors, unanimously voted to approve the continuation of the investment management agreement for the Fund with Hartford Investment Financial Services, LLC (“HIFSCO”) and the continuation of the investment sub-advisory agreement between HIFSCO and the Fund’s sub-adviser Wellington Management Company, LLP (“Sub-adviser,” and together with HIFSCO, “Advisers”) (collectively, the “Agreements”).
In the months preceding the August 4-5, 2009 meeting, the Board requested, received, and reviewed written responses from the Advisers to questions posed to them on behalf of the Independent Directors and supporting materials relating to those questions and responses. The Board considered information furnished to the Board at its meetings throughout the year, as well as information specifically prepared in connection with the annual approval of the Agreements at the Board’s meetings held on June 23-24, 2009 and August 4-5, 2009. Information provided to the Board at its meetings throughout the year, included, among other things, reports on Fund performance, legal and compliance matters, sales and marketing activity, shareholder services, and the other services provided to the Fund by the Advisers, and their affiliates. In addition, the Board received in-person presentations by Fund officers and representatives of HIFSCO at the Board’s meetings on June 23-24, 2009 and August 4-5, 2009 concerning the Agreements.
The Independent Directors, advised by independent legal counsel, engaged two service providers to assist them with evaluating the Agreements with respect to the Fund. Lipper Inc. (“Lipper”), an independent provider of investment company data, was retained to provide the Board with reports on how the Fund’s contractual management fees, actual management fees, other non-management fees, overall expense ratios and investment performance compared to those of mutual funds with similar investment objectives. The Independent Directors also engaged an independent financial services consulting firm (the “Consultant”) to assist them in evaluating the Fund’s management fees, sub-advisory fees, other non-management fees, overall expense ratios and investment performance. In addition, the Consultant reviewed the profitability calculations utilized by HIFSCO in connection with the continuation of the investment management agreement.
In determining to continue the Agreements for the Fund, the members of the Board reviewed and evaluated information and factors they believed to be relevant and appropriate in light of the information that the Board deemed necessary and appropriate and through the exercise of their reasonable business judgment. While individual members of the Board may have weighed certain factors differently, the Board’s determination to continue the Agreements was based on a comprehensive consideration of all information provided to the Board throughout the year and specifically with respect to the continuation of the Agreements. A more detailed discussion of the factors the Board considered with respect to its approval of the Agreements is provided below.
Nature, Extent And Quality Of Services Provided by the Advisers
The Board requested and considered information concerning the nature, extent, and quality of the services provided to the Fund by the Advisers. The Board considered, among other things, the terms of the Agreements and the range of services provided by the Advisers. In this regard, the Board considered information provided to it by HIFSCO concerning the Agreements, which were amended and restated to more completely reflect the services provided to the Fund, but did not result in a material amendment to the Fund’s prior contractual arrangement. The Board considered the Advisers’ professional personnel who provide services to the Fund, including each Adviser’s ability and experience in attracting and retaining qualified personnel to service the Fund. The Board considered each Adviser’s reputation and overall financial strength, as well as its willingness to consider and implement organizational and operational changes designed to improve services to the Fund. In addition, the Board considered the quality of each Adviser’s communications with the Board and responsiveness to Board inquiries.
The Board also requested and evaluated information concerning each Adviser’s regulatory and compliance environment. In this regard, the Board requested and reviewed information on each Adviser’s compliance policies and procedures, compliance history, and a report from the Fund’s Chief Compliance Officer on each Adviser’s compliance with applicable laws and regulations, including responses to regulatory developments and compliance issues raised by regulators. The Board also noted the Advisers’ support of the Fund’s compliance control structure, particularly the resources devoted by the Advisers in support of the Fund’s obligations pursuant to Rule 38a-1 under the 1940 Act.
30
With respect to HIFSCO, the Board noted that under the Agreements, HIFSCO is responsible for the management of the Fund, including overseeing fund operations and service providers and provides administration services to the Fund as well as investment advisory services in connection with selecting, monitoring and supervising the Sub-adviser. The Board considered HIFSCO’s constant monitoring of people, process and performance, including its ongoing commitment to review and rationalize The Hartford Fund Family’s product line-up. The Board considered that HIFSCO or its affiliates are responsible for providing the Fund’s officers and paying their salaries and expenses.
With respect to the Sub-adviser, who provides day-to-day portfolio management services, the Board considered the quality of the Fund’s portfolio managers, the Sub-adviser’s other investment personnel, its investment philosophy and process, investment research capabilities and resources, performance record, trade execution capabilities and experience. The Board considered the experience of the Fund’s portfolio managers, the number of accounts managed by the portfolio managers, and the Sub-adviser’s method for compensating the portfolio managers.
Based on these considerations, the Board concluded that it was satisfied with the nature, extent and quality of the services provided to the Fund by HIFSCO and the Sub-adviser.
Performance of the Fund and the Advisers
The Board considered the investment performance of the Fund. In this regard, the Board reviewed the performance of the Fund over different time periods presented in the materials and evaluated HIFSCO’s analysis of the Fund’s performance for these time periods. The Board considered information and materials provided to the Board by the Advisers concerning Fund performance, as well as information from Lipper comparing the investment performance of the Fund to an appropriate universe of peer funds.
The Board considered the detailed investment analytics reports provided by The Hartford’s Investment Advisory Group throughout the year. These reports include, among other things, information on the Fund’s gross and net returns, the Fund’s investment performance relative to an appropriate benchmark and peer group, various statistics concerning the Fund’s portfolio, and a narrative summary of various factors affecting Fund performance. The Board considered the Advisers’ cooperation with the Investment Committee, which assists the Board in evaluating the performance of the Fund at periodic meetings throughout the year. The Board also considered the analysis provided by the Consultant relating to the Fund’s performance track record. The Board noted HIFSCO’s initiatives over the course of the year to address performance issues.
In light of all the considerations noted above, the Board concluded that it had continued confidence in HIFSCO’s and the Sub-adviser’s overall capabilities to manage the Fund.
Costs of the Services and Profitability of the Advisers
The Board reviewed information regarding HIFSCO’s cost to provide investment management and related services to the Fund and HIFSCO’s profitability, both overall and for the Fund, on a pre-tax basis without regard to distribution expenses. The Board also requested and reviewed information about the profitability to HIFSCO and its affiliates from all services provided to the Fund and all aspects of their relationship with the Fund. The Board also requested and received information relating to the operations and profitability of the Sub-adviser.
The Board considered the Consultant’s review of the profitability calculations utilized by HIFSCO in connection with the continuation of the investment management agreement. In this regard, the Consultant reported that The Hartford’s process for calculating and reporting Fund profitability is reasonable, sound and well within common industry practice.
Based on these considerations, the Board concluded that the profits anticipated to be realized by the Advisers and their affiliates from their relationships with the Fund would not be excessive.
Comparison of Fees and Services Provided by the Advisers
The Board considered comparative information with respect to the investment management fees to be paid by the Fund to HIFSCO, the investment sub-advisory fees to be paid by HIFSCO to the Sub-adviser, and the total expense ratios of the Fund. In this regard, the Board requested and reviewed information from HIFSCO and the Sub-adviser relating to the management and
31
The Hartford Value Opportunities Fund
Approval of Investment Management and Investment Sub-Advisory Agreements (Unaudited) — (continued)
sub-advisory fees, and total operating expenses for the Fund. The Board also reviewed information from Lipper comparing the Fund’s contractual management fees, actual management fees and overall expense ratios, relative to a group of funds selected by Lipper, in consultation with the Consultant (“Expense Group”), and a broader universe of funds selected by Lipper (“Expense Universe”). The Board considered that as of November 1, 2009, transfer agency fees in excess of the transfer agency expense limitation amount (currently 0.30%) will be reimbursed by Hartford Administrative Services Company (“HASCO”) prior to the application of the Fund’s expense limitation by HIFSCO. The Board considered that in 2008, HIFSCO permanently reduced the contractual management fee by five basis points at the first two breakpoints and reduced the expense cap by five basis points.
While the Board recognized that comparisons between the Fund and peer funds are imprecise, given the differing service levels and characteristics of mutual funds and the different business models and cost structures of the Advisers, the comparative information provided by Lipper assisted the Board in evaluating the reasonableness of the Fund’s management fees and total operating expenses. In addition, the Board considered the analysis and recommendations of the Consultant relating to the Fund’s management and sub-advisory fees and total operating expenses.
Based on these considerations, the Board concluded that the Fund’s fees and total operating expenses, in conjunction with the information about quality of services, profitability, economies of scale, and other matters discussed, were reasonable in light of the services provided.
Economies of Scale
The Board requested and considered information regarding the Advisers’ realization of economies of scale with respect to the Fund, and whether the fee levels reflect these economies of scale for the benefit of the Fund’s investors. With respect to HIFSCO, the Board considered representations from HIFSCO that it is difficult to anticipate whether and the extent to which economies may be realized by HIFSCO as assets grow over time. The Board reviewed the breakpoints in the advisory fee schedule for the Fund, which reduces fees as Fund assets grow over time. The Board recognized that a fund with assets beyond the last breakpoint level will continue to benefit from economies of scale, because additional assets are charged the lowest breakpoint fee, resulting in lower overall effective management fee rates. The Board also considered that expense limitations and fee waivers that reduce the Fund’s expenses at all asset levels can have the same effect as breakpoints in sharing economies of scale with shareholders, and that a schedule that reaches a lower breakpoint quickly provides shareholders with the benefit of anticipated or potential economies of scale.
The Board reviewed and evaluated materials from Lipper showing how management fee schedules of peer funds reflect economies of scale for the benefit of investors as a peer fund’s assets hypothetically increase over time. Based on information provided by HIFSCO, Lipper, and the Consultant, the Board recognized that there is no uniform methodology for establishing breakpoints, or uniform pattern in asset levels that trigger breakpoints or the amounts of breakpoints triggered.
After considering all of the information available to it, the Board concluded that it was satisfied with the extent to which economies of scale would be shared for the benefit of the Fund’s shareholders, based on currently available information and the effective advisory fees and expense ratios for the Fund at its current and reasonably anticipated asset levels. The Board noted, however, that it would continue to monitor future growth in Fund assets and the appropriateness of additional breakpoints.
Other Benefits
The Board considered other benefits to the Advisers and their affiliates from their relationships with the Fund.
The Board reviewed information noting that Hartford Life, Inc. (“Hartford Life”) an affiliate of HIFSCO, receives fees for fund accounting and related services from the Fund, and the Board considered information on expected profits to Hartford Life or its affiliates for such services. The Board also considered that HASCO, the Fund’s transfer agent and an affiliate of HIFSCO, receives transfer agency compensation from the Fund, and the Board reviewed information on the expected profitability of the Fund’s transfer agency function to HASCO. The Board noted that HASCO is a recognized leader in providing high quality services to Fund shareholders and has received six consecutive mutual fund Dalbar service awards. The Board considered information provided by HASCO indicating that the transfer agent fees charged by HASCO to the Fund were fair and reasonable based on publicly available information.
32
The Board also considered that, as principal underwriter of the Fund, HIFSCO receives 12b-1 fees from the Fund and receives all or a portion of the sales charges on sales or redemptions of certain classes of shares. The Board also noted that certain affiliates of HIFSCO distribute shares of the Fund and receive compensation in that connection.
The Board considered benefits to the Sub-adviser from its use of the Fund’s brokerage commissions to obtain soft dollar research, and representations from HIFSCO and the Sub-adviser that the Sub-adviser would not make any revenue-sharing payments or any other type of distribution payments to HIFSCO or its affiliates.
The Board considered the benefits to shareholders of being part of the Hartford family of funds, including the right to exchange investments between the same class of funds without a sales charge, the ability to reinvest Fund dividends into other funds in the family, and the ability to combine holdings in the Fund with holdings in other funds to obtain a reduced sales charge. The Board considered HIFSCO’s efforts to provide investors in the family with a broad range of investment styles and asset classes and its entrepreneurial risk in initiating new funds to expand these opportunities for shareholders.
* * * *
Based upon its review of these various factors, among others, the Board concluded that it is in the best interests of the Fund and its shareholders for the Board to approve the Agreements for an additional year. In reaching this decision, the Board did not assign relative weights to the factors discussed above or deem any one or group of them to be controlling in and of themselves. In connection with their deliberations, the Independent Directors met separately in executive session on several occasions, with independent legal counsel, to review the relevant materials and consider their responsibilities under relevant laws and regulations.
33
This information is written in connection with the promotion or marketing of the matter(s) addressed in this material. The information cannot be used or relied upon for the purpose of avoiding IRS penalties. These materials are not intended to provide tax, accounting or legal advice. As with all matters of a tax or legal nature, you should consult your own tax or legal counsel for advice.
You should carefully consider investment objectives, risks, and charges and expenses of The Hartford Mutual Funds before investing. This and other information can be found in the Fund’s prospectus, which can be obtained from your investment representative or by calling 888-843-7824. Please read it carefully before you invest or send money.
The Hartford Mutual Funds are underwritten and distributed by Hartford Investment Financial Services, LLC.
“The Hartford” is The Hartford Financial Services Group, Inc., and its subsidiaries.
Mutual fund inception dates range from 1949 to date. The Hartford Mutual Funds are not a subsidiary of The Hartford but are underwritten, distributed by, and advised by subsidiaries of The Hartford. Investments in The Hartford Mutual Funds are not guaranteed by The Hartford or any other entity.
MFAR-51 12/09 MUT 8759 Printed in U.S.A. © 2009 The Hartford, Hartford, CT 06117
Item 2. Code of Ethics.
Registrant has adopted a code of ethics that applies to Registrant’s principal executive officer, principal financial officer, and controller, which is attached as an exhibit.
Item 3. Audit Committee Financial Expert.
The Board of Directors has designated Phillip O. Peterson as an Audit Committee Financial Expert. Mr. Peterson is considered by the Board to be an independent director.
Item 4. Principal Accountant Fees and Services.
Mutual Funds II N-CSR Item 4 — October 31, 2009
| | | | | | | | | |
| | | Mutual Funds II | |
| | | 2008 | | | 2009 | |
| | | | | | | | | |
| a Audit Fees | | $ | 133,200 | | | $ | 133,000 | |
| | | | | | | | | |
| b Audit related fees | | $ | 3,625 | | | $ | 5,261 | |
| | | | | | | | | |
| | | Audit-related services principally in connection with SEC Rule 17Ad-13 report. |
| | | | | | | | | |
| c Tax Fees | | $ | 32,081 | | | $ | 30,904 | |
| | | | | | | | | |
| d All other fees | | $ | — | | | $ | — | |
| | | | | | | | | |
| e (1) | | A copy of the Audit Committee’s pre-approval policies and procedures is attached as an exhibit. |
| | | | | | | | | |
| e (2) subject to pre approvel | | One Hundred percent of the services described in items 4(b) through 4(d) were approved in accordance with the Audit Committee’s Pre-Approval Policy. As a result, none of such services was approved pursuant to paragraph (c) (7) (i) (c) of Rule 2-01 of Regulation S-X |
| | | | | | | | | |
| f hours | | None of the hours expended on the principal accountant’s engagement to audit the Registrant’s financial statements for the year ended October 31, 2007, were attributed to work performed by persons other than the principal accountant’s full-time employees. |
| | | | | | | | | |
| g Non audit fees | | $ | 1,026,725 | | | $ | 998,615 | |
| | | | | | | | | |
| h | | The registrant’s Audit Committee of the Board of Directors has considered whether the provision of non-audit services that were rendered to the registrant’s investment adviser (not including any sub-adviser whose role is primarily portfolio management and is subcontracted with or overseen by another investment adviser), and any entity controlling, controlled by, or under common control with the investment adviser that provides ongoing services to the registrant that were not pre-approved pursuant to paragraph (c)(7)(ii) of Rule 2-01 of Regulation S-X is compatible with maintaining the principal accountant’s independence. |
Item 5. Audit Committee of Listed Registrants.
Robert M. Gavin
Sandra S. Jaffee
William P. Johnston
Phillip O. Peterson
Item 6. Schedule of Investments
The Schedule of Investments is included as part of the annual report filed under Item 1 of this form.
Item 7. Disclosure of Proxy Voting Policies and Procedures for Closed-End Management Investment Companies.
Not applicable.
Item 8. Portfolio Managers of Closed-End Management Investment Companies.
Not applicable.
Item 9. Purchases of Equity Securities by Closed-End Management Investment Company and Affiliated Purchasers.
Not applicable.
Item 10. Submission of Matters to a Vote of Security Holders
There have been no material changes to the procedures by which shareholders may recommend nominees to the registrant’s board of directors since registrant last provided disclosure in response to this requirement.
Item 11. Controls and Procedures.
| | (a) | | Based on an evaluation of the Registrant’s Disclosure Controls and Procedures as of a date within 90 days of the filing date of this report, the Disclosure Controls and Procedures are effectively designed to ensure that information required to be disclosed by the Registrant is recorded, processed, summarized and reported by the date of this report, including ensuring that information required to be disclosed in the report is accumulated and communicated to the Registrant’s management, including the Registrant’s officers, as appropriate, to allow timely decisions regarding required disclosure. |
| |
| | (b) | | There was no change in the Registrant’s internal control over financial reporting that occurred during the Registrant’s last fiscal half year that has materially affected, or is reasonably likely to materially affect, the registrant’s internal control over financial reporting. |
Item 12. Exhibits.
| | | | |
| | 11(a) (2) | | Section 302 certifications of the principal executive officer and principal financial officer of Registrant. |
| | | | |
| | (b) | | Section 906 certification. |
| | | | |
| | 12(a)(1) | | Code of Ethics |
| | | | |
| | 12(a)(2) | | Audit Committee Pre-Approval Policies and Procedures |
SIGNATURES
Pursuant to the requirements of the Securities Exchange Act of 1934 and the Investment Company Act of 1940, the registrant has duly caused this report to be signed on its behalf by the undersigned, thereunto duly authorized.
| | | | | |
| | THE HARTFORD MUTUAL FUNDS II, INC.
| |
| Date: December 14, 2009 | By: | /s/ Robert M. Arena | |
| | | Robert M. Arena | |
| | | Its: President | |
| |
Pursuant to the requirements of the Securities Exchange Act of 1934 and the Investment Company Act of 1940, this report has been signed below by the following persons on behalf of the registrant and in the capacities and on the dates indicated.
| | | | | |
| | | |
| Date: December 14, 2009 | By: | /s/ Robert M. Arena | |
| | | Robert M. Arena | |
| | | Its: President | |
| |
| | | |
| Date: December 14, 2009 | By: | /s/ Tamara L. Fagely | |
| | | Tamara L. Fagely | |
| | | Its: Vice President, Controller and Treasurer | |
EXHIBIT LIST
| | | | | | | |
| 99.CERT | | | 11(a) | (2) | | Certifications |
| | | | | | | |
| | | | | | | (i) Section 302 certification of principal executive officer |
| | | | | | | |
| | | | | | | (ii) Section 302 certification of principal financial officer |
| | | | | | | |
| 99.906CERT | | | 11(b | ) | | Section 906 certification of principal executive officer and principal financial officer |
| | | | | | | |
| | | | 12(a | )(1) | | Code of Ethics |
| | | | | | | |
| | | | 12(a | )(2) | | Audit Committee Pre-Approval Policies and Procedures |