UNITED STATES
SECURITIES AND EXCHANGE COMMISSION
Washington, D.C. 20549
FORM N-CSR
CERTIFIED SHAREHOLDER REPORT OF REGISTERED MANAGEMENT INVESTMENT COMPANIES
Investment Company Act file number: 811-00558
THE HARTFORD MUTUAL FUNDS II, INC.
(Exact name of registrant as specified in charter)
P. O. Box 2999, Hartford, Connecticut 06104-2999
(Address of Principal Executive Offices)
Edward P. Macdonald, Esquire
Life Law Unit
The Hartford Financial Services Group, Inc.
200 Hopmeadow Street
Simsbury, Connecticut 06089
(Name and Address of Agent for Service)
Registrant’s telephone number, including area code: (860) 843-9934
Date of fiscal year end: October 31, 2011
Date of reporting period: November 1, 2010 – October 31, 2011
Form N-CSR is to be used by management investment companies to file reports with the Commission not later than 10 days after the transmission to stockholders of any report that is required to be transmitted to stockholders under Rule 30e-1 under the Investment Company Act of 1940 (17 CFR 270.30e-1). The Commission may use the information provided on Form N-CSR in its regulatory, disclosure review, inspection, and policymaking roles.
A registrant is required to disclose the information specified by Form N-CSR, and the Commission will make this information public. A registrant is not required to respond to the collection of information contained in Form N-CSR unless the Form displays a currently valid Office of Management and Budget ("OMB") control number. Please direct comments concerning the accuracy of the information collection burden estimate and any suggestions for reducing the burden to Secretary, Securities and Exchange Commission, 450 Fifth Street, NW, Washington, DC 20549-0609. The OMB has reviewed this collection of information under the clearance requirements of 44 U.S.C. § 3507.
Item 1. Reports to Stockholders.
THE HARTFORD MUTUAL FUNDS 2011 Annual Report The Hartford Growth Fund |
A MESSAGE FROM THE PRESIDENT
Dear Fellow Shareholders:
I want to take this opportunity to say thank you for investing in The Hartford Mutual Funds.
This has been a tumultuous year. In the beginning of 2011, we witnessed tension-fueled political uprisings in the already-volatile Middle East and North Africa region. We also watched as Japan dealt with a series of crises including a massive earthquake and subsequent tsunami. Yet, U.S. economic conditions continued to improve, with gains in consumer confidence and retail sales. During the first half of 2011, domestic, international, and world indices (as measured by the S&P 500, MSCI EAFE and MSCI World) were all up more than 5% through June, 30 2011.
The economic recovery, however, lost momentum in the second half of 2011. The employment and housing markets both remain extremely challenged. Investors continue to be concerned about the implications of the European sovereign debt crisis, as well as our own high levels of domestic debt. Fears that the European sovereign debt crisis could continue to drag down the global economy have weighed heavily on stocks.
Ongoing apprehension regarding the U.S. debt ceiling during the summer, and the resulting downgrade of the U.S. sovereign credit rating by Standard & Poor’s, also contributed to weaker investor confidence.
There are, however, some reasons to remain confident. Corporations have record levels of cash on their balance sheets—corporate cash has doubled in the past 10 years. In addition, U.S. gross domestic product expanded at a 2.5 percent annual rate in the third quarter according to the Commerce Department, as consumers and businesses set aside fears about the recovery and stepped up spending. Corporate earnings have also remained positive, with a majority of companies beating expectations each quarter this year. This momentum will hopefully continue through the fourth quarter and into next year.
As we approach the end of 2011, in light of the continued market volatility, now would be a good time to schedule a meeting with your financial advisor to examine your current investment strategy and determine whether you are on the right track.
| | • Does your fixed-income portfolio complement your equity portfolio? |
| | • Are you receiving diversified sources of income? |
| | • Is your portfolio still in line with your risk tolerance and investment time horizon? |
Talk to your advisor to see what changes you should make to address these concerns and opportunities. Thank you again for investing with The Hartford Mutual Funds.

James Davey
President
The Hartford Mutual Funds
The Hartford Growth Fund
| Fund Performance (Unaudited) | 2 |
| Manager Discussion (Unaudited) | 3 |
| Financial Statements | |
| 5 |
| 7 |
| 8 |
| 9 |
| 10 |
| 11 |
| 24 |
| 26 |
| 27 |
| 29 |
| 29 |
| 30 |
| 31 |
| 32 |
The views expressed in the Fund’s Manager Discussion under ‘‘Why did the Fund perform this way?’’ and ‘‘What is the outlook?’’ are views of the Fund’s sub-adviser and portfolio management team through the end of the period and are subject to change based on market and other conditions.
The Hartford Growth Fund inception 06/08/1949 |
(sub-advised by Wellington Management Company, LLP) |
| |
Investment objective – Seeks long-term capital appreciation. |
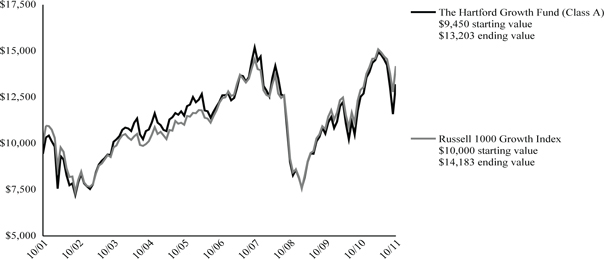
Performance Overview(1) 10/31/01 - 10/31/11
The chart above shows the growth of a $10,000 investment in Class A which includes a sales charge. Growth results in classes other than Class A will vary from what is seen above due to differences in the expenses charged to those share classes.
Average Annual Total Returns (as of 10/31/11) |
| | 1 Year | 5 Year | 10 Year |
| Growth A# | 5.39% | 1.50% | 3.40% |
| Growth A## | -0.41% | 0.36% | 2.82% |
| Growth B# | 4.51% | 0.81% | NA* |
| Growth B## | -0.49% | 0.47% | NA* |
| Growth C# | 4.66% | 0.78% | 2.68% |
| Growth C## | 3.66% | 0.78% | 2.68% |
| Growth I# | 5.70% | 1.86% | 3.83% |
| Growth R3# | 5.12% | 1.25% | 3.52% |
| Growth R4# | 5.42% | 1.56% | 3.68% |
| Growth R5# | 5.75% | 1.76% | 3.78% |
| Growth Y# | 5.88% | 1.97% | 3.89% |
| Russell 1000 Growth Index | 9.92% | 3.04% | 3.56% |
| * | Since inception returns are not applicable for Class B because after 8 years Class B converts to Class A. |
PAST PERFORMANCE IS NOT INDICATIVE OF FUTURE RESULTS.
The initial investment in Classes A shares reflects the maximum sales charge and Classes B and C reflect a contingent deferred sales charge.
Total returns presented above were calculated using the Fund's net asset value available to shareholders for sale or redemption of Fund shares on October 31, 2011, which excludes investment transactions as of this date.
Effective 9/30/09, Class B shares of The Hartford Mutual Funds were closed to new investments.
Class A, B, C and Y shares commenced operations on 2/19/02. Class A and C share performance prior to that date reflects Class L and N share performance and operating expenses less Class A or C share sales charges, respectively. (Class L and N shares are no longer offered.) Class Y share performance prior to 2/19/02 reflects Class L share performance and operating expenses, adjusted to reflect that Class Y has no sales charges. Class I shares commenced operations on 8/31/06. Performance prior to that date is that of the Fund's Class A shares (excluding sales charges), which had different operating expenses.Class R3, R4 and R5 shares commenced operations on 12/22/06. Class R3, R4 and R5 share performance between 2/19/02 and 12/22/06 reflects Class Y share performance and operating expenses. Class R3, R4 and R5 share performance prior to 2/19/02 reflects Class L share performance and operating expenses, adjusted to reflect the fact that Class R3, R4 and R5 have no sales charges.
Russell 1000 Growth Index is an unmanaged index which measures the performance of those Russell 1000 Index companies with higher price-to-book ratios and higher forecasted growth values. (The Russell 1000 Index is an unmanaged index that measures the performance of the 1,000 largest companies in the Russell 3000 Index, which measures the performance of the 3,000 largest U.S. companies based on total market capitalization.)
You cannot invest directly in an index.
The chart represents a hypothetical investment in the Fund. Performance data represents past performance and current performance could be higher or lower.
The value of shares will fluctuate so that, when redeemed, shares may be worth more or less than their original cost. The chart and table do not reflect the deduction of taxes that a shareholder would pay on Fund distributions or the redemption of Fund shares.
Performance information may reflect historical or current expense waivers/reimbursements from the investment adviser, without which performance would have been lower. For information on current expense waivers/reimbursements, please see the prospectus.
| The Hartford Growth Fund |
| Manager Discussion (Unaudited) |
| October 31, 2011 |
| Portfolio Manager |
| Andrew J. Shilling, CFA |
| Senior Vice President |
| |
How did the Fund perform?
The Class A shares of The Hartford Growth Fund returned 5.39%, before sales charges, for the twelve-month period ended October 31, 2011, underperforming its benchmark, the Russell 1000 Growth Index, which returned 9.92% for the same period. The Fund also underperformed the 6.76% return of the average fund in the Lipper Large-Cap Growth Funds peer group, a group of funds with investment strategies similar to those of the Fund.
Why did the Fund perform this way?
U.S. equities moved higher in the period despite a high degree of volatility caused by unrest in North Africa and the Middle East, as well as the devastating earthquake and tsunami in Japan. Fears of a global economic slowdown, due to the Japanese earthquake and concerns about heightened geopolitical risks, were not enough to offset strong corporate earnings, generally solid economic data, and a continued accommodative Federal Reserve policy. In the latter half of the period, positive returns from strong corporate earnings and generally solid economic data were offset by European sovereign debt concerns and a deteriorating outlook for economic growth. October, the final month of the period, produced a sharp so-called relief rally, as evidence began to surface that Europe’s leaders would take steps to address the continent’s financial crises.
Nine of the ten sectors in the Russell 1000 Growth Index had positive returns for the period. Utilities (+18%), Energy (+18%), and Consumer Discretionary (+14%) performed the best, while Telecommunication Services (-2%) and Materials (+3%) lagged on a relative basis. Growth stocks (+10%) outperformed Value stocks (+6%), as measured by the Russell 1000 Growth and Russell 1000 Value Indices, respectively.
Security selection in Information Technology, Financials, and Health Care detracted from the portfolio’s relative returns (i.e. performance of the Fund as measured against the benchmark). This was partially offset by strong security selection in Consumer Staples and Consumer Discretionary. Sector allocation, which is a residual of bottom-up (i.e. stock by stock fundamental research) stock selection, aided relative performance. Positive effects from an overweight (i.e. the Fund’s sector position was greater than the benchmark position) to Consumer Discretionary essentially neutralized the negative effects of the Fund’s underweight (i.e. the Fund’s sector position was less than the benchmark position)exposure to Energy.
Top detractors from relative performance during the period were Acme Packet (Information Technology), Juniper Networks (Information Technology), and IBM (Information Technology). Shares of Acme Packet, a leading provider of session border control solutions, which enable the delivery of VoIP (voice over internet protocol) and data communications across network borders, declined sharply during the period. We have had a positive view based on the firm's leading position in a fast growing market, but the current slower carrier spending environment has proved a headwind. Shares of Juniper Networks, a leading provider of routing and security solutions, lagged due to estimates coming down on the back of sluggish Japan demand and multiple product transitions. Not holding the strongly performing IBM during the period hindered the portfolio’s results. Cisco Systems (Information Technology) and Netflix (Consumer Discretionary) were also top detractors from absolute returns.
Green Mountain Coffee Roasters (Consumer Staples), Polo Ralph Lauren (Consumer Discretionary), and Hewlett-Packard (Information Technology) were the top contributors to relative performance during the period. Shares of Green Mountain Coffee Roasters nearly doubled during the period. For much of the period, core results topped expectations and management had raised guidance amid strong sales growth of the firm's Keurig single serving products. Shares of Polo Ralph Lauren, a producer of apparel, accessories, fragrances, and home furnishings, rose during the period. We sold our position to fund other attractive opportunities; the stock has been a solid performer and was beginning to approach our price target. The Fund benefited by not holding Hewlett-Packard, which struggled during the period. Additionally, Apple (Information Technology) and Altera (Information Technology) were among the top contributors to absolute performance.
What is the outlook?
In this environment we continue to focus our efforts on stock-by-stock fundamental research, picking one stock at a time based upon our view of the attractiveness of each company’s fundamentals and valuation. As a result of this bottom up stock selection, at the end of the period our largest overweight positions versus the benchmark were Information Technology and Consumer Discretionary. At the end of the period, we had underweight exposure to the defensive Consumer Staples and Health Care sectors as we were finding limited opportunities for growth in those areas. We were also modestly underweight Industrials at the period’s end.
| The Hartford Growth Fund |
Manager Discussion (Unaudited) – (continued) |
| October 31, 2011 |
At the end of the period, greater-than-benchmark exposure to Information Technology favored Technology Hardware. We believe our holdings were leveraged to several strong product cycles and emerging product categories. We increased our overweight exposure to Consumer Discretionary during the period. We favored companies with strong fundamentals, which should also benefit from an economic recovery. We trimmed our exposure to Financials and had a slight underweight position in the sector at the end of the period. We believe this group may face some headwinds in the near term due to continued weakness in the U.S. housing market and ongoing regulatory concerns.
| Diversification by Industry | |
| as of October 31, 2011 | |
| | | |
| Automobiles & Components (Consumer Discretionary) | | | 3.3 | % |
| Capital Goods (Industrials) | | | 8.9 | |
| Consumer Durables & Apparel (Consumer Discretionary) | | | 3.7 | |
| Consumer Services (Consumer Discretionary) | | | 3.0 | |
| Diversified Financials (Financials) | | | 3.5 | |
| Energy (Energy) | | | 9.4 | |
| Food, Beverage & Tobacco (Consumer Staples) | | | 2.7 | |
| Health Care Equipment & Services (Health Care) | | | 3.4 | |
| Materials (Materials) | | | 4.4 | |
| Media (Consumer Discretionary) | | | 3.8 | |
| Pharmaceuticals, Biotechnology & Life Sciences (Health Care) | | | 1.7 | |
| Retailing (Consumer Discretionary) | | | 4.9 | |
| Semiconductors & Semiconductor Equipment (Information Technology) | | | 8.7 | |
| Software & Services (Information Technology) | | | 17.8 | |
| Technology Hardware & Equipment (Information Technology) | | | 17.2 | |
| Transportation (Industrials) | | | 1.2 | |
| Short-Term Investments | | | 2.0 | |
| Other Assets and Liabilities | | | 0.4 | |
| Total | | | 100.0 | % |
|
| Schedule of Investments |
October 31, 2011 |
| Shares or Principal Amount | Market Value ╪ | |
COMMON STOCKS - 97.6% | |
| | | Automobiles & Components - 3.3% | |
| | 268 | | Harley-Davidson, Inc. | | $ | 10,441 | |
| | 418 | | Johnson Controls, Inc. | | | 13,779 | |
| | | | | | | 24,220 | |
| | | | Capital Goods - 8.9% | |
| | 184 | | AMETEK, Inc. | | | 7,271 | |
| | 109 | | Boeing Co. | | | 7,196 | |
| | 51 | | Caterpillar, Inc. | | | 4,813 | |
| | 125 | | Cummins, Inc. | | | 12,417 | |
| | 161 | | Eaton Corp. | | | 7,201 | |
| | 139 | | Illinois Tool Works, Inc. | | | 6,771 | |
| | 112 | | Joy Global, Inc. | | | 9,735 | |
| | 161 | | PACCAR, Inc. | | | 6,967 | |
| | 15 | | Precision Castparts Corp. | | | 2,503 | |
| | | | | | | 64,874 | |
| | | | Consumer Durables & Apparel - 3.7% | |
| | 190 | | Coach, Inc. | | | 12,377 | |
| | 86 | | Fossil, Inc. ● | | | 8,929 | |
| | 10 | | Lululemon Athletica, Inc. ● | | | 560 | |
| | 31 | | Ralph Lauren Corp. | | | 4,843 | |
| | | | | | | 26,709 | |
| | | | Consumer Services - 3.0% | |
| | 173 | | Las Vegas Sands Corp. ● | | | 8,101 | |
| | 575 | | MGM Resorts International ● | | | 6,626 | |
| | 170 | | Starbucks Corp. | | | 7,198 | |
| | | | | | | 21,925 | |
| | | | Diversified Financials - 3.5% | |
| | 84 | | American Express Co. | | | 4,252 | |
| | 208 | | Ameriprise Financial, Inc. | | | 9,707 | |
| | 72 | | BlackRock, Inc. | | | 11,427 | |
| | | | | | | 25,386 | |
| | | | Energy - 9.4% | |
| | 155 | | Anadarko Petroleum Corp. | | | 12,131 | |
| | 186 | | Consol Energy, Inc. | | | 7,942 | |
| | 181 | | ENSCO International plc | | | 9,008 | |
| | 109 | | EOG Resources, Inc. | | | 9,721 | |
| | 174 | | National Oilwell Varco, Inc. | | | 12,428 | |
| | 39 | | Occidental Petroleum Corp. | | | 3,641 | |
| | 182 | | Schlumberger Ltd. | | | 13,402 | |
| | | | | | | 68,273 | |
| | | | Food, Beverage & Tobacco - 2.7% | |
| | 298 | | Green Mountain Coffee Roasters, Inc. ● | | | 19,358 | |
| | | | | | | | |
| | | | Health Care Equipment & Services - 3.4% | |
| | 129 | | Covidien International plc | | | 6,049 | |
| | 111 | | Edwards Lifesciences Corp. ● | | | 8,392 | |
| | 373 | | Hologic, Inc. ● | | | 6,007 | |
| | 90 | | UnitedHealth Group, Inc. | | | 4,313 | |
| | | | | | | 24,761 | |
| | | | Materials - 4.4% | |
| | 114 | | Freeport-McMoRan Copper & Gold, Inc. | | | 4,578 | |
| | 170 | | Monsanto Co. | | | 12,362 | |
| | 116 | | Mosaic Co. | | | 6,820 | |
| | 71 | | Rio Tinto plc ADR | | | 3,864 | |
| | 53 | | Walter Energy, Inc. | | | 4,000 | |
| | | | | | | 31,624 | |
| | | | Media - 3.8% | |
| | 780 | | News Corp. Class A | | | 13,659 | |
| | 2,898 | | Sirius XM Radio, Inc. w/ Rights ● | | | 5,188 | |
| | 248 | | Walt Disney Co. | | | 8,652 | |
| | | | | | | 27,499 | |
| | | Pharmaceuticals, Biotechnology & Life Sciences - 1.7% | |
| | 340 | | Agilent Technologies, Inc. ● | | | 12,601 | |
| | | | | | | | |
| | | | Retailing - 4.9% | |
| | 158 | | Abercrombie & Fitch Co. Class A | | | 11,731 | |
| | 45 | | Amazon.com, Inc. ● | | | 9,700 | |
| | 13 | | Netflix, Inc. ● | | | 1,107 | |
| | 25 | | Priceline.com, Inc. ● | | | 12,855 | |
| | | | | | | 35,393 | |
| | | | Semiconductors & Semiconductor Equipment - 8.7% | |
| | 722 | | Altera Corp. | | | 27,380 | |
| | 308 | | Analog Devices, Inc. | | | 11,278 | |
| | 349 | | Broadcom Corp. Class A | | | 12,610 | |
| | 263 | | Skyworks Solutions, Inc. ● | | | 5,212 | |
| | 222 | | Texas Instruments, Inc. | | | 6,808 | |
| | | | | | | 63,288 | |
| | | | Software & Services - 17.8% | |
| | 120 | | Alliance Data Systems Corp. ● | | | 12,323 | |
| | 188 | | BMC Software, Inc. ● | | | 6,542 | |
| | 259 | | Citrix Systems, Inc. ● | | | 18,848 | |
| | 114 | | Cognizant Technology Solutions Corp. ● | | | 8,264 | |
| | 824 | | eBay, Inc. ● | | | 26,224 | |
| | 7 | | Google, Inc. ● | | | 3,923 | |
| | 808 | | Oracle Corp. | | | 26,479 | |
| | 138 | | Rovi Corp. ● | | | 6,838 | |
| | 28 | | Salesforce.com, Inc. ● | | | 3,697 | |
| | 199 | | Tibco Software, Inc. ● | | | 5,757 | |
| | 188 | | VeriSign, Inc. | | | 6,033 | |
| | 43 | | VMware, Inc. ● | | | 4,196 | |
| | | | | | | 129,124 | |
| | | | Technology Hardware & Equipment - 17.2% | |
| | 185 | | Acme Packet, Inc. ● | | | 6,706 | |
| | 125 | | Apple, Inc. ● | | | 50,427 | |
| | 818 | | EMC Corp. ● | | | 20,057 | |
| | 77 | | F5 Networks, Inc. ● | | | 8,038 | |
| | 511 | | Juniper Networks, Inc. ● | | | 12,511 | |
| | 293 | | NetApp, Inc. ● | | | 12,002 | |
| | 295 | | Qualcomm, Inc. | | | 15,236 | |
| | | | | | | 124,977 | |
| | | | Transportation - 1.2% | |
| | 45 | | C.H. Robinson Worldwide, Inc. | | | 3,137 | |
| | 136 | | J.B. Hunt Transport Services, Inc. | | | 5,733 | |
| | | | | | | 8,870 | |
| | | | Total common stocks | | | | |
| | | | (cost $590,938) | | $ | 708,882 | |
| | | | | | | | |
| | | | Total long-term investments | | | | |
| | | | (cost $590,938) | | $ | 708,882 | |
| | | | | | | | |
SHORT-TERM INVESTMENTS - 2.0% | |
| Repurchase Agreements - 2.0% | |
| | | | Bank of America Merrill Lynch TriParty Joint Repurchase Agreement (maturing on 11/01/2011 in the amount of $868, collateralized by FHLMC 4.50%, 2040, FNMA 5.00, 2041, value of $885) | | | | |
| $ | 868 | | 0.11%, 10/31/2011 | | $ | 868 | |
The accompanying notes are an integral part of these financial statements
| The Hartford Growth Fund |
| Schedule of Investments – (continued) |
October 31, 2011 |
Shares or Principal Amount | | | | | Market Value ╪ | |
SHORT-TERM INVESTMENTS - 2.0% - (continued) | | | | | | |
| Repurchase Agreements - 2.0% - (continued) | | | | | | |
| | | Barclays Capital TriParty Joint Repurchase Agreement (maturing on 11/01/2011 in the amount of $8,287, collateralized by FNMA 5.50%, 2041, GNMA 4.00%, 2040, U.S. Treasury Bond 8.13%, 2021, U.S. Treasury Note 2.50% - 3.63%, 2015 - 2020, value of $8,453) | | | | | | |
| $ | 8,287 | | 0.11%, 10/31/2011 | | | | | $ | 8,287 | |
| | | | Deutsche Bank Securities TriParty Joint Repurchase Agreement (maturing on 11/01/2011 in the amount of $1,172, collateralized by GNMA 4.00% - 5.00%, 2040, value of $1,195) | | | | | | | |
| | 1,172 | | 0.11%, 10/31/2011 | | | | | | 1,172 | |
| | | | UBS Securities, Inc. Joint Repurchase Agreement (maturing on 11/01/2011 in the amount of $-, collateralized by U.S. Treasury Note 1.88%, 2014, value of $-) | | | | | | | |
| | – | | 0.11%, 10/31/2011 | | | | | | – | |
| | | | UBS Securities, Inc. TriParty Joint Repurchase Agreement (maturing on 11/01/2011 in the amount of $4,035, collateralized by GNMA 3.50% - 4.50%, 2041, value of $4,116) | | | | | | | |
| | 4,035 | | 0.11%, 10/31/2011 | | | | | | 4,035 | |
| | | | | | | | | | 14,362 | |
| | | | Total short-term investments | | | | | | | |
| | | | (cost $14,362) | | | | | $ | 14,362 | |
| | | | | | | | | | | |
| | | | Total investments | | | | | | | |
| | | | (cost $605,300) ▲ | | | 99.6 | % | | $ | 723,244 | |
| | | | Other assets and liabilities | | | 0.4 | % | | | 2,662 | |
| | | | Total net assets | | | 100.0 | % | | $ | 725,906 | |
| Note: | Percentage of investments as shown is the ratio of the total market value to total net assets. Market value of long-term investments in foreign securities represents 1.9% of total net assets at October 31, 2011. |
Prices of foreign equities that are principally traded on certain foreign markets may be adjusted daily pursuant to a fair value pricing service approved by the Board of Directors in order to reflect an adjustment for factors occurring after the close of certain foreign markets but before the close of the New York Stock Exchange.
| ▲ | At October 31, 2011, the cost of securities for federal income tax purposes was $608,161 and the aggregate gross unrealized appreciation and depreciation based on that cost were: |
| Unrealized Appreciation | | $ | 146,946 | |
| Unrealized Depreciation | | | (31,863 | ) |
| Net Unrealized Appreciation | | $ | 115,083 | |
| ╪ | See Significant Accounting Policies of accompanying Notes to Financial Statements regarding valuation of securities. |
The accompanying notes are an integral part of these financial statements
|
| Investment Valuation Hierarchy Level Summary |
| October 31, 2011 |
| (000’s Omitted) |
| | | | | | | | | | | | | |
| Assets: | | | | | | | | | | | | |
| Common Stocks ‡ | | $ | 708,882 | | | $ | 708,882 | | | $ | – | | | $ | – | |
| Short-Term Investments | | | 14,362 | | | | – | | | | 14,362 | | | | – | |
| Total | | $ | 723,244 | | | $ | 708,882 | | | $ | 14,362 | | | $ | – | |
| ♦ | For the year ended October 31, 2011, there were no significant transfers between Level 1 and Level 2. |
| ‡ | The Fund has all or primarily all of the equity securities categorized in a particular level. Refer to the Schedule of Investments for further industry breakout. |
The accompanying notes are an integral part of these financial statements
|
| Statement of Assets and Liabilities |
| October 31, 2011 |
| (000’s Omitted) |
| Assets: | | | |
| Investments in securities, at market value (cost $605,300) | | $ | 723,244 | |
| Cash | | | 10 | |
| Receivables: | | | | |
| Investment securities sold | | | 3,326 | |
| Fund shares sold | | | 1,132 | |
| Dividends and interest | | | 186 | |
| Other assets | | | 79 | |
| Total assets | | | 727,977 | |
| Liabilities: | | | | |
| Payables: | | | | |
| Investment securities purchased | | | 750 | |
| Fund shares redeemed | | | 1,024 | |
| Investment management fees | | | 103 | |
| Administrative fees | | | — | |
| Distribution fees | | | 30 | |
| Accrued expenses | | | 164 | |
| Total liabilities | | | 2,071 | |
| Net assets | | $ | 725,906 | |
| Summary of Net Assets: | | | | |
| Capital stock and paid-in-capital | | $ | 694,314 | |
| Accumulated undistributed net investment income | | | — | |
| Accumulated net realized loss on investments and foreign currency transactions | | | (86,351 | ) |
| Unrealized appreciation of investments and the translation of assets and liabilities denominated in foreign currency | | | 117,943 | |
| Net assets | | $ | 725,906 | |
| | | | | |
| Shares authorized | | | 27,000,000 | |
| Par value | | $ | 0.0001 | |
Class A: Net asset value per share/Maximum offering price per share | | | $17.01/$18.00 | |
| Shares outstanding | | | 23,792 | |
| Net assets | | $ | 404,630 | |
Class B: Net asset value per share | | $ | 14.14 | |
| Shares outstanding | | | 949 | |
| Net assets | | $ | 13,411 | |
Class C: Net asset value per share | | $ | 14.16 | |
| Shares outstanding | | | 2,781 | |
| Net assets | | $ | 39,365 | |
Class I: Net asset value per share | | $ | 17.26 | |
| Shares outstanding | | | 8,079 | |
| Net assets | | $ | 139,421 | |
Class R3: Net asset value per share | | $ | 17.26 | |
| Shares outstanding | | | 17 | |
| Net assets | | $ | 298 | |
Class R4: Net asset value per share | | $ | 17.51 | |
| Shares outstanding | | | 224 | |
| Net assets | | $ | 3,918 | |
Class R5: Net asset value per share | | $ | 17.65 | |
| Shares outstanding | | | 39 | |
| Net assets | | $ | 689 | |
Class Y: Net asset value per share | | $ | 17.82 | |
| Shares outstanding | | | 6,970 | |
| Net assets | | $ | 124,174 | |
The accompanying notes are an integral part of these financial statements
|
| Statement of Operations |
| For the Year Ended October 31, 2011 |
| (000’s Omitted) |
| Investment Income: | | | |
| Dividends | | $ | 7,252 | |
| Interest | | | 8 | |
| Less: Foreign tax withheld | | | (38 | ) |
| Total investment income | | | 7,222 | |
| | | | | |
| Expenses: | | | | |
| Investment management fees | | | 5,419 | |
| Administrative services fees | | | 7 | |
| Transfer agent fees | | | 1,317 | |
| Distribution fees | | | | |
| Class A | | | 744 | |
| Class B | | | 168 | |
| Class C | | | 439 | |
| | | 389 | |
| Class R3 | | | 2 | |
| Class R4 | | | 10 | |
| Custodian fees | | | 6 | |
| Accounting services fees | | | 89 | |
| Registration and filing fees | | | 142 | |
| Board of Directors' fees | | | 15 | |
| Audit fees | | | 12 | |
| Other expenses | | | 133 | |
| Total expenses (before waivers and fees paid indirectly) | | | 8,892 | |
| Expense waivers | | | (35 | ) |
| Transfer agent fee waivers | | | (22 | ) |
| Commission recapture | | | (16 | ) |
| Total waivers and fees paid indirectly | | | (73 | ) |
| Total expenses, net | | | 8,819 | |
| Net Investment Loss | | | (1,597 | ) |
| Net Realized Gain on Investments and Foreign Currency Transactions: | | | | |
| Net realized gain on investments in securities | | | 51,401 | |
| Net realized gain on foreign currency contracts | | | — | |
| Net realized gain on other foreign currency transactions | | | 16 | |
| Net Realized Gain on Investments and Foreign Currency Transactions | | | 51,417 | |
| Net Changes in Unrealized Depreciation of Investments and Foreign Currency Transactions: | | | | |
| Net unrealized depreciation of investments | | | (12,876 | ) |
| Net unrealized depreciation on translation of other assets and liabilities in foreign currencies | | | (14 | ) |
| Net Changes in Unrealized Depreciation of Investments and Foreign Currency Transactions | | | (12,890 | ) |
| Net Gain on Investments and Foreign Currency Transactions | | | 38,527 | |
| Net Increase in Net Assets Resulting from Operations | | $ | 36,930 | |
* Class L merged into Class A on August 5, 2011. Please refer to the Notes to Financial Statements for further details.
The accompanying notes are an integral part of these financial statements
|
| Statement of Changes in Net Assets |
| |
| (000’s Omitted) |
| | | For the Year Ended October 31, 2011 | | | For the Year Ended October 31, 2010 | |
| Operations: | | | | | | |
| Net investment loss | | $ | (1,597 | ) | | $ | (1,425 | ) |
| Net realized gain on investments and foreign currency transactions | | | 51,417 | | | | 49,390 | |
| Net unrealized appreciation (depreciation) of investments and foreign currency transactions | | | (12,890 | ) | | | 68,730 | |
| Net Increase In Net Assets Resulting From Operations | | | 36,930 | | | | 116,695 | |
| Distributions to Shareholders: | | | | | | | | |
| From net investment income | | | | | | | | |
| Class I | | | — | | | | (239 | ) |
| Class L* | | | — | | | | (500 | ) |
| Class R3 | | | — | | | | — | |
| Class R4 | | | — | | | | (5 | ) |
| Class R5 | | | — | | | | — | |
| Class Y | | | — | | | | (509 | ) |
| Total distributions | | | — | | | | (1,253 | ) |
| Capital Share Transactions: | | | | | | | | |
| Class A | | | 105,155 | | | | (39,203 | ) |
| Class B | | | (5,074 | ) | | | (4,827 | ) |
| Class C | | | (6,415 | ) | | | (8,332 | ) |
| Class I | | | 79,116 | | | | (4,679 | ) |
| Class L* | | | (184,338 | ) | | | (20,296 | ) |
| Class R3 | | | 61 | | | | 36 | |
| Class R4 | | | 230 | | | | 449 | |
| Class R5 | | | 540 | | | | 26 | |
| Class Y | | | 18,053 | | | | (16,861 | ) |
| Net increase (decrease) from capital share transactions | | | 7,328 | | | | (93,687 | ) |
| Net Increase In Net Assets | | | 44,258 | | | | 21,755 | |
| Net Assets: | | | | | | | | |
| Beginning of period | | | 681,648 | | | | 659,893 | |
| End of period | | $ | 725,906 | | | $ | 681,648 | |
| Accumulated undistributed (distribution in excess of) net investment income (loss) | | $ | — | | | $ | — | |
| * | Class L merged into Class A on August 5, 2011. Please refer to the Notes to Financial Statements for further details. |
The accompanying notes are an integral part of these financial statements
|
| Notes to Financial Statements |
| October 31, 2011 |
| (000’s Omitted) |
The Hartford Mutual Funds II, Inc. (“Company”) is an open-end management investment company comprised of five portfolios. Financial statements for The Hartford Growth Fund (the “Fund”), a series of the Company, are included in this report.
The Company is organized under the laws of the State of Maryland and is registered with the Securities and Exchange Commission (“SEC”) under the Investment Company Act of 1940, as amended (“1940 Act”). The Fund is a diversified open-end management investment company.
Class A shares are sold with a front-end sales charge of up to 5.50%. Class B shares were sold with a contingent deferred sales charge which is assessed on the lesser of the per share net asset value (“NAV”) of the shares at the time of redemption or the original purchase price, and declines from up to 5.00% to zero depending on the period of time the shares are held (see note below regarding the closing of Class B shares). Class C shares are sold with a contingent deferred sales charge of up to 1.00% on shares redeemed within twelve months of purchase. Class I shares are sold without sales charges to certain eligible investors primarily through advisory fee-based wrap programs. Class R3, R4 and R5 shares, which are offered to employer-sponsored retirement plans, and Class Y shares, which are sold to certain eligible institutional investors, are sold without a sales charge. All classes of shares have identical voting, redemption, dividend, liquidation and other rights and the same terms and conditions, with the exceptions that each class may have different expenses, which may affect performance, and that Class B shares automatically convert to Class A shares after 8 years.
No new or additional investments are allowed in Class B shares of The Hartford Mutual Funds (including investments through any systematic investment plan). Existing shareholders of Class B shares may continue to hold their Class B shares, exchange their Class B shares for Class B shares of another Hartford Mutual Fund (as permitted by existing exchange privileges), or redeem their Class B shares as described in the Fund’s prospectus. Reinstatement privileges with respect to Class B shares will continue under the current policy. For investors electing to reinvest capital gains and dividends, any such capital gains or dividends on Class B shares will continue to be reinvested in Class B shares of the Fund. All Class B share attributes, including the 12b-1 fee, contingent deferred sales charge schedule, and conversion to Class A shares, remain unchanged.
| 2. | Significant Accounting Policies: |
The following is a summary of significant accounting policies of the Fund in the preparation of its financial statements, which are in accordance with the United States Generally Accepted Accounting Principles (“U.S. GAAP”). The preparation of financial statements in accordance with U.S. GAAP may require management to make estimates and assumptions that affect the reported amounts of assets and liabilities and disclosure of contingent assets and liabilities at the date of the financial statements and the reported amounts of increases and decreases in net assets from operations during the reporting period. Actual results could differ from those estimates.
| | a) | Determination of Net Asset Value – The NAV of each class of the Fund's shares is determined as of the close of regular trading (normally 4:00 p.m. Eastern Time) (the “NYSE Close”) on each day that the New York Stock Exchange (the “Exchange”) is open (“Valuation Date”). Information that becomes known to the Fund after the NAV has been calculated on a particular day will not generally be used to retroactively adjust the NAV determined earlier that day. |
| | b) | Investment Valuation and Fair Value Measurements – For purposes of calculating the NAV, portfolio securities and other assets held by the Fund's portfolio for which market quotes are readily available are valued at market value. Market value is generally determined on the basis of last reported sales prices or official close price. If no sales are reported, market value is based on quotes obtained from a quotation reporting system, established market makers, or independent pricing services. If market prices are not readily available or are deemed unreliable, the Fund will use the fair value of |
| The Hartford Growth Fund |
Notes to Financial Statements – (continued) |
| October 31, 2011 |
| (000’s Omitted) |
| | the security as determined in good faith under policies and procedures established by and under the supervision of the Company’s Board of Directors. Market quotes are considered not readily available where there is an absence of current or reliable market-based data (e.g., trade information or broker quotes), including where events occur after the close of the relevant market, but prior to the NYSE Close that materially affect the values of the Fund’s portfolio securities or assets. In addition, market quotes are considered not readily available when, due to extraordinary circumstances, the exchanges or markets on which the securities trade do not open for trading for the entire day and no other market prices are available. In addition, prices of foreign equities that are principally traded on certain foreign markets are adjusted daily pursuant to a fair value pricing service approved by the Board of Directors in order to reflect an adjustment for the factors occurring after the close of certain foreign markets but before the NYSE Close. Securities that are primarily traded on foreign markets may trade on days that are not business days of the Fund. The value of the foreign securities in which the Fund invests may change on days when a shareholder will not be able to purchase or redeem shares of the Fund. Fair value pricing is subjective in nature and the use of fair value pricing by the Fund may cause the NAV of its shares to differ significantly from the NAV that would have been calculated using market prices at the close of the exchange on which a portfolio security is primarily traded. There can be no assurance that the Fund could obtain the fair market value assigned to a security if the Fund were to sell the security at approximately the time at which the Fund determines its NAV. |
Investments valued in currencies other than U.S. dollars are converted to U.S. dollars using exchange rates obtained from independent pricing services for calculation of the NAV. As a result, the NAV of the Fund’s shares may be affected by changes in the value of currencies in relation to the U.S. dollar. The value of securities traded in markets outside the United States or denominated in currencies other than the U.S. dollar may be affected significantly on a day that the NYSE is closed and the market value may change on days when an investor is not able to purchase, redeem or exchange shares of the Fund.
Foreign currency contracts represent agreements to exchange currencies on specific future dates at predetermined rates. Foreign currency contracts are valued using foreign currency exchange rates and forward rates as provided by an independent pricing service on the Valuation Date.
Financial instruments for which prices are not available from an independent pricing service may be valued using market quotations obtained from one or more dealers that make markets in the respective financial instrument in accordance with procedures established by the Company’s Board of Directors.
U.S. GAAP defines fair value as the price that the Fund would receive to sell an asset or pay to transfer a liability in an orderly transaction between market participants. The U.S. GAAP fair value measurement standards require disclosure of a fair value hierarchy for each major category of assets and liabilities. Various inputs are used in determining the fair value of the Fund’s investments. These inputs are summarized into three broad hierarchy levels. This hierarchy is based on whether the valuation inputs are observable or unobservable. These levels are:
| | · | Level 1 – Quoted prices in active markets for identical securities. Level 1 may include exchange traded instruments, such as domestic equities, some foreign equities, options, futures, mutual funds, exchange traded funds, rights and warrants. |
| | · | Level 2 – Observable inputs other than Level 1 prices, such as quoted prices for similar securities; quoted prices in markets that are not active; or other inputs that are observable or can be corroborated by observable market data. Level 2 may include debt securities that are traded less frequently than exchange traded instruments and which are valued using third party pricing services; foreign equities, that are principally traded on certain foreign markets and are adjusted daily pursuant to a fair value pricing service in order to reflect an adjustment for the factors occurring after the close of certain foreign markets but before the NYSE Close; and short-term securities, which are valued at amortized cost. |
| | · | Level 3 – Significant unobservable inputs that are supported by limited or no market activity. Level 3 may include financial instruments whose values are determined using broker quotes or require significant management judgment or estimation. These unobservable valuation inputs may include estimates for current |
| | yields, maturity/duration, prepayment speed, and broker quotes for comparable securities along with other assumptions relating to credit quality, collateral value, complexity of the security structure, general market conditions and liquidity. This category may include securities where trading has been halted or there are certain restrictions on trading. While these securities are priced using unobservable inputs, the valuation of these securities reflects the best available data and management believes the prices are a reasonable representation of exit price. |
Valuation levels are not necessarily indicative of the risk associated with investing in such securities. Individual securities within any of the above mentioned asset classes may be assigned a different hierarchical level than those presented above, as individual circumstances dictate.
During the year ended October 31, 2011, the Fund held no Level 3 securities; therefore, no reconciliation of Level 3 securities is presented.
For additional information, refer to the Investment Valuation Hierarchy Level Summary which follows the Schedule of Investments.
For purposes of reporting transfers between different hierarchy levels, both transfers in and out of each level, as applicable, are shown as if they occurred at the beginning of the period.
| | c) | Security Transactions and Investment Income – Security transactions are recorded as of the trade date (the date the order to buy or sell is executed) for financial reporting purposes. Securities purchased or sold on a when-issued or delayed-delivery basis may be settled a month or more after the trade date. Realized gains and losses are determined on the basis of identified cost. |
Dividend income is accrued as of the ex-dividend date, except certain dividends from foreign securities where the ex-dividend date may have passed are recorded as soon as the Fund is informed of the dividend. Interest income, including amortization of premium and accretion of discounts, is accrued on a daily basis.
| �� | d) | Foreign Currency Transactions – Assets and liabilities denominated in currencies other than U.S. dollars are translated into U.S. dollars at the exchange rates in effect on the valuation date. Purchases and sales of investment securities, income, and expenses are translated into U.S. dollars at the exchange rates on the dates of such transactions. |
The Fund does not isolate that portion of portfolio security valuation resulting from fluctuations in the foreign currency exchange rates from the fluctuations arising from changes in the market prices of securities held. Exchange rate fluctuations are included with the net realized and unrealized gain or loss on investments in the accompanying financial statements.
Net realized foreign exchange gains or losses arise from sales of foreign currencies and the difference between asset and liability amounts initially stated in foreign currencies and the U.S. dollar value of the amounts actually received or paid. Net unrealized foreign exchange gains or losses arise from changes in the value of other assets and liabilities at the end of the reporting period, resulting from changes in the exchange rates.
| | e) | Joint Trading Account – The Fund may invest cash balances into a joint trading account that may be invested in one or more repurchase agreements. |
| | f) | Fund Share Valuation and Dividend Distributions to Shareholders – Orders for the Fund’s shares are executed in accordance with the investment instructions of the shareholders. The NAV of the Fund’s shares is determined as of the close of business on each business day of the Exchange. The NAV is determined separately for each class of shares of the Fund by dividing the Fund’s net assets attributable to that class by the number of shares of the class outstanding. |
| The Hartford Growth Fund |
| Notes to Financial Statements – (continued) |
| October 31, 2011 |
| (000’s Omitted) |
| | Each class of shares offered by the Fund has equal rights as to assets and voting privileges (except that shareholders of a class have exclusive voting rights regarding any matter relating solely to that class of shares). Income and non-class specific expenses are allocated daily to each class on the basis of the relative net assets of the class. Realized and unrealized capital gains and losses are allocated daily based on the relative net assets of each class of shares of the Fund. |
Orders for the purchase of the Fund’s shares received prior to the close of the Exchange on any day the Exchange is open for business are priced at the NAV determined as of the close of the Exchange. Orders received after the close of the Exchange, or on a day on which the Exchange and/or the Fund is not open for business, are priced at the next determined NAV.
Dividends are declared pursuant to a policy adopted by the Company’s Board of Directors based upon the investment performance of the Fund. The policy of the Fund is to pay dividends from net investment income and realized capital gains, if any, at least once a year.
Distributions from net investment income, net realized capital gains and capital are determined in accordance with federal income tax regulations, which may differ from U.S. GAAP with respect to character and timing. These differences may include but are not limited to losses deferred due to wash sale adjustments, foreign currency gains and losses, adjustments related to Passive Foreign Investment Companies (“PFICs”), Real Estate Investment Trusts (“REITs”), Regulated Investment Companies (“RICs”), certain derivatives and partnerships. Permanent book and federal income tax basis differences relating to shareholder distributions will result in reclassifications to certain of the Fund’s capital accounts (see Federal Income Taxes: Reclassification of Capital Accounts note).
| 3. | Securities and Other Investments: |
| | a) | Repurchase Agreements – A repurchase agreement is an agreement by which a counterparty agrees to sell a security and agrees to repurchase the security sold at a mutually agreed upon time and price. At the time the Fund enters into a repurchase agreement, the value of the underlying collateral security(ies), including accrued interest, will be equal to or exceed the value of the repurchase agreement. Repurchase agreements expose the Fund to counterparty risk. To minimize counterparty risk, the securities that serve to collateralize the repurchase agreement are held by the Fund's custodian in book entry or physical form in the custodial account of the Fund or in a third party custodial account. Repurchase agreements are valued at cost plus accrued interest. The Fund, as shown on the Schedule of Investments, had outstanding repurchase agreements as of October 31, 2011. |
| | b) | Securities Purchased on a When-Issued or Delayed-Delivery Basis – Delivery and payment for securities that have been purchased by the Fund on a forward commitment, or when-issued or delayed-delivery basis, take place beyond the customary settlement period. A fund may dispose of or renegotiate a delayed-delivery transaction after it is entered into, and may sell delayed-delivery securities before they are delivered, which may result in a realized gain or loss. During this period, such securities are subject to market fluctuations, and the Fund identifies securities segregated in its records with value at least equal to the amount of the commitment. As of October 31, 2011, the Fund had no outstanding when-issued or delayed delivery securities. |
| 4. | Financial Derivative Instruments: |
The following disclosures contain information on how and why the Fund uses derivative instruments, the credit-risk-related contingent features in certain derivative instruments, and how derivative instruments affect the Fund’s financial position and results of operations. The location and fair value amounts of these instruments on the Statement of Assets and Liabilities and the realized gains and losses and changes in unrealized gains and losses on the Statement of Operations, each categorized by type of derivative contract, are included in the following Additional Derivative Instrument Information footnote. The derivative instruments outstanding as of period-end are disclosed in the notes to
the Schedule of Investments and the amounts of realized gains and losses and changes in unrealized gains and losses on derivative instruments during the period are disclosed in the Statement of Operations.
| | a) | Foreign Currency Contracts – The Fund may enter into foreign currency contracts that obligate the Fund to purchase or sell currencies at specified future dates. Foreign currency contracts are used to hedge the currency exposure associated with some or all of the Fund's securities and/or as part of an investment strategy. Foreign currency contracts are marked to market daily and the change in value is recorded by the Fund as an unrealized gain or loss. The Fund will record a realized gain or loss when the foreign currency contract is settled. |
Foreign currency contracts involve elements of market risk in excess of the amounts reflected in the Statement of Assets and Liabilities. In addition, risks may arise upon entering into these contracts from the potential inability of the counterparties to meet the terms of the contracts and from unanticipated movements in the value of the foreign currencies relative to the U.S. dollar. The Fund had no outstanding foreign currency contracts as of October 31, 2011.
| | b) | Additional Derivative Instrument Information: |
The volume of derivative activity was minimal during the year ended October 31, 2011.
| The Effect of Derivative Instruments on the Statement of Operations for the year ended October 31, 2011: | |
| | | | |
| | | Risk Exposure Category | |
| | | | | | | | | | | | | | | | | | | | | | |
| Realized Gain (Loss) on Derivatives Recognized as a Result of Operations: | | | | | | | | | | |
| Net realized gain on foreign currency contracts | | $ | — | | | $ | — | | | $ | — | | | $ | — | | | $ | — | | | $ | — | | | $ | — | |
| Total | | $ | — | | | $ | — | | | $ | — | | | $ | — | | | $ | — | | | $ | — | | | $ | — | |
| | a) | Counterparty Risk – The Fund may be exposed to counterparty risk, or the risk that an institution or other entity with which the Fund has unsettled or open transactions will default. |
| | b) | Market Risks – If the Fund invests directly in foreign currencies or in securities that trade in, and receive revenues in, foreign currencies, or in derivatives that provide exposure to foreign currencies, it will be subject to the risk that those currencies will decline in value relative to the base currency of the Fund, or, in the case of hedging positions, that the Fund’s base currency will decline in value relative to the currency being hedged. Currency rates in foreign countries may fluctuate significantly over short periods of time for a number of reasons, including changes in interest rates, intervention (or the failure to intervene) by U.S. or foreign governments, central banks or supranational entities, such as the International Monetary Fund, or by the imposition of currency controls or other political developments in the United States or abroad. As a result, the Fund’s investments in foreign currency denominated securities may reduce the returns of the Fund. The market values of equity securities, such as common stocks and preferred stocks, or equity related investments, such as futures and options, may decline due to general market conditions which are not specifically related to a particular company, such as real or perceived adverse economic conditions, changes in the general outlook for corporate earnings, changes in interest or currency rates or adverse investor sentiment generally. The market value of equity securities may also decline due to factors which affect a particular industry or industries, such as labor shortages or increased production costs and competitive conditions within an industry. Equity securities and equity related investments generally have greater market price volatility than fixed income securities. |
| The Hartford Growth Fund |
| Notes to Financial Statements – (continued) |
| October 31, 2011 |
| (000’s Omitted) |
| | a) | Federal Income Taxes – For federal income tax purposes, the Fund intends to continue to qualify as a RIC under Subchapter M of the Internal Revenue Code (“IRC”) by distributing substantially all of its taxable net investment income and net realized capital gains to its shareholders and otherwise complying with the requirements of RICs. The Fund has distributed substantially all of its income and capital gains in prior years, if applicable, and intends to distribute substantially all of its income and capital gains during the calendar year ending December 31, 2011. Accordingly, no provision for federal income or excise taxes has been made in the accompanying financial statements. Distributions from short-term capital gains are treated as ordinary income distributions for federal income tax purposes. |
| | b) | Net Investment Income (Loss), Net Realized Gains (Losses) – Net investment income (loss) and net realized gains (losses) may differ for financial statement and tax purposes primarily because of losses deferred due to wash sale adjustments, foreign currency gains and losses, adjustments related to PFICs, REITs, RICs, certain derivatives and partnerships. The character of distributions made during the year from net investment income or net realized gains may differ from their ultimate characterization for federal income tax purposes. Also, due to the timing of dividend distributions, the fiscal year in which amounts are distributed may differ from the year that the income or realized gains (losses) were recorded by the Fund. |
| | c) | Distributions and Components of Distributable Earnings – The tax character of distributions paid by the Fund for the periods indicated is as follows (as adjusted for dividends payable): |
| | | For the Year Ended October 31, 2011 | | | For the Year Ended October 31, 2010 | |
| Ordinary Income | | $ | — | | | $ | 1,253 | |
As of October 31, 2011, the Fund’s components of distributable earnings (deficit) on a tax basis were as follows:
| | | Amount | |
| Accumulated Capital Losses * | | $ | (83,489 | ) |
| Unrealized Appreciation † | | | 115,081 | |
| Total Accumulated Earnings | | $ | 31,592 | |
| | * | The Fund has capital loss carryforwards that are identified in the Capital Loss Carryforward note that follows. |
| | † | The differences between book-basis and tax-basis unrealized appreciation (depreciation) may be attributable to the losses deferred due to wash sale adjustments, foreign currency gains and losses, adjustments related to PFICs, REITs, RICs, certain derivatives and partnerships. |
| | d) | Reclassification of Capital Accounts – The Fund may record reclassifications in its capital accounts. These reclassifications have no impact on the total net assets of the Fund. The reclassifications are a result of permanent differences between U.S. GAAP and tax accounting for such items as foreign currency, PFICs, expiration or utilization of capital loss carryforwards or net operating losses. Adjustments are made to reflect the impact these items have on current and future distributions to shareholders. Therefore, the source of the Fund’s distributions may be shown in the accompanying Statement of Changes in Net Assets as from accumulated undistributed net investment income, from accumulated net realized gains on investments or from capital depending on the type of book and tax differences that exist. For the year ended October 31, 2011, the Fund recorded reclassifications to increase (decrease) the accounts listed below: |
| | | Amount | |
| Accumulated Undistributed Net Investment Income | | $ | 1,597 | |
| Accumulated Net Realized Gain (Loss) on Investments and Foreign Currency Transactions | | | 65 | |
| Capital Stock and Paid-In-Capital | | | (1,662 | ) |
| | | | | |
| | e) | Capital Loss Carryforward – At October 31, 2011 (tax-year-end), the Fund had capital loss carryforwards for U.S. federal income tax purposes of approximately: |
Year of Expiration | | Amount | |
| 2017 | | $ | 83,489 | |
| Total | | $ | 83,489 | |
| | | | | |
| As of October 31, 2011, the Fund utilized $47,565 of prior year capital loss carryforwards. | |
| | f) | Accounting for Uncertainty in Income Taxes – The Fund has adopted financial reporting rules that require the Fund to analyze all open tax years, as defined by the statute of limitations, for all major jurisdictions. Generally, tax authorities can examine all tax returns filed for the last three years. The Fund does not have an examination in progress. |
The Fund has reviewed all open tax years and major jurisdictions and concluded that these financial reporting rules had no effect on the Fund’s financial position or results of operations. There is no tax liability resulting from unrecognized tax benefits relating to uncertain income tax positions taken or expected to be taken on the tax return for the fiscal year ended October 31, 2011. The Fund is also not aware of any tax positions for which it is reasonably possible that the total amounts of unrecognized tax benefits will significantly change in the next twelve months.
| | a) | Investment Management Agreement – Hartford Investment Financial Services, LLC (“HIFSCO”), a wholly-owned indirect subsidiary of The Hartford Financial Services Group, Inc. (“The Hartford”), serves as investment manager to the Fund pursuant to an Investment Management Agreement with the Company. As investment manager, HIFSCO has overall investment supervisory responsibility for the Fund. In addition, HIFSCO provides administrative personnel, services, equipment, facilities and office space for proper operation of the Fund. HIFSCO has contracted with Wellington Management Company, LLP (“Wellington Management”) under a sub-advisory agreement for the provision of day-to-day investment management services to the Fund in accordance with the Fund’s investment objective and policies. The Fund pays a fee to HIFSCO, a portion of which may be used to compensate Wellington Management. |
The schedule below reflects the rates of compensation paid to HIFSCO for investment management services rendered as of October 31, 2011; the rates are accrued daily and paid monthly:
| Average Daily Net Assets | | Annual Fee | |
| On first $250 million | | | 0.8000 | % |
| On next $4.75 billion | | | 0.7000 | % |
| On next $5 billion | | | 0.6975 | % |
| Over $10 billion | | | 0.6950 | % |
| | b) | Accounting Services Agreement – Pursuant to the Fund Accounting Agreement between Hartford Life Insurance Company (“HLIC”) and the Company, on behalf of the Fund, HLIC provides accounting services to the Fund and receives monthly compensation based on the Fund’s average net assets at the rates set forth below. The Fund’s accounting services fees are accrued daily and paid monthly. |
| Average Daily Net Assets | | Annual Fee | |
| On first $5 billion | | | 0.012 | % |
| Over $5 billion | | | 0.010 | % |
| The Hartford Growth Fund |
| Notes to Financial Statements – (continued) |
| October 31, 2011 |
| (000’s Omitted) |
| | c) | Operating Expenses – Allocable expenses incurred by the Company are allocated to each Fund and allocated to classes within the Fund in proportion to the average daily net assets of the Fund and each class, except where allocation of certain expenses is more fairly made directly to the Fund or to specific classes within a Fund. As of October 31, 2011, HIFSCO contractually limited the total operating expenses of this Fund, exclusive of taxes, interest expense, brokerage commissions, acquired fund fees and expenses and extraordinary expenses as follows: |
| Class A | | | Class B | | | Class C | | | Class I | | | Class R3 | | | Class R4 | | | Class R5 | | | Class Y | |
| | 1.25 | % | | | 2.00 | % | | | 2.00 | % | | | 1.00 | % | | | 1.50 | % | | | 1.20 | % | | | 0.90 | % | | | 0.85 | % |
From November 1, 2010 through February 28, 2011, HIFSCO contractually limited the total operating expenses of this Fund, exclusive of taxes, interest expense, brokerage commissions, acquired fund fees and expenses and extraordinary expenses as follows:
| Class A | | | Class B | | | Class C | | | Class I | | | Class R3 | | | Class R4 | | | Class R5 | | | Class Y | |
| | 1.30 | % | | | 2.05 | % | | | 2.05 | % | | | 1.05 | % | | | 1.50 | % | | | 1.20 | % | | | 0.90 | % | | | 0.85 | % |
| | d) | Fees Paid Indirectly – The Fund has entered into agreements with State Street Global Markets, LLC and Russell Implementation Services Inc. to partially recapture non-discounted trade commissions. Such rebates are used to pay a portion of the Fund’s expenses. In addition, the Fund’s custodian bank, State Street Bank and Trust Co., has also agreed to reduce its fees when the Fund maintains cash on deposit in a non-interest-bearing custody account. For the year ended October 31, 2011, these amounts are included in the Statement of Operations. |
The ratio of expenses to average net assets in the accompanying financial highlights excludes the reduction in expenses related to fees paid indirectly. The annualized expense ratio for the period listed below including the fees paid indirectly is as follows:
| | | Year Ended October 31, 2011 | |
| Class A Shares | | | 1.25 | % |
| Class B Shares | | | 2.04 | |
| Class C Shares | | | 1.95 | |
| Class I Shares | | | 0.95 | |
| Class R3 Shares | | | 1.50 | |
| Class R4 Shares | | | 1.19 | |
| Class R5 Shares | | | 0.90 | |
| Class Y Shares | | | 0.79 | |
| | e) | Distribution and Service Plan for Class A, B, C, R3 and R4 Shares – HIFSCO is the principal underwriter and distributor of the Fund. HIFSCO is engaged in distribution activities, which include marketing and distribution of shares through broker-dealers, financing distribution costs and maintaining financial books and records. For the year ended October 31, 2011, HIFSCO received front-end load sales charges of $456 and contingent deferred sales charges of $17 from the Fund. |
The Fund has adopted a Distribution and Service Plan in accordance with Rule 12b-1 of the 1940 Act to compensate the distributor (HIFSCO) for activities intended to result in the sale and distribution of Class A, B, C, R3 and R4 shares and for providing services for shareholders. During its May 3, 2011 meeting, the Board of Directors approved an amendment to the Fund’s Class A Plan to, effective August 1, 2011, lower the amount of Rule 12b-1 distribution fees that may be charged in respect of Class A shares of the Fund from an annual rate of 0.35% of the Fund’s average daily net assets attributable to Class A shares to 0.25%. The Board of Directors has authorized Rule 12b-1 payments of up to 0.25% of the Fund’s average daily net assets attributable to Class A shares. As a result, the amendment to the Class A Plan did not affect the fees charged under the plan. Some or all of the fee may be used for shareholder servicing expenses with the remainder used for distribution expenses. Some or the entire Rule 12b-1 fee for Class B shares may be remitted to
broker-dealers for distribution and/or shareholder account services. Under the Class B Plan, the Fund pays the distributor 1.00% of the average daily net assets of Class B shares that are outstanding for 8 years or less, 0.25% of which is a fee for services provided to existing shareholders with the remainder used for distribution expenses. After eight years, Class B shares convert to Class A shares. Upon conversion to Class A shares, the Class A plan described above will apply to those shares. Under the Class C Plan, the Fund pays the distributor 1.00% of the average daily net assets of Class C shares outstanding, 0.25% of which is intended as a fee for services provided to existing shareholders with the remainder used for distribution expenses. For Class C shares, some or the entire fee may be remitted to broker-dealers for distribution and/or shareholder account services. Class R3 shares have a distribution fee of 0.50% and Class R4 shares have a distribution fee of 0.25%. For Class R3 and R4 shares, some or the entire fee may be remitted to broker dealers for distribution and/or shareholder account services. The Fund’s 12b-1 fees are accrued daily and paid monthly.
For the year ended October 31, 2011, total sales commissions paid to affiliated brokers/dealers of The Hartford for distributing the Fund's shares were $50. These commissions are in turn paid to sales representatives of the broker/dealers.
| | f) | Other Related Party Transactions – Certain officers of the Fund are directors and/or officers of HIFSCO and/or The Hartford or its subsidiaries. For the year ended October 31, 2011, a portion of the Fund’s chief compliance officer’s compensation was paid by all of the investment companies in the Hartford fund complex. The portion allocated to the Fund was in the amount of $1. Hartford Administrative Services Company (“HASCO”), an indirect wholly-owned subsidiary of The Hartford, provides transfer agent services to the Fund. HASCO has contractually agreed to reimburse any portion of the transfer agency fees over 0.30% of average daily net assets per fiscal year for each class. HASCO was compensated on a per account basis, which varies by share class, for providing such services. The amount to HASCO and any related contractual reimbursement amounts, if applicable, can be found in the Statement of Operations. These fees are accrued daily and paid monthly. |
Administrative services fees are paid to HASCO for third-party recordkeeping services that are payable as a percentage of net assets in the amount of 0.20%, 0.15% and 0.10% for Classes R3, R4 and R5 shares, respectively. The total administrative services fees are shown on the Statement of Operations. These fees are accrued daily and paid monthly.
| | g) | Payment from Affiliate – On November 8, 2006, the SEC issued an order setting forth the terms of a settlement reached with three subsidiaries of The Hartford that resolved the SEC’s Division of Enforcement’s investigation of aspects of The Hartford’s variable annuity and mutual fund operations related to directed brokerage and revenue sharing. The Hartford settled this matter without admitting or denying the findings of the SEC. |
The total return in the accompanying financial highlights includes a payment from affiliate. Had the payment from affiliate been excluded, the impact and total return for the periods listed below would have been as follows:
| | | Impact from Payment from Affiliate for SEC Settlement for the Year Ended October 31, 2007 | | | Total Return Excluding Payment from Affiliate for the Year Ended October 31, 2007 | |
| Class A | | | 0.01 | % | | | 23.90 | % |
| Class B | | | 0.01 | | | | 23.00 | |
| Class C | | | 0.01 | | | | 23.08 | |
| Class I | | | 0.01 | | | | 24.35 | |
| Class L | | | 0.01 | | | | 24.20 | |
| Class Y | | | 0.01 | | | | 24.50 | |
| The Hartford Growth Fund |
| Notes to Financial Statements – (continued) |
| October 31, 2011 |
| (000’s Omitted) |
As of October 31, 2011, affiliates of The Hartford had ownership of shares in the Fund as follows:
| | | Shares | |
| Class R4 | | | 6 | |
| Class R5 | | | 7 | |
| 9. | Investment Transactions: |
For the year ended October 31, 2011, the Fund's aggregate purchases and sales of investment securities (excluding short-term investments) were as follows:
| | | Amount | |
| Cost of Purchases Excluding U.S. Government Obligations | | $ | 344,809 | |
| Sales Proceeds Excluding U.S. Government Obligations | | | 353,536 | |
| 10. | Capital Share Transactions: |
The following information is for the year ended October 31, 2011, and the year ended October 31, 2010:
| | | For the Year Ended October 31, 2011 | | | For the Year Ended October 31, 2010 | |
| | | | | | Shares Issued for Reinvested Dividends | | | | | | | | | Net Increase (Decrease) of Shares | | | | | | Shares Issued for Reinvested Dividends | | | | | | | | | Net Increase (Decrease) of Shares | |
| Class A | | | | | | | | | | | | | | | | | | | | | | | | | | | | | | |
| Shares | | | 2,922 | | | | — | | | | (6,522 | ) | | | 10,830 | | | | 7,230 | | | | 2,081 | | | | — | | | | (4,737 | ) | | | — | | | | (2,656 | ) |
| Amount | | $ | 52,714 | | | $ | — | | | $ | (115,672 | ) | | $ | 168,113 | | | $ | 105,155 | | | $ | 30,559 | | | $ | — | | | $ | (69,762 | ) | | $ | — | | | $ | (39,203 | ) |
| Class B | | | | | | | | | | | | | | | | | | | | | | | | | | | | | | | | | | | | | | | | |
| Shares | | | 52 | | | | — | | | | (399 | ) | | | — | | | | (347 | ) | | | 15 | | | | — | | | | (405 | ) | | | — | | | | (390 | ) |
| Amount | | $ | 761 | | | $ | — | | | $ | (5,835 | ) | | $ | — | | | $ | (5,074 | ) | | $ | 188 | | | $ | — | | | $ | (5,015 | ) | | $ | — | | | $ | (4,827 | ) |
| Class C | | | | | | | | | | | | | | | | | | | | | | | | | | | | | | | | | | | | | | | | |
| Shares | | | 285 | | | | — | | | | (721 | ) | | | — | | | | (436 | ) | | | 284 | | | | — | | | | (961 | ) | | | — | | | | (677 | ) |
| Amount | | $ | 4,183 | | | $ | — | | | $ | (10,598 | ) | | $ | — | | | $ | (6,415 | ) | | $ | 3,522 | | | $ | — | | | $ | (11,854 | ) | | $ | — | | | $ | (8,332 | ) |
| Class I | | | | | | | | | | | | | | | | | | | | | | | | | | | | | | | | | | | | | | | | |
| Shares | | | 5,804 | | | | — | | | | (1,371 | ) | | | — | | | | 4,433 | | | | 1,726 | | | | 15 | | | | (2,059 | ) | | | — | | | | (318 | ) |
| Amount | | $ | 103,384 | | | $ | — | | | $ | (24,268 | ) | | $ | — | | | $ | 79,116 | | | $ | 25,815 | | | $ | 221 | | | $ | (30,715 | ) | | $ | — | | | $ | (4,679 | ) |
| Class L | | | | | | | | | | | | | | | | | | | | | | | | | | | | | | | | | | | | | | | | |
| Shares | | | 172 | | | | — | | | | (1,051 | ) | | | (10,593 | ) | | | (11,472 | ) | | | 182 | | | | 32 | | | | (1,568 | ) | | | — | | | | (1,354 | ) |
| Amount | | $ | 3,138 | | | $ | — | | | $ | (19,363 | ) | | $ | (168,113 | ) | | $ | (184,338 | ) | | $ | 2,760 | | | $ | 480 | | | $ | (23,536 | ) | | $ | — | | | $ | (20,296 | ) |
| Class R3 | | | | | | | | | | | | | | | | | | | | | | | | | | | | | | | | | | | | | | | | |
| Shares | | | 9 | | | | — | | | | (6 | ) | | | — | | | | 3 | | | | 5 | | | | — | | | | (3 | ) | | | — | | | | 2 | |
| Amount | | $ | 164 | | | $ | — | | | $ | (103 | ) | | $ | — | | | $ | 61 | | | $ | 75 | | | $ | — | | | $ | (39 | ) | | $ | — | | | $ | 36 | |
| Class R4 | | | | | | | | | | | | | | | | | | | | | | | | | | | | | | | | | | | | | | | | |
| Shares | | | 47 | | | | — | | | | (34 | ) | | | — | | | | 13 | | | | 49 | | | | — | | | | (20 | ) | | | — | | | | 29 | |
| Amount | | $ | 857 | | | $ | — | | | $ | (627 | ) | | $ | — | | | $ | 230 | | | $ | 751 | | | $ | 5 | | | $ | (307 | ) | | $ | — | | | $ | 449 | |
| Class R5 | | | | | | | | | | | | | | | | | | | | | | | | | | | | | | | | | | | | | | | | |
| Shares | | | 32 | | | | — | | | | (1 | ) | | | — | | | | 31 | | | | 9 | | | | — | | | | (7 | ) | | | — | | | | 2 | |
| Amount | | $ | 555 | | | $ | — | | | $ | (15 | ) | | $ | — | | | $ | 540 | | | $ | 137 | | | $ | 1 | | | $ | (112 | ) | | $ | — | | | $ | 26 | |
| Class Y | | | | | | | | | | | | | | | | | | | | | | | | | | | | | | | | | | | | | | | | |
| Shares | | | 1,580 | | | | — | | | | (589 | ) | | | — | | | | 991 | | | | 501 | | | | 33 | | | | (1,622 | ) | | | — | | | | (1,088 | ) |
| Amount | | $ | 28,941 | | | $ | — | | | $ | (10,888 | ) | | $ | — | | | $ | 18,053 | | | $ | 7,596 | | | $ | 508 | | | $ | (24,965 | ) | | $ | — | | | $ | (16,861 | ) |
| Total | | | | | | | | | | | | | | | | | | | | | | | | | | | | | | | | | | | | | | | | |
| Shares | | | 10,903 | | | | — | | | | (10,694 | ) | | | 237 | | | | 446 | | | | 4,852 | | | | 80 | | | | (11,382 | ) | | | — | | | | (6,450 | ) |
| Amount | | $ | 194,697 | | | $ | — | | | $ | (187,369 | ) | | $ | — | | | $ | 7,328 | | | $ | 71,403 | | | $ | 1,215 | | | $ | (166,305 | ) | | $ | — | | | $ | (93,687 | ) |
The following reflects the conversion of Class B shares into Class A shares (reflected as Class A shares sold) for the year ended October 31, 2011, and the year ended October 31, 2010:
| | | Shares | | | Dollars | |
| For the Year Ended October 31, 2011 | | | 88 | | | $ | 1,544 | |
| For the Year Ended October 31, 2010 | | | 67 | | | $ | 1,005 | |
The Fund is one of several Hartford funds that participate in a $500 million committed revolving line of credit facility. The facility is to be used for temporary or emergency purposes. Under the arrangement, the funds are required to own securities having a market value in excess of 300% of the total bank borrowings. The interest rate on borrowings varies depending on the nature of the loan. The facility also requires a fee to be paid based on the amount of the commitment. This commitment fee is allocated to all of the funds participating in the line of credit based on the average net assets of the funds. During the year ended October 31, 2011, the Fund did not have any borrowings under this facility.
At its May 3, 2011, meeting, the Board of Directors of The Hartford Mutual Funds II, Inc. approved the reclassification of Class L shares into Class A shares of the Fund.
Effective with the close of business on August 5, 2011, Class L was merged into Class A. The merger was accomplished by a tax-free exchange as detailed below:
| | | Class A | | | Class L | |
| Shares exchanged | | | N/A | | | | 10,593 | |
| Shares issued - to Class L shareholders | | | 10,830 | | | | N/A | |
| Net assets immediately before merger | | $ | 229,124 | | | $ | 179,517 | |
| Net assets immediately after merger | | $ | 408,641 | | | | N/A | |
| 13. | Industry Classifications: |
Other than the industry classifications “Other Investment Pools and Funds” and “Exchange Traded Funds,” equity industry classifications used in this report are the Global Industry Classification Standard, which was developed by and is the exclusive property and service mark of MSCI, Inc. and Standard & Poor’s.
| 14. | Pending Legal Proceedings: |
On February 25, 2011, Jennifer L. Kasilag, Louis Mellinger, Judith M. Menendez, Jacqueline M. Robinson, and Linda A. Russell filed a derivative lawsuit against HIFSCO on behalf of six funds: The Hartford Global Health Fund (now known as The Hartford Healthcare Fund), The Hartford Conservative Allocation Fund, The Hartford Growth Opportunities Fund, The Hartford Inflation Plus Fund, The Hartford Advisers Fund and The Hartford Money Market Fund. The lawsuit, which was filed in the United States District Court for the District of New Jersey, seeks recovery under Section 36(b) of the 1940 Act for the alleged overpayment of investment management and 12b-1 distribution fees to HIFSCO. The plaintiffs seek recovery of the alleged overpayments or, alternatively, rescission of the contracts and restitution of all fees paid, together with lost earnings. On November 14, 2011, the plaintiffs filed an amended complaint, which dropped The Hartford Money Market Fund and added The Hartford Capital Appreciation Fund as a plaintiff. The Hartford intends to vigorously defend the action.
| The Hartford Growth Fund |
| Notes to Financial Statements – (continued) |
| October 31, 2011 |
| (000’s Omitted) |
No accrual for litigation relating to this matter has been recorded in the financial statements of the Fund because the Fund is not party to the suit.
Under the Company’s organizational documents, the Company shall indemnify its officers and directors to the full extent required or permitted under Maryland General Corporation Law and the federal securities laws. In addition, the Company, on behalf of the Fund, may enter into contracts that contain a variety of indemnifications. The Company’s maximum exposure under these arrangements is unknown. However, as of the date of these financial statements, the Company has not had prior claims or losses pursuant to these contracts and expects the risk of loss to be remote.
[This page is intentionally left blank]
- Selected Per-Share Data (A) – |
| | Net Asset Value at Beginning of Period | | | Net Investment Income (Loss) | | | Payments from (to) Affiliate | | | Net Realized and Unrealized Gain (Loss) on Investments | | | Total from Investment Operations | | | Dividends from Net Investment Income | | | Distributions from Realized Capital Gains | | | Distributions from Capital | | | | | | Net Increase (Decrease) in Net Asset Value | | | Net Asset Value at End of Period | |
| | |
| For the Year Ended October 31, 2011 | |
| A(E) | | $ | 16.14 | | | $ | 0.03 | | | $ | – | | | $ | 0.84 | | | $ | 0.87 | | | $ | – | | | $ | – | | | $ | – | | | $ | – | | | $ | 0.87 | | | $ | 17.01 | |
| B | | | 13.53 | | | | (0.18 | ) | | | – | | | | 0.79 | | | | 0.61 | | | | – | | | | – | | | | – | | | | – | | | | 0.61 | | | | 14.14 | |
| C | | | 13.53 | | | | (0.15 | ) | | | – | | | | 0.78 | | | | 0.63 | | | | – | | | | – | | | | – | | | | – | | | | 0.63 | | | | 14.16 | |
| I | | | 16.33 | | | | – | | | | – | | | | 0.93 | | | | 0.93 | | | | – | | | | – | | | | – | | | | – | | | | 0.93 | | | | 17.26 | |
| R3 | | | 16.42 | | | | (0.10 | ) | | | – | | | | 0.94 | | | | 0.84 | | | | – | | | | – | | | | – | | | | – | | | | 0.84 | | | | 17.26 | |
| R4 | | | 16.61 | | | | (0.04 | ) | | | – | | | | 0.94 | | | | 0.90 | | | | – | | | | – | | | | – | | | | – | | | | 0.90 | | | | 17.51 | |
| R5 | | | 16.69 | | | | – | | | | – | | | | 0.96 | | | | 0.96 | | | | – | | | | – | | | | – | | | | – | | | | 0.96 | | | | 17.65 | |
| Y | | | 16.83 | | | | 0.03 | | | | – | | | | 0.96 | | | | 0.99 | | | | – | | | | – | | | | – | | | | – | | | | 0.99 | | | | 17.82 | |
| | |
| For the Year Ended October 31, 2010 | |
| A | | | 13.57 | | | | (0.05 | ) | | | – | | | | 2.62 | | | | 2.57 | | | | – | | | | – | | | | – | | | | – | | | | 2.57 | | | | 16.14 | |
| B | | | 11.46 | | | | (0.16 | ) | | | – | | | | 2.23 | | | | 2.07 | | | | – | | | | – | | | | – | | | | – | | | | 2.07 | | | | 13.53 | |
| C | | | 11.46 | | | | (0.15 | ) | | | – | | | | 2.22 | | | | 2.07 | | | | – | | | | – | | | | – | | | | – | | | | 2.07 | | | | 13.53 | |
| I | | | 13.73 | | | | 0.01 | | | | – | | | | 2.65 | | | | 2.66 | | | | (0.06 | ) | | | – | | | | – | | | | (0.06 | ) | | | 2.60 | | | | 16.33 | |
| R3 | | | 13.84 | | | | (0.07 | ) | | | – | | | | 2.66 | | | | 2.59 | | | | (0.01 | ) | | | – | | | | – | | | | (0.01 | ) | | | 2.58 | | | | 16.42 | |
| R4 | | | 13.98 | | | | (0.03 | ) | | | – | | | | 2.69 | | | | 2.66 | | | | (0.03 | ) | | | – | | | | – | | | | (0.03 | ) | | | 2.63 | | | | 16.61 | |
| R5 | | | 14.10 | | | | 0.01 | | | | – | | | | 2.64 | | | | 2.65 | | | | (0.06 | ) | | | – | | | | – | | | | (0.06 | ) | | | 2.59 | | | | 16.69 | |
| Y | | | 14.15 | | | | 0.03 | | | | – | | | | 2.72 | | | | 2.75 | | | | (0.07 | ) | | | – | | | | – | | | | (0.07 | ) | | | 2.68 | | | | 16.83 | |
| | |
| For the Year Ended October 31, 2009 | |
| A | | | 11.59 | | | | 0.02 | | | | – | | | | 1.96 | | | | 1.98 | | | | – | | | | – | | | | – | | | | – | | | | 1.98 | | | | 13.57 | |
| B | | | 9.83 | | | | (0.03 | ) | | | – | | | | 1.66 | | | | 1.63 | | | | – | | | | – | | | | – | | | | – | | | | 1.63 | | | | 11.46 | |
| C | | | 9.86 | | | | (0.07 | ) | | | – | | | | 1.67 | | | | 1.60 | | | | – | | | | – | | | | – | | | | – | | | | 1.60 | | | | 11.46 | |
| I | | | 11.69 | | | | 0.05 | | | | – | | | | 1.99 | | | | 2.04 | | | | – | | | | – | | | | – | | | | – | | | | 2.04 | | | | 13.73 | |
| R3 | | | 11.86 | | | | (0.02 | ) | | | – | | | | 2.00 | | | | 1.98 | | | | – | | | | – | | | | – | | | | – | | | | 1.98 | | | | 13.84 | |
| R4 | | | 11.94 | | | | 0.01 | | | | – | | | | 2.03 | | | | 2.04 | | | | – | | | | – | | | | – | | | | – | | | | 2.04 | | | | 13.98 | |
| R5 | | | 12.00 | | | | 0.04 | | | | – | | | | 2.06 | | | | 2.10 | | | | – | | | | – | | | | – | | | | – | | | | 2.10 | | | | 14.10 | |
| Y | | | 12.03 | | | | 0.08 | | | | – | | | | 2.04 | | | | 2.12 | | | | – | | | | – | | | | – | | | | – | | | | 2.12 | | | | 14.15 | |
| | |
| For the Year Ended October 31, 2008 (F) | |
| A | | | 21.25 | | | | (0.05 | ) | | | – | | | | (8.03 | ) | | | (8.08 | ) | | | – | | | | (1.58 | ) | | | – | | | | (1.58 | ) | | | (9.66 | ) | | | 11.59 | |
| B | | | 18.39 | | | | (0.13 | ) | | | – | | | | (6.85 | ) | | | (6.98 | ) | | | – | | | | (1.58 | ) | | | – | | | | (1.58 | ) | | | (8.56 | ) | | | 9.83 | |
| C | | | 18.45 | | | | (0.14 | ) | | | – | | | | (6.87 | ) | | | (7.01 | ) | | | – | | | | (1.58 | ) | | | – | | | | (1.58 | ) | | | (8.59 | ) | | | 9.86 | |
| I | | | 21.34 | | | | 0.02 | | | | – | | | | (8.09 | ) | | | (8.07 | ) | | | – | | | | (1.58 | ) | | | – | | | | (1.58 | ) | | | (9.65 | ) | | | 11.69 | |
| R3 | | | 21.76 | | | | (0.08 | ) | | | – | | | | (8.24 | ) | | | (8.32 | ) | | | – | | | | (1.58 | ) | | | – | | | | (1.58 | ) | | | (9.90 | ) | | | 11.86 | |
| R4 | | | 21.82 | | | | (0.03 | ) | | | – | | | | (8.27 | ) | | | (8.30 | ) | | | – | | | | (1.58 | ) | | | – | | | | (1.58 | ) | | | (9.88 | ) | | | 11.94 | |
| R5 | | | 21.87 | | | | 0.02 | | | | – | | | | (8.31 | ) | | | (8.29 | ) | | | – | | | | (1.58 | ) | | | – | | | | (1.58 | ) | | | (9.87 | ) | | | 12.00 | |
| Y | | | 21.90 | | | | 0.04 | | | | – | | | | (8.33 | ) | | | (8.29 | ) | | | – | | | | (1.58 | ) | | | – | | | | (1.58 | ) | | | (9.87 | ) | | | 12.03 | |
| | |
| For the Year Ended October 31, 2007 | |
| A | | | 18.45 | | | | (0.07 | ) | | | – | | | | 4.17 | | | | 4.10 | | | | – | | | | (1.30 | ) | | | – | | | | (1.30 | ) | | | 2.80 | | | | 21.25 | |
| B | | | 16.25 | | | | (0.21 | ) | | | – | | | | 3.65 | | | | 3.44 | | | | – | | | | (1.30 | ) | | | – | | | | (1.30 | ) | | | 2.14 | | | | 18.39 | |
| C | | | 16.29 | | | | (0.19 | ) | | | – | | | | 3.65 | | | | 3.46 | | | | – | | | | (1.30 | ) | | | – | | | | (1.30 | ) | | | 2.16 | | | | 18.45 | |
| I | | | 18.46 | | | | – | | | | – | | | | 4.18 | | | | 4.18 | | | | – | | | | (1.30 | ) | | | – | | | | (1.30 | ) | | | 2.88 | | | | 21.34 | |
| R3(H) | | | 18.15 | | | | (0.08 | ) | | | – | | | | 3.69 | | | | 3.61 | | | | – | | | | – | | | | – | | | | – | | | | 3.61 | | | | 21.76 | |
| R4(H) | | | 18.15 | | | | (0.01 | ) | | | – | | | | 3.68 | | | | 3.67 | | | | – | | | | – | | | | – | | | | – | | | | 3.67 | | | | 21.82 | |
| R5(H) | | | 18.15 | | | | – | | | | – | | | | 3.72 | | | | 3.72 | | | | – | | | | – | | | | – | | | | – | | | | 3.72 | | | | 21.87 | |
| Y | | | 18.89 | | | | 0.02 | | | | – | | | | 4.29 | | | | 4.31 | | | | – | | | | (1.30 | ) | | | – | | | | (1.30 | ) | | | 3.01 | | | | 21.90 | |
| (A) | Information presented relates to a share outstanding throughout the indicated period. |
| (B) | Assumes initial investment at net asset value at the beginning of each period, reinvestment of all distributions, the complete redemption of the investment at net asset value at the end of each period and no sales charge. Total return would be reduced if sales charges were taken into account. |
| (C) | Ratios do not include fees paid indirectly (See Expenses in the accompanying Notes to Financial Statements). |
| (D) | Portfolio turnover rate is calculated on the basis of the Fund as a whole without distinguishing between the classes of shares issued. |
| (E) | Class L was merged into Class A on August 5, 2011 (See Class Merger in accompanying Notes to Financial Statements). |
| (F) | Per share amounts have been calculated using average shares outstanding method. |
| (G) | Total return without the inclusion of the Payments from (to) Affiliate, can be found in Expenses in the accompanying Notes to Financial Statements. |
| (H) | Commenced operations on December 22, 2006. |
- Ratios and Supplemental Data -
| | | Net Assets at End of Period (000's) | | | Ratio of Expenses to Average Net Assets Before Waivers and Reimbursements and Including Expenses not Subject to Cap(C) | | | Ratio of Expenses to Average Net Assets After Waivers and Reimbursements and Including Expenses not Subject to Cap(C) | | | Ratio of Expenses to Average Net Assets After Waivers and Reimbursements and Excluding Expenses not Subject to Cap(C) | | | Ratio of Net Investment Income (Loss) to Average Net Assets | | | | |
| | | | | | | | | | | | | | | | | | | | |
| | | | | | | | | | | | | | | | | | | | |
| | 5.39 | % | | $ | 404,630 | | | | 1.26 | % | | | 1.25 | % | | | 1.25 | % | | | 0.22 | % | | | 47 | % |
| | 4.51 | | | | 13,411 | | | | 2.22 | | | | 2.05 | | | | 2.05 | | | | (1.03 | ) | | | – | |
| | 4.66 | | | | 39,365 | | | | 1.95 | | | | 1.95 | | | | 1.95 | | | | (0.96 | ) | | | – | |
| | 5.70 | | | | 139,421 | | | | 0.95 | | | | 0.95 | | | | 0.95 | | | | (0.03 | ) | | | – | |
| | 5.12 | | | | 298 | | | | 1.61 | | | | 1.50 | | | | 1.50 | | | | (0.55 | ) | | | – | |
| | 5.42 | | | | 3,918 | | | | 1.19 | | | | 1.19 | | | | 1.19 | | | | (0.21 | ) | | | – | |
| | 5.75 | | | | 689 | | | | 0.91 | | | | 0.90 | | | | 0.90 | | | | (0.03 | ) | | | – | |
| | 5.88 | | | | 124,174 | | | | 0.79 | | | | 0.79 | | | | 0.79 | | | | 0.18 | | | | – | |
| | |
| | |
| | 18.94 | | | | 267,340 | | | | 1.29 | | | | 1.29 | | | | 1.29 | | | | (0.32 | ) | | | 57 | |
| | 18.06 | | | | 17,522 | | | | 2.28 | | | | 2.05 | | | | 2.05 | | | | (1.08 | ) | | | – | |
| | 18.06 | | | | 43,521 | | | | 1.99 | | | | 1.99 | | | | 1.99 | | | | (1.02 | ) | | | – | |
| | 19.42 | | | | 59,539 | | | | 0.90 | | | | 0.90 | | | | 0.90 | | | | 0.06 | | | | – | |
| | 18.69 | | | | 233 | | | | 1.62 | | | | 1.53 | | | | 1.53 | | | | (0.58 | ) | | | – | |
| | 19.03 | | | | 3,507 | | | | 1.20 | | | | 1.20 | | | | 1.20 | | | | (0.24 | ) | | | – | |
| | 18.83 | | | | 134 | | | | 0.94 | | | | 0.93 | | | | 0.93 | | | | 0.03 | | | | – | |
| | 19.50 | | | | 100,614 | | | | 0.81 | | | | 0.81 | | | | 0.81 | | | | 0.16 | | | | – | |
| | |
| | |
| | 17.08 | | | | 260,833 | | | | 1.44 | | | | 1.24 | | | | 1.24 | | | | 0.15 | | | | 94 | |
| | 16.58 | | | | 19,319 | | | | 2.49 | | | | 1.69 | | | | 1.69 | | | | (0.30 | ) | | | – | |
| | 16.23 | | | | 44,604 | | | | 2.09 | | | | 2.05 | | | | 2.05 | | | | (0.67 | ) | | | – | |
| | 17.45 | | | | 54,433 | | | | 0.94 | | | | 0.94 | | | | 0.94 | | | | 0.43 | | | | – | |
| | 16.69 | | | | 163 | | | | 1.73 | | | | 1.55 | | | | 1.55 | | | | (0.25 | ) | | | – | |
| | 17.09 | | | | 2,541 | | | | 1.23 | | | | 1.23 | | | | 1.23 | | | | 0.12 | | | | – | |
| | 17.50 | | | | 91 | | | | 0.96 | | | | 0.95 | | | | 0.95 | | | | 0.39 | | | | – | |
| | 17.62 | | | | 99,987 | | | | 0.84 | | | | 0.84 | | | | 0.84 | | | | 0.56 | | | | – | |
| | |
| | |
| | (40.77 | ) | | | 292,129 | | | | 1.27 | | | | 1.27 | | | | 1.27 | | | | (0.27 | ) | | | 106 | |
| | (41.16 | ) | | | 19,936 | | | | 2.24 | | | | 1.91 | | | | 1.91 | | | | (0.91 | ) | | | – | |
| | (41.19 | ) | | | 46,757 | | | | 1.97 | | | | 1.97 | | | | 1.97 | | | | (0.96 | ) | | | – | |
| | (40.53 | ) | | | 48,174 | | | | 0.89 | | | | 0.89 | | | | 0.89 | | | | 0.14 | | | | – | |
| | (40.93 | ) | | | 53 | | | | 1.71 | | | | 1.55 | | | | 1.55 | | | | (0.51 | ) | | | – | |
| | (40.70 | ) | | | 1,394 | | | | 1.20 | | | | 1.20 | | | | 1.20 | | | | (0.17 | ) | | | – | |
| | (40.56 | ) | | | 51 | | | | 0.92 | | | | 0.92 | | | | 0.92 | | | | 0.09 | | | | – | |
| | (40.50 | ) | | | 116,109 | | | | 0.80 | | | | 0.80 | | | | 0.80 | | | | 0.21 | | | | – | |
| | |
| | |
| | 23.92 | (G) | | | 627,677 | | | | 1.27 | | | | 1.27 | | | | 1.27 | | | | (0.35 | ) | | | 89 | |
| | 23.02 | (G) | | | 41,359 | | | | 2.22 | | | | 2.09 | | | | 2.09 | | | | (1.17 | ) | | | – | |
| | 23.10 | (G) | | | 85,303 | | | | 1.98 | | | | 1.98 | | | | 1.98 | | | | (1.06 | ) | | | – | |
| | 24.37 | (G) | | | 35,626 | | | | 0.91 | | | | 0.91 | | | | 0.91 | | | | 0.02 | | | | – | |
| | 19.89 | (I) | | | 16 | | | | 1.56 | (J) | | | 1.56 | (J) | | | 1.56 | (J) | | | (0.67 | ) (J) | | | – | |
| | 20.22 | (I) | | | 282 | | | | 1.17 | (J) | | | 1.17 | (J) | | | 1.17 | (J) | | | (0.28 | ) (J) | | | – | |
| | 20.50 | (I) | | | 63 | | | | 0.90 | (J) | | | 0.90 | (J) | | | 0.90 | (J) | | | (0.01 | ) (J) | | | – | |
| | 24.52 | (G) | | | 103,251 | | | | 0.81 | | | | 0.81 | | | | 0.81 | | | | 0.10 | | | | – | |
|
The Board of Directors and Shareholders of |
The Hartford Mutual Funds II, Inc. |
We have audited the accompanying statement of assets and liabilities, including the schedule of investments, of The Hartford Growth Fund (one of the portfolios constituting The Hartford Mutual Funds II, Inc. (the Funds)) as of October 31, 2011, and the related statement of operations for the year then ended, the statements of changes in net assets for each of the two years in the period then ended, and the financial highlights for each of the five years in the period then ended. These financial statements and financial highlights are the responsibility of the Funds’ management. Our responsibility is to express an opinion on these financial statements and financial highlights based on our audits.
We conducted our audits in accordance with the standards of the Public Company Accounting Oversight Board (United States). Those standards require that we plan and perform the audit to obtain reasonable assurance about whether the financial statements and financial highlights are free of material misstatement. We were not engaged to perform an audit of the Funds’ internal control over financial reporting. Our audits included consideration of internal control over financial reporting as a basis for designing audit procedures that are appropriate in the circumstances, but not for the purpose of expressing an opinion on the effectiveness of the Funds’ internal control over financial reporting. Accordingly, we express no such opinion. An audit also includes examining, on a test basis, evidence supporting the amounts and disclosures in the financial statements and financial highlights, assessing the accounting principles used and significant estimates made by management, and evaluating the overall financial statement presentation. Our procedures included confirmation of securities owned as of October 31, 2011, by correspondence with the custodian and brokers or by other appropriate auditing procedures where replies from brokers were not received. We believe that our audits provide a reasonable basis for our opinion.
In our opinion, the financial statements and financial highlights referred to above present fairly, in all material respects, the financial position of The Hartford Growth Fund of The Hartford Mutual Funds II, Inc. at October 31, 2011, the results of its operations for the year then ended, the changes in its net assets for each of the two years in the period then ended, and the financial highlights for each of the five years in the period then ended, in conformity with U.S. generally accepted accounting principles.
Minneapolis, MN
December 16, 2011
|
| Directors and Officers (Unaudited) |
The Board of Directors of the Company appoints officers who are responsible for the day-to-day operations of the Fund and who execute policies formulated by the Directors. Each director serves until his or her death, resignation, or retirement or until the next annual meeting of shareholders is held or until his or her successor is elected and qualifies.
Directors and officers who are employed by or who have a financial interest in The Hartford are considered “interested” persons of the Fund pursuant to the 1940 Act. Each officer and two of the Company’s directors, as noted in the chart below, are “interested” persons of the Fund. Each director serves as a director for The Hartford Mutual Funds, Inc., The Hartford Mutual Funds II, Inc., Hartford Series Fund, Inc., and Hartford HLS Series Fund II, Inc., and as a trustee for The Hartford Alternative Strategies Fund, which, as of October 31, 2011, collectively consist of 91 funds. Correspondence may be sent to directors and officers c/o Hartford Mutual Funds, P.O. Box 2999, Hartford, Connecticut 06104-2999, except that correspondence to Ms. Fagely may be sent to 500 Bielenberg Drive, Woodbury, Minnesota 55125.
The table below sets forth, for each director and officer, his or her name, year of birth, current position with the Company and date first elected or appointed to The Hartford Mutual Funds, Inc. (“MF”) and The Hartford Mutual Funds II, Inc. (“MF2”), principal occupation, and, for directors, other directorships held. The Fund’s statement of additional information contains further information on the directors and is available free of charge by calling 1-888-843-7824 or writing to Hartford Mutual Funds, P.O. Box 64387, St. Paul, MN 55164-0387.
Information on the aggregate remuneration paid to the directors of the Company can be found in the Statement of Operations herein. The Fund pays to The Hartford a portion of the Chief Compliance Officer’s compensation, but does not pay salaries or compensation to any of its other officers or directors who are employed by The Hartford.
Non-Interested Directors
Lynn S. Birdsong (1946) Director since 2003, Co-Chairman of the Investment Committee
Mr. Birdsong is a private investor. Mr. Birdsong currently serves as a Director of the Sovereign High Yield Investment Company (April 2010 to current). Mr. Birdsong currently serves as an Independent Director of Nomura Partners Funds, Inc. (formerly, The Japan Fund) (March 2003 to current). From 2003 to March 2005, Mr. Birdsong was an independent director of the Atlantic Whitehall Funds. From 1979 to 2002, Mr. Birdsong was a managing director of Zurich Scudder Investments, an investment management firm. During his employment with Scudder, Mr. Birdsong was an Interested Director of The Japan Fund. Since 1981, Mr. Birdsong has been a partner in Birdsong Company, an advertising specialty firm.
Robert M. Gavin, Jr. (1940) Director since 2002 (MF) and 1986 (MF2), Chairman of the Board since 2004
Dr. Gavin is an educational consultant. Prior to September 1, 2001, he was President of Cranbrook Education Community and prior to July 1996, he was President of Macalester College, St. Paul, Minnesota.
Duane E. Hill (1945) Director since 2001 (MF) and 2002 (MF2), Chairman of the Nominating Committee
Mr. Hill is Partner of TSG Ventures L.P., a private equity investment company. Mr. Hill is a former partner of TSG Capital Group, a private equity investment firm that served as sponsor and lead investor in leveraged buyouts of middle market companies.
Sandra S. Jaffee (1941) Director since 2005
Ms. Jaffee served as Chairman (2008 to 2009) and Chief Executive Officer of Fortent (formerly Searchspace Group), a leading provider of compliance/regulatory technology to financial institutions from August 2005 to August 2009. From August 2004 to August 2005, Ms. Jaffee served as an Entrepreneur in Residence with Warburg Pincus, a private equity firm. From September 1995 to July 2004, Ms. Jaffee served as Executive Vice President at Citigroup, where she was President and Chief Executive Officer of Citibank’s Global Securities Services (1995 to 2003). Ms. Jaffe currently serves as a member of the Board of Directors of Broadridge Financial Solutions as well as a Trustee of Muhlenberg College.
William P. Johnston (1944) Director since 2005, Chairman of the Compliance Committee
In June 2006, Mr. Johnston was appointed as Senior Advisor to The Carlyle Group, a global private equity investment firm. In August 2007, Mr. Johnston was elected to the Board of Directors of LifeCare Holdings, Inc. In February 2008, Mr. Johnston was elected to the Board of Directors of HCR-ManorCare, Inc. In May 2006, Mr. Johnston was elected to the Supervisory Board of Fresenius Medical Care AG & Co. KGaA, after its acquisition of Renal Care Group, Inc. in March 2006. Mr. Johnston joined Renal Care Group in November 2002 as a member of the Board of Directors and served as Chairman of the Board from March 2003 through March 2006. Mr. Johnston served as a Director of MultiPlan, Inc. from July 2006 through August 2010. From September 1987 to December 2002, Mr. Johnston was with Equitable Securities Corporation (and its successors, SunTrust Equitable Securities and SunTrust Robinson Humphrey) serving in various investment banking and managerial positions, including Managing Director and Head of Investment Banking, Chief Executive Officer and Vice Chairman.
| The Hartford Growth Fund |
| Directors and Officers (Unaudited) – (continued) |
Phillip O. Peterson (1944) Director since 2002, (MF) and 2000 (MF2), Chairman of the Audit Committee
Mr. Peterson is a mutual fund industry consultant. He was a partner of KPMG LLP (an accounting firm) until July 1999. Mr. Peterson joined William Blair Funds in February 2007 as a member of the Board of Trustees. From January 2004 to April 2005, Mr. Peterson served as Independent President of the Strong Mutual Funds.
Lemma W. Senbet (1946) Director since 2005
Dr. Senbet is the William E. Mayer Chair Professor of Finance and Director, Center for Financial Policy, at the University of Maryland, Robert H. Smith School of Business. He was chair of the Finance Department from 1998 to 2006. Previously he was a chaired professor of finance at the University of Wisconsin-Madison. Also, he was director of the Fortis Funds from March 2000 to July 2002. Dr. Senbet served the finance profession in various capacities, including as director of the American Finance Association and President of the Western Finance Association. In 2006, Dr. Senbet was inducted Fellow of Financial Management Association International for his career-long distinguished scholarship and professional service.
Interested Directors and Officers
David N. Levenson (1966) Director since 2010
Mr. Levenson currently serves as President of The Hartford’s Wealth Management business. He was appointed to this role in July 2010. Previously, Mr. Levenson served as Executive Vice President of Legacy Holdings for The Hartford from June 2009 to July 2010. From 2006 to 2009, Mr. Levenson was with Hartford Life Insurance K.K. where he served as President and Chief Executive Officer from 2007 to 2009. He served as Managing Director of Hartford Investment Management Company from 2005 to 2006. Additionally, Mr. Levenson serves as Executive Vice President of The Hartford and as President, Director and Chief Executive Officer of Hartford Life Insurance Company (“HLIC”) and Hartford Life, Inc. (“HL Inc.”).
Lowndes A. Smith (1939) Director since 1996, (MF) and 2002 (MF2), Co-Chairman of the Investment Committee
Mr. Smith served as Vice Chairman of The Hartford from February 1997 to January 2002, as President and Chief Executive Officer of HL Inc. from February 1997 to January 2002, and as President and Chief Operating Officer of The Hartford Life Insurance Companies from January 1989 to January 2002. Mr. Smith serves as a Director of White Mountains Insurance Group, Ltd., One Beacon Insurance and Symetra Financial and as a Managing Director of Whittington Gray Associates.
Other Officers
James E. Davey (1964) President and Chief Executive Officer since 2010
Mr. Davey serves as Executive Vice President of HLIC. Additionally, Mr. Davey serves as President, Chief Executive Officer and Manager of HIFSCO and President, Chief Executive Officer and Manager of HL Investment Advisors, LLC (“HL Advisors”). Mr. Davey joined The Hartford in 2002.
Michael R. Dressen (1963) AML Compliance Officer since 2011
Mr. Dressen currently serves as Assistant Vice President of HLIC. He also serves as Chief Compliance Officer and AML Compliance Officer of Hartford Administrative Services Company (“HASCO”) and as Assistant Secretary and Compliance Officer of HIFSCO. Mr Dressen joined The Hartford in 2005 from State Farm Insurance Companies where he held various positions related to mutual funds, variable products, and property casualty insurance.
Tamara L. Fagely (1958) Vice President, Controller and Treasurer since 2002 (MF) and 1993 (MF2)
Ms. Fagely has been a Vice President of HASCO since 1998 and Chief Financial Officer since 2006. Currently Ms. Fagely is a Vice President of HLIC. She served as Assistant Vice President of HLIC from December 2001 through March 2005. In addition, Ms. Fagely is Controller and Chief Financial Officer of HIFSCO.
Dr. Robert J. Froehlich (1953) Senior Managing Director since 2009
Dr. Froehlich joined The Hartford as Senior Managing Director in September 2009. Prior to joining The Hartford, Dr. Froehlich served as Vice Chairman of Deutsche Asset Management from 1997-2009.
Edward P. Macdonald (1967) Vice President, Secretary and Chief Legal Officer since 2005
Mr. Macdonald serves as Vice President of HLIC and Chief Legal Officer of Mutual Funds and Vice President of HIFSCO. He also serves as Vice President and Secretary of HASCO, and Chief Legal Officer, Secretary and Vice President of HL Advisors. Mr. Macdonald joined The Hartford in 2005.
Vernon J. Meyer (1964) Vice President since 2006
Mr. Meyer serves as Senior Vice President of HLIC. He also serves as Senior Vice President of HIFSCO and HL Advisors. Mr. Meyer joined The Hartford in 2004.
Colleen B. Pernerewski (1969) Vice President and Chief Compliance Officer since 2010
Ms. Pernerewski serves as Vice President and Chief Investment Advisor Compliance Officer of HIFSCO and as Vice President and Chief Compliance Officer of HL Advisors. Ms. Pernerewski joined The Hartford in 2005 from Travelers Life and Annuity where she served as Counsel (2004-2005). Prior to Travelers Life and Annuity, Ms. Pernerewski held the position of Counsel at The Hartford (1998-2004).
Elizabeth L. Schroeder (1966) Vice President since 2010
Ms. Schroeder currently serves as Assistant Vice President of HLIC. Ms. Schroeder joined HLIC in 1991. She is also an Assistant Vice President of HASCO, HIFSCO and HL Advisors.
Martin Swanson (1962) Vice President since 2010
Mr. Swanson is a Vice President of HLIC. Mr. Swanson also serves as Vice President/Marketing for HIFSCO. Prior to joining HLIC in 1998, Mr. Swanson was a Vice President at PaineWebber, Inc.
Jane Wolak (1961) Vice President since 2009
Ms. Wolak currently serves as Senior Vice President of HLIC. Ms. Wolak joined HLIC as Vice President, Retail Product Services in May 2007. She is also Vice President of HASCO. Previously, Ms. Wolak was with Sun Life Financial where she held the position of Vice President, Service Center Operations from 2001-2007.
A description of the policies and procedures that the Fund uses to determine how to vote proxies relating to portfolio securities and a record of how the Fund voted any proxies for the twelve-month period ended June 30, 2011 are available (1) without charge, upon request, by calling 888-843-7824 and (2) on the SEC’s website at http://www.sec.gov.
The Fund files a complete schedule of portfolio holdings with the SEC for the first and third quarters of each fiscal year on Form N-Q. The Fund’s Forms are available (1) without charge, upon request, by calling 888-843-7824 and (2) on the SEC’s website at http://www.sec.gov. The Form N-Q may be reviewed and copied at the SEC’s Public Reference Room in Washington, DC. Information on the operation of the Public Reference Room may be obtained by calling 1-800-SEC-0330.
|
| Federal Tax Information (Unaudited) |
For the fiscal year ended October 31, 2011, there is no further federal tax information required for this Fund.
|
| Expense Example (Unaudited) |
Your Fund's Expenses
As a shareholder of the Fund, you incur two types of costs: (1) transaction costs, including sales charges (loads) on purchase payments and contingent deferred sales charges (CDSC) and (2) ongoing costs, including investment management fees, distribution fees, and other fund expenses. This example is intended to help you understand your ongoing costs (in dollars) of investing in the Fund and to compare these costs with the ongoing costs of investing in other mutual funds. The example is based on an investment of $1,000 invested at the beginning of the period and held for the period of April 30, 2011 through October 31, 2011.
Actual Expenses
The first set of columns of the table below provides information about actual account values and actual expenses. You may use the information in this column, together with the amount you invested, to estimate the expenses that you paid over the period. Simply divide your account value by $1,000 (for example, an $8,600 account value divided by $1,000 = 8.6), then multiply the result by the number in the line under the heading entitled “Expenses Paid During Period” to estimate the expenses you paid on your account during this period.
Hypothetical Example for Comparison Purposes
The second set of columns of the table below provides information about hypothetical account values and hypothetical expenses based on the Fund's actual expense ratio and an assumed rate of return of 5% per year before expenses, which is not the Fund's actual return. The hypothetical account values and expenses may not be used to estimate the actual ending account balance or expenses you paid for the period. You may use this information to compare the ongoing costs of investing in the Fund and other funds. To do so, compare this 5% hypothetical example with the 5% hypothetical examples that appear in the shareholder reports of the other funds.
Please note that the expenses shown in the table are meant to highlight your ongoing costs only and do not reflect any transactional costs, such as sales charges (loads) and CDSC. Therefore, the second set of columns of the table is useful in comparing ongoing costs only, and will not help you determine the relative total costs of owning different funds. In addition, if these transactional costs were included, your costs would be higher. Expenses are equal to the Fund's annualized expense ratios multiplied by average account value over the period, multiplied by 184/365 (to reflect the one-half year period).
| | | Actual return | | | Hypothetical (5% return before expenses) | | | | | | | | | | |
| | | Beginning Account Value April 30, 2011 | | | Ending Account Value October 31, 2011 | | | Expenses paid during the period April 30, 2011 through October 31, 2011 | | | Beginning Account Value April 30, 2011 | | | Ending Account Value October 31, 2011 | | | Expenses paid during the period April 30, 2011 through October 31, 2011 | | | | | | | | | | |
| Class A | | $ | 1,000.00 | | | $ | 884.10 | | | $ | 5.94 | | | $ | 1,000.00 | | | $ | 1,018.90 | | | $ | 6.37 | | | | 1.25 | % | | | 184 | | | | 365 | |
| Class B | | $ | 1,000.00 | | | $ | 880.40 | | | $ | 9.61 | | | $ | 1,000.00 | | | $ | 1,014.98 | | | $ | 10.30 | | | | 2.03 | | | | 184 | | | | 365 | |
| Class C | | $ | 1,000.00 | | | $ | 881.10 | | | $ | 9.26 | | | $ | 1,000.00 | | | $ | 1,015.36 | | | $ | 9.92 | | | | 1.95 | | | | 184 | | | | 365 | |
| Class I | | $ | 1,000.00 | | | $ | 885.60 | | | $ | 4.60 | | | $ | 1,000.00 | | | $ | 1,020.33 | | | $ | 4.93 | | | | 0.97 | | | | 184 | | | | 365 | |
| Class R3 | | $ | 1,000.00 | | | $ | 883.30 | | | $ | 7.12 | | | $ | 1,000.00 | | | $ | 1,017.64 | | | $ | 7.63 | | | | 1.50 | | | | 184 | | | | 365 | |
| Class R4 | | $ | 1,000.00 | | | $ | 884.30 | | | $ | 5.64 | | | $ | 1,000.00 | | | $ | 1,019.22 | | | $ | 6.04 | | | | 1.19 | | | | 184 | | | | 365 | |
| Class R5 | | $ | 1,000.00 | | | $ | 885.60 | | | $ | 4.28 | | | $ | 1,000.00 | | | $ | 1,020.67 | | | $ | 4.59 | | | | 0.90 | | | | 184 | | | | 365 | |
| Class Y | | $ | 1,000.00 | | | $ | 886.60 | | | $ | 3.74 | | | $ | 1,000.00 | | | $ | 1,021.24 | | | $ | 4.01 | | | | 0.79 | | | | 184 | | | | 365 | |
|
| Approval of Investment Management and Investment Sub-Advisory Agreements (Unaudited) |
Section 15(c) of the Investment Company Act of 1940, as amended (the “1940 Act”), requires that each mutual fund’s board of directors, including a majority of those directors who are not “interested persons” of the mutual fund, as defined in the 1940 Act (the “Independent Directors”), annually review and consider the continuation of the mutual fund’s investment advisory and sub-advisory agreements. At its meeting held on August 2-3, 2011, the Board of Directors (the “Board”) of The Hartford Mutual Funds II, Inc., including each of the Independent Directors, unanimously voted to approve the continuation of the investment management agreement for The Hartford Growth Fund (the “Fund”) with Hartford Investment Financial Services, LLC (“HIFSCO”) and the continuation of the investment sub-advisory agreement between HIFSCO and the Fund’s sub-adviser, Wellington Management Company, LLP (the “Sub-adviser,” and together with HIFSCO, the “Advisers”) (collectively, the “Agreements”).
In the months preceding the August 2-3, 2011 meeting, the Board requested, received, and reviewed written responses from the Advisers to questions posed to them on behalf of the Independent Directors and supporting materials relating to those questions and responses. The Board considered information furnished to the Board at its meetings throughout the year, as well as information specifically prepared in connection with the annual approval of the Agreements at the Board’s meetings held on June 21-22, 2011 and August 2-3, 2011. Information provided to the Board at its meetings throughout the year included, among other things, reports on Fund performance, legal and compliance matters, sales and marketing activity, shareholder services, and the other services provided to the Fund by the Advisers and their affiliates. In addition, the Board received in-person presentations by Fund officers and representatives of HIFSCO at the Board’s meetings on June 21-22, 2011 and August 2-3, 2011 concerning the Agreements.
The Independent Directors, advised by independent legal counsel, engaged two service providers to assist them with evaluating the Agreements with respect to the Fund. Lipper Inc. (“Lipper”), an independent provider of investment company data, was retained to provide the Board with reports on how the Fund’s contractual management fees, actual management fees, other non-management fees, overall expense ratios and investment performance compared to those of mutual funds with similar investment objectives. The Independent Directors also engaged an independent financial services consulting firm (the “Consultant”) to assist them in evaluating the Fund’s management fees, sub-advisory fees, other non-management fees, overall expense ratios and investment performance. In addition, the Consultant reviewed the profitability calculations utilized by HIFSCO in connection with the continuation of the investment management agreement.
In determining to continue the Agreements for the Fund, the members of the Board reviewed and evaluated information and factors they believed to be relevant and appropriate in light of the information that the Board deemed necessary and appropriate through the exercise of their reasonable business judgment. While individual members of the Board may have weighed certain factors differently, the Board’s determination to continue the Agreements was based on a comprehensive consideration of all information provided to the Board throughout the year and specifically with respect to the continuation of the Agreements. A more detailed discussion of the factors the Board considered with respect to its approval of the Agreements is provided below.
Nature, Extent, And Quality Of Services Provided by the Advisers
The Board requested and considered information concerning the nature, extent, and quality of the services provided to the Fund by the Advisers. The Board considered, among other things, the terms of the Agreements and the range of services provided by the Advisers. The Board considered the Advisers’ professional personnel who provide services to the Fund, including each Adviser’s ability and experience in attracting and retaining qualified personnel to service the Fund. The Board considered each Adviser’s reputation and overall financial strength, as well as its willingness to consider and implement organizational and operational changes designed to improve services to the Fund. In addition, the Board considered the quality of each Adviser’s communications with the Board and responsiveness to Board inquiries.
The Board also requested and evaluated information concerning each Adviser’s regulatory and compliance environment. In this regard, the Board requested and reviewed information on each Adviser’s compliance policies and procedures, compliance history, and a report from the Fund’s Chief Compliance Officer on each Adviser’s compliance with applicable laws and regulations, including responses to regulatory developments and compliance issues raised by regulators. The Board also noted the Advisers’ support of the Fund’s compliance control structure, particularly the resources devoted by the Advisers in support of the Fund’s obligations pursuant to Rule 38a-1 under the 1940 Act.
With respect to HIFSCO, the Board noted that under the Agreements, HIFSCO is responsible for the management of the Fund, including overseeing fund operations and service providers, and provides administration services to the Fund as well as investment advisory services in connection with selecting, monitoring and supervising the Sub-adviser. The Board considered HIFSCO’s ongoing monitoring of people, process and performance, including its quarterly reviews of each of the Hartford Mutual Funds, semi-annual meetings with the leaders of each Fund’s portfolio management team, and oversight of the Funds’ 74 portfolio managers. The Board recognized that HIFSCO has demonstrated a record of making changes to the management and/or strategies of the Funds when warranted. The Board considered HIFSCO’s oversight of the Sub-adviser’s investment approach and results, process for monitoring best execution of portfolio trades by the Sub-adviser, and approach to risk management with respect to the Fund and the service providers to the Fund. The Board also considered HIFSCO’s oversight of compliance with the Fund’s objective and policies as well as with applicable laws and regulations, noting that regulatory and other developments had over time led to an increase in the scope of HIFSCO’s services in this regard.
In addition, the Board considered HIFSCO’s ongoing commitment to review and rationalize the Hartford fund family’s product line-up and the expenses that HIFSCO had incurred in connection with fund combinations in recent years. The Board considered that HIFSCO or its affiliates are responsible for providing the Fund’s officers.
With respect to the Sub-adviser, who provides day-to-day portfolio management services, the Board considered the quality of the Fund’s portfolio manager, the Sub-adviser’s other investment personnel, its investment philosophy and process, investment research capabilities and resources, performance record, trade execution capabilities and experience. The Board considered the experience of the Fund’s portfolio manager, the number of accounts managed by the portfolio manager, and the Sub-adviser’s method for compensating the portfolio manager.
Based on these considerations, the Board concluded that it was satisfied with the nature, extent and quality of the services provided to the Fund by HIFSCO and the Sub-adviser.
Performance of the Fund and the Advisers
The Board considered the investment performance of the Fund. In this regard, the Board reviewed the performance of the Fund over different time periods presented in the materials and evaluated HIFSCO’s analysis of the Fund’s performance for these time periods. The Board considered information and materials provided to the Board by the Advisers concerning Fund performance, as well as information from Lipper comparing the investment performance of the Fund to an appropriate benchmark and universe of peer funds. The Board noted that the performance of the Fund was within expectations.
The Board considered the detailed investment analytics reports provided by The Hartford’s Investment Advisory Group throughout the year. These reports include, among other things, information on the Fund’s gross and net returns, the Fund’s investment performance relative to an appropriate benchmark and peer group, various statistics concerning the Fund’s portfolio, and a narrative summary of various factors affecting Fund performance. The Board considered the Advisers’ cooperation with the Investment Committee, which assists the Board in evaluating the performance of the Fund at periodic meetings throughout the year. The Board also considered the analysis provided by the Consultant relating to the Fund’s performance track record.
In light of all the considerations noted above, the Board concluded that it had continued confidence in HIFSCO’s and the Sub-adviser’s overall capabilities to manage the Fund.
Costs of the Services and Profitability of the Advisers
The Board reviewed information regarding HIFSCO’s cost to provide investment management and related services to the Fund and HIFSCO’s profitability, both overall and for the Fund, on a pre-tax basis without regard to distribution expenses. The Board also requested and reviewed information about the profitability to HIFSCO and its affiliates from all services provided to the Fund and all aspects of their relationship with the Fund. The Board also requested and received information relating to the operations and profitability of the Sub-adviser.
The Board considered the Consultant’s review of the profitability calculations utilized by HIFSCO in connection with the continuation of the investment management agreement. In this regard, the Consultant reported that The Hartford’s process for calculating and reporting Fund profitability is reasonable, sound and well within common industry practice.
| The Hartford Growth Fund |
| Approval of Investment Management and Investment Sub-Advisory Agreements (Unaudited) – (continued) |
Based on these considerations, the Board concluded that the profits anticipated to be realized by the Advisers and their affiliates from their relationships with the Fund would not be excessive.
Comparison of Fees and Services Provided by the Advisers
The Board considered comparative information with respect to the management fees to be paid by the Fund to HIFSCO and the total expense ratios of the Fund. The Board also considered comparative information with respect to the sub-advisory fees to be paid by HIFSCO to the Sub-adviser, to the extent applicable. In this regard, the Board requested and reviewed information from HIFSCO and the Sub-adviser relating to the management and sub-advisory fees, including the sub-advisory fee schedule for the Fund, and total operating expenses for the Fund. The Board also reviewed information from Lipper comparing the Fund’s contractual management fees, actual management fees and overall expense ratios relative to a group of funds selected by Lipper, in consultation with the Consultant, and a broader universe of funds selected by Lipper. The Board considered that HIFSCO had recently lowered the contractual expense limitations for the Fund’s Class A, Class B, Class C and Class I shares by 0.05%.
While the Board recognized that comparisons between the Fund and peer funds are imprecise, given the differing service levels and characteristics of mutual funds and the different business models and cost structures of the Advisers, the comparative information provided by Lipper assisted the Board in evaluating the reasonableness of the Fund’s management and sub-advisory fees and total operating expenses. In addition, the Board considered the analysis and recommendations of the Consultant relating to the Fund’s management and sub-advisory fees and total operating expenses.
Based on these considerations, the Board concluded that the Fund’s fees and total operating expenses, in conjunction with the information about quality of services, profitability, economies of scale, and other matters discussed, were reasonable in light of the services provided.
Economies of Scale
The Board requested and considered information regarding the Advisers’ realization of economies of scale with respect to the Fund and whether the fee levels reflect these economies of scale for the benefit of the Fund’s investors. With respect to HIFSCO, the Board considered representations from HIFSCO that it is difficult to anticipate whether and to what extent economies may be realized by HIFSCO as assets grow over time. The Board reviewed the breakpoints in the management fee schedule for the Fund, which reduces fee rates as Fund assets grow over time. The Board recognized that a fund with assets beyond the last breakpoint level will continue to benefit from economies of scale because additional assets are charged the lowest breakpoint fee resulting in lower overall effective management fee rates. The Board also considered that expense limitations and fee waivers that reduce the Fund’s expenses at all asset levels can have the same effect as breakpoints in sharing economies of scale with shareholders and provide protection from an increase in expenses if Fund assets decline. The Board recognized that a fee schedule that reaches a lower breakpoint quickly provides shareholders with the benefit of anticipated or potential economies of scale. The Board also considered that HIFSCO has been active in managing expenses, which has resulted in benefits being realized by shareholders as assets within the Hartford fund family have grown over time, including through lower transfer agent costs and other operating expenses.
The Board reviewed and evaluated materials from Lipper showing how management fee schedules of peer funds reflect economies of scale for the benefit of investors as a peer fund’s assets hypothetically increase over time. Based on information provided by HIFSCO, Lipper, and the Consultant, the Board recognized that there is no uniform methodology for establishing breakpoints or uniform pattern in asset levels that trigger breakpoints or the amounts of breakpoints triggered.
After considering all of the information available to it, the Board concluded that it was satisfied with the extent to which economies of scale would be shared for the benefit of the Fund’s shareholders based on currently available information and the effective advisory fees and expense ratios for the Fund at its current and reasonably anticipated asset levels. The Board noted, however, that it would continue to monitor future growth in Fund assets and the appropriateness of additional breakpoints.
Other Benefits
The Board considered other benefits to the Advisers and their affiliates from their relationships with the Fund.
The Board reviewed information noting that Hartford Life, Inc. (“Hartford Life”), an affiliate of HIFSCO, receives fees for fund accounting and related services from the Fund, and the Board considered information on expected profits to Hartford Life or its affiliates for such services. The Board also considered that Hartford Administrative Services Company (“HASCO”), the Fund’s transfer agent and an affiliate of HIFSCO, receives transfer agency compensation from the Fund, and the Board reviewed information on the expected profitability of the Fund’s transfer agency function to HASCO. The Board considered information provided by HASCO indicating that the transfer agent fees charged by HASCO to the Fund were fair and reasonable based on publicly available information.
The Board also considered that, as principal underwriter of the Fund, HIFSCO receives 12b-1 fees from the Fund and receives all or a portion of the sales charges on sales or redemptions of certain classes of shares. The Board also noted that certain affiliates of HIFSCO distribute shares of the Fund and receive compensation in that connection.
The Board considered benefits to the Sub-adviser from its use of the Fund’s brokerage commissions to obtain soft dollar research, and representations from HIFSCO and the Sub-adviser that the Sub-adviser would not make any revenue-sharing payments or any other type of distribution payments to HIFSCO or its affiliates.
The Board considered the benefits to shareholders of being part of the Hartford family of funds, including the right to exchange investments between the same class of funds without a sales charge, the ability to reinvest Fund dividends into other funds in the family, and the ability to combine holdings in the Fund with holdings in other funds to obtain a reduced sales charge. The Board considered HIFSCO’s efforts to provide investors in the family with a broad range of investment styles and asset classes and its entrepreneurial risk in initiating new funds to expand these opportunities for shareholders.
* * * *
Based upon its review of these various factors, among others, the Board concluded that it is in the best interests of the Fund and its shareholders for the Board to approve the Agreements for an additional year. In reaching this decision, the Board did not assign relative weights to the factors discussed above or deem any one or group of them to be controlling in and of themselves. In connection with their deliberations, the Independent Directors met separately in executive session on several occasions, with independent legal counsel, to review the relevant materials and consider their responsibilities under relevant laws and regulations.

A MESSAGE FROM DR. BOB FROEHLICH
Dear Shareholders:
All I can say is wow! From an investment perspective, this has been quite a tough year.
Old challenges seem to be lingering, such as the ongoing European sovereign debt crisis. While, here in the United States, we just can't seem to turn the corner on our weak housing market and even weaker employment market. As if these issues aren’t enough, we add the new challenge of the United States of America losing its prestigious "AAA" credit rating for the first time in the history of our country. I can’t remember a time when our markets faced this great a challenge from so many different fronts. While all of this negative news can seem daunting at times, there are also some bright spots. Although it’s almost impossible to predict with any degree of accuracy where our markets may be headed, let me share with you a few of the issues that I’m closely watching that make me more optimistic than most about the prospects for our market going forward.
RECORD EARNINGS
Let me begin with earnings, which from my perspective always have been and always will be the single most important thing to focus upon. I’m willing to bet that most U.S. investors have no idea just how strong corporate earnings and profits have been. While there are numerous ways to measure earnings and profits, one of my favorite ways is to look at profits as a percentage of the economy, especially when you want some historical comparison. Fortunately, the Bureau of Economic Analysis does this equation for us on a quarterly basis. For the second quarter of 2011 (the most recent data available) corporate profits accounted for 10.1% of our economy as measured by the GDP (Gross Domestic Product).
So just how good is that profits number? For starters, it’s the single highest profits number in my entire 34-year career. In case that isn’t impressive enough for any of you history buffs, I would add one more thing. The Bureau of Economic Analysis has been recording these quarterly profit numbers as a percentage of GDP since 1947. Our most recent number, which placed corporate profits at 10.1% of GDP, is the highest in the 64 years of tracking this data. Again, if you believe, as I do, that markets ultimately go wherever earnings take them, then you have to like what the future might hold for our stock market.
CORPORATE CASH & STRONG BALANCE SHEETS
The second thing that makes me somewhat optimistic about the future prospects for our markets is the current financial strength of corporate America. I know that you’ve heard the term that “corporate America is flush with cash.” Let me show you just how flush. The single best measure for corporate cash is one called “U.S. nonfinancial corporations liquid assets.” In the past two years this cash has increased $700 billion, bringing the total to more than $2 trillion. In the most recently released numbers for the second quarter of 2011, on a quarter-over-quarter basis, cash is up 19.2%. Corporate cash at a level above $2 trillion is the highest level ever recorded.
Now you know what it means when someone says “corporate America is flush with cash.” The good news about all that cash, from my perspective, is once corporate confidence returns and that cash goes in motion, it will help both our economy and our markets. Money in motion could go toward increasing mergers and acquisitions, dividends, share buybacks, capital spending to drive productivity, or even creating jobs. Regardless of what the ultimate use is, money in motion is good for our economy and our markets.
INSIDER BUYING
Let me move on to my third point that makes me optimistic: “insider buying.” When someone on Wall Street says “insiders,” they’re referring to company officers and directors that must disclose to the Securities and Exchange Commission through Form 4 filings whether they’re buying or selling their company’s stock. Research firm Argus-Vickers tracks this number for all publicly traded companies.
I believe when insiders are selling, it suggests that the stock may be too expensive, and the market expects too much from future earnings. Conversely, when insiders are buying, it suggests that insiders believe that their stock is too cheap, and the market is underestimating future earnings.
For more than the past decade, the average has been two insiders selling for every one that is buying. Think about what our stock market did over the past decade and you might realize that maybe these insiders are a pretty good indicator, as our markets just went through what many are calling “the lost decade,” referring to our flat stock market over the past 10 years. Currently, there’s only one insider selling for every two that are buying. Do they know something that we don't know? Only time will tell. One thing for sure is that officers and directors always focus on earnings, earnings, and earnings.
In closing, now more than ever, it’s critical that you work closely with your trusted financial professional, as I predict that our investment landscape will become even more challenging in the future. The volatility in our markets is probably here to stay— meaning it will be more difficult than ever before to try to remain a long-term investor in this short-term world in which we live. If you’re interested in my longer-term and short-term perspectives on our current markets, you can go to our website: www.hartfordinvestor.com/drbob to read my weekly investment commentary.

Dr. Bob Froehlich
Senior Managing Director
The Hartford Mutual Funds
PAST ECONOMIC AND INDEX PERFORMANCE DO NOT ENSURE FUTURE RESULTS.
Dr. Bob Froehlich’s sources of information include Bank of Canada, The Bank of England, Bank of Japan, Bloomberg News, Business Roundtable, China Investment Corporation, CIA. World Fact Book, CNBC, Congressional Budget Office, Deutsche Bank, The European Monetary Union, Federal Reserve Board, The Financial Times, Freddie Mac, FOX Business, Goldman Sachs, International Monetary Fund, International Strategy & Investment, Journal of Commerce, Merrill Lynch, PIERS Global Intelligence Solutions, Strategas Research, Thomson Reuters, Union Bank of Switzerland, U.S. Census Bureau, U.S. Department of Commerce, U.S. Department of Labor, U.S. State Department, U.S. Treasury Department, The Wall Street Journal, and The World Bank. This information is written in connection with the promotion or marketing of the matter(s) addressed in this material. The information cannot be used or relied upon for the purpose of avoiding IRS penalties. These materials are not intended to provide tax, accounting or legal advice. As with all matters of a tax or legal nature, you should consult your own tax or legal counsel for advice. You should carefully consider investment objectives, risks, and charges and expenses of The Hartford Mutual Funds before investing. This and other information can be found in the Fund’s prospectus or summary prospectus, which can be obtained from your investment representative or by calling 888-843-7824. Please read them carefully before you invest or send money. The Hartford Mutual Funds are underwritten and distributed by Hartford Investment Financial Services, LLC. “The Hartford” is The Hartford Financial Services Group, Inc., and its subsidiaries. MFAR-G11 12/11 102949 Printed in U.S.A. ©2011 The Hartford, Hartford, CT 06155 | |
| | |
| | |
THE HARTFORD MUTUAL FUNDS 2011 Annual Report The Hartford Growth Opportunities Fund |
A MESSAGE FROM THE PRESIDENT
Dear Fellow Shareholders:
I want to take this opportunity to say thank you for investing in The Hartford Mutual Funds.
This has been a tumultuous year. In the beginning of 2011, we witnessed tension-fueled political uprisings in the already-volatile Middle East and North Africa region. We also watched as Japan dealt with a series of crises including a massive earthquake and subsequent tsunami. Yet, U.S. economic conditions continued to improve, with gains in consumer confidence and retail sales. During the first half of 2011, domestic, international, and world indices (as measured by the S&P 500, MSCI EAFE and MSCI World) were all up more than 5% through June, 30 2011.
The economic recovery, however, lost momentum in the second half of 2011. The employment and housing markets both remain extremely challenged. Investors continue to be concerned about the implications of the European sovereign debt crisis, as well as our own high levels of domestic debt. Fears that the European sovereign debt crisis could continue to drag down the global economy have weighed heavily on stocks.
Ongoing apprehension regarding the U.S. debt ceiling during the summer, and the resulting downgrade of the U.S. sovereign credit rating by Standard & Poor’s, also contributed to weaker investor confidence.
There are, however, some reasons to remain confident. Corporations have record levels of cash on their balance sheets—corporate cash has doubled in the past 10 years. In addition, U.S. gross domestic product expanded at a 2.5 percent annual rate in the third quarter according to the Commerce Department, as consumers and businesses set aside fears about the recovery and stepped up spending. Corporate earnings have also remained positive, with a majority of companies beating expectations each quarter this year. This momentum will hopefully continue through the fourth quarter and into next year.
As we approach the end of 2011, in light of the continued market volatility, now would be a good time to schedule a meeting with your financial advisor to examine your current investment strategy and determine whether you are on the right track.
| | • Does your fixed-income portfolio complement your equity portfolio? |
| | • Are you receiving diversified sources of income? |
| | • Is your portfolio still in line with your risk tolerance and investment time horizon? |
Talk to your advisor to see what changes you should make to address these concerns and opportunities. Thank you again for investing with The Hartford Mutual Funds.
James Davey
President
The Hartford Mutual Funds
The Hartford Growth Opportunities Fund
| Fund Performance (Unaudited) | 2 |
| Manager Discussion (Unaudited) | 3 |
| Financial Statements | |
| 5 |
| 8 |
| 9 |
| 10 |
| 11 |
| 12 |
| 24 |
| 26 |
| 27 |
| 29 |
| 29 |
| 30 |
| 31 |
| 32 |
The views expressed in the Fund’s Manager Discussion under ‘‘Why did the Fund perform this way?’’ and ‘‘What is the outlook?’’ are views of the Fund’s sub-adviser and portfolio management team through the end of the period and are subject to change based on market and other conditions.
The Hartford Growth Opportunities Fund inception 03/31/1963 |
| (sub-advised by Wellington Management Company, LLP) |
| |
| Investment objective – Seeks capital appreciation. |
Performance Overview 10/31/01 - 10/31/11
The chart above shows the growth of a $10,000 investment in Class A which includes a sales charge. Growth results in classes other than Class A will vary from what is seen above due to differences in the expenses charged to those share classes.
Average Annual Total Returns (as of 10/31/11)
| | 1 Year | 5 Year | 10 Year |
| Growth Opportunities A# | 4.84% | 1.65% | 6.06% |
| Growth Opportunities A## | -0.92% | 0.51% | 5.46% |
| Growth Opportunities B# | 3.96% | 0.90% | NA* |
| Growth Opportunities B## | -1.04% | 0.58% | NA* |
| Growth Opportunities C# | 4.10% | 0.96% | 5.32% |
| Growth Opportunities C## | 3.10% | 0.96% | 5.32% |
| Growth Opportunities I# | 5.14% | 2.03% | 6.54% |
| Growth Opportunities R3# | 4.62% | 1.45% | 6.20% |
| Growth Opportunities R4# | 4.92% | 1.78% | 6.37% |
| Growth Opportunities R5# | 5.22% | 2.06% | 6.51% |
| Growth Opportunities Y# | 5.32% | 2.16% | 6.57% |
| Russell 1000 Growth Index | 9.92% | 3.04% | 3.56% |
| Russell 3000 Growth Index | 9.92% | 3.01% | 3.74% |
| * | Since inception returns are not applicable for Class B because after 8 years Class B converts to Class A. |
PAST PERFORMANCE IS NOT INDICATIVE OF FUTURE RESULTS.
The initial investment in Class A shares reflects the maximum sales charge and Classes B and C reflect a contingent deferred sales charge.
Total returns presented above were calculated using the Fund's net asset value available to shareholders for sale or redemption of Fund shares on October 31, 2011, which excludes investment transactions as of this date.
Effective 9/30/09, Class B shares of The Hartford Mutual Funds were closed to new investments.
Class A, B, C and Y shares commenced operations on 2/19/02. Class A and C share performance prior to that date reflects Class L and N share performance and operating expenses less Class A or C share sales charges, respectively. (Class L and N shares are no longer offered.) Class Y share performance prior to 2/19/02 reflects Class L share performance and operating expenses, adjusted to reflect that Class Y has no sales charges. Class I shares commenced operations on 8/31/06. Performance prior to that date is that of the Fund's Class A shares (excluding sales charges), which had different operating expenses.Class R3, R4 and R5 shares commenced operations on 12/22/06. Class R3, R4 and R5 share performance between 2/19/02 and 12/22/06 reflects Class Y share performance and operating expenses. Class R3, R4 and R5 share performance prior to 2/19/02 reflects Class L share performance and operating expenses, adjusted to reflect the fact that Class R3, R4 and R5 have no sales charges.
Russell 1000 Growth Index is an unmanaged index which measures the performance of those Russell 1000 Index companies with higher price-to-book ratios and higher forecasted growth values. (The Russell 1000 Index is an unmanaged index that measures the performance of the 1,000 largest companies in the Russell 3000 Index, which measures the performance of the 3,000 largest U.S. companies based on total market capitalization.)
Russell 3000 Growth Index is an unmanaged index that measures the performance of those Russell 3000 Index companies with higher price-to-book ratios and higher forecasted growth values. (The Russell 3000 Index is an unmanaged index that measures the performance of the 3,000 largest U.S. companies based on total market capitalization.)
You cannot invest directly in an index.
The chart represents a hypothetical investment in the Fund. Performance data represents past performance and current performance could be higher or lower.
The value of shares will fluctuate so that, when redeemed, shares may be worth more or less than their original cost. The chart and table do not reflect the deduction of taxes that a shareholder would pay on Fund distributions or the redemption of Fund shares.
Performance information may reflect historical or current expense waivers/reimbursements from the investment adviser, without which performance would have been lower. For information on current expense waivers/reimbursements, please see the prospectus.
| The Hartford Growth Opportunities Fund |
| Manager Discussion (Unaudited) |
| October 31, 2011 |
| Portfolio Managers | | |
| Michael T. Carmen, CFA | Stephen Mortimer | Mario E. Abularach, CFA |
| Senior Vice President | Senior Vice President | Vice President and Equity Research Analyst |
| | | |
How did the Fund perform?
The Class A shares of The Hartford Growth Opportunities Fund returned 4.84%, before sales charges, for the 12-month period ended October 31, 2011, underperforming its benchmark, the Russell 3000 Growth Index, which returned 9.92% for the same period. The Fund also underperformed the 6.38% return of the average fund in the Lipper Multi-Cap Growth Funds peer group, a group of funds with investment strategies similar to those of the Fund.
Why did the Fund perform this way?
U.S. equities moved higher in the period despite a high degree of volatility caused, at least in part, by unrest in North Africa and the Middle East, as well as the devastating earthquake and tsunami in Japan. Increasing fears of a global economic slowdown and concerns about heightened geopolitical risks were not enough to offset strong corporate earnings, generally solid economic data, and a continued accommodative Federal Reserve policy. Positive absolute returns in the stock market were largely limited to the period’s early months. On the other hand, in the latter half of the fiscal year, strong corporate earnings were offset by heightened European sovereign debt concerns and a deteriorating outlook for economic growth. The market then reversed course yet again in October, the final month of the period, which produced a sharp rally for risk assets, as evidence began to surface that Europe’s leaders would take steps to address the continent’s crisis.
During the period, mid-cap equities (+9%) outperformed both large-caps (+8%) and small-caps (+7%) as represented by the S&P 400 MidCap, S&P 500, and Russell 2000 Indices, respectively. Growth stocks (+10%) outperformed Value stocks (+6%) during the period, as measured by the Russell 3000 Growth and Russell 3000 Value Indices, respectively. Nine of the 10 sectors of the Russell 3000 Growth Index (+10%) rose during the period. The Energy (+18%), Utilities (+17%), and Consumer Staples (+15%) sectors gained the most while Telecommunications (-1%) and Materials (+3%) lagged.
The Fund lagged its benchmark primarily due to weak security selection within the Materials, Industrials, and Energy sectors. Results were more favorable in the Consumer Staples and Health Care sectors. Sector allocation, a residual of bottom-up (i.e. stock by stock fundamental research) stock selection, was additive to relative results due in part to an overweight (i.e. the Fund’s sector position was greater than the benchmark position) to the Consumer Discretionary sector.
The top detractors from both absolute (i.e. total return) and relative performance (i.e. performance of the Fund as measured against the benchmark) in the Fund during the period were Sino-Forest (Materials), Alpha Natural Resources (Energy), and Acme Packet (Information Technology). Shares of Sino-Forest, a China-based commercial forest plantation operator and seller of wood logs and downstream engineered-wood products, fell after a published report raised several questions with regard to Sino-Forest's business practices and asset base. Shares of U.S.-based coal producer, Alpha Natural Resources, declined after reduced shipment guidance raised investor concerns about a slowdown in demand in China. With the acquisition of Massey Energy, the combined entity is now the largest supplier of metallurgical coal for the world's steel industry and a highly diversified supplier of thermal coal to electric utilities in the U.S. and overseas. We continue to hold the stock based on the firm's solid balance sheet, underappreciated potential synergies from the Massey acquisition, and our positive long-term global supply/demand outlook for metallurgical coal. Acme Packet is a leading provider of session border control solutions, which enable the delivery of Voice over Internet Protocol (VoIP or phone service over the internet) and data communications across network borders. We had had a positive view based on the firm's leading position in a fast growing market. However, the market did not respond favorably to a slower-than-expected carrier spending environment that developed, and the stock suffered accordingly. Slower carrier spending also led us to lower estimates of the stock’s upside. We sold the position during the period.
The top contributors to relative performance in the Fund during the period were Green Mountain Coffee (Consumer Staples) and Cisco Systems (Information Technology). Green Mountain Coffee, the leading provider of single-cup brewers and portion packs for coffee and other beverages, nearly doubled during the year. For much of the period, the company produced results that topped expectations and management raised guidance amid strong sales growth of the firm's Keurig single serving products. Not owning shares of Cisco Systems for most of the period was beneficial as the stock moved lower early in the period after the company released a disappointing revenue and earnings outlook as state and local
| The Hartford Growth Opportunities Fund |
| Manager Discussion (Unaudited) – (continued) |
| October 31, 2011 |
government spending slowed sharply due to budget concerns. Given the management team’s re-focused effort on driving returns higher, our expectations for acceleration in the income statement, as well as current attractive valuation, we initiated a position near the end of the period. Apple was the Fund’s top contributor on an absolute basis.
What is the outlook?
Economic momentum remained sluggish in recent months, with the most notable disappointments being the lack of jobs growth in the U.S. and the tenuous economic and political climate in Europe. During the final month of the period, the market responded to developments in Europe, which we believe were perceived as catalysts for moving the continent’s healing process forward. However, things may get worse before they get better. Despite these macroeconomic headwinds, corporate earnings remain a bright spot. Relative to history, corporate balance sheets are robust and supportive of both investment and a return of capital to shareholders.
As macro economic issues are once again dominating the headlines we continue to look for what we consider attractive growth stocks that have company-specific growth drivers rather than a dependence on a cyclical recovery. The effect of our bottom-up stock-selection decisions resulted in overweights to the Consumer Discretionary, Health Care, and Information Technology sectors and underweights (i.e. the Fund’s sector position was less than the benchmark position) to the Consumer Staples and Industrials sectors at the end of the period.
| Diversification by Industry | |
| as of October 31, 2011 | |
| | |
| | | |
| Automobiles & Components (Consumer Discretionary) | | | 2.2 | % |
| Capital Goods (Industrials) | | | 4.9 | |
| Commercial & Professional Services (Industrials) | | | 0.9 | |
| Consumer Durables & Apparel (Consumer Discretionary) | | | 4.0 | |
| Consumer Services (Consumer Discretionary) | | | 4.7 | |
| Diversified Financials (Financials) | | | 2.8 | |
| Energy (Energy) | | | 10.9 | |
| Food, Beverage & Tobacco (Consumer Staples) | | | 2.4 | |
| Health Care Equipment & Services (Health Care) | | | 9.5 | |
| Insurance (Financials) | | | 1.0 | |
| Materials (Materials) | | | 4.8 | |
| Media (Consumer Discretionary) | | | 3.0 | |
| Pharmaceuticals, Biotechnology & Life Sciences (Health Care) | | | 7.0 | |
| Retailing (Consumer Discretionary) | | | 6.3 | |
| Semiconductors & Semiconductor Equipment (Information Technology) | | | 2.5 | |
| Software & Services (Information Technology) | | | 17.3 | |
| Technology Hardware & Equipment (Information Technology) | | | 14.0 | |
| Telecommunication Services (Services) | | | 0.1 | |
| Short-Term Investments | | | 1.0 | |
| Other Assets and Liabilities | | | 0.7 | |
| Total | | | 100.0 | % |
|
Schedule of Investments October 31, 2011 |
|
| Shares or Principal Amount | | Market Value ╪ | |
COMMON STOCKS - 98.3% | |
| | | Automobiles & Components - 2.2% | |
| | 85 | | Hyundai Motor Co., Ltd. | | $ | 17,053 | |
| | 707 | | Johnson Controls, Inc. | | | 23,273 | |
| | | | | | | 40,326 | |
| | | | Capital Goods - 4.9% | |
| | 188 | | Cummins, Inc. | | | 18,663 | |
| | 307 | | Fluor Corp. | | | 17,467 | |
| | 761 | | Foster Wheeler AG ● | | | 16,219 | |
| | 682 | | Ingersoll-Rand plc | | | 21,227 | |
| | 435 | | Navistar International Corp. ● | | | 18,320 | |
| | | | | | | 91,896 | |
| | | | Commercial & Professional Services - 0.9% | |
| | 386 | | Manpower, Inc. | | | 16,633 | |
| | | | | | | | |
| | | | Consumer Durables & Apparel - 4.0% | |
| | 416 | | Coach, Inc. | | | 27,051 | |
| | 192 | | Deckers Outdoor Corp. ● | | | 22,172 | |
| | 814 | | Jarden Corp. | | | 26,082 | |
| | | | | | | 75,305 | |
| | | | Consumer Services - 4.7% | |
| | – | | Diamond Resorts LLC ⌂† | | | 15,605 | |
| | 307 | | Las Vegas Sands Corp. ● | | | 14,395 | |
| | 582 | | Starbucks Corp. | | | 24,661 | |
| | 446 | | Weight Watchers International, Inc. | | | 33,260 | |
| | | | | | | 87,921 | |
| | | | Diversified Financials - 2.8% | |
| | 83 | | BlackRock, Inc. | | | 13,018 | |
| | 227 | | Goldman Sachs Group, Inc. | | | 24,813 | |
| | 922 | | Justice Holdings Ltd. ● | | | 13,729 | |
| | | | | | | 51,560 | |
| | | | Energy - 10.9% | |
| | 457 | | Alpha Natural Resources, Inc. ● | | | 10,986 | |
| | 243 | | Anadarko Petroleum Corp. | | | 19,036 | |
| | 118 | | Apache Corp. | | | 11,756 | |
| | 1,106 | | Bumi plc ● | | | 13,161 | |
| | 729 | | Chesapeake Energy Corp. | | | 20,511 | |
| | 343 | | Consol Energy, Inc. | | | 14,645 | |
| | 178 | | EOG Resources, Inc. | | | 15,874 | |
| | 241 | | Occidental Petroleum Corp. | | | 22,362 | |
| | 298 | | Peabody Energy Corp. | | | 12,937 | |
| | 709 | | Petroleo Brasileiro S.A. ADR | | | 19,153 | |
| | 273 | | Pioneer Natural Resources Co. | | | 22,938 | |
| | 1,248 | | Vallares ⌂●† | | | 19,962 | |
| | | | | | | 203,321 | |
| | | | Food, Beverage & Tobacco - 2.4% | |
| | 405 | | Green Mountain Coffee Roasters, Inc. ● | | | 26,346 | |
| | 544 | | Unilever N.V. NY Shares ADR | | | 18,798 | |
| | | | | | | 45,144 | |
| | | | Health Care Equipment & Services - 9.5% | |
| | 402 | | Aetna, Inc. | | | 15,999 | |
| | 457 | | Cardinal Health, Inc. | | | 20,244 | |
| | 548 | | Edwards Lifesciences Corp. ● | | | 41,298 | |
| | 1,845 | | Hologic, Inc. ● | | | 29,749 | |
| | 63 | | Intuitive Surgical, Inc. ● | | | 27,463 | |
| | 258 | | McKesson Corp. | | | 21,032 | |
| | 444 | | UnitedHealth Group, Inc. | | | 21,327 | |
| | | | | | | 177,112 | |
| | | | Insurance - 1.0% | |
| | 1,006 | | Progressive Corp. | | | 19,115 | |
| | | | | | | | |
| | | Materials - 4.8% | |
| | 561 | | Ball Corp. | | | 19,380 | |
| | 3,489 | | Glencore International plc | | | 24,427 | |
| | 232 | | Molycorp, Inc. ● | | | 8,868 | |
| | 430 | | Mosaic Co. | | | 25,169 | |
| | 1,875 | | Sino Forest Corp. Class A ⌂●† | | | 1,804 | |
| | 515 | | Vedanta Resources plc | | | 10,513 | |
| | | | | | | 90,161 | |
| | | | Media - 3.0% | |
| | 10,360 | | Sirius XM Radio, Inc. w/ Rights ● | | | 18,544 | |
| | 1,043 | | Walt Disney Co. | | | 36,366 | |
| | | | | | | 54,910 | |
| | | | Pharmaceuticals, Biotechnology & Life Sciences - 7.0% | |
| | 688 | | Agilent Technologies, Inc. ● | | | 25,511 | |
| | 352 | | Amylin Pharmaceuticals, Inc. ● | | | 4,060 | |
| | 361 | | Auxilium Pharmaceuticals, Inc. ● | | | 5,611 | |
| | 192 | | Biogen Idec, Inc. ● | | | 22,364 | |
| | 408 | | Celgene Corp. ● | | | 26,418 | |
| | 328 | | Elan Corp. plc ADR ● | | | 3,936 | |
| | 526 | | Gilead Sciences, Inc. ● | | | 21,901 | |
| | 256 | | Waters Corp. ● | | | 20,495 | |
| | | | | | | 130,296 | |
| | | | Retailing - 6.3% | |
| | 207 | | Abercrombie & Fitch Co. Class A | | | 15,364 | |
| | 172 | | Amazon.com, Inc. ● | | | 36,809 | |
| | 188 | | Dufry Group | | | 20,086 | |
| | 32 | | Priceline.com, Inc. ● | | | 16,115 | |
| | 340 | | Ross Stores, Inc. | | | 29,811 | |
| | | | | | | 118,185 | |
| | | | Semiconductors & Semiconductor Equipment - 2.5% | |
| | 257 | | Altera Corp. | | | 9,761 | |
| | 1,108 | | Skyworks Solutions, Inc. ● | | | 21,947 | |
| | 425 | | Xilinx, Inc. | | | 14,231 | |
| | | | | | | 45,939 | |
| | | | Software & Services - 17.3% | |
| | 1,518 | | Activision Blizzard, Inc. | | | 20,322 | |
| | 370 | | Automatic Data Processing, Inc. | | | 19,346 | |
| | 1,997 | | Cadence Design Systems, Inc. ● | | | 22,108 | |
| | 42 | | Citrix Systems, Inc. ● | | | 3,082 | |
| | 1,221 | | eBay, Inc. ● | | | 38,877 | |
| | 81 | | Google, Inc. ● | | | 48,004 | |
| | 173 | | LinkedIn Corp. ● | | | 15,517 | |
| | 1,586 | | Oracle Corp. | | | 51,984 | |
| | 202 | | Red Hat, Inc. ● | | | 10,053 | |
| | 290 | | Teradata Corp. ● | | | 17,319 | |
| | 796 | | Tibco Software, Inc. ● | | | 22,988 | |
| | 477 | | VeriFone Systems, Inc. ● | | | 20,130 | |
| | 1,864 | | Western Union Co. | | | 32,562 | |
| | | | | | | 322,292 | |
| | | | Technology Hardware & Equipment - 14.0% | |
| | 320 | | Apple, Inc. ● | | | 129,634 | |
| | 2,133 | | Cisco Systems, Inc. | | | 39,515 | |
| | 1,517 | | EMC Corp. ● | | | 37,187 | |
| | 260 | | F5 Networks, Inc. ● | | | 27,062 | |
| | 430 | | Hughes Telematics | | | 2,194 | |
| | 1,600 | | Hughes Telematics, Inc. ● | | | 8,160 | |
| | 678 | | Juniper Networks, Inc. ● | | | 16,591 | |
| | | | | | | 260,343 | |
The accompanying notes are an integral part of these financial statements.
| The Hartford Growth Opportunities Fund |
Schedule of Investments – (continued) October 31, 2011 |
|
| Shares or Principal Amount | | | Market Value ╪ | |
COMMON STOCKS - 98.3% - (continued) | |
| | | Telecommunication Services - 0.1% | |
| | 481 | | Hughes Telematics, Inc. ● | | | | | $ | 2,455 | |
| | | | | | | | | | | |
| | | | Total common stocks | | | | | | | |
| | | | (cost $1,756,258) | | | | | $ | 1,832,914 | |
| | | | | | | | | | | |
| | | | Total long-term investments (cost $1,756,258) | | | | | $ | 1,832,914 | |
| | | | | | | | | | | |
SHORT-TERM INVESTMENTS - 1.0% | |
| Repurchase Agreements - 1.0% | |
| | | | Bank of America Merrill Lynch TriParty Joint Repurchase Agreement (maturing on 11/01/2011 in the amount of $1,117, collateralized by FHLMC 4.50%, 2040, FNMA 5.00, 2041, value of $1,139) | | | | | | | |
| $ | 1,117 | | 0.11%, 10/31/2011 | | | | | $ | 1,117 | |
| | | | Barclays Capital TriParty Joint Repurchase Agreement (maturing on 11/01/2011 in the amount of $10,666, collateralized by FNMA 5.50%, 2041, GNMA 4.00%, 2040, U.S. Treasury Bond 8.13%, 2021, U.S. Treasury Note 2.50% - 3.63%, 2015 - 2020, value of $10,879) | | | | | | | |
| | 10,666 | | 0.11%, 10/31/2011 | | | | | | 10,666 | |
| | | | Deutsche Bank Securities TriParty Joint Repurchase Agreement (maturing on 11/01/2011 in the amount of $1,508, collateralized by GNMA 4.00% - 5.00%, 2040, value of $1,538) | | | | | | | |
| | 1,508 | | 0.11%, 10/31/2011 | | | | | | 1,508 | |
| | | | UBS Securities, Inc. Joint Repurchase Agreement (maturing on 11/01/2011 in the amount of $-, collateralized by U.S. Treasury Note 1.88%, 2014, value of $-) | | | | | | | |
| | – | | 0.11%, 10/31/2011 | | | | | | – | |
| | | | UBS Securities, Inc. TriParty Joint Repurchase Agreement (maturing on 11/01/2011 in the amount of $5,193, collateralized by GNMA 3.50% - 4.50%, 2041, value of $5,297) | | | | | | | |
| | 5,193 | | 0.11%, 10/31/2011 | | | | | | 5,193 | |
| | 18484 | | | | | | | | 18,484 | |
| | | | Total short-term investments | | | | | | | |
| | | | (cost $18,484) | | | | | $ | 18,484 | |
| | | | | | | | | | | |
| | | | Total investments | | | | | | | |
| | | | (cost $1,774,742) ▲ | | | 99.3% | | $ | 1,851,398 | |
| | | | Other assets and liabilities | | | 0.7% | | | 12,228 | |
| | | | Total net assets | | | 100.0% | | $ | 1,863,626 | |
| | |
The accompanying notes are an integral part of these financial statements.
| Note: | Percentage of investments as shown is the ratio of the total market value to total net assets. Market value of long-term investments in foreign securities represents 8.8% of total net assets at October 31, 2011. |
Prices of foreign equities that are principally traded on certain foreign markets may be adjusted daily pursuant to a fair value pricing service approved by the Board of Directors in order to reflect an adjustment for factors occurring after the close of certain foreign markets but before the close of the New York Stock Exchange.
| ▲ | At October 31, 2011, the cost of securities for federal income tax purposes was $1,778,754 and the aggregate gross unrealized appreciation and depreciation based on that cost were: |
| Unrealized Appreciation | | $ | 210,697 | |
| Unrealized Depreciation | | | (138,053 | ) |
| Net Unrealized Appreciation | | $ | 72,644 | |
| † | These securities were valued in good faith at fair value as determined under policies and procedures established by and under the supervision of the Company's Board of Directors. At October 31, 2011, the aggregate value of these securities was $37,371, which represents 2.0% of total net assets. This amount excludes securities that are principally traded in certain foreign markets and whose prices are adjusted pursuant to a third party pricing service methodology approved by the Board of Directors.
|
| ⌂ | The following securities are considered illiquid. Illiquid securities are often purchased in private placement transactions, are often not registered under the Securities Act of 1933 and may have contractual restrictions on resale. A security may also be considered illiquid if the security lacks a readily available market or if its valuation has not changed for a certain period of time. |
| | | | | | | | |
| 07/2011 | | | | – | | Diamond Resorts LLC | | $ | 17,340 | |
| 05/2011 - 07/2011 | | | | 1,875 | | Sino Forest Corp. Class A | | | 26,988 | |
| 06/2011 | | | | 1,248 | | Vallares | | | 20,187 | |
At October 31, 2011, the aggregate value of these securities was $37,371, which represents 2.0% of total net assets.
Foreign Currency Contracts Outstanding at October 31, 2011
| | | | | | | | | | | | Unrealized Appreciation/ (Depreciation) | |
| Swiss Franc | | Banc of America Securities | | Sell | | $ | 683 | | $ | 698 | | 11/01/2011 | | $ | 15 | |
| ╪ | See Significant Accounting Policies of accompanying Notes to Financial Statements regarding valuation of securities. |
The accompanying notes are an integral part of these financial statements.
|
Investment Valuation Hierarchy Level Summary October 31, 2011 |
|
| | | | | | | | | | | | | |
| Assets: | | | | | | | | | | | | |
| Common Stocks ‡ | | $ | 1,832,914 | | | $ | 1,709,735 | | | $ | 85,808 | | | $ | 37,371 | |
| Short-Term Investments | | | 18,484 | | | | – | | | | 18,484 | | | | – | |
| Total | | $ | 1,851,398 | | | $ | 1,709,735 | | | $ | 104,292 | | | $ | 37,371 | |
| Foreign Currency Contracts * | | | 15 | | | | – | | | | 15 | | | | – | |
| Total | | $ | 15 | | | $ | – | | | $ | 15 | | | $ | – | |
| ♦ | For the year ended October 31, 2011, there were no significant transfers between Level 1 and Level 2. |
| ‡ | The Fund has all or primarily all of the equity securities categorized in a particular level. Refer to the Schedule of Investments for further industry breakout. |
| * | Derivative instruments not reflected in the Schedule of Investments are valued at the unrealized appreciation/depreciation on the investments. |
Following is a reconciliation of Level 3 assets for which significant unobservable inputs were used to determine fair value:
| | | Balance as of October 31, 2010 | | | | | | Change in Unrealized Appreciation (Depreciation) | | | | | | | | | | | | | | | | | | Balance as of October 31, 2011 | |
| Assets: | | | | | | | | | | | | | | | | | | | | | | | | | | | |
| Common Stocks | | $ | 1,588 | | | $ | — | | | $ | (27,144 | )† | | $ | — | | | $ | 64,515 | | | $ | — | | | $ | — | | | $ | (1,588 | ) | | $ | 37,371 | |
| Total | | $ | 1,588 | | | $ | — | | | $ | (27,144 | ) | | $ | — | | | $ | 64,515 | | | $ | — | | | $ | — | | | $ | (1,588 | ) | | $ | 37,371 | |
| * | Securities are transferred into and out of Level 3 for a variety of reasons including, but not limited to: |
| | 1) | Securities where trading has been halted (transfer into Level 3) or securities where trading has resumed (transfer out of Level 3). |
| | 2) | Broker quoted securities (transfer into Level 3) or quoted prices in active markets (transfer out of Level 3). |
| | 3) | Securities that have certain restrictions on trading (transfer into Level 3) or securities where trading restrictions have expired (transfer out of Level 3). |
| † | Change in unrealized appreciation (depreciation) in the current period relating to assets still held at October 31, 2011 was $(27,144). |
The accompanying notes are an integral part of these financial statements.
|
Statement of Assets and Liabilities October 31, 2011 |
|
| Assets: | | | |
| Investments in securities, at market value (cost $1,774,742) | | $ | 1,851,398 | |
| Cash | | | 26 | |
| Unrealized appreciation on foreign currency contracts | | | 15 | |
| Receivables: | | | | |
| Investment securities sold | | | 20,593 | |
| Fund shares sold | | | 5,263 | |
| Dividends and interest | | | 119 | |
| Other assets | | | 142 | |
| Total assets | | | 1,877,556 | |
| Liabilities: | | | | |
| Bank overdraft — foreign cash | | | — | |
| Payables: | | | | |
| Investment securities purchased | | | 2,324 | |
| Fund shares redeemed | | | 10,844 | |
| Investment management fees | | | 258 | |
| Administrative fees | | | 2 | |
| Distribution fees | | | 70 | |
| Accrued expenses | | | 432 | |
| Total liabilities | | | 13,930 | |
| Net assets | | $ | 1,863,626 | |
| Summary of Net Assets: | | | | |
| Capital stock and paid-in-capital | | $ | 2,226,483 | |
| Accumulated undistributed net investment income | | | — | |
| Accumulated net realized loss on investments and foreign currency transactions | | | (439,514 | ) |
| Unrealized appreciation of investments and the translation of assets and liabilities denominated in foreign currency | | | 76,657 | |
| Net assets | | $ | 1,863,626 | |
| | | | | |
| Shares authorized | | | 23,750,000 | |
| Par value | | $ | 0.0001 | |
Class A: Net asset value per share/Maximum offering price per share | | | $25.98/$27.49 | |
| Shares outstanding | | | 29,037 | |
| Net assets | | $ | 754,532 | |
Class B: Net asset value per share | | $ | 20.72 | |
| Shares outstanding | | | 1,345 | |
| Net assets | | $ | 27,884 | |
Class C: Net asset value per share | | $ | 20.80 | |
| Shares outstanding | | | 6,156 | |
| Net assets | | $ | 128,016 | |
Class I: Net asset value per share | | $ | 26.39 | |
| Shares outstanding | | | 29,976 | |
| Net assets | | $ | 791,091 | |
Class R3: Net asset value per share | | $ | 26.48 | |
| Shares outstanding | | | 508 | |
| Net assets | | $ | 13,444 | |
Class R4: Net asset value per share | | $ | 26.89 | |
| Shares outstanding | | | 1,348 | |
| Net assets | | $ | 36,249 | |
Class R5: Net asset value per share | | $ | 27.20 | |
| Shares outstanding | | | 520 | |
| Net assets | | $ | 14,132 | |
Class Y: Net asset value per share | | $ | 27.32 | |
| Shares outstanding | | | 3,597 | |
| Net assets | | $ | 98,278 | |
The accompanying notes are an integral part of these financial statements.
|
Statement of Operations For the Year Ended October 31, 2011 |
|
| Investment Income: | | | |
| Dividends | | $ | 14,202 | |
| Interest | | | 11 | |
| Less: Foreign tax withheld | | | (477 | ) |
| Total investment income | | | 13,736 | |
| | | | | |
| Expenses: | | | | |
| Investment management fees | | | 13,862 | |
| Administrative services fees | | | 104 | |
| Transfer agent fees | | | 3,324 | |
| Distribution fees | | | | |
| Class A | | | 1,266 | |
| Class B | | | 336 | |
| Class C | | | 1,512 | |
Class L* | | | 878 | |
| Class R3 | | | 62 | |
| Class R4 | | | 100 | |
| Custodian fees | | | 33 | |
| Accounting services fees | | | 234 | |
| Registration and filing fees | | | 235 | |
| Board of Directors' fees | | | 40 | |
| Audit fees | | | 9 | |
| Other expenses | | | 286 | |
| Total expenses (before waivers and fees paid indirectly) | | | 22,281 | |
| Expense waivers | | | (52 | ) |
| Transfer agent fee waivers | | | (24 | ) |
| Commission recapture | | | (98 | ) |
| Total waivers and fees paid indirectly | | | (174 | ) |
| Total expenses, net | | | 22,107 | |
| Net Investment Loss | | | (8,371 | ) |
| Net Realized Gain on Investments and Foreign Currency Transactions: | | | | |
| Net realized gain on investments in securities | | | 261,509 | |
| Net realized loss on foreign currency contracts | | | (1,163 | ) |
| Net realized gain on other foreign currency transactions | | | 636 | |
| Net Realized Gain on Investments and Foreign Currency Transactions | | | 260,982 | |
| Net Changes in Unrealized Depreciation of Investments and Foreign Currency Transactions: | | | | |
| Net unrealized depreciation of investments | | | (185,749 | ) |
| Net unrealized appreciation of foreign currency contracts | | | 760 | |
| Net unrealized depreciation on translation of other assets and liabilities in foreign currencies | | | (87 | ) |
| Net Changes in Unrealized Depreciation of Investments and Foreign Currency Transactions | | | (185,076 | ) |
| Net Gain on Investments and Foreign Currency Transactions | | | 75,906 | |
| Net Increase in Net Assets Resulting from Operations | | $ | 67,535 | |
| * | Class L merged into Class A on August 5, 2011. Please refer to the Notes to Financial Statements for further details. |
The accompanying notes are an integral part of these financial statements.
|
Statement of Changes in Net Assets |
|
| | | For the Year Ended October 31, 2011 | | | For the Year Ended October 31, 2010 | |
| Operations: | | | | | | |
| Net investment loss | | $ | (8,371 | ) | | $ | (8,769 | ) |
| Net realized gain on investments and foreign currency transactions | | | 260,982 | | | | 267,575 | |
| Net unrealized appreciation (depreciation) of investments and foreign currency transactions | | | (185,076 | ) | | | 95,922 | |
| Net Increase In Net Assets Resulting From Operations | | | 67,535 | | | | 354,728 | |
| Distributions to Shareholders: | | | | | | | | |
| From net investment income | | | | | | | | |
| Class I | | | — | | | | (652 | ) |
| Class L* | | | — | | | | (171 | ) |
| Class R5 | | | — | | | | (24 | ) |
| Class Y | | | — | | | | (471 | ) |
| Total distributions | | | — | | | | (1,318 | ) |
| Capital Share Transactions: | | | | | | | | |
| Class A | | | 200,204 | | | | (437,436 | ) |
| Class B | | | (8,347 | ) | | | (8,016 | ) |
| Class C | | | (36,671 | ) | | | (45,990 | ) |
| Class I | | | 298,181 | | | | 54,866 | |
| Class L* | | | (352,995 | ) | | | (48,677 | ) |
| Class R3 | | | 2,297 | | | | 674 | |
| Class R4 | | | (9,019 | ) | | | 290 | |
| Class R5 | | | (1,074 | ) | | | (169 | ) |
| Class Y | | | (47,582 | ) | | | (63,992 | ) |
| Net increase (decrease) from capital share transactions | | | 44,994 | | | | (548,450 | ) |
| Net Increase (Decrease) In Net Assets | | | 112,529 | | | | (195,040 | ) |
| Net Assets: | | | | | | | | |
| Beginning of period | | | 1,751,097 | | | | 1,946,137 | |
| End of period | | $ | 1,863,626 | | | $ | 1,751,097 | |
| Accumulated undistributed (distribution in excess of) net investment income (loss) | | $ | — | | | $ | — | |
| * | Class L merged into Class A on August 5, 2011. Please refer to the Notes to Financial Statements for further details. |
The accompanying notes are an integral part of these financial statements.
|
Notes to Financial Statements October 31, 2011 |
|
The Hartford Mutual Funds II, Inc. (“Company”) is an open-end management investment company comprised of five portfolios. Financial statements for The Hartford Growth Opportunities Fund (the “Fund”), a series of the Company, are included in this report.
The Company is organized under the laws of the State of Maryland and is registered with the Securities and Exchange Commission (“SEC”) under the Investment Company Act of 1940, as amended (“1940 Act”). The Fund is a diversified open-end management investment company.
Class A shares are sold with a front-end sales charge of up to 5.50%. Class B shares were sold with a contingent deferred sales charge which is assessed on the lesser of the per share net asset value (“NAV”) of the shares at the time of redemption or the original purchase price, and declines from up to 5.00% to zero depending on the period of time the shares are held (see note below regarding the closing of Class B shares). Class C shares are sold with a contingent deferred sales charge of up to 1.00% on shares redeemed within twelve months of purchase. Class I shares are sold without sales charges to certain eligible investors primarily through advisory fee-based wrap programs. Class R3, R4 and R5 shares, which are offered to employer-sponsored retirement plans, and Class Y shares, which are sold to certain eligible institutional investors, are sold without a sales charge. All classes of shares have identical voting, redemption, dividend, liquidation and other rights and the same terms and conditions, with the exceptions that each class may have different expenses, which may affect performance, and that Class B shares automatically convert to Class A shares after 8 years.
No new or additional investments are allowed in Class B shares of The Hartford Mutual Funds (including investments through any systematic investment plan). Existing shareholders of Class B shares may continue to hold their Class B shares, exchange their Class B shares for Class B shares of another Hartford Mutual Fund (as permitted by existing exchange privileges), or redeem their Class B shares as described in the Fund’s prospectus. Reinstatement privileges with respect to Class B shares will continue under the current policy. For investors electing to reinvest capital gains and dividends, any such capital gains or dividends on Class B shares will continue to be reinvested in Class B shares of the Fund. All Class B share attributes, including the 12b-1 fee, contingent deferred sales charge schedule, and conversion to Class A shares, remain unchanged.
| 2. | Significant Accounting Policies: |
The following is a summary of significant accounting policies of the Fund in the preparation of its financial statements, which are in accordance with the United States Generally Accepted Accounting Principles (“U.S. GAAP”). The preparation of financial statements in accordance with U.S. GAAP may require management to make estimates and assumptions that affect the reported amounts of assets and liabilities and disclosure of contingent assets and liabilities at the date of the financial statements and the reported amounts of increases and decreases in net assets from operations during the reporting period. Actual results could differ from those estimates.
| | a) | Determination of Net Asset Value – The NAV of each class of the Fund's shares is determined as of the close of regular trading (normally 4:00 p.m. Eastern Time) (the “NYSE Close”) on each day that the New York Stock Exchange (the “Exchange”) is open (“Valuation Date”). Information that becomes known to the Fund after the NAV has been calculated on a particular day will not generally be used to retroactively adjust the NAV determined earlier that day. |
| | b) | Investment Valuation and Fair Value Measurements – For purposes of calculating the NAV, portfolio securities and other assets held by the Fund's portfolio for which market quotes are readily available are valued at market value. Market value is generally determined on the basis of last reported sales prices or official close price. If no sales are reported, market value is based on quotes obtained from a quotation reporting system, established market makers, or independent pricing services. If market prices are not readily available or are deemed unreliable, the Fund will use the fair value of |
| | the security as determined in good faith under policies and procedures established by and under the supervision of the Company’s Board of Directors. Market quotes are considered not readily available where there is an absence of current or reliable market-based data (e.g., trade information or broker quotes), including where events occur after the close of the relevant market, but prior to the NYSE Close that materially affect the values of the Fund’s portfolio securities or assets. In addition, market quotes are considered not readily available when, due to extraordinary circumstances, the exchanges or markets on which the securities trade do not open for trading for the entire day and no other market prices are available. In addition, prices of foreign equities that are principally traded on certain foreign markets are adjusted daily pursuant to a fair value pricing service approved by the Board of Directors in order to reflect an adjustment for the factors occurring after the close of certain foreign markets but before the NYSE Close. Securities that are primarily traded on foreign markets may trade on days that are not business days of the Fund. The value of the foreign securities in which the Fund invests may change on days when a shareholder will not be able to purchase or redeem shares of the Fund. Fair value pricing is subjective in nature and the use of fair value pricing by the Fund may cause the NAV of its shares to differ significantly from the NAV that would have been calculated using market prices at the close of the exchange on which a portfolio security is primarily traded. There can be no assurance that the Fund could obtain the fair market value assigned to a security if the Fund were to sell the security at approximately the time at which the Fund determines its NAV. |
Investments valued in currencies other than U.S. dollars are converted to U.S. dollars using exchange rates obtained from independent pricing services for calculation of the NAV. As a result, the NAV of the Fund’s shares may be affected by changes in the value of currencies in relation to the U.S. dollar. The value of securities traded in markets outside the United States or denominated in currencies other than the U.S. dollar may be affected significantly on a day that the NYSE is closed and the market value may change on days when an investor is not able to purchase, redeem or exchange shares of the Fund.
Foreign currency contracts represent agreements to exchange currencies on specific future dates at predetermined rates. Foreign currency contracts are valued using foreign currency exchange rates and forward rates as provided by an independent pricing service on the Valuation Date.
Financial instruments for which prices are not available from an independent pricing service may be valued using market quotations obtained from one or more dealers that make markets in the respective financial instrument in accordance with procedures established by the Company’s Board of Directors.
Investments in open-end mutual funds are valued at the respective NAV of each open-end mutual fund on the Valuation Date.
U.S. GAAP defines fair value as the price that the Fund would receive to sell an asset or pay to transfer a liability in an orderly transaction between market participants. The U.S. GAAP fair value measurement standards require disclosure of a fair value hierarchy for each major category of assets and liabilities. Various inputs are used in determining the fair value of the Fund’s investments. These inputs are summarized into three broad hierarchy levels. This hierarchy is based on whether the valuation inputs are observable or unobservable. These levels are:
| | · | Level 1 – Quoted prices in active markets for identical securities. Level 1 may include exchange traded instruments such as domestic equities, some foreign equities, options, futures, mutual funds, exchange traded funds, rights and warrants. |
| | · | Level 2 – Observable inputs other than Level 1 prices, such as quoted prices for similar securities; quoted prices in markets that are not active; or other inputs that are observable or can be corroborated by observable market data. Level 2 may include debt securities that are traded less frequently than exchange traded instruments and which are valued using third party pricing services; foreign equities, that are principally traded on certain foreign markets and are adjusted daily pursuant to a fair value pricing service in order to reflect an adjustment |
| The Hartford Growth Opportunities Fund |
Notes to Financial Statements – (continued) October 31, 2011 |
|
| | for the factors occurring after the close of certain foreign markets but before the NYSE Close; and short-term securities, which are valued at amortized cost. |
| | · | Level 3 – Significant unobservable inputs that are supported by limited or no market activity. Level 3 may include financial instruments whose values are determined using broker quotes or require significant management judgment or estimation. These unobservable valuation inputs may include estimates for current yields, maturity/duration, prepayment speed, and broker quotes for comparable securities along with other assumptions relating to credit quality, collateral value, complexity of the security structure, general market conditions and liquidity. This category may include securities where trading has been halted or there are certain restrictions on trading. While these securities are priced using unobservable inputs, the valuation of these securities reflects the best available data and management believes the prices are a reasonable representation of exit price. |
Valuation levels are not necessarily indicative of the risk associated with investing in such securities. Individual securities within any of the above mentioned asset classes may be assigned a different hierarchical level than those presented above, as individual circumstances dictate.
For additional information, refer to the Investment Valuation Hierarchy Level Summary and the Level 3 roll forward reconciliation which follow the Schedule of Investments.
For purposes of reporting transfers between different hierarchy levels, both transfers in and out of each level, as applicable, are shown as if they occurred at the beginning of the period.
| | c) | Security Transactions and Investment Income – Security transactions are recorded as of the trade date (the date the order to buy or sell is executed) for financial reporting purposes. Securities purchased or sold on a when-issued or delayed-delivery basis may be settled a month or more after the trade date. Realized gains and losses are determined on the basis of identified cost. |
Dividend income is accrued as of the ex-dividend date, except certain dividends from foreign securities where the ex-dividend date may have passed are recorded as soon as the Fund is informed of the dividend. Interest income, including amortization of premium and accretion of discounts, is accrued on a daily basis.
| | d) | Foreign Currency Transactions – Assets and liabilities denominated in currencies other than U.S. dollars are translated into U.S. dollars at the exchange rates in effect on the valuation date. Purchases and sales of investment securities, income, and expenses are translated into U.S. dollars at the exchange rates on the dates of such transactions. |
The Fund does not isolate that portion of portfolio security valuation resulting from fluctuations in the foreign currency exchange rates from the fluctuations arising from changes in the market prices of securities held. Exchange rate fluctuations are included with the net realized and unrealized gain or loss on investments in the accompanying financial statements.
Net realized foreign exchange gains or losses arise from sales of foreign currencies and the difference between asset and liability amounts initially stated in foreign currencies and the U.S. dollar value of the amounts actually received or paid. Net unrealized foreign exchange gains or losses arise from changes in the value of other assets and liabilities at the end of the reporting period, resulting from changes in the exchange rates.
| | e) | Joint Trading Account – The Fund may invest cash balances into a joint trading account that may be invested in one or more repurchase agreements. |
| | f) | Fund Share Valuation and Dividend Distributions to Shareholders – Orders for the Fund’s shares are executed in accordance with the investment instructions of the shareholders. The NAV of the Fund’s shares is determined as of the close of business on each business day of the Exchange. The NAV is determined separately for each class of shares of |
| | the Fund by dividing the Fund’s net assets attributable to that class by the number of shares of the class outstanding. Each class of shares offered by the Fund has equal rights as to assets and voting privileges (except that shareholders of a class have exclusive voting rights regarding any matter relating solely to that class of shares). Income and non-class specific expenses are allocated daily to each class on the basis of the relative net assets of the class. Realized and unrealized capital gains and losses are allocated daily based on the relative net assets of each class of shares of the Fund. |
Orders for the purchase of the Fund’s shares received prior to the close of the Exchange on any day the Exchange is open for business are priced at the NAV determined as of the close of the Exchange. Orders received after the close of the Exchange, or on a day on which the Exchange and/or the Fund is not open for business, are priced at the next determined NAV.
Dividends are declared pursuant to a policy adopted by the Company’s Board of Directors based upon the investment performance of the Fund. The policy of the Fund is to pay dividends from net investment income and realized capital gains, if any, at least once a year.
Distributions from net investment income, net realized capital gains and capital are determined in accordance with federal income tax regulations, which may differ from U.S. GAAP with respect to character and timing. These differences may include but are not limited to losses deferred due to wash sale adjustments, foreign currency gains and losses, adjustments related to Passive Foreign Investment Companies (“PFICs”), Real Estate Investment Trusts (“REITs”), Regulated Investment Companies (“RICs”), certain derivatives and partnerships. Permanent book and federal income tax basis differences relating to shareholder distributions will result in reclassifications to certain of the Fund’s capital accounts (see Federal Income Taxes: Reclassification of Capital Accounts note).
| 3. | Securities and Other Investments: |
| | a) | Repurchase Agreements – A repurchase agreement is an agreement by which a counterparty agrees to sell a security and agrees to repurchase the security sold at a mutually agreed upon time and price. At the time the Fund enters into a repurchase agreement, the value of the underlying collateral security(ies), including accrued interest, will be equal to or exceed the value of the repurchase agreement. Repurchase agreements expose the Fund to counterparty risk. To minimize counterparty risk, the securities that serve to collateralize the repurchase agreement are held by the Fund's custodian in book entry or physical form in the custodial account of the Fund or in a third party custodial account. Repurchase agreements are valued at cost plus accrued interest. The Fund, as shown on the Schedule of Investments, had outstanding repurchase agreements as of October 31, 2011. |
| | b) | Illiquid and Restricted Securities – The Fund is permitted to invest up to 15% of its net assets in illiquid securities. Illiquid securities are those that may not be sold or disposed of in the ordinary course of business within seven days, at approximately the price used to determine the Fund’s NAV. The Fund may not be able to sell illiquid securities or other investments when its sub-adviser considers it desirable to do so or may have to sell such securities or investments at a price that is lower than the price that could be obtained if the securities or investments were more liquid. A sale of illiquid securities or other investments may require more time and may result in higher dealer discounts and other selling expenses than does the sale of those that are liquid. Illiquid securities and investments also may be more difficult to value due to the unavailability of reliable market quotations for such securities or investments, and an investment in them may have an adverse impact on the Fund’s NAV. The Fund may also purchase certain restricted securities that can only be resold to certain qualified investors and may be determined to be liquid pursuant to policies and guidelines established by the Company’s Board of Directors. The Fund, as shown on the Schedule of Investments, had illiquid and/or restricted securities as of October 31, 2011. |
| | c) | Securities Purchased on a When-Issued or Delayed-Delivery Basis – Delivery and payment for securities that have been purchased by the Fund on a forward commitment, or when-issued or delayed-delivery basis, take place beyond the customary settlement period. A fund may dispose of or renegotiate a delayed-delivery transaction after it is entered into, |
| The Hartford Growth Opportunities Fund |
Notes to Financial Statements – (continued) October 31, 2011 |
|
| | and may sell delayed-delivery securities before they are delivered, which may result in a realized gain or loss. During this period, such securities are subject to market fluctuations, and the Fund identifies securities segregated in its records with value at least equal to the amount of the commitment. As of October 31, 2011, the Fund had no outstanding when-issued or delayed delivery securities. |
| 4. | Financial Derivative Instruments: |
The following disclosures contain information on how and why the Fund uses derivative instruments, the credit-risk-related contingent features in certain derivative instruments, and how derivative instruments affect the Fund’s financial position and results of operations. The location and fair value amounts of these instruments on the Statement of Assets and Liabilities and the realized gains and losses and changes in unrealized gains and losses on the Statement of Operations, each categorized by type of derivative contract, are included in the following Additional Derivative Instrument Information footnote. The derivative instruments outstanding as of period-end are disclosed in the notes to the Schedule of Investments and the amounts of realized gains and losses and changes in unrealized gains and losses on derivative instruments during the period are disclosed in the Statement of Operations.
| | a) | Foreign Currency Contracts – The Fund may enter into foreign currency contracts that obligate the Fund to purchase or sell currencies at specified future dates. Foreign currency contracts are used to hedge the currency exposure associated with some or all of the Fund's securities and/or as part of an investment strategy. Foreign currency contracts are marked to market daily and the change in value is recorded by the Fund as an unrealized gain or loss. The Fund will record a realized gain or loss when the foreign currency contract is settled. |
Foreign currency contracts involve elements of market risk in excess of the amounts reflected in the Statement of Assets and Liabilities. In addition, risks may arise upon entering into these contracts from the potential inability of the counterparties to meet the terms of the contracts and from unanticipated movements in the value of the foreign currencies relative to the U.S. dollar. The Fund had outstanding foreign currency contracts as shown on the Schedule of Investments as of October 31, 2011.
| | b) | Additional Derivative Instrument Information: |
Fair Values of Derivative Instruments on the Statement of Assets and Liabilities as of October 31, 2011:
| | | Risk Exposure Category | |
| | | | | | | | | | | | | | | | | | | | | | |
| Assets: | | | | | | | | | | | | | | | | | | | | | |
| Unrealized appreciation on foreign currency contracts | | $ | — | | | $ | 15 | | | $ | — | | | $ | — | | | $ | — | | | $ | — | | | $ | 15 | |
| Total | | $ | — | | | $ | 15 | | | $ | — | | | $ | — | | | $ | — | | | $ | — | | | $ | 15 | |
The volume of derivatives that is presented in the Schedule of Investments is consistent with the derivative activity during the year ended October 31, 2011.
The Effect of Derivative Instruments on the Statement of Operations for the year ended October 31, 2011:
| | | Risk Exposure Category | |
| | | | | | | | | | | | | | | | | | | | | | |
| Realized Gain (Loss) on Derivatives Recognized as a Result of Operations: | |
| Net realized loss on foreign currency contracts | | $ | — | | | $ | (1,163 | ) | | $ | — | | | $ | — | | | $ | — | | | $ | — | | | $ | (1,163 | ) |
| Total | | $ | — | | | $ | (1,163 | ) | | $ | — | | | $ | — | | | $ | — | | | $ | — | | | $ | (1,163 | ) |
| | |
| Net Change in Unrealized Appreciation (Depreciation) on Derivatives Recognized as a Result of Operations: | |
| Net change in unrealized appreciation of foreign currency contracts | | $ | — | | | $ | 760 | | | $ | — | | | $ | — | | | $ | — | | | $ | — | | | $ | 760 | |
| Total | | $ | — | | | $ | 760 | | | $ | — | | | $ | — | | | $ | — | | | $ | — | | | $ | 760 | |
| | a) | Counterparty Risk – The Fund may be exposed to counterparty risk, or the risk that an institution or other entity with which the Fund has unsettled or open transactions will default. |
| | b) | Market Risks – If the Fund invests directly in foreign currencies or in securities that trade in, and receive revenues in, foreign currencies, or in derivatives that provide exposure to foreign currencies, it will be subject to the risk that those currencies will decline in value relative to the base currency of the Fund, or, in the case of hedging positions, that the Fund’s base currency will decline in value relative to the currency being hedged. Currency rates in foreign countries may fluctuate significantly over short periods of time for a number of reasons, including changes in interest rates, intervention (or the failure to intervene) by U.S. or foreign governments, central banks or supranational entities, such as the International Monetary Fund, or by the imposition of currency controls or other political developments in the United States or abroad. As a result, the Fund’s investments in foreign currency denominated securities may reduce the returns of the Fund. The market values of equity securities, such as common stocks and preferred stocks, or equity related investments, such as futures and options, may decline due to general market conditions which are not specifically related to a particular company, such as real or perceived adverse economic conditions, changes in the general outlook for corporate earnings, changes in interest or currency rates or adverse investor sentiment generally. The market value of equity securities may also decline due to factors which affect a particular industry or industries, such as labor shortages or increased production costs and competitive conditions within an industry. Equity securities and equity related investments generally have greater market price volatility than fixed income securities. |
| | a) | Federal Income Taxes – For federal income tax purposes, the Fund intends to continue to qualify as a RIC under Subchapter M of the Internal Revenue Code (“IRC”) by distributing substantially all of its taxable net investment income and net realized capital gains to its shareholders and otherwise complying with the requirements of RICs. The Fund has distributed substantially all of its income and capital gains in prior years, if applicable, and intends to distribute substantially all of its income and capital gains during the calendar year ending December 31, 2011. Accordingly, no provision for federal income or excise taxes has been made in the accompanying financial statements. Distributions from short-term capital gains are treated as ordinary income distributions for federal income tax purposes. |
| | b) | Net Investment Income (Loss), Net Realized Gains (Losses) – Net investment income (loss) and net realized gains (losses) may differ for financial statement and tax purposes primarily because of losses deferred due to wash sale adjustments, foreign currency gains and losses, adjustments related to PFICs, REITs, RICs, certain derivatives and partnerships. The character of distributions made during the year from net investment income or net realized gains may differ from their ultimate characterization for federal income tax purposes. Also, due to the timing of dividend |
| The Hartford Growth Opportunities Fund |
Notes to Financial Statements – (continued) October 31, 2011 |
|
| | distributions, the fiscal year in which amounts are distributed may differ from the year that the income or realized gains (losses) were recorded by the Fund. |
| | c) | Distributions and Components of Distributable Earnings – The tax character of distributions paid by the Fund for the periods indicated is as follows (as adjusted for dividends payable): |
| | | For the Year Ended October 31, 2011 | | | For the Year Ended October 31, 2010 | |
| Ordinary Income | | $ | — | | | $ | 1,318 | |
As of October 31, 2011, the Fund’s components of distributable earnings (deficit) on a tax basis were as follows:
| | | Amount | |
| Accumulated Capital Losses * | | $ | (435,501 | ) |
| Unrealized Appreciation † | | | 72,644 | |
| Total Accumulated Deficit | | $ | (362,857 | ) |
| | * | The Fund has capital loss carryforwards that are identified in the Capital Loss Carryforward note that follows. |
| | † | The differences between book-basis and tax-basis unrealized appreciation (depreciation) may be attributable to the losses deferred due to wash sale adjustments, foreign currency gains and losses, adjustments related to PFICs, REITs, RICs, certain derivatives and partnerships. |
| | d) | Reclassification of Capital Accounts – The Fund may record reclassifications in its capital accounts. These reclassifications have no impact on the total net assets of the Fund. The reclassifications are a result of permanent differences between U.S. GAAP and tax accounting for such items as foreign currency, PFICs, expiration or utilization of capital loss carryforwards or net operating losses. Adjustments are made to reflect the impact these items have on current and future distributions to shareholders. Therefore, the source of the Fund’s distributions may be shown in the accompanying Statement of Changes in Net Assets as from accumulated undistributed net investment income, from accumulated net realized gains on investments or from capital depending on the type of book and tax differences that exist. For the year ended October 31, 2011, the Fund recorded reclassifications to increase (decrease) the accounts listed below: |
| | | Amount | |
| Accumulated Undistributed Net Investment Income | | $ | 8,371 | |
| Accumulated Net Realized Gain (Loss) on Investments and Foreign Currency Transactions | | | 1,202 | |
| Capital Stock and Paid-In-Capital | | | (9,573 | ) |
| | e) | Capital Loss Carryforward – At October 31, 2011 (tax-year-end), the Fund had capital loss carryforwards for U.S. federal income tax purposes of approximately: |
Year of Expiration | | Amount | |
| 2017 | | $ | 435,501 | |
| Total | | $ | 435,501 | |
As of October 31, 2011, the Fund utilized $262,411 of prior year capital loss carryforwards.
| | f) | Accounting for Uncertainty in Income Taxes – The Fund has adopted financial reporting rules that require the Fund to analyze all open tax years, as defined by the statute of limitations, for all major jurisdictions. Generally, tax authorities can examine all tax returns filed for the last three years. The Fund does not have an examination in progress. |
The Fund has reviewed all open tax years and major jurisdictions and concluded that these financial reporting rules had no effect on the Fund’s financial position or results of operations. There is no tax liability resulting from unrecognized tax benefits relating to uncertain income tax positions taken or expected to be taken on the tax return for the fiscal year ended October 31, 2011. The Fund is also not aware of any tax positions for which it is reasonably possible that the total amounts of unrecognized tax benefits will significantly change in the next twelve months.
| | a) | Investment Management Agreement – Hartford Investment Financial Services, LLC (“HIFSCO”), a wholly-owned indirect subsidiary of The Hartford Financial Services Group, Inc. (“The Hartford”), serves as investment manager to the Fund pursuant to an Investment Management Agreement with the Company. As investment manager, HIFSCO has overall investment supervisory responsibility for the Fund. In addition, HIFSCO provides administrative personnel, services, equipment, facilities and office space for proper operation of the Fund. HIFSCO has contracted with Wellington Management Company, LLP (“Wellington Management”) under a sub-advisory agreement for the provision of day-to-day investment management services to the Fund in accordance with the Fund’s investment objective and policies. The Fund pays a fee to HIFSCO, a portion of which may be used to compensate Wellington Management. |
The schedule below reflects the rates of compensation paid to HIFSCO for investment management services rendered as of October 31, 2011; the rates are accrued daily and paid monthly:
| Average Daily Net Assets | | Annual Fee | |
| On first $250 million | | | 0.8000 | % |
| On next $4.75 billion | | | 0.7000 | % |
| On next $5 billion | | | 0.6975 | % |
| Over $10 billion | | | 0.6950 | % |
| | b) | Accounting Services Agreement – Pursuant to the Fund Accounting Agreement between Hartford Life Insurance Company (“HLIC”) and the Company, on behalf of the Fund, HLIC provides accounting services to the Fund and receives monthly compensation based on the Fund’s average net assets at the rates set forth below. The Fund’s accounting services fees are accrued daily and paid monthly. |
| Average Daily Net Assets | | Annual Fee | |
| On first $5 billion | | | 0.012 | % |
| Over $5 billion | | | 0.010 | % |
| | c) | Operating Expenses – Allocable expenses incurred by the Company are allocated to each Fund and allocated to classes within the Fund in proportion to the average daily net assets of the Fund and each class, except where allocation of certain expenses is more fairly made directly to the Fund or to specific classes within a Fund. As of October 31, 2011, HIFSCO contractually limited the total operating expenses of this Fund, exclusive of taxes, interest expense, brokerage commissions, acquired fund fees and expenses and extraordinary expenses as follows: |
Class A | | | Class B | | | Class C | | | Class I | | | Class R3 | | | Class R4 | | | Class R5 | | | Class Y | |
| | | | | | | | | | | | 1.45% | | | 1.15% | | | 0.85% | | | 0.85% | |
From November 1, 2010 through February 28, 2011, HIFSCO contractually limited the total operating expenses of this Fund, exclusive of taxes, interest expense, brokerage commissions, acquired fund fees and expenses and extraordinary expenses as follows:
| Class A | | | Class B | | | Class C | | | Class I | | | Class R3 | | | Class R4 | | | Class R5 | | | Class Y | |
| 1.36% | | | 2.11% | | | 2.11% | | | 1.11% | | | | | | | | | | | | | |
| The Hartford Growth Opportunities Fund |
Notes to Financial Statements – (continued) October 31, 2011 |
|
| | d) | Fees Paid Indirectly – The Fund has entered into agreements with State Street Global Markets, LLC and Russell Implementation Services Inc. to partially recapture non-discounted trade commissions. Such rebates are used to pay a portion of the Fund’s expenses. In addition, the Fund’s custodian bank, State Street Bank and Trust Co., has also agreed to reduce its fees when the Fund maintains cash on deposit in a non-interest-bearing custody account. For the year ended October 31, 2011, these amounts are included in the Statement of Operations. |
The ratio of expenses to average net assets in the accompanying financial highlights excludes the reduction in expenses related to fees paid indirectly. The annualized expense ratio for the period listed below including the fees paid indirectly is as follows:
| | | Year Ended October 31, 2011 | |
| Class A Shares | | | 1.21 | % |
| Class B Shares | | | 2.04 | |
| Class C Shares | | | 1.91 | |
| Class I Shares | | | 0.92 | |
| Class R3 Shares | | | 1.45 | |
| Class R4 Shares | | | 1.15 | |
| Class R5 Shares | | | 0.85 | |
| Class Y Shares | | | 0.75 | |
| | e) | Distribution and Service Plan for Class A, B, C, R3 and R4 Shares – HIFSCO is the principal underwriter and distributor of the Fund. HIFSCO is engaged in distribution activities, which include marketing and distribution of shares through broker-dealers, financing distribution costs and maintaining financial books and records. For the year ended October 31, 2011, HIFSCO received front-end load sales charges of $924 and contingent deferred sales charges of $126 from the Fund. |
The Fund has adopted a Distribution and Service Plan in accordance with Rule 12b-1 of the 1940 Act to compensate the distributor (HIFSCO) for activities intended to result in the sale and distribution of Class A, B, C, R3 and R4 shares and for providing services for shareholders. During its May 3, 2011 meeting, the Board of Directors approved an amendment to the Fund’s Class A Plan to, effective August 1, 2011, lower the amount of Rule 12b-1 distribution fees that may be charged in respect of Class A shares of the Fund from an annual rate of 0.35% of the Fund’s average daily net assets attributable to Class A shares to 0.25%. The Board of Directors has authorized Rule 12b-1 payments of up to 0.25% of the Fund’s average daily net assets attributable to Class A shares. As a result, the amendment to the Class A Plan did not affect the fees charged under the plan. Some or all of the fee may be used for shareholder servicing expenses with the remainder used for distribution expenses. Some or the entire Rule 12b-1 fee for Class B shares may be remitted to broker-dealers for distribution and/or shareholder account services. Under the Class B Plan, the Fund pays the distributor 1.00% of the average daily net assets of Class B shares that are outstanding for 8 years or less, 0.25% of which is a fee for services provided to existing shareholders with the remainder used for distribution expenses. After eight years, Class B shares convert to Class A shares. Upon conversion to Class A shares, the Class A plan described above will apply to those shares. Under the Class C Plan, the Fund pays the distributor 1.00% of the average daily net assets of Class C shares outstanding, 0.25% of which is intended as a fee for services provided to existing shareholders with the remainder used for distribution expenses. For Class C shares, some or the entire fee may be remitted to broker-dealers for distribution and/or shareholder account services. Class R3 shares have a distribution fee of 0.50% and Class R4 shares have a distribution fee of 0.25%. For Class R3 and R4 shares, some or the entire fee may be remitted to broker dealers for distribution and/or shareholder account services. The Fund’s 12b-1 fees are accrued daily and paid monthly.
For the year ended October 31, 2011, total sales commissions paid to affiliated brokers/dealers of The Hartford for distributing the Fund's shares were $129. These commissions are in turn paid to sales representatives of the broker/dealers.
| | f) | Other Related Party Transactions – Certain officers of the Fund are directors and/or officers of HIFSCO and/or The Hartford or its subsidiaries. For the year ended October 31, 2011, a portion of the Fund’s chief compliance officer’s compensation was paid by all of the investment companies in the Hartford fund complex. The portion allocated to the Fund was in the amount of $2. Hartford Administrative Services Company (“HASCO”), an indirect wholly-owned subsidiary of The Hartford, provides transfer agent services to the Fund. HASCO has contractually agreed to reimburse any portion of the transfer agency fees over 0.30% of average daily net assets per fiscal year for each class. HASCO was compensated on a per account basis, which varies by share class, for providing such services. The amount to HASCO and any related contractual reimbursement amounts, if applicable, can be found in the Statement of Operations. These fees are accrued daily and paid monthly. |
Administrative services fees are paid to HASCO for third-party recordkeeping services that are payable as a percentage of net assets in the amount of 0.20%, 0.15% and 0.10% for Classes R3, R4 and R5 shares, respectively. The total administrative services fees are shown on the Statement of Operations. These fees are accrued daily and paid monthly.
| | g) | Payment from Affiliate – On November 8, 2006, the SEC issued an order setting forth the terms of a settlement reached with three subsidiaries of The Hartford that resolved the SEC’s Division of Enforcement’s investigation of aspects of The Hartford’s variable annuity and mutual fund operations related to directed brokerage and revenue sharing. The Hartford settled this matter without admitting or denying the findings of the SEC. |
The total return in the accompanying financial highlights includes a payment from affiliate. Had the payment from affiliate been excluded, the impact and total return for the periods listed below would have been as follows:
| | | Impact from Payment from Affiliate for SEC Settlement for the Year Ended October 31, 2007 | | | Total Return Excluding Payment from Affiliate for the Year Ended October 31, 2007 | |
| Class A | | | 0.03 | % | | | 40.34 | % |
| Class B | | | 0.04 | | | | 39.24 | |
| Class C | | | 0.04 | | | | 39.35 | |
| Class I | | | 0.03 | | | | 40.84 | |
| Class L | | | 0.03 | | | | 40.72 | |
| Class Y | | | 0.03 | | | | 41.02 | |
| 8. | Investment Transactions: |
For the year ended October 31, 2011, the Fund's aggregate purchases and sales of investment securities (excluding short-term investments) were as follows:
| | | Amount | |
| Cost of Purchases Excluding U.S. Government Obligations | | $ | 2,352,340 | |
| Sales Proceeds Excluding U.S. Government Obligations | | | 2,300,197 | |
| The Hartford Growth Opportunities Fund |
Notes to Financial Statements – (continued) October 31, 2011 |
|
| 9. | Capital Share Transactions: |
The following information is for the year ended October 31, 2011, and the year ended October 31, 2010:
| | | For the Year Ended October 31, 2011 | | | For the Year Ended October 31, 2010 | |
| | | | | | Shares Issued for Reinvested Dividends | | | | | | | | | Net Increase (Decrease) of Shares | | | | | | Shares Issued for Reinvested Dividends | | | | | | | | | Net Increase (Decrease) of Shares | |
| Class A | | | | | | | | | | | | | | | | | | | | | | | | | | | | | | |
| Shares | | | 2,652 | | | | — | | | | (6,839 | ) | | | 15,814 | | | | 11,627 | | | | 5,602 | | | | — | | | | (24,289 | ) | | | — | | | | (18,687 | ) |
| Amount | | $ | 72,474 | | | $ | — | | | $ | (184,293 | ) | | $ | 312,023 | | | $ | 200,204 | | | $ | 127,587 | | | $ | — | | | $ | (565,023 | ) | | $ | — | | | $ | (437,436 | ) |
| Class B | | | | | | | | | | | | | | | | | | | | | | | | | | | | | | | | | | | | | | | | |
| Shares | | | 38 | | | | — | | | | (427 | ) | | | — | | | | (389 | ) | | | 33 | | | | — | | | | (468 | ) | | | — | | | | (435 | ) |
| Amount | | $ | 828 | | | $ | — | | | $ | (9,175 | ) | | $ | — | | | $ | (8,347 | ) | | $ | 615 | | | $ | — | | | $ | (8,631 | ) | | $ | — | | | $ | (8,016 | ) |
| Class C | | | | | | | | | | | | | | | | | | | | | | | | | | | | | | | | | | | | | | | | |
| Shares | | | 762 | | | | — | | | | (2,461 | ) | | | — | | | | (1,699 | ) | | | 838 | | | | — | | | | (3,338 | ) | | | — | | | | (2,500 | ) |
| Amount | | $ | 16,856 | | | $ | — | | | $ | (53,527 | ) | | $ | — | | | $ | (36,671 | ) | | $ | 15,523 | | | $ | — | | | $ | (61,513 | ) | | $ | — | | | $ | (45,990 | ) |
| Class I | | | | | | | | | | | | | | | | | | | | | | | �� | | | | | | | | | | | | | | | | | |
| Shares | | | 21,958 | | | | — | | | | (11,724 | ) | | | — | | | | 10,234 | | | | 13,596 | | | | 19 | | | | (11,101 | ) | | | — | | | | 2,514 | |
| Amount | | $ | 617,676 | | | $ | — | | | $ | (319,495 | ) | | $ | — | | | $ | 298,181 | | | $ | 314,735 | | | $ | 432 | | | $ | (260,301 | ) | | $ | — | | | $ | 54,866 | |
| Class L | | | | | | | | | | | | | | | | | | | | | | | | | | | | | | | | | | | | | | | | |
| Shares | | | 235 | | | | — | | | | (1,670 | ) | | | (15,385 | ) | | | (16,820 | ) | | | 267 | | | | 7 | | | | (2,350 | ) | | | — | | | | (2,076 | ) |
| Amount | | $ | 6,709 | | | $ | — | | | $ | (47,681 | ) | | $ | (312,023 | ) | | $ | (352,995 | ) | | $ | 6,249 | | | $ | 167 | | | $ | (55,093 | ) | | $ | — | | | $ | (48,677 | ) |
| Class R3 | | | | | | | | | | | | | | | | | | | | | | | | | | | | | | | | | | | | | | | | |
| Shares | | | 269 | | | | — | | | | (187 | ) | | | — | | | | 82 | | | | 205 | | | | — | | | | (179 | ) | | | — | | | | 26 | |
| Amount | | $ | 7,426 | | | $ | — | | | $ | (5,129 | ) | | $ | — | | | $ | 2,297 | | | $ | 4,798 | | | $ | — | | | $ | (4,124 | ) | | $ | — | | | $ | 674 | |
| Class R4 | | | | | | | | | | | | | | | | | | | | | | | | | | | | | | | | | | | | | | | | |
| Shares | | | 296 | | | | — | | | | (617 | ) | | | — | | | | (321 | ) | | | 249 | | | | — | | | | (238 | ) | | | — | | | | 11 | |
| Amount | | $ | 8,244 | | | $ | — | | | $ | (17,263 | ) | | $ | — | | | $ | (9,019 | ) | | $ | 5,858 | | | $ | — | | | $ | (5,568 | ) | | $ | — | | | $ | 290 | |
| Class R5 | | | | | | | | | | | | | | | | | | | | | | | | | | | | | | | | | | | | | | | | |
| Shares | | | 531 | | | | — | | | | (561 | ) | | | — | | | | (30 | ) | | | 145 | | | | 1 | | | | (152 | ) | | | — | | | | (6 | ) |
| Amount | | $ | 15,120 | | | $ | — | | | $ | (16,194 | ) | | $ | — | | | $ | (1,074 | ) | | $ | 3,443 | | | $ | 24 | | | $ | (3,636 | ) | | $ | — | | | $ | (169 | ) |
| Class Y | | | | | | | | | | | | | | | | | | | | | | | | | | | | | | | | | | | | | | | | |
| Shares | | | 346 | | | | — | | | | (2,018 | ) | | | — | | | | (1,672 | ) | | | 1,048 | | | | 18 | | | | (3,774 | ) | | | — | | | | (2,708 | ) |
| Amount | | $ | 9,849 | | | $ | — | | | $ | (57,431 | ) | | $ | — | | | $ | (47,582 | ) | | $ | 24,718 | | | $ | 434 | | | $ | (89,144 | ) | | $ | — | | | $ | (63,992 | ) |
| Total | | | | | | | | | | | | | | | | | | | | | | | | | | | | | | | | | | | | | | | | |
| Shares | | | 27,087 | | | | — | | | | (26,504 | ) | | | 429 | | | | 1,012 | | | | 21,983 | | | | 45 | | | | (45,889 | ) | | | — | | | | (23,861 | ) |
| Amount | | $ | 755,182 | | | $ | — | | | $ | (710,188 | ) | | $ | — | | | $ | 44,994 | | | $ | 503,526 | | | $ | 1,057 | | | $ | (1,053,033 | ) | | $ | — | | | $ | (548,450 | ) |
The following reflects the conversion of Class B shares into Class A shares (reflected as Class A shares sold) for the year ended October 31, 2011, and the year ended October 31, 2010:
| | | Shares | | | Dollars | |
| For the Year Ended October 31, 2011 | | | 51 | | | $ | 1,346 | |
| For the Year Ended October 31, 2010 | | | 61 | | | $ | 1,411 | |
The Fund is one of several Hartford funds that participate in a $500 million committed revolving line of credit facility. The facility is to be used for temporary or emergency purposes. Under the arrangement, the funds are required to own securities having a market value in excess of 300% of the total bank borrowings. The interest rate on borrowings varies depending on the nature of the loan. The facility also requires a fee to be paid based on the amount of the commitment. This commitment fee is allocated to all of the funds participating in the line of credit based on the average net assets of the funds. During the year ended October 31, 2011, the Fund did not have any borrowings under this facility.
At its May 3, 2011, meeting, the Board of Directors of The Hartford Mutual Funds II, Inc. approved the reclassification of Class L shares into Class A shares of the Fund.
Effective with the close of business on August 5, 2011, Class L was merged into Class A. The merger was accomplished by a tax-free exchange as detailed below:
| | | Class A | | | Class L | |
| Shares exchanged | | | N/A | | | | 15,385 | |
| Shares issued - to Class L shareholders | | | 15,814 | | | | N/A | |
| Net assets immediately before merger | | $ | 371,266 | | | $ | 402,076 | |
| Net assets immediately after merger | | $ | 773,342 | | | | N/A | |
| 12. | Industry Classifications: |
Other than the industry classifications “Other Investment Pools and Funds” and “Exchange Traded Funds,” equity industry classifications used in this report are the Global Industry Classification Standard, which was developed by and is the exclusive property and service mark of MSCI, Inc. and Standard & Poor’s.
| 13. | Pending Legal Proceedings: |
On February 25, 2011, Jennifer L. Kasilag, Louis Mellinger, Judith M. Menendez, Jacqueline M. Robinson, and Linda A. Russell filed a derivative lawsuit against HIFSCO on behalf of six funds: The Hartford Global Health Fund (now known as The Hartford Healthcare Fund), The Hartford Conservative Allocation Fund, The Hartford Growth Opportunities Fund, The Hartford Inflation Plus Fund, The Hartford Advisers Fund and The Hartford Money Market Fund. The lawsuit, which was filed in the United States District Court for the District of New Jersey, seeks recovery under Section 36(b) of the 1940 Act for the alleged overpayment of investment management and 12b-1 distribution fees to HIFSCO. The plaintiffs seek recovery of the alleged overpayments or, alternatively, rescission of the contracts and restitution of all fees paid, together with lost earnings. On November 14, 2011, the plaintiffs filed an amended complaint, which dropped The Hartford Money Market Fund and added The Hartford Capital Appreciation Fund as a plaintiff. The Hartford intends to vigorously defend the action.
No accrual for litigation relating to this matter has been recorded in the financial statements of the Fund because the Fund is not party to the suit.
Under the Company’s organizational documents, the Company shall indemnify its officers and directors to the full extent required or permitted under Maryland General Corporation Law and the federal securities laws. In addition, the Company, on behalf of the Fund, may enter into contracts that contain a variety of indemnifications. The Company’s maximum exposure under these arrangements is unknown. However, as of the date of these financial statements, the Company has not had prior claims or losses pursuant to these contracts and expects the risk of loss to be remote.
|
|
- Selected Per-Share Data (A) - |
| | Net Asset Value at Beginning of Period | | | Net Investment Income (Loss) | | | Payments from (to) Affiliate | | | Net Realized and Unrealized Gain (Loss) on Investments | | | Total from Investment Operations | | | Dividends from Net Investment Income | | | Distributions from Realized Capital Gains | | | Distributions from Capital | | | | | | Net Increase (Decrease) in Net Asset Value | | | Net Asset Value at End of Period | |
| For the Year Ended October 31, 2011 (E) | |
| A(F) | | $ | 24.78 | | | $ | 0.02 | | | $ | – | | | $ | 1.18 | | | $ | 1.20 | | | $ | – | | | $ | – | | | $ | – | | | $ | – | | | $ | 1.20 | | | $ | 25.98 | |
| B | | | 19.93 | | | | (0.29 | ) | | | – | | | | 1.08 | | | | 0.79 | | | | – | | | | – | | | | – | | | | – | | | | 0.79 | | | | 20.72 | |
| C | | | 19.98 | | | | (0.26 | ) | | | – | | | | 1.08 | | | | 0.82 | | | | – | | | | – | | | | – | | | | – | | | | 0.82 | | | | 20.80 | |
| I | | | 25.10 | | | | (0.06 | ) | | | – | | | | 1.35 | | | | 1.29 | | | | – | | | | – | | | | – | | | | – | | | | 1.29 | | | | 26.39 | |
| R3 | | | 25.31 | | | | (0.20 | ) | | | – | | | | 1.37 | | | | 1.17 | | | | – | | | | – | | | | – | | | | – | | | | 1.17 | | | | 26.48 | |
| R4 | | | 25.63 | | | | (0.12 | ) | | | – | | | | 1.38 | | | | 1.26 | | | | – | | | | – | | | | – | | | | – | | | | 1.26 | | | | 26.89 | |
| R5 | | | 25.85 | | | | (0.04 | ) | | | – | | | | 1.39 | | | | 1.35 | | | | – | | | | – | | | | – | | | | – | | | | 1.35 | | | | 27.20 | |
| Y | | | 25.94 | | | | (0.01 | ) | | | – | | | | 1.39 | | | | 1.38 | | | | – | | | | – | | | | – | | | | – | | | | 1.38 | | | | 27.32 | |
| | |
| For the Year Ended October 31, 2010 (E) | |
| A | | | 20.69 | | | | (0.13 | ) | | | – | | | | 4.22 | | | | 4.09 | | | | – | | | | – | | | | – | | | | – | | | | 4.09 | | | | 24.78 | |
| B | | | 16.77 | | | | (0.25 | ) | | | – | | | | 3.41 | | | | 3.16 | | | | – | | | | – | | | | – | | | | – | | | | 3.16 | | | | 19.93 | |
| C | | | 16.78 | | | | (0.23 | ) | | | – | | | | 3.43 | | | | 3.20 | | | | – | | | | – | | | | – | | | | – | | | | 3.20 | | | | 19.98 | |
| I | | | 20.91 | | | | (0.05 | ) | | | – | | | | 4.28 | | | | 4.23 | | | | (0.04 | ) | | | – | | | | – | | | | (0.04 | ) | | | 4.19 | | | | 25.10 | |
| R3 | | | 21.17 | | | | (0.18 | ) | | | – | | | | 4.32 | | | | 4.14 | | | | – | | | | – | | | | – | | | | – | | | | 4.14 | | | | 25.31 | |
| R4 | | | 21.37 | | | | (0.10 | ) | | | – | | | | 4.36 | | | | 4.26 | | | | – | | | | – | | | | – | | | | – | | | | 4.26 | | | | 25.63 | |
| R5 | | | 21.52 | | | | (0.03 | ) | | | – | | | | 4.40 | | | | 4.37 | | | | (0.04 | ) | | | – | | | | – | | | | (0.04 | ) | | | 4.33 | | | | 25.85 | |
| Y | | | 21.59 | | | | (0.01 | ) | | | – | | | | 4.42 | | | | 4.41 | | | | (0.06 | ) | | | – | | | | – | | | | (0.06 | ) | | | 4.35 | | | | 25.94 | |
| | |
| For the Year Ended October 31, 2009 | |
| A | | | 18.60 | | | | 0.02 | | | | – | | | | 2.07 | | | | 2.09 | | | | – | | | | – | | | | – | | | | – | | | | 2.09 | | | | 20.69 | |
| B | | | 15.16 | | | | (0.09 | ) | | | – | | | | 1.70 | | | | 1.61 | | | | – | | | | – | | | | – | | | | – | | | | 1.61 | | | | 16.77 | |
| C | | | 15.21 | | | | (0.13 | ) | | | – | | | | 1.70 | | | | 1.57 | | | | – | | | | – | | | | – | | | | – | | | | 1.57 | | | | 16.78 | |
| I | | | 18.74 | | | | 0.02 | | | | – | | | | 2.15 | | | | 2.17 | | | | – | | | | – | | | | – | | | | – | | | | 2.17 | | | | 20.91 | |
| R3 | | | 19.08 | | | | (0.04 | ) | | | – | | | | 2.13 | | | | 2.09 | | | | – | | | | – | | | | – | | | | – | | | | 2.09 | | | | 21.17 | |
| R4 | | | 19.19 | | | | 0.01 | | | | – | | | | 2.17 | | | | 2.18 | | | | – | | | | – | | | | – | | | | – | | | | 2.18 | | | | 21.37 | |
| R5 | | | 19.28 | | | | 0.02 | | | | – | | | | 2.22 | | | | 2.24 | | | | – | | | | – | | | | – | | | | – | | | | 2.24 | | | | 21.52 | |
| Y | | | 19.31 | | | | 0.10 | | | | – | | | | 2.18 | | | | 2.28 | | | | – | �� | | | – | | | | – | | | | – | | | | 2.28 | | | | 21.59 | |
| | |
| For the Year Ended October 31, 2008 (E) | |
| A | | | 38.24 | | | | (0.05 | ) | | | – | | | | (15.21 | ) | | | (15.26 | ) | | | – | | | | (4.38 | ) | | | – | | | | (4.38 | ) | | | (19.64 | ) | | | 18.60 | |
| B | | | 32.23 | | | | (0.22 | ) | | | – | | | | (12.47 | ) | | | (12.69 | ) | | | – | | | | (4.38 | ) | | | – | | | | (4.38 | ) | | | (17.07 | ) | | | 15.16 | |
| C | | | 32.27 | | | | (0.19 | ) | | | – | | | | (12.49 | ) | | | (12.68 | ) | | | – | | | | (4.38 | ) | | | – | | | | (4.38 | ) | | | (17.06 | ) | | | 15.21 | |
| I | | | 38.39 | | | | 0.07 | | | | – | | | | (15.25 | ) | | | (15.18 | ) | | | (0.09 | ) | | | (4.38 | ) | | | – | | | | (4.47 | ) | | | (19.65 | ) | | | 18.74 | |
| R3 | | | 39.18 | | | | (0.11 | ) | | | – | | | | (15.61 | ) | | | (15.72 | ) | | | – | | | | (4.38 | ) | | | – | | | | (4.38 | ) | | | (20.10 | ) | | | 19.08 | |
| R4 | | | 39.33 | | | | (0.02 | ) | | | – | | | | (15.68 | ) | | | (15.70 | ) | | | (0.06 | ) | | | (4.38 | ) | | | – | | | | (4.44 | ) | | | (20.14 | ) | | | 19.19 | |
| R5 | | | 39.39 | | | | 0.06 | | | | – | | | | (15.72 | ) | | | (15.66 | ) | | | (0.07 | ) | | | (4.38 | ) | | | – | | | | (4.45 | ) | | | (20.11 | ) | | | 19.28 | |
| Y | | | 39.43 | | | | 0.10 | | | | – | | | | (15.76 | ) | | | (15.66 | ) | | | (0.08 | ) | | | (4.38 | ) | | | – | | | | (4.46 | ) | | | (20.12 | ) | | | 19.31 | |
| | |
| For the Year Ended October 31, 2007 | |
| A | | | 29.33 | | | | (0.03 | ) | | | 0.01 | | | | 11.05 | | | | 11.03 | | | | – | | | | (2.12 | ) | | | – | | | | (2.12 | ) | | | 8.91 | | | | 38.24 | |
| B | | | 25.23 | | | | (0.20 | ) | | | 0.01 | | | | 9.31 | | | | 9.12 | | | | – | | | | (2.12 | ) | | | – | | | | (2.12 | ) | | | 7.00 | | | | 32.23 | |
| C | | | 25.24 | | | | (0.10 | ) | | | – | | | | 9.25 | | | | 9.15 | | | | – | | | | (2.12 | ) | | | – | | | | (2.12 | ) | | | 7.03 | | | | 32.27 | |
| I | | | 29.34 | | | | 0.01 | | | | – | | | | 11.16 | | | | 11.17 | | | | – | | | | (2.12 | ) | | | – | | | | (2.12 | ) | | | 9.05 | | | | 38.39 | |
| R3(H) | | | 29.39 | | | | (0.08 | ) | | | – | | | | 9.87 | | | | 9.79 | | | | – | | | | – | | | | – | | | | – | | | | 9.79 | | | | 39.18 | |
| R4(H) | | | 29.39 | | | | (0.01 | ) | | | – | | | | 9.95 | | | | 9.94 | | | | – | | | | – | | | | – | | | | – | | | | 9.94 | | | | 39.33 | |
| R5(H) | | | 29.39 | | | | – | | | | – | | | | 10.00 | | | | 10.00 | | | | – | | | | – | | | | – | | | | – | | | | 10.00 | | | | 39.39 | |
| Y(K) | | | 30.04 | | | | 0.15 | | | | 0.01 | | | | 11.35 | | | | 11.51 | | | | – | | | | (2.12 | ) | | | – | | | | (2.12 | ) | | | 9.39 | | | | 39.43 | |
| (A) | Information presented relates to a share outstanding throughout the indicated period. |
| (B) | Assumes initial investment at net asset value at the beginning of each period, reinvestment of all distributions, the complete redemption of the investment at net asset value at the end of each period and no sales charge. Total return would be reduced if sales charges were taken into account. |
| (C) | Ratios do not include fees paid indirectly (See Expenses in the accompanying Notes to Financial Statements). |
| (D) | Portfolio turnover rate is calculated on the basis of the Fund as a whole without distinguishing between the classes of shares issued. |
| (E) | Per share amounts have been calculated using average shares outstanding method. |
| (F) | Class L was merged into Class A on August 5, 2011 (See Class Merger in accompanying Notes to Financial Statements). |
| (G) | Total return without the inclusion of the Payments from (to) Affiliate, can be found in Expenses in the accompanying Notes to Financial Statements. |
| (H) | Commenced operations on December 22, 2006. |
| (K) | Classes H, M and N were merged into Class L and Class Z was merged into Class Y on February 9, 2007. |
- Ratios and Supplemental Data - |
| | | Net Assets at End of Period (000's) | | | Ratio of Expenses to Average Net Assets Before Waivers and Reimbursements and Including Expenses not Subject to Cap(C) | | | Ratio of Expenses to Average Net Assets After Waivers and Reimbursements and Including Expenses not Subject to Cap(C) | | | Ratio of Expenses to Average Net Assets After Waivers and Reimbursements and Excluding Expenses not Subject to Cap(C) | | | Ratio of Net Investment Income (Loss) to Average Net Assets | | | | |
| | |
| 4.84 | % | | $ | 754,532 | | | | 1.22 | % | | | 1.22 | % | | | 1.22 | % | | | 0.06 | % | | | 121 | % |
| 3.96 | | | | 27,884 | | | | 2.13 | | | | 2.04 | | | | 2.04 | | | | (1.32 | ) | | | – | |
| 4.10 | | | | 128,016 | | | | 1.92 | | | | 1.92 | | | | 1.92 | | | | (1.20 | ) | | | – | |
| 5.14 | | | | 791,091 | | | | 0.92 | | | | 0.92 | | | | 0.92 | | | | (0.22 | ) | | | – | |
| 4.62 | | | | 13,444 | | | | 1.48 | | | | 1.45 | | | | 1.45 | | | | (0.74 | ) | | | – | |
| 4.92 | | | | 36,249 | | | | 1.16 | | | | 1.15 | | | | 1.15 | | | | (0.43 | ) | | | – | |
| 5.22 | | | | 14,132 | | | | 0.86 | | | | 0.85 | | | | 0.85 | | | | (0.15 | ) | | | – | |
| 5.32 | | | | 98,278 | | | | 0.76 | | | | 0.76 | | | | 0.76 | | | | (0.04 | ) | | | – | |
| | |
| | |
| 19.77 | | | | 431,465 | | | | 1.35 | | | | 1.32 | | | | 1.32 | | | | (0.57 | ) | | | 115 | |
| 18.84 | | | | 34,559 | | | | 2.18 | | | | 2.07 | | | | 2.07 | | | | (1.33 | ) | | | – | |
| 19.07 | | | | 156,903 | | | | 1.95 | | | | 1.95 | | | | 1.95 | | | | (1.21 | ) | | | – | |
| 20.23 | | | | 495,439 | | | | 0.93 | | | | 0.93 | | | | 0.93 | | | | (0.22 | ) | | | – | |
| 19.56 | | | | 10,772 | | | | 1.49 | | | | 1.49 | | | | 1.49 | | | | (0.77 | ) | | | – | |
| 19.93 | | | | 42,770 | | | | 1.17 | | | | 1.17 | | | | 1.17 | | | | (0.44 | ) | | | – | |
| 20.34 | | | | 14,203 | | | | 0.87 | | | | 0.87 | | | | 0.87 | | | | (0.14 | ) | | | – | |
| 20.44 | | | | 136,662 | | | | 0.77 | | | | 0.77 | | | | 0.77 | | | | (0.04 | ) | | | – | |
| | |
| | |
| 11.24 | | | | 746,980 | | | | 1.47 | | | | 1.24 | | | | 1.24 | | | | 0.11 | | | | 137 | |
| 10.62 | | | | 36,371 | | | | 2.36 | | | | 1.84 | | | | 1.84 | | | | (0.53 | ) | | | – | |
| 10.32 | | | | 173,788 | | | | 2.04 | | | | 2.04 | | | | 2.04 | | | | (0.72 | ) | | | – | |
| 11.58 | | | | 360,198 | | | | 0.99 | | | | 0.99 | | | | 0.99 | | | | 0.23 | | | | – | |
| 10.95 | | | | 8,468 | | | | 1.55 | | | | 1.55 | | | | 1.55 | | | | (0.28 | ) | | | – | |
| 11.36 | | | | 35,421 | | | | 1.21 | | | | 1.21 | | | | 1.21 | | | | 0.05 | | | | – | |
| 11.62 | | | | 11,967 | | | | 0.92 | | | | 0.92 | | | | 0.92 | | | | 0.20 | | | | – | |
| 11.81 | | | | 172,228 | | | | 0.80 | | | | 0.80 | | | | 0.80 | | | | 0.50 | | | | – | |
| | |
| | |
| (44.66 | ) | | | 1,145,281 | | | | 1.31 | | | | 1.31 | | | | 1.31 | | | | (0.19 | ) | | | 142 | |
| (45.07 | ) | | | 38,167 | | | | 2.13 | | | | 2.05 | | | | 2.05 | | | | (0.93 | ) | | | – | |
| (44.97 | ) | | | 201,128 | | | | 1.93 | | | | 1.93 | | | | 1.93 | | | | (0.81 | ) | | | – | |
| (44.35 | ) | | | 118,918 | | | | 0.86 | | | | 0.86 | | | | 0.86 | | | | 0.25 | | | | – | |
| (44.77 | ) | | | 5,391 | | | | 1.52 | | | | 1.52 | | | | 1.52 | | | | (0.39 | ) | | | – | |
| (44.60 | ) | | | 19,129 | | | | 1.19 | | | | 1.19 | | | | 1.19 | | | | (0.08 | ) | | | – | |
| (44.41 | ) | | | 3,169 | | | | 0.93 | | | | 0.93 | | | | 0.93 | | | | 0.22 | | | | – | |
| (44.38 | ) | | | 133,048 | | | | 0.78 | | | | 0.78 | | | | 0.78 | | | | 0.34 | | | | – | |
| | |
| | |
| 40.39 | (G) | | | 989,969 | | | | 1.42 | | | | 1.31 | | | | 1.31 | | | | (0.12 | ) | | | 120 | |
| 39.29 | (G) | | | 56,396 | | | | 2.18 | | | | 2.11 | | | | 2.11 | | | | (0.88 | ) | | | – | |
| 39.40 | (G) | | | 201,274 | | | | 1.98 | | | | 1.98 | | | | 1.98 | | | | (0.82 | ) | | | – | |
| 40.89 | (G) | | | 40,678 | | | | 0.86 | | | | 0.86 | | | | 0.86 | | | | 0.09 | | | | – | |
| 33.31 | (I) | | | 322 | | | | 1.58 | (J) | | | 1.58 | (J) | | | 1.58 | (J) | | | (0.69 | ) (J) | | | – | |
| 33.82 | (I) | | | 3,402 | | | | 1.23 | (J) | | | 1.23 | (J) | | | 1.23 | (J) | | | (0.18 | ) (J) | | | – | |
| 34.03 | (I) | | | 81 | | | | 0.92 | (J) | | | 0.92 | (J) | | | 0.92 | (J) | | | 0.01 | (J) | | | – | |
| 41.07 | (G) | | | 138,065 | | | | 0.80 | | | | 0.80 | | | | 0.80 | | | | 0.53 | | | | – | |
|
The Board of Directors and Shareholders of |
The Hartford Mutual Funds II, Inc. |
We have audited the accompanying statement of assets and liabilities, including the schedule of investments, of The Hartford Growth Opportunities Fund (one of the portfolios constituting The Hartford Mutual Funds II, Inc. (the Funds)) as of October 31, 2011, and the related statement of operations for the year then ended, the statements of changes in net assets for each of the two years in the period then ended, and the financial highlights for each of the five years in the period then ended. These financial statements and financial highlights are the responsibility of the Funds’ management. Our responsibility is to express an opinion on these financial statements and financial highlights based on our audits.
We conducted our audits in accordance with the standards of the Public Company Accounting Oversight Board (United States). Those standards require that we plan and perform the audit to obtain reasonable assurance about whether the financial statements and financial highlights are free of material misstatement. We were not engaged to perform an audit of the Funds’ internal control over financial reporting. Our audits included consideration of internal control over financial reporting as a basis for designing audit procedures that are appropriate in the circumstances, but not for the purpose of expressing an opinion on the effectiveness of the Funds’ internal control over financial reporting. Accordingly, we express no such opinion. An audit also includes examining, on a test basis, evidence supporting the amounts and disclosures in the financial statements and financial highlights, assessing the accounting principles used and significant estimates made by management, and evaluating the overall financial statement presentation. Our procedures included confirmation of securities owned as of October 31, 2011, by correspondence with the custodian and brokers or by other appropriate auditing procedures where replies from brokers were not received. We believe that our audits provide a reasonable basis for our opinion.
In our opinion, the financial statements and financial highlights referred to above present fairly, in all material respects, the financial position of The Hartford Growth Opportunities Fund of The Hartford Mutual Funds II, Inc. at October 31, 2011, the results of its operations for the year then ended, the changes in its net assets for each of the two years in the period then ended, and the financial highlights for each of the five years in the period then ended, in conformity with U.S. generally accepted accounting principles.
Minneapolis, MN
December 16, 2011
|
Directors and Officers (Unaudited) |
The Board of Directors of the Company appoints officers who are responsible for the day-to-day operations of the Fund and who execute policies formulated by the Directors. Each director serves until his or her death, resignation, or retirement or until the next annual meeting of shareholders is held or until his or her successor is elected and qualifies.
Directors and officers who are employed by or who have a financial interest in The Hartford are considered “interested” persons of the Fund pursuant to the 1940 Act. Each officer and two of the Company’s directors, as noted in the chart below, are “interested” persons of the Fund. Each director serves as a director for The Hartford Mutual Funds, Inc., The Hartford Mutual Funds II, Inc., Hartford Series Fund, Inc., and Hartford HLS Series Fund II, Inc., and as a trustee for The Hartford Alternative Strategies Fund, which, as of October 31, 2011, collectively consist of 91 funds. Correspondence may be sent to directors and officers c/o Hartford Mutual Funds, P.O. Box 2999, Hartford, Connecticut 06104-2999, except that correspondence to Ms. Fagely may be sent to 500 Bielenberg Drive, Woodbury, Minnesota 55125.
The table below sets forth, for each director and officer, his or her name, year of birth, current position with the Company and date first elected or appointed to The Hartford Mutual Funds, Inc. (“MF”) and The Hartford Mutual Funds II, Inc. (“MF2”), principal occupation, and, for directors, other directorships held. The Fund’s statement of additional information contains further information on the directors and is available free of charge by calling 1-888-843-7824 or writing to Hartford Mutual Funds, P.O. Box 64387, St. Paul, MN 55164-0387.
Information on the aggregate remuneration paid to the directors of the Company can be found in the Statement of Operations herein. The Fund pays to The Hartford a portion of the Chief Compliance Officer’s compensation, but does not pay salaries or compensation to any of its other officers or directors who are employed by The Hartford.
Non-Interested Directors
Lynn S. Birdsong (1946) Director since 2003, Co-Chairman of the Investment Committee
Mr. Birdsong is a private investor. Mr. Birdsong currently serves as a Director of the Sovereign High Yield Investment Company (April 2010 to current). Mr. Birdsong currently serves as an Independent Director of Nomura Partners Funds, Inc. (formerly, The Japan Fund) (March 2003 to current). From 2003 to March 2005, Mr. Birdsong was an independent director of the Atlantic Whitehall Funds. From 1979 to 2002, Mr. Birdsong was a managing director of Zurich Scudder Investments, an investment management firm. During his employment with Scudder, Mr. Birdsong was an Interested Director of The Japan Fund. Since 1981, Mr. Birdsong has been a partner in Birdsong Company, an advertising specialty firm.
Robert M. Gavin, Jr. (1940) Director since 2002 (MF) and 1986 (MF2), Chairman of the Board since 2004
Dr. Gavin is an educational consultant. Prior to September 1, 2001, he was President of Cranbrook Education Community and prior to July 1996, he was President of Macalester College, St. Paul, Minnesota.
Duane E. Hill (1945) Director since 2001 (MF) and 2002 (MF2), Chairman of the Nominating Committee
Mr. Hill is Partner of TSG Ventures L.P., a private equity investment company. Mr. Hill is a former partner of TSG Capital Group, a private equity investment firm that served as sponsor and lead investor in leveraged buyouts of middle market companies.
Sandra S. Jaffee (1941) Director since 2005
Ms. Jaffee served as Chairman (2008 to 2009) and Chief Executive Officer of Fortent (formerly Searchspace Group), a leading provider of compliance/regulatory technology to financial institutions from August 2005 to August 2009. From August 2004 to August 2005, Ms. Jaffee served as an Entrepreneur in Residence with Warburg Pincus, a private equity firm. From September 1995 to July 2004, Ms. Jaffee served as Executive Vice President at Citigroup, where she was President and Chief Executive Officer of Citibank’s Global Securities Services (1995 to 2003). Ms. Jaffe currently serves as a member of the Board of Directors of Broadridge Financial Solutions as well as a Trustee of Muhlenberg College.
William P. Johnston (1944) Director since 2005, Chairman of the Compliance Committee
In June 2006, Mr. Johnston was appointed as Senior Advisor to The Carlyle Group, a global private equity investment firm. In August 2007, Mr. Johnston was elected to the Board of Directors of LifeCare Holdings, Inc. In February 2008, Mr. Johnston was elected to the Board of Directors of HCR-ManorCare, Inc. In May 2006, Mr. Johnston was elected to the Supervisory Board of Fresenius Medical Care AG & Co. KGaA, after its acquisition of Renal Care Group, Inc. in March 2006. Mr. Johnston joined Renal Care Group in November 2002 as a member of the Board of Directors and served as Chairman of the Board from March 2003 through March 2006. Mr. Johnston served as a Director of MultiPlan, Inc. from July 2006 through August 2010. From September 1987 to December 2002, Mr. Johnston was with Equitable Securities Corporation (and its successors, SunTrust Equitable Securities and SunTrust Robinson Humphrey) serving in various investment banking and managerial positions, including Managing Director and Head of Investment Banking, Chief Executive Officer and Vice Chairman.
The Hartford Growth Opportunities Fund |
Directors and Officers (Unaudited) – (continued) |
Phillip O. Peterson (1944) Director since 2002, (MF) and 2000 (MF2), Chairman of the Audit Committee
Mr. Peterson is a mutual fund industry consultant. He was a partner of KPMG LLP (an accounting firm) until July 1999. Mr. Peterson joined William Blair Funds in February 2007 as a member of the Board of Trustees. From January 2004 to April 2005, Mr. Peterson served as Independent President of the Strong Mutual Funds.
Lemma W. Senbet (1946) Director since 2005
Dr. Senbet is the William E. Mayer Chair Professor of Finance and Director, Center for Financial Policy, at the University of Maryland, Robert H. Smith School of Business. He was chair of the Finance Department from 1998 to 2006. Previously he was a chaired professor of finance at the University of Wisconsin-Madison. Also, he was director of the Fortis Funds from March 2000 to July 2002. Dr. Senbet served the finance profession in various capacities, including as director of the American Finance Association and President of the Western Finance Association. In 2006, Dr. Senbet was inducted Fellow of Financial Management Association International for his career-long distinguished scholarship and professional service.
Interested Directors and Officers
David N. Levenson (1966) Director since 2010
Mr. Levenson currently serves as President of The Hartford’s Wealth Management business. He was appointed to this role in July 2010. Previously, Mr. Levenson served as Executive Vice President of Legacy Holdings for The Hartford from June 2009 to July 2010. From 2006 to 2009, Mr. Levenson was with Hartford Life Insurance K.K. where he served as President and Chief Executive Officer from 2007 to 2009. He served as Managing Director of Hartford Investment Management Company from 2005 to 2006. Additionally, Mr. Levenson serves as Executive Vice President of The Hartford and as President, Director and Chief Executive Officer of Hartford Life Insurance Company (“HLIC”) and Hartford Life, Inc. (“HL Inc.”).
Lowndes A. Smith (1939) Director since 1996, (MF) and 2002 (MF2), Co-Chairman of the Investment Committee
Mr. Smith served as Vice Chairman of The Hartford from February 1997 to January 2002, as President and Chief Executive Officer of HL Inc. from February 1997 to January 2002, and as President and Chief Operating Officer of The Hartford Life Insurance Companies from January 1989 to January 2002. Mr. Smith serves as a Director of White Mountains Insurance Group, Ltd., One Beacon Insurance and Symetra Financial and as a Managing Director of Whittington Gray Associates.
Other Officers
James E. Davey (1964) President and Chief Executive Officer since 2010
Mr. Davey serves as Executive Vice President of HLIC. Additionally, Mr. Davey serves as President, Chief Executive Officer and Manager of HIFSCO and President, Chief Executive Officer and Manager of HL Investment Advisors, LLC (“HL Advisors”). Mr. Davey joined The Hartford in 2002.
Michael R. Dressen (1963) AML Compliance Officer since 2011
Mr. Dressen currently serves as Assistant Vice President of HLIC. He also serves as Chief Compliance Officer and AML Compliance Officer of Hartford Administrative Services Company (“HASCO”) and as Assistant Secretary and Compliance Officer of HIFSCO. Mr Dressen joined The Hartford in 2005 from State Farm Insurance Companies where he held various positions related to mutual funds, variable products, and property casualty insurance.
Tamara L. Fagely (1958) Vice President, Controller and Treasurer since 2002 (MF) and 1993 (MF2)
Ms. Fagely has been a Vice President of HASCO since 1998 and Chief Financial Officer since 2006. Currently Ms. Fagely is a Vice President of HLIC. She served as Assistant Vice President of HLIC from December 2001 through March 2005. In addition, Ms. Fagely is Controller and Chief Financial Officer of HIFSCO.
Dr. Robert J. Froehlich (1953) Senior Managing Director since 2009
Dr. Froehlich joined The Hartford as Senior Managing Director in September 2009. Prior to joining The Hartford, Dr. Froehlich served as Vice Chairman of Deutsche Asset Management from 1997-2009.
Edward P. Macdonald (1967) Vice President, Secretary and Chief Legal Officer since 2005
Mr. Macdonald serves as Vice President of HLIC and Chief Legal Officer of Mutual Funds and Vice President of HIFSCO. He also serves as Vice President and Secretary of HASCO, and Chief Legal Officer, Secretary and Vice President of HL Advisors. Mr. Macdonald joined The Hartford in 2005.
Vernon J. Meyer (1964) Vice President since 2006
Mr. Meyer serves as Senior Vice President of HLIC. He also serves as Senior Vice President of HIFSCO and HL Advisors. Mr. Meyer joined The Hartford in 2004.
Colleen B. Pernerewski (1969) Vice President and Chief Compliance Officer since 2010
Ms. Pernerewski serves as Vice President and Chief Investment Advisor Compliance Officer of HIFSCO and as Vice President and Chief Compliance Officer of HL Advisors. Ms. Pernerewski joined The Hartford in 2005 from Travelers Life and Annuity where she served as Counsel (2004-2005). Prior to Travelers Life and Annuity, Ms. Pernerewski held the position of Counsel at The Hartford (1998-2004).
Elizabeth L. Schroeder (1966) Vice President since 2010
Ms. Schroeder currently serves as Assistant Vice President of HLIC. Ms. Schroeder joined HLIC in 1991. She is also an Assistant Vice President of HASCO, HIFSCO and HL Advisors.
Martin Swanson (1962) Vice President since 2010
Mr. Swanson is a Vice President of HLIC. Mr. Swanson also serves as Vice President/Marketing for HIFSCO. Prior to joining HLIC in 1998, Mr. Swanson was a Vice President at PaineWebber, Inc.
Jane Wolak (1961) Vice President since 2009
Ms. Wolak currently serves as Senior Vice President of HLIC. Ms. Wolak joined HLIC as Vice President, Retail Product Services in May 2007. She is also Vice President of HASCO. Previously, Ms. Wolak was with Sun Life Financial where she held the position of Vice President, Service Center Operations from 2001-2007.
A description of the policies and procedures that the Fund uses to determine how to vote proxies relating to portfolio securities and a record of how the Fund voted any proxies for the twelve-month period ended June 30, 2011 are available (1) without charge, upon request, by calling 888-843-7824 and (2) on the SEC’s website at http://www.sec.gov.
The Fund files a complete schedule of portfolio holdings with the SEC for the first and third quarters of each fiscal year on Form N-Q. The Fund’s Forms are available (1) without charge, upon request, by calling 888-843-7824 and (2) on the SEC’s website at http://www.sec.gov. The Form N-Q may be reviewed and copied at the SEC’s Public Reference Room in Washington, DC. Information on the operation of the Public Reference Room may be obtained by calling 1-800-SEC-0330.
|
Federal Tax Information (Unaudited) |
For the fiscal year ended October 31, 2011, there is no further federal tax information required for this Fund.
|
Expense Example (Unaudited) |
Your Fund's Expenses
As a shareholder of the Fund, you incur two types of costs: (1) transaction costs, including sales charges (loads) on purchase payments and contingent deferred sales charges (CDSC) and (2) ongoing costs, including investment management fees, distribution fees, and other fund expenses. This example is intended to help you understand your ongoing costs (in dollars) of investing in the Fund and to compare these costs with the ongoing costs of investing in other mutual funds. The example is based on an investment of $1,000 invested at the beginning of the period and held for the period of April 30, 2011 through October 31, 2011.
Actual Expenses
The first set of columns of the table below provides information about actual account values and actual expenses. You may use the information in this column, together with the amount you invested, to estimate the expenses that you paid over the period. Simply divide your account value by $1,000 (for example, an $8,600 account value divided by $1,000 = 8.6), then multiply the result by the number in the line under the heading entitled “Expenses Paid During Period” to estimate the expenses you paid on your account during this period.
Hypothetical Example for Comparison Purposes
The second set of columns of the table below provides information about hypothetical account values and hypothetical expenses based on the Fund's actual expense ratio and an assumed rate of return of 5% per year before expenses, which is not the Fund's actual return. The hypothetical account values and expenses may not be used to estimate the actual ending account balance or expenses you paid for the period. You may use this information to compare the ongoing costs of investing in the Fund and other funds. To do so, compare this 5% hypothetical example with the 5% hypothetical examples that appear in the shareholder reports of the other funds.
Please note that the expenses shown in the table are meant to highlight your ongoing costs only and do not reflect any transactional costs, such as sales charges (loads) and CDSC. Therefore, the second set of columns of the table is useful in comparing ongoing costs only, and will not help you determine the relative total costs of owning different funds. In addition, if these transactional costs were included, your costs would be higher. Expenses are equal to the Fund's annualized expense ratios multiplied by average account value over the period, multiplied by 184/365 (to reflect the one-half year period).
| | | Actual return | | | Hypothetical (5% return before expenses) | | | | | | | | | | |
| | | Beginning Account Value April 30, 2011 | | | Ending Account Value October 31, 2011 | | | Expenses paid during the period April 30, 2011 through October 31, 2011 | | | Beginning Account Value April 30, 2011 | | | Ending Account Value October 31, 2011 | | | Expenses paid during the period April 30, 2011 through October 31, 2011 | | | | | | | | | | |
| Class A | | $ | 1,000.00 | | | $ | 869.50 | | | $ | 5.70 | | | $ | 1,000.00 | | | $ | 1,019.11 | | | $ | 6.16 | | | | 1.21 | % | | | 184 | | | | 365 | |
| Class B | | $ | 1,000.00 | | | $ | 866.20 | | | $ | 9.47 | | | $ | 1,000.00 | | | $ | 1,015.05 | | | $ | 10.23 | | | | 2.01 | | | | 184 | | | | 365 | |
| Class C | | $ | 1,000.00 | | | $ | 867.00 | | | $ | 9.00 | | | $ | 1,000.00 | | | $ | 1,015.57 | | | $ | 9.71 | | | | 1.91 | | | | 184 | | | | 365 | |
| Class I | | $ | 1,000.00 | | | $ | 871.00 | | | $ | 4.44 | | | $ | 1,000.00 | | | $ | 1,020.45 | | | $ | 4.80 | | | | 0.94 | | | | 184 | | | | 365 | |
| Class R3 | | $ | 1,000.00 | | | $ | 868.80 | | | $ | 6.83 | | | $ | 1,000.00 | | | $ | 1,017.90 | | | $ | 7.38 | | | | 1.45 | | | | 184 | | | | 365 | |
| Class R4 | | $ | 1,000.00 | | | $ | 870.20 | | | $ | 5.42 | | | $ | 1,000.00 | | | $ | 1,019.41 | | | $ | 5.85 | | | | 1.15 | | | | 184 | | | | 365 | |
| Class R5 | | $ | 1,000.00 | | | $ | 871.50 | | | $ | 4.01 | | | $ | 1,000.00 | | | $ | 1,020.92 | | | $ | 4.33 | | | | 0.85 | | | | 184 | | | | 365 | |
| Class Y | | $ | 1,000.00 | | | $ | 872.00 | | | $ | 3.52 | | | $ | 1,000.00 | | | $ | 1,021.44 | | | $ | 3.80 | | | | 0.75 | | | | 184 | | | | 365 | |
|
Approval of Investment Management and Investment Sub-Advisory Agreements (Unaudited) |
Section 15(c) of the Investment Company Act of 1940, as amended (the “1940 Act”), requires that each mutual fund’s board of directors, including a majority of those directors who are not “interested persons” of the mutual fund, as defined in the 1940 Act (the “Independent Directors”), annually review and consider the continuation of the mutual fund’s investment advisory and sub-advisory agreements. At its meeting held on August 2-3, 2011, the Board of Directors (the “Board”) of The Hartford Mutual Funds II, Inc., including each of the Independent Directors, unanimously voted to approve the continuation of the investment management agreement for The Hartford Growth Opportunities Fund (the “Fund”) with Hartford Investment Financial Services, LLC (“HIFSCO”) and the continuation of the investment sub-advisory agreement between HIFSCO and the Fund’s sub-adviser, Wellington Management Company, LLP (the “Sub-adviser,” and together with HIFSCO, the “Advisers”) (collectively, the “Agreements”).
In the months preceding the August 2-3, 2011 meeting, the Board requested, received, and reviewed written responses from the Advisers to questions posed to them on behalf of the Independent Directors and supporting materials relating to those questions and responses. The Board considered information furnished to the Board at its meetings throughout the year, as well as information specifically prepared in connection with the annual approval of the Agreements at the Board’s meetings held on June 21-22, 2011 and August 2-3, 2011. Information provided to the Board at its meetings throughout the year included, among other things, reports on Fund performance, legal and compliance matters, sales and marketing activity, shareholder services, and the other services provided to the Fund by the Advisers and their affiliates. In addition, the Board received in-person presentations by Fund officers and representatives of HIFSCO at the Board’s meetings on June 21-22, 2011 and August 2-3, 2011 concerning the Agreements.
The Independent Directors, advised by independent legal counsel, engaged two service providers to assist them with evaluating the Agreements with respect to the Fund. Lipper Inc. (“Lipper”), an independent provider of investment company data, was retained to provide the Board with reports on how the Fund’s contractual management fees, actual management fees, other non-management fees, overall expense ratios and investment performance compared to those of mutual funds with similar investment objectives. The Independent Directors also engaged an independent financial services consulting firm (the “Consultant”) to assist them in evaluating the Fund’s management fees, sub-advisory fees, other non-management fees, overall expense ratios and investment performance. In addition, the Consultant reviewed the profitability calculations utilized by HIFSCO in connection with the continuation of the investment management agreement.
In determining to continue the Agreements for the Fund, the members of the Board reviewed and evaluated information and factors they believed to be relevant and appropriate in light of the information that the Board deemed necessary and appropriate through the exercise of their reasonable business judgment. While individual members of the Board may have weighed certain factors differently, the Board’s determination to continue the Agreements was based on a comprehensive consideration of all information provided to the Board throughout the year and specifically with respect to the continuation of the Agreements. A more detailed discussion of the factors the Board considered with respect to its approval of the Agreements is provided below.
Nature, Extent, And Quality Of Services Provided by the Advisers
The Board requested and considered information concerning the nature, extent, and quality of the services provided to the Fund by the Advisers. The Board considered, among other things, the terms of the Agreements and the range of services provided by the Advisers. The Board considered the Advisers’ professional personnel who provide services to the Fund, including each Adviser’s ability and experience in attracting and retaining qualified personnel to service the Fund. The Board considered each Adviser’s reputation and overall financial strength, as well as its willingness to consider and implement organizational and operational changes designed to improve services to the Fund. In addition, the Board considered the quality of each Adviser’s communications with the Board and responsiveness to Board inquiries.
The Board also requested and evaluated information concerning each Adviser’s regulatory and compliance environment. In this regard, the Board requested and reviewed information on each Adviser’s compliance policies and procedures, compliance history, and a report from the Fund’s Chief Compliance Officer on each Adviser’s compliance with applicable laws and regulations, including responses to regulatory developments and compliance issues raised by regulators. The Board also noted the Advisers’ support of the Fund’s compliance control structure, particularly the resources devoted by the Advisers in support of the Fund’s obligations pursuant to Rule 38a-1 under the 1940 Act.
With respect to HIFSCO, the Board noted that under the Agreements, HIFSCO is responsible for the management of the Fund, including overseeing fund operations and service providers, and provides administration services to the Fund as well as investment advisory services in connection with selecting, monitoring and supervising the Sub-adviser. The Board considered HIFSCO’s ongoing monitoring of people, process and performance, including its quarterly reviews of each of the Hartford Mutual Funds, semi-annual meetings with the leaders of each Fund’s portfolio management team, and oversight of the Funds’ 74 portfolio managers. The Board recognized that HIFSCO has demonstrated a record of making changes to the management and/or strategies of the Funds when warranted. The Board considered HIFSCO’s oversight of the Sub-adviser’s investment approach and results, process for monitoring best execution of portfolio trades by the Sub-adviser, and approach to risk management with respect to the Fund and the service providers to the Fund. The Board also considered HIFSCO’s oversight of compliance with the Fund’s objective and policies as well as with applicable laws and regulations, noting that regulatory and other developments had over time led to an increase in the scope of HIFSCO’s services in this regard.
In addition, the Board considered HIFSCO’s ongoing commitment to review and rationalize the Hartford fund family’s product line-up and the expenses that HIFSCO had incurred in connection with fund combinations in recent years. The Board considered that HIFSCO or its affiliates are responsible for providing the Fund’s officers.
With respect to the Sub-adviser, who provides day-to-day portfolio management services, the Board considered the quality of the Fund’s portfolio managers, the Sub-adviser’s other investment personnel, its investment philosophy and process, investment research capabilities and resources, performance record, trade execution capabilities and experience. The Board considered the experience of the Fund’s portfolio managers, the number of accounts managed by the portfolio managers, and the Sub-adviser’s method for compensating the portfolio managers.
Based on these considerations, the Board concluded that it was satisfied with the nature, extent and quality of the services provided to the Fund by HIFSCO and the Sub-adviser.
Performance of the Fund and the Advisers
The Board considered the investment performance of the Fund. In this regard, the Board reviewed the performance of the Fund over different time periods presented in the materials and evaluated HIFSCO’s analysis of the Fund’s performance for these time periods. The Board considered information and materials provided to the Board by the Advisers concerning Fund performance, as well as information from Lipper comparing the investment performance of the Fund to an appropriate benchmark and universe of peer funds. The Board noted that the performance of the Fund was within expectations.
The Board considered the detailed investment analytics reports provided by The Hartford’s Investment Advisory Group throughout the year. These reports include, among other things, information on the Fund’s gross and net returns, the Fund’s investment performance relative to an appropriate benchmark and peer group, various statistics concerning the Fund’s portfolio, and a narrative summary of various factors affecting Fund performance. The Board considered the Advisers’ cooperation with the Investment Committee, which assists the Board in evaluating the performance of the Fund at periodic meetings throughout the year. The Board also considered the analysis provided by the Consultant relating to the Fund’s performance track record.
In light of all the considerations noted above, the Board concluded that it had continued confidence in HIFSCO’s and the Sub-adviser’s overall capabilities to manage the Fund.
Costs of the Services and Profitability of the Advisers
The Board reviewed information regarding HIFSCO’s cost to provide investment management and related services to the Fund and HIFSCO’s profitability, both overall and for the Fund, on a pre-tax basis without regard to distribution expenses. The Board also requested and reviewed information about the profitability to HIFSCO and its affiliates from all services provided to the Fund and all aspects of their relationship with the Fund. The Board also requested and received information relating to the operations and profitability of the Sub-adviser.
The Board considered the Consultant’s review of the profitability calculations utilized by HIFSCO in connection with the continuation of the investment management agreement. In this regard, the Consultant reported that The Hartford’s process for calculating and reporting Fund profitability is reasonable, sound and well within common industry practice.
| The Hartford Growth Opportunities Fund |
Approval of Investment Management and Investment Sub-Advisory Agreements (Unaudited) –(continued) |
Based on these considerations, the Board concluded that the profits anticipated to be realized by the Advisers and their affiliates from their relationships with the Fund would not be excessive.
Comparison of Fees and Services Provided by the Advisers
The Board considered comparative information with respect to the management fees to be paid by the Fund to HIFSCO and the total expense ratios of the Fund. The Board also considered comparative information with respect to the sub-advisory fees to be paid by HIFSCO to the Sub-adviser, to the extent applicable. In this regard, the Board requested and reviewed information from HIFSCO and the Sub-adviser relating to the management and sub-advisory fees, including the sub-advisory fee schedule for the Fund, and total operating expenses for the Fund. The Board also reviewed information from Lipper comparing the Fund’s contractual management fees, actual management fees and overall expense ratios relative to a group of funds selected by Lipper, in consultation with the Consultant, and a broader universe of funds selected by Lipper. The Board considered that HIFSCO had recently lowered the contractual expense limitations for the Fund’s Class A, Class B, Class C and Class I shares by 0.15%.
While the Board recognized that comparisons between the Fund and peer funds are imprecise, given the differing service levels and characteristics of mutual funds and the different business models and cost structures of the Advisers, the comparative information provided by Lipper assisted the Board in evaluating the reasonableness of the Fund’s management and sub-advisory fees and total operating expenses. In addition, the Board considered the analysis and recommendations of the Consultant relating to the Fund’s management and sub-advisory fees and total operating expenses.
Based on these considerations, the Board concluded that the Fund’s fees and total operating expenses, in conjunction with the information about quality of services, profitability, economies of scale, and other matters discussed, were reasonable in light of the services provided.
Economies of Scale
The Board requested and considered information regarding the Advisers’ realization of economies of scale with respect to the Fund and whether the fee levels reflect these economies of scale for the benefit of the Fund’s investors. With respect to HIFSCO, the Board considered representations from HIFSCO that it is difficult to anticipate whether and to what extent economies may be realized by HIFSCO as assets grow over time. The Board reviewed the breakpoints in the management fee schedule for the Fund, which reduces fee rates as Fund assets grow over time. The Board recognized that a fund with assets beyond the last breakpoint level will continue to benefit from economies of scale because additional assets are charged the lowest breakpoint fee resulting in lower overall effective management fee rates. The Board also considered that expense limitations and fee waivers that reduce the Fund’s expenses at all asset levels can have the same effect as breakpoints in sharing economies of scale with shareholders and provide protection from an increase in expenses if Fund assets decline. The Board recognized that a fee schedule that reaches a lower breakpoint quickly provides shareholders with the benefit of anticipated or potential economies of scale. The Board also considered that HIFSCO has been active in managing expenses, which has resulted in benefits being realized by shareholders as assets within the Hartford fund family have grown over time, including through lower transfer agent costs and other operating expenses.
The Board reviewed and evaluated materials from Lipper showing how management fee schedules of peer funds reflect economies of scale for the benefit of investors as a peer fund’s assets hypothetically increase over time. Based on information provided by HIFSCO, Lipper, and the Consultant, the Board recognized that there is no uniform methodology for establishing breakpoints or uniform pattern in asset levels that trigger breakpoints or the amounts of breakpoints triggered.
After considering all of the information available to it, the Board concluded that it was satisfied with the extent to which economies of scale would be shared for the benefit of the Fund’s shareholders based on currently available information and the effective advisory fees and expense ratios for the Fund at its current and reasonably anticipated asset levels. The Board noted, however, that it would continue to monitor future growth in Fund assets and the appropriateness of additional breakpoints.
Other Benefits
The Board considered other benefits to the Advisers and their affiliates from their relationships with the Fund.
The Board reviewed information noting that Hartford Life, Inc. (“Hartford Life”), an affiliate of HIFSCO, receives fees for fund accounting and related services from the Fund, and the Board considered information on expected profits to Hartford Life or its affiliates for such services. The Board also considered that Hartford Administrative Services Company (“HASCO”), the Fund’s transfer agent and an affiliate of HIFSCO, receives transfer agency compensation from the Fund, and the Board reviewed information on the expected profitability of the Fund’s transfer agency function to HASCO. The Board considered information provided by HASCO indicating that the transfer agent fees charged by HASCO to the Fund were fair and reasonable based on publicly available information.
The Board also considered that, as principal underwriter of the Fund, HIFSCO receives 12b-1 fees from the Fund and receives all or a portion of the sales charges on sales or redemptions of certain classes of shares. The Board also noted that certain affiliates of HIFSCO distribute shares of the Fund and receive compensation in that connection.
The Board considered benefits to the Sub-adviser from its use of the Fund’s brokerage commissions to obtain soft dollar research, and representations from HIFSCO and the Sub-adviser that the Sub-adviser would not make any revenue-sharing payments or any other type of distribution payments to HIFSCO or its affiliates.
The Board considered the benefits to shareholders of being part of the Hartford family of funds, including the right to exchange investments between the same class of funds without a sales charge, the ability to reinvest Fund dividends into other funds in the family, and the ability to combine holdings in the Fund with holdings in other funds to obtain a reduced sales charge. The Board considered HIFSCO’s efforts to provide investors in the family with a broad range of investment styles and asset classes and its entrepreneurial risk in initiating new funds to expand these opportunities for shareholders.
* * * *
Based upon its review of these various factors, among others, the Board concluded that it is in the best interests of the Fund and its shareholders for the Board to approve the Agreements for an additional year. In reaching this decision, the Board did not assign relative weights to the factors discussed above or deem any one or group of them to be controlling in and of themselves. In connection with their deliberations, the Independent Directors met separately in executive session on several occasions, with independent legal counsel, to review the relevant materials and consider their responsibilities under relevant laws and regulations.
A MESSAGE FROM DR. BOB FROEHLICH
Dear Shareholders:
All I can say is wow! From an investment perspective, this has been quite a tough year.
Old challenges seem to be lingering, such as the ongoing European sovereign debt crisis. While, here in the United States, we just can't seem to turn the corner on our weak housing market and even weaker employment market. As if these issues aren’t enough, we add the new challenge of the United States of America losing its prestigious "AAA" credit rating for the first time in the history of our country. I can’t remember a time when our markets faced this great a challenge from so many different fronts. While all of this negative news can seem daunting at times, there are also some bright spots. Although it’s almost impossible to predict with any degree of accuracy where our markets may be headed, let me share with you a few of the issues that I’m closely watching that make me more optimistic than most about the prospects for our market going forward.
RECORD EARNINGS
Let me begin with earnings, which from my perspective always have been and always will be the single most important thing to focus upon. I’m willing to bet that most U.S. investors have no idea just how strong corporate earnings and profits have been. While there are numerous ways to measure earnings and profits, one of my favorite ways is to look at profits as a percentage of the economy, especially when you want some historical comparison. Fortunately, the Bureau of Economic Analysis does this equation for us on a quarterly basis. For the second quarter of 2011 (the most recent data available) corporate profits accounted for 10.1% of our economy as measured by the GDP (Gross Domestic Product).
So just how good is that profits number? For starters, it’s the single highest profits number in my entire 34-year career. In case that isn’t impressive enough for any of you history buffs, I would add one more thing. The Bureau of Economic Analysis has been recording these quarterly profit numbers as a percentage of GDP since 1947. Our most recent number, which placed corporate profits at 10.1% of GDP, is the highest in the 64 years of tracking this data. Again, if you believe, as I do, that markets ultimately go wherever earnings take them, then you have to like what the future might hold for our stock market.
CORPORATE CASH & STRONG BALANCE SHEETS
The second thing that makes me somewhat optimistic about the future prospects for our markets is the current financial strength of corporate America. I know that you’ve heard the term that “corporate America is flush with cash.” Let me show you just how flush. The single best measure for corporate cash is one called “U.S. nonfinancial corporations liquid assets.” In the past two years this cash has increased $700 billion, bringing the total to more than $2 trillion. In the most recently released numbers for the second quarter of 2011, on a quarter-over-quarter basis, cash is up 19.2%. Corporate cash at a level above $2 trillion is the highest level ever recorded.
Now you know what it means when someone says “corporate America is flush with cash.” The good news about all that cash, from my perspective, is once corporate confidence returns and that cash goes in motion, it will help both our economy and our markets. Money in motion could go toward increasing mergers and acquisitions, dividends, share buybacks, capital spending to drive productivity, or even creating jobs. Regardless of what the ultimate use is, money in motion is good for our economy and our markets.
INSIDER BUYING
Let me move on to my third point that makes me optimistic: “insider buying.” When someone on Wall Street says “insiders,” they’re referring to company officers and directors that must disclose to the Securities and Exchange Commission through Form 4 filings whether they’re buying or selling their company’s stock. Research firm Argus-Vickers tracks this number for all publicly traded companies.
I believe when insiders are selling, it suggests that the stock may be too expensive, and the market expects too much from future earnings. Conversely, when insiders are buying, it suggests that insiders believe that their stock is too cheap, and the market is underestimating future earnings.
For more than the past decade, the average has been two insiders selling for every one that is buying. Think about what our stock market did over the past decade and you might realize that maybe these insiders are a pretty good indicator, as our markets just went through what many are calling “the lost decade,” referring to our flat stock market over the past 10 years. Currently, there’s only one insider selling for every two that are buying. Do they know something that we don't know? Only time will tell. One thing for sure is that officers and directors always focus on earnings, earnings, and earnings.
In closing, now more than ever, it’s critical that you work closely with your trusted financial professional, as I predict that our investment landscape will become even more challenging in the future. The volatility in our markets is probably here to stay— meaning it will be more difficult than ever before to try to remain a long-term investor in this short-term world in which we live. If you’re interested in my longer-term and short-term perspectives on our current markets, you can go to our website: www.hartfordinvestor.com/drbob to read my weekly investment commentary.
Dr. Bob Froehlich
Senior Managing Director
The Hartford Mutual Funds
PAST ECONOMIC AND INDEX PERFORMANCE DO NOT ENSURE FUTURE RESULTS.
Dr. Bob Froehlich’s sources of information include Bank of Canada, The Bank of England, Bank of Japan, Bloomberg News, Business Roundtable, China Investment Corporation, CIA. World Fact Book, CNBC, Congressional Budget Office, Deutsche Bank, The European Monetary Union, Federal Reserve Board, The Financial Times, Freddie Mac, FOX Business, Goldman Sachs, International Monetary Fund, International Strategy & Investment, Journal of Commerce, Merrill Lynch, PIERS Global Intelligence Solutions, Strategas Research, Thomson Reuters, Union Bank of Switzerland, U.S. Census Bureau, U.S. Department of Commerce, U.S. Department of Labor, U.S. State Department, U.S. Treasury Department, The Wall Street Journal, and The World Bank. This information is written in connection with the promotion or marketing of the matter(s) addressed in this material. The information cannot be used or relied upon for the purpose of avoiding IRS penalties. These materials are not intended to provide tax, accounting or legal advice. As with all matters of a tax or legal nature, you should consult your own tax or legal counsel for advice. You should carefully consider investment objectives, risks, and charges and expenses of The Hartford Mutual Funds before investing. This and other information can be found in the Fund’s prospectus or summary prospectus, which can be obtained from your investment representative or by calling 888-843-7824. Please read them carefully before you invest or send money. The Hartford Mutual Funds are underwritten and distributed by Hartford Investment Financial Services, LLC. “The Hartford” is The Hartford Financial Services Group, Inc., and its subsidiaries. MFAR-GO11 12/11 102949 Printed in U.S.A. ©2011 The Hartford, Hartford, CT 06155 | |
| | |
| | |
THE HARTFORD MUTUAL FUNDS 2011 Annual Report The Hartford Municipal Real Return Fund* *Prior to March 1, 2011, The Hartford Municipal Real Return Fund was known as The Hartford Tax-Free National Fund. |
A MESSAGE FROM THE PRESIDENT
Dear Fellow Shareholders:
I want to take this opportunity to say thank you for investing in The Hartford Mutual Funds.
This has been a tumultuous year. In the beginning of 2011, we witnessed tension-fueled political uprisings in the already-volatile Middle East and North Africa region. We also watched as Japan dealt with a series of crises including a massive earthquake and subsequent tsunami. Yet, U.S. economic conditions continued to improve, with gains in consumer confidence and retail sales. During the first half of 2011, domestic, international, and world indices (as measured by the S&P 500, MSCI EAFE and MSCI World) were all up more than 5% through June, 30 2011.
The economic recovery, however, lost momentum in the second half of 2011. The employment and housing markets both remain extremely challenged. Investors continue to be concerned about the implications of the European sovereign debt crisis, as well as our own high levels of domestic debt. Fears that the European sovereign debt crisis could continue to drag down the global economy have weighed heavily on stocks.
Ongoing apprehension regarding the U.S. debt ceiling during the summer, and the resulting downgrade of the U.S. sovereign credit rating by Standard & Poor’s, also contributed to weaker investor confidence.
There are, however, some reasons to remain confident. Corporations have record levels of cash on their balance sheets—corporate cash has doubled in the past 10 years. In addition, U.S. gross domestic product expanded at a 2.5 percent annual rate in the third quarter according to the Commerce Department, as consumers and businesses set aside fears about the recovery and stepped up spending. Corporate earnings have also remained positive, with a majority of companies beating expectations each quarter this year. This momentum will hopefully continue through the fourth quarter and into next year.
As we approach the end of 2011, in light of the continued market volatility, now would be a good time to schedule a meeting with your financial advisor to examine your current investment strategy and determine whether you are on the right track.
| | • Does your fixed-income portfolio complement your equity portfolio? |
| | • Are you receiving diversified sources of income? |
| | • Is your portfolio still in line with your risk tolerance and investment time horizon? |
Talk to your advisor to see what changes you should make to address these concerns and opportunities. Thank you again for investing with The Hartford Mutual Funds.
James Davey
President
The Hartford Mutual Funds
The Hartford Municipal Real Return Fund
(formerly The Hartford Tax-Free National Fund)
| Fund Performance (Unaudited) | 2 |
| Manager Discussion (Unaudited) | 3 |
| Financial Statements | |
| 6 |
| 13 |
| 14 |
| 15 |
| 16 |
| 17 |
| 28 |
| 30 |
| 31 |
| 33 |
| 33 |
| 34 |
| 35 |
| 36 |
The views expressed in the Fund’s Manager Discussion under ‘‘Why did the Fund perform this way?’’ and ‘‘What is the outlook?’’ are views of the Fund’s sub-adviser and portfolio management team through the end of the period and are subject to change based on market and other conditions.
The Hartford Municipal Real Return Fund inception 06/02/1986
(formerly The Hartford Tax-Free National Fund)
(sub-advised by Hartford Investment Management Company)
Investment objective – Seeks to provide current income exempt from federal income tax and after-tax inflation-adjusted total returns.
Performance Overview 10/31/01 - 10/31/11
The chart above shows the growth of a $10,000 investment in Class A which includes a sales charge. Growth results in classes other than Class A will vary from what is seen above due to differences in the expenses charged to those share classes.
Average Annual Total Returns (as of 10/31/11) |
| | 1 Year | 5 Year | 10 Year |
| Municipal Real Return A# | 1.28% | 0.50% | 2.82% |
| Municipal Real Return A## | -3.27% | -0.42% | 2.35% |
| Municipal Real Return B# | 0.54% | -0.23% | NA* |
| Municipal Real Return B## | -4.30% | -0.56% | NA* |
| Municipal Real Return C# | 0.43% | -0.25% | 2.07% |
| Municipal Real Return C## | -0.54% | -0.25% | 2.07% |
| Municipal Real Return I# | 1.53% | 0.76% | 2.95% |
| Municipal Real Return Y# | 1.54% | 0.74% | 3.07% |
| Barclays Capital Municipal Bond Index | 3.78% | 4.81% | 4.93% |
| # | Without sales charge |
| ## | With sales charge |
| * | Since inception returns are not applicable for Class B because after 8 years Class B converts to Class A. |
PAST PERFORMANCE IS NOT INDICATIVE OF FUTURE RESULTS.
The initial investment in Class A shares reflects the maximum sales charge and Classes B and C reflect a contingent deferred sales charge.
Total returns presented above were calculated using the Fund's net asset value available to shareholders for sale or redemption of Fund shares on October 31, 2011, which excludes investment transactions as of this date.
Effective 9/30/09, Class B shares of The Hartford Mutual Funds were closed to new investments.
Class A, B, C and Y shares commenced operations on 2/19/02. Class A and C share performance prior to that date reflects Class E and N share performance and operating expenses less Class A or C share sales charges, respectively. (Class E and N shares are no longer offered.) Class Y share performance prior to 2/19/02 reflects Class E share performance and operating expenses, adjusted to reflect that Class Y has no sales charges. Class I shares commenced operations on 5/31/07. Performance prior to that date is that of the Fund's Class A shares (excluding sales charges), which had different operating expenses.
Barclays Capital Municipal Bond Index is an unmanaged index of municipal bonds with maturities greater than two years.
You cannot invest directly in an index.
The chart represents a hypothetical investment in the Fund. Performance data represents past performance and current performance could be higher or lower.
The value of shares will fluctuate so that, when redeemed, shares may be worth more or less than their original cost. The chart and table do not reflect the deduction of taxes that a shareholder would pay on Fund distributions or the redemption of Fund shares.
Performance information may reflect historical or current expense waivers/reimbursements from the investment adviser, without which performance would have been lower. For information on current expense waivers/reimbursements, please see the prospectus.
The Hartford Municipal Real Return Fund (formerly The Hartford Tax-Free National Fund) |
| Manager Discussion (Unaudited) |
| October 31, 2011 |
| Portfolio Managers | | | | | |
| Ray Humphrey, CFA | James Ong, CFA | Christopher Bade | Joseph Darcy | | Luke Morosanu* |
| Senior Vice President | Vice President | Vice President | Executive Vice President | | Vice President |
| | | | | | |
How did the Fund perform?
The Class A shares of The Hartford Municipal Real Return Fund returned 1.28%, before sales charges, for the twelve-month period ended October 31, 2011, versus its benchmark, the Barclays Capital Municipal Bond Index, which returned 3.78%, and the 3.09% average return of the Lipper General Municipal Debt Funds category, a group of funds with investment strategies similar to those of the Fund.
Why did the Fund perform this way?
During the fiscal year, the municipal market and the Fund experienced two distinct periods of performance. During the early part of the year (Nov-Jan), tax-exempt rates moved aggressively higher (prices lower) amid the erosion of the strong technical foundation that supported the market for much of the prior years. Overblown credit fears, the expiration of the Build America Bond (BAB) provision of the stimulus bill, increased supply conditions, and forced selling in response to large mutual fund outflows contributed negatively to performance as tax-exempt rates rose and the curve shifted higher and steepened. Moreover, a litany of negative headlines regarding state and local governments’ budget deficits and pension problems caused some retail investors to pull money out of the market in late 2010 and early 2011. Further complicating market conditions at that time was the extension of the Bush era tax cuts for all income levels, which would potentially dampen demand for municipals in 2011.
However, the municipal market stabilized in late January and began to recover losses as investors adjusted to a new and what seemed to be more positive technical environment. After peaking in mid-January, tax-exempt rates consistently moved lower during the rest of the fiscal year (creating higher valuations) due to greater liquidity against lower supply. Fundamental conditions for municipal issuers continued to show signs of improvement as fiscal stresses eased due to increasing tax revenues and enacted fiscal austerity measures. Therefore, the scarcity value (i.e. additional value placed on an item due to its relatively low supply) in the market, coupled with lessening credit concerns and improving liquidity, helped support positive municipal performance for the year.
The Fund underperformed during the market selloff earlier in the period due to duration (i.e. sensitivity to changes in interest rates) and yield curve positioning out longer on the curve. Based on the aforementioned weakness in technicals at that time, the long end of the municipal yield curve and higher duration product severely underperformed. The Fund typically has longer duration than the benchmark and greater exposure to the long end of the curve for incremental income. However, in the second half of the year the Fund erased losses and recovered along with the market based mainly on security selection and the longer duration relative to the benchmark. Stronger technicals led to a flatter municipal yield curve resulting in the long end outperforming and contributing positively to performance.
Despite the volatility in municipal performance, the majority of the overall benchmark underperformance for the year came from the Fund’s negative returns on the inflation protection feature. Effective March 1, 2011, the Fund changed its investment strategy and name to The Hartford Municipal Real Return Fund (formerly The Hartford Tax-Free National Fund). The Fund now seeks to provide current income exempt from federal income tax and after-tax inflation-adjusted returns. As a result, the investment managers initiated purchases of zero coupon Consumer Price Index swaps in March as a hedge against inflation risk. The hedge purchased along the municipal curve effectively matched the duration weighted cash flows of the Fund.
Despite relatively high levels of current inflation, market expectations for inflation declined across the curve in response to declining growth expectations due to the political conflict over the debt ceiling, declining manufacturing orders and increasing turmoil in Europe. However, we anticipated this outcome and reduced the Fund’s inflation protection which helped to mitigate losses and support performance relative to other inflation hedged municipal funds.
The Fund’s security selection in transportation and utility bonds helped performance during the period, as the demand for certain higher quality, essential service sectors, such as public power, airports, water and sewer bonds, increased relative to other riskier revenue sectors.
The Hartford Municipal Real Return Fund (formerly The Hartford Tax-Free National Fund) |
| Manager Discussion (Unaudited) – (continued) |
| October 31, 2011 |
Detracting from performance in the municipal portfolio was exposure to lower rated bonds, specifically within education and long-term care. Credit deterioration and spreads widening for certain non-rated charter schools, independent private schools and continuing care retirement community bonds hurt performance. Plus, the Fund’s underweight (i.e. the Fund’s sector position was less than the benchmark position) to state General Obligation bonds (GOs) detracted from performance as states continued to recover from what may be considered the “Great Recession” and performed well during flights to quality.
What is the outlook?
Looking ahead, we are cautious short-term on municipals as we enter seasonal weakness in technicals with heavier new issue supply, higher dealer inventory and retail’s resistance to low absolute rates. While we believe fundamental conditions continue to exhibit signs of support for the sector as a whole, the headline volatility relating to deficit reduction policy initiatives at the Federal level suggests a more conservative posture. However, long term we still remain constructive on the municipal market given that we expect the restoration of a more normalized rate environment, continued heightened sensitivity to taxation and the relative safety of the asset class (limited defaults). Also, technicals should remain supportive of performance as long term supply remains constrained relative to historical levels as municipal issuers continue to focus on debt reduction. Higher relative value ratios (which should garner interest from crossover buyers), stabilizing fund flows and pent up rollover demand should also support market performance going forward. Furthermore, the gradual recovery in tax revenue consistent with the subpar economic growth, combined with austerity measures enacted to balance budgets should continue to result in the easing of fiscal stress. State and local revenues are up approximately 6.9% compared to the same period of 2010, representing the 7th consecutive quarterly increase. Overall tax revenues continue to improve and are now around 2.5% above their peak in 2008. However, most of the revenue growth came at the state level with state revenues up about 10.1%, while local revenues had a modest improvement of only 1.3% year-over-year. Sales tax revenue as well as personal and corporate income taxes all grew at higher levels, but property tax revenue continued to lag due to the ongoing housing recession. While home prices have fallen since 2006, property taxes have lagged the overall economic recovery, and are now starting to decline. Property taxes declined 1% last quarter, representing the third straight quarterly decline, which when combined with state cutbacks, continues to suggest ongoing fiscal stress at the local level.
Therefore, we expect to continue to avoid local credit content and selectively purchase high yield, emphasizing greater liquidity characteristics and diversification, favoring essential service revenue bonds higher up in the capital structure. Given what we consider the improved technical environment and favorable steepness of the curve, we will appropriately extend duration with purchases out longer on the yield curve in the 10-20 year range where there is better relative value and more incremental yield opportunities. Although we remain defensive given the market’s volatility, we will continue to look for good entry points during periods of stronger technicals, while taking advantage of what we consider attractive tax-exempt rates and wider credit spreads in high yield securities with good structural characteristics. Lastly, as the economy continues to recover we expect to focus more on the economically sensitive and consumer based sectors like sales tax, health care, and education bonds.
The Consumer Price Index (CPI) in recent months was stronger than market expectations. Headline and core CPI were either in line or slightly stronger than expectations. Headline CPI on a year over year basis was 3.5% as of October. The market events that drove the price of CPI swaps higher in late June were likely more related to overall growth expectations and the levels of nominal Treasuries. We believe the inflation market is now closer to fair value. However, the likelihood of continued economic volatility keeps us cautious on the inflation market in the near term.
* Effective November 1, 2011, Luke Morosanu will be involved in portfolio management and securities analysis for The Hartford Municipal Real Return Fund.
| Distribution by Credit Quality | |
| as of October 31, 2011 | |
| | | |
| Aaa / AAA | | | 4.3 | |
| Aa / AA | | | 31.7 | |
| A | | | 33.5 | |
| Baa / BBB | | | 11.4 | |
| Ba / BB | | | 0.4 | |
| B | | | 0.8 | |
| Unrated | | | 8.4 | |
| Non Debt Securities and Other Short-Term Instruments | | | 9.5 | |
| Other Assets & Liabilities | | | 0.0 | |
| Total | | | 100.0 | % |
| * | Does not apply to the Fund itself. Based upon Moody’s and S&P long-term credit ratings for the Fund’s holdings as of date noted. If Moody's and S&P assign different ratings to a holding, the lower rating is used. "Unrated" includes fixed-income securities (other than cash-like short-term instruments and U.S. Government securities) for which Moody’s and S&P have not issued long-term credit ratings. |
| Diversification by Industry | |
| as of October 31, 2011 | |
| | | |
| Airport Revenues | | | 7.1 | % |
| General Obligations | | | 12.7 | |
| Health Care/Services | | | 10.4 | |
| Higher Education (Univ., Dorms, etc.) | | | 11.6 | |
| Housing (HFA'S, etc.) | | | 0.5 | |
| Miscellaneous | | | 8.6 | |
| Prerefunded | | | 5.4 | |
| Special Tax Assessment | | | 4.8 | |
| Tax Allocation | | | 3.9 | |
| Transportation | | | 5.8 | |
| Utilities - Combined | | | 0.7 | |
| Utilities - Electric | | | 6.0 | |
| Utilities - Gas | | | 0.1 | |
| Utilities - Water and Sewer | | | 11.5 | |
| Waste Disposal | | | 1.4 | |
| Short-Term Investments | | | 9.5 | |
| Other Assets and Liabilities | | | 0.0 | |
| Total | | | 100.0 | % |
| Distribution by State | |
| as of October 31, 2011 | |
| | | |
| Alabama | | | 0.9 | % |
| Alaska | | | 0.5 | |
| Arizona | | | 3.4 | |
| California | | | 19.2 | |
| Colorado | | | 1.9 | |
| Delaware | | | 0.8 | |
| District of Columbia | | | 1.9 | |
| Florida | | | 5.8 | |
| Georgia | | | 4.3 | |
| Idaho | | | 0.7 | |
| Illinois | | | 5.6 | |
| Indiana | | | 2.7 | |
| Louisiana | | | 0.6 | |
| Maryland | | | 0.5 | |
| Massachusetts | | | 0.4 | |
| Michigan | | | 3.2 | |
| Minnesota | | | 1.7 | |
| Missouri | | | 0.9 | |
| Nevada | | | 0.9 | |
| New Jersey | | | 1.5 | |
| New Mexico | | | 0.2 | |
| New York | | | 7.9 | |
| North Carolina | | | 0.4 | |
| North Dakota | | | 0.9 | |
| Ohio | | | 1.2 | |
| Oklahoma | | | 0.5 | |
| Other U.S. Territories | | | 1.7 | |
| Pennsylvania | | | 2.1 | |
| Rhode Island | | | 2.0 | |
| South Carolina | | | 0.5 | |
| South Dakota | | | 0.1 | |
| Tennessee | | | 1.0 | |
| Texas | | | 8.3 | |
| Virginia | | | 1.3 | |
| Washington | | | 2.6 | |
| Wisconsin | | | 1.0 | |
| Wyoming | | | 1.4 | |
| Short-Term Investments | | | 9.5 | |
| Other Assets and Liabilities | | | 0.0 | |
| Total | | | 100.0 | % |
|
| Schedule of Investments |
| October 31, 2011 |
(000’s Omitted) |
| Shares or Principal Amount | Market Value ╪ | |
MUNICIPAL BONDS - 90.5% | |
| | | Alabama - 0.9% | |
| | | Huntsville, AL, GO (Prerefunded with State & Local Gov't Securities) | | | |
| $ | 1,855 | | 5.25%, 05/01/2022 ╦ | | $ | 1,939 | |
| | | | | | | | |
| | | | Alaska - 0.5% | |
| | | | Alaska Municipal Bond Bank Auth GO | | | | |
| | 375 | | 5.75%, 09/01/2033 | | | 412 | |
| | | | Anchorage, AK, GO | | | | |
| | 610 | | 5.25%, 08/01/2028 | | | 674 | |
| | | | | | | 1,086 | |
| | | | Arizona - 3.4% | |
| | | | Arizona Sundance Community Facilities Dist, Special Assess Rev #2 | | | | |
| | 325 | | 7.13%, 07/01/2027 ■ | | | 311 | |
| | | | Arizona Water Infrastructure FA Rev | | | | |
| | 1,500 | | 5.00%, 10/01/2030 | | | 1,667 | |
| | | | Estrella Mountain, AZ, Ranch Community GO | | | | |
| | 265 | | 6.20%, 07/15/2032 | | | 246 | |
| | | | Phoenix Arizona Civic Improvement Corp | | | | |
| | 2,000 | | 5.00%, 07/01/2040 | | | 2,049 | |
| | | | Salt River Proj Arizona Agricultural | | | | |
| | 3,000 | | 5.00%, 01/01/2034 | | | 3,183 | |
| | | | Vistancia, AZ, Community Fac Dist GO | | | | |
| | 200 | | 6.75%, 07/15/2022 | | | 204 | |
| | | | | | | 7,660 | |
| | | | California - 19.2% | |
| | | | Burbank, CA, FA Rev South San Fernando Redev Proj | | | | |
| | 350 | | 5.50%, 12/01/2023 | | | 337 | |
| | | | California Educational Facilities Auth, Pitzer College | | | | |
| | 630 | | 5.00%, 04/01/2030 | | | 636 | |
| | | | California Health Facilities FA Rev, Stanford Hospital | | | | |
| | 1,000 | | 5.50%, 11/15/2040 | | | 1,052 | |
| | | | California Health Facilities FA, Catholic Healthcare West | | | | |
| | 250 | | 5.25%, 07/01/2023 | | | 265 | |
| | | | California Health Facilities FA, Sutter Health | | | | |
| | 1,110 | | 5.88%, 08/15/2031 | | | 1,192 | |
| | | | California Public Works Board, Dept of Health Services Richmond Lab | | | | |
| | 300 | | 5.00%, 11/01/2030 | | | 295 | |
| | | | California State Dept of Water Resource Supply Rev | | | | |
| | 2,500 | | 5.00%, 05/01/2019 - 05/01/2022 | | | 2,906 | |
| | | | California State GO | | | | |
| | 3,515 | | 6.50%, 04/01/2033 ‡ ╦ | | | 4,113 | |
| | | | California State Public Works Board Lease Rev | | | | |
| | 1,500 | | 5.25%, 10/01/2022 | | | 1,627 | |
| | | | California State Public Works Board, Correctional Facilities Improvement | | | | |
| | 500 | | 6.00%, 03/01/2035 | | | 530 | |
| | | | California State Public Works Board, State University Trustees | | | | |
| | 170 | | 6.13%, 04/01/2029 | | | 189 | |
| | 2,000 | | 6.25%, 04/01/2034 | | | 2,135 | |
| | | California State Public Works Board, Various Capital Projects | | | |
| | 1,000 | | 6.38%, 11/01/2034 | | | 1,087 | |
| | | | California State Various Purpose | | | | |
| | 1,000 | | 5.00%, 10/01/2019 | | | 1,132 | |
| | | | California Statewide Communities Development Auth Rev | | | | |
| | 1,000 | | 5.00%, 03/01/2041 | | | 974 | |
| | | | California Statewide Community DA, Windrush School | | | | |
| | 250 | | 0.00%, 07/01/2037 ⌂● | | | 172 | |
| | | | Chula Vista, CA, IDR Daily San Diego Gas | | | | |
| | 300 | | 5.30%, 07/01/2021 | | | 319 | |
| | | | El Dorado County, CA, Irrigation Dist | | | | |
| | 300 | | 5.38%, 08/01/2024 | | | 329 | |
| | | | Fontana, CA, Redev Agency Tax Allocation Ref, Jurupa Hills Redev Proj | | | | |
| | 400 | | 5.50%, 10/01/2027 | | | 385 | |
| | | | Huntington Park, CA, Public FA Rev Ref | | | | |
| | 400 | | 5.25%, 09/01/2019 ╦ | | | 436 | |
| | | | Imperial Irrigation Dist Elec Rev | | | | |
| | 1,175 | | 5.25%, 11/01/2031 | | | 1,250 | |
| | | | Indio, CA, Public Improvement Act Special Assessment #2002-3 GO | | | | |
| | 95 | | 6.35%, 09/02/2027 | | | 97 | |
| | | | Kern County, CA, Tobacco Securitization Agency | | | | |
| | 860 | | 6.00%, 06/01/2029 | | | 813 | |
| | | | Lake Tahoe USD | | | | |
| | 8,000 | | 6.38%, 08/01/2045 ○ | | | 2,167 | |
| | | | Los Alamitos, CA, University GO | | | | |
| | 500 | | 5.50%, 08/01/2033 | | | 539 | |
| | | | Los Angeles Wastewater System Rev | | | | |
| | 2,000 | | 5.00%, 06/01/2022 | | | 2,302 | |
| | | | Madera, CA, Redev Agency Tax Rev | | | | |
| | 750 | | 5.25%, 09/01/2030 | | | 653 | |
| | | | Modesto, CA, Irrigation Dist | | | | |
| | 500 | | 5.50%, 07/01/2035 | | | 516 | |
| | | | Morongo Band of Mission Indians Enterprise Rev | | | | |
| | 1,655 | | 6.50%, 03/01/2028 ■ | | | 1,595 | |
| | | | Palm Springs, CA, Community Redev Agency | | | | |
| | 535 | | 5.50%, 09/01/2023 | | | 535 | |
| | | | Port of Oakland | | | | |
| | 1,000 | | 5.00%, 05/01/2026 | | | 1,015 | |
| | | | San Bernardino, CA, Community College Dist GO | | | | |
| | 500 | | 6.38%, 08/01/2026 | | | 578 | |
| | | | San Diego, CA, Public Fac FA Water Rev | | | | |
| | 1,500 | | 5.25%, 08/01/2038 | | | 1,590 | |
| | | | San Diego, CA, Redev Agency, Centre City Sub Pkg | | | | |
| | 200 | | 5.25%, 09/01/2026 | | | 200 | |
| | | | San Francisco City & County Airports Commission | | | | |
| | 1,000 | | 5.00%, 05/01/2040 | | | 1,021 | |
| | | | San Francisco City & County, CA, Redev Agency | | | | |
| | 1,120 | | 6.50%, 08/01/2032 | | | 1,204 | |
The accompanying notes are an integral part of these financial statements.
| Shares or Principal Amount | Market Value ╪ | |
MUNICIPAL BONDS - 90.5% - (continued) | |
| | | California - 19.2% - (continued) | |
| | | Santa Cruz County, CA, Redev Agency | | | |
| $ | 665 | | 6.63%, 09/01/2029 | | $ | 724 | |
| | | | Southern California Public Power Auth | | | | |
| | 500 | | 5.00%, 07/01/2023 | | | 556 | |
| | | | Temecula, CA, Redev Agency Tax Allocation Rev | | | | |
| | 250 | | 5.63%, 12/15/2038 | | | 214 | |
| | | | Torrance, CA, USD GO | | | | |
| | 1,500 | | 5.50%, 08/01/2025 | | | 1,694 | |
| | | | Tuolumne Wind Proj Auth Rev | | | | |
| | 1,000 | | 5.88%, 01/01/2029 | | | 1,103 | |
| | | | Ventura County, CA, Certificates of Participation | | | | |
| | 1,250 | | 5.63%, 08/15/2027 | | | 1,368 | |
| | | | Washington Township, CA, Health Care Dist Rev | | | | |
| | 500 | | 5.00%, 07/01/2037 | | | 484 | |
| | 1,000 | | 6.00%, 07/01/2029 | | | 1,059 | |
| | | | | | | 43,388 | |
| | | | Colorado - 1.9% | |
| | | | Adams County, CO, Certificates of Participation Correctional Facilities Improvement | | | | |
| | 1,000 | | 5.13%, 12/01/2029 | | | 1,050 | |
| | | | Colorado State Health Facilities Auth | | | | |
| | 1,500 | | 5.25%, 02/01/2031 ☼ | | | 1,540 | |
| | | | Regional Transportation Dist | | | | |
| | 1,000 | | 6.00%, 01/15/2034 | | | 1,013 | |
| | | | University of Colorado Enterprise Rev | | | | |
| | 600 | | 5.75%, 06/01/2028 | | | 689 | |
| | | | | | | 4,292 | |
| | | | Delaware - 0.8% | |
| | | | Delaware Transportation Auth | | | | |
| | 1,180 | | 5.00%, 07/01/2025 | | | 1,325 | |
| | | | New Castle County, DE, DA GO | | | | |
| | 500 | | 5.00%, 07/15/2033 | | | 541 | |
| | | | | | | 1,866 | |
| | | | District of Columbia - 1.9% | |
| | | | District of Columbia University Rev | | | | |
| | 3,000 | | 5.25%, 04/01/2034 | | | 3,239 | |
| | | | Washington, DC, Metropolitan Area Transit | | | | |
| | 1,000 | | 5.13%, 07/01/2032 | | | 1,070 | |
| | | | | | | 4,309 | |
| | | | Florida - 5.8% | |
| | | | Clearwater Water and Sewer Rev | | | | |
| | 2,500 | | 5.25%, 12/01/2039 | | | 2,680 | |
| | | | Colonial Country Club Community Development Dist, Capital Improvement Rev | | | | |
| | 455 | | 6.40%, 05/01/2033 | | | 457 | |
| | | | Florida Village Community Development | | | | |
| | 860 | | 6.50%, 05/01/2033 | | | 880 | |
| | | | Florida Village Community Development Dist No 8 | | | | |
| | 1,090 | | 6.38%, 05/01/2038 | | | 1,118 | |
| | | | Greater Orlando Aviation Auth | | | | |
| | 1,000 | | 5.00%, 10/01/2024 | | | 1,046 | |
| | | | Jacksonville, FL, Econ Development Community Health Care Fac | | | | |
| | 2,000 | | 6.25%, 09/01/2027 | | | 2,005 | |
| | | Miami-Dade County, FL, Educational Facilities Auth | | | |
| | 2,000 | | 5.75%, 04/01/2028 | | | 2,084 | |
| | | | River Bend Community Development Dist, Capital Improvement Rev | | | | |
| | 880 | | 0.00%, 11/01/2015 ⌂● | | | 352 | |
| | | | Tampa Bay Water Regional Water Supply Auth | | | | |
| | 2,000 | | 5.00%, 10/01/2019 | | | 2,371 | |
| | | | | | | 12,993 | |
| | | | Georgia - 4.3% | |
| | | | Atlanta Airport Passenger Facilities Charge Rev | | | | |
| | 2,000 | | 5.00%, 01/01/2023 | | | 2,192 | |
| | | | Atlanta Water & Wastewater Rev | | | | |
| | 1,500 | | 6.00%, 11/01/2022 | | | 1,760 | |
| | | | Dekalb, Newton & Gwinett County, GA, Joint Development Proj | | | | |
| | 1,000 | | 6.00%, 07/01/2034 | | | 1,087 | |
| | | | Fulton County, GA, School Dist GO | | | | |
| | 1,105 | | 5.38%, 01/01/2018 | | | 1,315 | |
| | | | Fulton County, GA, Water & Sewer Rev FGIC Part (Prerefunded with State & Local Gov't Securities) | | | | |
| | 1,160 | | 6.38%, 01/01/2014 | | | 1,233 | |
| | | | Georgia Municipal Electric Auth, Power Rev | | | | |
| | 945 | | 6.50%, 01/01/2017 | | | 1,085 | |
| | | | Georgia Municipal Electric Auth, Power Rev (Prerefunded with US Gov't Securities) | | | | |
| | 55 | | 6.50%, 01/01/2017 | | | 63 | |
| | | | Marietta, GA, DA Life University Inc Proj | | | | |
| | 1,000 | | 7.00%, 06/15/2030 | | | 996 | |
| | | | | | | 9,731 | |
| | | | Idaho - 0.7% | |
| | | | Idaho Board Bank Auth | | | | |
| | 1,470 | | 5.63%, 09/15/2026 | | | 1,688 | |
| | | | | | | | |
| | | | Illinois - 5.6% | |
| | | | Chicago Ill O'Hare Int'l Airport Revenues | | | | |
| | 1,000 | | 5.25%, 01/01/2027 | | | 1,011 | |
| | 1,000 | | 5.75%, 01/01/2039 | | | 1,082 | |
| | | | Hampshire, IL, Special Service Area #13, Tuscany Woods Proj | | | | |
| | 1,725 | | 5.75%, 03/01/2037 ⌂ | | | 826 | |
| | | | Huntley, IL, Special Service Area #9 | | | | |
| | 1,500 | | 5.10%, 03/01/2028 | | | 1,479 | |
| | | | Illinois Education Facilities Auth, Augustana College, Ser A | | | | |
| | 1,270 | | 5.70%, 10/01/2032 | | | 1,273 | |
| | | | Illinois State GO | | | | |
| | 1,000 | | 5.00%, 01/01/2022 | | | 1,046 | |
| | | | Round Lake, IL, Special Tax Rev | | | | |
| | 945 | | 4.70%, 03/01/2033 | | | 892 | |
| | | | Round Lake, IL, Special Tax Rev (Prerefunded with State & Local Gov't Securities) | | | | |
| | 484 | | 6.70%, 03/01/2033 | | | 526 | |
| | | | Springfield, IL, Water Rev | | | | |
| | 500 | | 5.25%, 03/01/2026 | | | 549 | |
| | | | State of Illinois | | | | |
| | 2,000 | | 5.25%, 01/01/2021 | | | 2,197 | |
The accompanying notes are an integral part of these financial statements.
The Hartford Municipal Real Return Fund (formerly The Hartford Tax-Free National Fund) |
| Schedule of Investments – (continued) |
| October 31, 2011 |
(000’s Omitted) |
| Shares or Principal Amount | Market Value ╪ | |
MUNICIPAL BONDS - 90.5% - (continued) | |
| | | Illinois - 5.6% - (continued) | |
| | | Wauconda, IL, Special Service Area #1 Special Tax Liberty Lakes Proj | | | |
| $ | 1,000 | | 6.63%, 03/01/2033 | | $ | 946 | |
| | | | Yorkville, IL, United City Special Service Area Tax Raintree Village Proj | | | | |
| | 913 | | 6.88%, 03/01/2033 | | | 916 | |
| | | | | | | 12,743 | |
| | | | Indiana - 2.7% | |
| | | | Indiana FA, Deaconess Hospital Rev | | | | |
| | 2,000 | | 6.75%, 03/01/2035 | | | 2,089 | |
| | | | Indiana Fin Auth Wastewater Utility Rev | | | | |
| | 1,000 | | 5.25%, 10/01/2031 | | | 1,073 | |
| | | | Indiana Municipal Power Agency | | | | |
| | 300 | | 5.75%, 01/01/2034 | | | 311 | |
| | | | Indiana State Municipal Power Agency | | | | |
| | 1,500 | | 5.00%, 01/01/2042 | | | 1,525 | |
| | | | University of Southern Indiana | | | | |
| | 1,070 | | 5.00%, 10/01/2022 - 10/01/2023 | | | 1,173 | |
| | | | | | | 6,171 | |
| | | | Louisiana - 0.6% | |
| | | | Louisiana Public Facilities Auth, Oschner Clinic Foundation Proj (Prerefunded with US Gov't Securities) | | | | |
| | 500 | | 5.50%, 05/15/2027 | | | 608 | |
| | | | Louisiana Public Facilities Auth, Susla Fac, Inc | | | | |
| | 1,000 | | 5.75%, 07/01/2039 ⌂■ | | | 745 | |
| | | | | | | 1,353 | |
| | | | Maryland - 0.5% | |
| | | | Baltimore MD Proj Rev | | | | |
| | 1,000 | | 5.00%, 07/01/2041 | | | 1,089 | |
| | | | | | | | |
| | | | Massachusetts - 0.4% | |
| | | | Massachusetts Development Fin Agency Rev | | | | |
| | 1,000 | | 2.25%, 12/01/2041 | | | 1,002 | |
| | | | | | | | |
| | | | Michigan - 3.2% | |
| | | | Detroit, MI, Water Supply System Ref Rev FGIC | | | | |
| | 1,750 | | 6.50%, 07/01/2015 | | | 1,937 | |
| | | | Grand Valley State University | | | | |
| | 1,500 | | 5.50%, 12/01/2027 | | | 1,611 | |
| | | | Michigan Hospital FA, Rev Ref Henry Ford Health System (Prerefunded with State & Local Gov't Securities) | | | | |
| | 500 | | 5.63%, 03/01/2017 | | | 534 | |
| | | | Michigan Public Educational FA Rev, Limited Obligation Landmark Academy | | | | |
| | 695 | | 7.00%, 12/01/2039 | | | 669 | |
| | | | Michigan State Financial Auth Rev | | | | |
| | 1,000 | | 5.00%, 12/01/2039 | | | 996 | |
| | | | Michigan State Strategic Fund | | | | |
| | 1,500 | | 5.25%, 10/15/2031 | | | 1,557 | |
| | | | | | | 7,304 | |
| | | | Minnesota - 1.7% | |
| | | | Minneapolis, MN, Parking Assessment GO | | | | |
| | 250 | | 5.00%, 12/01/2020 | | | 261 | |
| | | | Rosemount, MN, ISD #196 GO MBIA | | | | |
| | 1,950 | | 5.70%, 04/01/2015 ○ | | | 1,792 | |
| | | St Paul, MN, PA Lease Rev | | | |
| | 500 | | 5.00%, 12/01/2019 | | | 517 | |
| | | | University of Minnesota (Prerefunded with State & Local Gov't Securities) | | | | |
| | 1,000 | | 5.75%, 07/01/2018 | | | 1,202 | |
| | | | | | | 3,772 | |
| | | | Missouri - 0.9% | |
| | | | Branson Hills, MO, Infrastructure Fac | | | | |
| | 650 | | 5.50%, 04/01/2027 ⌂ | | | 512 | |
| | | | Lees Summit, MO, IDA Kensington Farms Improvement Proj | | | | |
| | 1,000 | | 5.75%, 03/01/2029 | | | 822 | |
| | | | Stone Canyon, MO, Community Improvement Proj | | | | |
| | 1,000 | | 5.75%, 04/01/2027 ⌂ | | | 749 | |
| | | | | | | 2,083 | |
| | | | Nevada - 0.9% | |
| | | | Clark County, NV, Airport Rev | | | | |
| | 1,000 | | 5.75%, 07/01/2042 | | | 1,058 | |
| | | | Nevada (State of) | | | | |
| | 1,000 | | 5.00%, 06/01/2027 | | | 1,062 | |
| | | | | | | 2,120 | |
| | | | New Jersey - 1.5% | |
| | | | New Jersey Econ Development Auth Rev | | | | |
| | 1,000 | | 5.00%, 09/01/2021 | | | 1,108 | |
| | | | New Jersey Health Care Facilities FA, Hospital Asset Transformation | | | | |
| | 2,145 | | 5.75%, 10/01/2031 | | | 2,279 | |
| | | | | | | 3,387 | |
| | | | New Mexico - 0.2% | |
| | | | Cabezon, NM, Public Improvement Dist | | | | |
| | 460 | | 5.20%, 09/01/2015 | | | 449 | |
| | | | | | | | |
| | | | New York - 7.9% | |
| | | | New York City Municipal Water Fin Auth | | | | |
| | 1,000 | | 5.00%, 06/15/2032 | | | 1,078 | |
| | | | New York City Transitional Financial Auth | | | | |
| | 1,000 | | 5.00%, 11/01/2022 ☼ | | | 1,172 | |
| | | | New York Dorm Auth, Fordham University FGIC | | | | |
| | 80 | | 5.00%, 07/01/2020 | | | 81 | |
| | | | New York Dorm Auth, Mount St Mary College | | | | |
| | 400 | | 5.00%, 07/01/2027 | | | 403 | |
| | | | New York Dorm Auth, Upstate Community College | | | | |
| | 250 | | 5.25%, 07/01/2021 | | | 267 | |
| | | | New York Environmental Fac Corp | | | | |
| | 450 | | 5.00%, 07/15/2026 | | | 460 | |
| | | | New York GO | | | | |
| | 1,000 | | 5.00%, 10/01/2032 | | | 1,079 | |
| | | | New York Metropolitan Transportation Auth | | | | |
| | 3,000 | | 5.25%, 11/15/2023 | | | 3,384 | |
| | | | New York State Dormitory Auth, Rev Non St | | | | |
| | 2,000 | | 5.38%, 03/01/2029 | | | 2,151 | |
| | | | New York, NY, GO | | | | |
| | 750 | | 5.00%, 08/01/2035 | | | 798 | |
| | 1,000 | | 6.25%, 10/15/2028 | | | 1,175 | |
The accompanying notes are an integral part of these financial statements.
| Shares or Principal Amount | Market Value ╪ | |
MUNICIPAL BONDS - 90.5% - (continued) | |
| | | New York - 7.9% - (continued) | |
| | | New York, NY, GO (Prerefunded with US Gov't Securities) | | | |
| $ | 45 | | 5.75%, 03/01/2019 | | $ | 48 | |
| | | | New York, NY, Transitional FA Future Tax Secured (Prerefunded with US Gov't Securities) | | | | |
| | 450 | | 5.00%, 08/01/2023 | | | 466 | |
| | | | PA of New York and New Jersey | | | | |
| | 1,000 | | 5.00%, 12/01/2023 | | | 1,046 | |
| | | | Ulster County, NY, IDA Kingston Regional Senior Living Proj | | | | |
| | 4,475 | | 6.00%, 09/15/2027 ⌂ | | | 3,633 | |
| | | | Westchester County, NY, IDA Continuing Care Retirement, Kendal on Hudson Proj | | | | |
| | 500 | | 6.38%, 01/01/2024 | | | 496 | |
| | | | | | | 17,737 | |
| | | | North Carolina - 0.4% | |
| | | | Mecklenburg County, NC, Certificate of Participation School Improvements | | �� | | |
| | 795 | | 5.00%, 02/01/2024 | | | 882 | |
| | | | | | | | |
| | | | North Dakota - 0.9% | |
| | | | North Dakota State FA | | | | |
| | 1,750 | | 5.00%, 10/01/2022 | | | 2,100 | |
| | | | | | | | |
| | | | Ohio - 1.2% | |
| | | | Cuyahoga, OH, Community College | | | | |
| | 1,200 | | 5.00%, 08/01/2027 | | | 1,294 | |
| | | | Hamilton, OH, School Dist Improvement GO | | | | |
| | 1,270 | | 6.15%, 12/01/2016 | | | 1,516 | |
| | | | | | | 2,810 | |
| | | | Oklahoma - 0.5% | |
| | | | Tulsa Airports Improvement Trust | | | | |
| | 1,000 | | 5.38%, 06/01/2024 | | | 1,018 | |
| | | | | | | | |
| | | | Other U.S. Territories - 1.7% | |
| | | | Guam Government, Limited Obligation Rev Section 30 Ser A | | | | |
| | 565 | | 5.75%, 12/01/2034 | | | 572 | |
| | | | Puerto Rico Housing FA | | | | |
| | 1,000 | | 5.13%, 12/01/2027 | | | 1,041 | |
| | | | Puerto Rico Sales Tax Financing | | | | |
| | 1,500 | | 5.50%, 08/01/2042 | | | 1,547 | |
| | | | University Virgin Islands | | | | |
| | 270 | | 5.13%, 12/01/2022 | | | 306 | |
| | 225 | | 5.25%, 12/01/2023 - 12/01/2024 | | | 256 | |
| | | | | | | 3,722 | |
| | | | Pennsylvania - 2.1% | |
| | | | Pennsylvania State Higher Educational Facilities Auth Rev | | | | |
| | 1,000 | | 6.00%, 07/01/2043 | | | 1,001 | |
| | | | Pennsylvania Turnpike Commission, Sub-Ser C | | | | |
| | 665 | | 6.00%, 06/01/2028 | | | 751 | |
| | | | Philadelphia, PA, GO | | | | |
| | 1,000 | | 5.25%, 08/01/2019 | | | 1,106 | |
| | | | Philadelphia, PA, Municipal Auth | | | | |
| | 750 | | 6.38%, 04/01/2029 | | | 797 | |
| | 1,000 | | 6.50%, 04/01/2034 | | | 1,048 | |
| | | | | | | 4,703 | |
| | | Rhode Island - 2.0% | |
| | | Central Falls, RI, Detention Facility Corp | | | |
| | 405 | | 6.75%, 01/15/2013 | | | 398 | |
| | | | Rhode Island St & Providence Plantations | | | | |
| | 2,000 | | 5.50%, 08/01/2027 | | | 2,301 | |
| | | | Rhode Island Tobacco Settlement Financing Corp | | | | |
| | 2,000 | | 6.25%, 06/01/2042 | | | 1,828 | |
| | | | | | | 4,527 | |
| | | | South Carolina - 0.5% | |
| | | | South Carolina State Public Service Auth Rev | | | | |
| | 1,000 | | 5.00%, 01/01/2019 | | | 1,176 | |
| | | | | | | | |
| | | | South Dakota - 0.1% | |
| | | | South Dakota Housing DA | | | | |
| | 190 | | 6.13%, 05/01/2033 | | | 191 | |
| | | | | | | | |
| | | | Tennessee - 1.0% | |
| | | | Johnson City Health & Educational Facilities | | | | |
| | 1,000 | | 5.50%, 07/01/2031 | | | 1,010 | |
| | | | Tennessee GO | | | | |
| | 1,000 | | 5.00%, 10/01/2022 | | | 1,209 | |
| | | | | | | 2,219 | |
| | | | Texas - 8.3% | |
| | | | Dallas Fort Worth, TX, International Airport | | | | |
| | 1,370 | | 6.00%, 11/01/2028 - 11/01/2032 | | | 1,371 | |
| | | | Houston Texas Higher Education Fin | | | | |
| | 1,000 | | 4.50%, 05/15/2042 | | | 1,010 | |
| | | | Houston, TX, Airport System Rev | | | | |
| | 1,070 | | 5.50%, 07/01/2034 | | | 1,143 | |
| | | | Houston, TX, Utility Systems Rev | | | | |
| | 2,000 | | 6.00%, 11/15/2036 | | | 2,277 | |
| | | | La Vernia, TX, Higher Education | | | | |
| | 2,000 | | 6.38%, 08/15/2044 | | | 2,094 | |
| | | | Lower Colorado River Auth Rev | | | | |
| | 1,000 | | 5.00%, 05/15/2041 | | | 1,014 | |
| | 35 | | 7.25%, 05/15/2037 | | | 39 | |
| | | | Lower Colorado River Auth Rev (Prerefunded with State & Local Gov't Securities) | | | | |
| | 1,965 | | 7.25%, 05/15/2037 | | | 2,400 | |
| | | | North Texas Tollway Auth Rev | | | | |
| | 3,000 | | 6.00%, 01/01/2025 | | | 3,342 | |
| | | | Tarrant County, TX, Cultural Education Facilities | | | | |
| | 1,000 | | 6.25%, 11/15/2029 | | | 1,117 | |
| | | | Texas Private Activity Surface Transportation, NTE Mobility Partners | | | | |
| | 2,000 | | 6.88%, 12/31/2039 | | | 2,134 | |
| | | | Travis County, TX, Health Fac, Querencia Barton Creek Project | | | | |
| | 1,000 | | 5.65%, 11/15/2035 | | | 843 | |
| | | | | | | 18,784 | |
| | | | Virginia - 1.3% | |
| | | | Peninsula, VA, Turn Center Community Dev DA | | | | |
| | 695 | | 6.45%, 09/01/2037 | | | 678 | |
| | | | Virginia State Residential Auth | | | | |
| | 500 | | 5.00%, 11/01/2024 | | | 567 | |
The accompanying notes are an integral part of these financial statements.
The Hartford Municipal Real Return Fund (formerly The Hartford Tax-Free National Fund) |
| Schedule of Investments – (continued) |
| October 31, 2011 |
(000’s Omitted) |
| Shares or Principal Amount | Market Value ╪ | |
MUNICIPAL BONDS - 90.5% - (continued) | |
| | | Virginia - 1.3% - (continued) | |
| | | Virginia Tobacco Settlement Funding Corp (Prerefunded with US Gov't Securities) | | | | |
| $ | 1,455 | | 5.50%, 06/01/2026 | | | $ | 1,599 | |
| | | | | | | | 2,844 | |
| | | | Washington - 2.6% | |
| | | | Port of Seattle Rev | | | | | |
| | 1,000 | | 5.00%, 06/01/2030 | | | | 1,055 | |
| | | | Washington State Health Care Facilities Auth, VA Mason Medical | | | | | |
| | 2,400 | | 6.13%, 08/15/2037 | | | | 2,419 | |
| | | | Washington State Projects, FYI Properties Lease Rev | | | | | |
| | 2,285 | | 5.50%, 06/01/2034 | | | | 2,430 | |
| | | | | | | | 5,904 | |
| | | | Wisconsin - 1.0% | |
| | | | Badger Tobacco Asset Securitization Corp of WI (Prerefunded with US Gov't Securities) | | | | | |
| | 1,000 | | 6.38%, 06/01/2032 | | | | 1,035 | |
| | | | Wisconsin State General Fund | | | | | |
| | 125 | | 5.75%, 05/01/2033 | | | | 139 | |
| | 865 | | 6.00%, 05/01/2036 | | | | 967 | |
| | | | | | | | 2,141 | |
| | | | Wyoming - 1.4% | |
| | | | Campbell County, WY, Solid Waste Facilities | | | | | |
| | 3,000 | | 5.75%, 07/15/2039 | | | | 3,233 | |
| | | | | | | | | |
| | | | Total municipal bonds | | | | | |
| | | | (cost $197,180) | | | $ | 204,416 | |
| | | | | | | | | |
| | | | Total long-term investments | | | | | |
| | | | (cost $197,180) | | | $ | 204,416 | |
| | | | | | | | | |
SHORT-TERM INVESTMENTS - 9.5% | |
| | | | Investment Pools and Funds - 9.5% | |
| | 21,424 | | State Street Bank Tax Free Money Market Fund | | | $ | 21,424 | |
| | | | | | | | | |
| | | | Total short-term investments | | | | | |
| | | | (cost $21,424) | | | $ | 21,424 | |
| | | | | | | | | |
| | | | Total investments | | | | | |
| | | | (cost $218,604) ▲ | 100.0 | % | $ | 225,840 | |
| | | | Other assets and liabilities | – | % | | 62 | |
| | | | Total net assets | 100.0 | % | $ | 225,902 | |
The accompanying notes are an integral part of these financial statements.
| Note: | Percentage of investments as shown is the ratio of the total market value to total net assets. |
| ▲ | Also represents cost for tax purposes. |
| ○ | The interest rate disclosed for these securities represents the effective yield on the date of the acquisition. |
| ● | Non-income producing. For long-term debt securities, items identified are in default as to payment of interest and/or principal. |
| ‡ | This security, or a portion of this security, has been segregated to cover funding requirements on investment transactions settling in the future. |
| ╦ | This security, or a portion of this security, has been pledged as collateral in connection with swap contracts. The Fund has also pledged $2,270 of cash as collateral in connection with swap contracts. |
| ■ | Securities issued within terms of a private placement memorandum, exempt from registration under Rule 144A under the Securities Act of 1933, as amended, and may be sold only to qualified institutional buyers. Unless otherwise indicated, these holdings are determined to be liquid. At October 31, 2011, the aggregate value of these securities was $2,651, which represents 1.2% of total net assets. |
| ☼ | The cost of securities purchased on a when-issued, delayed delivery or delayed draw basis at October 31, 2011 was $2,693. |
| ⌂ | The following securities are considered illiquid. Illiquid securities are often purchased in private placement transactions, are often not registered under the Securities Act of 1933 and may have contractual restrictions on resale. A security may also be considered illiquid if the security lacks a readily available market or if its valuation has not changed for a certain period of time. |
| | | | | | | | |
| 05/2007 | | | $ | 650 | | Branson Hills, MO, Infrastructure Fac, 5.50%, 04/01/2027 | | $ | 651 | |
| 07/2007 | | | $ | 250 | | California Statewide Community DA, Windrush School, 0.00%, 07/01/2037 | | | 250 | |
| 05/2007 | | | $ | 1,725 | | Hampshire, IL, Special Service Area #13, Tuscany Woods Proj, 5.75%, 03/01/2037 | | | 1,725 | |
| 07/2007 | | | $ | 1,000 | | Louisiana Public Facilities Auth, Susla Fac, Inc, 5.75%, 07/01/2039 - 144A | | | 1,005 | |
| 11/2007 | | | $ | 880 | | River Bend Community Development Dist, Capital Improvement Rev, 0.00%, 11/01/2015 | | | 880 | |
| 04/2007 | | | $ | 1,000 | | Stone Canyon, MO, Community Improvement Proj, 5.75%, 04/01/2027 | | | 990 | |
| 10/2007 | | | $ | 4,475 | | Ulster County, NY, IDA Kingston Regional Senior Living Proj, 6.00%, 09/15/2027 | | | 4,497 | |
| | | | | |
| At October 31, 2011, the aggregate value of these securities was $6,989, which represents 3.1% of total net assets. |
| | DA | | Development Authority |
| | FA | | Finance Authority |
| | FGIC | | Financial Guaranty Insurance Company |
| | GO | | General Obligations |
| | IDA | | Industrial Development Authority Bond |
| | IDR | | Industrial Development Revenue Bond |
| | ISD | | Independent School District |
| | MBIA | | Municipal Bond Insurance Association |
| | PA | | Port Authority |
| | USD | | United School District |
The accompanying notes are an integral part of these financial statements.
The Hartford Municipal Real Return Fund (formerly The Hartford Tax-Free National Fund) |
| Schedule of Investments – (continued) |
| October 31, 2011 |
(000’s Omitted) |
| Interest Rate Swap Contracts Outstanding at October 31, 2011 | |
| | | | | | | | | | | | | | | | | | |
| | | | | | | | | | Upfront Premiums Paid/ (Received) | | | | | | Unrealized Appreciation/ (Depreciation) | |
| Barclay Investment, Inc. | | 2.46% Fixed | | CPURNSA 219.45 | | $ | 3,500 | | 03/09/13 | | $ | – | | | $ | 1 | | | $ | 1 | |
| Barclay Investment, Inc. | | 2.53% Fixed | | CPURNSA 219.45 | | | 4,000 | | 03/09/12 | | | – | | | | 29 | | | | 29 | |
| Barclay Investment, Inc. | | 2.65% Fixed | | CPURNSA 219.28 | | | 10,500 | | 03/04/18 | | | – | | | | (189 | ) | | | (189 | ) |
| Barclay Investment, Inc. | | 2.75% Fixed | | CPURNSA 219.25 | | | 7,000 | | 03/03/21 | | | – | | | | (167 | ) | | | (167 | ) |
| Barclay Investment, Inc. | | 2.98% Fixed | | CPURNSA 219.41 | | | 5,750 | | 03/08/26 | | | – | | | | (309 | ) | | | (309 | ) |
| Barclay Investment, Inc. | | 3.00% Fixed | | CPURNSA 221.13 | | | 3,100 | | 04/26/31 | | | – | | | | (188 | ) | | | (188 | ) |
| Barclay Investment, Inc. | | 3.04% Fixed | | CPURNSA 219.41 | | | 5,000 | | 03/08/31 | | | – | | | | (333 | ) | | | (333 | ) |
| Credit Suisse | | 1.19% Fixed | | CPURNSA 226.04 | | | 4,000 | | 10/07/12 | | | – | | | | 23 | | | | 23 | |
| Deutsche Bank | | 1.40% Fixed | | CPURNSA 226.04 | | | 7,000 | | 10/07/14 | | | – | | | | 110 | | | | 110 | |
| JP Morgan Securities | | 2.33% Fixed | | CPURNSA 225.92 | | | 7,000 | | 09/30/21 | | | – | | | | 91 | | | | 91 | |
| JP Morgan Securities | | 2.34% Fixed | | CPURNSA 219.28 | | | 3,600 | | 03/04/14 | | | – | | | | (4 | ) | | | (4 | ) |
| JP Morgan Securities | | 2.45% Fixed | | CPURNSA 219.25 | | | 5,500 | | 03/03/16 | | | – | | | | (40 | ) | | | (40 | ) |
| JP Morgan Securities | | 2.46% Fixed | | CPURNSA 219.45 | | | 3,500 | | 03/09/13 | | | – | | | | 1 | | | | 1 | |
| JP Morgan Securities | | 2.53% Fixed | | CPURNSA 219.45 | | | 4,000 | | 03/09/12 | | | – | | | | 29 | | | | 29 | |
| JP Morgan Securities | | 2.75% Fixed | | CPURNSA 219.25 | | | 7,000 | | 03/03/21 | | | – | | | | (167 | ) | | | (167 | ) |
| JP Morgan Securities | | 2.97% Fixed | | CPURNSA 220.69 | | | 6,800 | | 04/14/26 | | | – | | | | (357 | ) | | | (357 | ) |
| JP Morgan Securities | | 2.98% Fixed | | CPURNSA 219.28 | | | 2,000 | | 03/04/36 | | | – | | | | (125 | ) | | | (125 | ) |
| JP Morgan Securities | | 3.05% Fixed | | CPURNSA 219.38 | | | 875 | | 03/07/41 | | | – | | | | (82 | ) | | | (82 | ) |
| UBS Securities LLC | | 2.34% Fixed | | CPURNSA 219.28 | | | 7,200 | | 03/04/14 | | | – | | | | (8 | ) | | | (8 | ) |
| UBS Securities LLC | | 2.65% Fixed | | CPURNSA 219.28 | | | 5,250 | | 03/04/18 | | | – | | | | (95 | ) | | | (95 | ) |
| UBS Securities LLC | | 2.71% Fixed | | CPURNSA 220.66 | | | 4,600 | | 04/13/16 | | | – | | | | (104 | ) | | | (104 | ) |
| UBS Securities LLC | | 2.75% Fixed | | CPURNSA 219.25 | | | 7,000 | | 03/03/21 | | | – | | | | (167 | ) | | | (167 | ) |
| UBS Securities LLC | | 2.79% Fixed | | CPURNSA 220.66 | | | 7,800 | | 04/13/18 | | | – | | | | (232 | ) | | | (232 | ) |
| UBS Securities LLC | | 2.95% Fixed | | CPURNSA 219.38 | | | 5,750 | | 03/07/26 | | | – | | | | (274 | ) | | | (274 | ) |
| UBS Securities LLC | | 2.98% Fixed | | CPURNSA 219.28 | | | 2,000 | | 03/04/36 | | | – | | | | (125 | ) | | | (125 | ) |
| UBS Securities LLC | | 3.04% Fixed | | CPURNSA 219.38 | | | 875 | | 03/07/41 | | | – | | | | (80 | ) | | | (80 | ) |
| | | | | | | | | | | | $ | – | | | $ | (2,762 | ) | | $ | (2,762 | ) |
U.S. CPI Urban Consumers NSA (CPURNSA)
| ╪ | See Significant Accounting Policies of accompanying Notes to Financial Statements regarding valuation of securities. |
The accompanying notes are an integral part of these financial statements.
|
| Investment Valuation Hierarchy Level Summary |
| October 31, 2011 |
(000’s Omitted) |
| | | | | | | | | | | | | |
| Assets: | | | | | | | | | | | | |
| Municipal Bonds | | | 204,416 | | | | – | | | | 204,416 | | | | – | |
| Short-Term Investments | | | 21,424 | | | | 21,424 | | | | – | | | | – | |
| Total | | $ | 225,840 | | | $ | 21,424 | | | $ | 204,416 | | | $ | – | |
| Interest Rate Swaps * | | | 284 | | | | – | | | | 193 | | | | 91 | |
| Total | | $ | 284 | | | $ | – | | | $ | 193 | | | $ | 91 | |
| Liabilities: | | | | | | | | | | | | | | | | |
| Interest Rate Swaps * | | | 3,046 | | | | – | | | | 1,173 | | | | 1,873 | |
| Total | | $ | 3,046 | | | $ | – | | | $ | 1,173 | | | $ | 1,873 | |
| ♦ | For the year ended October 31, 2011, there were no significant transfers between Level 1 and Level 2. |
| * | Derivative instruments not reflected in the Schedule of Investments are valued at the unrealized appreciation/depreciation on the investments. |
| Following is a reconciliation of Level 3 assets for which significant unobservable inputs were used to determine fair value: |
| | | Balance as of October 31, 2010 | | | | | | Change in Unrealized Appreciation (Depreciation) | | | | | | | | | | | | | | | | | | Balance as of October 31, 2011 | |
| Assets: | | | | | | | | | | | | | | | | | | | | | | | | | | | |
| Swaps* | | $ | — | | | $ | — | † | | $ | 91 | ‡ | | $ | — | | | $ | — | | | $ | — | | | $ | — | | | $ | — | | | $ | 91 | |
| Total | | $ | — | | | $ | — | | | $ | 91 | | | $ | — | | | $ | — | | | $ | — | | | $ | — | | | $ | — | | | $ | 91 | |
| | | | | | | | | | | | | | | | | | | | | | | | | | | | | | | | | | | | | |
| Liabilities: | | | | | | | | | | | | | | | | | | | | | | | | | | | | | | | | | | | | |
| Swaps* | | $ | — | | | $ | — | † | | $ | (1,873 | )‡ | | $ | — | | | $ | — | | | $ | — | | | $ | — | | | $ | — | | | $ | (1,873 | ) |
| Total | | $ | — | | | $ | — | | | $ | (1,873 | ) | | $ | — | | | $ | — | | | $ | — | | | $ | — | | | $ | — | | | $ | (1,873 | ) |
| * | Derivative instruments not reflected in the Schedule of Investments are valued at the unrealized appreciation/ depreciation on the investment. |
| † | The realized gain (loss) earned for swaps during the period ended October 31, 2011 was $82. |
| ‡ | Change in unrealized appreciation or depreciation in the current period relating to assets still held at October 31, 2011 was $(1,782). |
The accompanying notes are an integral part of these financial statements.
|
| Statement of Assets and Liabilities |
| October 31, 2011 |
(000’s Omitted) |
| Assets: | | | |
| Investments in securities, at market value (cost $218,604) | | $ | 225,840 | |
| Cash | | | 2,288 | * |
| Unrealized appreciation on swap contracts | | | 284 | |
| Receivables: | | | | |
| Fund shares sold | | | 1,415 | |
| Dividends and interest | | | 2,904 | |
| Other assets | | | 50 | |
| Total assets | | | 232,781 | |
| Liabilities: | | | | |
| Unrealized depreciation on swap contracts | | | 3,046 | |
| Payables: | | | | |
| Investment securities purchased | | | 2,693 | |
| Fund shares redeemed | | | 984 | |
| Investment management fees | | | 21 | |
| Dividends | | | 92 | |
| Distribution fees | | | 16 | |
| Accrued expenses | | | 27 | |
| Total liabilities | | | 6,879 | |
| Net assets | | $ | 225,902 | |
| Summary of Net Assets: | | | | |
| Capital stock and paid-in-capital | | $ | 272,255 | |
| Accumulated undistributed net investment income | | | 42 | |
| Accumulated net realized loss on investments | | | (50,869 | ) |
| Unrealized appreciation of investments | | | 4,474 | |
| Net assets | | $ | 225,902 | |
| | | | | |
| Shares authorized | | | 19,300,000 | |
| Par value | | $ | 0.0001 | |
Class A: Net asset value per share/Maximum offering price per share | | | $9.20/$9.63 | |
| Shares outstanding | | | 14,970 | |
| Net assets | | $ | 137,766 | |
Class B: Net asset value per share | | $ | 9.13 | |
| Shares outstanding | | | 500 | |
| Net assets | | $ | 4,565 | |
Class C: Net asset value per share | | $ | 9.15 | |
| Shares outstanding | | | 4,721 | |
| Net assets | | $ | 43,214 | |
Class I: Net asset value per share | | $ | 9.22 | |
| Shares outstanding | | | 1,157 | |
| Net assets | | $ | 10,671 | |
Class Y: Net asset value per share | | $ | 9.18 | |
| Shares outstanding | | | 3,234 | |
| Net assets | | $ | 29,686 | |
| * | Cash of $2,270 was pledged as collateral for open swap contracts at October 31, 2011. |
The accompanying notes are an integral part of these financial statements.
|
| Statement of Operations |
| For the Year Ended October 31, 2011 |
(000’s Omitted) |
| Investment Income: | | | |
| Interest | | $ | 11,607 | |
| Total investment income | | | 11,607 | |
| | | | | |
| Expenses: | | | | |
| Investment management fees | | | 1,090 | |
| Transfer agent fees | | | 100 | |
| Distribution fees | | | | |
| Class A | | | 318 | |
| Class B | | | 57 | |
| Class C | | | 410 | |
Class L* | | | 13 | |
| Custodian fees | | | 3 | |
| Accounting services fees | | | 30 | |
| Registration and filing fees | | | 100 | |
| Board of Directors' fees | | | 5 | |
| Audit fees | | | 10 | |
| Other expenses | | | 61 | |
| Total expenses (before waivers and fees paid indirectly) | | | 2,197 | |
| Expense waivers | | | (94 | ) |
| Custodian fee offset | | | — | |
| Total waivers and fees paid indirectly | | | (94 | ) |
| Total expenses, net | | | 2,103 | |
| Net Investment Income | | | 9,504 | |
| Net Realized Loss on Investments and Other Financial Instruments: | | | | |
| Net realized loss on investments in securities | | | (1,740 | ) |
| Net realized gain on swap contracts | | | 87 | |
| Net Realized Loss on Investments and Other Financial Instruments | | | (1,653 | ) |
| Net Changes in Unrealized Depreciation of Investments and Other Financial Instruments: | | | | |
| Net unrealized depreciation of investments | | | (4,686 | ) |
| Net unrealized depreciation of swap contracts | | | (2,762 | ) |
| Net Changes in Unrealized Depreciation of Investments and Other Financial Instruments | | | (7,448 | ) |
| Net Loss on Investments and Other Financial Instruments | | | (9,101 | ) |
| Net Increase in Net Assets Resulting from Operations | | $ | 403 | |
* Class L merged into Class A on August 5, 2011. Please refer to the Notes to Financial Statements for further details.
The accompanying notes are an integral part of these financial statements.
|
| Statement of Changes in Net Assets |
| |
(000’s Omitted) |
| | | For the Year Ended October 31, 2011 | | | For the Year Ended October 31, 2010 | |
| Operations: | | | | | | |
| Net investment income | | $ | 9,504 | | | $ | 11,606 | |
| Net realized loss on investments and other financial instruments | | | (1,653 | ) | | | (6,088 | ) |
| Net unrealized appreciation (depreciation) of investments and other financial instruments | | | (7,448 | ) | | | 16,826 | |
| Net Increase In Net Assets Resulting From Operations | | | 403 | | | | 22,344 | |
| Distributions to Shareholders: | | | | | | | | |
| From net investment income | | | | | | | | |
| Class A | | | (5,704 | ) | | | (7,169 | ) |
| Class B | | | (217 | ) | | | (319 | ) |
| Class C | | | (1,540 | ) | | | (1,779 | ) |
| Class I | | | (413 | ) | | | (366 | ) |
| Class L* | | | (240 | ) | | | (348 | ) |
| Class Y | | | (1,431 | ) | | | (1,645 | ) |
| Total distributions | | | (9,545 | ) | | | (11,626 | ) |
| Capital Share Transactions: | | | | | | | | |
| Class A | | | (11,279 | ) | | | (2,018 | ) |
| Class B | | | (2,529 | ) | | | (1,580 | ) |
| Class C | | | (2,924 | ) | | | 3,279 | |
| Class I | | | 2,559 | | | | 1,135 | |
| Class L* | | | (8,759 | ) | | | (40 | ) |
| Class Y | | | (2,261 | ) | | | (1,580 | ) |
| Net decrease from capital share transactions | | | (25,193 | ) | | | (804 | ) |
| Proceeds from regulatory settlements | | | — | | | | 3 | |
| Net Increase (Decrease) In Net Assets | | | (34,335 | ) | | | 9,917 | |
| Net Assets: | | | | | | | | |
| Beginning of period | | | 260,237 | | | | 250,320 | |
| End of period | | $ | 225,902 | | | $ | 260,237 | |
| Accumulated undistributed (distribution in excess of) net investment income (loss) | | $ | 42 | | | $ | 83 | |
* Class L merged into Class A on August 5, 2011. Please refer to the Notes to Financial Statements for further details.
The accompanying notes are an integral part of these financial statements.
|
| Notes to Financial Statements |
| October 31, 2011 |
(000’s Omitted) |
The Hartford Mutual Funds II, Inc. (“Company”) is an open-end management investment company comprised of five portfolios. Financial statements for The Hartford Municipal Real Return Fund (the “Fund”), a series of the Company, are included in this report.
The Company is organized under the laws of the State of Maryland and is registered with the Securities and Exchange Commission (“SEC”) under the Investment Company Act of 1940, as amended (“1940 Act”). The Fund is a diversified open-end management investment company.
Class A shares are sold with a front-end sales charge of up to 4.50%. Class B shares were sold with a contingent deferred sales charge which is assessed on the lesser of the per share net asset value (“NAV”) of the shares at the time of redemption or the original purchase price, and declines from up to 5.00% to zero depending on the period of time the shares are held (see note below regarding the closing of Class B shares). Class C shares are sold with a contingent deferred sales charge of up to 1.00% on shares redeemed within twelve months of purchase. Class I shares are sold without sales charges to certain eligible investors primarily through advisory fee-based wrap programs. Class Y shares, which are sold to certain eligible institutional investors, are sold without a sales charge. All classes of shares have identical voting, redemption, dividend, liquidation and other rights and the same terms and conditions, with the exceptions that each class may have different expenses, which may affect performance, and that Class B shares automatically convert to Class A shares after 8 years.
No new or additional investments are allowed in Class B shares of The Hartford Mutual Funds (including investments through any systematic investment plan). Existing shareholders of Class B shares may continue to hold their Class B shares, exchange their Class B shares for Class B shares of another Hartford Mutual Fund (as permitted by existing exchange privileges), or redeem their Class B shares as described in the Fund’s prospectus. Reinstatement privileges with respect to Class B shares will continue under the current policy. For investors electing to reinvest capital gains and dividends, any such capital gains or dividends on Class B shares will continue to be reinvested in Class B shares of the Fund. All Class B share attributes, including the 12b-1 fee, contingent deferred sales charge schedule, and conversion to Class A shares, remain unchanged.
| 2. | Significant Accounting Policies: |
The following is a summary of significant accounting policies of the Fund in the preparation of its financial statements, which are in accordance with the United States Generally Accepted Accounting Principles (“U.S. GAAP”). The preparation of financial statements in accordance with U.S. GAAP may require management to make estimates and assumptions that affect the reported amounts of assets and liabilities and disclosure of contingent assets and liabilities at the date of the financial statements and the reported amounts of increases and decreases in net assets from operations during the reporting period. Actual results could differ from those estimates.
| | a) | Determination of Net Asset Value – The NAV of each class of the Fund's shares is determined as of the close of regular trading (normally 4:00 p.m. Eastern Time) (the “NYSE Close”) on each day that the New York Stock Exchange (the “Exchange”) is open (“Valuation Date”). Information that becomes known to the Fund after the NAV has been calculated on a particular day will not generally be used to retroactively adjust the NAV determined earlier that day. |
| | b) | Investment Valuation and Fair Value Measurements – For purposes of calculating the NAV, portfolio securities and other assets held by the Fund's portfolio for which market quotes are readily available are valued at market value. Market value is generally determined on the basis of last reported sales prices or official close price. If no sales are reported, market value is based on quotes obtained from a quotation reporting system, established market makers, or independent pricing services. If market prices are not readily available or are deemed unreliable, the Fund will use the fair value of the security as determined in good faith under policies and procedures established by and under the supervision of the Company’s Board of Directors. Market quotes are considered not readily available where there is an absence of current |
The Hartford Municipal Real Return Fund (formerly The Hartford Tax-Free National Fund) |
| Notes to Financial Statements – (continued) |
| October 31, 2011 |
(000’s Omitted) |
| | or reliable market-based data (e.g., trade information or broker quotes), including where events occur after the close of the relevant market, but prior to the NYSE Close that materially affect the values of the Fund’s portfolio securities or assets. In addition, market quotes are considered not readily available when, due to extraordinary circumstances, the exchanges or markets on which the securities trade do not open for trading for the entire day and no other market prices are available. In addition, prices of foreign equities that are principally traded on certain foreign markets are adjusted daily pursuant to a fair value pricing service approved by the Board of Directors in order to reflect an adjustment for the factors occurring after the close of certain foreign markets but before the NYSE Close. Securities that are primarily traded on foreign markets may trade on days that are not business days of the Fund. The value of the foreign securities in which the Fund invests may change on days when a shareholder will not be able to purchase or redeem shares of the Fund. Fair value pricing is subjective in nature and the use of fair value pricing by the Fund may cause the NAV of its shares to differ significantly from the NAV that would have been calculated using market prices at the close of the exchange on which a portfolio security is primarily traded. There can be no assurance that the Fund could obtain the fair market value assigned to a security if the Fund were to sell the security at approximately the time at which the Fund determines its NAV. |
Fixed income securities (other than short term obligations) and non-exchange traded derivatives held by the Fund are normally valued on the basis of quotes obtained from brokers and dealers or independent pricing services in accordance with procedures established by the Company’s Board of Directors. Prices obtained from independent pricing services use information provided by market makers or estimates of market values obtained from yield data relating to investments or securities with similar characteristics. Generally, the Fund may use fair valuation in regard to fixed income securities when the Fund holds defaulted or distressed securities or securities in a company in which a reorganization is pending. Short-term investments maturing in 60 days or less are generally valued at amortized cost, if their original term to maturity was 60 days or less, or by amortizing their value on the 61st day prior to maturity, if the original term to maturity exceeded 60 days.
Financial instruments for which prices are not available from an independent pricing service may be valued using market quotations obtained from one or more dealers that make markets in the respective financial instrument in accordance with procedures established by the Company’s Board of Directors.
Investments in open-end mutual funds are valued at the respective NAV of each open-end mutual fund on the Valuation Date.
U.S. GAAP defines fair value as the price that the Fund would receive to sell an asset or pay to transfer a liability in an orderly transaction between market participants. The U.S. GAAP fair value measurement standards require disclosure of a fair value hierarchy for each major category of assets and liabilities. Various inputs are used in determining the fair value of the Fund’s investments. These inputs are summarized into three broad hierarchy levels. This hierarchy is based on whether the valuation inputs are observable or unobservable. These levels are:
| | · | Level 1 – Quoted prices in active markets for identical securities. Level 1 may include exchange traded instruments such as domestic equities, some foreign equities, options, futures, mutual funds, exchange traded funds, rights and warrants. |
| | · | Level 2 – Observable inputs other than Level 1 prices, such as quoted prices for similar securities; quoted prices in markets that are not active; or other inputs that are observable or can be corroborated by observable market data. Level 2 may include debt securities that are traded less frequently than exchange traded instruments and which are valued using third party pricing services; foreign equities, that are principally traded on certain foreign markets and are adjusted daily pursuant to a fair value pricing service in order to reflect an adjustment for the factors occurring after the close of certain foreign markets but before the NYSE Close; and short-term securities, which are valued at amortized cost. |
| | · | Level 3 – Significant unobservable inputs that are supported by limited or no market activity. Level 3 may include financial instruments whose values are determined using broker quotes or require significant management judgment or estimation. These unobservable valuation inputs may include estimates for current |
| | yields, maturity/duration, prepayment speed, and broker quotes for comparable securities along with other assumptions relating to credit quality, collateral value, complexity of the security structure, general market conditions and liquidity. This category may include securities where trading has been halted or there are certain restrictions on trading. While these securities are priced using unobservable inputs, the valuation of these securities reflects the best available data and management believes the prices are a reasonable representation of exit price. |
Valuation levels are not necessarily indicative of the risk associated with investing in such securities. Individual securities within any of the above mentioned asset classes may be assigned a different hierarchical level than those presented above, as individual circumstances dictate.
For additional information, refer to the Investment Valuation Hierarchy Level Summary and the Level 3 roll forward reconciliation which follow the Schedule of Investments.
For purposes of reporting transfers between different hierarchy levels, both transfers in and out of each level, as applicable, are shown as if they occurred at the beginning of the period.
| | c) | Security Transactions and Investment Income – Security transactions are recorded as of the trade date (the date the order to buy or sell is executed) for financial reporting purposes. Securities purchased or sold on a when-issued or delayed-delivery basis may be settled a month or more after the trade date. Realized gains and losses are determined on the basis of identified cost. |
Dividend income is accrued as of the ex-dividend date, except certain dividends from foreign securities where the ex-dividend date may have passed are recorded as soon as the Fund is informed of the dividend. Interest income, including amortization of premium and accretion of discounts, is accrued on a daily basis.
| | d) | Fund Share Valuation and Dividend Distributions to Shareholders – Orders for the Fund’s shares are executed in accordance with the investment instructions of the shareholders. The NAV of the Fund’s shares is determined as of the close of business on each business day of the Exchange. The NAV is determined separately for each class of shares of the Fund by dividing the Fund’s net assets attributable to that class by the number of shares of the class outstanding. Each class of shares offered by the Fund has equal rights as to assets and voting privileges (except that shareholders of a class have exclusive voting rights regarding any matter relating solely to that class of shares). Income and non-class specific expenses are allocated daily to each class on the basis of the relative net assets of the class. Realized and unrealized capital gains and losses are allocated daily based on the relative net assets of each class of shares of the Fund. |
Orders for the purchase of the Fund’s shares received prior to the close of the Exchange on any day the Exchange is open for business are priced at the NAV determined as of the close of the Exchange. Orders received after the close of the Exchange, or on a day on which the Exchange and/or the Fund is not open for business, are priced at the next determined NAV.
Dividends are declared pursuant to a policy adopted by the Company’s Board of Directors based upon the investment performance of the Fund. Normally, dividends from net investment income are declared daily and paid monthly. Dividends from realized capital gains, if any, are paid at least once a year.
Distributions from net investment income, net realized capital gains and capital are determined in accordance with federal income tax regulations, which may differ from U.S. GAAP with respect to character and timing. These differences may include but are not limited to losses deferred due to wash sale adjustments, foreign currency gains and losses, adjustments related to Passive Foreign Investment Companies (“PFICs”), Real Estate Investment Trusts (“REITs”), Regulated Investment Companies (“RICs”), certain derivatives and partnerships. Permanent book and federal income tax basis differences relating to shareholder distributions will result in reclassifications to certain of the Fund’s capital accounts (see Federal Income Taxes: Reclassification of Capital Accounts note).
The Hartford Municipal Real Return Fund (formerly The Hartford Tax-Free National Fund) |
| Notes to Financial Statements – (continued) |
| October 31, 2011 |
(000’s Omitted) |
| 3. | Securities and Other Investments: |
| | a) | Illiquid and Restricted Securities – The Fund is permitted to invest up to 15% of its net assets in illiquid securities. Illiquid securities are those that may not be sold or disposed of in the ordinary course of business within seven days, at approximately the price used to determine the Fund’s NAV. The Fund may not be able to sell illiquid securities or other investments when its sub-adviser considers it desirable to do so or may have to sell such securities or investments at a price that is lower than the price that could be obtained if the securities or investments were more liquid. A sale of illiquid securities or other investments may require more time and may result in higher dealer discounts and other selling expenses than does the sale of those that are liquid. Illiquid securities and investments also may be more difficult to value due to the unavailability of reliable market quotations for such securities or investments, and an investment in them may have an adverse impact on the Fund’s NAV. The Fund may also purchase certain restricted securities that can only be resold to certain qualified investors and may be determined to be liquid pursuant to policies and guidelines established by the Company’s Board of Directors. The Fund, as shown on the Schedule of Investments, had illiquid and/or restricted securities as of October 31, 2011. |
| | b) | Securities Purchased on a When-Issued or Delayed-Delivery Basis – Delivery and payment for securities that have been purchased by the Fund on a forward commitment, or when-issued or delayed-delivery basis, take place beyond the customary settlement period. A fund may dispose of or renegotiate a delayed-delivery transaction after it is entered into, and may sell delayed-delivery securities before they are delivered, which may result in a realized gain or loss. During this period, such securities are subject to market fluctuations, and the Fund identifies securities segregated in its records with value at least equal to the amount of the commitment. The Fund, as shown on the Schedule of Investments, had when-issued or delayed delivery securities as of October 31, 2011. |
| 4. | Financial Derivative Instruments: |
The following disclosures contain information on how and why the Fund uses derivative instruments, the credit-risk-related contingent features in certain derivative instruments, and how derivative instruments affect the Fund’s financial position and results of operations. The location and fair value amounts of these instruments on the Statement of Assets and Liabilities and the realized gains and losses and changes in unrealized gains and losses on the Statement of Operations, each categorized by type of derivative contract, are included in the following Additional Derivative Instrument Information footnote. The derivative instruments outstanding as of period-end are disclosed in the notes to the Schedule of Investments and the amounts of realized gains and losses and changes in unrealized gains and losses on derivative instruments during the period are disclosed in the Statement of Operations.
| | a) | Swap Agreements – The Fund may invest in swap agreements. Swap agreements are privately negotiated agreements between the Fund and a counterparty to exchange or swap investment cash flows, assets, foreign currencies or market-linked returns at specified future intervals. The Fund enters into credit default, total return, cross-currency, interest rate, inflation and other forms of swap agreements to manage its exposure to credit, currency, interest rate, commodity and inflation risk. Swap agreements are also used to gain exposure to certain markets. In connection with these agreements, securities or cash may be identified as collateral in accordance with the terms of the respective swap agreements to provide assets of value and recourse in the event of default or bankruptcy/insolvency. Swaps are valued based on custom valuations furnished by an independent pricing service. Swaps for which prices are not available from an independent pricing service are valued in accordance with procedures established by the Company’s Board of Directors, and the change in value, if any, is recorded as an unrealized gain or loss on the Statement of Assets and Liabilities. Payments received or made at the beginning of the measurement period are reflected as such on the Statement of Assets and Liabilities and represent payments made or received upon entering into the swap agreement to compensate for differences between the stated terms of the swap agreement and prevailing market conditions (credit spreads, currency exchange rates, interest rates, and other relevant factors). These upfront payments are recorded as realized gains or losses on the Statement of Operations upon termination or maturity of the swap. A liquidation payment received or made at the termination of the swap and some net periodic payments received or paid by the Fund are recorded as realized gains or losses on the Statement of Operations. Net periodic payments and some upfront payments received or paid by the Fund |
| | with regard to interest rate swaps are recorded as increases or decreases to income on the Statement of Operations. Entering into these agreements involves, to varying degrees, elements of credit, market and documentation risk in excess of the amounts recognized on the Statement of Assets and Liabilities. Such risks involve the possibility that there will be no liquid market for these agreements, that the counterparty to the agreements may default on its obligation to perform or disagree as to the meaning of contractual terms in the agreements, and that there may be unfavorable changes in interest rates. The Fund’s maximum risk of loss from counterparty credit risk is the discounted net value of the cash flows to be received from the counterparty over the contract’s remaining life, to the extent that amount is positive. The risk is mitigated by having a master netting arrangement between the Fund and the counterparty, which allows for the netting of payments made or received (although such amounts are presented on a gross basis within the Statement of Assets and Liabilities, as applicable) as well as the posting of collateral to the Fund to cover the Fund’s exposure to the counterparty. |
Interest Rate Swap Agreements – The Fund is subject to interest rate risk in the normal course of pursuing its investment objectives. Because the Fund holds fixed rate bonds, the value of these bonds may decrease if interest rates rise. To help hedge against this risk and to maintain its ability to generate income at prevailing market rates, the Fund may enter into interest rate swap agreements. In a typical interest rate swap, one party agrees to make regular payments equal to a floating interest rate, based on a specified interest rate benchmark (e.g., London Interbank Offered Rate (“LIBOR”)) or index (e.g., U.S. Consumer Price Index), multiplied by a “notional principal amount”, in return for payments equal to a fixed rate multiplied by the same amount, for a specific period of time. The net interest received or paid on interest rate swap contracts is accrued daily as interest income/expense. Interest rate swaps are marked to market daily and the change, if any, is recorded as an unrealized gain or loss in the Statement of Operations. When the interest rate swap agreement is terminated early, the Fund records a realized gain or loss equal to the difference between the current realized value and the expected cash flows.
If an interest rate swap contract provides for payments in different currencies, the parties might agree to exchange the notional principal amount as well. Interest rate swaps may also depend on other prices or rates, such as the value of an index or mortgage prepayments rates. The risks of interest rate swaps include changes in market conditions which will affect the value of the contract or the cash flows and the possible inability of the counterparty to fulfill its obligations under the agreement. The Fund’s maximum risk of loss from counterparty credit risk is the discounted net value of the cash flows to be received from the counterparty over the agreement’s remaining life, to the extent that the amount is positive. This risk may be mitigated by having a master netting arrangement between the Fund and the counterparty (although such amounts are presented on a gross basis within the Statement of Assets and Liabilities, as applicable) or by posting collateral by the counterparty to the Fund to cover the Fund’s exposure to the counterparty. The Fund, as shown on the Schedule of Investments, had outstanding interest rate swaps as of October 31, 2011.
| | b) | Additional Derivative Instrument Information: |
Fair Values of Derivative Instruments on the Statement of Assets and Liabilities as of October 31, 2011:
| | | Risk Exposure Category | |
| | | Interest Rate Contracts | | | Foreign Exchange Contracts | | | Credit Contracts | | | Equity Contracts | | | Commodity Contracts | | | Other Contracts | | | Total | |
| Assets: | | | | | | | | | | | | | | | | | | | | | |
| Unrealized appreciation on swap contracts | | $ | 284 | | | $ | — | | | $ | — | | | $ | — | | | $ | — | | | $ | — | | | $ | 284 | |
| Total | | $ | 284 | | | $ | — | | | $ | — | | | $ | — | | | $ | — | | | $ | — | | | $ | 284 | |
| | | | | | | | | | | | | | | | | | | | | | | | | | | | | |
| Liabilities: | | | | | | | | | | | | | | | | | | | | | | | | | | | | |
| Unrealized depreciation on swap contracts | | $ | 3,046 | | | $ | — | | | $ | — | | | $ | — | | | $ | — | | | $ | — | | | $ | 3,046 | |
| Total | | $ | 3,046 | | | $ | — | | | $ | — | | | $ | — | | | $ | — | | | $ | — | | | $ | 3,046 | |
The volume of derivatives that is presented in the Schedule of Investments is consistent with the derivative activity during the year ended October 31, 2011
The Hartford Municipal Real Return Fund (formerly The Hartford Tax-Free National Fund) |
| Notes to Financial Statements – (continued) |
| October 31, 2011 |
(000’s Omitted) |
The Effect of Derivative Instruments on the Statement of Operations for the year ended October 31, 2011:
| | | Risk Exposure Category | |
| | | Interest Rate Contracts | | | Foreign Exchange Contracts | | | Credit Contracts | | | Equity Contracts | | | Commodity Contracts | | | Other Contracts | | | Total | |
| Realized Gain (Loss) on Derivatives Recognized as a Result of Operations: | |
| Net realized gain on swap contracts | | $ | 87 | | | $ | — | | | $ | — | | | $ | — | | | $ | — | | | $ | — | | | $ | 87 | |
| Total | | $ | 87 | | | $ | — | | | $ | — | | | $ | — | | | $ | — | | | $ | — | | | $ | 87 | |
| | | | | | | | | | | | | | | | | | | | | | | | | | | | | |
| Net Change in Unrealized Appreciation (Depreciation) on Derivatives Recognized as a Result of Operations: | |
| Net change in unrealized depreciation of swap contracts | | $ | (2,762 | ) | | $ | — | | | $ | — | | | $ | — | | | $ | — | | | $ | — | | | $ | (2,762 | ) |
| Total | | $ | (2,762 | ) | | $ | — | | | $ | — | | | $ | — | | | $ | — | | | $ | — | | | $ | (2,762 | ) |
| | a) | Credit and Counterparty Risks – Credit risk depends largely on the perceived financial health of bond issuers. In general, the credit rating is inversely related to the credit risk of the issuer. Higher rated bonds generally are deemed to have less credit risk, while lower or unrated bonds are deemed to have higher risk of default. The share price, yield and total return of a fund that holds securities with higher credit risk may be more volatile than those of a fund that holds bonds with lower credit risk. Similar to credit risk, the Fund may be exposed to counterparty risk, or the risk that an institution or other entity with which the Fund has unsettled or open transactions will default. |
| | b) | Market Risks – The Fund’s investments expose the Fund to various risks including, but not limited to, interest rate, prepayment and extension risks. Interest rate risk is the risk that fixed income securities will decline in value because of changes in interest rates. As nominal interest rates rise, the values of certain fixed income securities held by the Fund are likely to decrease. A nominal interest rate can be described as the sum of a real interest rate and an expected inflation rate. Fixed income securities with longer durations tend to be more sensitive to changes in interest rates, usually making them more volatile than securities with shorter durations. Duration is useful primarily as a measure of the sensitivity of a fixed income security’s market price to interest rate (i.e. yield) movements. In addition, securities are subject to extension risk. Rising interest rates may cause prepayments to occur at a slower than expected rate, thereby effectively lengthening the maturity of the security and making the security more sensitive to interest rate changes. |
| | a) | Federal Income Taxes – For federal income tax purposes, the Fund intends to continue to qualify as a RIC under Subchapter M of the Internal Revenue Code (“IRC”) by distributing substantially all of its taxable net investment income and net realized capital gains to its shareholders and otherwise complying with the requirements of RICs. The Fund has distributed substantially all of its income and capital gains in prior years, if applicable, and intends to distribute substantially all of its income and capital gains during the calendar year ending December 31, 2011. Accordingly, no provision for federal income or excise taxes has been made in the accompanying financial statements. Distributions from short-term capital gains are treated as ordinary income distributions for federal income tax purposes. |
| | b) | Net Investment Income (Loss), Net Realized Gains (Losses) – Net investment income (loss) and net realized gains (losses) may differ for financial statement and tax purposes primarily because of losses deferred due to wash sale adjustments, foreign currency gains and losses, adjustments related to PFICs, REITs, RICs, certain derivatives and partnerships. The character of distributions made during the year from net investment income or net realized gains may differ from their ultimate characterization for federal income tax purposes. Also, due to the timing of dividend distributions, the fiscal year in which amounts are distributed may differ from the year that the income or realized gains (losses) were recorded by the Fund. |
| | c) | Distributions and Components of Distributable Earnings – The tax character of distributions paid by the Fund for the periods indicated is as follows (as adjusted for dividends payable): |
| | | For the Year Ended October 31, 2011 | | | For the Year Ended October 31, 2010 | |
| Tax Exempt Income † | | $ | 9,598 | | | $ | 11,621 | |
| Ordinary Income | | | 45 | | | | — | |
| | † | The Fund designates these distributions as exempt interest pursuant to IRC Sec. 852(b)(5). |
As of October 31, 2011, the Fund’s components of distributable earnings (deficit) on a tax basis were as follows:
| | | Amount | |
| Undistributed Ordinary Income | | $ | 134 | |
| Accumulated Capital Losses * | | | (50,869 | ) |
| Unrealized Appreciation † | | | 4,474 | |
| Total Accumulated Deficit | | $ | (46,261 | ) |
| | * | The Fund has capital loss carryforwards that are identified in the Capital Loss Carryforward note that follows. |
| | † | The differences between book-basis and tax-basis unrealized appreciation (depreciation) may be attributable to the losses deferred due to wash sale adjustments, foreign currency gains and losses, adjustments related to PFICs, REITs, RICs, certain derivatives and partnerships. |
| | d) | Reclassification of Capital Accounts – The Fund may record reclassifications in its capital accounts. These reclassifications have no impact on the total net assets of the Fund. The reclassifications are a result of permanent differences between U.S. GAAP and tax accounting for such items as foreign currency, PFICs, expiration or utilization of capital loss carryforwards or net operating losses. Adjustments are made to reflect the impact these items have on current and future distributions to shareholders. Therefore, the source of the Fund’s distributions may be shown in the accompanying Statement of Changes in Net Assets as from accumulated undistributed net investment income, from accumulated net realized gains on investments or from capital depending on the type of book and tax differences that exist. For the year ended October 31, 2011, the Fund had no reclassifications. |
| | e) | Capital Loss Carryforward – At October 31, 2011 (tax-year-end), the Fund had capital loss carryforwards for U.S. federal income tax purposes of approximately: |
Year of Expiration | | Amount | |
| 2013 | | $ | 5 | |
| 2014 | | | 433 | |
| 2015 | | | 2,885 | |
| 2016 | | | 23,183 | |
| 2017 | | | 16,621 | |
| 2018 | | | 6,088 | |
| 2019 | | | 1,654 | |
| Total | | $ | 50,869 | |
As a result of mergers in the Fund, certain provisions in the IRC may limit future utilization of capital losses.
The Hartford Municipal Real Return Fund (formerly The Hartford Tax-Free National Fund) |
| Notes to Financial Statements – (continued) |
| October 31, 2011 |
(000’s Omitted) |
| | f) | Accounting for Uncertainty in Income Taxes – The Fund has adopted financial reporting rules that require the Fund to analyze all open tax years, as defined by the statute of limitations, for all major jurisdictions. Generally, tax authorities can examine all tax returns filed for the last three years. The Fund does not have an examination in progress. |
The Fund has reviewed all open tax years and major jurisdictions and concluded that these financial reporting rules had no effect on the Fund’s financial position or results of operations. There is no tax liability resulting from unrecognized tax benefits relating to uncertain income tax positions taken or expected to be taken on the tax return for the fiscal year ended October 31, 2011. The Fund is also not aware of any tax positions for which it is reasonably possible that the total amounts of unrecognized tax benefits will significantly change in the next twelve months.
| | a) | Investment Management Agreement – Hartford Investment Financial Services, LLC (“HIFSCO”), a wholly-owned indirect subsidiary of The Hartford Financial Services Group, Inc. (“The Hartford”), serves as investment manager to the Fund pursuant to an Investment Management Agreement with the Company. As investment manager, HIFSCO has overall investment supervisory responsibility for the Fund. In addition, HIFSCO provides administrative personnel, services, equipment, facilities and office space for proper operation of the Fund. HIFSCO has contracted with Hartford Investment Management Company (“Hartford Investment Management”) under a sub-advisory agreement for the provision of day-to-day investment management services to the Fund in accordance with the Fund’s investment objective and policies. The Fund pays a fee to HIFSCO, a portion of which may be used to compensate Hartford Investment Management. |
The schedule below reflects the rates of compensation paid to HIFSCO for investment management services rendered as of October 31, 2011; the rates are accrued daily and paid monthly:
| Average Daily Net Assets | | Annual Fee | |
| On first $500 million | | | 0.50 | % |
| On next $4.5 billion | | | 0.45 | % |
| On next $5 billion | | | 0.43 | % |
| Over $10 billion | | | 0.42 | % |
| | b) | Accounting Services Agreement – Pursuant to the Fund Accounting Agreement between Hartford Life Insurance Company (“HLIC”) and the Company, on behalf of the Fund, HLIC provides accounting services to the Fund and receives monthly compensation based on the Fund’s average net assets at the rates set forth below. The Fund’s accounting services fees are accrued daily and paid monthly. |
| Average Daily Net Assets | | Annual Fee | |
| On first $5 billion | | | 0.014 | % |
| On next $5 billion | | | 0.012 | % |
| Over $10 billion | | | 0.010 | % |
Effective November 1, 2011, accounting services fees based on the Fund’s average daily net assets were increased by 0.002%. The new accounting services fees schedule is as follows:
| Average Daily Net Assets | | Annual Fee | |
| On first $5 billion | | | 0.016 | % |
| On next $5 billion | | | 0.014 | % |
| Over $10 billion | | | 0.012 | % |
| | c) | Operating Expenses – Allocable expenses incurred by the Company are allocated to each Fund and allocated to classes within the Fund in proportion to the average daily net assets of the Fund and each class, except where allocation of certain expenses is more fairly made directly to the Fund or to specific classes within a Fund. As of October 31, 2011, HIFSCO contractually limited the total operating expenses of this Fund, exclusive of taxes, interest expense, brokerage commissions, acquired fund fees and expenses and extraordinary expenses as follows: |
| Class A | | | Class B | | | Class C | | | Class I | | | Class Y | |
| 0.85 | % | | | 1.60 | % | | | 1.60 | % | | | 0.60 | % | | | 0.60 | % |
| | d) | Fees Paid Indirectly – The Fund’s custodian bank, State Street Bank and Trust Co., has agreed to reduce its fees when the Fund maintains cash on deposit in a non-interest-bearing custody account. For the year ended October 31, 2011, these amounts are included in the Statement of Operations. |
The ratio of expenses to average net assets in the accompanying financial highlights excludes the reduction in expenses related to fees paid indirectly. The annualized expense ratio for the period listed below including the fees paid indirectly is as follows:
| | | Year Ended October 31, 2011 | |
| Class A Shares | | | 0.85 | % |
| Class B Shares | | | 1.60 | |
| Class C Shares | | | 1.60 | |
| Class I Shares | | | 0.60 | |
| Class Y Shares | | | 0.60 | |
| | e) | Distribution and Service Plan for Class A, B and C Shares – HIFSCO is the principal underwriter and distributor of the Fund. HIFSCO is engaged in distribution activities, which include marketing and distribution of shares through broker-dealers, financing distribution costs and maintaining financial books and records. For the year ended October 31, 2011, HIFSCO received front-end load sales charges of $341 and contingent deferred sales charges of $28 from the Fund. |
The Fund has adopted a Distribution and Service Plan in accordance with Rule 12b-1 of the 1940 Act to compensate the distributor (HIFSCO) for activities intended to result in the sale and distribution of Class A, B and C shares and for providing services for shareholders. During its May 3, 2011 meeting, the Board of Directors approved an amendment to the Fund’s Class A Plan to, effective August 1, 2011, lower the amount of Rule 12b-1 distribution fees that may be charged in respect of Class A shares of the Fund from an annual rate of 0.35% of the Fund’s average daily net assets attributable to Class A shares to 0.25%. The Board of Directors has authorized Rule 12b-1 payments of up to 0.25% of the Fund’s average daily net assets attributable to Class A shares. As a result, the amendment to the Class A Plan did not affect the fees charged under the plan. Some or all of the fee may be used for shareholder servicing expenses with the remainder used for distribution expenses. Some or the entire Rule 12b-1 fee for Class B shares may be remitted to broker-dealers for distribution and/or shareholder account services. Under the Class B Plan, the Fund pays the distributor 1.00% of the average daily net assets of Class B shares that are outstanding for 8 years or less, 0.25% of which is a fee for services provided to existing shareholders with the remainder used for distribution expenses. After eight years, Class B shares convert to Class A shares. Upon conversion to Class A shares, the Class A plan described above will apply to those shares. Under the Class C Plan, the Fund pays the distributor 1.00% of the average daily net assets of Class C shares outstanding, 0.25% of which is intended as a fee for services provided to existing shareholders with the remainder used for distribution expenses. For Class C shares, some or the entire fee may be remitted to broker-dealers for distribution and/or shareholder account services. The Fund’s 12b-1 fees are accrued daily and paid monthly.
For the year ended October 31, 2011, total sales commissions paid to affiliated brokers/dealers of The Hartford for distributing the Fund's shares were $5. These commissions are in turn paid to sales representatives of the broker/dealers.
The Hartford Municipal Real Return Fund (formerly The Hartford Tax-Free National Fund) |
Notes to Financial Statements – (continued) |
|
(000’s Omitted) |
| | f) | Other Related Party Transactions – Certain officers of the Fund are directors and/or officers of HIFSCO and/or The Hartford or its subsidiaries. For the year ended October 31, 2011, a portion of the Fund’s chief compliance officer’s compensation was paid by all of the investment companies in the Hartford fund complex. The portion allocated to the Fund rounds to zero. Hartford Administrative Services Company (“HASCO”), an indirect wholly-owned subsidiary of The Hartford, provides transfer agent services to the Fund. HASCO has contractually agreed to reimburse any portion of the transfer agency fees over 0.30% of average daily net assets per fiscal year for each class. HASCO was compensated on a per account basis, which varies by share class, for providing such services. The amount to HASCO and any related contractual reimbursement amounts, if applicable, can be found in the Statement of Operations. These fees are accrued daily and paid monthly. |
| 8. | Investment Transactions: |
For the year ended October 31, 2011, the Fund's aggregate purchases and sales of investment securities (excluding short-term investments) were as follows:
| | | Amount | |
| Cost of Purchases Excluding U.S. Government Obligations | | $ | 60,716 | |
| Sales Proceeds Excluding U.S. Government Obligations | | | 106,939 | |
| 9. | Capital Share Transactions: |
The following information is for the year ended October 31, 2011, and the year ended October 31, 2010:
| | | For the Year Ended October 31, 2011 | | | For the Year Ended October 31, 2010 | |
| | | | | | Shares Issued for Reinvested Dividends | | | | | | | | | Net Increase (Decrease) of Shares | | | | | | Shares Issued for Reinvested Dividends | | | | | | | | | Net Increase (Decrease) of Shares | |
| Class A | | | | | | | | | | | | | | | | | | | | | | | | | | | | | | |
| Shares | | | 4,004 | | | | 560 | | | | (6,740 | ) | | | 723 | | | | (1,453 | ) | | | 4,674 | | | | 646 | | | | (5,542 | ) | | | — | | | | (222 | ) |
| Amount | | $ | 36,513 | | | $ | 5,079 | | | $ | (61,073 | ) | | $ | 8,202 | | | $ | (11,279 | ) | | $ | 43,441 | | | $ | 6,003 | | | $ | (51,462 | ) | | $ | — | | | $ | (2,018 | ) |
| Class B | | | | | | | | | | | | | | | | | | | | | | | | | | | | | | | | | | | | | | | | |
| Shares | | | 21 | | | | 20 | | | | (323 | ) | | | — | | | | (282 | ) | | | 74 | | | | 28 | | | | (274 | ) | | | — | | | | (172 | ) |
| Amount | | $ | 187 | | | $ | 179 | | | $ | (2,895 | ) | | $ | — | | | $ | (2,529 | ) | | $ | 688 | | | $ | 254 | | | $ | (2,522 | ) | | $ | — | | | $ | (1,580 | ) |
| Class C | | | | | | | | | | | | | | | | | | | | | | | | | | | | | | | | | | | | | | | | |
| Shares | | | 1,249 | | | | 131 | | | | (1,727 | ) | | | — | | | | (347 | ) | | | 1,270 | | | | 135 | | | | (1,051 | ) | | | — | | | | 354 | |
| Amount | | $ | 11,342 | | | $ | 1,183 | | | $ | (15,449 | ) | | $ | — | | | $ | (2,924 | ) | | $ | 11,713 | | | $ | 1,249 | | | $ | (9,683 | ) | | $ | — | | | $ | 3,279 | |
| Class I | | | | | | | | | | | | | | | | | | | | | | | | | | | | | | | | | | | | | | | | |
| Shares | | | 942 | | | | 35 | | | | (696 | ) | | | — | | | | 281 | | | | 259 | | | | 33 | | | | (172 | ) | | | — | | | | 120 | |
| Amount | | $ | 8,554 | | | $ | 318 | | | $ | (6,313 | ) | | $ | — | | | $ | 2,559 | | | $ | 2,433 | | | $ | 309 | | | $ | (1,607 | ) | | $ | — | | | $ | 1,135 | |
| Class L | | | | | | | | | | | | | | | | | | | | | | | | | | | | | | | | | | | | | | | | |
| Shares | | | 6 | | | | 21 | | | | (89 | ) | | | (726 | ) | | | (788 | ) | | | 6 | | | | 29 | | | | (39 | ) | | | — | | | | (4 | ) |
| Amount | | $ | 54 | | | $ | 187 | | | $ | (798 | ) | | $ | (8,202 | ) | | $ | (8,759 | ) | | $ | 55 | | | $ | 271 | | | $ | (366 | ) | | $ | — | | | $ | (40 | ) |
| Class Y | | | | | | | | | | | | | | | | | | | | | | | | | | | | | | | | | | | | | | | | |
| Shares | | | 38 | | | | 121 | | | | (411 | ) | | | — | | | | (252 | ) | | | 18 | | | | 132 | | | | (321 | ) | | | — | | | | (171 | ) |
| Amount | | $ | 342 | | | $ | 1,096 | | | $ | (3,699 | ) | | $ | — | | | $ | (2,261 | ) | | $ | 168 | | | $ | 1,228 | | | $ | (2,976 | ) | | $ | — | | | $ | (1,580 | ) |
| Total | | | | | | | | | | | | | | | | | | | | | | | | | | | | | | | | | | | | | | | | |
| Shares | | | 6,260 | | | | 888 | | | | (9,986 | ) | | | (3 | ) | | | (2,841 | ) | | | 6,301 | | | | 1,003 | | | | (7,399 | ) | | | — | | | | (95 | ) |
| Amount | | $ | 56,992 | | | $ | 8,042 | | | $ | (90,227 | ) | | $ | — | | | $ | (25,193 | ) | | $ | 58,498 | | | $ | 9,314 | | | $ | (68,616 | ) | | $ | — | | | $ | (804 | ) |
The following reflects the conversion of Class B shares into Class A shares (reflected as Class A shares sold) for the year ended October 31, 2011, and the year ended October 31, 2010:
| | | Shares | | | Dollars | |
| For the Year Ended October 31, 2011 | | | 73 | | | $ | 662 | |
| For the Year Ended October 31, 2010 | | | 39 | | | $ | 364 | |
| 10. | Proceeds from Regulatory Settlement: |
During the year ended October 31, 2010, as a result of a settlement of an administrative proceeding brought by the SEC against an unaffiliated third party relating to market timing and/or late trading of mutual funds, the Fund received $3, which represented the Fund’s portion of the proceeds from the settlement (the Fund was not a party to the proceeding). The proceeds received by the Fund were recorded as an increase to additional paid-in-capital. The payment did not have a material impact on the Fund’s NAV.
The Fund is one of several Hartford funds that participate in a $500 million committed revolving line of credit facility. The facility is to be used for temporary or emergency purposes. Under the arrangement, the funds are required to own securities having a market value in excess of 300% of the total bank borrowings. The interest rate on borrowings varies depending on the nature of the loan. The facility also requires a fee to be paid based on the amount of the commitment. This commitment fee is allocated to all of the funds participating in the line of credit based on the average net assets of the funds. During the year ended October 31, 2011, the Fund did not have any borrowings under this facility.
At its May 3, 2011, meeting, the Board of Directors of The Hartford Mutual Funds II, Inc. approved the reclassification of Class L shares into Class A shares of the Fund.
Effective with the close of business on August 5, 2011, Class L was merged into Class A. The merger was accomplished by a tax-free exchange as detailed below:
| | | Class A | | | Class L | |
| Shares exchanged | | | N/A | | | | 726 | |
| Shares issued - to Class L shareholders | | | 723 | | | | N/A | |
| Net assets immediately before merger | | $ | 122,513 | | | $ | 6,714 | |
| Net assets immediately after merger | | $ | 129,227 | | | | N/A | |
| 13. | Pending Legal Proceedings: |
On February 25, 2011, Jennifer L. Kasilag, Louis Mellinger, Judith M. Menendez, Jacqueline M. Robinson, and Linda A. Russell filed a derivative lawsuit against HIFSCO on behalf of six funds: The Hartford Global Health Fund (now known as The Hartford Healthcare Fund), The Hartford Conservative Allocation Fund, The Hartford Growth Opportunities Fund, The Hartford Inflation Plus Fund, The Hartford Advisers Fund and The Hartford Money Market Fund. The lawsuit, which was filed in the United States District Court for the District of New Jersey, seeks recovery under Section 36(b) of the 1940 Act for the alleged overpayment of investment management and 12b-1 distribution fees to HIFSCO. The plaintiffs seek recovery of the alleged overpayments or, alternatively, rescission of the contracts and restitution of all fees paid, together with lost earnings. On November 14, 2011, the plaintiffs filed an amended complaint, which dropped The Hartford Money Market Fund and added The Hartford Capital Appreciation Fund as a plaintiff. The Hartford intends to vigorously defend the action.
No accrual for litigation relating to this matter has been recorded in the financial statements of the Fund because the Fund is not party to the suit.
Under the Company’s organizational documents, the Company shall indemnify its officers and directors to the full extent required or permitted under Maryland General Corporation Law and the federal securities laws. In addition, the Company, on behalf of the Fund, may enter into contracts that contain a variety of indemnifications. The Company’s maximum exposure under these arrangements is unknown. However, as of the date of these financial statements, the Company has not had prior claims or losses pursuant to these contracts and expects the risk of loss to be remote.
|
|
- Selected Per-Share Data (A) - |
| | Net Asset Value at Beginning of Period | | | Net Investment Income (Loss) | | | Payments from (to) Affiliate | | | Net Realized and Unrealized Gain (Loss) on Investments | | | Total from Investment Operations | | | Dividends from Net Investment Income | | | Distributions from Realized Capital Gains | | | Distributions from Capital | | | | | | Net Increase (Decrease) in Net Asset Value | | | Net Asset Value at End of Period | |
| | |
| For the Year Ended October 31, 2011 | |
| A(E) | | $ | 9.50 | | | $ | 0.41 | | | $ | – | | | $ | (0.30 | ) | | $ | 0.11 | | | $ | (0.41 | ) | | $ | – | | | $ | – | | | $ | (0.41 | ) | | $ | (0.30 | ) | | $ | 9.20 | |
| B | | | 9.43 | | | | 0.34 | | | | – | | | | (0.30 | ) | | | 0.04 | | | | (0.34 | ) | | | – | | | | – | | | | (0.34 | ) | | | (0.30 | ) | | | 9.13 | |
| C | | | 9.46 | | | | 0.34 | | | | – | | | | (0.31 | ) | | | 0.03 | | | | (0.34 | ) | | | – | | | | – | | | | (0.34 | ) | | | (0.31 | ) | | | 9.15 | |
| I | | | 9.52 | | | | 0.43 | | | | – | | | | (0.30 | ) | | | 0.13 | | | | (0.43 | ) | | | – | | | | – | | | | (0.43 | ) | | | (0.30 | ) | | | 9.22 | |
| Y | | | 9.48 | | | | 0.43 | | | | – | | | | (0.30 | ) | | | 0.13 | | | | (0.43 | ) | | | – | | | | – | | | | (0.43 | ) | | | (0.30 | ) | | | 9.18 | |
| | |
| For the Year Ended October 31, 2010 | |
| A | | | 9.11 | | | | 0.43 | | | | – | | | | 0.40 | | | | 0.83 | | | | (0.44 | ) | | | – | | | | – | | | | (0.44 | ) | | | 0.39 | | | | 9.50 | |
| B | | | 9.04 | | | | 0.36 | | | | – | | | | 0.40 | | | | 0.76 | | | | (0.37 | ) | | | – | | | | – | | | | (0.37 | ) | | | 0.39 | | | | 9.43 | |
| C | | | 9.07 | | | | 0.36 | | | | – | | | | 0.40 | | | | 0.76 | | | | (0.37 | ) | | | – | | | | – | | | | (0.37 | ) | | | 0.39 | | | | 9.46 | |
| I | | | 9.13 | | | | 0.46 | | | | – | | | | 0.39 | | | | 0.85 | | | | (0.46 | ) | | | – | | | | – | | | | (0.46 | ) | | | 0.39 | | | | 9.52 | |
| Y | | | 9.09 | | | | 0.46 | | | | – | | | | 0.39 | | | | 0.85 | | | | (0.46 | ) | | | – | | | | – | | | | (0.46 | ) | | | 0.39 | | | | 9.48 | |
| | |
| For the Year Ended October 31, 2009 | |
| A | | | 8.67 | | | | 0.43 | | | | – | | | | 0.44 | | | | 0.87 | | | | (0.43 | ) | | | – | | | | – | | | | (0.43 | ) | | | 0.44 | | | | 9.11 | |
| B | | | 8.61 | | | | 0.36 | | | | – | | | | 0.44 | | | | 0.80 | | | | (0.37 | ) | | | – | | | | – | | | | (0.37 | ) | | | 0.43 | | | | 9.04 | |
| C | | | 8.63 | | | | 0.37 | | | | – | | | | 0.44 | | | | 0.81 | | | | (0.37 | ) | | | – | | | | – | | | | (0.37 | ) | | | 0.44 | | | | 9.07 | |
| I | | | 8.69 | | | | 0.45 | | | | – | | | | 0.45 | | | | 0.90 | | | | (0.46 | ) | | | – | | | | – | | | | (0.46 | ) | | | 0.44 | | | | 9.13 | |
| Y | | | 8.65 | | | | 0.45 | | | | – | | | | 0.45 | | | | 0.90 | | | | (0.46 | ) | | | – | | | | – | | | | (0.46 | ) | | | 0.44 | | | | 9.09 | |
| | |
| For the Year Ended October 31, 2008 (F) | |
| A | | | 10.88 | | | | 0.48 | | | | – | | | | (2.21 | ) | | | (1.73 | ) | | | (0.48 | ) | | | – | | | | – | | | | (0.48 | ) | | | (2.21 | ) | | | 8.67 | |
| B | | | 10.80 | | | | 0.39 | | | | – | | | | (2.17 | ) | | | (1.78 | ) | | | (0.41 | ) | | | – | | | | – | | | | (0.41 | ) | | | (2.19 | ) | | | 8.61 | |
| C | | | 10.83 | | | | 0.39 | | | | – | | | | (2.18 | ) | | | (1.79 | ) | | | (0.41 | ) | | | – | | | | – | | | | (0.41 | ) | | | (2.20 | ) | | | 8.63 | |
| I | | | 10.90 | | | | 0.48 | | | | – | | | | (2.18 | ) | | | (1.70 | ) | | | (0.51 | ) | | | – | | | | – | | | | (0.51 | ) | | | (2.21 | ) | | | 8.69 | |
| Y | | | 10.86 | | | | 0.50 | | | | – | | | | (2.20 | ) | | | (1.70 | ) | | | (0.51 | ) | | | – | | | | – | | | | (0.51 | ) | | | (2.21 | ) | | | 8.65 | |
| | |
| For the Year Ended October 31, 2007 | |
| A | | | 11.34 | | | | 0.47 | | | | – | | | | (0.44 | ) | | | 0.03 | | | | (0.46 | ) | | | (0.03 | ) | | | – | | | | (0.49 | ) | | | (0.46 | ) | | | 10.88 | |
| B | | | 11.26 | | | | 0.38 | | | | – | | | | (0.43 | ) | | | (0.05 | ) | | | (0.38 | ) | | | (0.03 | ) | | | – | | | | (0.41 | ) | | | (0.46 | ) | | | 10.80 | |
| C | | | 11.29 | | | | 0.38 | | | | – | | | | (0.43 | ) | | | (0.05 | ) | | | (0.38 | ) | | | (0.03 | ) | | | – | | | | (0.41 | ) | | | (0.46 | ) | | | 10.83 | |
| I(G) | | | 11.17 | | | | 0.21 | | | | – | | | | (0.27 | ) | | | (0.06 | ) | | | (0.21 | ) | | | – | | | | – | | | | (0.21 | ) | | | (0.27 | ) | | | 10.90 | |
| Y(J) | | | 11.32 | | | | 0.51 | | | | – | | | | (0.46 | ) | | | 0.05 | | | | (0.48 | ) | | | (0.03 | ) | | | – | | | | (0.51 | ) | | | (0.46 | ) | | | 10.86 | |
| (A) | Information presented relates to a share outstanding throughout the indicated period. |
| (B) | Assumes initial investment at net asset value at the beginning of each period, reinvestment of all distributions, the complete redemption of the investment at net asset value at the end of each period and no sales charge. Total return would be reduced if sales charges were taken into account. |
| (C) | Ratios do not include fees paid indirectly (See Expenses in the accompanying Notes to Financial Statements). |
| (D) | Portfolio turnover rate is calculated on the basis of the Fund as a whole without distinguishing between the classes of shares issued. |
| (E) | Class L was merged into Class A on August 5, 2011 (See Class Merger in accompanying Notes to Financial Statements). |
| (F) | Per share amounts have been calculated using average shares outstanding method. |
| (G) | Commenced operations on May 31, 2007. |
| (J) | Classes H, M and N were merged into Class L and Class E was merged into Class Y on February 9, 2007. |
- Ratios and Supplemental Data - |
| | | Net Assets at End of Period (000's) | | | Ratio of Expenses to Average Net Assets Before Waivers and Reimbursements and Including Expenses not Subject to Cap(C) | | | Ratio of Expenses to Average Net Assets After Waivers and Reimbursements and Including Expenses not Subject to Cap(C) | | | Ratio of Expenses to Average Net Assets After Waivers and Reimbursements and Excluding Expenses not Subject to Cap(C) | | | Ratio of Net Investment Income (Loss) to Average Net Assets | | | | |
| | |
| 1.28 | % | | $ | 137,766 | | | | 0.90 | % | | | 0.85 | % | | | 0.85 | % | | | 4.52 | % | | | 29 | % |
| 0.54 | | | | 4,565 | | | | 1.70 | | | | 1.60 | | | | 1.60 | | | | 3.75 | | | | – | |
| 0.43 | | | | 43,214 | | | | 1.64 | | | | 1.60 | | | | 1.60 | | | | 3.72 | | | | – | |
| 1.53 | | | | 10,671 | | | | 0.64 | | | | 0.60 | | | | 0.60 | | | | 4.71 | | | | – | |
| 1.54 | | | | 29,686 | | | | 0.60 | | | | 0.60 | | | | 0.60 | | | | 4.73 | | | | – | |
| | |
| | |
| 9.26 | | | | 156,092 | | | | 0.86 | | | | 0.85 | | | | 0.85 | | | | 4.69 | | | | 19 | |
| 8.53 | | | | 7,376 | | | | 1.67 | | | | 1.60 | | | | 1.60 | | | | 3.94 | | | | – | |
| 8.50 | | | | 47,918 | | | | 1.62 | | | | 1.60 | | | | 1.60 | | | | 3.94 | | | | – | |
| 9.52 | | | | 8,343 | | | | 0.62 | | | | 0.60 | | | | 0.60 | | | | 4.93 | | | | – | |
| 9.59 | | | | 33,050 | | | | 0.57 | | | | 0.57 | | | | 0.57 | | | | 4.97 | | | | – | |
| | |
| | |
| 10.48 | | | | 151,639 | | | | 0.89 | | | | 0.85 | | | | 0.85 | | | | 4.96 | | | | 46 | |
| 9.62 | | | | 8,623 | | | | 1.70 | | | | 1.60 | | | | 1.60 | | | | 4.21 | | | | – | |
| 9.72 | | | | 42,730 | | | | 1.65 | | | | 1.60 | | | | 1.60 | | | | 4.23 | | | | – | |
| 10.74 | | | | 6,899 | | | | 0.65 | | | | 0.60 | | | | 0.60 | | | | 5.24 | | | | – | |
| 10.79 | | | | 33,239 | | | | 0.59 | | | | 0.59 | | | | 0.59 | | | | 5.22 | | | | – | |
| | |
| | |
| (16.40 | ) | | | 113,542 | | | | 0.94 | | | | 0.85 | | | | 0.85 | | | | 4.63 | | | | 77 | |
| (16.97 | ) | | | 5,223 | | | | 1.75 | | | | 1.60 | | | | 1.60 | | | | 3.87 | | | | – | |
| (17.02 | ) | | | 27,234 | | | | 1.70 | | | | 1.60 | | | | 1.60 | | | | 3.89 | | | | – | |
| (16.16 | ) | | | 4,705 | | | | 0.66 | | | | 0.60 | | | | 0.60 | | | | 4.89 | | | | – | |
| (16.22 | ) | | | 18,238 | | | | 0.65 | | | | 0.60 | | | | 0.60 | | | | 4.87 | | | | – | |
| | |
| | |
| 0.30 | | | | 115,459 | | | | 1.15 | | | | 0.85 | | | | 0.85 | | | | 4.20 | | | | 43 | |
| (0.45 | ) | | | 6,839 | | | | 1.95 | | | | 1.60 | | | | 1.60 | | | | 3.43 | | | | – | |
| (0.45 | ) | | | 22,467 | | | | 1.90 | | | | 1.60 | | | | 1.60 | | | | 3.45 | | | | – | |
| (0.54 | )(H) | | | 3,505 | | | | 0.87 | (I) | | | 0.60 | (I) | | | 0.60 | (I) | | | 4.81 | (I) | | | – | |
| 0.48 | | | | 26,275 | | | | 0.85 | | | | 0.65 | | | | 0.65 | | | | 4.78 | | | | – | |
|
The Board of Directors and Shareholders of |
The Hartford Mutual Funds II, Inc. |
We have audited the accompanying statement of assets and liabilities, including the schedule of investments, of The Hartford Municipal Real Return Fund (one of the portfolios constituting The Hartford Mutual Funds II, Inc. (the Funds)) as of October 31, 2011, and the related statement of operations for the year then ended, the statements of changes in net assets for each of the two years in the period then ended, and the financial highlights for each of the five years in the period then ended. These financial statements and financial highlights are the responsibility of the Funds’ management. Our responsibility is to express an opinion on these financial statements and financial highlights based on our audits.
We conducted our audits in accordance with the standards of the Public Company Accounting Oversight Board (United States). Those standards require that we plan and perform the audit to obtain reasonable assurance about whether the financial statements and financial highlights are free of material misstatement. We were not engaged to perform an audit of the Funds’ internal control over financial reporting. Our audits included consideration of internal control over financial reporting as a basis for designing audit procedures that are appropriate in the circumstances, but not for the purpose of expressing an opinion on the effectiveness of the Funds’ internal control over financial reporting. Accordingly, we express no such opinion. An audit also includes examining, on a test basis, evidence supporting the amounts and disclosures in the financial statements and financial highlights, assessing the accounting principles used and significant estimates made by management, and evaluating the overall financial statement presentation. Our procedures included confirmation of securities owned as of October 31, 2011, by correspondence with the custodian and brokers or by other appropriate auditing procedures where replies from brokers were not received. We believe that our audits provide a reasonable basis for our opinion.
In our opinion, the financial statements and financial highlights referred to above present fairly, in all material respects, the financial position of The Hartford Municipal Real Return Fund of The Hartford Mutual Funds II, Inc. at October 31, 2011, the results of its operations for the year then ended, the changes in its net assets for each of the two years in the period then ended, and the financial highlights for each of the five years in the period then ended, in conformity with U.S. generally accepted accounting principles.
Minneapolis, MN
December 16, 2011
|
Directors and Officers (Unaudited) |
The Board of Directors of the Company appoints officers who are responsible for the day-to-day operations of the Fund and who execute policies formulated by the Directors. Each director serves until his or her death, resignation, or retirement or until the next annual meeting of shareholders is held or until his or her successor is elected and qualifies.
Directors and officers who are employed by or who have a financial interest in The Hartford are considered “interested” persons of the Fund pursuant to the 1940 Act. Each officer and two of the Company’s directors, as noted in the chart below, are “interested” persons of the Fund. Each director serves as a director for The Hartford Mutual Funds, Inc., The Hartford Mutual Funds II, Inc., Hartford Series Fund, Inc., and Hartford HLS Series Fund II, Inc., and as a trustee for The Hartford Alternative Strategies Fund, which, as of October 31, 2011, collectively consist of 91 funds. Correspondence may be sent to directors and officers c/o Hartford Mutual Funds, P.O. Box 2999, Hartford, Connecticut 06104-2999, except that correspondence to Ms. Fagely may be sent to 500 Bielenberg Drive, Woodbury, Minnesota 55125.
The table below sets forth, for each director and officer, his or her name, year of birth, current position with the Company and date first elected or appointed to The Hartford Mutual Funds, Inc. (“MF”) and The Hartford Mutual Funds II, Inc. (“MF2”), principal occupation, and, for directors, other directorships held. The Fund’s statement of additional information contains further information on the directors and is available free of charge by calling 1-888-843-7824 or writing to Hartford Mutual Funds, P.O. Box 64387, St. Paul, MN 55164-0387.
Information on the aggregate remuneration paid to the directors of the Company can be found in the Statement of Operations herein. The Fund pays to The Hartford a portion of the Chief Compliance Officer’s compensation, but does not pay salaries or compensation to any of its other officers or directors who are employed by The Hartford.
Non-Interested Directors
Lynn S. Birdsong (1946) Director since 2003, Co-Chairman of the Investment Committee
Mr. Birdsong is a private investor. Mr. Birdsong currently serves as a Director of the Sovereign High Yield Investment Company (April 2010 to current). Mr. Birdsong currently serves as an Independent Director of Nomura Partners Funds, Inc. (formerly, The Japan Fund) (March 2003 to current). From 2003 to March 2005, Mr. Birdsong was an independent director of the Atlantic Whitehall Funds. From 1979 to 2002, Mr. Birdsong was a managing director of Zurich Scudder Investments, an investment management firm. During his employment with Scudder, Mr. Birdsong was an Interested Director of The Japan Fund. Since 1981, Mr. Birdsong has been a partner in Birdsong Company, an advertising specialty firm.
Robert M. Gavin, Jr. (1940) Director since 2002 (MF) and 1986 (MF2), Chairman of the Board since 2004
Dr. Gavin is an educational consultant. Prior to September 1, 2001, he was President of Cranbrook Education Community and prior to July 1996, he was President of Macalester College, St. Paul, Minnesota.
Duane E. Hill (1945) Director since 2001 (MF) and 2002 (MF2), Chairman of the Nominating Committee
Mr. Hill is Partner of TSG Ventures L.P., a private equity investment company. Mr. Hill is a former partner of TSG Capital Group, a private equity investment firm that served as sponsor and lead investor in leveraged buyouts of middle market companies.
Sandra S. Jaffee (1941) Director since 2005
Ms. Jaffee served as Chairman (2008 to 2009) and Chief Executive Officer of Fortent (formerly Searchspace Group), a leading provider of compliance/regulatory technology to financial institutions from August 2005 to August 2009. From August 2004 to August 2005, Ms. Jaffee served as an Entrepreneur in Residence with Warburg Pincus, a private equity firm. From September 1995 to July 2004, Ms. Jaffee served as Executive Vice President at Citigroup, where she was President and Chief Executive Officer of Citibank’s Global Securities Services (1995 to 2003). Ms. Jaffe currently serves as a member of the Board of Directors of Broadridge Financial Solutions as well as a Trustee of Muhlenberg College.
William P. Johnston (1944) Director since 2005, Chairman of the Compliance Committee
In June 2006, Mr. Johnston was appointed as Senior Advisor to The Carlyle Group, a global private equity investment firm. In August 2007, Mr. Johnston was elected to the Board of Directors of LifeCare Holdings, Inc. In February 2008, Mr. Johnston was elected to the Board of Directors of HCR-ManorCare, Inc. In May 2006, Mr. Johnston was elected to the Supervisory Board of Fresenius Medical Care AG & Co. KGaA, after its acquisition of Renal Care Group, Inc. in March 2006. Mr. Johnston joined Renal Care Group in November 2002 as a member of the Board of Directors and served as Chairman of the Board from March 2003 through March 2006. Mr. Johnston served as a Director of MultiPlan, Inc. from July 2006 through August 2010. From September 1987 to December 2002, Mr. Johnston was with Equitable Securities Corporation (and its successors, SunTrust Equitable Securities and SunTrust Robinson Humphrey) serving in various investment banking and managerial positions, including Managing Director and Head of Investment Banking, Chief Executive Officer and Vice Chairman.
The Hartford Municipal Real Return Fund (formerly The Hartford Tax-Free National Fund) |
Directors and Officers (Unaudited) – (continued) |
Phillip O. Peterson (1944) Director since 2002, (MF) and 2000 (MF2), Chairman of the Audit Committee
Mr. Peterson is a mutual fund industry consultant. He was a partner of KPMG LLP (an accounting firm) until July 1999. Mr. Peterson joined William Blair Funds in February 2007 as a member of the Board of Trustees. From January 2004 to April 2005, Mr. Peterson served as Independent President of the Strong Mutual Funds.
Lemma W. Senbet (1946) Director since 2005
Dr. Senbet is the William E. Mayer Chair Professor of Finance and Director, Center for Financial Policy, at the University of Maryland, Robert H. Smith School of Business. He was chair of the Finance Department from 1998 to 2006. Previously he was a chaired professor of finance at the University of Wisconsin-Madison. Also, he was director of the Fortis Funds from March 2000 to July 2002. Dr. Senbet served the finance profession in various capacities, including as director of the American Finance Association and President of the Western Finance Association. In 2006, Dr. Senbet was inducted Fellow of Financial Management Association International for his career-long distinguished scholarship and professional service.
Interested Directors and Officers
David N. Levenson (1966) Director since 2010
Mr. Levenson currently serves as President of The Hartford’s Wealth Management business. He was appointed to this role in July 2010. Previously, Mr. Levenson served as Executive Vice President of Legacy Holdings for The Hartford from June 2009 to July 2010. From 2006 to 2009, Mr. Levenson was with Hartford Life Insurance K.K. where he served as President and Chief Executive Officer from 2007 to 2009. He served as Managing Director of Hartford Investment Management Company from 2005 to 2006. Additionally, Mr. Levenson serves as Executive Vice President of The Hartford and as President, Director and Chief Executive Officer of Hartford Life Insurance Company (“HLIC”) and Hartford Life, Inc. (“HL Inc.”).
Lowndes A. Smith (1939) Director since 1996, (MF) and 2002 (MF2), Co-Chairman of the Investment Committee
Mr. Smith served as Vice Chairman of The Hartford from February 1997 to January 2002, as President and Chief Executive Officer of HL Inc. from February 1997 to January 2002, and as President and Chief Operating Officer of The Hartford Life Insurance Companies from January 1989 to January 2002. Mr. Smith serves as a Director of White Mountains Insurance Group, Ltd., One Beacon Insurance and Symetra Financial and as a Managing Director of Whittington Gray Associates.
Other Officers
James E. Davey (1964) President and Chief Executive Officer since 2010
Mr. Davey serves as Executive Vice President of HLIC. Additionally, Mr. Davey serves as President, Chief Executive Officer and Manager of HIFSCO and President, Chief Executive Officer and Manager of HL Investment Advisors, LLC (“HL Advisors”). Mr. Davey joined The Hartford in 2002.
Michael R. Dressen (1963) AML Compliance Officer since 2011
Mr. Dressen currently serves as Assistant Vice President of HLIC. He also serves as Chief Compliance Officer and AML Compliance Officer of Hartford Administrative Services Company (“HASCO”) and as Assistant Secretary and Compliance Officer of HIFSCO. Mr Dressen joined The Hartford in 2005 from State Farm Insurance Companies where he held various positions related to mutual funds, variable products, and property casualty insurance.
Tamara L. Fagely (1958) Vice President, Controller and Treasurer since 2002 (MF) and 1993 (MF2)
Ms. Fagely has been a Vice President of HASCO since 1998 and Chief Financial Officer since 2006. Currently Ms. Fagely is a Vice President of HLIC. She served as Assistant Vice President of HLIC from December 2001 through March 2005. In addition, Ms. Fagely is Controller and Chief Financial Officer of HIFSCO.
Dr. Robert J. Froehlich (1953) Senior Managing Director since 2009
Dr. Froehlich joined The Hartford as Senior Managing Director in September 2009. Prior to joining The Hartford, Dr. Froehlich served as Vice Chairman of Deutsche Asset Management from 1997-2009.
Edward P. Macdonald (1967) Vice President, Secretary and Chief Legal Officer since 2005
Mr. Macdonald serves as Vice President of HLIC and Chief Legal Officer of Mutual Funds and Vice President of HIFSCO. He also serves as Vice President and Secretary of HASCO, and Chief Legal Officer, Secretary and Vice President of HL Advisors. Mr. Macdonald joined The Hartford in 2005.
Vernon J. Meyer (1964) Vice President since 2006
Mr. Meyer serves as Senior Vice President of HLIC. He also serves as Senior Vice President of HIFSCO and HL Advisors. Mr. Meyer joined The Hartford in 2004.
Colleen B. Pernerewski (1969) Vice President and Chief Compliance Officer since 2010
Ms. Pernerewski serves as Vice President and Chief Investment Advisor Compliance Officer of HIFSCO and as Vice President and Chief Compliance Officer of HL Advisors. Ms. Pernerewski joined The Hartford in 2005 from Travelers Life and Annuity where she served as Counsel (2004-2005). Prior to Travelers Life and Annuity, Ms. Pernerewski held the position of Counsel at The Hartford (1998-2004).
Elizabeth L. Schroeder (1966) Vice President since 2010
Ms. Schroeder currently serves as Assistant Vice President of HLIC. Ms. Schroeder joined HLIC in 1991. She is also an Assistant Vice President of HASCO, HIFSCO and HL Advisors.
Martin Swanson (1962) Vice President since 2010
Mr. Swanson is a Vice President of HLIC. Mr. Swanson also serves as Vice President/Marketing for HIFSCO. Prior to joining HLIC in 1998, Mr. Swanson was a Vice President at PaineWebber, Inc.
Jane Wolak (1961) Vice President since 2009
Ms. Wolak currently serves as Senior Vice President of HLIC. Ms. Wolak joined HLIC as Vice President, Retail Product Services in May 2007. She is also Vice President of HASCO. Previously, Ms. Wolak was with Sun Life Financial where she held the position of Vice President, Service Center Operations from 2001-2007.
A description of the policies and procedures that the Fund uses to determine how to vote proxies relating to portfolio securities and a record of how the Fund voted any proxies for the twelve-month period ended June 30, 2011 are available (1) without charge, upon request, by calling 888-843-7824 and (2) on the SEC’s website at http://www.sec.gov.
The Fund files a complete schedule of portfolio holdings with the SEC for the first and third quarters of each fiscal year on Form N-Q. The Fund’s Forms are available (1) without charge, upon request, by calling 888-843-7824 and (2) on the SEC’s website at http://www.sec.gov. The Form N-Q may be reviewed and copied at the SEC’s Public Reference Room in Washington, DC. Information on the operation of the Public Reference Room may be obtained by calling 1-800-SEC-0330.
|
Federal Tax Information (Unaudited) |
For the fiscal year ended October 31, 2011, there is no further federal tax information required for this Fund.
|
Expense Example (Unaudited) |
Your Fund's Expenses
As a shareholder of the Fund, you incur two types of costs: (1) transaction costs, including sales charges (loads) on purchase payments and contingent deferred sales charges (CDSC) and (2) ongoing costs, including investment management fees, distribution fees, and other fund expenses. This example is intended to help you understand your ongoing costs (in dollars) of investing in the Fund and to compare these costs with the ongoing costs of investing in other mutual funds. The example is based on an investment of $1,000 invested at the beginning of the period and held for the period of April 30, 2011 through October 31, 2011.
Actual Expenses
The first set of columns of the table below provides information about actual account values and actual expenses. You may use the information in this column, together with the amount you invested, to estimate the expenses that you paid over the period. Simply divide your account value by $1,000 (for example, an $8,600 account value divided by $1,000 = 8.6), then multiply the result by the number in the line under the heading entitled “Expenses Paid During Period” to estimate the expenses you paid on your account during this period.
Hypothetical Example for Comparison Purposes
The second set of columns of the table below provides information about hypothetical account values and hypothetical expenses based on the Fund's actual expense ratio and an assumed rate of return of 5% per year before expenses, which is not the Fund's actual return. The hypothetical account values and expenses may not be used to estimate the actual ending account balance or expenses you paid for the period. You may use this information to compare the ongoing costs of investing in the Fund and other funds. To do so, compare this 5% hypothetical example with the 5% hypothetical examples that appear in the shareholder reports of the other funds.
Please note that the expenses shown in the table are meant to highlight your ongoing costs only and do not reflect any transactional costs, such as sales charges (loads) and CDSC. Therefore, the second set of columns of the table is useful in comparing ongoing costs only, and will not help you determine the relative total costs of owning different funds. In addition, if these transactional costs were included, your costs would be higher. Expenses are equal to the Fund's annualized expense ratios multiplied by average account value over the period, multiplied by 184/365 (to reflect the one-half year period).
| | | Actual return | | | Hypothetical (5% return before expenses) | | | | | | | | | | |
| | | Beginning Account Value April 30, 2011 | | | Ending Account Value October 31, 2011 | | | Expenses paid during the period April 30, 2011 through October 31, 2011 | | | Beginning Account Value April 30, 2011 | | | Ending Account Value October 31, 2011 | | | Expenses paid during the period April 30, 2011 through October 31, 2011 | | | | | | | | | | |
| Class A | | $ | 1,000.00 | | | $ | 1,043.40 | | | $ | 4.38 | | | $ | 1,000.00 | | | $ | 1,020.92 | | | $ | 4.33 | | | | 0.85 | % | | | 184 | | | | 365 | |
| Class B | | $ | 1,000.00 | | | $ | 1,041.00 | | | $ | 8.23 | | | $ | 1,000.00 | | | $ | 1,017.14 | | | $ | 8.13 | | | | 1.60 | | | | 184 | | | | 365 | |
| Class C | | $ | 1,000.00 | | | $ | 1,039.70 | | | $ | 8.23 | | | $ | 1,000.00 | | | $ | 1,017.14 | | | $ | 8.14 | | | | 1.60 | | | | 184 | | | | 365 | |
| Class I | | $ | 1,000.00 | | | $ | 1,044.60 | | | $ | 3.09 | | | $ | 1,000.00 | | | $ | 1,022.18 | | | $ | 3.06 | | | | 0.60 | | | | 184 | | | | 365 | |
| Class Y | | $ | 1,000.00 | | | $ | 1,044.80 | | | $ | 3.08 | | | $ | 1,000.00 | | | $ | 1,022.20 | | | $ | 3.04 | | | | 0.60 | | | | 184 | | | | 365 | |
|
Approval of Investment Management and Investment Sub-Advisory Agreements (Unaudited) |
Section 15(c) of the Investment Company Act of 1940, as amended (the “1940 Act”), requires that each mutual fund’s board of directors, including a majority of those directors who are not “interested persons” of the mutual fund, as defined in the 1940 Act (the “Independent Directors”), annually review and consider the continuation of the mutual fund’s investment advisory and sub-advisory agreements. At its meeting held on August 2-3, 2011, the Board of Directors (the “Board”) of The Hartford Mutual Funds II, Inc., including each of the Independent Directors, unanimously voted to approve the continuation of the investment management agreement for The Hartford Municipal Real Return Fund (the “Fund”) with Hartford Investment Financial Services, LLC (“HIFSCO”) and the continuation of the investment sub-advisory agreement between HIFSCO and the Fund’s sub-adviser, Hartford Investment Management Company (the “Sub-adviser,” and together with HIFSCO, the “Advisers”) (collectively, the “Agreements”).
In the months preceding the August 2-3, 2011 meeting, the Board requested, received, and reviewed written responses from the Advisers to questions posed to them on behalf of the Independent Directors and supporting materials relating to those questions and responses. The Board considered information furnished to the Board at its meetings throughout the year, as well as information specifically prepared in connection with the annual approval of the Agreements at the Board’s meetings held on June 21-22, 2011 and August 2-3, 2011. Information provided to the Board at its meetings throughout the year included, among other things, reports on Fund performance, legal and compliance matters, sales and marketing activity, shareholder services, and the other services provided to the Fund by the Advisers and their affiliates. In addition, the Board received in-person presentations by Fund officers and representatives of HIFSCO at the Board’s meetings on June 21-22, 2011 and August 2-3, 2011 concerning the Agreements.
The Independent Directors, advised by independent legal counsel, engaged two service providers to assist them with evaluating the Agreements with respect to the Fund. Lipper Inc. (“Lipper”), an independent provider of investment company data, was retained to provide the Board with reports on how the Fund’s contractual management fees, actual management fees, other non-management fees, overall expense ratios and investment performance compared to those of mutual funds with similar investment objectives. The Independent Directors also engaged an independent financial services consulting firm (the “Consultant”) to assist them in evaluating the Fund’s management fees, sub-advisory fees, other non-management fees, overall expense ratios and investment performance. In addition, the Consultant reviewed the profitability calculations utilized by HIFSCO in connection with the continuation of the investment management agreement.
In determining to continue the Agreements for the Fund, the members of the Board reviewed and evaluated information and factors they believed to be relevant and appropriate in light of the information that the Board deemed necessary and appropriate through the exercise of their reasonable business judgment. While individual members of the Board may have weighed certain factors differently, the Board’s determination to continue the Agreements was based on a comprehensive consideration of all information provided to the Board throughout the year and specifically with respect to the continuation of the Agreements. A more detailed discussion of the factors the Board considered with respect to its approval of the Agreements is provided below.
Nature, Extent, And Quality Of Services Provided by the Advisers
The Board requested and considered information concerning the nature, extent, and quality of the services provided to the Fund by the Advisers. The Board considered, among other things, the terms of the Agreements and the range of services provided by the Advisers. The Board considered the Advisers’ professional personnel who provide services to the Fund, including each Adviser’s ability and experience in attracting and retaining qualified personnel to service the Fund. The Board considered each Adviser’s reputation and overall financial strength, as well as its willingness to consider and implement organizational and operational changes designed to improve services to the Fund. In addition, the Board considered the quality of each Adviser’s communications with the Board and responsiveness to Board inquiries.
The Board also requested and evaluated information concerning each Adviser’s regulatory and compliance environment. In this regard, the Board requested and reviewed information on each Adviser’s compliance policies and procedures, compliance history, and a report from the Fund’s Chief Compliance Officer on each Adviser’s compliance with applicable laws and regulations, including responses to regulatory developments and compliance issues raised by regulators. The Board also noted the Advisers’ support of the Fund’s compliance control structure, particularly the resources devoted by the Advisers in support of the Fund’s obligations pursuant to Rule 38a-1 under the 1940 Act.
With respect to HIFSCO, the Board noted that under the Agreements, HIFSCO is responsible for the management of the Fund, including overseeing fund operations and service providers, and provides administration services to the Fund as well as investment advisory services in connection with selecting, monitoring and supervising the Sub-adviser. The Board considered HIFSCO’s ongoing monitoring of people, process and performance, including its quarterly reviews of each of the Hartford Mutual Funds, semi-annual meetings with the leaders of each Fund’s portfolio management team, and oversight of the Funds’ 74 portfolio managers. The Board recognized that HIFSCO has demonstrated a record of making changes to the management and/or strategies of the Funds when warranted. The Board considered HIFSCO’s oversight of the Sub-adviser’s investment approach and results, process for monitoring best execution of portfolio trades by the Sub-adviser, and approach to risk management with respect to the Fund and the service providers to the Fund. The Board also considered HIFSCO’s oversight of compliance with the Fund’s objective and policies as well as with applicable laws and regulations, noting that regulatory and other developments had over time led to an increase in the scope of HIFSCO’s services in this regard.
In addition, the Board considered HIFSCO’s ongoing commitment to review and rationalize the Hartford fund family’s product line-up and the expenses that HIFSCO had incurred in connection with fund combinations in recent years. The Board considered that HIFSCO or its affiliates are responsible for providing the Fund’s officers.
With respect to the Sub-adviser, who provides day-to-day portfolio management services, the Board considered the quality of the Fund’s portfolio managers, the Sub-adviser’s other investment personnel, its investment philosophy and process, investment research capabilities and resources, performance record, trade execution capabilities and experience. The Board considered the experience of the Fund’s portfolio managers, the number of accounts managed by the portfolio managers, and the Sub-adviser’s method for compensating the portfolio managers.
Based on these considerations, the Board concluded that it was satisfied with the nature, extent and quality of the services provided to the Fund by HIFSCO and the Sub-adviser.
Performance of the Fund and the Advisers
The Board considered the investment performance of the Fund. In this regard, the Board reviewed the performance of the Fund over different time periods presented in the materials and evaluated HIFSCO’s analysis of the Fund’s performance for these time periods. The Board considered information and materials provided to the Board by the Advisers concerning Fund performance, as well as information from Lipper comparing the investment performance of the Fund to an appropriate benchmark and universe of peer funds. The Board noted that HIFSCO had made substantial changes to the Fund’s investment strategy and portfolio management team to address the Fund’s historical relative underperformance.
The Board considered the detailed investment analytics reports provided by The Hartford’s Investment Advisory Group throughout the year. These reports include, among other things, information on the Fund’s gross and net returns, the Fund’s investment performance relative to an appropriate benchmark and peer group, various statistics concerning the Fund’s portfolio, and a narrative summary of various factors affecting Fund performance. The Board considered the Advisers’ cooperation with the Investment Committee, which assists the Board in evaluating the performance of the Fund at periodic meetings throughout the year. The Board also considered the analysis provided by the Consultant relating to the Fund’s performance track record.
In light of all the considerations noted above, the Board concluded that it had continued confidence in HIFSCO’s and the Sub-adviser’s overall capabilities to manage the Fund.
Costs of the Services and Profitability of the Advisers
The Board reviewed information regarding HIFSCO’s cost to provide investment management and related services to the Fund and HIFSCO’s profitability, both overall and for the Fund, on a pre-tax basis without regard to distribution expenses. The Board also requested and reviewed information about the profitability to HIFSCO and its affiliates from all services provided to the Fund and all aspects of their relationship with the Fund. The Board noted that the fees payable to the Sub-adviser are equal to its estimated costs in providing sub-advisory services. Accordingly, the costs and profitability for the Sub-adviser and HIFSCO were considered in the aggregate.
The Hartford Municipal Real Return Fund (formerly The Hartford Tax-Free National Fund) |
Approval of Investment Management and Investment Sub-Advisory Agreements (Unaudited) – (continued) |
The Board considered the Consultant’s review of the profitability calculations utilized by HIFSCO in connection with the continuation of the investment management agreement. In this regard, the Consultant reported that The Hartford’s process for calculating and reporting Fund profitability is reasonable, sound and well within common industry practice.
Based on these considerations, the Board concluded that the profits anticipated to be realized by the Advisers and their affiliates from their relationships with the Fund would not be excessive.
Comparison of Fees and Services Provided by the Advisers
The Board considered comparative information with respect to the management fees to be paid by the Fund to HIFSCO and the total expense ratios of the Fund. The Board also considered comparative information with respect to the sub-advisory fees to be paid by HIFSCO to the Sub-adviser, to the extent applicable. In this regard, the Board requested and reviewed information from HIFSCO and the Sub-adviser relating to the management and sub-advisory fees and total operating expenses for the Fund. The Board also reviewed information from Lipper comparing the Fund’s contractual management fees, actual management fees and overall expense ratios relative to a group of funds selected by Lipper, in consultation with the Consultant, and a broader universe of funds selected by Lipper.
While the Board recognized that comparisons between the Fund and peer funds are imprecise, given the differing service levels and characteristics of mutual funds and the different business models and cost structures of the Advisers, the comparative information provided by Lipper assisted the Board in evaluating the reasonableness of the Fund’s management and sub-advisory fees and total operating expenses. In addition, the Board considered the analysis and recommendations of the Consultant relating to the Fund’s management and sub-advisory fees and total operating expenses.
Based on these considerations, the Board concluded that the Fund’s fees and total operating expenses, in conjunction with the information about quality of services, profitability, economies of scale, and other matters discussed, were reasonable in light of the services provided.
Economies of Scale
The Board requested and considered information regarding the Advisers’ realization of economies of scale with respect to the Fund and whether the fee levels reflect these economies of scale for the benefit of the Fund’s investors. With respect to HIFSCO, the Board considered representations from HIFSCO that it is difficult to anticipate whether and to what extent economies may be realized by HIFSCO as assets grow over time, and the Board noted the decrease in the Fund’s assets. The Board reviewed the breakpoints in the management fee schedule for the Fund, which reduces fee rates as Fund assets grow over time. The Board recognized that a fund with assets beyond the last breakpoint level will continue to benefit from economies of scale because additional assets are charged the lowest breakpoint fee resulting in lower overall effective management fee rates. The Board also considered that expense limitations and fee waivers that reduce the Fund’s expenses at all asset levels can have the same effect as breakpoints in sharing economies of scale with shareholders and provide protection from an increase in expenses if Fund assets decline. The Board recognized that a fee schedule that reaches a lower breakpoint quickly provides shareholders with the benefit of anticipated or potential economies of scale. The Board also considered that HIFSCO has been active in managing expenses, which has resulted in benefits being realized by shareholders as assets within the Hartford fund family have grown over time, including through lower transfer agent costs and other operating expenses.
The Board reviewed and evaluated materials from Lipper showing how management fee schedules of peer funds reflect economies of scale for the benefit of investors as a peer fund’s assets hypothetically increase over time. Based on information provided by HIFSCO, Lipper, and the Consultant, the Board recognized that there is no uniform methodology for establishing breakpoints or uniform pattern in asset levels that trigger breakpoints or the amounts of breakpoints triggered.
After considering all of the information available to it, the Board concluded that it was satisfied with the extent to which economies of scale would be shared for the benefit of the Fund’s shareholders based on currently available information and the effective advisory fees and expense ratios for the Fund at its current and reasonably anticipated asset levels. The Board noted, however, that it would continue to monitor future growth in Fund assets and the appropriateness of additional breakpoints.
Other Benefits
The Board considered other benefits to the Advisers and their affiliates from their relationships with the Fund.
The Board reviewed information noting that Hartford Life, Inc. (“Hartford Life”), an affiliate of HIFSCO, receives fees for fund accounting and related services from the Fund, and the Board considered information on expected profits to Hartford Life or its affiliates for such services. The Board also considered that Hartford Administrative Services Company (“HASCO”), the Fund’s transfer agent and an affiliate of HIFSCO, receives transfer agency compensation from the Fund, and the Board reviewed information on the expected profitability of the Fund’s transfer agency function to HASCO. The Board considered information provided by HASCO indicating that the transfer agent fees charged by HASCO to the Fund were fair and reasonable based on publicly available information.
The Board also considered that, as principal underwriter of the Fund, HIFSCO receives 12b-1 fees from the Fund and receives all or a portion of the sales charges on sales or redemptions of certain classes of shares. The Board also noted that certain affiliates of HIFSCO distribute shares of the Fund and receive compensation in that connection.
The Board considered the benefits, if any, to the Sub-adviser from any use of the Fund’s brokerage commissions to obtain soft dollar research.
The Board considered the benefits to shareholders of being part of the Hartford family of funds, including the right to exchange investments between the same class of funds without a sales charge, the ability to reinvest Fund dividends into other funds in the family, and the ability to combine holdings in the Fund with holdings in other funds to obtain a reduced sales charge. The Board considered HIFSCO’s efforts to provide investors in the family with a broad range of investment styles and asset classes and its entrepreneurial risk in initiating new funds to expand these opportunities for shareholders.
* * * *
Based upon its review of these various factors, among others, the Board concluded that it is in the best interests of the Fund and its shareholders for the Board to approve the Agreements for an additional year. In reaching this decision, the Board did not assign relative weights to the factors discussed above or deem any one or group of them to be controlling in and of themselves. In connection with their deliberations, the Independent Directors met separately in executive session on several occasions, with independent legal counsel, to review the relevant materials and consider their responsibilities under relevant laws and regulations.
A MESSAGE FROM DR. BOB FROEHLICH
Dear Shareholders:
All I can say is wow! From an investment perspective, this has been quite a tough year.
Old challenges seem to be lingering, such as the ongoing European sovereign debt crisis. While, here in the United States, we just can't seem to turn the corner on our weak housing market and even weaker employment market. As if these issues aren’t enough, we add the new challenge of the United States of America losing its prestigious "AAA" credit rating for the first time in the history of our country. I can’t remember a time when our markets faced this great a challenge from so many different fronts. While all of this negative news can seem daunting at times, there are also some bright spots. Although it’s almost impossible to predict with any degree of accuracy where our markets may be headed, let me share with you a few of the issues that I’m closely watching that make me more optimistic than most about the prospects for our market going forward.
RECORD EARNINGS
Let me begin with earnings, which from my perspective always have been and always will be the single most important thing to focus upon. I’m willing to bet that most U.S. investors have no idea just how strong corporate earnings and profits have been. While there are numerous ways to measure earnings and profits, one of my favorite ways is to look at profits as a percentage of the economy, especially when you want some historical comparison. Fortunately, the Bureau of Economic Analysis does this equation for us on a quarterly basis. For the second quarter of 2011 (the most recent data available) corporate profits accounted for 10.1% of our economy as measured by the GDP (Gross Domestic Product).
So just how good is that profits number? For starters, it’s the single highest profits number in my entire 34-year career. In case that isn’t impressive enough for any of you history buffs, I would add one more thing. The Bureau of Economic Analysis has been recording these quarterly profit numbers as a percentage of GDP since 1947. Our most recent number, which placed corporate profits at 10.1% of GDP, is the highest in the 64 years of tracking this data. Again, if you believe, as I do, that markets ultimately go wherever earnings take them, then you have to like what the future might hold for our stock market.
CORPORATE CASH & STRONG BALANCE SHEETS
The second thing that makes me somewhat optimistic about the future prospects for our markets is the current financial strength of corporate America. I know that you’ve heard the term that “corporate America is flush with cash.” Let me show you just how flush. The single best measure for corporate cash is one called “U.S. nonfinancial corporations liquid assets.” In the past two years this cash has increased $700 billion, bringing the total to more than $2 trillion. In the most recently released numbers for the second quarter of 2011, on a quarter-over-quarter basis, cash is up 19.2%. Corporate cash at a level above $2 trillion is the highest level ever recorded.
Now you know what it means when someone says “corporate America is flush with cash.” The good news about all that cash, from my perspective, is once corporate confidence returns and that cash goes in motion, it will help both our economy and our markets. Money in motion could go toward increasing mergers and acquisitions, dividends, share buybacks, capital spending to drive productivity, or even creating jobs. Regardless of what the ultimate use is, money in motion is good for our economy and our markets.
INSIDER BUYING
Let me move on to my third point that makes me optimistic: “insider buying.” When someone on Wall Street says “insiders,” they’re referring to company officers and directors that must disclose to the Securities and Exchange Commission through Form 4 filings whether they’re buying or selling their company’s stock. Research firm Argus-Vickers tracks this number for all publicly traded companies.
I believe when insiders are selling, it suggests that the stock may be too expensive, and the market expects too much from future earnings. Conversely, when insiders are buying, it suggests that insiders believe that their stock is too cheap, and the market is underestimating future earnings.
For more than the past decade, the average has been two insiders selling for every one that is buying. Think about what our stock market did over the past decade and you might realize that maybe these insiders are a pretty good indicator, as our markets just went through what many are calling “the lost decade,” referring to our flat stock market over the past 10 years. Currently, there’s only one insider selling for every two that are buying. Do they know something that we don't know? Only time will tell. One thing for sure is that officers and directors always focus on earnings, earnings, and earnings.
In closing, now more than ever, it’s critical that you work closely with your trusted financial professional, as I predict that our investment landscape will become even more challenging in the future. The volatility in our markets is probably here to stay— meaning it will be more difficult than ever before to try to remain a long-term investor in this short-term world in which we live. If you’re interested in my longer-term and short-term perspectives on our current markets, you can go to our website: www.hartfordinvestor.com/drbob to read my weekly investment commentary.
Dr. Bob Froehlich
Senior Managing Director
The Hartford Mutual Funds
PAST ECONOMIC AND INDEX PERFORMANCE DO NOT ENSURE FUTURE RESULTS.
Dr. Bob Froehlich’s sources of information include Bank of Canada, The Bank of England, Bank of Japan, Bloomberg News, Business Roundtable, China Investment Corporation, CIA. World Fact Book, CNBC, Congressional Budget Office, Deutsche Bank, The European Monetary Union, Federal Reserve Board, The Financial Times, Freddie Mac, FOX Business, Goldman Sachs, International Monetary Fund, International Strategy & Investment, Journal of Commerce, Merrill Lynch, PIERS Global Intelligence Solutions, Strategas Research, Thomson Reuters, Union Bank of Switzerland, U.S. Census Bureau, U.S. Department of Commerce, U.S. Department of Labor, U.S. State Department, U.S. Treasury Department, The Wall Street Journal, and The World Bank. This information is written in connection with the promotion or marketing of the matter(s) addressed in this material. The information cannot be used or relied upon for the purpose of avoiding IRS penalties. These materials are not intended to provide tax, accounting or legal advice. As with all matters of a tax or legal nature, you should consult your own tax or legal counsel for advice. You should carefully consider investment objectives, risks, and charges and expenses of The Hartford Mutual Funds before investing. This and other information can be found in the Fund’s prospectus or summary prospectus, which can be obtained from your investment representative or by calling 888-843-7824. Please read them carefully before you invest or send money. The Hartford Mutual Funds are underwritten and distributed by Hartford Investment Financial Services, LLC. “The Hartford” is The Hartford Financial Services Group, Inc., and its subsidiaries. MFAR-MMR11 12/11 102949 Printed in U.S.A. ©2011 The Hartford, Hartford, CT 06155 | |
| | |
| | |
THE HARTFORD MUTUAL FUNDS 2011 Annual Report The Hartford SmallCap Growth Fund |
A MESSAGE FROM THE PRESIDENT
Dear Fellow Shareholders:
I want to take this opportunity to say thank you for investing in The Hartford Mutual Funds.
This has been a tumultuous year. In the beginning of 2011, we witnessed tension-fueled political uprisings in the already-volatile Middle East and North Africa region. We also watched as Japan dealt with a series of crises including a massive earthquake and subsequent tsunami. Yet, U.S. economic conditions continued to improve, with gains in consumer confidence and retail sales. During the first half of 2011, domestic, international, and world indices (as measured by the S&P 500, MSCI EAFE and MSCI World) were all up more than 5% through June, 30 2011.
The economic recovery, however, lost momentum in the second half of 2011. The employment and housing markets both remain extremely challenged. Investors continue to be concerned about the implications of the European sovereign debt crisis, as well as our own high levels of domestic debt. Fears that the European sovereign debt crisis could continue to drag down the global economy have weighed heavily on stocks.
Ongoing apprehension regarding the U.S. debt ceiling during the summer, and the resulting downgrade of the U.S. sovereign credit rating by Standard & Poor’s, also contributed to weaker investor confidence.
There are, however, some reasons to remain confident. Corporations have record levels of cash on their balance sheets—corporate cash has doubled in the past 10 years. In addition, U.S. gross domestic product expanded at a 2.5 percent annual rate in the third quarter according to the Commerce Department, as consumers and businesses set aside fears about the recovery and stepped up spending. Corporate earnings have also remained positive, with a majority of companies beating expectations each quarter this year. This momentum will hopefully continue through the fourth quarter and into next year.
As we approach the end of 2011, in light of the continued market volatility, now would be a good time to schedule a meeting with your financial advisor to examine your current investment strategy and determine whether you are on the right track.
| | • Does your fixed-income portfolio complement your equity portfolio? |
| | • Are you receiving diversified sources of income? |
| | • Is your portfolio still in line with your risk tolerance and investment time horizon? |
Talk to your advisor to see what changes you should make to address these concerns and opportunities. Thank you again for investing with The Hartford Mutual Funds.
James Davey
President
The Hartford Mutual Funds
The Hartford SmallCap Growth Fund
| Fund Performance (Unaudited) | 2 |
| Manager Discussion (Unaudited) | 3 |
| Financial Statements | |
| 5 |
| 10 |
| 11 |
| 12 |
| 13 |
| 14 |
| 24 |
| 26 |
| 27 |
| 29 |
| 29 |
| 30 |
| 31 |
| 32 |
The views expressed in the Fund’s Manager Discussion under ‘‘Why did the Fund perform this way?’’ and ‘‘What is the outlook?’’ are views of the Fund’s sub-adviser and portfolio management team through the end of the period and are subject to change based on market and other conditions.
The Hartford SmallCap Growth Fund inception 01/04/1988 |
| (sub-advised by Wellington Management Company, LLP) |
| |
| Investment objective – Seeks long-term capital appreciation. |
Performance Overview 10/31/01 - 10/31/11
The chart above shows the growth of a $10,000 investment in Class A which includes a sales charge. Growth results in classes other than Class A will vary from what is seen above due to differences in the expenses charged to those share classes.
Average Annual Total Returns (as of 10/31/11)
| | 1 Year | 5 Year | 10 Year |
| SmallCap Growth A# | 13.34% | 2.27% | 6.46% |
| SmallCap Growth A## | 7.10% | 1.12% | 5.86% |
| SmallCap Growth B# | 12.48% | 1.60% | NA* |
| SmallCap Growth B## | 7.48% | 1.24% | NA* |
| SmallCap Growth C# | 12.47% | 1.45% | 5.65% |
| SmallCap Growth C## | 11.47% | 1.45% | 5.65% |
| SmallCap Growth I# | 13.67% | 2.42% | 6.81% |
| SmallCap Growth R3# | 13.13% | 1.99% | 6.53% |
| SmallCap Growth R4# | 13.44% | 2.23% | 6.65% |
| SmallCap Growth R5# | 13.77% | 2.52% | 6.81% |
| SmallCap Growth Y# | 13.91% | 2.60% | 6.85% |
| Russell 2000 Growth Index | 9.84% | 2.68% | 6.04% |
| * | Since inception returns are not applicable for Class B because after 8 years Class B converts to Class A. |
PAST PERFORMANCE IS NOT INDICATIVE OF FUTURE RESULTS.
The initial investment in Class A shares reflects the maximum sales charge and Classes B and C reflect a contingent deferred sales charge.
Total returns presented above were calculated using the Fund's net asset value available to shareholders for sale or redemption of Fund shares on October 31, 2011, which excludes investment transactions as of this date.
Effective 9/30/09, Class B shares of The Hartford Mutual Funds were closed to new investments.
Class A, B, C and Y shares commenced operations on 2/19/02. Class A and C share performance prior to that date reflects Class L and N share performance and operating expenses less Class A or C share sales charges, respectively. (Class L and N shares are no longer offered.) Class Y share performance prior to 2/19/02 reflects Class L share performance and operating expenses, adjusted to reflect that Class Y has no sales charges. Class I shares commenced operations on 8/31/06. Performance prior to that date is that of the Fund's Class A shares (excluding sales charges), which had different operating expenses.Class R3, R4 and R5 shares commenced operations on 12/22/06. Class R3, R4 and R5 share performance between 2/19/02 and 12/22/06 reflects Class Y share performance and operating expenses. Class R3, R4 and R5 share performance prior to 2/19/02 reflects Class L share performance and operating expenses, adjusted to reflect the fact that Class R3, R4 and R5 have no sales charges.
Russell 2000 Growth Index is an unmanaged index of those Russell 2000 Index growth companies with higher price-to-book ratios and higher forecasted growth values. (The Russell 2000 Index is a broad-based unmanaged index comprised of 2,000 of the smallest U.S.-domiciled company common stocks (on the basis of capitalization) that are traded in the United States on the New York Stock Exchange, American Stock Exchange and Nasdaq.)
You cannot invest directly in an index.
The chart represents a hypothetical investment in the Fund. Performance data represents past performance and current performance could be higher or lower.
The value of shares will fluctuate so that, when redeemed, shares may be worth more or less than their original cost. The chart and table do not reflect the deduction of taxes that a shareholder would pay on Fund distributions or the redemption of Fund shares.
Performance information may reflect historical or current expense waivers/reimbursements from the investment adviser, without which performance would have been lower. For information on current expense waivers/reimbursements, please see the prospectus.
| The Hartford SmallCap Growth Fund |
| Manager Discussion (Unaudited) |
| October 31, 2011 |
| |
| Portfolio Managers |
| Mammen Chally, CFA | David J. Elliot, CFA |
| Vice President | Vice President and Co-Director of Quantitative Investments |
| |
How did the Fund perform?
The Class A shares of The Hartford SmallCap Growth Fund returned 13.34%, before sales charges, for the twelve-month period ended October 31, 2011, outperforming its benchmark, the Russell 2000 Growth Index, which returned 9.84%. For the same period, the Fund also outperformed the 9.37% return of the average fund in the Lipper Small-Cap Growth Funds peer group, a group of funds with investment strategies similar to those of the Fund.
Why did the Fund perform this way?
U.S. equities moved higher during the period despite a high degree of volatility. During the first half of the period, equities moved higher as economic releases at the time indicated continued momentum in the U.S. recovery. After a flat second quarter, equity markets plummeted in the third quarter due to escalating global growth concerns, challenges in Europe, and mixed economic data. Risk aversion was amplified in this time period as political brinksmanship over an increase in the U.S. debt ceiling caused Standard & Poor’s to downgrade U.S. long-term government debt. Following the difficult third quarter, equity markets surged ahead in October, breaking a string of five consecutive monthly losses for the S&P 500 Index. Solid corporate earnings reports, generally better-than-expected economic data, and renewed hopes for a solution to the euro zone crisis boosted investors enthusiasm for stocks.
Overall equity market performance was positive for the period across all market capitalizations: large-cap equities (+8%), mid-caps (+9%), and small-caps (+7%) all rose as represented by the S&P 500, S&P 400 MidCap, and Russell 2000 Indices, respectively. During the twelve-month period nine of ten sectors within the Russell 2000 Growth Index posted positive returns, led by Consumer Staples (+28%) and Energy (+21%), while Materials (-5%) was the only sector to produce negative absolute returns.
Fund outperformance was driven by stock selection, primarily in the Health Care, Consumer Discretionary, and Information Technology sectors. This more than offset weaker selection in Materials and Financials. Sector allocation modestly detracted from relative results, as did a modest cash position in a rising market.
Among the top contributors to relative performance (i.e. performance of the Fund as measured against the benchmark) were Pharmasset (Health Care), Regeneron Pharmaceuticals (Health Care), and CVR Energy (Energy). Pharmasset, a clinical-stage pharmaceutical company, saw its shares outperform due to continued pipeline success in trials for its hepatitis C treatment. Shares of Regeneron Pharmaceuticals rose sharply after Eylea, the biopharmaceutical company’s macular degeneration treatment, received FDA approval for an every-other-month course of therapy after robust Phase III trial results. Independent petroleum refiner and marketer of transportation fuels, CVR Energy, gained after reporting results that exceeded expectations driven by strong product margins in refining and cost reduction. Rosetta Resources (Energy) was among the top absolute (i.e. total return) contributors.
MIPS Technologies (Information Technology), Netlogic Microsystems (Information Technology), and GT Advanced Technologies (Information Technology) detracted most from relative returns during the period. Shares of microprocessor manufacturer MIPS Technologies fell as the company lowered guidance for fourth quarter 2011 earnings. Shares of Netlogic Microsystems, a semiconductor company that designs and markets specialized processors, gained in value after Broadcom agreed to buy the company for approximately $3.7 billion. Not holding the stock detracted from relative performance during the period. GT Advanced Technologies, a leading global provider of polysilicon products for the solar power industry, sold off in the third quarter along with solar stocks in general. Fierce competition resulted in a significant drop in average selling prices. That, along with the slashing of government subsidies in Europe, reduced profit margins for many solar companies. Meritor (Industrials) was among the top absolute detractors.
What is the outlook?
Although the stock market performed well over the twelve month period, overhangs such as the European sovereign debt crisis and U.S. budget deficit issues have raised concerns about the economy falling into a double dip recession. We believe these fears are exacerbated by concerns surrounding the overall health of the banking system.
However, we generally do not devote much time or energy to forecasting the market's direction from a top-down perspective. Instead, we focus our efforts on identifying attractive stocks from a bottom-up (i.e. stock by stock fundamental research) perspective.
| The Hartford SmallCap Growth Fund |
| Manager Discussion (Unaudited) – (continued) |
| October 31, 2011 |
The Fund focuses on stock selection as the key driver of returns and uses proprietary fundamental and quantitative research in a disciplined framework to build a portfolio of the most attractive stocks. Sector exposures are residuals from this bottom-up stock selection process and are not explicit management decisions. Based on individual stock decisions, the Fund ended the period most overweight (i.e. the Fund’s sector position was greater than the benchmark position) Information Technology, Health Care, and Utilities, and most underweight (i.e. the Fund’s sector position was less than the benchmark position) Energy, Financials, and Telecommunication Services relative to the Russell 2000 Growth Index.
Diversification by Industry
| | | |
| Automobiles & Components (Consumer Discretionary) | | | 1.2 | % |
| Banks (Financials) | | | 2.2 | |
| Capital Goods (Industrials) | | | 11.6 | |
| Commercial & Professional Services (Industrials) | | | 2.6 | |
| Consumer Durables & Apparel (Consumer Discretionary) | | | 1.8 | |
| Consumer Services (Consumer Discretionary) | | | 3.1 | |
| Diversified Financials (Financials) | | | 2.2 | |
| Energy (Energy) | | | 7.0 | |
| Food & Staples Retailing (Consumer Staples) | | | 0.2 | |
| Food, Beverage & Tobacco (Consumer Staples) | | | 2.1 | |
| Health Care Equipment & Services (Health Care) | | | 7.7 | |
| Household & Personal Products (Consumer Staples) | | | 2.1 | |
| Insurance (Financials) | | | 0.8 | |
| Materials (Materials) | | | 3.7 | |
| Media (Consumer Discretionary) | | | 1.3 | |
| Other Investment Pools and Funds (Financials) | | | 0.8 | |
| Pharmaceuticals, Biotechnology & Life Sciences (Health Care) | | | 12.1 | |
| Real Estate (Financials) | | | 1.6 | |
| Retailing (Consumer Discretionary) | | | 7.2 | |
| Semiconductors & Semiconductor Equipment (Information Technology) | | | 4.1 | |
| Software & Services (Information Technology) | | | 15.3 | |
| Technology Hardware & Equipment (Information Technology) | | | 4.8 | |
| Telecommunication Services (Services) | | | 0.5 | |
| Transportation (Industrials) | | | 1.8 | |
| Utilities (Utilities) | | | 0.5 | |
| Short-Term Investments | | | 1.7 | |
| Other Assets and Liabilities | | | 0.0 | |
| Total | | | 100.0 | % |
|
| Schedule of Investments |
| October 31, 2011 |
| (000’s Omitted) |
| Shares or Principal Amount | | Market Value ╪ | |
COMMON STOCKS - 97.5% | |
| | | Automobiles & Components - 1.2% | |
| | 31 | | American Axle & Manufacturing, Inc. ● | | $ | 296 | |
| | 65 | | Amerigon, Inc. ● | | | 991 | |
| | 42 | | Dana Holding Corp. ● | | | 596 | |
| | 7 | | Federal Mogul Corp. ● | | | 119 | |
| | 61 | | Tenneco Automotive, Inc. ● | | | 1,993 | |
| | | | | | | 3,995 | |
| | | | Banks - 2.2% | |
| | 6 | | Bank of the Ozarks, Inc. | | | 149 | |
| | 157 | | Boston Private Financial Holdings, Inc. | | | 1,188 | |
| | 3 | | First Financial Bankshares, Inc. | | | 100 | |
| | 52 | | Flushing Financial Corp. | | | 636 | |
| | 75 | | Ocwen Financial Corp. ● | | | 1,089 | |
| | 29 | | Signature Bank ● | | | 1,636 | |
| | 109 | | Umpqua Holdings Corp. | | | 1,248 | |
| | 26 | | Walker & Dunlop, Inc. ● | | | 328 | |
| | 21 | | Wintrust Financial Corp. | | | 592 | |
| | | | | | | 6,966 | |
| | | | Capital Goods - 11.6% | |
| | 33 | | A.O. Smith Corp. | | | 1,216 | |
| | 27 | | Aaon, Inc. | | | 565 | |
| | 25 | | Acuity Brands, Inc. | | | 1,176 | |
| | 5 | | Aerovironment, Inc. ● | | | 149 | |
| | 27 | | Albany International Corp. Class A | | | 601 | |
| | 82 | | Altra Holdings, Inc. ● | | | 1,210 | |
| | 37 | | Applied Industrial Technologies, Inc. | | | 1,241 | |
| | 25 | | AZZ, Inc. | | | 1,134 | |
| | 62 | | Belden, Inc. | | | 2,013 | |
| | 11 | | Blount International, Inc. ● | | | 169 | |
| | 14 | | Briggs & Stratton Corp. | | | 202 | |
| | 53 | | Ceradyne, Inc. ● | | | 1,790 | |
| | 54 | | Chart Industries, Inc. ● | | | 3,065 | |
| | 8 | | Colfax Corp. ● | | | 195 | |
| | 59 | | Commercial Vehicles Group, Inc. ● | | | 649 | |
| | 15 | | Cubic Corp. | | | 711 | |
| | 26 | | Esterline Technologies Corp. ● | | | 1,471 | |
| | 56 | | Force Protection, Inc. ● | | | 205 | |
| | 36 | | Franklin Electric Co., Inc. | | | 1,665 | |
| | 127 | | FuelCell Energy, Inc. ● | | | 136 | |
| | 65 | | Gencorp, Inc. ● | | | 317 | |
| | 74 | | GrafTech International Ltd. ● | | | 1,164 | |
| | 10 | | Heico Corp. | | | 559 | |
| | 6 | | Hexcel Corp. ● | | | 141 | |
| | 3 | | Kaydon Corp. | | | 104 | |
| | 24 | | Lennox International, Inc. | | | 756 | |
| | 11 | | Lindsay Corp. | | | 610 | |
| | 87 | | Meritor, Inc. ● | | | 831 | |
| | 47 | | Moog, Inc. Class A ● | | | 1,833 | |
| | 2 | | Nacco Industries, Inc. Class A | | | 151 | |
| | 71 | | Nordson Corp. | | | 3,288 | |
| | 12 | | Polypore International, Inc. ● | | | 607 | |
| | 21 | | Primoris Services Corp. | | | 275 | |
| | 9 | | SauerDanfoss, Inc. ● | | | 345 | |
| | 36 | | Sun Hydraulics Corp. | | | 1,029 | |
| | 47 | | Taser International, Inc. ● | | | 234 | |
| | 33 | | Teledyne Technologies, Inc. ● | | | 1,824 | |
| | 4 | | Timken Co. | | | 186 | |
| | 6 | | Toro Co. | | | 337 | |
| | 17 | | TransDigm Group, Inc. ● | | | 1,623 | |
| | 78 | | Trimas Corp. ● | | | 1,523 | |
| | 12 | | Xerium Technologies, Inc. ● | | | 120 | |
| | | | | | | 37,420 | |
| | | | Commercial & Professional Services - 2.6% | |
| | 5 | | Acacia Research Corp. ● | | | 199 | |
| | 14 | | Brink's Co. | | | 398 | |
| | 13 | | Corporate Executive Board Co. | | | 483 | |
| | 51 | | Deluxe Corp. | | | 1,203 | |
| | 44 | | Exponent, Inc. ● | | | 2,115 | |
| | 127 | | Higher One Holdings, Inc. ● | | | 2,233 | |
| | 14 | | Insperity, Inc. | | | 366 | |
| | 8 | | Intersections, Inc. | | | 130 | |
| | 10 | | RPX Corp. ● | | | 157 | |
| | 60 | | Sykes Enterprises, Inc. ● | | | 962 | |
| | 14 | | TMS International Corp. ● | | | 116 | |
| | 4 | | United Stationers, Inc. | | | 137 | |
| | | | | | | 8,499 | |
| | | | Consumer Durables & Apparel - 1.8% | |
| | 4 | | Blyth, Inc. | | | 204 | |
| | 21 | | Brunswick Corp. | | | 364 | |
| | 23 | | Cherokee, Inc. | | | 306 | |
| | 16 | | Crocs, Inc. ● | | | 286 | |
| | 36 | | Polaris Industries, Inc. | | | 2,298 | |
| | 49 | | Sealy Corp. ● | | | 76 | |
| | 7 | | Sturm Ruger & Co., Inc. | | | 218 | |
| | 5 | | True Religion Apparel, Inc. ● | | | 156 | |
| | 36 | | Warnaco Group, Inc. ● | | | 1,783 | |
| | | | | | | 5,691 | |
| | | | Consumer Services - 3.1% | |
| | 11 | | AFC Enterprises, Inc. ● | | | 145 | |
| | 3 | | American Public Education, Inc. ● | | | 122 | |
| | 6 | | Ameristar Casinos, Inc. | | | 118 | |
| | 1 | | Biglari Holdings, Inc. ● | | | 442 | |
| | 8 | | Bridgepoint Education, Inc. ● | | | 167 | |
| | 3 | | Capella Education Co. ● | | | 111 | |
| | 141 | | Cheesecake Factory, Inc. ● | | | 3,937 | |
| | 3 | | Coinstar, Inc. ● | | | 134 | |
| | 11 | | Domino's Pizza, Inc. ● | | | 362 | |
| | 64 | | Grand Canyon Education, Inc. ● | | | 1,039 | |
| | 60 | | K12, Inc. ● | | | 2,104 | |
| | 10 | | Lincoln Educational Services Corp. | | | 93 | |
| | 13 | | Papa John's International, Inc. ● | | | 446 | |
| | 17 | | Sonic Corp. ● | | | 124 | |
| | 15 | | Sotheby's Holdings | | | 524 | |
| | 17 | | Town Sports International Holdings, Inc. ● | | | 145 | |
| | | | | | | 10,013 | |
| | | | Diversified Financials - 2.2% | |
| | 3 | | Cash America International, Inc. | | | 170 | |
| | 81 | | Compass Diversified Holdings | | | 1,058 | |
| | 90 | | DFC Global Corp. ● | | | 1,968 | |
| | 24 | | Ezcorp, Inc. ● | | | 656 | |
| | 9 | | First Cash Financial Services, Inc. ● | | | 378 | |
| | 37 | | ICG Group, Inc. ● | | | 397 | |
| | 16 | | Imperial Holdings, Inc. ● | | | 36 | |
| | 7 | | Nelnet, Inc. | | | 146 | |
| | 10 | | Portfolio Recovery Associate ● | | | 673 | |
| | 44 | | Stifel Financial ● | | | 1,412 | |
| | 4 | | Virtus Investment Partners, Inc. ● | | | 262 | |
| | | | | | | 7,156 | |
The accompanying notes are an integral part of these financial statements.
| The Hartford SmallCap Growth Fund |
| Schedule of Investments – (continued) |
| October 31, 2011 |
| (000’s Omitted) |
| Shares or Principal Amount | Market Value ╪ | |
COMMON STOCKS - 97.5% - (continued) | |
| | | Energy - 7.0% | |
| | 57 | | Alon USA Energy, Inc. | | $ | 429 | |
| | 9 | | Basic Energy Services, Inc. ● | | | 165 | |
| | 51 | | Berry Petroleum Co. | | | 1,753 | |
| | 44 | | Cal Dive International, Inc. ● | | | 100 | |
| | 12 | | Cloud Peak Energy, Inc. ● | | | 281 | |
| | 73 | | Complete Production Services, Inc. ● | | | 2,404 | |
| | 4 | | Contango ORE, Inc. ● | | | 251 | |
| | 108 | | CVR Energy, Inc. ● | | | 2,665 | |
| | 10 | | Gulf Island Fabrication | | | 284 | |
| | 67 | | Gulfmark Offshore, Inc. ● | | | 2,783 | |
| | 301 | | ION Geophysical Corp. ● | | | 2,290 | |
| | 31 | | James River Coal Co. ● | | | 325 | |
| | 11 | | Matrix Service Co. ● | | | 115 | |
| | 38 | | Petroleum Development Corp. ● | | | 1,000 | |
| | 90 | | Rosetta Resources, Inc. ● | | | 3,972 | |
| | 20 | | RPC, Inc. | | | 367 | |
| | 11 | | Stone Energy Corp. ● | | | 274 | |
| | 17 | | Targa Resources Corp. | | | 557 | |
| | 13 | | TETRA Technologies, Inc. ● | | | 126 | |
| | 183 | | Vaalco Energy, Inc. ● | | | 1,245 | |
| | 30 | | W&T Offshore, Inc. | | | 588 | |
| | 48 | | Warren Resources, Inc. ● | | | 150 | |
| | 23 | | Western Refining, Inc. ● | | | 364 | |
| | | | | | | 22,488 | |
| | | | Food & Staples Retailing - 0.2% | |
| | 18 | | Pantry, Inc. ● | | | 247 | |
| | 295 | | Rite Aid Corp. ● | | | 342 | |
| | | | | | | 589 | |
| | | | Food, Beverage & Tobacco - 2.1% | |
| | 20 | | B&G Foods, Inc. Class A | | | 431 | |
| | 25 | | Boston Beer Co., Inc. Class A ● | | | 2,191 | |
| | 169 | | Darling International, Inc. ● | | | 2,374 | |
| | 20 | | Diamond Foods, Inc. | | | 1,341 | |
| | 14 | | Omega Protein Corp. ● | | | 146 | |
| | 6 | | Vector Group Ltd. | | | 111 | |
| | | | | | | 6,594 | |
| | | | Health Care Equipment & Services - 7.7% | |
| | 28 | | Align Technology, Inc. ● | | | 655 | |
| | 29 | | Alliance Healthcare Services, Inc. ● | | | 32 | |
| | 80 | | Angiodynamics, Inc. ● | | | 1,234 | |
| | 6 | | ArthroCare Corp. ● | | | 166 | |
| | 17 | | Centene Corp. ● | | | 605 | |
| | 8 | | Computer Programs and Systems, Inc. | | | 429 | |
| | 31 | | Corvel Corp. ● | | | 1,579 | |
| | 47 | | Cyberonics, Inc. ● | | | 1,364 | |
| | 123 | | Dexcom, Inc. ● | | | 1,200 | |
| | 31 | | Dynavox, Inc. ● | | | 106 | |
| | 29 | | Hanger Orthopedic Group, Inc. ● | | | 495 | |
| | 38 | | HealthSouth Corp. ● | | | 669 | |
| | 65 | | Healthspring, Inc. ● | | | 3,507 | |
| | 12 | | Healthstream, Inc. ● | | | 179 | |
| | 14 | | Heartware International, Inc. ● | | | 951 | |
| | 50 | | Masimo Corp. | | | 1,034 | |
| | 26 | | Molina Healthcare, Inc. ● | | | 549 | |
| | 4 | | Neogen Corp. ● | | | 147 | |
| | 3 | | Orthofix International N.V. ● | | | 102 | |
| | 84 | | Owens & Minor, Inc. | | | 2,524 | |
| | 9 | | Providence Service Corp. ● | | | 118 | |
| | 37 | | RTI Biologics, Inc. ● | | | 168 | |
| | 5 | | Transcend Services, Inc. ● | | | 142 | |
| | 46 | | U.S. Physical Therapy, Inc. | | | 890 | |
| | 34 | | Volcano Corp. ● | | | 841 | |
| | 67 | | Wellcare Health Plans, Inc. ● | | | 3,288 | |
| | 47 | | Zoll Medical Corp. ● | | | 1,794 | |
| | | | | | | 24,768 | |
| | | | Household & Personal Products - 2.1% | |
| | 38 | | Elizabeth Arden, Inc. ● | | | 1,296 | |
| | 95 | | Nu Skin Enterprises, Inc. Class A | | | 4,806 | |
| | 8 | | Revlon, Inc. ● | | | 122 | |
| | 7 | | Spectrum Brands Holdings, Inc. ● | | | 175 | |
| | 5 | | Usana Health Sciences, Inc. ● | | | 183 | |
| | | | | | | 6,582 | |
| | | | Insurance - 0.8% | |
| | 14 | | Allied World Assurance Holdings Ltd. | | | 790 | |
| | 58 | | Amerisafe, Inc. ● | | | 1,246 | |
| | 18 | | Amtrust Financial Services | | | 444 | |
| | 6 | | Tower Group, Inc. | | | 145 | |
| | | | | | | 2,625 | |
| | | | Materials - 3.7% | |
| | 19 | | Coeur d'Alene Mines Corp. ● | | | 496 | |
| | 53 | | Georgia Gulf Corp. ● | | | 967 | |
| | 125 | | Hecla Mining Co. ● | | | 781 | |
| | 44 | | Kraton Performance Polymers ● | | | 862 | |
| | 11 | | Minerals Technologies, Inc. | | | 626 | |
| | 2 | | Newmarket Corp. | | | 387 | |
| | 70 | | Olin Corp. | | | 1,324 | |
| | 12 | | Rockwood Holdings, Inc. ● | | | 539 | |
| | 7 | | RTI International Metals, Inc. ● | | | 171 | |
| | 16 | | Senomyx, Inc. ● | | | 71 | |
| | 105 | | Silgan Holdings, Inc. | | | 3,936 | |
| | 71 | | Stillwater Mining Co. ● | | | 811 | |
| | 29 | | TPC Group, Inc. ● | | | 576 | |
| | 33 | | Verso Paper Corp. ● | | | 61 | |
| | 11 | | W.R. Grace & Co. ● | | | 439 | |
| | | | | | | 12,047 | |
| | | | Media - 1.3% | |
| | 101 | | Arbitron, Inc. | | | 4,023 | |
| | 17 | | Dex One Corp. ● | | | 11 | |
| | 9 | | National Cinemedia, Inc. | | | 103 | |
| | 19 | | Supermedia, Inc. ● | | | 33 | |
| | | | | | | 4,170 | |
| | | | Pharmaceuticals, Biotechnology & Life Sciences - 12.1% | |
| | 177 | | Alkermes plc ● | | | 3,093 | |
| | 42 | | ARIAD Pharmaceuticals, Inc. ● | | | 487 | |
| | 106 | | Astex Pharmaceuticals, Inc. ● | | | 205 | |
| | 9 | | Aveo Pharmaceuticals, Inc. ● | | | 146 | |
| | 108 | | Bruker Corp. ● | | | 1,555 | |
| | 148 | | Cadence Pharmaceuticals, Inc. ● | | | 862 | |
| | 56 | | Cleveland BioLabs, Inc. ● | | | 168 | |
| | 69 | | Columbia Laboratories, Inc. ● | | | 175 | |
| | 89 | | Cubist Pharmaceuticals, Inc. ● | | | 3,365 | |
| | 16 | | Cumberland Pharmaceuticals, Inc. ● | | | 93 | |
| | 25 | | DepoMed, Inc. ● | | | 112 | |
| | 53 | | DUSA Pharmaceuticals, Inc. ● | | | 239 | |
| | 26 | | Emergent Biosolutions, Inc. ● | | | 492 | |
| | 73 | | Enzon, Inc. ● | | | 534 | |
| | 119 | | Exelixis, Inc. ● | | | 920 | |
| | 20 | | Genomic Health, Inc. ● | | | 419 | |
The accompanying notes are an integral part of these financial statements.
| Shares or Principal Amount | Market Value ╪ | |
COMMON STOCKS - 97.5% - (continued) | |
| | | Pharmaceuticals, Biotechnology & Life Sciences - 12.1% - (continued) | |
| | 11 | | Hi-Technology Pharmacal Co., Inc. ● | | $ | 373 | |
| | 131 | | Immunogen, Inc. ● | | | 1,780 | |
| | 13 | | Impax Laboratories, Inc. ● | | | 249 | |
| | 96 | | Incyte Corp. ● | | | 1,318 | |
| | 124 | | Ironwood Pharmaceuticals, Inc. ● | | | 1,681 | |
| | 24 | | ISTA Pharmaceuticals, Inc. ● | | | 98 | |
| | 12 | | Jazz Pharmaceuticals, Inc. ● | | | 475 | |
| | 13 | | Map Pharmaceuticals, Inc. ● | | | 198 | |
| | 149 | | Medicines Co. ● | | | 2,791 | |
| | 21 | | Medicis Pharmaceutical Corp. Class A | | | 797 | |
| | 20 | | Momenta Pharmaceuticals, Inc. ● | | | 289 | |
| | 140 | | NPS Pharmaceuticals, Inc. ● | | | 724 | |
| | 22 | | Obagi Medical Products, Inc. ● | | | 210 | |
| | 29 | | Oncothyreon, Inc. ● | | | 204 | |
| | 52 | | Onyx Pharmaceuticals, Inc. ● | | | 2,127 | |
| | 47 | | Optimer Pharmaceuticals, Inc. ● | | | 672 | |
| | 4 | | Par Pharmaceutical Cos., Inc. ● | | | 132 | |
| | 43 | | PAREXEL International Corp. ● | | | 936 | |
| | 91 | | PDL Biopharma, Inc. | | | 554 | |
| | 8 | | Pharmasset, Inc. ● | | | 557 | |
| | 18 | | Questcor Pharmaceuticals ● | | | 748 | |
| | 20 | | Regeneron Pharmaceuticals, Inc. ● | | | 1,107 | |
| | 143 | | Rigel Pharmaceuticals, Inc. ● | | | 1,123 | |
| | 77 | | Salix Pharmaceuticals Ltd. ● | | | 2,644 | |
| | 170 | | Seattle Genetics, Inc. ● | | | 3,749 | |
| | 13 | | Spectrum Pharmaceuticals, Inc. ● | | | 147 | |
| | 20 | | ViroPharma, Inc. ● | | | 411 | |
| | | | | | | 38,959 | |
| | | | Real Estate - 1.6% | |
| | 2 | | American Assets Trust, Inc. | | | 45 | |
| | 11 | | CBL & Associates Properties | | | 163 | |
| | 51 | | Colonial Properties Trust | | | 1,032 | |
| | 50 | | Coresite Realty Corp. | | | 825 | |
| | 14 | | Getty Realty Corp. | | | 222 | |
| | 17 | | HFF, Inc. ● | | | 190 | |
| | 5 | | Highwoods Properties, Inc. | | | 164 | |
| | 122 | | MFA Mortgage Investments, Inc. | | | 825 | |
| | 8 | | Omega Healthcare Investors, Inc. | | | 138 | |
| | 13 | | PS Business Parks, Inc. | | | 687 | |
| | 14 | | Sabra Healthcare REIT, Inc. | | | 147 | |
| | 20 | | Universal Health Realty | | | 740 | |
| | | | | | | 5,178 | |
| | | | Retailing - 7.2% | |
| | 10 | | Ann, Inc. ● | | | 253 | |
| | 9 | | Blue Nile, Inc. ● | | | 384 | |
| | 11 | | Buckle (The), Inc. | | | 504 | |
| | 23 | | Cato Corp. | | | 595 | |
| | 55 | | Children's Place Retail Stores, Inc. ● | | | 2,568 | |
| | 17 | | Conns, Inc. ● | | | 160 | |
| | 59 | | Core-Mark Holding Co., Inc. ● | | | 1,962 | |
| | 18 | | Cost Plus, Inc. ● | | | 145 | |
| | 43 | | DSW, Inc. | | | 2,234 | |
| | 19 | | Express, Inc. | | | 420 | |
| | 80 | | GNC Holdings, Inc. ● | | | 1,980 | |
| | 22 | | Overstock.com, Inc. ● | | | 183 | |
| | 10 | | PetMed Express, Inc. | | | 103 | |
| | 32 | | Pier 1 Imports, Inc. ● | | | 399 | |
| | 63 | | rue21, Inc. ● | | | 1,667 | |
| | 23 | | Select Comfort Corp. ● | | | 475 | |
| | 66 | | Shutterfly, Inc. ● | | | 2,764 | |
| | 13 | | Systemax, Inc. ● | | | 197 | |
| | 48 | | Teavana Holdings, Inc. ● | | | 1,087 | |
| | 48 | | Ulta Salon, Cosmetics & Fragrances, Inc. ● | | | 3,240 | |
| | 43 | | Vitamin Shoppe, Inc. ● | | | 1,639 | |
| | 7 | | Williams-Sonoma, Inc. | | | 278 | |
| | | | | | | 23,237 | |
| | | | Semiconductors & Semiconductor Equipment - 4.1% | |
| | 12 | | Amtech Systems, Inc. ● | | | 125 | |
| | 7 | | Cabot Microelectronics Corp. ● | | | 270 | |
| | 46 | | Cymer, Inc. ● | | | 2,011 | |
| | 85 | | Energy Conversion Devices, Inc. ● | | | 42 | |
| | 18 | | Entegris, Inc. ● | | | 162 | |
| | 231 | | GT Advanced Technologies, Inc. ● | | | 1,891 | |
| | 10 | | Hittite Microwave Corp. ● | | | 537 | |
| | 153 | | Integrated Device Technology, Inc. ● | | | 933 | |
| | 12 | | IXYS Corp. ● | | | 159 | |
| | 20 | | Kulicke and Soffa Industries, Inc. ● | | | 191 | |
| | 256 | | Mindspeed Technologies, Inc. ● | | | 1,422 | |
| | 100 | | MIPS Technologies, Inc. Class A ● | | | 550 | |
| | 75 | | Nanometrics, Inc. ● | | | 1,259 | |
| | 32 | | OmniVision Technologies, Inc. ● | | | 525 | |
| | 81 | | ON Semiconductor Corp. ● | | | 615 | |
| | 133 | | Silicon Image, Inc. ● | | | 854 | |
| | 15 | | Standard Microsystems Corp. ● | | | 361 | |
| | 51 | | Ultratech Stepper, Inc. ● | | | 1,117 | |
| | 8 | | Veeco Instruments, Inc. ● | | | 203 | |
| | | | | | | 13,227 | |
| | | | Software & Services - 15.3% | |
| | 26 | | ACI Worldwide, Inc. ● | | | 811 | |
| | 41 | | Actuate Corp. ● | | | 266 | |
| | 58 | | Ancestry.com, Inc. ● | | | 1,324 | |
| | 13 | | Aspen Technology, Inc. ● | | | 232 | |
| | 13 | | CACI International, Inc. Class A ● | | | 692 | |
| | 72 | | Commvault Systems, Inc. w/ Rights ● | | | 3,058 | |
| | 84 | | Constant Contact, Inc. ● | | | 1,704 | |
| | 50 | | CSG Systems International, Inc. ● | | | 709 | |
| | 79 | | Dice Holdings, Inc. ● | | | 803 | |
| | 9 | | Digimarc Corp. ● | | | 235 | |
| | 42 | | Fortinet, Inc. ● | | | 977 | |
| | 53 | | Infospace, Inc. ● | | | 467 | |
| | 4 | | Interactive Intelligence Group ● | | | 100 | |
| | 63 | | j2 Global Communications, Inc. | | | 1,943 | |
| | 56 | | JDA Software Group, Inc. ● | | | 1,775 | |
| | 181 | | LivePerson, Inc. ● | | | 2,285 | |
| | 64 | | Magma Design Automation, Inc. ● | | | 338 | |
| | 15 | | Manhattan Associates, Inc. ● | | | 627 | |
| | 16 | | MAXIMUS, Inc. | | | 653 | |
| | 9 | | Mercadolibre, Inc. | | | 580 | |
| | 53 | | ModusLink Global Solutions, Inc. w/ Rights | | | 221 | |
| | 3 | | Opentable, Inc. ● | | | 132 | |
| | 61 | | Opnet Technologies, Inc. | | | 2,649 | |
| | 85 | | Parametric Technology Corp. ● | | | 1,763 | |
| | 69 | | QLIK Technologies, Inc. ● | | | 1,961 | |
| | 70 | | Quest Software, Inc. ● | | | 1,222 | |
| | 19 | | RightNow Technologies, Inc. ● | | | 836 | |
| | 236 | | Sapient Corp. | | | 2,923 | |
| | 15 | | SeaChange International, Inc. ● | | | 127 | |
| | 134 | | Solarwinds, Inc. ● | | | 3,855 | |
| | 42 | | Solera Holdings, Inc. | | | 2,309 | |
The accompanying notes are an integral part of these financial statements.
| The Hartford SmallCap Growth Fund |
| Schedule of Investments – (continued) |
| October 31, 2011 |
| (000’s Omitted) |
| Shares or Principal Amount | | | | | Market Value ╪ | |
COMMON STOCKS - 97.5% - (continued) | |
| | | Software & Services - 15.3% - (continued) | |
| | 38 | | Sourcefire, Inc. w/ Rights ● | | | | | | $ | 1,055 | |
| | 62 | | SuccessFactors, Inc. ● | | | | | | | 1,658 | |
| | 30 | | Telenav, Inc. ● | | | | | | | 259 | |
| | 85 | | Tibco Software, Inc. ● | | | | | | | 2,463 | |
| | 8 | | Travelzoo, Inc. ● | | | | | | | 264 | |
| | 13 | | Unisys Corp. ● | | | | | | | 333 | |
| | 22 | | United Online, Inc. | | | | | | | 127 | |
| | 14 | | Vasco Data Security International ● | | | | | | | 116 | |
| | 49 | | VeriFone Systems, Inc. ● | | | | | | | 2,075 | |
| | 6 | | Websense, Inc. ● | | | | | | | 112 | |
| | 61 | | Wright Express Corp. ● | | | | | | | 2,847 | |
| | 41 | | XO Group, Inc. ● | | | | | | | 378 | |
| | | | | | | | | | | 49,264 | |
| | | | Technology Hardware & Equipment - 4.8% | |
| | 10 | | ADTRAN, Inc. | | | | | | | 319 | |
| | 58 | | Aruba Networks, Inc. ● | | | | | | | 1,372 | |
| | 22 | | Blue Coat Systems, Inc. ● | | | | | | | 359 | |
| | 54 | | Coherent, Inc. ● | | | | | | | 2,768 | |
| | 18 | | Comtech Telecommunications Corp. | | | | | | | 604 | |
| | 33 | | Cray, Inc. ● | | | | | | | 207 | |
| | 12 | | DDI Corp. | | | | | | | 114 | |
| | 79 | | Extreme Networks, Inc. ● | | | | | | | 234 | |
| | 5 | | FEI Co. ● | | | | | | | 215 | |
| | 36 | | Interdigital, Inc. | | | | | | | 1,563 | |
| | 87 | | Oplink Communications, Inc. ● | | | | | | | 1,419 | |
| | 69 | | Plantronics, Inc. | | | | | | | 2,299 | |
| | 26 | | Polycom, Inc. ● | | | | | | | 426 | |
| | 42 | | QLogic Corp. ● | | | | | | | 581 | |
| | 14 | | Riverbed Technology, Inc. ● | | | | | | | 378 | |
| | 25 | | Synaptics, Inc. ● | | | | | | | 831 | |
| | 40 | | Universal Display Corp. ● | | | | | | | 1,875 | |
| | | | | | | | | | | 15,564 | |
| | | | Telecommunication Services - 0.5% | |
| | 16 | | AboveNet, Inc. | | | | | | | 932 | |
| | 19 | | Cbeyond, Inc. ● | | | | | | | 159 | |
| | 50 | | Cincinnati Bell, Inc. ● | | | | | | | 159 | |
| | 11 | | Leap Wireless International, Inc. w/ Rights ● | | | | | | | 74 | |
| | 42 | | Vonage Holdings Corp. ● | | | | | | | 141 | |
| | | | | | | | | | | 1,465 | |
| | | | Transportation - 1.8% | |
| | 174 | | Avis Budget Group, Inc. ● | | | | | | | 2,448 | |
| | 32 | | Hawaiian Holdings, Inc. ● | | | | | | | 173 | |
| | 31 | | Marten Transport Ltd. | | | | | | | 554 | |
| | 16 | | Quality Distribution, Inc. ● | | | | | | | 184 | |
| | 98 | | Werner Enterprises, Inc. | | | | | | | 2,322 | |
| | | | | | | | | | | 5,681 | |
| | | | Utilities - 0.5% | |
| | 40 | | UniSource Energy Corp. | | | | | | | 1,484 | |
| | | | | | | | | | | | |
| | | | Total common stocks | | | | | | | | |
| | | | (cost $281,136) | | | | | | $ | 313,662 | |
EXCHANGE TRADED FUNDS - 0.8% | |
| | | Other Investment Pools and Funds - 0.8% | |
| | 29 | | iShares Russell 2000 Growth Index Fund | | | | | | $ | 2,499 | |
| | | | | | | | | | | | |
| | | | Total exchange traded funds | | | | | | | | |
| | | | (cost $2,270) | | | | | | $ | 2,499 | |
| | | | | | | | | | | | |
| | | | Total long-term investments | | | | | | | | |
| | | | (cost $283,406) | | | | | | $ | 316,161 | |
| | | | | | | | | | | | |
SHORT-TERM INVESTMENTS - 1.7% | |
| Repurchase Agreements - 1.7% | |
| | | | Bank of America Merrill Lynch TriParty Joint Repurchase Agreement (maturing on 11/01/2011 in the amount of $327, collateralized by FHLMC 4.50%, 2040, FNMA 5.00, 2041, value of $334) | | | | | | | | |
| $ | 327 | | 0.11%, 10/31/2011 | | | | | | $ | 327 | |
| | | | Barclays Capital TriParty Joint Repurchase Agreement (maturing on 11/01/2011 in the amount of $3,125, collateralized by FNMA 5.50%, 2041, GNMA 4.00%, 2040, U.S. Treasury Bond 8.13%, 2021, U.S. Treasury Note 2.50% - 3.63%, 2015 - 2020, value of $3,188) | | | | | | | | |
| | 3,125 | | 0.11%, 10/31/2011 | | | | | | | 3,125 | |
| | | | Deutsche Bank Securities TriParty Joint Repurchase Agreement (maturing on 11/01/2011 in the amount of $442, collateralized by GNMA 4.00% - 5.00%, 2040, value of $451) | | | | | | | | |
| | 442 | | 0.11%, 10/31/2011 | | | | | | | 442 | |
| | | | UBS Securities, Inc. Joint Repurchase Agreement (maturing on 11/01/2011 in the amount of $-, collateralized by U.S. Treasury Note 1.88%, 2014, value of $-) | | | | | | | | |
| | – | | 0.11%, 10/31/2011 | | | | | | | – | |
| | | | UBS Securities, Inc. TriParty Joint Repurchase Agreement (maturing on 11/01/2011 in the amount of $1,522, collateralized by GNMA 3.50% - 4.50%, 2041, value of $1,552) | | | | | | | | |
| | 1,522 | | 0.11%, 10/31/2011 | | | | | | | 1,522 | |
| | | | | | | | | | | 5,416 | |
| | | | Total short-term investments | | | | | | | | |
| | | | (cost $5,416) | | | | | | $ | 5,416 | |
| | | | | | | | | | | | |
| | | | Total investments | | | | | | | | |
| | | | (cost $288,822) ▲ | | | 100.0 | % | | $ | 321,577 | |
| | | | Other assets and liabilities | | | – | % | | | (102 | ) |
| | | | Total net assets | | | 100.0 | % | | $ | 321,475 | |
The accompanying notes are an integral part of these financial statements.
| Note: | Percentage of investments as shown is the ratio of the total market value to total net assets. Market value of long-term investments in foreign securities represents 1.2% of total net assets at October 31, 2011. |
Prices of foreign equities that are principally traded on certain foreign markets may be adjusted daily pursuant to a fair value pricing service approved by the Board of Directors in order to reflect an adjustment for factors occurring after the close of certain foreign markets but before the close of the New York Stock Exchange.
| ▲ | At October 31, 2011, the cost of securities for federal income tax purposes was $290,227 and the aggregate gross unrealized appreciation and depreciation based on that cost were: |
| Unrealized Appreciation | | $ | 51,549 | |
| Unrealized Depreciation | | | (20,199 | ) |
| Net Unrealized Appreciation | | $ | 31,350 | |
| ╪ | See Significant Accounting Policies of accompanying Notes to Financial Statements regarding valuation of securities. |
The accompanying notes are an integral part of these financial statements.
|
| Investment Valuation Hierarchy Level Summary |
| October 31, 2011 |
| (000’s Omitted) |
| | | | | | | | | | | | | |
| Assets: | | | | | | | | | | | | |
| Common Stocks ‡ | | $ | 313,662 | | | $ | 313,662 | | | $ | – | | | $ | – | |
| Exchange Traded Funds | | | 2,499 | | | | 2,499 | | | | – | | | | – | |
| Short-Term Investments | | | 5,416 | | | | – | | | | 5,416 | | | | – | |
| Total | | $ | 321,577 | | | $ | 316,161 | | | $ | 5,416 | | | $ | – | |
| ♦ | For the year ended October 31, 2011, there were no significant transfers between Level 1 and Level 2. |
| ‡ | The Fund has all or primarily all of the equity securities categorized in a particular level. Refer to the Schedule of Investments for further industry breakout. |
The accompanying notes are an integral part of these financial statements.
|
| Statement of Assets and Liabilities |
| October 31, 2011 |
| (000’s Omitted) |
| Assets: | | | |
| Investments in securities, at market value (cost $288,822) | | $ | 321,577 | |
| Cash | | | 28 | |
| Receivables: | | | | |
| Investment securities sold | | | 2,809 | |
| Fund shares sold | | | 188 | |
| Dividends and interest | | | 34 | |
| Other assets | | | 74 | |
| Total assets | | | 324,710 | |
| Liabilities: | | | | |
| Payables: | | | | |
| Investment securities purchased | | | 2,688 | |
| Fund shares redeemed | | | 407 | |
| Investment management fees | | | 50 | |
| Administrative fees | | | — | |
| Distribution fees | | | 11 | |
| Accrued expenses | | | 79 | |
| Total liabilities | | | 3,235 | |
| Net assets | | $ | 321,475 | |
| Summary of Net Assets: | | | | |
| Capital stock and paid-in-capital | | $ | 329,459 | |
| Accumulated undistributed net investment income | | | — | |
| Accumulated net realized loss on investments | | | (40,739 | ) |
| Unrealized appreciation of investments | | | 32,755 | |
| Net assets | | $ | 321,475 | |
| Shares authorized | | | 27,000,000 | |
| Par value | | $ | 0.0001 | |
Class A: Net asset value per share/Maximum offering price per share | | | $31.27/$33.09 | |
| Shares outstanding | | | 4,935 | |
| Net assets | | $ | 154,303 | |
Class B: Net asset value per share | | $ | 26.77 | |
| Shares outstanding | | | 262 | |
| Net assets | | $ | 7,018 | |
Class C: Net asset value per share | | $ | 26.51 | |
| Shares outstanding | | | 463 | |
| Net assets | | $ | 12,285 | |
Class I: Net asset value per share | | $ | 31.52 | |
| Shares outstanding | | | 295 | |
| Net assets | | $ | 9,312 | |
Class R3: Net asset value per share | | $ | 31.53 | |
| Shares outstanding | | | 24 | |
| Net assets | | $ | 763 | |
Class R4: Net asset value per share | | $ | 31.91 | |
| Shares outstanding | | | 96 | |
| Net assets | | $ | 3,059 | |
Class R5: Net asset value per share | | $ | 32.38 | |
| Shares outstanding | | | 7 | |
| Net assets | | $ | 227 | |
Class Y: Net asset value per share | | $ | 32.51 | |
| Shares outstanding | | | 4,138 | |
| Net assets | | $ | 134,508 | |
The accompanying notes are an integral part of these financial statements.
|
| Statement of Operations |
For the Year Ended October 31, 2011 |
| (000’s Omitted) |
| Investment Income: | | | |
| Dividends | | $ | 2,119 | |
| Interest | | | 5 | |
| Total investment income | | | 2,124 | |
| | | | | |
| Expenses: | | | | |
| Investment management fees | | | 2,546 | |
| Administrative services fees | | | 6 | |
| Transfer agent fees | | | 646 | |
| Distribution fees | | | | |
| Class A | | | 205 | |
| Class B | | | 85 | |
| Class C | | | 129 | |
Class L* | | | 192 | |
| Class R3 | | | 3 | |
| Class R4 | | | 8 | |
| Custodian fees | | | 18 | |
| Accounting services fees | | | 50 | |
| Registration and filing fees | | | 110 | |
| Board of Directors' fees | | | 6 | |
| Audit fees | | | 13 | |
| Other expenses | | | 53 | |
| Total expenses (before waivers and fees paid indirectly) | | | 4,070 | |
| Expense waivers | | | (125 | ) |
| Transfer agent fee waivers | | | (88 | ) |
| Commission recapture | | | (2 | ) |
| Total waivers and fees paid indirectly | | | (215 | ) |
| Total expenses, net | | | 3,855 | |
| Net Investment Loss | | | (1,731 | ) |
| Net Realized Gain on Investments: | | | | |
| Net realized gain on investments in securities | | | 39,667 | |
| Net Realized Gain on Investments | | | 39,667 | |
| Net Changes in Unrealized Depreciation of Investments: | | | | |
| Net unrealized depreciation of investments | | | (899 | ) |
| Net Changes in Unrealized Depreciation of Investments | | | (899 | ) |
| Net Gain on Investments | | | 38,768 | |
| Net Increase in Net Assets Resulting from Operations | | $ | 37,037 | |
| * | Class L merged into Class A on August 5, 2011. Please refer to the Notes to Financial Statements for further details. |
The accompanying notes are an integral part of these financial statements.
|
| Statement of Changes in Net Assets |
| |
| (000’s Omitted) |
| | | For the Year Ended October 31, 2011 | | | For the Year Ended October 31, 2010 | |
| Operations: | | | | | | |
| Net investment loss | | $ | (1,731 | ) | | $ | (1,035 | ) |
| Net realized gain on investments | | | 39,667 | | | | 27,377 | |
| Net unrealized appreciation (depreciation) of investments | | | (899 | ) | | | 32,836 | |
| Payment from affiliate | | | — | | | | 242 | |
| Net Increase In Net Assets Resulting From Operations | | | 37,037 | | | | 59,420 | |
| Capital Share Transactions: | | | | | | | | |
| Class A | | | 114,058 | | | | (6,093 | ) |
| Class B | | | (2,430 | ) | | | (2,062 | ) |
| Class C | | | (180 | ) | | | (1,709 | ) |
| Class I | | | 3,345 | | | | (579 | ) |
| Class L* | | | (122,076 | ) | | | (9,989 | ) |
| Class R3 | | | 378 | | | | 93 | |
| Class R4 | | | (119 | ) | | | 280 | |
| Class R5 | | | 75 | | | | (1,348 | ) |
| Class Y | | | 26,308 | | | | 73,578 | |
| Net increase from capital share transactions | | | 19,359 | | | | 52,171 | |
| Net Increase In Net Assets | | | 56,396 | | | | 111,591 | |
| Net Assets: | | | | | | | | |
| Beginning of period | | | 265,079 | | | | 153,488 | |
| End of period | | $ | 321,475 | | | $ | 265,079 | |
| Accumulated undistributed (distribution in excess of) net investment income (loss) | | $ | — | | | $ | — | |
| * | Class L merged into Class A on August 5, 2011. Please refer to the Notes to Financial Statements for further details. |
The accompanying notes are an integral part of these financial statements.
|
| Notes to Financial Statements |
| October 31, 2011 |
| (000’s Omitted) |
The Hartford Mutual Funds II, Inc. (“Company”) is an open-end management investment company comprised of five portfolios. Financial statements for The Hartford SmallCap Growth Fund (the “Fund”), a series of the Company, are included in this report.
The Company is organized under the laws of the State of Maryland and is registered with the Securities and Exchange Commission (“SEC”) under the Investment Company Act of 1940, as amended (“1940 Act”). The Fund is a diversified open-end management investment company.
Class A shares are sold with a front-end sales charge of up to 5.50%. Class B shares were sold with a contingent deferred sales charge which is assessed on the lesser of the per share net asset value (“NAV”) of the shares at the time of redemption or the original purchase price, and declines from up to 5.00% to zero depending on the period of time the shares are held (see note below regarding the closing of Class B shares). Class C shares are sold with a contingent deferred sales charge of up to 1.00% on shares redeemed within twelve months of purchase. Class I shares are sold without sales charges to certain eligible investors primarily through advisory fee-based wrap programs. Class R3, R4 and R5 shares, which are offered to employer-sponsored retirement plans, and Class Y shares, which are sold to certain eligible institutional investors, are sold without a sales charge. All classes of shares have identical voting, redemption, dividend, liquidation and other rights and the same terms and conditions, with the exceptions that each class may have different expenses, which may affect performance, and that Class B shares automatically convert to Class A shares after 8 years.
No new or additional investments are allowed in Class B shares of The Hartford Mutual Funds (including investments through any systematic investment plan). Existing shareholders of Class B shares may continue to hold their Class B shares, exchange their Class B shares for Class B shares of another Hartford Mutual Fund (as permitted by existing exchange privileges), or redeem their Class B shares as described in the Fund’s prospectus. Reinstatement privileges with respect to Class B shares will continue under the current policy. For investors electing to reinvest capital gains and dividends, any such capital gains or dividends on Class B shares will continue to be reinvested in Class B shares of the Fund. All Class B share attributes, including the 12b-1 fee, contingent deferred sales charge schedule, and conversion to Class A shares, remain unchanged.
| 2. | Significant Accounting Policies: |
The following is a summary of significant accounting policies of the Fund in the preparation of its financial statements, which are in accordance with the United States Generally Accepted Accounting Principles (“U.S. GAAP”). The preparation of financial statements in accordance with U.S. GAAP may require management to make estimates and assumptions that affect the reported amounts of assets and liabilities and disclosure of contingent assets and liabilities at the date of the financial statements and the reported amounts of increases and decreases in net assets from operations during the reporting period. Actual results could differ from those estimates.
| | a) | Determination of Net Asset Value – The NAV of each class of the Fund's shares is determined as of the close of regular trading (normally 4:00 p.m. Eastern Time) (the “NYSE Close”) on each day that the New York Stock Exchange (the “Exchange”) is open (“Valuation Date”). Information that becomes known to the Fund after the NAV has been calculated on a particular day will not generally be used to retroactively adjust the NAV determined earlier that day. |
| | b) | Investment Valuation and Fair Value Measurements – For purposes of calculating the NAV, portfolio securities and other assets held by the Fund's portfolio for which market quotes are readily available are valued at market value. Market value is generally determined on the basis of last reported sales prices or official close price. If no sales are reported, market value is based on quotes obtained from a quotation reporting system, established market makers, or independent |
| | pricing services. If market prices are not readily available or are deemed unreliable, the Fund will use the fair value of the security as determined in good faith under policies and procedures established by and under the supervision of the Company’s Board of Directors. Market quotes are considered not readily available where there is an absence of current or reliable market-based data (e.g., trade information or broker quotes), including where events occur after the close of the relevant market, but prior to the NYSE Close that materially affect the values of the Fund’s portfolio securities or assets. In addition, market quotes are considered not readily available when, due to extraordinary circumstances, the exchanges or markets on which the securities trade do not open for trading for the entire day and no other market prices are available. In addition, prices of foreign equities that are principally traded on certain foreign markets are adjusted daily pursuant to a fair value pricing service approved by the Board of Directors in order to reflect an adjustment for the factors occurring after the close of certain foreign markets but before the NYSE Close. Securities that are primarily traded on foreign markets may trade on days that are not business days of the Fund. The value of the foreign securities in which the Fund invests may change on days when a shareholder will not be able to purchase or redeem shares of the Fund. Fair value pricing is subjective in nature and the use of fair value pricing by the Fund may cause the NAV of its shares to differ significantly from the NAV that would have been calculated using market prices at the close of the exchange on which a portfolio security is primarily traded. There can be no assurance that the Fund could obtain the fair market value assigned to a security if the Fund were to sell the security at approximately the time at which the Fund determines its NAV. |
Investments in open-end mutual funds are valued at the respective NAV of each open-end mutual fund on the Valuation Date.
Financial instruments for which prices are not available from an independent pricing service may be valued using market quotations obtained from one or more dealers that make markets in the respective financial instrument in accordance with procedures established by the Company’s Board of Directors.
U.S. GAAP defines fair value as the price that the Fund would receive to sell an asset or pay to transfer a liability in an orderly transaction between market participants. The U.S. GAAP fair value measurement standards require disclosure of a fair value hierarchy for each major category of assets and liabilities. Various inputs are used in determining the fair value of the Fund’s investments. These inputs are summarized into three broad hierarchy levels. This hierarchy is based on whether the valuation inputs are observable or unobservable. These levels are:
| | · | Level 1 – Quoted prices in active markets for identical securities. Level 1 may include exchange traded instruments, such as domestic equities, some foreign equities, options, futures, mutual funds, exchange traded funds, rights and warrants. |
| | · | Level 2 – Observable inputs other than Level 1 prices, such as quoted prices for similar securities; quoted prices in markets that are not active; or other inputs that are observable or can be corroborated by observable market data. Level 2 may include debt securities that are traded less frequently than exchange traded instruments and which are valued using third party pricing services; foreign equities, that are principally traded on certain foreign markets and are adjusted daily pursuant to a fair value pricing service in order to reflect an adjustment for the factors occurring after the close of certain foreign markets but before the NYSE Close; and short-term securities, which are valued at amortized cost. |
| | · | Level 3 – Significant unobservable inputs that are supported by limited or no market activity. Level 3 may include financial instruments whose values are determined using broker quotes or require significant management judgment or estimation. These unobservable valuation inputs may include estimates for current yields, maturity/duration, prepayment speed, and broker quotes for comparable securities along with other assumptions relating to credit quality, collateral value, complexity of the security structure, general market conditions and liquidity. This category may include securities where trading has been halted or there are certain restrictions on trading. While these securities are priced using unobservable inputs, the valuation of these securities reflects the best available data and management believes the prices are a reasonable representation of exit price. |
| The Hartford SmallCap Growth Fund |
Notes to Financial Statements – (continued) |
| October 31, 2011 |
| (000’s Omitted) |
Valuation levels are not necessarily indicative of the risk associated with investing in such securities. Individual securities within any of the above mentioned asset classes may be assigned a different hierarchical level than those presented above, as individual circumstances dictate.
During the year ended October 31, 2011, the Fund held no Level 3 securities; therefore, no reconciliation of Level 3 securities is presented.
For additional information, refer to the Investment Valuation Hierarchy Level Summary which follows the Schedule of Investments.
For purposes of reporting transfers between different hierarchy levels, both transfers in and out of each level, as applicable, are shown as if they occurred at the beginning of the period.
| | c) | Security Transactions and Investment Income – Security transactions are recorded as of the trade date (the date the order to buy or sell is executed) for financial reporting purposes. Securities purchased or sold on a when-issued or delayed-delivery basis may be settled a month or more after the trade date. Realized gains and losses are determined on the basis of identified cost. |
Dividend income is accrued as of the ex-dividend date, except certain dividends from foreign securities where the ex-dividend date may have passed are recorded as soon as the Fund is informed of the dividend. Interest income, including amortization of premium and accretion of discounts, is accrued on a daily basis.
| | d) | Joint Trading Account – The Fund may invest cash balances into a joint trading account that may be invested in one or more repurchase agreements. |
| | e) | Fund Share Valuation and Dividend Distributions to Shareholders – Orders for the Fund’s shares are executed in accordance with the investment instructions of the shareholders. The NAV of the Fund’s shares is determined as of the close of business on each business day of the Exchange. The NAV is determined separately for each class of shares of the Fund by dividing the Fund’s net assets attributable to that class by the number of shares of the class outstanding. Each class of shares offered by the Fund has equal rights as to assets and voting privileges (except that shareholders of a class have exclusive voting rights regarding any matter relating solely to that class of shares). Income and non-class specific expenses are allocated daily to each class on the basis of the relative net assets of the class. Realized and unrealized capital gains and losses are allocated daily based on the relative net assets of each class of shares of the Fund. |
Orders for the purchase of the Fund’s shares received prior to the close of the Exchange on any day the Exchange is open for business are priced at the NAV determined as of the close of the Exchange. Orders received after the close of the Exchange, or on a day on which the Exchange and/or the Fund is not open for business, are priced at the next determined NAV.
Dividends are declared pursuant to a policy adopted by the Company’s Board of Directors based upon the investment performance of the Fund. The policy of the Fund is to pay dividends from net investment income and realized capital gains, if any, at least once a year.
Distributions from net investment income, net realized capital gains and capital are determined in accordance with federal income tax regulations, which may differ from U.S. GAAP with respect to character and timing. These differences may include but are not limited to losses deferred due to wash sale adjustments, foreign currency gains and losses, adjustments related to Passive Foreign Investment Companies (“PFICs”), Real Estate Investment Trusts (“REITs”), Regulated Investment Companies (“RICs”), certain derivatives and partnerships. Permanent book and federal
income tax basis differences relating to shareholder distributions will result in reclassifications to certain of the Fund’s capital accounts (see Federal Income Taxes: Reclassification of Capital Accounts note).
| 3. | Securities and Other Investments: |
| | a) | Repurchase Agreements – A repurchase agreement is an agreement by which a counterparty agrees to sell a security and agrees to repurchase the security sold at a mutually agreed upon time and price. At the time the Fund enters into a repurchase agreement, the value of the underlying collateral security(ies), including accrued interest, will be equal to or exceed the value of the repurchase agreement. Repurchase agreements expose the Fund to counterparty risk. To minimize counterparty risk, the securities that serve to collateralize the repurchase agreement are held by the Fund's custodian in book entry or physical form in the custodial account of the Fund or in a third party custodial account. Repurchase agreements are valued at cost plus accrued interest. The Fund, as shown on the Schedule of Investments, had outstanding repurchase agreements as of October 31, 2011. |
| | a) | Counterparty Risk – The Fund may be exposed to counterparty risk, or the risk that an institution or other entity with which the Fund has unsettled or open transactions will default. |
| | b) | Market Risks – The market values of equity securities, such as common stocks and preferred stocks, or equity related investments, such as futures and options, may decline due to general market conditions which are not specifically related to a particular company, such as real or perceived adverse economic conditions, changes in the general outlook for corporate earnings, changes in interest or currency rates or adverse investor sentiment generally. The market value of equity securities may also decline due to factors which affect a particular industry or industries, such as labor shortages or increased production costs and competitive conditions within an industry. Equity securities and equity related investments generally have greater market price volatility than fixed income securities. |
| | a) | Federal Income Taxes – For federal income tax purposes, the Fund intends to continue to qualify as a RIC under Subchapter M of the Internal Revenue Code (“IRC”) by distributing substantially all of its taxable net investment income and net realized capital gains to its shareholders and otherwise complying with the requirements of RICs. The Fund has distributed substantially all of its income and capital gains in prior years, if applicable, and intends to distribute substantially all of its income and capital gains during the calendar year ending December 31, 2011. Accordingly, no provision for federal income or excise taxes has been made in the accompanying financial statements. Distributions from short-term capital gains are treated as ordinary income distributions for federal income tax purposes. |
| | b) | Net Investment Income (Loss), Net Realized Gains (Losses) – Net investment income (loss) and net realized gains (losses) may differ for financial statement and tax purposes primarily because of losses deferred due to wash sale adjustments, foreign currency gains and losses, adjustments related to PFICs, REITs, RICs, certain derivatives and partnerships. The character of distributions made during the year from net investment income or net realized gains may differ from their ultimate characterization for federal income tax purposes. Also, due to the timing of dividend distributions, the fiscal year in which amounts are distributed may differ from the year that the income or realized gains (losses) were recorded by the Fund. |
| The Hartford SmallCap Growth Fund |
Notes to Financial Statements – (continued) |
| October 31, 2011 |
| (000’s Omitted) |
| | c) | Components of Distributable Earnings – The Fund’s components of distributable earnings (deficit) on a tax basis at October 31, 2011, are as follows: |
| | | Amount | |
| Accumulated Capital Losses * | | $ | (39,333 | ) |
| Unrealized Appreciation † | | | 31,349 | |
| Total Accumulated Deficit | | $ | (7,984 | ) |
| | * | The Fund has capital loss carryforwards that are identified in the Capital Loss Carryforward note that follows. |
| | † | The differences between book-basis and tax-basis unrealized appreciation (depreciation) may be attributable to the losses deferred due to wash sale adjustments, foreign currency gains and losses, adjustments related to PFICs, REITs, RICs, certain derivatives and partnerships. |
| | d) | Reclassification of Capital Accounts – The Fund may record reclassifications in its capital accounts. These reclassifications have no impact on the total net assets of the Fund. The reclassifications are a result of permanent differences between U.S. GAAP and tax accounting for such items as foreign currency, PFICs, expiration or utilization of capital loss carryforwards or net operating losses. Adjustments are made to reflect the impact these items have on current and future distributions to shareholders. Therefore, the source of the Fund’s distributions may be shown in the accompanying Statement of Changes in Net Assets as from accumulated undistributed net investment income, from accumulated net realized gains on investments or from capital depending on the type of book and tax differences that exist. For the year ended October 31, 2011, the Fund recorded reclassifications to increase (decrease) the accounts listed below: |
| | | Amount | |
| Accumulated Undistributed Net Investment Income | | $ | 1,731 | |
| Accumulated Net Realized Gain (Loss) on Investments | | | 137 | |
| Capital Stock and Paid-In-Capital | | | (1,868 | ) |
| | e) | Capital Loss Carryforward – At October 31, 2011 (tax-year-end), the Fund had capital loss carryforwards for U.S. federal income tax purposes of approximately: |
Year of Expiration | | Amount | |
| 2017 | | $ | 39,333 | |
| Total | | $ | 39,333 | |
As of October 31, 2011, the Fund utilized $39,833 of prior year capital loss carryforwards.
| | f) | Accounting for Uncertainty in Income Taxes – The Fund has adopted financial reporting rules that require the Fund to analyze all open tax years, as defined by the statute of limitations, for all major jurisdictions. Generally, tax authorities can examine all tax returns filed for the last three years. The Fund does not have an examination in progress. |
The Fund has reviewed all open tax years and major jurisdictions and concluded that these financial reporting rules had no effect on the Fund’s financial position or results of operations. There is no tax liability resulting from unrecognized tax benefits relating to uncertain income tax positions taken or expected to be taken on the tax return for the fiscal year ended October 31, 2011. The Fund is also not aware of any tax positions for which it is reasonably possible that the total amounts of unrecognized tax benefits will significantly change in the next twelve months.
| | a) | Investment Management Agreement – Hartford Investment Financial Services, LLC (“HIFSCO”), a wholly-owned indirect subsidiary of The Hartford Financial Services Group, Inc. (“The Hartford”), serves as investment manager to the Fund pursuant to an Investment Management Agreement with the Company. As investment manager, HIFSCO has overall investment supervisory responsibility for the Fund. In addition, HIFSCO provides administrative personnel, services, equipment, facilities and office space for proper operation of the Fund. HIFSCO has contracted with Wellington Management Company, LLP (“Wellington Management”) under a sub-advisory agreement for the provision of day-to-day investment management services to the Fund in accordance with the Fund’s investment objective and policies. The Fund pays a fee to HIFSCO, a portion of which may be used to compensate Wellington Management. |
The schedule below reflects the rates of compensation paid to HIFSCO for investment management services rendered as of October 31, 2011; the rates are accrued daily and paid monthly:
| Average Daily Net Assets | | Annual Fee | |
| On first $100 million | | | 0.90 | % |
| On next $150 million | | | 0.80 | % |
| On next $250 million | | | 0.70 | % |
| On next $4.5 billion | | | 0.65 | % |
| On next $5 billion | | | 0.63 | % |
| Over $10 billion | | | 0.62 | % |
| | b) | Accounting Services Agreement – Pursuant to the Fund Accounting Agreement between Hartford Life Insurance Company (“HLIC”) and the Company, on behalf of the Fund, HLIC provides accounting services to the Fund and receives monthly compensation based on the Fund’s average net assets at the rates set forth below. The Fund’s accounting services fees are accrued daily and paid monthly. |
| Average Daily Net Assets | | Annual Fee | |
| On first $5 billion | | | 0.016 | % |
| On next $5 billion | | | 0.014 | % |
| Over $10 billion | | | 0.012 | % |
| | c) | Operating Expenses – Allocable expenses incurred by the Company are allocated to each Fund and allocated to classes within the Fund in proportion to the average daily net assets of the Fund and each class, except where allocation of certain expenses is more fairly made directly to the Fund or to specific classes within a Fund. As of October 31, 2011, HIFSCO contractually limited the total operating expenses of this Fund, exclusive of taxes, interest expense, brokerage commissions, acquired fund fees and expenses and extraordinary expenses as follows: |
| Class A | | | Class B | | | Class C | | | Class I | | | Class R3 | | | Class R4 | | | Class R5 | | | Class Y | |
| | 1.40 | % | | | 2.15 | % | | | 2.15 | % | | | 1.15 | % | | | 1.60 | % | | | 1.30 | % | | | 1.00 | % | | | 0.95 | % |
| | d) | Fees Paid Indirectly – The Fund has entered into agreements with State Street Global Markets, LLC and Russell Implementation Services Inc. to partially recapture non-discounted trade commissions. Such rebates are used to pay a portion of the Fund’s expenses. In addition, the Fund’s custodian bank, State Street Bank and Trust Co., has also agreed to reduce its fees when the Fund maintains cash on deposit in a non-interest-bearing custody account. For the year ended October 31, 2011, these amounts are included in the Statement of Operations. |
| The Hartford SmallCap Growth Fund |
| Notes to Financial Statements – (continued) |
| October 31, 2011 |
| (000’s Omitted) |
The ratio of expenses to average net assets in the accompanying financial highlights excludes the reduction in expenses related to fees paid indirectly. The annualized expense ratio for the period listed below including the fees paid indirectly is as follows:
| | | Year Ended October 31, 2011 | |
| Class A Shares | | | 1.40 | % |
| Class B Shares | | | 2.15 | |
| Class C Shares | | | 2.15 | |
| Class I Shares | | | 1.10 | |
| Class R3 Shares | | | 1.60 | |
| Class R4 Shares | | | 1.30 | |
| Class R5 Shares | | | 1.00 | |
| Class Y Shares | | | 0.89 | |
| | e) | Distribution and Service Plan for Class A, B, C, R3 and R4 Shares – HIFSCO is the principal underwriter and distributor of the Fund. HIFSCO is engaged in distribution activities, which include marketing and distribution of shares through broker-dealers, financing distribution costs and maintaining financial books and records. For the year ended October 31, 2011, HIFSCO received front-end load sales charges of $242 and contingent deferred sales charges of $9 from the Fund. |
The Fund has adopted a Distribution and Service Plan in accordance with Rule 12b-1 of the 1940 Act to compensate the distributor (HIFSCO) for activities intended to result in the sale and distribution of Class A, B, C, R3 and R4 shares and for providing services for shareholders. During its May 3, 2011 meeting, the Board of Directors approved an amendment to the Fund’s Class A Plan to, effective August 1, 2011, lower the amount of Rule 12b-1 distribution fees that may be charged in respect of Class A shares of the Fund from an annual rate of 0.35% of the Fund’s average daily net assets attributable to Class A shares to 0.25%. The Board of Directors has authorized Rule 12b-1 payments of up to 0.25% of the Fund’s average daily net assets attributable to Class A shares. As a result, the amendment to the Class A Plan did not affect the fees charged under the plan. Some or all of the fee may be used for shareholder servicing expenses with the remainder used for distribution expenses. Some or the entire Rule 12b-1 fee for Class B shares may be remitted to broker-dealers for distribution and/or shareholder account services. Under the Class B Plan, the Fund pays the distributor 1.00% of the average daily net assets of Class B shares that are outstanding for 8 years or less, 0.25% of which is a fee for services provided to existing shareholders with the remainder used for distribution expenses. After eight years, Class B shares convert to Class A shares. Upon conversion to Class A shares, the Class A plan described above will apply to those shares. Under the Class C Plan, the Fund pays the distributor 1.00% of the average daily net assets of Class C shares outstanding, 0.25% of which is intended as a fee for services provided to existing shareholders with the remainder used for distribution expenses. For Class C shares, some or the entire fee may be remitted to broker-dealers for distribution and/or shareholder account services. Class R3 shares have a distribution fee of 0.50% and Class R4 shares have a distribution fee of 0.25%. For Class R3 and R4 shares, some or the entire fee may be remitted to broker dealers for distribution and/or shareholder account services. The Fund’s 12b-1 fees are accrued daily and paid monthly.
For the year ended October 31, 2011, total sales commissions paid to affiliated brokers/dealers of The Hartford for distributing the Fund's shares were $37. These commissions are in turn paid to sales representatives of the broker/dealers.
| | f) | Other Related Party Transactions – Certain officers of the Fund are directors and/or officers of HIFSCO and/or The Hartford or its subsidiaries. For the year ended October 31, 2011, a portion of the Fund’s chief compliance officer’s compensation was paid by all of the investment companies in the Hartford fund complex. The portion allocated to the Fund rounds to zero. Hartford Administrative Services Company (“HASCO”), an indirect wholly-owned subsidiary of The Hartford, provides transfer agent services to the Fund. HASCO has contractually agreed to reimburse any portion of the transfer agency fees over 0.30% of average daily net assets per fiscal year for each class. HASCO was compensated on a per account basis, which varies by share class, for providing such services. The amount to HASCO and any related |
| | contractual reimbursement amounts, if applicable, can be found in the Statement of Operations. These fees are accrued daily and paid monthly. |
Administrative services fees are paid to HASCO for third-party recordkeeping services that are payable as a percentage of net assets in the amount of 0.20%, 0.15% and 0.10% for Classes R3, R4 and R5 shares, respectively. The total administrative services fees are shown on the Statement of Operations. These fees are accrued daily and paid monthly.
| | g) | Payment from Affiliates – On July 28, 2010, the Fund was reimbursed by HASCO $242 relating to a trading error. |
On November 8, 2006, the SEC issued an order setting forth the terms of a settlement reached with three subsidiaries of The Hartford that resolved the SEC’s Division of Enforcement’s investigation of aspects of The Hartford’s variable annuity and mutual fund operations related to directed brokerage and revenue sharing. The Hartford settled this matter without admitting or denying the findings of the SEC.
The total return in the accompanying financial highlights includes a payment from affiliate. Had the payment from affiliate been excluded, the impact and total return for the periods listed below would have been as follows:
| | | Impact from Payment from Affiliate for trading error for the Year Ended October 31, 2010 | | | Total Return Excluding Payment from Affiliate for the Year Ended October 31, 2010 | | | Impact from Payment from Affiliate for SEC Settlement for the Year Ended October 31, 2007 | | | Total Return Excluding Payment from Affiliate for the Year Ended October 31, 2007 | |
| Class A | | | 0.14 | % | | | 34.77 | % | | | 0.01 | % | | | 7.17 | % |
| Class B | | | 0.16 | | | | 33.70 | | | | 0.01 | | | | 6.43 | |
| Class C | | | 0.16 | | | | 33.76 | | | | 0.01 | | | | 6.33 | |
| Class I | | | 0.14 | | | | 35.13 | | | | 0.01 | | | | 7.36 | |
| Class L | | | 0.14 | | | | 35.07 | | | | 0.01 | | | | 7.40 | |
| Class Y | | | 0.14 | | | | 35.38 | | | | 0.01 | | | | 7.60 | |
| Class R3 | | | 0.14 | | | | 34.43 | | | NA | | | NA | |
| Class R4 | | | 0.14 | | | | 34.84 | | | NA | | | NA | |
| Class R5 | | | 0.14 | | | | 35.25 | | | NA | | | NA | |
As of October 31, 2011, affiliates of The Hartford had ownership of shares in the Fund as follows:
| 8. | Investment Transactions: |
For the year ended October 31, 2011, the Fund's aggregate purchases and sales of investment securities (excluding short-term investments) were as follows:
| | | Amount | |
| Cost of Purchases Excluding U.S. Government Obligations | | $ | 229,607 | |
| Sales Proceeds Excluding U.S. Government Obligations | | | 216,227 | |
| The Hartford SmallCap Growth Fund |
| Notes to Financial Statements – (continued) |
| October 31, 2011 |
| (000’s Omitted) |
| 9. | Capital Share Transactions: |
The following information is for the year ended October 31, 2011, and the year ended October 31, 2010:
| | | For the Year Ended October 31, 2011 | | | For the Year Ended October 31, 2010 | |
| | | | | | Shares Issued for Reinvested Dividends | | | | | | | | | Net Increase (Decrease) of Shares | | | | | | Shares Issued for Reinvested Dividends | | | | | | | | | Net Increase (Decrease) of Shares | |
| Class A | | | | | | | | | | | | | | | | | | | | | | | | | | | | | | |
| Shares | | | 761 | | | | — | | | | (740 | ) | | | 2,973 | | | | 2,994 | | | | 373 | | | | — | | | | (634 | ) | | | — | | | | (261 | ) |
| Amount | | $ | 23,715 | | | $ | — | | | $ | (22,980 | ) | | $ | 113,323 | | | $ | 114,058 | | | $ | 9,046 | | | $ | — | | | $ | (15,139 | ) | | $ | — | | | $ | (6,093 | ) |
| Class B | | | | | | | | | | | | | | | | | | | | | | | | | | | | | | | | | | | | | | | | |
| Shares | | | 32 | | | | — | | | | (123 | ) | | | — | | | | (91 | ) | | | 8 | | | | — | | | | (107 | ) | | | — | | | | (99 | ) |
| Amount | | $ | 865 | | | $ | — | | | $ | (3,295 | ) | | $ | — | | | $ | (2,430 | ) | | $ | 163 | | | $ | — | | | $ | (2,225 | ) | | $ | — | | | $ | (2,062 | ) |
| Class C | | | | | | | | | | | | | | | | | | | | | | | | | | | | | | | | | | | | | | | | |
| Shares | | | 103 | | | | — | | | | (110 | ) | | | — | | | | (7 | ) | | | 77 | | | | — | | | | (164 | ) | | | — | | | | (87 | ) |
| Amount | | $ | 2,765 | | | $ | — | | | $ | (2,945 | ) | | $ | — | | | $ | (180 | ) | | $ | 1,602 | | | $ | — | | | $ | (3,311 | ) | | $ | — | | | $ | (1,709 | ) |
| Class I | | | | | | | | | | | | | | | | | | | | | | | | | | | | | | | | | | | | | | | | |
| Shares | | | 179 | | | | — | | | | (78 | ) | | | — | | | | 101 | | | | 36 | | | | — | | | | (59 | ) | | | — | | | | (23 | ) |
| Amount | | $ | 5,814 | | | $ | — | | | $ | (2,469 | ) | | $ | — | | | $ | 3,345 | | | $ | 861 | | | $ | — | | | $ | (1,440 | ) | | $ | — | | | $ | (579 | ) |
| Class L | | | | | | | | | | | | | | | | | | | | | | | | | | | | | | | | | | | | | | | | |
| Shares | | | 68 | | | | — | | | | (335 | ) | | | (2,950 | ) | | | (3,217 | ) | | | 87 | | | | — | | | | (504 | ) | | | — | | | | (417 | ) |
| Amount | | $ | 2,220 | | | $ | — | | | $ | (10,973 | ) | | $ | (113,323 | ) | | $ | (122,076 | ) | | $ | 2,102 | | | $ | — | | | $ | (12,091 | ) | | $ | — | | | $ | (9,989 | ) |
| Class R3 | | | | | | | | | | | | | | | | | | | | | | | | | | | | | | | | | | | | | | | | |
| Shares | | | 16 | | | | — | | | | (5 | ) | | | — | | | | 11 | | | | 6 | | | | — | | | | (2 | ) | | | — | | | | 4 | |
| Amount | | $ | 533 | | | $ | — | | | $ | (155 | ) | | $ | — | | | $ | 378 | | | $ | 138 | | | $ | — | | | $ | (45 | ) | | $ | — | | | $ | 93 | |
| Class R4 | | | | | | | | | | | | | | | | | | | | | | | | | | | | | | | | | | | | | | | | |
| Shares | | | 25 | | | | — | | | | (30 | ) | | | — | | | | (5 | ) | | | 25 | | | | — | | | | (14 | ) | | | — | | | | 11 | |
| Amount | | $ | 836 | | | $ | — | | | $ | (955 | ) | | $ | — | | | $ | (119 | ) | | $ | 623 | | | $ | — | | | $ | (343 | ) | | $ | — | | | $ | 280 | |
| Class R5 | | | | | | | | | | | | | | | | | | | | | | | | | | | | | | | | | | | | | | | | |
| Shares | | | 2 | | | | — | | | | — | | | | — | | | | 2 | | | | 14 | | | | — | | | | (72 | ) | | | — | | | | (58 | ) |
| Amount | | $ | 82 | | | $ | — | | | $ | (7 | ) | | $ | — | | | $ | 75 | | | $ | 345 | | | $ | — | | | $ | (1,693 | ) | | $ | — | | | $ | (1,348 | ) |
| Class Y | | | | | | | | | | | | | | | | | | | | | | | | | | | | | | | | | | | | | | | | |
| Shares | | | 1,658 | | | | — | | | | (810 | ) | | | — | | | | 848 | | | | 3,327 | | | | — | | | | (419 | ) | | | — | | | | 2,908 | |
| Amount | | $ | 52,827 | | | $ | — | | | $ | (26,519 | ) | | $ | — | | | $ | 26,308 | | | $ | 84,288 | | | $ | — | | | $ | (10,710 | ) | | $ | — | | | $ | 73,578 | |
| Total | | | | | | | | | | | | | | | | | | | | | | | | | | | | | | | | | | | | | | | | |
| Shares | | | 2,844 | | | | — | | | | (2,231 | ) | | | 23 | | | | 636 | | | | 3,953 | | | | — | | | | (1,975 | ) | | | — | | | | 1,978 | |
| Amount | | $ | 89,657 | | | $ | — | | | $ | (70,298 | ) | | $ | — | | | $ | 19,359 | | | $ | 99,168 | | | $ | — | | | $ | (46,997 | ) | | $ | — | | | $ | 52,171 | |
The following reflects the conversion of Class B shares into Class A shares (reflected as Class A shares sold) for the year ended October 31, 2011, and the year ended October 31, 2010:
| | | Shares | | | Dollars | |
| For the Year Ended October 31, 2011 | | | 29 | | | $ | 890 | |
| For the Year Ended October 31, 2010 | | | 28 | | | $ | 689 | |
The Fund is one of several Hartford funds that participate in a $500 million committed revolving line of credit facility. The facility is to be used for temporary or emergency purposes. Under the arrangement, the funds are required to own securities having a market value in excess of 300% of the total bank borrowings. The interest rate on borrowings varies depending on the nature of the loan. The facility also requires a fee to be paid based on the amount of the commitment. This commitment fee is allocated to all of the funds participating in the line of credit based on the average net assets of the funds. During the year ended October 31, 2011, the Fund did not have any borrowings under this facility.
At its May 3, 2011, meeting, the Board of Directors of The Hartford Mutual Funds II, Inc. approved the reclassification of Class L shares into Class A shares of the Fund.
Effective with the close of business on August 5, 2011, Class L was merged into Class A. The merger was accomplished by a tax-free exchange as detailed below:
| | | Class A | | | Class L | |
| Shares exchanged | | | N/A | | | | 2,950 | |
| Shares issued - to Class L shareholders | | | 2,973 | | | | N/A | |
| Net assets immediately before merger | | $ | 57,547 | | | $ | 88,480 | |
| Net assets immediately after merger | | $ | 146,027 | | | | N/A | |
| 12. | Industry Classifications: |
Other than the industry classifications “Other Investment Pools and Funds” and “Exchange Traded Funds,” equity industry classifications used in this report are the Global Industry Classification Standard, which was developed by and is the exclusive property and service mark of MSCI, Inc. and Standard & Poor’s.
| 13. | Pending Legal Proceedings: |
On February 25, 2011, Jennifer L. Kasilag, Louis Mellinger, Judith M. Menendez, Jacqueline M. Robinson, and Linda A. Russell filed a derivative lawsuit against HIFSCO on behalf of six funds: The Hartford Global Health Fund (now known as The Hartford Healthcare Fund), The Hartford Conservative Allocation Fund, The Hartford Growth Opportunities Fund, The Hartford Inflation Plus Fund, The Hartford Advisers Fund and The Hartford Money Market Fund. The lawsuit, which was filed in the United States District Court for the District of New Jersey, seeks recovery under Section 36(b) of the 1940 Act for the alleged overpayment of investment management and 12b-1 distribution fees to HIFSCO. The plaintiffs seek recovery of the alleged overpayments or, alternatively, rescission of the contracts and restitution of all fees paid, together with lost earnings. On November 14, 2011, the plaintiffs filed an amended complaint, which dropped The Hartford Money Market Fund and added The Hartford Capital Appreciation Fund as a plaintiff. The Hartford intends to vigorously defend the action.
No accrual for litigation relating to this matter has been recorded in the financial statements of the Fund because the Fund is not party to the suit.
Under the Company’s organizational documents, the Company shall indemnify its officers and directors to the full extent required or permitted under Maryland General Corporation Law and the federal securities laws. In addition, the Company, on behalf of the Fund, may enter into contracts that contain a variety of indemnifications. The Company’s maximum exposure under these arrangements is unknown. However, as of the date of these financial statements, the Company has not had prior claims or losses pursuant to these contracts and expects the risk of loss to be remote.
|
| Financial Highlights |
| - Selected Per-Share Data (A) - |
| | Net Asset Value at Beginning of Period | | | Net Investment Income (Loss) | | | Payments from (to) Affiliate | | | Net Realized and Unrealized Gain (Loss) on Investments | | | Total from Investment Operations | | | Dividends from Net Investment Income | | | Distributions from Realized Capital Gains | | | Distributions from Capital | | | | | | Net Increase (Decrease) in Net Asset Value | | | Net Asset Value at End of Period | |
| | |
| For the Year Ended October 31, 2011 (E) | |
| A(F) | | $ | 27.59 | | | $ | (0.29 | ) | | $ | – | | | $ | 3.97 | | | $ | 3.68 | | | $ | – | | | $ | – | | | $ | – | | | $ | – | | | $ | 3.68 | | | $ | 31.27 | |
| B | | | 23.80 | | | | (0.40 | ) | | | – | | | | 3.37 | | | | 2.97 | | | | – | | | | – | | | | – | | | | – | | | | 2.97 | | | | 26.77 | |
| C | | | 23.57 | | | | (0.40 | ) | | | – | | | | 3.34 | | | | 2.94 | | | | – | | | | – | | | | – | | | | – | | | | 2.94 | | | | 26.51 | |
| I | | | 27.73 | | | | (0.14 | ) | | | – | | | | 3.93 | | | | 3.79 | | | | – | | | | – | | | | – | | | | – | | | | 3.79 | | | | 31.52 | |
| R3 | | | 27.87 | | | | (0.30 | ) | | | – | | | | 3.96 | | | | 3.66 | | | | – | | | | – | | | | – | | | | – | | | | 3.66 | | | | 31.53 | |
| R4 | | | 28.13 | | | | (0.20 | ) | | | – | | | | 3.98 | | | | 3.78 | | | | – | | | | – | | | | – | | | | – | | | | 3.78 | | | | 31.91 | |
| R5 | | | 28.46 | | | | (0.11 | ) | | | – | | | | 4.03 | | | | 3.92 | | | | – | | | | – | | | | – | | | | – | | | | 3.92 | | | | 32.38 | |
| Y | | | 28.54 | | | | (0.07 | ) | | | – | | | | 4.04 | | | | 3.97 | | | | – | | | | – | | | | – | | | | – | | | | 3.97 | | | | 32.51 | |
| | |
| For the Year Ended October 31, 2010 (E) | |
| A | | | 20.45 | | | | (0.15 | ) | | | 0.02 | | | | 7.27 | | | | 7.14 | | | | – | | | | – | | | | – | | | | – | | | | 7.14 | | | | 27.59 | |
| B | | | 17.78 | | | | (0.29 | ) | | | 0.02 | | | | 6.29 | | | | 6.02 | | | | – | | | | – | | | | – | | | | – | | | | 6.02 | | | | 23.80 | |
| C | | | 17.60 | | | | (0.29 | ) | | | 0.02 | | | | 6.24 | | | | 5.97 | | | | – | | | | – | | | | – | | | | – | | | | 5.97 | | | | 23.57 | |
| I | | | 20.50 | | | | (0.09 | ) | | | 0.02 | | | | 7.30 | | | | 7.23 | | | | – | | | | – | | | | – | | | | – | | | | 7.23 | | | | 27.73 | |
| R3 | | | 20.71 | | | | (0.22 | ) | | | 0.03 | | | | 7.35 | | | | 7.16 | | | | – | | | | – | | | | – | | | | – | | | | 7.16 | | | | 27.87 | |
| R4 | | | 20.84 | | | | (0.14 | ) | | | 0.03 | | | | 7.40 | | | | 7.29 | | | | – | | | | – | | | | – | | | | – | | | | 7.29 | | | | 28.13 | |
| R5 | | | 21.02 | | | | (0.06 | ) | | | 0.03 | | | | 7.47 | | | | 7.44 | | | | – | | | | – | | | | – | | | | – | | | | 7.44 | | | | 28.46 | |
| Y | | | 21.06 | | | | (0.04 | ) | | | 0.03 | | | | 7.49 | | | | 7.48 | | | | – | | | | – | | | | – | | | | – | | | | 7.48 | | | | 28.54 | |
| | |
| For the Year Ended October 31, 2009 | |
| A | | | 18.47 | | | | (0.05 | ) | | | – | | | | 2.03 | | | | 1.98 | | | | – | | | | – | | | | – | | | | – | | | | 1.98 | | | | 20.45 | |
| B | | | 16.13 | | | | (0.11 | ) | | | – | | | | 1.76 | | | | 1.65 | | | | – | | | | – | | | | – | | | | – | | | | 1.65 | | | | 17.78 | |
| C | | | 16.03 | | | | (0.17 | ) | | | – | | | | 1.74 | | | | 1.57 | | | | – | | | | – | | | | – | | | | – | | | | 1.57 | | | | 17.60 | |
| I | | | 18.53 | | | | (0.05 | ) | | | – | | | | 2.02 | | | | 1.97 | | | | – | | | | – | | | | – | | | | – | | | | 1.97 | | | | 20.50 | |
| R3 | | | 18.79 | | | | (0.11 | ) | | | – | | | | 2.03 | | | | 1.92 | | | | – | | | | – | | | | – | | | | – | | | | 1.92 | | | | 20.71 | |
| R4 | | | 18.88 | | | | (0.09 | ) | | | – | | | | 2.05 | | | | 1.96 | | | | – | | | | – | | | | – | | | | – | | | | 1.96 | | | | 20.84 | |
| R5 | | | 18.99 | | | | (0.05 | ) | | | – | | | | 2.08 | | | | 2.03 | | | | – | | | | – | | | | – | | | | – | | | | 2.03 | | | | 21.02 | |
| Y | | | 19.03 | | | | 0.01 | | | | – | | | | 2.02 | | | | 2.03 | | | | – | | | | – | | | | – | | | | – | | | | 2.03 | | | | 21.06 | |
| | |
| For the Year Ended October 31, 2008 | |
| A | | | 33.57 | | | | (0.07 | ) | | | – | | | | (11.68 | ) | | | (11.75 | ) | | | – | | | | (3.35 | ) | | | – | | | | (3.35 | ) | | | (15.10 | ) | | | 18.47 | |
| B | | | 29.93 | | | | (0.21 | ) | | | – | | | | (10.24 | ) | | | (10.45 | ) | | | – | | | | (3.35 | ) | | | – | | | | (3.35 | ) | | | (13.80 | ) | | | 16.13 | |
| C | | | 29.85 | | | | (0.29 | ) | | | – | | | | (10.18 | ) | | | (10.47 | ) | | | – | | | | (3.35 | ) | | | – | | | | (3.35 | ) | | | (13.82 | ) | | | 16.03 | |
| I | | | 33.64 | | | | (0.04 | ) | | | – | | | | (11.72 | ) | | | (11.76 | ) | | | – | | | | (3.35 | ) | | | – | | | | (3.35 | ) | | | (15.11 | ) | | | 18.53 | |
| R3 | | | 34.16 | | | | (0.12 | ) | | | – | | | | (11.90 | ) | | | (12.02 | ) | | | – | | | | (3.35 | ) | | | – | | | | (3.35 | ) | | | (15.37 | ) | | | 18.79 | |
| R4 | | | 34.26 | | | | (0.06 | ) | | | – | | | | (11.97 | ) | | | (12.03 | ) | | | – | | | | (3.35 | ) | | | – | | | | (3.35 | ) | | | (15.38 | ) | | | 18.88 | |
| R5 | | | 34.34 | | | | (0.02 | ) | | | – | | | | (11.98 | ) | | | (12.00 | ) | | | – | | | | (3.35 | ) | | | – | | | | (3.35 | ) | | | (15.35 | ) | | | 18.99 | |
| Y | | | 34.38 | | | | 0.02 | | | | – | | | | (12.02 | ) | | | (12.00 | ) | | | – | | | | (3.35 | ) | | | – | | | | (3.35 | ) | | | (15.35 | ) | | | 19.03 | |
| | |
| For the Year Ended October 31, 2007 | |
| A | | | 31.32 | | | | (0.13 | ) | | | – | | | | 2.38 | | | | 2.25 | | | | – | | | | – | | | | – | | | | – | | | | 2.25 | | | | 33.57 | |
| B | | | 28.12 | | | | (0.31 | ) | | | – | | | | 2.12 | | | | 1.81 | | | | – | | | | – | | | | – | | | | – | | | | 1.81 | | | | 29.93 | |
| C | | | 28.07 | | | | (0.35 | ) | | | – | | | | 2.13 | | | | 1.78 | | | | – | | | | – | | | | – | | | | – | | | | 1.78 | | | | 29.85 | |
| I | | | 31.33 | | | | (0.03 | ) | | | – | | | | 2.34 | | | | 2.31 | | | | – | | | | – | | | | – | | | | – | | | | 2.31 | | | | 33.64 | |
| R3(H) | | | 32.34 | | | | (0.19 | ) | | | – | | | | 2.01 | | | | 1.82 | | | | – | | | | – | | | | – | | | | – | | | | 1.82 | | | | 34.16 | |
| R4(H) | | | 32.34 | | | | (0.02 | ) | | | – | | | | 1.94 | | | | 1.92 | | | | – | | | | – | | | | – | | | | – | | | | 1.92 | | | | 34.26 | |
| R5(H) | | | 32.34 | | | | (0.01 | ) | | | – | | | | 2.01 | | | | 2.00 | | | | – | | | | – | | | | – | | | | – | | | | 2.00 | | | | 34.34 | |
| Y | | | 31.95 | | | | 0.02 | | | | – | | | | 2.41 | | | | 2.43 | | | | – | | | | – | | | | – | | | | – | | | | 2.43 | | | | 34.38 | |
| (A) | Information presented relates to a share outstanding throughout the indicated period. |
| (B) | Assumes initial investment at net asset value at the beginning of each period, reinvestment of all distributions, the complete redemption of the investment at net asset value at the end of each period and no sales charge. Total return would be reduced if sales charges were taken into account. |
| (C) | Ratios do not include fees paid indirectly (See Expenses in the accompanying Notes to Financial Statements). |
| (D) | Portfolio turnover rate is calculated on the basis of the Fund as a whole without distinguishing between the classes of shares issued. |
| (E) | Per share amounts have been calculated using average shares outstanding method. |
| (F) | Class L was merged into Class A on August 5, 2011 (See Class Merger in accompanying Notes to Financial Statements). |
| (G) | Total return without the inclusion of the Payments from (to) Affiliate, can be found in Expenses in the accompanying Notes to Financial Statements. |
| (H) | Commenced operations on December 22, 2006. |
| - Ratios and Supplemental Data - |
| | | | | Net Assets at End of Period (000's) | | | Ratio of Expenses to Average Net Assets Before Waivers and Reimbursements and Including Expenses not Subject to Cap(C) | | | Ratio of Expenses to Average Net Assets After Waivers and Reimbursements and Including Expenses not Subject to Cap(C) | | | Ratio of Expenses to Average Net Assets After Waivers and Reimbursements and Excluding Expenses not Subject to Cap(C) | | | Ratio of Net Investment Income (Loss) to Average Net Assets | | | | |
| | | |
| | | | | | | | | | | | | | | | | | | | | | | | | | | |
| | 13.34 | % | | $ | 154,303 | | | | 1.48 | % | | | 1.40 | % | | | 1.40 | % | | | (0.93 | )% | | | 70 | % |
| | 12.48 | | | | 7,018 | | | | 2.39 | | | | 2.15 | | | | 2.15 | | | | (1.46 | ) | | | – | |
| | 12.47 | | | | 12,285 | | | | 2.18 | | | | 2.15 | | | | 2.15 | | | | (1.47 | ) | | | – | |
| | 13.67 | | | | 9,312 | | | | 1.10 | | | | 1.10 | | | | 1.10 | | | | (0.43 | ) | | | – | |
| | 13.13 | | | | 763 | | | | 1.69 | | | | 1.60 | | | | 1.60 | | | | (0.93 | ) | | | – | |
| | 13.44 | | | | 3,059 | | | | 1.30 | | | | 1.30 | | | | 1.30 | | | | (0.62 | ) | | | – | |
| | 13.77 | | | | 227 | | | | 1.03 | | | | 1.00 | | | | 1.00 | | | | (0.33 | ) | | | – | |
| | 13.91 | | | | 134,508 | | | | 0.89 | | | | 0.89 | | | | 0.89 | | | | (0.22 | ) | | | – | |
| | | |
| | | | | | | | | | | | | | | | | | | | | | | | | | | |
| | 34.91 | (G) | | | 53,548 | | | | 1.62 | | | | 1.40 | | | | 1.40 | | | | (0.64 | ) | | | 137 | |
| | 33.86 | (G) | | | 8,398 | | | | 2.59 | | | | 2.15 | | | | 2.15 | | | | (1.39 | ) | | | – | |
| | 33.92 | (G) | | | 11,084 | | | | 2.34 | | | | 2.15 | | | | 2.15 | | | | (1.39 | ) | | | – | |
| | 35.27 | (G) | | | 5,384 | | | | 1.23 | | | | 1.15 | | | | 1.15 | | | | (0.39 | ) | | | – | |
| | 34.57 | (G) | | | 367 | | | | 1.77 | | | | 1.63 | | | | 1.63 | | | | (0.90 | ) | | | – | |
| | 34.98 | (G) | | | 2,831 | | | | 1.38 | | | | 1.33 | | | | 1.33 | | | | (0.58 | ) | | | – | |
| | 35.39 | (G) | | | 132 | | | | 1.09 | | | | 1.05 | | | | 1.05 | | | | (0.26 | ) | | | – | |
| | 35.52 | (G) | | | 93,908 | | | | 0.95 | | | | 0.95 | | | | 0.95 | | | | (0.18 | ) | | | – | |
| | | |
| | | | | | | | | | | | | | | | | | | | | | | | | | | |
| | 10.72 | | | | 45,036 | | | | 1.89 | | | | 1.07 | | | | 1.07 | | | | (0.26 | ) | | | 84 | |
| | 10.23 | | | | 8,042 | | | | 2.97 | | | | 1.50 | | | | 1.50 | | | | (0.68 | ) | | | – | |
| | 9.79 | | | | 9,800 | | | | 2.60 | | | | 1.87 | | | | 1.87 | | | | (1.05 | ) | | | – | |
| | 10.63 | | | | 4,456 | | | | 1.37 | | | | 1.08 | | | | 1.08 | | | | (0.28 | ) | | | – | |
| | 10.22 | | | | 192 | | | | 1.85 | | | | 1.65 | | | | 1.65 | | | | (0.91 | ) | | | – | |
| | 10.38 | | | | 1,868 | | | | 1.42 | | | | 1.35 | | | | 1.35 | | | | (0.54 | ) | | | – | |
| | 10.69 | | | | 1,321 | | | | 1.12 | | | | 1.05 | | | | 1.05 | | | | (0.34 | ) | | | – | |
| | 10.67 | | | | 8,042 | | | | 1.02 | | | | 1.02 | | | | 1.02 | | | | 0.04 | | | | – | |
| | | |
| | | | | | | | | | | | | | | | | | | | | | | | | | | |
| | (38.35 | ) | | | 78,279 | | | | 1.64 | | | | 1.20 | | | | 1.20 | | | | (0.25 | ) | | | 103 | |
| | (38.71 | ) | | | 8,645 | | | | 2.51 | | | | 1.83 | | | | 1.83 | | | | (0.88 | ) | | | – | |
| | (38.90 | ) | | | 10,472 | | | | 2.25 | | | | 2.10 | | | | 2.10 | | | | (1.14 | ) | | | – | |
| | (38.29 | ) | | | 3,159 | | | | 1.17 | | | | 1.15 | | | | 1.15 | | | | (0.21 | ) | | | – | |
| | (38.49 | ) | | | 9 | | | | 2.08 | | | | 1.46 | | | | 1.46 | | | | (0.52 | ) | | | – | |
| | (38.40 | ) | | | 1,298 | | | | 1.28 | | | | 1.28 | | | | 1.28 | | | | (0.39 | ) | | | – | |
| | (38.20 | ) | | | 44 | | | | 1.03 | | | | 1.03 | | | | 1.03 | | | | (0.14 | ) | | | – | |
| | (38.15 | ) | | | 30,361 | | | | 0.89 | | | | 0.89 | | | | 0.89 | | | | 0.06 | | | | – | |
| | | |
| | | | | | | | | | | | | | | | | | | | | | | | | | | |
| | 7.18 | (G) | | | 162,102 | | | | 1.62 | | | | 1.31 | | | | 1.31 | | | | (0.26 | ) | | | 105 | |
| | 6.44 | (G) | | | 17,352 | | | | 2.42 | | | | 2.00 | | | | 2.00 | | | | (0.95 | ) | | | – | |
| | 6.34 | (G) | | | 23,778 | | | | 2.21 | | | | 2.15 | | | | 2.15 | | | | (1.10 | ) | | | – | |
| | 7.37 | (G) | | | 4,614 | | | | 1.21 | | | | 1.15 | | | | 1.15 | | | | (0.17 | ) | | | – | |
| | 5.63 | (I) | | | 11 | | | | 1.69 | (J) | | | 1.65 | (J) | | | 1.65 | (J) | | | (0.65 | ) (J) | | | – | |
| | 5.94 | (I) | | | 309 | | | | 1.40 | (J) | | | 1.35 | (J) | | | 1.35 | (J) | | | (0.43 | ) (J) | | | – | |
| | 6.18 | (I) | | | 11 | | | | 1.09 | (J) | | | 1.05 | (J) | | | 1.05 | (J) | | | (0.05 | ) (J) | | | – | |
| | 7.61 | (G) | | | 46,466 | | | | 0.93 | | | | 0.93 | | | | 0.93 | | | | 0.12 | | | | – | |
|
| The Board of Directors and Shareholders of |
| The Hartford Mutual Funds II, Inc. |
We have audited the accompanying statement of assets and liabilities, including the schedule of investments, of The Hartford SmallCap Growth Fund (one of the portfolios constituting The Hartford Mutual Funds II, Inc. (the Funds)) as of October 31, 2011, and the related statement of operations for the year then ended, the statements of changes in net assets for each of the two years in the period then ended, and the financial highlights for each of the five years in the period then ended. These financial statements and financial highlights are the responsibility of the Funds’ management. Our responsibility is to express an opinion on these financial statements and financial highlights based on our audits.
We conducted our audits in accordance with the standards of the Public Company Accounting Oversight Board (United States). Those standards require that we plan and perform the audit to obtain reasonable assurance about whether the financial statements and financial highlights are free of material misstatement. We were not engaged to perform an audit of the Funds’ internal control over financial reporting. Our audits included consideration of internal control over financial reporting as a basis for designing audit procedures that are appropriate in the circumstances, but not for the purpose of expressing an opinion on the effectiveness of the Funds’ internal control over financial reporting. Accordingly, we express no such opinion. An audit also includes examining, on a test basis, evidence supporting the amounts and disclosures in the financial statements and financial highlights, assessing the accounting principles used and significant estimates made by management, and evaluating the overall financial statement presentation. Our procedures included confirmation of securities owned as of October 31, 2011, by correspondence with the custodian and brokers or by other appropriate auditing procedures where replies from brokers were not received. We believe that our audits provide a reasonable basis for our opinion.
In our opinion, the financial statements and financial highlights referred to above present fairly, in all material respects, the financial position of The Hartford SmallCap Growth Fund of The Hartford Mutual Funds II, Inc. at October 31, 2011, the results of its operations for the year then ended, the changes in its net assets for each of the two years in the period then ended, and the financial highlights for each of the five years in the period then ended, in conformity with U.S. generally accepted accounting principles.
Minneapolis, MN
December 16, 2011
|
| Directors and Officers (Unaudited) |
The Board of Directors of the Company appoints officers who are responsible for the day-to-day operations of the Fund and who execute policies formulated by the Directors. Each director serves until his or her death, resignation, or retirement or until the next annual meeting of shareholders is held or until his or her successor is elected and qualifies.
Directors and officers who are employed by or who have a financial interest in The Hartford are considered “interested” persons of the Fund pursuant to the 1940 Act. Each officer and two of the Company’s directors, as noted in the chart below, are “interested” persons of the Fund. Each director serves as a director for The Hartford Mutual Funds, Inc., The Hartford Mutual Funds II, Inc., Hartford Series Fund, Inc., and Hartford HLS Series Fund II, Inc., and as a trustee for The Hartford Alternative Strategies Fund, which, as of October 31, 2011, collectively consist of 91 funds. Correspondence may be sent to directors and officers c/o Hartford Mutual Funds, P.O. Box 2999, Hartford, Connecticut 06104-2999, except that correspondence to Ms. Fagely may be sent to 500 Bielenberg Drive, Woodbury, Minnesota 55125.
The table below sets forth, for each director and officer, his or her name, year of birth, current position with the Company and date first elected or appointed to The Hartford Mutual Funds, Inc. (“MF”) and The Hartford Mutual Funds II, Inc. (“MF2”), principal occupation, and, for directors, other directorships held. The Fund’s statement of additional information contains further information on the directors and is available free of charge by calling 1-888-843-7824 or writing to Hartford Mutual Funds, P.O. Box 64387, St. Paul, MN 55164-0387.
Information on the aggregate remuneration paid to the directors of the Company can be found in the Statement of Operations herein. The Fund pays to The Hartford a portion of the Chief Compliance Officer’s compensation, but does not pay salaries or compensation to any of its other officers or directors who are employed by The Hartford.
Non-Interested Directors
Lynn S. Birdsong (1946) Director since 2003, Co-Chairman of the Investment Committee
Mr. Birdsong is a private investor. Mr. Birdsong currently serves as a Director of the Sovereign High Yield Investment Company (April 2010 to current). Mr. Birdsong currently serves as an Independent Director of Nomura Partners Funds, Inc. (formerly, The Japan Fund) (March 2003 to current). From 2003 to March 2005, Mr. Birdsong was an independent director of the Atlantic Whitehall Funds. From 1979 to 2002, Mr. Birdsong was a managing director of Zurich Scudder Investments, an investment management firm. During his employment with Scudder, Mr. Birdsong was an Interested Director of The Japan Fund. Since 1981, Mr. Birdsong has been a partner in Birdsong Company, an advertising specialty firm.
Robert M. Gavin, Jr. (1940) Director since 2002 (MF) and 1986 (MF2), Chairman of the Board since 2004
Dr. Gavin is an educational consultant. Prior to September 1, 2001, he was President of Cranbrook Education Community and prior to July 1996, he was President of Macalester College, St. Paul, Minnesota.
Duane E. Hill (1945) Director since 2001 (MF) and 2002 (MF2), Chairman of the Nominating Committee
Mr. Hill is Partner of TSG Ventures L.P., a private equity investment company. Mr. Hill is a former partner of TSG Capital Group, a private equity investment firm that served as sponsor and lead investor in leveraged buyouts of middle market companies.
Sandra S. Jaffee (1941) Director since 2005
Ms. Jaffee served as Chairman (2008 to 2009) and Chief Executive Officer of Fortent (formerly Searchspace Group), a leading provider of compliance/regulatory technology to financial institutions from August 2005 to August 2009. From August 2004 to August 2005, Ms. Jaffee served as an Entrepreneur in Residence with Warburg Pincus, a private equity firm. From September 1995 to July 2004, Ms. Jaffee served as Executive Vice President at Citigroup, where she was President and Chief Executive Officer of Citibank’s Global Securities Services (1995 to 2003). Ms. Jaffe currently serves as a member of the Board of Directors of Broadridge Financial Solutions as well as a Trustee of Muhlenberg College.
William P. Johnston (1944) Director since 2005, Chairman of the Compliance Committee
In June 2006, Mr. Johnston was appointed as Senior Advisor to The Carlyle Group, a global private equity investment firm. In August 2007, Mr. Johnston was elected to the Board of Directors of LifeCare Holdings, Inc. In February 2008, Mr. Johnston was elected to the Board of Directors of HCR-ManorCare, Inc. In May 2006, Mr. Johnston was elected to the Supervisory Board of Fresenius Medical Care AG & Co. KGaA, after its acquisition of Renal Care Group, Inc. in March 2006. Mr. Johnston joined Renal Care Group in November 2002 as a member of the Board of Directors and served as Chairman of the Board from March 2003 through March 2006. Mr. Johnston served as a Director of MultiPlan, Inc. from July 2006 through August 2010. From September 1987 to December 2002, Mr. Johnston was with Equitable Securities Corporation (and its successors, SunTrust Equitable Securities and SunTrust Robinson Humphrey) serving in various investment banking and managerial positions, including Managing Director and Head of Investment Banking, Chief Executive Officer and Vice Chairman.
| The Hartford SmallCap Growth Fund |
| Directors and Officers (Unaudited) – (continued) |
Phillip O. Peterson (1944) Director since 2002, (MF) and 2000 (MF2), Chairman of the Audit Committee
Mr. Peterson is a mutual fund industry consultant. He was a partner of KPMG LLP (an accounting firm) until July 1999. Mr. Peterson joined William Blair Funds in February 2007 as a member of the Board of Trustees. From January 2004 to April 2005, Mr. Peterson served as Independent President of the Strong Mutual Funds.
Lemma W. Senbet (1946) Director since 2005
Dr. Senbet is the William E. Mayer Chair Professor of Finance and Director, Center for Financial Policy, at the University of Maryland, Robert H. Smith School of Business. He was chair of the Finance Department from 1998 to 2006. Previously he was a chaired professor of finance at the University of Wisconsin-Madison. Also, he was director of the Fortis Funds from March 2000 to July 2002. Dr. Senbet served the finance profession in various capacities, including as director of the American Finance Association and President of the Western Finance Association. In 2006, Dr. Senbet was inducted Fellow of Financial Management Association International for his career-long distinguished scholarship and professional service.
Interested Directors and Officers
David N. Levenson (1966) Director since 2010
Mr. Levenson currently serves as President of The Hartford’s Wealth Management business. He was appointed to this role in July 2010. Previously, Mr. Levenson served as Executive Vice President of Legacy Holdings for The Hartford from June 2009 to July 2010. From 2006 to 2009, Mr. Levenson was with Hartford Life Insurance K.K. where he served as President and Chief Executive Officer from 2007 to 2009. He served as Managing Director of Hartford Investment Management Company from 2005 to 2006. Additionally, Mr. Levenson serves as Executive Vice President of The Hartford and as President, Director and Chief Executive Officer of Hartford Life Insurance Company (“HLIC”) and Hartford Life, Inc. (“HL Inc.”).
Lowndes A. Smith (1939) Director since 1996, (MF) and 2002 (MF2), Co-Chairman of the Investment Committee
Mr. Smith served as Vice Chairman of The Hartford from February 1997 to January 2002, as President and Chief Executive Officer of HL Inc. from February 1997 to January 2002, and as President and Chief Operating Officer of The Hartford Life Insurance Companies from January 1989 to January 2002. Mr. Smith serves as a Director of White Mountains Insurance Group, Ltd., One Beacon Insurance and Symetra Financial and as a Managing Director of Whittington Gray Associates.
Other Officers
James E. Davey (1964) President and Chief Executive Officer since 2010
Mr. Davey serves as Executive Vice President of HLIC. Additionally, Mr. Davey serves as President, Chief Executive Officer and Manager of HIFSCO and President, Chief Executive Officer and Manager of HL Investment Advisors, LLC (“HL Advisors”). Mr. Davey joined The Hartford in 2002.
Michael R. Dressen (1963) AML Compliance Officer since 2011
Mr. Dressen currently serves as Assistant Vice President of HLIC. He also serves as Chief Compliance Officer and AML Compliance Officer of Hartford Administrative Services Company (“HASCO”) and as Assistant Secretary and Compliance Officer of HIFSCO. Mr Dressen joined The Hartford in 2005 from State Farm Insurance Companies where he held various positions related to mutual funds, variable products, and property casualty insurance.
Tamara L. Fagely (1958) Vice President, Controller and Treasurer since 2002 (MF) and 1993 (MF2)
Ms. Fagely has been a Vice President of HASCO since 1998 and Chief Financial Officer since 2006. Currently Ms. Fagely is a Vice President of HLIC. She served as Assistant Vice President of HLIC from December 2001 through March 2005. In addition, Ms. Fagely is Controller and Chief Financial Officer of HIFSCO.
Dr. Robert J. Froehlich (1953) Senior Managing Director since 2009
Dr. Froehlich joined The Hartford as Senior Managing Director in September 2009. Prior to joining The Hartford, Dr. Froehlich served as Vice Chairman of Deutsche Asset Management from 1997-2009.
Edward P. Macdonald (1967) Vice President, Secretary and Chief Legal Officer since 2005
Mr. Macdonald serves as Vice President of HLIC and Chief Legal Officer of Mutual Funds and Vice President of HIFSCO. He also serves as Vice President and Secretary of HASCO, and Chief Legal Officer, Secretary and Vice President of HL Advisors. Mr. Macdonald joined The Hartford in 2005.
Vernon J. Meyer (1964) Vice President since 2006
Mr. Meyer serves as Senior Vice President of HLIC. He also serves as Senior Vice President of HIFSCO and HL Advisors. Mr. Meyer joined The Hartford in 2004.
Colleen B. Pernerewski (1969) Vice President and Chief Compliance Officer since 2010
Ms. Pernerewski serves as Vice President and Chief Investment Advisor Compliance Officer of HIFSCO and as Vice President and Chief Compliance Officer of HL Advisors. Ms. Pernerewski joined The Hartford in 2005 from Travelers Life and Annuity where she served as Counsel (2004-2005). Prior to Travelers Life and Annuity, Ms. Pernerewski held the position of Counsel at The Hartford (1998-2004).
Elizabeth L. Schroeder (1966) Vice President since 2010
Ms. Schroeder currently serves as Assistant Vice President of HLIC. Ms. Schroeder joined HLIC in 1991. She is also an Assistant Vice President of HASCO, HIFSCO and HL Advisors.
Martin Swanson (1962) Vice President since 2010
Mr. Swanson is a Vice President of HLIC. Mr. Swanson also serves as Vice President/Marketing for HIFSCO. Prior to joining HLIC in 1998, Mr. Swanson was a Vice President at PaineWebber, Inc.
Jane Wolak (1961) Vice President since 2009
Ms. Wolak currently serves as Senior Vice President of HLIC. Ms. Wolak joined HLIC as Vice President, Retail Product Services in May 2007. She is also Vice President of HASCO. Previously, Ms. Wolak was with Sun Life Financial where she held the position of Vice President, Service Center Operations from 2001-2007.
A description of the policies and procedures that the Fund uses to determine how to vote proxies relating to portfolio securities and a record of how the Fund voted any proxies for the twelve-month period ended June 30, 2011 are available (1) without charge, upon request, by calling 888-843-7824 and (2) on the SEC’s website at http://www.sec.gov.
The Fund files a complete schedule of portfolio holdings with the SEC for the first and third quarters of each fiscal year on Form N-Q. The Fund’s Forms are available (1) without charge, upon request, by calling 888-843-7824 and (2) on the SEC’s website at http://www.sec.gov. The Form N-Q may be reviewed and copied at the SEC’s Public Reference Room in Washington, DC. Information on the operation of the Public Reference Room may be obtained by calling 1-800-SEC-0330.
|
| Federal Tax Information (Unaudited) |
For the fiscal year ended October 31, 2011, there is no further federal tax information required for this Fund.
|
| Expense Example (Unaudited) |
Your Fund's Expenses
As a shareholder of the Fund, you incur two types of costs: (1) transaction costs, including sales charges (loads) on purchase payments and contingent deferred sales charges (CDSC) and (2) ongoing costs, including investment management fees, distribution fees, and other fund expenses. This example is intended to help you understand your ongoing costs (in dollars) of investing in the Fund and to compare these costs with the ongoing costs of investing in other mutual funds. The example is based on an investment of $1,000 invested at the beginning of the period and held for the period of April 30, 2011 through October 31, 2011.
Actual Expenses
The first set of columns of the table below provides information about actual account values and actual expenses. You may use the information in this column, together with the amount you invested, to estimate the expenses that you paid over the period. Simply divide your account value by $1,000 (for example, an $8,600 account value divided by $1,000 = 8.6), then multiply the result by the number in the line under the heading entitled “Expenses Paid During Period” to estimate the expenses you paid on your account during this period.
Hypothetical Example for Comparison Purposes
The second set of columns of the table below provides information about hypothetical account values and hypothetical expenses based on the Fund's actual expense ratio and an assumed rate of return of 5% per year before expenses, which is not the Fund's actual return. The hypothetical account values and expenses may not be used to estimate the actual ending account balance or expenses you paid for the period. You may use this information to compare the ongoing costs of investing in the Fund and other funds. To do so, compare this 5% hypothetical example with the 5% hypothetical examples that appear in the shareholder reports of the other funds.
Please note that the expenses shown in the table are meant to highlight your ongoing costs only and do not reflect any transactional costs, such as sales charges (loads) and CDSC. Therefore, the second set of columns of the table is useful in comparing ongoing costs only, and will not help you determine the relative total costs of owning different funds. In addition, if these transactional costs were included, your costs would be higher. Expenses are equal to the Fund's annualized expense ratios multiplied by average account value over the period, multiplied by 184/365 (to reflect the one-half year period).
| | | Actual return | | | Hypothetical (5% return before expenses) | | | | | | | | | | |
| | | Beginning Account Value April 30, 2011 | | | Ending Account Value October 31, 2011 | | | Expenses paid during the period April 30, 2011 through October 31, 2011 | | | Beginning Account Value April 30, 2011 | | | Ending Account Value October 31, 2011 | | | Expenses paid during the period April 30, 2011 through October 31, 2011 | | | | | | | | | | |
| Class A | | $ | 1,000.00 | | | $ | 882.60 | | | $ | 6.64 | | | $ | 1,000.00 | | | $ | 1,018.15 | | | $ | 7.12 | | | | 1.40 | % | | | 184 | | | | 365 | |
| Class B | | $ | 1,000.00 | | | $ | 879.10 | | | $ | 10.16 | | | $ | 1,000.00 | | | $ | 1,014.39 | | | $ | 10.89 | | | | 2.15 | | | | 184 | | | | 365 | |
| Class C | | $ | 1,000.00 | | | $ | 879.30 | | | $ | 10.18 | | | $ | 1,000.00 | | | $ | 1,014.37 | | | $ | 10.92 | | | | 2.15 | | | | 184 | | | | 365 | |
| Class I | | $ | 1,000.00 | | | $ | 884.20 | | | $ | 5.18 | | | $ | 1,000.00 | | | $ | 1,019.70 | | | $ | 5.55 | | | | 1.09 | | | | 184 | | | | 365 | |
| Class R3 | | $ | 1,000.00 | | | $ | 882.00 | | | $ | 7.59 | | | $ | 1,000.00 | | | $ | 1,017.14 | | | $ | 8.13 | | | | 1.60 | | | | 184 | | | | 365 | |
| Class R4 | | $ | 1,000.00 | | | $ | 883.00 | | | $ | 6.17 | | | $ | 1,000.00 | | | $ | 1,018.65 | | | $ | 6.61 | | | | 1.30 | | | | 184 | | | | 365 | |
| Class R5 | | $ | 1,000.00 | | | $ | 884.50 | | | $ | 4.75 | | | $ | 1,000.00 | | | $ | 1,020.16 | | | $ | 5.09 | | | | 1.00 | | | | 184 | | | | 365 | |
| Class Y | | $ | 1,000.00 | | | $ | 884.90 | | | $ | 4.23 | | | $ | 1,000.00 | | | $ | 1,020.72 | | | $ | 4.53 | | | | 0.89 | | | | 184 | | | | 365 | |
|
| Approval of Investment Management and Investment Sub-Advisory Agreements (Unaudited) |
Section 15(c) of the Investment Company Act of 1940, as amended (the “1940 Act”), requires that each mutual fund’s board of directors, including a majority of those directors who are not “interested persons” of the mutual fund, as defined in the 1940 Act (the “Independent Directors”), annually review and consider the continuation of the mutual fund’s investment advisory and sub-advisory agreements. At its meeting held on August 2-3, 2011, the Board of Directors (the “Board”) of The Hartford Mutual Funds II, Inc., including each of the Independent Directors, unanimously voted to approve the continuation of the investment management agreement for The Hartford SmallCap Growth Fund (the “Fund”) with Hartford Investment Financial Services, LLC (“HIFSCO”) and the continuation of the investment sub-advisory agreement between HIFSCO and the Fund’s sub-adviser, Wellington Management Company, LLP (“Wellington” or the “Sub-adviser,” and together with HIFSCO, the “Advisers”) (collectively, the “Agreements”).
In the months preceding the August 2-3, 2011 meeting, the Board requested, received, and reviewed written responses from the Advisers to questions posed to them on behalf of the Independent Directors and supporting materials relating to those questions and responses. The Board considered information furnished to the Board at its meetings throughout the year, as well as information specifically prepared in connection with the annual approval of the Agreements at the Board’s meetings held on June 21-22, 2011 and August 2-3, 2011. Information provided to the Board at its meetings throughout the year included, among other things, reports on Fund performance, legal and compliance matters, sales and marketing activity, shareholder services, and the other services provided to the Fund by the Advisers and their affiliates. In addition, the Board received in-person presentations by Fund officers and representatives of HIFSCO at the Board’s meetings on June 21-22, 2011 and August 2-3, 2011 concerning the Agreements.
The Independent Directors, advised by independent legal counsel, engaged two service providers to assist them with evaluating the Agreements with respect to the Fund. Lipper Inc. (“Lipper”), an independent provider of investment company data, was retained to provide the Board with reports on how the Fund’s contractual management fees, actual management fees, other non-management fees, overall expense ratios and investment performance compared to those of mutual funds with similar investment objectives. The Independent Directors also engaged an independent financial services consulting firm (the “Consultant”) to assist them in evaluating the Fund’s management fees, sub-advisory fees, other non-management fees, overall expense ratios and investment performance. In addition, the Consultant reviewed the profitability calculations utilized by HIFSCO in connection with the continuation of the investment management agreement.
In determining to continue the Agreements for the Fund, the members of the Board reviewed and evaluated information and factors they believed to be relevant and appropriate in light of the information that the Board deemed necessary and appropriate through the exercise of their reasonable business judgment. While individual members of the Board may have weighed certain factors differently, the Board’s determination to continue the Agreements was based on a comprehensive consideration of all information provided to the Board throughout the year and specifically with respect to the continuation of the Agreements. A more detailed discussion of the factors the Board considered with respect to its approval of the Agreements is provided below.
Nature, Extent, And Quality Of Services Provided by the Advisers
The Board requested and considered information concerning the nature, extent, and quality of the services provided to the Fund by the Advisers. The Board considered, among other things, the terms of the Agreements and the range of services provided by the Advisers. The Board considered the Advisers’ professional personnel who provide services to the Fund, including each Adviser’s ability and experience in attracting and retaining qualified personnel to service the Fund. The Board considered each Adviser’s reputation and overall financial strength, as well as its willingness to consider and implement organizational and operational changes designed to improve services to the Fund. In addition, the Board considered the quality of each Adviser’s communications with the Board and responsiveness to Board inquiries.
The Board also requested and evaluated information concerning each Adviser’s regulatory and compliance environment. In this regard, the Board requested and reviewed information on each Adviser’s compliance policies and procedures, compliance history, and a report from the Fund’s Chief Compliance Officer on each Adviser’s compliance with applicable laws and regulations, including responses to regulatory developments and compliance issues raised by regulators. The Board also noted the Advisers’ support of the Fund’s compliance control structure, particularly the resources devoted by the Advisers in support of the Fund’s obligations pursuant to Rule 38a-1 under the 1940 Act.
With respect to HIFSCO, the Board noted that under the Agreements, HIFSCO is responsible for the management of the Fund, including overseeing fund operations and service providers, and provides administration services to the Fund as well as investment advisory services in connection with selecting, monitoring and supervising the Sub-adviser. The Board considered HIFSCO’s ongoing monitoring of people, process and performance, including its quarterly reviews of each of the Hartford Mutual Funds, semi-annual meetings with the leaders of each Fund’s portfolio management team, and oversight of the Funds’ 74 portfolio managers. The Board recognized that HIFSCO has demonstrated a record of making changes to the management and/or strategies of the Funds when warranted. The Board considered HIFSCO’s oversight of the Sub-adviser’s investment approach and results, process for monitoring best execution of portfolio trades by the Sub-adviser, and approach to risk management with respect to the Fund and the service providers to the Fund. The Board also considered HIFSCO’s oversight of compliance with the Fund’s objective and policies as well as with applicable laws and regulations, noting that regulatory and other developments had over time led to an increase in the scope of HIFSCO’s services in this regard.
In addition, the Board considered HIFSCO’s ongoing commitment to review and rationalize the Hartford fund family’s product line-up and the expenses that HIFSCO had incurred in connection with fund combinations in recent years. The Board considered that HIFSCO or its affiliates are responsible for providing the Fund’s officers.
With respect to the Sub-adviser, who provides day-to-day portfolio management services, the Board considered the quality of the Fund’s portfolio managers, the Sub-adviser’s other investment personnel, its investment philosophy and process, investment research capabilities and resources, performance record, trade execution capabilities and experience. The Board considered the experience of the Fund’s portfolio managers, the number of accounts managed by the portfolio managers, and the Sub-adviser’s method for compensating the portfolio managers. The Board noted that Wellington became the sole sub-adviser to the Fund in July 2010 and that the portion of the Fund previously sub-advised by a prior sub-adviser was moved to Wellington.
Based on these considerations, the Board concluded that it was satisfied with the nature, extent and quality of the services provided to the Fund by HIFSCO and the Sub-adviser.
Performance of the Fund and the Advisers
The Board considered the investment performance of the Fund. In this regard, the Board reviewed the performance of the Fund over different time periods presented in the materials and evaluated HIFSCO’s analysis of the Fund’s performance for these time periods. The Board considered information and materials provided to the Board by the Advisers concerning Fund performance, as well as information from Lipper comparing the investment performance of the Fund to an appropriate benchmark and universe of peer funds. The Board noted that the performance of the Fund was within expectations.
The Board considered the detailed investment analytics reports provided by The Hartford’s Investment Advisory Group throughout the year. These reports include, among other things, information on the Fund’s gross and net returns, the Fund’s investment performance relative to an appropriate benchmark and peer group, various statistics concerning the Fund’s portfolio, and a narrative summary of various factors affecting Fund performance. The Board considered the Advisers’ cooperation with the Investment Committee, which assists the Board in evaluating the performance of the Fund at periodic meetings throughout the year. The Board also considered the analysis provided by the Consultant relating to the Fund’s performance track record.
In light of all the considerations noted above, the Board concluded that it had continued confidence in HIFSCO’s and the Sub-adviser’s overall capabilities to manage the Fund.
Costs of the Services and Profitability of the Advisers
The Board reviewed information regarding HIFSCO’s cost to provide investment management and related services to the Fund and HIFSCO’s profitability, both overall and for the Fund, on a pre-tax basis without regard to distribution expenses. The Board also requested and reviewed information about the profitability to HIFSCO and its affiliates from all services provided to the Fund and all aspects of their relationship with the Fund. The Board also requested and received information relating to the operations and profitability of the Sub-adviser.
| The Hartford SmallCap Growth Fund |
Approval of Investment Management and Investment Sub-Advisory Agreements (Unaudited) – (continued) |
The Board considered the Consultant’s review of the profitability calculations utilized by HIFSCO in connection with the continuation of the investment management agreement. In this regard, the Consultant reported that The Hartford’s process for calculating and reporting Fund profitability is reasonable, sound and well within common industry practice.
Based on these considerations, the Board concluded that the profits anticipated to be realized by the Advisers and their affiliates from their relationships with the Fund would not be excessive.
Comparison of Fees and Services Provided by the Advisers
The Board considered comparative information with respect to the management fees to be paid by the Fund to HIFSCO and the total expense ratios of the Fund. The Board also considered comparative information with respect to the sub-advisory fees to be paid by HIFSCO to the Sub-adviser, to the extent applicable. In this regard, the Board requested and reviewed information from HIFSCO and the Sub-adviser relating to the management and sub-advisory fees, including the sub-advisory fee schedule for the Fund, and total operating expenses for the Fund. The Board also reviewed information from Lipper comparing the Fund’s contractual management fees, actual management fees and overall expense ratios relative to a group of funds selected by Lipper, in consultation with the Consultant, and a broader universe of funds selected by Lipper.
While the Board recognized that comparisons between the Fund and peer funds are imprecise, given the differing service levels and characteristics of mutual funds and the different business models and cost structures of the Advisers, the comparative information provided by Lipper assisted the Board in evaluating the reasonableness of the Fund’s management and sub-advisory fees and total operating expenses. In addition, the Board considered the analysis and recommendations of the Consultant relating to the Fund’s management and sub-advisory fees and total operating expenses.
Based on these considerations, the Board concluded that the Fund’s fees and total operating expenses, in conjunction with the information about quality of services, profitability, economies of scale, and other matters discussed, were reasonable in light of the services provided.
Economies of Scale
The Board requested and considered information regarding the Advisers’ realization of economies of scale with respect to the Fund and whether the fee levels reflect these economies of scale for the benefit of the Fund’s investors. With respect to HIFSCO, the Board considered representations from HIFSCO that it is difficult to anticipate whether and to what extent economies may be realized by HIFSCO as assets grow over time. The Board reviewed the breakpoints in the management fee schedule for the Fund, which reduces fee rates as Fund assets grow over time. The Board recognized that a fund with assets beyond the last breakpoint level will continue to benefit from economies of scale because additional assets are charged the lowest breakpoint fee resulting in lower overall effective management fee rates. The Board also considered that expense limitations and fee waivers that reduce the Fund’s expenses at all asset levels can have the same effect as breakpoints in sharing economies of scale with shareholders and provide protection from an increase in expenses if Fund assets decline. The Board recognized that a fee schedule that reaches a lower breakpoint quickly provides shareholders with the benefit of anticipated or potential economies of scale. The Board also considered that HIFSCO has been active in managing expenses, which has resulted in benefits being realized by shareholders as assets within the Hartford fund family have grown over time, including through lower transfer agent costs and other operating expenses.
The Board reviewed and evaluated materials from Lipper showing how management fee schedules of peer funds reflect economies of scale for the benefit of investors as a peer fund’s assets hypothetically increase over time. Based on information provided by HIFSCO, Lipper, and the Consultant, the Board recognized that there is no uniform methodology for establishing breakpoints or uniform pattern in asset levels that trigger breakpoints or the amounts of breakpoints triggered.
After considering all of the information available to it, the Board concluded that it was satisfied with the extent to which economies of scale would be shared for the benefit of the Fund’s shareholders based on currently available information and the effective advisory fees and expense ratios for the Fund at its current and reasonably anticipated asset levels. The Board noted, however, that it would continue to monitor future growth in Fund assets and the appropriateness of additional breakpoints.
Other Benefits
The Board considered other benefits to the Advisers and their affiliates from their relationships with the Fund.
The Board reviewed information noting that Hartford Life, Inc. (“Hartford Life”), an affiliate of HIFSCO, receives fees for fund accounting and related services from the Fund, and the Board considered information on expected profits to Hartford Life or its affiliates for such services. The Board also considered that Hartford Administrative Services Company (“HASCO”), the Fund’s transfer agent and an affiliate of HIFSCO, receives transfer agency compensation from the Fund, and the Board reviewed information on the expected profitability of the Fund’s transfer agency function to HASCO. The Board considered information provided by HASCO indicating that the transfer agent fees charged by HASCO to the Fund were fair and reasonable based on publicly available information.
The Board also considered that, as principal underwriter of the Fund, HIFSCO receives 12b-1 fees from the Fund and receives all or a portion of the sales charges on sales or redemptions of certain classes of shares. The Board also noted that certain affiliates of HIFSCO distribute shares of the Fund and receive compensation in that connection.
The Board considered benefits to the Sub-adviser from its use of the Fund’s brokerage commissions to obtain soft dollar research, and representations from HIFSCO and the Sub-adviser that the Sub-adviser would not make any revenue-sharing payments or any other type of distribution payments to HIFSCO or its affiliates.
The Board considered the benefits to shareholders of being part of the Hartford family of funds, including the right to exchange investments between the same class of funds without a sales charge, the ability to reinvest Fund dividends into other funds in the family, and the ability to combine holdings in the Fund with holdings in other funds to obtain a reduced sales charge. The Board considered HIFSCO’s efforts to provide investors in the family with a broad range of investment styles and asset classes and its entrepreneurial risk in initiating new funds to expand these opportunities for shareholders.
* * * *
Based upon its review of these various factors, among others, the Board concluded that it is in the best interests of the Fund and its shareholders for the Board to approve the Agreements for an additional year. In reaching this decision, the Board did not assign relative weights to the factors discussed above or deem any one or group of them to be controlling in and of themselves. In connection with their deliberations, the Independent Directors met separately in executive session on several occasions, with independent legal counsel, to review the relevant materials and consider their responsibilities under relevant laws and regulations.
A MESSAGE FROM DR. BOB FROEHLICH
Dear Shareholders:
All I can say is wow! From an investment perspective, this has been quite a tough year.
Old challenges seem to be lingering, such as the ongoing European sovereign debt crisis. While, here in the United States, we just can't seem to turn the corner on our weak housing market and even weaker employment market. As if these issues aren’t enough, we add the new challenge of the United States of America losing its prestigious "AAA" credit rating for the first time in the history of our country. I can’t remember a time when our markets faced this great a challenge from so many different fronts. While all of this negative news can seem daunting at times, there are also some bright spots. Although it’s almost impossible to predict with any degree of accuracy where our markets may be headed, let me share with you a few of the issues that I’m closely watching that make me more optimistic than most about the prospects for our market going forward.
RECORD EARNINGS
Let me begin with earnings, which from my perspective always have been and always will be the single most important thing to focus upon. I’m willing to bet that most U.S. investors have no idea just how strong corporate earnings and profits have been. While there are numerous ways to measure earnings and profits, one of my favorite ways is to look at profits as a percentage of the economy, especially when you want some historical comparison. Fortunately, the Bureau of Economic Analysis does this equation for us on a quarterly basis. For the second quarter of 2011 (the most recent data available) corporate profits accounted for 10.1% of our economy as measured by the GDP (Gross Domestic Product).
So just how good is that profits number? For starters, it’s the single highest profits number in my entire 34-year career. In case that isn’t impressive enough for any of you history buffs, I would add one more thing. The Bureau of Economic Analysis has been recording these quarterly profit numbers as a percentage of GDP since 1947. Our most recent number, which placed corporate profits at 10.1% of GDP, is the highest in the 64 years of tracking this data. Again, if you believe, as I do, that markets ultimately go wherever earnings take them, then you have to like what the future might hold for our stock market.
CORPORATE CASH & STRONG BALANCE SHEETS
The second thing that makes me somewhat optimistic about the future prospects for our markets is the current financial strength of corporate America. I know that you’ve heard the term that “corporate America is flush with cash.” Let me show you just how flush. The single best measure for corporate cash is one called “U.S. nonfinancial corporations liquid assets.” In the past two years this cash has increased $700 billion, bringing the total to more than $2 trillion. In the most recently released numbers for the second quarter of 2011, on a quarter-over-quarter basis, cash is up 19.2%. Corporate cash at a level above $2 trillion is the highest level ever recorded.
Now you know what it means when someone says “corporate America is flush with cash.” The good news about all that cash, from my perspective, is once corporate confidence returns and that cash goes in motion, it will help both our economy and our markets. Money in motion could go toward increasing mergers and acquisitions, dividends, share buybacks, capital spending to drive productivity, or even creating jobs. Regardless of what the ultimate use is, money in motion is good for our economy and our markets.
INSIDER BUYING
Let me move on to my third point that makes me optimistic: “insider buying.” When someone on Wall Street says “insiders,” they’re referring to company officers and directors that must disclose to the Securities and Exchange Commission through Form 4 filings whether they’re buying or selling their company’s stock. Research firm Argus-Vickers tracks this number for all publicly traded companies.
I believe when insiders are selling, it suggests that the stock may be too expensive, and the market expects too much from future earnings. Conversely, when insiders are buying, it suggests that insiders believe that their stock is too cheap, and the market is underestimating future earnings.
For more than the past decade, the average has been two insiders selling for every one that is buying. Think about what our stock market did over the past decade and you might realize that maybe these insiders are a pretty good indicator, as our markets just went through what many are calling “the lost decade,” referring to our flat stock market over the past 10 years. Currently, there’s only one insider selling for every two that are buying. Do they know something that we don't know? Only time will tell. One thing for sure is that officers and directors always focus on earnings, earnings, and earnings.
In closing, now more than ever, it’s critical that you work closely with your trusted financial professional, as I predict that our investment landscape will become even more challenging in the future. The volatility in our markets is probably here to stay— meaning it will be more difficult than ever before to try to remain a long-term investor in this short-term world in which we live. If you’re interested in my longer-term and short-term perspectives on our current markets, you can go to our website: www.hartfordinvestor.com/drbob to read my weekly investment commentary.
Dr. Bob Froehlich
Senior Managing Director
The Hartford Mutual Funds
PAST ECONOMIC AND INDEX PERFORMANCE DO NOT ENSURE FUTURE RESULTS.
Dr. Bob Froehlich’s sources of information include Bank of Canada, The Bank of England, Bank of Japan, Bloomberg News, Business Roundtable, China Investment Corporation, CIA. World Fact Book, CNBC, Congressional Budget Office, Deutsche Bank, The European Monetary Union, Federal Reserve Board, The Financial Times, Freddie Mac, FOX Business, Goldman Sachs, International Monetary Fund, International Strategy & Investment, Journal of Commerce, Merrill Lynch, PIERS Global Intelligence Solutions, Strategas Research, Thomson Reuters, Union Bank of Switzerland, U.S. Census Bureau, U.S. Department of Commerce, U.S. Department of Labor, U.S. State Department, U.S. Treasury Department, The Wall Street Journal, and The World Bank. This information is written in connection with the promotion or marketing of the matter(s) addressed in this material. The information cannot be used or relied upon for the purpose of avoiding IRS penalties. These materials are not intended to provide tax, accounting or legal advice. As with all matters of a tax or legal nature, you should consult your own tax or legal counsel for advice. You should carefully consider investment objectives, risks, and charges and expenses of The Hartford Mutual Funds before investing. This and other information can be found in the Fund’s prospectus or summary prospectus, which can be obtained from your investment representative or by calling 888-843-7824. Please read them carefully before you invest or send money. The Hartford Mutual Funds are underwritten and distributed by Hartford Investment Financial Services, LLC. “The Hartford” is The Hartford Financial Services Group, Inc., and its subsidiaries. MFAR-SCG11 12/11 102949 Printed in U.S.A. ©2011 The Hartford, Hartford, CT 06155 | |
| | |
| | |
THE HARTFORD MUTUAL FUNDS 2011 Annual Report The Hartford Value Opportunities Fund |
A MESSAGE FROM THE PRESIDENT
Dear Fellow Shareholders:
I want to take this opportunity to say thank you for investing in The Hartford Mutual Funds.
This has been a tumultuous year. In the beginning of 2011, we witnessed tension-fueled political uprisings in the already-volatile Middle East and North Africa region. We also watched as Japan dealt with a series of crises including a massive earthquake and subsequent tsunami. Yet, U.S. economic conditions continued to improve, with gains in consumer confidence and retail sales. During the first half of 2011, domestic, international, and world indices (as measured by the S&P 500, MSCI EAFE and MSCI World) were all up more than 5% through June, 30 2011.
The economic recovery, however, lost momentum in the second half of 2011. The employment and housing markets both remain extremely challenged. Investors continue to be concerned about the implications of the European sovereign debt crisis, as well as our own high levels of domestic debt. Fears that the European sovereign debt crisis could continue to drag down the global economy have weighed heavily on stocks.
Ongoing apprehension regarding the U.S. debt ceiling during the summer, and the resulting downgrade of the U.S. sovereign credit rating by Standard & Poor’s, also contributed to weaker investor confidence.
There are, however, some reasons to remain confident. Corporations have record levels of cash on their balance sheets—corporate cash has doubled in the past 10 years. In addition, U.S. gross domestic product expanded at a 2.5 percent annual rate in the third quarter according to the Commerce Department, as consumers and businesses set aside fears about the recovery and stepped up spending. Corporate earnings have also remained positive, with a majority of companies beating expectations each quarter this year. This momentum will hopefully continue through the fourth quarter and into next year.
As we approach the end of 2011, in light of the continued market volatility, now would be a good time to schedule a meeting with your financial advisor to examine your current investment strategy and determine whether you are on the right track.
| | • Does your fixed-income portfolio complement your equity portfolio? |
| | • Are you receiving diversified sources of income? |
| | • Is your portfolio still in line with your risk tolerance and investment time horizon? |
Talk to your advisor to see what changes you should make to address these concerns and opportunities. Thank you again for investing with The Hartford Mutual Funds.
James Davey
President
The Hartford Mutual Funds
The Hartford Value Opportunities Fund
| Fund Performance (Unaudited) | 2 |
| Manager Discussion (Unaudited) | 3 |
| Financial Statements | |
| 5 |
| 8 |
| 9 |
| 10 |
| 11 |
| 12 |
| 24 |
| 26 |
| 27 |
| 29 |
| 29 |
| 30 |
| 31 |
| 32 |
The views expressed in the Fund’s Manager Discussion under ‘‘Why did the Fund perform this way?’’ and ‘‘What is the outlook?’’ are views of the Fund’s sub-adviser and portfolio management team through the end of the period and are subject to change based on market and other conditions.
The Hartford Value Opportunities Fund inception 01/02/1996 |
| (sub-advised by Wellington Management Company, LLP) | |
| | |
| Investment objective – Seeks capital appreciation. | |
| | |
Performance Overview 10/31/01 - 10/31/11
The chart above shows the growth of a $10,000 investment in Class A which includes a sales charge. Growth results in classes other than Class A will vary from what is seen above due to differences in the expenses charged to those share classes.
Average Annual Total Returns (as of 10/31/11) |
| | 1 Year | 5 Year | 10 Year |
| Value Opportunities A# | 4.41% | -1.57% | 4.50% |
| Value Opportunities A## | -1.33% | -2.68% | 3.91% |
| Value Opportunities B# | 3.56% | -2.20% | NA* |
| Value Opportunities B## | -1.44% | -2.49% | NA* |
| Value Opportunities C# | 3.67% | -2.32% | 3.73% |
| Value Opportunities C## | 2.67% | -2.32% | 3.73% |
| Value Opportunities I# | 4.80% | -1.31% | 4.84% |
| Value Opportunities R3# | 4.15% | -1.87% | 4.50% |
| Value Opportunities R4# | 4.47% | -1.58% | 4.66% |
| Value Opportunities R5# | 4.81% | -1.29% | 4.82% |
| Value Opportunities Y# | 4.82% | -1.17% | 4.88% |
| Russell 1000 Value Index | 6.16% | -2.05% | 4.57% |
| Russell 3000 Value Index | 5.94% | -2.01% | 4.80% |
| * | Since inception returns are not applicable for Class B because after 8 years Class B converts to Class A. |
PAST PERFORMANCE IS NOT INDICATIVE OF FUTURE RESULTS.
The initial investment in Class A shares reflects the maximum sales charge and Classes B and C reflect a contingent deferred sales charge.
Total returns presented above were calculated using the Fund's net asset value available to shareholders for sale or redemption of Fund shares on October 31, 2011, which excludes investment transactions as of this date.
Effective 9/30/09, Class B shares of The Hartford Mutual Funds were closed to new investments.
Class A, B, C and Y shares commenced operations on 2/19/02. Class A and C share performance prior to that date reflects Class L and N share performance and operating expenses less Class A or C share sales charges, respectively. (Class L and N shares are no longer offered.) Class Y share performance prior to 2/19/02 reflects Class L share performance and operating expenses, adjusted to reflect that Class Y has no sales charges. Class I shares commenced operations on 8/31/06. Performance prior to that date is that of the Fund's Class A shares (excluding sales charges), which had different operating expenses.Class R3, R4 and R5 shares commenced operations on 12/22/06. Class R3, R4 and R5 share performance between 2/19/02 and 12/22/06 reflects Class Y share performance and operating expenses. Class R3, R4 and R5 share performance prior to 2/19/02 reflects Class L share performance and operating expenses, adjusted to reflect the fact that Class R3, R4 and R5 have no sales charges.
Russell 1000 Value Index is an unmanaged index measuring the performance of those Russell 1000 Index companies with lower price-to-book ratios and lower forecasted growth values. (The Russell 1000 Index is an unmanaged index that measures the performance of the 1,000 largest companies in the Russell 3000 Index, which measures the performance of the 3,000 largest U.S. companies, based on total market capitalizations.)
Russell 3000 Value Index is an unmanaged index measuring the performance of those Russell 3000 Index companies with lower price-to-book ratios and lower forecasted growth values. (The Russell 3000 Index is an unmanaged index that measures the performance of the 3,000 largest U.S. companies based on total market capitalization.)
You cannot invest directly in an index.
The chart represents a hypothetical investment in the Fund. Performance data represents past performance and current performance could be higher or lower.
The value of shares will fluctuate so that, when redeemed, shares may be worth more or less than their original cost. The chart and table do not reflect the deduction of taxes that a shareholder would pay on Fund distributions or the redemption of Fund shares.
Performance information may reflect historical or current expense waivers/reimbursements from the investment adviser, without which performance would have been lower. For information on current expense waivers/reimbursements, please see the prospectus.
|
| Manager Discussion (Unaudited) |
|
| Portfolio Managers | | |
| David R. Fassnacht, CFA | James N. Mordy | David W. Palmer, CFA |
| Senior Vice President | Senior Vice President | Senior Vice President |
| | | |
How did the Fund perform?
The Class A shares of The Hartford Value Opportunities Fund returned 4.41%, before sales charges, for the twelve-month period ended October 31, 2011, underperforming its benchmarks, the Russell 1000 Value Index and Russell 3000 Value Index, which returned 6.16% and 5.94%, respectively, for the same period. The Fund outperformed the 4.12% return of the average fund in the Lipper Multi-Cap Value Fund peer group, a group of funds with investment strategies similar to those of the Fund.
Why did the Fund perform this way?
U.S. equities moved higher in the period despite a high degree of volatility related to, in the first half of the period, unrest in North Africa and the Middle East as well as the devastating earthquake and tsunami in Japan. Fears of a global economic slowdown and concerns about heightened geopolitical risks were not enough to offset strong corporate earnings, generally solid economic data, and a continued accommodative Federal Reserve policy. In the latter half of the period, positive returns from strong corporate earnings and generally solid economic data were offset by European sovereign debt concerns and a deteriorating outlook for economic growth. October, the final month of the period, produced a sharp rally for risk assets, as evidence began to surface that Europe’s leaders would take steps to address the continent’s fiscal crises.
Nine of the ten sectors within the Russell 3000 Value Index posted positive returns during the period. Energy (+21%), Utilities (+15%), and Health Care (+12%) were the top performers while Financials (-6%) and Materials (+3%) lagged on a relative basis.
Sector allocation, a fall-out of our bottom-up (i.e. stock by stock fundamental research) stock selection process, was the primary driver of the Fund’s return. Sector allocation was strongest in Health Care, Consumer Staples, and Energy and weakest within Utilities, Information Technology, and Financials. Security selection, primarily in Energy, Information Technology, and Consumer Staples, detracted from relative performance (i.e. performance of the Fund as measured against the benchmark).
The largest contributors to relative performance were Merck (Health Care), Citigroup (Financials), and Oaktree Capital (Financials). Merck struggled in the period due to disappointing results from clinical studies of a new drug. Management also withdrew earnings guidance for the year, creating volatility in the stock. The portfolio did not own Merck for the early part of the period, which contributed positively to relative performance; we established a position later in the period on weakness. Shares of Citigroup remained relatively flat during the period as weakness continued in the securities/banking sector and the company reduced estimates on higher expenses; not holding the stock contributed to relative performance. Shares of Oaktree Capital, a U.S.-based privately held financial firm that seeks to capitalize on market inefficiencies, returned 34% for the period, as it announced many private equity acquisitions during the year that were looked favorably upon by investors. Top contributors to absolute (i.e. total return) performance included Cabot Oil & Gas (Energy) and Weatherford International (Energy).
The largest detractors from relative performance included Cisco Systems (Information Technology), Bank of America (Financials), and Frontline (Energy). Shares of Cisco, a top global provider of networking equipment, fell throughout the period as the company missed analysts earnings estimates and shares were pressured by a sharp decline in gross margins due to higher sales of lower margin products. Shares of Bank of America declined amid negative headlines regarding litigation uncertainty related to its ownership of Countrywide Financial. A large investment by Warren Buffet was not enough to convince investors to buy as the stock finished down for the period. Frontline, a Bermuda-based owner/operator of crude oil transport tankers, fell during the period as day rates for tankers were pressured, the company generated little cash margin, and ships remained in oversupply while new builds continued to be delivered. Top detractors to absolute returns included China Agri-Industries (Consumer Staples).
What is the outlook?
Economic momentum remained sluggish in recent months, with the most notable disappointments being the lack of jobs growth in the U.S. and the tenuous economic and political climate in Europe. During the final month of the period, the market responded to developments in Europe, which we believe were perceived as catalysts for moving the continent’s healing process forward, though things may get worse before they get better. In the months ahead, we will be watching closely. We also will be paying attention to potential macro developments that can influence how we position the portfolio stock by stock including an easing of commodity price
| The Hartford Value Opportunities Fund |
| Manager Discussion (Unaudited) – (continued) |
|
pressure, less uncertainty around banking reform, recovery in U.S. housing, stronger U.S. capital spending, and potential progress from Congress toward long-term fiscal deficit reduction.
At the end of the period, the Fund was most overweight (i.e. the Fund’s sector position was greater than the benchmark position) Information Technology, Financials, and Health Care and most underweight (i.e. the Fund’s sector position was less than the benchmark position) Telecommunication Services, Utilities, and Industrials relative to the benchmark.
| Diversification by Industry | |
| as of October 31, 2011 | |
| | | |
| Banks (Financials) | | | 9.0 | % |
| Capital Goods (Industrials) | | | 3.6 | |
| Consumer Durables & Apparel (Consumer Discretionary) | | | 0.9 | |
| Consumer Services (Consumer Discretionary) | | | 1.6 | |
| Diversified Financials (Financials) | | | 8.8 | |
| Energy (Energy) | | | 12.8 | |
| Food, Beverage & Tobacco (Consumer Staples) | | | 7.3 | |
| Health Care Equipment & Services (Health Care) | | | 4.1 | |
| Insurance (Financials) | | | 10.1 | |
| Materials (Materials) | | | 5.0 | |
| Media (Consumer Discretionary) | | | 1.3 | |
| Pharmaceuticals, Biotechnology & Life Sciences (Health Care) | | | 9.6 | |
| Real Estate (Financials) | | | 0.6 | |
| Retailing (Consumer Discretionary) | | | 4.5 | |
| Software & Services (Information Technology) | | | 5.9 | |
| Technology Hardware & Equipment (Information Technology) | | | 6.2 | |
| Transportation (Industrials) | | | 3.4 | |
| Utilities (Utilities) | | | 3.3 | |
| Short-Term Investments | | | 1.3 | |
| Other Assets and Liabilities | | | 0.7 | |
| Total | | | 100.0 | % |
|
| Schedule of Investments |
| October 31, 2011 |
|
| Shares or Principal Amount | | Market Value ╪ | |
| COMMON STOCKS - 98.0% | | | |
| | | Banks - 9.0% | | | |
| | 166 | | BB&T Corp. | | $ | 3,877 | |
| | 224 | | Fifth Third Bancorp | | | 2,695 | |
| | 256 | | Wells Fargo & Co. | | | 6,641 | |
| | | | | | | 13,213 | |
| | | | Capital Goods - 3.6% | | | | |
| | 16 | | General Dynamics Corp. | | | 1,040 | |
| | 18 | | L-3 Communications Holdings, Inc. | | | 1,247 | |
| | 18 | | Moog, Inc. Class A ● | | | 709 | |
| | 26 | | PACCAR, Inc. | | | 1,137 | |
| | 32 | | Pentair, Inc. | | | 1,163 | |
| | | | | | | 5,296 | |
| | | | Consumer Durables & Apparel - 0.9% | | | | |
| | 127 | | Pulte Group, Inc. ● | | | 659 | |
| | 49 | | Skechers USA, Inc. Class A ● | | | 700 | |
| | | | | | | 1,359 | |
| | | | Consumer Services - 1.6% | | | | |
| | 19 | | Apollo Group, Inc. Class A ● | | | 876 | |
| | 32 | | DeVry, Inc. | | | 1,194 | |
| | 312 | | Thomas Cook Group plc | | | 259 | |
| | | | | | | 2,329 | |
| | | | Diversified Financials - 8.8% | | | | |
| | 25 | | Ameriprise Financial, Inc. | | | 1,181 | |
| | 414 | | Bank of America Corp. | | | 2,829 | |
| | 13 | | BlackRock, Inc. | | | 1,973 | |
| | 15 | | Goldman Sachs Group, Inc. | | | 1,665 | |
| | 54 | | JP Morgan Chase & Co. | | | 1,870 | |
| | 45 | | Nasdaq OMX Group, Inc. ● | | | 1,117 | |
| | 25 | | Oaktree Capital ■● | | | 1,125 | |
| | 55 | | PHH Corp. ● | | | 1,020 | |
| | 74 | | Solar Cayman Ltd. ⌂■●† | | | 7 | |
| | | | | | | 12,787 | |
| | | | Energy - 12.8% | | | | |
| | 9 | | Apache Corp. | | | 867 | |
| | 38 | | Bourbon S.A. | | | 1,042 | |
| | 43 | | Canadian Natural Resources Ltd. ADR | | | 1,513 | |
| | 80 | | Cobalt International Energy ● | | | 827 | |
| | 35 | | Consol Energy, Inc. | | | 1,475 | |
| | 62 | | Frontline Ltd. | | | 323 | |
| | – | | Inpex Corp. | | | 1,637 | |
| | 128 | | Lone Pine Resources, Inc. ● | | | 967 | |
| | 54 | | Noble Corp. | | | 1,944 | |
| | 28 | | Occidental Petroleum Corp. | | | 2,639 | |
| | 22 | | Overseas Shipholding Group, Inc. | | | 280 | |
| | 68 | | Southwestern Energy Co. ● | | | 2,855 | |
| | 67 | | Statoilhydro ASA ADR | | | 1,711 | |
| | 101 | | Tsakos Energy Navigation Ltd. | | | 605 | |
| | | | | | | 18,685 | |
| | | | Food, Beverage & Tobacco - 7.3% | | | | |
| | 99 | | Archer Daniels Midland Co. | | | 2,876 | |
| | 1,268 | | China Agri-Industries Holdings | | | 1,011 | |
| | 147 | | Maple Leaf Foods, Inc. w/ Rights | | | 1,661 | |
| | 82 | | Molson Coors Brewing Co. | | | 3,455 | |
| | 84 | | Tyson Foods, Inc. Class A | | | 1,629 | |
| | | | | | | 10,632 | |
| | | | Health Care Equipment & Services - 4.1% | | | | |
| | 20 | | Covidien International plc | | | 950 | |
| | 76 | | Medtronic, Inc. | | | 2,641 | |
| | 61 | | Universal Health Services, Inc. Class B | | | 2,442 | |
| | | | | | | 6,033 | |
| | | | Insurance - 10.1% | | | | |
| | 15 | | ACE Ltd. | | | 1,106 | |
| | 33 | | Everest Re Group Ltd. | | | 2,940 | |
| | 35 | | Platinum Underwriters Holdings Ltd. | | | 1,216 | |
| | 50 | | Principal Financial Group, Inc. | | | 1,281 | |
| | 45 | | Reinsurance Group of America, Inc. | | | 2,340 | |
| | 24 | | StanCorp Financial Group, Inc. | | | 801 | |
| | 24 | | Swiss Re Ltd. | | | 1,304 | |
| | 157 | | Unum Group | | | 3,736 | |
| | | | | | | 14,724 | |
| | | | Materials - 5.0% | | | | |
| | 63 | | Cabot Corp. | | | 1,907 | |
| | 89 | | CRH plc | | | 1,606 | |
| | 20 | | HeidelbergCement AG w/ Rights | | | 915 | |
| | 60 | | Methanex Corp. ADR | | | 1,543 | |
| | 23 | | Mosaic Co. | | | 1,318 | |
| | | | | | | 7,289 | |
| | | | Media - 1.3% | | | | |
| | 39 | | Comcast Corp. Class A | | | 924 | |
| | 44 | | Comcast Corp. Special Class A | | | 1,014 | |
| | | | | | | 1,938 | |
| | | | Pharmaceuticals, Biotechnology & Life Sciences - 9.6% | | | | |
| | 134 | | Almirall S.A. | | | 1,000 | |
| | 42 | | Amgen, Inc. | | | 2,383 | |
| | 320 | | Avanir Pharmaceuticals ● | | | 955 | |
| | 159 | | Merck & Co., Inc. | | | 5,468 | |
| | 17 | | Roche Holding AG | | | 2,750 | |
| | 122 | | WuXi PharmaTech Cayman, Inc. ● | | | 1,518 | |
| | | | | | | 14,074 | |
| | | | Real Estate - 0.6% | | | | |
| | 24 | | Plum Creek Timber Co., Inc. | | | 911 | |
| | | | | | | | |
| | | | Retailing - 4.5% | | | | |
| | 572 | | Allstar Co. ⌂† | | | 514 | |
| | 58 | | Kohl's Corp. | | | 3,048 | |
| | 94 | | Lowe's Co., Inc. | | | 1,982 | |
| | 20 | | Target Corp. | | | 1,084 | |
| | | | | | | 6,628 | |
| | | | Software & Services - 5.9% | | | | |
| | 120 | | Booz Allen Hamilton Holding Corp. ● | | | 1,896 | |
| | 90 | | Microsoft Corp. | | | 2,386 | |
| | 41 | | Paychex, Inc. | | | 1,195 | |
| | 184 | | Western Union Co. | | | 3,207 | |
| | | | | | | 8,684 | |
| | | | Technology Hardware & Equipment - 6.2% | | | | |
| | 22 | | Avnet, Inc. ● | | | 667 | |
| | 90 | | Cisco Systems, Inc. | | | 1,664 | |
| | 69 | | Corning, Inc. | | | 985 | |
| | 354 | | Flextronics International Ltd. ● | | | 2,321 | |
| | 44 | | Harris Corp. | | | 1,650 | |
| | 73 | | Juniper Networks, Inc. ● | | | 1,796 | |
| | | | | | | 9,083 | |
| | | | Transportation - 3.4% | | | | |
| | 97 | | Knight Transportation, Inc. | | | 1,478 | |
| | 64 | | Swift Transportation Co. ● | | | 574 | |
| | 225 | | Toll Holdings Ltd. | | | 1,138 | |
| | 25 | | United Parcel Service, Inc. Class B | | | 1,735 | |
| | | | | | | 4,925 | |
| | | | Utilities - 3.3% | | | | |
| | 35 | | Entergy Corp. | | | 2,400 | |
The accompanying notes are an integral part of these financial statements.
|
| Schedule of Investments – (continued) |
| October 31, 2011 |
|
| Shares or Principal Amount | | | | | Market Value ╪ | |
| COMMON STOCKS - 98.0% - (continued) | | | | | | |
| | | Utilities - 3.3% - (continued) | | | | | | |
| | 87 | | N.V. Energy, Inc. | | | | | | $ | 1,388 | |
| | 35 | | UGI Corp. | | | | | | | 1,003 | |
| | | | | | | | | | | 4,791 | |
| | | | Total common stocks | | | | | | | | |
| | | | (cost $149,369) | | | | | | $ | 143,381 | |
| | | | | | | | | | | | |
| | | | Total long-term investments | | | | | | | | |
| | | | (cost $149,369) | | | | | | $ | 143,381 | |
| | | | | | | | | | | | |
| SHORT-TERM INVESTMENTS - 1.3% | | | | | | | | |
| Repurchase Agreements - 1.3% | | | | | | | | |
| | | | Bank of America Merrill Lynch TriParty Joint Repurchase Agreement (maturing on 11/01/2011 in the amount of $114, collateralized by FHLMC 4.50%, 2040, FNMA 5.00, 2041, value of $117) | | | | | | | | |
| $ | 114 | | 0.11%, 10/31/2011 | | | | | | $ | 114 | |
| | | | Barclays Capital TriParty Joint Repurchase Agreement (maturing on 11/01/2011 in the amount of $1,091, collateralized by FNMA 5.50%, 2041, GNMA 4.00%, 2040, U.S. Treasury Bond 8.13%, 2021, U.S. Treasury Note 2.50% - 3.63%, 2015 - 2020, value of $1,113) | | | | | | | | |
| | 1,091 | | 0.11%, 10/31/2011 | | | | | | | 1,091 | |
| | | | Deutsche Bank Securities TriParty Joint Repurchase Agreement (maturing on 11/01/2011 in the amount of $154, collateralized by GNMA 4.00% - 5.00%, 2040, value of $157) | | | | | | | | |
| | 154 | | 0.11%, 10/31/2011 | | | | | | | 154 | |
| | | | UBS Securities, Inc. Joint Repurchase Agreement (maturing on 11/01/2011 in the amount of $–, collateralized by U.S. Treasury Note 1.88%, 2014, value of $–) | | | | | | | | |
| | – | | 0.11%, 10/31/2011 | | | | | | | – | |
| | | | UBS Securities, Inc. TriParty Joint Repurchase Agreement (maturing on 11/01/2011 in the amount of $532, collateralized by GNMA 3.50% - 4.50%, 2041, value of $542) | | | | | | | | |
| | 532 | | 0.11%, 10/31/2011 | | | | | | | 532 | |
| | | | | | | | | | | 1,891 | |
| | | | Total short-term investments | | | | | | | | |
| | | | (cost $1,891) | | | | | | $ | 1,891 | |
| | | | | | | | | | | | |
| | | | Total investments | | | | | | | | |
| | | | (cost $151,260) ▲ | | | 99.3 | % | | $ | 145,272 | |
| | | | Other assets and liabilities | | | 0.7 | % | | | 1,014 | |
| | | | Total net assets | | | 100.0 | % | | $ | 146,286 | |
| Note: | Percentage of investments as shown is the ratio of the total market value to total net assets. Market value of long-term investments in foreign securities represents 14.5% of total net assets at October 31, 2011. |
Prices of foreign equities that are principally traded on certain foreign markets may be adjusted daily pursuant to a fair value pricing service approved by the Board of Directors in order to reflect an adjustment for factors occurring after the close of certain foreign markets but before the close of the New York Stock Exchange.
The accompanying notes are an integral part of these financial statements.
| ▲ | At October 31, 2011, the cost of securities for federal income tax purposes was $152,395 and the aggregate gross unrealized appreciation and depreciation based on that cost were: |
| Unrealized Appreciation | | $ | 8,424 | |
| Unrealized Depreciation | | | (15,547 | ) |
| Net Unrealized Depreciation | | $ | (7,123 | ) |
| † | These securities were valued in good faith at fair value as determined under policies and procedures established by and under the supervision of the Company's Board of Directors. At October 31, 2011, the aggregate value of these securities was $521, which represents 0.4% of total net assets. This amount excludes securities that are principally traded in certain foreign markets and whose prices are adjusted pursuant to a third party pricing service methodology approved by the Board of Directors. |
| ■ | Securities issued within terms of a private placement memorandum, exempt from registration under Rule 144A under the Securities Act of 1933, as amended, and may be sold only to qualified institutional buyers. Unless otherwise indicated, these issues are determined to be liquid. At October 31, 2011, the aggregate value of these securities was $1,132, which represents 0.8% of total net assets. |
| ⌂ | The following securities are considered illiquid. Illiquid securities are often purchased in private placement transactions, are often not registered under the Securities Act of 1933 and may have contractual restrictions on resale. A security may also be considered illiquid if the security lacks a readily available market or if its valuation has not changed for a certain period of time. |
| Period Acquired | | | Shares/ Par | | Security | | Cost Basis | |
| 08/2011 | | | | 572 | | Allstar Co. | | $ | 582 | |
| 03/2007 | | | | 74 | | Solar Cayman Ltd. - 144A | | | 22 | |
At October 31, 2011, the aggregate value of these securities was $521, which represents 0.4% of total net assets.
Foreign Currency Contracts Outstanding at October 31, 2011
| Description | | Counterparty | | Buy / Sell | | Market Value ╪ | | | Contract Amount | | Delivery Date | | Unrealized Appreciation/ (Depreciation) | |
| Australian Dollar | | Banc of America Securities | | Sell | | $ | 4 | | | $ | 4 | | 11/02/2011 | | $ | – | |
| Euro | | UBS AG | | Sell | | | 9 | | | | 9 | | 11/01/2011 | | | – | |
| Japanese Yen | | CS First Boston | | Sell | | | 7 | | | | 7 | | 11/02/2011 | | | – | |
| Swiss Franc | | Banc of America Securities | | Sell | | | 22 | | | | 23 | | 11/01/2011 | | | 1 | |
| | | | | | | | | | | | | | | | $ | 1 | |
| ╪ | See Significant Accounting Policies of accompanying Notes to Financial Statements regarding valuation of securities. |
The accompanying notes are an integral part of these financial statements.
|
| Investment Valuation Hierarchy Level Summary |
| October 31, 2011 |
|
| | | | | | | | | | | | | |
| Assets: | | | | | | | | | | | | |
| Common Stocks ‡ | | $ | 143,381 | | | $ | 129,072 | | | $ | 12,663 | | | $ | 1,646 | |
| Short-Term Investments | | | 1,891 | | | | – | | | | 1,891 | | | | – | |
| Total | | $ | 145,272 | | | $ | 129,072 | | | $ | 14,554 | | | $ | 1,646 | |
| Foreign Currency Contracts * | | | 1 | | | | – | | | | 1 | | | | – | |
| Total | | $ | 1 | | | $ | – | | | $ | 1 | | | $ | – | |
| ♦ | For the year ended October 31, 2011, there were no significant transfers between Level 1 and Level 2. |
| ‡ | The Fund has all or primarily all of the equity securities categorized in a particular level. Refer to the Schedule of Investments for further industry breakout. |
| * | Derivative instruments not reflected in the Schedule of Investments are valued at the unrealized appreciation/depreciation on the investments. |
Following is a reconciliation of Level 3 assets for which significant unobservable inputs were used to determine fair value:
| | | Balance as of October 31, 2010 | | | Realized Gain (Loss) | | | Change in Unrealized Appreciation (Depreciation) | | | Net Amortization | | | Purchases | | | Sales | | | Transfers Into Level 3 | | | Transfers Out of Level 3 | | | Balance as of October 31, 2011 | |
| Assets: | | | | | | | | | | | | | | | | | | | | | | | | | | | |
| Common Stocks | | $ | 2,409 | | | $ | 258 | | | $ | 559 | * | | $ | — | | | $ | 582 | | | $ | (2,162 | ) | | $ | — | | | $ | — | | | $ | 1,646 | |
| Total | | $ | 2,409 | | | $ | 258 | | | $ | 559 | | | $ | — | | | $ | 582 | | | $ | (2,162 | ) | | $ | — | | | $ | — | | | $ | 1,646 | |
| * | Change in unrealized appreciation (depreciation) in the current period relating to assets still held at October 31, 2011 was $559. |
The accompanying notes are an integral part of these financial statements.
|
| Statement of Assets and Liabilities |
| October 31, 2011 |
|
| Assets: | | | |
| Investments in securities, at market value (cost $151,260) | | $ | 145,272 | |
| Cash | | | 1 | |
| Unrealized appreciation on foreign currency contracts | | | 1 | |
| Receivables: | | | | |
| Investment securities sold | | | 1,390 | |
| Fund shares sold | | | 146 | |
| Dividends and interest | | | 122 | |
| Other assets | | | 67 | |
| Total assets | | | 146,999 | |
| Liabilities: | | | | |
| Payables: | | | | |
| Investment securities purchased | | | 452 | |
| Fund shares redeemed | | | 179 | |
| Investment management fees | | | 22 | |
| Administrative fees | | | — | |
| Distribution fees | | | 8 | |
| Accrued expenses | | | 52 | |
| Total liabilities | | | 713 | |
| Net assets | | $ | 146,286 | |
| Summary of Net Assets: | | | | |
| Capital stock and paid-in-capital | | $ | 206,733 | |
| Accumulated undistributed net investment income | | | 1,105 | |
| Accumulated net realized loss on investments and foreign currency transactions | | | (55,565 | ) |
| Unrealized depreciation of investments and the translation of assets and liabilities denominated in foreign currency | | | (5,987 | ) |
| Net assets | | $ | 146,286 | |
| | | | | |
| Shares authorized | | | 27,000,000 | |
| Par value | | $ | 0.0001 | |
Class A: Net asset value per share/Maximum offering price per share | | | $12.68/$13.42 | |
| Shares outstanding | | | 6,821 | |
| Net assets | | $ | 86,456 | |
Class B: Net asset value per share | | $ | 11.33 | |
| Shares outstanding | | | 515 | |
| Net assets | | $ | 5,838 | |
Class C: Net asset value per share | | $ | 11.31 | |
| Shares outstanding | | | 905 | |
| Net assets | | $ | 10,227 | |
Class I: Net asset value per share | | $ | 12.57 | |
| Shares outstanding | | | 202 | |
| Net assets | | $ | 2,535 | |
Class R3: Net asset value per share | | $ | 12.81 | |
| Shares outstanding | | | 73 | |
| Net assets | | $ | 934 | |
Class R4: Net asset value per share | | $ | 12.90 | |
| Shares outstanding | | | 454 | |
| Net assets | | $ | 5,865 | |
Class R5: Net asset value per share | | $ | 12.99 | |
| Shares outstanding | | | 17 | |
| Net assets | | $ | 221 | |
Class Y: Net asset value per share | | $ | 13.05 | |
| Shares outstanding | | | 2,621 | |
| Net assets | | $ | 34,210 | |
The accompanying notes are an integral part of these financial statements.
|
| Statement of Operations |
| For the Year Ended October 31, 2011 |
|
| Investment Income: | | | |
| Dividends | | $ | 3,157 | |
| Interest | | | 3 | |
| Less: Foreign tax withheld | | | (87 | ) |
| Total investment income | | | 3,073 | |
| | | | | |
| Expenses: | | | | |
| Investment management fees | | | 1,204 | |
| Administrative services fees | | | 11 | |
| Transfer agent fees | | | 371 | |
| Distribution fees | | | | |
| Class A | | | 191 | |
| Class B | | | 69 | |
| Class C | | | 113 | |
| | | 46 | |
| Class R3 | | | 5 | |
| Class R4 | | | 15 | |
| Custodian fees | | | 12 | |
| Accounting services fees | | | 22 | |
| Registration and filing fees | | | 107 | |
| Board of Directors' fees | | | 3 | |
| Audit fees | | | 11 | |
| Other expenses | | | 35 | |
| Total expenses (before waivers and fees paid indirectly) | | | 2,215 | |
| Expense waivers | | | (116 | ) |
| Transfer agent fee waivers | | | (36 | ) |
| Commission recapture | | | (4 | ) |
| Total waivers and fees paid indirectly | | | (156 | ) |
| Total expenses, net | | | 2,059 | |
| Net Investment Income | | | 1,014 | |
| Net Realized Gain on Investments and Foreign Currency Transactions: | | | | |
| Net realized gain on investments in securities | | | 17,039 | |
| Net realized loss on foreign currency contracts | | | (173 | ) |
| Net realized gain on other foreign currency transactions | | | 27 | |
| Net Realized Gain on Investments and Foreign Currency Transactions | | | 16,893 | |
| Net Changes in Unrealized Depreciation of Investments and Foreign Currency Transactions: | | | | |
| Net unrealized depreciation of investments | | | (11,645 | ) |
| Net unrealized appreciation of foreign currency contracts | | | 63 | |
| Net unrealized appreciation on translation of other assets and liabilities in foreign currencies | | | 1 | |
| Net Changes in Unrealized Depreciation of Investments and Foreign Currency Transactions | | | (11,581 | ) |
| Net Gain on Investments and Foreign Currency Transactions | | | 5,312 | |
| Net Increase in Net Assets Resulting from Operations | | $ | 6,326 | |
| * | Class L merged into Class A on August 5, 2011. Please refer to the Notes to Financial Statements for further details. |
The accompanying notes are an integral part of these financial statements.
|
| Statement of Changes in Net Assets |
| |
|
| | | For the Year Ended October 31, 2011 | | | For the Year Ended October 31, 2010 | |
| Operations: | | | | | | |
| Net investment income | | $ | 1,014 | | | $ | 463 | |
| Net realized gain on investments and foreign currency transactions | | | 16,893 | | | | 13,874 | |
| Net unrealized appreciation (depreciation) of investments and foreign currency transactions | | | (11,581 | ) | | | 8,611 | |
| Net Increase In Net Assets Resulting From Operations | | | 6,326 | | | | 22,948 | |
| Distributions to Shareholders: | | | | | | | | |
| From net investment income | | | | | | | | |
| Class A | | | (32 | ) | | | (336 | ) |
| Class B | | | — | | | | (7 | ) |
| Class C | | | — | | | | — | |
| Class I | | | (6 | ) | | | (8 | ) |
| Class L* | | | (56 | ) | | | (107 | ) |
| Class R3 | | | — | | | | (1 | ) |
| Class R4 | | | (10 | ) | | | (17 | ) |
| Class R5 | | | (1 | ) | | | — | |
| Class Y | | | (137 | ) | | | (62 | ) |
| Total distributions | | | (242 | ) | | | (538 | ) |
| Capital Share Transactions: | | | | | | | | |
| Class A | | | 16,118 | | | | (10,213 | ) |
| Class B | | | (1,542 | ) | | | (2,197 | ) |
| Class C | | | (1,160 | ) | | | (1,046 | ) |
| Class I | | | 1,162 | | | | (156 | ) |
| Class L* | | | (25,432 | ) | | | (2,677 | ) |
| Class R3 | | | (143 | ) | | | 89 | |
| Class R4 | | | 550 | | | | 897 | |
| Class R5 | | | 63 | | | | 131 | |
| Class Y | | | 3,879 | | | | 19,751 | |
| Net increase (decrease) from capital share transactions | | | (6,505 | ) | | | 4,579 | |
| Net Increase (Decrease) In Net Assets | | | (421 | ) | | | 26,989 | |
| Net Assets: | | | | | | | | |
| Beginning of period | | | 146,707 | | | | 119,718 | |
| End of period | | $ | 146,286 | | | $ | 146,707 | |
| Accumulated undistributed (distribution in excess of) net investment income (loss) | | $ | 1,105 | | | $ | 305 | |
| * | Class L merged into Class A on August 5, 2011. Please refer to the Notes to Financial Statements for further details. |
The accompanying notes are an integral part of these financial statements.
|
| Notes to Financial Statements |
| October 31, 2011 |
|
The Hartford Mutual Funds II, Inc. (“Company”) is an open-end management investment company comprised of five portfolios. Financial statements for The Hartford Value Opportunities Fund (the “Fund”), a series of the Company, are included in this report.
The Company is organized under the laws of the State of Maryland and is registered with the Securities and Exchange Commission (“SEC”) under the Investment Company Act of 1940, as amended (“1940 Act”). The Fund is a diversified open-end management investment company.
Class A shares are sold with a front-end sales charge of up to 5.50%. Class B shares were sold with a contingent deferred sales charge which is assessed on the lesser of the per share net asset value (“NAV”) of the shares at the time of redemption or the original purchase price, and declines from up to 5.00% to zero depending on the period of time the shares are held (see note below regarding the closing of Class B shares). Class C shares are sold with a contingent deferred sales charge of up to 1.00% on shares redeemed within twelve months of purchase. Class I shares are sold without sales charges to certain eligible investors primarily through advisory fee-based wrap programs. Class R3, R4 and R5 shares, which are offered to employer-sponsored retirement plans, and Class Y shares, which are sold to certain eligible institutional investors, are sold without a sales charge. All classes of shares have identical voting, redemption, dividend, liquidation and other rights and the same terms and conditions, with the exceptions that each class may have different expenses, which may affect performance, and that Class B shares automatically convert to Class A shares after 8 years.
No new or additional investments are allowed in Class B shares of The Hartford Mutual Funds (including investments through any systematic investment plan). Existing shareholders of Class B shares may continue to hold their Class B shares, exchange their Class B shares for Class B shares of another Hartford Mutual Fund (as permitted by existing exchange privileges), or redeem their Class B shares as described in the Fund’s prospectus. Reinstatement privileges with respect to Class B shares will continue under the current policy. For investors electing to reinvest capital gains and dividends, any such capital gains or dividends on Class B shares will continue to be reinvested in Class B shares of the Fund. All Class B share attributes, including the 12b-1 fee, contingent deferred sales charge schedule, and conversion to Class A shares, remain unchanged.
| 2. | Significant Accounting Policies: |
The following is a summary of significant accounting policies of the Fund in the preparation of its financial statements, which are in accordance with the United States Generally Accepted Accounting Principles (“U.S. GAAP”). The preparation of financial statements in accordance with U.S. GAAP may require management to make estimates and assumptions that affect the reported amounts of assets and liabilities and disclosure of contingent assets and liabilities at the date of the financial statements and the reported amounts of increases and decreases in net assets from operations during the reporting period. Actual results could differ from those estimates.
| | a) | Determination of Net Asset Value – The NAV of each class of the Fund's shares is determined as of the close of regular trading (normally 4:00 p.m. Eastern Time) (the “NYSE Close”) on each day that the New York Stock Exchange (the “Exchange”) is open (“Valuation Date”). Information that becomes known to the Fund after the NAV has been calculated on a particular day will not generally be used to retroactively adjust the NAV determined earlier that day. |
| | b) | Investment Valuation and Fair Value Measurements – For purposes of calculating the NAV, portfolio securities and other assets held by the Fund's portfolio for which market quotes are readily available are valued at market value. Market value is generally determined on the basis of last reported sales prices or official close price. If no sales are reported, market value is based on quotes obtained from a quotation reporting system, established market makers, or independent pricing services. If market prices are not readily available or are deemed unreliable, the Fund will use the fair value of |
| | the security as determined in good faith under policies and procedures established by and under the supervision of the Company’s Board of Directors. Market quotes are considered not readily available where there is an absence of current or reliable market-based data (e.g., trade information or broker quotes), including where events occur after the close of the relevant market, but prior to the NYSE Close that materially affect the values of the Fund’s portfolio securities or assets. In addition, market quotes are considered not readily available when, due to extraordinary circumstances, the exchanges or markets on which the securities trade do not open for trading for the entire day and no other market prices are available. In addition, prices of foreign equities that are principally traded on certain foreign markets are adjusted daily pursuant to a fair value pricing service approved by the Board of Directors in order to reflect an adjustment for the factors occurring after the close of certain foreign markets but before the NYSE Close. Securities that are primarily traded on foreign markets may trade on days that are not business days of the Fund. The value of the foreign securities in which the Fund invests may change on days when a shareholder will not be able to purchase or redeem shares of the Fund. Fair value pricing is subjective in nature and the use of fair value pricing by the Fund may cause the NAV of its shares to differ significantly from the NAV that would have been calculated using market prices at the close of the exchange on which a portfolio security is primarily traded. There can be no assurance that the Fund could obtain the fair market value assigned to a security if the Fund were to sell the security at approximately the time at which the Fund determines its NAV. |
Investments valued in currencies other than U.S. dollars are converted to U.S. dollars using exchange rates obtained from independent pricing services for calculation of the NAV. As a result, the NAV of the Fund’s shares may be affected by changes in the value of currencies in relation to the U.S. dollar. The value of securities traded in markets outside the United States or denominated in currencies other than the U.S. dollar may be affected significantly on a day that the NYSE is closed and the market value may change on days when an investor is not able to purchase, redeem or exchange shares of the Fund.
Foreign currency contracts represent agreements to exchange currencies on specific future dates at predetermined rates. Foreign currency contracts are valued using foreign currency exchange rates and forward rates as provided by an independent pricing service on the Valuation Date.
Financial instruments for which prices are not available from an independent pricing service may be valued using market quotations obtained from one or more dealers that make markets in the respective financial instrument in accordance with procedures established by the Company’s Board of Directors.
U.S. GAAP defines fair value as the price that the Fund would receive to sell an asset or pay to transfer a liability in an orderly transaction between market participants. The U.S. GAAP fair value measurement standards require disclosure of a fair value hierarchy for each major category of assets and liabilities. Various inputs are used in determining the fair value of the Fund’s investments. These inputs are summarized into three broad hierarchy levels. This hierarchy is based on whether the valuation inputs are observable or unobservable. These levels are:
| | · | Level 1 – Quoted prices in active markets for identical securities. Level 1 may include exchange traded instruments such as domestic equities, some foreign equities, options, futures, mutual funds, exchange traded funds, rights and warrants. |
| | · | Level 2 – Observable inputs other than Level 1 prices, such as quoted prices for similar securities; quoted prices in markets that are not active; or other inputs that are observable or can be corroborated by observable market data. Level 2 may include debt securities that are traded less frequently than exchange traded instruments and which are valued using third party pricing services; foreign equities, that are principally traded on certain foreign markets and are adjusted daily pursuant to a fair value pricing service in order to reflect an adjustment for the factors occurring after the close of certain foreign markets but before the NYSE Close; and short-term securities, which are valued at amortized cost. |
| | · | Level 3 – Significant unobservable inputs that are supported by limited or no market activity. Level 3 may include financial instruments whose values are determined using broker quotes or require significant |
The Hartford Value Opportunities Fund |
| Notes to Financial Statements – (continued) |
| October 31, 2011 |
|
| | management judgment or estimation. These unobservable valuation inputs may include estimates for current yields, maturity/duration, prepayment speed, and broker quotes for comparable securities along with other assumptions relating to credit quality, collateral value, complexity of the security structure, general market conditions and liquidity. This category may include securities where trading has been halted or there are certain restrictions on trading. While these securities are priced using unobservable inputs, the valuation of these securities reflects the best available data and management believes the prices are a reasonable representation of exit price. |
Valuation levels are not necessarily indicative of the risk associated with investing in such securities. Individual securities within any of the above mentioned asset classes may be assigned a different hierarchical level than those presented above, as individual circumstances dictate.
For additional information, refer to the Investment Valuation Hierarchy Level Summary and the Level 3 roll forward reconciliation which follow the Schedule of Investments.
For purposes of reporting transfers between different hierarchy levels, both transfers in and out of each level, as applicable, are shown as if they occurred at the beginning of the period.
| | c) | Security Transactions and Investment Income – Security transactions are recorded as of the trade date (the date the order to buy or sell is executed) for financial reporting purposes. Securities purchased or sold on a when-issued or delayed-delivery basis may be settled a month or more after the trade date. Realized gains and losses are determined on the basis of identified cost. |
Dividend income is accrued as of the ex-dividend date, except certain dividends from foreign securities where the ex-dividend date may have passed are recorded as soon as the Fund is informed of the dividend. Interest income, including amortization of premium and accretion of discounts, is accrued on a daily basis.
| | d) | Foreign Currency Transactions – Assets and liabilities denominated in currencies other than U.S. dollars are translated into U.S. dollars at the exchange rates in effect on the valuation date. Purchases and sales of investment securities, income, and expenses are translated into U.S. dollars at the exchange rates on the dates of such transactions. |
The Fund does not isolate that portion of portfolio security valuation resulting from fluctuations in the foreign currency exchange rates from the fluctuations arising from changes in the market prices of securities held. Exchange rate fluctuations are included with the net realized and unrealized gain or loss on investments in the accompanying financial statements.
Net realized foreign exchange gains or losses arise from sales of foreign currencies and the difference between asset and liability amounts initially stated in foreign currencies and the U.S. dollar value of the amounts actually received or paid. Net unrealized foreign exchange gains or losses arise from changes in the value of other assets and liabilities at the end of the reporting period, resulting from changes in the exchange rates.
| | e) | Joint Trading Account – The Fund may invest cash balances into a joint trading account that may be invested in one or more repurchase agreements. |
| | f) | Fund Share Valuation and Dividend Distributions to Shareholders – Orders for the Fund’s shares are executed in accordance with the investment instructions of the shareholders. The NAV of the Fund’s shares is determined as of the close of business on each business day of the Exchange. The NAV is determined separately for each class of shares of the Fund by dividing the Fund’s net assets attributable to that class by the number of shares of the class outstanding. Each class of shares offered by the Fund has equal rights as to assets and voting privileges (except that shareholders of a class have exclusive voting rights regarding any matter relating solely to that class of shares). Income and non-class |
| | specific expenses are allocated daily to each class on the basis of the relative net assets of the class. Realized and unrealized capital gains and losses are allocated daily based on the relative net assets of each class of shares of the Fund. |
Orders for the purchase of the Fund’s shares received prior to the close of the Exchange on any day the Exchange is open for business are priced at the NAV determined as of the close of the Exchange. Orders received after the close of the Exchange, or on a day on which the Exchange and/or the Fund is not open for business, are priced at the next determined NAV.
Dividends are declared pursuant to a policy adopted by the Company’s Board of Directors based upon the investment performance of the Fund. The policy of the Fund is to pay dividends from net investment income and realized capital gains, if any, at least once a year.
Distributions from net investment income, net realized capital gains and capital are determined in accordance with federal income tax regulations, which may differ from U.S. GAAP with respect to character and timing. These differences may include but are not limited to losses deferred due to wash sale adjustments, foreign currency gains and losses, adjustments related to Passive Foreign Investment Companies (“PFICs”), Real Estate Investment Trusts (“REITs”), Regulated Investment Companies (“RICs”), certain derivatives and partnerships. Permanent book and federal income tax basis differences relating to shareholder distributions will result in reclassifications to certain of the Fund’s capital accounts (see Federal Income Taxes: Reclassification of Capital Accounts note).
| 3. | Securities and Other Investments: |
| | a) | Repurchase Agreements – A repurchase agreement is an agreement by which a counterparty agrees to sell a security and agrees to repurchase the security sold at a mutually agreed upon time and price. At the time the Fund enters into a repurchase agreement, the value of the underlying collateral security(ies), including accrued interest, will be equal to or exceed the value of the repurchase agreement. Repurchase agreements expose the Fund to counterparty risk. To minimize counterparty risk, the securities that serve to collateralize the repurchase agreement are held by the Fund's custodian in book entry or physical form in the custodial account of the Fund or in a third party custodial account. Repurchase agreements are valued at cost plus accrued interest. The Fund, as shown on the Schedule of Investments, had outstanding repurchase agreements as of October 31, 2011. |
| | b) | Illiquid and Restricted Securities – The Fund is permitted to invest up to 15% of its net assets in illiquid securities. Illiquid securities are those that may not be sold or disposed of in the ordinary course of business within seven days, at approximately the price used to determine the Fund’s NAV. The Fund may not be able to sell illiquid securities or other investments when its sub-adviser considers it desirable to do so or may have to sell such securities or investments at a price that is lower than the price that could be obtained if the securities or investments were more liquid. A sale of illiquid securities or other investments may require more time and may result in higher dealer discounts and other selling expenses than does the sale of those that are liquid. Illiquid securities and investments also may be more difficult to value due to the unavailability of reliable market quotations for such securities or investments, and an investment in them may have an adverse impact on the Fund’s NAV. The Fund may also purchase certain restricted securities that can only be resold to certain qualified investors and may be determined to be liquid pursuant to policies and guidelines established by the Company’s Board of Directors. The Fund, as shown on the Schedule of Investments, had illiquid and/or restricted securities as of October 31, 2011. |
| | c) | Securities Purchased on a When-Issued or Delayed-Delivery Basis – Delivery and payment for securities that have been purchased by the Fund on a forward commitment, or when-issued or delayed-delivery basis, take place beyond the customary settlement period. A fund may dispose of or renegotiate a delayed-delivery transaction after it is entered into, and may sell delayed-delivery securities before they are delivered, which may result in a realized gain or loss. During this period, such securities are subject to market fluctuations, and the Fund identifies securities segregated in its records |
The Hartford Value Opportunities Fund |
| Notes to Financial Statements – (continued) |
| October 31, 2011 |
|
| | with value at least equal to the amount of the commitment. As of October 31, 2011, the Fund had no outstanding when-issued or delayed delivery securities. |
| 4. | Financial Derivative Instruments: |
The following disclosures contain information on how and why the Fund uses derivative instruments, the credit-risk-related contingent features in certain derivative instruments, and how derivative instruments affect the Fund’s financial position and results of operations. The location and fair value amounts of these instruments on the Statement of Assets and Liabilities and the realized gains and losses and changes in unrealized gains and losses on the Statement of Operations, each categorized by type of derivative contract, are included in the following Additional Derivative Instrument Information footnote. The derivative instruments outstanding as of period-end are disclosed in the notes to the Schedule of Investments and the amounts of realized gains and losses and changes in unrealized gains and losses on derivative instruments during the period are disclosed in the Statement of Operations.
| | a) | Foreign Currency Contracts – The Fund may enter into foreign currency contracts that obligate the Fund to purchase or sell currencies at specified future dates. Foreign currency contracts are used to hedge the currency exposure associated with some or all of the Fund's securities and/or as part of an investment strategy. Foreign currency contracts are marked to market daily and the change in value is recorded by the Fund as an unrealized gain or loss. The Fund will record a realized gain or loss when the foreign currency contract is settled. |
Foreign currency contracts involve elements of market risk in excess of the amounts reflected in the Statement of Assets and Liabilities. In addition, risks may arise upon entering into these contracts from the potential inability of the counterparties to meet the terms of the contracts and from unanticipated movements in the value of the foreign currencies relative to the U.S. dollar. The Fund had outstanding foreign currency contracts as shown on the Schedule of Investments as of October 31, 2011.
| | b) | Additional Derivative Instrument Information: |
Fair Values of Derivative Instruments on the Statement of Assets and Liabilities as of October 31, 2011:
| | | Risk Exposure Category | |
| | | | | | Foreign Exchange Contracts | | | | | | | | | | | | | | | | |
| Assets: | | | | | | | | | | | | | | | | | | | | | |
| Unrealized appreciation on foreign currency contracts | | $ | — | | | $ | 1 | | | $ | — | | | $ | — | | | $ | — | | | $ | — | | | $ | 1 | |
| Total | | $ | — | | | $ | 1 | | | $ | — | | | $ | — | | | $ | — | | | $ | — | | | $ | 1 | |
The volume of derivatives that is presented in the Schedule of Investments is consistent with the derivative activity during the year ended October 31, 2011.
The Effect of Derivative Instruments on the Statement of Operations for the year ended October 31, 2011:
| | | Risk Exposure Category | |
| | | Interest Rate Contracts | | | Foreign Exchange Contracts | | | Credit Contracts | | | Equity Contracts | | | Commodity Contracts | | | Other Contracts | | | Total | |
| Realized Gain (Loss) on Derivatives Recognized as a Result of Operations: | |
| Net realized loss on foreign currency contracts | | $ | — | | | $ | (173 | ) | | $ | — | | | $ | — | | | $ | — | | | $ | — | | | $ | (173 | ) |
| Total | | $ | — | | | $ | (173 | ) | | $ | — | | | $ | — | | | $ | — | | | $ | — | | | $ | (173 | ) |
| | | | | | | | | | | | | | | | | | | | | | | | | | | | | |
| Net Change in Unrealized Appreciation (Depreciation) on Derivatives Recognized as a Result of Operations: | |
| Net change in unrealized appreciation of foreign currency contracts | | $ | — | | | $ | 63 | | | $ | — | | | $ | — | | | $ | — | | | $ | — | | | $ | 63 | |
| Total | | $ | — | | | $ | 63 | | | $ | — | | | $ | — | | | $ | — | | | $ | — | | | $ | 63 | |
| | a) | Counterparty Risk – The Fund may be exposed to counterparty risk, or the risk that an institution or other entity with which the Fund has unsettled or open transactions will default. |
| | b) | Market Risks – If the Fund invests directly in foreign currencies or in securities that trade in, and receive revenues in, foreign currencies, or in derivatives that provide exposure to foreign currencies, it will be subject to the risk that those currencies will decline in value relative to the base currency of the Fund, or, in the case of hedging positions, that the Fund’s base currency will decline in value relative to the currency being hedged. Currency rates in foreign countries may fluctuate significantly over short periods of time for a number of reasons, including changes in interest rates, intervention (or the failure to intervene) by U.S. or foreign governments, central banks or supranational entities, such as the International Monetary Fund, or by the imposition of currency controls or other political developments in the United States or abroad. As a result, the Fund’s investments in foreign currency denominated securities may reduce the returns of the Fund. The market values of equity securities, such as common stocks and preferred stocks, or equity related investments, such as futures and options, may decline due to general market conditions which are not specifically related to a particular company, such as real or perceived adverse economic conditions, changes in the general outlook for corporate earnings, changes in interest or currency rates or adverse investor sentiment generally. The market value of equity securities may also decline due to factors which affect a particular industry or industries, such as labor shortages or increased production costs and competitive conditions within an industry. Equity securities and equity related investments generally have greater market price volatility than fixed income securities. |
| | a) | Federal Income Taxes – For federal income tax purposes, the Fund intends to continue to qualify as a RIC under Subchapter M of the Internal Revenue Code (“IRC”) by distributing substantially all of its taxable net investment income and net realized capital gains to its shareholders and otherwise complying with the requirements of RICs. The Fund has distributed substantially all of its income and capital gains in prior years, if applicable, and intends to distribute substantially all of its income and capital gains during the calendar year ending December 31, 2011. Accordingly, no provision for federal income or excise taxes has been made in the accompanying financial statements. Distributions from short-term capital gains are treated as ordinary income distributions for federal income tax purposes. |
| | b) | Net Investment Income (Loss), Net Realized Gains (Losses) – Net investment income (loss) and net realized gains (losses) may differ for financial statement and tax purposes primarily because of losses deferred due to wash sale adjustments, foreign currency gains and losses, adjustments related to PFICs, REITs, RICs, certain derivatives and partnerships. The character of distributions made during the year from net investment income or net realized gains may differ from their ultimate characterization for federal income tax purposes. Also, due to the timing of dividend |
The Hartford Value Opportunities Fund |
| Notes to Financial Statements – (continued) |
| October 31, 2011 |
|
| | distributions, the fiscal year in which amounts are distributed may differ from the year that the income or realized gains (losses) were recorded by the Fund. |
| | c) | Distributions and Components of Distributable Earnings – The tax character of distributions paid by the Fund for the periods indicated is as follows (as adjusted for dividends payable): |
| | | For the Year Ended October 31, 2011 | | | For the Year Ended October 31, 2010 | |
| Ordinary Income | | $ | 242 | | | $ | 538 | |
As of October 31, 2011, the Fund’s components of distributable earnings (deficit) on a tax basis were as follows:
| | | Amount | |
| Undistributed Ordinary Income | | $ | 1,105 | |
| Accumulated Capital Losses * | | | (54,430 | ) |
| Unrealized Depreciation † | | | (7,122 | ) |
| Total Accumulated Deficit | | $ | (60,447 | ) |
| | * | The Fund has capital loss carryforwards that are identified in the Capital Loss Carryforward note that follows. |
| | † | The differences between book-basis and tax-basis unrealized appreciation (depreciation) may be attributable to the losses deferred due to wash sale adjustments, foreign currency gains and losses, adjustments related to PFICs, REITs, RICs, certain derivatives and partnerships. |
| | d) | Reclassification of Capital Accounts – The Fund may record reclassifications in its capital accounts. These reclassifications have no impact on the total net assets of the Fund. The reclassifications are a result of permanent differences between U.S. GAAP and tax accounting for such items as foreign currency, PFICs, expiration or utilization of capital loss carryforwards or net operating losses. Adjustments are made to reflect the impact these items have on current and future distributions to shareholders. Therefore, the source of the Fund’s distributions may be shown in the accompanying Statement of Changes in Net Assets as from accumulated undistributed net investment income, from accumulated net realized gains on investments or from capital depending on the type of book and tax differences that exist. For the year ended October 31, 2011, the Fund recorded reclassifications to increase (decrease) the accounts listed below: |
| | | Amount | |
| Accumulated Undistributed Net Investment Income | | $ | 28 | |
| Accumulated Net Realized Gain (Loss) on Investments and Foreign Currency Transactions | | | (29 | ) |
| Capital Stock and Paid-In-Capital | | | 1 | |
| | e) | Capital Loss Carryforward – At October 31, 2011 (tax-year-end), the Fund had capital loss carryforwards for U.S. federal income tax purposes of approximately: |
Year of Expiration | | Amount | |
| 2016 | | $ | 19,304 | |
| 2017 | | | 35,126 | |
| Total | | $ | 54,430 | |
As of October 31, 2011, the Fund utilized $16,517 of prior year capital loss carryforwards.
| | f) | Accounting for Uncertainty in Income Taxes – The Fund has adopted financial reporting rules that require the Fund to analyze all open tax years, as defined by the statute of limitations, for all major jurisdictions. Generally, tax authorities can examine all tax returns filed for the last three years. The Fund does not have an examination in progress. |
The Fund has reviewed all open tax years and major jurisdictions and concluded that these financial reporting rules had no effect on the Fund’s financial position or results of operations. There is no tax liability resulting from unrecognized tax benefits relating to uncertain income tax positions taken or expected to be taken on the tax return for the fiscal year ended October 31, 2011. The Fund is also not aware of any tax positions for which it is reasonably possible that the total amounts of unrecognized tax benefits will significantly change in the next twelve months.
| | a) | Investment Management Agreement – Hartford Investment Financial Services, LLC (“HIFSCO”), a wholly-owned indirect subsidiary of The Hartford Financial Services Group, Inc. (“The Hartford”), serves as investment manager to the Fund pursuant to an Investment Management Agreement with the Company. As investment manager, HIFSCO has overall investment supervisory responsibility for the Fund. In addition, HIFSCO provides administrative personnel, services, equipment, facilities and office space for proper operation of the Fund. HIFSCO has contracted with Wellington Management Company, LLP (“Wellington Management”) under a sub-advisory agreement for the provision of day-to-day investment management services to the Fund in accordance with the Fund’s investment objective and policies. The Fund pays a fee to HIFSCO, a portion of which may be used to compensate Wellington Management. |
The schedule below reflects the rates of compensation paid to HIFSCO for investment management services rendered as of October 31, 2011; the rates are accrued daily and paid monthly:
| Average Daily Net Assets | | Annual Fee | |
| On first $100 million | | | 0.8000 | % |
| On next $150 million | | | 0.7500 | % |
| On next $4.75 billion | | | 0.7000 | % |
| On next $5 billion | | | 0.6975 | % |
| Over $10 billion | | | 0.6950 | % |
| | b) | Accounting Services Agreement – Pursuant to the Fund Accounting Agreement between Hartford Life Insurance Company (“HLIC”) and the Company, on behalf of the Fund, HLIC provides accounting services to the Fund and receives monthly compensation based on the Fund’s average net assets at the rates set forth below. The Fund’s accounting services fees are accrued daily and paid monthly. |
| Average Daily Net Assets | | Annual Fee | |
| On first $5 billion | | | 0.014 | % |
| On next $5 billion | | | 0.012 | % |
| Over $10 billion | | | 0.010 | % |
| | c) | Operating Expenses – Allocable expenses incurred by the Company are allocated to each Fund and allocated to classes within the Fund in proportion to the average daily net assets of the Fund and each class, except where allocation of certain expenses is more fairly made directly to the Fund or to specific classes within a Fund. As of October 31, 2011, HIFSCO contractually limited the total operating expenses of this Fund, exclusive of taxes, interest expense, brokerage commissions, acquired fund fees and expenses and extraordinary expenses as follows: |
| Class A | | | Class B | | | Class C | | | Class I | | | Class R3 | | | Class R4 | | | Class R5 | | | Class Y | |
| | 1.35 | % | | | 2.10 | % | | | 2.10 | % | | | 1.10 | % | | | 1.55 | % | | | 1.25 | % | | | 0.95 | % | | | 0.90 | % |
The Hartford Value Opportunities Fund |
| Notes to Financial Statements – (continued) |
| October 31, 2011 |
|
| | d) | Fees Paid Indirectly – The Fund has entered into agreements with State Street Global Markets, LLC and Russell Implementation Services Inc. to partially recapture non-discounted trade commissions. Such rebates are used to pay a portion of the Fund’s expenses. In addition, the Fund’s custodian bank, State Street Bank and Trust Co., has also agreed to reduce its fees when the Fund maintains cash on deposit in a non-interest-bearing custody account. For the year ended October 31, 2011, these amounts are included in the Statement of Operations. |
The ratio of expenses to average net assets in the accompanying financial highlights excludes the reduction in expenses related to fees paid indirectly. The annualized expense ratio for the period listed below including the fees paid indirectly is as follows:
| | | Year Ended October 31, 2011 | |
| Class A Shares | | | 1.35 | % |
| Class B Shares | | | 2.10 | |
| Class C Shares | | | 2.10 | |
| Class I Shares | | | 1.01 | |
| Class R3 Shares | | | 1.55 | |
| Class R4 Shares | | | 1.25 | |
| Class R5 Shares | | | 0.95 | |
| Class Y Shares | | | 0.90 | |
| | e) | Distribution and Service Plan for Class A, B, C, R3 and R4 Shares – HIFSCO is the principal underwriter and distributor of the Fund. HIFSCO is engaged in distribution activities, which include marketing and distribution of shares through broker-dealers, financing distribution costs and maintaining financial books and records. For the year ended October 31, 2011, HIFSCO received front-end load sales charges of $278 and contingent deferred sales charges of $13 from the Fund. |
The Fund has adopted a Distribution and Service Plan in accordance with Rule 12b-1 of the 1940 Act to compensate the distributor (HIFSCO) for activities intended to result in the sale and distribution of Class A, B, C, R3 and R4 shares and for providing services for shareholders. During its May 3, 2011 meeting, the Board of Directors approved an amendment to the Fund’s Class A Plan to, effective August 1, 2011, lower the amount of Rule 12b-1 distribution fees that may be charged in respect of Class A shares of the Fund from an annual rate of 0.35% of the Fund’s average daily net assets attributable to Class A shares to 0.25%. The Board of Directors has authorized Rule 12b-1 payments of up to 0.25% of the Fund’s average daily net assets attributable to Class A shares. As a result, the amendment to the Class A Plan did not affect the fees charged under the plan. Some or all of the fee may be used for shareholder servicing expenses with the remainder used for distribution expenses. Some or the entire Rule 12b-1 fee for Class B shares may be remitted to broker-dealers for distribution and/or shareholder account services. Under the Class B Plan, the Fund pays the distributor 1.00% of the average daily net assets of Class B shares that are outstanding for 8 years or less, 0.25% of which is a fee for services provided to existing shareholders with the remainder used for distribution expenses. After eight years, Class B shares convert to Class A shares. Upon conversion to Class A shares, the Class A plan described above will apply to those shares. Under the Class C Plan, the Fund pays the distributor 1.00% of the average daily net assets of Class C shares outstanding, 0.25% of which is intended as a fee for services provided to existing shareholders with the remainder used for distribution expenses. For Class C shares, some or the entire fee may be remitted to broker-dealers for distribution and/or shareholder account services. Class R3 shares have a distribution fee of 0.50% and Class R4 shares have a distribution fee of 0.25%. For Class R3 and R4 shares, some or the entire fee may be remitted to broker dealers for distribution and/or shareholder account services. The Fund’s 12b-1 fees are accrued daily and paid monthly.
For the year ended October 31, 2011, total sales commissions paid to affiliated brokers/dealers of The Hartford for distributing the Fund's shares were $15. These commissions are in turn paid to sales representatives of the broker/dealers.
| | f) | Other Related Party Transactions – Certain officers of the Fund are directors and/or officers of HIFSCO and/or The Hartford or its subsidiaries. For the year ended October 31, 2011, a portion of the Fund’s chief compliance officer’s compensation was paid by all of the investment companies in the Hartford fund complex. The portion allocated to the Fund rounds to zero. Hartford Administrative Services Company (“HASCO”), an indirect wholly-owned subsidiary of The Hartford, provides transfer agent services to the Fund. HASCO has contractually agreed to reimburse any portion of the transfer agency fees over 0.30% of average daily net assets per fiscal year for each class. HASCO was compensated on a per account basis, which varies by share class, for providing such services. The amount to HASCO and any related contractual reimbursement amounts, if applicable, can be found in the Statement of Operations. These fees are accrued daily and paid monthly. |
Administrative services fees are paid to HASCO for third-party recordkeeping services that are payable as a percentage of net assets in the amount of 0.20%, 0.15% and 0.10% for Classes R3, R4 and R5 shares, respectively. The total administrative services fees are shown on the Statement of Operations. These fees are accrued daily and paid monthly.
| | g) | Payment from Affiliate – On November 8, 2006, the SEC issued an order setting forth the terms of a settlement reached with three subsidiaries of The Hartford that resolved the SEC’s Division of Enforcement’s investigation of aspects of The Hartford’s variable annuity and mutual fund operations related to directed brokerage and revenue sharing. The Hartford settled this matter without admitting or denying the findings of the SEC. |
The total return in the accompanying financial highlights includes a payment from affiliate. Had the payment from affiliate been excluded, the impact and total return for the periods listed below would have been as follows:
| | | Impact from Payment from Affiliate for SEC Settlement for the Year Ended October 31, 2007 | | | Total Return Excluding Payment from Affiliate for the Year Ended October 31, 2007 | |
| Class A | | | 0.01 | % | | | 9.72 | % |
| Class B | | | 0.01 | | | | 8.89 | |
| Class C | | | 0.01 | | | | 8.90 | |
| Class I | | | 0.01 | | | | 10.07 | |
| Class Y | | | 0.01 | | | | 10.29 | |
As of October 31, 2011, affiliates of The Hartford had ownership of shares in the Fund as follows:
| 9. | Investment Transactions: |
For the year ended October 31, 2011, the Fund's aggregate purchases and sales of investment securities (excluding short-term investments) were as follows:
| | | Amount | |
| Cost of Purchases Excluding U.S. Government Obligations | | $ | 105,446 | |
| Sales Proceeds Excluding U.S. Government Obligations | | | 111,262 | |
The Hartford Value Opportunities Fund |
| Notes to Financial Statements – (continued) |
| October 31, 2011 |
|
| 10. | Capital Share Transactions: |
The following information is for the year ended October 31, 2011, and the year ended October 31, 2010:
| | | For the Year Ended October 31, 2011 | | | For the Year Ended October 31, 2010 | |
| | | | | | Shares Issued for Reinvested Dividends | | | | | | | | | Net Increase (Decrease) of Shares | | | | | | Shares Issued for Reinvested Dividends | | | | | | | | | Net Increase (Decrease) of Shares | |
| Class A | | | | | | | | | | | | | | | | | | | | | | | | | | | | | | |
| Shares | | | 1,147 | | | | 2 | | | | (1,732 | ) | | | 1,691 | | | | 1,108 | | | | 1,140 | | | | 28 | | | | (2,086 | ) | | | — | | | | (918 | ) |
| Amount | | $ | 15,350 | | | $ | 31 | | | $ | (22,680 | ) | | $ | 23,417 | | | $ | 16,118 | | | $ | 13,157 | | | $ | 315 | | | $ | (23,685 | ) | | $ | — | | | $ | (10,213 | ) |
| Class B | | | | | | | | | | | | | | | | | | | | | | | | | | | | | | | | | | | | | | | | |
| Shares | | | 29 | | | | — | | | | (160 | ) | | | — | | | | (131 | ) | | | 24 | | | | — | | | | (236 | ) | | | — | | | | (212 | ) |
| Amount | | $ | 346 | | | $ | — | | | $ | (1,888 | ) | | $ | — | | | $ | (1,542 | ) | | $ | 252 | | | $ | 7 | | | $ | (2,456 | ) | | $ | — | | | $ | (2,197 | ) |
| Class C | | | | | | | | | | | | | | | | | | | | | | | | | | | | | | | | | | | | | | | | |
| Shares | | | 166 | | | | — | | | | (265 | ) | | | — | | | | (99 | ) | | | 169 | | | | — | | | | (271 | ) | | | — | | | | (102 | ) |
| Amount | | $ | 1,939 | | | $ | — | | | $ | (3,099 | ) | | $ | — | | | $ | (1,160 | ) | | $ | 1,740 | | | $ | — | | | $ | (2,786 | ) | | $ | — | | | $ | (1,046 | ) |
| Class I | | | | | | | | | | | | | | | | | | | | | | | | | | | | | | | | | | | | | | | | |
| Shares | | | 229 | | | | — | | | | (151 | ) | | | — | | | | 78 | | | | 57 | | | | 1 | | | | (74 | ) | | | — | | | | (16 | ) |
| Amount | | $ | 3,138 | | | $ | 5 | | | $ | (1,981 | ) | | $ | — | | | $ | 1,162 | | | $ | 654 | | | $ | 7 | | | $ | (817 | ) | | $ | — | | | $ | (156 | ) |
| Class L | | | | | | | | | | | | | | | | | | | | | | | | | | | | | | | | | | | | | | | | |
| Shares | | | 33 | | | | 4 | | | | (185 | ) | | | (1,689 | ) | | | (1,837 | ) | | | 49 | | | | 9 | | | | (292 | ) | | | — | | | | (234 | ) |
| Amount | | $ | 452 | | | $ | 55 | | | $ | (2,522 | ) | | $ | (23,417 | ) | | $ | (25,432 | ) | | $ | 561 | | | $ | 107 | | | $ | (3,345 | ) | | $ | — | | | $ | (2,677 | ) |
| Class R3 | | | | | | | | | | | | | | | | | | | | | | | | | | | | | | | | | | | | | | | | |
| Shares | | | 35 | | | | — | | | | (45 | ) | | | — | | | | (10 | ) | | | 68 | | | | — | | | | (61 | ) | | | — | | | | 7 | |
| Amount | | $ | 475 | | | $ | — | | | $ | (618 | ) | | $ | — | | | $ | (143 | ) | | $ | 803 | | | $ | 1 | | | $ | (715 | ) | | $ | — | | | $ | 89 | |
| Class R4 | | | | | | | | | | | | | | | | | | | | | | | | | | | | | | | | | | | | | | | | |
| Shares | | | 129 | | | | 1 | | | | (92 | ) | | | — | | | | 38 | | | | 149 | | | | 2 | | | | (77 | ) | | | — | | | | 74 | |
| Amount | | $ | 1,781 | | | $ | 10 | | | $ | (1,241 | ) | | $ | — | | | $ | 550 | | | $ | 1,768 | | | $ | 17 | | | $ | (888 | ) | | $ | — | | | $ | 897 | |
| Class R5 | | | | | | | | | | | | | | | | | | | | | | | | | | | | | | | | | | | | | | | | |
| Shares | | | 5 | | | | — | | | | — | | | | — | | | | 5 | | | | 11 | | | | — | | | | — | | | | — | | | | 11 | |
| Amount | | $ | 64 | | | $ | 1 | | | $ | (2 | ) | | $ | — | | | $ | 63 | | | $ | 132 | | | $ | — | | | $ | (1 | ) | | $ | — | | | $ | 131 | |
| Class Y | | | | | | | | | | | | | | | | | | | | | | | | | | | | | | | | | | | | | | | | |
| Shares | | | 745 | | | | 10 | | | | (460 | ) | | | — | | | | 295 | | | | 2,263 | | | | 5 | | | | (629 | ) | | | — | | | | 1,639 | |
| Amount | | $ | 10,034 | | | $ | 137 | | | $ | (6,292 | ) | | $ | — | | | $ | 3,879 | | | $ | 27,066 | | | $ | 62 | | | $ | (7,377 | ) | | $ | — | | | $ | 19,751 | |
| Total | | | | | | | | | | | | | | | | | | | | | | | | | | | | | | | | | | | | | | | | |
| Shares | | | 2,518 | | | | 17 | | | | (3,090 | ) | | | 2 | | | | (553 | ) | | | 3,930 | | | | 45 | | | | (3,726 | ) | | | — | | | | 249 | |
| Amount | | $ | 33,579 | | | $ | 239 | | | $ | (40,323 | ) | | $ | — | | | $ | (6,505 | ) | | $ | 46,133 | | | $ | 516 | | | $ | (42,070 | ) | | $ | — | | | $ | 4,579 | |
The following reflects the conversion of Class B shares into Class A shares (reflected as Class A shares sold) for the year ended October 31, 2011, and the year ended October 31, 2010:
| | | Shares | | | Dollars | |
| For the Year Ended October 31, 2011 | | | 37 | | | $ | 482 | |
| For the Year Ended October 31, 2010 | | | 43 | | | $ | 502 | |
The Fund is one of several Hartford funds that participate in a $500 million committed revolving line of credit facility. The facility is to be used for temporary or emergency purposes. Under the arrangement, the funds are required to own securities having a market value in excess of 300% of the total bank borrowings. The interest rate on borrowings varies depending on the nature of the loan. The facility also requires a fee to be paid based on the amount of the commitment. This commitment fee is allocated to all of the funds participating in the line of credit based on the average net assets of the funds. During the year ended October 31, 2011, the Fund did not have any borrowings under this facility.
At its May 3, 2011, meeting, the Board of Directors of The Hartford Mutual Funds II, Inc. approved the reclassification of Class L shares into Class A shares of the Fund.
Effective with the close of business on August 5, 2011, Class L was merged into Class A. The merger was accomplished by a tax-free exchange as detailed below:
| | | Class A | | | Class L | |
| Shares exchanged | | | N/A | | | | 1,689 | |
| Shares issued - to Class L shareholders | | | 1,691 | | | | N/A | |
| Net assets immediately before merger | | $ | 65,527 | | | $ | 20,811 | |
| Net assets immediately after merger | | $ | 86,338 | | | | N/A | |
| 13. | Industry Classifications: |
Other than the industry classifications “Other Investment Pools and Funds” and “Exchange Traded Funds,” equity industry classifications used in this report are the Global Industry Classification Standard, which was developed by and is the exclusive property and service mark of MSCI, Inc. and Standard & Poor’s.
| 14. | Pending Legal Proceedings: |
On February 25, 2011, Jennifer L. Kasilag, Louis Mellinger, Judith M. Menendez, Jacqueline M. Robinson, and Linda A. Russell filed a derivative lawsuit against HIFSCO on behalf of six funds: The Hartford Global Health Fund (now known as The Hartford Healthcare Fund), The Hartford Conservative Allocation Fund, The Hartford Growth Opportunities Fund, The Hartford Inflation Plus Fund, The Hartford Advisers Fund and The Hartford Money Market Fund. The lawsuit, which was filed in the United States District Court for the District of New Jersey, seeks recovery under Section 36(b) of the 1940 Act for the alleged overpayment of investment management and 12b-1 distribution fees to HIFSCO. The plaintiffs seek recovery of the alleged overpayments or, alternatively, rescission of the contracts and restitution of all fees paid, together with lost earnings. On November 14, 2011, the plaintiffs filed an amended complaint, which dropped The Hartford Money Market Fund and added The Hartford Capital Appreciation Fund as a plaintiff. The Hartford intends to vigorously defend the action.
No accrual for litigation relating to this matter has been recorded in the financial statements of the Fund because the Fund is not party to the suit.
Under the Company’s organizational documents, the Company shall indemnify its officers and directors to the full extent required or permitted under Maryland General Corporation Law and the federal securities laws. In addition, the Company, on behalf of the Fund, may enter into contracts that contain a variety of indemnifications. The Company’s maximum exposure under these arrangements is unknown. However, as of the date of these financial statements, the Company has not had prior claims or losses pursuant to these contracts and expects the risk of loss to be remote.
|
| Financial Highlights |
| - Selected Per-Share Data (A) - |
| | Net Asset Value at Beginning of Period | | | Net Investment Income (Loss) | | | Payments from (to) Affiliate | | | Net Realized and Unrealized Gain (Loss) on Investments | | | Total from Investment Operations | | | Dividends from Net Investment Income | | | Distributions from Realized Capital Gains | | | Distributions from Capital | | | | | | Net Increase (Decrease) in Net Asset Value | | | Net Asset Value at End of Period | |
| | |
| For the Year Ended October 31, 2011 | |
| A(E) | | $ | 12.15 | | | $ | 0.09 | | | $ | – | | | $ | 0.45 | | | $ | 0.54 | | | $ | (0.01 | ) | | $ | – | | | $ | – | | | $ | (0.01 | ) | | $ | 0.53 | | | $ | 12.68 | |
| B | | | 10.94 | | | | (0.02 | ) | | | – | | | | 0.41 | | | | 0.39 | | | | – | | | | – | | | | – | | | | – | | | | 0.39 | | | | 11.33 | |
| C | | | 10.91 | | | | (0.01 | ) | | | – | | | | 0.41 | | | | 0.40 | | | | – | | | | – | | | | – | | | | – | | | | 0.40 | | | | 11.31 | |
| I | | | 12.04 | | | | 0.14 | | | | – | | | | 0.44 | | | | 0.58 | | | | (0.05 | ) | | | – | | | | – | | | | (0.05 | ) | | | 0.53 | | | | 12.57 | |
| R3 | | | 12.30 | | | | 0.07 | | | | – | | | | 0.44 | | | | 0.51 | | | | – | | | | – | | | | – | | | | – | | | | 0.51 | | | | 12.81 | |
| R4 | | | 12.37 | �� | | | 0.10 | | | | – | | | | 0.45 | | | | 0.55 | | | | (0.02 | ) | | | – | | | | – | | | | (0.02 | ) | | | 0.53 | | | | 12.90 | |
| R5 | | | 12.45 | | | | 0.13 | | | | – | | | | 0.47 | | | | 0.60 | | | | (0.06 | ) | | | – | | | | – | | | | (0.06 | ) | | | 0.54 | | | | 12.99 | |
| Y | | | 12.51 | | | | 0.14 | | | | – | | | | 0.47 | | | | 0.61 | | | | (0.07 | ) | | | – | | | | – | | | | (0.07 | ) | | | 0.54 | | | | 13.05 | |
| | |
| For the Year Ended October 31, 2010 (F) | |
| A | | | 10.19 | | | | 0.04 | | | | – | | | | 1.97 | | | | 2.01 | | | | (0.05 | ) | | | – | | | | – | | | | (0.05 | ) | | | 1.96 | | | | 12.15 | |
| B | | | 9.21 | | | | (0.04 | ) | | | – | | | | 1.78 | | | | 1.74 | | | | (0.01 | ) | | | – | | | | – | | | | (0.01 | ) | | | 1.73 | | | | 10.94 | |
| C | | | 9.18 | | | | (0.04 | ) | | | – | | | | 1.77 | | | | 1.73 | | | | – | | | | – | | | | – | | | | – | | | | 1.73 | | | | 10.91 | |
| I | | | 10.09 | | | | 0.07 | | | | – | | | | 1.94 | | | | 2.01 | | | | (0.06 | ) | | | – | | | | – | | | | (0.06 | ) | | | 1.95 | | | | 12.04 | |
| R3 | | | 10.30 | | | | 0.01 | | | | – | | | | 2.00 | | | | 2.01 | | | | (0.01 | ) | | | – | | | | – | | | | (0.01 | ) | | | 2.00 | | | | 12.30 | |
| R4 | | | 10.37 | | | | 0.05 | | | | – | | | | 2.00 | | | | 2.05 | | | | (0.05 | ) | | | – | | | | – | | | | (0.05 | ) | | | 2.00 | | | | 12.37 | |
| R5 | | | 10.43 | | | | 0.07 | | | | – | | | | 2.03 | | | | 2.10 | | | | (0.08 | ) | | | – | | | | – | | | | (0.08 | ) | | | 2.02 | | | | 12.45 | |
| Y | | | 10.47 | | | | 0.08 | | | | – | | | | 2.04 | | | | 2.12 | | | | (0.08 | ) | | | – | | | | – | | | | (0.08 | ) | | | 2.04 | | | | 12.51 | |
| | |
| For the Year Ended October 31, 2009 (F) | |
| A | | | 8.22 | | | | 0.06 | | | | – | | | | 2.06 | | | | 2.12 | | | | (0.15 | ) | | | – | | | | – | | | | (0.15 | ) | | | 1.97 | | | | 10.19 | |
| B | | | 7.42 | | | | 0.02 | | | | – | | | | 1.87 | | | | 1.89 | | | | (0.10 | ) | | | – | | | | – | | | | (0.10 | ) | | | 1.79 | | | | 9.21 | |
| C | | | 7.38 | | | | (0.01 | ) | | | – | | | | 1.86 | | | | 1.85 | | | | (0.05 | ) | | | – | | | | – | | | | (0.05 | ) | | | 1.80 | | | | 9.18 | |
| I | | | 8.15 | | | | 0.06 | | | | – | | | | 2.05 | | | | 2.11 | | | | (0.17 | ) | | | – | | | | – | | | | (0.17 | ) | | | 1.94 | | | | 10.09 | |
| R3 | | | 8.33 | | | | 0.02 | | | | – | | | | 2.09 | | | | 2.11 | | | | (0.14 | ) | | | – | | | | – | | | | (0.14 | ) | | | 1.97 | | | | 10.30 | |
| R4 | | | 8.39 | | | | 0.04 | | | | – | | | | 2.11 | | | | 2.15 | | | | (0.17 | ) | | | – | | | | – | | | | (0.17 | ) | | | 1.98 | | | | 10.37 | |
| R5 | | | 8.44 | | | | 0.07 | | | | – | | | | 2.12 | | | | 2.19 | | | | (0.20 | ) | | | – | | | | – | | | | (0.20 | ) | | | 1.99 | | | | 10.43 | |
| Y | | | 8.48 | | | | 0.11 | | | | – | | | | 2.08 | | | | 2.19 | | | | (0.20 | ) | | | – | | | | – | | | | (0.20 | ) | | | 1.99 | | | | 10.47 | |
| | |
| For the Year Ended October 31, 2008 | |
| A | | | 18.24 | | | | 0.09 | | | | – | | | | (7.48 | ) | | | (7.39 | ) | | | (0.04 | ) | | | (2.59 | ) | | | – | | | | (2.63 | ) | | | (10.02 | ) | | | 8.22 | |
| B | | | 16.75 | | | | – | | | | – | | | | (6.74 | ) | | | (6.74 | ) | | | – | | | | (2.59 | ) | | | – | | | | (2.59 | ) | | | (9.33 | ) | | | 7.42 | |
| C | | | 16.71 | | | | (0.03 | ) | | | – | | | | (6.71 | ) | | | (6.74 | ) | | | – | | | | (2.59 | ) | | | – | | | | (2.59 | ) | | | (9.33 | ) | | | 7.38 | |
| I | | | 18.13 | | | | 0.07 | | | | – | | | | (7.37 | ) | | | (7.30 | ) | | | (0.09 | ) | | | (2.59 | ) | | | – | | | | (2.68 | ) | | | (9.98 | ) | | | 8.15 | |
| R3 | | | 18.56 | | | | 0.10 | | | | – | | | | (7.64 | ) | | | (7.54 | ) | | | (0.10 | ) | | | (2.59 | ) | | | – | | | | (2.69 | ) | | | (10.23 | ) | | | 8.33 | |
| R4 | | | 18.61 | | | | 0.12 | | | | – | | | | (7.66 | ) | | | (7.54 | ) | | | (0.09 | ) | | | (2.59 | ) | | | – | | | | (2.68 | ) | | | (10.22 | ) | | | 8.39 | |
| R5 | | | 18.66 | | | | 0.10 | | | | – | | | | (7.64 | ) | | | (7.54 | ) | | | (0.09 | ) | | | (2.59 | ) | | | – | | | | (2.68 | ) | | | (10.22 | ) | | | 8.44 | |
| Y | | | 18.73 | | | | 0.12 | | | | – | | | | (7.67 | ) | | | (7.55 | ) | | | (0.11 | ) | | | (2.59 | ) | | | – | | | | (2.70 | ) | | | (10.25 | ) | | | 8.48 | |
| | |
| For the Year Ended October 31, 2007 | |
| A | | | 18.26 | | | | 0.08 | | | | – | | | | 1.56 | | | | 1.64 | | | | (0.14 | ) | | | (1.52 | ) | | | – | | | | (1.66 | ) | | | (0.02 | ) | | | 18.24 | |
| B | | | 16.92 | | | | (0.04 | ) | | | – | | | | 1.43 | | | | 1.39 | | | | (0.04 | ) | | | (1.52 | ) | | | – | | | | (1.56 | ) | | | (0.17 | ) | | | 16.75 | |
| C | | | 16.92 | | | | (0.01 | ) | | | – | | | | 1.40 | | | | 1.39 | | | | (0.08 | ) | | | (1.52 | ) | | | – | | | | (1.60 | ) | | | (0.21 | ) | | | 16.71 | |
| I | | | 18.27 | | | | 0.34 | | | | – | | | | 1.36 | | | | 1.70 | | | | (0.32 | ) | | | (1.52 | ) | | | – | | | | (1.84 | ) | | | (0.14 | ) | | | 18.13 | |
| R3(H) | | | 17.74 | | | | – | | | | – | | | | 0.82 | | | | 0.82 | | | | – | | | | – | | | | – | | | | – | | | | 0.82 | | | | 18.56 | |
| R4(H) | | | 17.74 | | | | – | | | | – | | | | 0.87 | | | | 0.87 | | | | – | | | | – | | | | – | | | | – | | | | 0.87 | | | | 18.61 | |
| R5(H) | | | 17.74 | | | | 0.12 | | | | – | | | | 0.80 | | | | 0.92 | | | | – | | | | – | | | | – | | | | – | | | | 0.92 | | | | 18.66 | |
| Y | | | 18.48 | | | | 0.51 | | | | – | | | | 1.26 | | | | 1.77 | | | | – | | | | (1.52 | ) | | | – | | | | (1.52 | ) | | | 0.25 | | | | 18.73 | |
| (A) | Information presented relates to a share outstanding throughout the indicated period. |
| (B) | Assumes initial investment at net asset value at the beginning of each period, reinvestment of all distributions, the complete redemption of the investment at net asset value at the end of each period and no sales charge. Total return would be reduced if sales charges were taken into account. |
| (C) | Ratios do not include fees paid indirectly (See Expenses in the accompanying Notes to Financial Statements). |
| (D) | Portfolio turnover rate is calculated on the basis of the Fund as a whole without distinguishing between the classes of shares issued. |
| (E) | Class L was merged into Class A on August 5, 2011 (See Class Merger in accompanying Notes to Financial Statements). |
| (F) | Per share amounts have been calculated using average shares outstanding method. |
| (G) | Total return without the inclusion of the Payments from (to) Affiliate, can be found in Expenses in the accompanying Notes to Financial Statements. |
| (H) | Commenced operations on December 22, 2006. |
| - Ratios and Supplemental Data - |
| | | Net Assets at End of Period (000's) | | | Ratio of Expenses to Average Net Assets Before Waivers and Reimbursements and Including Expenses not Subject to Cap(C) | | | Ratio of Expenses to Average Net Assets After Waivers and Reimbursements and Including Expenses not Subject to Cap(C) | | | Ratio of Expenses to Average Net Assets After Waivers and Reimbursements and Excluding Expenses not Subject to Cap(C) | | | Ratio of Net Investment Income (Loss) to Average Net Assets | | | Portfolio Turnover Rate(D) | |
| | | | | | | | | | | | | | | | | | | | | | | | | | | |
| | 4.41 | % | | $ | 86,456 | | | | 1.46 | % | | | 1.35 | % | | | 1.35 | % | | | 0.81 | % | | | 70 | % |
| | 3.56 | | | | 5,838 | | | | 2.39 | | | | 2.10 | | | | 2.10 | | | | (0.10 | ) | | | – | |
| | 3.67 | | | | 10,227 | | | | 2.15 | | | | 2.10 | | | | 2.10 | | | | (0.09 | ) | | | – | |
| | 4.80 | | | | 2,535 | | | | 1.03 | | | | 1.01 | | | | 1.01 | | | | 1.06 | | | | – | |
| | 4.15 | | | | 934 | | | | 1.68 | | | | 1.55 | | | | 1.55 | | | | 0.45 | | | | – | |
| | 4.47 | | | | 5,865 | | | | 1.31 | | | | 1.25 | | | | 1.25 | | | | 0.75 | | | | – | |
| | 4.81 | | | | 221 | | | | 1.05 | | | | 0.95 | | | | 0.95 | | | | 1.04 | | | | – | |
| | 4.82 | | | | 34,210 | | | | 0.91 | | | | 0.90 | | | | 0.90 | | | | 1.08 | | | | – | |
| | |
| | |
| | 19.78 | | | | 69,397 | | | | 1.46 | | | | 1.35 | | | | 1.35 | | | | 0.34 | | | | 87 | |
| | 18.89 | | | | 7,069 | | | | 2.42 | | | | 2.10 | | | | 2.10 | | | | (0.40 | ) | | | – | |
| | 18.85 | | | | 10,954 | | | | 2.18 | | | | 2.10 | | | | 2.10 | | | | (0.41 | ) | | | – | |
| | 20.00 | | | | 1,494 | | | | 1.05 | | | | 1.05 | | | | 1.05 | | | | 0.64 | | | | – | |
| | 19.56 | | | | 1,021 | | | | 1.67 | | | | 1.58 | | | | 1.58 | | | | 0.10 | | | | – | |
| | 19.79 | | | | 5,147 | | | | 1.31 | | | | 1.28 | | | | 1.28 | | | | 0.39 | | | | – | |
| | 20.17 | | | | 154 | | | | 1.07 | | | | 0.98 | | | | 0.98 | | | | 0.65 | | | | – | |
| | 20.28 | | | | 29,098 | | | | 0.91 | | | | 0.91 | | | | 0.91 | | | | 0.73 | | | | – | |
| | |
| | |
| | 26.41 | | | | 67,577 | | | | 1.66 | | | | 1.20 | | | | 1.20 | | | | 0.67 | | | | 90 | |
| | 25.90 | | | | 7,903 | | | | 2.74 | | | | 1.63 | | | | 1.63 | | | | 0.26 | | | | – | |
| | 25.33 | | | | 10,158 | | | | 2.39 | | | | 1.98 | | | | 1.98 | | | | (0.07 | ) | | | – | |
| | 26.68 | | | | 1,416 | | | | 1.17 | | | | 1.10 | | | | 1.10 | | | | 0.71 | | | | – | |
| | 25.97 | | | | 784 | | | | 1.78 | | | | 1.60 | | | | 1.60 | | | | 0.28 | | | | – | |
| | 26.38 | | | | 3,551 | | | | 1.36 | | | | 1.30 | | | | 1.30 | | | | 0.50 | | | | – | |
| | 26.77 | | | | 12 | | | | 1.12 | | | | 1.00 | | | | 1.00 | | | | 0.77 | | | | – | |
| | 26.76 | | | | 7,195 | | | | 0.96 | | | | 0.96 | | | | 0.96 | | | | 1.20 | | | | – | |
| | |
| | |
| | (46.75 | ) | | | 59,576 | | | | 1.50 | | | | 1.40 | | | | 1.40 | | | | 0.62 | | | | 65 | |
| | (46.99 | ) | | | 7,613 | | | | 2.47 | | | | 1.95 | | | | 1.95 | | | | 0.08 | | | | – | |
| | (47.13 | ) | | | 11,167 | | | | 2.21 | | | | 2.15 | | | | 2.15 | | | | (0.12 | ) | | | – | |
| | (46.63 | ) | | | 1,139 | | | | 1.22 | | | | 1.15 | | | | 1.15 | | | | 0.99 | | | | – | |
| | (46.93 | ) | | | 657 | | | | 1.72 | | | | 1.65 | | | | 1.65 | | | | 0.30 | | | | – | |
| | (46.73 | ) | | | 1,877 | | | | 1.37 | | | | 1.35 | | | | 1.35 | | | | 0.66 | | | | – | |
| | (46.57 | ) | | | 6 | | | | 1.07 | | | | 1.05 | | | | 1.05 | | | | 0.96 | | | | – | |
| | (46.52 | ) | | | 18,603 | | | | 0.97 | | | | 0.97 | | | | 0.97 | | | | 1.01 | | | | – | |
| | |
| | |
| | 9.73 | (G) | | | 157,671 | | | | 1.48 | | | | 1.40 | | | | 1.40 | | | | 0.48 | | | | 77 | |
| | 8.90 | (G) | | | 20,792 | | | | 2.38 | | | | 2.13 | | | | 2.13 | | | | (0.25 | ) | | | – | |
| | 8.91 | (G) | | | 32,738 | | | | 2.19 | | | | 2.15 | | | | 2.15 | | | | (0.28 | ) | | | – | |
| | 10.08 | (G) | | | 4,659 | | | | 1.22 | | | | 1.15 | | | | 1.15 | | | | 0.61 | | | | – | |
| | 4.62 | (I) | | | 124 | | | | 1.78 | (J) | | | 1.65 | (J) | | | 1.65 | (J) | | | 0.03 | (J) | | | – | |
| | 4.90 | (I) | | | 732 | | | | 1.40 | (J) | | | 1.35 | (J) | | | 1.35 | (J) | | | (0.01 | ) (J) | | | – | |
| | 5.19 | (I) | | | 11 | | | | 1.17 | (J) | | | 1.05 | (J) | | | 1.05 | (J) | | | 0.75 | (J) | | | – | |
| | 10.30 | (G) | | | 26,645 | | | | 0.94 | | | | 0.94 | | | | 0.94 | | | | 1.19 | | | | – | |
|
| The Board of Directors and Shareholders of |
The Hartford Mutual Funds II, Inc. |
We have audited the accompanying statement of assets and liabilities, including the schedule of investments, of The Hartford Value Opportunities Fund (one of the portfolios constituting The Hartford Mutual Funds II, Inc. (the Funds)) as of October 31, 2011, and the related statement of operations for the year then ended, the statements of changes in net assets for each of the two years in the period then ended, and the financial highlights for each of the five years in the period then ended. These financial statements and financial highlights are the responsibility of the Funds’ management. Our responsibility is to express an opinion on these financial statements and financial highlights based on our audits.
We conducted our audits in accordance with the standards of the Public Company Accounting Oversight Board (United States). Those standards require that we plan and perform the audit to obtain reasonable assurance about whether the financial statements and financial highlights are free of material misstatement. We were not engaged to perform an audit of the Funds’ internal control over financial reporting. Our audits included consideration of internal control over financial reporting as a basis for designing audit procedures that are appropriate in the circumstances, but not for the purpose of expressing an opinion on the effectiveness of the Funds’ internal control over financial reporting. Accordingly, we express no such opinion. An audit also includes examining, on a test basis, evidence supporting the amounts and disclosures in the financial statements and financial highlights, assessing the accounting principles used and significant estimates made by management, and evaluating the overall financial statement presentation. Our procedures included confirmation of securities owned as of October 31, 2011, by correspondence with the custodian and brokers or by other appropriate auditing procedures where replies from brokers were not received. We believe that our audits provide a reasonable basis for our opinion.
In our opinion, the financial statements and financial highlights referred to above present fairly, in all material respects, the financial position of The Hartford Value Opportunities Fund of The Hartford Mutual Funds II, Inc. at October 31, 2011, the results of its operations for the year then ended, the changes in its net assets for each of the two years in the period then ended, and the financial highlights for each of the five years in the period then ended, in conformity with U.S. generally accepted accounting principles.
Minneapolis, MN
December 16, 2011
|
Directors and Officers (Unaudited) |
The Board of Directors of the Company appoints officers who are responsible for the day-to-day operations of the Fund and who execute policies formulated by the Directors. Each director serves until his or her death, resignation, or retirement or until the next annual meeting of shareholders is held or until his or her successor is elected and qualifies.
Directors and officers who are employed by or who have a financial interest in The Hartford are considered “interested” persons of the Fund pursuant to the 1940 Act. Each officer and two of the Company’s directors, as noted in the chart below, are “interested” persons of the Fund. Each director serves as a director for The Hartford Mutual Funds, Inc., The Hartford Mutual Funds II, Inc., Hartford Series Fund, Inc., and Hartford HLS Series Fund II, Inc., and as a trustee for The Hartford Alternative Strategies Fund, which, as of October 31, 2011, collectively consist of 91 funds. Correspondence may be sent to directors and officers c/o Hartford Mutual Funds, P.O. Box 2999, Hartford, Connecticut 06104-2999, except that correspondence to Ms. Fagely may be sent to 500 Bielenberg Drive, Woodbury, Minnesota 55125.
The table below sets forth, for each director and officer, his or her name, year of birth, current position with the Company and date first elected or appointed to The Hartford Mutual Funds, Inc. (“MF”) and The Hartford Mutual Funds II, Inc. (“MF2”), principal occupation, and, for directors, other directorships held. The Fund’s statement of additional information contains further information on the directors and is available free of charge by calling 1-888-843-7824 or writing to Hartford Mutual Funds, P.O. Box 64387, St. Paul, MN 55164-0387.
Information on the aggregate remuneration paid to the directors of the Company can be found in the Statement of Operations herein. The Fund pays to The Hartford a portion of the Chief Compliance Officer’s compensation, but does not pay salaries or compensation to any of its other officers or directors who are employed by The Hartford.
Non-Interested Directors
Lynn S. Birdsong (1946) Director since 2003, Co-Chairman of the Investment Committee
Mr. Birdsong is a private investor. Mr. Birdsong currently serves as a Director of the Sovereign High Yield Investment Company (April 2010 to current). Mr. Birdsong currently serves as an Independent Director of Nomura Partners Funds, Inc. (formerly, The Japan Fund) (March 2003 to current). From 2003 to March 2005, Mr. Birdsong was an independent director of the Atlantic Whitehall Funds. From 1979 to 2002, Mr. Birdsong was a managing director of Zurich Scudder Investments, an investment management firm. During his employment with Scudder, Mr. Birdsong was an Interested Director of The Japan Fund. Since 1981, Mr. Birdsong has been a partner in Birdsong Company, an advertising specialty firm.
Robert M. Gavin, Jr. (1940) Director since 2002 (MF) and 1986 (MF2), Chairman of the Board since 2004
Dr. Gavin is an educational consultant. Prior to September 1, 2001, he was President of Cranbrook Education Community and prior to July 1996, he was President of Macalester College, St. Paul, Minnesota.
Duane E. Hill (1945) Director since 2001 (MF) and 2002 (MF2), Chairman of the Nominating Committee
Mr. Hill is Partner of TSG Ventures L.P., a private equity investment company. Mr. Hill is a former partner of TSG Capital Group, a private equity investment firm that served as sponsor and lead investor in leveraged buyouts of middle market companies.
Sandra S. Jaffee (1941) Director since 2005
Ms. Jaffee served as Chairman (2008 to 2009) and Chief Executive Officer of Fortent (formerly Searchspace Group), a leading provider of compliance/regulatory technology to financial institutions from August 2005 to August 2009. From August 2004 to August 2005, Ms. Jaffee served as an Entrepreneur in Residence with Warburg Pincus, a private equity firm. From September 1995 to July 2004, Ms. Jaffee served as Executive Vice President at Citigroup, where she was President and Chief Executive Officer of Citibank’s Global Securities Services (1995 to 2003). Ms. Jaffe currently serves as a member of the Board of Directors of Broadridge Financial Solutions as well as a Trustee of Muhlenberg College.
William P. Johnston (1944) Director since 2005, Chairman of the Compliance Committee
In June 2006, Mr. Johnston was appointed as Senior Advisor to The Carlyle Group, a global private equity investment firm. In August 2007, Mr. Johnston was elected to the Board of Directors of LifeCare Holdings, Inc. In February 2008, Mr. Johnston was elected to the Board of Directors of HCR-ManorCare, Inc. In May 2006, Mr. Johnston was elected to the Supervisory Board of Fresenius Medical Care AG & Co. KGaA, after its acquisition of Renal Care Group, Inc. in March 2006. Mr. Johnston joined Renal Care Group in November 2002 as a member of the Board of Directors and served as Chairman of the Board from March 2003 through March 2006. Mr. Johnston served as a Director of MultiPlan, Inc. from July 2006 through August 2010. From September 1987 to December 2002, Mr. Johnston was with Equitable Securities Corporation (and its successors, SunTrust Equitable Securities and SunTrust Robinson Humphrey) serving in various investment banking and managerial positions, including Managing Director and Head of Investment Banking, Chief Executive Officer and Vice Chairman.
The Hartford Value Opportunities Fund |
Directors and Officers (Unaudited) – (continued) |
Phillip O. Peterson (1944) Director since 2002, (MF) and 2000 (MF2), Chairman of the Audit Committee
Mr. Peterson is a mutual fund industry consultant. He was a partner of KPMG LLP (an accounting firm) until July 1999. Mr. Peterson joined William Blair Funds in February 2007 as a member of the Board of Trustees. From January 2004 to April 2005, Mr. Peterson served as Independent President of the Strong Mutual Funds.
Lemma W. Senbet (1946) Director since 2005
Dr. Senbet is the William E. Mayer Chair Professor of Finance and Director, Center for Financial Policy, at the University of Maryland, Robert H. Smith School of Business. He was chair of the Finance Department from 1998 to 2006. Previously he was a chaired professor of finance at the University of Wisconsin-Madison. Also, he was director of the Fortis Funds from March 2000 to July 2002. Dr. Senbet served the finance profession in various capacities, including as director of the American Finance Association and President of the Western Finance Association. In 2006, Dr. Senbet was inducted Fellow of Financial Management Association International for his career-long distinguished scholarship and professional service.
Interested Directors and Officers
David N. Levenson (1966) Director since 2010
Mr. Levenson currently serves as President of The Hartford’s Wealth Management business. He was appointed to this role in July 2010. Previously, Mr. Levenson served as Executive Vice President of Legacy Holdings for The Hartford from June 2009 to July 2010. From 2006 to 2009, Mr. Levenson was with Hartford Life Insurance K.K. where he served as President and Chief Executive Officer from 2007 to 2009. He served as Managing Director of Hartford Investment Management Company from 2005 to 2006. Additionally, Mr. Levenson serves as Executive Vice President of The Hartford and as President, Director and Chief Executive Officer of Hartford Life Insurance Company (“HLIC”) and Hartford Life, Inc. (“HL Inc.”).
Lowndes A. Smith (1939) Director since 1996, (MF) and 2002 (MF2), Co-Chairman of the Investment Committee
Mr. Smith served as Vice Chairman of The Hartford from February 1997 to January 2002, as President and Chief Executive Officer of HL Inc. from February 1997 to January 2002, and as President and Chief Operating Officer of The Hartford Life Insurance Companies from January 1989 to January 2002. Mr. Smith serves as a Director of White Mountains Insurance Group, Ltd., One Beacon Insurance and Symetra Financial and as a Managing Director of Whittington Gray Associates.
Other Officers
James E. Davey (1964) President and Chief Executive Officer since 2010
Mr. Davey serves as Executive Vice President of HLIC. Additionally, Mr. Davey serves as President, Chief Executive Officer and Manager of HIFSCO and President, Chief Executive Officer and Manager of HL Investment Advisors, LLC (“HL Advisors”). Mr. Davey joined The Hartford in 2002.
Michael R. Dressen (1963) AML Compliance Officer since 2011
Mr. Dressen currently serves as Assistant Vice President of HLIC. He also serves as Chief Compliance Officer and AML Compliance Officer of Hartford Administrative Services Company (“HASCO”) and as Assistant Secretary and Compliance Officer of HIFSCO. Mr Dressen joined The Hartford in 2005 from State Farm Insurance Companies where he held various positions related to mutual funds, variable products, and property casualty insurance.
Tamara L. Fagely (1958) Vice President, Controller and Treasurer since 2002 (MF) and 1993 (MF2)
Ms. Fagely has been a Vice President of HASCO since 1998 and Chief Financial Officer since 2006. Currently Ms. Fagely is a Vice President of HLIC. She served as Assistant Vice President of HLIC from December 2001 through March 2005. In addition, Ms. Fagely is Controller and Chief Financial Officer of HIFSCO.
Dr. Robert J. Froehlich (1953) Senior Managing Director since 2009
Dr. Froehlich joined The Hartford as Senior Managing Director in September 2009. Prior to joining The Hartford, Dr. Froehlich served as Vice Chairman of Deutsche Asset Management from 1997-2009.
Edward P. Macdonald (1967) Vice President, Secretary and Chief Legal Officer since 2005
Mr. Macdonald serves as Vice President of HLIC and Chief Legal Officer of Mutual Funds and Vice President of HIFSCO. He also serves as Vice President and Secretary of HASCO, and Chief Legal Officer, Secretary and Vice President of HL Advisors. Mr. Macdonald joined The Hartford in 2005.
Vernon J. Meyer (1964) Vice President since 2006
Mr. Meyer serves as Senior Vice President of HLIC. He also serves as Senior Vice President of HIFSCO and HL Advisors. Mr. Meyer joined The Hartford in 2004.
Colleen B. Pernerewski (1969) Vice President and Chief Compliance Officer since 2010
Ms. Pernerewski serves as Vice President and Chief Investment Advisor Compliance Officer of HIFSCO and as Vice President and Chief Compliance Officer of HL Advisors. Ms. Pernerewski joined The Hartford in 2005 from Travelers Life and Annuity where she served as Counsel (2004-2005). Prior to Travelers Life and Annuity, Ms. Pernerewski held the position of Counsel at The Hartford (1998-2004).
Elizabeth L. Schroeder (1966) Vice President since 2010
Ms. Schroeder currently serves as Assistant Vice President of HLIC. Ms. Schroeder joined HLIC in 1991. She is also an Assistant Vice President of HASCO, HIFSCO and HL Advisors.
Martin Swanson (1962) Vice President since 2010
Mr. Swanson is a Vice President of HLIC. Mr. Swanson also serves as Vice President/Marketing for HIFSCO. Prior to joining HLIC in 1998, Mr. Swanson was a Vice President at PaineWebber, Inc.
Jane Wolak (1961) Vice President since 2009
Ms. Wolak currently serves as Senior Vice President of HLIC. Ms. Wolak joined HLIC as Vice President, Retail Product Services in May 2007. She is also Vice President of HASCO. Previously, Ms. Wolak was with Sun Life Financial where she held the position of Vice President, Service Center Operations from 2001-2007.
A description of the policies and procedures that the Fund uses to determine how to vote proxies relating to portfolio securities and a record of how the Fund voted any proxies for the twelve-month period ended June 30, 2011 are available (1) without charge, upon request, by calling 888-843-7824 and (2) on the SEC’s website at http://www.sec.gov.
The Fund files a complete schedule of portfolio holdings with the SEC for the first and third quarters of each fiscal year on Form N-Q. The Fund’s Forms are available (1) without charge, upon request, by calling 888-843-7824 and (2) on the SEC’s website at http://www.sec.gov. The Form N-Q may be reviewed and copied at the SEC’s Public Reference Room in Washington, DC. Information on the operation of the Public Reference Room may be obtained by calling 1-800-SEC-0330.
|
Federal Tax Information (Unaudited) |
The information set forth below is for the Fund’s fiscal year as required by federal tax law. Shareholders, however, must report distributions on a calendar year basis for income tax purposes which may include distributions of two fiscal years of the Fund. Accordingly, the information needed by shareholders for income tax purposes will be sent to them in early 2012. Shareholders may wish to consult a tax advisor on how to report distributions for state and local purposes.
| * | Income distributions, taxable as dividend income which qualify for deduction by corporations. |
| † | For the fiscal year ended October 31, 2011, certain dividends paid by the Fund may be subject to a maximum tax rate of 15%, as provided for by the Jobs and Growth Tax Relief Reconciliation Act of 2003. The Fund intends to designate ordinary distributions declared as taxed at a maximum rate of 15%. |
|
Expense Example (Unaudited) |
Your Fund's Expenses
As a shareholder of the Fund, you incur two types of costs: (1) transaction costs, including sales charges (loads) on purchase payments and contingent deferred sales charges (CDSC) and (2) ongoing costs, including investment management fees, distribution fees, and other fund expenses. This example is intended to help you understand your ongoing costs (in dollars) of investing in the Fund and to compare these costs with the ongoing costs of investing in other mutual funds. The example is based on an investment of $1,000 invested at the beginning of the period and held for the period of April 30, 2011 through October 31, 2011.
Actual Expenses
The first set of columns of the table below provides information about actual account values and actual expenses. You may use the information in this column, together with the amount you invested, to estimate the expenses that you paid over the period. Simply divide your account value by $1,000 (for example, an $8,600 account value divided by $1,000 = 8.6), then multiply the result by the number in the line under the heading entitled “Expenses Paid During Period” to estimate the expenses you paid on your account during this period.
Hypothetical Example for Comparison Purposes
The second set of columns of the table below provides information about hypothetical account values and hypothetical expenses based on the Fund's actual expense ratio and an assumed rate of return of 5% per year before expenses, which is not the Fund's actual return. The hypothetical account values and expenses may not be used to estimate the actual ending account balance or expenses you paid for the period. You may use this information to compare the ongoing costs of investing in the Fund and other funds. To do so, compare this 5% hypothetical example with the 5% hypothetical examples that appear in the shareholder reports of the other funds.
Please note that the expenses shown in the table are meant to highlight your ongoing costs only and do not reflect any transactional costs, such as sales charges (loads) and CDSC. Therefore, the second set of columns of the table is useful in comparing ongoing costs only, and will not help you determine the relative total costs of owning different funds. In addition, if these transactional costs were included, your costs would be higher. Expenses are equal to the Fund's annualized expense ratios multiplied by average account value over the period, multiplied by 184/365 (to reflect the one-half year period).
| | | Actual return | | | Hypothetical (5% return before expenses) | | | | | | | | | | |
| | | Beginning Account Value April 30, 2011 | | | Ending Account Value October 31, 2011 | | | Expenses paid during the period April 30, 2011 through October 31, 2011 | | | Beginning Account Value April 30, 2011 | | | Ending Account Value October 31, 2011 | | | Expenses paid during the period April 30, 2011 through October 31, 2011 | | | | | | Days in the current 1/2 year | | | | |
| Class A | | $ | 1,000.00 | | | $ | 876.90 | | | $ | 6.39 | | | $ | 1,000.00 | | | $ | 1,018.40 | | | $ | 6.87 | | | | 1.35 | % | | | 184 | | | | 365 | |
| Class B | | $ | 1,000.00 | | | $ | 872.90 | | | $ | 9.92 | | | $ | 1,000.00 | | | $ | 1,014.62 | | | $ | 10.67 | | | | 2.10 | | | | 184 | | | | 365 | |
| Class C | | $ | 1,000.00 | | | $ | 873.40 | | | $ | 9.92 | | | $ | 1,000.00 | | | $ | 1,014.62 | | | $ | 10.67 | | | | 2.10 | | | | 184 | | | | 365 | |
| Class I | | $ | 1,000.00 | | | $ | 878.40 | | | $ | 4.72 | | | $ | 1,000.00 | | | $ | 1,020.18 | | | $ | 5.07 | | | | 1.00 | | | | 184 | | | | 365 | |
| Class R3 | | $ | 1,000.00 | | | $ | 875.60 | | | $ | 7.32 | | | $ | 1,000.00 | | | $ | 1,017.40 | | | $ | 7.88 | | | | 1.55 | | | | 184 | | | | 365 | |
| Class R4 | | $ | 1,000.00 | | | $ | 877.00 | | | $ | 5.91 | | | $ | 1,000.00 | | | $ | 1,018.90 | | | $ | 6.36 | | | | 1.25 | | | | 184 | | | | 365 | |
| Class R5 | | $ | 1,000.00 | | | $ | 878.30 | | | $ | 4.50 | | | $ | 1,000.00 | | | $ | 1,020.42 | | | $ | 4.84 | | | | 0.95 | | | | 184 | | | | 365 | |
| Class Y | | $ | 1,000.00 | | | $ | 878.20 | | | $ | 4.26 | | | $ | 1,000.00 | | | $ | 1,020.67 | | | $ | 4.58 | | | | 0.90 | | | | 184 | | | | 365 | |
|
Approval of Investment Management and Investment Sub-Advisory Agreements (Unaudited) |
Section 15(c) of the Investment Company Act of 1940, as amended (the “1940 Act”), requires that each mutual fund’s board of directors, including a majority of those directors who are not “interested persons” of the mutual fund, as defined in the 1940 Act (the “Independent Directors”), annually review and consider the continuation of the mutual fund’s investment advisory and sub-advisory agreements. At its meeting held on August 2-3, 2011, the Board of Directors (the “Board”) of The Hartford Mutual Funds II, Inc., including each of the Independent Directors, unanimously voted to approve the continuation of the investment management agreement for The Hartford Value Opportunities Fund (the “Fund”) with Hartford Investment Financial Services, LLC (“HIFSCO”) and the continuation of the investment sub-advisory agreement between HIFSCO and the Fund’s sub-adviser, Wellington Management Company, LLP (the “Sub-adviser,” and together with HIFSCO, the “Advisers”) (collectively, the “Agreements”).
In the months preceding the August 2-3, 2011 meeting, the Board requested, received, and reviewed written responses from the Advisers to questions posed to them on behalf of the Independent Directors and supporting materials relating to those questions and responses. The Board considered information furnished to the Board at its meetings throughout the year, as well as information specifically prepared in connection with the annual approval of the Agreements at the Board’s meetings held on June 21-22, 2011 and August 2-3, 2011. Information provided to the Board at its meetings throughout the year included, among other things, reports on Fund performance, legal and compliance matters, sales and marketing activity, shareholder services, and the other services provided to the Fund by the Advisers and their affiliates. In addition, the Board received in-person presentations by Fund officers and representatives of HIFSCO at the Board’s meetings on June 21-22, 2011 and August 2-3, 2011 concerning the Agreements.
The Independent Directors, advised by independent legal counsel, engaged two service providers to assist them with evaluating the Agreements with respect to the Fund. Lipper Inc. (“Lipper”), an independent provider of investment company data, was retained to provide the Board with reports on how the Fund’s contractual management fees, actual management fees, other non-management fees, overall expense ratios and investment performance compared to those of mutual funds with similar investment objectives. The Independent Directors also engaged an independent financial services consulting firm (the “Consultant”) to assist them in evaluating the Fund’s management fees, sub-advisory fees, other non-management fees, overall expense ratios and investment performance. In addition, the Consultant reviewed the profitability calculations utilized by HIFSCO in connection with the continuation of the investment management agreement.
In determining to continue the Agreements for the Fund, the members of the Board reviewed and evaluated information and factors they believed to be relevant and appropriate in light of the information that the Board deemed necessary and appropriate through the exercise of their reasonable business judgment. While individual members of the Board may have weighed certain factors differently, the Board’s determination to continue the Agreements was based on a comprehensive consideration of all information provided to the Board throughout the year and specifically with respect to the continuation of the Agreements. A more detailed discussion of the factors the Board considered with respect to its approval of the Agreements is provided below.
Nature, Extent, And Quality Of Services Provided by the Advisers
The Board requested and considered information concerning the nature, extent, and quality of the services provided to the Fund by the Advisers. The Board considered, among other things, the terms of the Agreements and the range of services provided by the Advisers. The Board considered the Advisers’ professional personnel who provide services to the Fund, including each Adviser’s ability and experience in attracting and retaining qualified personnel to service the Fund. The Board considered each Adviser’s reputation and overall financial strength, as well as its willingness to consider and implement organizational and operational changes designed to improve services to the Fund. In addition, the Board considered the quality of each Adviser’s communications with the Board and responsiveness to Board inquiries.
The Board also requested and evaluated information concerning each Adviser’s regulatory and compliance environment. In this regard, the Board requested and reviewed information on each Adviser’s compliance policies and procedures, compliance history, and a report from the Fund’s Chief Compliance Officer on each Adviser’s compliance with applicable laws and regulations, including responses to regulatory developments and compliance issues raised by regulators. The Board also noted the Advisers’ support of the Fund’s compliance control structure, particularly the resources devoted by the Advisers in support of the Fund’s obligations pursuant to Rule 38a-1 under the 1940 Act.
With respect to HIFSCO, the Board noted that under the Agreements, HIFSCO is responsible for the management of the Fund, including overseeing fund operations and service providers, and provides administration services to the Fund as well as investment advisory services in connection with selecting, monitoring and supervising the Sub-adviser. The Board considered HIFSCO’s ongoing monitoring of people, process and performance, including its quarterly reviews of each of the Hartford Mutual Funds, semi-annual meetings with the leaders of each Fund’s portfolio management team, and oversight of the Funds’ 74 portfolio managers. The Board recognized that HIFSCO has demonstrated a record of making changes to the management and/or strategies of the Funds when warranted. The Board considered HIFSCO’s oversight of the Sub-adviser’s investment approach and results, process for monitoring best execution of portfolio trades by the Sub-adviser, and approach to risk management with respect to the Fund and the service providers to the Fund. The Board also considered HIFSCO’s oversight of compliance with the Fund’s objective and policies as well as with applicable laws and regulations, noting that regulatory and other developments had over time led to an increase in the scope of HIFSCO’s services in this regard.
In addition, the Board considered HIFSCO’s ongoing commitment to review and rationalize the Hartford fund family’s product line-up and the expenses that HIFSCO had incurred in connection with fund combinations in recent years. The Board considered that HIFSCO or its affiliates are responsible for providing the Fund’s officers.
With respect to the Sub-adviser, who provides day-to-day portfolio management services, the Board considered the quality of the Fund’s portfolio managers, the Sub-adviser’s other investment personnel, its investment philosophy and process, investment research capabilities and resources, performance record, trade execution capabilities and experience. The Board considered the experience of the Fund’s portfolio managers, the number of accounts managed by the portfolio managers, and the Sub-adviser’s method for compensating the portfolio managers.
Based on these considerations, the Board concluded that it was satisfied with the nature, extent and quality of the services provided to the Fund by HIFSCO and the Sub-adviser.
Performance of the Fund and the Advisers
The Board considered the investment performance of the Fund. In this regard, the Board reviewed the performance of the Fund over different time periods presented in the materials and evaluated HIFSCO’s analysis of the Fund’s performance for these time periods. The Board considered information and materials provided to the Board by the Advisers concerning Fund performance, as well as information from Lipper comparing the investment performance of the Fund to an appropriate benchmark and universe of peer funds. The Board noted that the performance of the Fund was within expectations. The Board also noted the Fund’s improved performance since changes were made to the Fund’s portfolio management team.
The Board considered the detailed investment analytics reports provided by The Hartford’s Investment Advisory Group throughout the year. These reports include, among other things, information on the Fund’s gross and net returns, the Fund’s investment performance relative to an appropriate benchmark and peer group, various statistics concerning the Fund’s portfolio, and a narrative summary of various factors affecting Fund performance. The Board considered the Advisers’ cooperation with the Investment Committee, which assists the Board in evaluating the performance of the Fund at periodic meetings throughout the year. The Board also considered the analysis provided by the Consultant relating to the Fund’s performance track record.
In light of all the considerations noted above, the Board concluded that it had continued confidence in HIFSCO’s and the Sub-adviser’s overall capabilities to manage the Fund.
Costs of the Services and Profitability of the Advisers
The Board reviewed information regarding HIFSCO’s cost to provide investment management and related services to the Fund and HIFSCO’s profitability, both overall and for the Fund, on a pre-tax basis without regard to distribution expenses. The Board also requested and reviewed information about the profitability to HIFSCO and its affiliates from all services provided to the Fund and all aspects of their relationship with the Fund. The Board also requested and received information relating to the operations and profitability of the Sub-adviser.
| The Hartford Value Opportunities Fund |
Approval of Investment Management and Investment Sub-Advisory Agreements (Unaudited) – (continued) |
The Board considered the Consultant’s review of the profitability calculations utilized by HIFSCO in connection with the continuation of the investment management agreement. In this regard, the Consultant reported that The Hartford’s process for calculating and reporting Fund profitability is reasonable, sound and well within common industry practice.
Based on these considerations, the Board concluded that the profits anticipated to be realized by the Advisers and their affiliates from their relationships with the Fund would not be excessive.
Comparison of Fees and Services Provided by the Advisers
The Board considered comparative information with respect to the management fees to be paid by the Fund to HIFSCO and the total expense ratios of the Fund. The Board also considered comparative information with respect to the sub-advisory fees to be paid by HIFSCO to the Sub-adviser, to the extent applicable. In this regard, the Board requested and reviewed information from HIFSCO and the Sub-adviser relating to the management and sub-advisory fees, including the sub-advisory fee schedule for the Fund, and total operating expenses for the Fund. The Board also reviewed information from Lipper comparing the Fund’s contractual management fees, actual management fees and overall expense ratios relative to a group of funds selected by Lipper, in consultation with the Consultant, and a broader universe of funds selected by Lipper.
While the Board recognized that comparisons between the Fund and peer funds are imprecise, given the differing service levels and characteristics of mutual funds and the different business models and cost structures of the Advisers, the comparative information provided by Lipper assisted the Board in evaluating the reasonableness of the Fund’s management and sub-advisory fees and total operating expenses. In addition, the Board considered the analysis and recommendations of the Consultant relating to the Fund’s management and sub-advisory fees and total operating expenses.
Based on these considerations, the Board concluded that the Fund’s fees and total operating expenses, in conjunction with the information about quality of services, profitability, economies of scale, and other matters discussed, were reasonable in light of the services provided.
Economies of Scale
The Board requested and considered information regarding the Advisers’ realization of economies of scale with respect to the Fund and whether the fee levels reflect these economies of scale for the benefit of the Fund’s investors. With respect to HIFSCO, the Board considered representations from HIFSCO that it is difficult to anticipate whether and to what extent economies may be realized by HIFSCO as assets grow over time. The Board reviewed the breakpoints in the management fee schedule for the Fund, which reduces fee rates as Fund assets grow over time. The Board recognized that a fund with assets beyond the last breakpoint level will continue to benefit from economies of scale because additional assets are charged the lowest breakpoint fee resulting in lower overall effective management fee rates. The Board also considered that expense limitations and fee waivers that reduce the Fund’s expenses at all asset levels can have the same effect as breakpoints in sharing economies of scale with shareholders and provide protection from an increase in expenses if Fund assets decline. The Board recognized that a fee schedule that reaches a lower breakpoint quickly provides shareholders with the benefit of anticipated or potential economies of scale. The Board also considered that HIFSCO has been active in managing expenses, which has resulted in benefits being realized by shareholders as assets within the Hartford fund family have grown over time, including through lower transfer agent costs and other operating expenses.
The Board reviewed and evaluated materials from Lipper showing how management fee schedules of peer funds reflect economies of scale for the benefit of investors as a peer fund’s assets hypothetically increase over time. Based on information provided by HIFSCO, Lipper, and the Consultant, the Board recognized that there is no uniform methodology for establishing breakpoints or uniform pattern in asset levels that trigger breakpoints or the amounts of breakpoints triggered.
After considering all of the information available to it, the Board concluded that it was satisfied with the extent to which economies of scale would be shared for the benefit of the Fund’s shareholders based on currently available information and the effective advisory fees and expense ratios for the Fund at its current and reasonably anticipated asset levels. The Board noted, however, that it would continue to monitor future growth in Fund assets and the appropriateness of additional breakpoints.
Other Benefits
The Board considered other benefits to the Advisers and their affiliates from their relationships with the Fund.
The Board reviewed information noting that Hartford Life, Inc. (“Hartford Life”), an affiliate of HIFSCO, receives fees for fund accounting and related services from the Fund, and the Board considered information on expected profits to Hartford Life or its affiliates for such services. The Board also considered that Hartford Administrative Services Company (“HASCO”), the Fund’s transfer agent and an affiliate of HIFSCO, receives transfer agency compensation from the Fund, and the Board reviewed information on the expected profitability of the Fund’s transfer agency function to HASCO. The Board considered information provided by HASCO indicating that the transfer agent fees charged by HASCO to the Fund were fair and reasonable based on publicly available information.
The Board also considered that, as principal underwriter of the Fund, HIFSCO receives 12b-1 fees from the Fund and receives all or a portion of the sales charges on sales or redemptions of certain classes of shares. The Board also noted that certain affiliates of HIFSCO distribute shares of the Fund and receive compensation in that connection.
The Board considered benefits to the Sub-adviser from its use of the Fund’s brokerage commissions to obtain soft dollar research, and representations from HIFSCO and the Sub-adviser that the Sub-adviser would not make any revenue-sharing payments or any other type of distribution payments to HIFSCO or its affiliates.
The Board considered the benefits to shareholders of being part of the Hartford family of funds, including the right to exchange investments between the same class of funds without a sales charge, the ability to reinvest Fund dividends into other funds in the family, and the ability to combine holdings in the Fund with holdings in other funds to obtain a reduced sales charge. The Board considered HIFSCO’s efforts to provide investors in the family with a broad range of investment styles and asset classes and its entrepreneurial risk in initiating new funds to expand these opportunities for shareholders.
* * * *
Based upon its review of these various factors, among others, the Board concluded that it is in the best interests of the Fund and its shareholders for the Board to approve the Agreements for an additional year. In reaching this decision, the Board did not assign relative weights to the factors discussed above or deem any one or group of them to be controlling in and of themselves. In connection with their deliberations, the Independent Directors met separately in executive session on several occasions, with independent legal counsel, to review the relevant materials and consider their responsibilities under relevant laws and regulations.
A MESSAGE FROM DR. BOB FROEHLICH
Dear Shareholders:
All I can say is wow! From an investment perspective, this has been quite a tough year.
Old challenges seem to be lingering, such as the ongoing European sovereign debt crisis. While, here in the United States, we just can't seem to turn the corner on our weak housing market and even weaker employment market. As if these issues aren’t enough, we add the new challenge of the United States of America losing its prestigious "AAA" credit rating for the first time in the history of our country. I can’t remember a time when our markets faced this great a challenge from so many different fronts. While all of this negative news can seem daunting at times, there are also some bright spots. Although it’s almost impossible to predict with any degree of accuracy where our markets may be headed, let me share with you a few of the issues that I’m closely watching that make me more optimistic than most about the prospects for our market going forward.
RECORD EARNINGS
Let me begin with earnings, which from my perspective always have been and always will be the single most important thing to focus upon. I’m willing to bet that most U.S. investors have no idea just how strong corporate earnings and profits have been. While there are numerous ways to measure earnings and profits, one of my favorite ways is to look at profits as a percentage of the economy, especially when you want some historical comparison. Fortunately, the Bureau of Economic Analysis does this equation for us on a quarterly basis. For the second quarter of 2011 (the most recent data available) corporate profits accounted for 10.1% of our economy as measured by the GDP (Gross Domestic Product).
So just how good is that profits number? For starters, it’s the single highest profits number in my entire 34-year career. In case that isn’t impressive enough for any of you history buffs, I would add one more thing. The Bureau of Economic Analysis has been recording these quarterly profit numbers as a percentage of GDP since 1947. Our most recent number, which placed corporate profits at 10.1% of GDP, is the highest in the 64 years of tracking this data. Again, if you believe, as I do, that markets ultimately go wherever earnings take them, then you have to like what the future might hold for our stock market.
CORPORATE CASH & STRONG BALANCE SHEETS
The second thing that makes me somewhat optimistic about the future prospects for our markets is the current financial strength of corporate America. I know that you’ve heard the term that “corporate America is flush with cash.” Let me show you just how flush. The single best measure for corporate cash is one called “U.S. nonfinancial corporations liquid assets.” In the past two years this cash has increased $700 billion, bringing the total to more than $2 trillion. In the most recently released numbers for the second quarter of 2011, on a quarter-over-quarter basis, cash is up 19.2%. Corporate cash at a level above $2 trillion is the highest level ever recorded.
Now you know what it means when someone says “corporate America is flush with cash.” The good news about all that cash, from my perspective, is once corporate confidence returns and that cash goes in motion, it will help both our economy and our markets. Money in motion could go toward increasing mergers and acquisitions, dividends, share buybacks, capital spending to drive productivity, or even creating jobs. Regardless of what the ultimate use is, money in motion is good for our economy and our markets.
INSIDER BUYING
Let me move on to my third point that makes me optimistic: “insider buying.” When someone on Wall Street says “insiders,” they’re referring to company officers and directors that must disclose to the Securities and Exchange Commission through Form 4 filings whether they’re buying or selling their company’s stock. Research firm Argus-Vickers tracks this number for all publicly traded companies.
I believe when insiders are selling, it suggests that the stock may be too expensive, and the market expects too much from future earnings. Conversely, when insiders are buying, it suggests that insiders believe that their stock is too cheap, and the market is underestimating future earnings.
For more than the past decade, the average has been two insiders selling for every one that is buying. Think about what our stock market did over the past decade and you might realize that maybe these insiders are a pretty good indicator, as our markets just went through what many are calling “the lost decade,” referring to our flat stock market over the past 10 years. Currently, there’s only one insider selling for every two that are buying. Do they know something that we don't know? Only time will tell. One thing for sure is that officers and directors always focus on earnings, earnings, and earnings.
In closing, now more than ever, it’s critical that you work closely with your trusted financial professional, as I predict that our investment landscape will become even more challenging in the future. The volatility in our markets is probably here to stay— meaning it will be more difficult than ever before to try to remain a long-term investor in this short-term world in which we live. If you’re interested in my longer-term and short-term perspectives on our current markets, you can go to our website: www.hartfordinvestor.com/drbob to read my weekly investment commentary.
Dr. Bob Froehlich
Senior Managing Director
The Hartford Mutual Funds
PAST ECONOMIC AND INDEX PERFORMANCE DO NOT ENSURE FUTURE RESULTS.
Dr. Bob Froehlich’s sources of information include Bank of Canada, The Bank of England, Bank of Japan, Bloomberg News, Business Roundtable, China Investment Corporation, CIA. World Fact Book, CNBC, Congressional Budget Office, Deutsche Bank, The European Monetary Union, Federal Reserve Board, The Financial Times, Freddie Mac, FOX Business, Goldman Sachs, International Monetary Fund, International Strategy & Investment, Journal of Commerce, Merrill Lynch, PIERS Global Intelligence Solutions, Strategas Research, Thomson Reuters, Union Bank of Switzerland, U.S. Census Bureau, U.S. Department of Commerce, U.S. Department of Labor, U.S. State Department, U.S. Treasury Department, The Wall Street Journal, and The World Bank. This information is written in connection with the promotion or marketing of the matter(s) addressed in this material. The information cannot be used or relied upon for the purpose of avoiding IRS penalties. These materials are not intended to provide tax, accounting or legal advice. As with all matters of a tax or legal nature, you should consult your own tax or legal counsel for advice. You should carefully consider investment objectives, risks, and charges and expenses of The Hartford Mutual Funds before investing. This and other information can be found in the Fund’s prospectus or summary prospectus, which can be obtained from your investment representative or by calling 888-843-7824. Please read them carefully before you invest or send money. The Hartford Mutual Funds are underwritten and distributed by Hartford Investment Financial Services, LLC. “The Hartford” is The Hartford Financial Services Group, Inc., and its subsidiaries. MFAR-VO11 12/11 102949 Printed in U.S.A. ©2011 The Hartford, Hartford, CT 06155 | |
| | |
| | |
Item 2. Code of Ethics.
Registrant has adopted a code of ethics that applies to Registrant’s principal executive officer, principal financial officer, and controller, which is attached as an exhibit.
Item 3. Audit Committee Financial Expert.
The Board of Directors of the Registrant has designated Phillip O. Peterson as an Audit Committee Financial Expert. Mr. Peterson is considered by the Board to be an independent director.
Item 4. Principal Accountant Fees and Services.
| | (a) | Audit Fees: $92,400 for the fiscal year ended October 31, 2010; $65,500 for the fiscal year ended October 31, 2011. |
| | (b) | Audit Related Fees: $4,481 for the fiscal year ended October 31, 2010; $3,531 for the fiscal year ended October 31, 2011. Audit-related services principally in connection with SEC Rule 17Ad-13 report. |
| | (c) | Tax Fees: $19,791 for the fiscal year ended October 31, 2010; $16,575 for the fiscal year ended October 31, 2011. |
| | (d) | All Other Fees: $0 for the fiscal year ended October 31, 2010; $0 for the fiscal year ended October 31, 2011. |
| | (e) | (1) A copy of the Audit Committee’s pre-approval policies and procedures is attached as an exhibit. |
| | (e) | (2) One hundred percent of the services described in items 4(b) through 4(d) were approved in accordance with the Audit Committee's Pre-Approval Policy. As a result, none of such services was approved pursuant to paragraph (c) (7) (i) (c) of Rule 2-01 of Regulation S-X. |
| | (f) | None of the hours expended on the principal accountant's engagement to audit the Registrant's financial statements for the year ended October 31, 2011, were attributed to work performed by persons other than the principal accountant's full-time employees. |
| | (g) | Non-Audit Fees: $1,080,999 for the fiscal year ended October 31, 2010; $1,220,709 for the fiscal year ended October 31, 2011. |
The registrant's Audit Committee of the Board of Directors has considered whether the provision of non-audit services that were rendered to the registrant's investment adviser (not including any sub-adviser whose role is primarily portfolio management and is subcontracted with or overseen by another investment adviser), and any entity controlling, controlled by, or under common control with the investment adviser that provides ongoing services to the registrant that were not pre-approved pursuant to paragraph (c)(7)(ii) of Rule 2-01 of Regulation S-X is compatible with maintaining the principal accountant's independence.
Item 5. Audit Committee of Listed Registrants.
Not applicable to this Annual filing.
Item 6. Schedule of Investments
The Schedule of Investments is included as part of the Annual report filed under Item 1 of this form.
Item 7. Disclosure of Proxy Voting Policies and Procedures for Closed-End Management Investment Companies.
Not applicable.
Item 8. Portfolio Managers of Closed-End Management Investment Companies.
Not applicable.
Item 9. Purchases of Equity Securities by Closed-End Management Investment Company and Affiliated Purchasers.
Not applicable.
Item 10. Submission of Matters to a Vote of Security Holders
There have been no material changes to the procedures by which shareholders may recommend nominees to the registrant’s board of directors since registrant last provided disclosure in response to this requirement.
Item 11. Controls and Procedures.
| | (a) | Based on an evaluation of the Registrant's Disclosure Controls and Procedures as of a date within 90 days of the filing date of this report, the Disclosure Controls and Procedures are effectively designed to ensure that information required to be disclosed by the Registrant is recorded, processed, summarized and reported by the date of this report, including ensuring that information required to be disclosed in the report is accumulated and communicated to the Registrant's management, including the Registrant's officers, as appropriate, to allow timely decisions regarding required disclosure. |
| | (b) | There was no change in the Registrant's internal control over financial reporting that occurred during the Registrant’s last fiscal half year that has materially affected, or is reasonably likely to materially affect, the registrant’s internal control over financial reporting. |
Item 12. Exhibits.
| | 11(a)(2) | Section 302 certifications of the principal executive officer and principal financial officer of Registrant. |
| | (b) | Section 906 certification. |
SIGNATURES
Pursuant to the requirements of the Securities Exchange Act of 1934 and the Investment Company Act of 1940, the registrant has duly caused this report to be signed on its behalf by the undersigned, thereunto duly authorized.
| | THE HARTFORD MUTUAL FUNDS II, INC. |
| | |
| Date: December 14, 2011 | By: /s/ James E. Davey James E. Davey Its: President |
Pursuant to the requirements of the Securities Exchange Act of 1934 and the Investment Company Act of 1940, this report has been signed below by the following persons on behalf of the registrant and in the capacities and on the dates indicated.
| | |
| | |
| Date: December 14, 2011 | By: /s/ James E. Davey James E. Davey Its: President |
| | |
| | |
| Date: December 14, 2011 | By: /s/ Tamara L. Fagely Tamara L. Fagely Its: Vice President, Controller and Treasurer |
| 99.CERT | 11(a)(2) | Certifications |
| | | |
| | | (i) Section 302 certification of principal executive officer |
| | | |
| | | (ii) Section 302 certification of principal financial officer |
| | | |
| 99.906CERT | 11(b) | Section 906 certification of principal executive officer and principal financial officer |
| | | |
| | 12(a)(1) | Code of Ethics |