UNITED STATES
SECURITIES AND EXCHANGE COMMISSION
Washington, D.C. 20549
FORM N-CSR
CERTIFIED SHAREHOLDER REPORT OF REGISTERED MANAGEMENT
INVESTMENT COMPANIES
Investment Company Act file number: 811-00558
THE HARTFORD MUTUAL FUNDS II, INC.
(Exact name of registrant as specified in charter)
5 Radnor Corporate Center, Suite 300, 100 Matsonford Road, Radnor, Pennsylvania 19087
(Address of Principal Executive Offices) (Zip Code)
Edward P. Macdonald, Esquire
Hartford Funds Management Company, LLC
5 Radnor Corporate Center, Suite 300
100 Matsonford Road
Radnor, Pennsylvania 19087
(Name and Address of Agent for Service)
Registrant’s telephone number, including area code: (610) 386-4068
Date of fiscal year end: October 31
Date of reporting period: October 31, 2014
Form N-CSR is to be used by management investment companies to file reports with the Commission not later than 10 days after the transmission to stockholders of any report that is required to be transmitted to stockholders under Rule 30e-1 under the Investment Company Act of 1940 (17 CFR 270.30e-1). The Commission may use the information provided on Form N-CSR in its regulatory, disclosure review, inspection, and policymaking roles.
A registrant is required to disclose the information specified by Form N-CSR, and the Commission will make this information public. A registrant is not required to respond to the collection of information contained in Form N-CSR unless the Form displays a currently valid Office of Management and Budget ("OMB") control number. Please direct comments concerning the accuracy of the information collection burden estimate and any suggestions for reducing the burden to Secretary, Securities and Exchange Commission, 100 F Street, NE, Washington, DC 20549. The OMB has reviewed this collection of information under the clearance requirements of 44 U.S.C. § 3507.
Item 1. Reports to Stockholders.
HARTFORDFUNDS
 | THE HARTFORD GROWTH OPPORTUNITIES FUND 2014 Annual Report |

A MESSAGE FROM THE PRESIDENT
Dear Fellow Shareholders:
Thank you for investing in Hartford Funds.
Market Review
U.S. equities (as represented by the S&P 500 Index) rose steadily for the fiscal year ended October 31, 2014, with a return of 17.27% for the period. With the exception of short-lived geopolitical scares early in 2014 and concerns about continuing global growth near the end of the period, stocks generally rose on solid fundamentals and encouraging macroeconomic data during the year.
September 2014 marked the six-year anniversary of the start of the financial crisis. Within weeks of that anniversary, both the S&P 500 Index and the Dow Jones Industrial Average set new all-time highs, closing at 2,018 and 17,391, respectively, on October 31. Although the fallout of the crisis continues to influence investor behavior, stocks have recovered and risen dramatically, up 198% from their low in March 2009. Meanwhile, the domestic economy is notching strong growth, and the unemployment rate has reached its lowest level since August 2008.
While the U.S. economy appears to have stabilized and to have reverted to a solid growth path, the outlook for the global economy appears to have gotten cloudier. The U.S. Federal Reserve has ended quantitative easing, while Europe and Japan are pursuing stimulus options to avoid a double-dip recession and deflation, respectively. Diverging central-bank policies will likely continue to play an important role in market movements going forward as investors wait to see the reactions to their efforts and their impacts on global markets.
How have market movements impacted your portfolio throughout the last year? Are your investments still on track to provide the growth or income you need, and are you comfortable with their progress during times of volatility?
Your financial professional can help you navigate today’s markets with confidence, as well as assist you to achieve your investment goals by providing advice on the best options within our fund family to help you work toward overcoming today’s investing challenges. Meet with your financial advisor regularly to examine your portfolio and your investment strategy, and to determine if you’re still on track to meet your goals.
Thank you again for investing with Hartford Funds.

James Davey
President
Hartford Funds
1 The S&P 500 Index is a market capitalization-weighted price index composed of 500 widely held common stocks.
2 The Dow Jones Industrial Average is an unmanaged, price-weighted index of 30 of the largest, most widely held stocks traded on the NYSE
The Hartford Growth Opportunities Fund
Table of Contents
The views expressed in the Fund’s Manager Discussion under ‘‘Why did the Fund perform this way?’’ and ‘‘What is the outlook?’’ are views of the Fund’s sub-adviser and portfolio management team through the end of the period and are subject to change based on market and other conditions. The Fund’s Manager Discussion is for informational purposes only and does not represent an offer, recommendation or solicitation to buy, hold or sell any security. The specific securities identified and described, if any, do not represent all of the securities purchased or sold and you should not assume that investments in the securities identified and discussed will be profitable.
| The Hartford Growth Opportunities Fund inception 03/31/1963 |
| (sub-advised by Wellington Management Company, LLP) |
| |
| Investment objective – The Fund seeks capital appreciation. |
Performance Overview 10/31/04 - 10/31/14
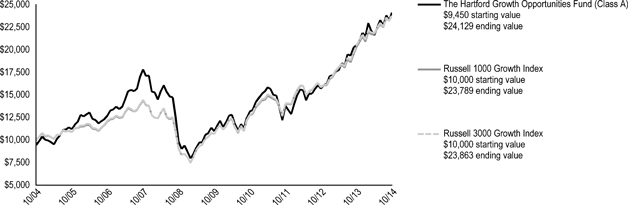
The chart above represents the hypothetical growth of a $10,000 investment in Class A, which includes a sales charge. Growth results in classes other than Class A will vary from what is seen above due to differences in the expenses charged to those share classes.
Average Annual Total Returns (as of 10/31/14)
| | | 1 Year | | 5 Years | | 10 Years |
| Growth Opportunities A# | | | 17.63 | % | | | 17.07 | % | | | 9.83 | % |
| Growth Opportunities A## | | | 11.16 | % | | | 15.75 | % | | | 9.21 | % |
| Growth Opportunities B# | | | 16.65 | % | | | 16.14 | % | | | 9.16 | %* |
| Growth Opportunities B## | | | 11.65 | % | | | 15.92 | % | | | 9.16 | %* |
| Growth Opportunities C# | | | 16.81 | % | | | 16.26 | % | | | 9.04 | % |
| Growth Opportunities C## | | | 15.81 | % | | | 16.26 | % | | | 9.04 | % |
| Growth Opportunities I# | | | 17.92 | % | | | 17.40 | % | | | 10.12 | % |
| Growth Opportunities R3# | | | 17.28 | % | | | 16.78 | % | | | 9.72 | % |
| Growth Opportunities R4# | | | 17.65 | % | | | 17.14 | % | | | 10.00 | % |
| Growth Opportunities R5# | | | 18.02 | % | | | 17.50 | % | | | 10.25 | % |
| Growth Opportunities Y# | | | 18.11 | % | | | 17.60 | % | | | 10.34 | % |
| Russell 1000 Growth Index | | | 17.11 | % | | | 17.43 | % | | | 9.05 | % |
| Russell 3000 Growth Index | | | 16.39 | % | | | 17.52 | % | | | 9.09 | % |
| * | Class B shares convert to Class A shares after 8 years. The return shown reflects the conversion to Class A shares, which had different operating expenses, for the period after conversion. |
PERFORMANCE DATA QUOTED REPRESENTS PAST PERFORMANCE AND DOES NOT GUARANTEE FUTURE RESULTS. The investment return and principal value of the investment will fluctuate so that investors’ shares, when redeemed, may be worth more or less than their original cost. Current performance may be lower or higher than the performance data quoted. To obtain performance data current to the most recent month-end, please visit our website www.hartfordfunds.com.
The initial investment in Class A shares reflects the maximum sales charge of 5.50% and returns for Class B shares reflect a contingent deferred sales charge of up to 5.00% and declining to zero, depending on the period of time the shares are held. Returns for Class C shares reflect a contingent deferred sales charge of up to 1.00% on shares redeemed within twelve months of purchase.
Total returns presented above were calculated using the Fund’s net asset value available to shareholders for sale or redemption of Fund shares on October 31, 2014, which may exclude investment transactions as of this date. All share class returns assume the reinvestment of all distributions at net asset value and the deduction of all fund expenses.
Effective 9/30/09, Class B shares of the Fund were closed to new investments.
Class I shares commenced operations on 8/31/06. Performance prior to that date is that of the Fund's Class A shares (excluding sales charges), which had different operating expenses. Class R3, R4 and R5 shares commenced operations on 12/22/06. Performance prior to that date is that of the Fund's Class Y shares, which had different operating expenses.
Russell 1000 Growth Index is an unmanaged index that measures the performance of those Russell 1000 Index companies with higher price-to-book ratios and higher forecasted growth values. The Russell 1000 Index is an unmanaged index that measures the performance of the 1,000 largest companies in the Russell 3000 Index, which measures the performance of the 3,000 largest U.S. companies based on total market capitalization.
Russell 3000 Growth Index is an unmanaged index that measures the performance of those Russell 3000 Index companies with higher price-to-book ratios and higher forecasted growth values. The Russell 3000 Index is an unmanaged index that measures the performance of the 3,000 largest U.S. companies based on total market capitalization.
You cannot invest directly in an index.
The chart and table do not reflect the deductions of taxes that a shareholder would pay on Fund distributions or the redemption of Fund shares.
Performance information may reflect historical or current expense waivers/reimbursements from the investment adviser, without which performance would have been lower. For information on current expense waivers/reimbursements, please see the prospectus.
| The Hartford Growth Opportunities Fund |
| Manager Discussion |
| October 31, 2014 (Unaudited) |
| Operating Expenses* |
| | | Net | | Gross |
| Growth Opportunities Class A | | | 1.19 | % | | | 1.19 | % |
| Growth Opportunities Class B | | | 2.05 | % | | | 2.11 | % |
| Growth Opportunities Class C | | | 1.90 | % | | | 1.90 | % |
| Growth Opportunities Class I | | | 0.92 | % | | | 0.92 | % |
| Growth Opportunities Class R3 | | | 1.45 | % | | | 1.46 | % |
| Growth Opportunities Class R4 | | | 1.15 | % | | | 1.15 | % |
| Growth Opportunities Class R5 | | | 0.85 | % | | | 0.85 | % |
| Growth Opportunities Class Y | | | 0.75 | % | | | 0.75 | % |
| * | As shown in the Fund's prospectus dated March 1, 2014. Actual expenses may be higher or lower. Please see accompanying Financial Highlights for expense ratios for the year ended October 31, 2014. |
Gross expenses are the Fund's total annual operating expenses shown in the Fund's prospectus dated March 1, 2014. Net expenses are the Fund's total annual operating expenses shown in the Fund's prospectus dated March 1, 2014 and reflect contractual expense waivers/reimbursements in instances when these reductions reduce the Fund's gross expenses. Certain contractual waivers/reimbursements remain in effect until February 28, 2015. Other contractual waivers/reimbursements remain in effect until February 28, 2015, and automatically renew for one-year terms unless terminated.
The Fund filed an updated prospectus, dated November 7, 2014, with the U.S. Securities and Exchange Commission that became effective on that date. However, the information in this annual report is as of October 31, 2014 and does not reflect any changes made to the total annual fund operating expense table in the November 7, 2014 prospectus. The net expense ratios shown in the November 7, 2014 prospectus are 1.19%, 2.11%, 1.90%, 0.92%, 1.45%, 1.15%, 0.85% and 0.75% for Class A, Class B, Class C, Class I, Class R3, Class R4, Class R5 and Class Y, respectively, and reflect contractual expense reimbursements in place until February 29, 2016. The gross expense ratios shown in the November 7, 2014 prospectus are 1.19%, 2.11%, 1.90%, 0.92%, 1.46%, 1.15%, 0.85% and 0.75% for Class A, Class B, Class C, Class I, Class R3, Class R4, Class R5 and Class Y, respectively.
All investments are subject to risk including the possible loss of principal. For a discussion of the Fund’s risks, please see the Main Risks section of this report. For more detailed information on the risks associated with an investment in the Fund, please see the prospectus.
| Portfolio Managers | | |
| Michael T. Carmen, CFA | Mario E. Abularach, CFA | Stephen Mortimer |
Senior Vice President and Equity Portfolio
Manager | Senior Vice President and Equity
Research Analyst | Senior Vice President and Equity Portfolio
Manager |
| | | |
How did the Fund perform?
The Class A shares of The Hartford Growth Opportunities Fund returned 17.63%, before sales charge, for the twelve-month period ended October 31, 2014, outperforming the Fund’s benchmarks, the Russell 1000 Growth Index and the Russell 3000 Growth Index, which returned 17.11% and 16.39%, respectively, for the same period. The Fund also outperformed the 13.80% average return of the Lipper Multi-Cap Growth Funds peer group, a group of funds with investment strategies similar to those of the Fund.
Why did the Fund perform this way?
U.S. equities surged during the period, despite bouts of significant volatility. After finishing their best year since 1997, U.S. stocks began 2014 with their worst month in nearly two years. Worries about a slowdown in China and general angst surrounding emerging markets overshadowed a fairly benign domestic environment. However, robust merger and acquisition activity and an uncontested increase in the debt ceiling from Congress helped stoke investors' risk appetites in February. The rally continued in May amid renewed signs of life in the housing market and the best payroll gain in more than two years. However, a pullback in July ended a streak of five consecutive monthly gains. Fear gripped the market as heightened geopolitical risks, a potential Portuguese banking crisis, and worries of U.S. Federal Reserve (Fed) tightening took center stage. Stocks rebounded in August as investors were emboldened by encouraging economic data, headlined by better-than-expected Gross Domestic Product (GDP) growth and signs that the housing recovery still had legs. In September, U.S. equities retreated for just the third month this year. Despite solid manufacturing and consumer confidence readings, the reality of quantitative easing ending and the prospect of higher federal funds rates in mid-2015 contributed to increased risk aversion levels. Stocks finished a volatile October at an all-time high on the heels of a positive earnings season and generally solid economic data. Returns also varied noticeably by market-cap, as small- and mid-cap stocks underperformed large-cap stocks.
All ten sectors in the Russell 3000 Growth Index posted positive returns during the period, with Healthcare (+33%), Utilities (+24%), and Information Technology (+21%) gaining most. Energy (+3%), Telecommunication Services (+8%), and Consumer Discretionary (+8%) lagged the broader index.
Strong security selection within Information Technology, Healthcare, and Materials was the primary driver of outperformance relative to the Russell 3000 Growth Index during the period, more than offsetting weak selection within Consumer Discretionary and Industrials. Sector allocation, a result of our bottom-up stock selection process, also contributed to outperformance relative to the Russell 3000 Growth Index. In particular, an overweight to
| The Hartford Growth Opportunities Fund |
| Manager Discussion – (continued) |
| October 31, 2014 (Unaudited) |
Healthcare and underweights to Energy and Consumer Staples contributed to returns relative to the Russell 3000 Growth Index.
Top contributors to relative performance during the period included Forest Labs (Healthcare), Platform Specialty (Materials), and Palo Alto Networks (Information Technology). Shares of Forest Labs, a U.S.-based pharmaceutical company, soared on news that Actavis, the world’s second-largest generic drug maker by market value, agreed to buy Forest for approximately $25 billion. Shares of Platform Specialty, a global producer of high technology specialty chemical products and provider of technical services, rose during the period as a result of multiple acquisitions, including acquiring Arysta LifeScience for $3.5 billion. This acquisition among others was viewed favorable by the market. Lastly, Palo Alto Networks, a U.S.-based network security platform company, outperformed after the company’s operating strength over multiple quarters continued as a result of its next-generation security platform.
Top absolute and relative detractors during the period included Lululemon Athletica (Consumer Discretionary), Whole Foods Markets (Consumer Staples), and Amazon.com (Consumer Discretionary). Shares of Lululemon Athletica, a Canada-headquartered manufacturer and retailer of premium athletic apparel, underperformed during the period. We believe the company is facing a number of different issues including image challenges, a need to upgrade systems and processes, and new management additions which have continued to be disruptive to the business and weighed on share price. Shares of Whole Foods Market, a U.S.-based retailer of natural and organic foods, underperformed after the company missed earnings targets for multiple quarters and lowered guidance as well. Shares of Amazon.com, a U.S.-based global e-commerce retailer, fell during the period as investors became concerned with continuous increases in expenses and the impact of a price increase for Amazon Prime customers.
Derivatives are not used in a significant manner in this Fund and did not have a material impact on performance during the period.
What is the outlook?
In our view, the global cycle continues to advance at a moderate pace with a mix of stronger growth in the U.S. and more sluggish activity in Europe, Japan, and China. We believe the U.S. economy is on track for a self-sustaining expansion. After three years of fiscal consolidation, it appears that this policy drag is starting to fade, which we believe should support growth. Meanwhile, investment spending appears to be picking up. Wage trends and inflation have been quite muted in the U.S., yet below the surface it is apparent that U.S. firms are having a tougher time finding qualified labor, suggesting that wages may rise in 2015 with an improving labor market.
At the end of the period, the Fund was most overweight the Consumer Discretionary, Healthcare, and Information Technology sectors and most underweight the Consumer Staples, Telecommunication Services, and Energy sectors relative to the Russell 3000 Growth Index.
| Diversification by Sector |
| as of October 31, 2014 |
| Sector | | Percentage of
Net Assets | |
| Equity Securities | | | | |
| Consumer Discretionary | | | 21.8 | % |
| Consumer Staples | | | 1.6 | |
| Energy | | | 3.8 | |
| Financials | | | 8.4 | |
| Health Care | | | 17.7 | |
| Industrials | | | 13.4 | |
| Information Technology | | | 28.2 | |
| Materials | | | 1.1 | |
| Services | | | 0.4 | |
| Total | | | 96.4 | % |
| Short-Term Investments | | | 1.5 | |
| Other Assets and Liabilities | | | 2.1 | |
| Total | | | 100.0 | % |
A sector may be comprised of several industries. For Fund compliance purposes, the Fund may not use the same classification system and these sector classifications are used for reporting ease.
| The Hartford Growth Opportunities Fund |
| Schedule of Investments |
| October 31, 2014 |
| (000’s Omitted) |
| Shares or Principal Amount | | Market Value ╪ | |
| Common Stocks - 92.2% | | | | |
| | | | | Automobiles and Components - 1.3% | | | | |
| | 749 | | | Harley-Davidson, Inc. | | $ | 49,194 | |
| | | | | | | | | |
| | | | | Capital Goods - 8.8% | | | | |
| | 462 | | | Acuity Brands, Inc. | | | 64,394 | |
| | 846 | | | Danaher Corp. | | | 68,026 | |
| | 975 | | | DigitalGlobe, Inc. ● | | | 27,866 | |
| | 1,609 | | | HD Supply Holdings, Inc. ● | | | 46,414 | |
| | 447 | | | Pall Corp. | | | 40,855 | |
| | 529 | | | Pentair plc | | | 35,466 | |
| | 1,153 | | | Textron, Inc. | | | 47,884 | |
| | | | | | | | 330,905 | |
| | | | | Commercial and Professional Services - 2.7% | | | | |
| | 529 | | | IHS, Inc. ● | | | 69,298 | |
| | 749 | | | Nielsen N.V. | | | 31,842 | |
| | | | | | | | 101,140 | |
| | | | | Consumer Durables and Apparel - 4.3% | | | | |
| | 319 | | | Harman International Industries, Inc. | | | 34,212 | |
| | 479 | | | Lennar Corp. | | | 20,624 | |
| | 10,022 | | | Samsonite International S.A. | | | 33,301 | |
| | 418 | | | Whirlpool Corp. | | | 71,878 | |
| | | | | | | | 160,015 | |
| | | | | Consumer Services - 5.2% | | | | |
| | 76 | | | Chipotle Mexican Grill, Inc. ● | | | 48,529 | |
| | 1,674 | | | Diamond Resorts International, Inc. ● | | | 43,445 | |
| | 241 | | | Panera Bread Co. Class A ● | | | 38,974 | |
| | 381 | | | Starbucks Corp. | | | 28,751 | |
| | 454 | | | Wyndham Worldwide Corp. | | | 35,275 | |
| | | | | | | | 194,974 | |
| | | | | Diversified Financials - 5.8% | | | | |
| | 167 | | | BlackRock, Inc. | | | 56,890 | |
| | 899 | | | Julius Baer Group Ltd. | | | 39,417 | |
| | 1,491 | | | Nomad Holdings Ltd. ●† | | | 17,184 | |
| | 530 | | | Northern Trust Corp. | | | 35,159 | |
| | 1,522 | | | Platform Specialty Products Corp. ● | | | 39,576 | |
| | 1,314 | | | Platform Specialty Products Corp. PIPE ⌂●† | | | 31,613 | |
| | | | | | | | 219,839 | |
| | | | | Energy - 3.8% | | | | |
| | 656 | | | Baker Hughes, Inc. | | | 34,762 | |
| | 614 | | | Energen Corp. | | | 41,558 | |
| | 355 | | | Pioneer Natural Resources Co. | | | 67,105 | |
| | | | | | | | 143,425 | |
| | | | | Food, Beverage and Tobacco - 1.6% | | | | |
| | 157 | | | Keurig Green Mountain, Inc. | | | 23,788 | |
| | 376 | | | Monster Beverage Corp. ● | | | 37,948 | |
| | | | | | | | 61,736 | |
| | | | | Health Care Equipment and Services - 2.9% | | | | |
| | 285 | | | Becton, Dickinson & Co. | | | 36,726 | |
| | 532 | | | Cerner Corp. ● | | | 33,668 | |
| | 1,066 | | | Envision Healthcare Holdings ● | | | 37,273 | |
| | | | | | | | 107,667 | |
| | | | | Insurance - 1.1% | | | | |
| | 783 | | | American International Group, Inc. | | | 41,937 | |
| | | | | | | | | |
| | | | | Materials - 1.1% | | | | |
| | 340 | | | Martin Marietta Materials, Inc. | | | 39,795 | |
| | | | | | | | | |
| | | | | Media - 1.2% | | | | |
| | 1,345 | | | Twenty-First Century Fox, Inc. | | | 46,361 | |
| | | | | | | | | |
| | | | | Pharmaceuticals, Biotechnology and Life Sciences - 14.8% | | | | |
| | 221 | | | Actavis plc ● | | | 53,748 | |
| | 164 | | | Alnylam Pharmaceuticals, Inc. ● | | | 15,184 | |
| | 655 | | | AstraZeneca plc | | | 47,855 | |
| | 2,160 | | | Bristol-Myers Squibb Co. | | | 125,712 | |
| | 586 | | | Celgene Corp. ● | | | 62,724 | |
| | 387 | | | Covance, Inc. ● | | | 30,942 | |
| | 323 | | | Incyte Corp. ● | | | 21,682 | |
| | 805 | | | Merck & Co., Inc. | | | 46,656 | |
| | 395 | | | Novartis AG | | | 36,634 | |
| | 536 | | | Ono Pharmaceutical Co., Ltd. | | | 54,096 | |
| | 115 | | | Regeneron Pharmaceuticals, Inc. ● | | | 45,351 | |
| | 131 | | | Vertex Pharmaceuticals, Inc. ● | | | 14,732 | |
| | | | | | | | 555,316 | |
| | | | | Real Estate - 1.5% | | | | |
| | 1,160 | | | CBRE Group, Inc. ● | | | 37,119 | |
| | 169 | | | Zillow, Inc. ● | | | 18,374 | |
| | | | | | | | 55,493 | |
| | | | | Retailing - 9.0% | | | | |
| | 274 | | | Advance Automotive Parts, Inc. | | | 40,312 | |
| | 210 | | | Amazon.com, Inc. ● | | | 63,999 | |
| | 117 | | | Honest (The) Co. ⌂●† | | | 2,839 | |
| | 1,192 | | | Lowe's Cos., Inc. | | | 68,207 | |
| | 142 | | | Netflix, Inc. ● | | | 55,686 | |
| | 32 | | | Priceline (The) Group, Inc. ● | | | 38,513 | |
| | 337 | | | Signet Jewelers Ltd. | | | 40,487 | |
| | 418 | | | Tory Burch LLC ⌂●† | | | 27,396 | |
| | | | | | | | 337,439 | |
| | | | | Semiconductors and Semiconductor Equipment - 3.5% | | | | |
| | 294 | | | ASML Holding N.V. | | | 29,266 | |
| | 465 | | | First Solar, Inc. ● | | | 27,413 | |
| | 613 | | | NXP Semiconductors N.V. ● | | | 42,078 | |
| | 1,639 | | | SunEdison, Inc. ● | | | 31,981 | |
| | | | | | | | 130,738 | |
| | | | | Software and Services - 11.2% | | | | |
| | 1,532 | | | Activision Blizzard, Inc. | | | 30,569 | |
| | 763 | | | Akamai Technologies, Inc. ● | | | 45,986 | |
| | 711 | | | Alibaba Group Holding Ltd. ● | | | 70,083 | |
| | 205 | | | Baidu, Inc. ADR ● | | | 48,990 | |
| | 2,620 | | | Cadence Design Systems, Inc. ● | | | 47,026 | |
| | 1,292 | | | Facebook, Inc. ● | | | 96,869 | |
| | 294 | | | Factset Research Systems, Inc. | | | 38,629 | |
| | 156 | | | ServiceNow, Inc. ● | | | 10,592 | |
| | 560 | | | Yelp, Inc. ● | | | 33,587 | |
| | | | | | | | 422,331 | |
| | | | | Technology Hardware and Equipment - 10.8% | | | | |
| | 2,808 | | | Apple, Inc. | | | 303,267 | |
| | 473 | | | F5 Networks, Inc. ● | | | 58,185 | |
| | 750 | | | TE Connectivity Ltd. | | | 45,837 | |
| | | | | | | | 407,289 | |
| | | | | Telecommunication Services - 0.2% | | | | |
| | 347 | | | Zayo Group Holdings, Inc. ● | | | 8,133 | |
| | | | | | | | | |
| | | | | Transportation - 1.4% | | | | |
| | 305 | | | FedEx Corp. | | | 51,076 | |
| | | | | | | | | |
| | | | | Total Common Stocks | | | | |
| | | | | (Cost $3,040,809) | | $ | 3,464,803 | |
The accompanying notes are an integral part of these financial statements.
| The Hartford Growth Opportunities Fund |
| Schedule of Investments – (continued) |
| October 31, 2014 |
| (000’s Omitted) |
| Shares or Principal Amount | | Market Value ╪ | |
| Preferred Stocks - 4.2% | | | | |
| | | | | Capital Goods - 0.5% | | | | |
| | 3,149 | | | Lithium Technology Corp. ⌂●† | | $ | 17,507 | |
| | | | | | | | | |
| | | | | Consumer Durables and Apparel - 0.6% | | | | |
| | 388 | | | Cloudera, Inc. ⌂●† | | | 9,459 | |
| | 924 | | | One Kings Lane, Inc. ⌂●† | | | 14,042 | |
| | | | | | | | 23,501 | |
| | | | | Retailing - 0.2% | | | | |
| | 272 | | | Honest (The) Co. Series C ⌂●†β | | | 6,624 | |
| | | | | | | | | |
| | | | | Software and Services - 2.1% | | | | |
| | 3,330 | | | Apigee Corp. ⌂●† | | | 10,955 | |
| | 5,669 | | | Essence Holding Group ⌂●† | | | 8,068 | |
| | 743 | | | Lookout, Inc. ⌂●† | | | 7,643 | |
| | 156 | | | New Relic, Inc. ⌂●† | | | 4,052 | |
| | 610 | | | Nutanix, Inc. ⌂●† | | | 7,357 | |
| | 578 | | | Uber Technologies, Inc. ⌂●† | | | 32,278 | |
| | 566 | | | Veracode, Inc. ⌂●† | | | 9,410 | |
| | | | | | | | 79,763 | |
| | | | | Technology Hardware and Equipment - 0.6% | | | | |
| | 1,407 | | | DataLogix Holdings ⌂●† | | | 13,043 | |
| | 655 | | | Pure Storage, Inc. ⌂●† | | | 9,269 | |
| | | | | | | | 22,312 | |
| | | | | Telecommunication Services - 0.2% | | | | |
| | 395 | | | DocuSign, Inc. ⌂●† | | | 6,673 | |
| | | | | | | | 6,673 | |
| | | | | Total Preferred Stocks | | | | |
| | | | | (Cost $158,720) | | $ | 156,380 | |
| | | | | | | | | |
| Warrants - 0.0% | | | | |
| | | | | Diversified Financials - 0.0% | | | | |
| | 1,491 | | | Nomad Holdings Ltd. † | | $ | 798 | |
| | | | | | | | | |
| | | | | Total Warrants | | | | |
| | | | | (Cost $15) | | $ | 798 | |
| | | | | | | | | |
| | | | | Total Long-Term Investments | | | | |
| | | | | (Cost $3,199,544) | | $ | 3,621,981 | |
| | | | | | | | | |
| Short-Term Investments - 1.5% | | | | |
| Repurchase Agreements - 1.5% | | | | |
| | | | | Bank of America Merrill Lynch TriParty
Repurchase Agreement (maturing on
11/03/2014 in the amount of $166, collateralized
by U.S. Treasury Note 1.50%, 2019, value of
$169) | | | | |
| $ | 166 | | | 0.08%, 10/31/2014 | | $ | 166 | |
| | | | | Bank of America Merrill Lynch TriParty Repurchase
Agreement (maturing on 11/03/2014 in the
amount of $2,823, collateralized by GNMA
1.63% - 7.00%, 2031 - 2054, value of $2,879) | | | | |
| | 2,822 | | | 0.09%, 10/31/2014 | | | 2,822 | |
| | | | | Bank of Montreal TriParty Repurchase Agreement
(maturing on 11/03/2014 in the amount of $758,
collateralized by U.S. Treasury Bond 2.88% -
5.25%, 2029 - 2043, U.S. Treasury Note 0.38%
- 4.50%, 2015 - 2022, value of $773) | | | | |
| | 758 | | | 0.08%, 10/31/2014 | | | 758 | |
| | | | | Bank of Montreal TriParty Repurchase Agreement
(maturing on 11/03/2014 in the amount of
$2,571, collateralized by FHLMC 2.00% -
5.50%, 2022 - 2034, FNMA 2.00% - 4.50%,
2024 - 2039, GNMA 3.00%, 2043, U.S. Treasury
Note 4.63%, 2017, value of $2,622) | | | | |
| 2,571 | | | 0.10%, 10/31/2014 | | | 2,571 | |
| | | | | Barclays Capital TriParty Repurchase Agreement
(maturing on 11/03/2014 in the amount of
$9,686, collateralized by U.S. Treasury Bond
4.50% - 6.25%, 2023 - 2036, U.S. Treasury
Note 1.63% - 2.13%, 2015 - 2019, value of
$9,880) | | | | |
| | 9,686 | | | 0.08%, 10/31/2014 | | | 9,686 | |
| | | | | Citigroup Global Markets, Inc. TriParty Repurchase
Agreement (maturing on 11/03/2014 in the
amount of $11,133, collateralized by U.S.
Treasury Bill 0.02%, 2015, U.S. Treasury Bond
3.88% - 11.25%, 2015 - 2040, U.S. Treasury
Note 2.00% - 3.38%, 2019 - 2021, value of
$11,356) | | | | |
| | 11,133 | | | 0.09%, 10/31/2014 | | | 11,133 | |
| | | | | Deutsche Bank Securities TriParty Repurchase
Agreement (maturing on 11/03/2014 in the
amount of $643, collateralized by U.S. Treasury
Note 0.88%, 2017, value of $656) | | | | |
| | 643 | | | 0.13%, 10/31/2014 | | | 643 | |
| | | | | RBS Securities, Inc. TriParty Repurchase
Agreement (maturing on 11/03/2014 in the
amount of $946, collateralized by U.S. Treasury
Bond 3.63% - 5.00%, 2037 - 2043, U.S.
Treasury Note 2.13%, 2020, value of $965) | | | | |
| | 946 | | | 0.07%, 10/31/2014 | | | 946 | |
| | | | | Societe Generale TriParty Repurchase Agreement
(maturing on 11/03/2014 in the amount of
$9,966, collateralized by U.S. Treasury Bill
0.02%, 2015, U.S. Treasury Bond 3.75% -
11.25%, 2015 - 2043, U.S. Treasury Note 1.38%
- 4.25%, 2015 - 2022, value of $10,165) | | | | |
| | 9,966 | | | 0.08%, 10/31/2014 | | | 9,966 | |
| | | | | TD Securities TriParty Repurchase Agreement
(maturing on 11/03/2014 in the amount of
$19,313, collateralized by FHLMC 3.00% -
4.00%, 2026 - 2044, FNMA 2.50% - 5.00%,
2025 - 2044, U.S. Treasury Bond 3.50% -
6.50%, 2026 - 2041, U.S. Treasury Note 1.75%
- 2.88%, 2018 - 2019, value of $19,699) | | | | |
| | 19,313 | | | 0.10%, 10/31/2014 | | | 19,313 | |
| | | | | | | | 58,004 | |
| | | | | Total Short-Term Investments | | | | |
| | | | | (Cost $58,004) | | $ | 58,004 | |
| | | | | | | | | |
| | | | | Total Investments | | | | |
| | | | | | | | | |
| | | | | (Cost $3,257,548) ▲ | | | 97.9 | % | | $ | 3,679,985 | |
| | | | | Other Assets and Liabilities | | | 2.1 | % | | | 77,784 | |
| | | | | Total Net Assets | | | 100.0 | % | | $ | 3,757,769 | |
The accompanying notes are an integral part of these financial statements.
| The Hartford Growth Opportunities Fund |
| Schedule of Investments – (continued) |
| October 31, 2014 |
| (000’s Omitted) |
| Note: | Percentage of investments as shown is the ratio of the total market value to total net assets. |
Prices of foreign equities that are principally traded on certain foreign markets may be adjusted daily pursuant to a fair value pricing service approved by the Board of Directors in order to reflect an adjustment for factors occurring after the close of certain foreign markets but before the close of the New York Stock Exchange.
Equity industry classifications used in this report are the Global Industry Classification Standard, which was developed by and is the exclusive property and service mark of MSCI, Inc. and Standard & Poor’s.
For Fund compliance purposes, the Fund may not use the same classification system shown in this report as these classifications are used for reporting ease.
| ▲ | At October 31, 2014, the cost of securities for federal income tax purposes was $3,258,537 and the aggregate gross unrealized appreciation and depreciation based on that cost were: |
| Unrealized Appreciation | | $ | 485,593 | |
| Unrealized Depreciation | | | (64,145 | ) |
| Net Unrealized Appreciation | | $ | 421,448 | |
| † | These securities were valued in good faith at fair value as determined under policies and procedures established by and under the supervision of the Board of Directors. At October 31, 2014, the aggregate fair value of these securities was $236,210, which represents 6.3% of total net assets. This amount excludes securities that are principally traded in certain foreign markets and whose prices are adjusted pursuant to a third party pricing service methodology approved by the Board of Directors. |
| ⌂ | The following securities are considered illiquid. Illiquid securities are often purchased in private placement transactions, are often not registered under the Securities Act of 1933, as amended, and may have contractual restrictions on resale. A security may also be considered illiquid if the security lacks a readily available market or if its valuation has not changed for a certain period of time. |
| Period Acquired | | | Shares/ Par | | | Security | | Cost Basis | |
| 04/2014 | | | | 3,330 | | | Apigee Corp. Preferred | | $ | 9,690 | |
| 02/2014 | | | | 388 | | | Cloudera, Inc. Preferred | | | 5,644 | |
| 05/2014 | | | | 1,407 | | | DataLogix Holdings Preferred | | | 14,493 | |
| 02/2014 | | | | 395 | | | DocuSign, Inc. Preferred | | | 5,191 | |
| 05/2014 | | | | 5,669 | | | Essence Holding Group Preferred | | | 8,964 | |
| 08/2014 | | | | 117 | | | Honest (The) Co. | | | 3,154 | |
| 08/2014 | | | | 272 | | | Honest (The) Co. Series C Preferred | | | 7,360 | |
| 08/2013 | | | | 3,149 | | | Lithium Technology Corp. Preferred | | | 15,347 | |
| 07/2014 | | | | 743 | | | Lookout, Inc. Preferred | | | 8,493 | |
| 04/2014 | | | | 156 | | | New Relic, Inc. Preferred | | | 4,502 | |
| 08/2014 | | | | 610 | | | Nutanix, Inc. Preferred | | | 8,174 | |
| 01/2014 | | | | 924 | | | One Kings Lane, Inc. Preferred | | | 14,243 | |
| 10/2014 | | | | 1,314 | | | Platform Specialty Products Corp. PIPE | | | 33,618 | |
| 04/2014 | | | | 655 | | | Pure Storage, Inc. Preferred | | | 10,299 | |
| 11/2013 | | | | 418 | | | Tory Burch LLC | | | 32,762 | |
| 06/2014 | | | | 578 | | | Uber Technologies, Inc. Preferred | | | 35,865 | |
| 08/2014 | | | | 566 | | | Veracode, Inc. Preferred | | | 10,456 | |
At October 31, 2014, the aggregate value of these securities was $218,228, which represents 5.8% of total net assets.
| ╪ | See Significant Accounting Policies of accompanying Notes to Financial Statements regarding valuation of securities. |
| GLOSSARY: (abbreviations used in preceding Schedule of Investments) |
| |
| Other Abbreviations: |
| ADR | American Depositary Receipt |
| FHLMC | Federal Home Loan Mortgage Corp. |
| FNMA | Federal National Mortgage Association |
| GNMA | Government National Mortgage Association |
| PIPE | Private Investment in Public Equity |
The accompanying notes are an integral part of these financial statements.
| The Hartford Growth Opportunities Fund |
| Schedule of Investments – (continued) |
| October 31, 2014 |
| (000’s Omitted) |
Investment Valuation Hierarchy Level Summary
October 31, 2014
| | | Total | | | Level 1 ♦ | | | Level 2 ♦ | | | Level 3 | |
| Assets: | | | | | | | | | | | | | | | | |
| Common Stocks ‡ | | $ | 3,464,803 | | | $ | 3,191,652 | | | $ | 211,303 | | | $ | 61,848 | |
| Preferred Stocks | | | 156,380 | | | | – | | | | – | | | | 156,380 | |
| Warrants | | | 798 | | | | 798 | | | | – | | | | – | |
| Short-Term Investments | | | 58,004 | | | | – | | | | 58,004 | | | | – | |
| Total | | $ | 3,679,985 | | | $ | 3,192,450 | | | $ | 269,307 | | | $ | 218,228 | |
| ♦ | For the year ended October 31, 2014, investments valued at $6,466 were transferred from Level 1 to Level 2, and there were no transfers from Level 2 to Level 1. Investments are transferred between Level 1 and Level 2 for a variety of reasons including, but not limited to: |
| 1) | Foreign equities for which a fair value price is more representative of exit value than the local market close (transfer into Level 2). Foreign equities for which the local market close is more representative of exit value (transfer into Level 1). |
| 2) | U.S. Treasury securities that no longer represent the most recent issue (transfer into Level 2). |
| 3) | Equity investments with no observable trading but a bid or mean price is used (transfer into Level 2). Equity investments using observable quoted prices in an active market (transfer into Level 1). |
| ‡ | The Fund has all or primarily all of the equity securities categorized in a particular level. Refer to the Schedule of Investments for further industry breakout. |
Following is a reconciliation of Level 3 assets for which significant unobservable inputs were used to determine fair value:
| | | Balance as
of October
31, 2013 | | | Realized
Gain
(Loss) | | | Change in
Unrealized
Appreciation
(Depreciation) | | | Net
Amortization | | | Purchases | | | Sales | | | Transfers
Into
Level 3 * | | | Transfers
Out of
Level 3 * | | | Balance as
of October
31, 2014 | |
| Assets: | | | | | | | | | | | | | | | | | | | | | | | | | | | | | | | | | | | | |
| Common Stocks | | $ | 59,811 | | | $ | — | | | $ | (7,686 | )† | | $ | — | | | $ | 69,535 | | | $ | — | | | $ | — | | | $ | (59,812 | ) | | $ | 61,848 | |
| Preferred Stocks | | | — | | | | — | | | | (805 | )‡ | | | — | | | | 143,373 | | | | — | | | | 13,812 | | | | — | | | | 156,380 | |
| Warrants | | | 87 | | | | — | | | | — | | | | — | | | | — | | | | — | | | | — | | | | (87 | ) | | | — | |
| Total | | $ | 59,898 | | | $ | — | | | $ | (8,491 | ) | | $ | — | | | $ | 212,908 | | | $ | — | | | $ | 13,812 | | | $ | (59,899 | ) | | $ | 218,228 | |
| * | Investments are transferred into and out of Level 3 for a variety of reasons including, but not limited to: |
| 1) | Investments where trading has been halted (transfer into Level 3) or investments where trading has resumed (transfer out of Level 3). |
| 2) | Broker quoted investments (transfer into Level 3) or quoted prices in active markets (transfer out of Level 3). |
| 3) | Investments that have certain restrictions on trading (transfer into Level 3) or investments where trading restrictions have expired (transfer out of Level 3). |
| † | Change in unrealized appreciation (depreciation) in the current period relating to assets still held at October 31, 2014 was $(7,686). |
| ‡ | Change in unrealized appreciation (depreciation) in the current period relating to assets still held at October 31, 2014 was $(805). |
| Note: | For purposes of reporting transfers between different hierarchy levels, both transfers in and out of each level, as applicable, are shown as if they occurred at the beginning of the period. |
The accompanying notes are an integral part of these financial statements.
| The Hartford Growth Opportunities Fund |
| Statement of Assets and Liabilities |
| October 31, 2014 |
| (000’s Omitted) |
| Assets: | | | | |
| Investments in securities, at market value (cost $3,257,548) | | $ | 3,679,985 | |
| Cash | | | — | |
| Receivables: | | | | |
| Investment securities sold | | | 106,215 | |
| Fund shares sold | | | 10,479 | |
| Dividends and interest | | | 2,132 | |
| Other assets | | | 156 | |
| Total assets | | | 3,798,967 | |
| Liabilities: | | | | |
| Payables: | | | | |
| Investment securities purchased | | | 34,878 | |
| Fund shares redeemed | | | 5,057 | |
| Investment management fees | | | 496 | |
| Administrative fees | | | 4 | |
| Distribution fees | | | 126 | |
| Accrued expenses | | | 637 | |
| Total liabilities | | | 41,198 | |
| Net assets | | $ | 3,757,769 | |
| Summary of Net Assets: | | | | |
| Capital stock and paid-in-capital | | $ | 2,672,090 | |
| Undistributed net investment income | | | — | |
| Accumulated net realized gain | | | 663,268 | |
| Unrealized appreciation of investments and the translation of assets and liabilities denominated in foreign currency | | | 422,411 | |
| Net assets | | $ | 3,757,769 | |
| | | | | |
| Shares authorized | | | 23,750,000 | |
| Par value | | $ | 0.0001 | |
| Class A: Net asset value per share/Maximum offering price per share | | | $43.76/$46.31 | |
| Shares outstanding | | | 34,214 | |
| Net assets | | $ | 1,497,082 | |
| Class B: Net asset value per share | | $ | 33.71 | |
| Shares outstanding | | | 661 | |
| Net assets | | $ | 22,277 | |
| Class C: Net asset value per share | | $ | 33.91 | |
| Shares outstanding | | | 7,420 | |
| Net assets | | $ | 251,628 | |
| Class I: Net asset value per share | | $ | 44.82 | |
| Shares outstanding | | | 38,676 | |
| Net assets | | $ | 1,733,488 | |
| Class R3: Net asset value per share | | $ | 44.25 | |
| Shares outstanding | | | 677 | |
| Net assets | | $ | 29,954 | |
| Class R4: Net asset value per share | | $ | 45.39 | |
| Shares outstanding | | | 1,157 | |
| Net assets | | $ | 52,498 | |
| Class R5: Net asset value per share | | $ | 46.36 | |
| Shares outstanding | | | 2,218 | |
| Net assets | | $ | 102,841 | |
| Class Y: Net asset value per share | | $ | 46.70 | |
| Shares outstanding | | | 1,456 | |
| Net assets | | $ | 68,001 | |
The accompanying notes are an integral part of these financial statements.
| The Hartford Growth Opportunities Fund |
| Statement of Operations |
| For the Year Ended October 31, 2014 |
| (000’s Omitted) |
| Investment Income: | | | | |
| Dividends | | $ | 27,473 | |
| Interest | | | 20 | |
| Less: Foreign tax withheld | | | (669 | ) |
| Total investment income | | | 26,824 | |
| | | | | |
| Expenses: | | | | |
| Investment management fees | | | 23,137 | |
| Administrative services fees | | | | |
| Class R3 | | | 54 | |
| Class R4 | | | 70 | |
| Class R5 | | | 89 | |
| Transfer agent fees | | | | |
| Class A | | | 1,912 | |
| Class B | | | 75 | |
| Class C | | | 273 | |
| Class I | | | 2,494 | |
| Class R3 | | | 3 | |
| Class R4 | | | 1 | |
| Class R5 | | | 1 | |
| Class Y | | | 1 | |
| Distribution fees | | | | |
| Class A | | | 3,172 | |
| Class B | | | 237 | |
| Class C | | | 2,159 | |
| Class R3 | | | 136 | |
| Class R4 | | | 117 | |
| Custodian fees | | | 30 | |
| Accounting services fees | | | 392 | |
| Registration and filing fees | | | 317 | |
| Board of Directors' fees | | | 82 | |
| Audit fees | | | 26 | |
| Other expenses | | | 547 | |
| Total expenses (before waivers and fees paid indirectly) | | | 35,325 | |
| Expense waivers | | | (11 | ) |
| Transfer agent fee waivers | | | (4 | ) |
| Commission recapture | | | (102 | ) |
| Total waivers and fees paid indirectly | | | (117 | ) |
| Total expenses, net | | | 35,208 | |
| Net Investment Loss | | | (8,384 | ) |
| Net Realized Gain on Investments, Other Financial Instruments and Foreign Currency Transactions: | | | | |
| Net realized gain on investments | | | 673,980 | |
| Net realized loss on purchased option contracts | | | (1,731 | ) |
| Net realized loss on foreign currency contracts | | | (784 | ) |
| Net realized gain on other foreign currency transactions | | | 751 | |
| Net Realized Gain on Investments, Other Financial Instruments and Foreign Currency Transactions | | | 672,216 | |
| Net Changes in Unrealized Depreciation of Investments, Other Financial Instruments and Foreign Currency Transactions: | | | | |
| Net unrealized depreciation of investments | | | (129,517 | ) |
| Net unrealized appreciation of purchased option contracts | | | 1,496 | |
| Net unrealized depreciation of translation of other assets and liabilities in foreign currencies | | | (24 | ) |
| Net Changes in Unrealized Depreciation of Investments, Other Financial Instruments and Foreign Currency Transactions | | | (128,045 | ) |
| Net Gain on Investments, Other Financial Instruments and Foreign Currency Transactions | | | 544,171 | |
| Net Increase in Net Assets Resulting from Operations | | $ | 535,787 | |
The accompanying notes are an integral part of these financial statements.
| The Hartford Growth Opportunities Fund |
| Statement of Changes in Net Assets |
| |
| (000’s Omitted) |
| | | For the
Year Ended
October 31, 2014 | | | For the
Year Ended
October 31, 2013 | |
| Operations: | | | | | | | | |
| Net investment loss | | $ | (8,384 | ) | | $ | (4,791 | ) |
| Net realized gain on investments, other financial instruments and foreign currency transactions | | | 672,216 | | | | 395,628 | |
| Net unrealized appreciation (depreciation) of investments, other financial instruments and foreign currency transactions | | | (128,045 | ) | | | 205,893 | |
| Net Increase in Net Assets Resulting from Operations | | | 535,787 | | | | 596,730 | |
| Distributions to Shareholders: | | | | | | | | |
| From net realized gain on investments | | | | | | | | |
| Class A | | | (38,220 | ) | | | — | |
| Class B | | | (1,170 | ) | | | — | |
| Class C | | | (8,748 | ) | | | — | |
| Class I | | | (49,466 | ) | | | — | |
| Class R3 | | | (960 | ) | | | — | |
| Class R4 | | | (1,636 | ) | | | — | |
| Class R5 | | | (762 | ) | | | — | |
| Class Y | | | (2,123 | ) | | | — | |
| Total distributions | | | (103,085 | ) | | | — | |
| Capital Share Transactions: | | | | | | | | |
| Class A | | | 344,518 | * | | | 4,120 | * |
| Class B | | | (3,053 | )* | | | (5,190 | )* |
| Class C | | | 53,660 | * | | | 15,469 | * |
| Class I | | | 239,248 | * | | | 108,570 | * |
| Class R3 | | | 1,559 | * | | | 2,216 | * |
| Class R4 | | | 1,982 | * | | | (5,137 | )* |
| Class R5 | | | 68,424 | * | | | 595 | * |
| Class Y | | | (668 | )* | | | (4,471 | )* |
| Net increase from capital share transactions | | | 705,670 | | | | 116,172 | |
| Net Increase in Net Assets | | | 1,138,372 | | | | 712,902 | |
| Net Assets: | | | | | | | | |
| Beginning of period | | | 2,619,397 | | | | 1,906,495 | |
| End of period | | $ | 3,757,769 | | | $ | 2,619,397 | |
| Undistributed (distributions in excess of) net investment income | | $ | — | | | $ | (5,357 | ) |
* Includes merger activity (see Fund Mergers in accompanying Notes to Financial Statements).
The accompanying notes are an integral part of these financial statements.
| The Hartford Growth Opportunities Fund |
| Notes to Financial Statements |
| October 31, 2014 |
| (000’s Omitted) |
Organization:
The Hartford Mutual Funds II, Inc. (“Company”) is an open-end management investment company comprised of four portfolios. Financial statements for The Hartford Growth Opportunities Fund (the "Fund"), a series of the Company, are included in this report.
The Company is organized under the laws of the State of Maryland and is registered with the Securities and Exchange Commission (“SEC”) under the Investment Company Act of 1940, as amended (“1940 Act”). The Fund is a diversified open-end management investment company. The Fund is an investment company and applies specialized accounting and reporting under Accounting Standards Codification Topic 946, Financial Services - Investment Companies.
Class A shares are sold with a front-end sales charge of up to 5.50%. Class B shares were sold with a contingent deferred sales charge which is assessed on the lesser of the per share net asset value (“NAV”) of the shares at the time of redemption or the original purchase price, and declines from up to 5.00% to zero depending on the period of time the shares are held (see note below regarding the closing of Class B shares). Class C shares are sold with a contingent deferred sales charge of up to 1.00% on shares redeemed within twelve months of purchase. Class I shares are sold without sales charges to certain eligible investors primarily through advisory fee-based wrap programs. Class R3, R4 and R5 shares, which are offered to employer-sponsored retirement plans, and Class Y shares, which are sold to certain eligible institutional investors, are sold without a sales charge. All classes of shares have identical voting, redemption, dividend, liquidation and other rights and the same terms and conditions, with the exceptions that each class may have different expenses, which may affect performance, and that Class B shares automatically convert to Class A shares after 8 years.
No new or additional investments are allowed in Class B shares of the Fund (including investments through any systematic investment plan). Existing shareholders of Class B shares may continue to hold their Class B shares, exchange their Class B shares for Class B shares of another Hartford Fund (as permitted by existing exchange privileges), or redeem their Class B shares as described in the Fund’s prospectus. Reinstatement privileges with respect to Class B shares are set forth in the Fund's prospectus. For investors electing to reinvest capital gains and dividends, any such capital gains or dividends on Class B shares will continue to be reinvested in Class B shares of the Fund. All Class B share attributes, including the 12b-1 fee, contingent deferred sales charge schedule, and conversion to Class A shares, remain unchanged.
Significant Accounting Policies:
The following is a summary of significant accounting policies of the Fund in the preparation of its financial statements, which are in accordance with United States generally accepted accounting principles (“U.S. GAAP”). The preparation of financial statements in accordance with U.S. GAAP may require management to make estimates and assumptions that affect the reported amounts of assets and liabilities and disclosure of contingent assets and liabilities at the date of the financial statements and the reported amounts of increases and decreases in net assets from operations during the reporting period. Actual results could differ from those estimates.
Determination of Net Asset Value – The NAV of each class of the Fund's shares is determined as of the close of regular trading (normally 4:00 p.m. Eastern Time) (the “NYSE Close”) on each day that the New York Stock Exchange (the “Exchange”) is open (“Valuation Date”). Information that becomes known to the Fund after the NAV has been calculated on a particular day will not generally be used to retroactively adjust the NAV determined earlier that day.
Investment Valuation and Fair Value Measurements – For purposes of calculating the NAV, portfolio investments and other assets held by the Fund's portfolio for which market quotes are readily available are valued at market value. Market value is generally determined on the basis of last reported sales prices or official close price. If no sales are reported, market value is based on quotes obtained from a quotation reporting system, established market makers, or independent pricing services. If market prices are not readily available or are deemed unreliable, the Fund will use the fair value of the investment as determined in good faith under policies and procedures established by and under the supervision of the Company's Board of Directors. Market quotes are considered not readily available where there is an absence of current or reliable market-based data (e.g., trade information or indicative market quotes), including where events occur after the close of the relevant market, but prior to the NYSE Close, that materially affect the values of the Fund's portfolio investments or assets. In addition, market quotes are considered not readily available when, due to extraordinary circumstances, the exchanges or markets on which the investments trade do not open for trading for the entire day and no other market prices are available. In addition, prices of foreign equities that are principally traded on certain foreign markets may
| The Hartford Growth Opportunities Fund |
| Notes to Financial Statements – (continued) |
| October 31, 2014 |
| (000’s Omitted) |
be adjusted daily pursuant to a fair value pricing service approved by the Board of Directors in order to reflect an adjustment for the factors occurring after the close of certain foreign markets but before the NYSE Close. Investments that are primarily traded on foreign markets may trade on days that are not business days of the Fund. The value of the foreign investments in which the Fund invests may change on days when a shareholder will not be able to purchase or redeem shares of the Fund. Fair value pricing is subjective in nature and the use of fair value pricing by the Fund may cause the NAV of its shares to differ significantly from the NAV that would have been calculated using market prices at the close of the exchange on which a portfolio investment is primarily traded. There can be no assurance that the Fund could obtain the fair market value assigned to an investment if the Fund were to sell the investment at approximately the time at which the Fund determines its NAV.
Investments valued in currencies other than U.S. dollars are converted to U.S. dollars using exchange rates obtained from independent pricing services for calculation of the NAV. As a result, the NAV of the Fund’s shares may be affected by changes in the value of currencies in relation to the U.S. dollar. The value of investments traded in markets outside the United States or denominated in currencies other than the U.S. dollar may be affected significantly on a day that the NYSE is closed and the market value may change on days when an investor is not able to purchase, redeem or exchange shares of the Fund.
Foreign currency contracts represent agreements to exchange currencies on specific future dates at predetermined rates. Foreign currency contracts are valued using foreign currency exchange rates and forward rates as provided by an independent pricing service on the Valuation Date.
Investments in open-end mutual funds are valued at the respective NAV of each open-end mutual fund on the Valuation Date.
Financial instruments for which prices are not available from an independent pricing service may be valued using market quotations obtained from one or more dealers that make markets in the respective financial instrument in accordance with procedures established by the Company's Board of Directors.
U.S. GAAP defines fair value as the price that the Fund would receive to sell an asset or pay to transfer a liability in an orderly transaction between market participants. The U.S. GAAP fair value measurement standards require disclosure of a fair value hierarchy for each major category of assets and liabilities. Various inputs are used in determining the fair value of the Fund’s investments. These inputs are summarized into three broad hierarchy levels. This hierarchy is based on whether the valuation inputs are observable or unobservable. These levels are:
Level 1 – Quoted prices in active markets for identical investments. Level 1 may include exchange traded instruments, such as domestic equities, some foreign equities, options, futures, mutual funds, exchange traded funds, rights and warrants.
Level 2 – Observable inputs other than Level 1 prices, such as quoted prices for similar investments; quoted prices in markets that are not active; or other inputs that are observable or can be corroborated by observable market data. Level 2 may include debt investments that are traded less frequently than exchange traded instruments and which are valued using independent pricing services; foreign equities, which are principally traded on certain foreign markets and are adjusted daily pursuant to a fair value pricing service in order to reflect an adjustment for the factors occurring after the close of certain foreign markets but before the NYSE Close; senior floating rate interests, which are valued using an aggregate of dealer bids; short-term investments, which are valued at amortized cost; and swaps, which are valued based upon the terms of each swap contract.
Level 3 – Significant unobservable inputs that are supported by limited or no market activity. Level 3 may include financial instruments whose values are determined using indicative market quotes or require significant management judgment or estimation. These unobservable valuation inputs may include estimates for current yields, maturity/duration, prepayment speed, and indicative market quotes for comparable investments along with other assumptions relating to credit quality, collateral value, complexity of the investment structure, general market conditions and liquidity. This category may include investments where trading has been halted or there are certain restrictions on trading. While these investments are priced using unobservable inputs, the valuation of these investments reflects the best available data and management believes the prices are a reasonable representation of exit price. For more information on specific valuation techniques and unobservable inputs, please see the following table titled "Quantitative Information about Level 3 Fair Value Measurements."
| The Hartford Growth Opportunities Fund |
| Notes to Financial Statements – (continued) |
| October 31, 2014 |
| (000’s Omitted) |
The Board of Directors of the Company generally reviews and approves the “Procedures for Valuation of Portfolio Securities” at least once a year. These procedures define how investments are to be valued, including the formation and activities of a Valuation Committee. The Valuation Committee is responsible for determining in good faith the fair value of investments when the value cannot be obtained from primary pricing services or alternative sources or if the valuation of an investment as provided by the primary pricing service or alternative source is believed not to reflect the investment’s fair value as of the Valuation Date. Voting members of the Valuation Committee include the Fund’s Treasurer or designee and a Vice President of the investment manager or designee. An Assistant Vice President of the Fund with legal expertise or designee is also included on the Valuation Committee as a non-voting advisory member. In addition, the Fund’s Chief Compliance Officer shall designate a member of the compliance group to attend Valuation Committee meetings as a non-voting resource, to monitor for and provide guidance with respect to compliance with these procedures. Two members of the Valuation Committee or their designees, representing different departments, shall constitute a quorum for purposes of permitting the Valuation Committee to take action. The Valuation Committee will consider all relevant factors in determining an investment’s fair value, and may seek the advice of the Fund’s sub-adviser, knowledgeable brokers, and legal counsel in making such determination. The Valuation Committee reports to the Audit Committee of the Company’s Board of Directors. The Audit Committee receives quarterly written reports which include details of all fair-valued investments, including the reason for the fair valuation, and an indication, when possible, of the accuracy of the valuation by disclosing the next available reliable public price quotation or the disposition price of such investments (the “look-back” test). The Board of Directors then must consider for ratification all of the fair value determinations made during the previous quarter.
Valuation levels are not necessarily indicative of the risk associated with investing in such investments. Individual investments within any of the above mentioned asset classes may be assigned a different hierarchical level than those presented above, as individual circumstances dictate.
| The Hartford Growth Opportunities Fund |
| Notes to Financial Statements – (continued) |
| October 31, 2014 |
| (000’s Omitted) |
For additional information, refer to the Investment Valuation Hierarchy Level Summary and the Level 3 roll-forward reconciliation, if applicable, which follow the Schedule of Investments.
Quantitative Information about Level 3 Fair Value Measurements:
| Security Type/Valuation Technique | | Unobservable Input * | | Input Value(s) Range (Weighted
Average) ‡ | | Fair Value at
October 31, 2014 | |
| Assets: | | | | | | | | |
| Common Stocks | | | | | | | | |
| Cost Δ | | Recent trade price | | $24.35 | | | 2,839 | |
| | | Date | | 8/20/2014 | | | | |
| Intrinsic value Δ | | Parity to underlying security | | $24.06 | | | 31,613 | |
| Model Δ | | Enterprise Value/Estimated 2014 EBITDA | | 11.42x to 18.73x | | | 27,396 | |
| Preferred Stocks |
| Cost Δ | | Recent trade price | | $1.42 - $55.85 ($27.18) | | | 97,744 | |
| | | Date | | 4/16/2014 - 8/26/2014 | | | | |
| Model Δ | | Enterprise Value/Estimated Last Twelve Months EBITDA ◄ | | 0.80x to 2.00x | | | 14,042 | |
| Model Δ | | Enterprise Value/Estimated 2014 Revenue | | 8.20x to 14.30x | | | 10,955 | |
| Model Δ | | Enterprise Value/Estimated 2015 Revenue ■ | | 3.42x to 6.17x | | | 17,507 | |
| Model Δ | | Enterprise Value/Estimated 2015 Revenue | | 6.18x to 14.52x | | | 6,673 | |
| Model Δ | | Enterprise Value/Estimated 2016 Revenue | | 6.50x to 10.40x | | | 9,459 | |
| Total | | | | | | $ | 218,228 | |
| * | Significant changes to any unobservable inputs may result in a significant change to the fair value. |
| ‡ | Unless otherwise noted, inputs were weighted based on the fair value of the investments included in the range. |
| Δ | Includes illiquidity discount of 10%. |
| ◄ | The Option Pricing Method ("OPM") is used to allocate enterprise value between multiple tiers of equity. Inputs for the OPM include: |
| | Volatility - 40% |
| | Term to Liquidity Event - 2.0 years |
| | Risk-free rate - 0.48% |
| ■ | The OPM is used to allocate enterprise values between multiple tiers of equity. The use of the OPM represents a change in methodology from prior year for this investment. Inputs for the OPM include: |
| | Volatility - 40.0% |
| | Term to Liquidity Event - 1.0 years |
| | Risk-free rate - 0.11% |
Investment Transactions and Investment Income – Investment transactions are recorded as of the trade date (the date the order to buy or sell is executed) for financial reporting purposes. Investments purchased or sold on a when-issued or delayed-delivery basis may be settled a month or more after the trade date. Realized gains and losses are determined on the basis of identified cost.
Dividend income from domestic securities is accrued on the ex-dividend date. In general, dividend income from foreign securities is recorded on the ex-date; however, dividend notifications in certain foreign jurisdictions may not be available in a timely manner and as a result, the Fund will record the dividend as soon as the relevant details (i.e., rate per share, payment date, shareholders of record, etc.) are publicly available. Interest income, including amortization of premium, accretion of discounts and additional principal received in-kind in lieu of cash, is accrued on a daily basis.
Foreign Currency Transactions – Assets and liabilities denominated in currencies other than U.S. dollars are translated into U.S. dollars at the exchange rates in effect on the valuation date. Purchases and sales of investments, income and expenses are translated into U.S. dollars at the exchange rates on the dates of such transactions.
The Fund does not isolate that portion of portfolio investment valuation resulting from fluctuations in the foreign currency exchange rates from the fluctuations arising from changes in the market prices of investments held. Exchange rate fluctuations are included with the net realized and unrealized gain or loss on investments in the accompanying financial statements.
Net realized foreign exchange gains or losses arise from sales of foreign currencies and the difference between asset and liability amounts initially stated in foreign currencies and the U.S. dollar value of the amounts actually received or paid. Net unrealized foreign
| The Hartford Growth Opportunities Fund |
| Notes to Financial Statements – (continued) |
| October 31, 2014 |
| (000’s Omitted) |
exchange gains or losses arise from changes in the value of other assets and liabilities at the end of the reporting period, resulting from changes in the exchange rates.
Joint Trading Account – The Fund may invest cash balances into a joint trading account that may be invested in one or more repurchase agreements.
Fund Share Valuation and Dividend Distributions to Shareholders – Orders for the Fund’s shares are executed in accordance with the investment instructions of the shareholders. The NAV of the Fund’s shares is determined as of the close of business on each business day of the Exchange. The NAV is determined separately for each class of shares of the Fund by dividing the Fund’s net assets attributable to that class by the number of shares of the class outstanding. Each class of shares offered by the Fund has equal rights as to assets and voting privileges (except that shareholders of a class have exclusive voting rights regarding any matter relating solely to that class of shares). Income and non-class specific expenses are allocated daily to each class on the basis of the relative net assets of the class. Realized and unrealized gains and losses are allocated daily based on the relative net assets of each class of shares of the Fund.
Orders for the purchase of the Fund’s shares received prior to the close of the Exchange on any day the Exchange is open for business are priced at the NAV determined as of the close of the Exchange. Orders received after the close of the Exchange, or on a day on which the Exchange and/or the Fund is not open for business, are priced at the next determined NAV.
Dividends are declared pursuant to a policy adopted by the Company's Board of Directors based upon the investment performance of the Fund. The policy of the Fund is to pay dividends from net investment income and realized gains, if any, at least once a year.
Net investment income, dividends and distributions from net realized gains and capital are determined in accordance with federal income tax regulations, which may differ from U.S. GAAP with respect to character and timing (see Federal Income Taxes: Distributions and Components of Distributable Earnings and Reclassification of Capital Accounts).
Securities and Other Investments:
Repurchase Agreements – A repurchase agreement is an agreement by which a counterparty agrees to sell an investment and agrees to repurchase the investment sold from the buyer at a mutually agreed upon time and price. During the period of the repurchase agreement, the counterparty will deposit cash and or securities in a third party custodial account to serve as collateral. At the time the Fund enters into a repurchase agreement, the value of the underlying collateral, including accrued interest, will be equal to or exceed the value of the repurchase agreement. Repurchase agreements expose the Fund to counterparty risk - that is, the risk that the counterparty will not fulfill its obligations. To minimize counterparty risk, the investments that serve to collateralize the repurchase agreement are held by the Fund’s custodian in book entry or physical form in the custodial account of the Fund or in a third party custodial account. Repurchase agreements are valued at cost plus accrued interest, which approximates fair value. Repurchase agreements have master netting arrangements which allow the Fund to offset amounts owed to a counterparty with amounts owed by the counterparty, including any collateral. Upon an event of default under a master repurchase agreement, the non-defaulting party may close out all transactions traded under such agreement and net amounts owed under each transaction to one net amount payable by one party to the other. Absent an event of default, the master repurchase agreement does not result in an offset of reported amounts of assets and liabilities in the Statement of Assets and Liabilities across transactions between the Fund and the applicable counterparty. The Fund, as shown on the Schedule of Investments, had outstanding repurchase agreements and related collateral as of October 31, 2014.
Illiquid and Restricted Investments – The Fund is permitted to invest up to 15% of its net assets in illiquid investments. Illiquid investments are those that may not be sold or disposed of in the ordinary course of business within seven days, at approximately the price used to determine the Fund’s NAV. The Fund may not be able to sell illiquid investments when its sub-adviser considers it desirable to do so or may have to sell such investments at a price that is lower than the price that could be obtained if the investments were more liquid. A sale of illiquid investments may require more time and may result in higher dealer discounts and other selling expenses than does the sale of those that are liquid. Illiquid investments also may be more difficult to value due to the unavailability of reliable market quotations for such investments, and an investment in them may have an adverse impact on the Fund’s NAV. The Fund may also purchase certain restricted investments that can only be resold to certain qualified investors and may be determined to
| The Hartford Growth Opportunities Fund |
| Notes to Financial Statements – (continued) |
| October 31, 2014 |
| (000’s Omitted) |
be liquid pursuant to policies and guidelines established by the Company's Board of Directors. The Fund, as shown on the Schedule of Investments, had illiquid or restricted investments as of October 31, 2014.
Investments Purchased on a When-Issued or Delayed-Delivery Basis – Delivery and payment for investments that have been purchased by the Fund on a forward commitment, or when-issued or delayed-delivery basis, take place beyond the customary settlement period. The Fund may dispose of or renegotiate a delayed-delivery transaction after it is entered into, and may sell delayed-delivery investments before they are delivered, which may result in a realized gain or loss. During this period, such investments are subject to market fluctuations, and the Fund identifies investments segregated in its records with a value at least equal to the amount of the commitment. The Fund had no when-issued or delayed-delivery investments as of October 31, 2014.
Financial Derivative Instruments:
The following disclosures contain information on how and why the Fund uses derivative instruments, the credit-risk-related contingent features in certain derivative instruments and how derivative instruments affect the Fund’s financial position and results of operations. The location and fair value amounts of these instruments on the Statement of Assets and Liabilities and the realized gains and losses and changes in unrealized gains and losses on the Statement of Operations, each categorized by type of derivative contract, are included in the following Additional Derivative Instrument Information footnote. The derivative instruments outstanding as of year-end are disclosed in the notes to the Schedule of Investments, if applicable. The amounts of realized gains and losses and changes in unrealized gains and losses on derivative instruments during the year are disclosed in the Statement of Operations.
Foreign Currency Contracts – The Fund may enter into foreign currency contracts that obligate the Fund to purchase or sell currencies at specified future dates. Foreign currency contracts are used to hedge the currency exposure associated with some or all of the Fund’s investments and/or as part of an investment strategy. Foreign currency contracts are marked to market daily and the change in value is recorded by the Fund as an unrealized gain or loss. The Fund will record a realized gain or loss when the foreign currency contract is settled.
Foreign currency contracts involve elements of market risk in excess of the amounts reflected in the Statement of Assets and Liabilities. In addition, risks may arise upon entering into these contracts from the potential inability of the counterparties to meet the terms of the contracts and from unanticipated movements in the value of the foreign currencies relative to the U.S. dollar. The Fund had no outstanding foreign currency contracts as of October 31, 2014.
Options Contracts – An option contract is a contract sold by one party to another party that offers the buyer the right, but not the obligation, to buy (call) or sell (put) an investment or other financial asset at an agreed-upon price during a specific period of time or on a specific date. Options contracts are either privately negotiated in the over-the-counter market ("OTC options") or executed in a registered exchange ("exchange traded options"). The Fund may write (sell) covered call and put options on futures, swaps (“swaptions”), securities, commodities or currencies. “Covered” means that so long as the Fund is obligated as the writer of an option, it will own either the underlying investments or currency or an option to purchase the same underlying investments or currency having an expiration date of the covered option and an exercise price equal to or less than the exercise price of the covered option, or will pledge cash or other liquid investments having a value equal to or greater than the fluctuating market value of the option investment or currency. Writing put options increases the Fund’s exposure to the underlying instrument. Writing call options decreases the Fund’s exposure to the underlying instrument. Premiums received from writing options that expire are treated as realized gains. Premiums received from writing options that are exercised or closed are added to the proceeds or offset amounts paid on the underlying futures, swap, investment or currency transaction to determine the realized gain or loss. The Fund as a writer of an option has no control over whether the underlying instrument may be sold (call) or purchased (put) and as a result bears the market risk of an unfavorable change in the price of the instrument underlying the written option. There is the risk the Fund may not be able to enter into a closing transaction because of an illiquid market. The Fund may also purchase put and call options. Purchasing call options increases the Fund’s exposure to the underlying instrument. Purchasing put options decreases the Fund’s exposure to the underlying instrument. The Fund pays a premium, which is included on the Fund’s Statement of Assets and Liabilities as an investment and is subsequently marked to market to reflect the current value of the option. Premiums paid for purchasing options that expire are treated as realized losses. Certain options may be purchased with premiums to be determined on a future date. The premiums for these options are based upon implied volatility parameters at specified terms. The risk associated with purchasing put and call options is generally limited to the premium paid. Premiums paid for purchasing options that are exercised or closed are added to the amounts paid or
| The Hartford Growth Opportunities Fund |
| Notes to Financial Statements – (continued) |
| October 31, 2014 |
| (000’s Omitted) |
offset against the proceeds on the underlying investment transaction to determine the realized gain or loss. Entering into over-the-counter options also exposes the Fund to counterparty risk. Counterparty risk is the possibility that the counterparty to the agreements may default on its obligation to perform or disagree as to the meaning of the contractual terms in the agreements.
As of October 31, 2014 the Fund had no outstanding purchased option or written option contracts. There were no transactions involving written option contracts during the year ended October 31, 2014.
Additional Derivative Instrument Information:
The volume of derivative activity was minimal during the year ended October 31, 2014.
The Effect of Derivative Instruments on the Statement of Operations for the year ended October 31, 2014:
| | | Risk Exposure Category | |
| | | Interest Rate
Contracts | | | Foreign
Exchange
Contracts | | | Credit
Contracts | | | Equity
Contracts | | | Commodity
Contracts | | | Other
Contracts | | | Total | |
| Realized Loss on Derivatives Recognized as a Result of Operations: | | | | | | | | | | | | | | | | | | | |
| Net realized loss on purchased option contracts | | $ | — | | | $ | — | | | $ | — | | | $ | (1,731 | ) | | $ | — | | | $ | — | | | $ | (1,731 | ) |
| Net realized loss on foreign currency contracts | | | — | | | | (784 | ) | | | — | | | | — | | | | — | | | | — | | | | (784 | ) |
| Total | | $ | — | | | $ | (784 | ) | | $ | — | | | $ | (1,731 | ) | | $ | — | | | $ | — | | | $ | (2,515 | ) |
| Net Change in Unrealized Appreciation (Depreciation) on Derivatives Recognized as a Result of Operations: | | |
| Net change in unrealized appreciation of purchased option contracts | | $ | — | | | $ | — | | | $ | — | | | $ | 1,496 | | | $ | — | | | $ | — | | | $ | 1,496 | |
| Total | | $ | — | | | $ | — | | | $ | — | | | $ | 1,496 | | | $ | — | | | $ | — | | | $ | 1,496 | |
Principal Risks:
The Fund may be exposed to counterparty risk, or the risk that an institution or other entity with which the Fund has unsettled or open transactions will default.
If the Fund invests directly in foreign currencies or in securities that trade in, and receive revenues in, foreign currencies, or in derivatives that provide exposure to foreign currencies, it will be subject to the risk that those currencies will decline in value relative to the base currency (U.S. dollars) of the Fund, or, in the case of hedging positions, that the Fund’s base currency will decline in value relative to the currency being hedged. Currency rates in foreign countries may fluctuate significantly over short periods of time for a number of reasons, including changes in interest rates, intervention (or the failure to intervene) by U.S. or foreign governments, central banks or supranational entities, such as the International Monetary Fund, or by the imposition of currency controls or other political developments in the United States or abroad. As a result, the Fund’s investments in foreign currency denominated securities may reduce the returns of the Fund. The market values of equity securities, such as common stocks and preferred stocks, or equity related investments, such as futures and options, may decline due to general market conditions which are not specifically related to a particular company, such as real or perceived adverse economic conditions, changes in the general outlook for corporate earnings, changes in interest or currency rates or adverse investor sentiment generally. The market value of equity securities may also decline due to factors which affect a particular industry or industries, such as labor shortages or increased production costs and competitive conditions within an industry. Equity securities and equity related investments generally have greater market price volatility than fixed income securities.
Federal Income Taxes:
Federal Income Taxes – For federal income tax purposes, the Fund intends to continue to qualify as a Regulated Investment Company ("RIC") under Subchapter M of the Internal Revenue Code (“IRC”) by distributing substantially all of its taxable net investment income and net realized capital gains to its shareholders and otherwise complying with the requirements of the IRC. The Fund has distributed substantially all of its income and capital gains in prior years, if applicable, and intends to distribute substantially all of its income and capital gains during the calendar year ending December 31, 2014. Accordingly, no provision for federal income or
| The Hartford Growth Opportunities Fund |
| Notes to Financial Statements – (continued) |
| October 31, 2014 |
| (000’s Omitted) |
excise taxes has been made in the accompanying financial statements. Distributions from short-term capital gains are treated as ordinary income distributions for federal income tax purposes.
Net Investment Income (Loss), Net Realized Gains (Losses) and Distributions – Net investment income (loss) and net realized gains (losses) may differ for financial statement and tax purposes primarily because of losses deferred due to wash sale adjustments, foreign currency gains and losses, adjustments related to Passive Foreign Investment Companies ("PFICs"), Real Estate Investment Trusts ("REITs"), RICs, certain derivatives and partnerships. The character of distributions made during the year from net investment income or net realized gains may differ from their ultimate characterization for federal income tax purposes. Also, due to the timing of dividend distributions, the fiscal year in which amounts are distributed may differ from the year that the income or realized gains (losses) were recorded by the Fund.
Distributions and Components of Distributable Earnings – The tax character of distributions paid by the Fund for the periods indicated is as follows (as adjusted for dividends payable, if applicable):
| | | For the Year Ended
October 31, 2014 | | | For the Year Ended
October 31, 2013 | |
| Long-Term Capital Gains ‡ | | $ | 103,085 | | | $ | — | |
| ‡ The Fund designates these distributions as long-term capital gain dividends pursuant to IRC Sec. 852(b)(3)(C). |
As of October 31, 2014, the Fund’s components of distributable earnings (deficit) on a tax basis are as follows:
| | | Amount | |
| Undistributed Ordinary Income | | $ | 160,899 | |
| Undistributed Long-Term Capital Gain | | | 503,358 | |
| Unrealized Appreciation* | | | 421,422 | |
| Total Accumulated Earnings | | $ | 1,085,679 | |
| * | Differences between book-basis and tax-basis unrealized appreciation (depreciation) may be attributable to the losses deferred due to wash sale adjustments, foreign currency gains and losses, adjustments related to PFICs, REITs, RICs, certain derivatives and partnerships. |
Reclassification of Capital Accounts – The Fund may record reclassifications in its capital accounts. These reclassifications have no impact on the total net assets of the Fund. The reclassifications are a result of permanent differences between U.S. GAAP and tax accounting for such items as foreign currency, PFICs, expiration or utilization of capital loss carryforwards or net operating losses. Adjustments are made to reflect the impact these items have on current and future distributions to shareholders. Therefore, the source of the Fund’s distributions may be shown in the accompanying Statement of Changes in Net Assets as from undistributed net investment income, from accumulated net realized gains on investments or from capital depending on the type of book and tax differences that exist. For the year ended October 31, 2014, the Fund recorded reclassifications to increase (decrease) the accounts listed below:
| | | Amount | |
| Undistributed Net Investment Income (Loss) | | $ | 13,741 | |
| Accumulated Net Realized Gain (Loss) | | | (13,741 | ) |
Capital Loss Carryforward – On December 22, 2010, the Regulated Investment Company Modernization Act of 2010 (the “Act”) was enacted, which made changes to the capital loss carryforward rules. The changes are effective for taxable years beginning after the date of enactment. Under the Act, funds are permitted to carry forward capital losses for an unlimited period. Additionally, capital loss carryforwards retain their character as either short-term or long-term capital losses rather than being considered all short-term as permitted under prior regulation.
The Fund had no capital loss carryforward for U.S. federal income tax purposes as of October 31, 2014.
| The Hartford Growth Opportunities Fund |
| Notes to Financial Statements – (continued) |
| October 31, 2014 |
| (000’s Omitted) |
Accounting for Uncertainty in Income Taxes – The Fund has adopted financial reporting rules that require the Fund to analyze all open tax years, as defined by the statute of limitations, for all major jurisdictions. Generally, tax authorities can examine all tax returns filed for the last three years. The Fund does not have an examination in progress.
The Fund has reviewed all open tax years and major jurisdictions and concluded that these financial reporting rules had no effect on the Fund’s financial position or results of operations. There is no tax liability resulting from unrecognized tax benefits relating to uncertain income tax positions taken or expected to be taken on the tax return for the fiscal year ended October 31, 2014. The Fund is also not aware of any tax positions for which it is reasonably possible that the total amounts of unrecognized tax benefits will significantly change in the next twelve months.
Expenses:
Investment Management Agreement – Hartford Funds Management Company, LLC ("HFMC") serves as the Fund’s investment manager pursuant to an Investment Management Agreement with the Company. HFMC is an indirect wholly owned subsidiary of The Hartford Financial Services Group, Inc. ("The Hartford"). The investment manager has overall investment supervisory responsibility for the Fund. In addition, the investment manager provides administrative personnel, services, equipment, facilities and office space for proper operation of the Fund. HFMC has contracted with Wellington Management Company, LLP ("Wellington Management") under a sub-advisory agreement for the provision of day-to-day investment management services to the Fund in accordance with the Fund’s investment objective and policies. The Fund pays a fee to the investment manager, a portion of which may be used to compensate Wellington Management.
The schedule below reflects the rates of compensation paid to the investment manager for investment management services rendered as of October 31, 2014; the rates are accrued daily and paid monthly:
| Average Daily Net Assets | | Annual Fee | |
| On first $250 million | | | 0.8000% | |
| On next $4.75 billion | | | 0.7000% | |
| On next $5 billion | | | 0.6975% | |
| Over $10 billion | | | 0.6950% | |
Accounting Services Agreement – Pursuant to the Fund Accounting Agreement between HFMC and the Company, on behalf of the Fund, HFMC provides accounting services to the Fund and receives monthly compensation based on the Fund’s average daily net assets at the rates set forth below. The Fund’s accounting services fees are accrued daily and paid monthly.
| Average Daily Net Assets | | Annual Fee | |
| On first $5 billion | | | 0.012% | |
| Over $5 billion | | | 0.010% | |
Operating Expenses – Allocable expenses incurred by the Company are allocated to each Fund and allocated to classes within the Fund in proportion to the average daily net assets of the Fund and each class, except where allocation of certain expenses is more fairly made directly to the Fund or to specific classes within a Fund. As of October 31, 2014, HFMC contractually limited the total operating expenses of this Fund, exclusive of taxes, interest expense, brokerage commissions, acquired fund fees and expenses and extraordinary expenses, through February 28, 2015 as follows:
| Class A | | Class B | | Class C | | Class I | | Class R3 | | Class R4 | | Class R5 | | Class Y |
| 1.19% | | 2.05% | | 2.05% | | 0.92% | | 1.45% | | 1.15% | | 0.85% | | 0.85% |
| The Hartford Growth Opportunities Fund |
| Notes to Financial Statements – (continued) |
| October 31, 2014 |
| (000’s Omitted) |
From November 1, 2013 through February 27, 2014, the investment manager contractually limited the total operating expenses of this Fund, exclusive of taxes, interest expense, brokerage commissions, acquired fund fees and expenses and extraordinary expenses as follows:
| Class A | | Class B | | Class C | | Class I | | Class R3 | | Class R4 | | Class R5 | | Class Y |
| 1.21% | | 1.96% | | 1.96% | | 0.96% | | 1.45% | | 1.15% | | 0.85% | | 0.85% |
Fees Paid Indirectly – The Fund has entered into agreements with State Street Global Markets, LLC and Russell Implementation Services, Inc. to partially recapture non-discounted trade commissions. Such rebates are used to pay a portion of the Fund's expenses. For the year ended October 31, 2014, this amount, if any, is included in the Statement of Operations.
The ratio of expenses to average net assets in the accompanying financial highlights excludes the reduction in expenses related to fees paid indirectly. The annualized expense ratio after waivers for the period listed below reflecting the reduction for fees paid indirectly is as follows:
| | | Year Ended
October 31, 2014 | |
| Class A | | | 1.15 | % |
| Class B | | | 2.02 | |
| Class C | | | 1.87 | |
| Class I | | | 0.91 | |
| Class R3 | | | 1.45 | |
| Class R4 | | | 1.15 | |
| Class R5 | | | 0.85 | |
| Class Y | | | 0.75 | |
Distribution and Service Plan for Class A, B, C, R3 and R4 Shares – Hartford Funds Distributors, LLC ("HFD"), an indirect wholly owned subsidiary of The Hartford, is the principal underwriter and distributor of the Fund. HFD is engaged in distribution activities, which include marketing and distribution of shares through broker/dealers, financing distribution costs and maintaining financial books and records. For the year ended October 31, 2014, HFD received front-end load sales charges of $2,284 and contingent deferred sales charges of $24 from the Fund.
The Fund has adopted a Distribution and Service Plan in accordance with Rule 12b-1 of the 1940 Act to compensate the distributor (HFD) for activities intended to result in the sale and distribution of Class A, B, C, R3 and R4 shares and for providing services for shareholders. The Rule 12b-1 plan applicable to Class A shares of the Fund provides for payment of a Rule 12b-1 fee of 0.25% of average daily net assets. Some or all of the fee may be used for shareholder servicing expenses with the remainder used for distribution expenses. Under the Class B Plan, the Fund pays the distributor 1.00% of the average daily net assets of Class B shares that are outstanding for 8 years or less, 0.25% of which is a fee for services provided to existing shareholders with the remainder used for distribution expenses. Some or the entire Rule 12b-1 fee for Class B shares may be remitted to broker/dealers for distribution and/or shareholder account services. After eight years, Class B shares convert to Class A shares. Upon conversion to Class A shares, the Class A plan described above will apply to those shares. Under the Class C Plan, the Fund pays the distributor 1.00% of the average daily net assets of Class C shares outstanding, 0.25% of which is intended as a fee for services provided to existing shareholders with the remainder used for distribution expenses. For Class C shares, some or the entire fee may be remitted to broker/dealers for distribution and/or shareholder account services. Class R3 shares have a distribution fee of 0.50% of average daily net assets and Class R4 shares have a distribution fee of 0.25% of average daily net assets. For Class R3 and R4 shares, some or the entire fee may be remitted to broker/dealers for distribution and/or shareholder account services. The Fund’s 12b-1 fees are accrued daily and paid monthly or at such other intervals as the Board of Directors may determine.
Other Related Party Transactions – Certain officers of the Fund are directors and/or officers of HFMC and/or The Hartford or its subsidiaries. For the year ended October 31, 2014, a portion of the Fund’s Chief Compliance Officer’s compensation was paid by all of the investment companies in the Hartford fund complex. The portion allocated to the Fund, as represented in other expenses on
| The Hartford Growth Opportunities Fund |
| Notes to Financial Statements – (continued) |
| October 31, 2014 |
| (000’s Omitted) |
the Statement of Operations, was in the amount of $5. Hartford Administrative Services Company (“HASCO”), an indirect wholly-owned subsidiary of The Hartford, provides transfer agent services to the Fund. HASCO has contractually agreed to reimburse any portion of the transfer agency fees over 0.30% of average daily net assets per fiscal year for each class. Any transfer agency fee reimbursement is determined before considering the contractual operating expense limitation. For providing such services, HASCO is compensated on a per account basis that varies by account type, except with respect to Class Y, for which it is compensated based on average daily net assets. The amount paid to HASCO and any related contractual reimbursement amounts, if applicable, can be found in the Statement of Operations. These fees are accrued daily and paid monthly.
Administrative services fees are paid to HASCO for third-party recordkeeping services that are payable as a percentage of net assets in the amount of up to 0.20%, 0.15% and 0.10% for Classes R3, R4 and R5 shares, respectively. The total administrative services fees are shown on the Statement of Operations. These fees are accrued daily and paid monthly.
Affiliate Holdings:
As of October 31, 2014, affiliates of The Hartford had ownership of shares in the Fund as follows:
| | | Percentage
of Class | | | | Percentage
of Fund | |
| Class R4 | | | —%* | | | | —%* | |
| * | Percentage rounds to zero. |
Investment Transactions:
For the year ended October 31, 2014, the cost of purchases and proceeds from sales of investment securities (excluding short-term investments) were as follows:
| | | Excluding U.S.
Government
Obligations | | | U.S.
Government
Obligations | | | Total | |
| Cost of Purchases | | $ | 5,057,596 | | | $ | — | | | $ | 5,057,596 | |
| Sales Proceeds | | | 4,700,136 | | | | — | | | | 4,700,136 | |
| The Hartford Growth Opportunities Fund |
| Notes to Financial Statements – (continued) |
| October 31, 2014 |
| (000’s Omitted) |
Capital Share Transactions:
The following information is for the year ended October 31, 2014, and the year ended October 31, 2013:
| | | For the Year Ended October 31, 2014 | | | For the Year Ended October 31, 2013 | |
| | | Shares Sold* | | | Shares Issued
for Reinvested
Dividends | | | Shares
Redeemed | | | Net Increase
(Decrease) of
Shares | | | Shares Sold* | | | Shares Issued
for Reinvested
Dividends | | | Shares
Redeemed | | | Net Increase
(Decrease) of
Shares | |
| Class A | | | | | | | | | | | | | | | | | | | | | | | | | | | | | | | | |
| Shares | | | 12,595 | | | | 981 | | | | (4,767 | ) | | | 8,809 | | | | 4,679 | | | | — | | | | (4,573 | ) | | | 106 | |
| Amount | | $ | 501,567 | | | $ | 37,199 | | | $ | (194,248 | ) | | $ | 344,518 | | | $ | 157,035 | | | $ | — | | | $ | (152,915 | ) | | $ | 4,120 | |
| Class B | | | | | | | | | | | | | | | | | | | | | | | | | | | | | | | | |
| Shares | | | 162 | | | | 35 | | | | (336 | ) | | | (139 | ) | | | 78 | | | | — | | | | (282 | ) | | | (204 | ) |
| Amount | | $ | 6,474 | | | $ | 1,042 | | | $ | (10,569 | ) | | $ | (3,053 | ) | | $ | 2,257 | | | $ | — | | | $ | (7,447 | ) | | $ | (5,190 | ) |
| Class C | | | | | | | | | | | | | | | | | | | | | | | | | | | | | | | | |
| Shares | | | 2,391 | | | | 242 | | | | (994 | ) | | | 1,639 | | | | 1,454 | | | | — | | | | (910 | ) | | | 544 | |
| Amount | | $ | 77,939 | | | $ | 7,150 | | | $ | (31,429 | ) | | $ | 53,660 | | | $ | 39,655 | | | $ | — | | | $ | (24,186 | ) | | $ | 15,469 | |
| Class I | | | | | | | | | | | | | | | | | | | | | | | | | | | | | | | | |
| Shares | | | 15,562 | | | | 923 | | | | (10,441 | ) | | | 6,044 | | | | 15,156 | | | | — | | | | (12,173 | ) | | | 2,983 | |
| Amount | | $ | 637,498 | | | $ | 35,772 | | | $ | (434,022 | ) | | $ | 239,248 | | | $ | 525,939 | | | $ | — | | | $ | (417,369 | ) | | $ | 108,570 | |
| Class R3 | | | | | | | | | | | | | | | | | | | | | | | | | | | | | | | | |
| Shares | | | 220 | | | | 23 | | | | (202 | ) | | | 41 | | | | 228 | | | | — | | | | (166 | ) | | | 62 | |
| Amount | | $ | 9,031 | | | $ | 890 | | | $ | (8,362 | ) | | $ | 1,559 | | | $ | 7,834 | | | $ | — | | | $ | (5,618 | ) | | $ | 2,216 | |
| Class R4 | | | | | | | | | | | | | | | | | | | | | | | | | | | | | | | | |
| Shares | | | 337 | | | | 38 | | | | (325 | ) | | | 50 | | | | 232 | | | | — | | | | (380 | ) | | | (148 | ) |
| Amount | | $ | 14,240 | | | $ | 1,494 | | | $ | (13,752 | ) | | $ | 1,982 | | | $ | 8,052 | | | $ | — | | | $ | (13,189 | ) | | $ | (5,137 | ) |
| Class R5 | | | | | | | | | | | | | | | | | | | | | | | | | | | | | | | | |
| Shares | | | 2,187 | | | | 19 | | | | (485 | ) | | | 1,721 | | | | 157 | | | | — | | | | (140 | ) | | | 17 | |
| Amount | | $ | 88,567 | | | $ | 762 | | | $ | (20,905 | ) | | $ | 68,424 | | | $ | 5,485 | | | $ | — | | | $ | (4,890 | ) | | $ | 595 | |
| Class Y | | | | | | | | | | | | | | | | | | | | | | | | | | | | | | | | |
| Shares | | | 289 | | | | 51 | | | | (291 | ) | | | 49 | | | | 400 | | | | — | | | | (490 | ) | | | (90 | ) |
| Amount | | $ | 9,643 | | | $ | 2,067 | | | $ | (12,378 | ) | | $ | (668 | ) | | $ | 22,859 | | | $ | — | | | $ | (27,330 | ) | | $ | (4,471 | ) |
| Total | | | | | | | | | | | | | | | | | | | | | | | | | | | | | | | | |
| Shares | | | 33,743 | | | | 2,312 | | | | (17,841 | ) | | | 18,214 | | | | 22,384 | | | | — | | | | (19,114 | ) | | | 3,270 | |
| Amount | | $ | 1,344,959 | | | $ | 86,376 | | | $ | (725,665 | ) | | $ | 705,670 | | | $ | 769,116 | | | $ | — | | | $ | (652,944 | ) | | $ | 116,172 | |
* Includes shares issued from merger. Please see the tables immediately following for details. For further information please see Fund Mergers section that follows.
| | | Shares Issued from Merger | |
| | | For the Year Ended October 31, 2014 | |
| | | Shares | | | Amount | |
| Class A | | | 9,620 | | | $ | 380,974 | |
| Class B | | | 145 | | | | 4,455 | |
| Class C | | | 1,244 | | | | 38,336 | |
| Class I | | | 5,901 | | | | 239,063 | |
| Class R3 | | | 28 | | | | 1,124 | |
| Class R4 | | | 87 | | | | 3,581 | |
| Class R5 | | | 1 | | | | 62 | |
| Class Y | | | 134 | | | | 5,663 | |
| | | | 17,160 | | | $ | 673,258 | |
| The Hartford Growth Opportunities Fund |
| Notes to Financial Statements – (continued) |
| October 31, 2014 |
| (000’s Omitted) |
| | | Shares Issued from Merger | |
| | | For the Year Ended October 31, 2013 | |
| | | Shares | | | Amount | |
| Class A | | | 826 | | | $ | 26,790 | |
| Class B | | | 35 | | | | 909 | |
| Class C | | | 249 | | | | 6,406 | |
| Class I | | | 17 | | | | 573 | |
| Class R3 | | | 5 | | | | 154 | |
| Class R4 | | | 4 | | | | 125 | |
| Class R5 | | | 4 | | | | 126 | |
| Class Y | | | 26 | | | | 903 | |
| | | | 1,166 | | | $ | 35,986 | |
The following reflects the conversion of Class B shares into Class A shares (reflected as Class A shares sold) for the year ended October 31, 2014, and the year ended October 31, 2013:
| | | Shares | | | Dollars | |
| For the Year Ended October 31, 2014 | | | 68 | | | $ | 2,767 | |
| For the Year Ended October 31, 2013 | | | 44 | | | $ | 1,471 | |
Fund Mergers:
Reorganization of The Hartford Growth Fund into the Fund – At a meeting held on December 13, 2013, the Board of Directors of The Hartford Mutual Funds II, Inc. approved an Agreement and Plan of Reorganization providing for the acquisition of all the assets and liabilities of The Hartford Growth Fund (“Growth Fund”) by the Fund (“Acquiring Fund”).
Under the terms of the Agreement and Plan of Reorganization, the assets and liabilities of the Growth Fund were acquired by the Fund on April 7, 2014. The Fund acquired the assets and liabilities of the Growth Fund in exchange for shares in the Fund, which were distributed pro rata by the Growth Fund to shareholders, in complete liquidation of the Growth Fund.
The Fund did not acquire any capital loss carryforwards from the Growth Fund.
This merger was accomplished by tax free exchange, as detailed below:
| | | Net assets of Growth
Fund on April 4, 2014* | | | Net assets of
Acquiring Fund
immediately before
merger | | | Net assets of
Acquiring Fund
immediately after
merger | | | Growth Fund shares
exchanged | | | Acquiring Fund
shares issued to the
Growth Fund's
shareholders | |
| | | | | | | | | | | | | | | | | | | | | |
| Class A | | $ | 380,974 | | | $ | 1,035,366 | | | $ | 1,416,340 | | | | 18,178 | | | | 9,620 | |
| Class B | | | 4,455 | | | | 21,626 | | | | 26,081 | | | | 272 | | | | 145 | |
| Class C | | | 38,336 | | | | 190,907 | | | | 229,243 | | | | 2,333 | | | | 1,244 | |
| Class I | | | 239,063 | | | | 1,378,007 | | | | 1,617,070 | | | | 11,132 | | | | 5,901 | |
| Class R3 | | | 1,124 | | | | 25,275 | | | | 26,399 | | | | 53 | | | | 28 | |
| Class R4 | | | 3,581 | | | | 44,072 | | | | 47,653 | | | | 165 | | | | 87 | |
| Class R5 | | | 62 | | | | 96,958 | | | | 97,020 | | | | 3 | | | | 1 | |
| Class Y | | | 5,663 | | | | 61,921 | | | | 67,584 | | | | 252 | | | | 134 | |
| Total | | $ | 673,258 | | | $ | 2,854,132 | | | $ | 3,527,390 | | | | 32,388 | | | | 17,160 | |
* Final day of operations immediately prior to the merger.
| The Hartford Growth Opportunities Fund |
| Notes to Financial Statements – (continued) |
| October 31, 2014 |
| (000’s Omitted) |
The Growth Fund had the following unrealized appreciation, accumulated net realized losses and capital stock as of the merger date:
| Fund | | Undistributed
Income | | | Unrealized
Appreciation
(Depreciation) | | | Accumulated
Net Realized
Gains (Losses) | | | Capital Stock | | | Total | |
| Growth Fund | | $ | — | | | $ | 166,559 | | | $ | (252 | ) | | $ | 506,951 | | | $ | 673,258 | |
Assuming the acquisition had been completed on November 1, 2013, the beginning of the annual reporting period of the Funds, the Fund’s pro forma results of operations for the year ended October 31, 2014, are as follows:
| Fund | | Net Investment Loss | | | Net gain on investments | | | Net increase in net assets
resulting from operations | |
| Acquiring Fund | | $ | (8,554 | ) | | $ | 583,594 | | | $ | 575,040 | |
Because the combined investment portfolios have been managed as a single integrated portfolio since the acquisition was completed, it is not practical to separate the amounts of revenue and earnings of the Growth Fund that have been included in the Fund’s Statement of Operations since the merger date.
Reorganization of The Hartford Fundamental Growth Fund into the Fund: At a Special Meeting of Shareholders held on December 17, 2012, the shareholders of The Hartford Fundamental Growth Fund approved a proposed Agreement and Plan of Reorganization providing for the acquisition of all the assets and liabilities of The Hartford Fundamental Growth Fund (“Fundamental Growth Fund”) by the Fund.
Under the terms of the Agreement and Plan of Reorganization, and pursuant to the approval by the shareholders of the Fundamental Growth Fund, the assets and liabilities were acquired by the Fund on February 22, 2013. The Fund acquired the assets and liabilities of the Fundamental Growth Fund in exchange for shares in the Fund, which were distributed pro rata by the Fundamental Growth Fund to shareholders, in complete liquidation of the Fundamental Growth Fund.
This merger was accomplished by tax free exchange as detailed below:
| | | Net assets of
Fundamental Growth
Fund on February 22,
2013* | | | Net assets of
Acquiring Fund
immediately before
merger | | | Net assets of
Acquiring Fund
immediately after
merger | | | Fundamental Growth
Fund shares
exchanged | | | Acquiring Fund
shares issued to the
Fundamental Growth
Fund's shareholders | |
| | | | | | | | | | | | | | | | |
| Class A | | $ | 26,790 | | | $ | 810,633 | | | $ | 837,423 | | | | 2,793 | | | | 826 | |
| Class B | | | 909 | | | | 23,436 | | | | 24,345 | | | | 105 | | | | 35 | |
| Class C | | | 6,406 | | | | 134,786 | | | | 141,192 | | | | 743 | | | | 249 | |
| Class I | | | 573 | | | | 1,018,343 | | | | 1,018,916 | | | | 59 | | | | 17 | |
| Class R3 | | | 154 | | | | 19,361 | | | | 19,515 | | | | 16 | | | | 5 | |
| Class R4 | | | 125 | | | | 40,011 | | | | 40,136 | | | | 12 | | | | 4 | |
| Class R5 | | | 126 | | | | 16,678 | | | | 16,804 | | | | 13 | | | | 4 | |
| Class Y | | | 903 | | | | 53,960 | | | | 54,863 | | | | 90 | | | | 26 | |
| Total | | $ | 35,986 | | | $ | 2,117,208 | | | $ | 2,153,194 | | | | 3,831 | | | | 1,166 | |
* Final day of operations immediately prior to the merger.
The Fundamental Growth Fund had the following unrealized appreciation, accumulated net realized losses and capital stock as of the merger date:
| Fund | | Undistributed
Income | | | Unrealized
Appreciation
(Depreciation) | | | Accumulated
Net Realized
Gains (Losses) | | | Capital Stock | | | Total | |
| Fundamental Growth Fund | | $ | — | | | $ | 2,958 | | | $ | (894 | ) | | $ | 33,922 | | | $ | 35,986 | |
| The Hartford Growth Opportunities Fund |
| Notes to Financial Statements – (continued) |
| October 31, 2014 |
| (000’s Omitted) |
Assuming the acquisition had been completed on November 1, 2012, the beginning of the annual reporting period of the Funds, the Fund’s pro forma results of operations for the year ended October 31, 2013, are as follows:
| Fund | | Net Investment Loss | | | Net gain on investments | | | Net increase in net assets
resulting from operations | |
| Acquiring Fund | | $ | (4,566 | ) | | $ | 607,439 | | | $ | 602,873 | |
Because the combined investment portfolios have been managed as a single integrated portfolio since the acquisition was completed, it is not practical to separate the amounts of revenue and earnings of the Fundamental Growth Fund that have been included in the Fund’s Statement of Operations since the merger date.
Line of Credit:
The Fund is one of several Hartford Funds that participate in a $500 million committed revolving line of credit facility. The facility is to be used for temporary or emergency purposes. Under the arrangement, the funds are required to own securities having a market value in excess of 300% of the total bank borrowings. The interest rate on borrowings varies depending on the nature of the loan. The facility also requires a fee to be paid based on the amount of the commitment. This commitment fee is allocated to all the funds participating in the line of credit based on the average net assets of the funds. During the year ended October 31, 2014, the Fund did not have any borrowings under this facility.
Pending Legal Proceedings:
On February 25, 2011, Jennifer L. Kasilag, Louis Mellinger, Judith M. Menendez, Jacqueline M. Robinson, and Linda A. Russell filed a derivative lawsuit against Hartford Investment Financial Services, LLC (“HIFSCO”) (now known as HFD) on behalf of six Hartford retail mutual funds in the United States District Court for the District of New Jersey, alleging that HIFSCO received excessive advisory and distribution fees in violation of its statutory fiduciary duty under Section 36(b) of the 1940 Act when serving as investment manager and principal underwriter, respectively, to the Hartford retail mutual funds. Although this action was purportedly filed on behalf of certain of the Hartford Funds, none of the Hartford Funds is itself a defendant to the suit. HIFSCO moved to dismiss and, in September 2011, the motion was granted in part and denied in part, with leave to amend the complaint. In November 2011, plaintiffs filed an amended complaint on behalf of certain Hartford retail mutual funds, The Hartford Global Health Fund (now known as The Hartford Healthcare Fund), The Hartford Conservative Allocation Fund, The Hartford Growth Opportunities Fund, The Hartford Inflation Plus Fund, The Hartford Advisers Fund (now known as The Hartford Balanced Fund), and The Hartford Capital Appreciation Fund. Plaintiffs seek to rescind the investment management agreements and distribution plans between HIFSCO and these funds and to recover the total fees charged thereunder or, in the alternative, to recover any improper compensation HIFSCO received, in addition to lost earnings. HIFSCO filed a partial motion to dismiss the amended complaint and, in December 2012, the court dismissed without prejudice the claims regarding distribution fees and denied the motion with respect to the advisory fees claims. HIFSCO disputes the allegations and intends to defend vigorously.
In March 2014, the plaintiffs filed a new complaint that added as new plaintiffs The Hartford Floating Rate Fund and The Hartford Small Company Fund and named as a defendant HFMC, which assumed the role as investment manager to the funds as of January 2013. HFMC and HIFSCO dispute the allegations and intend to defend vigorously.
No accrual for litigation relating to this matter has been recorded in the financial statements of the Fund because the Fund is not party to the suit.
Indemnifications:
Under the Company's organizational documents, the Company shall indemnify its officers and directors to the full extent required or permitted under Maryland General Corporation Law and the federal securities laws. In addition, the Company, on behalf of the Fund, may enter into contracts that contain a variety of indemnifications. The Company's maximum exposure under these arrangements is unknown. However, as of the date of these financial statements, the Company has not had prior claims or losses pursuant to these contracts and expects the risk of loss to be remote.
| The Hartford Growth Opportunities Fund |
| Notes to Financial Statements – (continued) |
| October 31, 2014 |
| (000’s Omitted) |
Subsequent Events:
At the August 5-6, 2014 meeting, the Board of Directors approved the creation of Class R6 shares for the Fund. Class R6 shares launched on November 7, 2014. In connection with the launch of the Class R6 shares, an updated prospectus, dated November 7, 2014, and Statement of Additional Information, dated March 1, 2014, as amended November 7, 2014, for the Fund were filed with the U.S. Securities and Exchange Commission.
Effective December 1, 2014, pursuant to a sub-transfer agency agreement between HASCO and Boston Financial Data Services, Inc. (“BFDS”), HASCO has delegated certain transfer agent, dividend disbursing agent and shareholder servicing agent functions to BFDS. The costs and expenses of such delegation are borne by HASCO, not by the Fund.
| The Hartford Growth Opportunities Fund |
Financial Highlights |
| | | - Selected Per-Share Data - (A) | | | - Ratios and Supplemental Data - | |
| Class | | Net Asset
Value at
Beginning
of Period | | | Net
Investment
Income
(Loss) | | | Net
Realized
and
Unrealized
Gain
(Loss) on
Invest-
ments | | | Total from
Investment
Operations | | | Dividends
from Net
Investment
Income | | | Distribu-
tions from
Realized
Capital
Gains | | | Total
Dividends
and
Distributions | | | Net Asset
Value at
End of
Period | | | Total
Return(B) | | | Net Assets
at End of
Period
(000's) | | | Ratio of
Expenses
to
Average
Net
Assets
Before
Adjust-
ments(C) | | | Ratio of
Expenses
to
Average
Net
Assets
After
Adjust-
ments(C) | | | Ratio of
Net
Investment
Income
(Loss) to
Average
Net Assets | |
| For the Year Ended October 31, 2014 | | | | | | | | | | | | | | | | | | | | | | | | | | | | | | | | | | | | | | | | | | |
| A | | $ | 38.68 | | | $ | (0.13 | ) | | $ | 6.72 | | | $ | 6.59 | | | $ | – | | | $ | (1.51 | ) | | $ | (1.51 | ) | | $ | 43.76 | | | | 17.63 | % | | $ | 1,497,082 | | | | 1.15 | % | | | 1.15 | % | | | (0.33 | )% |
| B | | | 30.38 | | | | (0.37 | ) | | | 5.21 | | | | 4.84 | | | | – | | | | (1.51 | ) | | | (1.51 | ) | | | 33.71 | | | | 16.65 | | | | 22,277 | | | | 2.07 | | | | 2.02 | | | | (1.18 | ) |
| C | | | 30.51 | | | | (0.33 | ) | | | 5.24 | | | | 4.91 | | | | – | | | | (1.51 | ) | | | (1.51 | ) | | | 33.91 | | | | 16.81 | | | | 251,628 | | | | 1.88 | | | | 1.88 | | | | (1.05 | ) |
| I | | | 39.49 | | | | (0.04 | ) | | | 6.88 | | | | 6.84 | | | | – | | | | (1.51 | ) | | | (1.51 | ) | | | 44.82 | | | | 17.92 | | | | 1,733,488 | | | | 0.91 | | | | 0.91 | | | | (0.09 | ) |
| R3 | | | 39.21 | | | | (0.26 | ) | | | 6.81 | | | | 6.55 | | | | – | | | | (1.51 | ) | | | (1.51 | ) | | | 44.25 | | | | 17.28 | | | | 29,954 | | | | 1.46 | | | | 1.45 | | | | (0.62 | ) |
| R4 | | | 40.06 | | | | (0.14 | ) | | | 6.98 | | | | 6.84 | | | | – | | | | (1.51 | ) | | | (1.51 | ) | | | 45.39 | | | | 17.65 | | | | 52,498 | | | | 1.15 | | | | 1.15 | | | | (0.32 | ) |
| R5 | | | 40.76 | | | | (0.02 | ) | | | 7.13 | | | | 7.11 | | | | – | | | | (1.51 | ) | | | (1.51 | ) | | | 46.36 | | | | 18.02 | | | | 102,841 | | | | 0.85 | | | | 0.85 | | | | (0.05 | ) |
| Y | | | 41.02 | | | | 0.03 | | | | 7.16 | | | | 7.19 | | | | – | | | | (1.51 | ) | | | (1.51 | ) | | | 46.70 | | | | 18.11 | | | | 68,001 | | | | 0.75 | | | | 0.75 | | | | 0.08 | |
| | | | | | | | | | | | | | | | | | | | | | | | | | | | | | | | | | | | | | | | | | | | | | | | | | | | | |
| For the Year Ended October 31, 2013 | | | | | | | | | | | | | | | | | | | | | | | | | | | | | | | | | | | | | | | | | | |
| A | | $ | 29.60 | | | $ | (0.10 | ) | | $ | 9.18 | | | $ | 9.08 | | | $ | – | | | $ | – | | | $ | – | | | $ | 38.68 | | | | 30.68 | % | | $ | 982,699 | | | | 1.19 | % | | | 1.19 | % | | | (0.30 | )% |
| B | | | 23.43 | | | | (0.28 | ) | | | 7.23 | | | | 6.95 | | | | – | | | | – | | | | – | | | | 30.38 | | | | 29.66 | | | | 24,296 | | | | 2.11 | | | | 1.96 | | | | (1.05 | ) |
| C | | | 23.52 | | | | (0.27 | ) | | | 7.26 | | | | 6.99 | | | | – | | | | – | | | | – | | | | 30.51 | | | | 29.72 | | | | 176,392 | | | | 1.90 | | | | 1.90 | | | | (1.01 | ) |
| I | | | 30.14 | | | | (0.01 | ) | | | 9.36 | | | | 9.35 | | | | – | | | | – | | | | – | | | | 39.49 | | | | 31.02 | | | | 1,288,778 | | | | 0.92 | | | | 0.92 | | | | (0.03 | ) |
| R3 | | | 30.09 | | | | (0.19 | ) | | | 9.31 | | | | 9.12 | | | | – | | | | – | | | | – | | | | 39.21 | | | | 30.31 | | | | 24,924 | | | | 1.46 | | | | 1.45 | | | | (0.56 | ) |
| R4 | | | 30.64 | | | | (0.09 | ) | | | 9.51 | | | | 9.42 | | | | – | | | | – | | | | – | | | | 40.06 | | | | 30.74 | | | | 44,353 | | | | 1.15 | | | | 1.15 | | | | (0.25 | ) |
| R5 | | | 31.09 | | | | 0.01 | | | | 9.66 | | | | 9.67 | | | | – | | | | – | | | | – | | | | 40.76 | | | | 31.10 | | | | 20,243 | | | | 0.85 | | | | 0.85 | | | | 0.04 | |
| Y | | | 31.25 | | | | 0.05 | | | | 9.72 | | | | 9.77 | | | | – | | | | – | | | | – | | | | 41.02 | | | | 31.26 | | | | 57,712 | | | | 0.75 | | | | 0.75 | | | | 0.14 | |
| | | | | | | | | | | | | | | | | | | | | | | | | | | | | | | | | | | | | | | | | | | | | | | | | | | | | |
| For the Year Ended October 31, 2012 | | | | | | | | | | | | | | | | | | | | | | | | | | | | | | | | | | | | | | | | | | |
| A | | $ | 25.98 | | | $ | (0.15 | ) | | $ | 3.77 | | | $ | 3.62 | | | $ | – | | | $ | – | | | $ | – | | | $ | 29.60 | | | | 13.93 | % | | $ | 748,795 | | | | 1.23 | % | | | 1.21 | % | | | (0.54 | )% |
| B | | | 20.72 | | | | (0.28 | ) | | | 2.99 | | | | 2.71 | | | | – | | | | – | | | | – | | | | 23.43 | | | | 13.08 | | | | 23,529 | | | | 2.15 | | | | 1.96 | | | | (1.29 | ) |
| C | | | 20.80 | | | | (0.28 | ) | | | 3.00 | | | | 2.72 | | | | – | | | | – | | | | – | | | | 23.52 | | | | 13.08 | | | | 123,174 | | | | 1.93 | | | | 1.93 | | | | (1.26 | ) |
| I | | | 26.39 | | | | (0.08 | ) | | | 3.83 | | | | 3.75 | | | | – | | | | – | | | | – | | | | 30.14 | | | | 14.21 | | | | 893,563 | | | | 0.95 | | | | 0.95 | | | | (0.28 | ) |
| R3 | | | 26.48 | | | | (0.22 | ) | | | 3.83 | | | | 3.61 | | | | – | | | | – | | | | – | | | | 30.09 | | | | 13.63 | | | | 17,259 | | | | 1.48 | | | | 1.45 | | | | (0.78 | ) |
| R4 | | | 26.89 | | | | (0.14 | ) | | | 3.89 | | | | 3.75 | | | | – | | | | – | | | | – | | | | 30.64 | | | | 13.95 | | | | 38,458 | | | | 1.16 | | | | 1.15 | | | | (0.47 | ) |
| R5 | | | 27.20 | | | | (0.05 | ) | | | 3.94 | | | | 3.89 | | | | – | | | | – | | | | – | | | | 31.09 | | | | 14.30 | | | | 14,935 | | | | 0.86 | | | | 0.85 | | | | (0.17 | ) |
| Y | | | 27.32 | | | | (0.03 | ) | | | 3.96 | | | | 3.93 | | | | – | | | | – | | | | – | | | | 31.25 | | | | 14.39 | | | | 46,782 | | | | 0.76 | | | | 0.76 | | | | (0.09 | ) |
| | | | | | | | | | | | | | | | | | | | | | | | | | | | | | | | | | | | | | | | | | | | | | | | | | | | | |
| For the Year Ended October 31, 2011 | | | | | | | | | | | | | | | | | | | | | | | | | | | | | | | | | | | | | | | | | | |
| A(D) | | $ | 24.78 | | | $ | 0.02 | | | $ | 1.18 | | | $ | 1.20 | | | $ | – | | | $ | – | | | $ | – | | | $ | 25.98 | | | | 4.84 | % | | $ | 754,532 | | | | 1.22 | % | | | 1.22 | % | | | 0.06 | % |
| B | | | 19.93 | | | | (0.29 | ) | | | 1.08 | | | | 0.79 | | | | – | | | | – | | | | – | | | | 20.72 | | | | 3.96 | | | | 27,884 | | | | 2.13 | | | | 2.04 | | | | (1.32 | ) |
| C | | | 19.98 | | | | (0.26 | ) | | | 1.08 | | | | 0.82 | | | | – | | | | – | | | | – | | | | 20.80 | | | | 4.10 | | | | 128,016 | | | | 1.92 | | | | 1.92 | | | | (1.20 | ) |
| I | | | 25.10 | | | | (0.06 | ) | | | 1.35 | | | | 1.29 | | | | – | | | | – | | | | – | | | | 26.39 | | | | 5.14 | | | | 791,091 | | | | 0.92 | | | | 0.92 | | | | (0.22 | ) |
| R3 | | | 25.31 | | | | (0.20 | ) | | | 1.37 | | | | 1.17 | | | | – | | | | – | | | | – | | | | 26.48 | | | | 4.62 | | | | 13,444 | | | | 1.48 | | | | 1.45 | | | | (0.74 | ) |
| R4 | | | 25.63 | | | | (0.12 | ) | | | 1.38 | | | | 1.26 | | | | – | | | | – | | | | – | | | | 26.89 | | | | 4.92 | | | | 36,249 | | | | 1.16 | | | | 1.15 | | | | (0.43 | ) |
| R5 | | | 25.85 | | | | (0.04 | ) | | | 1.39 | | | | 1.35 | | | | – | | | | – | | | | – | | | | 27.20 | | | | 5.22 | | | | 14,132 | | | | 0.86 | | | | 0.85 | | | | (0.15 | ) |
| Y | | | 25.94 | | | | (0.01 | ) | | | 1.39 | | | | 1.38 | | | | – | | | | – | | | | – | | | | 27.32 | | | | 5.32 | | | | 98,278 | | | | 0.76 | | | | 0.76 | | | | (0.04 | ) |
See Portfolio Turnover information on the next page.
| The Hartford Growth Opportunities Fund |
| Financial Highlights – (continued) |
| | | - Selected Per-Share Data - (A) | | | - Ratios and Supplemental Data - | |
Class | | Net Asset
Value at
Beginning
of Period | | | Net
Investment
Income
(Loss) | | | Net
Realized
and
Unrealized
Gain
(Loss) on
Invest-
ments | | | Total from
Investment
Operations | | | Dividends
from Net
Investment
Income | | | Distribu-
tions from
Realized
Capital
Gains | | | Total
Dividends
and
Distributions | | | Net Asset
Value at
End of
Period | �� | | Total
Return(B) | | | Net Assets
at End of
Period
(000's) | | | Ratio of
Expenses
to
Average
Net
Assets
Before
Adjust-
ments(C) | | | Ratio of
Expenses
to
Average
Net
Assets
After
Adjust-
ments(C) | | | Ratio of
Net
Investment
Income
(Loss) to
Average
Net Assets | |
| For the Year Ended October 31, 2010 | | | | | | | | | | | | | | | | | | | | | | | | | | | | | | | | | | | | | | | | | | |
| A | | $ | 20.69 | | | $ | (0.13 | ) | | $ | 4.22 | | | $ | 4.09 | | | $ | – | | | $ | – | | | $ | – | | | $ | 24.78 | | | | 19.77 | % | | $ | 431,465 | | | | 1.35 | % | | | 1.32 | % | | | (0.57 | )% |
| B | | | 16.77 | | | | (0.25 | ) | | | 3.41 | | | | 3.16 | | | | – | | | | – | | | | – | | | | 19.93 | | | | 18.84 | | | | 34,559 | | | | 2.18 | | | | 2.07 | | | | (1.33 | ) |
| C | | | 16.78 | | | | (0.23 | ) | | | 3.43 | | | | 3.20 | | | | – | | | | – | | | | – | | | | 19.98 | | | | 19.07 | | | | 156,903 | | | | 1.95 | | | | 1.95 | | | | (1.21 | ) |
| I | | | 20.91 | | | | (0.05 | ) | | | 4.28 | | | | 4.23 | | | | (0.04 | ) | | | – | | | | (0.04 | ) | | | 25.10 | | | | 20.23 | | | | 495,439 | | | | 0.93 | | | | 0.93 | | | | (0.22 | ) |
| R3 | | | 21.17 | | | | (0.18 | ) | | | 4.32 | | | | 4.14 | | | | – | | | | – | | | | – | | | | 25.31 | | | | 19.56 | | | | 10,772 | | | | 1.49 | | | | 1.49 | | | | (0.77 | ) |
| R4 | | | 21.37 | | | | (0.10 | ) | | | 4.36 | | | | 4.26 | | | | – | | | | – | | | | – | | | | 25.63 | | | | 19.93 | | | | 42,770 | | | | 1.17 | | | | 1.17 | | | | (0.44 | ) |
| R5 | | | 21.52 | | | | (0.03 | ) | | | 4.40 | | | | 4.37 | | | | (0.04 | ) | | | – | | | | (0.04 | ) | | | 25.85 | | | | 20.34 | | | | 14,203 | | | | 0.87 | | | | 0.87 | | | | (0.14 | ) |
| Y | | | 21.59 | | | | (0.01 | ) | | | 4.42 | | | | 4.41 | | | | (0.06 | ) | | | – | | | | (0.06 | ) | | | 25.94 | | | | 20.44 | | | | 136,662 | | | | 0.77 | | | | 0.77 | | | | (0.04 | ) |
| (A) | Information presented relates to a share outstanding throughout the indicated period. Net investment income (loss) per share amounts are calculated based on average shares outstanding unless otherwise noted. |
| (B) | Assumes initial investment at net asset value at the beginning of each period, reinvestment of all distributions, the complete redemption of the investment at net asset value at the end of each period and no sales charge. Total return would be reduced if sales charges were taken into account. |
| (C) | Adjustments include waivers and reimbursements, if applicable. Ratios do not include fees paid indirectly (see Expenses in the accompanying Notes to Financial Statements). |
| (D) | Class L was merged into Class A on August 5, 2011. |
| | | Portfolio Turnover
Rate for
All Share Classes | |
| For the Year Ended October 31, 2014 | | | 136 | %(A) |
| For the Year Ended October 31, 2013 | | | 120 | (B) |
| For the Year Ended October 31, 2012 | | | 116 | |
| For the Year Ended October 31, 2011 | | | 121 | |
| For the Year Ended October 31, 2010 | | | 115 | |
| (A) | During the year ended October 31, 2014, the Fund incurred $415.5 million in sales of securities held associated with the transition of assets from The Hartford Growth Fund, which merged into the Fund on April 7, 2014. These sales are excluded from the portfolio turnover rate calculation. |
| (B) | During the year ended October 31, 2013, the Fund incurred $2.8 million in sales of securities held associated with the transition of assets from The Hartford Fundamental Growth Fund, which merged into the Fund on February 22, 2013. These sales are excluded from the portfolio turnover rate calculation. |
| Report of Independent Registered Public Accounting Firm |
| The Board of Directors and Shareholders of |
| The Hartford Mutual Funds II, Inc. |
| We have audited the accompanying statement of assets and liabilities, including the schedule of investments, of The Hartford Growth Opportunities Fund (one of the portfolios constituting The Hartford Mutual Funds II, Inc. (the Funds)) as of October 31, 2014, and the related statement of operations for the year then ended, the statements of changes in net assets for each of the two years in the period then ended, and the financial highlights for each of the five years in the period then ended. These financial statements and financial highlights are the responsibility of the Funds’ management. Our responsibility is to express an opinion on these financial statements and financial highlights based on our audits. |
| We conducted our audits in accordance with the standards of the Public Company Accounting Oversight Board (United States). Those standards require that we plan and perform the audit to obtain reasonable assurance about whether the financial statements and financial highlights are free of material misstatement. We were not engaged to perform an audit of the Funds’ internal control over financial reporting. Our audits included consideration of internal control over financial reporting as a basis for designing audit procedures that are appropriate in the circumstances, but not for the purpose of expressing an opinion on the effectiveness of the Funds’ internal control over financial reporting. Accordingly, we express no such opinion. An audit also includes examining, on a test basis, evidence supporting the amounts and disclosures in the financial statements and financial highlights, assessing the accounting principles used and significant estimates made by management, and evaluating the overall financial statement presentation. Our procedures included confirmation of securities owned as of October 31, 2014, by correspondence with the custodian and brokers or by other appropriate auditing procedures where replies from brokers were not received. We believe that our audits provide a reasonable basis for our opinion. |
| In our opinion, the financial statements and financial highlights referred to above present fairly, in all material respects, the financial position of The Hartford Growth Opportunities Fund of The Hartford Mutual Funds II, Inc. at October 31, 2014, the results of its operations for the year then ended, the changes in its net assets for each of the two years in the period then ended, and the financial highlights for each of the five years in the period then ended, in conformity with U.S. generally accepted accounting principles. |
| |  |
Minneapolis, Minnesota
December 18, 2014
| The Hartford Growth Opportunities Fund |
Directors and Officers (Unaudited) |
The Board of Directors of the Company (the "Directors") appoints officers who are responsible for the day-to-day operations of the Fund and who execute policies formulated by the Directors. Each Director serves until his or her death, resignation, or retirement or until the next annual meeting of shareholders is held or until his or her successor is elected and qualifies.
Directors and officers who are employed by or who have a financial interest in The Hartford Financial Services Group, Inc. ("The Hartford") are considered “interested” persons of the Fund pursuant to the 1940 Act. Each officer and two of the Company's Directors, as noted in the chart below, are “interested” persons of the Fund. Each Director serves as a director for The Hartford Mutual Funds, Inc., The Hartford Mutual Funds II, Inc., Hartford Series Fund, Inc., and Hartford HLS Series Fund II, Inc., and as a trustee for The Hartford Alternative Strategies Fund, which, as of October 31, 2014, collectively consist of 66 funds. Correspondence may be sent to Directors and officers c/o Hartford Funds, 5 Radnor Corporate Center, Suite 300, 100 Matsonford Road, Radnor, Pennsylvania 19087, except that correspondence to Mr. Annoni, Mr. Dressen and Ms. Quade may be sent to 500 Bielenberg Drive, Suite 500, Woodbury, Minnesota 55125.
The table below sets forth, for each Director and officer, his or her name, year of birth, current position with the Company and date first elected or appointed to The Hartford Mutual Funds, Inc. ("MF") and The Hartford Mutual Funds II, Inc. ("MF2"), principal occupation, and, for Directors, other directorships held. The Fund’s Statement of Additional Information contains further information on the Directors and is available free of charge by calling 1-888-843-7824 or writing to: Hartford Funds, P.O. Box 55022, Boston, MA 02205-5022.
Information on the aggregate remuneration paid to the directors of the Company can be found in the Statement of Operations herein. The Fund pays to The Hartford a portion of the Chief Compliance Officer’s compensation, but does not pay salaries or compensation to any of its other officers or Directors who are employed by The Hartford.
Non-Interested Directors
Hilary E. Ackermann (1956) Director since September 23, 2014
Ms. Ackermann served as Chief Risk Officer at Goldman Sachs Bank USA from October 2008 to November 2011 and serves as a Director of Dynegy, Inc., an independent power company, from October 2012 to present.
Lynn S. Birdsong (1946) Director since 2003, Chairman of the Investment Committee since 2014
Mr. Birdsong is a private investor. Mr. Birdsong currently serves as a Director of the Sovereign High Yield Investment Company (April 2010 to current). Mr. Birdsong currently serves as an Independent Director of Nomura Partners Funds, Inc. (formerly, The Japan Fund) (April 2003 to current). From 2003 to March 2005, Mr. Birdsong was an Independent Director of the Atlantic Whitehall Funds. From 1979 to 2002, Mr. Birdsong was a Managing Director of Zurich Scudder Investments, an investment management firm. During his employment with Scudder, Mr. Birdsong was an Interested Director of The Japan Fund. From January 1981 through December 2013, Mr. Birdsong was a partner in Birdsong Company, an advertising specialty firm.
Robert M. Gavin, Jr. (1940) Director since 2002 (MF) and 1986 (MF2), Chairman of the Board for each since 2004
Dr. Gavin is an educational consultant. Prior to September 1, 2001, he was President of Cranbrook Education Community and prior to July 1996, he was President of Macalester College, St. Paul, Minnesota.
Duane E. Hill (1945) Director since 2001 (MF) and 2002 (MF2), Chairman of the Nominating Committee since 2003
Mr. Hill is a Partner of TSG Ventures L.P., a private equity investment company. Mr. Hill is a former partner of TSG Capital Group, a private equity investment firm that served as sponsor and lead investor in leveraged buyouts of middle market companies.
Sandra S. Jaffee (1941) Director since 2005
Ms. Jaffee is the founder and Chief Executive Officer of a private company, Homeworks Concierge, LLC, which provides residential property management services in Westchester County, New York (January 2012 to present). Ms. Jaffee served as Chairman (2008 to 2009) and Chief Executive Officer of Fortent (formerly Searchspace Group), a leading provider of compliance/regulatory technology to financial institutions from August 2005 to August 2009. From August 2004 to August 2005, Ms. Jaffee served as an Entrepreneur in Residence with Warburg Pincus, a private equity firm. Prior to joining Warburg Pincus, Ms. Jaffee served as Executive Vice President at Citigroup, from September 1995 to July 2004, where she was President and Chief Executive Officer of Citibank’s Global Securities Services (1995 to 2003). Ms. Jaffee currently serves as a member of the Board of Directors of Broadridge Financial Solutions as well as a Trustee of Muhlenberg College.
| The Hartford Growth Opportunities Fund |
Directors and Officers (Unaudited) – (continued) |
William P. Johnston (1944) Director since 2005, Chairman of the Compliance Committee since 2005
In June 2006, Mr. Johnston was appointed as Senior Advisor to The Carlyle Group, a global private equity and other alternative asset investment firm and currently serves as an Operating Executive. In July 2006, Mr. Johnston was elected to the Board of Directors of MultiPlan, Inc. and served as a Director (July 2006 to August 2010). In August 2007, Mr. Johnston was elected to the Board of Directors of LifeCare Holdings, Inc. and served as a Director (August 2007 to June 2013). In February 2008, Mr. Johnston was elected to the Board of Directors of HCR-ManorCare, Inc. In May 2006, Mr. Johnston was elected to the Supervisory Board of Fresenius Medical Care AG & Co. KGaA, after its acquisition of Renal Care Group, Inc. in March 2006. Mr. Johnston joined Renal Care Group in November 2002 as a member of the Board of Directors and served as Chairman of the Board from March 2003 through March 2006. From 2002 through 2013, Mr. Johnston served as a Board member of the Georgia O’Keefe Museum. From September 1987 to December 2002, Mr. Johnston was with Equitable Securities Corporation (and its successors, SunTrust Equitable Securities and SunTrust Robinson Humphrey) serving in various investment banking and managerial positions, including Managing Director and Head of Investment Banking, Chief Executive Officer and Vice Chairman.
Phillip O. Peterson (1944) Director since 2002 (MF) and 2000 (MF2), Chairman of the Audit Committee since 2002
Mr. Peterson is a mutual fund industry consultant. He was a partner of KPMG LLP (an accounting firm) until July 1999. Mr. Peterson joined William Blair Funds in February 2007 as a member of the Board of Trustees. From February 2012 to February 2014, Mr. Peterson served as a Trustee of Symetra Variable Mutual Funds. From January 2004 to April 2005, Mr. Peterson served as Independent President of the Strong Mutual Funds.
Lemma W. Senbet (1946) Director since 2005
Dr. Senbet is the William E. Mayer Chair Professor of Finance and Founding Director, Center for Financial Policy, at the University of Maryland, Robert H. Smith School of Business. He was chair of the Finance Department of the University of Maryland, Robert H. Smith School of Business from 1998 to 2006. Since June 2013, he has been on leave from the University to serve as Executive Director of African Economic Research Consortium which focuses on economic policy research and training. Previously, he was a chaired professor of finance at the University of Wisconsin-Madison. Also, he was a Director of the Fortis Funds from March 2000 to July 2002. Dr. Senbet served as Director of the American Finance Association and President of the Western Finance Association. In 2006, Dr. Senbet was inducted Fellow of Financial Management Association International for his career-long distinguished scholarship and professional service.
Interested Directors and Officers
James E. Davey (1964) Director since 2012, President and Chief Executive Officer since 2010
Mr. Davey serves as Executive Vice President of Hartford Life Insurance Company (“HLIC”) and The Hartford. Additionally, Mr. Davey serves as Chairman of the Board, Manager and Senior Managing Director of Hartford Funds Distributors, LLC (“HFD”). He also currently serves as Director, Chairman of the Board, President and Senior Managing Director of Hartford Administrative Services Company (“HASCO”). Mr. Davey also serves as Manager, Chairman of the Board and Senior Managing Director for Hartford Funds Management Company, LLC (“HFMC”) and Director, Chairman of the Board and Senior Managing Director for Hartford Funds Management Group, Inc. ("HFMG"). Mr. Davey has served in various positions within The Hartford and its subsidiaries in connection with the operation of the Hartford Funds. Mr. Davey joined The Hartford in 2002.
Lowndes A. Smith* (1939) Director since 1996 (MF) and 2002 (MF2)
Mr. Smith served as Vice Chairman of The Hartford from February 1997 to January 2002, as President and Chief Executive Officer of Hartford Life, Inc. from February 1997 to January 2002, and as President and Chief Operating Officer of The Hartford Life Insurance Companies from January 1989 to January 2002. Mr. Smith serves as a Director of White Mountains Insurance Group Ltd. (October 2003 to current); One Beacon Insurance (October 2006 to current); Symetra Financial (August 2007 to current) and is a Managing Director of Whittington Gray Associates (January 2007 to current).
* Mr. Smith resigned as a Director of MF, MF2, Hartford Series Fund, Inc. and Hartford HLS Series Fund II, Inc. and as a Trustee of The Hartford Alternative Strategies Fund effective September 17, 2014.
Other Officers
Mark A. Annoni (1964) Vice President, Controller and Treasurer since 2012
Mr. Annoni currently serves as the Assistant Vice President of HLIC (February 2004 to present) and Senior Vice President of HFMG (December 2013 to present). Mr. Annoni has served in various positions within The Hartford and its subsidiaries in connection with the operation of the Hartford Funds. Mr. Annoni joined The Hartford in 2001.
| The Hartford Growth Opportunities Fund |
Directors and Officers (Unaudited) – (continued) |
Michael R. Dressen (1963) AML Compliance Officer since 2011
Mr. Dressen currently serves as Assistant Vice President of HLIC. He also serves as Chief Compliance Officer and AML Compliance Officer of HASCO and as AML Officer of HFD. Mr. Dressen has served in various positions within The Hartford and its subsidiaries in connection with the operation of the Hartford Funds.
Edward P. Macdonald (1967) Vice President, Secretary and Chief Legal Officer since 2005
Mr. Macdonald currently serves as Assistant Secretary, Executive Vice President and Deputy General Counsel of HFD, HASCO, HFMC and HFMG. He also serves as Vice President of HLIC. Mr. Macdonald has served in various positions within The Hartford and its subsidiaries in connection with the operation of the Hartford Funds. Mr. Macdonald joined The Hartford in 2005.
Joseph G. Melcher (1973) Vice President and Chief Compliance Officer since 2013
Mr. Melcher currently serves as Executive Vice President of HFD, HFMG and HASCO. Mr. Melcher also currently serves as Executive Vice President and Chief Compliance Officer of HFMC. Mr. Melcher has served in various positions within The Hartford and its subsidiaries in connection with the operation of the Hartford Funds since joining The Hartford in 2012. Prior to joining The Hartford, Mr. Melcher worked at Touchstone Investments, a member of the Western & Southern Financial Group, where he held the position of Vice President and Chief Compliance Officer from 2010 through 2012 and Assistant Vice President, Compliance from 2005 to 2010.
Vernon J. Meyer (1964) Vice President since 2006
Mr. Meyer currently serves as Senior Vice President of HLIC. He also currently serves as Managing Director and Chief Investment Officer of HFMC and Managing Director of HFMG. Mr. Meyer has served in various positions within The Hartford and its subsidiaries in connection with the operation of the Hartford Funds. Mr. Meyer joined The Hartford in 2004.
Laura S. Quade (1969) Vice President since 2012
Ms. Quade currently serves as Vice President of HASCO, HFD and HFMG. She is the Head of Operations of HASCO and formerly served as Director, Enterprise Operations of HLIC. Ms. Quade has served in various positions within The Hartford and its subsidiaries in connection with the operation of the Hartford Funds. Ms. Quade joined The Hartford in 2001.
Martin A. Swanson** (1962) Vice President since 2010
Mr. Swanson currently serves as Vice President of HLIC. Mr. Swanson also serves as Managing Director, Chief Marketing Officer and Principal of HFD and Managing Director of HFMG. Mr. Swanson has served in various positions within The Hartford and its subsidiaries in connection with the operation of the Hartford Funds.
** Mr. Swanson resigned as an officer effective November 6, 2014.
HOW TO OBTAIN A COPY OF THE FUND’S PROXY VOTING POLICIES AND VOTING RECORDS (UNAUDITED)
A description of the policies and procedures that the Fund uses to determine how to vote proxies relating to portfolio securities and information about how the Fund voted proxies relating to portfolio securities during the most recent twelve-month period ended June 30 are available (1) without charge, upon request, by calling 888-843-7824 and (2) on the SEC’s website at http://www.sec.gov.
QUARTERLY PORTFOLIO HOLDINGS INFORMATION (UNAUDITED)
The Fund files a complete schedule of portfolio holdings with the SEC for the first and third quarters of each fiscal year on Form N-Q. The Fund’s Forms N-Q are available (1) without charge, upon request, by calling 888-843-7824 and (2) on the SEC’s website at http://www.sec.gov. The Form N-Q may be reviewed and copied at the SEC’s Public Reference Room in Washington, DC. Information on the operation of the Public Reference Room may be obtained by calling 1-800-SEC-0330.
| The Hartford Growth Opportunities Fund |
Federal Tax Information (Unaudited) |
For the fiscal year ended October 31, 2014, there is no further federal tax information required for this Fund.
| The Hartford Growth Opportunities Fund |
Expense Example (Unaudited) |
Your Fund's Expenses
As a shareholder of the Fund, you incur two types of costs: (1) transaction costs, including sales charges (loads) on purchase payments, if any, and contingent deferred sales charges (CDSC), if any, and (2) ongoing costs, including investment management fees, distribution and/or service (12b-1) fees, if any, and other fund expenses. This example is intended to help you understand your ongoing costs (in dollars) of investing in the Fund and to compare these costs with the ongoing costs of investing in other mutual funds. The example is based on an investment of $1,000 invested at the beginning of the period and held for the entire period of April 30, 2014 through October 31, 2014.
Actual Expenses
The first set of columns of the table below provides information about actual account values and actual expenses. You may use the information in this column, together with the amount you invested, to estimate the expenses that you paid over the period. Simply divide your account value by $1,000 (for example, an $8,600 account value divided by $1,000 = 8.6), then multiply the result by the number in the line under the heading entitled “Expenses Paid During Period” to estimate the expenses you paid on your account during this period.
Hypothetical Example for Comparison Purposes
The second set of columns of the table below provides information about hypothetical account values and hypothetical expenses based on the Fund's actual expense ratio and an assumed rate of return of 5% per year before expenses, which is not the Fund's actual return. The hypothetical account values and expenses may not be used to estimate the actual ending account balance or expenses you paid for the period. You may use this information to compare the ongoing costs of investing in the Fund and other funds. To do so, compare this 5% hypothetical example with the 5% hypothetical examples that appear in the shareholder reports of the other funds.
Please note that the expenses shown in the table are meant to highlight your ongoing costs only and do not reflect any transactional costs, such as sales charges (loads) and CDSC. Therefore, the second set of columns of the table is useful in comparing ongoing costs only, and will not help you determine the relative total costs of owning different funds. In addition, if these transactional costs were included, your costs would be higher. Expenses are equal to the Fund's annualized expense ratios multiplied by average account value over the period, multiplied by 184/365 (to reflect the one-half year period).
| | | Actual return | | | Hypothetical (5% return before expenses) | | | | | | | | | | |
| | | Beginning
Account Value
April 30, 2014 | | | Ending Account
Value
October 31, 2014 | | | Expenses paid
during the period
April 30, 2014
through
October 31, 2014 | | | Beginning
Account Value
April 30, 2014 | | | Ending Account
Value
October 31, 2014 | | | Expenses paid
during the period
April 30, 2014
through
October 31, 2014 | | | Annualized
expense
ratio | | | Days
in the
current
1/2
year | | | Days
in the
full
year | |
| Class A | | $ | 1,000.00 | | | $ | 1,116.60 | | | $ | 6.16 | | | $ | 1,000.00 | | | $ | 1,019.39 | | | $ | 5.88 | | | | 1.15 | % | | | 184 | | | | 365 | |
| Class B | | $ | 1,000.00 | | | $ | 1,111.80 | | | $ | 10.93 | | | $ | 1,000.00 | | | $ | 1,014.86 | | | $ | 10.43 | | | | 2.05 | | | | 184 | | | | 365 | |
| Class C | | $ | 1,000.00 | | | $ | 1,112.50 | | | $ | 10.01 | | | $ | 1,000.00 | | | $ | 1,015.72 | | | $ | 9.56 | | | | 1.88 | | | | 184 | | | | 365 | |
| Class I | | $ | 1,000.00 | | | $ | 1,118.00 | | | $ | 4.91 | | | $ | 1,000.00 | | | $ | 1,020.57 | | | $ | 4.69 | | | | 0.92 | | | | 184 | | | | 365 | |
| Class R3 | | $ | 1,000.00 | | | $ | 1,114.90 | | | $ | 7.74 | | | $ | 1,000.00 | | | $ | 1,017.89 | | | $ | 7.38 | | | | 1.45 | | | | 184 | | | | 365 | |
| Class R4 | | $ | 1,000.00 | | | $ | 1,116.90 | | | $ | 6.15 | | | $ | 1,000.00 | | | $ | 1,019.40 | | | $ | 5.86 | | | | 1.15 | | | | 184 | | | | 365 | |
| Class R5 | | $ | 1,000.00 | | | $ | 1,118.50 | | | $ | 4.56 | | | $ | 1,000.00 | | | $ | 1,020.90 | | | $ | 4.35 | | | | 0.85 | | | | 184 | | | | 365 | |
| Class Y | | $ | 1,000.00 | | | $ | 1,118.80 | | | $ | 4.03 | | | $ | 1,000.00 | | | $ | 1,021.40 | | | $ | 3.84 | | | | 0.75 | | | | 184 | | | | 365 | |
| The Hartford Growth Opportunities Fund |
| Approval of Investment Management and Investment Sub-Advisory Agreements (Unaudited) |
Section 15(c) of the Investment Company Act of 1940, as amended (the “1940 Act”), requires that each mutual fund’s board of directors, including a majority of those directors who are not “interested persons” of the mutual fund, as defined in the 1940 Act (the “Independent Directors”), annually review and consider the continuation of the mutual fund’s investment advisory and sub-advisory agreements. At its meeting held on August 5-6, 2014, the Board of Directors (the “Board”) of The Hartford Mutual Funds II, Inc., including each of the Independent Directors, unanimously voted to approve the continuation of the investment management agreement for The Hartford Growth Opportunities Fund (the “Fund”) with Hartford Funds Management Company, LLC (“HFMC”) and the continuation of the investment sub-advisory agreement between HFMC and the Fund’s sub-adviser, Wellington Management Company, LLP (the “Sub-adviser,” and together with HFMC, the “Advisers”) (collectively, the “Agreements”).
In the months preceding the August 5-6, 2014 meeting, the Board requested, received and reviewed written responses from the Advisers to questions posed to them on behalf of the Independent Directors and supporting materials relating to those questions and responses. The Board considered information furnished to the Board at its meetings throughout the year, as well as information specifically prepared in connection with the annual approval of the Agreements at the Board’s meetings held on June 17-18, 2014 and August 5-6, 2014. Information provided to the Board at its meetings throughout the year included, among other things, reports on Fund performance, legal and compliance matters, sales and marketing activity, shareholder services, and the other services provided to the Fund by the Advisers and their affiliates. The Board also received in-person presentations by Fund officers and representatives of HFMC at the Board’s meetings on June 17-18, 2014 and August 5-6, 2014 concerning the Agreements.
The Independent Directors, advised by independent legal counsel, engaged service providers to assist them with evaluating the Agreements with respect to the Fund. Lipper Inc. (“Lipper”), an independent provider of investment company data, was retained to provide the Board with reports on how the Fund’s contractual management fees, actual management fees, other non-management fees, overall expense ratios and investment performance compared to those of mutual funds with similar investment objectives. The Independent Directors also engaged an independent financial services consultant (the “Consultant”) to assist them in evaluating the Fund’s management fees, sub-advisory fees, other non-management fees, overall expense ratios and investment performance. In addition, the Consultant reviewed the profitability calculations utilized by HFMC in connection with the continuation of the investment management agreement.
In determining whether to continue the Agreements for the Fund, the members of the Board reviewed and evaluated information and factors they believed to be relevant and appropriate in light of the information that the Board deemed necessary and appropriate through the exercise of its reasonable business judgment. While individual members of the Board may have weighed certain factors differently, the Board’s determination to continue the Agreements was based on a comprehensive consideration of all information provided to the Board throughout the year and specifically with respect to the continuation of the Agreements. A more detailed discussion of the factors the Board considered with respect to its approval of the Agreements is provided below.
Nature, Extent and Quality of Services Provided by the Advisers
The Board requested and considered information concerning the nature, extent and quality of the services provided to the Fund by the Advisers. The Board considered, among other things, the terms of the Agreements and the range of services provided by the Advisers. The Board considered the Advisers’ professional personnel who provide services to the Fund, including each Adviser’s ability and experience in attracting and retaining qualified personnel to service the Fund. The Board considered each Adviser’s reputation and overall financial strength, as well as its willingness to consider and implement organizational and operational changes designed to enhance services to the Hartford Funds. In addition, the Board considered the quality of each Adviser’s communications with the Board and responsiveness to Board inquiries and requests made from time to time with respect to the Fund and other Hartford Funds.
The Board also requested and evaluated information concerning each Adviser’s regulatory and compliance environment. In this regard, the Board requested and reviewed information on each Adviser’s compliance policies and procedures, compliance history, and a report from the Fund’s Chief Compliance Officer on each Adviser’s compliance with applicable laws and regulations, including responses to regulatory developments and compliance issues raised by regulators. The Board also noted the Advisers’ support of the Fund’s compliance control structure, particularly the resources devoted by the Advisers in support of the Fund’s obligations pursuant to Rule 38a-1 under the 1940 Act.
With respect to HFMC, the Board noted that, under the Agreements, HFMC is responsible for the management of the Fund, including oversight of fund operations and service providers, and provides administrative and investment advisory services in connection with selecting, monitoring and supervising the Sub-adviser. The Board considered HFMC’s ongoing monitoring of people, process and performance, including its quarterly reviews of each of the Hartford Funds, semi-annual meetings with the leaders of each Fund’s portfolio management team, and oversight of the Hartford Funds’ approximately 66 portfolio managers. The Board recognized that HFMC has demonstrated a record of making changes to the
| The Hartford Growth Opportunities Fund |
| Approval of Investment Management and Investment Sub-Advisory Agreements (Unaudited) – (continued) |
management and/or strategies of the Hartford Funds when warranted. The Board considered HFMC’s oversight of the Sub-adviser’s investment approach and results, process for monitoring best execution of portfolio trades by the Sub-adviser, and approach to risk management with respect to the Fund and the service providers to the Fund. The Board also considered HFMC’s oversight of compliance with the Fund’s objective and policies as well as with applicable laws and regulations, noting that regulatory and other developments had over time led to an increase in the scope of HFMC’s services in this regard.
In addition, the Board considered HFMC’s ongoing commitment to review and rationalize the Hartford Funds product line-up and the expenses that HFMC had incurred in connection with fund combinations in recent years. The Board considered that HFMC or its affiliates are responsible for providing the Fund’s officers.
With respect to the Sub-adviser, which provides certain day-to-day portfolio management services for the Fund, the Board considered the quality of the Fund’s portfolio managers, the Sub-adviser’s other investment personnel, its investment philosophy and process, investment research capabilities and resources, performance record, trade execution capabilities and experience. The Board considered the experience of the Fund’s portfolio managers, the number of accounts managed by the portfolio managers, and the Sub-adviser’s method for compensating the portfolio managers.
Based on these considerations, the Board concluded that it was satisfied with the nature, extent and quality of the services provided to the Fund by HFMC and the Sub-adviser.
Performance of the Fund and the Advisers
The Board considered the investment performance of the Fund. In this regard, the Board reviewed the performance of the Fund over different time periods presented in the materials and evaluated HFMC’s analysis of the Fund’s performance for these time periods. The Board considered information and materials provided to the Board by the Advisers concerning Fund performance, as well as information from Lipper comparing the investment performance of the Fund to an appropriate benchmark and universe of peer funds. The Board noted that the Fund’s performance was in the 3rd quintile of its performance universe for the 1-, 3- and 5-year periods. The Board also noted that the Fund’s performance was above its benchmark for the 1- and 5-year periods and in line with its benchmark for the 3-year period. The Board considered that, in response to questions raised concerning the Fund’s performance, HFMC stated that it has confidence in the Fund’s portfolio management team and investment strategy.
The Board considered the detailed investment analytics reports provided by Hartford Funds’ Investment Advisory Group throughout the year. These reports include, among other things, information on the Fund’s gross and net returns, the Fund’s investment performance relative to an appropriate benchmark and peer group, various statistics concerning the Fund’s portfolio, and a narrative summary of various factors affecting Fund performance. The Board considered the Advisers’ cooperation with the Investment Committee, which assists the Board in evaluating the performance of the Fund at periodic meetings throughout the year. The Board also considered the analysis provided by the Consultant relating to the Fund’s performance track record.
In light of all the considerations noted above, the Board concluded that it had continued confidence in HFMC’s and the Sub-adviser’s overall capabilities to manage the Fund.
Costs of the Services and Profitability of the Advisers
The Board reviewed information regarding HFMC’s cost to provide investment management and related services to the Fund and HFMC’s profitability, both overall and for the Fund, on a pre-tax basis without regard to distribution expenses. The Board also requested and reviewed information about the profitability to HFMC and its affiliates from all services provided to the Fund and all aspects of their relationship with the Fund. The Board also requested and received information relating to the operations and profitability of the Sub-adviser.
The Board considered the Consultant’s review of the profitability calculations used by HFMC in connection with the continuation of the investment management agreement, noting the Consultant’s view that Hartford Funds’ process for calculating and reporting Fund profitability is reasonable. In this regard, the Board noted that the Consultant performed a full review of this process in light of the recent restructuring of the Hartford Funds business and reported that the approach to analyzing Fund profitability, including the use of common expense allocation methodologies, is reasonable, sound and well within common industry practice.
| The Hartford Growth Opportunities Fund |
| Approval of Investment Management and Investment Sub-Advisory Agreements (Unaudited) – (continued) |
Based on these considerations, the Board concluded that the profits anticipated to be realized by the Advisers and their affiliates from their relationships with the Fund would not be excessive.
Comparison of Fees and Services Provided by the Advisers
The Board considered comparative information with respect to the management fees to be paid by the Fund to HFMC and the total expense ratios of the Fund. The Board also considered comparative information with respect to the sub-advisory fees to be paid by HFMC to the Sub-adviser. In this regard, the Board requested and reviewed information from HFMC and the Sub-adviser relating to the management and sub-advisory fees, including the sub-advisory fee schedule for the Fund, and total operating expenses for the Fund. With respect to the sub-advisory fee schedule, the Board considered representations from HFMC and the Sub-adviser that the Sub-adviser’s fees were negotiated at arm’s length on a fund-by-fund basis. The Board also reviewed information from Lipper comparing the Fund’s contractual management fees, actual management fees and overall expense ratios relative to a group of funds selected by Lipper, in consultation with the Consultant, and a broader universe of funds selected by Lipper. The Board considered that the Fund’s contractual management fee, actual management fee and total expenses (less 12b-1 and shareholder service fees) were in the 3rd quintile of its expense group. The Board noted that the Fund has a temporary contractual expense cap on each share class through February 28, 2015 as well as an automatically renewable contractual expense cap on each share class. These arrangements resulted in reimbursement of certain expenses incurred in 2013.
While the Board recognized that comparisons between the Fund and peer funds may be imprecise, given the different service levels and characteristics of mutual funds and the different business models and cost structures of the Advisers, the comparative information provided by Lipper assisted the Board in evaluating the reasonableness of the Fund’s management and sub-advisory fees and total operating expenses. In addition, the Board considered the analysis and recommendations of the Consultant relating to the Fund’s management and sub-advisory fees and total operating expenses.
Based on these considerations, the Board concluded that the Fund’s fees and total operating expenses, in conjunction with the information about quality of services, profitability, economies of scale, and other matters discussed, were reasonable in light of the services provided.
Economies of Scale
The Board requested and considered information regarding the Advisers’ realization of economies of scale with respect to the Fund and whether the fee levels reflect these economies of scale for the benefit of the Fund’s shareholders. The Board reviewed the breakpoints in the management fee schedule for the Fund, which reduce fee rates as Fund assets grow over time. The Board recognized that a fund with assets beyond the highest breakpoint level will continue to benefit from economies of scale because additional assets are charged the lowest breakpoint fee resulting in lower overall effective management fee rates. The Board also considered that expense limitations and fee waivers that reduce the Fund’s expenses at all asset levels can have the same effect as breakpoints in sharing economies of scale with shareholders and provide protection from an increase in expenses if Fund assets decline. The Board recognized that a fee schedule that reaches a lower breakpoint quickly provides shareholders with the benefit of anticipated or potential economies of scale. The Board also considered that HFMC has been active in managing expenses, which has resulted in benefits being realized by shareholders as assets within the Hartford Funds family of funds have grown over time, including through lower transfer agent costs and other operating expenses.
The Board reviewed and evaluated materials from Lipper and the Consultant showing how management fee schedules of peer funds reflect economies of scale for the benefit of shareholders as a peer fund’s assets hypothetically increase over time. Based on information provided by HFMC, Lipper, and the Consultant, the Board recognized that there is no uniform methodology for establishing breakpoints or uniform pattern in asset levels that trigger breakpoints or the amounts of breakpoints triggered.
After considering all of the information available to it, the Board concluded that it was satisfied with the extent to which economies of scale would be shared for the benefit of the Fund’s shareholders based on currently available information and the effective advisory fees and expense ratios for the Fund at its current and reasonably anticipated asset levels. The Board noted, however, that it would continue to monitor future growth in Fund assets and the appropriateness of additional breakpoints.
Other Benefits
The Board considered other benefits to the Advisers and their affiliates from their relationships with the Fund.
| The Hartford Growth Opportunities Fund |
| Approval of Investment Management and Investment Sub-Advisory Agreements (Unaudited) – (continued) |
The Board noted that HFMC receives fees for fund accounting and related services from the Fund, and the Board considered information on profits to HFMC for such services. The Board also considered that Hartford Administrative Services Company (“HASCO”), the Fund’s transfer agent and an affiliate of HFMC, receives transfer agency compensation from the Fund, and the Board reviewed information on the profitability of the Fund’s transfer agency function to HASCO. The Board considered information provided by HASCO indicating that the transfer agent fees charged by HASCO to the Fund were fair and reasonable based on publicly available information.
The Board also considered that Hartford Funds Distributors, LLC (“HFD”), an affiliate of HFMC, serves as principal underwriter of the Fund. As principal underwriter, HFD receives 12b-1 fees from the Fund and receives all or a portion of the sales charges on sales or redemptions of certain classes of shares. The Board also noted that certain affiliates of HFD distribute shares of the Fund and receive compensation in that connection.
The Board considered benefits to the Sub-adviser from its use of the Fund’s brokerage commissions to obtain soft dollar research, and representations from HFMC and the Sub-adviser that the Sub-adviser would not make any revenue-sharing payments or any other type of distribution payments to HFMC or its affiliates.
The Board considered the benefits to shareholders of being part of the Hartford Funds family of funds, including the right to exchange investments between the same class of funds without a sales charge, the ability to reinvest Fund dividends into other funds in the family, and the ability to combine holdings in the Fund with holdings in other funds to obtain a reduced sales charge. The Board considered HFMC’s efforts to provide investors in the family with a broad range of investment styles and asset classes and its entrepreneurial risk in initiating new funds to expand these opportunities for shareholders.
* * * *
Based upon its review of these various factors, among others, the Board concluded that it is in the best interests of the Fund and its shareholders for the Board to approve the Agreements for an additional year. In reaching this decision, the Board did not assign relative weights to the factors discussed above or deem any one or group of them to be controlling in and of themselves. In connection with their deliberations, the Independent Directors met separately in executive session on several occasions, with independent legal counsel and the Consultant, to review the relevant materials and consider their responsibilities under relevant laws and regulations.
| The Hartford Growth Opportunities Fund |
| Main Risks (Unaudited) |
The main risks of investing in the Fund are described below.
Market, Selection and Strategy Risk: The Fund’s share price may fluctuate due to market risk and/or security selections that may underperform the market or relevant benchmarks. If the sub-adviser's investment strategy does not perform as expected, the Fund could underperform its peers or lose money. There is no guarantee the Fund will achieve its stated objective.
Growth Investing Risk: Growth investments can be volatile, and may fail to increase earnings or grow as quickly as anticipated. Growth-style investing falls in and out of favor, which may result in periods of underperformance.
Foreign Investment Risk: Investments in foreign securities may be riskier than investments in U.S. securities. Potential risks include the risks of illiquidity, increased price volatility, less government regulation, less extensive and less frequent accounting and other reporting requirements, unfavorable changes in currency exchange rates, and economic and political disruptions.
Mid-Cap Stock Risk: Mid-cap stocks are generally more volatile and risky and may be less liquid than large-cap stocks because they may have limited operating histories, narrow product lines, and focus on niche markets.
Active Trading Risk: Actively trading investments may result in higher costs and higher taxable income.
THIS PRIVACY POLICY IS NOT PART OF THIS REPORT
Privacy Policy and Practices of The Hartford Financial Services Group, Inc. and its Affiliates
(herein called “we, our and us”)
This Privacy Policy applies to our United States Operations
We value your trust. We are committed to the responsible: a) management; b) use; and c) protection; of Personal Information. This notice describes how we collect, disclose, and protect Personal Information. We collect Personal Information to: a) service your Transactions with us; and b) support our business functions. We may obtain Personal Information from: a) You; b) your Transactions with us; and c) third parties such as a consumer-reporting agency. Based on the type of product or service You apply for or get from us, Personal Information such as: a) your name; b) your address; c) your income; d) your payment; or e) your credit history; may be gathered from sources such as applications, Transactions, and consumer reports. To serve You and service our business, we may share certain Personal Information. We will share Personal Information, only as allowed by law, with affiliates such as: a) our insurance companies; b) our employee agents; c) our brokerage firms; and d) our administrators. As allowed by law, we may share Personal Financial Information with our affiliates to: a) market our products; or b) market our services; to You without providing You with an option to prevent these disclosures. | We may also share Personal Information, only as allowed by law, with unaffiliated third parties including: a) independent agents; b) brokerage firms; c) insurance companies; d) administrators; and e) service providers; who help us serve You and service our business. When allowed by law, we may share certain Personal Financial Information with other unaffiliated third parties who assist us by performing services or functions such as: a) taking surveys; b) marketing our products or services; or c) offering financial products or services under a joint agreement between us and one or more financial institutions. We, and third parties we partner with, may track some of the pages You visit through the use of: a) cookies; b) pixel tagging; or c) other technologies; and currently do not process or comply with any web browser’s “do not track” signal or similar mechanism that indicates a request to disable online tracking of individual users who visit our websites or use our services. We will not sell or share your Personal Financial Information with anyone for purposes unrelated to our business functions without offering You the opportunity to: a) “opt-out;” or b) “opt-in;” as required by law. We only disclose Personal Health Information with: a) your proper written authorization; or b) as otherwise allowed or required by law. Our employees have access to Personal Information in the course of doing their jobs, such as: a) underwriting policies; b) paying claims; c) developing new products; or d) advising customers of our products and services. |
We use manual and electronic security procedures to maintain: a) the confidentiality; and b) the integrity of; Personal Information that we have. We use these procedures to guard against unauthorized access. Some techniques we use to protect Personal Information include: a) secured files; b) user authentication; c) encryption; d) firewall technology; and e) the use of detection software. We are responsible for and must: a) identify information to be protected; b) provide an adequate level of protection for that data; c) grant access to protected data only to those people who must use it in the performance of their job-related duties. Employees who violate our Privacy Policy will be subject to discipline, which may include ending their employment with us. At the start of our business relationship, we will give You a copy of our current Privacy Policy. We will also give You a copy of our current Privacy Policy once a year if You maintain a continuing business relationship with us. We will continue to follow our Privacy Policy regarding Personal Information even when a business relationship no longer exists between us. | As used in this Privacy Notice: Application means your request for our product or service. Personal Financial Information means financial information such as: a) credit history; b) income; c) financial benefits; or d) policy or claim information. Personal Health Information means health information such as: a) your medical records; or b) information about your illness, disability or injury. Personal Information means information that identifies You personally and is not otherwise available to the public. It includes: a) Personal Financial Information; and b) Personal Health Information. Transaction means your business dealings with us, such as: a) your Application; b) your request for us to pay a claim; and c) your request for us to take an action on your account. You means an individual who has given us Personal Information in conjunction with: a) asking about; b) applying for; or c) obtaining; a financial product or service from us if the product or service is used mainly for personal, family, or household purposes. |
This Privacy Policy is being provided on behalf of the following affiliates of The Hartford Financial Services Group, Inc.:
1stAGChoice, Inc.; Access CoverageCorp, Inc.; Access CoverageCorp Technologies, Inc.; American Maturity Life Insurance Company; Archway 60 R, LLC; Business Management Group, Inc.; Champlain Life Reinsurance Company; DMS R, LLC; Eloy R, LLC; Ersatz Corporation; First State Insurance Company; Hartford Accident and Indemnity Company; Hartford Administrative Services Company; Hartford Casualty General Agency, Inc.; Hartford Casualty Insurance Company; Hartford-Comprehensive Employee Benefit Service Company; Hartford Equity Sales Company, Inc.; Hartford Fire General Agency, Inc.; Hartford Fire Insurance Company; Hartford Funds Management Company, LLC; Hartford Funds Management Group, Inc.; Hartford HLS Series Fund II, Inc.; Hartford Insurance Company of Illinois; Hartford Insurance Company of the Midwest; Hartford Insurance Company of the Southeast; Hartford Integrated Technologies, Inc.; Hartford International Life Reassurance Corporation; Hartford Funds Distributors, LLC; Hartford Investment Management Company; Hartford Life and Accident Insurance Company; Hartford Life and Annuity Insurance Company; Hartford Life Insurance Company; Hartford Life Private Placement, LLC; Hartford Lloyd’s Corporation; Hartford Lloyd’s Insurance Company; Hartford Mezzanine Investors I, LLC; Hartford Residual Market, L.C.C.; Hartford Retirement Services, LLC; Hartford Securities Distribution Company, Inc.; Hartford Series Fund, Inc.; Hartford Specialty Insurance Services of Texas, LLC; Hartford Strategic Investments, LLC; Hartford Underwriters Insurance Company; Hartford Technology Services Company, L.L.C.; Hartford of Texas General Agency, Inc.; Hartford Underwriters General Agency, Inc.; HARTRE Company, L.C.C.; HL Investment Advisors, LLC; HLA LLC; Horizon Management Group, LLC; HRA Brokerage Services, Inc.; Lanidex Class B, LLC; M-CAP Insurance Agency, LLC; New England Insurance Company; New England Reinsurance Corporation; Nutmeg Insurance Agency, Inc.; Nutmeg Insurance Company; Pacific Insurance Company, Limited; Planco, LLC: Property and Casualty Insurance Company of Hartford; Revere R, LLC; RVR R, LLC; Sentinel Insurance Company, Ltd.; Sunstone R, LLC; Symphony R, LLC; The Evergreen Group Incorporated; The Hartford Alternative Strategies Fund; The Hartford Mutual Funds, Inc.; The Hartford Mutual Funds II, Inc.; Trumbull Flood Management, L.L.C.; Trumbull Insurance Company; Twin City Fire Insurance Company; White River Life Reinsurance Company.
HPP Revised January 2014
HARTFORDFUNDS
hartfordfunds.com
This information is written in connection with the promotion or marketing of the matter(s) addressed in this material.
This report is submitted for the general information of the shareholders of the Fund. It is not authorized for distribution unless preceded or accompanied by a current prospectus for the Fund.
The information cannot be used or relied upon for the purpose of avoiding IRS penalties. These materials are not intended to provide tax, accounting or legal advice. As with all matters of a tax or legal nature, you should consult your own tax or legal counsel for advice.
Investors should carefully consider the investment objectives, risks, charges, and expenses of Hartford Funds before investing. This and other information can be found in the prospectus and summary prospectus, which can be obtained by calling 888-843-7824 (retail) or 800-279-1541 (institutional). Investors should read them carefully before they invest.
Hartford Funds are underwritten and distributed by Hartford Funds Distributors, LLC.
MFAR-GO14 12/14 113983-3 Printed in U.S.A.
HARTFORDFUNDS
| THE HARTFORD MUNICIPAL REAL RETURN FUND 2014 Annual Report |
A MESSAGE FROM THE PRESIDENT
Dear Fellow Shareholders:
Thank you for investing in Hartford Funds.
Market Review
U.S. equities (as represented by the S&P 500 Index ) rose steadily for the fiscal year ended October 31, 2014, with a return of 17.27% for the period. With the exception of short-lived geopolitical scares early in 2014 and concerns about continuing global growth near the end of the period, stocks generally rose on solid fundamentals and encouraging macroeconomic data during the year.
September 2014 marked the six-year anniversary of the start of the financial crisis. Within weeks of that anniversary, both the S&P 500 Index and the Dow Jones Industrial Average set new all-time highs, closing at 2,018 and 17,391, respectively, on October 31. Although the fallout of the crisis continues to influence investor behavior, stocks have recovered and risen dramatically, up 198% from their low in March 2009. Meanwhile, the domestic economy is notching strong growth, and the unemployment rate has reached its lowest level since August 2008.
While the U.S. economy appears to have stabilized and to have reverted to a solid growth path, the outlook for the global economy appears to have gotten cloudier. The U.S. Federal Reserve has ended quantitative easing, while Europe and Japan are pursuing stimulus options to avoid a double-dip recession and deflation, respectively. Diverging central-bank policies will likely continue to play an important role in market movements going forward as investors wait to see the reactions to their efforts and their impacts on global markets.
How have market movements impacted your portfolio throughout the last year? Are your investments still on track to provide the growth or income you need, and are you comfortable with their progress during times of volatility?
Your financial professional can help you navigate today’s markets with confidence, as well as assist you to achieve your investment goals by providing advice on the best options within our fund family to help you work toward overcoming today’s investing challenges. Meet with your financial advisor regularly to examine your portfolio and your investment strategy, and to determine if you’re still on track to meet your goals.
Thank you again for investing with Hartford Funds.
James Davey
President
Hartford Funds
1 The S&P 500 Index is a market capitalization-weighted price index composed of 500 widely held common stocks.
2 The Dow Jones Industrial Average is an unmanaged, price-weighted index of 30 of the largest, most widely held stocks traded on the NYSE
The Hartford Municipal Real Return Fund
Table of Contents
The views expressed in the Fund’s Manager Discussion under ‘‘Why did the Fund perform this way?’’ and ‘‘What is the outlook?’’ are views of the Fund’s sub-adviser and portfolio management team through the end of the period and are subject to change based on market and other conditions. The Fund’s Manager Discussion is for informational purposes only and does not represent an offer, recommendation or solicitation to buy, hold or sell any security. The specific securities identified and described, if any, do not represent all of the securities purchased or sold and you should not assume that investments in the securities identified and discussed will be profitable.
The Hartford Municipal Real Return Fund inception 06/02/1986
(sub-advised by Wellington Management Company, LLP)
Investment objective – The Fund seeks to provide current income exempt from federal income tax and after-tax inflation-adjusted total returns.
Performance Overview 10/31/04 - 10/31/14
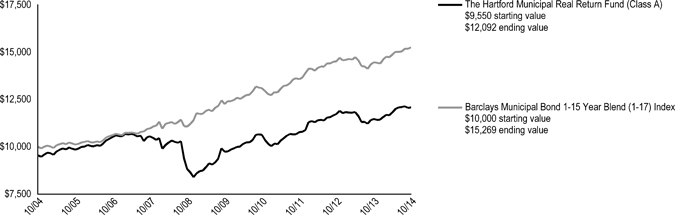
The chart above represents the hypothetical growth of a $10,000 investment in Class A, which includes a sales charge. Growth results in classes other than Class A will vary from what is seen above due to differences in the expenses charged to those share classes.
| Average Annual Total Returns (as of 10/31/14) |
| | 1 Year | | 5 Years | | 10 Years |
| Municipal Real Return A# | 5.46% | | 4.42% | | 2.39 | % |
| Municipal Real Return A## | 0.71% | | 3.46% | | 1.92 | % |
| Municipal Real Return B# | 4.62% | | 3.64% | | 1.78 | %* |
| Municipal Real Return B## | -0.38% | | 3.29% | | 1.78 | %* |
| Municipal Real Return C# | 4.71% | | 3.64% | | 1.63 | % |
| Municipal Real Return C## | 3.71% | | 3.64% | | 1.63 | % |
| Municipal Real Return I# | 5.82% | | 4.69% | | 2.60 | % |
| Municipal Real Return Y# | 5.74% | | 4.71% | | 2.62 | % |
| Barclays Municipal Bond 1-15 Year Blend (1-17) Index | 5.56% | | 4.48% | | 4.32 | % |
| # | Without sales charge |
| ## | With sales charge |
| * | Class B shares convert to Class A shares after 8 years. The return shown reflects the conversion to Class A shares, which had different operating expenses, for the period after conversion. |
PERFORMANCE DATA QUOTED REPRESENTS PAST PERFORMANCE AND DOES NOT GUARANTEE FUTURE RESULTS. The investment return and principal value of the investment will fluctuate so that investors’ shares, when redeemed, may be worth more or less than their original cost. Current performance may be lower or higher than the performance data quoted. To obtain performance data current to the most recent month-end, please visit our website www.hartfordfunds.com.
The initial investment in Class A shares reflects the maximum sales charge of 4.50% and returns for Class B shares reflect a contingent deferred sales charge of up to 5.00% and declining to zero, depending on the period of time the shares are held. Returns for Class C shares reflect a contingent deferred sales charge of up to 1.00% on shares redeemed within twelve months of purchase.
Total returns presented above were calculated using the Fund’s net asset value available to shareholders for sale or redemption of Fund shares on October 31, 2014, which may exclude investment transactions as of this date. All share class returns assume the reinvestment of all distributions at net asset value and the deduction of all fund expenses.
Effective 9/30/09, Class B shares of the Fund were closed to new investments.
Class I shares commenced operations on 5/31/07. Performance prior to that date is that of the Fund’s Class A shares (excluding sales charges), which had different operating expenses.
Performance information includes performance under the Fund’s previous sub-adviser, Hartford Investment Management Company, using a modified investment strategy. As of March 5, 2012, Hartford Investment Management Company no longer served as the sub-adviser to the Fund.
Barclays Municipal Bond 1-15 Year Blend (1-17) Index is a sub-index of the Barclays Municipal Bond Index. It is a rules-based market value-weighted index of bonds with maturities of one year to 17 years engineered for the tax-exempt bond market.
You cannot invest directly in an index.
The chart and table do not reflect the deductions of taxes that a shareholder would pay on Fund distributions or the redemption of Fund shares.
Performance information may reflect historical or current expense waivers/reimbursements from the investment adviser, without which performance would have been lower. For information on current expense waivers/reimbursements, please see the prospectus.
The Hartford Municipal Real Return Fund
Manager Discussion
October 31, 2014 (Unaudited)
Operating Expenses*
| | Net | | Gross |
| Municipal Real Return Class A | 0.85 | % | | 0.88 | % |
| Municipal Real Return Class B | 1.60 | % | | 1.71 | % |
| Municipal Real Return Class C | 1.60 | % | | 1.62 | % |
| Municipal Real Return Class I | 0.60 | % | | 0.64 | % |
| Municipal Real Return Class Y | 0.58 | % | | 0.58 | % |
| * | As shown in the Fund's current prospectus dated March 1, 2014. Actual expenses may be higher or lower. Please see accompanying Financial Highlights for expense ratios for the year ended October 31, 2014. |
Gross expenses are the Fund's total annual operating expenses shown in the Fund's most recent prospectus. Net expenses are the Fund's total annual operating expenses shown in the Fund's most recent prospectus and reflect contractual expense reimbursements in instances when these reductions reduce the Fund's gross expenses. Contractual reimbursements remain in effect until February 28, 2015, and automatically renew for one-year terms unless terminated.
All investments are subject to risk including the possible loss of principal. For a discussion of the Fund’s risks, please see the Main Risks section of this report. For more detailed information on the risks associated with an investment in the Fund, please see the prospectus.
| Portfolio Managers | | |
| Timothy D. Haney, CFA | Brad W. Libby | Lindsay T. Politi |
| Senior Vice President and Fixed Income Portfolio Manager | Vice President and Fixed Income Credit Analyst | Vice President and Fixed Income Portfolio Manager |
| | | |
How did the Fund perform?
The Class A shares of The Hartford Municipal Real Return Fund returned 5.46%, before sales charge, for the twelve-month period ended October 31, 2014, underperforming the Fund’s benchmark, the Barclays Municipal Bond 1-15 Year Blend (1-17) Index, which returned 5.56% for the same period. The Fund outperformed the 5.43% average return of the Lipper Intermediate Municipal Debt Funds peer group, a group of funds with investment strategies similar to those of the Fund.
Why did the Fund perform this way?
Fixed income markets gained throughout much of the period as expectations of prolonged easy monetary policy by major central banks and a supportive macroeconomic environment kept rates low and suppressed volatility. Early in the period emerging markets dominated headlines as economic and political developments sparked risk aversion across global markets, pushing bond prices higher and yields lower amid a flight to quality. Toward the end of the period, however, persistent geopolitical risks – tensions between Ukraine and Russia and violence in Iraq – and Chinese economic slowdown concerns raised questions about the global growth rate, keeping a lid on risk appetites overall.
The period was also highlighted by a divergence in central bank policies. The European Central Bank (ECB) cut its benchmark lending and deposit rates and announced a host of stimulus measures in an effort to encourage lending and fend off fears of deflation. China’s central bank joined the ECB in boosting liquidity by injecting funds into the nation’s largest banks in an attempt to combat weakening growth. The Bank of Japan pre-emptively announced incremental monetary easing to counter the risk of missing the country’s inflation and growth targets. In contrast, the Bank of England and U.S. Federal Reserve (Fed) leaned toward tighter policies. The Fed ended its quantitative easing program as U.S. data largely suggested the economy was on a sustainable growth path. Second quarter Gross Domestic Product (GDP) rebounded after the first quarter’s steep contraction. The labor market strengthened as the unemployment rate dropped to a six-year low. Housing regained some lost ground after a weak start to the year, though the pace of home price appreciation started to slow after a strong 2013. Inflation pressures were muted overall, alleviating pressure on the Fed to raise rates.
The U.S. Treasury curve flattened as markets contemplated bringing interest rates to normal levels; short-term yields rose while longer term rates declined. Most credit risk sectors posted positive absolute returns and outperformed duration-equivalent government bonds as credit spreads tightened. The market’s longer term inflation expectations decreased over the period as 10-year breakeven rates, which can be regarded as a proxy for the market’s inflation expectations, decreased meaningfully.
The yield on 10-year AAA general obligations (GOs) remained inside of 10-year Treasuries throughout the twelve month period, as the GO-to-Treasury yield ratio fell from 96% to 89%. Municipal issuance has remained slow, which continues to create a positive technical market environment as demand for municipal bonds is strong. Municipal credit spreads continued to tighten over the period, but remained attractive in our view relative to corporates on an after-tax basis.
The Fund’s inflation overlay – which is implemented via Consumer Price Index (CPI) swap derivatives – was the main driver of relative underperformance during the period, as longer term inflation expectations decreased during the period. Yield curve positioning detracted modestly due to an overweight to the 5-year portion of the curve as short rates increased over the period. Security selection within investment grade revenue bonds contributed to benchmark-relative returns, particularly within the lease and special tax sectors. Our allocation to high yield revenue bonds was also additive over the period, in particular our allocation to the health care sector.
The Hartford Municipal Real Return Fund
Manager Discussion – (continued)
October 31, 2014 (Unaudited)
What is the outlook?
We expect U.S. economic momentum to be positive. In our view, the global growth outlook is improving, but increasing instability around the world poses a risk. We expect a slow increase in rates as the Fed moves policy and ended the period with a moderately procyclical risk posture. Pension and health care costs are projected to absorb almost all of the expected revenue growth of local governments which may continue to pressure municipal budgets. We expect revenue bond fundamentals to remain positive in near-to medium term and we continue to favor credit sectors in this area, especially special-tax, toll-road, airport, and health care.
We believe near term factors, such as slow European growth concerns and a strengthening US Dollar, represent a headwind to inflation leading the U.S. “importing” dis-inflation. Falling energy prices are also weighing on inflation. Longer term, we expect inflation to move higher due to structural imbalances in the labor market pushing wages higher, increases in personal consumption driven by household wealth, and an increase in the velocity of money as consumer credit loosens.
We decreased the Fund’s inflation sensitivity during the period via the inflation overlay, with the hedge ratio, or inflation protection, at approximately 77% on a contribution to duration basis at the end of the period.
Credit Exposure
as of October 31, 2014
| Credit Rating * | | Percentage of
Net Assets | |
| Aaa/ AAA | | | 3.1 | % |
| Aa/ AA | | | 19.3 | |
| A | | | 47.9 | |
| Baa/ BBB | | | 14.5 | |
| Ba/ BB | | | 2.2 | |
| B | | | 0.8 | |
| Not Rated | | | 9.6 | |
| Short-Term Instruments | | | 3.5 | |
| Other Assets and Liabilities | | | (0.9 | ) |
| Total | | | 100.0 | % |
| * | Credit exposure is the long-term credit ratings for the Fund's holdings, as of the date noted, as provided by Standard and Poor's (S&P) or Moody's Investors Service (Moody's) and typically range from AAA/Aaa (highest) to C/D (lowest). Presentation of S&P and Moody's credit ratings in this report have been selected for informational purposes for shareholders, as well as the Fund's consideration of industry practice. If Moody's and S&P assign different ratings, the lower rating is used. Fixed income securities that are not rated by either agency are listed as "Not Rated." Ratings do not apply to the Fund itself or to the Fund's shares. Ratings may change. |
Diversification by Industry
as of October 31, 2014
| Industry | | Percentage of
Net Assets | |
| Airport Revenues | | | 9.9 | % |
| General Obligations | | | 15.9 | |
| Health Care/Services | | | 14.6 | |
| Higher Education (Univ., Dorms, etc.) | | | 8.3 | |
| Housing (HFA'S, etc.) | | | 1.5 | |
| Industrial | | | 1.6 | |
| Miscellaneous | | | 10.2 | |
| Pollution Control | | | 0.5 | |
| Pre-Refunded | | | 3.8 | |
| Public Facilities | | | 1.6 | |
| Special Tax Assessment | | | 4.6 | |
| Tax Allocation | | | 4.8 | |
| Transportation | | | 8.2 | |
| Utilities - Electric | | | 4.7 | |
| Utilities - Gas | | | 1.2 | |
| Utilities - Water and Sewer | | | 5.7 | |
| Waste Disposal | | | 0.3 | |
| Short-Term Investments | | | 3.5 | |
| Other Assets and Liabilities | | | (0.9 | ) |
| Total | | | 100.0 | % |
For Fund compliance purposes, the Fund may use the same classification system; these classifications are used for reporting ease.
The Hartford Municipal Real Return Fund
Schedule of Investments
October 31, 2014
(000’s Omitted)
| Shares or Principal Amount | | Market Value ╪ | |
| Municipal Bonds - 97.4% | |
| | | | | Alabama - 1.4% | | | | |
| | | | | County of Jefferson, AL, Sewer Rev | | | | |
| $ | 1,500 | | | 5.00%, 10/01/2018 | | $ | 1,657 | |
| | | | | Mobile, AL, Industrial Development Board Pollution | | | | |
| | 1,000 | | | 1.65%, 06/01/2034 | | | 1,018 | |
| | | | | | | | 2,675 | |
| | | | | Alaska - 0.6% | | | | |
| | | | | Alaska Municipal Bond Bank Auth GO | | | | |
| | 375 | | | 5.75%, 09/01/2033 | | | 431 | |
| | | | | Anchorage, AK, GO | | | | |
| | 610 | | | 5.25%, 08/01/2028 | | | 693 | |
| | | | | | | | 1,124 | |
| | | | | Arizona - 1.0% | | | | |
| | | | | Arizona State Health Fac Auth Hospital System Rev | | | | |
| | 1,000 | | | 5.00%, 02/01/2020 | | | 1,162 | |
| | | | | Estrella Mountain Ranch, AZ, Community Fac Dist GO | | | | |
| | 265 | | | 6.20%, 07/15/2032 | | | 279 | |
| | | | | Sundance, AZ, Community Fac Dist | | | | |
| | 260 | | | 7.13%, 07/01/2027 ■ | | | 260 | |
| | | | | Vistancia, AZ, Community Fac Dist GO | | | | |
| | 185 | | | 6.75%, 07/15/2022 | | | 186 | |
| | | | | | | | 1,887 | |
| | | | | California - 19.3% | | | | |
| | | | | California State Communities DA Rev | | | | |
| | 250 | | | 0.00%, 07/01/2037 ● | | | — | |
| | 570 | | | 0.94%, 04/01/2036 Δ | | | 496 | |
| | 1,000 | | | 5.00%, 10/01/2022 | | | 1,079 | |
| | | | | California State Dept Water Resources Supply Rev | | | | |
| | 500 | | | 5.00%, 05/01/2022 | | | 568 | |
| | | | | California State GO | | | | |
| | 3,515 | | | 6.50%, 04/01/2033 ‡ | | | 4,296 | |
| | | | | California State Health Facilities | | | | |
| | 1,000 | | | 6.00%, 07/01/2029 | | | 1,181 | |
| | | | | California State Pollution Control FA | | | | |
| | 1,000 | | | 1.88%, 04/01/2025 | | | 1,005 | |
| | | | | California State Public Works Board Lease Rev | | | | |
| | 1,500 | | | 5.25%, 10/01/2022 | | | 1,840 | |
| | | | | California State Public Works Board, State University Trustees | | | | |
| | 170 | | | 6.13%, 04/01/2029 | | | 203 | |
| | | | | Corona-Norco California University | | | | |
| | 1,530 | | | 4.00%, 09/01/2019 | | | 1,692 | |
| | | | | El Dorado, CA, Irrigation Dist | | | | |
| | 300 | | | 5.38%, 08/01/2024 | | | 349 | |
| | | | | Foothill-Eastern Transportation Corridor Agency | | | | |
| | 435 | | | 5.00%, 01/15/2053 Δ | | | 475 | |
| | | | | Golden State Tobacco Securitization Agency | | | | |
| | 425 | | | 5.00%, 06/01/2017 | | | 463 | |
| | | | | Huntington Park, CA, Public FA Rev | | | | |
| | 400 | | | 5.25%, 09/01/2019 | | | 409 | |
| | | | | Irvine, CA, Improvement Bond Act | | | | |
| | 1,000 | | | 4.00%, 09/02/2019 | | | 1,090 | |
| | | | | Los Angeles, CA, Airport Rev | | | | |
| | 1,100 | | | 5.00%, 01/01/2020 | | | 1,262 | |
| | | | | Oakland, CA, Airport Rev | | | | |
| | 1,000 | | | 5.00%, 05/01/2026 | | | 1,134 | |
| | | | | San Bernardino City, CA, Unif School Dist GO | | | | |
| | 725 | | | 5.00%, 08/01/2020 | | | 858 | |
| | | | | San Bernardino, CA, Community College Dist GO | | | | |
| | 500 | | | 6.38%, 08/01/2026 | | | 603 | |
| | | | | San Buenaventura, CA, Rev | | | | |
| | 500 | | | 5.25%, 12/01/2017 | | | 537 | |
| | | | | San Diego, CA, Redev Agency, Centre City Sub Pkg | | | | |
| | 200 | | | 5.25%, 09/01/2026 | | | 200 | |
| | | | | San Francisco City & County, CA, Redev FA | | | | |
| | 1,120 | | | 6.50%, 08/01/2032 | | | 1,342 | |
| | | | | San Joaquin Hills, CA, Transporation Auth | | | | |
| | 290 | | | 5.00%, 01/15/2029 ☼ | | | 325 | |
| | | | | San Jose, CA, Redev Agency | | | | |
| | 1,000 | | | 6.50%, 08/01/2019 | | | 1,168 | |
| | | | | San Mateo Joint Powers Financing Auth | | | | |
| | 1,505 | | | 5.00%, 06/15/2028 | | | 1,787 | |
| | | | | Santa Cruz County, CA, Redev Agency | | | | |
| | 1,360 | | | 5.00%, 09/01/2022 | | | 1,626 | |
| | 665 | | | 6.63%, 09/01/2029 | | | 780 | |
| | | | | Santa Margarita, CA, Water Dist Special Tax | | | | |
| | 2,000 | | | 5.00%, 09/01/2024 - 09/01/2028 | | | 2,230 | |
| | | | | Southern California State Public Power Auth | | | | |
| | 500 | | | 5.00%, 07/01/2023 | | | 573 | |
| | | | | Temecula, CA, Redev Agency Tax Allocation Rev | | | | |
| | 235 | | | 5.63%, 12/15/2038 | | | 242 | |
| | | | | Torrance, CA, USD GO | | | | |
| | 1,500 | | | 5.50%, 08/01/2025 | | | 1,748 | |
| | | | | Tuolumne, CA, Wind Proj Auth Rev | | | | |
| | 1,000 | | | 5.88%, 01/01/2029 | | | 1,184 | |
| | | | | Twin Rivers, CA, Unif School Dist Cops | | | | |
| | 700 | | | 3.20%, 06/01/2035 | | | 700 | |
| | | | | Ventura County, CA, Certificates of Participation | | | | |
| | 1,250 | | | 5.63%, 08/15/2027 | | | 1,475 | |
| | | | | Washington Township, CA, Health Care Dist Rev | | | | |
| | 1,000 | | | 6.00%, 07/01/2029 | | | 1,130 | |
| | | | | | | | 36,050 | |
| | | | | Colorado - 0.4% | | | | |
| | | | | University of Colorado Enterprise Rev | | | | |
| | 600 | | | 5.75%, 06/01/2028 | | | 724 | |
| | | | | | | | | |
| | | | | Connecticut - 0.6% | | | | |
| | | | | City of New Haven, CT, GO | | | | |
| | 1,000 | | | 5.00%, 11/01/2017 | | | 1,106 | |
| | | �� | | | | | | |
| | | | | Delaware - 0.7% | | | | |
| | | | | Delaware State Transportation Auth | | | | |
| | 1,180 | | | 5.00%, 07/01/2025 | | | 1,348 | |
| | | | | | | | | |
| | | | | District of Columbia - 3.1% | | | | |
| | | | | District of Columbia University Rev | | | | |
| | 3,000 | | | 5.25%, 04/01/2034 | | | 3,388 | |
| | | | | Metropolitan Washington, DC, Airport Auth System Rev | | | | |
| | 2,035 | | | 5.00%, 10/01/2022 - 10/01/2027 | | | 2,404 | |
| | | | | | | | 5,792 | |
| | | | | Florida - 6.7% | | | | |
| | | | | Arlington of Naples | | | | |
| | 500 | | | 6.50%, 05/15/2020 ■ | | | 502 | |
| | 500 | | | 7.00%, 05/15/2024 ■ | | | 551 | |
The accompanying notes are an integral part of these financial statements.
The Hartford Municipal Real Return Fund
Schedule of Investments – (continued)
October 31, 2014
(000’s Omitted)
| Shares or Principal Amount | | Market Value ╪ | |
| Municipal Bonds - 97.4% - (continued) | |
| | | | | Florida - 6.7% - (continued) | | | | |
| | | | | Broward County, FL, Airport System Rev | | | | |
| $ | 550 | | | 5.00%, 10/01/2019 - 10/01/2021 | | $ | 644 | |
| | | | | Greater Orlando, FL, Aviation Auth | | | | |
| | 2,500 | | | 5.00%, 10/01/2021 - 10/01/2024 | | | 2,919 | |
| | | | | Jacksonville, FL, Econ Development Commission Obligor: Florida Proton Therapy Institute, Inc | | | | |
| | 2,000 | | | 6.25%, 09/01/2027 | | | 2,178 | |
| | | | | Miami Beach, FL, Health Fac Auth | | | | |
| | 190 | | | 5.00%, 11/15/2020 | | | 221 | |
| | | | | Miami-Dade County Expressway Auth | | | | |
| | 625 | | | 5.00%, 07/01/2024 | | | 751 | |
| | | | | Miami-Dade County, FL, Educational Fac Auth | | | | |
| | 2,000 | | | 5.75%, 04/01/2028 | | | 2,129 | |
| | | | | Palm Beach County Health | | | | |
| | 1,000 | | | 6.80%, 06/01/2025 | | | 1,132 | |
| | | | | River Bend Community Development Dist, Capital Improvement Rev | | | | |
| | 780 | | | 0.00%, 11/01/2015 ● | | | 101 | |
| | | | | Village, FL, Community Development Dist #11 | | | | |
| | 250 | | | 3.25%, 05/01/2019 ☼ | | | 250 | |
| | | | | Volusia County, FL, School Board | | | | |
| | 1,000 | | | 5.00%, 08/01/2025 | | | 1,197 | |
| | | | | | | | 12,575 | |
| | | | | Georgia - 2.6% | | | | |
| | | | | Atlanta, GA, Airport Passenger Fac Charge Rev | | | | |
| | 2,000 | | | 5.00%, 01/01/2023 ╦ | | | 2,333 | |
| | | | | Atlanta, GA, Water & Wastewater Rev | | | | |
| | 1,500 | | | 6.00%, 11/01/2022 | | | 1,837 | |
| | | | | Georgia Municipal Electric Auth, Power Rev (Prerefunded with US Gov't Securities) | | | | |
| | 20 | | | 6.50%, 01/01/2017 | | | 21 | |
| | | | | Georgia State Municipal Elec Auth | | | | |
| | 605 | | | 6.50%, 01/01/2017 | | | 642 | |
| | | | | | | | 4,833 | |
| | | | | Hawaii - 0.9% | | | | |
| | | | | Hawaii State Dept of Transportation | | | | |
| | 1,000 | | | 5.00%, 08/01/2022 | | | 1,180 | |
| | | | | Hawaii State Harbor System Rev | | | | |
| | 500 | | | 5.38%, 01/01/2020 | | | 502 | |
| | | | | | | | 1,682 | |
| | | | | Idaho - 0.9% | | | | |
| | | | | Idaho State Bond Bank Auth Rev | | | | |
| | 1,470 | | | 5.63%, 09/15/2026 | | | 1,706 | |
| | | | | | | | | |
| | | | | Illinois - 10.0% | | | | |
| | | | | Chicago, IL, Board of Education | | | | |
| | 825 | | | 6.00%, 01/01/2020 | | | 928 | |
| | | | | Chicago, IL, O'Hare International Airport Rev | | | | |
| | 2,540 | | | 5.00%, 01/01/2015 - 01/01/2026 | | | 2,862 | |
| | 850 | | | 5.25%, 01/01/2027 | | | 853 | |
| | | | | Chicago, IL, Park Dist, GO | | | | |
| | 2,370 | | | 5.00%, 01/01/2025 | | | 2,770 | |
| | | | | City of Chicago, IL, GO | | | | |
| | 785 | | | 4.00%, 01/01/2018 | | | 818 | |
| | | | | Hampshire, IL, Special Service Area #13, Tuscany Woods Proj | | | | |
| | 867 | | | 0.00%, 03/01/2037 ● | | | 494 | |
| | | | | Huntley, IL, Special Service #9 | | | | |
| | 1,500 | | | 5.10%, 03/01/2028 | | | 1,615 | |
| | | | | Illinois State FA Rev | | | | |
| | 1,000 | | | 5.00%, 10/01/2023 | | | 1,189 | |
| | | | | Illinois State GO | | | | |
| | 1,000 | | | 5.00%, 01/01/2022 | | | 1,091 | |
| | 2,000 | | | 5.25%, 01/01/2021 | | | 2,277 | |
| | | | | Illinois State Toll Highway Auth | | | | |
| | 1,060 | | | 5.00%, 01/01/2023 - 01/01/2027 | | | 1,217 | |
| | | | | Railsplitter, IL, Tobacco Settlement Auth | | | | |
| | 1,000 | | | 5.50%, 06/01/2023 | | | 1,174 | |
| | | | | Springfield, IL, Water Rev | | | | |
| | 500 | | | 5.25%, 03/01/2026 | | | 555 | |
| | | | | Wauconda, IL, Special Service Area #1 Special Tax Liberty Lakes Proj | | | | |
| | 947 | | | 6.63%, 03/01/2033 | | | 953 | |
| | | | | | | | 18,796 | |
| | | | | Indiana - 1.3% | | | | |
| | | | | Indiana State Housing and Community DA | | | | |
| | 1,170 | | | 4.55%, 07/01/2027 ╦ | | | 1,191 | |
| | | | | University of Southern Indiana | | | | |
| | 1,070 | | | 5.00%, 10/01/2022 - 10/01/2023 | | | 1,220 | |
| | | | | | | | 2,411 | |
| | | | | Kentucky - 1.5% | | | | |
| | | | | Kentucky Public Transportation Inf Auth | | | | |
| | 230 | | | 5.00%, 07/01/2017 | | | 255 | |
| | | | | Kentucky State Asset/Liability Commission | | | | |
| | 1,000 | | | 5.00%, 09/01/2023 | | | 1,208 | |
| | | | | Louisville & Jefferson County, KY | | | | |
| | 1,085 | | | 5.00%, 12/01/2023 | | | 1,272 | |
| | | | | | | | 2,735 | |
| | | | | Louisiana - 0.8% | | | | |
| | | | | LA, Tobacco Settlement Financing Corp. | | | | |
| | 1,500 | | | 5.00%, 05/15/2026 | | | 1,591 | |
| | | | | | | | | |
| | | | | Maryland - 0.5% | | | | |
| | | | | Westminster Maryland Rev | | | | |
| | 1,000 | | | 3.88%, 07/01/2019 | | | 1,025 | |
| | | | | | | | | |
| | | | | Massachusetts - 0.5% | | | | |
| | | | | Massachusetts State Development Fin Agency Rev | | | | |
| | 925 | | | 5.00%, 01/01/2017 | | | 1,002 | |
| | | | | | | | | |
| | | | | Michigan - 2.0% | | | | |
| | | | | Detroit, MI, Water Supply System Ref Rev | | | | |
| | 915 | | | 6.50%, 07/01/2015 | | | 948 | |
| | | | | Grand Valley, MI, State University Rev | | | | |
| | 1,500 | | | 5.50%, 12/01/2027 | | | 1,657 | |
| | | | | Michigan FA | | | | |
| | 950 | | | 5.00%, 07/01/2018 - 07/01/2029 | | | 1,052 | |
| | | | | | | | 3,657 | |
| | | | | Missouri - 0.3% | | | | |
| | | | | Stone Canyon, MO, Community Improvement Dist Rev | | | | |
| | 1,000 | | | 0.00%, 04/01/2027 ⌂● | | | 480 | |
The accompanying notes are an integral part of these financial statements.
The Hartford Municipal Real Return Fund
Schedule of Investments – (continued)
October 31, 2014
(000’s Omitted)
| Shares or Principal Amount | | Market Value ╪ | |
| Municipal Bonds - 97.4% - (continued) | |
| | | | | Nebraska - 0.6% | | | | |
| | | | | Central Plains, NE, Energy Proj Gas Rev | | | | |
| $ | 1,000 | | | 5.00%, 09/01/2015 | | $ | 1,031 | |
| | | | | | | | | |
| | | | | Nevada - 0.6% | | | | |
| | | | | Clark County, NV, School Dist GO | | | | |
| | 1,000 | | | 5.00%, 06/15/2020 | | | 1,037 | |
| | | | | | | | | |
| | | | | New Jersey - 1.0% | | | | |
| | | | | New Jersey State Econ DA | | | | |
| | 760 | | | 4.88%, 09/15/2019 | | | 804 | |
| | | | | New Jersey State Econ DA Lease Rev | | | | |
| | 1,000 | | | 5.00%, 09/01/2021 | | | 1,141 | |
| | | | | | | | 1,945 | |
| | | | | New Mexico - 0.1% | | | | |
| | | | | Cabezon, NM, Public Improvement Dist | | | | |
| | 125 | | | 5.20%, 09/01/2015 | | | 129 | |
| | | | | | | | | |
| | | | | New York - 7.7% | | | | |
| | | | | Liberty, NY, Corp. Development Goldman Sachs Headquarters | | | | |
| | 1,000 | | | 5.25%, 10/01/2035 | | | 1,185 | |
| | | | | Metropolitan Transportation Auth, NY, Rev | | | | |
| | 3,000 | | | 5.25%, 11/15/2023 ╦ | | | 3,560 | |
| | | | | New York City Housing Development Corp | | | | |
| | 395 | | | 4.50%, 11/15/2024 ■☼ | | | 402 | |
| | | | | New York State Dormitory Auth Rev | | | | |
| | 1,970 | | | 5.00%, 03/15/2022 - 03/15/2028 | | | 2,276 | |
| | | | | New York State Dormitory Auth Rev Obligor: Teacher's College | | | | |
| | 2,000 | | | 5.38%, 03/01/2029 | | | 2,275 | |
| | | | | New York State Liberty Development Corp. Rev | | | | |
| | 765 | | | 5.15%, 11/15/2034 ■☼ | | | 778 | |
| | | | | New York, NY, GO | | | | |
| | 1,000 | | | 6.25%, 10/15/2028 | | | 1,190 | |
| | | | | Newburth, NY, GO | | | | |
| | 1,255 | | | 5.00%, 06/15/2017 - 06/15/2018 | | | 1,347 | |
| | | | | Ulster County, NY, Capital Resource Corp. Rev | | | | |
| | 575 | | | 3.72%, 09/15/2044 ■○ | | | 404 | |
| | | | | Ulster County, NY, Industrial Development Agency | | | | |
| | 1,000 | | | 6.00%, 09/15/2027 | | | 958 | |
| | | | | | | | 14,375 | |
| | | | | North Carolina - 0.5% | | | | |
| | | | | Mecklenburg County, NC, Certificate of Participation School Improvements | | | | |
| | 795 | | | 5.00%, 02/01/2024 | | | 907 | |
| | | | | | | | | |
| | | | | Ohio - 2.0% | | | | |
| | | | | Cuyahoga, OH, Community College Dist | | | | |
| | 1,200 | | | 5.00%, 08/01/2027 | | | 1,352 | |
| | | | | Dayton, OH, City School Dist | | | | |
| | 2,000 | | | 5.00%, 11/01/2027 | | | 2,425 | |
| | | | | | | | 3,777 | |
| | | | | Oklahoma - 1.3% | | | | |
| | | | | Norman, OK, Regional Hospital Auth Rev | | | | |
| | 2,310 | | | 5.25%, 09/01/2019 | | | 2,499 | |
| | | | | | | | | |
| | | | | Other U.S. Territories - 2.6% | | | | |
| | | | | Guam Government Business Privilege Tax Rev | | | | |
| | 1,500 | | | 5.00%, 01/01/2027 | | | 1,693 | |
| | | | | Guam Government Power Auth Rev | | | | |
| | 2,000 | | | 5.00%, 10/01/2021 - 10/01/2023 | | | 2,374 | |
| | | | | Puerto Rico Highway and Transportation Auth | | | | |
| | 380 | | | 4.95%, 07/01/2026 | | | 378 | |
| | | | | University Virgin Islands | | | | |
| | 270 | | | 5.13%, 12/01/2022 | | | 271 | |
| | 225 | | | 5.25%, 12/01/2023 - 12/01/2024 | | | 226 | |
| | | | | | | | 4,942 | |
| | | | | Pennsylvania - 3.7% | | | | |
| | | | | Montgomery County, PA, Higher Education and Health | | | | |
| | 1,000 | | | 5.00%, 10/01/2023 | | | 1,130 | |
| | | | | Pennsylvania State Turnpike Commission Rev | | | | |
| | 665 | | | 6.00%, 06/01/2028 | | | 765 | |
| | | | | Philadelphia, PA, GO | | | | |
| | 1,000 | | | 5.25%, 08/01/2019 | | | 1,169 | |
| | | | | Pittsburgh, PA, School Dist GO | | | | |
| | 2,320 | | | 5.00%, 09/01/2021 - 09/01/2023 | | | 2,710 | |
| | | | | Susquehanna, PA, Regional Airport Auth System Rev | | | | |
| | 1,000 | | | 5.00%, 01/01/2018 | | | 1,082 | |
| | | | | | | | 6,856 | |
| | | | | Rhode Island - 1.6% | | | | |
| | | | | Cranston, RI, GO | | | | |
| | 1,410 | | | 5.00%, 07/01/2018 | | | 1,583 | |
| | | | | Rhode Island State Health and Educational Bldg Corp. | | | | |
| | 1,215 | | | 5.00%, 05/15/2018 | | | 1,350 | |
| | | | | | | | 2,933 | |
| | | | | South Carolina - 0.6% | | | | |
| | | | | South Carolina St Jobs-Econ Development Auth Hospital Rev | | | | |
| | 1,000 | | | 5.25%, 08/01/2024 | | | 1,161 | |
| | | | | | | | | |
| | | | | South Dakota - 0.3% | | | | |
| | | | | South Dakota State Health & Educational FA | | | | |
| | 415 | | | 5.00%, 11/01/2029 | | | 482 | |
| | | | | | | | | |
| | | | | Tennessee - 0.6% | | | | |
| | | | | Johnson City, TN, Health & Educational Fac Board Hospital Rev | | | | |
| | 1,000 | | | 5.50%, 07/01/2031 | | | 1,052 | |
| | | | | | | | | |
| | | | | Texas - 10.2% | | | | |
| | | | | Arlington, TX, Higher Education Fin | | | | |
| | 1,000 | | | 5.00%, 08/15/2024 | | | 1,229 | |
| | | | | Dallas-Fort Worth, TX, International Airport Rev | | | | |
| | 750 | | | 5.00%, 11/01/2023 | | | 861 | |
| | | | | El Paso, TX, ISD, GO | | | | |
| | 2,000 | | | 5.00%, 08/15/2026 | | | 2,217 | |
| | | | | Houston, TX, Utility System Rev | | | | |
| | 2,000 | | | 6.00%, 11/15/2036 | | | 2,362 | |
| | | | | Kerrville, TX, Health Fac Development Corp Hospital Rev | | | | |
| | 935 | | | 5.00%, 08/15/2015 | | | 960 | |
The accompanying notes are an integral part of these financial statements.
The Hartford Municipal Real Return Fund
Schedule of Investments – (continued)
October 31, 2014
(000’s Omitted)
| Shares or Principal Amount | | | | | | Market Value ╪ | |
| Municipal Bonds - 97.4% - (continued) | |
| | | | | Texas - 10.2% - (continued) | | | | | | | | |
| | | | | Love Field, TX, Airport Modernization Corp Special Fac Rev | | | | | | | | |
| $ | 1,000 | | | 5.00%, 11/01/2015 | | | | | | $ | 1,040 | |
| | | | | Lower Colorado River Auth Rev (Prerefunded with State & Local Gov't Securities) | | | | | | | | |
| | 1,965 | | | 7.25%, 05/15/2037 | | | | | | | 2,038 | |
| | | | | North Texas Tollway Auth Rev | | | | | | | | |
| | 1,055 | | | 1.95%, 01/01/2038 | | | | | | | 1,077 | |
| | 3,000 | | | 6.00%, 01/01/2025 | | | | | | | 3,386 | |
| | | | | Tarrant County, TX, Cultural Education Fac | | | | | | | | |
| | 1,000 | | | 6.25%, 11/15/2029 | | | | | | | 1,163 | |
| | | | | Texas State Municipal Gas Acquisition & Supply Cor | | | | | | | | |
| | 1,000 | | | 5.25%, 12/15/2017 | | | | | | | 1,111 | |
| | | | | Texas State Transportation Commission Turnpike System Rev | | | | | | | | |
| | 635 | | | 1.25%, 08/15/2042 | | | | | | | 637 | |
| | | | | Travis County, TX, Health Fac, Querencia Barton Creek Project | | | | | | | | |
| | 1,000 | | | 5.65%, 11/15/2035 | | | | | | | 1,012 | |
| | | | | | | | | | | | 19,093 | |
| | | | | Vermont - 0.3% | | | | | | | | |
| | | | | Vermont State Econ DA Waste | | | | | | | | |
| | 600 | | | 4.75%, 04/01/2036 ■ | | | | | | | 617 | |
| | | | | | | | | | | | | |
| | | | | Virginia - 0.3% | | | | | | | | |
| | | | | Virginia State Resources Auth Infrastructure | | | | | | | | |
| | 500 | | | 5.00%, 11/01/2024 | | | | | | | 569 | |
| | | | | | | | | | | | | |
| | | | | Washington - 4.4% | | | | | | | | |
| | | | | FYI Properties, WA, Lease Rev | | | | | | | | |
| | 2,285 | | | 5.50%, 06/01/2034 | | | | | | | 2,588 | |
| | | | | Grant County, WA, Utility Dist #2 | | | | | | | | |
| | 1,605 | | | 5.00%, 01/01/2021 | | | | | | | 1,889 | |
| | | | | Tobacco Settlement Auth, WA, Rev | | | | | | | | |
| | 1,500 | | | 5.00%, 06/01/2023 | | | | | | | 1,750 | |
| | | | | Washington State Health Care Fac Auth | | | | | | | | |
| | 1,820 | | | 5.00%, 03/01/2029 | | | | | | | 2,087 | |
| | | | | | | | | | | | 8,314 | |
| | | | | West Virginia - 0.8% | | | | | | | | |
| | | | | West Virginia State Econ DA Solid Waste Disposal Fac | | | | | | | | |
| | 1,500 | | | 2.25%, 01/01/2041 | | | | | | | 1,524 | |
| | | | | | | | | | | | | |
| | | | | Wisconsin - 3.1% | | | | | | | | |
| | | | | Milwaukee County, WI, Airport Rev | | | | | | | | |
| | 1,705 | | | 5.00%, 12/01/2024 ☼ | | | | | | | 1,990 | |
| | | | | Wisconsin State | | | | | | | | |
| | 125 | | | 5.75%, 05/01/2033 | | | | | | | 147 | |
| | 865 | | | 6.00%, 05/01/2036 | | | | | | | 1,026 | |
| | | | | Wisconsin State Health & Educational Fac Auth Rev | | | | | | | | |
| | 2,265 | | | 5.00%, 02/15/2026 | | | | | | | 2,547 | |
| | | | | | | | | | | | 5,710 | |
| | | | | Total Municipal Bonds | | | | | | | | |
| | | | | (Cost $172,209) | | | | | | $ | 182,152 | |
| | | | | | | | | | | | | |
| | | | | Total Long-Term Investments | | | | | | | | |
| | | | | (Cost $172,209) | | | | | | $ | 182,152 | |
| | | | | | | | | | | | | |
| Short-Term Investments - 3.5% | | | |
| | | | | Other Investment Pools and Funds - 3.5% | | | | | | | | |
| | 6,593 | | | JP Morgan Tax Free Money Market Fund | | | | | | $ | 6,593 | |
| | | | | | | | | | | | | |
| | | | | Total Short-Term Investments | | | | | | | | |
| | | | | (Cost $6,593) | | | | | | $ | 6,593 | |
| | | | | | | | | | | | | |
| | | | | Total Investments | | | | | | | | |
| | | | | (Cost $178,802) ▲ | | | 100.9 | % | | $ | 188,745 | |
| | | | | Other Assets and Liabilities | | | (0.9 | )% | | | (1,646 | ) |
| | | | | Total Net Assets | | | 100.0 | % | | $ | 187,099 | |
The accompanying notes are an integral part of these financial statements.
The Hartford Municipal Real Return Fund
Schedule of Investments
October 31, 2014
(000’s Omitted)
| Note: | Percentage of investments as shown is the ratio of the total market value to total net assets. |
The Fund may refer to any one or more of the industry classifications used by one or more widely recognized market indices, ratings group indices and/or as defined by Fund management. Industry classifications may not be identical across all security types.
For Fund compliance purposes, the Fund may not use the same classification system shown in this report as these classifications are used for reporting ease.
| ▲ | At October 31, 2014, the cost of securities for federal income tax purposes was $178,802 and the aggregate gross unrealized appreciation and depreciation based on that cost were: |
| Unrealized Appreciation | | $ | 11,882 | |
| Unrealized Depreciation | | | (1,939 | ) |
| Net Unrealized Appreciation | | $ | 9,943 | |
| ● | Non-income producing. For long-term debt securities, items identified are in default as to payment of interest and/or principal. |
| Δ | Variable rate securities; the rate reported is the coupon rate in effect at October 31, 2014. |
| ○ | The interest rate disclosed for these securities represents the effective yield on the date of the acquisition. |
| ■ | Securities issued within terms of a private placement memorandum, exempt from registration under Rule 144A under the Securities Act of 1933, as amended, and may be sold only to qualified institutional buyers. Unless otherwise indicated, these holdings are determined to be liquid. At October 31, 2014, the aggregate value of these securities was $3,514, which represents 1.9% of total net assets. |
| ⌂ | The following securities are considered illiquid. Illiquid securities are often purchased in private placement transactions, are often not registered under the Securities Act of 1933, as amended, and may have contractual restrictions on resale. A security may also be considered illiquid if the security lacks a readily available market or if its valuation has not changed for a certain period of time. |
| Period Acquired | | Shares/ Par | | | Security | | Cost Basis | |
| 04/2007 | | $ | 1,000 | | | Stone Canyon, MO, Community Improvement Dist Rev, 0.00%, 04/01/2027 | | $ | 990 | |
At October 31, 2014, the aggregate value of these securities was $480, which represents 0.3% of total net assets.
| ☼ | This security, or a portion of this security, was purchased on a when-issued or delayed-delivery basis. The cost of these securities was $3,729 at October 31, 2014. |
| ‡ | This security, or a portion of this security, has been segregated to cover funding requirements on investment transactions settling in the future. |
| ╦ | This security, or a portion of this security, has been pledged as collateral in connection with swap contracts. |
Cash pledged and received as collateral in connection with derivatives at October 31, 2014:
| | | Pledged | | | Received | |
| OTC swap contracts | | $ | 6,346 | | | $ | – | |
| Total | | $ | 6,346 | | | $ | – | |
OTC Total Return Swap Contracts Outstanding at October 31, 2014
| | | Payments made | | Payments received | | Notional | | | Expiration | | Upfront
Premiums | | | Upfront
Premiums | | | Market | | | Unrealized
Appreciation/(Depreciation) | |
| Counterparty | | by Fund | | by Fund (a) | | Amount | | | Date | | Paid | | | Received | | | Value ╪ | | | Asset | | | Liability | |
| BCLY | | 1.86% Fixed | | CPURNSA | | USD | 3,600 | | | 01/15/20 | | $ | – | | | $ | – | | | $ | – | | | $ | – | | | $ | – | |
| BCLY | | 2.09% Fixed | | CPURNSA | | USD | 9,125 | | | 12/14/15 | | | – | | | | – | | | | (210 | ) | | | – | | | | (210 | ) |
| BCLY | | 2.09% Fixed | | CPURNSA | | USD | 4,175 | | | 07/15/16 | | | – | | | | – | | | | (48 | ) | | | – | | | | (48 | ) |
| BCLY | | 2.12% Fixed | | CPURNSA | | USD | 7,550 | | | 01/15/19 | | | – | | | | – | | | | (140 | ) | | | – | | | | (140 | ) |
| BCLY | | 2.22% Fixed | | CPURNSA | | USD | 12,925 | | | 04/05/15 | | | – | | | | – | | | | (257 | ) | | | – | | | | (257 | ) |
| BCLY | | 2.75% Fixed | | CPURNSA | | USD | 7,000 | | | 03/03/21 | | | – | | | | – | | | | (555 | ) | | | – | | | | (555 | ) |
| BCLY | | 2.98% Fixed | | CPURNSA | | USD | 5,750 | | | 03/08/26 | | | – | | | | – | | | | (691 | ) | | | – | | | | (691 | ) |
| BNP | | 1.53% Fixed | | CPURNSA | | USD | 11,325 | | | 01/15/18 | | | – | | | | – | | | | 8 | | | | 8 | | | | – | |
| BOA | | 2.45% Fixed | | CPURNSA | | USD | 7,800 | | | 03/22/17 | | | – | | | | – | | | | (339 | ) | | | – | | | | (339 | ) |
The accompanying notes are an integral part of these financial statements.
The Hartford Municipal Real Return Fund
Schedule of Investments – (continued)
October 31, 2014
(000’s Omitted)
OTC Total Return Swap Contracts Outstanding at October 31, 2014 - (continued)
| | | Payments made | | Payments received | | Notional | | | Expiration | | Upfront
Premiums | | | Upfront
Premiums | | | Market | | | Unrealized
Appreciation/(Depreciation) | |
| Counterparty | | by Fund | | by Fund (a) | | Amount | | | Date | | Paid | | | Received | | | Value ╪ | | | Asset | | | Liability | |
| CBK | | 2.34% Fixed | | CPURNSA | | USD | 525 | | | 04/15/18 | | $ | – | | | $ | – | | | $ | (20 | ) | | $ | – | | | $ | (20 | ) |
| DEUT | | 2.40% Fixed | | CPURNSA | | USD | 2,125 | | | 03/12/17 | | | – | | | | – | | | | (85 | ) | | | – | | | | (85 | ) |
| DEUT | | 2.48% Fixed | | CPURNSA | | USD | 2,300 | | | 07/15/23 | | | – | | | | – | | | | (80 | ) | | | – | | | | (80 | ) |
| JPM | | 2.33% Fixed | | CPURNSA | | USD | 7,000 | | | 09/30/21 | | | – | | | | – | | | | (274 | ) | | | – | | | | (274 | ) |
| JPM | | 2.75% Fixed | | CPURNSA | | USD | 7,000 | | | 03/03/21 | | | – | | | | – | | | | (555 | ) | | | – | | | | (555 | ) |
| JPM | | 2.97% Fixed | | CPURNSA | | USD | 6,800 | | | 04/14/26 | | | – | | | | – | | | | (804 | ) | | | – | | | | (804 | ) |
| MSC | | 2.60% Fixed | | CPURNSA | | USD | 6,450 | | | 08/08/23 | | | – | | | | – | | | | (302 | ) | | | – | | | | (302 | ) |
| UBS | | 2.65% Fixed | | CPURNSA | | USD | 5,250 | | | 03/04/18 | | | – | | | | – | | | | (304 | ) | | | – | | | | (304 | ) |
| UBS | | 2.71% Fixed | | CPURNSA | | USD | 1,750 | | | 04/13/16 | | | – | | | | – | | | | (85 | ) | | | – | | | | (85 | ) |
| UBS | | 2.75% Fixed | | CPURNSA | | USD | 7,000 | | | 03/03/21 | | | – | | | | – | | | | (555 | ) | | | – | | | | (555 | ) |
| UBS | | 2.79% Fixed | | CPURNSA | | USD | 7,800 | | | 04/13/18 | | | – | | | | – | | | | (548 | ) | | | – | | | | (548 | ) |
| UBS | | 2.95% Fixed | | CPURNSA | | USD | 5,750 | | | 03/07/26 | | | – | | | | – | | | | (653 | ) | | | – | | | | (653 | ) |
| Total | | | | | | | | $ | – | | | $ | – | | | $ | (6,497 | ) | | $ | 8 | | | $ | (6,505 | ) |
| (a) | For payments received based on the CPURNSA index, if the index level of the floating index drops below the initial index level when the total return swap was purchased, the Fund will be required to make a payment to the counterparty rather than receive the payment noted in the table above. |
| ╪ | See Significant Accounting Policies of accompanying Notes to Financial Statements regarding valuation of securities. |
| GLOSSARY: (abbreviations used in preceding Schedule of Investments) |
| |
| Counterparty Abbreviations: |
| BCLY | Barclays |
| BNP | BNP Paribas Securities Services |
| BOA | Banc of America Securities LLC |
| CBK | Citibank NA |
| DEUT | Deutsche Bank Securities, Inc. |
| JPM | JP Morgan Chase & Co. | |
| MSC | Morgan Stanley |
| UBS | UBS AG |
| |
| Currency Abbreviations: |
| USD | U.S. Dollar | |
| |
| Index Abbreviations: |
| CPURNSA | Consumer Price All Urban Non-Seasonally Adjusted |
| |
| Municipal Bond Abbreviations: |
| DA | Development Authority | |
| FA | Finance Authority | |
| GO | General Obligation | |
| ISD | Independent School District |
| Rev | Revenue | |
| USD | United School District | |
| | |
| Other Abbreviations: |
| OTC | Over-the-Counter |
The accompanying notes are an integral part of these financial statements.
The Hartford Municipal Real Return Fund
Schedule of Investments
October 31, 2014
(000’s Omitted)
Investment Valuation Hierarchy Level Summary
October 31, 2014
| | | Total | | | Level 1 ♦ | | | Level 2 ♦ | | | Level 3 | |
| Assets: | | | | | | | | | | | | | | | | |
| Municipal Bonds | | $ | 182,152 | | | $ | – | | | $ | 182,152 | | | $ | – | |
| Short-Term Investments | | | 6,593 | | | | 6,593 | | | | – | | | | – | |
| Total | | $ | 188,745 | | | $ | 6,593 | | | $ | 182,152 | | | $ | – | |
| Swaps - Total Return * | | $ | 8 | | | $ | – | | | $ | 8 | | | $ | – | |
| Total | | $ | 8 | | | $ | – | | | $ | 8 | | | $ | – | |
| Liabilities: | | | | | | | | | | | | | | | | |
| Swaps - Total Return * | | $ | 6,505 | | | $ | – | | | $ | 6,505 | | | $ | – | |
| Total | | $ | 6,505 | | | $ | – | | | $ | 6,505 | | | $ | – | |
| ♦ | For the year ended October 31, 2014, there were no transfers between Level 1 and Level 2. |
| * | Derivative instruments (excluding purchased and written options, if applicable) are valued at the unrealized appreciation/depreciation on the investments. |
| Note: | For purposes of reporting transfers between different hierarchy levels, both transfers in and out of each level, as applicable, are shown as if they occurred at the beginning of the period. |
The accompanying notes are an integral part of these financial statements.
The Hartford Municipal Real Return Fund
Statement of Assets and Liabilities
October 31, 2014
(000’s Omitted)
| Assets: | | | | |
| Investments in securities, at market value (cost $178,802) | | $ | 188,745 | |
| Cash | | | 6,473 | * |
| Unrealized appreciation on OTC swap contracts | | | 8 | |
| Receivables: | | | | |
| Fund shares sold | | | 128 | |
| Interest | | | 2,250 | |
| Other assets | | | 118 | |
| Total assets | | | 197,722 | |
| Liabilities: | | | | |
| Unrealized depreciation on OTC swap contracts | | | 6,505 | |
| Payables: | | | | |
| Investment securities purchased | | | 3,729 | |
| Fund shares redeemed | | | 286 | |
| Investment management fees | | | 18 | |
| Dividends | | | 44 | |
| Distribution fees | | | 12 | |
| Accrued expenses | | | 29 | |
| Total liabilities | | | 10,623 | |
| Net assets | | $ | 187,099 | |
| Summary of Net Assets: | | | | |
| Capital stock and paid-in-capital | | $ | 227,539 | |
| Undistributed net investment income | | | 68 | |
| Accumulated net realized loss | | | (43,954 | ) |
| Unrealized appreciation of investments | | | 3,446 | |
| Net assets | | $ | 187,099 | |
| | | | | |
| Shares authorized | | | 19,300,000 | |
| Par value | | $ | 0.0001 | |
| Class A: Net asset value per share/Maximum offering price per share | | | $9.50/$9.95 | |
| Shares outstanding | | | 12,201 | |
| Net assets | | $ | 115,957 | |
| Class B: Net asset value per share | | $ | 9.41 | |
| Shares outstanding | | | 159 | |
| Net assets | | $ | 1,497 | |
| Class C: Net asset value per share | | $ | 9.45 | |
| Shares outstanding | | | 3,390 | |
| Net assets | | $ | 32,022 | |
| Class I: Net asset value per share | | $ | 9.53 | |
| Shares outstanding | | | 1,751 | |
| Net assets | | $ | 16,682 | |
| Class Y: Net asset value per share | | $ | 9.48 | |
| Shares outstanding | | | 2,210 | |
| Net assets | | $ | 20,941 | |
* Cash of $6,346 was pledged as collateral for open financial derivative instruments at October 31, 2014.
The accompanying notes are an integral part of these financial statements.
The Hartford Municipal Real Return Fund
Statement of Operations
For the Year Ended October 31, 2014
(000’s Omitted)
| Investment Income: | | | | |
| Interest | | $ | 6,790 | |
| Total investment income | | | 6,790 | |
| | | | | |
| Expenses: | | | | |
| Investment management fees | | | 909 | |
| Transfer agent fees | | | | |
| Class A | | | 62 | |
| Class B | | | 2 | |
| Class C | | | 16 | |
| Class I | | | 8 | |
| Class Y | | | — | |
| Distribution fees | | | | |
| Class A | | | 280 | |
| Class B | | | 19 | |
| Class C | | | 339 | |
| Custodian fees | | | 8 | |
| Accounting services fees | | | 29 | |
| Registration and filing fees | | | 91 | |
| Board of Directors' fees | | | 6 | |
| Audit fees | | | 12 | |
| Other expenses | | | 27 | |
| Total expenses (before waivers) | | | 1,808 | |
| Expense waivers | | | (81 | ) |
| Total waivers | | | (81 | ) |
| Total expenses, net | | | 1,727 | |
| Net Investment Income | | | 5,063 | |
| Net Realized Loss on Investments and Other Financial Instruments: | | | | |
| Net realized gain on investments | | | 799 | |
| Net realized loss on swap contracts | | | (1,384 | ) |
| Net Realized Loss on Investments and Other Financial Instruments | | | (585 | ) |
| Net Changes in Unrealized Appreciation of Investments and Other Financial Instruments: | | | | |
| Net unrealized appreciation of investments | | | 6,292 | |
| Net unrealized depreciation of swap contracts | | | (1,574 | ) |
| Net Changes in Unrealized Appreciation of Investments and Other Financial Instruments | | | 4,718 | |
| Net Gain on Investments and Other Financial Instruments | | | 4,133 | |
| Net Increase in Net Assets Resulting from Operations | | $ | 9,196 | |
The accompanying notes are an integral part of these financial statements.
The Hartford Municipal Real Return Fund
Statement of Changes in Net Assets
(000’s Omitted)
| | | For the
Year Ended
October 31, 2014 | | | For the
Year Ended
October 31, 2013 | |
| Operations: | | | | | | | | |
| Net investment income | | $ | 5,063 | | | $ | 5,674 | |
| Net realized loss on investments and other financial instruments | | | (585 | ) | | | (150 | ) |
| Net unrealized appreciation (depreciation) of investments and other financial instruments | | | 4,718 | | | | (11,684 | ) |
| Net Increase (Decrease) in Net Assets Resulting from Operations | | | 9,196 | | | | (6,160 | ) |
| Distributions to Shareholders: | | | | | | | | |
| From net investment income | | | | | | | | |
| Class A | | | (3,209 | ) | | | (3,614 | ) |
| Class B | | | (40 | ) | | | (50 | ) |
| Class C | | | (727 | ) | | | (798 | ) |
| Class I | | | (384 | ) | | | (486 | ) |
| Class Y | | | (677 | ) | | | (703 | ) |
| Total distributions | | | (5,037 | ) | | | (5,651 | ) |
| Capital Share Transactions: | | | | | | | | |
| Class A | | | (10,632 | ) | | | (26,707 | ) |
| Class B | | | (744 | ) | | | (1,169 | ) |
| Class C | | | (6,971 | ) | | | (9,315 | ) |
| Class I | | | 3,712 | | | | (6,314 | ) |
| Class Y | | | (1,953 | ) | | | (3,972 | ) |
| Net decrease from capital share transactions | | | (16,588 | ) | | | (47,477 | ) |
| Net Decrease in Net Assets | | | (12,429 | ) | | | (59,288 | ) |
| Net Assets: | | | | | | | | |
| Beginning of period | | | 199,528 | | | | 258,816 | |
| End of period | | $ | 187,099 | | | $ | 199,528 | |
| Undistributed (distributions in excess of) net investment income | | $ | 68 | | | $ | 42 | |
The accompanying notes are an integral part of these financial statements.
The Hartford Municipal Real Return Fund
Notes to Financial Statements
October 31, 2014
(000’s Omitted)
Organization:
The Hartford Mutual Funds II, Inc. (“Company”) is an open-end management investment company comprised of four portfolios. Financial statements for The Hartford Municipal Real Return Fund (the "Fund"), a series of the Company, are included in this report.
The Company is organized under the laws of the State of Maryland and is registered with the Securities and Exchange Commission (“SEC”) under the Investment Company Act of 1940, as amended (“1940 Act”). The Fund is a diversified open-end management investment company. The Fund is an investment company and applies specialized accounting and reporting under Accounting Standards Codification Topic 946, Financial Services - Investment Companies.
Class A shares are sold with a front-end sales charge of up to 4.50%. Class B shares were sold with a contingent deferred sales charge which is assessed on the lesser of the per share net asset value (“NAV”) of the shares at the time of redemption or the original purchase price, and declines from up to 5.00% to zero depending on the period of time the shares are held (see note below regarding the closing of Class B shares). Class C shares are sold with a contingent deferred sales charge of up to 1.00% on shares redeemed within twelve months of purchase. Class I shares are sold without sales charges to certain eligible investors primarily through advisory fee-based wrap programs. Class Y shares, which are sold to certain eligible institutional investors, are sold without a sales charge. All classes of shares have identical voting, redemption, dividend, liquidation and other rights and the same terms and conditions, with the exceptions that each class may have different expenses, which may affect performance, and that Class B shares automatically convert to Class A shares after 8 years.
No new or additional investments are allowed in Class B shares of the Fund (including investments through any systematic investment plan). Existing shareholders of Class B shares may continue to hold their Class B shares, exchange their Class B shares for Class B shares of another Hartford Fund (as permitted by existing exchange privileges), or redeem their Class B shares as described in the Fund’s prospectus. Reinstatement privileges with respect to Class B shares are set forth in the Fund's prospectus. For investors electing to reinvest capital gains and dividends, any such capital gains or dividends on Class B shares will continue to be reinvested in Class B shares of the Fund. All Class B share attributes, including the 12b-1 fee, contingent deferred sales charge schedule, and conversion to Class A shares, remain unchanged.
Significant Accounting Policies:
The following is a summary of significant accounting policies of the Fund in the preparation of its financial statements, which are in accordance with United States generally accepted accounting principles (“U.S. GAAP”). The preparation of financial statements in accordance with U.S. GAAP may require management to make estimates and assumptions that affect the reported amounts of assets and liabilities and disclosure of contingent assets and liabilities at the date of the financial statements and the reported amounts of increases and decreases in net assets from operations during the reporting period. Actual results could differ from those estimates.
Determination of Net Asset Value – The NAV of each class of the Fund's shares is determined as of the close of regular trading (normally 4:00 p.m. Eastern Time) (the “NYSE Close”) on each day that the New York Stock Exchange (the “Exchange”) is open (“Valuation Date”). Information that becomes known to the Fund after the NAV has been calculated on a particular day will not generally be used to retroactively adjust the NAV determined earlier that day.
Investment Valuation and Fair Value Measurements – For purposes of calculating the NAV, portfolio investments and other assets held by the Fund's portfolio for which market quotes are readily available are valued at market value. Market value is generally determined on the basis of last reported sales prices or official close price. If no sales are reported, market value is based on quotes obtained from a quotation reporting system, established market makers, or independent pricing services. If market prices are not readily available or are deemed unreliable, the Fund will use the fair value of the investment as determined in good faith under policies and procedures established by and under the supervision of the Company's Board of Directors. Market quotes are considered not readily available where there is an absence of current or reliable market-based data (e.g., trade information or indicative market quotes), including where events occur after the close of the relevant market, but prior to the NYSE Close, that materially affect the values of the Fund's portfolio investments or assets. In addition, market quotes are considered not readily available when, due to extraordinary circumstances, the exchanges or markets on which the investments trade do not open for trading for the entire day and
The Hartford Municipal Real Return Fund
Notes to Financial Statements – (continued)
October 31, 2014
(000’s Omitted)
no other market prices are available. There can be no assurance that the Fund could obtain the fair market value assigned to an investment if the Fund were to sell the investment at approximately the time at which the Fund determines its NAV.
Fixed income investments (other than short-term obligations), non-exchange traded derivatives and centrally cleared swaps held by the Fund are normally valued on the basis of quotes obtained from independent pricing services or brokers and dealers in accordance with procedures established by the Company's Board of Directors. Prices obtained from independent pricing services use information provided by market makers or estimates of market values through accepted market modeling, trading and pricing conventions. Inputs to the models may include, but are not limited to, prepayment speeds, pricing spread, yield, trade information, dealer quotes, market color, cash flow models and the investment’s terms and conditions. Generally, the Fund may use fair valuation in regard to fixed income investments when the Fund holds defaulted or distressed investments or investments in a company in which a reorganization is pending. Short-term investments maturing in 60 days or less are generally valued at amortized cost, if their original term to maturity was 60 days or less, or by amortizing their value on the 61st day prior to maturity, if the original term to maturity exceeded 60 days, which approximates fair value.
Investments in open-end mutual funds are valued at the respective NAV of each open-end mutual fund on the Valuation Date.
Financial instruments for which prices are not available from an independent pricing service may be valued using market quotations obtained from one or more dealers that make markets in the respective financial instrument in accordance with procedures established by the Company's Board of Directors.
U.S. GAAP defines fair value as the price that the Fund would receive to sell an asset or pay to transfer a liability in an orderly transaction between market participants. The U.S. GAAP fair value measurement standards require disclosure of a fair value hierarchy for each major category of assets and liabilities. Various inputs are used in determining the fair value of the Fund’s investments. These inputs are summarized into three broad hierarchy levels. This hierarchy is based on whether the valuation inputs are observable or unobservable. These levels are:
Level 1 – Quoted prices in active markets for identical investments. Level 1 may include exchange traded instruments, such as domestic equities, some foreign equities, options, futures, mutual funds, exchange traded funds, rights and warrants.
Level 2 – Observable inputs other than Level 1 prices, such as quoted prices for similar investments; quoted prices in markets that are not active; or other inputs that are observable or can be corroborated by observable market data. Level 2 may include debt investments that are traded less frequently than exchange traded instruments and which are valued using independent pricing services; foreign equities, which are principally traded on certain foreign markets and are adjusted daily pursuant to a fair value pricing service in order to reflect an adjustment for the factors occurring after the close of certain foreign markets but before the NYSE Close; senior floating rate interests, which are valued using an aggregate of dealer bids; short-term investments, which are valued at amortized cost; and swaps, which are valued based upon the terms of each swap contract.
Level 3 – Significant unobservable inputs that are supported by limited or no market activity. Level 3 may include financial instruments whose values are determined using indicative market quotes or require significant management judgment or estimation. These unobservable valuation inputs may include estimates for current yields, maturity/duration, prepayment speed, and indicative market quotes for comparable investments along with other assumptions relating to credit quality, collateral value, complexity of the investment structure, general market conditions and liquidity. This category may include investments where trading has been halted or there are certain restrictions on trading. While these investments are priced using unobservable inputs, the valuation of these investments reflects the best available data and management believes the prices are a reasonable representation of exit price.
The Board of Directors of the Company generally reviews and approves the “Procedures for Valuation of Portfolio Securities” at least once a year. These procedures define how investments are to be valued, including the formation and activities of a Valuation Committee. The Valuation Committee is responsible for determining in good faith the fair value of investments when the value cannot be obtained from primary pricing services or alternative sources or if the valuation of an investment as provided by the primary pricing service or alternative source is believed not to reflect the investment’s fair value as of the Valuation Date.
The Hartford Municipal Real Return Fund
Notes to Financial Statements – (continued)
October 31, 2014
(000’s Omitted)
Voting members of the Valuation Committee include the Fund's Treasurer or designee and a Vice President of the investment manager or designee. An Assistant Vice President of the Fund with legal expertise or designee is also included on the Valuation Committee as a non-voting advisory member. In addition, the Fund’s Chief Compliance Officer shall designate a member of the compliance group to attend Valuation Committee meetings as a non-voting resource, to monitor for and provide guidance with respect to compliance with these procedures. Two members of the Valuation Committee or their designees, representing different departments, shall constitute a quorum for purposes of permitting the Valuation Committee to take action. The Valuation Committee will consider all relevant factors in determining an investment’s fair value, and may seek the advice of the Fund’s sub-adviser, knowledgeable brokers, and legal counsel in making such determination. The Valuation Committee reports to the Audit Committee of the Company's Board of Directors. The Audit Committee receives quarterly written reports which include details of all fair-valued investments, including the reason for the fair valuation, and an indication, when possible, of the accuracy of the valuation by disclosing the next available reliable public price quotation or the disposition price of such investments (the “look-back” test). The Board of Directors then must consider for ratification all of the fair value determinations made during the previous quarter.
Valuation levels are not necessarily indicative of the risk associated with investing in such investments. Individual investments within any of the above mentioned asset classes may be assigned a different hierarchical level than those presented above, as individual circumstances dictate.
For additional information, refer to the Investment Valuation Hierarchy Level Summary which follows the Schedule of Investments.
Investment Transactions and Investment Income – Investment transactions are recorded as of the trade date (the date the order to buy or sell is executed) for financial reporting purposes. Investments purchased or sold on a when-issued or delayed-delivery basis may be settled a month or more after the trade date. Realized gains and losses are determined on the basis of identified cost.
Dividend income from domestic securities is accrued on the ex-dividend date. Interest income, including amortization of premium, accretion of discounts and additional principal received in-kind in lieu of cash, is accrued on a daily basis.
Fund Share Valuation and Dividend Distributions to Shareholders – Orders for the Fund’s shares are executed in accordance with the investment instructions of the shareholders. The NAV of the Fund’s shares is determined as of the close of business on each business day of the Exchange. The NAV is determined separately for each class of shares of the Fund by dividing the Fund’s net assets attributable to that class by the number of shares of the class outstanding. Each class of shares offered by the Fund has equal rights as to assets and voting privileges (except that shareholders of a class have exclusive voting rights regarding any matter relating solely to that class of shares). Income and non-class specific expenses are allocated daily to each class on the basis of the relative net assets of the class. Realized and unrealized gains and losses are allocated daily based on the relative net assets of each class of shares of the Fund.
Orders for the purchase of the Fund’s shares received prior to the close of the Exchange on any day the Exchange is open for business are priced at the NAV determined as of the close of the Exchange. Orders received after the close of the Exchange, or on a day on which the Exchange and/or the Fund is not open for business, are priced at the next determined NAV.
Dividends are declared pursuant to a policy adopted by the Company's Board of Directors based upon the investment performance of the Fund. Normally, dividends from net investment income are declared daily and paid monthly. Dividends from realized gains, if any, are paid at least once a year.
Net investment income, dividends and distributions from net realized gains and capital are determined in accordance with federal income tax regulations, which may differ from U.S. GAAP with respect to character and timing (see Federal Income Taxes: Distributions and Components of Distributable Earnings and Reclassification of Capital Accounts).
The Hartford Municipal Real Return Fund
Notes to Financial Statements – (continued)
October 31, 2014
(000’s Omitted)
Securities and Other Investments:
Illiquid and Restricted Investments – The Fund is permitted to invest up to 15% of its net assets in illiquid investments. Illiquid investments are those that may not be sold or disposed of in the ordinary course of business within seven days, at approximately the price used to determine the Fund’s NAV. The Fund may not be able to sell illiquid investments when its sub-adviser considers it desirable to do so or may have to sell such investments at a price that is lower than the price that could be obtained if the investments were more liquid. A sale of illiquid investments may require more time and may result in higher dealer discounts and other selling expenses than does the sale of those that are liquid. Illiquid investments also may be more difficult to value due to the unavailability of reliable market quotations for such investments, and an investment in them may have an adverse impact on the Fund’s NAV. The Fund may also purchase certain restricted investments that can only be resold to certain qualified investors and may be determined to be liquid pursuant to policies and guidelines established by the Company's Board of Directors. The Fund, as shown on the Schedule of Investments, had illiquid or restricted investments as of October 31, 2014.
Investments Purchased on a When-Issued or Delayed-Delivery Basis – Delivery and payment for investments that have been purchased by the Fund on a forward commitment, or when-issued or delayed-delivery basis, take place beyond the customary settlement period. The Fund may dispose of or renegotiate a delayed-delivery transaction after it is entered into, and may sell delayed-delivery investments before they are delivered, which may result in a realized gain or loss. During this period, such investments are subject to market fluctuations, and the Fund identifies investments segregated in its records with a value at least equal to the amount of the commitment. The Fund, as shown on the Schedule of Investments, had when-issued or delayed-delivery investments as of October 31, 2014.
Financial Derivative Instruments:
The following disclosures contain information on how and why the Fund uses derivative instruments, the credit-risk-related contingent features in certain derivative instruments and how derivative instruments affect the Fund’s financial position and results of operations. The location and fair value amounts of these instruments on the Statement of Assets and Liabilities and the realized gains and losses and changes in unrealized gains and losses on the Statement of Operations, each categorized by type of derivative contract, are included in the following Additional Derivative Instrument Information footnote. The derivative instruments outstanding as of year-end are disclosed in the notes to the Schedule of Investments, if applicable. The amounts of realized gains and losses and changes in unrealized gains and losses on derivative instruments during the year are disclosed in the Statement of Operations.
Swap Contracts – The Fund may invest in swap contracts. Swap contracts are agreements to exchange or swap investment cash flows, assets, foreign currencies or market-linked returns at specified, future intervals. Swap contracts are either privately negotiated in the over-the-counter market (“OTC swaps”) or cleared in a central clearing house (“centrally cleared swaps”). The Fund may enter into credit default, total return, cross-currency, interest rate, inflation and other forms of swap contracts to manage its exposure to credit, currency, interest rate, commodity and inflation risk. Swap contracts are also used to gain exposure to certain markets. In connection with these contracts, investments or cash may be identified as collateral or margin in accordance with the terms of the respective swap contracts and/or master netting arrangement to provide assets of value and recourse in the event of default or bankruptcy/insolvency.
Swaps are valued based on custom valuations furnished by an independent pricing service. Swaps for which prices are not available from an independent pricing service are valued in accordance with procedures established by the Company's Board of Directors. Changes in market value, if any, are reflected as a component of net changes in unrealized appreciation or depreciation on the Statement of Operations. Daily changes in valuation of centrally cleared swaps, if any, are recorded as a receivable or payable for the change in value (“variation margin”) on the Statement of Assets and Liabilities. Realized gains or losses on centrally cleared swaps are recorded upon the termination of the swap. OTC swap payments received or paid at the beginning of the measurement period are reflected as such on the Statement of Assets and Liabilities and represent premiums paid or received upon entering into the swap contract to compensate for differences between the stated terms of the swap contract and prevailing market conditions (credit spreads, currency exchange rates, interest rates and other relevant factors). These upfront premiums are recorded as realized gains or losses on the Statement of Operations upon termination or maturity of the swap. A liquidation payment received or made at the
The Hartford Municipal Real Return Fund
Notes to Financial Statements – (continued)
October 31, 2014
(000’s Omitted)
termination or maturity of the swap is recorded as a realized gain or loss on the Statement of Operations. Net periodic payments received or paid by the Fund are included as part of realized gains or losses on the Statement of Operations.
Entering into these contracts involves, to varying degrees, elements of liquidation, counterparty, credit and market risk in excess of the amounts recognized on the Statement of Assets and Liabilities. Such risks involve the possibility that there will be no liquid market for these contracts, that the counterparty to the contracts may default on its obligation to perform or disagree as to the meaning of contractual terms in the contracts, and that there may be unfavorable changes in market conditions (credit spreads, currency exchange rates, interest rates and other relevant factors).
The Fund’s maximum risk of loss from counterparty risk for OTC swaps is the net value of the discounted cash flows to be received from the counterparty over the contract’s remaining life, and current market value, to the extent that amount is positive. The risk is mitigated by having a master netting arrangement between the Fund and the counterparty, which allows for the netting of payments made or received (although such amounts are presented on a gross basis within the Statement of Assets and Liabilities, as applicable) as well as the posting of collateral to the Fund to cover the Fund’s exposure to the counterparty. In a centrally cleared swap, while the Fund enters into an agreement with a clearing broker to execute contracts with a counterparty, the performance of the swap is guaranteed by the central clearinghouse, which reduces the Fund’s exposure to counterparty risk. The Fund is still exposed to the counterparty risk through the clearing broker and clearinghouse. The clearinghouse attempts to minimize this risk to its participants through the use of mandatory margin requirements, daily cash settlements and other procedures. Likewise, the clearing broker reduces its risk through margin requirements and required segregation of customer balances.
Total Return Swap Contracts – The Fund may invest in total return swap contracts. An investment in a total return swap allows the Fund to gain or mitigate exposure to underlying referenced securities, indices or commodities. Total return swap contracts involve commitments where cash flows are exchanged based on the price of underlying securities, indices or commodities and based on a fixed or variable rate. One party would receive payments based on the price appreciation or depreciation of a commodity index, a portion of the index, or a single commodity in exchange for paying to or receiving from the counterparty seller an agreed-upon rate, which can be fixed or variable. A variable rate may be correlated to a base rate, such as the LIBOR, and is adjusted each reset period, which are defined at the beginning of the contract. Therefore, if interest rates increase over the term of the swap contract, the party paying the rate may be required to pay a higher rate at each swap reset date.
Total return swap contracts on indices involve commitments to pay interest in exchange for a market-linked return. One party pays out the total return of a specific reference asset, which may be an equity, index, or bond, and in return receives a regular stream of payments. To the extent the total return of the security or index underlying the transaction exceeds or falls short of the offsetting interest rate obligation, the Fund will receive a payment from or make a payment to the counterparty. The Fund, as shown on the Schedule of Investments, had outstanding total return swap contracts as of October 31, 2014.
Additional Derivative Instrument Information:
Fair Value of Derivative Instruments on the Statement of Assets and Liabilities as of October 31, 2014:
| | | Risk Exposure Category | |
| | | Interest Rate
Contracts | | | Foreign
Exchange
Contracts | | | Credit
Contracts | | | Equity
Contracts | | | Commodity
Contracts | | | Other
Contracts | | | Total | |
| Assets: | | | | | | | | | | | | | | | | | | | | | | | | | | | | |
| Unrealized appreciation on OTC swap contracts | | $ | 8 | | | $ | — | | | $ | — | | | $ | — | | | $ | — | | | $ | — | | | $ | 8 | |
| Total | | $ | 8 | | | $ | — | | | $ | — | | | $ | — | | | $ | — | | | $ | — | | | $ | 8 | |
| | | | | | | | | | | | | | | | | | | | | | | | | | | | | |
| Liabilities: | | | | | | | | | | | | | | | | | | | | | | | | | | | | |
| Unrealized depreciation on OTC swap contracts | | $ | 6,505 | | | $ | — | | | $ | — | | | $ | — | | | $ | — | | | $ | — | | | $ | 6,505 | |
| Total | | $ | 6,505 | | | $ | — | | | $ | — | | | $ | — | | | $ | — | | | $ | — | | | $ | 6,505 | |
The volume of derivatives that is presented in the Schedule of Investments is consistent with the derivative activity during the year ended October 31, 2014.
The Hartford Municipal Real Return Fund
Notes to Financial Statements – (continued)
October 31, 2014
(000’s Omitted)
The Effect of Derivative Instruments on the Statement of Operations for the year ended October 31, 2014:
| | | Risk Exposure Category | |
| | | Interest Rate
Contracts | | | Foreign
Exchange
Contracts | | | Credit
Contracts | | | Equity
Contracts | | | Commodity
Contracts | | | Other
Contracts | | | Total | |
| Realized Loss on Derivatives Recognized as a Result of Operations: |
| Net realized loss on swap contracts | | $ | (1,384 | ) | | $ | — | | | $ | — | | | $ | — | | | $ | — | | | $ | — | | | $ | (1,384 | ) |
| Total | | $ | (1,384 | ) | | $ | — | | | $ | — | | | $ | — | | | $ | — | | | $ | — | | | $ | (1,384 | ) |
| | | | | | | | | | | | | | | | | | | | | | | | | | | | | |
| Net Change in Unrealized Appreciation (Depreciation) on Derivatives Recognized as a Result of Operations: |
| Net change in unrealized depreciation of swap contracts | | $ | (1,574 | ) | | $ | — | | | $ | — | | | $ | — | | | $ | — | | | $ | — | | | $ | (1,574) | |
| Total | | $ | (1,574 | ) | | $ | — | | | $ | — | | | $ | — | | | $ | — | | | $ | — | | | $ | (1,574 | ) |
Balance Sheet Offsetting Information - The following discloses both gross information and net information about instruments and transactions eligible for offset in the financial statements, and instruments and transactions that are subject to a master netting arrangement, as well as amounts related to margin, reflected as financial collateral (including cash collateral), held at clearing brokers, counterparties and the Fund’s custodian. The master netting arrangements allow the clearing brokers to net any collateral held in or on behalf of the Fund, or liabilities or payment obligations of the clearing brokers to the Fund, against any liabilities or payment obligations of the Fund to the clearing brokers. The Fund is required to deposit financial collateral (including cash collateral) at the Futures Commission Merchant's ("FCM") custodian on behalf of clearing brokers and counterparties to continually meet the original and maintenance requirements established by the clearing brokers and counterparties. Such requirements are specific to the respective clearing broker or counterparty. Certain master netting arrangements may not be enforceable in the bankruptcy proceedings of a counterparty.
Offsetting of Financial Assets and Derivative Assets as of October 31, 2014:
| | | Gross Amounts*
of Assets
Presented in
Statement of
Assets and
Liabilities | | | Financial
Instruments with
Allowable Netting | | | Non-cash
Collateral
Received | | | Cash Collateral
Received | | | Net Amount (not
less than $0) | |
| Description | | | | | | | | | | | | | | | | | | | | |
| OTC swap contracts at market value | | $ | 8 | | | $ | — | | | $ | — | | | $ | — | | | $ | 8 | |
| Total subject to a master netting or similar arrangement | | $ | 8 | | | $ | — | | | $ | — | | | $ | — | | | $ | 8 | |
* Gross amounts are presented here as there are no amounts that are netted within the Statement of Assets and Liabilities.
Offsetting of Financial Liabilities and Derivative Liabilities as of October 31, 2014:
| | | Gross Amounts*
of Liabilities
Presented in
Statement of
Assets and
Liabilities | | | Financial
Instruments with
Allowable Netting | | | Non-cash
Collateral
Pledged | | | Cash Collateral
Pledged | | | Net Amount (not
less than $0) | |
| Description | | | | | | | | | | | | | | | | | | | | |
| OTC swap contracts at market value | | $ | 6,505 | | | $ | — | | | $ | — | | | $ | (6,197 | )† | | $ | 308 | |
| Total subject to a master netting or similar arrangement | | $ | 6,505 | | | $ | — | | | $ | — | | | $ | (6,197 | ) | | $ | 308 | |
| * | Gross amounts are presented here as there are no amounts that are netted within the Statement of Assets and Liabilities. |
| † | An additional $149 of cash collateral was pledged to counterparties related to derivative liabilities. |
The Hartford Municipal Real Return Fund
Notes to Financial Statements – (continued)
October 31, 2014
(000’s Omitted)
Principal Risks:
Credit risk depends largely on the perceived financial health of bond issuers. In general, the credit rating is inversely related to the credit risk of the issuer. Higher rated bonds generally are deemed to have less credit risk, while lower or unrated bonds are deemed to have higher risk of default. The share price, yield and total return of a fund that holds securities with higher credit risk may be more volatile than those of a fund that holds bonds with lower credit risk. Similar to credit risk, the Fund may be exposed to counterparty risk, or the risk that an institution or other entity with which the Fund has unsettled or open transactions will default.
The Fund’s investments expose the Fund to various risks including, but not limited to, interest rate, prepayment and extension risks. Interest rate risk is the risk that fixed income securities will decline in value because of changes in interest rates. As nominal interest rates rise, the values of certain fixed income securities held by the Fund are likely to decrease. A nominal interest rate can be described as the sum of a real interest rate and an expected inflation rate. Fixed income securities with longer durations tend to be more sensitive to changes in interest rates, usually making them more volatile than securities with shorter durations. Duration is useful primarily as a measure of the sensitivity of a fixed income security’s market price to interest rate (i.e. yield) movements. Rising interest rates may cause prepayments to occur at a slower than expected rate, thereby effectively lengthening the maturity of the security and making the security more sensitive to interest rate changes.
Federal Income Taxes:
Federal Income Taxes – For federal income tax purposes, the Fund intends to continue to qualify as a Regulated Investment Company ("RIC") under Subchapter M of the Internal Revenue Code (“IRC”) by distributing substantially all of its taxable net investment income and net realized capital gains to its shareholders and otherwise complying with the requirements of the IRC. The Fund has distributed substantially all of its income and capital gains in prior years, if applicable, and intends to distribute substantially all of its income and capital gains during the calendar year ending December 31, 2014. Accordingly, no provision for federal income or excise taxes has been made in the accompanying financial statements. Distributions from short-term capital gains are treated as ordinary income distributions for federal income tax purposes.
Net Investment Income (Loss), Net Realized Gains (Losses) and Distributions – Net investment income (loss) and net realized gains (losses) may differ for financial statement and tax purposes primarily because of losses deferred due to wash sale adjustments, foreign currency gains and losses, adjustments related to Passive Foreign Investment Companies ("PFICs"), Real Estate Investment Trusts ("REITs"), RICs, certain derivatives and partnerships. The character of distributions made during the year from net investment income or net realized gains may differ from their ultimate characterization for federal income tax purposes. Also, due to the timing of dividend distributions, the fiscal year in which amounts are distributed may differ from the year that the income or realized gains (losses) were recorded by the Fund.
The Hartford Municipal Real Return Fund
Notes to Financial Statements – (continued)
October 31, 2014
(000’s Omitted)
Distributions and Components of Distributable Earnings – The tax character of distributions paid by the Fund for the periods indicated is as follows (as adjusted for dividends payable, if applicable):
| | | For the Year Ended
October 31, 2014 | | | For the Year Ended
October 31, 2013 | |
| Tax Exempt Income | | $ | 5,041 | | | $ | 5,666 | |
| Ordinary Income | | | 3 | | | | — | |
As of October 31, 2014, the Fund’s components of distributable earnings (deficit) on a tax basis are as follows:
| | | Amount | |
| Undistributed Ordinary Income | | $ | 112 | |
| Accumulated Capital Losses* | | | (43,954 | ) |
| Unrealized Appreciation† | | | 3,446 | |
| Total Accumulated Deficit | | $ | (40,396 | ) |
| * | The Fund has capital loss carryforwards that are identified in the Capital Loss Carryforward note that follows. |
| † | Differences between book-basis and tax-basis unrealized appreciation (depreciation) may be attributable to the losses deferred due to wash sale adjustments, foreign currency gains and losses, adjustments related to PFICs, REITs, RICs, certain derivatives and partnerships. |
Reclassification of Capital Accounts – The Fund may record reclassifications in its capital accounts. These reclassifications have no impact on the total net assets of the Fund. The reclassifications are a result of permanent differences between U.S. GAAP and tax accounting for such items as foreign currency, PFICs, expiration or utilization of capital loss carryforwards or net operating losses. Adjustments are made to reflect the impact these items have on current and future distributions to shareholders. Therefore, the source of the Fund’s distributions may be shown in the accompanying Statement of Changes in Net Assets as from undistributed net investment income, from accumulated net realized gains on investments or from capital depending on the type of book and tax differences that exist. For the year ended October 31, 2014, the Fund had no reclassifications.
Capital Loss Carryforward – On December 22, 2010, the Regulated Investment Company Modernization Act of 2010 (the “Act”) was enacted, which made changes to the capital loss carryforward rules. The changes are effective for taxable years beginning after the date of enactment. Under the Act, funds are permitted to carry forward capital losses for an unlimited period. However, any losses incurred during those future taxable years will be required to be utilized prior to the losses incurred in pre-enactment taxable years, which carry an expiration date. As a result of this ordering rule, pre-enactment capital loss carryforwards may be more likely to expire unused. Additionally, post-enactment capital loss carryforwards retain their character as either short-term or long-term capital losses rather than being considered all short-term as permitted under prior regulation.
At October 31, 2014 (tax year end), the Fund had capital loss carryforwards for U.S. federal income tax purposes as follows:
| | | Amount | |
| Long-Term Capital Loss Carryforward | | $ | 735 | |
| Total | | $ | 735 | |
During the year ended October 31, 2014, the Fund utilized $150 of prior year short term capital loss carryforwards.
The Hartford Municipal Real Return Fund
Notes to Financial Statements – (continued)
October 31, 2014
(000’s Omitted)
Capital loss carryforwards with expiration:
| Year of Expiration | | Amount | |
| 2016 | | $ | 18,856 | |
| 2017 | | | 16,621 | |
| 2018 | | | 6,088 | |
| 2019 | | | 1,654 | |
| Total | | $ | 43,219 | |
As a result of prior year mergers in the Fund, certain provisions in the IRC may limit future utilization of capital losses.
Accounting for Uncertainty in Income Taxes – The Fund has adopted financial reporting rules that require the Fund to analyze all open tax years, as defined by the statute of limitations, for all major jurisdictions. Generally, tax authorities can examine all tax returns filed for the last three years. The Fund does not have an examination in progress.
The Fund has reviewed all open tax years and major jurisdictions and concluded that these financial reporting rules had no effect on the Fund’s financial position or results of operations. There is no tax liability resulting from unrecognized tax benefits relating to uncertain income tax positions taken or expected to be taken on the tax return for the fiscal year ended October 31, 2014. The Fund is also not aware of any tax positions for which it is reasonably possible that the total amounts of unrecognized tax benefits will significantly change in the next twelve months.
Expenses:
Investment Management Agreement – Hartford Funds Management Company, LLC ("HFMC") serves as the Fund’s investment manager pursuant to an Investment Management Agreement with the Company. HFMC is an indirect wholly owned subsidiary of The Hartford Financial Services Group, Inc. ("The Hartford"). The investment manager has overall investment supervisory responsibility for the Fund. In addition, the investment manager provides administrative personnel, services, equipment, facilities and office space for proper operation of the Fund. HFMC has contracted with Wellington Management Company, LLP ("Wellington Management") under a sub-advisory agreement for the provision of day-to-day investment management services to the Fund in accordance with the Fund’s investment objective and policies. The Fund pays a fee to the investment manager, a portion of which may be used to compensate Wellington Management.
The schedule below reflects the rates of compensation paid to the investment manager for investment management services rendered as of October 31, 2014; the rates are accrued daily and paid monthly:
| Average Daily Net Assets | | Annual Fee | |
| On first $500 million | | | 0.50% | |
| On next $500 million | | | 0.45% | |
| On next $1.5 billion | | | 0.44% | |
| On next $2.5 billion | | | 0.43% | |
| On next $5 billion | | | 0.42% | |
| Over $10 billion | | | 0.41% | |
The Hartford Municipal Real Return Fund
Notes to Financial Statements – (continued)
October 31, 2014
(000’s Omitted)
Accounting Services Agreement – Pursuant to the Fund Accounting Agreement between HFMC and the Company, on behalf of the Fund, HFMC provides accounting services to the Fund and receives monthly compensation based on the Fund’s average daily net assets at the rates set forth below. The Fund’s accounting services fees are accrued daily and paid monthly.
| Average Daily Net Assets | | Annual Fee | |
| On first $5 billion | | | 0.016% | |
| On next $5 billion | | | 0.013% | |
| Over $10 billion | | | 0.010% | |
Operating Expenses – Allocable expenses incurred by the Company are allocated to each Fund and allocated to classes within the Fund in proportion to the average daily net assets of the Fund and each class, except where allocation of certain expenses is more fairly made directly to the Fund or to specific classes within a Fund. As of October 31, 2014, HFMC contractually limited the total operating expenses of this Fund, exclusive of taxes, interest expense, brokerage commissions, acquired fund fees and expenses and extraordinary expenses, through February 28, 2015 as follows:
| Class A | | | Class B | | | Class C | | | Class I | | | Class Y | |
| | 0.85% | | | | 1.60% | | | | 1.60% | | | | 0.60% | | | | 0.60% | |
Distribution and Service Plan for Class A, B and C Shares – Hartford Funds Distributors, LLC ("HFD"), an indirect wholly owned subsidiary of The Hartford, is the principal underwriter and distributor of the Fund. HFD is engaged in distribution activities, which include marketing and distribution of shares through broker/dealers, financing distribution costs and maintaining financial books and records. For the year ended October 31, 2014, HFD received front-end load sales charges of $236 and contingent deferred sales charges of $29 from the Fund.
The Fund has adopted a Distribution and Service Plan in accordance with Rule 12b-1 of the 1940 Act to compensate the distributor (HFD) for activities intended to result in the sale and distribution of Class A, B and C shares and for providing services for shareholders. The Rule 12b-1 plan applicable to Class A shares of the Fund provides for payment of a Rule 12b-1 fee of 0.25% of average daily net assets. Some or all of the fee may be used for shareholder servicing expenses with the remainder used for distribution expenses. Under the Class B Plan, the Fund pays the distributor 1.00% of the average daily net assets of Class B shares that are outstanding for 8 years or less, 0.25% of which is a fee for services provided to existing shareholders with the remainder used for distribution expenses. Some or the entire Rule 12b-1 fee for Class B shares may be remitted to broker/dealers for distribution and/or shareholder account services. After eight years, Class B shares convert to Class A shares. Upon conversion to Class A shares, the Class A plan described above will apply to those shares. Under the Class C Plan, the Fund pays the distributor 1.00% of the average daily net assets of Class C shares outstanding, 0.25% of which is intended as a fee for services provided to existing shareholders with the remainder used for distribution expenses. For Class C shares, some or the entire fee may be remitted to broker/dealers for distribution and/or shareholder account services. The Fund’s 12b-1 fees are accrued daily and paid monthly or at such other intervals as the Board of Directors may determine.
Other Related Party Transactions – Certain officers of the Fund are directors and/or officers of HFMC and/or The Hartford or its subsidiaries. For the year ended October 31, 2014, a portion of the Fund’s Chief Compliance Officer’s compensation was paid by all of the investment companies in the Hartford fund complex. The portion allocated to the Fund, as represented in other expenses on the Statement of Operations, rounds to zero. Hartford Administrative Services Company (“HASCO”), an indirect wholly-owned subsidiary of The Hartford, provides transfer agent services to the Fund. HASCO has contractually agreed to reimburse any portion of the transfer agency fees over 0.30% of average daily net assets per fiscal year for each class. Any transfer agency fee reimbursement is determined before considering the contractual operating expense limitation. For providing such services, HASCO is compensated on a per account basis that varies by account type, except with respect to Class Y, for which it is compensated based on average daily net assets. The amount paid to HASCO and any related contractual reimbursement amounts, if applicable, can be found in the Statement of Operations. These fees are accrued daily and paid monthly.
The Hartford Municipal Real Return Fund
Notes to Financial Statements – (continued)
October 31, 2014
(000’s Omitted)
Investment Transactions:
For the year ended October 31, 2014, the cost of purchases and proceeds from sales of investment securities (excluding short-term investments) were as follows:
| | | Excluding U.S.
Government
Obligations | | | U.S.
Government
Obligations | | | Total | |
| Cost of Purchases | | $ | 53,888 | | | $ | — | | | $ | 53,888 | |
| Sales Proceeds | | | 73,460 | | | | — | | | | 73,460 | |
Capital Share Transactions:
The following information is for the year ended October 31, 2014, and the year ended October 31, 2013:
| | | For the Year Ended October 31, 2014 | | | For the Year Ended October 31, 2013 | |
| | | Shares Sold | | | Shares Issued
for Reinvested
Dividends | | | Shares
Redeemed | | | Net Increase
(Decrease) of
Shares | | | Shares Sold | | | Shares Issued
for Reinvested
Dividends | | | Shares
Redeemed | | | Net Increase
(Decrease) of
Shares | |
| Class A | | | | | | | | | | | | | | | | | | | | | | | | | | | | | | | | |
| Shares | | | 2,433 | | | | 317 | | | | (3,921 | ) | | | (1,171 | ) | | | 3,371 | | | | 350 | | | | (6,576 | ) | | | (2,855 | ) |
| Amount | | $ | 22,982 | | | $ | 2,989 | | | $ | (36,603 | ) | | $ | (10,632 | ) | | $ | 32,333 | | | $ | 3,329 | | | $ | (62,369 | ) | | $ | (26,707 | ) |
| Class B | | | | | | | | | | | | | | | | | | | | | | | | | | | | | | | | |
| Shares | | | — | | | | 4 | | | | (84 | ) | | | (80 | ) | | | 2 | | | | 5 | | | | (131 | ) | | | (124 | ) |
| Amount | | $ | 4 | | | $ | 39 | | | $ | (787 | ) | | $ | (744 | ) | | $ | 17 | | | $ | 46 | | | $ | (1,232 | ) | | $ | (1,169 | ) |
| Class C | | | | | | | | | | | | | | | | | | | | | | | | | | | | | | | | |
| Shares | | | 336 | | | | 56 | | | | (1,143 | ) | | | (751 | ) | | | 708 | | | | 62 | | | | (1,774 | ) | | | (1,004 | ) |
| Amount | | $ | 3,143 | | | $ | 528 | | | $ | (10,642 | ) | | $ | (6,971 | ) | | $ | 6,811 | | | $ | 593 | | | $ | (16,719 | ) | | $ | (9,315 | ) |
| Class I | | | | | | | | | | | | | | | | | | | | | | | | | | | | | | | | |
| Shares | | | 1,465 | | | | 36 | | | | (1,125 | ) | | | 376 | | | | 1,253 | | | | 43 | | | | (1,978 | ) | | | (682 | ) |
| Amount | | $ | 13,968 | | | $ | 340 | | | $ | (10,596 | ) | | $ | 3,712 | | | $ | 12,143 | | | $ | 410 | | | $ | (18,867 | ) | | $ | (6,314 | ) |
| Class Y | | | | | | | | | | | | | | | | | | | | | | | | | | | | | | | | |
| Shares | | | 4 | | | | 60 | | | | (273 | ) | | | (209 | ) | | | 7 | | | | 59 | | | | (486 | ) | | | (420 | ) |
| Amount | | $ | 36 | | | $ | 566 | | | $ | (2,555 | ) | | $ | (1,953 | ) | | $ | 68 | | | $ | 562 | | | $ | (4,602 | ) | | $ | (3,972 | ) |
| Total | | | | | | | | | | | | | | | | | | | | | | | | | | | | | | | | |
| Shares | | | 4,238 | | | | 473 | | | | (6,546 | ) | | | (1,835 | ) | | | 5,341 | | | | 519 | | | | (10,945 | ) | | | (5,085 | ) |
| Amount | | $ | 40,133 | | | $ | 4,462 | | | $ | (61,183 | ) | | $ | (16,588 | ) | | $ | 51,372 | | | $ | 4,940 | | | $ | (103,789 | ) | | $ | (47,477 | ) |
The following reflects the conversion of Class B shares into Class A shares (reflected as Class A shares sold) for the year ended October 31, 2014, and the year ended October 31, 2013:
| | | Shares | | | Dollars | |
| For the Year Ended October 31, 2014 | | | 6 | | | $ | 59 | |
| For the Year Ended October 31, 2013 | | | 11 | | | $ | 104 | |
Line of Credit:
The Fund is one of several Hartford Funds that participate in a $500 million committed revolving line of credit facility. The facility is to be used for temporary or emergency purposes. Under the arrangement, the funds are required to own securities having a market value in excess of 300% of the total bank borrowings. The interest rate on borrowings varies depending on the nature of the loan. The facility also requires a fee to be paid based on the amount of the commitment. This commitment fee is allocated to all the funds participating in the line of credit based on the average net assets of the funds. During the year ended October 31, 2014, the Fund did not have any borrowings under this facility.
The Hartford Municipal Real Return Fund
Notes to Financial Statements – (continued)
October 31, 2014
(000’s Omitted)
Pending Legal Proceedings:
On February 25, 2011, Jennifer L. Kasilag, Louis Mellinger, Judith M. Menendez, Jacqueline M. Robinson, and Linda A. Russell filed a derivative lawsuit against Hartford Investment Financial Services, LLC (“HIFSCO”) (now known as HFD) on behalf of six Hartford retail mutual funds in the United States District Court for the District of New Jersey, alleging that HIFSCO received excessive advisory and distribution fees in violation of its statutory fiduciary duty under Section 36(b) of the 1940 Act when serving as investment manager and principal underwriter, respectively, to the Hartford retail mutual funds. Although this action was purportedly filed on behalf of certain of the Hartford Funds, none of the Hartford Funds is itself a defendant to the suit. HIFSCO moved to dismiss and, in September 2011, the motion was granted in part and denied in part, with leave to amend the complaint. In November 2011, plaintiffs filed an amended complaint on behalf of certain Hartford retail mutual funds, The Hartford Global Health Fund (now known as The Hartford Healthcare Fund), The Hartford Conservative Allocation Fund, The Hartford Growth Opportunities Fund, The Hartford Inflation Plus Fund, The Hartford Advisers Fund (now known as The Hartford Balanced Fund), and The Hartford Capital Appreciation Fund. Plaintiffs seek to rescind the investment management agreements and distribution plans between HIFSCO and these funds and to recover the total fees charged thereunder or, in the alternative, to recover any improper compensation HIFSCO received, in addition to lost earnings. HIFSCO filed a partial motion to dismiss the amended complaint and, in December 2012, the court dismissed without prejudice the claims regarding distribution fees and denied the motion with respect to the advisory fees claims. HIFSCO disputes the allegations and intends to defend vigorously.
In March 2014, the plaintiffs filed a new complaint that added as new plaintiffs The Hartford Floating Rate Fund and The Hartford Small Company Fund and named as a defendant HFMC, which assumed the role as investment manager to the funds as of January 2013. HFMC and HIFSCO dispute the allegations and intend to defend vigorously.
No accrual for litigation relating to this matter has been recorded in the financial statements of the Fund because the Fund is not party to the suit.
Indemnifications:
Under the Company's organizational documents, the Company shall indemnify its officers and directors to the full extent required or permitted under Maryland General Corporation Law and the federal securities laws. In addition, the Company, on behalf of the Fund, may enter into contracts that contain a variety of indemnifications. The Company's maximum exposure under these arrangements is unknown. However, as of the date of these financial statements, the Company has not had prior claims or losses pursuant to these contracts and expects the risk of loss to be remote.
Subsequent Event:
Effective December 1, 2014, pursuant to a sub-transfer agency agreement between HASCO and Boston Financial Data Services, Inc. (“BFDS”), HASCO has delegated certain transfer agent, dividend disbursing agent and shareholder servicing agent functions to BFDS. The costs and expenses of such delegation are borne by HASCO, not by the Fund.
The Hartford Municipal Real Return Fund
Financial Highlights
| | | - Selected Per-Share Data - (A) | | | - Ratios and Supplemental Data - | |
| Class | | Net Asset
Value at
Beginning
of Period | | | Net
Investment
Income
(Loss) | | | Net
Realized
and
Unrealized
Gain
(Loss) on
Invest-
ments | | | Total from
Investment
Operations | | | Dividends
from Net
Investment
Income | | | Distribu-
tions from
Realized
Capital
Gains | | | Total
Dividends
and
Distributions | | | Net Asset
Value at
End of
Period | | | Total
Return(B) | | | Net Assets
at End of
Period
(000's) | | | Ratio of
Expenses
to
Average
Net
Assets
Before
Adjust-
ments(C) | | | Ratio of
Expenses
to
Average
Net
Assets
After
Adjust-
ments(C) | | | Ratio of
Net
Investment
Income
(Loss) to
Average
Net Assets | |
| For the Year Ended October 31, 2014 |
| A | | $ | 9.27 | | | $ | 0.27 | | | $ | 0.23 | | | $ | 0.50 | | | $ | (0.27 | ) | | $ | – | | | $ | (0.27 | ) | | $ | 9.50 | | | | 5.46 | % | | $ | 115,957 | | | | 0.90 | % | | | 0.85 | % | | | 2.89 | % |
| B | | | 9.19 | | | | 0.20 | | | | 0.22 | | | | 0.42 | | | | (0.20 | ) | | | – | | | | (0.20 | ) | | | 9.41 | | | | 4.62 | | | | 1,497 | | | | 1.73 | | | | 1.60 | | | | 2.15 | |
| C | | | 9.22 | | | | 0.20 | | | | 0.23 | | | | 0.43 | | | | (0.20 | ) | | | – | | | | (0.20 | ) | | | 9.45 | | | | 4.71 | | | | 32,022 | | | | 1.64 | | | | 1.60 | | | | 2.14 | |
| I | | | 9.29 | | | | 0.29 | | | | 0.25 | | | | 0.54 | | | | (0.30 | ) | | | – | | | | (0.30 | ) | | | 9.53 | | | | 5.82 | | | | 16,682 | | | | 0.66 | | | | 0.60 | | | | 3.12 | |
| Y | | | 9.25 | | | | 0.29 | | | | 0.23 | | | | 0.52 | | | | (0.29 | ) | | | – | | | | (0.29 | ) | | | 9.48 | | | | 5.74 | | | | 20,941 | | | | 0.60 | | | | 0.60 | | | | 3.14 | |
| | | | | | | | | | | | | | | | | | | | | | | | | | | | | | | | | | | | | | | | | | | | | | | | | | | | | |
| For the Year Ended October 31, 2013 |
| A | | $ | 9.73 | | | $ | 0.24 | | | $ | (0.46 | ) | | $ | (0.22 | ) | | $ | (0.24 | ) | | $ | – | | | $ | (0.24 | ) | | $ | 9.27 | | | | (2.30 | )% | | $ | 124,008 | | | | 0.88 | % | | | 0.85 | % | | | 2.51 | % |
| B | | | 9.65 | | | | 0.17 | | | | (0.46 | ) | | | (0.29 | ) | | | (0.17 | ) | | | – | | | | (0.17 | ) | | | 9.19 | | | | (3.05 | ) | | | 2,194 | | | | 1.71 | | | | 1.60 | | | | 1.76 | |
| C | | | 9.68 | | | | 0.17 | | | | (0.46 | ) | | | (0.29 | ) | | | (0.17 | ) | | | – | | | | (0.17 | ) | | | 9.22 | | | | (3.05 | ) | | | 38,185 | | | | 1.62 | | | | 1.60 | | | | 1.76 | |
| I | | | 9.75 | | | | 0.26 | | | | (0.46 | ) | | | (0.20 | ) | | | (0.26 | ) | | | – | | | | (0.26 | ) | | | 9.29 | | | | (2.05 | ) | | | 12,776 | | | | 0.64 | | | | 0.60 | | | | 2.75 | |
| Y | | | 9.70 | | | | 0.26 | | | | (0.44 | ) | | | (0.18 | ) | | | (0.27 | ) | | | – | | | | (0.27 | ) | | | 9.25 | | | | (1.94 | ) | | | 22,365 | | | | 0.58 | | | | 0.58 | | | | 2.78 | |
| | | | | | | | | | | | | | | | | | | | | | | | | | | | | | | | | | | | | | | | | | | | | | | | | | | | | |
| For the Year Ended October 31, 2012 |
| A | | $ | 9.20 | | | $ | 0.27 | | | $ | 0.54 | | | $ | 0.81 | | | $ | (0.28 | ) | | $ | – | | | $ | (0.28 | ) | | $ | 9.73 | | | | 8.87 | % | | $ | 157,918 | | | | 0.87 | % | | | 0.85 | % | | | 2.89 | % |
| B | | | 9.13 | | | | 0.21 | | | | 0.52 | | | | 0.73 | | | | (0.21 | ) | | | – | | | | (0.21 | ) | | | 9.65 | | | | 8.03 | | | | 3,497 | | | | 1.68 | | | | 1.60 | | | | 2.18 | |
| C | | | 9.15 | | | | 0.20 | | | | 0.54 | | | | 0.74 | | | | (0.21 | ) | | | – | | | | (0.21 | ) | | | 9.68 | | | | 8.11 | | | | 49,791 | | | | 1.62 | | | | 1.60 | | | | 2.13 | |
| I | | | 9.22 | | | | 0.29 | | | | 0.54 | | | | 0.83 | | | | (0.30 | ) | | | – | | | | (0.30 | ) | | | 9.75 | | | | 9.12 | | | | 20,061 | | | | 0.64 | | | | 0.60 | | | | 3.07 | |
| Y | | | 9.18 | | | | 0.30 | | | | 0.52 | | | | 0.82 | | | | (0.30 | ) | | | – | | | | (0.30 | ) | | | 9.70 | | | | 9.08 | | | | 27,549 | | | | 0.58 | | | | 0.58 | | | | 3.18 | |
| | | | | | | | | | | | | | | | | | | | | | | | | | | | | | | | | | | | | | | | | | | | | | | | | | | | | |
| For the Year Ended October 31, 2011 (D) |
| A(E) | | $ | 9.50 | | | $ | 0.41 | | | $ | (0.30 | ) | | $ | 0.11 | | | $ | (0.41 | ) | | $ | – | | | $ | (0.41 | ) | | $ | 9.20 | | | | 1.28 | % | | $ | 137,766 | | | | 0.90 | % | | | 0.85 | % | | | 4.52 | % |
| B | | | 9.43 | | | | 0.34 | | | | (0.30 | ) | | | 0.04 | | | | (0.34 | ) | | | – | | | | (0.34 | ) | | | 9.13 | | | | 0.54 | | | | 4,565 | | | | 1.70 | | | | 1.60 | | | | 3.75 | |
| C | | | 9.46 | | | | 0.34 | | | | (0.31 | ) | | | 0.03 | | | | (0.34 | ) | | | – | | | | (0.34 | ) | | | 9.15 | | | | 0.43 | | | | 43,214 | | | | 1.64 | | | | 1.60 | | | | 3.72 | |
| I | | | 9.52 | | | | 0.43 | | | | (0.30 | ) | | | 0.13 | | | | (0.43 | ) | | | – | | | | (0.43 | ) | | | 9.22 | | | | 1.53 | | | | 10,671 | | | | 0.64 | | | | 0.60 | | | | 4.71 | |
| Y | | | 9.48 | | | | 0.43 | | | | (0.30 | ) | | | 0.13 | | | | (0.43 | ) | | | – | | | | (0.43 | ) | | | 9.18 | | | | 1.54 | | | | 29,686 | | | | 0.60 | | | | 0.60 | | | | 4.73 | |
| | | | | | | | | | | | | | | | | | | | | | | | | | | | | | | | | | | | | | | | | | | | | | | | | | | | | |
| For the Year Ended October 31, 2010 (D) |
| A | | $ | 9.11 | | | $ | 0.43 | | | $ | 0.40 | | | $ | 0.83 | | | $ | (0.44 | ) | | $ | – | | | $ | (0.44 | ) | | $ | 9.50 | | | | 9.26 | % | | $ | 156,092 | | | | 0.86 | % | | | 0.85 | % | | | 4.69 | % |
| B | | | 9.04 | | | | 0.36 | | | | 0.40 | | | | 0.76 | | | | (0.37 | ) | | | – | | | | (0.37 | ) | | | 9.43 | | | | 8.53 | | | | 7,376 | | | | 1.67 | | | | 1.60 | | | | 3.94 | |
| C | | | 9.07 | | | | 0.36 | | | | 0.40 | | | | 0.76 | | | | (0.37 | ) | | | – | | | | (0.37 | ) | | | 9.46 | | | | 8.50 | | | | 47,918 | | | | 1.62 | | | | 1.60 | | | | 3.94 | |
| I | | | 9.13 | | | | 0.46 | | | | 0.39 | | | | 0.85 | | | | (0.46 | ) | | | – | | | | (0.46 | ) | | | 9.52 | | | | 9.52 | | | | 8,343 | | | | 0.62 | | | | 0.60 | | | | 4.93 | |
| Y | | | 9.09 | | | | 0.46 | | | | 0.39 | | | | 0.85 | | | | (0.46 | ) | | | – | | | | (0.46 | ) | | | 9.48 | | | | 9.59 | | | | 33,050 | | | | 0.57 | | | | 0.57 | | | | 4.97 | |
See Portfolio Turnover information on the next page.
The Hartford Municipal Real Return Fund
Financial Highlights – (continued)
| (A) | Information presented relates to a share outstanding throughout the indicated period. Net investment income (loss) per share amounts are calculated based on average shares outstanding unless otherwise noted. |
| (B) | Assumes initial investment at net asset value at the beginning of each period, reinvestment of all distributions, the complete redemption of the investment at net asset value at the end of each period and no sales charge. Total return would be reduced if sales charges were taken into account. |
| (C) | Adjustments include waivers and reimbursements, if applicable. |
| (D) | Net investment income (loss) per share amounts have been calculated using the SEC method. |
| (E) | Class L was merged into Class A on August 5, 2011. |
| | | Portfolio Turnover
Rate for
All Share Classes | |
| For the Year Ended October 31, 2014 | | | 31% |
| For the Year Ended October 31, 2013 | | | 20 | |
| For the Year Ended October 31, 2012 | | | 61 | |
| For the Year Ended October 31, 2011 | | | 29 | |
| For the Year Ended October 31, 2010 | | | 19 | |
Report of Independent Registered Public Accounting Firm
The Board of Directors and Shareholders of
The Hartford Mutual Funds II, Inc.
We have audited the accompanying statement of assets and liabilities, including the schedule of investments, of The Hartford Municipal Real Return Fund (one of the portfolios constituting The Hartford Mutual Funds II, Inc. (the Funds)) as of October 31, 2014, and the related statement of operations for the year then ended, the statements of changes in net assets for each of the two years in the period then ended, and the financial highlights for each of the five years in the period then ended. These financial statements and financial highlights are the responsibility of the Funds’ management. Our responsibility is to express an opinion on these financial statements and financial highlights based on our audits.
We conducted our audits in accordance with the standards of the Public Company Accounting Oversight Board (United States). Those standards require that we plan and perform the audit to obtain reasonable assurance about whether the financial statements and financial highlights are free of material misstatement. We were not engaged to perform an audit of the Funds’ internal control over financial reporting. Our audits included consideration of internal control over financial reporting as a basis for designing audit procedures that are appropriate in the circumstances, but not for the purpose of expressing an opinion on the effectiveness of the Funds’ internal control over financial reporting. Accordingly, we express no such opinion. An audit also includes examining, on a test basis, evidence supporting the amounts and disclosures in the financial statements and financial highlights, assessing the accounting principles used and significant estimates made by management, and evaluating the overall financial statement presentation. Our procedures included confirmation of securities owned as of October 31, 2014, by correspondence with the custodian and brokers or by other appropriate auditing procedures where replies from brokers were not received. We believe that our audits provide a reasonable basis for our opinion.
In our opinion, the financial statements and financial highlights referred to above present fairly, in all material respects, the financial position of The Hartford Municipal Real Return Fund of The Hartford Mutual Funds II, Inc. at October 31, 2014, the results of its operations for the year then ended, the changes in its net assets for each of the two years in the period then ended, and the financial highlights for each of the five years in the period then ended, in conformity with U.S. generally accepted accounting principles.
Minneapolis, Minnesota
December 18, 2014
The Hartford Municipal Real Return Fund
Federal Tax Information (Unaudited)
The Board of Directors of the Company (the "Directors") appoints officers who are responsible for the day-to-day operations of the Fund and who execute policies formulated by the Directors. Each Director serves until his or her death, resignation, or retirement or until the next annual meeting of shareholders is held or until his or her successor is elected and qualifies.
Directors and officers who are employed by or who have a financial interest in The Hartford Financial Services Group, Inc. ("The Hartford") are considered “interested” persons of the Fund pursuant to the 1940 Act. Each officer and two of the Company's Directors, as noted in the chart below, are “interested” persons of the Fund. Each Director serves as a director for The Hartford Mutual Funds, Inc., The Hartford Mutual Funds II, Inc., Hartford Series Fund, Inc., and Hartford HLS Series Fund II, Inc., and as a trustee for The Hartford Alternative Strategies Fund, which, as of October 31, 2014, collectively consist of 66 funds. Correspondence may be sent to Directors and officers c/o Hartford Funds, 5 Radnor Corporate Center, Suite 300, 100 Matsonford Road, Radnor, Pennsylvania 19087, except that correspondence to Mr. Annoni, Mr. Dressen and Ms. Quade may be sent to 500 Bielenberg Drive, Suite 500, Woodbury, Minnesota 55125.
The table below sets forth, for each Director and officer, his or her name, year of birth, current position with the Company and date first elected or appointed to The Hartford Mutual Funds, Inc. ("MF") and The Hartford Mutual Funds II, Inc. ("MF2"), principal occupation, and, for Directors, other directorships held. The Fund’s Statement of Additional Information contains further information on the Directors and is available free of charge by calling 1-888-843-7824 or writing to: Hartford Funds, P.O. Box 55022, Boston, MA 02205-5022.
Information on the aggregate remuneration paid to the directors of the Company can be found in the Statement of Operations herein. The Fund pays to The Hartford a portion of the Chief Compliance Officer’s compensation, but does not pay salaries or compensation to any of its other officers or Directors who are employed by The Hartford.
Non-Interested Directors
Hilary E. Ackermann (1956) Director since September 23, 2014
Ms. Ackermann served as Chief Risk Officer at Goldman Sachs Bank USA from October 2008 to November 2011 and serves as a Director of Dynegy, Inc., an independent power company, from October 2012 to present.
Lynn S. Birdsong (1946) Director since 2003, Chairman of the Investment Committee since 2014
Mr. Birdsong is a private investor. Mr. Birdsong currently serves as a Director of the Sovereign High Yield Investment Company (April 2010 to current). Mr. Birdsong currently serves as an Independent Director of Nomura Partners Funds, Inc. (formerly, The Japan Fund) (April 2003 to current). From 2003 to March 2005, Mr. Birdsong was an Independent Director of the Atlantic Whitehall Funds. From 1979 to 2002, Mr. Birdsong was a Managing Director of Zurich Scudder Investments, an investment management firm. During his employment with Scudder, Mr. Birdsong was an Interested Director of The Japan Fund. From January 1981 through December 2013, Mr. Birdsong was a partner in Birdsong Company, an advertising specialty firm.
Robert M. Gavin, Jr. (1940) Director since 2002 (MF) and 1986 (MF2), Chairman of the Board for each since 2004
Dr. Gavin is an educational consultant. Prior to September 1, 2001, he was President of Cranbrook Education Community and prior to July 1996, he was President of Macalester College, St. Paul, Minnesota.
Duane E. Hill (1945) Director since 2001 (MF) and 2002 (MF2), Chairman of the Nominating Committee since 2003
Mr. Hill is a Partner of TSG Ventures L.P., a private equity investment company. Mr. Hill is a former partner of TSG Capital Group, a private equity investment firm that served as sponsor and lead investor in leveraged buyouts of middle market companies.
Sandra S. Jaffee (1941) Director since 2005
Ms. Jaffee is the founder and Chief Executive Officer of a private company, Homeworks Concierge, LLC, which provides residential property management services in Westchester County, New York (January 2012 to present). Ms. Jaffee served as Chairman (2008 to 2009) and Chief Executive Officer of Fortent (formerly Searchspace Group), a leading provider of compliance/regulatory technology to financial institutions from August 2005 to August 2009. From August 2004 to August 2005, Ms. Jaffee served as an Entrepreneur in Residence with Warburg Pincus, a private equity firm. Prior to joining Warburg Pincus, Ms. Jaffee served as Executive Vice President at Citigroup, from September 1995 to July 2004, where she was President and Chief Executive Officer of Citibank’s Global Securities Services (1995 to 2003). Ms. Jaffee currently serves as a member of the Board of Directors of Broadridge Financial Solutions as well as a Trustee of Muhlenberg College.
The Hartford Municipal Real Return Fund
Directors and Officers (Unaudited) – (continued)
William P. Johnston (1944) Director since 2005, Chairman of the Compliance Committee since 2005
In June 2006, Mr. Johnston was appointed as Senior Advisor to The Carlyle Group, a global private equity and other alternative asset investment firm and currently serves as an Operating Executive. In July 2006, Mr. Johnston was elected to the Board of Directors of MultiPlan, Inc. and served as a Director (July 2006 to August 2010). In August 2007, Mr. Johnston was elected to the Board of Directors of LifeCare Holdings, Inc. and served as a Director (August 2007 to June 2013). In February 2008, Mr. Johnston was elected to the Board of Directors of HCR-ManorCare, Inc. In May 2006, Mr. Johnston was elected to the Supervisory Board of Fresenius Medical Care AG & Co. KGaA, after its acquisition of Renal Care Group, Inc. in March 2006. Mr. Johnston joined Renal Care Group in November 2002 as a member of the Board of Directors and served as Chairman of the Board from March 2003 through March 2006. From 2002 through 2013, Mr. Johnston served as a Board member of the Georgia O’Keefe Museum. From September 1987 to December 2002, Mr. Johnston was with Equitable Securities Corporation (and its successors, SunTrust Equitable Securities and SunTrust Robinson Humphrey) serving in various investment banking and managerial positions, including Managing Director and Head of Investment Banking, Chief Executive Officer and Vice Chairman.
Phillip O. Peterson (1944) Director since 2002 (MF) and 2000 (MF2), Chairman of the Audit Committee since 2002
Mr. Peterson is a mutual fund industry consultant. He was a partner of KPMG LLP (an accounting firm) until July 1999. Mr. Peterson joined William Blair Funds in February 2007 as a member of the Board of Trustees. From February 2012 to February 2014, Mr. Peterson served as a Trustee of Symetra Variable Mutual Funds. From January 2004 to April 2005, Mr. Peterson served as Independent President of the Strong Mutual Funds.
Lemma W. Senbet (1946) Director since 2005
Dr. Senbet is the William E. Mayer Chair Professor of Finance and Founding Director, Center for Financial Policy, at the University of Maryland, Robert H. Smith School of Business. He was chair of the Finance Department of the University of Maryland, Robert H. Smith School of Business from 1998 to 2006. Since June 2013, he has been on leave from the University to serve as Executive Director of African Economic Research Consortium which focuses on economic policy research and training. Previously, he was a chaired professor of finance at the University of Wisconsin-Madison. Also, he was a Director of the Fortis Funds from March 2000 to July 2002. Dr. Senbet served as Director of the American Finance Association and President of the Western Finance Association. In 2006, Dr. Senbet was inducted Fellow of Financial Management Association International for his career-long distinguished scholarship and professional service.
Interested Directors and Officers
James E. Davey (1964) Director since 2012, President and Chief Executive Officer since 2010
Mr. Davey serves as Executive Vice President of Hartford Life Insurance Company (“HLIC”) and The Hartford. Additionally, Mr. Davey serves as Chairman of the Board, Manager and Senior Managing Director of Hartford Funds Distributors, LLC (“HFD”). He also currently serves as Director, Chairman of the Board, President and Senior Managing Director of Hartford Administrative Services Company (“HASCO”). Mr. Davey also serves as Manager, Chairman of the Board and Senior Managing Director for Hartford Funds Management Company, LLC (“HFMC”) and Director, Chairman of the Board and Senior Managing Director for Hartford Funds Management Group, Inc. ("HFMG"). Mr. Davey has served in various positions within The Hartford and its subsidiaries in connection with the operation of the Hartford Funds. Mr. Davey joined The Hartford in 2002.
Lowndes A. Smith* (1939) Director since 1996 (MF) and 2002 (MF2)
Mr. Smith served as Vice Chairman of The Hartford from February 1997 to January 2002, as President and Chief Executive Officer of Hartford Life, Inc. from February 1997 to January 2002, and as President and Chief Operating Officer of The Hartford Life Insurance Companies from January 1989 to January 2002. Mr. Smith serves as a Director of White Mountains Insurance Group Ltd. (October 2003 to current); One Beacon Insurance (October 2006 to current); Symetra Financial (August 2007 to current) and is a Managing Director of Whittington Gray Associates (January 2007 to current).
* Mr. Smith resigned as a Director of MF, MF2, Hartford Series Fund, Inc. and Hartford HLS Series Fund II, Inc. and as a Trustee of The Hartford Alternative Strategies Fund effective September 17, 2014.
Other Officers
Mark A. Annoni (1964) Vice President, Controller and Treasurer since 2012
Mr. Annoni currently serves as the Assistant Vice President of HLIC (February 2004 to present) and Senior Vice President of HFMG (December 2013 to present). Mr. Annoni has served in various positions within The Hartford and its subsidiaries in connection with the operation of the Hartford Funds. Mr. Annoni joined The Hartford in 2001.
The Hartford Municipal Real Return Fund
Directors and Officers (Unaudited) – (continued)
Michael R. Dressen (1963) AML Compliance Officer since 2011
Mr. Dressen currently serves as Assistant Vice President of HLIC. He also serves as Chief Compliance Officer and AML Compliance Officer of HASCO and as AML Officer of HFD. Mr. Dressen has served in various positions within The Hartford and its subsidiaries in connection with the operation of the Hartford Funds.
Edward P. Macdonald (1967) Vice President, Secretary and Chief Legal Officer since 2005
Mr. Macdonald currently serves as Assistant Secretary, Executive Vice President and Deputy General Counsel of HFD, HASCO, HFMC and HFMG. He also serves as Vice President of HLIC. Mr. Macdonald has served in various positions within The Hartford and its subsidiaries in connection with the operation of the Hartford Funds. Mr. Macdonald joined The Hartford in 2005.
Joseph G. Melcher (1973) Vice President and Chief Compliance Officer since 2013
Mr. Melcher currently serves as Executive Vice President of HFD, HFMG and HASCO. Mr. Melcher also currently serves as Executive Vice President and Chief Compliance Officer of HFMC. Mr. Melcher has served in various positions within The Hartford and its subsidiaries in connection with the operation of the Hartford Funds since joining The Hartford in 2012. Prior to joining The Hartford, Mr. Melcher worked at Touchstone Investments, a member of the Western & Southern Financial Group, where he held the position of Vice President and Chief Compliance Officer from 2010 through 2012 and Assistant Vice President, Compliance from 2005 to 2010.
Vernon J. Meyer (1964) Vice President since 2006
Mr. Meyer currently serves as Senior Vice President of HLIC. He also currently serves as Managing Director and Chief Investment Officer of HFMC and Managing Director of HFMG. Mr. Meyer has served in various positions within The Hartford and its subsidiaries in connection with the operation of the Hartford Funds. Mr. Meyer joined The Hartford in 2004.
Laura S. Quade (1969) Vice President since 2012
Ms. Quade currently serves as Vice President of HASCO, HFD and HFMG. She is the Head of Operations of HASCO and formerly served as Director, Enterprise Operations of HLIC. Ms. Quade has served in various positions within The Hartford and its subsidiaries in connection with the operation of the Hartford Funds. Ms. Quade joined The Hartford in 2001.
Martin A. Swanson** (1962) Vice President since 2010
Mr. Swanson currently serves as Vice President of HLIC. Mr. Swanson also serves as Managing Director, Chief Marketing Officer and Principal of HFD and Managing Director of HFMG. Mr. Swanson has served in various positions within The Hartford and its subsidiaries in connection with the operation of the Hartford Funds.
** Mr. Swanson resigned as an officer effective November 6, 2014.
HOW TO OBTAIN A COPY OF THE FUND’S PROXY VOTING POLICIES AND VOTING RECORDS (UNAUDITED)
A description of the policies and procedures that the Fund uses to determine how to vote proxies relating to portfolio securities and information about how the Fund voted proxies relating to portfolio securities during the most recent twelve-month period ended June 30 are available (1) without charge, upon request, by calling 888-843-7824 and (2) on the SEC’s website at http://www.sec.gov.
QUARTERLY PORTFOLIO HOLDINGS INFORMATION (UNAUDITED)
The Fund files a complete schedule of portfolio holdings with the SEC for the first and third quarters of each fiscal year on Form N-Q. The Fund’s Forms N-Q are available (1) without charge, upon request, by calling 888-843-7824 and (2) on the SEC’s website at http://www.sec.gov. The Form N-Q may be reviewed and copied at the SEC’s Public Reference Room in Washington, DC. Information on the operation of the Public Reference Room may be obtained by calling 1-800-SEC-0330.
The Hartford Municipal Real Return Fund
Federal Tax Information (Unaudited)
For the fiscal year ended October 31, 2014, there is no further federal tax information required for this Fund.
The Hartford Municipal Real Return Fund
Expense Example (Unaudited)
Your Fund's Expenses
As a shareholder of the Fund, you incur two types of costs: (1) transaction costs, including sales charges (loads) on purchase payments, if any, and contingent deferred sales charges (CDSC), if any, and (2) ongoing costs, including investment management fees, distribution and/or service (12b-1) fees, if any, and other fund expenses. This example is intended to help you understand your ongoing costs (in dollars) of investing in the Fund and to compare these costs with the ongoing costs of investing in other mutual funds. The example is based on an investment of $1,000 invested at the beginning of the period and held for the entire period of April 30, 2014 through October 31, 2014.
Actual Expenses
The first set of columns of the table below provides information about actual account values and actual expenses. You may use the information in this column, together with the amount you invested, to estimate the expenses that you paid over the period. Simply divide your account value by $1,000 (for example, an $8,600 account value divided by $1,000 = 8.6), then multiply the result by the number in the line under the heading entitled “Expenses Paid During Period” to estimate the expenses you paid on your account during this period.
Hypothetical Example for Comparison Purposes
The second set of columns of the table below provides information about hypothetical account values and hypothetical expenses based on the Fund's actual expense ratio and an assumed rate of return of 5% per year before expenses, which is not the Fund's actual return. The hypothetical account values and expenses may not be used to estimate the actual ending account balance or expenses you paid for the period. You may use this information to compare the ongoing costs of investing in the Fund and other funds. To do so, compare this 5% hypothetical example with the 5% hypothetical examples that appear in the shareholder reports of the other funds.
Please note that the expenses shown in the table are meant to highlight your ongoing costs only and do not reflect any transactional costs, such as sales charges (loads) and CDSC. Therefore, the second set of columns of the table is useful in comparing ongoing costs only, and will not help you determine the relative total costs of owning different funds. In addition, if these transactional costs were included, your costs would be higher. Expenses are equal to the Fund's annualized expense ratios multiplied by average account value over the period, multiplied by 184/365 (to reflect the one-half year period).
| | | Actual return | | | Hypothetical (5% return before expenses) | | | | | | | | | | |
| | | Beginning
Account Value
April 30, 2014 | | | Ending Account
Value
October 31, 2014 | | | Expenses paid
during the period
April 30, 2014
through
October 31, 2014 | | | Beginning
Account Value
April 30, 2014 | | | Ending Account
Value
October 31, 2014 | | | Expenses paid
during the period
April 30, 2014
through
October 31, 2014 | | | Annualized
expense
ratio | | | Days
in the
current
1/2
year | | | Days
in the
full
year | |
| Class A | | $ | 1,000.00 | | | $ | 1,022.70 | | | $ | 4.33 | | | $ | 1,000.00 | | | $ | 1,020.92 | | | $ | 4.33 | | | | 0.85 | % | | | 184 | | | | 365 | |
| Class B | | $ | 1,000.00 | | | $ | 1,018.10 | | | $ | 8.14 | | | $ | 1,000.00 | | | $ | 1,017.14 | | | $ | 8.14 | | | | 1.60 | | | | 184 | | | | 365 | |
| Class C | | $ | 1,000.00 | | | $ | 1,019.10 | | | $ | 8.14 | | | $ | 1,000.00 | | | $ | 1,017.14 | | | $ | 8.14 | | | | 1.60 | | | | 184 | | | | 365 | |
| Class I | | $ | 1,000.00 | | | $ | 1,025.00 | | | $ | 3.06 | | | $ | 1,000.00 | | | $ | 1,022.18 | | | $ | 3.06 | | | | 0.60 | | | | 184 | | | | 365 | |
| Class Y | | $ | 1,000.00 | | | $ | 1,025.20 | | | $ | 3.04 | | | $ | 1,000.00 | | | $ | 1,022.20 | | | $ | 3.04 | | | | 0.60 | | | | 184 | | | | 365 | |
The Hartford Municipal Real Return Fund
Approval of Investment Management and Investment Sub-Advisory Agreements (Unaudited)
Section 15(c) of the Investment Company Act of 1940, as amended (the “1940 Act”), requires that each mutual fund’s board of directors, including a majority of those directors who are not “interested persons” of the mutual fund, as defined in the 1940 Act (the “Independent Directors”), annually review and consider the continuation of the mutual fund’s investment advisory and sub-advisory agreements. At its meeting held on August 5-6, 2014, the Board of Directors (the “Board”) of The Hartford Mutual Funds II, Inc., including each of the Independent Directors, unanimously voted to approve the continuation of the investment management agreement for The Hartford Municipal Real Return Fund (the “Fund”) with Hartford Funds Management Company, LLC (“HFMC”) and the continuation of the investment sub-advisory agreement between HFMC and the Fund’s sub-adviser, Wellington Management Company, LLP (the “Sub-adviser,” and together with HFMC, the “Advisers”) (collectively, the “Agreements”).
In the months preceding the August 5-6, 2014 meeting, the Board requested, received and reviewed written responses from the Advisers to questions posed to them on behalf of the Independent Directors and supporting materials relating to those questions and responses. The Board considered information furnished to the Board at its meetings throughout the year, as well as information specifically prepared in connection with the annual approval of the Agreements at the Board’s meetings held on June 17-18, 2014 and August 5-6, 2014. Information provided to the Board at its meetings throughout the year included, among other things, reports on Fund performance, legal and compliance matters, sales and marketing activity, shareholder services, and the other services provided to the Fund by the Advisers and their affiliates. The Board also received in-person presentations by Fund officers and representatives of HFMC at the Board’s meetings on June 17-18, 2014 and August 5-6, 2014 concerning the Agreements.
The Independent Directors, advised by independent legal counsel, engaged service providers to assist them with evaluating the Agreements with respect to the Fund. Lipper Inc. (“Lipper”), an independent provider of investment company data, was retained to provide the Board with reports on how the Fund’s contractual management fees, actual management fees, other non-management fees, overall expense ratios and investment performance compared to those of mutual funds with similar investment objectives. The Independent Directors also engaged an independent financial services consultant (the “Consultant”) to assist them in evaluating the Fund’s management fees, sub-advisory fees, other non-management fees, overall expense ratios and investment performance. In addition, the Consultant reviewed the profitability calculations utilized by HFMC in connection with the continuation of the investment management agreement.
In determining whether to continue the Agreements for the Fund, the members of the Board reviewed and evaluated information and factors they believed to be relevant and appropriate in light of the information that the Board deemed necessary and appropriate through the exercise of its reasonable business judgment. While individual members of the Board may have weighed certain factors differently, the Board’s determination to continue the Agreements was based on a comprehensive consideration of all information provided to the Board throughout the year and specifically with respect to the continuation of the Agreements. A more detailed discussion of the factors the Board considered with respect to its approval of the Agreements is provided below.
Nature, Extent and Quality of Services Provided by the Advisers
The Board requested and considered information concerning the nature, extent and quality of the services provided to the Fund by the Advisers. The Board considered, among other things, the terms of the Agreements and the range of services provided by the Advisers. The Board considered the Advisers’ professional personnel who provide services to the Fund, including each Adviser’s ability and experience in attracting and retaining qualified personnel to service the Fund. The Board considered each Adviser’s reputation and overall financial strength, as well as its willingness to consider and implement organizational and operational changes designed to enhance services to the Hartford Funds. In addition, the Board considered the quality of each Adviser’s communications with the Board and responsiveness to Board inquiries and requests made from time to time with respect to the Fund and other Hartford Funds.
The Board also requested and evaluated information concerning each Adviser’s regulatory and compliance environment. In this regard, the Board requested and reviewed information on each Adviser’s compliance policies and procedures, compliance history, and a report from the Fund’s Chief Compliance Officer on each Adviser’s compliance with applicable laws and regulations, including responses to regulatory developments and compliance issues raised by regulators. The Board also noted the Advisers’ support of the Fund’s compliance control structure, particularly the resources devoted by the Advisers in support of the Fund’s obligations pursuant to Rule 38a-1 under the 1940 Act.
With respect to HFMC, the Board noted that, under the Agreements, HFMC is responsible for the management of the Fund, including oversight of fund operations and service providers, and provides administrative and investment advisory services in connection with selecting, monitoring and supervising the Sub-adviser. The Board considered HFMC’s ongoing monitoring of people, process and performance, including its quarterly reviews of each of the Hartford Funds, semi-annual meetings with the leaders of each Fund’s portfolio management team, and oversight of the Hartford Funds’ approximately 66 portfolio managers. The Board recognized that HFMC has demonstrated a record of making changes to the
The Hartford Municipal Real Return Fund
Approval of Investment Management and Investment Sub-Advisory Agreements (Unaudited) – (continued)
management and/or strategies of the Hartford Funds when warranted. The Board considered HFMC’s oversight of the Sub-adviser’s investment approach and results, process for monitoring best execution of portfolio trades by the Sub-adviser, and approach to risk management with respect to the Fund and the service providers to the Fund. The Board also considered HFMC’s oversight of compliance with the Fund’s objective and policies as well as with applicable laws and regulations, noting that regulatory and other developments had over time led to an increase in the scope of HFMC’s services in this regard.
In addition, the Board considered HFMC’s ongoing commitment to review and rationalize the Hartford Funds product line-up and the expenses that HFMC had incurred in connection with fund combinations in recent years. The Board considered that HFMC or its affiliates are responsible for providing the Fund’s officers.
With respect to the Sub-adviser, which provides certain day-to-day portfolio management services for the Fund, the Board considered the quality of the Fund’s portfolio managers, the Sub-adviser’s other investment personnel, its investment philosophy and process, investment research capabilities and resources, performance record, trade execution capabilities and experience. The Board considered the experience of the Fund’s portfolio managers, the number of accounts managed by the portfolio managers, and the Sub-adviser’s method for compensating the portfolio managers.
Based on these considerations, the Board concluded that it was satisfied with the nature, extent and quality of the services provided to the Fund by HFMC and the Sub-adviser.
Performance of the Fund and the Advisers
The Board considered the investment performance of the Fund. In this regard, the Board reviewed the performance of the Fund over different time periods presented in the materials and evaluated HFMC’s analysis of the Fund’s performance for these time periods. The Board considered information and materials provided to the Board by the Advisers concerning Fund performance, as well as information from Lipper comparing the investment performance of the Fund to an appropriate benchmark and universe of peer funds. The Board noted that the Fund’s performance was in the 5th quintile of its performance universe for the 1-year period, the 3rd quintile for the 3-year period and the 1st quintile for the 5-year period. The Board also noted that the Fund’s performance was below its benchmark for the 1-year period and above its benchmark for the 3- and 5-year periods.
The Board considered the detailed investment analytics reports provided by Hartford Funds’ Investment Advisory Group throughout the year. These reports include, among other things, information on the Fund’s gross and net returns, the Fund’s investment performance relative to an appropriate benchmark and peer group, various statistics concerning the Fund’s portfolio, and a narrative summary of various factors affecting Fund performance. The Board considered the Advisers’ cooperation with the Investment Committee, which assists the Board in evaluating the performance of the Fund at periodic meetings throughout the year. The Board also considered the analysis provided by the Consultant relating to the Fund’s performance track record.
In light of all the considerations noted above, the Board concluded that it had continued confidence in HFMC’s and the Sub-adviser’s overall capabilities to manage the Fund.
Costs of the Services and Profitability of the Advisers
The Board reviewed information regarding HFMC’s cost to provide investment management and related services to the Fund and HFMC’s profitability, both overall and for the Fund, on a pre-tax basis without regard to distribution expenses. The Board also requested and reviewed information about the profitability to HFMC and its affiliates from all services provided to the Fund and all aspects of their relationship with the Fund. The Board also requested and received information relating to the operations and profitability of the Sub-adviser.
The Board considered the Consultant’s review of the profitability calculations used by HFMC in connection with the continuation of the investment management agreement, noting the Consultant’s view that Hartford Funds’ process for calculating and reporting Fund profitability is reasonable. In this regard, the Board noted that the Consultant performed a full review of this process in light of the recent restructuring of the Hartford Funds business and reported that the approach to analyzing Fund profitability, including the use of common expense allocation methodologies, is reasonable, sound and well within common industry practice.
Based on these considerations, the Board concluded that the profits anticipated to be realized by the Advisers and their affiliates from their relationships with the Fund would not be excessive.
The Hartford Municipal Real Return Fund
Approval of Investment Management and Investment Sub-Advisory Agreements (Unaudited) – (continued)
Comparison of Fees and Services Provided by the Advisers
The Board considered comparative information with respect to the management fees to be paid by the Fund to HFMC and the total expense ratios of the Fund. The Board also considered comparative information with respect to the sub-advisory fees to be paid by HFMC to the Sub-adviser. In this regard, the Board requested and reviewed information from HFMC and the Sub-adviser relating to the management and sub-advisory fees, including the sub-advisory fee schedule for the Fund, and total operating expenses for the Fund. With respect to the sub-advisory fee schedule, the Board considered representations from HFMC and the Sub-adviser that the Sub-adviser’s fees were negotiated at arm’s length on a fund-by-fund basis. The Board also reviewed information from Lipper comparing the Fund’s contractual management fees, actual management fees and overall expense ratios relative to a group of funds selected by Lipper, in consultation with the Consultant, and a broader universe of funds selected by Lipper. The Board considered that the Fund’s contractual management fee was in the 1st quintile of its expense group, while its actual management fee and its total expenses (less 12b-1 and shareholder service fees) were in the 2nd quintile. The Board noted that the Fund has an automatically renewable contractual expense cap and a permanent expense cap on each share class. These arrangements resulted in reimbursement of certain expenses incurred in 2013.
While the Board recognized that comparisons between the Fund and peer funds may be imprecise, given the different service levels and characteristics of mutual funds and the different business models and cost structures of the Advisers, the comparative information provided by Lipper assisted the Board in evaluating the reasonableness of the Fund’s management and sub-advisory fees and total operating expenses. In addition, the Board considered the analysis and recommendations of the Consultant relating to the Fund’s management and sub-advisory fees and total operating expenses.
Based on these considerations, the Board concluded that the Fund’s fees and total operating expenses, in conjunction with the information about quality of services, profitability, economies of scale, and other matters discussed, were reasonable in light of the services provided.
Economies of Scale
The Board requested and considered information regarding the Advisers’ realization of economies of scale with respect to the Fund and whether the fee levels reflect these economies of scale for the benefit of the Fund’s shareholders. The Board reviewed the breakpoints in the management fee schedule for the Fund, which reduce fee rates as Fund assets grow over time. The Board recognized that a fund with assets beyond the highest breakpoint level will continue to benefit from economies of scale because additional assets are charged the lowest breakpoint fee resulting in lower overall effective management fee rates. The Board also considered that expense limitations and fee waivers that reduce the Fund’s expenses at all asset levels can have the same effect as breakpoints in sharing economies of scale with shareholders and provide protection from an increase in expenses if Fund assets decline. The Board recognized that a fee schedule that reaches a lower breakpoint quickly provides shareholders with the benefit of anticipated or potential economies of scale, although the Board noted that the Fund’s current low asset levels have kept the Fund from fully realizing this benefit. The Board also considered that HFMC has been active in managing expenses, which has resulted in benefits being realized by shareholders as assets within the Hartford Funds family of funds have grown over time, including through lower transfer agent costs and other operating expenses.
The Board reviewed and evaluated materials from Lipper and the Consultant showing how management fee schedules of peer funds reflect economies of scale for the benefit of shareholders as a peer fund’s assets hypothetically increase over time. Based on information provided by HFMC, Lipper, and the Consultant, the Board recognized that there is no uniform methodology for establishing breakpoints or uniform pattern in asset levels that trigger breakpoints or the amounts of breakpoints triggered.
After considering all of the information available to it, the Board concluded that it was satisfied with the extent to which economies of scale would be shared for the benefit of the Fund’s shareholders based on currently available information and the effective advisory fees and expense ratios for the Fund at its current and reasonably anticipated asset levels. The Board noted, however, that it would continue to monitor future growth in Fund assets and the appropriateness of additional breakpoints.
Other Benefits
The Board considered other benefits to the Advisers and their affiliates from their relationships with the Fund.
The Board noted that HFMC receives fees for fund accounting and related services from the Fund, and the Board considered information on profits to HFMC for such services. The Board also considered that Hartford Administrative Services Company (“HASCO”), the Fund’s transfer agent and an affiliate of HFMC, receives transfer agency compensation from the Fund, and the Board reviewed information on the profitability of
The Hartford Municipal Real Return Fund
Approval of Investment Management and Investment Sub-Advisory Agreements (Unaudited) – (continued)
the Fund’s transfer agency function to HASCO. The Board considered information provided by HASCO indicating that the transfer agent fees charged by HASCO to the Fund were fair and reasonable based on publicly available information.
The Board also considered that Hartford Funds Distributors, LLC (“HFD”), an affiliate of HFMC, serves as principal underwriter of the Fund. As principal underwriter, HFD receives 12b-1 fees from the Fund and receives all or a portion of the sales charges on sales or redemptions of certain classes of shares. The Board also noted that certain affiliates of HFD distribute shares of the Fund and receive compensation in that connection.
The Board considered the benefits, if any, to the Sub-adviser from any use of the Fund’s brokerage commissions to obtain soft dollar research, and representations from HFMC and the Sub-adviser that the Sub-adviser would not make any revenue-sharing payments or any other type of distribution payments to HFMC or its affiliates.
The Board considered the benefits to shareholders of being part of the Hartford Funds family of funds, including the right to exchange investments between the same class of funds without a sales charge, the ability to reinvest Fund dividends into other funds in the family, and the ability to combine holdings in the Fund with holdings in other funds to obtain a reduced sales charge. The Board considered HFMC’s efforts to provide investors in the family with a broad range of investment styles and asset classes and its entrepreneurial risk in initiating new funds to expand these opportunities for shareholders.
* * * *
Based upon its review of these various factors, among others, the Board concluded that it is in the best interests of the Fund and its shareholders for the Board to approve the Agreements for an additional year. In reaching this decision, the Board did not assign relative weights to the factors discussed above or deem any one or group of them to be controlling in and of themselves. In connection with their deliberations, the Independent Directors met separately in executive session on several occasions, with independent legal counsel and the Consultant, to review the relevant materials and consider their responsibilities under relevant laws and regulations.
The Hartford Municipal Real Return Fund
Main Risks (Unaudited)
The main risks of investing in the Fund are described below.
Market, Selection and Strategy Risk: The Fund’s share price may fluctuate due to market risk and/or security selections that may underperform the market or relevant benchmarks. If the sub-adviser's investment strategy does not perform as expected, the Fund could underperform its peers or lose money. There is no guarantee the Fund will achieve its stated objective.
Muni Bond Risk: Municipal securities are subject to interest rate risk (the risk that the value of an investment decreases when interest rates rise), credit risk (the risk that the issuing company of a security is unable to pay interest and principal when due), liquidity risk (the risk that an investment may be difficult to sell at an advantageous time or price), call risk (the risk that an investment may be redeemed early), and risks related to changes in the tax-exempt status of the securities.
Derivatives Risk: Investments in derivatives can be volatile. Potential risks include currency risk, leverage risk (the risk that small market movements may result in large changes in the value of an investment), liquidity risk, index risk, pricing risk, and counterparty risk (the risk that the counterparty may be unwilling or unable to honor its obligations).
AMT Risk: Income from the Fund may be subject to income tax, including the Alternative Minimum Tax.
Active Trading Risk: Actively trading investments may result in higher costs and higher taxable income.
THIS PRIVACY POLICY IS NOT PART OF THIS REPORT
Privacy Policy and Practices of The Hartford Financial Services Group, Inc. and its Affiliates
(herein called “we, our and us”)
This Privacy Policy applies to our United States Operations
| | | |
We value your trust. We are committed to the responsible: a) management; b) use; and c) protection; of Personal Information. This notice describes how we collect, disclose, and protect Personal Information. We collect Personal Information to: a) service your Transactions with us; and b) support our business functions. We may obtain Personal Information from: a) You; b) your Transactions with us; and c) third parties such as a consumer-reporting agency. Based on the type of product or service You apply for or get from us, Personal Information such as: a) your name; b) your address; c) your income; d) your payment; or e) your credit history; may be gathered from sources such as applications, Transactions, and consumer reports. To serve You and service our business, we may share certain Personal Information. We will share Personal Information, only as allowed by law, with affiliates such as: a) our insurance companies; b) our employee agents; c) our brokerage firms; and d) our administrators. As allowed by law, we may share Personal Financial Information with our affiliates to: a) market our products; or b) market our services; to You without providing You with an option to prevent these disclosures. | | | We may also share Personal Information, only as allowed by law, with unaffiliated third parties including: a) independent agents; b) brokerage firms; c) insurance companies; d) administrators; and e) service providers; who help us serve You and service our business. When allowed by law, we may share certain Personal Financial Information with other unaffiliated third parties who assist us by performing services or functions such as: a) taking surveys; b) marketing our products or services; or c) offering financial products or services under a joint agreement between us and one or more financial institutions. We, and third parties we partner with, may track some of the pages You visit through the use of: a) cookies; b) pixel tagging; or c) other technologies; and currently do not process or comply with any web browser’s “do not track” signal or similar mechanism that indicates a request to disable online tracking of individual users who visit our websites or use our services. We will not sell or share your Personal Financial Information with anyone for purposes unrelated to our business functions without offering You the opportunity to: a) “opt-out;” or b) “opt-in;” as required by law. We only disclose Personal Health Information with: a) your proper written authorization; or b) as otherwise allowed or required by law. Our employees have access to Personal Information in the course of doing their jobs, such as: a) underwriting policies; b) paying claims; c) developing new products; or d) advising customers of our products and services. |
We use manual and electronic security procedures to maintain: a) the confidentiality; and b) the integrity of; Personal Information that we have. We use these procedures to guard against unauthorized access. Some techniques we use to protect Personal Information include: a) secured files; b) user authentication; c) encryption; d) firewall technology; and e) the use of detection software. We are responsible for and must: a) identify information to be protected; b) provide an adequate level of protection for that data; c) grant access to protected data only to those people who must use it in the performance of their job-related duties. Employees who violate our Privacy Policy will be subject to discipline, which may include ending their employment with us. At the start of our business relationship, we will give You a copy of our current Privacy Policy. We will also give You a copy of our current Privacy Policy once a year if You maintain a continuing business relationship with us. We will continue to follow our Privacy Policy regarding Personal Information even when a business relationship no longer exists between us. | | | As used in this Privacy Notice: Application means your request for our product or service. Personal Financial Information means financial information such as: a) credit history; b) income; c) financial benefits; or d) policy or claim information. Personal Health Information means health information such as: a) your medical records; or b) information about your illness, disability or injury. Personal Information means information that identifies You personally and is not otherwise available to the public. It includes: a) Personal Financial Information; and b) Personal Health Information. Transaction means your business dealings with us, such as: a) your Application; b) your request for us to pay a claim; and c) your request for us to take an action on your account. You means an individual who has given us Personal Information in conjunction with: a) asking about; b) applying for; or c) obtaining; a financial product or service from us if the product or service is used mainly for personal, family, or household purposes. |
This Privacy Policy is being provided on behalf of the following affiliates of The Hartford Financial Services Group, Inc.:
1stAGChoice, Inc.; Access CoverageCorp, Inc.; Access CoverageCorp Technologies, Inc.; American Maturity Life Insurance Company; Archway 60 R, LLC; Business Management Group, Inc.; Champlain Life Reinsurance Company; DMS R, LLC; Eloy R, LLC; Ersatz Corporation; First State Insurance Company; Hartford Accident and Indemnity Company; Hartford Administrative Services Company; Hartford Casualty General Agency, Inc.; Hartford Casualty Insurance Company; Hartford-Comprehensive Employee Benefit Service Company; Hartford Equity Sales Company, Inc.; Hartford Fire General Agency, Inc.; Hartford Fire Insurance Company; Hartford Funds Management Company, LLC; Hartford Funds Management Group, Inc.; Hartford HLS Series Fund II, Inc.; Hartford Insurance Company of Illinois; Hartford Insurance Company of the Midwest; Hartford Insurance Company of the Southeast; Hartford Integrated Technologies, Inc.; Hartford International Life Reassurance Corporation; Hartford Funds Distributors, LLC; Hartford Investment Management Company; Hartford Life and Accident Insurance Company; Hartford Life and Annuity Insurance Company; Hartford Life Insurance Company; Hartford Life Private Placement, LLC; Hartford Lloyd’s Corporation; Hartford Lloyd’s Insurance Company; Hartford Mezzanine Investors I, LLC; Hartford Residual Market, L.C.C.; Hartford Retirement Services, LLC; Hartford Securities Distribution Company, Inc.; Hartford Series Fund, Inc.; Hartford Specialty Insurance Services of Texas, LLC; Hartford Strategic Investments, LLC; Hartford Underwriters Insurance Company; Hartford Technology Services Company, L.L.C.; Hartford of Texas General Agency, Inc.; Hartford Underwriters General Agency, Inc.; HARTRE Company, L.C.C.; HL Investment Advisors, LLC; HLA LLC; Horizon Management Group, LLC; HRA Brokerage Services, Inc.; Lanidex Class B, LLC; M-CAP Insurance Agency, LLC; New England Insurance Company; New England Reinsurance Corporation; Nutmeg Insurance Agency, Inc.; Nutmeg Insurance Company; Pacific Insurance Company, Limited; Planco, LLC: Property and Casualty Insurance Company of Hartford; Revere R, LLC; RVR R, LLC; Sentinel Insurance Company, Ltd.; Sunstone R, LLC; Symphony R, LLC; The Evergreen Group Incorporated; The Hartford Alternative Strategies Fund; The Hartford Mutual Funds, Inc.; The Hartford Mutual Funds II, Inc.; Trumbull Flood Management, L.L.C.; Trumbull Insurance Company; Twin City Fire Insurance Company; White River Life Reinsurance Company.
HPP Revised January 2014
HARTFORDFUNDS
hartfordfunds.com
This information is written in connection with the promotion or marketing of the matter(s) addressed in this material.
This report is submitted for the general information of the shareholders of the Fund. It is not authorized for distribution unless preceded or accompanied by a current prospectus for the Fund.
The information cannot be used or relied upon for the purpose of avoiding IRS penalties. These materials are not intended to provide tax, accounting or legal advice. As with all matters of a tax or legal nature, you should consult your own tax or legal counsel for advice.
Investors should carefully consider the investment objectives, risks, charges, and expenses of Hartford Funds before investing. This and other information can be found in the prospectus and summary prospectus, which can be obtained by calling 888-843-7824 (retail) or 800-279-1541 (institutional). Investors should read them carefully before they invest.
Hartford Funds are underwritten and distributed by Hartford Funds Distributors, LLC.
MFAR-MRR14 12/14 113995-3 Printed in U.S.A.
HARTFORDFUNDS
| THE HARTFORD SMALLCAP GROWTH FUND 2014 Annual Report |
A MESSAGE FROM THE PRESIDENT
Dear Fellow Shareholders:
Thank you for investing in Hartford Funds.
Market Review
U.S. equities (as represented by the S&P 500 Index) rose steadily for the fiscal year ended October 31, 2014, with a return of 17.27% for the period. With the exception of short-lived geopolitical scares early in 2014 and concerns about continuing global growth near the end of the period, stocks generally rose on solid fundamentals and encouraging macroeconomic data during the year.
September 2014 marked the six-year anniversary of the start of the financial crisis. Within weeks of that anniversary, both the S&P 500 Index and the Dow Jones Industrial Average set new all-time highs, closing at 2,018 and 17,391, respectively, on October 31. Although the fallout of the crisis continues to influence investor behavior, stocks have recovered and risen dramatically, up 198% from their low in March 2009. Meanwhile, the domestic economy is notching strong growth, and the unemployment rate has reached its lowest level since August 2008.
While the U.S. economy appears to have stabilized and to have reverted to a solid growth path, the outlook for the global economy appears to have gotten cloudier. The U.S. Federal Reserve has ended quantitative easing, while Europe and Japan are pursuing stimulus options to avoid a double-dip recession and deflation, respectively. Diverging central-bank policies will likely continue to play an important role in market movements going forward as investors wait to see the reactions to their efforts and their impacts on global markets.
How have market movements impacted your portfolio throughout the last year? Are your investments still on track to provide the growth or income you need, and are you comfortable with their progress during times of volatility?
Your financial professional can help you navigate today’s markets with confidence, as well as assist you to achieve your investment goals by providing advice on the best options within our fund family to help you work toward overcoming today’s investing challenges. Meet with your financial advisor regularly to examine your portfolio and your investment strategy, and to determine if you’re still on track to meet your goals.
Thank you again for investing with Hartford Funds.
James Davey
President
Hartford Funds
1 The S&P 500 Index is a market capitalization-weighted price index composed of 500 widely held common stocks.
2 The Dow Jones Industrial Average is an unmanaged, price-weighted index of 30 of the largest, most widely held stocks traded on the NYSE
The Hartford SmallCap Growth Fund
Table of Contents
The views expressed in the Fund’s Manager Discussion under ‘‘Why did the Fund perform this way?’’ and ‘‘What is the outlook?’’ are views of the Fund’s sub-adviser and portfolio management team through the end of the period and are subject to change based on market and other conditions. The Fund’s Manager Discussion is for informational purposes only and does not represent an offer, recommendation or solicitation to buy, hold or sell any security. The specific securities identified and described, if any, do not represent all of the securities purchased or sold and you should not assume that investments in the securities identified and discussed will be profitable.
The Hartford SmallCap Growth Fund inception 01/04/1988
(sub-advised by Wellington Management Company, LLP)
Investment objective – The Fund seeks long-term capital appreciation.
Performance Overview 10/31/04 - 10/31/14
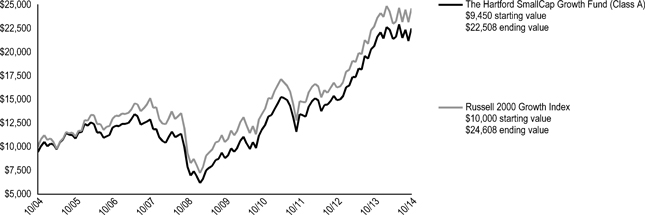
The chart above represents the hypothetical growth of a $10,000 investment in Class A, which includes a sales charge. Growth results in classes other than Class A will vary from what is seen above due to differences in the expenses charged to those share classes.
Average Annual Total Returns (as of 10/31/14)
| | | 1 Year | | 5 Years | | 10 Years |
| SmallCap Growth A# | | | 9.02 | % | | | 20.65 | % | | | 9.07 | % |
| SmallCap Growth A## | | | 3.03 | % | | | 19.30 | % | | | 8.45 | % |
| SmallCap Growth B# | | | 8.16 | % | | | 19.73 | % | | | 8.48 | %* |
| SmallCap Growth B## | | | 3.20 | % | | | 19.54 | % | | | 8.48 | %* |
| SmallCap Growth C# | | | 8.30 | % | | | 19.79 | % | | | 8.23 | % |
| SmallCap Growth C## | | | 7.31 | % | | | 19.79 | % | | | 8.23 | % |
| SmallCap Growth I# | | | 9.34 | % | | | 21.02 | % | | | 9.26 | % |
| SmallCap Growth R3# | | | 8.76 | % | | | 20.40 | % | | | 8.94 | % |
| SmallCap Growth R4# | | | 9.09 | % | | | 20.76 | % | | | 9.17 | % |
| SmallCap Growth R5# | | | 9.45 | % | | | 21.12 | % | | | 9.43 | % |
| SmallCap Growth Y# | | | 9.54 | % | | | 21.24 | % | | | 9.50 | % |
| Russell 2000 Growth Index | | | 8.26 | % | | | 18.61 | % | | | 9.42 | % |
| # | Without sales charge |
| ## | With sales charge |
| * | Class B shares convert to Class A shares after 8 years. The return shown reflects the conversion to Class A shares, which had different operating expenses, for the period after conversion. |
PERFORMANCE DATA QUOTED REPRESENTS PAST PERFORMANCE AND DOES NOT GUARANTEE FUTURE RESULTS. The investment return and principal value of the investment will fluctuate so that investors’ shares, when redeemed, may be worth more or less than their original cost. Current performance may be lower or higher than the performance data quoted. To obtain performance data current to the most recent month-end, please visit our website www.hartfordfunds.com.
The initial investment in Class A shares reflects the maximum sales charge of 5.50% and returns for Class B shares reflect a contingent deferred sales charge of up to 5.00% and declining to zero, depending on the period of time the shares are held. Returns for Class C shares reflect a contingent deferred sales charge of up to 1.00% on shares redeemed within twelve months of purchase.
Total returns presented above were calculated using the Fund’s net asset value available to shareholders for sale or redemption of Fund shares on October 31, 2014, which may exclude investment transactions as of this date. All share class returns assume the reinvestment of all distributions at net asset value and the deduction of all fund expenses.
Effective 9/30/09, Class B shares of the Fund were closed to new investments.
Performance information includes performance under the Fund’s previous sub-adviser, Hartford Investment Management Company. As of July 21, 2010, Hartford Investment Management Company no longer served as the sub-adviser to the Fund.
Class I shares commenced operations on 8/31/06. Performance prior to that date is that of the Fund's Class A shares (excluding sales charges), which had different operating expenses. Class R3, R4 and R5 shares commenced operations on 12/22/06. Performance prior to that date is that of the Fund's Class Y shares, which had different operating expenses.
Russell 2000 Growth Index is an unmanaged index of those Russell 2000 Index growth companies with higher price-to-book ratios and higher forecasted growth values. The Russell 2000 Index is a broad-based unmanaged index comprised of 2,000 of the smallest U.S.-domiciled company common stocks (on the basis of capitalization) that are traded in the United States on the New York Stock Exchange, NYSE MKT LLC and Nasdaq.
You cannot invest directly in an index.
The chart and table do not reflect the deductions of taxes that a shareholder would pay on Fund distributions or the redemption of Fund shares.
Performance information may reflect historical or current expense waivers/reimbursements from the investment adviser, without which performance would have been lower. For information on current expense waivers/reimbursements, please see the prospectus.
The Hartford SmallCap Growth Fund
Manager Discussion
October 31, 2014 (Unaudited)
| Operating Expenses* |
| | | Net | | | Gross | |
| SmallCap Growth Class A | | | 1.40% | | | | 1.40% | |
| SmallCap Growth Class B | | | 2.15% | | | | 2.40% | |
| SmallCap Growth Class C | | | 2.08% | | | | 2.08% | |
| SmallCap Growth Class I | | | 1.04% | | | | 1.04% | |
| SmallCap Growth Class R3 | | | 1.59% | | | | 1.59% | |
| SmallCap Growth Class R4 | | | 1.27% | | | | 1.27% | |
| SmallCap Growth Class R5 | | | 0.97% | | | | 0.97% | |
| SmallCap Growth Class Y | | | 0.87% | | | | 0.87% | |
| * | As shown in the Fund's prospectus dated March 1, 2014. Actual expenses may be higher or lower. Please see accompanying Financial Highlights for expense ratios for the year ended October 31, 2014. |
Gross expenses are the Fund's total annual operating expenses shown in the Fund's prospectus dated March 1, 2014. Net expenses are the Fund's total annual operating expenses shown in the Fund's prospectus dated March 1, 2014 and reflect contractual expense reimbursements in instances when these reductions reduce the Fund's gross expenses. Contractual reimbursements remain in effect until February 28, 2015, and automatically renew for one-year terms unless terminated.
The Fund filed an updated prospectus, dated November 7, 2014, with the U.S. Securities and Exchange Commission that became effective on that date. However, the information in this annual report is as of October 31, 2014 and does not reflect any changes made to the total annual fund operating expense table in the November 7, 2014 prospectus.
All investments are subject to risk including the possible loss of principal. For a discussion of the Fund’s risks, please see the Main Risks section of this report. For more detailed information on the risks associated with an investment in the Fund, please see the prospectus.
| Portfolio Managers | |
| Mammen Chally, CFA | David J. Elliott, CFA |
| Vice President and Equity Portfolio Manager | Vice President, Co-Director, Quantitative Investments and Portfolio Manager |
How did the Fund perform?
The Class A shares of The Hartford SmallCap Growth Fund returned 9.02%, before sales charge, for the twelve-month period ended October 31, 2014, outperforming the Fund’s benchmark, the Russell 2000 Growth Index, which returned 8.26% for the same period. The Fund outperformed the 5.67% average return of the Lipper Small-Cap Growth Funds peer group, a group of funds with investment strategies similar to those of the Fund.
Why did the Fund perform this way?
U.S. equities surged during the period, despite bouts of significant volatility. After finishing their best year since 1997, U.S. stocks began 2014 with their worst month in nearly two years. Worries about a slowdown in China and general angst surrounding emerging markets overshadowed a fairly benign domestic environment. However, robust merger and acquisition activity and an uncontested increase in the debt ceiling from Congress helped stoke investors' risk appetites in February. The rally continued in May amid renewed signs of life in the housing market and the best payroll gain in more than two years. However, a pullback in July ended a streak of five consecutive monthly gains. Fear gripped the market as heightened geopolitical risks, a potential Portuguese banking crisis, and worries of U.S. Federal Reserve (Fed) tightening took center stage. Stocks rebounded in August as investors were emboldened by encouraging economic data, headlined by better-than-expected Gross Domestic Product (GDP) growth and signs that the housing recovery still had legs. In September, U.S. equities retreated for just the third month this year. Despite solid manufacturing and consumer confidence readings, the reality of quantitative easing ending and the prospect of higher federal funds rates in mid-2015 contributed to increased risk aversion levels. Stocks finished a volatile October at an all-time high on the heels of a positive earnings season and generally solid economic data.
Returns also varied noticeably by market-cap, as small and mid-cap stocks underperformed large-cap stocks. Small cap (+8%) stocks underperformed large cap stocks (+17%) during the period, as measured by the Russell 2000 Growth and S&P 500 Indices, respectively. Value (+16%) stocks performed in line with Growth (+16%) stocks during the period, as measured by the Russell 3000 Value and Russell 3000 Growth Indices. Seven out of ten sectors in the Russell 2000 Growth Index had positive returns during the period. The Healthcare (+22%), Consumer Staples (+14%), and Information Technology (+9%) sectors performed best, while Energy (-13%), Consumer Discretionary (-2%), and Utilities (0%) lagged on a relative basis.
Security selection was the primary driver of relative outperformance during the period. Positive security selection within Healthcare, Industrials, and Information Technology more than offset negative selection within the Consumer Staples and Energy sectors. Sector allocation, driven by our bottom-up stock selection, had a muted impact on relative returns during the period. Negative results from being underweight Healthcare and Consumer Staples were offset by our positioning in the Energy sector during the period. A modest cash position detracted in an upward trending market environment.
The top relative contributors to performance were Agios Pharmaceutical (Healthcare), Avis Budget (Industrials), and Puma Biotechnology (Healthcare). Shares of Agios Pharmaceutical, a biotech company with a focus on cancer metabolism and rare genetic disorders of metabolism, rose early in 2014 after the company reported strong enrollment trends and progress in reaching
The Hartford SmallCap Growth Fund
Manager Discussion – (continued)
October 31, 2014 (Unaudited)
clinical trial and drug approval milestones. Avis Budget, a rental car supplier, outperformed on continued recovery in its European business, along with the utilization impact from its new dynamic pricing tool that exceeded expectations. Shares of Puma Biotechnology, a development-stage biopharmaceutical company that acquires and develops products for the treatment of various forms of cancer, outperformed on positive clinical trial results for the company’s breast cancer drug. Top absolute contributors for the period also included SunEdison (Information Technology).
The top relative detractors included Intermune (Healthcare), Energy XXI (Energy), and Chart Industries (Industrials). Shares of Intermune, a biotech company focused on developing treatments for pulmonology and hepatology, rose after the announcement of a merger agreement with Roche. Not owning the strong performing benchmark-constituent weighed on relative returns. Shares of Energy XXI, an independent oil and natural gas exploration and production company, declined as the company recently reported lowered production numbers, largely driven by rig moves and platform construction. Chart Industries is a global manufacturer of equipment used in the production, storage, and end-use of hydrocarbon and industrial gas whose business is driven by backlog. Backlog trends have slowed causing investors to take a negative view on the stock. Top absolute detractors for the period also included Pier One Imports (Consumer Discretionary).
Derivatives are not used in a significant manner in this Fund and did not have a material impact on performance during the period.
What is the outlook?
We are seeing slowing growth in the emerging markets, Europe, and Latin America. Relatively speaking, the U.S. appears to be one of the strongest areas in the world right now. While growth may likely remain moderate, we believe the U.S. economy is on track for a self-sustaining expansion. We are seeing signs of a recovery in non-residential construction spending and capital expenditures, as well as a modest recovery in housing. Housing data has been choppy and the recovery is taking longer than we expected; however we continue to believe housing will be an important growth driver for the U.S. economy going forward. Home improvement spending has appeared quite strong. Oil prices appeared very weak recently given tepid global oil demand and growing supply. For us, the weakness in oil confirms a slowing rate of growth outside of the U.S. and has made us slightly more cautious than we were three months ago. In sum, we believe a 2.5 – 3% growth rate for the U.S. economy is achievable.
Overall, we continue to find stocks that we believe are attractively valued with the characteristics we seek. We are cautiously optimistic about the outlook for the U.S. economy and for equity markets, and we continue to monitor policy decisions and economic trends which may impact our holdings. At the end of the period, our largest overweight was to Healthcare while our largest underweights were to the Information Technology, Energy, and Telecommunication Services sectors relative to the Fund’s benchmark.
Diversification by Sector
as of October 31, 2014
| Sector | | Percentage of
Net Assets | |
| Equity Securities | | | | |
| Consumer Discretionary | | | 14.9 | % |
| Consumer Staples | | | 4.1 | |
| Energy | | | 2.8 | |
| Financials | | | 10.9 | |
| Health Care | | | 22.1 | |
| Industrials | | | 14.3 | |
| Information Technology | | | 23.4 | |
| Materials | | | 4.8 | |
| Services | | | 0.1 | |
| Total | | | 97.4 | % |
| Short-Term Investments | | | 1.9 | |
| Other Assets and Liabilities | | | 0.7 | |
| Total | | | 100.0 | % |
A sector may be comprised of several industries. For Fund compliance purposes, the Fund may not use the same classification system and these sector classifications are used for reporting ease.
The Hartford SmallCap Growth Fund
Schedule of Investments
October 31, 2014
(000’s Omitted)
| Shares or Principal Amount | | Market Value ╪ | |
| Common Stocks - 93.9% | | | | |
| | | | | Automobiles and Components - 1.6% | | | | |
| | 14 | | | Cooper Tire & Rubber Co. | | $ | 464 | |
| | 201 | | | Dana Holding Corp. | | | 4,118 | |
| | 6 | | | Gentherm, Inc. ● | | | 250 | |
| | 126 | | | Tenneco Automotive, Inc. ● | | | 6,596 | |
| | 11 | | | Tower International, Inc. ● | | | 258 | |
| | | | | | | | 11,686 | |
| | | | | Banks - 2.4% | | | | |
| | 210 | | | EverBank Financial Corp. | | | 4,026 | |
| | 171 | | | First Merchants Corp. | | | 3,868 | |
| | 84 | | | Flushing Financial Corp. | | | 1,695 | |
| | 76 | | | Great Western Bancorp, Inc. ● | | | 1,474 | |
| | 283 | | | MGIC Investment Corp. ● | | | 2,523 | |
| | 71 | | | Wintrust Financial Corp. | | | 3,286 | |
| | | | | | | | 16,872 | |
| | | | | Capital Goods - 8.8% | | | | |
| | 61 | | | A.O. Smith Corp. | | | 3,273 | |
| | 166 | | | AAON, Inc. | | | 3,257 | |
| | 118 | | | Altra Industrial Motion Corp. | | | 3,729 | |
| | 9 | | | American Railcar Industries, Inc. | | | 573 | |
| | 71 | | | Applied Industrial Technologies, Inc. | | | 3,462 | |
| | 9 | | | Argan, Inc. | | | 324 | |
| | 75 | | | Astronics Corp. ● | | | 3,865 | |
| | 78 | | | AZZ, Inc. | | | 3,640 | |
| | 18 | | | Blount International, Inc. ● | | | 276 | |
| | 68 | | | Chart Industries, Inc. ● | | | 3,169 | |
| | 20 | | | Enphase Energy, Inc. ● | | | 306 | |
| | 28 | | | Esterline Technologies Corp. ● | | | 3,270 | |
| | 85 | | | Generac Holdings, Inc. ● | | | 3,869 | |
| | 17 | | | Global Brass & Copper Holdings, Inc. | | | 232 | |
| | 6 | | | Gorman Rupp Co. | | | 181 | |
| | 64 | | | Heico Corp. | | | 3,445 | |
| | 11 | | | Hyster-Yale Materials Handling, Inc. | | | 863 | |
| | 52 | | | Lennox International, Inc. | | | 4,599 | |
| | 62 | | | Meritor, Inc. ● | | | 710 | |
| | 74 | | | Moog, Inc. Class A ● | | | 5,646 | |
| | 7 | | | Polypore International, Inc. ● | | | 307 | |
| | 12 | | | Proto Laboratories, Inc. ● | | | 811 | |
| | 4 | | | Standex International Corp. | | | 328 | |
| | 46 | | | Sun Hydraulics Corp. | | | 1,831 | |
| | 38 | | | Taser International, Inc. ● | | | 720 | |
| | 47 | | | Teledyne Technologies, Inc. ● | | | 4,832 | |
| | 58 | | | Toro Co. | | | 3,601 | |
| | 26 | | | Trex Co., Inc. ● | | | 1,101 | |
| | 6 | | | Woodward, Inc. | | | 312 | |
| | 12 | | | Xerium Technologies, Inc. ● | | | 173 | |
| | | | | | | | 62,705 | |
| | | | | Commercial and Professional Services - 3.5% | | | | |
| | 10 | | | Barrett Business Services, Inc. | | | 242 | |
| | 38 | | | Brink's Co. | | | 806 | |
| | 109 | | | Deluxe Corp. | | | 6,648 | |
| | 39 | | | Enernoc, Inc. ● | | | 582 | |
| | 58 | | | Exponent, Inc. | | | 4,643 | |
| | 114 | | | GP Strategies Corp. ● | | | 3,777 | |
| | 24 | | | Korn/Ferry International ● | | | 656 | |
| | 116 | | | On Assignment, Inc. ● | | | 3,367 | |
| | 21 | | | Performant Financial Corp. ● | | | 179 | |
| | 37 | | | RPX Corp. ● | | | 514 | |
| | 10 | | | Sykes Enterprises, Inc. ● | | | 220 | |
| | 26 | | | TrueBlue, Inc. ● | | | 638 | |
| | 6 | | | UniFirst Corp. | | | 681 | |
| | 39 | | | Wageworks, Inc. ● | | | 2,202 | |
| | | | | | | | 25,155 | |
| | | | | Consumer Durables and Apparel - 3.2% | | | | |
| | 90 | | | Arctic Cat, Inc. | | | 3,033 | |
| | 19 | | | Ethan Allen Interiors, Inc. | | | 538 | |
| | 3 | | | Helen of Troy Ltd. ● | | | 204 | |
| | 127 | | | Kate Spade & Co. ● | | | 3,457 | |
| | 7 | | | Polaris Industries, Inc. | | | 1,113 | |
| | 224 | | | Quiksilver, Inc. ● | | | 392 | |
| | 16 | | | Skechers USA, Inc. Class A ● | | | 849 | |
| | 161 | | | Steven Madden Ltd. ● | | | 5,032 | |
| | 111 | | | Taylor Morrison Home Corp. ● | | | 1,908 | |
| | 26 | | | Vera Bradley, Inc. ● | | | 600 | |
| | 161 | | | Vince Holding Corp. ● | | | 5,651 | |
| | | | | | | | 22,777 | |
| | | | | Consumer Services - 5.1% | | | | |
| | 8 | | | American Public Education, Inc. ● | | | 248 | |
| | 293 | | | Bloomin' Brands, Inc. ● | | | 5,544 | |
| | 9 | | | Bridgepoint Education, Inc. ● | | | 110 | |
| | 69 | | | Brinker International, Inc. | | | 3,699 | |
| | 40 | | | Buffalo Wild Wings, Inc. ● | | | 5,934 | |
| | 12 | | | Capella Education Co. | | | 877 | |
| | 17 | | | Cheesecake Factory, Inc. | | | 772 | |
| | 130 | | | Del Frisco's Restaurant Group, Inc. ● | | | 3,025 | |
| | 18 | | | Domino's Pizza, Inc. | | | 1,563 | |
| | 10 | | | Grand Canyon Education, Inc. ● | | | 455 | |
| | 23 | | | Hillenbrand, Inc. | | | 772 | |
| | 174 | | | Ignite Restaurant Group, Inc. ● | | | 1,198 | |
| | 12 | | | ITT Educational Services, Inc. ● | | | 117 | |
| | 24 | | | K12, Inc. ● | | | 303 | |
| | 71 | | | Marriott Vacations Worldwide Corp. | | | 4,904 | |
| | 18 | | | Outerwall, Inc. ● | | | 1,151 | |
| | 85 | | | Sotheby's Holdings | | | 3,366 | |
| | 12 | | | Strayer Education, Inc. ● | | | 842 | |
| | 38 | | | Texas Roadhouse, Inc. | | | 1,094 | |
| | | | | | | | 35,974 | |
| | | | | Diversified Financials - 1.6% | | | | |
| | 39 | | | BGC Partners, Inc. | | | 332 | |
| | 6 | | | Credit Acceptance Corp. ● | | | 915 | |
| | 57 | | | Evercore Partners, Inc. | | | 2,966 | |
| | 130 | | | HFF, Inc. | | | 4,098 | |
| | 9 | | | Marcus & Millichap, Inc. ● | | | 289 | |
| | 28 | | | Portfolio Recovery Associates, Inc. ● | | | 1,765 | |
| | 19 | | | RCS Capital Corp-Class A | | | 318 | |
| | 6 | | | World Acceptance Corp. ● | | | 451 | |
| | | | | | | | 11,134 | |
| | | | | Energy - 2.8% | | | | |
| | 121 | | | Abraxas Petroleum Corp. ● | | | 499 | |
| | 19 | | | Basic Energy Services, Inc. ● | | | 240 | |
| | 17 | | | Carrizo Oil & Gas, Inc. ● | | | 899 | |
| | 5 | | | Clayton Williams Energy, Inc. ● | | | 374 | |
| | 5 | | | CVR Energy, Inc. | | | 257 | |
| | 39 | | | Diamondback Energy, Inc. ● | | | 2,668 | |
| | 86 | | | Forum Energy Technologies, Inc. ● | | | 2,355 | |
| | 9 | | | Geospace Technologies Corp. ● | | | 268 | |
| | 7 | | | Green Plains, Inc. | | | 222 | |
| | 102 | | | ION Geophysical Corp. ● | | | 285 | |
| | 129 | | | Jones Energy, Inc. ● | | | 1,590 | |
| | 43 | | | Newpark Resources, Inc. ● | | | 495 | |
| | 13 | | | Pacific Ethanol, Inc. ● | | | 188 | |
The accompanying notes are an integral part of these financial statements.
The Hartford SmallCap Growth Fund
Schedule of Investments – (continued)
October 31, 2014
(000’s Omitted)
| Shares or Principal Amount | | Market Value ╪ | |
| Common Stocks - 93.9% - (continued) | | | | |
| | | | | Energy - 2.8% - (continued) | | | | |
| | 71 | | | PBF Energy, Inc. | | $ | 1,859 | |
| | 22 | | | Pioneer Energy Services Corp. ● | | | 203 | |
| | 76 | | | Quicksilver Resources, Inc. ● | | | 42 | |
| | 5 | | | REX American Resources Corp. ● | | | 335 | |
| | 76 | | | Rosetta Resources, Inc. ● | | | 2,875 | |
| | 139 | | | RSP Permian, Inc. ● | | | 3,402 | |
| | 63 | | | Vaalco Energy, Inc. ● | | | 466 | |
| | 19 | | | W&T Offshore, Inc. | | | 176 | |
| | | | | | | | 19,698 | |
| | | | | Food and Staples Retailing - 2.2% | | | | |
| | 10 | | | Andersons (The), Inc. | | | 605 | |
| | 86 | | | Casey's General Stores, Inc. | | | 7,074 | |
| | 57 | | | Diplomat Pharmacy, Inc. ● | | | 1,226 | |
| | 9 | | | Fresh Market, Inc. ● | | | 312 | |
| | 149 | | | Natural Grocers by Vitamin Cottage, Inc. ● | | | 2,705 | |
| | 40 | | | PriceSmart, Inc. | | | 3,602 | |
| | 53 | | | Rite Aid Corp. ● | | | 276 | |
| | | | | | | | 15,800 | |
| | | | | Food, Beverage and Tobacco - 1.1% | | | | |
| | 4 | | | Cal-Maine Foods, Inc. | | | 316 | |
| | 3 | | | J&J Snack Foods Corp. | | | 278 | |
| | 35 | | | Pilgrim's Pride Corp. ● | | | 989 | |
| | 9 | | | Sanderson Farms, Inc. | | | 773 | |
| | 67 | | | TreeHouse Foods, Inc. ● | | | 5,739 | |
| | | | | | | | 8,095 | |
| | | | | Health Care Equipment and Services - 9.7% | | | | |
| | 10 | | | Addus Homecare Corp. ● | | | 191 | |
| | 14 | | | Align Technology, Inc. ● | | | 717 | |
| | 17 | | | Anika Therapeutics, Inc. ● | | | 690 | |
| | 10 | | | Atrion Corp. | | | 3,242 | |
| | 20 | | | Centene Corp. ● | | | 1,828 | |
| | 9 | | | Computer Programs & Systems, Inc. | | | 573 | |
| | 93 | | | Corvel Corp. ● | | | 3,212 | |
| | 67 | | | Cyberonics, Inc. ● | | | 3,495 | |
| | 151 | | | Dexcom, Inc. ● | | | 6,804 | |
| | 246 | | | Globus Medical, Inc. ● | | | 5,458 | |
| | 157 | | | HealthSouth Corp. | | | 6,336 | |
| | 26 | | | Heartware International, Inc. ● | | | 2,027 | |
| | 20 | | | HMS Holdings Corp. ● | | | 474 | |
| | 62 | | | ICU Medical, Inc. ● | | | 4,417 | |
| | 21 | | | Magellan Health, Inc. ● | | | 1,259 | |
| | 12 | | | Molina Healthcare, Inc. ● | | | 569 | |
| | 6 | | | Natus Medical, Inc. ● | | | 204 | |
| | 115 | | | Omnicell, Inc. ● | | | 3,710 | |
| | 30 | | | Orthofix International N.V. ● | | | 877 | |
| | 69 | | | Quality Systems, Inc. | | | 1,044 | |
| | 43 | | | Radnet, Inc. ● | | | 399 | |
| | 103 | | | Team Health Holdings ● | | | 6,473 | |
| | 28 | | | Triple-S Management Corp., Class B ● | | | 609 | |
| | 119 | | | U.S. Physical Therapy, Inc. | | | 5,119 | |
| | 191 | | | Vascular Solutions, Inc. ● | | | 5,630 | |
| | 55 | | | Wellcare Health Plans, Inc. ● | | | 3,699 | |
| | | | | | | | 69,056 | |
| | | | | Household and Personal Products - 0.8% | | | | |
| | 8 | | | Medifast, Inc. ● | | | 251 | |
| | 139 | | | Prestige Brands Holdings, Inc. ● | | | 4,917 | |
| | 6 | | | Usana Health Sciences, Inc. ● | | | 729 | |
| | | | | | | | 5,897 | |
| | | | | Insurance - 1.1% | | | | |
| | 103 | | | Amerisafe, Inc. | | | 4,302 | |
| | 13 | | | AmTrust Financial Services, Inc. | | | 582 | |
| | 27 | | | Greenlight Capital Re Ltd. Class A ● | | | 863 | |
| | 38 | | | Maiden Holdings Ltd. | | | 449 | |
| | 31 | | | Montpelier Re Holdings Ltd. | | | 1,017 | |
| | 20 | | | United Insurance Holdings Corp. | | | 398 | |
| | 28 | | | Universal Insurance Holdings, Inc. | | | 494 | |
| | | | | | | | 8,105 | |
| | | | | Materials - 4.8% | | | | |
| | 20 | | | Berry Plastics Group, Inc. ● | | | 515 | |
| | 65 | | | Cabot Corp. | | | 3,019 | |
| | 17 | | | Clearwater Paper Corp. ● | | | 1,068 | |
| | 34 | | | Flotek Industries, Inc. ● | | | 754 | |
| | 18 | | | FutureFuel Corp. | | | 238 | |
| | 9 | | | Globe Specialty Metals, Inc. | | | 177 | |
| | 77 | | | Gold Resource Corp. | | | 300 | |
| | 534 | | | Graphic Packaging Holding Co. ● | | | 6,478 | |
| | 332 | | | Headwaters, Inc. ● | | | 4,221 | |
| | 16 | | | Olin Corp. | | | 378 | |
| | 343 | | | Omnova Solutions, Inc. ● | | | 2,408 | |
| | 73 | | | Orion Engineered Carbons S. A. ● | | | 1,108 | |
| | 11 | | | P.H. Glatfelter Co. | | | 285 | |
| | 186 | | | PolyOne Corp. | | | 6,879 | |
| | 5 | | | Schweitzer-Mauduit International, Inc. | | | 198 | |
| | 72 | | | Silgan Holdings, Inc. | | | 3,539 | |
| | 6 | | | Stepan Co. | | | 257 | |
| | 86 | | | Stillwater Mining Co. ● | | | 1,124 | |
| | 21 | | | US Silica Holdings, Inc. | | | 925 | |
| | | | | | | | 33,871 | |
| | | | | Media - 0.4% | | | | |
| | 81 | | | DreamWorks Animation SKG, Inc. ● | | | 1,794 | |
| | 18 | | | Eros International plc ● | | | 328 | |
| | 29 | | | McClatchy Co. Class A ● | | | 104 | |
| | 5 | | | Shutterstock, Inc. ● | | | 373 | |
| | | | | | | | 2,599 | |
| | | | | Pharmaceuticals, Biotechnology and Life Sciences - 12.4% | | | | |
| | 50 | | | Achillion Pharmaceuticals, Inc. ● | | | 586 | |
| | 81 | | | Acorda Therapeutics, Inc. ● | | | 2,835 | |
| | 110 | | | Aerie Pharmaceuticals, Inc. ● | | | 2,778 | |
| | 69 | | | Affymetrix, Inc. ● | | | 625 | |
| | 54 | | | Agios Pharmaceuticals, Inc. ● | | | 4,564 | |
| | 9 | | | Akorn, Inc. ● | | | 392 | |
| | 76 | | | Alkermes plc ● | | | 3,862 | |
| | 45 | | | Alnylam Pharmaceuticals, Inc. ● | | | 4,189 | |
| | 119 | | | Anacor Pharmaceuticals, Inc. ● | | | 3,496 | |
| | 162 | | | Arena Pharmaceuticals, Inc. ● | | | 704 | |
| | 193 | | | Bruker Corp. ● | | | 3,993 | |
| | 17 | | | Cambrex Corp. ● | | | 356 | |
| | 8 | | | Cumberland Pharmaceuticals, Inc. ● | | | 40 | |
| | 88 | | | DepoMed, Inc. ● | | | 1,349 | |
| | 155 | | | Durata Therapeutics, Inc. ● | | | 3,734 | |
| | 27 | | | Dyax Corp. ● | | | 334 | |
| | 38 | | | Emergent Biosolutions, Inc. ● | | | 860 | |
| | 472 | | | Exelixis, Inc. ● | | | 802 | |
| | 110 | | | Five Prime Therapeutics, Inc. ● | | | 1,432 | |
| | 103 | | | Glycomimetics, Inc. ● | | | 736 | |
| | 121 | | | Hyperion Therapeutics, Inc. ● | | | 2,932 | |
| | 131 | | | Immunogen, Inc. ● | | | 1,209 | |
| | 16 | | | Impax Laboratories, Inc. ● | | | 463 | |
| | 16 | | | Insys Therapeutics, Inc. ● | | | 639 | |
| | 147 | | | Ironwood Pharmaceuticals, Inc. ● | | | 2,065 | |
The accompanying notes are an integral part of these financial statements.
The Hartford SmallCap Growth Fund
Schedule of Investments – (continued)
October 31, 2014
(000’s Omitted)
| Shares or Principal Amount | | Market Value ╪ | |
| Common Stocks - 93.9% - (continued) | | | | |
| | | | | Pharmaceuticals, Biotechnology and Life Sciences - 12.4% - (continued) | | | | |
| | 21 | | | Isis Pharmaceuticals, Inc. ● | | $ | 986 | |
| | 19 | | | Lannet, Inc. ● | | | 1,055 | |
| | 16 | | | Ligand Pharmaceuticals, Inc. Class B ● | | | 902 | |
| | 125 | | | Medicines Co. ● | | | 3,158 | |
| | 69 | | | Merrimack Pharmaceuticals, Inc. ● | | | 636 | |
| | 66 | | | Nektar Therapeutics ● | | | 909 | |
| | 88 | | | Northwest Biotherapeutics, Inc. ● | | | 465 | |
| | 135 | | | NPS Pharmaceuticals, Inc. ● | | | 3,700 | |
| | 31 | | | Omeros Corp. ● | | | 517 | |
| | 19 | | | Ophthotech Corp. ● | | | 776 | |
| | 55 | | | Pacific Biosciences of California ● | | | 360 | |
| | 115 | | | PAREXEL International Corp. ● | | | 6,230 | |
| | 178 | | | PDL Biopharma, Inc. | | | 1,522 | |
| | 82 | | | Portola Pharmaceuticals, Inc. ● | | | 2,324 | |
| | 52 | | | Pozen, Inc. | | | 472 | |
| | 9 | | | Prothena Corp. plc ● | | | 206 | |
| | 62 | | | PTC Therapeutics, Inc. ● | | | 2,523 | |
| | 22 | | | Puma Biotechnology, Inc. ● | | | 5,577 | |
| | 46 | | | Repligen Corp. ● | | | 1,155 | |
| | 8 | | | Sagent Pharmaceuticals, Inc. ● | | | 263 | |
| | 13 | | | Salix Pharmaceuticals Ltd. ● | | | 1,806 | |
| | 19 | | | Sangamo BioSciences, Inc. ● | | | 234 | |
| | 103 | | | Sciclone Pharmaceuticals, Inc. ● | | | 783 | |
| | 59 | | | Synta Pharmaceuticals Corp. ● | | | 175 | |
| | 76 | | | Tesaro, Inc. ● | | | 2,102 | |
| | 48 | | | Ultragenyx Pharmaceutical, Inc. ● | | | 2,244 | |
| | 225 | | | Xenoport, Inc. ● | | | 1,526 | |
| | 49 | | | XOMA Corp. ● | | | 212 | |
| | | | | | | | 87,793 | |
| | | | | Real Estate - 2.3% | | | | |
| | 70 | | | Altisource Residential Corp. | | | 1,627 | |
| | 51 | | | Apollo Residential Mortgage, Inc. REIT | | | 856 | |
| | 83 | | | Coresite Realty Corp. REIT | | | 3,078 | |
| | 19 | | | Inland Real Estate Corp. REIT | | | 197 | |
| | 11 | | | National Health Investors, Inc. REIT | | | 692 | |
| | 35 | | | Potlatch Corp. REIT | | | 1,531 | |
| | 123 | | | Ramco-Gershenson Properties Trust REIT | | | 2,158 | |
| | 50 | | | Sabra Healthcare REIT, Inc. | | | 1,420 | |
| | 42 | | | St. Joe Co. ● | | | 795 | |
| | 262 | | | Sunstone Hotel Investors, Inc. REIT | | | 4,018 | |
| | | | | | | | 16,372 | |
| | | | | Retailing - 4.6% | | | | |
| | 22 | | | ANN, Inc. ● | | | 852 | |
| | 34 | | | Buckle (The), Inc. | | | 1,687 | |
| | 11 | | | Burlington Stores, Inc. ● | | | 444 | |
| | 8 | | | Cato Corp. | | | 271 | |
| | 101 | | | Core-Mark Holding Co., Inc. | | | 5,871 | |
| | 120 | | | DSW, Inc. | | | 3,554 | |
| | 25 | | | Finish Line (The), Inc. | | | 672 | |
| | 100 | | | Five Below, Inc. ● | | | 3,986 | |
| | 64 | | | Francescas Holding Corp. ● | | | 759 | |
| | 4 | | | Hibbett Sports, Inc. ● | | | 177 | |
| | 88 | | | HSN, Inc. | | | 5,830 | |
| | 16 | | | Kirklands, Inc. ● | | | 287 | |
| | 78 | | | Nutrisystem, Inc. | | | 1,320 | |
| | 23 | | | Overstock.com, Inc. ● | | | 529 | |
| | 309 | | | Pier 1 Imports, Inc. | | | 3,984 | |
| | 41 | | | Select Comfort Corp. ● | | | 1,056 | |
| | 46 | | | Wayfair, Inc. ● | | | 1,150 | |
| | | | | | | | 32,429 | |
| | | | | Semiconductors and Semiconductor Equipment - 3.1% | | | | |
| | 14 | | | Ambarella, Inc. ● | | | 609 | |
| | 40 | | | Amkor Technology, Inc. ● | | | 272 | |
| | 33 | | | Cirrus Logic, Inc. ● | | | 629 | |
| | 88 | | | Integrated Device Technology, Inc. ● | | | 1,440 | |
| | 65 | | | Kulicke & Soffa Industries, Inc. ● | | | 940 | |
| | 106 | | | Lattice Semiconductor Corp. ● | | | 709 | |
| | 145 | | | Nanometrics, Inc. ● | | | 1,965 | |
| | 35 | | | Rambus, Inc. ● | | | 405 | |
| | 95 | | | RF Micro Devices, Inc. ● | | | 1,232 | |
| | 118 | | | Silicon Image, Inc. ● | | | 635 | |
| | 29 | | | Spansion, Inc. Class A ● | | | 597 | |
| | 84 | | | SunEdison Semiconductor Ltd. ● | | | 1,624 | |
| | 240 | | | SunEdison, Inc. ● | | | 4,677 | |
| | 96 | | | SunPower Corp. ● | | | 3,067 | |
| | 11 | | | Synaptics, Inc. ● | | | 753 | |
| | 14 | | | Tessera Technologies, Inc. | | | 428 | |
| | 104 | | | Ultratech Stepper, Inc. ● | | | 1,988 | |
| | | | | | | | 21,970 | |
| | | | | Software and Services - 17.7% | | | | |
| | 95 | | | Angie's List, Inc. ● | | | 659 | |
| | 172 | | | Aspen Technology, Inc. ● | | | 6,343 | |
| | 62 | | | AVG Technologies N.V. ● | | | 1,107 | |
| | 138 | | | Bankrate, Inc. ● | | | 1,497 | |
| | 45 | | | CACI International, Inc. Class A ● | | | 3,670 | |
| | 292 | | | Carbonite, Inc. ● | | | 3,193 | |
| | 78 | | | Cass Information Systems, Inc. | | | 3,701 | |
| | 41 | | | CSG Systems International, Inc. | | | 1,079 | |
| | 54 | | | Cvent, Inc. ● | | | 1,402 | |
| | 35 | | | Demandware, Inc. ● | | | 2,107 | |
| | 63 | | | Digital River, Inc. ● | | | 1,616 | |
| | 145 | | | Ellie Mae, Inc. ● | | | 5,566 | |
| | 24 | | | Envestnet, Inc. ● | | | 1,048 | |
| | 8 | | | EPAM Systems, Inc. ● | | | 363 | |
| | 65 | | | ePlus, Inc. ● | | | 3,957 | |
| | 70 | | | Everyday Health, Inc. ● | | | 960 | |
| | 123 | | | Exlservice Holdings, Inc. ● | | | 3,430 | |
| | 79 | | | Fair Isaac, Inc. | | | 4,935 | |
| | 383 | | | Five9, Inc. ● | | | 1,687 | |
| | 159 | | | Fleetmatics Group Ltd. ● | | | 5,896 | |
| | 114 | | | Global Cash Access, Inc. ● | | | 830 | |
| | 106 | | | Heartland Payment Systems, Inc. | | | 5,489 | |
| | 9 | | | iGate Corp. ● | | | 315 | |
| | 21 | | | Infoblox, Inc. ● | | | 345 | |
| | 99 | | | j2 Global, Inc. | | | 5,330 | |
| | 72 | | | Jive Software, Inc. ● | | | 442 | |
| | 27 | | | Logmein, Inc. ● | | | 1,288 | |
| | 187 | | | Manhattan Associates, Inc. ● | | | 7,493 | |
| | 93 | | | Marketo, Inc. ● | | | 2,990 | |
| | 262 | | | Model N, Inc. ● | | | 2,559 | |
| | 104 | | | Netscout Systems, Inc. ● | | | 3,843 | |
| | 10 | | | NIC, Inc. | | | 186 | |
| | 59 | | | Pegasystems, Inc. | | | 1,268 | |
| | 168 | | | PTC, Inc. ● | | | 6,403 | |
| | 88 | | | Qualys, Inc. ● | | | 2,820 | |
| | 245 | | | Sapient Corp. ● | | | 4,235 | |
| | 9 | | | Solarwinds, Inc. ● | | | 409 | |
| | 59 | | | Solera Holdings, Inc. | | | 3,048 | |
The accompanying notes are an integral part of these financial statements.
The Hartford SmallCap Growth Fund
Schedule of Investments – (continued)
October 31, 2014
(000’s Omitted)
| Shares or Principal Amount | | Market Value ╪ | |
| Common Stocks - 93.9% - (continued) | | | | |
| | | | | Software and Services - 17.7% - (continued) | | | | |
| | 25 | | | SS&C Technologies Holdings, Inc. ● | | $ | 1,227 | |
| | 6 | | | Stamps.com, Inc. ● | | | 218 | |
| | 4 | | | Syntel, Inc. ● | | | 338 | |
| | 56 | | | Take-Two Interactive Software, Inc. ● | | | 1,481 | |
| | 65 | | | Tyler Corp. ● | | | 7,266 | |
| | 44 | | | VASCO Data Security International, Inc. ● | | | 1,111 | |
| | 5 | | | Verint Systems, Inc. ● | | | 299 | |
| | 109 | | | WebMD Health Corp. ● | | | 4,658 | |
| | 46 | | | WEX, Inc. ● | | | 5,257 | |
| | 11 | | | Zendesk, Inc. ● | | | 294 | |
| | | | | | | | 125,658 | |
| | | | | Technology Hardware and Equipment - 2.6% | | | | |
| | 23 | | | Alliance Fiber Optic Product, Inc. | | | 291 | |
| | 192 | | | Aruba Networks, Inc. ● | | | 4,142 | |
| | 134 | | | CDW Corp. of Delaware | | | 4,138 | |
| | 24 | | | Clearfield, Inc. ● | | | 358 | |
| | 11 | | | Comtech Telecommunications Corp. | | | 425 | |
| | 51 | | | FEI Co. | | | 4,333 | |
| | 22 | | | Polycom, Inc. ● | | | 292 | |
| | 388 | | | Sonus Networks, Inc. ● | | | 1,347 | |
| | 82 | | | Ubiquiti Networks, Inc. | | | 2,919 | |
| | | | | | | | 18,245 | |
| | | | | Telecommunication Services - 0.1% | | | | |
| | 22 | | | IDT Corp. Class B | | | 361 | |
| | 41 | | | Inteliquent, Inc. | | | 690 | |
| | | | | | | | 1,051 | |
| | | | | Transportation - 2.0% | | | | |
| | 8 | | | Alaska Air Group, Inc. | | | 426 | |
| | 5 | | | Allegiant Travel Co. | | | 627 | |
| | 17 | | | ArcBest Corp. | | | 662 | |
| | 126 | | | Celadon Group, Inc. | | | 2,449 | |
| | 43 | | | Hawaiian Holdings, Inc. ● | | | 746 | |
| | 114 | | | Marten Transport Ltd. | | | 2,239 | |
| | 15 | | | Matson, Inc. | | | 416 | |
| | 17 | | | SkyWest, Inc. | | | 193 | |
| | 19 | | | Spirit Airlines, Inc. ● | | | 1,396 | |
| | 201 | | | Swift Transportation Co. ● | | | 4,968 | |
| | | | | | | | 14,122 | |
| | | | | Total Common Stocks | | | | |
| | | | | (Cost $567,513) | | $ | 667,064 | |
| | | | | | | | | |
| Exchange Traded Funds - 3.5% | | | | |
| | | | | Other Investment Pools and Funds - 3.5% | | | | |
| | 178 | | | iShares Russell 2000 Growth ETF | | $ | 24,537 | |
| | | | | | | | | |
| | | | | Total Exchange Traded Funds | | | | |
| | | | | (Cost $23,397) | | $ | 24,537 | |
| | | | | | | | | |
| | | | | Total Long-Term Investments | | | | |
| | | | | (Cost $590,910) | | $ | 691,601 | |
| | | | | | | | | |
| Short-Term Investments - 1.9% | | | | |
| Repurchase Agreements - 1.9% | | | | |
| | | | | Bank of America Merrill Lynch TriParty Repurchase
Agreement (maturing on 11/03/2014 in the
amount of $38, collateralized by U.S. Treasury
Note 1.50%, 2019, value of $39) | | | | |
| $ | 38 | | | 0.08%, 10/31/2014 | | $ | 38 | |
| | | | | Bank of America Merrill Lynch TriParty Repurchase
Agreement (maturing on 11/03/2014 in the
amount of $647, collateralized by GNMA 1.63%
- 7.00%, 2031 - 2054, value of $660) | | | | |
| | 647 | | | 0.09%, 10/31/2014 | | | 647 | |
| | | | | Bank of Montreal TriParty Repurchase Agreement
(maturing on 11/03/2014 in the amount of $174,
collateralized by U.S. Treasury Bond 2.88% -
5.25%, 2029 - 2043, U.S. Treasury Note 0.38% -
4.50%, 2015 - 2022, value of $177) | | | | |
| | 174 | | | 0.08%, 10/31/2014 | | | 174 | |
| | | | | Bank of Montreal TriParty Repurchase Agreement
(maturing on 11/03/2014 in the amount of $589,
collateralized by FHLMC 2.00% - 5.50%, 2022 -
2034, FNMA 2.00% - 4.50%, 2024 - 2039,
GNMA 3.00%, 2043, U.S. Treasury Note 4.63%,
2017, value of $601) | | | | |
| | 589 | | | 0.10%, 10/31/2014 | | | 589 | |
| | | | | Barclays Capital TriParty Repurchase Agreement
(maturing on 11/03/2014 in the amount of
$2,221, collateralized by U.S. Treasury Bond
4.50% - 6.25%, 2023 - 2036, U.S. Treasury Note
1.63% - 2.13%, 2015 - 2019, value of $2,265) | | | | |
| | 2,221 | | | 0.08%, 10/31/2014 | | | 2,221 | |
| | | | | Citigroup Global Markets, Inc. TriParty Repurchase
Agreement (maturing on 11/03/2014 in the
amount of $2,552, collateralized by U.S.
Treasury Bill 0.02%, 2015, U.S. Treasury Bond
3.88% - 11.25%, 2015 - 2040, U.S. Treasury
Note 2.00% - 3.38%, 2019 - 2021, value of
$2,603) | | | | |
| | 2,552 | | | 0.09%, 10/31/2014 | | | 2,552 | |
| | | | | Deutsche Bank Securities TriParty Repurchase
Agreement (maturing on 11/03/2014 in the
amount of $147, collateralized by U.S. Treasury
Note 0.88%, 2017, value of $150) | | | | |
| | 147 | | | 0.13%, 10/31/2014 | | | 147 | |
| | | | | RBS Securities, Inc. TriParty Repurchase
Agreement (maturing on 11/03/2014 in the
amount of $217, collateralized by U.S. Treasury
Bond 3.63% - 5.00%, 2037 - 2043, U.S.
Treasury Note 2.13%, 2020, value of $221) | | | | |
| | 217 | | | 0.07%, 10/31/2014 | | | 217 | |
| | | | | Societe Generale TriParty Repurchase Agreement
(maturing on 11/03/2014 in the amount of
$2,285, collateralized by U.S. Treasury Bill
0.02%, 2015, U.S. Treasury Bond 3.75% -
11.25%, 2015 - 2043, U.S. Treasury Note 1.38%
- 4.25%, 2015 - 2022, value of $2,331) | | | | |
| | 2,285 | | | 0.08%, 10/31/2014 | | | 2,285 | |
The accompanying notes are an integral part of these financial statements.
The Hartford SmallCap Growth Fund
Schedule of Investments – (continued)
October 31, 2014
(000’s Omitted)
| Shares or Principal Amount | | | | | Market Value ╪ | |
| Short-Term Investments - 1.9% - (continued) | | | | | | | | |
| Repurchase Agreements - 1.9% - (continued) | | | | | | | | |
| | | | | TD Securities TriParty Repurchase Agreement
(maturing on 11/03/2014 in the amount of
$4,428, collateralized by FHLMC 3.00% - 4.00%,
2026 - 2044, FNMA 2.50% - 5.00%, 2025 -
2044, U.S. Treasury Bond 3.50% - 6.50%, 2026
- 2041, U.S. Treasury Note 1.75% - 2.88%, 2018
- 2019, value of $4,516) | | | | | | | | |
| $ | 4,428 | | | 0.10%, 10/31/2014 | | | | | | $ | 4,428 | |
| | | | | | | | | | | | 13,298 | |
| | | | | Total Short-Term Investments | | | | | | | | |
| | | | | (Cost $13,298) | | | | | | $ | 13,298 | |
| | | | | | | | | | | | | |
| | | | | Total Investments | | | | | | | | |
| | | | | (Cost $604,208) ▲ | | | 99.3 | % | | $ | 704,899 | |
| | | | | Other Assets and Liabilities | | | 0.7 | % | | | 5,139 | |
| | | | | Total Net Assets | | | 100.0 | % | | $ | 710,038 | |
The accompanying notes are an integral part of these financial statements.
The Hartford SmallCap Growth Fund
Schedule of Investments – (continued)
October 31, 2014
(000’s Omitted)
Note: Percentage of investments as shown is the ratio of the total market value to total net assets.
Other than the industry classifications "Other Investment Pools and Funds" and "Exchange Traded Funds," equity industry classifications used in this report are the Global Industry Classification Standard, which was developed by and is the exclusive property and service mark of MSCI, Inc. and Standard & Poor’s.
For Fund compliance purposes, the Fund may not use the same classification system shown in this report as these classifications are used for reporting ease.
| ▲ | At October 31, 2014, the cost of securities for federal income tax purposes was $606,855 and the aggregate gross unrealized appreciation and depreciation based on that cost were: |
| Unrealized Appreciation | | $ | 128,441 | |
| Unrealized Depreciation | | | (30,397 | ) |
| Net Unrealized Appreciation | | $ | 98,044 | |
| ╪ | See Significant Accounting Policies of accompanying Notes to Financial Statements regarding valuation of securities. |
| GLOSSARY: (abbreviations used in preceding Schedule of Investments) |
| |
| Other Abbreviations: |
| ETF | Exchange Traded Fund |
| FHLMC | Federal Home Loan Mortgage Corp. |
| FNMA | Federal National Mortgage Association |
| GNMA | Government National Mortgage Association |
| REIT | Real Estate Investment Trust |
The accompanying notes are an integral part of these financial statements.
The Hartford SmallCap Growth Fund
Schedule of Investments – (continued)
October 31, 2014
(000’s Omitted)
Investment Valuation Hierarchy Level Summary
October 31, 2014
| | | Total | | | Level 1 ♦ | | | Level 2 ♦ | | | Level 3 | |
| Assets: | | | | | | | | | | | | | | | | |
| Common Stocks ‡ | | $ | 667,064 | | | $ | 667,064 | | | $ | – | | | $ | – | |
| Exchange Traded Funds | | | 24,537 | | | | 24,537 | | | | – | | | | – | |
| Short-Term Investments | | | 13,298 | | | | – | | | | 13,298 | | | | – | |
| Total | | $ | 704,899 | | | $ | 691,601 | | | $ | 13,298 | | | $ | – | |
| ♦ | For the year ended October 31, 2014, there were no transfers between Level 1 and Level 2. |
| ‡ | The Fund has all or primarily all of the equity securities categorized in a particular level. Refer to the Schedule of Investments for further industry breakout. |
Following is a reconciliation of Level 3 assets for which significant unobservable inputs were used to determine fair value:
| | | Balance as
of October
31, 2013 | | | Realized
Gain (Loss) | | | Change in
Unrealized
Appreciation
(Depreciation) | | | Net
Amortization | | | Purchases | | | Sales | | | Transfers
Into
Level 3 * | | | Transfers
Out of
Level 3 * | | | Balance as
of October
31, 2014 | |
| Assets: | | | | | | | | | | | | | | | | | | | | | | | | | | | | | | | | | | | | |
| Common Stocks | | $ | 32 | | | $ | 1,424 | | | $ | 576 | | | $ | — | | | $ | 325 | | | $ | (3,402 | ) | | $ | 1,045 | | | $ | — | | | $ | — | |
| Total | | $ | 32 | | | $ | 1,424 | | | $ | 576 | | | $ | — | | | $ | 325 | | | $ | (3,402 | ) | | $ | 1,045 | | | $ | — | | | $ | — | |
| * | Investments are transferred into and out of Level 3 for a variety of reasons including, but not limited to: |
| | | 1) | Investments where trading has been halted (transfer into Level 3) or investments where trading has resumed (transfer out of Level 3). |
| | | 2) | Broker quoted investments (transfer into Level 3) or quoted prices in active markets (transfer out of Level 3). |
| | | 3) | Investments that have certain restrictions on trading (transfer into Level 3) or investments where trading restrictions have expired (transfer out of Level 3). |
| Note: | For purposes of reporting transfers between different hierarchy levels, both transfers in and out of each level, as applicable, are shown as if they occurred at the beginning of the period. |
The accompanying notes are an integral part of these financial statements.
The Hartford SmallCap Growth Fund
Statement of Assets and Liabilities
October 31, 2014
(000’s Omitted)
| Assets: | | | | |
| Investments in securities, at market value (cost $604,208) | | $ | 704,899 | |
| Cash | | | 1 | |
| Receivables: | | | | |
| Investment securities sold | | | 906 | |
| Fund shares sold | | | 4,665 | |
| Dividends and interest | | | 87 | |
| Other assets | | | 58 | |
| Total assets | | | 710,616 | |
| Liabilities: | | | | |
| Payables: | | | | |
| Fund shares redeemed | | | 354 | |
| Investment management fees | | | 97 | |
| Administrative fees | | | 2 | |
| Distribution fees | | | 23 | |
| Accrued expenses | | | 102 | |
| Total liabilities | | | 578 | |
| Net assets | | $ | 710,038 | |
| Summary of Net Assets: | | | | |
| Capital stock and paid-in-capital | | $ | 579,077 | |
| Undistributed net investment income | | | — | |
| Accumulated net realized gain | | | 30,270 | |
| Unrealized appreciation of investments | | | 100,691 | |
| Net assets | | $ | 710,038 | |
| | | | | |
| Shares authorized | | | 27,000,000 | |
| Par value | | $ | 0.0001 | |
| Class A: Net asset value per share/Maximum offering price per share | | | $48.63/$51.46 | |
| Shares outstanding | | | 4,929 | |
| Net assets | | $ | 239,697 | |
| Class B: Net asset value per share | | $ | 40.12 | |
| Shares outstanding | | | 67 | |
| Net assets | | $ | 2,695 | |
| Class C: Net asset value per share | | $ | 39.77 | |
| Shares outstanding | | | 1,111 | |
| Net assets | | $ | 44,184 | |
| Class I: Net asset value per share | | $ | 49.55 | |
| Shares outstanding | | | 2,310 | |
| Net assets | | $ | 114,450 | |
| Class R3: Net asset value per share | | $ | 48.74 | |
| Shares outstanding | | | 179 | |
| Net assets | | $ | 8,744 | |
| Class R4: Net asset value per share | | $ | 49.86 | |
| Shares outstanding | | | 943 | |
| Net assets | | $ | 47,028 | |
| Class R5: Net asset value per share | | $ | 51.13 | |
| Shares outstanding | | | 780 | |
| Net assets | | $ | 39,856 | |
| Class Y: Net asset value per share | | $ | 51.49 | |
| Shares outstanding | | | 4,144 | |
| Net assets | | $ | 213,384 | |
The accompanying notes are an integral part of these financial statements.
The Hartford SmallCap Growth Fund
Statement of Operations
For the Year Ended October 31, 2014
(000’s Omitted)
| Investment Income: | | | | |
| Dividends | | $ | 4,309 | |
| Interest | | | 5 | |
| Less: Foreign tax withheld | | | (1 | ) |
| Total investment income | | | 4,313 | |
| | | | | |
| Expenses: | | | | |
| Investment management fees | | | 4,475 | |
| Administrative services fees | | | | |
| Class R3 | | | 20 | |
| Class R4 | | | 45 | |
| Class R5 | | | 21 | |
| Transfer agent fees | | | | |
| Class A | | | 530 | |
| Class B | | | 17 | |
| Class C | | | 65 | |
| Class I | | | 143 | |
| Class R3 | | | 2 | |
| Class R4 | | | 2 | |
| Class R5 | | | 1 | |
| Class Y | | | 2 | |
| Distribution fees | | | | |
| Class A | | | 597 | |
| Class B | | | 37 | |
| Class C | | | 404 | |
| Class R3 | | | 51 | |
| Class R4 | | | 75 | |
| Custodian fees | | | 2 | |
| Accounting services fees | | | 95 | |
| Registration and filing fees | | | 144 | |
| Board of Directors' fees | | | 16 | |
| Audit fees | | | 15 | |
| Other expenses | | | 94 | |
| Total expenses (before waivers and fees paid indirectly) | | | 6,853 | |
| Transfer agent fee waivers | | | (6 | ) |
| Commission recapture | | | (9 | ) |
| Total waivers and fees paid indirectly | | | (15 | ) |
| Total expenses, net | | | 6,838 | |
| Net Investment Loss | | | (2,525 | ) |
| Net Realized Gain on Investments: | | | | |
| Net realized gain on investments | | | 34,490 | |
| Net Realized Gain on Investments | | | 34,490 | |
| Net Changes in Unrealized Appreciation of Investments: | | | | |
| Net unrealized appreciation of investments | | | 16,021 | |
| Net Changes in Unrealized Appreciation of Investments | | | 16,021 | |
| Net Gain on Investments | | | 50,511 | |
| Net Increase in Net Assets Resulting from Operations | | $ | 47,986 | |
The accompanying notes are an integral part of these financial statements.
The Hartford SmallCap Growth Fund
Statement of Changes in Net Assets
(000’s Omitted)
| | | For the
Year Ended
October 31, 2014 | | | For the
Year Ended
October 31, 2013 | |
| Operations: | | | | | | | | |
| Net investment loss | | $ | (2,525 | ) | | $ | (1,028 | ) |
| Net realized gain on investments | | | 34,490 | | | | 39,346 | |
| Net unrealized appreciation of investments | | | 16,021 | | | | 63,731 | |
| Net Increase in Net Assets Resulting from Operations | | | 47,986 | | | | 102,049 | |
| Distributions to Shareholders: | | | | | | | | |
| From net realized gain on investments | | | | | | | | |
| Class A | | | (16,173 | ) | | | — | |
| Class B | | | (371 | ) | | | — | |
| Class C | | | (2,972 | ) | | | — | |
| Class I | | | (5,151 | ) | | | — | |
| Class R3 | | | (615 | ) | | | — | |
| Class R4 | | | (1,380 | ) | | | — | |
| Class R5 | | | (539 | ) | | | — | |
| Class Y | | | (8,596 | ) | | | — | |
| Total distributions | | | (35,797 | ) | | | — | |
| Capital Share Transactions: | | | | | | | | |
| Class A | | | 8,637 | | | | 12,864 | |
| Class B | | | (1,803 | ) | | | (1,605 | ) |
| Class C | | | 10,902 | | | | 13,693 | |
| Class I | | | 40,854 | | | | 38,931 | |
| Class R3 | | | 646 | | | | 2,943 | |
| Class R4 | | | 28,894 | | | | 11,156 | |
| Class R5 | | | 35,003 | | | | 2,885 | |
| Class Y | | | 88,239 | | | | 60,511 | |
| Net increase from capital share transactions | | | 211,372 | | | | 141,378 | |
| Net Increase in Net Assets | | | 223,561 | | | | 243,427 | |
| Net Assets: | | | | | | | | |
| Beginning of period | | | 486,477 | | | | 243,050 | |
| End of period | | $ | 710,038 | | | $ | 486,477 | |
| Undistributed (distributions in excess of) net investment income | | $ | — | | | $ | (61 | ) |
The accompanying notes are an integral part of these financial statements.
The Hartford SmallCap Growth Fund
Notes to Financial Statements
October 31, 2014
(000’s Omitted)
Organization:
The Hartford Mutual Funds II, Inc. (“Company”) is an open-end management investment company comprised of four portfolios. Financial statements for The Hartford SmallCap Growth Fund (the "Fund"), a series of the Company, are included in this report.
The Company is organized under the laws of the State of Maryland and is registered with the Securities and Exchange Commission (“SEC”) under the Investment Company Act of 1940, as amended (“1940 Act”). The Fund's portfolio managers are Mammen Chally (79%) and David J. Elliot (21%). The Fund is a diversified open-end management investment company. The Fund is an investment company and applies specialized accounting and reporting under Accounting Standards Codification Topic 946, Financial Services - Investment Companies.
Class A shares are sold with a front-end sales charge of up to 5.50%. Class B shares were sold with a contingent deferred sales charge which is assessed on the lesser of the per share net asset value (“NAV”) of the shares at the time of redemption or the original purchase price, and declines from up to 5.00% to zero depending on the period of time the shares are held (see note below regarding the closing of Class B shares). Class C shares are sold with a contingent deferred sales charge of up to 1.00% on shares redeemed within twelve months of purchase. Class I shares are sold without sales charges to certain eligible investors primarily through advisory fee-based wrap programs. Class R3, R4 and R5 shares, which are offered to employer-sponsored retirement plans, and Class Y shares, which are sold to certain eligible institutional investors, are sold without a sales charge. All classes of shares have identical voting, redemption, dividend, liquidation and other rights and the same terms and conditions, with the exceptions that each class may have different expenses, which may affect performance, and that Class B shares automatically convert to Class A shares after 8 years.
No new or additional investments are allowed in Class B shares of the Fund (including investments through any systematic investment plan). Existing shareholders of Class B shares may continue to hold their Class B shares, exchange their Class B shares for Class B shares of another Hartford Fund (as permitted by existing exchange privileges), or redeem their Class B shares as described in the Fund’s prospectus. Reinstatement privileges with respect to Class B shares are set forth in the Fund's prospectus. For investors electing to reinvest capital gains and dividends, any such capital gains or dividends on Class B shares will continue to be reinvested in Class B shares of the Fund. All Class B share attributes, including the 12b-1 fee, contingent deferred sales charge schedule, and conversion to Class A shares, remain unchanged.
Significant Accounting Policies:
The following is a summary of significant accounting policies of the Fund in the preparation of its financial statements, which are in accordance with United States generally accepted accounting principles (“U.S. GAAP”). The preparation of financial statements in accordance with U.S. GAAP may require management to make estimates and assumptions that affect the reported amounts of assets and liabilities and disclosure of contingent assets and liabilities at the date of the financial statements and the reported amounts of increases and decreases in net assets from operations during the reporting period. Actual results could differ from those estimates.
Determination of Net Asset Value – The NAV of each class of the Fund's shares is determined as of the close of regular trading (normally 4:00 p.m. Eastern Time) (the “NYSE Close”) on each day that the New York Stock Exchange (the “Exchange”) is open (“Valuation Date”). Information that becomes known to the Fund after the NAV has been calculated on a particular day will not generally be used to retroactively adjust the NAV determined earlier that day.
Investment Valuation and Fair Value Measurements – For purposes of calculating the NAV, portfolio investments and other assets held by the Fund's portfolio for which market quotes are readily available are valued at market value. Market value is generally determined on the basis of last reported sales prices or official close price. If no sales are reported, market value is based on quotes obtained from a quotation reporting system, established market makers, or independent pricing services. If market prices are not readily available or are deemed unreliable, the Fund will use the fair value of the investment as determined in good faith under policies and procedures established by and under the supervision of the Company's Board of Directors. Market quotes are considered not readily available where there is an absence of current or reliable market-based data (e.g., trade information or indicative market quotes), including where events occur after the close of the relevant market, but prior to the NYSE Close, that materially affect the values of the Fund's portfolio investments or assets. In addition, market quotes are considered not readily available when, due to extraordinary circumstances, the exchanges or markets on which the investments trade do not open for trading for the entire day and
The Hartford SmallCap Growth Fund
Notes to Financial Statements – (continued)
October 31, 2014
(000’s Omitted)
no other market prices are available. There can be no assurance that the Fund could obtain the fair market value assigned to an investment if the Fund were to sell the investment at approximately the time at which the Fund determines its NAV.
Financial instruments for which prices are not available from an independent pricing service may be valued using market quotations obtained from one or more dealers that make markets in the respective financial instrument in accordance with procedures established by the Company's Board of Directors.
U.S. GAAP defines fair value as the price that the Fund would receive to sell an asset or pay to transfer a liability in an orderly transaction between market participants. The U.S. GAAP fair value measurement standards require disclosure of a fair value hierarchy for each major category of assets and liabilities. Various inputs are used in determining the fair value of the Fund’s investments. These inputs are summarized into three broad hierarchy levels. This hierarchy is based on whether the valuation inputs are observable or unobservable. These levels are:
Level 1 – Quoted prices in active markets for identical investments. Level 1 may include exchange traded instruments, such as domestic equities, some foreign equities, options, futures, mutual funds, exchange traded funds, rights and warrants.
Level 2 – Observable inputs other than Level 1 prices, such as quoted prices for similar investments; quoted prices in markets that are not active; or other inputs that are observable or can be corroborated by observable market data. Level 2 may include debt investments that are traded less frequently than exchange traded instruments and which are valued using independent pricing services; foreign equities, which are principally traded on certain foreign markets and are adjusted daily pursuant to a fair value pricing service in order to reflect an adjustment for the factors occurring after the close of certain foreign markets but before the NYSE Close; senior floating rate interests, which are valued using an aggregate of dealer bids; short-term investments, which are valued at amortized cost; and swaps, which are valued based upon the terms of each swap contract.
Level 3 – Significant unobservable inputs that are supported by limited or no market activity. Level 3 may include financial instruments whose values are determined using indicative market quotes or require significant management judgment or estimation. These unobservable valuation inputs may include estimates for current yields, maturity/duration, prepayment speed, and indicative market quotes for comparable investments along with other assumptions relating to credit quality, collateral value, complexity of the investment structure, general market conditions and liquidity. This category may include investments where trading has been halted or there are certain restrictions on trading. While these investments are priced using unobservable inputs, the valuation of these investments reflects the best available data and management believes the prices are a reasonable representation of exit price.
The Board of Directors of the Company generally reviews and approves the “Procedures for Valuation of Portfolio Securities” at least once a year. These procedures define how investments are to be valued, including the formation and activities of a Valuation Committee. The Valuation Committee is responsible for determining in good faith the fair value of investments when the value cannot be obtained from primary pricing services or alternative sources or if the valuation of an investment as provided by the primary pricing service or alternative source is believed not to reflect the investment’s fair value as of the Valuation Date. Voting members of the Valuation Committee include the Fund's Treasurer or designee and a Vice President of the investment manager or designee. An Assistant Vice President of the Fund with legal expertise or designee is also included on the Valuation Committee as a non-voting advisory member. In addition, the Fund’s Chief Compliance Officer shall designate a member of the compliance group to attend Valuation Committee meetings as a non-voting resource, to monitor for and provide guidance with respect to compliance with these procedures. Two members of the Valuation Committee or their designees, representing different departments, shall constitute a quorum for purposes of permitting the Valuation Committee to take action. The Valuation Committee will consider all relevant factors in determining an investment’s fair value, and may seek the advice of the Fund’s sub-adviser, knowledgeable brokers, and legal counsel in making such determination. The Valuation Committee reports to the Audit Committee of the Company's Board of Directors. The Audit Committee receives quarterly written reports which include details of all fair-valued investments, including the reason for the fair valuation, and an indication, when possible, of the accuracy of the valuation by disclosing the next available reliable public price quotation or the disposition price of such investments (the “look-back” test). The Board of Directors then must consider for ratification all of the fair value determinations made during the previous quarter.
The Hartford SmallCap Growth Fund
Notes to Financial Statements – (continued)
October 31, 2014
(000’s Omitted)
Valuation levels are not necessarily indicative of the risk associated with investing in such investments. Individual investments within any of the above mentioned asset classes may be assigned a different hierarchical level than those presented above, as individual circumstances dictate.
For additional information, refer to the Investment Valuation Hierarchy Level Summary and the Level 3 roll-forward reconciliation, if applicable, which follow the Schedule of Investments.
Investment Transactions and Investment Income – Investment transactions are recorded as of the trade date (the date the order to buy or sell is executed) for financial reporting purposes. Investments purchased or sold on a when-issued or delayed-delivery basis may be settled a month or more after the trade date. Realized gains and losses are determined on the basis of identified cost.
Dividend income from domestic securities is accrued on the ex-dividend date. Interest income, including amortization of premium, accretion of discounts and additional principal received in-kind in lieu of cash, is accrued on a daily basis.
Joint Trading Account – The Fund may invest cash balances into a joint trading account that may be invested in one or more repurchase agreements.
Fund Share Valuation and Dividend Distributions to Shareholders – Orders for the Fund’s shares are executed in accordance with the investment instructions of the shareholders. The NAV of the Fund’s shares is determined as of the close of business on each business day of the Exchange. The NAV is determined separately for each class of shares of the Fund by dividing the Fund’s net assets attributable to that class by the number of shares of the class outstanding. Each class of shares offered by the Fund has equal rights as to assets and voting privileges (except that shareholders of a class have exclusive voting rights regarding any matter relating solely to that class of shares). Income and non-class specific expenses are allocated daily to each class on the basis of the relative net assets of the class. Realized and unrealized gains and losses are allocated daily based on the relative net assets of each class of shares of the Fund.
Orders for the purchase of the Fund’s shares received prior to the close of the Exchange on any day the Exchange is open for business are priced at the NAV determined as of the close of the Exchange. Orders received after the close of the Exchange, or on a day on which the Exchange and/or the Fund is not open for business, are priced at the next determined NAV.
Dividends are declared pursuant to a policy adopted by the Company's Board of Directors based upon the investment performance of the Fund. The policy of the Fund is to pay dividends from net investment income and realized gains, if any, at least once a year.
Net investment income, dividends and distributions from net realized gains and capital are determined in accordance with federal income tax regulations, which may differ from U.S. GAAP with respect to character and timing (see Federal Income Taxes: Distributions and Components of Distributable Earnings and Reclassification of Capital Accounts).
Securities and Other Investments:
Repurchase Agreements – A repurchase agreement is an agreement by which a counterparty agrees to sell an investment and agrees to repurchase the investment sold from the buyer at a mutually agreed upon time and price. During the period of the repurchase agreement, the counterparty will deposit cash and or securities in a third party custodial account to serve as collateral. At the time the Fund enters into a repurchase agreement, the value of the underlying collateral, including accrued interest, will be equal to or exceed the value of the repurchase agreement. Repurchase agreements expose the Fund to counterparty risk - that is, the risk that the counterparty will not fulfill its obligations. To minimize counterparty risk, the investments that serve to collateralize the repurchase agreement are held by the Fund’s custodian in book entry or physical form in the custodial account of the Fund or in a third party custodial account. Repurchase agreements are valued at cost plus accrued interest, which approximates fair value. Repurchase agreements have master netting arrangements which allow the Fund to offset amounts owed to a counterparty with amounts owed by the counterparty, including any collateral. Upon an event of default under a master repurchase agreement, the non-defaulting party may close out all transactions traded under such agreement and net amounts owed under each transaction to one net amount payable by one party to the other. Absent an event of default, the master repurchase agreement does not result in an offset of reported amounts of assets and liabilities in the Statement of Assets and Liabilities across transactions between the Fund and the
The Hartford SmallCap Growth Fund
Notes to Financial Statements – (continued)
October 31, 2014
(000’s Omitted)
applicable counterparty. The Fund, as shown on the Schedule of Investments, had outstanding repurchase agreements and related collateral as of October 31, 2014.
Illiquid and Restricted Investments – The Fund is permitted to invest up to 15% of its net assets in illiquid investments. Illiquid investments are those that may not be sold or disposed of in the ordinary course of business within seven days, at approximately the price used to determine the Fund’s NAV. The Fund may not be able to sell illiquid investments when its sub-adviser considers it desirable to do so or may have to sell such investments at a price that is lower than the price that could be obtained if the investments were more liquid. A sale of illiquid investments may require more time and may result in higher dealer discounts and other selling expenses than does the sale of those that are liquid. Illiquid investments also may be more difficult to value due to the unavailability of reliable market quotations for such investments, and an investment in them may have an adverse impact on the Fund’s NAV. The Fund may also purchase certain restricted investments that can only be resold to certain qualified investors and may be determined to be liquid pursuant to policies and guidelines established by the Company's Board of Directors. The Fund had no illiquid or restricted investments as of October 31, 2014.
Investments Purchased on a When-Issued or Delayed-Delivery Basis – Delivery and payment for investments that have been purchased by the Fund on a forward commitment, or when-issued or delayed-delivery basis, take place beyond the customary settlement period. The Fund may dispose of or renegotiate a delayed-delivery transaction after it is entered into, and may sell delayed-delivery investments before they are delivered, which may result in a realized gain or loss. During this period, such investments are subject to market fluctuations, and the Fund identifies investments segregated in its records with a value at least equal to the amount of the commitment. The Fund had no when-issued or delayed-delivery investments as of October 31, 2014.
Principal Risks:
The Fund may be exposed to counterparty risk, or the risk that an institution or other entity with which the Fund has unsettled or open transactions will default.
The market values of equity securities, such as common stocks and preferred stocks, or equity related investments, such as futures and options, may decline due to general market conditions which are not specifically related to a particular company, such as real or perceived adverse economic conditions, changes in the general outlook for corporate earnings, changes in interest or currency rates or adverse investor sentiment generally. The market value of equity securities may also decline due to factors which affect a particular industry or industries, such as labor shortages or increased production costs and competitive conditions within an industry. Equity securities and equity related investments generally have greater market price volatility than fixed income securities.
Federal Income Taxes:
Federal Income Taxes – For federal income tax purposes, the Fund intends to continue to qualify as a Regulated Investment Company ("RIC") under Subchapter M of the Internal Revenue Code (“IRC”) by distributing substantially all of its taxable net investment income and net realized capital gains to its shareholders and otherwise complying with the requirements of the IRC. The Fund has distributed substantially all of its income and capital gains in prior years, if applicable, and intends to distribute substantially all of its income and capital gains during the calendar year ending December 31, 2014. Accordingly, no provision for federal income or excise taxes has been made in the accompanying financial statements. Distributions from short-term capital gains are treated as ordinary income distributions for federal income tax purposes.
Net Investment Income (Loss), Net Realized Gains (Losses) and Distributions – Net investment income (loss) and net realized gains (losses) may differ for financial statement and tax purposes primarily because of losses deferred due to wash sale adjustments, foreign currency gains and losses, adjustments related to Passive Foreign Investment Companies ("PFICs"), Real Estate Investment Trusts ("REITs"), RICs, certain derivatives and partnerships. The character of distributions made during the year from net investment income or net realized gains may differ from their ultimate characterization for federal income tax purposes. Also, due to the timing of dividend distributions, the fiscal year in which amounts are distributed may differ from the year that the income or realized gains (losses) were recorded by the Fund.
The Hartford SmallCap Growth Fund
Notes to Financial Statements – (continued)
October 31, 2014
(000’s Omitted)
Distributions and Components of Distributable Earnings – The tax character of distributions paid by the Fund for the periods indicated is as follows (as adjusted for dividends payable, if applicable):
| | | For the Year Ended
October 31, 2014 | | | For the Year Ended
October 31, 2013 | |
| Ordinary Income | | $ | 11,810 | | | $ | — | |
| Long-Term Capital Gains ‡ | | | 23,987 | | | | — | |
| | ‡ | The Fund designates these distributions as long-term capital gain dividends pursuant to IRC Sec. 852(b)(3)(C). |
As of October 31, 2014, the Fund’s components of distributable earnings (deficit) on a tax basis are as follows:
| | | Amount | |
| Undistributed Ordinary Income | | $ | 1,326 | |
| Undistributed Long-Term Capital Gain | | | 31,591 | |
| Unrealized Appreciation* | | | 98,044 | |
| Total Accumulated Earnings | | $ | 130,961 | |
| * | Differences between book-basis and tax-basis unrealized appreciation (depreciation) may be attributable to the losses deferred due to wash sale adjustments, foreign currency gains and losses, adjustments related to PFICs, REITs, RICs, certain derivatives and partnerships. |
Reclassification of Capital Accounts – The Fund may record reclassifications in its capital accounts. These reclassifications have no impact on the total net assets of the Fund. The reclassifications are a result of permanent differences between U.S. GAAP and tax accounting for such items as foreign currency, PFICs, expiration or utilization of capital loss carryforwards or net operating losses. Adjustments are made to reflect the impact these items have on current and future distributions to shareholders. Therefore, the source of the Fund’s distributions may be shown in the accompanying Statement of Changes in Net Assets as from undistributed net investment income, from accumulated net realized gains on investments or from capital depending on the type of book and tax differences that exist. For the year ended October 31, 2014, the Fund recorded reclassifications to increase (decrease) the accounts listed below:
| | | Amount | |
| Undistributed Net Investment Income (Loss) | | $ | 2,586 | |
| Accumulated Net Realized Gain (Loss) | | | (2,586 | ) |
Capital Loss Carryforward – On December 22, 2010, the Regulated Investment Company Modernization Act of 2010 (the “Act”) was enacted, which made changes to the capital loss carryforward rules. The changes are effective for taxable years beginning after the date of enactment. Under the Act, funds are permitted to carry forward capital losses for an unlimited period. Additionally, capital loss carryforwards retain their character as either short-term or long-term capital losses rather than being considered all short-term as permitted under prior regulation.
The Fund had no capital loss carryforward for U.S. federal income tax purposes as of October 31, 2014.
Accounting for Uncertainty in Income Taxes – The Fund has adopted financial reporting rules that require the Fund to analyze all open tax years, as defined by the statute of limitations, for all major jurisdictions. Generally, tax authorities can examine all tax returns filed for the last three years. The Fund does not have an examination in progress.
The Fund has reviewed all open tax years and major jurisdictions and concluded that these financial reporting rules had no effect on the Fund’s financial position or results of operations. There is no tax liability resulting from unrecognized tax benefits relating to uncertain income tax positions taken or expected to be taken on the tax return for the fiscal year ended October 31, 2014. The Fund is also not aware of any tax positions for which it is reasonably possible that the total amounts of unrecognized tax benefits will significantly change in the next twelve months.
The Hartford SmallCap Growth Fund
Notes to Financial Statements – (continued)
October 31, 2014
(000’s Omitted)
Expenses:
Investment Management Agreement – Hartford Funds Management Company, LLC ("HFMC") serves as the Fund’s investment manager pursuant to an Investment Management Agreement with the Company. HFMC is an indirect wholly owned subsidiary of The Hartford Financial Services Group, Inc. ("The Hartford"). The investment manager has overall investment supervisory responsibility for the Fund. In addition, the investment manager provides administrative personnel, services, equipment, facilities and office space for proper operation of the Fund. HFMC has contracted with Wellington Management Company, LLP ("Wellington Management") under a sub-advisory agreement for the provision of day-to-day investment management services to the Fund in accordance with the Fund’s investment objective and policies. The Fund pays a fee to the investment manager, a portion of which may be used to compensate Wellington Management.
The schedule below reflects the rates of compensation paid to the investment manager for investment management services rendered as of October 31, 2014; the rates are accrued daily and paid monthly:
| Average Daily Net Assets | | Annual Fee | |
| On first $100 million | | | 0.90% | |
| On next $150 million | | | 0.80% | |
| On next $250 million | | | 0.70% | |
| On next $4.5 billion | | | 0.65% | |
| On next $5 billion | | | 0.63% | |
| Over $10 billion | | | 0.62% | |
Accounting Services Agreement – Pursuant to the Fund Accounting Agreement between HFMC and the Company, on behalf of the Fund, HFMC provides accounting services to the Fund and receives monthly compensation based on the Fund’s average daily net assets at the rates set forth below. The Fund’s accounting services fees are accrued daily and paid monthly.
| Average Daily Net Assets | | Annual Fee | |
| On first $5 billion | | | 0.016% | |
| On next $5 billion | | | 0.013% | |
| Over $10 billion | | | 0.010% | |
Operating Expenses – Allocable expenses incurred by the Company are allocated to each Fund and allocated to classes within the Fund in proportion to the average daily net assets of the Fund and each class, except where allocation of certain expenses is more fairly made directly to the Fund or to specific classes within a Fund. As of October 31, 2014, HFMC contractually limited the total operating expenses of this Fund, exclusive of taxes, interest expense, brokerage commissions, acquired fund fees and expenses and extraordinary expenses, through February 28, 2015 as follows:
| Class A | | | Class B | | | Class C | | | Class I | | | Class R3 | | | Class R4 | | | Class R5 | | | Class Y | |
| | 1.40% | | | | 2.15% | | | | 2.15% | | | | 1.15% | | | | 1.60% | | | | 1.30% | | | | 1.00% | | | | 0.95% | |
Fees Paid Indirectly – The Fund has entered into agreements with State Street Global Markets, LLC and Russell Implementation Services, Inc. to partially recapture non-discounted trade commissions. Such rebates are used to pay a portion of the Fund's expenses. For the year ended October 31, 2014, this amount, if any, is included in the Statement of Operations.
The Hartford SmallCap Growth Fund
Notes to Financial Statements – (continued)
October 31, 2014
(000’s Omitted)
The ratio of expenses to average net assets in the accompanying financial highlights excludes the reduction in expenses related to fees paid indirectly. The annualized expense ratio after waivers for the period listed below reflecting the reduction for fees paid indirectly is as follows:
| | | Year Ended
October 31, 2014 | |
| Class A | | | 1.28 | % |
| Class B | | | 2.11 | |
| Class C | | | 1.97 | |
| Class I | | | 0.97 | |
| Class R3 | | | 1.53 | |
| Class R4 | | | 1.21 | |
| Class R5 | | | 0.91 | |
| Class Y | | | 0.81 | |
Distribution and Service Plan for Class A, B, C, R3 and R4 Shares – Hartford Funds Distributors, LLC ("HFD"), an indirect wholly owned subsidiary of The Hartford, is the principal underwriter and distributor of the Fund. HFD is engaged in distribution activities, which include marketing and distribution of shares through broker/dealers, financing distribution costs and maintaining financial books and records. For the year ended October 31, 2014, HFD received front-end load sales charges of $458 and contingent deferred sales charges of $14 from the Fund.
The Fund has adopted a Distribution and Service Plan in accordance with Rule 12b-1 of the 1940 Act to compensate the distributor (HFD) for activities intended to result in the sale and distribution of Class A, B, C, R3 and R4 shares and for providing services for shareholders. The Rule 12b-1 plan applicable to Class A shares of the Fund provides for payment of a Rule 12b-1 fee of 0.25% of average daily net assets. Some or all of the fee may be used for shareholder servicing expenses with the remainder used for distribution expenses. Under the Class B Plan, the Fund pays the distributor 1.00% of the average daily net assets of Class B shares that are outstanding for 8 years or less, 0.25% of which is a fee for services provided to existing shareholders with the remainder used for distribution expenses. Some or the entire Rule 12b-1 fee for Class B shares may be remitted to broker/dealers for distribution and/or shareholder account services. After eight years, Class B shares convert to Class A shares. Upon conversion to Class A shares, the Class A plan described above will apply to those shares. Under the Class C Plan, the Fund pays the distributor 1.00% of the average daily net assets of Class C shares outstanding, 0.25% of which is intended as a fee for services provided to existing shareholders with the remainder used for distribution expenses. For Class C shares, some or the entire fee may be remitted to broker/dealers for distribution and/or shareholder account services. Class R3 shares have a distribution fee of 0.50% of average daily net assets and Class R4 shares have a distribution fee of 0.25% of average daily net assets. For Class R3 and R4 shares, some or the entire fee may be remitted to broker/dealers for distribution and/or shareholder account services. The Fund’s 12b-1 fees are accrued daily and paid monthly or at such other intervals as the Board of Directors may determine.
Other Related Party Transactions – Certain officers of the Fund are directors and/or officers of HFMC and/or The Hartford or its subsidiaries. For the year ended October 31, 2014, a portion of the Fund’s Chief Compliance Officer’s compensation was paid by all of the investment companies in the Hartford fund complex. The portion allocated to the Fund, as represented in other expenses on the Statement of Operations, was in the amount of $1. Hartford Administrative Services Company (“HASCO”), an indirect wholly-owned subsidiary of The Hartford, provides transfer agent services to the Fund. HASCO has contractually agreed to reimburse any portion of the transfer agency fees over 0.30% of average daily net assets per fiscal year for each class. Any transfer agency fee reimbursement is determined before considering the contractual operating expense limitation. For providing such services, HASCO is compensated on a per account basis that varies by account type, except with respect to Class Y, for which it is compensated based on average daily net assets. The amount paid to HASCO and any related contractual reimbursement amounts, if applicable, can be found in the Statement of Operations. These fees are accrued daily and paid monthly.
Administrative services fees are paid to HASCO for third-party recordkeeping services that are payable as a percentage of net assets in the amount of up to 0.20%, 0.15% and 0.10% for Classes R3, R4 and R5 shares, respectively. The total administrative services fees are shown on the Statement of Operations. These fees are accrued daily and paid monthly.
The Hartford SmallCap Growth Fund
Notes to Financial Statements – (continued)
October 31, 2014
(000’s Omitted)
Payment from Affiliate – On July 28, 2010, the Fund was reimbursed by HASCO $242 relating to a trading error.
The total return in the accompanying financial highlights includes a payment from affiliate. Had the payment from affiliate been excluded, the impact and total return for the periods listed below would have been as follows:
| | | Impact from Payment from Affiliate for trading
error for the Year Ended October 31, 2010 | | | Total Return Excluding Payment from Affiliate for
the Year Ended October 31, 2010 | |
| Class A | | | 0.14% | | | | 34.77% | |
| Class B | | | 0.16 | | | | 33.70 | |
| Class C | | | 0.16 | | | | 33.76 | |
| Class I | | | 0.14 | | | | 35.13 | |
| Class Y | | | 0.14 | | | | 35.38 | |
| Class R3 | | | 0.14 | | | | 34.43 | |
| Class R4 | | | 0.14 | | | | 34.84 | |
| Class R5 | | | 0.14 | | | | 35.25 | |
Investment Transactions:
For the year ended October 31, 2014, the cost of purchases and proceeds from sales of investment securities (excluding short-term investments) were as follows:
| | | Excluding U.S.
Government
Obligations | | | U.S.
Government
Obligations | | | Total | |
| Cost of Purchases | | $ | 517,881 | | | $ | — | | | $ | 517,881 | |
| Sales Proceeds | | | 356,749 | | | | — | | | | 356,749 | |
The Hartford SmallCap Growth Fund
Notes to Financial Statements – (continued)
October 31, 2014
(000’s Omitted)
Capital Share Transactions:
The following information is for the year ended October 31, 2014, and the year ended October 31, 2013:
| | | For the Year Ended October 31, 2014 | | | For the Year Ended October 31, 2013 | |
| | | Shares Sold | | | Shares Issued
for Reinvested
Dividends | | | Shares
Redeemed | | | Net Increase
(Decrease) of
Shares | | | Shares Sold | | | Shares Issued
for Reinvested
Dividends | | | Shares
Redeemed | | | Net Increase
(Decrease) of
Shares | |
| Class A | | | | | | | | | | | | | | | | | | | | | | | | | | | | | | | | |
| Shares | | | 953 | | | | 351 | | | | (1,104 | ) | | | 200 | | | | 1,097 | | | | — | | | | (816 | ) | | | 281 | |
| Amount | | $ | 45,135 | | | $ | 16,010 | | | $ | (52,508 | ) | | $ | 8,637 | | | $ | 45,638 | | | $ | — | | | $ | (32,774 | ) | | $ | 12,864 | |
| Class B | | | | | | | | | | | | | | | | | | | | | | | | | | | | | | | | |
| Shares | | | 4 | | | | 9 | | | | (59 | ) | | | (46 | ) | | | 9 | | | | — | | | | (57 | ) | | | (48 | ) |
| Amount | | $ | 199 | | | $ | 353 | | | $ | (2,355 | ) | | $ | (1,803 | ) | | $ | 315 | | | $ | — | | | $ | (1,920 | ) | | $ | (1,605 | ) |
| Class C | | | | | | | | | | | | | | | | | | | | | | | | | | | | | | | | |
| Shares | | | 382 | | | | 76 | | | | (177 | ) | | | 281 | | | | 463 | | | | — | | | | (90 | ) | | | 373 | |
| Amount | | $ | 14,892 | | | $ | 2,836 | | | $ | (6,826 | ) | | $ | 10,902 | | | $ | 16,783 | | | $ | — | | | $ | (3,090 | ) | | $ | 13,693 | |
| Class I | | | | | | | | | | | | | | | | | | | | | | | | | | | | | | | | |
| Shares | | | 1,746 | | | | 102 | | | | (1,009 | ) | | | 839 | | | | 1,348 | | | | — | | | | (468 | ) | | | 880 | |
| Amount | | $ | 84,481 | | | $ | 4,715 | | | $ | (48,342 | ) | | $ | 40,854 | | | $ | 58,817 | | | $ | — | | | $ | (19,886 | ) | | $ | 38,931 | |
| Class R3 | | | | | | | | | | | | | | | | | | | | | | | | | | | | | | | | |
| Shares | | | 172 | | | | 12 | | | | (177 | ) | | | 7 | | | | 94 | | | | — | | | | (27 | ) | | | 67 | |
| Amount | | $ | 8,220 | | | $ | 562 | | | $ | (8,136 | ) | | $ | 646 | | | $ | 4,065 | | | $ | — | | | $ | (1,122 | ) | | $ | 2,943 | |
| Class R4 | | | | | | | | | | | | | | | | | | | | | | | | | | | | | | | | |
| Shares | | | 735 | | | | 24 | | | | (171 | ) | | | 588 | | | | 319 | | | | — | | | | (78 | ) | | | 241 | |
| Amount | | $ | 35,982 | | | $ | 1,118 | | | $ | (8,206 | ) | | $ | 28,894 | | | $ | 14,296 | | | $ | — | | | $ | (3,140 | ) | | $ | 11,156 | |
| Class R5 | | | | | | | | | | | | | | | | | | | | | | | | | | | | | | | | |
| Shares | | | 815 | | | | 11 | | | | (117 | ) | | | 709 | | | | 66 | | | | — | | | | (5 | ) | | | 61 | |
| Amount | | $ | 40,296 | | | $ | 513 | | | $ | (5,806 | ) | | $ | 35,003 | | | $ | 3,116 | | | $ | — | | | $ | (231 | ) | | $ | 2,885 | |
| Class Y | | | | | | | | | | | | | | | | | | | | | | | | | | | | | | | | |
| Shares | | | 2,928 | | | | 172 | | | | (1,359 | ) | | | 1,741 | | | | 1,879 | | | | — | | | | (627 | ) | | | 1,252 | |
| Amount | | $ | 146,372 | | | $ | 8,282 | | | $ | (66,415 | ) | | $ | 88,239 | | | $ | 87,730 | | | $ | — | | | $ | (27,219 | ) | | $ | 60,511 | |
| Total | | | | | | | | | | | | | | | | | | | | | | | | | | | | | | | | |
| Shares | | | 7,735 | | | | 757 | | | | (4,173 | ) | | | 4,319 | | | | 5,275 | | | | — | | | | (2,168 | ) | | | 3,107 | |
| Amount | | $ | 375,577 | | | $ | 34,389 | | | $ | (198,594 | ) | | $ | 211,372 | | | $ | 230,760 | | | $ | — | | | $ | (89,382 | ) | | $ | 141,378 | |
The following reflects the conversion of Class B shares into Class A shares (reflected as Class A shares sold) for the year ended October 31, 2014, and the year ended October 31, 2013:
| | | Shares | | | Dollars | |
| For the Year Ended October 31, 2014 | | | 21 | | | $ | 977 | |
| For the Year Ended October 31, 2013 | | | 19 | | | $ | 740 | |
Line of Credit:
The Fund is one of several Hartford Funds that participate in a $500 million committed revolving line of credit facility. The facility is to be used for temporary or emergency purposes. Under the arrangement, the funds are required to own securities having a market value in excess of 300% of the total bank borrowings. The interest rate on borrowings varies depending on the nature of the loan. The facility also requires a fee to be paid based on the amount of the commitment. This commitment fee is allocated to all the funds participating in the line of credit based on the average net assets of the funds. During the year ended October 31, 2014, the Fund did not have any borrowings under this facility.
Pending Legal Proceedings:
On February 25, 2011, Jennifer L. Kasilag, Louis Mellinger, Judith M. Menendez, Jacqueline M. Robinson, and Linda A. Russell filed a derivative lawsuit against Hartford Investment Financial Services, LLC (“HIFSCO”) (now known as HFD) on behalf of six Hartford retail mutual funds in the United States District Court for the District of New Jersey, alleging that HIFSCO received excessive advisory and distribution fees in violation of its statutory fiduciary duty under Section 36(b) of the 1940 Act when serving as investment manager and principal underwriter, respectively, to the Hartford retail mutual funds. Although this action was purportedly filed on behalf of certain of the
The Hartford SmallCap Growth Fund
Notes to Financial Statements – (continued)
October 31, 2014
(000’s Omitted)
Hartford Funds, none of the Hartford Funds is itself a defendant to the suit. HIFSCO moved to dismiss and, in September 2011, the motion was granted in part and denied in part, with leave to amend the complaint. In November 2011, plaintiffs filed an amended complaint on behalf of certain Hartford retail mutual funds, The Hartford Global Health Fund (now known as The Hartford Healthcare Fund), The Hartford Conservative Allocation Fund, The Hartford Growth Opportunities Fund, The Hartford Inflation Plus Fund, The Hartford Advisers Fund (now known as The Hartford Balanced Fund), and The Hartford Capital Appreciation Fund. Plaintiffs seek to rescind the investment management agreements and distribution plans between HIFSCO and these funds and to recover the total fees charged thereunder or, in the alternative, to recover any improper compensation HIFSCO received, in addition to lost earnings. HIFSCO filed a partial motion to dismiss the amended complaint and, in December 2012, the court dismissed without prejudice the claims regarding distribution fees and denied the motion with respect to the advisory fees claims. HIFSCO disputes the allegations and intends to defend vigorously.
In March 2014, the plaintiffs filed a new complaint that added as new plaintiffs The Hartford Floating Rate Fund and The Hartford Small Company Fund and named as a defendant HFMC, which assumed the role as investment manager to the funds as of January 2013. HFMC and HIFSCO dispute the allegations and intend to defend vigorously.
No accrual for litigation relating to this matter has been recorded in the financial statements of the Fund because the Fund is not party to the suit.
Indemnifications:
Under the Company's organizational documents, the Company shall indemnify its officers and directors to the full extent required or permitted under Maryland General Corporation Law and the federal securities laws. In addition, the Company, on behalf of the Fund, may enter into contracts that contain a variety of indemnifications. The Company's maximum exposure under these arrangements is unknown. However, as of the date of these financial statements, the Company has not had prior claims or losses pursuant to these contracts and expects the risk of loss to be remote.
Subsequent Events:
At the August 5-6, 2014 meeting, the Board of Directors approved the creation of Class R6 shares for the Fund. Class R6 shares launched on November 7, 2014. In connection with the launch of the Class R6 shares, an updated prospectus, dated November 7, 2014, and Statement of Additional Information, dated March 1, 2014, as amended November 7, 2014, for the Fund were filed with the U.S. Securities and Exchange Commission.
Effective December 1, 2014, pursuant to a sub-transfer agency agreement between HASCO and Boston Financial Data Services, Inc. (“BFDS”), HASCO has delegated certain transfer agent, dividend disbursing agent and shareholder servicing agent functions to BFDS. The costs and expenses of such delegation are borne by HASCO, not by the Fund.
The Hartford SmallCap Growth Fund
Financial Highlights
| | | - Selected Per-Share Data - (A) | | | - Ratios and Supplemental Data - | |
Class | | Net Asset
Value at
Beginning
of Period | | | Net
Investment
Income
(Loss) | | | Net
Realized
and
Unrealized
Gain
(Loss) on
Invest-
ments | | | Total from
Investment
Operations | | | Dividends
from Net
Investment
Income | | | Distribu-
tions
from
Realized
Capital
Gains | | | Total
Dividends
and
Distributions | | | Net Asset
Value at
End of
Period | | | Total
Return(B) | | | Net
Assets at
End of
Period
(000's) | | | Ratio of
Expenses
to
Average
Net
Assets
Before
Adjust-
ments(C) | | | Ratio of
Expenses
to
Average
Net
Assets
After
Adjust-
ments(C) | | | Ratio of
Net
Investment
Income
(Loss) to
Average
Net Assets | |
| For the Year Ended October 31, 2014 | | | | | | | | | | | | | | | | | | | | | | | | | | | | | | | | | | | |
| A | | $ | 47.96 | | | $ | (0.26 | ) | | $ | 4.36 | | | $ | 4.10 | | | $ | – | | | $ | (3.43 | ) | | $ | (3.43 | ) | | $ | 48.63 | | | | 9.02 | % | | $ | 239,697 | | | | 1.28 | % | | | 1.28 | % | | | (0.55 | )% |
| B | | | 40.45 | | | | (0.54 | ) | | | 3.64 | | | | 3.10 | | | | – | | | | (3.43 | ) | | | (3.43 | ) | | | 40.12 | | | | 8.16 | | | | 2,695 | | | | 2.26 | | | | 2.11 | | | | (1.36 | ) |
| C | | | 40.08 | | | | (0.49 | ) | | | 3.61 | | | | 3.12 | | | | – | | | | (3.43 | ) | | | (3.43 | ) | | | 39.77 | | | | 8.30 | | | | 44,184 | | | | 1.97 | | | | 1.97 | | | | (1.24 | ) |
| I | | | 48.67 | | | | (0.12 | ) | | | 4.43 | | | | 4.31 | | | | – | | | | (3.43 | ) | | | (3.43 | ) | | | 49.55 | | | | 9.34 | | | | 114,450 | | | | 0.97 | | | | 0.97 | | | | (0.25 | ) |
| R3 | | | 48.17 | | | | (0.38 | ) | | | 4.38 | | | | 4.00 | | | | – | | | | (3.43 | ) | | | (3.43 | ) | | | 48.74 | | | | 8.76 | | | | 8,744 | | | | 1.53 | | | | 1.53 | | | | (0.81 | ) |
| R4 | | | 49.06 | | | | (0.25 | ) | | | 4.48 | | | | 4.23 | | | | – | | | | (3.43 | ) | | | (3.43 | ) | | | 49.86 | | | | 9.09 | | | | 47,028 | | | | 1.22 | | | | 1.22 | | | | (0.52 | ) |
| R5 | | | 50.07 | | | | (0.11 | ) | | | 4.60 | | | | 4.49 | | | | – | | | | (3.43 | ) | | | (3.43 | ) | | | 51.13 | | | | 9.45 | | | | 39,856 | | | | 0.91 | | | | 0.91 | | | | (0.22 | ) |
| Y | | | 50.36 | | | | (0.05 | ) | | | 4.61 | | | | 4.56 | | | | – | | | | (3.43 | ) | | | (3.43 | ) | | | 51.49 | | | | 9.54 | | | | 213,384 | | | | 0.81 | | | | 0.81 | | | | (0.10 | ) |
| | | | | | | | | | | | | | | | | | | | | | | | | | | | | | | | | | | | | | | | | | | | | | | | | | | | | |
| For the Year Ended October 31, 2013 | | | | | | | | | | | | | | | | | | | | | | | | | | | | | | | | | | | |
| A | | $ | 34.72 | | | $ | (0.15 | ) | | $ | 13.39 | | | $ | 13.24 | | | $ | – | | | $ | – | | | $ | – | | | $ | 47.96 | | | | 38.13 | % | | $ | 226,795 | | | | 1.40 | % | | | 1.40 | % | | | (0.37 | )% |
| B | | | 29.50 | | | | (0.36 | ) | | | 11.31 | | | | 10.95 | | | | – | | | | – | | | | – | | | | 40.45 | | | | 37.12 | | | | 4,552 | | | | 2.40 | | | | 2.15 | | | | (1.05 | ) |
| C | | | 29.21 | | | | (0.40 | ) | | | 11.27 | | | | 10.87 | | | | – | | | | – | | | | – | | | | 40.08 | | | | 37.21 | | | | 33,255 | | | | 2.08 | | | | 2.08 | | | | (1.13 | ) |
| I | | | 35.10 | | | | (0.05 | ) | | | 13.62 | | | | 13.57 | | | | – | | | | – | | | | – | | | | 48.67 | | | | 38.66 | | | | 71,601 | | | | 1.04 | | | | 1.04 | | | | (0.13 | ) |
| R3 | | | 34.93 | | | | (0.26 | ) | | | 13.50 | | | | 13.24 | | | | – | | | | – | | | | – | | | | 48.17 | | | | 37.90 | | | | 8,280 | | | | 1.59 | | | | 1.59 | | | | (0.62 | ) |
| R4 | | | 35.47 | | | | (0.19 | ) | | | 13.78 | | | | 13.59 | | | | – | | | | – | | | | – | | | | 49.06 | | | | 38.31 | | | | 17,412 | | | | 1.27 | | | | 1.27 | | | | (0.44 | ) |
| R5 | | | 36.10 | | | | (0.10 | ) | | | 14.07 | | | | 13.97 | | | | – | | | | – | | | | – | | | | 50.07 | | | | 38.70 | | | | 3,579 | | | | 0.97 | | | | 0.97 | | | | (0.22 | ) |
| Y | | | 36.27 | | | | 0.03 | | | | 14.06 | | | | 14.09 | | | | – | | | | – | | | | – | | | | 50.36 | | | | 38.85 | | | | 121,003 | | | | 0.87 | | | | 0.87 | | | | 0.07 | |
| | | | | | | | | | | | | | | | | | | | | | | | | | | | | | | | | | | | | | | | | | | | | | | | | | | | | |
| For the Year Ended October 31, 2012 | | | | | | | | | | | | | | | | | | | | | | | | | | | | | | | | | | | |
| A | | $ | 31.27 | | | $ | (0.22 | ) | | $ | 3.67 | | | $ | 3.45 | | | $ | – | | | $ | – | | | $ | – | | | $ | 34.72 | | | | 11.03 | % | | $ | 154,415 | | | | 1.48 | % | | | 1.40 | % | | | (0.65 | )% |
| B | | | 26.77 | | | | (0.40 | ) | | | 3.13 | | | | 2.73 | | | | – | | | | – | | | | – | | | | 29.50 | | | | 10.20 | | | | 4,747 | | | | 2.44 | | | | 2.15 | | | | (1.41 | ) |
| C | | | 26.51 | | | | (0.40 | ) | | | 3.10 | | | | 2.70 | | | | – | | | | – | | | | – | | | | 29.21 | | | | 10.18 | | | | 13,343 | | | | 2.17 | | | | 2.15 | | | | (1.40 | ) |
| I | | | 31.52 | | | | (0.11 | ) | | | 3.69 | | | | 3.58 | | | | – | | | | – | | | | – | | | | 35.10 | | | | 11.36 | | | | 20,730 | | | | 1.11 | | | | 1.11 | | | | (0.33 | ) |
| R3 | | | 31.53 | | | | (0.27 | ) | | | 3.67 | | | | 3.40 | | | | – | | | | – | | | | – | | | | 34.93 | | | | 10.78 | | | | 3,672 | | | | 1.67 | | | | 1.60 | | | | (0.80 | ) |
| R4 | | | 31.91 | | | | (0.19 | ) | | | 3.75 | | | | 3.56 | | | | – | | | | – | | | | – | | | | 35.47 | | | | 11.16 | | | | 4,053 | | | | 1.32 | | | | 1.30 | | | | (0.54 | ) |
| R5 | | | 32.38 | | | | (0.08 | ) | | | 3.80 | | | | 3.72 | | | | – | | | | – | | | | – | | | | 36.10 | | | | 11.49 | | | | 345 | | | | 1.05 | | | | 1.00 | | | | (0.24 | ) |
| Y | | | 32.51 | | | | (0.06 | ) | | | 3.82 | | | | 3.76 | | | | – | | | | – | | | | – | | | | 36.27 | | | | 11.57 | | | | 41,745 | | | | 0.89 | | | | 0.89 | | | | (0.18 | ) |
| | | | | | | | | | | | | | | | | | | | | | | | | | | | | | | | | | | | | | | | | | | | | | | | | | | | | |
| For the Year Ended October 31, 2011 | | | | | | | | | | | | | | | | | | | | | | | | | | | | | | | | | | | |
| A(D) | | $ | 27.59 | | | $ | (0.29 | ) | | $ | 3.97 | | | $ | 3.68 | | | $ | – | | | $ | – | | | $ | – | | | $ | 31.27 | | | | 13.34 | % | | $ | 154,303 | | | | 1.48 | % | | | 1.40 | % | | | (0.93 | )% |
| B | | | 23.80 | | | | (0.40 | ) | | | 3.37 | | | | 2.97 | | | | – | | | | – | | | | – | | | | 26.77 | | | | 12.48 | | | | 7,018 | | | | 2.39 | | | | 2.15 | | | | (1.46 | ) |
| C | | | 23.57 | | | | (0.40 | ) | | | 3.34 | | | | 2.94 | | | | – | | | | – | | | | – | | | | 26.51 | | | | 12.47 | | | | 12,285 | | | | 2.18 | | | | 2.15 | | | | (1.47 | ) |
| I | | | 27.73 | | | | (0.14 | ) | | | 3.93 | | | | 3.79 | | | | – | | | | – | | | | – | | | | 31.52 | | | | 13.67 | | | | 9,312 | | | | 1.10 | | | | 1.10 | | | | (0.43 | ) |
| R3 | | | 27.87 | | | | (0.30 | ) | | | 3.96 | | | | 3.66 | | | | – | | | | – | | | | – | | | | 31.53 | | | | 13.13 | | | | 763 | | | | 1.69 | | | | 1.60 | | | | (0.93 | ) |
| R4 | | | 28.13 | | | | (0.20 | ) | | | 3.98 | | | | 3.78 | | | | – | | | | – | | | | – | | | | 31.91 | | | | 13.44 | | | | 3,059 | | | | 1.30 | | | | 1.30 | | | | (0.62 | ) |
| R5 | | | 28.46 | | | | (0.11 | ) | | | 4.03 | | | | 3.92 | | | | – | | | | – | | | | – | | | | 32.38 | | | | 13.77 | | | | 227 | | | | 1.03 | | | | 1.00 | | | | (0.33 | ) |
| Y | | | 28.54 | | | | (0.07 | ) | | | 4.04 | | | | 3.97 | | | | – | | | | – | | | | – | | | | 32.51 | | | | 13.91 | | | | 134,508 | | | | 0.89 | | | | 0.89 | | | | (0.22 | ) |
See Portfolio Turnover information on the next page.
| The Hartford SmallCap Growth Fund |
| Financial Highlights – (continued) |
| | | - Selected Per-Share Data - (A) | | | - Ratios and Supplemental Data - | |
| Class | | Net Asset
Value at
Beginning
of Period | | | Net
Investment
Income
(Loss) | | | Net
Realized
and
Unrealized
Gain
(Loss) on
Invest-
ments | | | Total from
Investment
Operations | | | Dividends
from Net
Investment
Income | | | Distribu-
tions
from
Realized
Capital
Gains | | | Total
Dividends
and
Distributions | | | Net Asset
Value at
End of
Period | | | Total
Return(B) | | | Net
Assets at
End of
Period
(000's) | | | Ratio of
Expenses
to
Average
Net
Assets
Before
Adjust-
ments(C) | | | Ratio of
Expenses
to
Average
Net
Assets
After
Adjust-
ments(C) | | | Ratio of
Net
Investment
Income
(Loss) to
Average
Net Assets | |
| For the Year Ended October 31, 2010 | | | | | | | | | | | | | | | | | | | | | | | | | | | | | | | | | | | | | | | | | | |
| A | | $ | 20.45 | | | $ | (0.15 | )(E) | | $ | 7.27 | | | $ | 7.14 | | | $ | – | | | $ | – | | | $ | – | | | $ | 27.59 | | | | 34.91 | %(F) | | $ | 53,548 | | | | 1.62 | % | | | 1.40 | % | | | (0.64 | )% |
| B | | | 17.78 | | | | (0.29 | )(E) | | | 6.29 | | | | 6.02 | | | | – | | | | – | | | | – | | | | 23.80 | | | | 33.86 | (F) | | | 8,398 | | | | 2.59 | | | | 2.15 | | | | (1.39 | ) |
| C | | | 17.60 | | | | (0.29 | )(E) | | | 6.24 | | | | 5.97 | | | | – | | | | – | | | | – | | | | 23.57 | | | | 33.92 | (F) | | | 11,084 | | | | 2.34 | | | | 2.15 | | | | (1.39 | ) |
| I | | | 20.50 | | | | (0.09 | )(E) | | | 7.30 | | | | 7.23 | | | | – | | | | – | | | | – | | | | 27.73 | | | | 35.27 | (F) | | | 5,384 | | | | 1.23 | | | | 1.15 | | | | (0.39 | ) |
| R3 | | | 20.71 | | | | (0.22 | )(E) | | | 7.35 | | | | 7.16 | | | | – | | | | – | | | | – | | | | 27.87 | | | | 34.57 | (F) | | | 367 | | | | 1.77 | | | | 1.63 | | | | (0.90 | ) |
| R4 | | | 20.84 | | | | (0.14 | )(E) | | | 7.40 | | | | 7.29 | | | | – | | | | – | | | | – | | | | 28.13 | | | | 34.98 | (F) | | | 2,831 | | | | 1.38 | | | | 1.33 | | | | (0.58 | ) |
| R5 | | | 21.02 | | | | (0.06 | )(E) | | | 7.47 | | | | 7.44 | | | | – | | | | – | | | | – | | | | 28.46 | | | | 35.39 | (F) | | | 132 | | | | 1.09 | | | | 1.05 | | | | (0.26 | ) |
| Y | | | 21.06 | | | | (0.04 | )(E) | | | 7.49 | | | | 7.48 | | | | – | | | | – | | | | – | | | | 28.54 | | | | 35.52 | (F) | | | 93,908 | | | | 0.95 | | | | 0.95 | | | | (0.18 | ) |
| (A) | Information presented relates to a share outstanding throughout the indicated period. Net investment income (loss) per share amounts are calculated based on average shares outstanding unless otherwise noted. |
| (B) | Assumes initial investment at net asset value at the beginning of each period, reinvestment of all distributions, the complete redemption of the investment at net asset value at the end of each period and no sales charge. Total return would be reduced if sales charges were taken into account. |
| (C) | Adjustments include waivers and reimbursements, if applicable. Ratios do not include fees paid indirectly (see Expenses in the accompanying Notes to Financial Statements). |
| (D) | Class L was merged into Class A on August 5, 2011. |
| (E) | The impact of the Payment from Affiliate per share was $0.02 for Class A, Class B, Class C and Class I, and $0.03 for Class R3, Class R4, Class R5 and ClassY. (F) Total return without the inclusion of the Payments from Affiliate, can be found in Expenses in the accompanying Notes to Financial Statements. |
| | | Portfolio Turnover
Rate for
All Share Classes | |
| For the Year Ended October 31, 2014 | | | 61 | % |
| For the Year Ended October 31, 2013 | | | 90 | |
| For the Year Ended October 31, 2012 | | | 73 | |
| For the Year Ended October 31, 2011 | | | 70 | |
| For the Year Ended October 31, 2010 | | | 137 | |
| The Hartford SmallCap Growth Fund |
| The Board of Directors and Shareholders of |
| The Hartford Mutual Funds II, Inc. |
We have audited the accompanying statement of assets and liabilities, including the schedule of investments, of The Hartford SmallCap Growth Fund (one of the portfolios constituting The Hartford Mutual Funds II, Inc. (the Funds)) as of October 31, 2014, and the related statement of operations for the year then ended, the statements of changes in net assets for each of the two years in the period then ended, and the financial highlights for each of the five years in the period then ended. These financial statements and financial highlights are the responsibility of the Funds’ management. Our responsibility is to express an opinion on these financial statements and financial highlights based on our audits.
We conducted our audits in accordance with the standards of the Public Company Accounting Oversight Board (United States). Those standards require that we plan and perform the audit to obtain reasonable assurance about whether the financial statements and financial highlights are free of material misstatement. We were not engaged to perform an audit of the Funds’ internal control over financial reporting. Our audits included consideration of internal control over financial reporting as a basis for designing audit procedures that are appropriate in the circumstances, but not for the purpose of expressing an opinion on the effectiveness of the Funds’ internal control over financial reporting. Accordingly, we express no such opinion. An audit also includes examining, on a test basis, evidence supporting the amounts and disclosures in the financial statements and financial highlights, assessing the accounting principles used and significant estimates made by management, and evaluating the overall financial statement presentation. Our procedures included confirmation of securities owned as of October 31, 2014, by correspondence with the custodian. We believe that our audits provide a reasonable basis for our opinion.
In our opinion, the financial statements and financial highlights referred to above present fairly, in all material respects, the financial position of The Hartford SmallCap Growth Fund of The Hartford Mutual Funds II, Inc. at October 31, 2014, the results of its operations for the year then ended, the changes in its net assets for each of the two years in the period then ended, and the financial highlights for each of the five years in the period then ended, in conformity with U.S. generally accepted accounting principles.
Minneapolis, Minnesota
December 18, 2014
| The Hartford SmallCap Growth Fund |
| Directors and Officers (Unaudited) |
The Board of Directors of the Company (the "Directors") appoints officers who are responsible for the day-to-day operations of the Fund and who execute policies formulated by the Directors. Each Director serves until his or her death, resignation, or retirement or until the next annual meeting of shareholders is held or until his or her successor is elected and qualifies.
Directors and officers who are employed by or who have a financial interest in The Hartford Financial Services Group, Inc. ("The Hartford") are considered “interested” persons of the Fund pursuant to the 1940 Act. Each officer and two of the Company's Directors, as noted in the chart below, are “interested” persons of the Fund. Each Director serves as a director for The Hartford Mutual Funds, Inc., The Hartford Mutual Funds II, Inc., Hartford Series Fund, Inc., and Hartford HLS Series Fund II, Inc., and as a trustee for The Hartford Alternative Strategies Fund, which, as of October 31, 2014, collectively consist of 66 funds. Correspondence may be sent to Directors and officers c/o Hartford Funds, 5 Radnor Corporate Center, Suite 300, 100 Matsonford Road, Radnor, Pennsylvania 19087, except that correspondence to Mr. Annoni, Mr. Dressen and Ms. Quade may be sent to 500 Bielenberg Drive, Suite 500, Woodbury, Minnesota 55125.
The table below sets forth, for each Director and officer, his or her name, year of birth, current position with the Company and date first elected or appointed to The Hartford Mutual Funds, Inc. ("MF") and The Hartford Mutual Funds II, Inc. ("MF2"), principal occupation, and, for Directors, other directorships held. The Fund’s Statement of Additional Information contains further information on the Directors and is available free of charge by calling 1-888-843-7824 or writing to: Hartford Funds, P.O. Box 55022, Boston, MA 02205-5022.
Information on the aggregate remuneration paid to the directors of the Company can be found in the Statement of Operations herein. The Fund pays to The Hartford a portion of the Chief Compliance Officer’s compensation, but does not pay salaries or compensation to any of its other officers or Directors who are employed by The Hartford.
Non-Interested Directors
Hilary E. Ackermann (1956) Director since September 23, 2014
Ms. Ackermann served as Chief Risk Officer at Goldman Sachs Bank USA from October 2008 to November 2011 and serves as a Director of Dynegy, Inc., an independent power company, from October 2012 to present.
Lynn S. Birdsong (1946) Director since 2003, Chairman of the Investment Committee since 2014
Mr. Birdsong is a private investor. Mr. Birdsong currently serves as a Director of the Sovereign High Yield Investment Company (April 2010 to current). Mr. Birdsong currently serves as an Independent Director of Nomura Partners Funds, Inc. (formerly, The Japan Fund) (April 2003 to current). From 2003 to March 2005, Mr. Birdsong was an Independent Director of the Atlantic Whitehall Funds. From 1979 to 2002, Mr. Birdsong was a Managing Director of Zurich Scudder Investments, an investment management firm. During his employment with Scudder, Mr. Birdsong was an Interested Director of The Japan Fund. From January 1981 through December 2013, Mr. Birdsong was a partner in Birdsong Company, an advertising specialty firm.
Robert M. Gavin, Jr. (1940) Director since 2002 (MF) and 1986 (MF2), Chairman of the Board for each since 2004
Dr. Gavin is an educational consultant. Prior to September 1, 2001, he was President of Cranbrook Education Community and prior to July 1996, he was President of Macalester College, St. Paul, Minnesota.
Duane E. Hill (1945) Director since 2001 (MF) and 2002 (MF2), Chairman of the Nominating Committee since 2003
Mr. Hill is a Partner of TSG Ventures L.P., a private equity investment company. Mr. Hill is a former partner of TSG Capital Group, a private equity investment firm that served as sponsor and lead investor in leveraged buyouts of middle market companies.
Sandra S. Jaffee (1941) Director since 2005
Ms. Jaffee is the founder and Chief Executive Officer of a private company, Homeworks Concierge, LLC, which provides residential property management services in Westchester County, New York (January 2012 to present). Ms. Jaffee served as Chairman (2008 to 2009) and Chief Executive Officer of Fortent (formerly Searchspace Group), a leading provider of compliance/regulatory technology to financial institutions from August 2005 to August 2009. From August 2004 to August 2005, Ms. Jaffee served as an Entrepreneur in Residence with Warburg Pincus, a private equity firm. Prior to joining Warburg Pincus, Ms. Jaffee served as Executive Vice President at Citigroup, from September 1995 to July 2004, where she was President and Chief Executive Officer of Citibank’s Global Securities Services (1995 to 2003). Ms. Jaffee currently serves as a member of the Board of Directors of Broadridge Financial Solutions as well as a Trustee of Muhlenberg College.
| The Hartford SmallCap Growth Fund |
| Directors and Officers (Unaudited) – (continued) |
William P. Johnston (1944) Director since 2005, Chairman of the Compliance Committee since 2005
In June 2006, Mr. Johnston was appointed as Senior Advisor to The Carlyle Group, a global private equity and other alternative asset investment firm and currently serves as an Operating Executive. In July 2006, Mr. Johnston was elected to the Board of Directors of MultiPlan, Inc. and served as a Director (July 2006 to August 2010). In August 2007, Mr. Johnston was elected to the Board of Directors of LifeCare Holdings, Inc. and served as a Director (August 2007 to June 2013). In February 2008, Mr. Johnston was elected to the Board of Directors of HCR-ManorCare, Inc. In May 2006, Mr. Johnston was elected to the Supervisory Board of Fresenius Medical Care AG & Co. KGaA, after its acquisition of Renal Care Group, Inc. in March 2006. Mr. Johnston joined Renal Care Group in November 2002 as a member of the Board of Directors and served as Chairman of the Board from March 2003 through March 2006. From 2002 through 2013, Mr. Johnston served as a Board member of the Georgia O’Keefe Museum. From September 1987 to December 2002, Mr. Johnston was with Equitable Securities Corporation (and its successors, SunTrust Equitable Securities and SunTrust Robinson Humphrey) serving in various investment banking and managerial positions, including Managing Director and Head of Investment Banking, Chief Executive Officer and Vice Chairman.
Phillip O. Peterson (1944) Director since 2002 (MF) and 2000 (MF2), Chairman of the Audit Committee since 2002
Mr. Peterson is a mutual fund industry consultant. He was a partner of KPMG LLP (an accounting firm) until July 1999. Mr. Peterson joined William Blair Funds in February 2007 as a member of the Board of Trustees. From February 2012 to February 2014, Mr. Peterson served as a Trustee of Symetra Variable Mutual Funds. From January 2004 to April 2005, Mr. Peterson served as Independent President of the Strong Mutual Funds.
Lemma W. Senbet (1946) Director since 2005
Dr. Senbet is the William E. Mayer Chair Professor of Finance and Founding Director, Center for Financial Policy, at the University of Maryland, Robert H. Smith School of Business. He was chair of the Finance Department of the University of Maryland, Robert H. Smith School of Business from 1998 to 2006. Since June 2013, he has been on leave from the University to serve as Executive Director of African Economic Research Consortium which focuses on economic policy research and training. Previously, he was a chaired professor of finance at the University of Wisconsin-Madison. Also, he was a Director of the Fortis Funds from March 2000 to July 2002. Dr. Senbet served as Director of the American Finance Association and President of the Western Finance Association. In 2006, Dr. Senbet was inducted Fellow of Financial Management Association International for his career-long distinguished scholarship and professional service.
Interested Directors and Officers
James E. Davey (1964) Director since 2012, President and Chief Executive Officer since 2010
Mr. Davey serves as Executive Vice President of Hartford Life Insurance Company (“HLIC”) and The Hartford. Additionally, Mr. Davey serves as Chairman of the Board, Manager and Senior Managing Director of Hartford Funds Distributors, LLC (“HFD”). He also currently serves as Director, Chairman of the Board, President and Senior Managing Director of Hartford Administrative Services Company (“HASCO”). Mr. Davey also serves as Manager, Chairman of the Board and Senior Managing Director for Hartford Funds Management Company, LLC (“HFMC”) and Director, Chairman of the Board and Senior Managing Director for Hartford Funds Management Group, Inc. ("HFMG"). Mr. Davey has served in various positions within The Hartford and its subsidiaries in connection with the operation of the Hartford Funds. Mr. Davey joined The Hartford in 2002.
Lowndes A. Smith* (1939) Director since 1996 (MF) and 2002 (MF2)
Mr. Smith served as Vice Chairman of The Hartford from February 1997 to January 2002, as President and Chief Executive Officer of Hartford Life, Inc. from February 1997 to January 2002, and as President and Chief Operating Officer of The Hartford Life Insurance Companies from January 1989 to January 2002. Mr. Smith serves as a Director of White Mountains Insurance Group Ltd. (October 2003 to current); One Beacon Insurance (October 2006 to current); Symetra Financial (August 2007 to current) and is a Managing Director of Whittington Gray Associates (January 2007 to current).
* Mr. Smith resigned as a Director of MF, MF2, Hartford Series Fund, Inc. and Hartford HLS Series Fund II, Inc. and as a Trustee of The Hartford Alternative Strategies Fund effective September 17, 2014.
Other Officers
Mark A. Annoni (1964) Vice President, Controller and Treasurer since 2012
Mr. Annoni currently serves as the Assistant Vice President of HLIC (February 2004 to present) and Senior Vice President of HFMG (December 2013 to present). Mr. Annoni has served in various positions within The Hartford and its subsidiaries in connection with the operation of the Hartford Funds. Mr. Annoni joined The Hartford in 2001.
| The Hartford SmallCap Growth Fund |
| Directors and Officers (Unaudited) – (continued) |
Michael R. Dressen (1963) AML Compliance Officer since 2011
Mr. Dressen currently serves as Assistant Vice President of HLIC. He also serves as Chief Compliance Officer and AML Compliance Officer of HASCO and as AML Officer of HFD. Mr. Dressen has served in various positions within The Hartford and its subsidiaries in connection with the operation of the Hartford Funds.
Edward P. Macdonald (1967) Vice President, Secretary and Chief Legal Officer since 2005
Mr. Macdonald currently serves as Assistant Secretary, Executive Vice President and Deputy General Counsel of HFD, HASCO, HFMC and HFMG. He also serves as Vice President of HLIC. Mr. Macdonald has served in various positions within The Hartford and its subsidiaries in connection with the operation of the Hartford Funds. Mr. Macdonald joined The Hartford in 2005.
Joseph G. Melcher (1973) Vice President and Chief Compliance Officer since 2013
Mr. Melcher currently serves as Executive Vice President of HFD, HFMG and HASCO. Mr. Melcher also currently serves as Executive Vice President and Chief Compliance Officer of HFMC. Mr. Melcher has served in various positions within The Hartford and its subsidiaries in connection with the operation of the Hartford Funds since joining The Hartford in 2012. Prior to joining The Hartford, Mr. Melcher worked at Touchstone Investments, a member of the Western & Southern Financial Group, where he held the position of Vice President and Chief Compliance Officer from 2010 through 2012 and Assistant Vice President, Compliance from 2005 to 2010.
Vernon J. Meyer (1964) Vice President since 2006
Mr. Meyer currently serves as Senior Vice President of HLIC. He also currently serves as Managing Director and Chief Investment Officer of HFMC and Managing Director of HFMG. Mr. Meyer has served in various positions within The Hartford and its subsidiaries in connection with the operation of the Hartford Funds. Mr. Meyer joined The Hartford in 2004.
Laura S. Quade (1969) Vice President since 2012
Ms. Quade currently serves as Vice President of HASCO, HFD and HFMG. She is the Head of Operations of HASCO and formerly served as Director, Enterprise Operations of HLIC. Ms. Quade has served in various positions within The Hartford and its subsidiaries in connection with the operation of the Hartford Funds. Ms. Quade joined The Hartford in 2001.
Martin A. Swanson** (1962) Vice President since 2010
Mr. Swanson currently serves as Vice President of HLIC. Mr. Swanson also serves as Managing Director, Chief Marketing Officer and Principal of HFD and Managing Director of HFMG. Mr. Swanson has served in various positions within The Hartford and its subsidiaries in connection with the operation of the Hartford Funds.
** Mr. Swanson resigned as an officer effective November 6, 2014.
HOW TO OBTAIN A COPY OF THE FUND’S PROXY VOTING POLICIES AND VOTING RECORDS (UNAUDITED)
A description of the policies and procedures that the Fund uses to determine how to vote proxies relating to portfolio securities and information about how the Fund voted proxies relating to portfolio securities during the most recent twelve-month period ended June 30 are available (1) without charge, upon request, by calling 888-843-7824 and (2) on the SEC’s website at http://www.sec.gov.
QUARTERLY PORTFOLIO HOLDINGS INFORMATION (UNAUDITED)
The Fund files a complete schedule of portfolio holdings with the SEC for the first and third quarters of each fiscal year on Form N-Q. The Fund’s Forms N-Q are available (1) without charge, upon request, by calling 888-843-7824 and (2) on the SEC’s website at http://www.sec.gov. The Form N-Q may be reviewed and copied at the SEC’s Public Reference Room in Washington, DC. Information on the operation of the Public Reference Room may be obtained by calling 1-800-SEC-0330.
| The Hartford SmallCap Growth Fund |
| Federal Tax Information (Unaudited) |
For the fiscal year ended October 31, 2014, there is no further federal tax information required for this Fund.
| The Hartford SmallCap Growth Fund |
| Expense Example (Unaudited) |
Your Fund's Expenses
As a shareholder of the Fund, you incur two types of costs: (1) transaction costs, including sales charges (loads) on purchase payments, if any, and contingent deferred sales charges (CDSC), if any, and (2) ongoing costs, including investment management fees, distribution and/or service (12b-1) fees, if any, and other fund expenses. This example is intended to help you understand your ongoing costs (in dollars) of investing in the Fund and to compare these costs with the ongoing costs of investing in other mutual funds. The example is based on an investment of $1,000 invested at the beginning of the period and held for the entire period of April 30, 2014 through October 31, 2014.
Actual Expenses
The first set of columns of the table below provides information about actual account values and actual expenses. You may use the information in this column, together with the amount you invested, to estimate the expenses that you paid over the period. Simply divide your account value by $1,000 (for example, an $8,600 account value divided by $1,000 = 8.6), then multiply the result by the number in the line under the heading entitled “Expenses Paid During Period” to estimate the expenses you paid on your account during this period.
Hypothetical Example for Comparison Purposes
The second set of columns of the table below provides information about hypothetical account values and hypothetical expenses based on the Fund's actual expense ratio and an assumed rate of return of 5% per year before expenses, which is not the Fund's actual return. The hypothetical account values and expenses may not be used to estimate the actual ending account balance or expenses you paid for the period. You may use this information to compare the ongoing costs of investing in the Fund and other funds. To do so, compare this 5% hypothetical example with the 5% hypothetical examples that appear in the shareholder reports of the other funds.
Please note that the expenses shown in the table are meant to highlight your ongoing costs only and do not reflect any transactional costs, such as sales charges (loads) and CDSC. Therefore, the second set of columns of the table is useful in comparing ongoing costs only, and will not help you determine the relative total costs of owning different funds. In addition, if these transactional costs were included, your costs would be higher. Expenses are equal to the Fund's annualized expense ratios multiplied by average account value over the period, multiplied by 184/365 (to reflect the one-half year period).
| | | Actual return | | | Hypothetical (5% return before expenses) | | | | | | | | | | |
| | | Beginning
Account Value
April 30, 2014 | | | Ending Account
Value
October 31, 2014 | | | Expenses paid
during the period
April 30, 2014
through
October 31, 2014 | | | Beginning
Account Value
April 30, 2014 | | | Ending Account
Value
October 31, 2014 | | | Expenses paid
during the period
April 30, 2014
through
October 31, 2014 | | | Annualized
expense
ratio | | | Days
in the
current
1/2
year | | | Days
in the
full
year | |
| Class A | | $ | 1,000.00 | | | $ | 1,051.50 | | | $ | 6.64 | | | $ | 1,000.00 | | | $ | 1,018.74 | | | $ | 6.53 | | | | 1.28 | % | | | 184 | | | | 365 | |
| Class B | | $ | 1,000.00 | | | $ | 1,047.50 | | | $ | 10.80 | | | $ | 1,000.00 | | | $ | 1,014.66 | | | $ | 10.62 | | | | 2.09 | | | | 184 | | | | 365 | |
| Class C | | $ | 1,000.00 | | | $ | 1,048.00 | | | $ | 10.21 | | | $ | 1,000.00 | | | $ | 1,015.23 | | | $ | 10.05 | | | | 1.98 | | | | 184 | | | | 365 | |
| Class I | | $ | 1,000.00 | | | $ | 1,053.10 | | | $ | 5.04 | | | $ | 1,000.00 | | | $ | 1,020.29 | | | $ | 4.96 | | | | 0.97 | | | | 184 | | | | 365 | |
| Class R3 | | $ | 1,000.00 | | | $ | 1,050.20 | | | $ | 7.93 | | | $ | 1,000.00 | | | $ | 1,017.47 | | | $ | 7.80 | | | | 1.53 | | | | 184 | | | | 365 | |
| Class R4 | | $ | 1,000.00 | | | $ | 1,051.90 | | | $ | 6.28 | | | $ | 1,000.00 | | | $ | 1,019.08 | | | $ | 6.18 | | | | 1.22 | | | | 184 | | | | 365 | |
| Class R5 | | $ | 1,000.00 | | | $ | 1,053.60 | | | $ | 4.74 | | | $ | 1,000.00 | | | $ | 1,020.59 | | | $ | 4.66 | | | | 0.92 | | | | 184 | | | | 365 | |
| Class Y | | $ | 1,000.00 | | | $ | 1,054.00 | | | $ | 4.21 | | | $ | 1,000.00 | | | $ | 1,021.11 | | | $ | 4.14 | | | | 0.81 | | | | 184 | | | | 365 | |
| The Hartford SmallCap Growth Fund |
| Approval of Investment Management and Investment Sub-Advisory Agreements (Unaudited) |
Section 15(c) of the Investment Company Act of 1940, as amended (the “1940 Act”), requires that each mutual fund’s board of directors, including a majority of those directors who are not “interested persons” of the mutual fund, as defined in the 1940 Act (the “Independent Directors”), annually review and consider the continuation of the mutual fund’s investment advisory and sub-advisory agreements. At its meeting held on August 5-6, 2014, the Board of Directors (the “Board”) of The Hartford Mutual Funds II, Inc., including each of the Independent Directors, unanimously voted to approve the continuation of the investment management agreement for The Hartford SmallCap Growth Fund (the “Fund”) with Hartford Funds Management Company, LLC (“HFMC”) and the continuation of the investment sub-advisory agreement between HFMC and the Fund’s sub-adviser, Wellington Management Company, LLP (the “Sub-adviser,” and together with HFMC, the “Advisers”) (collectively, the “Agreements”).
In the months preceding the August 5-6, 2014 meeting, the Board requested, received and reviewed written responses from the Advisers to questions posed to them on behalf of the Independent Directors and supporting materials relating to those questions and responses. The Board considered information furnished to the Board at its meetings throughout the year, as well as information specifically prepared in connection with the annual approval of the Agreements at the Board’s meetings held on June 17-18, 2014 and August 5-6, 2014. Information provided to the Board at its meetings throughout the year included, among other things, reports on Fund performance, legal and compliance matters, sales and marketing activity, shareholder services, and the other services provided to the Fund by the Advisers and their affiliates. The Board also received in-person presentations by Fund officers and representatives of HFMC at the Board’s meetings on June 17-18, 2014 and August 5-6, 2014 concerning the Agreements.
The Independent Directors, advised by independent legal counsel, engaged service providers to assist them with evaluating the Agreements with respect to the Fund. Lipper Inc. (“Lipper”), an independent provider of investment company data, was retained to provide the Board with reports on how the Fund’s contractual management fees, actual management fees, other non-management fees, overall expense ratios and investment performance compared to those of mutual funds with similar investment objectives. The Independent Directors also engaged an independent financial services consultant (the “Consultant”) to assist them in evaluating the Fund’s management fees, sub-advisory fees, other non-management fees, overall expense ratios and investment performance. In addition, the Consultant reviewed the profitability calculations utilized by HFMC in connection with the continuation of the investment management agreement.
In determining whether to continue the Agreements for the Fund, the members of the Board reviewed and evaluated information and factors they believed to be relevant and appropriate in light of the information that the Board deemed necessary and appropriate through the exercise of its reasonable business judgment. While individual members of the Board may have weighed certain factors differently, the Board’s determination to continue the Agreements was based on a comprehensive consideration of all information provided to the Board throughout the year and specifically with respect to the continuation of the Agreements. A more detailed discussion of the factors the Board considered with respect to its approval of the Agreements is provided below.
Nature, Extent and Quality of Services Provided by the Advisers
The Board requested and considered information concerning the nature, extent and quality of the services provided to the Fund by the Advisers. The Board considered, among other things, the terms of the Agreements and the range of services provided by the Advisers. The Board considered the Advisers’ professional personnel who provide services to the Fund, including each Adviser’s ability and experience in attracting and retaining qualified personnel to service the Fund. The Board considered each Adviser’s reputation and overall financial strength, as well as its willingness to consider and implement organizational and operational changes designed to enhance services to the Hartford Funds. In addition, the Board considered the quality of each Adviser’s communications with the Board and responsiveness to Board inquiries and requests made from time to time with respect to the Fund and other Hartford Funds.
The Board also requested and evaluated information concerning each Adviser’s regulatory and compliance environment. In this regard, the Board requested and reviewed information on each Adviser’s compliance policies and procedures, compliance history, and a report from the Fund’s Chief Compliance Officer on each Adviser’s compliance with applicable laws and regulations, including responses to regulatory developments and compliance issues raised by regulators. The Board also noted the Advisers’ support of the Fund’s compliance control structure, particularly the resources devoted by the Advisers in support of the Fund’s obligations pursuant to Rule 38a-1 under the 1940 Act.
With respect to HFMC, the Board noted that, under the Agreements, HFMC is responsible for the management of the Fund, including oversight of fund operations and service providers, and provides administrative and investment advisory services in connection with selecting, monitoring and supervising the Sub-adviser. The Board considered HFMC’s ongoing monitoring of people, process and performance, including its quarterly reviews of each of the Hartford Funds, semi-annual meetings with the leaders of each Fund’s portfolio management team, and oversight of the Hartford Funds’ approximately 66 portfolio managers. The Board recognized that HFMC has demonstrated a record of making changes to the
| The Hartford SmallCap Growth Fund |
| Approval of Investment Management and Investment Sub-Advisory Agreements (Unaudited) – (continued) |
management and/or strategies of the Hartford Funds when warranted. The Board considered HFMC’s oversight of the Sub-adviser’s investment approach and results, process for monitoring best execution of portfolio trades by the Sub-adviser, and approach to risk management with respect to the Fund and the service providers to the Fund. The Board also considered HFMC’s oversight of compliance with the Fund’s objective and policies as well as with applicable laws and regulations, noting that regulatory and other developments had over time led to an increase in the scope of HFMC’s services in this regard.
In addition, the Board considered HFMC’s ongoing commitment to review and rationalize the Hartford Funds product line-up and the expenses that HFMC had incurred in connection with fund combinations in recent years. The Board considered that HFMC or its affiliates are responsible for providing the Fund’s officers.
With respect to the Sub-adviser, which provides certain day-to-day portfolio management services for the Fund, the Board considered the quality of the Fund’s portfolio managers, the Sub-adviser’s other investment personnel, its investment philosophy and process, investment research capabilities and resources, performance record, trade execution capabilities and experience. The Board considered the experience of the Fund’s portfolio managers, the number of accounts managed by the portfolio managers, and the Sub-adviser’s method for compensating the portfolio managers.
Based on these considerations, the Board concluded that it was satisfied with the nature, extent and quality of the services provided to the Fund by HFMC and the Sub-adviser.
Performance of the Fund and the Advisers
The Board considered the investment performance of the Fund. In this regard, the Board reviewed the performance of the Fund over different time periods presented in the materials and evaluated HFMC’s analysis of the Fund’s performance for these time periods. The Board considered information and materials provided to the Board by the Advisers concerning Fund performance, as well as information from Lipper comparing the investment performance of the Fund to an appropriate benchmark and universe of peer funds. The Board noted that the Fund’s performance was in the 2nd quintile of its performance universe for the 1-year period and the 1st quintile for the 3- and 5-year periods. The Board also noted that the Fund’s performance was above its benchmark for the 1-, 3- and 5-year periods.
The Board considered the detailed investment analytics reports provided by Hartford Funds’ Investment Advisory Group throughout the year. These reports include, among other things, information on the Fund’s gross and net returns, the Fund’s investment performance relative to an appropriate benchmark and peer group, various statistics concerning the Fund’s portfolio, and a narrative summary of various factors affecting Fund performance. The Board considered the Advisers’ cooperation with the Investment Committee, which assists the Board in evaluating the performance of the Fund at periodic meetings throughout the year. The Board also considered the analysis provided by the Consultant relating to the Fund’s performance track record.
In light of all the considerations noted above, the Board concluded that it had continued confidence in HFMC’s and the Sub-adviser’s overall capabilities to manage the Fund.
Costs of the Services and Profitability of the Advisers
The Board reviewed information regarding HFMC’s cost to provide investment management and related services to the Fund and HFMC’s profitability, both overall and for the Fund, on a pre-tax basis without regard to distribution expenses. The Board also requested and reviewed information about the profitability to HFMC and its affiliates from all services provided to the Fund and all aspects of their relationship with the Fund. The Board also requested and received information relating to the operations and profitability of the Sub-adviser.
The Board considered the Consultant’s review of the profitability calculations used by HFMC in connection with the continuation of the investment management agreement, noting the Consultant’s view that Hartford Funds’ process for calculating and reporting Fund profitability is reasonable. In this regard, the Board noted that the Consultant performed a full review of this process in light of the recent restructuring of the Hartford Funds business and reported that the approach to analyzing Fund profitability, including the use of common expense allocation methodologies, is reasonable, sound and well within common industry practice.
Based on these considerations, the Board concluded that the profits anticipated to be realized by the Advisers and their affiliates from their relationships with the Fund would not be excessive.
| The Hartford SmallCap Growth Fund |
| Approval of Investment Management and Investment Sub-Advisory Agreements (Unaudited) – (continued) |
Comparison of Fees and Services Provided by the Advisers
The Board considered comparative information with respect to the management fees to be paid by the Fund to HFMC and the total expense ratios of the Fund. The Board also considered comparative information with respect to the sub-advisory fees to be paid by HFMC to the Sub-adviser. In this regard, the Board requested and reviewed information from HFMC and the Sub-adviser relating to the management and sub-advisory fees, including the sub-advisory fee schedule for the Fund, and total operating expenses for the Fund. With respect to the sub-advisory fee schedule, the Board considered representations from HFMC and the Sub-adviser that the Sub-adviser’s fees were negotiated at arm’s length on a fund-by-fund basis. The Board also reviewed information from Lipper comparing the Fund’s contractual management fees, actual management fees and overall expense ratios relative to a group of funds selected by Lipper, in consultation with the Consultant, and a broader universe of funds selected by Lipper. The Board considered that the Fund’s contractual management fee was in the 2nd quintile of its expense group, while its actual management fee and total expenses (less 12b-1 and shareholder service fees) were in the 3rd quintile. The Board noted that the Fund has an automatically renewable contractual expense cap on each share class.
While the Board recognized that comparisons between the Fund and peer funds may be imprecise, given the different service levels and characteristics of mutual funds and the different business models and cost structures of the Advisers, the comparative information provided by Lipper assisted the Board in evaluating the reasonableness of the Fund’s management and sub-advisory fees and total operating expenses. In addition, the Board considered the analysis and recommendations of the Consultant relating to the Fund’s management and sub-advisory fees and total operating expenses.
Based on these considerations, the Board concluded that the Fund’s fees and total operating expenses, in conjunction with the information about quality of services, profitability, economies of scale, and other matters discussed, were reasonable in light of the services provided.
Economies of Scale
The Board requested and considered information regarding the Advisers’ realization of economies of scale with respect to the Fund and whether the fee levels reflect these economies of scale for the benefit of the Fund’s shareholders. The Board reviewed the breakpoints in the management fee schedule for the Fund, which reduce fee rates as Fund assets grow over time. The Board recognized that a fund with assets beyond the highest breakpoint level will continue to benefit from economies of scale because additional assets are charged the lowest breakpoint fee resulting in lower overall effective management fee rates. The Board also considered that expense limitations and fee waivers that reduce the Fund’s expenses at all asset levels can have the same effect as breakpoints in sharing economies of scale with shareholders and provide protection from an increase in expenses if Fund assets decline. The Board recognized that a fee schedule that reaches a lower breakpoint quickly provides shareholders with the benefit of anticipated or potential economies of scale. The Board also considered that HFMC has been active in managing expenses, which has resulted in benefits being realized by shareholders as assets within the Hartford Funds family of funds have grown over time, including through lower transfer agent costs and other operating expenses.
The Board reviewed and evaluated materials from Lipper and the Consultant showing how management fee schedules of peer funds reflect economies of scale for the benefit of shareholders as a peer fund’s assets hypothetically increase over time. Based on information provided by HFMC, Lipper, and the Consultant, the Board recognized that there is no uniform methodology for establishing breakpoints or uniform pattern in asset levels that trigger breakpoints or the amounts of breakpoints triggered.
After considering all of the information available to it, the Board concluded that it was satisfied with the extent to which economies of scale would be shared for the benefit of the Fund’s shareholders based on currently available information and the effective advisory fees and expense ratios for the Fund at its current and reasonably anticipated asset levels. The Board noted, however, that it would continue to monitor future growth in Fund assets and the appropriateness of additional breakpoints.
Other Benefits
The Board considered other benefits to the Advisers and their affiliates from their relationships with the Fund.
The Board noted that HFMC receives fees for fund accounting and related services from the Fund, and the Board considered information on profits to HFMC for such services. The Board also considered that Hartford Administrative Services Company (“HASCO”), the Fund’s transfer agent and an affiliate of HFMC, receives transfer agency compensation from the Fund, and the Board reviewed information on the profitability of the Fund’s transfer agency function to HASCO. The Board considered information provided by HASCO indicating that the transfer agent fees charged by HASCO to the Fund were fair and reasonable based on publicly available information.
| The Hartford SmallCap Growth Fund |
| Approval of Investment Management and Investment Sub-Advisory Agreements (Unaudited) – (continued) |
The Board also considered that Hartford Funds Distributors, LLC (“HFD”), an affiliate of HFMC, serves as principal underwriter of the Fund. As principal underwriter, HFD receives 12b-1 fees from the Fund and receives all or a portion of the sales charges on sales or redemptions of certain classes of shares. The Board also noted that certain affiliates of HFD distribute shares of the Fund and receive compensation in that connection.
The Board considered benefits to the Sub-adviser from its use of the Fund’s brokerage commissions to obtain soft dollar research, and representations from HFMC and the Sub-adviser that the Sub-adviser would not make any revenue-sharing payments or any other type of distribution payments to HFMC or its affiliates.
The Board considered the benefits to shareholders of being part of the Hartford Funds family of funds, including the right to exchange investments between the same class of funds without a sales charge, the ability to reinvest Fund dividends into other funds in the family, and the ability to combine holdings in the Fund with holdings in other funds to obtain a reduced sales charge. The Board considered HFMC’s efforts to provide investors in the family with a broad range of investment styles and asset classes and its entrepreneurial risk in initiating new funds to expand these opportunities for shareholders.
* * * *
Based upon its review of these various factors, among others, the Board concluded that it is in the best interests of the Fund and its shareholders for the Board to approve the Agreements for an additional year. In reaching this decision, the Board did not assign relative weights to the factors discussed above or deem any one or group of them to be controlling in and of themselves. In connection with their deliberations, the Independent Directors met separately in executive session on several occasions, with independent legal counsel and the Consultant, to review the relevant materials and consider their responsibilities under relevant laws and regulations.
| The Hartford SmallCap Growth Fund |
| Main Risks (Unaudited) |
The main risks of investing in the Fund are described below.
Market, Selection and Strategy Risk: The Fund’s share price may fluctuate due to market risk and/or security selections that may underperform the market or relevant benchmarks. If the sub-adviser's investment strategy does not perform as expected, the Fund could underperform its peers or lose money. There is no guarantee the Fund will achieve its stated objective.
Small-Cap Stock Risk: Small-cap stocks are generally more volatile and risky and may be less liquid than large-cap stocks because they may have limited operating histories, narrow product lines, and focus on niche markets.
Growth Investing Risk: Growth investments can be volatile, and may fail to increase earnings or grow as quickly as anticipated. Growth-style investing falls in and out of favor, which may result in periods of underperformance.
Foreign Investment Risk: Investments in foreign securities may be riskier than investments in U.S. securities. Potential risks include the risks of illiquidity, increased price volatility, less government regulation, less extensive and less frequent accounting and other reporting requirements, unfavorable changes in currency exchange rates, and economic and political disruptions.
Active Trading Risk: Actively trading investments may result in higher costs and higher taxable income.
THIS PRIVACY POLICY IS NOT PART OF THIS REPORT
Privacy Policy and Practices of The Hartford Financial Services Group, Inc. and its Affiliates
(herein called “we, our and us”)
This Privacy Policy applies to our United States Operations
We value your trust. We are committed to the responsible: a) management; b) use; and c) protection; of Personal Information. This notice describes how we collect, disclose, and protect Personal Information. We collect Personal Information to: a) service your Transactions with us; and b) support our business functions. We may obtain Personal Information from: a) You; b) your Transactions with us; and c) third parties such as a consumer-reporting agency. Based on the type of product or service You apply for or get from us, Personal Information such as: a) your name; b) your address; c) your income; d) your payment; or e) your credit history; may be gathered from sources such as applications, Transactions, and consumer reports. To serve You and service our business, we may share certain Personal Information. We will share Personal Information, only as allowed by law, with affiliates such as: a) our insurance companies; b) our employee agents; c) our brokerage firms; and d) our administrators. As allowed by law, we may share Personal Financial Information with our affiliates to: a) market our products; or b) market our services; to You without providing You with an option to prevent these disclosures. | We may also share Personal Information, only as allowed by law, with unaffiliated third parties including: a) independent agents; b) brokerage firms; c) insurance companies; d) administrators; and e) service providers; who help us serve You and service our business. When allowed by law, we may share certain Personal Financial Information with other unaffiliated third parties who assist us by performing services or functions such as: a) taking surveys; b) marketing our products or services; or c) offering financial products or services under a joint agreement between us and one or more financial institutions. We, and third parties we partner with, may track some of the pages You visit through the use of: a) cookies; b) pixel tagging; or c) other technologies; and currently do not process or comply with any web browser’s “do not track” signal or similar mechanism that indicates a request to disable online tracking of individual users who visit our websites or use our services. We will not sell or share your Personal Financial Information with anyone for purposes unrelated to our business functions without offering You the opportunity to: a) “opt-out;” or b) “opt-in;” as required by law. We only disclose Personal Health Information with: a) your proper written authorization; or b) as otherwise allowed or required by law. Our employees have access to Personal Information in the course of doing their jobs, such as: a) underwriting policies; b) paying claims; c) developing new products; or d) advising customers of our products and services. |
We use manual and electronic security procedures to maintain: a) the confidentiality; and b) the integrity of; Personal Information that we have. We use these procedures to guard against unauthorized access. Some techniques we use to protect Personal Information include: a) secured files; b) user authentication; c) encryption; d) firewall technology; and e) the use of detection software. We are responsible for and must: a) identify information to be protected; b) provide an adequate level of protection for that data; c) grant access to protected data only to those people who must use it in the performance of their job-related duties. Employees who violate our Privacy Policy will be subject to discipline, which may include ending their employment with us. At the start of our business relationship, we will give You a copy of our current Privacy Policy. We will also give You a copy of our current Privacy Policy once a year if You maintain a continuing business relationship with us. We will continue to follow our Privacy Policy regarding Personal Information even when a business relationship no longer exists between us. | As used in this Privacy Notice: Application means your request for our product or service. Personal Financial Information means financial information such as: a) credit history; b) income; c) financial benefits; or d) policy or claim information. Personal Health Information means health information such as: a) your medical records; or b) information about your illness, disability or injury. Personal Information means information that identifies You personally and is not otherwise available to the public. It includes: a) Personal Financial Information; and b) Personal Health Information. Transaction means your business dealings with us, such as: a) your Application; b) your request for us to pay a claim; and c) your request for us to take an action on your account. You means an individual who has given us Personal Information in conjunction with: a) asking about; b) applying for; or c) obtaining; a financial product or service from us if the product or service is used mainly for personal, family, or household purposes. |
This Privacy Policy is being provided on behalf of the following affiliates of The Hartford Financial Services Group, Inc.:
1stAGChoice, Inc.; Access CoverageCorp, Inc.; Access CoverageCorp Technologies, Inc.; American Maturity Life Insurance Company; Archway 60 R, LLC; Business Management Group, Inc.; Champlain Life Reinsurance Company; DMS R, LLC; Eloy R, LLC; Ersatz Corporation; First State Insurance Company; Hartford Accident and Indemnity Company; Hartford Administrative Services Company; Hartford Casualty General Agency, Inc.; Hartford Casualty Insurance Company; Hartford-Comprehensive Employee Benefit Service Company; Hartford Equity Sales Company, Inc.; Hartford Fire General Agency, Inc.; Hartford Fire Insurance Company; Hartford Funds Management Company, LLC; Hartford Funds Management Group, Inc.; Hartford HLS Series Fund II, Inc.; Hartford Insurance Company of Illinois; Hartford Insurance Company of the Midwest; Hartford Insurance Company of the Southeast; Hartford Integrated Technologies, Inc.; Hartford International Life Reassurance Corporation; Hartford Funds Distributors, LLC; Hartford Investment Management Company; Hartford Life and Accident Insurance Company; Hartford Life and Annuity Insurance Company; Hartford Life Insurance Company; Hartford Life Private Placement, LLC; Hartford Lloyd’s Corporation; Hartford Lloyd’s Insurance Company; Hartford Mezzanine Investors I, LLC; Hartford Residual Market, L.C.C.; Hartford Retirement Services, LLC; Hartford Securities Distribution Company, Inc.; Hartford Series Fund, Inc.; Hartford Specialty Insurance Services of Texas, LLC; Hartford Strategic Investments, LLC; Hartford Underwriters Insurance Company; Hartford Technology Services Company, L.L.C.; Hartford of Texas General Agency, Inc.; Hartford Underwriters General Agency, Inc.; HARTRE Company, L.C.C.; HL Investment Advisors, LLC; HLA LLC; Horizon Management Group, LLC; HRA Brokerage Services, Inc.; Lanidex Class B, LLC; M-CAP Insurance Agency, LLC; New England Insurance Company; New England Reinsurance Corporation; Nutmeg Insurance Agency, Inc.; Nutmeg Insurance Company; Pacific Insurance Company, Limited; Planco, LLC: Property and Casualty Insurance Company of Hartford; Revere R, LLC; RVR R, LLC; Sentinel Insurance Company, Ltd.; Sunstone R, LLC; Symphony R, LLC; The Evergreen Group Incorporated; The Hartford Alternative Strategies Fund; The Hartford Mutual Funds, Inc.; The Hartford Mutual Funds II, Inc.; Trumbull Flood Management, L.L.C.; Trumbull Insurance Company; Twin City Fire Insurance Company; White River Life Reinsurance Company.
HPP Revised January 2014
HARTFORDFUNDS
hartfordfunds.com
This information is written in connection with the promotion or marketing of the matter(s) addressed in this material.
This report is submitted for the general information of the shareholders of the Fund. It is not authorized for distribution unless preceded or accompanied by a current prospectus for the Fund.
The information cannot be used or relied upon for the purpose of avoiding IRS penalties. These materials are not intended to provide tax, accounting or legal advice. As with all matters of a tax or legal nature, you should consult your own tax or legal counsel for advice.
Investors should carefully consider the investment objectives, risks, charges, and expenses of Hartford Funds before investing. This and other information can be found in the prospectus and summary prospectus, which can be obtained by calling 888-843-7824 (retail) or 800-279-1541 (institutional). Investors should read them carefully before they invest.
Hartford Funds are underwritten and distributed by Hartford Funds Distributors, LLC.
MFAR-SCG14 12/14 113998-3 Printed in U.S.A.
HARTFORDFUNDS
| THE HARTFORD VALUE OPPORTUNITIES FUND 2014 Annual Report |
A MESSAGE FROM THE PRESIDENT
Dear Fellow Shareholders:
Thank you for investing in Hartford Funds.
Market Review
U.S. equities (as represented by the S&P 500 Index) rose steadily for the fiscal year ended October 31, 2014, with a return of 17.27% for the period. With the exception of short-lived geopolitical scares early in 2014 and concerns about continuing global growth near the end of the period, stocks generally rose on solid fundamentals and encouraging macroeconomic data during the year.
September 2014 marked the six-year anniversary of the start of the financial crisis. Within weeks of that anniversary, both the S&P 500 Index and the Dow Jones Industrial Average set new all-time highs, closing at 2,018 and 17,391, respectively, on October 31. Although the fallout of the crisis continues to influence investor behavior, stocks have recovered and risen dramatically, up 198% from their low in March 2009. Meanwhile, the domestic economy is notching strong growth, and the unemployment rate has reached its lowest level since August 2008.
While the U.S. economy appears to have stabilized and to have reverted to a solid growth path, the outlook for the global economy appears to have gotten cloudier. The U.S. Federal Reserve has ended quantitative easing, while Europe and Japan are pursuing stimulus options to avoid a double-dip recession and deflation, respectively. Diverging central-bank policies will likely continue to play an important role in market movements going forward as investors wait to see the reactions to their efforts and their impacts on global markets.
How have market movements impacted your portfolio throughout the last year? Are your investments still on track to provide the growth or income you need, and are you comfortable with their progress during times of volatility?
Your financial professional can help you navigate today’s markets with confidence, as well as assist you to achieve your investment goals by providing advice on the best options within our fund family to help you work toward overcoming today’s investing challenges. Meet with your financial advisor regularly to examine your portfolio and your investment strategy, and to determine if you’re still on track to meet your goals.
Thank you again for investing with Hartford Funds.
James Davey
President
Hartford Funds
1 The S&P 500 Index is a market capitalization-weighted price index composed of 500 widely held common stocks.
2 The Dow Jones Industrial Average is an unmanaged, price-weighted index of 30 of the largest, most widely held stocks traded on the NYSE
The Hartford Value Opportunities Fund
Table of Contents
The views expressed in the Fund’s Manager Discussion under ‘‘Why did the Fund perform this way?’’ and ‘‘What is the outlook?’’ are views of the Fund’s sub-adviser and portfolio management team through the end of the period and are subject to change based on market and other conditions. The Fund’s Manager Discussion is for informational purposes only and does not represent an offer, recommendation or solicitation to buy, hold or sell any security. The specific securities identified and described, if any, do not represent all of the securities purchased or sold and you should not assume that investments in the securities identified and discussed will be profitable.
| The Hartford Value Opportunities Fund inception 01/02/1996 |
| (sub-advised by Wellington Management Company, LLP) |
| |
| Investment objective – The Fund seeks capital appreciation. |
Performance Overview 10/31/04 - 10/31/14
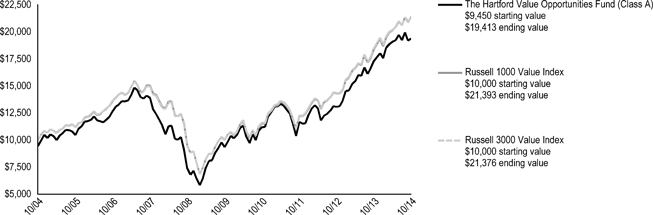
The chart above represents the hypothetical growth of a $10,000 investment in Class A, which includes a sales charge. Growth results in classes other than Class A will vary from what is seen above due to differences in the expenses charged to those share classes.
| Average Annual Total Returns (as of 10/31/14) |
| | | 1 Year | | 5 Years | | 10 Years |
| Value Opportunities A# | | | 12.18 | % | | | 15.72 | % | | | 7.46 | % |
| Value Opportunities A## | | | 6.01 | % | | | 14.42 | % | | | 6.86 | % |
| Value Opportunities B# | | | 11.37 | % | | | 14.86 | % | | | 6.90 | %* |
| Value Opportunities B## | | | 6.37 | % | | | 14.63 | % | | | 6.90 | %* |
| Value Opportunities C# | | | 11.36 | % | | | 14.86 | % | | | 6.66 | % |
| Value Opportunities C## | | | 10.36 | % | | | 14.86 | % | | | 6.66 | % |
| Value Opportunities I# | | | 12.56 | % | | | 16.05 | % | | | 7.71 | % |
| Value Opportunities R3# | | | 11.84 | % | | | 15.46 | % | | | 7.31 | % |
| Value Opportunities R4# | | | 12.24 | % | | | 15.81 | % | | | 7.57 | % |
| Value Opportunities R5# | | | 12.52 | % | | | 16.14 | % | | | 7.82 | % |
| Value Opportunities Y# | | | 12.64 | % | | | 16.18 | % | | | 7.89 | % |
| Russell 1000 Value Index | | | 16.46 | % | | | 16.49 | % | | | 7.90 | % |
| Russell 3000 Value Index | | | 15.76 | % | | | 16.47 | % | | | 7.89 | % |
| # | Without sales charge |
| ## | With sales charge |
| * | Class B shares convert to Class A shares after 8 years. The return shown reflects the conversion to Class A shares, which had different operating expenses, for the period after conversion. |
PERFORMANCE DATA QUOTED REPRESENTS PAST PERFORMANCE AND DOES NOT GUARANTEE FUTURE RESULTS. The investment return and principal value of the investment will fluctuate so that investors’ shares, when redeemed, may be worth more or less than their original cost. Current performance may be lower or higher than the performance data quoted. To obtain performance data current to the most recent month-end, please visit our website www.hartfordfunds.com.
The initial investment in Class A shares reflects the maximum sales charge of 5.50% and returns for Class B shares reflect a contingent deferred sales charge of up to 5.00% and declining to zero, depending on the period of time the shares are held. Returns for Class C shares reflect a contingent deferred sales charge of up to 1.00% on shares redeemed within twelve months of purchase.
Total returns presented above were calculated using the Fund’s net asset value available to shareholders for sale or redemption of Fund shares on October 31, 2014, which may exclude investment transactions as of this date. All share class returns assume the reinvestment of all distributions at net asset value and the deduction of all fund expenses.
Effective 9/30/09, Class B shares of the Fund were closed to new investments.
Class I shares commenced operations on 8/31/06. Performance prior to that date is that of the Fund's Class A shares (excluding sales charges), which had different operating expenses. Class R3, R4 and R5 shares commenced operations on 12/22/06. Performance prior to that date is that of the Fund's Class Y shares, which had different operating expenses.
Russell 1000 Value Index is an unmanaged index that measures the performance of those Russell 1000 Index companies with lower price-to-book ratios and lower forecasted growth values. The Russell 1000 Index is an unmanaged index that measures the performance of the 1,000 largest companies in the Russell 3000 Index, which measures the performance of the 3,000 largest U.S. companies, based on total market capitalizations.
Russell 3000 Value Index is an unmanaged index that measures the performance of those Russell 3000 Index companies with lower price-to-book ratios and lower forecasted growth values. The Russell 3000 Index is an unmanaged index that measures the performance of the 3,000 largest U.S. companies based on total market capitalization.
You cannot invest directly in an index.
The chart and table do not reflect the deductions of taxes that a shareholder would pay on Fund distributions or the redemption of Fund shares.
Performance information may reflect historical or current expense waivers/reimbursements from the investment adviser, without which performance would have been lower. For information on current expense waivers/reimbursements, please see the prospectus.
The Hartford Value Opportunities Fund
Manager Discussion
October 31, 2014 (Unaudited)
Operating Expenses*
| | | Net | | | Gross | |
| Value Opportunities Class A | | | 1.22 | % | | | 1.35 | % |
| Value Opportunities Class B | | | 1.92 | % | | | 2.30 | % |
| Value Opportunities Class C | | | 1.92 | % | | | 2.04 | % |
| Value Opportunities Class I | | | 0.98 | % | | | 0.98 | % |
| Value Opportunities Class R3 | | | 1.45 | % | | | 1.59 | % |
| Value Opportunities Class R4 | | | 1.15 | % | | | 1.23 | % |
| Value Opportunities Class R5 | | | 0.85 | % | | | 0.93 | % |
| Value Opportunities Class Y | | | 0.80 | % | | | 0.82 | % |
* As shown in the Fund's current prospectus dated March 1, 2014. Actual expenses may be higher or lower. Please see accompanying Financial Highlights for expense ratios for the year ended October 31, 2014.
Gross expenses are the Fund's total annual operating expenses shown in the Fund's most recent prospectus. Net expenses are the Fund's total annual operating expenses shown in the Fund's most recent prospectus and reflect contractual expense waivers/reimbursements in instances when these reductions reduce the Fund's gross expenses. Certain contractual waivers/reimbursements remain in effect until February 28, 2015. Other contractual waivers/reimbursements remain in effect until February 28, 2015, and automatically renew for one-year terms unless terminated.
All investments are subject to risk including the possible loss of principal. For a discussion of the Fund’s risks, please see the Main Risks section of this report. For more detailed information on the risks associated with an investment in the Fund, please see the prospectus.
| Portfolio Managers | |
| David W. Palmer, CFA | James N. Mordy |
| Senior Vice President and Equity Portfolio Manager | Senior Vice President and Equity Portfolio Manager |
| | |
How did the Fund perform?
The Class A shares of The Hartford Value Opportunities Fund returned 12.18%, before sales charge, for the twelve-month period ended October 31, 2014, underperforming the Fund’s benchmark, the Russell 3000 Value Index, which returned 15.76% for the same period. The Fund underperformed the Russell 1000 Value Index, the Fund’s other benchmark, which returned 16.46% for the same period. The Fund also underperformed the 12.46% average return of the Lipper Multi Cap Value Fund peer group, a group of funds with investment strategies similar to those of the Fund.
Why did the Fund perform this way?
The S&P 500 Index surged during the period, despite bouts of significant volatility. After finishing its best year since 1997, the S&P 500 Index began 2014 with its worst month in nearly two years. Worries about a slowdown in China and general angst surrounding emerging markets overshadowed a fairly benign domestic environment. However, robust merger and acquisition activity and an uncontested increase in the debt ceiling from Congress helped stoke investors' risk appetites in February. The rally continued in May amid renewed signs of life in the housing market and the best payroll gain in more than two years. However, a pullback in July ended a streak of five consecutive monthly gains. Fear gripped the market as heightened geopolitical risks, a potential Portuguese banking crisis, and worries of U.S. Federal Reserve tightening took center stage. Stocks rebounded in August as investors were emboldened by encouraging economic data, headlined by better-than-expected Gross Domestic Product growth and signs that the housing recovery still had legs. In September, U.S. equities retreated for just the third month this year. Despite solid manufacturing and consumer confidence readings, the reality of quantitative easing ending and the prospect of higher federal funds rates in mid-2015 contributed to increased risk aversion levels. Stocks finished a volatile October at an all-time high on the heels of a positive earnings season and generally solid economic data. Returns also varied noticeably by market-cap, as small- and mid-cap stocks underperformed large-cap stocks. The style indices were mixed during the period with the Russell 3000 Growth Index outperforming the Russell 3000 Value Index, but both indices trailed the broader S&P 500 Index.
All ten sectors within the Russell 3000 Value Index posted positive returns during the period. Information Technology (+29%), Healthcare (+25%), and Utilities (+21%) were top performers while Energy (+3%), Telecommunication Services (+4%), and Consumer Discretionary (+10%) lagged on a relative basis.
Security selection was the primary driver of the Fund’s relative underperformance. Security selection was weak within Energy, Information Technology, and Industrials, but this was partially offset by strong selection in Financials and Healthcare. Sector allocation, a fall-out of the bottom-up stock selection process, also detracted from relative returns due primarily to overweights to Energy and Materials. A modest cash position detracted in an upward trending environment.
The largest detractors from both absolute and relative performance included Cobalt (Energy), KBR (Industrials), and Trican Well Services (Energy). Shares of Cobalt, a U.S.-based oil-focused exploration and production company, declined due to disappointing well test results at multiple wells, uncertainty surrounding the impact of the SEC’s investigation into its Angola operations, and negative investor sentiment for the subsector. KBR, a global engineering, construction, and services company, underperformed on disappointing quarterly earnings results and news that it failed to win any of the large liquefied natural gas projects in North America that the company had targeted. Shares of Trican Well Services, supplier of pressure pumping services to the oil and gas industry, declined
The Hartford Value Opportunities Fund
Manager Discussion – (continued)
October 31, 2014 (Unaudited)
along with the broader energy sector despite beating consensus earnings and revenue estimates.
The largest contributors to relative performance were Skyworks Solutions (Information Technology), Vertex Pharmaceuticals (Healthcare), and General Electric (Industrials). Shares of Skyworks Solutions, a supplier of mixed-signal analog semiconductors, rose due to market share and content gains across multiple handset platforms. Vertex Pharmaceuticals, a biopharmaceutical company focusing on cancer and neurodegenerative diseases, saw shares outperform as the company launched its product to treat cystic fibrosis patients. General Electric is a U.S.-based multinational conglomerate operating in the technology infrastructure, capital finance, and consumer and industrial products industries. Shares have fallen as the company is struggling with slow growth and increased competition; not holding this Russell 3000 Value Index constituent contributed to relative performance. Top contributors on an absolute basis also included Merck (Healthcare) and Aetna (Healthcare).
Derivatives are not used in a significant manner in this Fund and did not have a material impact on performance during the period.
What is the outlook?
The shift in investor assumptions towards slower non-U.S. growth, spurred by events such as the Russia-Ukraine conflict and Chinese property pricing weakness, and reflected in currency volatility and plunging European interest rates, appears to have negatively affected the valuation of many cyclical stocks. We saw several interesting opportunities to initiate positions–or add to existing holdings–in economically-sensitive companies during the period. As a result, the pro-cyclical stance of the Fund increased modestly, although it still remained within our historic ranges. Wellington Management’s macroeconomic group still forecasts a muted global expansion, though that growth appears strongest in the U.S., while other geographies, including Europe, Japan and China, have seen more mixed data, and appear more dependent on monetary stimulus and currency debasement to maintain forward progress. The dollar has strengthened against this backdrop, and we have found some foreign assets more attractive as a result. At the end of the period, the Fund was most overweight Energy, Materials, and Consumer Discretionary and most underweight Healthcare, Industrials, and Financials relative to the Russell 3000 Value Index.
Diversification by Sector
as of October 31, 2014
| Sector | | Percentage of
Net Assets | |
| Equity Securities | | | | |
| Consumer Discretionary | | | 8.8 | % |
| Consumer Staples | | | 6.5 | |
| Energy | | | 15.3 | |
| Financials | | | 28.0 | |
| Health Care | | | 9.4 | |
| Industrials | | | 8.2 | |
| Information Technology | | | 10.0 | |
| Materials | | | 6.8 | |
| Services | | | 1.4 | |
| Utilities | | | 4.5 | |
| Total | | | 98.9 | % |
| Short-Term Investments | | | 0.5 | |
| Other Assets and Liabilities | | | 0.6 | |
| Total | | | 100.0 | % |
A sector may be comprised of several industries. For Fund compliance purposes, the Fund may not use the same classification system and these sector classifications are used for reporting ease.
The Hartford Value Opportunities Fund
Schedule of Investments
October 31, 2014
(000’s Omitted)
| Shares or Principal Amount | | Market Value ╪ | |
| Common Stocks - 98.9% | |
| | | | | Banks - 2.2% | | | | |
| | 86 | | | PNC Financial Services Group, Inc. | | $ | 7,434 | |
| | | | | | | | | |
| | | | | Capital Goods - 5.5% | | | | |
| | 3 | | | Alliant Techsystems, Inc. | | | 386 | |
| | 47 | | | Eaton Corp. plc | | | 3,208 | |
| | 62 | | | Generac Holdings, Inc. ● | | | 2,793 | |
| | 75 | | | KBR, Inc. | | | 1,425 | |
| | 16 | | | Raytheon Co. | | | 1,704 | |
| | 134 | | | Rexel S.A. | | | 2,248 | |
| | 17 | | | Sulzer AG | | | 1,883 | |
| | 60 | | | WESCO International, Inc. ● | | | 4,913 | |
| | | | | | | | 18,560 | |
| | | | | Commercial and Professional Services - 1.5% | | | | |
| | 265 | | | Knoll, Inc. | | | 5,272 | |
| | | | | | | | | |
| | | | | Consumer Durables and Apparel - 4.2% | | | | |
| | 96 | | | D.R. Horton, Inc. | | | 2,190 | |
| | 147 | | | Electrolux AB Series B | | | 4,154 | |
| | 74 | | | Lennar Corp. | | | 3,175 | |
| | 55 | | | Toll Brothers, Inc. ● | | | 1,750 | |
| | 138 | | | Vera Bradley, Inc. ● | | | 3,144 | |
| | | | | | | | 14,413 | |
| | | | | Consumer Services - 2.5% | | | | |
| | 27 | | | Las Vegas Sands Corp. | | | 1,681 | |
| | 120 | | | Norwegian Cruise Line Holdings Ltd. ● | | | 4,661 | |
| | 357 | | | Sands China Ltd. | | | 2,228 | |
| | | | | | | | 8,570 | |
| | | | | Diversified Financials - 9.6% | | | | |
| | 156 | | | Citigroup, Inc. | | | 8,370 | |
| | 217 | | | JP Morgan Chase & Co. | | | 13,117 | |
| | 81 | | | Julius Baer Group Ltd. | | | 3,568 | |
| | 65 | | | Northern Trust Corp. | | | 4,310 | |
| | 62 | | | Raymond James Financial, Inc. | | | 3,475 | |
| | 74 | | | Solar Cayman Ltd. ⌂■●† | | | 5 | |
| | | | | | | | 32,845 | |
| | | | | Energy - 15.3% | | | | |
| | 30 | | | Baker Hughes, Inc. | | | 1,594 | |
| | 178 | | | Cabot Oil & Gas Corp. | | | 5,547 | |
| | 114 | | | Cameco Corp. | | | 1,983 | |
| | 91 | | | Canadian Natural Resources Ltd. ADR | | | 3,167 | |
| | 88 | | | Chevron Corp. | | | 10,520 | |
| | 202 | | | Cobalt International Energy, Inc. ● | | | 2,369 | |
| | 92 | | | Halliburton Co. | | | 5,057 | |
| | 107 | | | HollyFrontier Corp. | | | 4,838 | |
| | 77 | | | National Oilwell Varco, Inc. | | | 5,629 | |
| | 8 | | | Pioneer Natural Resources Co. | | | 1,554 | |
| | 81 | | | QEP Resources, Inc. | | | 2,030 | |
| | 162 | | | Southwestern Energy Co. ● | | | 5,261 | |
| | 267 | | | Trican Well Service Ltd. | | | 2,396 | |
| | | | | | | | 51,945 | |
| | | | | Food and Staples Retailing - 2.2% | | | | |
| | 99 | | | Wal-Mart Stores, Inc. | | | 7,582 | |
| | | | | | | | | |
| | | | | Food, Beverage and Tobacco - 3.5% | | | | |
| | 180 | | | Imperial Tobacco Group plc | | | 7,810 | |
| | 23 | | | Ingredion, Inc. | | | 1,772 | |
| | 574 | | | Treasury Wine Estates Ltd. | | | 2,342 | |
| | | | | | | | 11,924 | |
| | | | | | | | | |
| | | | | Health Care Equipment and Services - 1.0% | | | | |
| | 41 | | | Aetna, Inc. | | | 3,404 | |
| | | | | | | | | |
| | | | | Household and Personal Products - 0.8% | | | | |
| | 164 | | | Coty, Inc. | | | 2,727 | |
| | | | | | | | | |
| | | | | Insurance - 8.8% | | | | |
| | 147 | | | American International Group, Inc. | | | 7,855 | |
| | 252 | | | MetLife, Inc. | | | 13,659 | |
| | 158 | | | Principal Financial Group, Inc. | | | 8,298 | |
| | | | | | | | 29,812 | |
| | | | | Materials - 6.8% | | | | |
| | 84 | | | Barrick Gold Corp. | | | 991 | |
| | 42 | | | Cabot Corp. | | | 1,942 | |
| | 91 | | | Celanese Corp. | | | 5,369 | |
| | 135 | | | Constellium N.V. ● | | | 2,726 | |
| | 113 | | | Reliance Steel & Aluminum | | | 7,598 | |
| | 94 | | | Rio Tinto plc ADR | | | 4,527 | |
| | | | | | | | 23,153 | |
| | | | | Media - 1.2% | | | | |
| | 157 | | | Quebecor, Inc. | | | 4,017 | |
| | | | | | | | | |
| | | | | Pharmaceuticals, Biotechnology and Life Sciences - 8.4% | | | | |
| | 142 | | | Almirall S.A. ● | | | 2,333 | |
| | 28 | | | AstraZeneca plc ADR | | | 2,042 | |
| | 126 | | | Bristol-Myers Squibb Co. | | | 7,304 | |
| | 217 | | | Merck & Co., Inc. | | | 12,572 | |
| | 65 | | | Tesaro, Inc. ● | | | 1,797 | |
| | 21 | | | Vertex Pharmaceuticals, Inc. ● | | | 2,389 | |
| | | | | | | | 28,437 | |
| | | | | Real Estate - 7.4% | | | | |
| | 36 | | | AvalonBay Communities, Inc. REIT | | | 5,610 | |
| | 33 | | | Boston Properties, Inc. REIT | | | 4,140 | |
| | 80 | | | Equity Lifestyle Properties, Inc. REIT | | | 3,949 | |
| | 57 | | | Plum Creek Timber Co., Inc. REIT | | | 2,357 | |
| | 84 | | | Realogy Holdings Corp. ● | | | 3,455 | |
| | 10 | | | SL Green Realty Corp. REIT | | | 1,099 | |
| | 175 | | | Two Harbors Investment Corp. REIT | | | 1,769 | |
| | 87 | | | Weyerhaeuser Co. REIT | | | 2,951 | |
| | | | | | | | 25,330 | |
| | | | | Retailing - 0.9% | | | | |
| | 572 | | | Allstar Co. ⌂●† | | | 485 | |
| | 66 | | | GNC Holdings, Inc. | | | 2,754 | |
| | | | | | | | 3,239 | |
| | | | | Semiconductors and Semiconductor Equipment - 2.3% | | | | |
| | 156 | | | Maxim Integrated Products, Inc. | | | 4,580 | |
| | 3 | | | Samsung Electronics Co., Ltd. | | | 3,277 | |
| | | | | | | | 7,857 | |
| | | | | Software and Services - 3.5% | | | | |
| | 262 | | | Activision Blizzard, Inc. | | | 5,228 | |
| | 159 | | | Teradata Corp. ● | | | 6,750 | |
| | | | | | | | 11,978 | |
| | | | | Technology Hardware and Equipment - 4.2% | | | | |
| | 354 | | | Cisco Systems, Inc. | | | 8,655 | |
| | 194 | | | EMC Corp. | | | 5,576 | |
| | | | | | | | 14,231 | |
| | | | | Telecommunication Services - 1.4% | | | | |
| | 286 | | | NTT DoCoMo, Inc. | | | 4,825 | |
The accompanying notes are an integral part of these financial statements.
The Hartford Value Opportunities Fund
Schedule of Investments – (continued)
October 31, 2014
(000’s Omitted)
| Shares or Principal Amount | | Market Value ╪ | |
| Common Stocks - 98.9% - (continued) | |
| | | | | Transportation - 1.2% | | | | |
| | 38 | | | United Parcel Service, Inc. Class B | | $ | 3,945 | |
| | | | | | | | | |
| | | | | Utilities - 4.5% | | | | |
| | 24 | | | Edison International | | | 1,489 | |
| | 99 | | | PG&E Corp. | | | 4,991 | |
| | 622 | | | Snam S.p.A. | | | 3,362 | |
| | 160 | | | Xcel Energy, Inc. | | | 5,349 | |
| | | | | | | | 15,191 | |
| | | | | Total Common Stocks | | | | |
| | | | | (Cost $319,733) | | $ | 336,691 | |
| | | | | | | | | |
| | | | | Total Long-Term Investments | | | | |
| | | | | (Cost $319,733) | | $ | 336,691 | |
| | | | | | | | | |
| Short-Term Investments - 0.5% | |
| Repurchase Agreements - 0.5% |
| | | | | Bank of America Merrill Lynch TriParty Repurchase
Agreement (maturing on 11/03/2014 in the
amount of $5, collateralized by U.S. Treasury
Note 1.50%, 2019, value of $5) | | | | |
| $ | 4 | | | 0.08%, 10/31/2014 | | $ | 4 | |
| | | | | Bank of America Merrill Lynch TriParty Repurchase
Agreement (maturing on 11/03/2014 in the
amount of $77, collateralized by GNMA 1.63% -
7.00%, 2031 - 2054, value of $78) | | | | |
| | 77 | | | 0.09%, 10/31/2014 | | | 77 | |
| | | | | Bank of Montreal TriParty Repurchase Agreement
(maturing on 11/03/2014 in the amount of $21,
collateralized by U.S. Treasury Bond 2.88% -
5.25%, 2029 - 2043, U.S. Treasury Note 0.38% -
4.50%, 2015 - 2022, value of $21) | | | | |
| | 21 | | | 0.08%, 10/31/2014 | | | 21 | |
| | | | | Bank of Montreal TriParty Repurchase Agreement
(maturing on 11/03/2014 in the amount of $70,
collateralized by FHLMC 2.00% - 5.50%, 2022 -
2034, FNMA 2.00% - 4.50%, 2024 - 2039,
GNMA 3.00%, 2043, U.S. Treasury Note 4.63%,
2017, value of $71) | | | | |
| | 70 | | | 0.10%, 10/31/2014 | | | 70 | |
| | | | | Barclays Capital TriParty Repurchase Agreement
(maturing on 11/03/2014 in the amount of $263,
collateralized by U.S. Treasury Bond 4.50% -
6.25%, 2023 - 2036, U.S. Treasury Note 1.63% -
2.13%, 2015 - 2019, value of $268) | | | | |
| | 263 | | | 0.08%, 10/31/2014 | | | 263 | |
| | | | | Citigroup Global Markets, Inc. TriParty Repurchase
Agreement (maturing on 11/03/2014 in the
amount of $302, collateralized by U.S. Treasury
Bill 0.02%, 2015, U.S. Treasury Bond 3.88% -
11.25%, 2015 - 2040, U.S. Treasury Note 2.00%
- 3.38%, 2019 - 2021, value of $308) | | | | |
| | 302 | | | 0.09%, 10/31/2014 | | | 302 | |
| | | | | Deutsche Bank Securities TriParty Repurchase
Agreement (maturing on 11/03/2014 in the
amount of $17, collateralized by U.S. Treasury
Note 0.88%, 2017, value of $18) | | | | |
| | 17 | | | 0.13%, 10/31/2014 | | | 17 | |
| | | | | RBS Securities, Inc. TriParty Repurchase
Agreement (maturing on 11/03/2014 in the
amount of $26, collateralized by U.S. Treasury
Bond 3.63% - 5.00%, 2037 - 2043, U.S.
Treasury Note 2.13%, 2020, value of $26) | | | | |
| 26 | | | 0.07%, 10/31/2014 | | | 26 | |
| | | | | Societe Generale TriParty Repurchase Agreement
(maturing on 11/03/2014 in the amount of $271,
collateralized by U.S. Treasury Bill 0.02%, 2015,
U.S. Treasury Bond 3.75% - 11.25%, 2015 -
2043, U.S. Treasury Note 1.38% - 4.25%, 2015 -
2022, value of $276) | | | | |
| | 271 | | | 0.08%, 10/31/2014 | | | 271 | |
| | | | | TD Securities TriParty Repurchase Agreement
(maturing on 11/03/2014 in the amount of $524,
collateralized by FHLMC 3.00% - 4.00%, 2026 -
2044, FNMA 2.50% - 5.00%, 2025 - 2044, U.S.
Treasury Bond 3.50% - 6.50%, 2026 - 2041,
U.S. Treasury Note 1.75% - 2.88%, 2018 - 2019,
value of $535) | | | | |
| | 524 | | | 0.10%, 10/31/2014 | | | 524 | |
| | | | | | | | 1,575 | |
| | | | | Total Short-Term Investments | | | | |
| | | | | (Cost $1,575) | | $ | 1,575 | |
| | | | | | | | | |
| | | | | Total Investments | | | | | | |
| | | | | (Cost $321,308) ▲ | 99.4 | % | | $ | 338,266 | |
| | | | | Other Assets and Liabilities | 0.6 | % | | | 1,966 | |
| | | | | Total Net Assets | 100.0 | % | | $ | 340,232 | |
The accompanying notes are an integral part of these financial statements.
The Hartford Value Opportunities Fund
Schedule of Investments – (continued)
October 31, 2014
(000’s Omitted)
| Note: | Percentage of investments as shown is the ratio of the total market value to total net assets. |
Prices of foreign equities that are principally traded on certain foreign markets may be adjusted daily pursuant to a fair value pricing service approved by the Board of Directors in order to reflect an adjustment for factors occurring after the close of certain foreign markets but before the close of the New York Stock Exchange.
Equity industry classifications used in this report are the Global Industry Classification Standard, which was developed by and is the exclusive property and service mark of MSCI, Inc. and Standard & Poor’s.
For Fund compliance purposes, the Fund may not use the same classification system shown in this report as these classifications are used for reporting ease.
| ▲ | At October 31, 2014, the cost of securities for federal income tax purposes was $322,317 and the aggregate gross unrealized appreciation and depreciation based on that cost were: |
| Unrealized Appreciation | | $ | 28,709 | |
| Unrealized Depreciation | | | (12,760 | ) |
| Net Unrealized Appreciation | | $ | 15,949 | |
| † | These securities were valued in good faith at fair value as determined under policies and procedures established by and under the supervision of the Board of Directors. At October 31, 2014, the aggregate fair value of these securities was $490, which represents 0.1% of total net assets. This amount excludes securities that are principally traded in certain foreign markets and whose prices are adjusted pursuant to a third party pricing service methodology approved by the Board of Directors. |
| ■ | Securities issued within terms of a private placement memorandum, exempt from registration under Rule 144A under the Securities Act of 1933, as amended, and may be sold only to qualified institutional buyers. Unless otherwise indicated, these holdings are determined to be liquid. At October 31, 2014, the aggregate value of these securities was $5, which rounds to zero percent of total net assets. |
| ⌂ | The following securities are considered illiquid. Illiquid securities are often purchased in private placement transactions, are often not registered under the Securities Act of 1933, as amended, and may have contractual restrictions on resale. A security may also be considered illiquid if the security lacks a readily available market or if its valuation has not changed for a certain period of time. |
| Period Acquired | | Shares/ Par | | | Security | | Cost Basis | |
| 08/2011 | | | 572 | | | Allstar Co. | | $ | 249 | |
| 03/2007 | | | 74 | | | Solar Cayman Ltd. - 144A | | | 22 | |
At October 31, 2014, the aggregate value of these securities was $490, which represents 0.1% of total net assets.
Foreign Currency Contracts Outstanding at October 31, 2014
| | | | | | | | | | | | | | | Unrealized Appreciation/(Depreciation) | |
| Currency | | Buy / Sell | | Delivery Date | | Counterparty | | Contract Amount | | | Market Value ╪ | | | Asset | | | Liability | |
| EUR | | Sell | | 12/17/2014 | | JPM | | $ | 16,735 | | | $ | 16,770 | | | $ | – | | | $ | (35 | ) |
| JPY | | Sell | | 12/17/2014 | | JPM | | | 4,488 | | | | 4,260 | | | | 228 | | | | – | |
| Total | | | | | | | | | | | | | | | | $ | 228 | | | $ | (35 | ) |
| ╪ | See Significant Accounting Policies of accompanying Notes to Financial Statements regarding valuation of securities. |
| GLOSSARY: (abbreviations used in preceding Schedule of Investments) |
| |
| Counterparty Abbreviations: |
| JPM | JP Morgan Chase & Co. | |
| |
| Currency Abbreviations: |
| EUR | EURO | |
| JPY | Japanese Yen | |
| |
| Other Abbreviations: |
| ADR | American Depositary Receipt |
| FHLMC | Federal Home Loan Mortgage Corp. |
| FNMA | Federal National Mortgage Association |
| GNMA | Government National Mortgage Association |
| REIT | Real Estate Investment Trust |
The accompanying notes are an integral part of these financial statements.
The Hartford Value Opportunities Fund
Schedule of Investments – (continued)
October 31, 2014
(000’s Omitted)
| Investment Valuation Hierarchy Level Summary |
| October 31, 2014 |
| | | Total | | | Level 1 ♦ | | | Level 2 ♦ | | | Level 3 | |
| Assets: | | | | | | | | | | | | | | | | |
| Common Stocks | | | | | | | | | | | | | | | | |
| Banks | | $ | 7,434 | | | $ | 7,434 | | | $ | – | | | $ | – | |
| Capital Goods | | | 18,560 | | | | 14,429 | | | | 4,131 | | | | – | |
| Commercial and Professional Services | | | 5,272 | | | | 5,272 | | | | – | | | | – | |
| Consumer Durables and Apparel | | | 14,413 | | | | 10,259 | | | | 4,154 | | | | – | |
| Consumer Services | | | 8,570 | | | | 6,342 | | | | 2,228 | | | | – | |
| Diversified Financials | | | 32,845 | | | | 29,272 | | | | 3,568 | | | | 5 | |
| Energy | | | 51,945 | | | | 51,945 | | | | – | | | | – | |
| Food and Staples Retailing | | | 7,582 | | | | 7,582 | | | | – | | | | – | |
| Food, Beverage and Tobacco | | | 11,924 | | | | 1,772 | | | | 10,152 | | | | – | |
| Health Care Equipment and Services | | | 3,404 | | | | 3,404 | | | | – | | | | – | |
| Household and Personal Products | | | 2,727 | | | | 2,727 | | | | – | | | | – | |
| Insurance | | | 29,812 | | | | 29,812 | | | | – | | | | – | |
| Materials | | | 23,153 | | | | 23,153 | | | | – | | | | – | |
| Media | | | 4,017 | | | | 4,017 | | | | – | | | | – | |
| Pharmaceuticals, Biotechnology and Life Sciences | | | 28,437 | | | | 26,104 | | | | 2,333 | | | | – | |
| Real Estate | | | 25,330 | | | | 25,330 | | | | – | | | | – | |
| Retailing | | | 3,239 | | | | 2,754 | | | | – | | | | 485 | |
| Semiconductors and Semiconductor Equipment | | | 7,857 | | | | 4,580 | | | | 3,277 | | | | – | |
| Software and Services | | | 11,978 | | | | 11,978 | | | | – | | | | – | |
| Technology Hardware and Equipment | | | 14,231 | | | | 14,231 | | | | – | | | | – | |
| Telecommunication Services | | | 4,825 | | | | – | | | | 4,825 | | | | – | |
| Transportation | | | 3,945 | | | | 3,945 | | | | – | | | | – | |
| Utilities | | | 15,191 | | | | 11,829 | | | | 3,362 | | | | – | |
| Total | | | 336,691 | | | | 298,171 | | | | 38,030 | | | | 490 | |
| Short-Term Investments | | | 1,575 | | | | – | | | | 1,575 | | | | – | |
| Total | | $ | 338,266 | | | $ | 298,171 | | | $ | 39,605 | | | $ | 490 | |
| Foreign Currency Contracts* | | $ | 228 | | | $ | – | | | $ | 228 | | | $ | – | |
| Total | | $ | 228 | | | $ | – | | | $ | 228 | | | $ | – | |
| Liabilities: | | | | | | | | | | | | | | | | |
| Foreign Currency Contracts* | | $ | 35 | | | $ | – | | | $ | 35 | | | $ | – | |
| Total | | $ | 35 | | | $ | – | | | $ | 35 | | | $ | – | |
| ♦ | For the year ended October 31, 2014, there were no transfers between Level 1 and Level 2. |
| * | Derivative instruments (excluding purchased and written options, if applicable) are valued at the unrealized appreciation/depreciation on the investments. |
Following is a reconciliation of Level 3 assets for which significant unobservable inputs were used to determine fair value:
| | | Balance as
of October
31, 2013 | | | Realized
Gain (Loss) | | | Change in
Unrealized
Appreciation
(Depreciation) | | | Net
Amortization | | | Purchases | | | Sales | | | Transfers
Into
Level 3 | | | Transfers
Out of
Level 3 | | | Balance as
of October
31, 2014 | |
| Assets: | | | | | | | | | | | | | | | | | | | | | | | | | | | | | | | | | | | | |
| Common Stocks | | $ | 1,057 | | | $ | — | | | $ | (477 | )* | | $ | — | | | $ | — | | | $ | (90 | ) | | $ | — | | | $ | — | | | $ | 490 | |
| Total | | $ | 1,057 | | | $ | — | | | $ | (477 | ) | | $ | — | | | $ | — | | | $ | (90 | ) | | $ | — | | | $ | — | | | $ | 490 | |
| * | Change in unrealized appreciation (depreciation) in the current period relating to assets still held at October 31, 2014 was $(477). |
| Note: | For purposes of reporting transfers between different hierarchy levels, both transfers in and out of each level, as applicable, are shown as if they occurred at the beginning of the period. |
The accompanying notes are an integral part of these financial statements.
The Hartford Value Opportunities Fund
Statement of Assets and Liabilities
October 31, 2014
(000’s Omitted)
| Assets: | | | | |
| Investments in securities, at market value (cost $321,308) | | $ | 338,266 | |
| Cash | | | 1 | |
| Unrealized appreciation on foreign currency contracts | | | 228 | |
| Receivables: | | | | |
| Investment securities sold | | | 3,788 | |
| Fund shares sold | | | 251 | |
| Dividends and interest | | | 314 | |
| Other assets | | | 71 | |
| Total assets | | | 342,919 | |
| Liabilities: | | | | |
| Unrealized depreciation on foreign currency contracts | | | 35 | |
| Payables: | | | | |
| Investment securities purchased | | | 2,180 | |
| Fund shares redeemed | | | 333 | |
| Investment management fees | | | 45 | |
| Administrative fees | | | 1 | |
| Distribution fees | | | 19 | |
| Accrued expenses | | | 74 | |
| Total liabilities | | | 2,687 | |
| Net assets | | $ | 340,232 | |
| Summary of Net Assets: | | | | |
| Capital stock and paid-in-capital | | $ | 304,925 | |
| Undistributed net investment income | | | 2,222 | |
| Accumulated net realized gain | | | 15,942 | |
| Unrealized appreciation of investments and the translation of assets and liabilities denominated in foreign currency | | | 17,143 | |
| Net assets | | $ | 340,232 | |
| Shares authorized | | | 27,000,000 | |
| Par value | | $ | 0.0001 | |
| Class A: Net asset value per share/Maximum offering price per share | | | $20.45/$21.64 | |
| Shares outstanding | | | 11,618 | |
| Net assets | | $ | 237,539 | |
| Class B: Net asset value per share | | $ | 18.22 | |
| Shares outstanding | | | 216 | |
| Net assets | | $ | 3,928 | |
| Class C: Net asset value per share | | $ | 18.14 | |
| Shares outstanding | | | 1,750 | |
| Net assets | | $ | 31,729 | |
| Class I: Net asset value per share | | $ | 20.25 | |
| Shares outstanding | | | 2,188 | |
| Net assets | | $ | 44,306 | |
| Class R3: Net asset value per share | | $ | 20.62 | |
| Shares outstanding | | | 220 | |
| Net assets | | $ | 4,528 | |
| Class R4: Net asset value per share | | $ | 20.82 | |
| Shares outstanding | | | 654 | |
| Net assets | | $ | 13,626 | |
| Class R5: Net asset value per share | | $ | 20.95 | |
| Shares outstanding | | | 131 | |
| Net assets | | $ | 2,735 | |
| Class Y: Net asset value per share | | $ | 21.03 | |
| Shares outstanding | | | 88 | |
| Net assets | | $ | 1,841 | |
The accompanying notes are an integral part of these financial statements.
The Hartford Value Opportunities Fund
Statement of Operations
For the Year Ended October 31, 2014
(000’s Omitted)
| Investment Income: | | | | |
| Dividends | | $ | 5,873 | |
| Interest | | | 1 | |
| Less: Foreign tax withheld | | | (85 | ) |
| Total investment income | | | 5,789 | |
| | | | | |
| Expenses: | | | | |
| Investment management fees | | | 1,975 | |
| Administrative services fees | | | | |
| Class R3 | | | 7 | |
| Class R4 | | | 19 | |
| Class R5 | | | 11 | |
| Transfer agent fees | | | | |
| Class A | | | 368 | |
| Class B | | | 19 | |
| Class C | | | 36 | |
| Class I | | | 22 | |
| Class R3 | | | 1 | |
| Class R4 | | | — | |
| Class R5 | | | — | |
| Class Y | | | — | |
| Distribution fees | | | | |
| Class A | | | 476 | |
| Class B | | | 42 | |
| Class C | | | 235 | |
| Class R3 | | | 18 | |
| Class R4 | | | 31 | |
| Custodian fees | | | 5 | |
| Accounting services fees | | | 39 | |
| Registration and filing fees | | | 151 | |
| Board of Directors' fees | | | 6 | |
| Audit fees | | | 10 | |
| Other expenses | | | 46 | |
| Total expenses (before waivers and fees paid indirectly) | | | 3,517 | |
| Expense waivers | | | (33 | ) |
| Transfer agent fee waivers | | | (6 | ) |
| Commission recapture | | | (3 | ) |
| Custodian fee offset | | | — | |
| Total waivers and fees paid indirectly | | | (42 | ) |
| Total expenses, net | | | 3,475 | |
| Net Investment Income | | | 2,314 | |
| Net Realized Gain on Investments and Foreign Currency Transactions: | | | | |
| Net realized gain on investments | | | 52,236 | |
| Net realized gain on foreign currency contracts | | | 221 | |
| Net realized loss on other foreign currency transactions | | | (149 | ) |
| Net Realized Gain on Investments and Foreign Currency Transactions | | | 52,308 | |
| Net Changes in Unrealized Depreciation of Investments and Foreign Currency Transactions: | | | | |
| Net unrealized depreciation of investments | | | (31,446 | ) |
| Net unrealized appreciation of foreign currency contracts | | | 193 | |
| Net unrealized depreciation of translation of other assets and liabilities in foreign currencies | | | (9 | ) |
| Net Changes in Unrealized Depreciation of Investments and Foreign Currency Transactions | | | (31,262 | ) |
| Net Gain on Investments and Foreign Currency Transactions | | | 21,046 | |
| Net Increase in Net Assets Resulting from Operations | | $ | 23,360 | |
The accompanying notes are an integral part of these financial statements.
The Hartford Value Opportunities Fund
Statement of Changes in Net Assets
(000’s Omitted)
| | | For the
Year Ended
October 31, 2014 | | | For the
Year Ended
October 31, 2013 | |
| Operations: | | | | | | | | |
| Net investment income | | $ | 2,314 | | | $ | 804 | |
| Net realized gain on investments and foreign currency transactions | | | 52,308 | | | | 16,444 | |
| Net unrealized appreciation (depreciation) of investments and foreign currency transactions | | | (31,262 | ) | | | 18,395 | |
| Net Increase in Net Assets Resulting from Operations | | | 23,360 | | | | 35,643 | |
| Distributions to Shareholders: | | | | | | | | |
| From net investment income | | | | | | | | |
| Class A | | | (539 | ) | | | (1,297 | ) |
| Class B | | | — | | | | (35 | ) |
| Class C | | | — | | | | (80 | ) |
| Class I | | | (62 | ) | | | (62 | ) |
| Class R3 | | | (6 | ) | | | (18 | ) |
| Class R4 | | | (37 | ) | | | (93 | ) |
| Class R5 | | | (12 | ) | | | (22 | ) |
| Class Y | | | (10 | ) | | | (18 | ) |
| Total distributions | | | (666 | ) | | | (1,625 | ) |
| Capital Share Transactions: | | | | | | | | |
| Class A | | | 102,078 | * | | | 5,976 | |
| Class B | | | (382 | )* | | | (1,709 | ) |
| Class C | | | 19,112 | * | | | (361 | ) |
| Class I | | | 35,197 | * | | | 2,357 | |
| Class R3 | | | 2,751 | * | | | (280 | ) |
| Class R4 | | | 5,234 | * | | | (518 | ) |
| Class R5 | | | 422 | * | | | 205 | |
| Class Y | | | 322 | * | | | (238 | ) |
| Net increase from capital share transactions | | | 164,734 | | | | 5,432 | |
| Net Increase in Net Assets | | | 187,428 | | | | 39,450 | |
| Net Assets: | | | | | | | | |
| Beginning of period | | | 152,804 | | | | 113,354 | |
| End of period | | $ | 340,232 | | | $ | 152,804 | |
| Undistributed (distributions in excess of) net investment income | | $ | 2,222 | | | $ | 665 | |
* Includes merger activity (see Fund Merger in accompanying Notes to Financial Statements).
The accompanying notes are an integral part of these financial statements.
The Hartford Value Opportunities Fund
Notes to Financial Statements
October 31, 2014
(000’s Omitted)
Organization:
The Hartford Mutual Funds II, Inc. (“Company”) is an open-end management investment company comprised of four portfolios. Financial statements for The Hartford Value Opportunities Fund (the "Fund"), a series of the Company, are included in this report.
The Company is organized under the laws of the State of Maryland and is registered with the Securities and Exchange Commission (“SEC”) under the Investment Company Act of 1940, as amended (“1940 Act”). The Fund is a diversified open-end management investment company. The Fund is an investment company and applies specialized accounting and reporting under Accounting Standards Codification Topic 946, Financial Services - Investment Companies.
Class A shares are sold with a front-end sales charge of up to 5.50%. Class B shares were sold with a contingent deferred sales charge which is assessed on the lesser of the per share net asset value (“NAV”) of the shares at the time of redemption or the original purchase price, and declines from up to 5.00% to zero depending on the period of time the shares are held (see note below regarding the closing of Class B shares). Class C shares are sold with a contingent deferred sales charge of up to 1.00% on shares redeemed within twelve months of purchase. Class I shares are sold without sales charges to certain eligible investors primarily through advisory fee-based wrap programs. Class R3, R4 and R5 shares, which are offered to employer-sponsored retirement plans, and Class Y shares, which are sold to certain eligible institutional investors, are sold without a sales charge. All classes of shares have identical voting, redemption, dividend, liquidation and other rights and the same terms and conditions, with the exceptions that each class may have different expenses, which may affect performance, and that Class B shares automatically convert to Class A shares after 8 years.
No new or additional investments are allowed in Class B shares of the Fund (including investments through any systematic investment plan). Existing shareholders of Class B shares may continue to hold their Class B shares, exchange their Class B shares for Class B shares of another Hartford Fund (as permitted by existing exchange privileges), or redeem their Class B shares as described in the Fund’s prospectus. Reinstatement privileges with respect to Class B shares are set forth in the Fund's prospectus. For investors electing to reinvest capital gains and dividends, any such capital gains or dividends on Class B shares will continue to be reinvested in Class B shares of the Fund. All Class B share attributes, including the 12b-1 fee, contingent deferred sales charge schedule, and conversion to Class A shares, remain unchanged.
Significant Accounting Policies:
The following is a summary of significant accounting policies of the Fund in the preparation of its financial statements, which are in accordance with United States generally accepted accounting principles (“U.S. GAAP”). The preparation of financial statements in accordance with U.S. GAAP may require management to make estimates and assumptions that affect the reported amounts of assets and liabilities and disclosure of contingent assets and liabilities at the date of the financial statements and the reported amounts of increases and decreases in net assets from operations during the reporting period. Actual results could differ from those estimates.
Determination of Net Asset Value – The NAV of each class of the Fund's shares is determined as of the close of regular trading (normally 4:00 p.m. Eastern Time) (the “NYSE Close”) on each day that the New York Stock Exchange (the “Exchange”) is open (“Valuation Date”). Information that becomes known to the Fund after the NAV has been calculated on a particular day will not generally be used to retroactively adjust the NAV determined earlier that day.
Investment Valuation and Fair Value Measurements – For purposes of calculating the NAV, portfolio investments and other assets held by the Fund's portfolio for which market quotes are readily available are valued at market value. Market value is generally determined on the basis of last reported sales prices or official close price. If no sales are reported, market value is based on quotes obtained from a quotation reporting system, established market makers, or independent pricing services. If market prices are not readily available or are deemed unreliable, the Fund will use the fair value of the investment as determined in good faith under policies and procedures established by and under the supervision of the Company's Board of Directors. Market quotes are considered not readily available where there is an absence of current or reliable market-based data (e.g., trade information or indicative market quotes), including where events occur after the close of the relevant market, but prior to the NYSE Close, that materially affect the values of the Fund's portfolio investments or assets. In addition, market quotes are considered not readily available when, due to extraordinary circumstances, the exchanges or markets on which the investments trade do not open for trading for the entire day and no other market prices are available. In addition, prices of foreign equities that are principally traded on certain foreign markets may
The Hartford Value Opportunities Fund
Notes to Financial Statements – (continued)
October 31, 2014
(000’s Omitted)
be adjusted daily pursuant to a fair value pricing service approved by the Board of Directors in order to reflect an adjustment for the factors occurring after the close of certain foreign markets but before the NYSE Close. Investments that are primarily traded on foreign markets may trade on days that are not business days of the Fund. The value of the foreign investments in which the Fund invests may change on days when a shareholder will not be able to purchase or redeem shares of the Fund. Fair value pricing is subjective in nature and the use of fair value pricing by the Fund may cause the NAV of its shares to differ significantly from the NAV that would have been calculated using market prices at the close of the exchange on which a portfolio investment is primarily traded. There can be no assurance that the Fund could obtain the fair market value assigned to an investment if the Fund were to sell the investment at approximately the time at which the Fund determines its NAV.
Investments valued in currencies other than U.S. dollars are converted to U.S. dollars using exchange rates obtained from independent pricing services for calculation of the NAV. As a result, the NAV of the Fund’s shares may be affected by changes in the value of currencies in relation to the U.S. dollar. The value of investments traded in markets outside the United States or denominated in currencies other than the U.S. dollar may be affected significantly on a day that the NYSE is closed and the market value may change on days when an investor is not able to purchase, redeem or exchange shares of the Fund.
Foreign currency contracts represent agreements to exchange currencies on specific future dates at predetermined rates. Foreign currency contracts are valued using foreign currency exchange rates and forward rates as provided by an independent pricing service on the Valuation Date.
Financial instruments for which prices are not available from an independent pricing service may be valued using market quotations obtained from one or more dealers that make markets in the respective financial instrument in accordance with procedures established by the Company's Board of Directors.
U.S. GAAP defines fair value as the price that the Fund would receive to sell an asset or pay to transfer a liability in an orderly transaction between market participants. The U.S. GAAP fair value measurement standards require disclosure of a fair value hierarchy for each major category of assets and liabilities. Various inputs are used in determining the fair value of the Fund’s investments. These inputs are summarized into three broad hierarchy levels. This hierarchy is based on whether the valuation inputs are observable or unobservable. These levels are:
Level 1 – Quoted prices in active markets for identical investments. Level 1 may include exchange traded instruments, such as domestic equities, some foreign equities, options, futures, mutual funds, exchange traded funds, rights and warrants.
Level 2 – Observable inputs other than Level 1 prices, such as quoted prices for similar investments; quoted prices in markets that are not active; or other inputs that are observable or can be corroborated by observable market data. Level 2 may include debt investments that are traded less frequently than exchange traded instruments and which are valued using independent pricing services; foreign equities, which are principally traded on certain foreign markets and are adjusted daily pursuant to a fair value pricing service in order to reflect an adjustment for the factors occurring after the close of certain foreign markets but before the NYSE Close; senior floating rate interests, which are valued using an aggregate of dealer bids; short-term investments, which are valued at amortized cost; and swaps, which are valued based upon the terms of each swap contract.
Level 3 – Significant unobservable inputs that are supported by limited or no market activity. Level 3 may include financial instruments whose values are determined using indicative market quotes or require significant management judgment or estimation. These unobservable valuation inputs may include estimates for current yields, maturity/duration, prepayment speed, and indicative market quotes for comparable investments along with other assumptions relating to credit quality, collateral value, complexity of the investment structure, general market conditions and liquidity. This category may include investments where trading has been halted or there are certain restrictions on trading. While these investments are priced using unobservable inputs, the valuation of these investments reflects the best available data and management believes the prices are a reasonable representation of exit price.
The Board of Directors of the Company generally reviews and approves the “Procedures for Valuation of Portfolio Securities” at least once a year. These procedures define how investments are to be valued, including the formation and activities of a Valuation Committee. The Valuation Committee is responsible for determining in good faith the fair value of investments when
The Hartford Value Opportunities Fund
Notes to Financial Statements – (continued)
October 31, 2014
(000’s Omitted)
the value cannot be obtained from primary pricing services or alternative sources or if the valuation of an investment as provided by the primary pricing service or alternative source is believed not to reflect the investment’s fair value as of the Valuation Date. Voting members of the Valuation Committee include the Fund's Treasurer or designee and a Vice President of the investment manager or designee. An Assistant Vice President of the Fund with legal expertise or designee is also included on the Valuation Committee as a non-voting advisory member. In addition, the Fund’s Chief Compliance Officer shall designate a member of the compliance group to attend Valuation Committee meetings as a non-voting resource, to monitor for and provide guidance with respect to compliance with these procedures. Two members of the Valuation Committee or their designees, representing different departments, shall constitute a quorum for purposes of permitting the Valuation Committee to take action. The Valuation Committee will consider all relevant factors in determining an investment’s fair value, and may seek the advice of the Fund’s sub-adviser, knowledgeable brokers, and legal counsel in making such determination. The Valuation Committee reports to the Audit Committee of the Company's Board of Directors. The Audit Committee receives quarterly written reports which include details of all fair-valued investments, including the reason for the fair valuation, and an indication, when possible, of the accuracy of the valuation by disclosing the next available reliable public price quotation or the disposition price of such investments (the “look-back” test). The Board of Directors then must consider for ratification all of the fair value determinations made during the previous quarter.
Valuation levels are not necessarily indicative of the risk associated with investing in such investments. Individual investments within any of the above mentioned asset classes may be assigned a different hierarchical level than those presented above, as individual circumstances dictate.
For additional information, refer to the Investment Valuation Hierarchy Level Summary and the Level 3 roll-forward reconciliation, if applicable, which follow the Schedule of Investments.
Investment Transactions and Investment Income – Investment transactions are recorded as of the trade date (the date the order to buy or sell is executed) for financial reporting purposes. Investments purchased or sold on a when-issued or delayed-delivery basis may be settled a month or more after the trade date. Realized gains and losses are determined on the basis of identified cost.
Dividend income from domestic securities is accrued on the ex-dividend date. In general, dividend income from foreign securities is recorded on the ex-date; however, dividend notifications in certain foreign jurisdictions may not be available in a timely manner and as a result, the Fund will record the dividend as soon as the relevant details (i.e., rate per share, payment date, shareholders of record, etc.) are publicly available. Interest income, including amortization of premium, accretion of discounts and additional principal received in-kind in lieu of cash, is accrued on a daily basis.
Foreign Currency Transactions – Assets and liabilities denominated in currencies other than U.S. dollars are translated into U.S. dollars at the exchange rates in effect on the valuation date. Purchases and sales of investments, income and expenses are translated into U.S. dollars at the exchange rates on the dates of such transactions.
The Fund does not isolate that portion of portfolio investment valuation resulting from fluctuations in the foreign currency exchange rates from the fluctuations arising from changes in the market prices of investments held. Exchange rate fluctuations are included with the net realized and unrealized gain or loss on investments in the accompanying financial statements.
Net realized foreign exchange gains or losses arise from sales of foreign currencies and the difference between asset and liability amounts initially stated in foreign currencies and the U.S. dollar value of the amounts actually received or paid. Net unrealized foreign exchange gains or losses arise from changes in the value of other assets and liabilities at the end of the reporting period, resulting from changes in the exchange rates.
Joint Trading Account – The Fund may invest cash balances into a joint trading account that may be invested in one or more repurchase agreements.
Fund Share Valuation and Dividend Distributions to Shareholders – Orders for the Fund’s shares are executed in accordance with the investment instructions of the shareholders. The NAV of the Fund’s shares is determined as of the close of business on each business day of the Exchange. The NAV is determined separately for each class of shares of the Fund by dividing the Fund’s net
The Hartford Value Opportunities Fund
Notes to Financial Statements – (continued)
October 31, 2014
(000’s Omitted)
assets attributable to that class by the number of shares of the class outstanding. Each class of shares offered by the Fund has equal rights as to assets and voting privileges (except that shareholders of a class have exclusive voting rights regarding any matter relating solely to that class of shares). Income and non-class specific expenses are allocated daily to each class on the basis of the relative net assets of the class. Realized and unrealized gains and losses are allocated daily based on the relative net assets of each class of shares of the Fund.
Orders for the purchase of the Fund’s shares received prior to the close of the Exchange on any day the Exchange is open for business are priced at the NAV determined as of the close of the Exchange. Orders received after the close of the Exchange, or on a day on which the Exchange and/or the Fund is not open for business, are priced at the next determined NAV.
Dividends are declared pursuant to a policy adopted by the Company's Board of Directors based upon the investment performance of the Fund. The policy of the Fund is to pay dividends from net investment income and realized gains, if any, at least once a year.
Net investment income, dividends and distributions from net realized gains and capital are determined in accordance with federal income tax regulations, which may differ from U.S. GAAP with respect to character and timing (see Federal Income Taxes: Distributions and Components of Distributable Earnings and Reclassification of Capital Accounts).
Securities and Other Investments:
Repurchase Agreements – A repurchase agreement is an agreement by which a counterparty agrees to sell an investment and agrees to repurchase the investment sold from the buyer at a mutually agreed upon time and price. During the period of the repurchase agreement, the counterparty will deposit cash and or securities in a third party custodial account to serve as collateral. At the time the Fund enters into a repurchase agreement, the value of the underlying collateral, including accrued interest, will be equal to or exceed the value of the repurchase agreement. Repurchase agreements expose the Fund to counterparty risk - that is, the risk that the counterparty will not fulfill its obligations. To minimize counterparty risk, the investments that serve to collateralize the repurchase agreement are held by the Fund’s custodian in book entry or physical form in the custodial account of the Fund or in a third party custodial account. Repurchase agreements are valued at cost plus accrued interest, which approximates fair value. Repurchase agreements have master netting arrangements which allow the Fund to offset amounts owed to a counterparty with amounts owed by the counterparty, including any collateral. Upon an event of default under a master repurchase agreement, the non-defaulting party may close out all transactions traded under such agreement and net amounts owed under each transaction to one net amount payable by one party to the other. Absent an event of default, the master repurchase agreement does not result in an offset of reported amounts of assets and liabilities in the Statement of Assets and Liabilities across transactions between the Fund and the applicable counterparty. The Fund, as shown on the Schedule of Investments, had outstanding repurchase agreements and related collateral as of October 31, 2014.
Illiquid and Restricted Investments – The Fund is permitted to invest up to 15% of its net assets in illiquid investments. Illiquid investments are those that may not be sold or disposed of in the ordinary course of business within seven days, at approximately the price used to determine the Fund’s NAV. The Fund may not be able to sell illiquid investments when its sub-adviser considers it desirable to do so or may have to sell such investments at a price that is lower than the price that could be obtained if the investments were more liquid. A sale of illiquid investments may require more time and may result in higher dealer discounts and other selling expenses than does the sale of those that are liquid. Illiquid investments also may be more difficult to value due to the unavailability of reliable market quotations for such investments, and an investment in them may have an adverse impact on the Fund’s NAV. The Fund may also purchase certain restricted investments that can only be resold to certain qualified investors and may be determined to be liquid pursuant to policies and guidelines established by the Company's Board of Directors. The Fund, as shown on the Schedule of Investments, had illiquid or restricted investments as of October 31, 2014.
Investments Purchased on a When-Issued or Delayed-Delivery Basis – Delivery and payment for investments that have been purchased by the Fund on a forward commitment, or when-issued or delayed-delivery basis, take place beyond the customary settlement period. The Fund may dispose of or renegotiate a delayed-delivery transaction after it is entered into, and may sell delayed-delivery investments before they are delivered, which may result in a realized gain or loss. During this period, such investments are subject to market fluctuations, and the Fund identifies investments segregated in its records with a value at least equal to the amount of the commitment. The Fund had no when-issued or delayed-delivery investments as of October 31, 2014.
The Hartford Value Opportunities Fund
Notes to Financial Statements – (continued)
October 31, 2014
(000’s Omitted)
Financial Derivative Instruments:
The following disclosures contain information on how and why the Fund uses derivative instruments, the credit-risk-related contingent features in certain derivative instruments and how derivative instruments affect the Fund’s financial position and results of operations. The location and fair value amounts of these instruments on the Statement of Assets and Liabilities and the realized gains and losses and changes in unrealized gains and losses on the Statement of Operations, each categorized by type of derivative contract, are included in the following Additional Derivative Instrument Information footnote. The derivative instruments outstanding as of year-end are disclosed in the notes to the Schedule of Investments, if applicable. The amounts of realized gains and losses and changes in unrealized gains and losses on derivative instruments during the year are disclosed in the Statement of Operations.
Foreign Currency Contracts – The Fund may enter into foreign currency contracts that obligate the Fund to purchase or sell currencies at specified future dates. Foreign currency contracts are used to hedge the currency exposure associated with some or all of the Fund’s investments and/or as part of an investment strategy. Foreign currency contracts are marked to market daily and the change in value is recorded by the Fund as an unrealized gain or loss. The Fund will record a realized gain or loss when the foreign currency contract is settled.
Foreign currency contracts involve elements of market risk in excess of the amounts reflected in the Statement of Assets and Liabilities. In addition, risks may arise upon entering into these contracts from the potential inability of the counterparties to meet the terms of the contracts and from unanticipated movements in the value of the foreign currencies relative to the U.S. dollar. The Fund, as shown on the Schedule of Investments, had outstanding foreign currency contracts as of October 31, 2014.
Additional Derivative Instrument Information:
Fair Value of Derivative Instruments on the Statement of Assets and Liabilities as of October 31, 2014:
| | | Risk Exposure Category | |
| | | Interest Rate
Contracts | | | Foreign
Exchange
Contracts | | | Credit
Contracts | | | Equity
Contracts | | | Commodity
Contracts | | | Other
Contracts | | | Total | |
| Assets: | | | | | | | | | | | | | | | | | | | | | | | | | | | | |
| Unrealized appreciation on foreign currency contracts | | $ | — | | | $ | 228 | | | $ | — | | | $ | — | | | $ | — | | | $ | — | | | $ | 228 | |
| Total | | $ | — | | | $ | 228 | | | $ | — | | | $ | — | | | $ | — | | | $ | — | | | $ | 228 | |
| | | | | | | | | | | | | | | | | | | | | | | | | | | | | |
| Liabilities: | | | | | | | | | | | | | | | | | | | | | | | | | | | | |
| Unrealized depreciation on foreign currency contracts | | $ | — | | | $ | 35 | | | $ | — | | | $ | — | | | $ | — | | | $ | — | | | $ | 35 | |
| Total | | $ | — | | | $ | 35 | | | $ | — | | | $ | — | | | $ | — | | | $ | — | | | $ | 35 | |
The volume of derivatives that is presented in the Schedule of Investments is consistent with the derivative activity during the year ended October 31, 2014.
The Effect of Derivative Instruments on the Statement of Operations for the year ended October 31, 2014:
| | | Risk Exposure Category | |
| | | Interest Rate
Contracts | | | Foreign
Exchange
Contracts | | | Credit
Contracts | | | Equity
Contracts | | | Commodity
Contracts | | | Other
Contracts | | | Total | |
| Realized Gain on Derivatives Recognized as a Result of Operations: |
| Net realized gain on foreign currency contracts | | $ | — | | | $ | 221 | | | $ | — | | | $ | — | | | $ | — | | | $ | — | | | $ | 221 | |
| Total | | $ | — | | | $ | 221 | | | $ | — | | | $ | — | | | $ | — | | | $ | — | | | $ | 221 | |
| | | | | | | | | | | | | | | | | | | | | | | | | | | | | |
| Net Change in Unrealized Appreciation (Depreciation) on Derivatives Recognized as a Result of Operations: |
| Net change in unrealized appreciation of foreign currency contracts | | $ | — | | | $ | 193 | | | $ | — | | | $ | — | | | $ | — | | | $ | — | | | $ | 193 | |
| Total | | $ | — | | | $ | 193 | | | $ | — | | | $ | — | | | $ | — | | | $ | — | | | $ | 193 | |
The Hartford Value Opportunities Fund
Notes to Financial Statements – (continued)
October 31, 2014
(000’s Omitted)
Balance Sheet Offsetting Information - The following discloses both gross information and net information about instruments and transactions eligible for offset in the financial statements, and instruments and transactions that are subject to a master netting arrangement, as well as amounts related to margin, reflected as financial collateral (including cash collateral), held at clearing brokers, counterparties and the Fund’s custodian. The master netting arrangements allow the clearing brokers to net any collateral held in or on behalf of the Fund, or liabilities or payment obligations of the clearing brokers to the Fund, against any liabilities or payment obligations of the Fund to the clearing brokers. The Fund is required to deposit financial collateral (including cash collateral) at the Futures Commission Merchant's ("FCM") custodian on behalf of clearing brokers and counterparties to continually meet the original and maintenance requirements established by the clearing brokers and counterparties. Such requirements are specific to the respective clearing broker or counterparty. Certain master netting arrangements may not be enforceable in the bankruptcy proceedings of a counterparty.
Offsetting of Financial Assets and Derivative Assets as of October 31, 2014:
| | | Gross Amounts*
of Assets
Presented in
Statement of
Assets and
Liabilities | | | Financial
Instruments with
Allowable Netting | | | Non-cash
Collateral
Received | | | Cash Collateral
Received | | | Net Amount (not
less than $0) | |
| Description | | | | | | | | | | | | | | | | | | | | |
| Unrealized appreciation on foreign currency contracts | | $ | 228 | | | $ | (35 | ) | | $ | — | | | $ | — | | | $ | 193 | |
| Total subject to a master netting or similar arrangement | | $ | 228 | | | $ | (35 | ) | | $ | — | | | $ | — | | | $ | 193 | |
* Gross amounts are presented here as there are no amounts that are netted within the Statement of Assets and Liabilities.
Offsetting of Financial Liabilities and Derivative Liabilities as of October 31, 2014:
| | | Gross Amounts*
of Liabilities
Presented in
Statement of
Assets and
Liabilities | | | Financial
Instruments with
Allowable Netting | | | Non-cash
Collateral
Pledged | | | Cash Collateral
Pledged | | | Net Amount (not
less than $0) | |
| Description | | | | | | | | | | | | | | | | | | | | |
| Unrealized depreciation on foreign currency contracts | | $ | 35 | | | $ | (35 | ) | | $ | — | | | $ | — | | | $ | — | |
| Total subject to a master netting or similar arrangement | | $ | 35 | | | $ | (35 | ) | | $ | — | | | $ | — | | | $ | — | |
* Gross amounts are presented here as there are no amounts that are netted within the Statement of Assets and Liabilities.
Principal Risks:
The Fund may be exposed to counterparty risk, or the risk that an institution or other entity with which the Fund has unsettled or open transactions will default.
If the Fund invests directly in foreign currencies or in securities that trade in, and receive revenues in, foreign currencies, or in derivatives that provide exposure to foreign currencies, it will be subject to the risk that those currencies will decline in value relative to the base currency (U.S. dollars) of the Fund, or, in the case of hedging positions, that the Fund’s base currency will decline in value relative to the currency being hedged. Currency rates in foreign countries may fluctuate significantly over short periods of time for a number of reasons, including changes in interest rates, intervention (or the failure to intervene) by U.S. or foreign governments, central banks or supranational entities, such as the International Monetary Fund, or by the imposition of currency controls or other political developments in the United States or abroad. As a result, the Fund’s investments in foreign currency denominated securities may reduce the returns of the Fund. The market values of equity securities, such as common stocks and preferred stocks, or equity related investments, such as futures and options, may decline due to general market conditions which are not specifically related to a particular company, such as real or perceived adverse economic conditions, changes in the general outlook for corporate earnings, changes in interest or currency rates or adverse investor sentiment generally. The market value of equity securities may also decline due to factors which affect a particular industry or industries, such as labor shortages or increased production costs and competitive
The Hartford Value Opportunities Fund
Notes to Financial Statements – (continued)
October 31, 2014
(000’s Omitted)
conditions within an industry. Equity securities and equity related investments generally have greater market price volatility than fixed income securities.
Federal Income Taxes:
Federal Income Taxes – For federal income tax purposes, the Fund intends to continue to qualify as a Regulated Investment Company ("RIC") under Subchapter M of the Internal Revenue Code (“IRC”) by distributing substantially all of its taxable net investment income and net realized capital gains to its shareholders and otherwise complying with the requirements of the IRC. The Fund has distributed substantially all of its income and capital gains in prior years, if applicable, and intends to distribute substantially all of its income and capital gains during the calendar year ending December 31, 2014. Accordingly, no provision for federal income or excise taxes has been made in the accompanying financial statements. Distributions from short-term capital gains are treated as ordinary income distributions for federal income tax purposes.
Net Investment Income (Loss), Net Realized Gains (Losses) and Distributions – Net investment income (loss) and net realized gains (losses) may differ for financial statement and tax purposes primarily because of losses deferred due to wash sale adjustments, foreign currency gains and losses, adjustments related to Passive Foreign Investment Companies ("PFICs"), Real Estate Investment Trusts ("REITs"), RICs, certain derivatives and partnerships. The character of distributions made during the year from net investment income or net realized gains may differ from their ultimate characterization for federal income tax purposes. Also, due to the timing of dividend distributions, the fiscal year in which amounts are distributed may differ from the year that the income or realized gains (losses) were recorded by the Fund.
Distributions and Components of Distributable Earnings – The tax character of distributions paid by the Fund for the periods indicated is as follows (as adjusted for dividends payable, if applicable):
| | | For the Year Ended
October 31, 2014 | | | For the Year Ended
October 31, 2013 | |
| Ordinary Income | | $ | 666 | | | $ | 1,625 | |
As of October 31, 2014, the Fund’s components of distributable earnings (deficit) on a tax basis are as follows:
| | | Amount | |
| Undistributed Ordinary Income | | $ | 2,222 | |
| Undistributed Long-Term Capital Gain | | | 23,291 | |
| Accumulated Capital and Other Losses* | | | (6,147 | ) |
| Unrealized Appreciation† | | | 15,941 | |
| Total Accumulated Earnings | | $ | 35,307 | |
| * | The Fund has capital loss carryforwards that are identified in the Capital Loss Carryforward note that follows. |
| † | Differences between book-basis and tax-basis unrealized appreciation (depreciation) may be attributable to the losses deferred due to wash sale adjustments, foreign currency gains and losses, adjustments related to PFICs, REITs, RICs, certain derivatives and partnerships. |
The Hartford Value Opportunities Fund
Notes to Financial Statements – (continued)
October 31, 2014
(000’s Omitted)
Reclassification of Capital Accounts – The Fund may record reclassifications in its capital accounts. These reclassifications have no impact on the total net assets of the Fund. The reclassifications are a result of permanent differences between U.S. GAAP and tax accounting for such items as foreign currency, PFICs, expiration or utilization of capital loss carryforwards or net operating losses. Adjustments are made to reflect the impact these items have on current and future distributions to shareholders. Therefore, the source of the Fund’s distributions may be shown in the accompanying Statement of Changes in Net Assets as from undistributed net investment income, from accumulated net realized gains on investments or from capital depending on the type of book and tax differences that exist. For the year ended October 31, 2014, the Fund recorded reclassifications to increase (decrease) the accounts listed below:
| | | Amount | |
| Undistributed Net Investment Income (Loss) | | $ | (91 | ) |
| Accumulated Net Realized Gain (Loss) | | | 91 | |
Capital Loss Carryforward – On December 22, 2010, the Regulated Investment Company Modernization Act of 2010 (the “Act”) was enacted, which made changes to the capital loss carryforward rules. The changes are effective for taxable years beginning after the date of enactment. Under the Act, funds are permitted to carry forward capital losses for an unlimited period. However, any losses incurred during those future taxable years will be required to be utilized prior to the losses incurred in pre-enactment taxable years, which carry an expiration date. As a result of this ordering rule, pre-enactment capital loss carryforwards may be more likely to expire unused. Additionally, post-enactment capital loss carryforwards retain their character as either short-term or long-term capital losses rather than being considered all short-term as permitted under prior regulation.
At October 31, 2014 (tax year end), the Fund had capital loss carryforwards for U.S. federal income tax purposes as follows:
| Year of Expiration | | Amount | |
| 2017 | | $ | 6,147 | |
| Total | | $ | 6,147 | |
As a result of mergers in the Fund, certain provisions in the IRC may limit the future utilization of capital losses. During the year ended October 31, 2014, the Fund utilized $28,344 of prior year capital loss carryforwards.
Accounting for Uncertainty in Income Taxes – The Fund has adopted financial reporting rules that require the Fund to analyze all open tax years, as defined by the statute of limitations, for all major jurisdictions. Generally, tax authorities can examine all tax returns filed for the last three years. The Fund does not have an examination in progress.
The Fund has reviewed all open tax years and major jurisdictions and concluded that these financial reporting rules had no effect on the Fund’s financial position or results of operations. There is no tax liability resulting from unrecognized tax benefits relating to uncertain income tax positions taken or expected to be taken on the tax return for the fiscal year ended October 31, 2014. The Fund is also not aware of any tax positions for which it is reasonably possible that the total amounts of unrecognized tax benefits will significantly change in the next twelve months.
Expenses:
Investment Management Agreement – Hartford Funds Management Company, LLC ("HFMC") serves as the Fund’s investment manager pursuant to an Investment Management Agreement with the Company. HFMC is an indirect wholly owned subsidiary of The Hartford Financial Services Group, Inc. ("The Hartford"). The investment manager has overall investment supervisory responsibility for the Fund. In addition, the investment manager provides administrative personnel, services, equipment, facilities and office space for proper operation of the Fund. HFMC has contracted with Wellington Management Company, LLP ("Wellington Management") under a sub-advisory agreement for the provision of day-to-day investment management services to the Fund in accordance with the Fund’s investment objective and policies. The Fund pays a fee to the investment manager, a portion of which may be used to compensate Wellington Management.
The Hartford Value Opportunities Fund
Notes to Financial Statements – (continued)
October 31, 2014
(000’s Omitted)
The schedule below reflects the rates of compensation paid to the investment manager for investment management services rendered for the period from February 28, 2014 through October 31, 2014; the rates are accrued daily and paid monthly:
| Average Daily Net Assets | | Annual Fee |
| On first $500 million | | 0.7000% |
| On next $500 million | | 0.6000% |
| On next $1.5 billion | | 0.5900% |
| On next $2.5 billion | | 0.5850% |
| On next $5 billion | | 0.5800% |
| Over $10 billion | | 0.5750% |
The schedule below reflects the rates of compensation paid to the investment manager for investment management services rendered during the period November 1, 2013 through February 27, 2014.
| Average Daily Net Assets | | Annual Fee |
| On first $100 million | | 0.8000% |
| On next $150 million | | 0.7500% |
| On next $4.75 billion | | 0.7000% |
| On next $5 billion | | 0.6975% |
| Over $10 billion | | 0.6950% |
Accounting Services Agreement – Pursuant to the Fund Accounting Agreement between HFMC and the Company, on behalf of the Fund, HFMC provides accounting services to the Fund and receives monthly compensation based on the Fund’s average daily net assets at the rates set forth below. The Fund’s accounting services fees are accrued daily and paid monthly.
| Average Daily Net Assets | | Annual Fee |
| On first $5 billion | | 0.014% |
| On next $5 billion | | 0.012% |
| Over $10 billion | | 0.010% |
Operating Expenses – Allocable expenses incurred by the Company are allocated to each Fund and allocated to classes within the Fund in proportion to the average daily net assets of the Fund and each class, except where allocation of certain expenses is more fairly made directly to the Fund or to specific classes within a Fund. As of February 28, 2014, HFMC contractually limited the total operating expenses of this Fund, exclusive of taxes, interest expense, brokerage commissions, acquired fund fees and expenses and extraordinary expenses, through February 28, 2015 as follows:
| Class A | Class B | Class C | Class I | Class R3 | Class R4 | Class R5 | Class Y |
| 1.22% | 1.92% | 1.92% | 1.00% | 1.45% | 1.15% | 0.85% | 0.80% |
From November 1, 2013 through February 27, 2014, the investment manager contractually limited the total operating expenses of this Fund, exclusive of taxes, interest expense, brokerage commissions, acquired fund fees and expenses and extraordinary expenses as follows:
| Class A | Class B | Class C | Class I | Class R3 | Class R4 | Class R5 | Class Y |
| 1.35% | 2.10% | 2.10% | 1.10% | 1.55% | 1.25% | 0.95% | 0.90% |
Fees Paid Indirectly – The Fund has entered into agreements with State Street Global Markets, LLC and Russell Implementation Services, Inc. to partially recapture non-discounted trade commissions. Such rebates are used to pay a portion of the Fund’s expenses. In addition, the Fund's custodian bank has agreed to reduce its fees when the Fund maintains cash on deposit in a non-
The Hartford Value Opportunities Fund
Notes to Financial Statements – (continued)
October 31, 2014
(000’s Omitted)
interest-bearing custody account. For the year ended October 31, 2014, these amounts, if any, are included in the Statement of Operations.
The ratio of expenses to average net assets in the accompanying financial highlights excludes the reduction in expenses related to fees paid indirectly. The annualized expense ratio after waivers for the period listed below reflecting the reduction for fees paid indirectly is as follows:
| | | Year Ended
October 31, 2014 | |
| Class A | | | 1.24 | % |
| Class B | | | 1.97 | |
| Class C | | | 1.95 | |
| Class I | | | 0.87 | |
| Class R3 | | | 1.47 | |
| Class R4 | | | 1.17 | |
| Class R5 | | | 0.85 | |
| Class Y | | | 0.83 | |
Distribution and Service Plan for Class A, B, C, R3 and R4 Shares – Hartford Funds Distributors, LLC ("HFD"), an indirect wholly owned subsidiary of The Hartford, is the principal underwriter and distributor of the Fund. HFD is engaged in distribution activities, which include marketing and distribution of shares through broker/dealers, financing distribution costs and maintaining financial books and records. For the year ended October 31, 2014, HFD received front-end load sales charges of $703 and contingent deferred sales charges of $6 from the Fund.
The Fund has adopted a Distribution and Service Plan in accordance with Rule 12b-1 of the 1940 Act to compensate the distributor (HFD) for activities intended to result in the sale and distribution of Class A, B, C, R3 and R4 shares and for providing services for shareholders. The Rule 12b-1 plan applicable to Class A shares of the Fund provides for payment of a Rule 12b-1 fee of 0.25% of average daily net assets. Some or all of the fee may be used for shareholder servicing expenses with the remainder used for distribution expenses. Under the Class B Plan, the Fund pays the distributor 1.00% of the average daily net assets of Class B shares that are outstanding for 8 years or less, 0.25% of which is a fee for services provided to existing shareholders with the remainder used for distribution expenses. Some or the entire Rule 12b-1 fee for Class B shares may be remitted to broker/dealers for distribution and/or shareholder account services. After eight years, Class B shares convert to Class A shares. Upon conversion to Class A shares, the Class A plan described above will apply to those shares. Under the Class C Plan, the Fund pays the distributor 1.00% of the average daily net assets of Class C shares outstanding, 0.25% of which is intended as a fee for services provided to existing shareholders with the remainder used for distribution expenses. For Class C shares, some or the entire fee may be remitted to broker/dealers for distribution and/or shareholder account services. Class R3 shares have a distribution fee of 0.50% of average daily net assets and Class R4 shares have a distribution fee of 0.25% of average daily net assets. For Class R3 and R4 shares, some or the entire fee may be remitted to broker/dealers for distribution and/or shareholder account services. The Fund’s 12b-1 fees are accrued daily and paid monthly or at such other intervals as the Board of Directors may determine.
Other Related Party Transactions – Certain officers of the Fund are directors and/or officers of HFMC and/or The Hartford or its subsidiaries. For the year ended October 31, 2014, a portion of the Fund’s Chief Compliance Officer’s compensation was paid by all of the investment companies in the Hartford fund complex. The portion allocated to the Fund, as represented in other expenses on the Statement of Operations, rounds to zero. Hartford Administrative Services Company (“HASCO”), an indirect wholly-owned subsidiary of The Hartford, provides transfer agent services to the Fund. HASCO has contractually agreed to reimburse any portion of the transfer agency fees over 0.30% of average daily net assets per fiscal year for each class. Any transfer agency fee reimbursement is determined before considering the contractual operating expense limitation. For providing such services, HASCO is compensated on a per account basis that varies by account type, except with respect to Class Y, for which it is compensated based on average daily net assets. The amount paid to HASCO and any related contractual reimbursement amounts, if applicable, can be found in the Statement of Operations. These fees are accrued daily and paid monthly.
The Hartford Value Opportunities Fund
Notes to Financial Statements – (continued)
October 31, 2014
(000’s Omitted)
Administrative services fees are paid to HASCO for third-party recordkeeping services that are payable as a percentage of net assets in the amount of up to 0.20%, 0.15% and 0.10% for Classes R3, R4 and R5 shares, respectively. The total administrative services fees are shown on the Statement of Operations. These fees are accrued daily and paid monthly.
Affiliate Holdings:
As of October 31, 2014, affiliates of The Hartford had ownership of shares in the Fund as follows:
| | | Percentage of
Class | | | Percentage of
Fund | |
| Class R5 | | | 6 | % | | | — | %* |
| Class Y | | | 13 | | | | — | * |
| | * | Percentage rounds to zero. |
Investment Transactions:
For the year ended October 31, 2014, the cost of purchases and proceeds from sales of investment securities (excluding short-term investments) were as follows:
| | | Excluding U.S.
Government
Obligations | | | U.S.
Government
Obligations | | | Total | |
| Cost of Purchases | | $ | 445,798 | | | $ | — | | | $ | 445,798 | |
| Sales Proceeds | | | 310,397 | | | | — | | | | 310,397 | |
The Hartford Value Opportunities Fund
Notes to Financial Statements – (continued)
October 31, 2014
(000’s Omitted)
Capital Share Transactions:
The following information is for the year ended October 31, 2014, and the year ended October 31, 2013:
| | | For the Year Ended October 31, 2014 | | | For the Year Ended October 31, 2013 | |
| | | Shares Sold* | | | Shares Issued
for Reinvested
Dividends | | | Shares
Redeemed | | | Net Increase
(Decrease) of
Shares | | | Shares Sold | | | Shares Issued
for Reinvested
Dividends | | | Shares
Redeemed | | | Net Increase
(Decrease) of
Shares | |
| Class A | | | | | | | | | | | | | | | | | | | | | | | | | | | | | | | | |
| Shares | | | 6,960 | | | | 28 | | | | (1,825 | ) | | | 5,163 | | | | 1,637 | | | | 88 | | | | (1,422 | ) | | | 303 | |
| Amount | | $ | 138,132 | | | $ | 536 | | | $ | (36,590 | ) | | $ | 102,078 | | | $ | 27,591 | | | $ | 1,287 | | | $ | (22,902 | ) | | $ | 5,976 | |
| Class B | | | | | | | | | | | | | | | | | | | | | | | | | | | | | | | | |
| Shares | | | 106 | | | | — | | | | (124 | ) | | | (18 | ) | | | 20 | | | | 3 | | | | (139 | ) | | | (116 | ) |
| Amount | | $ | 1,829 | | | $ | — | | | $ | (2,211 | ) | | $ | (382 | ) | | $ | 293 | | | $ | 34 | | | $ | (2,036 | ) | | $ | (1,709 | ) |
| Class C | | | | | | | | | | | | | | | | | | | | | | | | | | | | | | | | |
| Shares | | | 1,353 | | | | — | | | | (282 | ) | | | 1,071 | | | | 124 | | | | 6 | | | | (162 | ) | | | (32 | ) |
| Amount | | $ | 24,133 | | | $ | — | | | $ | (5,021 | ) | | $ | 19,112 | | | $ | 1,880 | | | $ | 74 | | | $ | (2,315 | ) | | $ | (361 | ) |
| Class I | | | | | | | | | | | | | | | | | | | | | | | | | | | | | | | | |
| Shares | | | 2,526 | | | | 3 | | | | (777 | ) | | | 1,752 | | | | 349 | | | | 4 | | | | (205 | ) | | | 148 | |
| Amount | | $ | 50,407 | | | $ | 56 | | | $ | (15,266 | ) | | $ | 35,197 | | | $ | 5,522 | | | $ | 57 | | | $ | (3,222 | ) | | $ | 2,357 | |
| Class R3 | | | | | | | | | | | | | | | | | | | | | | | | | | | | | | | | |
| Shares | | | 260 | | | | 1 | | | | (121 | ) | | | 140 | | | | 59 | | | | 1 | | | | (82 | ) | | | (22 | ) |
| Amount | | $ | 5,233 | | | $ | 4 | | | $ | (2,486 | ) | | $ | 2,751 | | | $ | 960 | | | $ | 13 | | | $ | (1,253 | ) | | $ | (280 | ) |
| Class R4 | | | | | | | | | | | | | | | | | | | | | | | | | | | | | | | | |
| Shares | | | 761 | | | | 2 | | | | (499 | ) | | | 264 | | | | 97 | | | | 6 | | | | (135 | ) | | | (32 | ) |
| Amount | | $ | 15,418 | | | $ | 37 | | | $ | (10,221 | ) | | $ | 5,234 | | | $ | 1,618 | | | $ | 93 | | | $ | (2,229 | ) | | $ | (518 | ) |
| Class R5 | | | | | | | | | | | | | | | | | | | | | | | | | | | | | | | | |
| Shares | | | 1,346 | | | | 1 | | | | (1,318 | ) | | | 29 | | | | 34 | | | | 2 | | | | (24 | ) | | | 12 | |
| Amount | | $ | 27,933 | | | $ | 12 | | | $ | (27,523 | ) | | $ | 422 | | | $ | 556 | | | $ | 22 | | | $ | (373 | ) | | $ | 205 | |
| Class Y | | | | | | | | | | | | | | | | | | | | | | | | | | | | | | | | |
| Shares | | | 36 | | | | 1 | | | | (10 | ) | | | 27 | | | | 90 | | | | 1 | | | | (105 | ) | | | (14 | ) |
| Amount | | $ | 23,489 | | | $ | 10 | | | $ | (23,177 | ) | | $ | 322 | | | $ | 1,576 | | | $ | 18 | | | $ | (1,832 | ) | | $ | (238 | ) |
| Total | | | | | | | | | | | | | | | | | | | | | | | | | | | | | | | | |
| Shares | | | 13,348 | | | | 36 | | | | (4,956 | ) | | | 8,428 | | | | 2,410 | | | | 111 | | | | (2,274 | ) | | | 247 | |
| Amount | | $ | 286,574 | | | $ | 655 | | | $ | (122,495 | ) | | $ | 164,734 | | | $ | 39,996 | | | $ | 1,598 | | | $ | (36,162 | ) | | $ | 5,432 | |
* Includes shares issued from merger. Please see the table immediately following for details. For further information please see Fund Merger section that follows.
| | | Shares Issued from Merger | |
| | | For the Year Ended October 31, 2014 | |
| | | Shares | | | Amount | |
| Class A | | | 5,068 | | | $ | 101,053 | |
| Class B | | | 99 | | | | 1,773 | |
| Class C | | | 1,137 | | | | 20,189 | |
| Class I | | | 496 | | | | 9,781 | |
| Class R3 | | | 161 | | | | 3,246 | |
| Class R4 | | | 490 | | | | 9,940 | |
| Class R5 | | | 1,252 | | | | 25,515 | |
| Class Y | | | 21 | | | | 422 | |
| | | | 8,724 | | | $ | 171,919 | |
The following reflects the conversion of Class B shares into Class A shares (reflected as Class A shares sold) for the year ended October 31, 2014, and the year ended October 31, 2013:
| | | Shares | | | Dollars | |
| For the Year Ended October 31, 2014 | | | 36 | | | $ | 712 | |
| For the Year Ended October 31, 2013 | | | 43 | | | $ | 709 | |
The Hartford Value Opportunities Fund
Notes to Financial Statements – (continued)
October 31, 2014
(000’s Omitted)
Line of Credit:
The Fund is one of several Hartford Funds that participate in a $500 million committed revolving line of credit facility. The facility is to be used for temporary or emergency purposes. Under the arrangement, the funds are required to own securities having a market value in excess of 300% of the total bank borrowings. The interest rate on borrowings varies depending on the nature of the loan. The facility also requires a fee to be paid based on the amount of the commitment. This commitment fee is allocated to all the funds participating in the line of credit based on the average net assets of the funds. During the year ended October 31, 2014, the Fund did not have any borrowings under this facility.
Fund Merger:
Reorganization of The Hartford Value Fund into the Fund – At a meeting held on December 13, 2013, the Board of Directors of The Hartford Mutual Funds, Inc. and The Hartford Mutual Funds II, Inc. approved an Agreement and Plan of Reorganization providing for the acquisition of all the assets and liabilities of The Hartford Value Fund (“Target Fund”) by the Fund (“Acquiring Fund”).
Under the terms of the Agreement and Plan of Reorganization, the assets and liabilities of the Target Fund were acquired by the Fund on April 7, 2014. The Fund acquired the assets and liabilities of the Target Fund in exchange for shares in the Fund, which were distributed pro rata by the Target Fund to shareholders, in complete liquidation of the Target Fund.
The Fund did not acquire any capital loss carryforwards from the Target Fund.
This merger was accomplished by tax free exchange, as detailed below:
| | | Net Assets of Target
Fund on April 4, 2014* | | | Net Assets of
Acquiring Fund
Immediately Before
Merger | | | Net Assets of
Acquiring Fund
Immediately
After Merger | | | Target Fund Shares
Exchanged | | | Acquiring Fund
Shares Issued to the
Target Fund's
Shareholders | |
| | | | | | | | | | | | | | | | |
| Class A | | $ | 101,053 | | | $ | 132,465 | | | $ | 233,518 | | | | 9,038 | | | | 5,068 | |
| Class B | | | 1,773 | | | | 3,468 | | | | 5,241 | | | | 162 | | | | 99 | |
| Class C | | | 20,189 | | | | 12,305 | | | | 32,494 | | | | 1,870 | | | | 1,137 | |
| Class I | | | 9,781 | | | | 12,250 | | | | 22,031 | | | | 886 | | | | 496 | |
| Class R3 | | | 3,246 | | | | 2,678 | | | | 5,924 | | | | 300 | | | | 161 | |
| Class R4 | | | 9,940 | | | | 8,094 | | | | 18,034 | | | | 906 | | | | 490 | |
| Class R5 | | | 25,515 | | | | 1,945 | | | | 27,460 | | | | 2,315 | | | | 1,252 | |
| Class Y | | | 422 | | | | 1,397 | | | | 1,819 | | | | 38 | | | | 21 | |
| Total | | $ | 171,919 | | | $ | 174,602 | | | $ | 346,521 | | | | 15,515 | | | | 8,724 | |
* Final day of operations immediately prior to the merger.
The Target Fund had the following unrealized appreciation, accumulated net realized losses and capital stock as of April 4, 2014:
| Fund | | Undistributed
Income | | | Unrealized
Appreciation
(Depreciation) | | | Accumulated
Net Realized
Gains (Losses) | | | Capital Stock | | | Total | |
| Target Fund | | $ | — | | | $ | 28,489 | | | $ | (1,177 | ) | | $ | 144,607 | | | $ | 171,919 | |
The Hartford Value Opportunities Fund
Notes to Financial Statements – (continued)
October 31, 2014
(000’s Omitted)
Assuming the acquisition had been completed on November 1, 2013, the beginning of the annual reporting period of the Funds, the Fund’s pro forma results of operations for the year ended October 31, 2014, would be as follows:
| Fund | | Net Investment Income | | | Net Gain on Investments | | | Net Increase in Net Assets
Resulting From Operations | |
| Acquiring Fund | | $ | 3,762 | | | $ | 35,871 | | | $ | 39,633 | |
Because the combined investment portfolios have been managed as a single integrated portfolio since the acquisition was completed, it is not practical to separate the amounts of revenue and earnings of The Hartford Value Fund that have been included in the Fund’s Statement of Operations since the merger date.
Pending Legal Proceedings:
On February 25, 2011, Jennifer L. Kasilag, Louis Mellinger, Judith M. Menendez, Jacqueline M. Robinson, and Linda A. Russell filed a derivative lawsuit against Hartford Investment Financial Services, LLC (“HIFSCO”) (now known as HFD) on behalf of six Hartford retail mutual funds in the United States District Court for the District of New Jersey, alleging that HIFSCO received excessive advisory and distribution fees in violation of its statutory fiduciary duty under Section 36(b) of the 1940 Act when serving as investment manager and principal underwriter, respectively, to the Hartford retail mutual funds. Although this action was purportedly filed on behalf of certain of the Hartford Funds, none of the Hartford Funds is itself a defendant to the suit. HIFSCO moved to dismiss and, in September 2011, the motion was granted in part and denied in part, with leave to amend the complaint. In November 2011, plaintiffs filed an amended complaint on behalf of certain Hartford retail mutual funds, The Hartford Global Health Fund (now known as The Hartford Healthcare Fund), The Hartford Conservative Allocation Fund, The Hartford Growth Opportunities Fund, The Hartford Inflation Plus Fund, The Hartford Advisers Fund (now known as The Hartford Balanced Fund), and The Hartford Capital Appreciation Fund. Plaintiffs seek to rescind the investment management agreements and distribution plans between HIFSCO and these funds and to recover the total fees charged thereunder or, in the alternative, to recover any improper compensation HIFSCO received, in addition to lost earnings. HIFSCO filed a partial motion to dismiss the amended complaint and, in December 2012, the court dismissed without prejudice the claims regarding distribution fees and denied the motion with respect to the advisory fees claims. HIFSCO disputes the allegations and intends to defend vigorously.
In March 2014, the plaintiffs filed a new complaint that added as new plaintiffs The Hartford Floating Rate Fund and The Hartford Small Company Fund and named as a defendant HFMC, which assumed the role as investment manager to the funds as of January 2013. HFMC and HIFSCO dispute the allegations and intend to defend vigorously.
No accrual for litigation relating to this matter has been recorded in the financial statements of the Fund because the Fund is not party to the suit.
Indemnifications:
Under the Company's organizational documents, the Company shall indemnify its officers and directors to the full extent required or permitted under Maryland General Corporation Law and the federal securities laws. In addition, the Company, on behalf of the Fund, may enter into contracts that contain a variety of indemnifications. The Company's maximum exposure under these arrangements is unknown. However, as of the date of these financial statements, the Company has not had prior claims or losses pursuant to these contracts and expects the risk of loss to be remote.
Subsequent Event:
Effective December 1, 2014, pursuant to a sub-transfer agency agreement between HASCO and Boston Financial Data Services, Inc. (“BFDS”), HASCO has delegated certain transfer agent, dividend disbursing agent and shareholder servicing agent functions to BFDS. The costs and expenses of such delegation are borne by HASCO, not by the Fund.
The Hartford Value Opportunities Fund
Financial Highlights
| | | - Selected Per-Share Data - (A) | | | - Ratios and Supplemental Data - | |
| Class | | Net Asset
Value at
Beginning
of Period | | | Net
Investment
Income
(Loss) | | | Net
Realized
and
Unrealized
Gain
(Loss) on
Invest-
ments | | | Total from
Investment
Operations | | | Dividends
from Net
Investment
Income | | | Distribu-
tions
from
Realized
Capital
Gains | | | Total
Dividends
and
Distributions | | | Net Asset
Value at
End of
Period | | | Total
Return(B) | | | Net Assets
at End of
Period
(000's) | | | Ratio of
Expenses
to
Average
Net
Assets
Before
Adjust-
ments(C) | | | Ratio of
Expenses
to
Average
Net
Assets
After
Adjust-
ments(C) | | | Ratio of
Net
Investment
Income
(Loss) to
Average
Net Assets | |
| For the Year Ended October 31, 2014 |
| A | | $ | 18.31 | | | $ | 0.17 | | | $ | 2.05 | | | $ | 2.22 | | | $ | (0.08 | ) | | $ | – | | | $ | (0.08 | ) | | $ | 20.45 | | | | 12.18 | % | | $ | 237,539 | | | | 1.25 | % | | | 1.25 | % | | | 0.87 | % |
| B | | | 16.36 | | | | 0.03 | | | | 1.83 | | | | 1.86 | | | | – | | | | – | | | | – | | | | 18.22 | | | | 11.37 | | | | 3,928 | | | | 2.27 | | | | 1.97 | | | | 0.19 | |
| C | | | 16.29 | | | | 0.02 | | | | 1.83 | | | | 1.85 | | | | – | | | | – | | | | – | | | | 18.14 | | | | 11.36 | | | | 31,729 | | | | 1.95 | | | | 1.95 | | | | 0.12 | |
| I | | | 18.12 | | | | 0.23 | | | | 2.03 | | | | 2.26 | | | | (0.13 | ) | | | – | | | | (0.13 | ) | | | 20.25 | | | | 12.56 | | | | 44,306 | | | | 0.87 | | | | 0.87 | | | | 1.17 | |
| R3 | | | 18.50 | | | | 0.13 | | | | 2.05 | | | | 2.18 | | | | (0.06 | ) | | | – | | | | (0.06 | ) | | | 20.62 | | | | 11.84 | | | | 4,528 | | | | 1.53 | | | | 1.47 | | | | 0.63 | |
| R4 | | | 18.64 | | | | 0.18 | | | | 2.09 | | | | 2.27 | | | | (0.09 | ) | | | – | | | | (0.09 | ) | | | 20.82 | | | | 12.24 | | | | 13,626 | | | | 1.21 | | | | 1.17 | | | | 0.91 | |
| R5 | | | 18.76 | | | | 0.24 | | | | 2.10 | | | | 2.34 | | | | (0.15 | ) | | | – | | | | (0.15 | ) | | | 20.95 | | | | 12.52 | | | | 2,735 | | | | 0.88 | | | | 0.85 | | | | 1.15 | |
| Y | | | 18.82 | | | | 0.21 | | | | 2.16 | | | | 2.37 | | | | (0.16 | ) | | | – | | | | (0.16 | ) | | | 21.03 | | | | 12.64 | | | | 1,841 | | | | 0.83 | | | | 0.83 | | | | 1.07 | |
| | | | | | | | | | | | | | | | | | | | | | | | | | | | | | | | | | | | | | | | | | | | | | | | | | | | | |
| For the Year Ended October 31, 2013 |
| A | | $ | 14.02 | | | $ | 0.11 | | | $ | 4.40 | | | $ | 4.51 | | | $ | (0.22 | ) | | $ | – | | | $ | (0.22 | ) | | $ | 18.31 | | | | 32.53 | % | | $ | 118,203 | | | | 1.44 | % | | | 1.35 | % | | | 0.67 | % |
| B | | | 12.54 | | | | – | | | | 3.93 | | | | 3.93 | | | | (0.11 | ) | | | – | | | | (0.11 | ) | | | 16.36 | | | | 31.50 | | | | 3,825 | | | | 2.39 | | | | 2.10 | | | | (0.03 | ) |
| C | | | 12.49 | | | | (0.01 | ) | | | 3.93 | | | | 3.92 | | | | (0.12 | ) | | | – | | | | (0.12 | ) | | | 16.29 | | | | 31.59 | | | | 11,059 | | | | 2.13 | | | | 2.10 | | | | (0.07 | ) |
| I | | | 13.87 | | | | 0.16 | | | | 4.34 | | | | 4.50 | | | | (0.25 | ) | | | – | | | | (0.25 | ) | | | 18.12 | | | | 32.93 | | | | 7,908 | | | | 1.07 | | | | 1.06 | | | | 0.95 | |
| R3 | | | 14.16 | | | | 0.08 | | | | 4.45 | | | | 4.53 | | | | (0.19 | ) | | | – | | | | (0.19 | ) | | | 18.50 | | | | 32.31 | | | | 1,480 | | | | 1.68 | | | | 1.55 | | | | 0.49 | |
| R4 | | | 14.27 | | | | 0.13 | | | | 4.47 | | | | 4.60 | | | | (0.23 | ) | | | – | | | | (0.23 | ) | | | 18.64 | | | | 32.62 | | | | 7,271 | | | | 1.32 | | | | 1.25 | | | | 0.78 | |
| R5 | | | 14.36 | | | | 0.18 | | | | 4.50 | | | | 4.68 | | | | (0.28 | ) | | | – | | | | (0.28 | ) | | | 18.76 | | | | 33.06 | | | | 1,909 | | | | 1.02 | | | | 0.95 | | | | 1.08 | |
| Y | | | 14.41 | | | | 0.19 | | | | 4.50 | | | | 4.69 | | | | (0.28 | ) | | | – | | | | (0.28 | ) | | | 18.82 | | | | 33.06 | | | | 1,149 | | | | 0.91 | | | | 0.90 | | | | 1.17 | |
| | | | | | | | | | | | | | | | | | | | | | | | | | | | | | | | | | | | | | | | | | | | | | | | | | | | | |
| For the Year Ended October 31, 2012 |
| A | | $ | 12.68 | | | $ | 0.19 | | | $ | 1.27 | | | $ | 1.46 | | | $ | (0.12 | ) | | $ | – | | | $ | (0.12 | ) | | $ | 14.02 | | | | 11.60 | % | | $ | 86,261 | | | | 1.50 | % | | | 1.35 | % | | | 1.44 | % |
| B | | | 11.33 | | | | 0.08 | | | | 1.15 | | | | 1.23 | | | | (0.02 | ) | | | – | | | | (0.02 | ) | | | 12.54 | | | | 10.85 | | | | 4,388 | | | | 2.44 | | | | 2.10 | | | | 0.65 | |
| C | | | 11.31 | | | | 0.08 | | | | 1.13 | | | | 1.21 | | | | (0.03 | ) | | | – | | | | (0.03 | ) | | | 12.49 | | | | 10.74 | | | | 8,880 | | | | 2.17 | | | | 2.10 | | | | 0.67 | |
| I | | | 12.57 | | | | 0.22 | | | | 1.25 | | | | 1.47 | | | | (0.17 | ) | | | – | | | | (0.17 | ) | | | 13.87 | | | | 11.87 | | | | 3,995 | | | | 1.11 | | | | 1.09 | | | | 1.70 | |
| R3 | | | 12.81 | | | | 0.18 | | | | 1.27 | | | | 1.45 | | | | (0.10 | ) | | | – | | | | (0.10 | ) | | | 14.16 | | | | 11.38 | | | | 1,443 | | | | 1.70 | | | | 1.55 | | | | 1.31 | |
| R4 | | | 12.90 | | | | 0.21 | | | | 1.30 | | | | 1.51 | | | | (0.14 | ) | | | – | | | | (0.14 | ) | | | 14.27 | | | | 11.81 | | | | 6,015 | | | | 1.33 | | | | 1.25 | | | | 1.55 | |
| R5 | | | 12.99 | | | | 0.31 | | | | 1.24 | | | | 1.55 | | | | (0.18 | ) | | | – | | | | (0.18 | ) | | | 14.36 | | | | 12.08 | | | | 1,296 | | | | 1.05 | | | | 0.95 | | | | 2.25 | |
| Y | | | 13.05 | | | | 0.24 | | | | 1.30 | | | | 1.54 | | | | (0.18 | ) | | | – | | | | (0.18 | ) | | | 14.41 | | | | 12.00 | | | | 1,076 | | | | 0.92 | | | | 0.90 | | | | 1.77 | |
| | | | | | | | | | | | | | | | | | | | | | | | | | | | | | | | | | | | | | | | | | | | | | | | | | | | | |
| For the Year Ended October 31, 2011 (D) |
| A(E) | | $ | 12.15 | | | $ | 0.09 | | | $ | 0.45 | | | $ | 0.54 | | | $ | (0.01 | ) | | $ | – | | | $ | (0.01 | ) | | $ | 12.68 | | | | 4.41 | % | | $ | 86,456 | | | | 1.46 | % | | | 1.35 | % | | | 0.81 | % |
| B | | | 10.94 | | | | (0.02 | ) | | | 0.41 | | | | 0.39 | | | | – | | | | – | | | | – | | | | 11.33 | | | | 3.56 | | | | 5,838 | | | | 2.39 | | | | 2.10 | | | | (0.10 | ) |
| C | | | 10.91 | | | | (0.01 | ) | | | 0.41 | | | | 0.40 | | | | – | | | | – | | | | – | | | | 11.31 | | | | 3.67 | | | | 10,227 | | | | 2.15 | | | | 2.10 | | | | (0.09 | ) |
| I | | | 12.04 | | | | 0.14 | | | | 0.44 | | | | 0.58 | | | | (0.05 | ) | | | – | | | | (0.05 | ) | | | 12.57 | | | | 4.80 | | | | 2,535 | | | | 1.03 | | | | 1.01 | | | | 1.06 | |
| R3 | | | 12.30 | | | | 0.07 | | | | 0.44 | | | | 0.51 | | | | – | | | | – | | | | – | | | | 12.81 | | | | 4.15 | | | | 934 | | | | 1.68 | | | | 1.55 | | | | 0.45 | |
| R4 | | | 12.37 | | | | 0.10 | | | | 0.45 | | | | 0.55 | | | | (0.02 | ) | | | – | | | | (0.02 | ) | | | 12.90 | | | | 4.47 | | | | 5,865 | | | | 1.31 | | | | 1.25 | | | | 0.75 | |
| R5 | | | 12.45 | | | | 0.13 | | | | 0.47 | | | | 0.60 | | | | (0.06 | ) | | | – | | | | (0.06 | ) | | | 12.99 | | | | 4.81 | | | | 221 | | | | 1.05 | | | | 0.95 | | | | 1.04 | |
| Y | | | 12.51 | | | | 0.14 | | | | 0.47 | | | | 0.61 | | | | (0.07 | ) | | | – | | | | (0.07 | ) | | | 13.05 | | | | 4.82 | | | | 34,210 | | | | 0.91 | | | | 0.90 | | | | 1.08 | |
See Portfolio Turnover information on the next page.
The Hartford Value Opportunities Fund
Financial Highlights – (continued)
| | | - Selected Per-Share Data - (A) | | | - Ratios and Supplemental Data - | |
| Class | | Net Asset
Value at
Beginning
of Period | | | Net
Investment
Income
(Loss) | | | Net
Realized
and
Unrealized
Gain
(Loss) on
Invest-
ments | | | Total from
Investment
Operations | | | Dividends
from Net
Investment
Income | | | Distribu-
tions
from
Realized
Capital
Gains | | | Total
Dividends
and
Distributions | | | Net Asset
Value at
End of
Period | | | Total
Return(B) | | | Net Assets
at End of
Period
(000's) | | | Ratio of
Expenses
to
Average
Net
Assets
Before
Adjust-
ments(C) | | | Ratio of
Expenses
to
Average
Net
Assets
After
Adjust-
ments(C) | | | Ratio of
Net
Investment
Income
(Loss) to
Average
Net Assets | |
| For the Year Ended October 31, 2010 |
| A | | $ | 10.19 | | | $ | 0.04 | | | $ | 1.97 | | | $ | 2.01 | | | $ | (0.05 | ) | | $ | – | | | $ | (0.05 | ) | | $ | 12.15 | | | | 19.78 | % | | $ | 69,397 | | | | 1.46 | % | | | 1.35 | % | | | 0.34 | % |
| B | | | 9.21 | | | | (0.04 | ) | | | 1.78 | | | | 1.74 | | | | (0.01 | ) | | | – | | | | (0.01 | ) | | | 10.94 | | | | 18.89 | | | | 7,069 | | | | 2.42 | | | | 2.10 | | | | (0.40 | ) |
| C | | | 9.18 | | | | (0.04 | ) | | | 1.77 | | | | 1.73 | | | | – | | | | – | | | | – | | | | 10.91 | | | | 18.85 | | | | 10,954 | | | | 2.18 | | | | 2.10 | | | | (0.41 | ) |
| I | | | 10.09 | | | | 0.07 | | | | 1.94 | | | | 2.01 | | | | (0.06 | ) | | | – | | | | (0.06 | ) | | | 12.04 | | | | 20.00 | | | | 1,494 | | | | 1.05 | | | | 1.05 | | | | 0.64 | |
| R3 | | | 10.30 | | | | 0.01 | | | | 2.00 | | | | 2.01 | | | | (0.01 | ) | | | – | | | | (0.01 | ) | | | 12.30 | | | | 19.56 | | | | 1,021 | | | | 1.67 | | | | 1.58 | | | | 0.10 | |
| R4 | | | 10.37 | | | | 0.05 | | | | 2.00 | | | | 2.05 | | | | (0.05 | ) | | | – | | | | (0.05 | ) | | | 12.37 | | | | 19.79 | | | | 5,147 | | | | 1.31 | | | | 1.28 | | | | 0.39 | |
| R5 | | | 10.43 | | | | 0.07 | | | | 2.03 | | | | 2.10 | | | | (0.08 | ) | | | – | | | | (0.08 | ) | | | 12.45 | | | | 20.17 | | | | 154 | | | | 1.07 | | | | 0.98 | | | | 0.65 | |
| Y | | | 10.47 | | | | 0.08 | | | | 2.04 | | | | 2.12 | | | | (0.08 | ) | | | – | | | | (0.08 | ) | | | 12.51 | | | | 20.28 | | | | 29,098 | | | | 0.91 | | | | 0.91 | | | | 0.73 | |
| (A) | Information presented relates to a share outstanding throughout the indicated period. Net investment income (loss) per share amounts are calculated based on average shares outstanding unless otherwise noted. |
| (B) | Assumes initial investment at net asset value at the beginning of each period, reinvestment of all distributions, the complete redemption of the investment at net asset value at the end of each period and no sales charge. Total return would be reduced if sales charges were taken into account. |
| (C) | Adjustments include waivers and reimbursements, if applicable. Ratios do not include fees paid indirectly (see Expenses in the accompanying Notes to Financial Statements). |
| (D) | Net investment income (loss) per share amounts have been calculated using the SEC method. (E) Class L was merged into Class A on August 5, 2011. |
| | | Portfolio Turnover
Rate for
All Share Classes | |
| For the Year Ended October 31, 2014 | | | 74 | %(A) |
| For the Year Ended October 31, 2013 | | | 81 | |
| For the Year Ended October 31, 2012 | | | 56 | |
| For the Year Ended October 31, 2011 | | | 70 | |
| For the Year Ended October 31, 2010 | | | 87 | |
| (A) | During the year ended October 31, 2014, The Fund incurred $121.7 million in sales of securities held associated with the transition of assets from The Hartford Value Fund, which merged into the Fund on April 7, 2014. These sales are excluded from the portfolio turnover rate calculation. |
Report of Independent Registered Public Accounting Firm
The Board of Directors and Shareholders of
The Hartford Mutual Funds II, Inc.
We have audited the accompanying statement of assets and liabilities, including the schedule of investments, of The Hartford Value Opportunities Fund (one of the portfolios constituting The Hartford Mutual Funds II, Inc. (the Funds)) as of October 31, 2014, and the related statement of operations for the year then ended, the statements of changes in net assets for each of the two years in the period then ended, and the financial highlights for each of the five years in the period then ended. These financial statements and financial highlights are the responsibility of the Funds’ management. Our responsibility is to express an opinion on these financial statements and financial highlights based on our audits.
We conducted our audits in accordance with the standards of the Public Company Accounting Oversight Board (United States). Those standards require that we plan and perform the audit to obtain reasonable assurance about whether the financial statements and financial highlights are free of material misstatement. We were not engaged to perform an audit of the Funds’ internal control over financial reporting. Our audits included consideration of internal control over financial reporting as a basis for designing audit procedures that are appropriate in the circumstances, but not for the purpose of expressing an opinion on the effectiveness of the Funds’ internal control over financial reporting. Accordingly, we express no such opinion. An audit also includes examining, on a test basis, evidence supporting the amounts and disclosures in the financial statements and financial highlights, assessing the accounting principles used and significant estimates made by management, and evaluating the overall financial statement presentation. Our procedures included confirmation of securities owned as of October 31, 2014, by correspondence with the custodian and brokers or by other appropriate auditing procedures where replies from brokers were not received. We believe that our audits provide a reasonable basis for our opinion.
In our opinion, the financial statements and financial highlights referred to above present fairly, in all material respects, the financial position of The Hartford Value Opportunities Fund of The Hartford Mutual Funds II, Inc. at October 31, 2014, the results of its operations for the year then ended, the changes in its net assets for each of the two years in the period then ended, and the financial highlights for each of the five years in the period then ended, in conformity with U.S. generally accepted accounting principles.
Minneapolis, Minnesota
December 18, 2014
The Hartford Value Opportunities Fund
Directors and Officers (Unaudited)
The Board of Directors of the Company (the "Directors") appoints officers who are responsible for the day-to-day operations of the Fund and who execute policies formulated by the Directors. Each Director serves until his or her death, resignation, or retirement or until the next annual meeting of shareholders is held or until his or her successor is elected and qualifies.
Directors and officers who are employed by or who have a financial interest in The Hartford Financial Services Group, Inc. ("The Hartford") are considered “interested” persons of the Fund pursuant to the 1940 Act. Each officer and two of the Company's Directors, as noted in the chart below, are “interested” persons of the Fund. Each Director serves as a director for The Hartford Mutual Funds, Inc., The Hartford Mutual Funds II, Inc., Hartford Series Fund, Inc., and Hartford HLS Series Fund II, Inc., and as a trustee for The Hartford Alternative Strategies Fund, which, as of October 31, 2014, collectively consist of 66 funds. Correspondence may be sent to Directors and officers c/o Hartford Funds, 5 Radnor Corporate Center, Suite 300, 100 Matsonford Road, Radnor, Pennsylvania 19087, except that correspondence to Mr. Annoni, Mr. Dressen and Ms. Quade may be sent to 500 Bielenberg Drive, Suite 500, Woodbury, Minnesota 55125.
The table below sets forth, for each Director and officer, his or her name, year of birth, current position with the Company and date first elected or appointed to The Hartford Mutual Funds, Inc. ("MF") and The Hartford Mutual Funds II, Inc. ("MF2"), principal occupation, and, for Directors, other directorships held. The Fund’s Statement of Additional Information contains further information on the Directors and is available free of charge by calling 1-888-843-7824 or writing to: Hartford Funds, P.O. Box 55022, Boston, MA 02205-5022.
Information on the aggregate remuneration paid to the directors of the Company can be found in the Statement of Operations herein. The Fund pays to The Hartford a portion of the Chief Compliance Officer’s compensation, but does not pay salaries or compensation to any of its other officers or Directors who are employed by The Hartford.
Non-Interested Directors
Hilary E. Ackermann (1956) Director since September 23, 2014
Ms. Ackermann served as Chief Risk Officer at Goldman Sachs Bank USA from October 2008 to November 2011 and serves as a Director of Dynegy, Inc., an independent power company, from October 2012 to present.
Lynn S. Birdsong (1946) Director since 2003, Chairman of the Investment Committee since 2014
Mr. Birdsong is a private investor. Mr. Birdsong currently serves as a Director of the Sovereign High Yield Investment Company (April 2010 to current). Mr. Birdsong currently serves as an Independent Director of Nomura Partners Funds, Inc. (formerly, The Japan Fund) (April 2003 to current). From 2003 to March 2005, Mr. Birdsong was an Independent Director of the Atlantic Whitehall Funds. From 1979 to 2002, Mr. Birdsong was a Managing Director of Zurich Scudder Investments, an investment management firm. During his employment with Scudder, Mr. Birdsong was an Interested Director of The Japan Fund. From January 1981 through December 2013, Mr. Birdsong was a partner in Birdsong Company, an advertising specialty firm.
Robert M. Gavin, Jr. (1940) Director since 2002 (MF) and 1986 (MF2), Chairman of the Board for each since 2004
Dr. Gavin is an educational consultant. Prior to September 1, 2001, he was President of Cranbrook Education Community and prior to July 1996, he was President of Macalester College, St. Paul, Minnesota.
Duane E. Hill (1945) Director since 2001 (MF) and 2002 (MF2), Chairman of the Nominating Committee since 2003
Mr. Hill is a Partner of TSG Ventures L.P., a private equity investment company. Mr. Hill is a former partner of TSG Capital Group, a private equity investment firm that served as sponsor and lead investor in leveraged buyouts of middle market companies.
Sandra S. Jaffee (1941) Director since 2005
Ms. Jaffee is the founder and Chief Executive Officer of a private company, Homeworks Concierge, LLC, which provides residential property management services in Westchester County, New York (January 2012 to present). Ms. Jaffee served as Chairman (2008 to 2009) and Chief Executive Officer of Fortent (formerly Searchspace Group), a leading provider of compliance/regulatory technology to financial institutions from August 2005 to August 2009. From August 2004 to August 2005, Ms. Jaffee served as an Entrepreneur in Residence with Warburg Pincus, a private equity firm. Prior to joining Warburg Pincus, Ms. Jaffee served as Executive Vice President at Citigroup, from September 1995 to July 2004, where she was President and Chief Executive Officer of Citibank’s Global Securities Services (1995 to 2003). Ms. Jaffee currently serves as a member of the Board of Directors of Broadridge Financial Solutions as well as a Trustee of Muhlenberg College.
The Hartford Value Opportunities Fund
Directors and Officers (Unaudited) – (continued)
William P. Johnston (1944) Director since 2005, Chairman of the Compliance Committee since 2005
In June 2006, Mr. Johnston was appointed as Senior Advisor to The Carlyle Group, a global private equity and other alternative asset investment firm and currently serves as an Operating Executive. In July 2006, Mr. Johnston was elected to the Board of Directors of MultiPlan, Inc. and served as a Director (July 2006 to August 2010). In August 2007, Mr. Johnston was elected to the Board of Directors of LifeCare Holdings, Inc. and served as a Director (August 2007 to June 2013). In February 2008, Mr. Johnston was elected to the Board of Directors of HCR-ManorCare, Inc. In May 2006, Mr. Johnston was elected to the Supervisory Board of Fresenius Medical Care AG & Co. KGaA, after its acquisition of Renal Care Group, Inc. in March 2006. Mr. Johnston joined Renal Care Group in November 2002 as a member of the Board of Directors and served as Chairman of the Board from March 2003 through March 2006. From 2002 through 2013, Mr. Johnston served as a Board member of the Georgia O’Keefe Museum. From September 1987 to December 2002, Mr. Johnston was with Equitable Securities Corporation (and its successors, SunTrust Equitable Securities and SunTrust Robinson Humphrey) serving in various investment banking and managerial positions, including Managing Director and Head of Investment Banking, Chief Executive Officer and Vice Chairman.
Phillip O. Peterson (1944) Director since 2002 (MF) and 2000 (MF2), Chairman of the Audit Committee since 2002
Mr. Peterson is a mutual fund industry consultant. He was a partner of KPMG LLP (an accounting firm) until July 1999. Mr. Peterson joined William Blair Funds in February 2007 as a member of the Board of Trustees. From February 2012 to February 2014, Mr. Peterson served as a Trustee of Symetra Variable Mutual Funds. From January 2004 to April 2005, Mr. Peterson served as Independent President of the Strong Mutual Funds.
Lemma W. Senbet (1946) Director since 2005
Dr. Senbet is the William E. Mayer Chair Professor of Finance and Founding Director, Center for Financial Policy, at the University of Maryland, Robert H. Smith School of Business. He was chair of the Finance Department of the University of Maryland, Robert H. Smith School of Business from 1998 to 2006. Since June 2013, he has been on leave from the University to serve as Executive Director of African Economic Research Consortium which focuses on economic policy research and training. Previously, he was a chaired professor of finance at the University of Wisconsin-Madison. Also, he was a Director of the Fortis Funds from March 2000 to July 2002. Dr. Senbet served as Director of the American Finance Association and President of the Western Finance Association. In 2006, Dr. Senbet was inducted Fellow of Financial Management Association International for his career-long distinguished scholarship and professional service.
Interested Directors and Officers
James E. Davey (1964) Director since 2012, President and Chief Executive Officer since 2010
Mr. Davey serves as Executive Vice President of Hartford Life Insurance Company (“HLIC”) and The Hartford. Additionally, Mr. Davey serves as Chairman of the Board, Manager and Senior Managing Director of Hartford Funds Distributors, LLC (“HFD”). He also currently serves as Director, Chairman of the Board, President and Senior Managing Director of Hartford Administrative Services Company (“HASCO”). Mr. Davey also serves as Manager, Chairman of the Board and Senior Managing Director for Hartford Funds Management Company, LLC (“HFMC”) and Director, Chairman of the Board and Senior Managing Director for Hartford Funds Management Group, Inc. ("HFMG"). Mr. Davey has served in various positions within The Hartford and its subsidiaries in connection with the operation of the Hartford Funds. Mr. Davey joined The Hartford in 2002.
Lowndes A. Smith* (1939) Director since 1996 (MF) and 2002 (MF2)
Mr. Smith served as Vice Chairman of The Hartford from February 1997 to January 2002, as President and Chief Executive Officer of Hartford Life, Inc. from February 1997 to January 2002, and as President and Chief Operating Officer of The Hartford Life Insurance Companies from January 1989 to January 2002. Mr. Smith serves as a Director of White Mountains Insurance Group Ltd. (October 2003 to current); One Beacon Insurance (October 2006 to current); Symetra Financial (August 2007 to current) and is a Managing Director of Whittington Gray Associates (January 2007 to current).
* Mr. Smith resigned as a Director of MF, MF2, Hartford Series Fund, Inc. and Hartford HLS Series Fund II, Inc. and as a Trustee of The Hartford Alternative Strategies Fund effective September 17, 2014.
Other Officers
Mark A. Annoni (1964) Vice President, Controller and Treasurer since 2012
Mr. Annoni currently serves as the Assistant Vice President of HLIC (February 2004 to present) and Senior Vice President of HFMG (December 2013 to present). Mr. Annoni has served in various positions within The Hartford and its subsidiaries in connection with the operation of the Hartford Funds. Mr. Annoni joined The Hartford in 2001.
The Hartford Value Opportunities Fund
Directors and Officers (Unaudited) – (continued)
Michael R. Dressen (1963) AML Compliance Officer since 2011
Mr. Dressen currently serves as Assistant Vice President of HLIC. He also serves as Chief Compliance Officer and AML Compliance Officer of HASCO and as AML Officer of HFD. Mr. Dressen has served in various positions within The Hartford and its subsidiaries in connection with the operation of the Hartford Funds.
Edward P. Macdonald (1967) Vice President, Secretary and Chief Legal Officer since 2005
Mr. Macdonald currently serves as Assistant Secretary, Executive Vice President and Deputy General Counsel of HFD, HASCO, HFMC and HFMG. He also serves as Vice President of HLIC. Mr. Macdonald has served in various positions within The Hartford and its subsidiaries in connection with the operation of the Hartford Funds. Mr. Macdonald joined The Hartford in 2005.
Joseph G. Melcher (1973) Vice President and Chief Compliance Officer since 2013
Mr. Melcher currently serves as Executive Vice President of HFD, HFMG and HASCO. Mr. Melcher also currently serves as Executive Vice President and Chief Compliance Officer of HFMC. Mr. Melcher has served in various positions within The Hartford and its subsidiaries in connection with the operation of the Hartford Funds since joining The Hartford in 2012. Prior to joining The Hartford, Mr. Melcher worked at Touchstone Investments, a member of the Western & Southern Financial Group, where he held the position of Vice President and Chief Compliance Officer from 2010 through 2012 and Assistant Vice President, Compliance from 2005 to 2010.
Vernon J. Meyer (1964) Vice President since 2006
Mr. Meyer currently serves as Senior Vice President of HLIC. He also currently serves as Managing Director and Chief Investment Officer of HFMC and Managing Director of HFMG. Mr. Meyer has served in various positions within The Hartford and its subsidiaries in connection with the operation of the Hartford Funds. Mr. Meyer joined The Hartford in 2004.
Laura S. Quade (1969) Vice President since 2012
Ms. Quade currently serves as Vice President of HASCO, HFD and HFMG. She is the Head of Operations of HASCO and formerly served as Director, Enterprise Operations of HLIC. Ms. Quade has served in various positions within The Hartford and its subsidiaries in connection with the operation of the Hartford Funds. Ms. Quade joined The Hartford in 2001.
Martin A. Swanson** (1962) Vice President since 2010
Mr. Swanson currently serves as Vice President of HLIC. Mr. Swanson also serves as Managing Director, Chief Marketing Officer and Principal of HFD and Managing Director of HFMG. Mr. Swanson has served in various positions within The Hartford and its subsidiaries in connection with the operation of the Hartford Funds.
** Mr. Swanson resigned as an officer effective November 6, 2014.
HOW TO OBTAIN A COPY OF THE FUND’S PROXY VOTING POLICIES AND VOTING RECORDS (UNAUDITED)
A description of the policies and procedures that the Fund uses to determine how to vote proxies relating to portfolio securities and information about how the Fund voted proxies relating to portfolio securities during the most recent twelve-month period ended June 30 are available (1) without charge, upon request, by calling 888-843-7824 and (2) on the SEC’s website at http://www.sec.gov.
QUARTERLY PORTFOLIO HOLDINGS INFORMATION (UNAUDITED)
The Fund files a complete schedule of portfolio holdings with the SEC for the first and third quarters of each fiscal year on Form N-Q. The Fund’s Forms N-Q are available (1) without charge, upon request, by calling 888-843-7824 and (2) on the SEC’s website at http://www.sec.gov. The Form N-Q may be reviewed and copied at the SEC’s Public Reference Room in Washington, DC. Information on the operation of the Public Reference Room may be obtained by calling 1-800-SEC-0330.
The Hartford Value Opportunities Fund
Federal Tax Information (Unaudited)
For the fiscal year ended October 31, 2014, there is no further federal tax information required for this Fund.
The Hartford Value Opportunities Fund
Expense Example (Unaudited)
Your Fund's Expenses
As a shareholder of the Fund, you incur two types of costs: (1) transaction costs, including sales charges (loads) on purchase payments, if any, and contingent deferred sales charges (CDSC), if any, and (2) ongoing costs, including investment management fees, distribution and/or service (12b-1) fees, if any, and other fund expenses. This example is intended to help you understand your ongoing costs (in dollars) of investing in the Fund and to compare these costs with the ongoing costs of investing in other mutual funds. The example is based on an investment of $1,000 invested at the beginning of the period and held for the entire period of April 30, 2014 through October 31, 2014.
Actual Expenses
The first set of columns of the table below provides information about actual account values and actual expenses. You may use the information in this column, together with the amount you invested, to estimate the expenses that you paid over the period. Simply divide your account value by $1,000 (for example, an $8,600 account value divided by $1,000 = 8.6), then multiply the result by the number in the line under the heading entitled “Expenses Paid During Period” to estimate the expenses you paid on your account during this period.
Hypothetical Example for Comparison Purposes
The second set of columns of the table below provides information about hypothetical account values and hypothetical expenses based on the Fund's actual expense ratio and an assumed rate of return of 5% per year before expenses, which is not the Fund's actual return. The hypothetical account values and expenses may not be used to estimate the actual ending account balance or expenses you paid for the period. You may use this information to compare the ongoing costs of investing in the Fund and other funds. To do so, compare this 5% hypothetical example with the 5% hypothetical examples that appear in the shareholder reports of the other funds.
Please note that the expenses shown in the table are meant to highlight your ongoing costs only and do not reflect any transactional costs, such as sales charges (loads) and CDSC. Therefore, the second set of columns of the table is useful in comparing ongoing costs only, and will not help you determine the relative total costs of owning different funds. In addition, if these transactional costs were included, your costs would be higher. Expenses are equal to the Fund's annualized expense ratios multiplied by average account value over the period, multiplied by 184/365 (to reflect the one-half year period).
| | | Actual return | | | Hypothetical (5% return before expenses) | | | | | | | | |
| | | Beginning
Account Value
April 30, 2014 | | | Ending Account
Value
October 31, 2014 | | | Expenses paid
during the period
April 30, 2014
through
October 31, 2014 | | | Beginning
Account Value
April 30, 2014 | | | Ending Account
Value
October 31, 2014 | | | Expenses paid
during the period
April 30, 2014
through
October 31, 2014 | | | Annualized
expense
ratio | | | Days
in the
current
1/2
year | | Days
in the
full
year |
| Class A | | $ | 1,000.00 | | | $ | 1,016.40 | | | $ | 6.21 | | | $ | 1,000.00 | | | $ | 1,019.04 | | | $ | 6.22 | | | | 1.22 | % | | 184 | | 365 |
| Class B | | $ | 1,000.00 | | | $ | 1,012.80 | | | $ | 9.74 | | | $ | 1,000.00 | | | $ | 1,015.53 | | | $ | 9.75 | | | | 1.92 | | | 184 | | 365 |
| Class C | | $ | 1,000.00 | | | $ | 1,012.80 | | | $ | 9.74 | | | $ | 1,000.00 | | | $ | 1,015.53 | | | $ | 9.75 | | | | 1.92 | | | 184 | | 365 |
| Class I | | $ | 1,000.00 | | | $ | 1,018.10 | | | $ | 4.34 | | | $ | 1,000.00 | | | $ | 1,020.90 | | | $ | 4.35 | | | | 0.85 | | | 184 | | 365 |
| Class R3 | | $ | 1,000.00 | | | $ | 1,014.80 | | | $ | 7.36 | | | $ | 1,000.00 | | | $ | 1,017.90 | | | $ | 7.38 | | | | 1.45 | | | 184 | | 365 |
| Class R4 | | $ | 1,000.00 | | | $ | 1,016.10 | | | $ | 5.84 | | | $ | 1,000.00 | | | $ | 1,019.41 | | | $ | 5.85 | | | | 1.15 | | | 184 | | 365 |
| Class R5 | | $ | 1,000.00 | | | $ | 1,018.00 | | | $ | 4.32 | | | $ | 1,000.00 | | | $ | 1,020.92 | | | $ | 4.33 | | | | 0.85 | | | 184 | | 365 |
| Class Y | | $ | 1,000.00 | | | $ | 1,018.40 | | | $ | 4.01 | | | $ | 1,000.00 | | | $ | 1,021.23 | | | $ | 4.02 | | | | 0.79 | | | 184 | | 365 |
The Hartford Value Opportunities Fund
Approval of Investment Management and Investment Sub-Advisory Agreements (Unaudited)
Section 15(c) of the Investment Company Act of 1940, as amended (the “1940 Act”), requires that each mutual fund’s board of directors, including a majority of those directors who are not “interested persons” of the mutual fund, as defined in the 1940 Act (the “Independent Directors”), annually review and consider the continuation of the mutual fund’s investment advisory and sub-advisory agreements. At its meeting held on August 5-6, 2014, the Board of Directors (the “Board”) of The Hartford Mutual Funds II, Inc., including each of the Independent Directors, unanimously voted to approve the continuation of the investment management agreement for The Hartford Value Opportunities Fund (the “Fund”) with Hartford Funds Management Company, LLC (“HFMC”) and the continuation of the investment sub-advisory agreement between HFMC and the Fund’s sub-adviser, Wellington Management Company, LLP (the “Sub-adviser,” and together with HFMC, the “Advisers”) (collectively, the “Agreements”).
In the months preceding the August 5-6, 2014 meeting, the Board requested, received and reviewed written responses from the Advisers to questions posed to them on behalf of the Independent Directors and supporting materials relating to those questions and responses. The Board considered information furnished to the Board at its meetings throughout the year, as well as information specifically prepared in connection with the annual approval of the Agreements at the Board’s meetings held on June 17-18, 2014 and August 5-6, 2014. Information provided to the Board at its meetings throughout the year included, among other things, reports on Fund performance, legal and compliance matters, sales and marketing activity, shareholder services, and the other services provided to the Fund by the Advisers and their affiliates. The Board also received in-person presentations by Fund officers and representatives of HFMC at the Board’s meetings on June 17-18, 2014 and August 5-6, 2014 concerning the Agreements.
The Independent Directors, advised by independent legal counsel, engaged service providers to assist them with evaluating the Agreements with respect to the Fund. Lipper Inc. (“Lipper”), an independent provider of investment company data, was retained to provide the Board with reports on how the Fund’s contractual management fees, actual management fees, other non-management fees, overall expense ratios and investment performance compared to those of mutual funds with similar investment objectives. The Independent Directors also engaged an independent financial services consultant (the “Consultant”) to assist them in evaluating the Fund’s management fees, sub-advisory fees, other non-management fees, overall expense ratios and investment performance. In addition, the Consultant reviewed the profitability calculations utilized by HFMC in connection with the continuation of the investment management agreement.
In determining whether to continue the Agreements for the Fund, the members of the Board reviewed and evaluated information and factors they believed to be relevant and appropriate in light of the information that the Board deemed necessary and appropriate through the exercise of its reasonable business judgment. While individual members of the Board may have weighed certain factors differently, the Board’s determination to continue the Agreements was based on a comprehensive consideration of all information provided to the Board throughout the year and specifically with respect to the continuation of the Agreements. A more detailed discussion of the factors the Board considered with respect to its approval of the Agreements is provided below.
Nature, Extent and Quality of Services Provided by the Advisers
The Board requested and considered information concerning the nature, extent and quality of the services provided to the Fund by the Advisers. The Board considered, among other things, the terms of the Agreements and the range of services provided by the Advisers. The Board considered the Advisers’ professional personnel who provide services to the Fund, including each Adviser’s ability and experience in attracting and retaining qualified personnel to service the Fund. The Board considered each Adviser’s reputation and overall financial strength, as well as its willingness to consider and implement organizational and operational changes designed to enhance services to the Hartford Funds. In addition, the Board considered the quality of each Adviser’s communications with the Board and responsiveness to Board inquiries and requests made from time to time with respect to the Fund and other Hartford Funds.
The Board also requested and evaluated information concerning each Adviser’s regulatory and compliance environment. In this regard, the Board requested and reviewed information on each Adviser’s compliance policies and procedures, compliance history, and a report from the Fund’s Chief Compliance Officer on each Adviser’s compliance with applicable laws and regulations, including responses to regulatory developments and compliance issues raised by regulators. The Board also noted the Advisers’ support of the Fund’s compliance control structure, particularly the resources devoted by the Advisers in support of the Fund’s obligations pursuant to Rule 38a-1 under the 1940 Act.
With respect to HFMC, the Board noted that, under the Agreements, HFMC is responsible for the management of the Fund, including oversight of fund operations and service providers, and provides administrative and investment advisory services in connection with selecting, monitoring and supervising the Sub-adviser. The Board considered HFMC’s ongoing monitoring of people, process and performance, including its quarterly reviews of each of the Hartford Funds, semi-annual meetings with the leaders of each Fund’s portfolio management team, and oversight of the Hartford Funds’ approximately 66 portfolio managers. The Board recognized that HFMC has demonstrated a record of making changes to the
The Hartford Value Opportunities Fund
Approval of Investment Management and Investment Sub-Advisory Agreements (Unaudited) – (continued)
management and/or strategies of the Hartford Funds when warranted. The Board considered HFMC’s oversight of the Sub-adviser’s investment approach and results, process for monitoring best execution of portfolio trades by the Sub-adviser, and approach to risk management with respect to the Fund and the service providers to the Fund. The Board also considered HFMC’s oversight of compliance with the Fund’s objective and policies as well as with applicable laws and regulations, noting that regulatory and other developments had over time led to an increase in the scope of HFMC’s services in this regard.
In addition, the Board considered HFMC’s ongoing commitment to review and rationalize the Hartford Funds product line-up and the expenses that HFMC had incurred in connection with fund combinations in recent years. The Board considered that HFMC or its affiliates are responsible for providing the Fund’s officers.
With respect to the Sub-adviser, which provides certain day-to-day portfolio management services for the Fund, the Board considered the quality of the Fund’s portfolio managers, the Sub-adviser’s other investment personnel, its investment philosophy and process, investment research capabilities and resources, performance record, trade execution capabilities and experience. The Board considered the experience of the Fund’s portfolio managers, the number of accounts managed by the portfolio managers, and the Sub-adviser’s method for compensating the portfolio managers.
Based on these considerations, the Board concluded that it was satisfied with the nature, extent and quality of the services provided to the Fund by HFMC and the Sub-adviser.
Performance of the Fund and the Advisers
The Board considered the investment performance of the Fund. In this regard, the Board reviewed the performance of the Fund over different time periods presented in the materials and evaluated HFMC’s analysis of the Fund’s performance for these time periods. The Board considered information and materials provided to the Board by the Advisers concerning Fund performance, as well as information from Lipper comparing the investment performance of the Fund to an appropriate benchmark and universe of peer funds. The Board noted that the Fund’s performance was in the 2nd quintile of its performance universe for the 1- and 5-year periods and the 3rd quintile for the 3-year period. The Board also noted that the Fund’s performance was above its benchmark for the 1- and 5-year periods and in line with its benchmark for the 3-year period.
The Board considered the detailed investment analytics reports provided by Hartford Funds’ Investment Advisory Group throughout the year. These reports include, among other things, information on the Fund’s gross and net returns, the Fund’s investment performance relative to an appropriate benchmark and peer group, various statistics concerning the Fund’s portfolio, and a narrative summary of various factors affecting Fund performance. The Board considered the Advisers’ cooperation with the Investment Committee, which assists the Board in evaluating the performance of the Fund at periodic meetings throughout the year. The Board also considered the analysis provided by the Consultant relating to the Fund’s performance track record.
In light of all the considerations noted above, the Board concluded that it had continued confidence in HFMC’s and the Sub-adviser’s overall capabilities to manage the Fund.
Costs of the Services and Profitability of the Advisers
The Board reviewed information regarding HFMC’s cost to provide investment management and related services to the Fund and HFMC’s profitability, both overall and for the Fund, on a pre-tax basis without regard to distribution expenses. The Board also requested and reviewed information about the profitability to HFMC and its affiliates from all services provided to the Fund and all aspects of their relationship with the Fund. The Board also requested and received information relating to the operations and profitability of the Sub-adviser.
The Board considered the Consultant’s review of the profitability calculations used by HFMC in connection with the continuation of the investment management agreement, noting the Consultant’s view that Hartford Funds’ process for calculating and reporting Fund profitability is reasonable. In this regard, the Board noted that the Consultant performed a full review of this process in light of the recent restructuring of the Hartford Funds business and reported that the approach to analyzing Fund profitability, including the use of common expense allocation methodologies, is reasonable, sound and well within common industry practice.
Based on these considerations, the Board concluded that the profits anticipated to be realized by the Advisers and their affiliates from their relationships with the Fund would not be excessive.
The Hartford Value Opportunities Fund
Approval of Investment Management and Investment Sub-Advisory Agreements (Unaudited) – (continued)
Comparison of Fees and Services Provided by the Advisers
The Board considered comparative information with respect to the management fees to be paid by the Fund to HFMC and the total expense ratios of the Fund. The Board also considered comparative information with respect to the sub-advisory fees to be paid by HFMC to the Sub-adviser. In this regard, the Board requested and reviewed information from HFMC and the Sub-adviser relating to the management and sub-advisory fees, including the sub-advisory fee schedule for the Fund, and total operating expenses for the Fund. With respect to the sub-advisory fee schedule, the Board considered representations from HFMC and the Sub-adviser that the Sub-adviser’s fees were negotiated at arm’s length on a fund-by-fund basis. The Board also reviewed information from Lipper comparing the Fund’s contractual management fees, actual management fees and overall expense ratios relative to a group of funds selected by Lipper, in consultation with the Consultant, and a broader universe of funds selected by Lipper. The Board considered that the Fund’s contractual management fee and total expenses (less 12b-1 and shareholder service fees) were in the 1st quintile of its expense group, while its actual management fee was in the 2nd quintile. The Board noted that the Fund has a temporary contractual expense cap on each share class through February 28, 2015 as well as an automatically renewable contractual expense cap on each share class. These arrangements resulted in reimbursement of certain expenses incurred in 2013.
While the Board recognized that comparisons between the Fund and peer funds may be imprecise, given the different service levels and characteristics of mutual funds and the different business models and cost structures of the Advisers, the comparative information provided by Lipper assisted the Board in evaluating the reasonableness of the Fund’s management and sub-advisory fees and total operating expenses. In addition, the Board considered the analysis and recommendations of the Consultant relating to the Fund’s management and sub-advisory fees and total operating expenses.
Based on these considerations, the Board concluded that the Fund’s fees and total operating expenses, in conjunction with the information about quality of services, profitability, economies of scale, and other matters discussed, were reasonable in light of the services provided.
Economies of Scale
The Board requested and considered information regarding the Advisers’ realization of economies of scale with respect to the Fund and whether the fee levels reflect these economies of scale for the benefit of the Fund’s shareholders. The Board reviewed the breakpoints in the management fee schedule for the Fund, which reduce fee rates as Fund assets grow over time. The Board recognized that a fund with assets beyond the highest breakpoint level will continue to benefit from economies of scale because additional assets are charged the lowest breakpoint fee resulting in lower overall effective management fee rates. The Board also considered that expense limitations and fee waivers that reduce the Fund’s expenses at all asset levels can have the same effect as breakpoints in sharing economies of scale with shareholders and provide protection from an increase in expenses if Fund assets decline. The Board recognized that a fee schedule that reaches a lower breakpoint quickly provides shareholders with the benefit of anticipated or potential economies of scale. The Board also considered that HFMC has been active in managing expenses, which has resulted in benefits being realized by shareholders as assets within the Hartford Funds family of funds have grown over time, including through lower transfer agent costs and other operating expenses.
The Board reviewed and evaluated materials from Lipper and the Consultant showing how management fee schedules of peer funds reflect economies of scale for the benefit of shareholders as a peer fund’s assets hypothetically increase over time. Based on information provided by HFMC, Lipper, and the Consultant, the Board recognized that there is no uniform methodology for establishing breakpoints or uniform pattern in asset levels that trigger breakpoints or the amounts of breakpoints triggered.
After considering all of the information available to it, the Board concluded that it was satisfied with the extent to which economies of scale would be shared for the benefit of the Fund’s shareholders based on currently available information and the effective advisory fees and expense ratios for the Fund at its current and reasonably anticipated asset levels. The Board noted, however, that it would continue to monitor future growth in Fund assets and the appropriateness of additional breakpoints.
Other Benefits
The Board considered other benefits to the Advisers and their affiliates from their relationships with the Fund.
The Board noted that HFMC receives fees for fund accounting and related services from the Fund, and the Board considered information on profits to HFMC for such services. The Board also considered that Hartford Administrative Services Company (“HASCO”), the Fund’s transfer agent and an affiliate of HFMC, receives transfer agency compensation from the Fund, and the Board reviewed information on the profitability of
The Hartford Value Opportunities Fund
Approval of Investment Management and Investment Sub-Advisory Agreements (Unaudited) – (continued)
the Fund’s transfer agency function to HASCO. The Board considered information provided by HASCO indicating that the transfer agent fees charged by HASCO to the Fund were fair and reasonable based on publicly available information.
The Board also considered that Hartford Funds Distributors, LLC (“HFD”), an affiliate of HFMC, serves as principal underwriter of the Fund. As principal underwriter, HFD receives 12b-1 fees from the Fund and receives all or a portion of the sales charges on sales or redemptions of certain classes of shares. The Board also noted that certain affiliates of HFD distribute shares of the Fund and receive compensation in that connection.
The Board considered benefits to the Sub-adviser from its use of the Fund’s brokerage commissions to obtain soft dollar research, and representations from HFMC and the Sub-adviser that the Sub-adviser would not make any revenue-sharing payments or any other type of distribution payments to HFMC or its affiliates.
The Board considered the benefits to shareholders of being part of the Hartford Funds family of funds, including the right to exchange investments between the same class of funds without a sales charge, the ability to reinvest Fund dividends into other funds in the family, and the ability to combine holdings in the Fund with holdings in other funds to obtain a reduced sales charge. The Board considered HFMC’s efforts to provide investors in the family with a broad range of investment styles and asset classes and its entrepreneurial risk in initiating new funds to expand these opportunities for shareholders.
* * * *
Based upon its review of these various factors, among others, the Board concluded that it is in the best interests of the Fund and its shareholders for the Board to approve the Agreements for an additional year. In reaching this decision, the Board did not assign relative weights to the factors discussed above or deem any one or group of them to be controlling in and of themselves. In connection with their deliberations, the Independent Directors met separately in executive session on several occasions, with independent legal counsel and the Consultant, to review the relevant materials and consider their responsibilities under relevant laws and regulations.
The Hartford Value Opportunities Fund
Main Risks (Unaudited)
The main risks of investing in the Fund are described below.
Market, Selection and Strategy Risk: The Fund’s share price may fluctuate due to market risk and/or security selections that may underperform the market or relevant benchmarks. If the sub-adviser's investment strategy does not perform as expected, the Fund could underperform its peers or lose money. There is no guarantee the Fund will achieve its stated objective.
Value Investing Risk: Value investments are considered to be undervalued, but they may never attain their potential value. Value-style investing falls in and out of favor, which may result in periods of underperformance.
Small/Mid-Cap Stock Risk: Small- and mid-cap stocks are generally more volatile and risky and may be less liquid than large-cap stocks because they may have limited operating histories, narrow product lines, and focus on niche markets.
Foreign Investment Risk: Investments in foreign securities may be riskier than investments in U.S. securities. Potential risks include the risks of illiquidity, increased price volatility, less government regulation, less extensive and less frequent accounting and other reporting requirements, unfavorable changes in currency exchange rates, and economic and political disruptions.
THIS PRIVACY POLICY IS NOT PART OF THIS REPORT
Privacy Policy and Practices of The Hartford Financial Services Group, Inc. and its Affiliates
(herein called “we, our and us”)
This Privacy Policy applies to our United States Operations
We value your trust. We are committed to the responsible: a) management; b) use; and c) protection; of Personal Information. This notice describes how we collect, disclose, and protect Personal Information. We collect Personal Information to: a) service your Transactions with us; and b) support our business functions. We may obtain Personal Information from: a) You; b) your Transactions with us; and c) third parties such as a consumer-reporting agency. Based on the type of product or service You apply for or get from us, Personal Information such as: a) your name; b) your address; c) your income; d) your payment; or e) your credit history; may be gathered from sources such as applications, Transactions, and consumer reports. To serve You and service our business, we may share certain Personal Information. We will share Personal Information, only as allowed by law, with affiliates such as: a) our insurance companies; b) our employee agents; c) our brokerage firms; and d) our administrators. As allowed by law, we may share Personal Financial Information with our affiliates to: a) market our products; or b) market our services; to You without providing You with an option to prevent these disclosures. | We may also share Personal Information, only as allowed by law, with unaffiliated third parties including: a) independent agents; b) brokerage firms; c) insurance companies; d) administrators; and e) service providers; who help us serve You and service our business. When allowed by law, we may share certain Personal Financial Information with other unaffiliated third parties who assist us by performing services or functions such as: a) taking surveys; b) marketing our products or services; or c) offering financial products or services under a joint agreement between us and one or more financial institutions. We, and third parties we partner with, may track some of the pages You visit through the use of: a) cookies; b) pixel tagging; or c) other technologies; and currently do not process or comply with any web browser’s “do not track” signal or similar mechanism that indicates a request to disable online tracking of individual users who visit our websites or use our services. We will not sell or share your Personal Financial Information with anyone for purposes unrelated to our business functions without offering You the opportunity to: a) “opt-out;” or b) “opt-in;” as required by law. We only disclose Personal Health Information with: a) your proper written authorization; or b) as otherwise allowed or required by law. Our employees have access to Personal Information in the course of doing their jobs, such as: a) underwriting policies; b) paying claims; c) developing new products; or d) advising customers of our products and services. |
We use manual and electronic security procedures to maintain: a) the confidentiality; and b) the integrity of; Personal Information that we have. We use these procedures to guard against unauthorized access. Some techniques we use to protect Personal Information include: a) secured files; b) user authentication; c) encryption; d) firewall technology; and e) the use of detection software. We are responsible for and must: a) identify information to be protected; b) provide an adequate level of protection for that data; c) grant access to protected data only to those people who must use it in the performance of their job-related duties. Employees who violate our Privacy Policy will be subject to discipline, which may include ending their employment with us. At the start of our business relationship, we will give You a copy of our current Privacy Policy. We will also give You a copy of our current Privacy Policy once a year if You maintain a continuing business relationship with us. We will continue to follow our Privacy Policy regarding Personal Information even when a business relationship no longer exists between us. | As used in this Privacy Notice: Application means your request for our product or service. Personal Financial Information means financial information such as: a) credit history; b) income; c) financial benefits; or d) policy or claim information. Personal Health Information means health information such as: a) your medical records; or b) information about your illness, disability or injury. Personal Information means information that identifies You personally and is not otherwise available to the public. It includes: a) Personal Financial Information; and b) Personal Health Information. Transaction means your business dealings with us, such as: a) your Application; b) your request for us to pay a claim; and c) your request for us to take an action on your account. You means an individual who has given us Personal Information in conjunction with: a) asking about; b) applying for; or c) obtaining; a financial product or service from us if the product or service is used mainly for personal, family, or household purposes. |
This Privacy Policy is being provided on behalf of the following affiliates of The Hartford Financial Services Group, Inc.:
1stAGChoice, Inc.; Access CoverageCorp, Inc.; Access CoverageCorp Technologies, Inc.; American Maturity Life Insurance Company; Archway 60 R, LLC; Business Management Group, Inc.; Champlain Life Reinsurance Company; DMS R, LLC; Eloy R, LLC; Ersatz Corporation; First State Insurance Company; Hartford Accident and Indemnity Company; Hartford Administrative Services Company; Hartford Casualty General Agency, Inc.; Hartford Casualty Insurance Company; Hartford-Comprehensive Employee Benefit Service Company; Hartford Equity Sales Company, Inc.; Hartford Fire General Agency, Inc.; Hartford Fire Insurance Company; Hartford Funds Management Company, LLC; Hartford Funds Management Group, Inc.; Hartford HLS Series Fund II, Inc.; Hartford Insurance Company of Illinois; Hartford Insurance Company of the Midwest; Hartford Insurance Company of the Southeast; Hartford Integrated Technologies, Inc.; Hartford International Life Reassurance Corporation; Hartford Funds Distributors, LLC; Hartford Investment Management Company; Hartford Life and Accident Insurance Company; Hartford Life and Annuity Insurance Company; Hartford Life Insurance Company; Hartford Life Private Placement, LLC; Hartford Lloyd’s Corporation; Hartford Lloyd’s Insurance Company; Hartford Mezzanine Investors I, LLC; Hartford Residual Market, L.C.C.; Hartford Retirement Services, LLC; Hartford Securities Distribution Company, Inc.; Hartford Series Fund, Inc.; Hartford Specialty Insurance Services of Texas, LLC; Hartford Strategic Investments, LLC; Hartford Underwriters Insurance Company; Hartford Technology Services Company, L.L.C.; Hartford of Texas General Agency, Inc.; Hartford Underwriters General Agency, Inc.; HARTRE Company, L.C.C.; HL Investment Advisors, LLC; HLA LLC; Horizon Management Group, LLC; HRA Brokerage Services, Inc.; Lanidex Class B, LLC; M-CAP Insurance Agency, LLC; New England Insurance Company; New England Reinsurance Corporation; Nutmeg Insurance Agency, Inc.; Nutmeg Insurance Company; Pacific Insurance Company, Limited; Planco, LLC: Property and Casualty Insurance Company of Hartford; Revere R, LLC; RVR R, LLC; Sentinel Insurance Company, Ltd.; Sunstone R, LLC; Symphony R, LLC; The Evergreen Group Incorporated; The Hartford Alternative Strategies Fund; The Hartford Mutual Funds, Inc.; The Hartford Mutual Funds II, Inc.; Trumbull Flood Management, L.L.C.; Trumbull Insurance Company; Twin City Fire Insurance Company; White River Life Reinsurance Company.
HPP Revised January 2014
HARTFORDFUNDS
hartfordfunds.com
This information is written in connection with the promotion or marketing of the matter(s) addressed in this material.
This report is submitted for the general information of the shareholders of the Fund. It is not authorized for distribution unless preceded or accompanied by a current prospectus for the Fund.
The information cannot be used or relied upon for the purpose of avoiding IRS penalties. These materials are not intended to provide tax, accounting or legal advice. As with all matters of a tax or legal nature, you should consult your own tax or legal counsel for advice.
Investors should carefully consider the investment objectives, risks, charges, and expenses of Hartford Funds before investing. This and other information can be found in the prospectus and summary prospectus, which can be obtained by calling 888-843-7824 (retail) or 800-279-1541 (institutional). Investors should read them carefully before they invest.
Hartford Funds are underwritten and distributed by Hartford Funds Distributors, LLC.
MFAR-VO14 12/14 114014-3 Printed in U.S.A.
Item 2. Code of Ethics.
| (a) | The registrant, as of the end of the period covered by this report, has adopted a code of ethics that applies to the registrant’s principal executive officer, principal financial officer, principal accounting officer or controller, or persons performing similar functions, regardless of whether these individuals are employed by the registrant or a third party. A copy of the code of ethics is filed herewith. |
| (c) | There have been no amendments, during the period covered by this report, to a provision of the code of ethics that applies to the registrant’s principal executive officer, principal financial officer, principal accounting officer or controller, or persons performing similar functions, regardless of whether these individuals are employed by the registrant or a third party, and that relates to any element of the code of ethics description. |
| (d) | The registrant has not granted any waivers, including an implicit waiver, from a provision of the code of ethics that applies to the registrant’s principal executive officer, principal financial officer, principal accounting officer or controller, or persons performing similar functions, regardless of whether these individuals are employed by the registrant or a third party, that relates to one or more of the items set forth in paragraph (b) of this item’s instructions. |
Item 3. Audit Committee Financial Expert.
The Board of Directors of the Registrant has designated Phillip O. Peterson as an Audit Committee Financial Expert. Mr. Peterson is considered by the Board to be an independent director.
Item 4. Principal Accountant Fees and Services.
| (a) | Audit Fees: The aggregate fees billed for each of the last two fiscal years for professional services rendered by the principal accountant for the audit of the registrant’s annual financial statements or services that are normally provided by the accountant in connection with statutory and regulatory filings or engagements for those fiscal years were: |
$68,785 for the fiscal year ended October 31, 2013; $67,811 for the fiscal year ended October 31, 2014.
| (b) | Audit Related Fees: The aggregate fees billed in each of the last two fiscal years for assurance and related services by the principal accountant that are reasonably related to the performance of the audit of the registrant’s financial statements and are not reported under paragraph (a) of this Item were: |
$2,261 for the fiscal year ended October 31, 2013; $2,439 for the fiscal year ended October 31, 2014. Audit-related services principally in connection with Rule 17Ad-13 under the Securities and Exchange Act of 1934.
| (c) | Tax Fees: The aggregate fees billed in each of the last two fiscal years for professional services rendered by the principal accountant for tax compliance, tax advice, and tax planning were: |
$22,323 for the fiscal year ended October 31, 2013; $18,884 for the fiscal year ended October 31, 2014. Tax-related services are principally in connection with, but not limited to, general tax services, excise tax and Passive Foreign Investment Company (PFIC) analysis.
| (d) | All Other Fees: The aggregate fees billed in each of the last two fiscal years for products and services provided by the principal accountant, other than the services reported in paragraphs (a) through (c) of this Item were: |
$0 for the fiscal year ended October 31, 2013; $0 for the fiscal year ended October 31, 2014.
| (e) | (1) The Pre-Approval Policies and Procedures (the “Policy”) adopted by the Audit Committee of the Registrant (also, the “Fund”) sets forth the procedures pursuant to which services performed by the Independent Auditor for the Registrant may be pre-approved. The following are some main provisions from the Policy. |
| 1. | The Audit Committee must pre-approve all audit services and non-audit services that the Independent Auditor provides to the Fund. |
| 2. | The Audit Committee must pre-approve any engagement of the Independent Auditor to provide non-audit services to any Service Affiliate (which is defined to include any entity controlling, controlled by, or under common control with the investment adviser that provides ongoing services to the Fund) during the period of the Independent Auditor’s engagement to provide audit services to the Fund, if the non-audit services to the Service Affiliate directly impact the Fund’s operations and financial reporting. |
| 3. | The Audit Committee shall pre-approve certain non-audit services to the Fund and its Service Affiliates pursuant to procedures set forth in the Policy. |
| 4. | The Audit Committee, from time to time, may designate one or more of its members who are Independent Directors (each a “Designated Member”) to consider, on the Audit Committee’s behalf, any non-audit services, whether to the Fund or to any Service Affiliate, that have not been pre-approved by the Audit Committee. In considering any requested non-audit services or proposed material change in such services, the Designated Member shall not authorize services which would exceed $50,000 in fees for such services. Any action by the Designated Member in approving a requested non-audit service shall be reported to the Audit Committee not later than at its next scheduled meeting. |
| 5. | The Independent Auditor may not provide specified prohibited non-audit services set forth in the Policy to the Fund, the Fund’s investment adviser, the Service Affiliates or any other member of the investment company complex. |
| (e) | (2) One hundred percent of the services described in items 4(b) through 4(d) were approved in accordance with the Audit Committee's Pre-Approval Policy. As a result, none of such services was approved pursuant to paragraph (c) (7) (i) (c) of Rule 2-01 of Regulation S-X. |
| (f) | None of the hours expended on the principal accountant's engagement to audit the registrant's financial statements for the year ended October 31, 2014, were attributed to work performed by persons other than the principal accountant's full-time, permanent employees. |
| (g) | The aggregate non-audit fees billed by the registrant’s accountant for services rendered to the registrant, and rendered to the registrant’s investment adviser (not including any sub-adviser whose role is primarily portfolio management and is subcontracted with or overseen by another investment adviser), and any entity controlling, controlled by, or under common control with the adviser that provides ongoing services to the registrant for each of the last two fiscal years of the registrant were: |
Non-Audit Fees: $3,499,424 for the fiscal year ended October 31, 2013; $1,438,077 for the fiscal year ended October 31, 2014.
| (h) | The registrant’s audit committee of the board of directors has considered whether the provision of non-audit services that were rendered to the registrant’s investment adviser (not including any sub-adviser whose role is primarily portfolio management and is subcontracted with or overseen by another investment adviser), and any entity controlling, controlled by, or under common control with the investment adviser that provides ongoing services to the registrant that were not pre-approved pursuant to paragraph (c)(7)(ii) of Rule 2-01 of Regulation S-X is compatible with maintaining the principal accountant’s independence. |
Item 5. Audit Committee of Listed Registrants.
Not applicable.
Item 6. Investments
| (a) | The Schedule of Investments in securities of unaffiliated issuers as of the close of the reporting period is included as part of the annual report filed under Item 1 of this form. |
Item 7. Disclosure of Proxy Voting Policies and Procedures for Closed-End Management Investment Companies.
Not applicable.
Item 8. Portfolio Managers of Closed-End Management Investment Companies.
Not applicable.
Item 9. Purchases of Equity Securities by Closed-End Management Investment Company and Affiliated Purchasers.
Not applicable.
Item 10. Submission of Matters to a Vote of Security Holders
There have been no material changes to the procedures by which shareholders may recommend nominees to the registrant’s board of directors since registrant last provided disclosure in response to this requirement.
Item 11. Controls and Procedures.
| (a) | The registrant’s principal executive and principal financial officers, or persons performing similar functions, have concluded that the registrant’s disclosure controls and procedures (as defined in Rule 30a-3(c) under the Investment Company Act of 1940, as amended (the “1940 Act”) (17 CFR 270.30a-3(c))) are generally effective to provide reasonable assurance, as of a date within 90 days of the filing date of the report that includes the disclosure required by this paragraph, based on their evaluation of these controls and procedures required by Rule 30a-3(b) under the 1940 Act (17 CFR 270.30a-3(b)) and Rules 13a-15(b) or 15d-15(b) under the Securities Exchange Act of 1934, as amended (17 CFR 240.13a-15(b) or 240.15d-15(b)). |
| (b) | There were no changes in the registrant’s internal control over financial reporting (as defined in Rule 30a-3(d) under the 1940 Act (17 CFR 270.30a-3(d)) that occurred during the registrant’s second fiscal quarter of the period covered by this report that have materially affected, or is reasonably likely to materially affect, the registrant’s internal control over financial reporting. |
Item 12. Exhibits.
(a)(1) Code of Ethics
(a)(2) Separate certifications for each principal executive officer and principal financial officer of the registrant as required by Rule 30a-2(a) under the 1940 Act (17 CFR 270.30a-2(a)) and Section 302 of the Sarbanes-Oxley Act of 2002 are attached hereto.
(a)(3) Not applicable
(b) Certifications pursuant to Rule 30a-2(b) under the 1940 Act and Section 906 of the Sarbanes-Oxley Act of 2002 are attached hereto.
SIGNATURES
Pursuant to the requirements of the Securities Exchange Act of 1934 and the Investment Company Act of 1940, the registrant has duly caused this report to be signed on its behalf by the undersigned, thereunto duly authorized.
| | THE HARTFORD MUTUAL FUNDS II, INC. |
| | |
| | |
| Date: December 16, 2014 | By: /s/ James E. Davey_______ |
| | James E. Davey, President and |
| | Chief Executive Officer |
Pursuant to the requirements of the Securities Exchange Act of 1934 and the Investment Company Act of 1940, this report has been signed below by the following persons on behalf of the registrant and in the capacities and on the dates indicated.
| Date: December 16, 2014 | By: /s/ James E. Davey______ |
| | James E. Davey, President and |
| | Chief Executive Officer |
| | |
| | |
| Date: December 16, 2014 | By: /s/ Mark A. Annoni_________ |
| | Mark A. Annoni, Vice President, |
| | Treasurer and Controller |