UNITED STATES
SECURITIES AND EXCHANGE COMMISSION
Washington, D.C. 20549
FORM N-CSR
CERTIFIED SHAREHOLDER REPORT OF REGISTERED MANAGEMENT INVESTMENT COMPANIES
Investment Company Act file number: 811-00558
THE HARTFORD MUTUAL FUNDS II, INC.
(Exact name of registrant as specified in charter)
P. O. Box 2999, Hartford, Connecticut 06104-2999
(Address of Principal Executive Offices) (Zip Code)
Edward P. Macdonald, Esquire
Hartford Funds Management Company, LLC
5 Radnor Corporate Center, Suite 300
100 Matsonford Road
Radnor, Pennsylvania 19087
(Name and Address of Agent for Service)
Registrant’s telephone number, including area code: (860) 843-9934
Date of fiscal year end: October 31
Date of reporting period: October 31, 2013
Form N-CSR is to be used by management investment companies to file reports with the Commission not later than 10 days after the transmission to stockholders of any report that is required to be transmitted to stockholders under Rule 30e-1 under the Investment Company Act of 1940 (17 CFR 270.30e-1). The Commission may use the information provided on Form N-CSR in its regulatory, disclosure review, inspection, and policymaking roles.
A registrant is required to disclose the information specified by Form N-CSR, and the Commission will make this information public. A registrant is not required to respond to the collection of information contained in Form N-CSR unless the Form displays a currently valid Office of Management and Budget ("OMB") control number. Please direct comments concerning the accuracy of the information collection burden estimate and any suggestions for reducing the burden to Secretary, Securities and Exchange Commission, 100 F. Street, NE, Washington, DC 20549. The OMB has reviewed this collection of information under the clearance requirements of 44 U.S.C. § 3507.
Item 1. Reports to Stockholders.
HARTFORDFUNDS
 | THE HARTFORD GROWTH FUND
2013 Annual Report |
The Hartford Growth Fund
Table of Contents
The views expressed in the Fund’s Manager Discussion under ‘‘Why did the Fund perform this way?’’ and ‘‘What is the outlook?’’ are views of the Fund’s sub-adviser and portfolio management team through the end of the period and are subject to change based on market and other conditions. The Fund’s Manager Discussion is for informational purposes only and does not represent an offer, recommendation or solicitation to buy, hold or sell any security. The specific securities identified and described, if any, do not represent all of the securities purchased or sold and you should not assume that investments in the securities identified and discussed will be profitable.
| The Hartford Growth Fund inception 06/08/1949 |
| (sub-advised by Wellington Management Company, LLP) |
| |
| Investment objective – Seeks long-term capital appreciation. |
Performance Overview 10/31/03 - 10/31/13
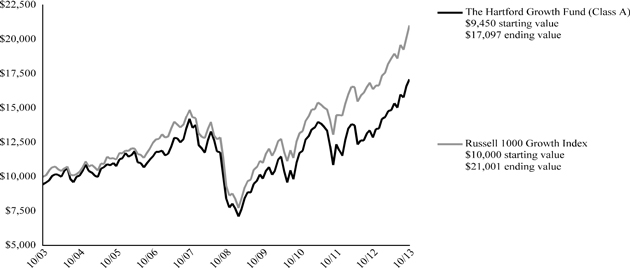
The chart above represents the hypothetical growth of a $10,000 investment in Class A which includes a sales charge. Growth results in classes other than Class A will vary from what is seen above due to differences in the expenses charged to those share classes.
Average Annual Total Returns (as of 10/31/13)
| | | 1 Year | | | 5 Years | | | 10 Years | |
| Growth A# | | | 32.96 | % | | | 15.20 | % | | | 6.11 | % |
| Growth A## | | | 25.64 | % | | | 13.91 | % | | | 5.51 | % |
| Growth B# | | | 31.92 | % | | | 14.40 | % | | | 5.50 | %* |
| Growth B## | | | 26.92 | % | | | 14.16 | % | | | 5.50 | %* |
| Growth C# | | | 32.01 | % | | | 14.38 | % | | | 5.36 | % |
| Growth C## | | | 31.01 | % | | | 14.38 | % | | | 5.36 | % |
| Growth I# | | | 33.28 | % | | | 15.56 | % | | | 6.36 | % |
| Growth R3# | | | 32.68 | % | | | 14.91 | % | | | 6.09 | % |
| Growth R4# | | | 33.04 | % | | | 15.26 | % | | | 6.32 | % |
| Growth R5# | | | 33.42 | % | | | 15.52 | % | | | 6.49 | % |
| Growth Y# | | | 33.67 | % | | | 15.76 | % | | | 6.63 | % |
| Russell 1000 Growth Index | | | 28.29 | % | | | 17.51 | % | | | 7.70 | % |
| * | Class B shares convert to Class A shares after 8 years. The return shown reflects the conversion to Class A shares, which had different operating expenses, for the period after conversion. |
PERFORMANCE DATA QUOTED REPRESENTS PAST PERFORMANCE AND DOES NOT GUARANTEE FUTURE RESULTS. The investment return and principal value of the investment will fluctuate so that investors’ shares, when redeemed, may be worth more or less than their original cost. Current performance may be lower or higher than the performance data quoted. To obtain performance data current to the most recent month-end, please visit our website www.hartfordfunds.com.
The initial investment in Class A shares reflects the maximum sales charge of 5.50% and returns for Classes B and C reflect a contingent deferred sales charge of 5.00% and 1.00%, respectively.
Total returns presented above were calculated using the Fund’s net asset value available to shareholders for sale or redemption of Fund shares on October 31, 2013, which may exclude investment transactions as of this date. All share class returns assume the reinvestment of all distributions at net asset value and the deduction of all fund expenses.
Effective 9/30/09, Class B shares of the Fund were closed to new investments.
Class I shares commenced operations on 8/31/06. Performance prior to that date is that of the Fund's Class A shares (excluding sales charges), which had different operating expenses. Class R3, R4 and R5 shares commenced operations on 12/22/06. Performance prior to that date is that of the Fund's Class Y shares which had different operating expenses.
Russell 1000 Growth Index is an unmanaged index which measures the performance of those Russell 1000 Index companies with higher price-to-book ratios and higher forecasted growth values. (The Russell 1000 Index is an unmanaged index that measures the performance of the 1,000 largest companies in the Russell 3000 Index, which measures the performance of the 3,000 largest U.S. companies based on total market capitalization.)
You cannot invest directly in an index.
The chart and table do not reflect the deductions of taxes that a shareholder would pay on Fund distributions or the redemption of Fund shares.
Performance information may reflect historical or current expense waivers/reimbursements from the investment adviser, without which performance would have been lower. For information on current expense waivers/reimbursements, please see the prospectus.
| The Hartford Growth Fund |
| Manager Discussion |
| October 31, 2013 (Unaudited) |
| Operating Expenses* |
| | | Net | | | Gross | |
| Growth Class A | | | 1.25% | | | | 1.27% | |
| Growth Class B | | | 2.00% | | | | 2.27% | |
| Growth Class C | | | 1.97% | | | | 1.97% | |
| Growth Class I | | | 0.99% | | | | 0.99% | |
| Growth Class R3 | | | 1.50% | | | | 1.65% | |
| Growth Class R4 | | | 1.20% | | | | 1.20% | |
| Growth Class R5 | | | 0.90% | | | | 0.90% | |
| Growth Class Y | | | 0.79% | | | | 0.79% | |
| * | As of the Fund's current prospectus dated March 1, 2013. Actual expenses may be higher. Please see accompanying Financial Highlights for expense ratios for the year ended October 31, 2013. |
Gross expenses are the Fund's total annual operating expenses shown in the Fund's most recent prospectus. Net expenses are the Fund's total annual operating expenses as of the date of the Fund's most recent prospectus and reflect contractual expense waivers/reimbursements in instances when these reductions reduce the Fund's gross expenses. Certain contractual waivers/reimbursements remain in effect until February 28, 2014. Other contractual waivers/reimbursements remain in effect until February 28, 2014, and automatically renew for one-year terms unless terminated.
All investments are subject to risk including the possible loss of principal. For a discussion of the Fund’s risks, please see the Main Risks section. For more detailed information on the risks associated with an investment in the Fund, please see the prospectus.
| Portfolio Manager |
| Andrew J. Shilling, CFA |
| Senior Vice President and Equity Portfolio Manager |
How did the Fund perform?
The Class A shares of The Hartford Growth Fund returned 32.96%, before sales charge, for the twelve-month period ended October 31, 2013, outperforming the Fund’s benchmark, the Russell 1000 Growth Index, which returned 28.29% for the same period. The Fund also outperformed the 31.20% average return of the Multi-Cap Growth Funds peer group, a group of funds with investment strategies similar to those of the Fund.
Why did the Fund perform this way?
Despite clear signs of political dysfunction in Washington, U.S. equities surged during the period (+27%) and reached a new all-time high during October (as measured by the S&P 500 Index). From its closing low on March 9, 2009, the S&P 500 ended October 2013 up over 159%. There have been a few hiccups during the rally, including in August 2013, where U.S. stocks suffered their worst month of the year amid heightened geopolitical risks stemming from the widening conflict in Syria. In September, the Federal Open Market Committee’s decision to leave the pace of its monthly asset purchases unchanged at $85 billion surprised many investors and contributed to the burgeoning risk appetites among many market participants. This continued highly accommodative monetary policy, along with solid earnings results and an upward trending housing market, overshadowed the 16-day government shutdown and near breach of the U.S. debt ceiling. Investors applauded the last-minute deal to end the fiscal stalemate in Washington; however, the U.S. Congress only extended the debt ceiling until February 7 and funded the government through January 15, so we may revisit the political dysfunction early in 2014. Investors also cheered the nomination of Janet Yellen to become the next head of the U.S. Federal Reserve (Fed); she is widely viewed as more likely to maintain the Fed’s current monetary policy than outgoing chairman Ben Bernanke.
All ten sectors of the Russell 1000 Growth Index had positive returns for the period. Health Care (+42%), Consumer Discretionary (+40%), and Industrials (+37%) performed the best, while Information Technology (+16%) and Telecommunication Services (+19%) lagged on a relative basis. Growth stocks (+28%) performed in line with value stocks (+28%), as measured by the Russell 1000 Growth and Russell 1000 Value Indices.
The Fund’s outperformance versus the benchmark was driven primarily by strong stock selection in the Information Technology and Consumer Staples sectors, which was slightly offset by weak selection in the Consumer Discretionary and Health Care sectors. Sector allocation, which is a residual of bottom-up stock selection, also contributed to relative performance. Positive effects from an overweight to the Consumer Discretionary sector and an underweight to the Consumer Staples sector more than offset the negative effects of the Fund’s overweight to the Information Technology sector and underweight to the Industrials sector. A modest cash position detracted from relative returns in an upward-trending market.
Green Mountain Coffee (Consumer Staples), Gilead Sciences (Health Care), and Facebook (Information Technology) were the top contributors to absolute and relative performance during the period. Shares of Green Mountain Coffee, the leading provider of single-cup brewers and portion packs, outperformed during the period after management announced plans for an expanded relationship with Starbucks and provided an upward revision to earnings guidance. Shares of Gilead Sciences, a U.S.-based biopharmaceutical company, moved steadily higher as strong quarterly results were driven by growing sales of the firm's antiviral franchise and pipeline momentum continued to build. Shares of Facebook, a social
| The Hartford Growth Fund |
| Manager Discussion – (continued) |
| October 31, 2013 (Unaudited) |
networking website, surged after the company reported better-than-expected quarterly earnings driven by strong mobile ad revenues.
Top detractors from relative performance during the period were Edwards Lifesciences (Health Care), D.R. Horton (Consumer Discretionary), and Citrix Systems (Information Technology). Shares of Edwards Lifesciences, a medical device company specializing in heart valve technology and treatments for cardiovascular diseases, declined after the firm reported disappointing first quarter 2013 results due to poor transcatheter heart valve (THV) sales; we eliminated our position during the period. Shares of D.R. Horton, a U.S.-based homebuilder, underperformed during the period after the company reported solid earnings but missed consensus revenue expectations. Some investors feared that the eventual rise in interest rates (and mortgage/borrowing rates) could serve as a significant headwind for homebuilders. Shares of Citrix Systems, a cloud computing solutions provider, fell after management preannounced weaker-than-expected quarterly revenue and earnings. Stocks that detracted most from absolute returns also included Apple (Information Technology) and Intuitive Surgical (Health Care).
Derivatives are not used in a significant manner in this Fund and did not have a material impact on performance during the period.
What is the outlook?
We continue to anticipate moderate growth globally. We are encouraged by the recent data out of Europe, which we believe suggests that the continent’s economy has stabilized. Emerging markets have shown pockets of recent weakness, but we do not expect a significant global downturn given the strength of the U.S. economy and the improved balance sheets of many emerging market countries.
In the U.S., we expect continued momentum in housing and auto sales, and sustained growth in the oil shale industry, should benefit the U.S. economy. We continue to anticipate moderate GDP growth, but we have been encouraged by recent data. The combination of a reduction in household debt and historic lows in interest rates has resulted in the reduction of household debt burdens that usually mark the beginning of a consumer spending recovery. Additionally, banks have loosened lending standards to businesses, which we view as a positive signal for capital spending. Overall, we believe the U.S. economy should still be in an expansion phase with stronger growth, a lower fiscal deficit, and limited inflationary pressures.
At the end of the period, the Fund’s largest overweights were to Consumer Discretionary and Information Technology, while the Fund remained underweight in Consumer Staples and Energy, relative to the benchmark.
Diversification by Sector
as of October 31, 2013
| Sector | | Percentage of
Net Assets | |
| Equity Securities | | | | |
| Consumer Discretionary | | | 32.0 | % |
| Consumer Staples | | | 7.7 | |
| Energy | | | 1.7 | |
| Financials | | | 5.0 | |
| Health Care | | | 11.4 | |
| Industrials | | | 11.6 | |
| Information Technology | | | 27.1 | |
| Materials | | | 3.2 | |
| Total | | | 99.7 | % |
| Short-Term Investments | | | 0.2 | |
| Other Assets and Liabilities | | | 0.1 | |
| Total | | | 100.0 | % |
A sector may be comprised of several industries. For Fund compliance purposes, the Fund may not use the same classification system and these sector classifications are used for reporting ease.
| The Hartford Growth Fund |
| Schedule of Investments |
| October 31, 2013 |
| (000’s Omitted) |
| Shares or Principal Amount | | Market Value ╪ | |
| COMMON STOCKS - 99.7% | | | | |
| | | | | Automobiles and Components - 1.6% | | | | |
| | 170 | | | Harley-Davidson, Inc. | | $ | 10,862 | |
| | | | | | | | | |
| | | | | Capital Goods - 5.5% | | | | |
| | 181 | | | AMETEK, Inc. | | | 8,665 | |
| | 47 | | | Cummins, Inc. | | | 5,999 | |
| | 108 | | | Eaton Corp. plc | | | 7,625 | |
| | 20 | | | Precision Castparts Corp. | | | 5,155 | |
| | 122 | | | Safran S.A. ADR | | | 7,829 | |
| | 6 | | | W.W. Grainger, Inc. | | | 1,560 | |
| | | | | | | | 36,833 | |
| | | | | Commercial and Professional Services - 3.0% | | | | |
| | 86 | | | Equifax, Inc. ● | | | 5,581 | |
| | 71 | | | IHS, Inc. ● | | | 7,763 | |
| | 164 | | | Nielsen Holdings N.V. | | | 6,451 | |
| | | | | | | | 19,795 | |
| | | | | Consumer Durables and Apparel - 7.4% | | | | |
| | 550 | | | D.R. Horton, Inc. | | | 10,428 | |
| | 310 | | | Lennar Corp. | | | 11,010 | |
| | 148 | | | Lululemon Athletica, Inc. ● | | | 10,245 | |
| | 73 | | | Michael Kors Holdings Ltd. ● | | | 5,645 | |
| | 50 | | | PVH Corp. | | | 6,226 | |
| | 34 | | | Ralph Lauren Corp. | | | 5,604 | |
| | | | | | | | 49,158 | |
| | | | | Consumer Services - 6.5% | | | | |
| | 9 | | | Chipotle Mexican Grill, Inc. | | | 4,840 | |
| | 216 | | | Dunkin' Brands Group, Inc. | | | 10,296 | |
| | 121 | | | Starwood Hotels & Resorts, Inc. | | | 8,926 | |
| | 96 | | | Wyndham Worldwide Corp. | | | 6,397 | |
| | 51 | | | Wynn Resorts Ltd. | | | 8,447 | |
| | 59 | | | Yum! Brands, Inc. | | | 3,972 | |
| | | | | | | | 42,878 | |
| | | | | Diversified Financials - 4.2% | | | | |
| | 89 | | | American Express Co. | | | 7,250 | |
| | 27 | | | BlackRock, Inc. | | | 8,238 | |
| | 32 | | | IntercontinentalExchange, Inc. ● | | | 6,140 | |
| | 123 | | | JP Morgan Chase & Co. | | | 6,361 | |
| | | | | | | | 27,989 | |
| | | | | Energy - 1.7% | | | | |
| | 66 | | | Anadarko Petroleum Corp. | | | 6,289 | |
| | 222 | | | Cobalt International Energy, Inc. ● | | | 5,145 | |
| | | | | | | | 11,434 | |
| | | | | Food and Staples Retailing - 1.3% | | | | |
| | 143 | | | CVS Caremark Corp. ● | | | 8,880 | |
| | | | | | | | | |
| | | | | Food, Beverage and Tobacco - 6.4% | | | | |
| | 84 | | | Anheuser-Busch InBev N.V. ADR | | | 8,743 | |
| | 47 | | | Diageo plc ADR | | | 6,024 | |
| | 180 | | | Green Mountain Coffee Roasters, Inc. ● | | | 11,320 | |
| | 46 | | | Mead Johnson Nutrition Co. | | | 3,749 | |
| | 202 | | | Mondelez International, Inc. | | | 6,782 | |
| | 105 | | | Monster Beverage Corp. ● | | | 5,988 | |
| | | | | | | | 42,606 | |
| | | | | Health Care Equipment and Services - 2.0% | | | | |
| | 111 | | | Covidien plc | | | 7,086 | |
| | 16 | | | Intuitive Surgical, Inc. ● | | | 5,975 | |
| | | | | | | | 13,061 | |
| | | | | Materials - 3.2% | | | | |
| | 127 | | | Monsanto Co. | | | 13,280 | |
| | 42 | | | Sherwin-Williams Co. | | | 7,816 | |
| | | | | | | | 21,096 | |
| | | | | Media - 7.1% | | | | |
| | 196 | | | Comcast Corp. Class A | | | 9,337 | |
| | 2,351 | | | Sirius XM Radio, Inc. | | | 8,864 | |
| | 140 | | | Time Warner, Inc. | | | 9,593 | |
| | 231 | | | Twenty-First Century Fox, Inc. | | | 7,864 | |
| | 163 | | | Walt Disney Co. | | | 11,213 | |
| | | | | | | | 46,871 | |
| | | | | Pharmaceuticals, Biotechnology and Life Sciences - 9.4% | | | | |
| | 78 | | | Allergan, Inc. ● | | | 7,026 | |
| | 45 | | | Biogen Idec, Inc. | | | 11,109 | |
| | 240 | | | Bristol-Myers Squibb Co. | | | 12,627 | |
| | 289 | | | Gilead Sciences, Inc. ● | | | 20,494 | |
| | 27 | | | Regeneron Pharmaceuticals, Inc. ● | | | 7,677 | |
| | 47 | | | Vertex Pharmaceuticals, Inc. ● | | | 3,375 | |
| | | | | | | | 62,308 | |
| | | | | Real Estate - 0.8% | | | | |
| | 66 | | | American Tower Corp. REIT | | | 5,274 | |
| | | | | | | | | |
| | | | | Retailing - 9.4% | | | | |
| | 5 | | | Amazon.com, Inc. | | | 1,822 | |
| | 26 | | | AutoZone, Inc. ● | | | 11,387 | |
| | 110 | | | Dollar General Corp. ● | | | 6,333 | |
| | 45 | | | Family Dollar Stores, Inc. | | | 3,069 | |
| | 112 | | | Home Depot, Inc. | | | 8,733 | |
| | 342 | | | Lowe's Co., Inc. | | | 17,001 | |
| | 12 | | | Priceline.com, Inc. ● | | | 12,219 | |
| | 21 | | | Ross Stores, Inc. | | | 1,617 | |
| | | | | | | | 62,181 | |
| | | | | Semiconductors and Semiconductor Equipment - 1.2% | | | | |
| | 248 | | | Altera Corp. ● | | | 8,319 | |
| | | | | | | | | |
| | | | | Software and Services - 23.4% | | | | |
| | 45 | | | Alliance Data Systems Corp. | | | 10,669 | |
| | 134 | | | Citrix Systems, Inc. ● | | | 7,589 | |
| | 146 | | | Cognizant Technology Solutions Corp. ● | | | 12,732 | |
| | 237 | | | eBay, Inc. ● | | | 12,475 | |
| | 317 | | | Facebook, Inc. ● | | | 15,910 | |
| | 26 | | | Google, Inc. ● | | | 26,630 | |
| | 45 | | | IBM Corp. | | | 8,050 | |
| | 99 | | | Intuit, Inc. | | | 7,076 | |
| | 28 | | | LinkedIn Corp. Class A ● | | | 6,256 | |
| | 17 | | | Mastercard, Inc. | | | 11,943 | |
| | 204 | | | Oracle Corp. | | | 6,827 | |
| | 150 | | | Salesforce.com, Inc. ● | | | 7,999 | |
| | 92 | | | ServiceNow, Inc. ● | | | 5,030 | |
| | 99 | | | Splunk, Inc. ● | | | 6,223 | |
| | 49 | | | Visa, Inc. | | | 9,659 | |
| | | | | | | | 155,068 | |
| | | | | Technology Hardware and Equipment - 2.5% | | | | |
| | 21 | | | Apple, Inc. ● | | | 10,888 | |
| | 323 | | | Juniper Networks, Inc. ● | | | 6,023 | |
| | | | | | | | 16,911 | |
| | | | | Transportation - 3.1% | | | | |
| | 300 | | | Hertz Global Holdings, Inc. ● | | | 6,893 | |
| | 88 | | | J.B. Hunt Transport Services, Inc. | | | 6,579 | |
The accompanying notes are an integral part of these financial statements.
| The Hartford Growth Fund |
| Schedule of Investments – (continued) |
| October 31, 2013 |
| (000’s Omitted) |
| Shares or Principal Amount | | Market Value ╪ | |
| COMMON STOCKS - 99.7% - (continued) | |
| | | | | Transportation - 3.1% - (continued) | | | | |
| | 58 | | | Kansas City Southern | | $ | 6,995 | |
| | | | | | | | 20,467 | |
| | | | | Total common stocks | | | | |
| | | | | (cost $493,373) | | $ | 661,991 | |
| | | | | | | | | |
| | | | | Total long-term investments
(cost $493,373) | | $ | 661,991 | |
| | | | | | | | | |
| SHORT-TERM INVESTMENTS - 0.2% | | | | |
| Repurchase Agreements - 0.2% | | | | |
| | | | | Bank of America Merrill Lynch TriParty
Repurchase Agreement (maturing on
11/01/2013 in the amount of $103,
collateralized by FHLMC 4.50%, 2040,
FNMA 1.92% - 4.00%, 2036 - 2043, value
of $105) | | | | |
| $ | 103 | | | 0.10%, 10/31/2013 | | $ | 103 | |
| | | | | Bank of Montreal TriParty Repurchase
Agreement (maturing on 11/01/2013 in the
amount of $36, collateralized by FHLMC
4.00%, 2043, FNMA 2.00% - 6.00%, 2020 -
2043, GNMA 3.00%, 2043, value of $36) | | | | |
| | 35 | | | 0.09%, 10/31/2013 | | | 35 | |
| | | | | Barclays Capital TriParty Repurchase
Agreement (maturing on 11/01/2013 in the
amount of $165, collateralized by U.S.
Treasury Note 0.25% - 4.00%, 2015, value
of $168) | | | | |
| | 165 | | | 0.08%, 10/31/2013 | | | 165 | |
| | | | | Citigroup Global Markets, Inc. TriParty
Repurchase Agreement (maturing on
11/01/2013 in the amount of $468,
collateralized by U.S. Treasury Bill 0.01% -
0.35%, 2013 - 2014, U.S. Treasury Bond
2.75% - 8.75%, 2017 - 2042, U.S. Treasury
Note 0.25% - 4.75%, 2013 - 2022, value of
$477) | | | | |
| | 468 | | | 0.09%, 10/31/2013 | | | 468 | |
| | | | | Deutsche Bank Securities TriParty Repurchase
Agreement (maturing on 11/01/2013 in the
amount of $189, collateralized by FHLMC
2.50% - 7.50%, 2026 - 2043, FNMA 3.00%
- 7.00%, 2026 - 2043, GNMA 2.67% -
5.00%, 2024 - 2048, value of $192) | | | | |
| | 189 | | | 0.12%, 10/31/2013 | | | 189 | |
| | | | | RBS Securities, Inc. TriParty Repurchase
Agreement (maturing on 11/01/2013 in the
amount of $111, collateralized by U.S.
Treasury Note 0.75% - 2.63%, 2014 - 2021,
value of $114) | | | | |
| | 111 | | | 0.09%, 10/31/2013 | | | 111 | |
| | | | | TD Securities TriParty Repurchase Agreement
(maturing on 11/01/2013 in the amount of
$196, collateralized by FNMA 2.50% -
4.00%, 2027 - 2042, GNMA 2.50%, 2043,
value of $200) | | | | |
| | 196 | | | 0.10%, 10/31/2013 | | | | | | | 196 | |
| | | | | UBS Securities, Inc. Repurchase Agreement
(maturing on 11/01/2013 in the amount of
$1, collateralized by U.S. Treasury Note
0.63%, 2017, value of $1) | | | | | | | | |
| | 1 | | | 0.09%, 10/31/2013 | | | | | | | 1 | |
| | | | | | | | | | | | 1,268 | |
| | | | | Total short-term investments | | | | | | | | |
| | | | | (cost $1,268) | | | | | | $ | 1,268 | |
| | | | | | | | | | | | | |
| | | | | Total investments | | | | | | | | |
| | | | | (cost $494,641) ▲ | | | 99.9 | % | | $ | 663,259 | |
| | | | | Other assets and liabilities | | | 0.1 | % | | | 491 | |
| | | | | Total net assets | | | 100.0 | % | | $ | 663,750 | |
The accompanying notes are an integral part of these financial statements.
| Note: | Percentage of investments as shown is the ratio of the total market value to total net assets. |
| ▲ | At October 31, 2013, the cost of securities for federal income tax purposes was $495,685 and the aggregate gross unrealized appreciation and depreciation based on that cost were: |
| Unrealized Appreciation | | $ | 177,268 | |
| Unrealized Depreciation | | | (9,694 | ) |
| Net Unrealized Appreciation | | $ | 167,574 | |
| ╪ | See Significant Accounting Policies of accompanying Notes to Financial Statements regarding valuation of securities. |
| GLOSSARY: (abbreviations used in preceding Schedule of Investments) |
| |
| Other Abbreviations: |
| ADR | American Depositary Receipt |
| FHLMC | Federal Home Loan Mortgage Corp. |
| FNMA | Federal National Mortgage Association |
| GNMA | Government National Mortgage Association |
| REIT | Real Estate Investment Trust |
The accompanying notes are an integral part of these financial statements.
| The Hartford Growth Fund |
| Investment Valuation Hierarchy Level Summary |
| October 31, 2013 |
| (000’s Omitted) |
| | | Total | | | Level 1 ♦ | | | Level 2 ♦ | | | Level 3 | |
| Assets: | | | | | | | | | | | | | | | | |
| Common Stocks ‡ | | $ | 661,991 | | | $ | 661,991 | | | $ | – | | | $ | – | |
| Short-Term Investments | | | 1,268 | | | | – | | | | 1,268 | | | | – | |
| Total | | $ | 663,259 | | | $ | 661,991 | | | $ | 1,268 | | | $ | – | |
| ♦ | For the year ended October 31, 2013, there were no transfers between Level 1 and Level 2. |
| ‡ | The Fund has all or primarily all of the equity securities categorized in a particular level. Refer to the Schedule of Investments for further industry breakout. |
| Note: | For purposes of reporting transfers between different hierarchy levels, both transfers in and out of each level, as applicable, are shown as if they occurred at the beginning of the period. |
The accompanying notes are an integral part of these financial statements.
| The Hartford Growth Fund |
| Statement of Assets and Liabilities |
| October 31, 2013 |
| (000’s Omitted) |
| Assets: | | | | |
| Investments in securities, at market value (cost $494,641) | | $ | 663,259 | |
| Cash | | | 1 | |
| Receivables: | | | | |
| Investment securities sold | | | 843 | |
| Fund shares sold | | | 1,160 | |
| Dividends and interest | | | 323 | |
| Other assets | | | 73 | |
| Total assets | | | 665,659 | |
| Liabilities: | | | | |
| Payables: | | | | |
| Investment securities purchased | | | 678 | |
| Fund shares redeemed | | | 941 | |
| Investment management fees | | | 95 | |
| Administrative fees | | | — | |
| Distribution fees | | | 27 | |
| Accrued expenses | | | 168 | |
| Total liabilities | | | 1,909 | |
| Net assets | | $ | 663,750 | |
| Summary of Net Assets: | | | | |
| Capital stock and paid-in-capital | | $ | 424,239 | |
| Undistributed net investment income | | | — | |
| Accumulated net realized gain | | | 70,893 | |
| Unrealized appreciation of investments | | | 168,618 | |
| Net assets | | $ | 663,750 | |
| | | | | |
| Shares authorized | | | 27,000,000 | |
| Par value | | $ | 0.0001 | |
| Class A: Net asset value per share/Maximum offering price per share | | | $23.52/$24.89 | |
| Shares outstanding | | | 16,125 | |
| Net assets | | $ | 379,258 | |
| Class B: Net asset value per share | | $ | 19.26 | |
| Shares outstanding | | | 277 | |
| Net assets | | $ | 5,331 | |
| Class C: Net asset value per share | | $ | 19.30 | |
| Shares outstanding | | | 1,929 | |
| Net assets | | $ | 37,227 | |
| Class I: Net asset value per share | | $ | 23.99 | |
| Shares outstanding | | | 9,398 | |
| Net assets | | $ | 225,416 | |
| Class R3: Net asset value per share | | $ | 23.75 | |
| Shares outstanding | | | 39 | |
| Net assets | | $ | 932 | |
| Class R4: Net asset value per share | | $ | 24.24 | |
| Shares outstanding | | | 142 | |
| Net assets | | $ | 3,447 | |
| Class R5: Net asset value per share | | $ | 24.59 | |
| Shares outstanding | | | 21 | |
| Net assets | | $ | 512 | |
| Class Y: Net asset value per share | | $ | 24.89 | |
| Shares outstanding | | | 467 | |
| Net assets | | $ | 11,627 | |
The accompanying notes are an integral part of these financial statements.
| The Hartford Growth Fund |
Statement of Operations |
For the Year Ended October 31, 2013 |
| (000’s Omitted) |
| Investment Income: | | | | |
| Dividends | | $ | 6,474 | |
| Interest | | | 6 | |
| Less: Foreign tax withheld | | | (65 | ) |
| Total investment income | | | 6,415 | |
| | | | | |
| Expenses: | | | | |
| Investment management fees | | | 4,650 | |
| Administrative services fees | | | | |
| Class R3 | | | 1 | |
| Class R4 | | | 5 | |
| Class R5 | | | 1 | |
| Transfer agent fees | | | | |
| Class A | | | 817 | |
| Class B | | | 32 | |
| Class C | | | 57 | |
| Class I | | | 475 | |
| Class R3 | | | 1 | |
| Class R4 | | | — | |
| Class R5 | | | — | |
| Class Y | | | 1 | |
| Distribution fees | | | | |
| Class A | | | 877 | |
| Class B | | | 67 | |
| Class C | | | 325 | |
| Class R3 | | | 3 | |
| Class R4 | | | 8 | |
| Custodian fees | | | 5 | |
| Accounting services fees | | | 75 | |
| Registration and filing fees | | | 114 | |
| Board of Directors' fees | | | 16 | |
| Audit fees | | | 16 | |
| Other expenses | | | 136 | |
| Total expenses (before waivers and fees paid indirectly) | | | 7,682 | |
| Expense waivers | | | (149 | ) |
| Transfer agent fee waivers | | | (12 | ) |
| Commission recapture | | | (8 | ) |
| Total waivers and fees paid indirectly | | | (169 | ) |
| Total expenses, net | | | 7,513 | |
| Net Investment Loss | | | (1,098 | ) |
| Net Realized Gain on Investments: | | | | |
| Net realized gain on investments | | | 80,501 | |
| Net Realized Gain on Investments | | | 80,501 | |
| Net Changes in Unrealized Appreciation of Investments: | | | | |
| Net unrealized appreciation of investments | | | 98,829 | |
| Net Changes in Unrealized Appreciation of Investments | | | 98,829 | |
| Net Gain on Investments | | | 179,330 | |
| Net Increase in Net Assets Resulting from Operations | | $ | 178,232 | |
The accompanying notes are an integral part of these financial statements.
| The Hartford Growth Fund |
| Statement of Changes in Net Assets |
| |
| (000’s Omitted) |
| | | For the
Year Ended
October 31, 2013 | | | For the
Year Ended
October 31, 2012 | |
| Operations: | | | | | | | | |
| Net investment loss | | $ | (1,098 | ) | | $ | (2,374 | ) |
| Net realized gain on investments | | | 80,501 | | | | 79,577 | |
| Net unrealized appreciation (depreciation) of investments | | | 98,829 | | | | (48,154 | ) |
| Net Increase in Net Assets Resulting from Operations | | | 178,232 | | | | 29,049 | |
| Capital Share Transactions: | | | | | | | | |
| Class A | | | (70,033 | ) | | | (71,341 | ) |
| Class B | | | (4,695 | ) | | | (5,744 | ) |
| Class C | | | (1,280 | ) | | | (11,058 | ) |
| Class I | | | (37,344 | ) | | | 54,918 | |
| Class R3 | | | 403 | | | | 42 | |
| Class R4 | | | (857 | ) | | | (680 | ) |
| Class R5 | | | (292 | ) | | | (91 | ) |
| Class Y | | | (57,884 | ) | | | (63,501 | ) |
| Net decrease from capital share transactions | | | (171,982 | ) | | | (97,455 | ) |
| Net Increase (Decrease) in Net Assets | | | 6,250 | | | | (68,406 | ) |
| Net Assets: | | | | | | | | |
| Beginning of period | | | 657,500 | | | | 725,906 | |
| End of period | | $ | 663,750 | | | $ | 657,500 | |
| Undistributed (distribution in excess of) net investment income | | $ | (1,725 | ) | | $ | (2,304 | ) |
The accompanying notes are an integral part of these financial statements.
| The Hartford Growth Fund |
| Notes to Financial Statements |
| October 31, 2013 |
| (000’s Omitted) |
The Hartford Mutual Funds II, Inc. (“Company”) is an open-end management investment company comprised of five portfolios. Financial statements for The Hartford Growth Fund (the “Fund”), a series of the Company, are included in this report.
The Company is organized under the laws of the State of Maryland and is registered with the Securities and Exchange Commission (“SEC”) under the Investment Company Act of 1940, as amended (“1940 Act”). The Fund is a diversified open-end management investment company.
Class A shares are sold with a front-end sales charge of up to 5.50%. Class B shares were sold with a contingent deferred sales charge which is assessed on the lesser of the per share net asset value (“NAV”) of the shares at the time of redemption or the original purchase price, and declines from up to 5.00% to zero depending on the period of time the shares are held (see note below regarding the closing of Class B shares). Class C shares are sold with a contingent deferred sales charge of up to 1.00% on shares redeemed within twelve months of purchase. Class I shares are sold without sales charges to certain eligible investors primarily through advisory fee-based wrap programs. Class R3, R4 and R5 shares, which are offered to employer-sponsored retirement plans, and Class Y shares, which are sold to certain eligible institutional investors, are sold without a sales charge. All classes of shares have identical voting, redemption, dividend, liquidation and other rights and the same terms and conditions, with the exceptions that each class may have different expenses, which may affect performance, and that Class B shares automatically convert to Class A shares after 8 years.
No new or additional investments are allowed in Class B shares of the Fund (including investments through any systematic investment plan). Existing shareholders of Class B shares may continue to hold their Class B shares, exchange their Class B shares for Class B shares of another Hartford Fund (as permitted by existing exchange privileges), or redeem their Class B shares as described in the Fund’s prospectus. Reinstatement privileges with respect to Class B shares will continue under the current policy. For investors electing to reinvest capital gains and dividends, any such capital gains or dividends on Class B shares will continue to be reinvested in Class B shares of the Fund. All Class B share attributes, including the 12b-1 fee, contingent deferred sales charge schedule, and conversion to Class A shares, remain unchanged.
| 2. | Significant Accounting Policies: |
The following is a summary of significant accounting policies of the Fund in the preparation of its financial statements, which are in accordance with United States Generally Accepted Accounting Principles (“U.S. GAAP”). The preparation of financial statements in accordance with U.S. GAAP may require management to make estimates and assumptions that affect the reported amounts of assets and liabilities and disclosure of contingent assets and liabilities at the date of the financial statements and the reported amounts of increases and decreases in net assets from operations during the reporting period. Actual results could differ from those estimates.
| | a) | Determination of Net Asset Value – The NAV of each class of the Fund’s shares is determined as of the close of regular trading (normally 4:00 p.m. Eastern Time) (the “NYSE Close”) on each day that the New York Stock Exchange (the “Exchange”) is open (“Valuation Date”). Information that becomes known to the Fund after the NAV has been calculated on a particular day will not generally be used to retroactively adjust the NAV determined earlier that day. |
| b) | Investment Valuation and Fair Value Measurements – For purposes of calculating the NAV, portfolio investments and other assets held by the Fund's portfolio for which market quotes are readily available are valued at market value. Market value is generally determined on the basis of last reported sales prices or official close price. If no sales are reported, market value is based on quotes obtained from a quotation reporting system, established market makers, or independent pricing services. If market prices are not readily available or are deemed unreliable, the Fund will use the fair value of the investment as determined in good faith under policies and procedures established by and under the supervision of the Company’s Board of Directors. Market quotes are considered not readily available where there is an absence of current or reliable market-based data (e.g., trade information or indicative market quotes), including where events occur after the close of the relevant market, but prior to the NYSE Close, that materially affect the values of the Fund’s portfolio |
investments or assets. In addition, market quotes are considered not readily available when, due to extraordinary circumstances, the exchanges or markets on which the investments trade do not open for trading for the entire day and no other market prices are available. In addition, prices of foreign equities that are principally traded on certain foreign markets may be adjusted daily pursuant to a fair value pricing service approved by the Board of Directors in order to reflect an adjustment for the factors occurring after the close of certain foreign markets but before the NYSE Close. Investments that are primarily traded on foreign markets may trade on days that are not business days of the Fund. The value of the foreign investments in which the Fund invests may change on days when a shareholder will not be able to purchase or redeem shares of the Fund. Fair value pricing is subjective in nature and the use of fair value pricing by the Fund may cause the NAV of its shares to differ significantly from the NAV that would have been calculated using market prices at the close of the exchange on which a portfolio investment is primarily traded. There can be no assurance that the Fund could obtain the fair market value assigned to an investment if the Fund were to sell the investment at approximately the time at which the Fund determines its NAV.
Investments valued in currencies other than U.S. dollars are converted to U.S. dollars using exchange rates obtained from independent pricing services for calculation of the NAV. As a result, the NAV of the Fund’s shares may be affected by changes in the value of currencies in relation to the U.S. dollar. The value of investments traded in markets outside the United States or denominated in currencies other than the U.S. dollar may be affected significantly on a day that the NYSE is closed and the market value may change on days when an investor is not able to purchase, redeem or exchange shares of the Fund.
Financial instruments for which prices are not available from an independent pricing service may be valued using market quotations obtained from one or more dealers that make markets in the respective financial instrument in accordance with procedures established by the Company’s Board of Directors.
U.S. GAAP defines fair value as the price that the Fund would receive to sell an asset or pay to transfer a liability in an orderly transaction between market participants. The U.S. GAAP fair value measurement standards require disclosure of a fair value hierarchy for each major category of assets and liabilities. Various inputs are used in determining the fair value of the Fund’s investments. These inputs are summarized into three broad hierarchy levels. This hierarchy is based on whether the valuation inputs are observable or unobservable. These levels are:
| | · | Level 1 – Quoted prices in active markets for identical investments. Level 1 may include exchange traded instruments, such as domestic equities, some foreign equities, options, futures, mutual funds, exchange traded funds, rights and warrants. |
| | · | Level 2 – Observable inputs other than Level 1 prices, such as quoted prices for similar investments; quoted prices in markets that are not active; or other inputs that are observable or can be corroborated by observable market data. Level 2 may include debt investments that are traded less frequently than exchange traded instruments and which are valued using independent pricing services; foreign equities, which are principally traded on certain foreign markets and are adjusted daily pursuant to a fair value pricing service in order to reflect an adjustment for the factors occurring after the close of certain foreign markets but before the NYSE Close; senior floating rate interests, which are valued using an aggregate of dealer bids; and short-term investments, which are valued at amortized cost. |
| | · | Level 3 – Significant unobservable inputs that are supported by limited or no market activity. Level 3 may include financial instruments whose values are determined using indicative market quotes or require significant management judgment or estimation. These unobservable valuation inputs may include estimates for current yields, maturity/duration, prepayment speed, and indicative market quotes for comparable investments along with other assumptions relating to credit quality, collateral value, complexity of the investment structure, general market conditions and liquidity. This category may include investments where trading has been halted or there are certain restrictions on trading. While these investments are priced using unobservable inputs, the valuation of these investments reflects the best available data and management believes the prices are a reasonable representation of exit price. |
| The Hartford Growth Fund |
| Notes to Financial Statements – (continued) |
| October 31, 2013 |
| (000’s Omitted) |
The Board of Directors of the Company generally reviews and approves the “Procedures for Valuation of Portfolio Securities” on an annual basis. These procedures define how investments are to be valued, including the formation and activities of a Valuation Committee. The Valuation Committee is responsible for determining in good faith the fair value of investments when the value cannot be obtained from primary pricing services or alternative sources or if the valuation of an investment as provided by the primary pricing service or alternative source is believed not to reflect the investment’s fair value as of the Valuation Date. Voting members of the Valuation Committee include the Fund’s Treasurer or designee and a Vice President of the investment manager or designee. An Assistant Vice President of the Fund with legal expertise or designee is also included on the Valuation Committee as a non-voting advisory member. In addition, the Fund’s Chief Compliance Officer shall designate a member of the compliance group to attend Valuation Committee meetings as a non-voting resource, to monitor for and provide guidance with respect to compliance with these procedures. Two members of the Valuation Committee or their designees, representing different departments, shall constitute a quorum for purposes of permitting the Valuation Committee to take action. The Valuation Committee will consider all relevant factors in determining an investment’s fair value, and may seek the advice of the Fund’s sub-adviser, knowledgeable brokers, and legal counsel in making such determination. The Valuation Committee reports to the Audit Committee of the Company’s Board of Directors. The Audit Committee receives quarterly written reports which include details of all fair-valued investments, including the reason for the fair valuation, and an indication, when possible, of the accuracy of the valuation by disclosing the next available reliable public price quotation or the disposition price of such investments (the “look-back” test). The Board of Directors then must consider for ratification all of the fair value determinations made during the previous quarter.
Valuation levels are not necessarily indicative of the risk associated with investing in such investments. Individual investments within any of the above mentioned asset classes may be assigned a different hierarchical level than those presented above, as individual circumstances dictate.
For additional information, refer to the Investment Valuation Hierarchy Level Summary and the Level 3 roll-forward reconciliation, if applicable, which follow the Schedule of Investments.
| | c) | Investment Transactions and Investment Income – Investment transactions are recorded as of the trade date (the date the order to buy or sell is executed) for financial reporting purposes. Investments purchased or sold on a when-issued or delayed-delivery basis may be settled a month or more after the trade date. Realized gains and losses are determined on the basis of identified cost. |
Dividend income from domestic securities is accrued on the ex-dividend date. In general, dividend income from foreign securities is recorded on the ex-date; however, dividend notifications in certain foreign jurisdictions may not be available in a timely manner and as a result, the Fund will record the dividend as soon as the relevant details (i.e., rate per share, payment date, shareholders of record, etc.) are publicly available. Interest income, including amortization of premium and accretion of discounts, is accrued on a daily basis.
| | d) | Foreign Currency Transactions – Assets and liabilities denominated in currencies other than U.S. dollars are translated into U.S. dollars at the exchange rates in effect on the valuation date. Purchases and sales of investments, income and expenses are translated into U.S. dollars at the exchange rates on the dates of such transactions. |
The Fund does not isolate that portion of portfolio investment valuation resulting from fluctuations in the foreign currency exchange rates from the fluctuations arising from changes in the market prices of investments held. Exchange rate fluctuations are included with the net realized and unrealized gain or loss on investments in the accompanying financial statements.
Net realized foreign exchange gains or losses arise from sales of foreign currencies and the difference between asset and liability amounts initially stated in foreign currencies and the U.S. dollar value of the amounts actually received or paid. Net unrealized foreign exchange gains or losses arise from changes in the value of other assets and liabilities at the end of the reporting period, resulting from changes in the exchange rates.
| | e) | Joint Trading Account – The Fund may invest cash balances into a joint trading account that may be invested in one or more repurchase agreements. |
| | f) | Fund Share Valuation and Dividend Distributions to Shareholders – Orders for the Fund’s shares are executed in accordance with the investment instructions of the shareholders. The NAV of the Fund’s shares is determined as of the close of business on each business day of the Exchange. The NAV is determined separately for each class of shares of the Fund by dividing the Fund’s net assets attributable to that class by the number of shares of the class outstanding. Each class of shares offered by the Fund has equal rights as to assets and voting privileges (except that shareholders of a class have exclusive voting rights regarding any matter relating solely to that class of shares). Income and non-class specific expenses are allocated daily to each class on the basis of the relative net assets of the class. Realized and unrealized gains and losses are allocated daily based on the relative net assets of each class of shares of the Fund. |
Orders for the purchase of the Fund’s shares received prior to the close of the Exchange on any day the Exchange is open for business are priced at the NAV determined as of the close of the Exchange. Orders received after the close of the Exchange, or on a day on which the Exchange and/or the Fund is not open for business, are priced at the next determined NAV.
Dividends are declared pursuant to a policy adopted by the Company’s Board of Directors based upon the investment performance of the Fund. The policy of the Fund is to pay dividends from net investment income and realized gains, if any, at least once a year.
Distributions from net investment income, net realized gains and capital are determined in accordance with federal income tax regulations, which may differ from U.S. GAAP with respect to character and timing. These differences may include but are not limited to losses deferred due to wash sale adjustments, foreign currency gains and losses, adjustments related to Passive Foreign Investment Companies (“PFICs”), Real Estate Investment Trusts (“REITs”), Regulated Investment Companies (“RICs”), certain derivatives and partnerships. Permanent book and federal income tax basis differences relating to shareholder distributions will result in reclassifications to certain of the Fund’s capital accounts (see Federal Income Taxes: Reclassification of Capital Accounts note).
| 3. | Securities and Other Investments: |
| | a) | Repurchase Agreements – A repurchase agreement is an agreement by which a counterparty agrees to sell an investment and agrees to repurchase the investment sold from the buyer at a mutually agreed upon time and price. During the period of the repurchase agreement, the counterparty will deposit cash and or securities in a third party custodial account to serve as collateral. At the time the Fund enters into a repurchase agreement, the value of the underlying collateral, including accrued interest, will be equal to or exceed the value of the repurchase agreement. Repurchase agreements expose the Fund to counterparty risk - that is, the risk that the counterparty will not fulfill its obligations. To minimize counterparty risk, the investments that serve to collateralize the repurchase agreement are held by the Fund’s custodian in book entry or physical form in the custodial account of the Fund or in a third party custodial account. Repurchase agreements are valued at cost plus accrued interest, which approximates fair value. The Fund, as shown on the Schedule of Investments, had outstanding repurchase agreements as of October 31, 2013. |
The Fund may be exposed to counterparty risk, or the risk that an institution or other entity with which the Fund has unsettled or open transactions will default.
If the Fund invests directly in foreign currencies or in securities that trade in, and receive revenues in, foreign currencies, or in derivatives that provide exposure to foreign currencies, it will be subject to the risk that those currencies will decline in value relative to the base currency of the Fund, or, in the case of hedging positions, that the Fund’s base currency will decline in value relative to the currency being hedged. Currency rates in foreign countries may fluctuate significantly over short periods of time for a number of reasons, including changes in interest rates, intervention (or the
| The Hartford Growth Fund |
| Notes to Financial Statements – (continued) |
| October 31, 2013 |
| (000’s Omitted) |
failure to intervene) by U.S. or foreign governments, central banks or supranational entities, such as the International Monetary Fund, or by the imposition of currency controls or other political developments in the United States or abroad. As a result, the Fund’s investments in foreign currency denominated securities may reduce the returns of the Fund. The market values of equity securities, such as common stocks and preferred stocks, or equity related investments, such as futures and options, may decline due to general market conditions which are not specifically related to a particular company, such as real or perceived adverse economic conditions, changes in the general outlook for corporate earnings, changes in interest or currency rates or adverse investor sentiment generally. The market value of equity securities may also decline due to factors which affect a particular industry or industries, such as labor shortages or increased production costs and competitive conditions within an industry. Equity securities and equity related investments generally have greater market price volatility than fixed income securities.
| | a) | Federal Income Taxes – For federal income tax purposes, the Fund intends to continue to qualify as a RIC under Subchapter M of the Internal Revenue Code (“IRC”) by distributing substantially all of its taxable net investment income and net realized capital gains to its shareholders and otherwise complying with the requirements of the IRC. The Fund has distributed substantially all of its income and capital gains in prior years, if applicable, and intends to distribute substantially all of its income and capital gains during the calendar year ending December 31, 2013. Accordingly, no provision for federal income or excise taxes has been made in the accompanying financial statements. Distributions from short-term capital gains are treated as ordinary income distributions for federal income tax purposes. |
| | b) | Net Investment Income (Loss), Net Realized Gains (Losses) and Distributions – Net investment income (loss) and net realized gains (losses) may differ for financial statement and tax purposes primarily because of losses deferred due to wash sale adjustments, foreign currency gains and losses, adjustments related to PFICs, REITs, RICs, certain derivatives and partnerships. The character of distributions made during the year from net investment income or net realized gains may differ from their ultimate characterization for federal income tax purposes. Also, due to the timing of dividend distributions, the fiscal year in which amounts are distributed may differ from the year that the income or realized gains (losses) were recorded by the Fund. |
| | c) | Components of Distributable Earnings – The Fund’s components of distributable earnings (deficit) on a tax basis at October 31, 2013, are as follows: |
| | | Amount | |
| Undistributed Ordinary Income | | $ | 6,187 | |
| Undistributed Long-Term Capital Gain | | | 65,750 | |
| Unrealized Appreciation * | | | 167,574 | |
| Total Accumulated Earnings | | $ | 239,511 | |
| * | Differences between book-basis and tax-basis unrealized appreciation (depreciation) may be attributable to the losses deferred due to wash sale adjustments, foreign currency gains and losses, adjustments related to PFICs, REITs, RICs, certain derivatives and partnerships. |
| | d) | Reclassification of Capital Accounts – The Fund may record reclassifications in its capital accounts. These reclassifications have no impact on the total net assets of the Fund. The reclassifications are a result of permanent differences between U.S. GAAP and tax accounting for such items as foreign currency, PFICs, expiration or utilization of capital loss carryforwards or net operating losses. Adjustments are made to reflect the impact these items have on current and future distributions to shareholders. Therefore, the source of the Fund’s distributions may be shown in the accompanying Statement of Changes in Net Assets as from undistributed net investment income, from accumulated net realized gains on investments or from capital depending on the type of book and tax differences that exist. For the year ended October 31, 2013, the Fund recorded reclassifications to increase (decrease) the accounts listed below: |
| | | Amount | |
| Undistributed Net Investment Income | | $ | 3,402 | |
| Accumulated Net Realized Gain (Loss) | | | (3,402 | ) |
| | e) | Capital Loss Carryforward – On December 22, 2010, the Regulated Investment Company Modernization Act of 2010 (the “Act”) was enacted, which made changes to the capital loss carryforward rules. The changes are effective for taxable years beginning after the date of enactment. Under the Act, funds are permitted to carry forward capital losses for an unlimited period. However, any losses incurred during those future taxable years will be required to be utilized prior to the losses incurred in pre-enactment taxable years, which carry an expiration date. As a result of this ordering rule, pre-enactment capital loss carryforwards may be more likely to expire unused. Additionally, post-enactment capital loss carryforwards retain their character as either short-term or long-term capital losses rather than being considered all short-term as permitted under prior regulation. |
The Fund had no capital loss carryforward for U.S. federal income tax purposes as of October 31, 2013.
During the year ended October 31, 2013, the Fund utilized $4,223 of prior year capital loss carryforwards.
| | f) | Accounting for Uncertainty in Income Taxes – The Fund has adopted financial reporting rules that require the Fund to analyze all open tax years, as defined by the statute of limitations, for all major jurisdictions. Generally, tax authorities can examine all tax returns filed for the last three years. The Fund does not have an examination in progress. |
The Fund has reviewed all open tax years and major jurisdictions and concluded that these financial reporting rules had no effect on the Fund’s financial position or results of operations. There is no tax liability resulting from unrecognized tax benefits relating to uncertain income tax positions taken or expected to be taken on the tax return for the fiscal year ended October 31, 2013. The Fund is also not aware of any tax positions for which it is reasonably possible that the total amounts of unrecognized tax benefits will significantly change in the next twelve months.
| | a) | Investment Management Agreement – Effective January 1, 2013, Hartford Funds Management Company, LLC (“HFMC”) replaced Hartford Investment Financial Services, LLC (“HIFSCO”) as the Fund’s investment manager. HFMC and HIFSCO are both indirect wholly owned subsidiaries of The Hartford Financial Services Group, Inc. (“The Hartford”). As of January 1, 2013, HFMC serves as investment manager to the Fund pursuant to an Investment Management Agreement with the Company. For the calendar year ended December 31, 2012, HIFSCO served as the Fund’s investment manager pursuant to a separate agreement between HIFSCO and the Company. The replacement of HIFSCO with HFMC did not result in any change to (i) the contractual terms of, including the fees payable under, the Fund’s investment management agreements; or (ii) the day-to-day management of the Fund. The investment manager has overall investment supervisory responsibility for the Fund. In addition, the investment manager provides administrative personnel, services, equipment, facilities and office space for proper operation of the Fund. HFMC has contracted with Wellington Management Company, LLP (“Wellington Management”) under a sub-advisory agreement for the provision of day-to-day investment management services to the Fund in accordance with the Fund’s investment |
| The Hartford Growth Fund |
| Notes to Financial Statements – (continued) |
| October 31, 2013 |
| (000’s Omitted) |
objective and policies. The Fund pays a fee to the investment manager, a portion of which may be used to compensate Wellington Management.
The schedule below reflects the rates of compensation paid to the investment manager for investment management services rendered as of October 31, 2013; the rates are accrued daily and paid monthly:
| Average Daily Net Assets | | Annual Fee | |
| On first $250 million | | | 0.8000 | % |
| On next $4.75 billion | | | 0.7000 | % |
| On next $5 billion | | | 0.6975 | % |
| Over $10 billion | | | 0.6950 | % |
| | b) | Accounting Services Agreement – Effective January 1, 2013, HFMC replaced Hartford Life Insurance Company (“HLIC”) as provider of accounting services to the Fund. HLIC provided accounting services for the Fund for the calendar year ended December 31, 2012. The replacement of HLIC with HFMC did not result in any changes to the fund accounting services provided to the Fund or the fees charged to the Fund for such services. Pursuant to the Fund Accounting Agreement between HFMC and the Company, on behalf of the Fund, HFMC provides accounting services to the Fund and receives monthly compensation based on the Fund’s average daily net assets at the rates set forth below. The Fund’s accounting services fees are accrued daily and paid monthly. |
| Average Daily Net Assets | | Annual Fee | |
| On first $5 billion | | | 0.012 | % |
| Over $5 billion | | | 0.010 | % |
| | c) | Operating Expenses – Allocable expenses incurred by the Company are allocated to each Fund and allocated to classes within the Fund in proportion to the average daily net assets of the Fund and each class, except where allocation of certain expenses is more fairly made directly to the Fund or to specific classes within a Fund. As of October 31, 2013, HFMC contractually limited the total operating expenses of this Fund, exclusive of taxes, interest expense, brokerage commissions, acquired fund fees and expenses and extraordinary expenses, through February 28, 2014 as follows: |
| Class A | | | Class B | | | Class C | | | Class I | | | Class R3 | | | Class R4 | | | Class R5 | | | Class Y | |
| | 1.25% | | | | 2.00% | | | | 2.00% | | | | 1.00% | | | | 1.50% | | | | 1.20% | | | | 0.90% | | | | 0.85% | |
| | d) | Fees Paid Indirectly – The Fund has entered into agreements with State Street Global Markets, LLC and Russell Implementation Services, Inc. to partially recapture non-discounted trade commissions. Such rebates are used to pay a portion of the Fund’s expenses. In addition, the Fund’s custodian bank has agreed to reduce its fees when the Fund maintains cash on deposit in a non-interest-bearing custody account. For the year ended October 31, 2013, these amounts, if any, are included in the Statement of Operations. |
The ratio of expenses to average net assets in the accompanying financial highlights excludes the reduction in expenses related to fees paid indirectly. The annualized expense ratio after waivers for the period listed below reflecting the reduction for fees paid indirectly is as follows:
| | | Year Ended
October 31, 2013 | |
| Class A | | | 1.25 | % |
| Class B | | | 2.00 | |
| Class C | | | 1.97 | |
| Class I | | | 1.00 | |
| Class R3 | | | 1.50 | |
| Class R4 | | | 1.20 | |
| Class R5 | | | 0.90 | |
| Class Y | | | 0.80 | |
| | e) | Distribution and Service Plan for Class A, B, C, R3 and R4 Shares – Effective June 14, 2013, HIFSCO was renamed Hartford Funds Distributors, LLC (“HFD”). HFD is the principal underwriter and distributor of the Fund. HFD is engaged in distribution activities, which include marketing and distribution of shares through broker/dealers, financing distribution costs and maintaining financial books and records. For the year ended October 31, 2013, HFD received front-end load sales charges of $329 and contingent deferred sales charges of $4 from the Fund. |
The Fund has adopted a Distribution and Service Plan in accordance with Rule 12b-1 of the 1940 Act to compensate the distributor (HFD) for activities intended to result in the sale and distribution of Class A, B, C, R3 and R4 shares and for providing services for shareholders. The Rule 12b-1 plan applicable to Class A shares of the Fund provides for payment of a Rule 12b-1 fee of 0.25% of average daily net assets. Some or all of the fee may be used for shareholder servicing expenses with the remainder used for distribution expenses. Some or the entire Rule 12b-1 fee for Class B shares may be remitted to broker/dealers for distribution and/or shareholder account services. Under the Class B Plan, the Fund pays the distributor 1.00% of the average daily net assets of Class B shares that are outstanding for 8 years or less, 0.25% of which is a fee for services provided to existing shareholders with the remainder used for distribution expenses. After eight years, Class B shares convert to Class A shares. Upon conversion to Class A shares, the Class A plan described above will apply to those shares. Under the Class C Plan, the Fund pays the distributor 1.00% of the average daily net assets of Class C shares outstanding, 0.25% of which is intended as a fee for services provided to existing shareholders with the remainder used for distribution expenses. For Class C shares, some or the entire fee may be remitted to broker/dealers for distribution and/or shareholder account services. Class R3 shares have a distribution fee of 0.50% of average daily net assets and Class R4 shares have a distribution fee of 0.25% of average daily net assets. For Class R3 and R4 shares, some or the entire fee may be remitted to broker/dealers for distribution and/or shareholder account services. The Fund’s 12b-1 fees are accrued daily and paid monthly.
| | f) | Other Related Party Transactions – Certain officers of the Fund are directors and/or officers of the investment manager and/or The Hartford or its subsidiaries. For the year ended October 31, 2013, a portion of the Fund’s Chief Compliance Officer’s compensation was paid by all of the investment companies in the Hartford fund complex. The portion allocated to the Fund was in the amount of $1. Hartford Administrative Services Company (“HASCO”), an indirect wholly-owned subsidiary of The Hartford, provides transfer agent services to the Fund. HASCO has contractually agreed to reimburse any portion of the transfer agency fees over 0.30% of average daily net assets per fiscal year for each class. For providing such services, HASCO is compensated on a per account basis that varies by account type, except with respect to Class Y, for which it is compensated based on average daily net assets. The amount paid to HASCO and any related contractual reimbursement amounts, if applicable, can be found in the Statement of Operations. These fees are accrued daily and paid monthly. |
| The Hartford Growth Fund |
| Notes to Financial Statements – (continued) |
| October 31, 2013 |
| (000’s Omitted) |
Administrative services fees are paid to HASCO for third-party recordkeeping services that are payable as a percentage of net assets in the amount of 0.20%, 0.15% and 0.10% for Classes R3, R4 and R5 shares, respectively. The total administrative services fees are shown on the Statement of Operations. These fees are accrued daily and paid monthly.
As of October 31, 2013, affiliates of The Hartford had ownership of shares in the Fund as follows:
| | | Percentage
of Class | |
| Class R4 | | | 4 | % |
| 8. | Investment Transactions: |
For the year ended October 31, 2013, the Fund's aggregate purchases and sales of investment securities (excluding short-term investments) were as follows:
| | | Amount | |
| Cost of Purchases Excluding U.S. Government Obligations | | $ | 291,972 | |
| Sales Proceeds Excluding U.S. Government Obligations | | | 466,228 | |
| 9. | Capital Share Transactions: |
The following information is for the year ended October 31, 2013, and the year ended October 31, 2012:
| | | For the Year Ended October 31, 2013 | | | For the Year Ended October 31, 2012 | |
| | | Shares Sold | | | Shares Issued
for Reinvested
Dividends | | | Shares
Redeemed | | | Net Increase
(Decrease) of
Shares | | | Shares Sold | | | Shares Issued
for Reinvested
Dividends | | | Shares
Redeemed | | | Net Increase
(Decrease) of
Shares | |
| Class A | | | | | | | | | | | | | | | | | | | | | | | | | | | | | | | | |
| Shares | | | 1,241 | | | | — | | | | (4,913 | ) | | | (3,672 | ) | | | 1,421 | | | | — | | | | (5,416 | ) | | | (3,995 | ) |
| Amount | | $ | 25,270 | | | $ | — | | | $ | (95,303 | ) | | $ | (70,033 | ) | | $ | 25,008 | | | $ | — | | | $ | (9,349 | ) | | $ | (71,341 | ) |
| Class B | | | | | | | | | | | | | | | | | | | | | | | | | | | | | | | | |
| Shares | | | 10 | | | | — | | | | (290 | ) | | | (280 | ) | | | 19 | | | | — | | | | (411 | ) | | | (392 | ) |
| Amount | | $ | 173 | | | $ | — | | | $ | (4,868 | ) | | $ | (4,695 | ) | | $ | 273 | | | $ | — | | | $ | (6,017 | ) | | $ | (5,744 | ) |
| Class C | | | | | | | | | | | | | | | | | | | | | | | | | | | | | | | | |
| Shares | | | 327 | | | | — | | | | (418 | ) | | | (91 | ) | | | 204 | | | | — | | | | (965 | ) | | | (761 | ) |
| Amount | | $ | 5,663 | | | $ | — | | | $ | (6,943 | ) | | $ | (1,280 | ) | | $ | 2,991 | | | $ | — | | | $ | (14,049 | ) | | $ | (11,058 | ) |
| Class I | | | | | | | | | | | | | | | | | | | | | | | | | | | | | | | | |
| Shares | | | 4,112 | | | | — | | | | (5,881 | ) | | | (1,769 | ) | | | 4,878 | | | | — | | | | (1,790 | ) | | | 3,088 | |
| Amount | | $ | 85,150 | | | $ | — | | | $ | (122,494 | ) | | $ | (37,344 | ) | | $ | 87,120 | | | $ | — | | | $ | (32,202 | ) | | $ | 54,918 | |
| Class R3 | | | | | | | | | | | | | | | | | | | | | | | | | | | | | | | | |
| Shares | | | 25 | | | | — | | | | (6 | ) | | | 19 | | | | 13 | | | | — | | | | (10 | ) | | | 3 | |
| Amount | | $ | 529 | | | $ | — | | | $ | (126 | ) | | $ | 403 | | | $ | 221 | | | $ | — | | | $ | (179 | ) | | $ | 42 | |
| Class R4 | | | | | | | | | | | | | | | | | | | | | | | | | | | | | | | | |
| Shares | | | 26 | | | | — | | | | (70 | ) | | | (44 | ) | | | 30 | | | | — | | | | (68 | ) | | | (38 | ) |
| Amount | | $ | 540 | | | $ | — | | | $ | (1,397 | ) | | $ | (857 | ) | | $ | 552 | | | $ | — | | | $ | (1,232 | ) | | $ | (680 | ) |
| Class R5 | | | | | | | | | | | | | | | | | | | | | | | | | | | | | | | | |
| Shares | | | 8 | | | | — | | | | (22 | ) | | | (14 | ) | | | 17 | | | | — | | | | (21 | ) | | | (4 | ) |
| Amount | | $ | 164 | | | $ | — | | | $ | (456 | ) | | $ | (292 | ) | | $ | 310 | | | $ | — | | | $ | (401 | ) | | $ | (91 | ) |
| Class Y | | | | | | | | | | | | | | | | | | | | | | | | | | | | | | | | |
| Shares | | | 101 | | | | — | | | | (3,087 | ) | | | (2,986 | ) | | | 939 | | | | — | | | | (4,456 | ) | | | (3,517 | ) |
| Amount | | $ | 2,145 | | | $ | — | | | $ | (60,029 | ) | | $ | (57,884 | ) | | $ | 17,359 | | | $ | — | | | $ | (80,860 | ) | | $ | (63,501 | ) |
| Total | | | | | | | | | | | | | | | | | | | | | | | | | | | | | | | | |
| Shares | | | 5,850 | | | | — | | | | (14,687 | ) | | | (8,837 | ) | | | 7,521 | | | | — | | | | (13,137 | ) | | | (5,616 | ) |
| Amount | | $ | 119,634 | | | $ | — | | | $ | (291,616 | ) | | $ | (171,982 | ) | | $ | 133,834 | | | $ | — | | | $ | (231,289 | ) | | $ | (97,455 | ) |
The following reflects the conversion of Class B shares into Class A shares (reflected as Class A shares sold) for the year ended October 31, 2013, and the year ended October 31, 2012:
| | | Shares | | | Dollars | |
| For the Year Ended October 31, 2013 | | | 75 | | | | $1,543 | |
| For the Year Ended October 31, 2012 | | | 108 | | | | $1,914 | |
The Fund is one of several Hartford funds that participate in a $500 million committed revolving line of credit facility. The facility is to be used for temporary or emergency purposes. Under the arrangement, the funds are required to own securities having a market value in excess of 300% of the total bank borrowings. The interest rate on borrowings varies depending on the nature of the loan. The facility also requires a fee to be paid based on the amount of the commitment. This commitment fee is allocated to all of the funds participating in the line of credit based on the average net assets of the funds. During the year ended October 31, 2013, the Fund did not have any borrowings under this facility.
| 11. | Industry Classifications: |
Other than the industry classifications “Other Investment Pools and Funds” and “Exchange Traded Funds,” equity industry classifications used in this report are the Global Industry Classification Standard, which was developed by and is the exclusive property and service mark of MSCI, Inc. and Standard & Poor’s.
| 12. | Pending Legal Proceedings: |
On February 25, 2011, Jennifer L. Kasilag, Louis Mellinger, Judith M. Menendez, Jacqueline M. Robinson, and Linda A. Russell filed a derivative lawsuit against Hartford Investment Financial Services, LLC (“HIFSCO”)(now known as Hartford Funds Distributors, LLC) on behalf of six Hartford retail mutual funds in the United States District Court for the District of New Jersey, alleging that HIFSCO received excessive advisory and distribution fees in violation of its statutory fiduciary duty under Section 36(b) of the 1940 Act when serving as investment manager and principal underwriter, respectively, to the Hartford retail mutual funds. HIFSCO moved to dismiss and, in September 2011, the motion was granted in part and denied in part, with leave to amend the complaint. In November 2011, plaintiffs filed an amended complaint on behalf of certain Hartford retail mutual funds, The Hartford Global Health Fund (now known as The Hartford Healthcare Fund), The Hartford Conservative Allocation Fund, The Hartford Growth Opportunities Fund, The Hartford Inflation Plus Fund, The Hartford Advisers Fund (now known as The Hartford Balanced Fund), and The Hartford Capital Appreciation Fund. Plaintiffs seek to rescind the investment management agreements and distribution plans between HIFSCO and these funds and to recover the total fees charged thereunder or, in the alternative, to recover any improper compensation HIFSCO received, in addition to lost earnings. HIFSCO filed a partial motion to dismiss the amended complaint and, in December 2012, the court dismissed without prejudice the claims regarding distribution fees and denied the motion with respect to the advisory fees claims. HIFSCO disputes the allegations and intends to defend the advisory fee claims vigorously.
Although this action was purportedly filed on behalf of certain of the Hartford Funds, none of the Hartford Funds is itself a defendant to the suit. For this reason, no accrual for litigation relating to this matter has been recorded in the financial statements of the Fund.
Under the Company’s organizational documents, the Company shall indemnify its officers and directors to the full extent required or permitted under Maryland General Corporation Law and the federal securities laws. In addition, the Company, on behalf of the Fund, may enter into contracts that contain a variety of indemnifications. The Company’s maximum exposure under these arrangements is unknown. However, as of the date of these financial statements, the Company has not had prior claims or losses pursuant to these contracts and expects the risk of loss to be remote.
| The Hartford Growth Fund |
| Notes to Financial Statements – (continued) |
| October 31, 2013 |
| (000’s Omitted) |
| 14. | Recent Accounting Pronouncement: |
In January 2013, the Financial Accounting Standards Board (FASB) issued Accounting Standards Update (ASU) No. 2013-01, Clarifying the Scope of Disclosures about Offsetting Assets and Liabilities, which clarified ASU No. 2011-11, Disclosures about Offsetting Assets and Liabilities. The objective of ASU 2013-01 is to enhance disclosure requirements on the offsetting of financial assets and liabilities. ASU 2013-01 limits the scope of the new balance sheet offsetting disclosures to derivatives, repurchase agreements and securities lending transactions to the extent that they are (1) offset in the financial statements or (2) subject to an enforceable master netting arrangement or similar agreement. The effective date of ASU 2013-01 is for annual periods beginning on or after January 1, 2013 and interim periods within those annual periods. At this time, management is evaluating the implications of this guidance and the impact it will have on the Fund’s financial statements and footnote disclosures, if any.
At a meeting held on December 13, 2013, the Board of Directors of The Hartford Mutual Funds II, Inc. approved an Agreement and Plan of Reorganization relating to the reorganization of the Fund into The Hartford Growth Opportunities Fund, a series of The Hartford Mutual Funds II, Inc. The Reorganization does not require shareholder approval. The Reorganization is expected to occur on or about April 7, 2014.
| The Hartford Growth Fund |
| Financial Highlights |
| | | | - Selected Per-Share Data - (A) | | | - Ratios and Supplemental Data - | |
| Class | | | Net Asset
Value at
Beginning
of Period | | | Net
Investment
Income
(Loss) | | | Net
Realized
and
Unrealized
Gain
(Loss) on
Invest-
ments | | | Total from
Investment
Operations | | | Dividends
from Net
Investment
Income | | | Distribu-
tions
from
Realized
Capital
Gains | | | Total
Dividends
and
Distributions | | | Net Asset
Value at
End of
Period | | | Total
Return(B) | | | Net
Assets at
End of
Period
(000's) | | | Ratio of
Expenses
to
Average
Net
Assets
Before
Adjust-
ments(C) | | | Ratio of
Expenses
to
Average
Net
Assets
After
Adjust-
ments(C) | | | Ratio of
Net
Investment
Income
to
Average
Net
Assets | |
| For the Year Ended October 31, 2013 | |
| A | | | $ | 17.69 | | | $ | (0.05 | ) | | $ | 5.88 | | | $ | 5.83 | | | $ | – | | | $ | – | | | $ | – | | | $ | 23.52 | | | | 32.96 | % | | $ | 379,258 | | | | 1.28 | % | | | 1.25 | % | | | (0.24 | )% |
| B | | | | 14.60 | | | | (0.16 | ) | | | 4.82 | | | | 4.66 | | | | – | | | | – | | | | – | | | | 19.26 | | | | 31.92 | | | | 5,331 | | | | 2.28 | | | | 2.00 | | | | (0.96 | ) |
| C | | | | 14.62 | | | | (0.16 | ) | | | 4.84 | | | | 4.68 | | | | – | | | | – | | | | – | | | | 19.30 | | | | 32.01 | | | | 37,227 | | | | 1.97 | | | | 1.97 | | | | (0.97 | ) |
| I | | | | 18.00 | | | | – | | | | 5.99 | | | | 5.99 | | | | – | | | | – | | | | – | | | | 23.99 | | | | 33.28 | | | | 225,416 | | | | 1.02 | | | | 1.00 | | | | 0.01 | |
| R3 | | | | 17.90 | | | | (0.12 | ) | | | 5.97 | | | | 5.85 | | | | – | | | | – | | | | – | | | | 23.75 | | | | 32.68 | | | | 932 | | | | 1.58 | | | | 1.50 | | | | (0.55 | ) |
| R4 | | | | 18.22 | | | | (0.04 | ) | | | 6.06 | | | | 6.02 | | | | – | | | | – | | | | – | | | | 24.24 | | | | 33.04 | | | | 3,447 | | | | 1.20 | | | | 1.20 | | | | (0.18 | ) |
| R5 | | | | 18.43 | | | | 0.03 | | | | 6.13 | | | | 6.16 | | | | – | | | | – | | | | – | | | | 24.59 | | | | 33.42 | | | | 512 | | | | 0.91 | | | | 0.90 | | | | 0.13 | |
| Y | | | | 18.62 | | | | 0.12 | | | | 6.15 | | | | 6.27 | | | | – | | | | – | | | | – | | | | 24.89 | | | | 33.67 | | | | 11,627 | | | | 0.80 | | | | 0.80 | | | | 0.57 | |
| | | | | | | | | | | | | | | | | | | | | | | | | | | | | | | | | | | �� | | | | | | | | | | | | | | | | | | | |
| For the Year Ended October 31, 2012 (D) |
| A | | | $ | 17.01 | | | $ | (0.08 | ) | | $ | 0.76 | | | $ | 0.68 | | | $ | – | | | $ | – | | | $ | – | | | $ | 17.69 | | | | 4.00 | % | | $ | 350,195 | | | | 1.27 | % | | | 1.25 | % | | | (0.41 | )% |
| B | | | | 14.14 | | | | (0.22 | ) | | | 0.68 | | | | 0.46 | | | | – | | | | – | | | | – | | | | 14.60 | | | | 3.25 | | | | 8,124 | | | | 2.27 | | | | 2.00 | | | | (1.16 | ) |
| C | | | | 14.16 | | | | (0.20 | ) | | | 0.66 | | | | 0.46 | | | | – | | | | – | | | | – | | | | 14.62 | | | | 3.25 | | | | 29,533 | | | | 1.97 | | | | 1.97 | | | | (1.13 | ) |
| I | | | | 17.26 | | | | (0.02 | ) | | | 0.76 | | | | 0.74 | | | | – | | | | – | | | | – | | | | 18.00 | | | | 4.29 | | | | 200,957 | | | | 0.99 | | | | 0.99 | | | | (0.15 | ) |
| R3 | | | | 17.26 | | | | (0.13 | ) | | | 0.77 | | | | 0.64 | | | | – | | | | – | | | | – | | | | 17.90 | | | | 3.71 | | | | 358 | | | | 1.65 | | | | 1.50 | | | | (0.67 | ) |
| R4 | | | | 17.51 | | | | (0.07 | ) | | | 0.78 | | | | 0.71 | | | | – | | | | – | | | | – | | | | 18.22 | | | | 4.05 | | | | 3,395 | | | | 1.20 | | | | 1.20 | | | | (0.36 | ) |
| R5 | | | | 17.65 | | | | (0.01 | ) | | | 0.79 | | | | 0.78 | | | | – | | | | – | | | | – | | | | 18.43 | | | | 4.42 | | | | 648 | | | | 0.90 | | | | 0.90 | | | | (0.06 | ) |
| Y | | | | 17.82 | | | | 0.01 | | | | 0.79 | | | | 0.80 | | | | – | | | | – | | | | – | | | | 18.62 | | | | 4.49 | | | | 64,290 | | | | 0.79 | | | | 0.79 | | | | 0.04 | |
| | | | | | | | | | | | | | | | | | | | | | | | | | | | | | | | | | | | | | | | | | | | | | | | | | | | | | |
| For the Year Ended October 31, 2011 (D) |
| A(E) | | | $ | 16.14 | | | $ | 0.03 | | | $ | 0.84 | | | $ | 0.87 | | | $ | – | | | $ | – | | | $ | – | | | $ | 17.01 | | | | 5.39 | % | | $ | 404,630 | | | | 1.26 | % | | | 1.25 | % | | | 0.22 | % |
| B | | | | 13.53 | | | | (0.18 | ) | | | 0.79 | | | | 0.61 | | | | – | | | | – | | | | – | | | | 14.14 | | | | 4.51 | | | | 13,411 | | | | 2.22 | | | | 2.05 | | | | (1.03 | ) |
| C | | | | 13.53 | | | | (0.15 | ) | | | 0.78 | | | | 0.63 | | | | – | | | | – | | | | – | | | | 14.16 | | | | 4.66 | | | | 39,365 | | | | 1.95 | | | | 1.95 | | | | (0.96 | ) |
| I | | | | 16.33 | | | | – | | | | 0.93 | | | | 0.93 | | | | – | | | | – | | | | – | | | | 17.26 | | | | 5.70 | | | | 139,421 | | | | 0.95 | | | | 0.95 | | | | (0.03 | ) |
| R3 | | | | 16.42 | | | | (0.10 | ) | | | 0.94 | | | | 0.84 | | | | – | | | | – | | | | – | | | | 17.26 | | | | 5.12 | | | | 298 | | | | 1.61 | | | | 1.50 | | | | (0.55 | ) |
| R4 | | | | 16.61 | | | | (0.04 | ) | | | 0.94 | | | | 0.90 | | | | – | | | | – | | | | – | | | | 17.51 | | | | 5.42 | | | | 3,918 | | | | 1.19 | | | | 1.19 | | | | (0.21 | ) |
| R5 | | | | 16.69 | | | | – | | | | 0.96 | | | | 0.96 | | | | – | | | | – | | | | – | | | | 17.65 | | | | 5.75 | | | | 689 | | | | 0.91 | | | | 0.90 | | | | (0.03 | ) |
| Y | | | | 16.83 | | | | 0.03 | | | | 0.96 | | | | 0.99 | | | | – | | | | – | | | | – | | | | 17.82 | | | | 5.88 | | | | 124,174 | | | | 0.79 | | | | 0.79 | | | | 0.18 | |
| | | | | | | | | | | | | | | | | | | | | | | | | | | | | | | | | | | | | | | | | | | | | | | | | | | | | | |
| For the Year Ended October 31, 2010 (D) |
| A | | | $ | 13.57 | | | $ | (0.05 | ) | | $ | 2.62 | | | $ | 2.57 | | | $ | – | | | $ | – | | | $ | – | | | $ | 16.14 | | | | 18.94 | % | | $ | 267,340 | | | | 1.29 | % | | | 1.29 | % | | | (0.32 | )% |
| B | | | | 11.46 | | | | (0.16 | ) | | | 2.23 | | | | 2.07 | | | | – | | | | – | | | | – | | | | 13.53 | | | | 18.06 | | | | 17,522 | | | | 2.28 | | | | 2.05 | | | | (1.08 | ) |
| C | | | | 11.46 | | | | (0.15 | ) | | | 2.22 | | | | 2.07 | | | | – | | | | – | | | | – | | | | 13.53 | | | | 18.06 | | | | 43,521 | | | | 1.99 | | | | 1.99 | | | | (1.02 | ) |
| I | | | | 13.73 | | | | 0.01 | | | | 2.65 | | | | 2.66 | | | | (0.06 | ) | | | – | | | | (0.06 | ) | | | 16.33 | | | | 19.42 | | | | 59,539 | | | | 0.90 | | | | 0.90 | | | | 0.06 | |
| R3 | | | | 13.84 | | | | (0.07 | ) | | | 2.66 | | | | 2.59 | | | | (0.01 | ) | | | – | | | | (0.01 | ) | | | 16.42 | | | | 18.69 | | | | 233 | | | | 1.62 | | | | 1.53 | | | | (0.58 | ) |
| R4 | | | | 13.98 | | | | (0.03 | ) | | | 2.69 | | | | 2.66 | | | | (0.03 | ) | | | – | | | | (0.03 | ) | | | 16.61 | | | | 19.03 | | | | 3,507 | | | | 1.20 | | | | 1.20 | | | | (0.24 | ) |
| R5 | | | | 14.10 | | | | 0.01 | | | | 2.64 | | | | 2.65 | | | | (0.06 | ) | | | – | | | | (0.06 | ) | | | 16.69 | | | | 18.83 | | | | 134 | | | | 0.94 | | | | 0.93 | | | | 0.03 | |
| Y | | | | 14.15 | | | | 0.03 | | | | 2.72 | | | | 2.75 | | | | (0.07 | ) | | | – | | | | (0.07 | ) | | | 16.83 | | | | 19.50 | | | | 100,614 | | | | 0.81 | | | | 0.81 | | | | 0.16 | |
See Portfolio Turnover information on the next page.
| The Hartford Growth Fund |
| Financial Highlights |
| | | | - Selected Per-Share Data - (A) | | | - Ratios and Supplemental Data - | |
| Class | | | Net Asset
Value at
Beginning
of Period | | | Net
Investment
Income
(Loss) | | | Net
Realized
and
Unrealized
Gain
(Loss) on
Invest-
ments | | | Total from
Investment
Operations | | | Dividends
from Net
Investment
Income | | | Distribu-
tions
from
Realized
Capital
Gains | | | Total
Dividends
and
Distributions | | | Net Asset
Value at
End of
Period | | | Total
Return(B) | | | Net
Assets at
End of
Period
(000's) | | | Ratio of
Expenses
to
Average
Net
Assets
Before
Adjust-
ments(C) | | | Ratio of
Expenses
to
Average
Net
Assets
After
Adjust-
ments(C) | | | Ratio of
Net
Investment
Income to
Average
Net
Assets | |
| | | | | | | | | | | | | | | | | | | | | | | | | | | | | | | | | | | | | | | | | |
| For the Year Ended October 31, 2009 (D) |
| A | | | $ | 11.59 | | | $ | 0.02 | | | $ | 1.96 | | | $ | 1.98 | | | $ | – | | | $ | – | | | $ | – | | | $ | 13.57 | | | | 17.08 | % | | $ | 260,833 | | | | 1.44 | % | | | 1.24 | % | | | 0.15 | % |
| B | | | | 9.83 | | | | (0.03 | ) | | | 1.66 | | | | 1.63 | | | | – | | | | – | | | | – | | | | 11.46 | | | | 16.58 | | | | 19,319 | | | | 2.49 | | | | 1.69 | | | | (0.30 | ) |
| C | | | | 9.86 | | | | (0.07 | ) | | | 1.67 | | | | 1.60 | | | | – | | | | – | | | | – | | | | 11.46 | | | | 16.23 | | | | 44,604 | | | | 2.09 | | | | 2.05 | | | | (0.67 | ) |
| I | | | | 11.69 | | | | 0.05 | | | | 1.99 | | | | 2.04 | | | | – | | | | – | | | | – | | | | 13.73 | | | | 17.45 | | | | 54,433 | | | | 0.94 | | | | 0.94 | | | | 0.43 | |
| R3 | | | | 11.86 | | | | (0.02 | ) | | | 2.00 | | | | 1.98 | | | | – | | | | – | | | | – | | | | 13.84 | | | | 16.69 | | | | 163 | | | | 1.73 | | | | 1.55 | | | | (0.25 | ) |
| R4 | | | | 11.94 | | | | 0.01 | | | | 2.03 | | | | 2.04 | | | | – | | | | – | | | | – | | | | 13.98 | | | | 17.09 | | | | 2,541 | | | | 1.23 | | | | 1.23 | | | | 0.12 | |
| R5 | | | | 12.00 | | | | 0.04 | | | | 2.06 | | | | 2.10 | | | | – | | | | – | | | | – | | | | 14.10 | | | | 17.50 | | | | 91 | | | | 0.96 | | | | 0.95 | | | | 0.39 | |
| Y | | | | 12.03 | | | | 0.08 | | | | 2.04 | | | | 2.12 | | | | – | | | | – | | | | – | | | | 14.15 | | | | 17.62 | | | | 99,987 | | | | 0.84 | | | | 0.84 | | | | 0.56 | |
| (A) | Information presented relates to a share outstanding throughout the indicated period. Net investment income (loss) per share amounts are calculated based on average shares outstanding unless otherwise noted. |
| (B) | Assumes initial investment at net asset value at the beginning of each period, reinvestment of all distributions, the complete redemption of the investment at net asset value at the end of each period and no sales charge. Total return would be reduced if sales charges were taken into account. |
| (C) | Adjustments include waivers and reimbursements, if applicable. Ratios do not include fees paid indirectly (see Expenses in the accompanying Notes to Financial Statements). |
| (D) | Net investment income (loss) per share amounts have been calculated using the SEC method. |
| (E) | Class L was merged into Class A on August 5, 2011. |
| | | Portfolio Turnover
Rate for
All Share Classes | |
| For the Year Ended October 31, 2013 | | | 47 | % |
| For the Year Ended October 31, 2012 | | | 62 | |
| For the Year Ended October 31, 2011 | | | 47 | |
| For the Year Ended October 31, 2010 | | | 57 | |
| For the Year Ended October 31, 2009 | | | 94 | |
| Report of Independent Registered Public Accounting Firm |
| The Board of Directors and Shareholders of |
| The Hartford Mutual Funds II, Inc. |
We have audited the accompanying statement of assets and liabilities, including the schedule of investments, of The Hartford Growth Fund (one of the portfolios constituting The Hartford Mutual Funds II, Inc. (the Funds)) as of October 31, 2013, and the related statement of operations for the year then ended, the statements of changes in net assets for each of the two years in the period then ended, and the financial highlights for each of the five years in the period then ended. These financial statements and financial highlights are the responsibility of the Funds’ management. Our responsibility is to express an opinion on these financial statements and financial highlights based on our audits.
We conducted our audits in accordance with the standards of the Public Company Accounting Oversight Board (United States). Those standards require that we plan and perform the audit to obtain reasonable assurance about whether the financial statements and financial highlights are free of material misstatement. We were not engaged to perform an audit of the Funds’ internal control over financial reporting. Our audits included consideration of internal control over financial reporting as a basis for designing audit procedures that are appropriate in the circumstances, but not for the purpose of expressing an opinion on the effectiveness of the Funds’ internal control over financial reporting. Accordingly, we express no such opinion. An audit also includes examining, on a test basis, evidence supporting the amounts and disclosures in the financial statements and financial highlights, assessing the accounting principles used and significant estimates made by management, and evaluating the overall financial statement presentation. Our procedures included confirmation of securities owned as of October 31, 2013, by correspondence with the custodian and brokers or by other appropriate auditing procedures where replies from brokers were not received. We believe that our audits provide a reasonable basis for our opinion.
In our opinion, the financial statements and financial highlights referred to above present fairly, in all material respects, the financial position of The Hartford Growth Fund of The Hartford Mutual Funds II, Inc. at October 31, 2013, the results of its operations for the year then ended, the changes in its net assets for each of the two years in the period then ended, and the financial highlights for each of the five years in the period then ended, in conformity with U.S. generally accepted accounting principles.
| |  |
| | |
| Minneapolis, MN | |
| December 18, 2013 | |
| The Hartford Growth Fund |
| Directors and Officers (Unaudited) |
The Board of Directors of the Company appoints officers who are responsible for the day-to-day operations of the Fund and who execute policies formulated by the Directors. Each director serves until his or her death, resignation, or retirement or until the next annual meeting of shareholders is held or until his or her successor is elected and qualifies.
Directors and officers who are employed by or who have a financial interest in The Hartford are considered “interested” persons of the Fund pursuant to the 1940 Act. Each officer and two of the Company’s directors, as noted in the chart below, are “interested” persons of the Fund. Each director serves as a director for The Hartford Mutual Funds, Inc., The Hartford Mutual Funds II, Inc., Hartford Series Fund, Inc., and Hartford HLS Series Fund II, Inc., and as a trustee for The Hartford Alternative Strategies Fund, which, as of October 31, 2013, collectively consist of 89 funds. Correspondence may be sent to directors and officers c/o Hartford Funds, P.O. Box 2999, Hartford, Connecticut 06104-2999, except that correspondence to Mr. Annoni, Mr. Dressen, Ms. Fagely and Ms. Quade may be sent to 500 Bielenberg Drive, Woodbury, Minnesota 55125 and correspondence to Mr. Davey and Mr. Melcher may be sent to 5 Radnor Corporate Center, Suite 300, 100 Matsonford Road, Radnor, Pennsylvania 19087.
The table below sets forth, for each director and officer, his or her name, year of birth, current position with the Company and date first elected or appointed to The Hartford Mutual Funds, Inc. (“MF”) and The Hartford Mutual Funds II, Inc. (“MF2”), principal occupation, and, for directors, other directorships held. The Fund’s statement of additional information contains further information on the directors and is available free of charge by calling 1-888-843-7824 or writing to Hartford Funds, P.O. Box 64387, St. Paul, MN 55164-0387.
Information on the aggregate remuneration paid to the directors of the Company can be found in the Statement of Operations herein. The Fund pays to The Hartford a portion of the Chief Compliance Officer’s compensation, but does not pay salaries or compensation to any of its other officers or directors who are employed by The Hartford.
Non-Interested Directors
Lynn S. Birdsong (1946) Director since 2003, Co-Chairman of the Investment Committee
Mr. Birdsong is a private investor. Mr. Birdsong currently serves as a Director of the Sovereign High Yield Investment Company (April 2010 to current). Mr. Birdsong currently serves as an Independent Director of Nomura Partners Funds, Inc. (formerly, The Japan Fund) (March 2003 to current). From 1979 to 2002, Mr. Birdsong was a managing director of Zurich Scudder Investments, an investment management firm. During his employment with Scudder, Mr. Birdsong was an Interested Director of The Japan Fund. Since 1981, Mr. Birdsong has been a partner in Birdsong Company, an advertising specialty firm.
Robert M. Gavin, Jr. (1940) Director since 2002 (MF) and 1986 (MF2), Chairman of the Board since 2004
Dr. Gavin is an educational consultant. Prior to September 1, 2001, he was President of Cranbrook Education Community and prior to July 1996, he was President of Macalester College, St. Paul, Minnesota.
Duane E. Hill (1945) Director since 2001 (MF) and 2002 (MF2), Chairman of the Nominating Committee
Mr. Hill is Partner of TSG Ventures L.P., a private equity investment company. Mr. Hill is a former partner of TSG Capital Group, a private equity investment firm that served as sponsor and lead investor in leveraged buyouts of middle market companies.
Sandra S. Jaffee (1941) Director since 2005
Ms. Jaffee is the founder and Chief Executive Officer of a private company, Homeworks Concierge, LLC, which provides residential property management services in Westchester County, New York (January 2012 to present). Ms. Jaffee served as Chairman (2008 to 2009) and Chief Executive Officer of Fortent (formerly Searchspace Group), a leading provider of compliance/regulatory technology to financial institutions from August 2005 to August 2009. Ms. Jaffee currently serves as a member of the Board of Directors of Broadridge Financial Solutions as well as a Trustee of Muhlenberg College.
William P. Johnston (1944) Director since 2005, Chairman of the Compliance Committee
In February 2008, Mr. Johnston was elected to the Board of Directors of HCR-ManorCare, Inc. In August 2007, Mr. Johnston was elected to the Board of Directors of LifeCare Holdings, Inc. In July 2006, Mr. Johnston was elected to the Board of Directors of MultiPlan, Inc. and served as a director (July 2006 to August 2010). In June 2006, Mr. Johnston was appointed as Senior Advisor to The Carlyle Group, a global private equity and alternative asset investment firm. In May 2006, Mr. Johnston was elected to the Supervisory Board of Fresenius Medical Care AG & Co. KGaA, after its acquisition of Renal Care Group, Inc. in March 2006.
Phillip O. Peterson (1944) Director since 2002 (MF) and 2000 (MF2), Chairman of the Audit Committee
Mr. Peterson is a mutual fund industry consultant. He was a partner of KPMG LLP (an accounting firm) until July 1999. Mr. Peterson joined William Blair Funds in February 2007 as a member of the Board of Trustees. Mr. Peterson also joined the Board of Trustees of Symetra Variable Mutual Funds Trust as a trustee in February 2012.
Lemma W. Senbet (1946) Director since 2005
Dr. Senbet is the William E. Mayer Chair Professor of Finance and Director, Center for Financial Policy, at the University of Maryland, Robert H. Smith School of Business. He was chair of the Finance Department from 1998 to 2006. Previously he was a chaired professor of finance at the University of Wisconsin-Madison. Also, he was director of the Fortis Funds from March 2000 to July 2002. Dr. Senbet served the finance profession in various capacities, including as director of the American Finance Association and President of the Western Finance Association. In 2006, Dr. Senbet was inducted Fellow of Financial Management Association International for his career-long distinguished scholarship and professional service.
Interested Directors and Officers
James E. Davey (1964) Director since 2012, President and Chief Executive Officer since 2010
Mr. Davey serves as Executive Vice President of Hartford Life Insurance Company (“HLIC”) and The Hartford Financial Services Group, Inc. Additionally, Mr. Davey serves as Chairman of the Board and Manager of Hartford Funds Distributors, LLC (“HFD”) and Director and Chairman of the Board of Hartford Administrative Services Company (“HASCO”). Mr. Davey also serves as Manager, President and Chairman of the Board for Hartford Funds Management Company, LLC (“HFMC”). Mr. Davey joined The Hartford in 2002.
Lowndes A. Smith (1939) Director since 1996 (MF) and 2002 (MF2), Co-Chairman of the Investment Committee
Mr. Smith served as Vice Chairman of The Hartford from February 1997 to January 2002, as President and Chief Executive Officer of Hartford Life, Inc. from February 1997 to January 2002, and as President and Chief Operating Officer of The Hartford Life Insurance Companies from January 1989 to January 2002. Mr. Smith serves as a Director of White Mountains Insurance Group, Ltd., One Beacon Insurance and Symetra Financial and as Managing Director of Whittington Gray Associates.
Other Officers
Mark A. Annoni (1964) Vice President, Controller and Treasurer since 2012
Mr. Annoni serves as the Assistant Vice President of HLIC (February 2004 to present). Mr. Annoni joined The Hartford in April 2001 as part of The Hartford’s acquisition of Fortis Financial Group (“Fortis”).
Michael R. Dressen (1963) AML Compliance Officer since 2011
Mr. Dressen currently serves as Assistant Vice President of HLIC. He also serves as Chief Compliance Officer and AML Compliance Officer of HASCO and as AML Officer of HFD. Mr. Dressen joined The Hartford in 2005 from State Farm Insurance Companies where he held various positions related to mutual funds, variable products, and property casualty insurance.
Tamara L. Fagely (1958) Vice President since 2002 (MF) and 1993 (MF2) (1)
Currently, Ms. Fagely is President and a Director of HASCO, Chief Administrative Officer and Manager of HFMC and a Vice President of HLIC. Ms. Fagely served as a Vice President of HASCO (1998-2013) and Chief Financial Officer of HASCO (2006-2013). She served as Assistant Vice President of HLIC from December 2001 through March 2005. In addition, Ms. Fagely is Manager and Chief Operating Officer of HFD.
(1) Ms. Fagley will be retiring on December 31, 2013.
Edward P. Macdonald (1967) Vice President, Secretary and Chief Legal Officer since 2005
Mr. Macdonald serves as Vice President of HLIC and Vice President, Chief Legal Officer and Secretary of HFD and HASCO. Mr. Macdonald also serves as Manager, Vice President, Chief Legal Officer and Secretary of HFMC. Mr. Macdonald joined The Hartford in 2005.
Joseph G. Melcher (1973) Vice President and Chief Compliance Officer since 2013
Mr. Melcher currently serves as Vice President of HFMC and HFD. Mr. Melcher joined The Hartford in 2012 from Touchstone Investments, a member of the Western & Southern Financial Group, where he held the position of Vice President and Chief Compliance Officer from 2010 through 2012 and Assistant Vice President, Compliance from 2005 to 2010.
| The Hartford Growth Fund |
| Directors and Officers (Unaudited) – (continued) |
Vernon J. Meyer (1964) Vice President since 2006
Mr. Meyer serves as Senior Vice President of HLIC. He also serves as Senior Vice President of HFMC and HFD. Mr. Meyer joined The Hartford in 2004.
Laura S. Quade (1969) Vice President since 2012
Ms. Quade currently serves as Vice President of HASCO and is a Director of Mutual Fund Service Operations. She also serves as Director, Enterprise Operations of HFD and HLIC. Ms. Quade joined The Hartford in 2001 as part of The Hartford’s acquisition of Fortis.
Martin A. Swanson (1962) Vice President since 2010
Mr. Swanson is a Vice President of HLIC. Mr. Swanson also serves as Vice President and Chief Marketing Officer for HFD. Prior to joining HLIC in 1998, Mr. Swanson was a Vice President at PaineWebber, Inc.
HOW TO OBTAIN A COPY OF THE FUND’S PROXY VOTING POLICIES AND VOTING RECORDS (UNAUDITED)
A description of the policies and procedures that the Fund uses to determine how to vote proxies relating to portfolio securities and information about how the Fund voted proxies relating to portfolio securities during the most recent twelve-month period ended June 30 are available (1) without charge, upon request, by calling 888-843-7824 and (2) on the SEC’s website at http://www.sec.gov.
QUARTERLY PORTFOLIO HOLDINGS INFORMATION (UNAUDITED)
The Fund files a complete schedule of portfolio holdings with the SEC for the first and third quarters of each fiscal year on Form N-Q. The Fund’s Forms N-Q are available (1) without charge, upon request, by calling 888-843-7824 and (2) on the SEC’s website at http://www.sec.gov. The Form N-Q may be reviewed and copied at the SEC’s Public Reference Room in Washington, DC. Information on the operation of the Public Reference Room may be obtained by calling 1-800-SEC-0330.
| The Hartford Growth Fund |
| Federal Tax Information (Unaudited) |
For the fiscal year ended October 31, 2013, there is no further federal tax information required for this Fund.
| The Hartford Growth Fund |
| Expense Example (Unaudited) |
Your Fund's Expenses
As a shareholder of the Fund, you incur two types of costs: (1) transaction costs, including sales charges (loads) on purchase payments, if any, and contingent deferred sales charges (CDSC), if any, and (2) ongoing costs, including investment management fees, distribution and/or service (12b-1) fees, if any, and other fund expenses. This example is intended to help you understand your ongoing costs (in dollars) of investing in the Fund and to compare these costs with the ongoing costs of investing in other mutual funds. The example is based on an investment of $1,000 invested at the beginning of the period and held for the period of April 30, 2013 through October 31, 2013.
Actual Expenses
The first set of columns of the table below provides information about actual account values and actual expenses. You may use the information in this column, together with the amount you invested, to estimate the expenses that you paid over the period. Simply divide your account value by $1,000 (for example, an $8,600 account value divided by $1,000 = 8.6), then multiply the result by the number in the line under the heading entitled “Expenses Paid During Period” to estimate the expenses you paid on your account during this period.
Hypothetical Example for Comparison Purposes
The second set of columns of the table below provides information about hypothetical account values and hypothetical expenses based on the Fund's actual expense ratio and an assumed rate of return of 5% per year before expenses, which is not the Fund's actual return. The hypothetical account values and expenses may not be used to estimate the actual ending account balance or expenses you paid for the period. You may use this information to compare the ongoing costs of investing in the Fund and other funds. To do so, compare this 5% hypothetical example with the 5% hypothetical examples that appear in the shareholder reports of the other funds.
Please note that the expenses shown in the table are meant to highlight your ongoing costs only and do not reflect any transactional costs, such as sales charges (loads) and CDSC. Therefore, the second set of columns of the table is useful in comparing ongoing costs only, and will not help you determine the relative total costs of owning different funds. In addition, if these transactional costs were included, your costs would be higher. Expenses are equal to the Fund's annualized expense ratios multiplied by average account value over the period, multiplied by 184/365 (to reflect the one-half year period).
| | | Actual return | | | Hypothetical (5% return before expenses) | | | | | | | | | | |
| | | Beginning
Account Value
April 30, 2013 | | | Ending Account
Value
October 31, 2013 | | | Expenses paid
during the period
April 30, 2013
through
October 31, 2013 | | | Beginning
Account Value
April 30, 2013 | | | Ending Account
Value
October 31, 2013 | | | Expenses paid
during the
period
April 30, 2013
through
October 31, 2013 | | | Annualized
expense
ratio | | | Days in
the
current
1/2
year | | | Days
in the
full
year | |
| Class A | | $ | 1,000.00 | | | $ | 1,151.20 | | | $ | 6.78 | | | $ | 1,000.00 | | | $ | 1,018.90 | | | $ | 6.37 | | | | 1.25 | % | | 184 | | | 365 | |
| Class B | | $ | 1,000.00 | | | $ | 1,147.10 | | | $ | 10.83 | | | $ | 1,000.00 | | | $ | 1,015.12 | | | $ | 10.17 | | | | 2.00 | | | 184 | | | 365 | |
| Class C | | $ | 1,000.00 | | | $ | 1,147.40 | | | $ | 10.64 | | | $ | 1,000.00 | | | $ | 1,015.30 | | | $ | 9.98 | | | | 1.97 | | | 184 | | | 365 | |
| Class I | | $ | 1,000.00 | | | $ | 1,152.80 | | | $ | 5.43 | | | $ | 1,000.00 | | | $ | 1,020.16 | | | $ | 5.10 | | | | 1.00 | | | 184 | | | 365 | |
| Class R3 | | $ | 1,000.00 | | | $ | 1,150.10 | | | $ | 8.14 | | | $ | 1,000.00 | | | $ | 1,017.64 | | | $ | 7.63 | | | | 1.50 | | | 184 | | | 365 | |
| Class R4 | | $ | 1,000.00 | | | $ | 1,151.50 | | | $ | 6.51 | | | $ | 1,000.00 | | | $ | 1,019.15 | | | $ | 6.11 | | | | 1.20 | | | 184 | | | 365 | |
| Class R5 | | $ | 1,000.00 | | | $ | 1,153.40 | | | $ | 4.89 | | | $ | 1,000.00 | | | $ | 1,020.66 | | | $ | 4.59 | | | | 0.90 | | | 184 | | | 365 | |
| Class Y | | $ | 1,000.00 | | | $ | 1,153.90 | | | $ | 4.35 | | | $ | 1,000.00 | | | $ | 1,021.17 | | | $ | 4.08 | | | | 0.80 | | | 184 | | | 365 | |
| | | | | | | | | | | | | | | | | | | | | | | | | | | | | | | | | | | | | |
| The Hartford Growth Fund |
| Approval of Investment Management and Investment Sub-Advisory Agreements (Unaudited) |
Section 15(c) of the Investment Company Act of 1940, as amended (the “1940 Act”), requires that each mutual fund’s board of directors, including a majority of those directors who are not “interested persons” of the mutual fund, as defined in the 1940 Act (the “Independent Directors”), annually review and consider the continuation of the mutual fund’s investment advisory and sub-advisory agreements. At its meeting held on August 6-7, 2013, the Board of Directors (the “Board”) of The Hartford Mutual Funds II, Inc., including each of the Independent Directors, unanimously voted to approve the continuation of the investment management agreement for The Hartford Growth Fund (the “Fund”) with Hartford Funds Management Company, LLC (“HFMC”) and the continuation of the investment sub-advisory agreement between HFMC and the Fund’s sub-adviser, Wellington Management Company, LLP (the “Sub-adviser,” and together with HFMC, the “Advisers”) (collectively, the “Agreements”).
In the months preceding the August 6-7, 2013 meeting, the Board requested, received, and reviewed written responses from the Advisers to questions posed to them on behalf of the Independent Directors and supporting materials relating to those questions and responses. The Board considered information furnished to the Board at its meetings throughout the year, as well as information specifically prepared in connection with the annual approval of the Agreements at the Board’s meetings held on June 18-19, 2013 and August 6-7, 2013. Information provided to the Board at its meetings throughout the year included, among other things, reports on Fund performance, legal and compliance matters, sales and marketing activity, shareholder services, and the other services provided to the Fund by the Advisers and their affiliates. The Board also received in-person presentations by Fund officers and representatives of HFMC at the Board’s meetings on June 18-19, 2013 and August 6-7, 2013 concerning the Agreements.
The Independent Directors, advised by independent legal counsel, engaged two service providers to assist them with evaluating the Agreements with respect to the Fund. Lipper Inc. (“Lipper”), an independent provider of investment company data, was retained to provide the Board with reports on how the Fund’s contractual management fees, actual management fees, other non-management fees, overall expense ratios and investment performance compared to those of mutual funds with similar investment objectives. The Independent Directors also engaged an independent financial services consulting firm (the “Consultant”) to assist them in evaluating the Fund’s management fees, sub-advisory fees, other non-management fees, overall expense ratios and investment performance.
In determining whether to continue the Agreements for the Fund, the members of the Board reviewed and evaluated information and factors they believed to be relevant and appropriate in light of the information that the Board deemed necessary and appropriate through the exercise of its reasonable business judgment. While individual members of the Board may have weighed certain factors differently, the Board’s determination to continue the Agreements was based on a comprehensive consideration of all information provided to the Board throughout the year and specifically with respect to the continuation of the Agreements. A more detailed discussion of the factors the Board considered with respect to its approval of the Agreements is provided below.
Nature, Extent, and Quality of Services Provided by the Advisers
The Board requested and considered information concerning the nature, extent, and quality of the services provided to the Fund by the Advisers. The Board considered, among other things, the terms of the Agreements and the range of services provided by the Advisers. The Board considered the Advisers’ professional personnel who provide services to the Fund, including each Adviser’s ability and experience in attracting and retaining qualified personnel to service the Fund. The Board considered each Adviser’s reputation and overall financial strength, as well as its willingness to consider and implement organizational and operational changes designed to improve services to the Fund. In addition, the Board considered the quality of each Adviser’s communications with the Board and responsiveness to Board inquiries.
The Board also requested and evaluated information concerning each Adviser’s regulatory and compliance environment. In this regard, the Board requested and reviewed information on each Adviser’s compliance policies and procedures, compliance history and a report from the Fund’s Chief Compliance Officer on each Adviser’s compliance with applicable laws and regulations, including responses to regulatory developments and compliance issues raised by regulators. The Board also noted the Advisers’
| The Hartford Growth Fund |
| Approval of Investment Management and Investment Sub-Advisory Agreements (Unaudited) – (continued) |
support of the Fund’s compliance control structure, particularly the resources devoted by the Advisers in support of the Fund’s obligations pursuant to Rule 38a-1 under the 1940 Act.
With respect to HFMC, the Board noted that under the Agreements, HFMC is responsible for the management of the Fund, including overseeing fund operations and service providers, and provides administrative services to the Fund as well as investment advisory services in connection with selecting, monitoring and supervising the Sub-adviser. The Board considered HFMC’s ongoing monitoring of people, process and performance, including its quarterly reviews of each of the Hartford Funds, semi-annual meetings with the leaders of each Fund’s portfolio management team, and oversight of the Funds’ approximately 60 portfolio managers. The Board recognized that HFMC has demonstrated a record of making changes to the management and/or strategies of the Funds when warranted. The Board considered HFMC’s oversight of the Sub-adviser’s investment approach and results, process for monitoring best execution of portfolio trades by the Sub-adviser, and approach to risk management with respect to the Fund and the service providers to the Fund. The Board also considered HFMC’s oversight of compliance with the Fund’s objective and policies as well as with applicable laws and regulations, noting that regulatory and other developments had over time led to an increase in the scope of HFMC’s services in this regard.
In addition, the Board considered HFMC’s ongoing commitment to review and rationalize the Hartford Funds product line-up and the expenses that HFMC had incurred in connection with fund combinations in recent years. The Board considered that HFMC or its affiliates are responsible for providing the Fund’s officers.
With respect to the Sub-adviser, who provides day-to-day portfolio management services, the Board considered the quality of the Fund’s portfolio manager, the Sub-adviser’s other investment personnel, its investment philosophy and process, investment research capabilities and resources, performance record, trade execution capabilities and experience. The Board considered the experience of the Fund’s portfolio manager, the number of accounts managed by the portfolio manager, and the Sub-adviser’s method for compensating the portfolio manager.
Based on these considerations, the Board concluded that it was satisfied with the nature, extent and quality of the services provided to the Fund by HFMC and the Sub-adviser.
Performance of the Fund and the Advisers
The Board considered the investment performance of the Fund. In this regard, the Board reviewed the performance of the Fund over different time periods presented in the materials and evaluated HFMC’s analysis of the Fund’s performance for these time periods. The Board considered information and materials provided to the Board by the Advisers concerning Fund performance, as well as information from Lipper comparing the investment performance of the Fund to an appropriate benchmark and universe of peer funds. The Board noted that the Fund’s performance was in the 4th quintile of its performance universe for the 1-, 3- and 5-year periods. The Board also noted that the Fund’s performance was below its benchmark for the 1-, 3- and 5-year periods. The Board considered that, in response to questions raised concerning the Fund’s performance, HFMC stated that it has confidence in the Fund’s portfolio management team and investment strategy.
The Board considered the detailed investment analytics reports provided by Hartford Funds’ Investment Advisory Group throughout the year. These reports include, among other things, information on the Fund’s gross and net returns, the Fund’s investment performance relative to an appropriate benchmark and peer group, various statistics concerning the Fund’s portfolio, and a narrative summary of various factors affecting Fund performance. The Board considered the Advisers’ cooperation with the Investment Committee, which assists the Board in evaluating the performance of the Fund at periodic meetings throughout the year. The Board also considered the analysis provided by the Consultant relating to the Fund’s performance track record.
In light of all the considerations noted above, the Board concluded that it had continued confidence in HFMC’s and the Sub-adviser’s overall capabilities to manage the Fund.
Costs of the Services and Profitability of the Advisers
The Board reviewed information regarding HFMC’s cost to provide investment management and related services to the Fund and HFMC’s profitability, both overall and for the Fund, on a pre-tax basis without regard to distribution expenses. The Board also
requested and reviewed information about the profitability to HFMC and its affiliates from all services provided to the Fund and all aspects of their relationship with the Fund. The Board also requested and received information relating to the operations and profitability of the Sub-adviser.
The Board considered the Consultant’s review of the profitability calculations utilized by HFMC in connection with the continuation of the investment management agreement, noting the Consultant’s view that Hartford Funds’ process for calculating and reporting Fund profitability is reasonable. In this regard, the Board noted that the Consultant had previously performed a full review of this process and reported that such process is sound and well within common industry practice.
Based on these considerations, the Board concluded that the profits anticipated to be realized by the Advisers and their affiliates from their relationships with the Fund would not be excessive.
Comparison of Fees and Services Provided by the Advisers
The Board considered comparative information with respect to the management fees to be paid by the Fund to HFMC and the total expense ratios of the Fund. The Board also considered comparative information with respect to the sub-advisory fees to be paid by HFMC to the Sub-adviser. In this regard, the Board requested and reviewed information from HFMC and the Sub-adviser relating to the management and sub-advisory fees, including the sub-advisory fee schedule for the Fund, and total operating expenses for the Fund. With respect to the sub-advisory fee schedule, the Board considered representations from HFMC and the Sub-adviser that the Sub-adviser’s fees were negotiated at arm’s length. The Board also reviewed information from Lipper comparing the Fund’s contractual management fees, actual management fees and overall expense ratios relative to a group of funds selected by Lipper, in consultation with the Consultant, and a broader universe of funds selected by Lipper. The Board noted that the Fund’s contractual management fee was in the 1st quintile of its expense group, while its actual management fee and total expenses (less 12b-1 and shareholder service fee) were in the 2nd quintile. The Board noted that the Fund has an automatically renewable contractual expense cap on each share class, which HFMC has temporarily agreed to lower for certain share classes through February 28, 2014. The Board noted that this arrangement resulted in reimbursement of certain expenses incurred in 2012.
While the Board recognized that comparisons between the Fund and peer funds are imprecise, given the differing service levels and characteristics of mutual funds and the different business models and cost structures of the Advisers, the comparative information provided by Lipper assisted the Board in evaluating the reasonableness of the Fund’s management and sub-advisory fees and total operating expenses. In addition, the Board considered the analysis and recommendations of the Consultant relating to the Fund’s management and sub-advisory fees and total operating expenses.
Based on these considerations, the Board concluded that the Fund’s fees and total operating expenses, in conjunction with the information about quality of services, profitability, economies of scale, and other matters discussed, were reasonable in light of the services provided.
Economies of Scale
The Board requested and considered information regarding the Advisers’ realization of economies of scale with respect to the Fund and whether the fee levels reflect these economies of scale for the benefit of the Fund’s shareholders. The Board reviewed the breakpoints in the management fee schedule for the Fund, which reduce fee rates as Fund assets grow over time. The Board recognized that a fund with assets beyond the last breakpoint level will continue to benefit from economies of scale because additional assets are charged the lowest breakpoint fee resulting in lower overall effective management fee rates. The Board also considered that expense limitations and fee waivers that reduce the Fund’s expenses at all asset levels can have the same effect as breakpoints in sharing economies of scale with shareholders and provide protection from an increase in expenses if Fund assets decline. The Board recognized that a fee schedule that reaches a lower breakpoint quickly provides shareholders with the benefit of anticipated or potential economies of scale. The Board also considered that HFMC has been active in managing expenses, which has resulted in benefits being realized by shareholders as assets within the Hartford Funds family of funds have grown over time, including through lower transfer agent costs and other operating expenses.
The Board reviewed and evaluated materials from Lipper showing how management fee schedules of peer funds reflect economies of scale for the benefit of shareholders as a peer fund’s assets hypothetically increase over time. Based on information
| The Hartford Growth Fund |
| Approval of Investment Management and Investment Sub-Advisory Agreements (Unaudited) – (continued) |
provided by HFMC, Lipper, and the Consultant, the Board recognized that there is no uniform methodology for establishing breakpoints or uniform pattern in asset levels that trigger breakpoints or the amounts of breakpoints triggered.
After considering all of the information available to it, the Board concluded that it was satisfied with the extent to which economies of scale would be shared for the benefit of the Fund’s shareholders based on currently available information and the effective advisory fees and expense ratios for the Fund at its current and reasonably anticipated asset levels. The Board noted, however, that it would continue to monitor future growth in Fund assets and the appropriateness of additional breakpoints.
Other Benefits
The Board considered other benefits to the Advisers and their affiliates from their relationships with the Fund.
The Board reviewed information noting that HFMC receives fees for fund accounting and related services from the Fund, and the Board considered information on profits to HFMC for such services. The Board also considered that Hartford Administrative Services Company (“HASCO”), the Fund’s transfer agent and an affiliate of HFMC, receives transfer agency compensation from the Fund, and the Board reviewed information on the profitability of the Fund’s transfer agency function to HASCO. The Board considered information provided by HASCO indicating that the transfer agent fees charged by HASCO to the Fund were fair and reasonable based on publicly available information.
The Board also considered that Hartford Funds Distributors, LLC (“HFD”), an affiliate of HFMC, serves as principal underwriter of the Fund. As principal underwriter, HFD receives 12b-1 fees from the Fund and receives all or a portion of the sales charges on sales or redemptions of certain classes of shares. The Board also noted that certain affiliates of HFD distribute shares of the Fund and receive compensation in that connection.
The Board considered benefits to the Sub-adviser from its use of the Fund’s brokerage commissions to obtain soft dollar research, and representations from HFMC and the Sub-adviser that the Sub-adviser would not make any revenue-sharing payments or any other type of distribution payments to HFMC or its affiliates.
The Board considered the benefits to shareholders of being part of the Hartford Funds family of funds, including the right to exchange investments between the same class of funds without a sales charge, the ability to reinvest Fund dividends into other funds in the family, and the ability to combine holdings in the Fund with holdings in other funds to obtain a reduced sales charge. The Board considered HFMC’s efforts to provide investors in the family with a broad range of investment styles and asset classes and its entrepreneurial risk in initiating new funds to expand these opportunities for shareholders.
* * * *
Based upon its review of these various factors, among others, the Board concluded that it is in the best interests of the Fund and its shareholders for the Board to approve the Agreements for an additional year. In reaching this decision, the Board did not assign relative weights to the factors discussed above or deem any one or group of them to be controlling in and of themselves. In connection with their deliberations, the Independent Directors met separately in executive session on several occasions, with independent legal counsel and the Consultant, to review the relevant materials and consider their responsibilities under relevant laws and regulations.
| The Hartford Growth Fund |
| Main Risks (Unaudited) |
The main risks of investing in the Fund are described below.
Market, Selection, and Strategy Risk: The Fund’s share price may fluctuate due to market risk and/or security selections that may underperform the market or relevant benchmarks. If the sub-adviser’s investment strategy does not perform as expected, the Fund could underperform its peers or lose money. There is no guarantee the Fund will achieve its stated objective.
Growth Investing Risk: Growth investments can be volatile, and may fail to increase earnings or grow as quickly as anticipated. Growth-style investing falls in and out of favor, which may result in periods of underperformance.
Foreign Investment Risk: Foreign investments can be riskier than U.S. investments. Potential risks include currency risk that may result from unfavorable exchange rates, liquidity risk if decreased demand for a security makes it difficult to sell at the desired price, and risks that stem from substantially lower trading volume on foreign markets.
HARTFORDFUNDS
hartfordfunds.com
This information is written in connection with the promotion or marketing of the matter(s) addressed in this material.
This report is submitted for the general information of the shareholders of the Fund. It is not authorized for distribution unless preceded or accompanied by a current prospectus for the Fund.
The information cannot be used or relied upon for the purpose of avoiding IRS penalties. These materials are not intended to provide tax, accounting or legal advice. As with all matters of a tax or legal nature, you should consult your own tax or legal counsel for advice.
Investors should carefully consider the investment objectives, risks, charges, and expenses of Hartford Funds before investing. This and other information can be found in the prospectus and summary prospectus, which can be obtained by calling 888-843-7824 (retail) or 877-836-5854 (institutional). Investors should read them carefully before they invest.
Hartford Funds are underwritten and distributed by Hartford Funds Distributors, LLC.
MFAR-G13 12/13 113982-1 Printed in U.S.A. ©2013 The Hartford, Hartford, CT 06155
HARTFORDFUNDS
| THE HARTFORD
GROWTH OPPORTUNITIES FUND
2013 Annual Report |
The Hartford Growth Opportunities Fund
Table of Contents
The views expressed in the Fund’s Manager Discussion under ‘‘Why did the Fund perform this way?’’ and ‘‘What is the outlook?’’ are views of the Fund’s sub-adviser and portfolio management team through the end of the period and are subject to change based on market and other conditions. The Fund’s Manager Discussion is for informational purposes only and does not represent an offer, recommendation or solicitation to buy, hold or sell any security. The specific securities identified and described, if any, do not represent all of the securities purchased or sold and you should not assume that investments in the securities identified and discussed will be profitable.
| The Hartford Growth Opportunities Fund inception 03/31/1963 |
| (sub-advised by Wellington Management Company, LLP) |
| |
| Investment objective – Seeks capital appreciation. |
Performance Overview 10/31/03 - 10/31/13
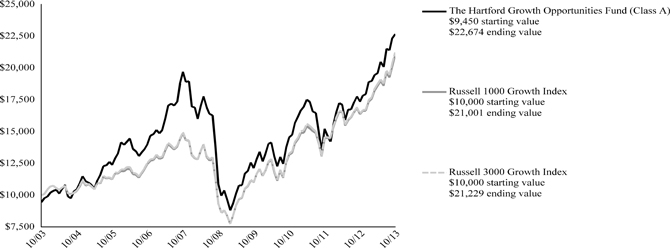
The chart above represents the hypothetical growth of a $10,000 investment in Class A which includes a sales charge. Growth results in classes other than Class A will vary from what is seen above due to differences in the expenses charged to those share classes.
Average Annual Total Returns (as of 10/31/13)
| | | 1 Year | | | 5 Years | | | 10 Years | |
| Growth Opportunities A# | | | 30.68% | | | | 15.77% | | | | 9.15% | |
| Growth Opportunities A## | | | 23.49% | | | | 14.47% | | | | 8.53% | |
| Growth Opportunities B# | | | 29.66% | | | | 14.92% | | | | 8.49%* | |
| Growth Opportunities B## | | | 24.66% | | | | 14.68% | | | | 8.49%* | |
| Growth Opportunities C# | | | 29.72% | | | | 14.95% | | | | 8.37% | |
| Growth Opportunities C## | | | 28.72% | | | | 14.95% | | | | 8.37% | |
| Growth Opportunities I# | | | 31.02% | | | | 16.11% | | | | 9.41% | |
| Growth Opportunities R3# | | | 30.31% | | | | 15.50% | | | | 9.14% | |
| Growth Opportunities R4# | | | 30.74% | | | | 15.86% | | | | 9.38% | |
| Growth Opportunities R5# | | | 31.10% | | | | 16.19% | | | | 9.60% | |
| Growth Opportunities Y# | | | 31.26% | | | | 16.32% | | | | 9.67% | |
| Russell 1000 Growth Index | | | 28.29% | | | | 17.51% | | | | 7.70% | |
| Russell 3000 Growth Index | | | 29.16% | | | | 17.65% | | | | 7.82% | |
| * | Class B shares convert to Class A shares after 8 years. The return shown reflects the conversion to Class A shares, which had different operating expenses, for the period after conversion. |
PERFORMANCE DATA QUOTED REPRESENTS PAST PERFORMANCE AND DOES NOT GUARANTEE FUTURE RESULTS. The investment return and principal value of the investment will fluctuate so that investors’ shares, when redeemed, may be worth more or less than their original cost. Current performance may be lower or higher than the performance data quoted. To obtain performance data current to the most recent month-end, please visit our website www.hartfordfunds.com.
The initial investment in Class A shares reflects the maximum sales charge of 5.50% and returns for Classes B and C reflect a contingent deferred sales charge of 5.00% and 1.00%, respectively.
Total returns presented above were calculated using the Fund’s net asset value available to shareholders for sale or redemption of Fund shares on October 31, 2013, which may exclude investment transactions as of this date. All share class returns assume the reinvestment of all distributions at net asset value and the deduction of all fund expenses.
Effective 9/30/09, Class B shares of the Fund were closed to new investments.
Class I shares commenced operations on 8/31/06. Performance prior to that date is that of the Fund's Class A shares (excluding sales charges), which had different operating expenses. Class R3, R4 and R5 shares commenced operations on 12/22/06. Performance prior to that date is that of the Fund's Class Y shares which had different operating expenses.
Russell 1000 Growth Index is an unmanaged index which measures the performance of those Russell 1000 Index companies with higher price-to-book ratios and higher forecasted growth values. (The Russell 1000 Index is an unmanaged index that measures the performance of the 1,000 largest companies in the Russell 3000 Index, which measures the performance of the 3,000 largest U.S. companies based on total market capitalization.)
Russell 3000 Growth Index is an unmanaged index that measures the performance of those Russell 3000 Index companies with higher price-to-book ratios and higher forecasted growth values. (The Russell 3000 Index is an unmanaged index that measures the performance of the 3,000 largest U.S. companies based on total market capitalization.)
You cannot invest directly in an index.
The chart and table do not reflect the deductions of taxes that a shareholder would pay on Fund distributions or the redemption of Fund shares.
Performance information may reflect historical or current expense waivers/reimbursements from the investment adviser, without which performance would have been lower. For information on current expense waivers/reimbursements, please see the prospectus.
| The Hartford Growth Opportunities Fund |
| Manager Discussion |
| October 31, 2013 (Unaudited) |
| Operating Expenses* |
| | | Net | | | Gross | |
| Growth Opportunities Class A | | | 1.21% | | | | 1.23% | |
| Growth Opportunities Class B | | | 1.96% | | | | 2.15% | |
| Growth Opportunities Class C | | | 1.93% | | | | 1.93% | |
| Growth Opportunities Class I | | | 0.95% | | | | 0.95% | |
| Growth Opportunities Class R3 | | | 1.45% | | | | 1.48% | |
| Growth Opportunities Class R4 | | | 1.15% | | | | 1.16% | |
| Growth Opportunities Class R5 | | | 0.85% | | | | 0.86% | |
| Growth Opportunities Class Y | | | 0.76% | | | | 0.76% | |
| * | As of the Fund's current prospectus dated March 1, 2013. Actual expenses may be higher. Please see accompanying Financial Highlights for expense ratios for the year ended October 31, 2013. |
Gross expenses are the Fund's total annual operating expenses shown in the Fund's most recent prospectus. Net expenses are the Fund's total annual operating expenses as of the date of the Fund's most recent prospectus and reflect contractual expense waivers/reimbursements in instances when these reductions reduce the Fund's gross expenses. Certain contractual waivers/reimbursements remain in effect until February 28, 2014. Other contractual waivers/reimbursements remain in effect until February 28, 2014, and automatically renew for one-year terms unless terminated.
All investments are subject to risk including the possible loss of principal. For a discussion of the Fund’s risks, please see the Main Risks section. For more detailed information on the risks associated with an investment in the Fund, please see the prospectus.
| Portfolio Managers | | | | |
| Michael T. Carmen, CFA | | Stephen Mortimer | | Mario E. Abularach, CFA |
| Senior Vice President and Equity Portfolio Manager | | Senior Vice President and Equity Portfolio Manager | | Senior Vice President and Equity Research Analyst |
How did the Fund perform?
The Class A shares of The Hartford Growth Opportunities Fund returned 30.68%, before sales charge, for the twelve-month period ended October 31, 2013, outperforming the Fund’s benchmark, the Russell 3000 Growth Index, which returned 29.16% for the same period. The Fund underperformed the 31.20% average return of the Lipper Multi-Cap Growth Funds peer group, a group of funds with investment strategies similar to those of the Fund.
Why did the Fund perform this way?
Despite clear signs of political dysfunction in Washington, U.S. equities surged during the period (+27%) and reached a new all-time high during October (as measured by the S&P 500 Index). From its closing low on March 9, 2009, the S&P 500 ended October 2013 up over 159%. There have been a few hiccups during the rally, including in August 2013, where U.S. stocks suffered their worst month of the year amid heightened geopolitical risks stemming from the widening conflict in Syria. In September, the Federal Open Market Committee’s decision to leave the pace of its monthly asset purchases unchanged at $85 billion surprised many investors and contributed to the burgeoning risk appetites among many market participants. This continued highly accommodative monetary policy, along with solid earnings results and an upward trending housing market, overshadowed the 16-day government shutdown and near breach of the U.S. debt ceiling. Investors applauded the last-minute deal to end the fiscal stalemate in Washington; however, the U.S. Congress only extended the debt ceiling until February 7 and funded the government through January 15, so we may revisit the political dysfunction early in 2014. Investors also cheered the nomination of Janet Yellen to become the next head of the U.S. Federal Reserve (Fed); she is widely viewed as more likely to maintain the Fed’s current monetary policy than outgoing chairman Ben Bernanke.
All ten sectors in the Russell 3000 Growth Index posted positive returns during the period, with Health Care (+42%), Consumer Discretionary (+40%), and Industrials (+38%) gaining most. Information Technology (+18%) and Utilities (+19%) lagged on a relative basis.
Strong security selection was the primary driver of relative outperformance during the period. In particular, selection within Information Technology, Consumer Discretionary, and Financials more than offset negative stock selection in Industrials, Health Care, and Energy. Allocation among sectors, a result of our bottom-up stock selection process, also contributed to relative performance. Overweight allocations to the strong- performing Health Care and Consumer Discretionary sectors and an underweight to the weaker-performing Consumer Staples sector contributed most.
Top contributors to relative performance during the period were Apple (Information Technology), LinkedIn (Information Technology), and Facebook (Information Technology). Shares of consumer electronics company Apple fell when the company missed revenue expectations and issued disappointing earnings guidance. We were underweight in the stock, and the underweight contributed positively to relative performance. Shares of LinkedIn, a career networking website, rose due to better-than-expected earnings driven by the strong revenue growth in advertising and in the core talent solutions division. Shares of Facebook, a social networking website, rose after the company reported better-than-expected quarterly earnings driven by strong mobile ad revenues.
| The Hartford Growth Opportunities Fund |
| Manager Discussion – (continued) |
| October 31, 2013 (Unaudited) |
Priceline.com (Information Technology) was also among top contributors to absolute performance.
Among the top detractors from relative performance during the period were Teradata (Information Technology), VeriFone Systems (Information Technology), and Edwards Lifesciences (Health Care). Shares of Teradata, a U.S.-based provider of analytic data and business applications, underperformed due to weak results related to revenue softness in emerging markets. Shares of electronic payment solution provider VeriFone Systems fell due to weak macroeconomic conditions in Europe, lower revenue from the company’s Brazil-based business, decreased synergies from the VeriFone-Hypercom merger, and delays in customer projects, which caused the company to lower earnings estimates. Shares of Edwards Life Sciences, a medical device company specializing in heart valve technology and treatments for cardiovascular diseases, underperformed due management lowering its 2013 guidance primarily due to lower U.S. transcatheter heart valve (THV) sales, which is the growth driver of the business. Apple (Information Technology) was also among the top detractors from absolute performance. Although we were underweight relative to the benchmark, we did own the stock throughout the period, which detracted from absolute returns as the company’s share price declined.
Derivatives are not used in a significant manner in this Fund and did not have a material impact on performance during the period.
What is the outlook?
We are seeing more positives than negatives and more areas around the world where the rate of growth is getting better instead of getting worse for the first time in several years. We believe that housing continues to be an area of strength within the market. Although we expect further volatility among homebuilder and housing-related stocks, we believe we are at the beginning of a long cycle based on housing turnover, relatively old housing stock in the U.S., and housing start trends.
At the end of the period, the Fund was most overweight in the Consumer Discretionary, Health Care, and Financials sectors and most underweight in the Consumer Staples, Information Technology, and Energy sectors relative to the benchmark.
| Diversification by Sector |
| as of October 31, 2013 |
| Sector | | Percentage of
Net Assets | |
| Equity Securities | | | | |
| Consumer Discretionary | | | 25.4 | % |
| Consumer Staples | | | 5.8 | |
| Energy | | | 2.6 | |
| Financials | | | 7.4 | |
| Health Care | | | 18.0 | |
| Industrials | | | 12.7 | |
| Information Technology | | | 21.2 | |
| Materials | | | 4.4 | |
| Total | | | 97.5 | % |
| Purchased Options | | | 0.0 | |
| Short-Term Investments | | | 3.6 | |
| Other Assets and Liabilities | | | (1.1 | ) |
| Total | | | 100.0 | % |
A sector may be comprised of several industries. For Fund compliance purposes, the Fund may not use the same classification system and these sector classifications are used for reporting ease.
| The Hartford Growth Opportunities Fund |
| Schedule of Investments |
| October 31, 2013 |
| (000’s Omitted) |
| Shares or Principal Amount | | Market Value ╪ | |
| COMMON STOCKS - 97.5% | | | | |
| | | | | Capital Goods - 6.9% | | | | |
| | 148 | | | Cummins, Inc. | | $ | 18,853 | |
| | 921 | | | DigitalGlobe, Inc. ● | | | 29,297 | |
| | 1,520 | | | HD Supply Holdings, Inc. ● | | | 30,688 | |
| | 880 | | | KBR, Inc. | | | 30,405 | |
| | 3,149 | | | Lithium Technology Corp. ⌂●† | | | 13,812 | |
| | 821 | | | Owens Corning, Inc. ● | | | 29,493 | |
| | 336 | | | Pall Corp. | | | 27,079 | |
| | | | | | | | 179,627 | |
| | | | | Commercial and Professional Services - 3.9% | | | | |
| | 608 | | | ADT (The) Corp. | | | 26,386 | |
| | 415 | | | IHS, Inc. ● | | | 45,292 | |
| | 777 | | | Nielsen Holdings N.V. | | | 30,648 | |
| | | | | | | | 102,326 | |
| | | | | Consumer Durables and Apparel - 6.5% | | | | |
| | 554 | | | Lennar Corp. | | | 19,681 | |
| | 619 | | | Lululemon Athletica, Inc. ● | | | 42,754 | |
| | 1,203 | | | Pulte Group, Inc. | | | 21,228 | |
| | 219 | | | PVH Corp. | | | 27,267 | |
| | 10,586 | | | Samsonite International S.A. | | | 28,936 | |
| | 211 | | | Whirlpool Corp. | | | 30,769 | |
| | | | | | | | 170,635 | |
| | | | | Consumer Services - 6.5% | | | | |
| | 1,199 | | | Burger King Worldwide, Inc. | | | 25,388 | |
| | 1,381 | | | Diamond Resorts LLC ⌂●† | | | 24,423 | |
| | 884 | | | Melco PBL Entertainment Ltd. ADR ● | | | 29,298 | |
| | 182 | | | Panera Bread Co. Class A ● | | | 28,741 | |
| | 392 | | | Starwood Hotels & Resorts, Inc. | | | 28,823 | |
| | 517 | | | Wyndham Worldwide Corp. | | | 34,314 | |
| | | | | | | | 170,987 | |
| | | | | Diversified Financials - 3.9% | | | | |
| | 82 | | | BlackRock, Inc. | | | 24,646 | |
| | 473 | | | Citigroup, Inc. | | | 23,074 | |
| | 131 | | | IntercontinentalExchange, Inc. ● | | | 25,318 | |
| | 2,023 | | | Platform Acquisition ⌂●† | | | 21,576 | |
| | 640 | | | Silver Eagle Acquisition Corp. ●† | | | 6,466 | |
| | | | | | | | 101,080 | |
| | | | | Energy - 2.6% | | | | |
| | 196 | | | Anadarko Petroleum Corp. | | | 18,638 | |
| | 388 | | | Cabot Oil & Gas Corp. | | | 13,715 | |
| | 545 | | | Cobalt International Energy, Inc. ● | | | 12,661 | |
| | 117 | | | Pioneer Natural Resources Co. | | | 23,871 | |
| | | | | | | | 68,885 | |
| | | | | Food and Staples Retailing - 2.9% | | | | |
| | 374 | | | CVS Caremark Corp. ● | | | 23,269 | |
| | 332 | | | Walgreen Co. | | | 19,697 | |
| | 524 | | | Whole Foods Market, Inc. | | | 33,050 | |
| | | | | | | | 76,016 | |
| | | | | Food, Beverage and Tobacco - 1.9% | | | | |
| | 260 | | | Anheuser-Busch InBev N.V. ADR | | | 26,937 | |
| | 353 | | | Green Mountain Coffee Roasters, Inc. ● | | | 22,181 | |
| | | | | | | | 49,118 | |
| | | | | Health Care Equipment and Services - 3.9% | | | | |
| | 882 | | | Catamaran Corp. ● | | | 41,432 | |
| | 136 | | | Envision Healthcare Holdings ● | | | 3,937 | |
| | 1,302 | | | Hologic, Inc. ● | | | 29,156 | |
| | 356 | | | Universal Health Services, Inc. Class B | | | 28,702 | |
| | | | | | | | 103,227 | |
| | | | | Household and Personal Products - 1.0% | | | | |
| | 1,663 | | | Coty, Inc. ● | | | 25,575 | |
| | | | | | | | | |
| | | | | Insurance - 2.4% | | | | |
| | 824 | | | American International Group, Inc. | | | 42,563 | |
| | 673 | | | XL Group plc | | | 20,574 | |
| | | | | | | | 63,137 | |
| | | | | Materials - 4.4% | | | | |
| | 401 | | | Akzo Nobel N.V. ⌂ | | | 29,090 | |
| | 1,795 | | | Cemex S.A.B. de C.V. ADR ● | | | 18,993 | |
| | 368 | | | Monsanto Co. | | | 38,583 | |
| | 256 | | | Rock Tenn Co. Class A | | | 27,428 | |
| | | | | | | | 114,094 | |
| | | | | Media - 1.0% | | | | |
| | 759 | | | Twenty-First Century Fox, Inc. | | | 25,874 | |
| | | | | | | | | |
| | | | | Pharmaceuticals, Biotechnology and Life Sciences - 14.1% | | | | |
| | 265 | | | Actavis plc ● | | | 40,995 | |
| | 166 | | | Alnylam Pharmaceuticals, Inc. ● | | | 9,576 | |
| | 302 | | | Amgen, Inc. | | | 35,081 | |
| | 639 | | | AstraZeneca plc | | | 33,838 | |
| | 954 | | | Bristol-Myers Squibb Co. | | | 50,120 | |
| | 296 | | | Covance, Inc. ● | | | 26,448 | |
| | 673 | | | Eli Lilly & Co. | | | 33,511 | |
| | 664 | | | Forest Laboratories, Inc. ● | | | 31,235 | |
| | 390 | | | Gilead Sciences, Inc. ● | | | 27,701 | |
| | 169 | | | Illumina, Inc. ● | | | 15,763 | |
| | 826 | | | Merck & Co., Inc. | | | 37,260 | |
| | 97 | | | Regeneron Pharmaceuticals, Inc. ● | | | 27,894 | |
| | | | | | | | 369,422 | |
| | | | | Real Estate - 1.1% | | | | |
| | 1,518 | | | Host Hotels & Resorts, Inc. REIT | | | 28,165 | |
| | | | | | | | | |
| | | | | Retailing - 11.4% | | | | |
| | 72 | | | AutoZone, Inc. ● | | | 31,219 | |
| | 560 | | | Best Buy Co., Inc. | | | 23,964 | |
| | 678 | | | Dick's Sporting Goods, Inc. | | | 36,060 | |
| | 2,231 | | | Groupon, Inc. ● | | | 20,366 | |
| | 992 | | | Lowe's Co., Inc. | | | 49,368 | |
| | 81 | | | Netflix, Inc. ● | | | 26,064 | |
| | 53 | | | Priceline.com, Inc. ● | | | 55,389 | |
| | 181 | | | Ross Stores, Inc. | | | 14,038 | |
| | 526 | | | TripAdvisor, Inc. ● | | | 43,492 | |
| | | | | | | | 299,960 | |
| | | | | Semiconductors and Semiconductor Equipment - 1.5% | | | | |
| | 942 | | | NXP Semiconductors N.V. ● | | | 39,687 | |
| | | | | | | | | |
| | | | | Software and Services - 17.8% | | | | |
| | 1,841 | | | Activision Blizzard, Inc. | | | 30,628 | |
| | 745 | | | Akamai Technologies, Inc. ● | | | 33,312 | |
| | 1,213 | | | Autodesk, Inc. ● | | | 48,391 | |
| | 3,293 | | | Cadence Design Systems, Inc. ● | | | 42,704 | |
| | 339 | | | Cognizant Technology Solutions Corp. ● | | | 29,451 | |
| | 283 | | | Concur Technologies, Inc. ● | | | 29,619 | |
| | 561 | | | eBay, Inc. ● | | | 29,562 | |
| | 933 | | | Facebook, Inc. ● | | | 46,913 | |
| | 469 | | | IAC/InterActiveCorp. | | | 25,058 | |
| | 126 | | | LinkedIn Corp. Class A ● | | | 28,200 | |
| | 5 | | | NetSuite, Inc. ● | | | 469 | |
| | 264 | | | ServiceNow, Inc. ● | | | 14,406 | |
The accompanying notes are an integral part of these financial statements.
| The Hartford Growth Opportunities Fund |
| Schedule of Investments – (continued) |
| October 31, 2013 |
| (000’s Omitted) |
| Shares or Principal Amount | | Market Value ╪ | |
| COMMON STOCKS - 97.5% - (continued) | | | | |
| | | | | Software and Services - 17.8% - (continued) | | | | |
| | 208 | | | Splunk, Inc. ● | | $ | 13,066 | |
| | 1,185 | | | Symantec Corp. | | | 26,953 | |
| | 645 | | | Teradata Corp. ● | | | 28,421 | |
| | 1,002 | | | Yahoo!, Inc. ● | | | 32,994 | |
| | 160 | | | Yandex N.V. ● | | | 5,901 | |
| | | | | | | | 466,048 | |
| | | | | Technology Hardware and Equipment - 1.9% | | | | |
| | 49 | | | Apple, Inc. ● | | | 25,575 | |
| | 558 | | | Palo Alto Networks, Inc. ● | | | 23,539 | |
| | | | | | | | 49,114 | |
| | | | | Transportation - 1.9% | | | | |
| | 584 | | | Expeditors International of Washington, Inc. | | | 26,445 | |
| | 1,045 | | | Hertz Global Holdings, Inc. ● | | | 23,988 | |
| | | | | | | | 50,433 | |
| | | | | Total common stocks | | | | |
| | | | | (cost $2,168,093) | | $ | 2,553,410 | |
| | | | | | | | | |
| WARRANTS - 0.0% | | | | |
| | | | | Diversified Financials - 0.0% | | | | |
| | 867 | | | Platform Acquisition ⌂† | | $ | 87 | |
| | | | | | | | | |
| | | | | Total warrants | | | | |
| | | | | (cost $9) | | $ | 87 | |
| Contracts | | Market Value ╪ | |
| PUT OPTIONS PURCHASED - 0.0% | |
| Equity Contracts - 0.0% |
| | | | | Cognizant Technology Solutions Corp. | | | | |
| | | | | Expiration: 01/18/2014, Exercise Price: | | | | |
| | 3 | | | $70.00 | | $ | 237 | |
| | | | | | | | | |
| | | | | Total put options purchased | | | | |
| | | | | (cost $1,733) | | $ | 237 | |
| | | | | | | | | |
| | | | | Total long-term investments | | | | |
| | | | | (cost $2,169,835) | | $ | 2,553,734 | |
| Shares or Principal Amount | | | | | Market Value ╪ | |
| SHORT-TERM INVESTMENTS - 3.6% | | | | | | |
| Repurchase Agreements - 3.6% | | | | | | | | |
| | | | | Bank of America Merrill Lynch TriParty
Repurchase Agreement (maturing on
11/01/2013 in the amount of $7,680,
collateralized by FHLMC 4.50%, 2040,
FNMA 1.92% - 4.00%, 2036 - 2043, value
of $7,834) | | | | | | | | |
| $ | 7,680 | | | 0.10%, 10/31/2013 | | | | | | $ | 7,680 | |
| | | | | Bank of Montreal TriParty Repurchase
Agreement (maturing on 11/01/2013 in the
amount of $2,657, collateralized by
FHLMC 4.00%, 2043, FNMA 2.00% -
6.00%, 2020 - 2043, GNMA 3.00%, 2043,
value of $2,710) | | | | | | | | |
| | 2,657 | | | 0.09%, 10/31/2013 | | | | | | | 2,657 | |
| | | | Barclays Capital TriParty Repurchase
Agreement (maturing on 11/01/2013 in the
amount of $12,320, collateralized by U.S.
Treasury Note 0.25% - 4.00%, 2015, value
of $12,566) | | | | | | |
| | 12,320 | | | 0.08%, 10/31/2013 | | | | | | | 12,320 | |
| | | | | Citigroup Global Markets, Inc. TriParty
Repurchase Agreement (maturing on
11/01/2013 in the amount of $34,935,
collateralized by U.S. Treasury Bill 0.01%
- 0.35%, 2013 - 2014, U.S. Treasury Bond
2.75% - 8.75%, 2017 - 2042, U.S. Treasury
Note 0.25% - 4.75%, 2013 - 2022, value
of $35,634) | | | | | | | | |
| | 34,935 | | | 0.09%, 10/31/2013 | | | | | | | 34,935 | |
| | | | | Deutsche Bank Securities TriParty
Repurchase Agreement (maturing on
11/01/2013 in the amount of $14,085,
collateralized by FHLMC 2.50% - 7.50%,
2026 - 2043, FNMA 3.00% - 7.00%, 2026
- 2043, GNMA 2.67% - 5.00%, 2024 -
2048, value of $14,367) | | | | | | | | |
| | 14,085 | | | 0.12%, 10/31/2013 | | | | | | | 14,085 | |
| | | | | RBS Securities, Inc. TriParty Repurchase
Agreement (maturing on 11/01/2013 in the
amount of $8,314, collateralized by U.S.
Treasury Note 0.75% - 2.63%, 2014 -
2021, value of $8,480) | | | | | | | | |
| | 8,314 | | | 0.09%, 10/31/2013 | | | | | | | 8,314 | |
| | | | | TD Securities TriParty Repurchase
Agreement (maturing on 11/01/2013 in the
amount of $14,633, collateralized by
FNMA 2.50% - 4.00%, 2027 - 2042,
GNMA 2.50%, 2043, value of $14,953) | | | | | | | | |
| | 14,633 | | | 0.10%, 10/31/2013 | | | | | | | 14,633 | |
| | | | | UBS Securities, Inc. Repurchase Agreement
(maturing on 11/01/2013 in the amount of
$73, collateralized by U.S. Treasury Note
0.63%, 2017, value of $74) | | | | | | | | |
| | 73 | | | 0.09%, 10/31/2013 | | | | | | | 73 | |
| | | | | | | | | | | | 94,697 | |
| | | | | Total short-term investments | | | | | | | | |
| | | | | (cost $94,697) | | | | | | $ | 94,697 | |
| | | | | | | | | | | | | |
| | | | | Total investments | | | | | | | | |
| | | | | (cost $2,264,532) ▲ | | | 101.1 | % | | $ | 2,648,431 | |
| | | | | Other assets and liabilities | | | (1.1 | )% | | | (29,034 | ) |
| | | | | Total net assets | | | 100.0 | % | | $ | 2,619,397 | |
The accompanying notes are an integral part of these financial statements.
| Note: | Percentage of investments as shown is the ratio of the total market value to total net assets. |
Prices of foreign equities that are principally traded on certain foreign markets may be adjusted daily pursuant to a fair value pricing service approved by the Board of Directors in order to reflect an adjustment for factors occurring after the close of certain foreign markets but before the close of the New York Stock Exchange.
| ▲ | At October 31, 2013, the cost of securities for federal income tax purposes was $2,259,487 and the aggregate gross unrealized appreciation and depreciation based on that cost were: |
| | | | |
| Unrealized Appreciation | | $ | 431,216 | |
| Unrealized Depreciation | | | (42,272 | ) |
| Net Unrealized Appreciation | | $ | 388,944 | |
| † | These securities were valued in good faith at fair value as determined under policies and procedures established by and under the supervision of the Company's Board of Directors. At October 31, 2013, the aggregate value of these securities was $66,364, which represents 2.5% of total net assets. This amount excludes securities that are principally traded in certain foreign markets and whose prices are adjusted pursuant to a third party pricing service methodology approved by the Board of Directors. |
| ⌂ | The following securities are considered illiquid. Illiquid securities are often purchased in private placement transactions, are often not registered under the Securities Act of 1933 and may have contractual restrictions on resale. A security may also be considered illiquid if the security lacks a readily available market or if its valuation has not changed for a certain period of time. |
| Period Acquired | | Shares/ Par | | | Security | | Cost Basis | |
| 09/2013 | | | 401 | | | Akzo Nobel N.V. | | $ | 26,214 | |
| 07/2011 | | | 1,381 | | | Diamond Resorts LLC | | | 17,340 | |
| 08/2013 | | | 3,149 | | | Lithium Technology Corp. | | | 15,347 | |
| 05/2013 - 10/2013 | | | 2,023 | | | Platform Acquisition | | | 20,367 | |
| 05/2013 | | | 867 | | | Platform Acquisition Warrants | | | 9 | |
At October 31, 2013, the aggregate value of these securities was $88,988, which represents 3.4% of total net assets.
| ╬ | All principal or contract amounts are in U.S. dollars unless otherwise indicated. |
| ╪ | See Significant Accounting Policies of accompanying Notes to Financial Statements regarding valuation of securities. |
| GLOSSARY: (abbreviations used in preceding Schedule of Investments) |
| |
| Other Abbreviations: |
| ADR | American Depositary Receipt |
| FHLMC | Federal Home Loan Mortgage Corp. |
| FNMA | Federal National Mortgage Association |
| GNMA | Government National Mortgage Association |
| REIT | Real Estate Investment Trust |
The accompanying notes are an integral part of these financial statements.
| The Hartford Growth Opportunities Fund |
| Investment Valuation Hierarchy Level Summary |
| October 31, 2013 |
| (000’s Omitted) |
| | | Total | | | Level 1 ♦ | | | Level 2 ♦ | | | Level 3 | |
| Assets: | | | | | | | | | | | | | | | | |
| Common Stocks ‡ | | $ | 2,553,410 | | | $ | 2,401,735 | | | $ | 91,864 | | | $ | 59,811 | |
| Put Options Purchased | | | 237 | | | | 237 | | | | – | | | | – | |
| Warrants | | | 87 | | | | – | | | | – | | | | 87 | |
| Short-Term Investments | | | 94,697 | | | | – | | | | 94,697 | | | | – | |
| Total | | $ | 2,648,431 | | | $ | 2,401,972 | | | $ | 186,561 | | | $ | 59,898 | |
| ♦ | For the year ended October 31, 2013, there were no transfers between Level 1 and Level 2. |
| ‡ | The Fund has all or primarily all of the equity securities categorized in a particular level. Refer to the Schedule of Investments for further industry breakout. |
Following is a reconciliation of Level 3 assets for which significant unobservable inputs were used to determine fair value:
| | | Balance as
of
October
31, 2012 | | | Realized
Gain
(Loss) | | | Change in
Unrealized
Appreciation
(Depreciation) | | | Net
Amortization | | | Purchases | | | Sales | | | Transfers
Into
Level 3 | | | Transfers
Out of
Level 3 | | | Balance as
of
October
31, 2013 | |
| Assets: | | | | | | | | | | | | | | | | | | | | | | | | | | | | | | | | | | | | |
| Common Stocks | | $ | 19,819 | | | $ | (26,988 | ) | | $ | 31,267 | * | | $ | — | | | $ | 35,713 | | | $ | — | | | $ | — | | | $ | — | | | $ | 59,811 | |
| Warrants | | | — | | | | — | | | | 78 | † | | | — | | | | 18 | | | | (9 | ) | | | — | | | | — | | | | 87 | |
| Total | | $ | 19,819 | | | $ | (26,988 | ) | | $ | 31,345 | | | $ | — | | | $ | 35,731 | | | $ | (9 | ) | | $ | — | | | $ | — | | | $ | 59,898 | |
| * | Change in unrealized appreciation (depreciation) in the current period relating to assets still held at October 31, 2013 was $4,279. |
| † | Change in unrealized appreciation (depreciation) in the current period relating to assets still held at October 31, 2013 was $78. |
| Note: | For purposes of reporting transfers between different hierarchy levels, both transfers in and out of each level, as applicable, are shown as if they occurred at the beginning of the period. |
The accompanying notes are an integral part of these financial statements.
| The Hartford Growth Opportunities Fund |
| Statement of Assets and Liabilities |
| October 31, 2013 |
| (000’s Omitted) |
| Assets: | | | | |
| Investments in securities, at market value (cost $2,264,532) | | $ | 2,648,431 | |
| Cash | | | — | |
| Foreign currency on deposit with custodian (cost $–) | | | — | |
| Receivables: | | | | |
| Investment securities sold | | | 8,189 | |
| Fund shares sold | | | 9,078 | |
| Dividends and interest | | | 882 | |
| Other assets | | | 116 | |
| Total assets | | | 2,666,696 | |
| Liabilities: | | | | |
| Payables: | | | | |
| Investment securities purchased | | | 43,082 | |
| Fund shares redeemed | | | 3,299 | |
| Investment management fees | | | 358 | |
| Administrative fees | | | 3 | |
| Distribution fees | | | 91 | |
| Accrued expenses | | | 466 | |
| Total liabilities | | | 47,299 | |
| Net assets | | $ | 2,619,397 | |
| Summary of Net Assets: | | | | |
| Capital stock and paid-in-capital | | $ | 2,132,727 | |
| Distributions in excess of net investment income | | | (5,357 | ) |
| Accumulated net realized gain | | | 108,130 | |
| Unrealized appreciation of investments and the translation of assets and liabilities denominated in foreign currency | | | 383,897 | |
| Net assets | | $ | 2,619,397 | |
| | | | | |
| Shares authorized | | | 23,750,000 | |
| Par value | | $ | 0.0001 | |
| Class A: Net asset value per share/Maximum offering price per share | | | $38.68/$40.93 | |
| Shares outstanding | | | 25,405 | |
| Net assets | | $ | 982,699 | |
| Class B: Net asset value per share | | $ | 30.38 | |
| Shares outstanding | | | 800 | |
| Net assets | | $ | 24,296 | |
| Class C: Net asset value per share | | $ | 30.51 | |
| Shares outstanding | | | 5,781 | |
| Net assets | | $ | 176,392 | |
| Class I: Net asset value per share | | $ | 39.49 | |
| Shares outstanding | | | 32,632 | |
| Net assets | | $ | 1,288,778 | |
| Class R3: Net asset value per share | | $ | 39.21 | |
| Shares outstanding | | | 636 | |
| Net assets | | $ | 24,924 | |
| Class R4: Net asset value per share | | $ | 40.06 | |
| Shares outstanding | | | 1,107 | |
| Net assets | | $ | 44,353 | |
| Class R5: Net asset value per share | | $ | 40.76 | |
| Shares outstanding | | | 497 | |
| Net assets | | $ | 20,243 | |
| Class Y: Net asset value per share | | $ | 41.02 | |
| Shares outstanding | | | 1,407 | |
| Net assets | | $ | 57,712 | |
The accompanying notes are an integral part of these financial statements.
| The Hartford Growth Opportunities Fund |
| Statement of Operations |
| For the Year Ended October 31, 2013 |
| (000’s Omitted) |
| Investment Income: | | | | |
| Dividends | | $ | 20,214 | |
| Interest | | | 34 | |
| Less: Foreign tax withheld | | | (362 | ) |
| Total investment income | | | 19,886 | |
| | | | | |
| Expenses: | | | | |
| Investment management fees | | | 15,961 | |
| Administrative services fees | | | | |
| Class R3 | | | 42 | |
| Class R4 | | | 62 | |
| Class R5 | | | 18 | |
| Transfer agent fees | | | | |
| Class A | | | 1,625 | |
| Class B | | | 86 | |
| Class C | | | 226 | |
| Class I | | | 1,825 | |
| Class R3 | | | 3 | |
| Class R4 | | | 1 | |
| Class R5 | | | — | |
| Class Y | | | 1 | |
| Distribution fees | | | | |
| Class A | | | 2,158 | |
| Class B | | | 240 | |
| Class C | | | 1,480 | |
| Class R3 | | | 104 | |
| Class R4 | | | 103 | |
| Custodian fees | | | 16 | |
| Accounting services fees | | | 269 | |
| Registration and filing fees | | | 194 | |
| Board of Directors' fees | | | 49 | |
| Audit fees | | | 23 | |
| Other expenses | | | 355 | |
| Total expenses (before waivers and fees paid indirectly) | | | 24,841 | |
| Expense waivers | | | (26 | ) |
| Transfer agent fee waivers | | | (14 | ) |
| Commission recapture | | | (124 | ) |
| Custodian fee offset | | | — | |
| Total waivers and fees paid indirectly | | | (164 | ) |
| Total expenses, net | | | 24,677 | |
| Net Investment Loss | | | (4,791 | ) |
| Net Realized Gain on Investments and Foreign Currency Transactions: | | | | |
| Net realized gain on investments | | | 395,313 | |
| Net realized gain on foreign currency contracts | | | 418 | |
| Net realized loss on other foreign currency transactions | | | (103 | ) |
| Net Realized Gain on Investments and Foreign Currency Transactions | | | 395,628 | |
| Net Changes in Unrealized Appreciation of Investments, Other Financial Instruments and Foreign Currency Transactions: | | | | |
| Net unrealized appreciation of investments | | | 207,391 | |
| Net unrealized depreciation of purchased options | | | (1,496 | ) |
| Net unrealized depreciation on translation of other assets and liabilities in foreign currencies | | | (2 | ) |
| Net Changes in Unrealized Appreciation of Investments, Other Financial Instruments and Foreign Currency Transactions | | | 205,893 | |
| Net Gain on Investments, Other Financial Instruments and Foreign Currency Transactions | | | 601,521 | |
| Net Increase in Net Assets Resulting from Operations | | $ | 596,730 | |
The accompanying notes are an integral part of these financial statements.
| The Hartford Growth Opportunities Fund |
| Statement of Changes in Net Assets |
| |
| (000’s Omitted) |
| | | For the
Year Ended
October 31, 2013 | | | For the
Year Ended
October 31, 2012 | |
| Operations: | | | | | | | | |
| Net investment loss | | $ | (4,791 | ) | | $ | (8,550 | ) |
| Net realized gain on investments and foreign currency transactions | | | 395,628 | | | | 146,825 | |
| Net unrealized appreciation of investments, other financial instruments and foreign currency transactions | | | 205,893 | | | | 98,389 | |
| Net Increase in Net Assets Resulting from Operations | | | 596,730 | | | | 236,664 | |
| Capital Share Transactions: | | | | | | | | |
| Class A | | | 4,120 | * | | | (101,986 | ) |
| Class B | | | (5,190 | )* | | | (7,447 | ) |
| Class C | | | 15,469 | * | | | (19,411 | ) |
| Class I | | | 108,570 | * | | | (2,175 | ) |
| Class R3 | | | 2,216 | * | | | 1,891 | |
| Class R4 | | | (5,137 | )* | | | (2,805 | ) |
| Class R5 | | | 595 | * | | | (1,074 | ) |
| Class Y | | | (4,471 | )* | | | (60,788 | ) |
| Net increase (decrease) from capital share transactions | | | 116,172 | | | | (193,795 | ) |
| Net Increase in Net Assets | | | 712,902 | | | | 42,869 | |
| Net Assets: | | | | | | | | |
| Beginning of period | | | 1,906,495 | | | | 1,863,626 | |
| End of period | | $ | 2,619,397 | | | $ | 1,906,495 | |
| Undistributed (distribution in excess of) net investment income | | $ | (5,357 | ) | | $ | (7,896 | ) |
| * | Includes merger activity (See Fund Merger in accompanying Notes to Financial Statements). |
The accompanying notes are an integral part of these financial statements.
| The Hartford Growth Opportunities Fund |
| Notes to Financial Statements |
| October 31, 2013 |
| (000’s Omitted) |
The Hartford Mutual Funds II, Inc. (“Company”) is an open-end management investment company comprised of five portfolios. Financial statements for The Hartford Growth Opportunities Fund (the “Fund”), a series of the Company, are included in this report.
The Company is organized under the laws of the State of Maryland and is registered with the Securities and Exchange Commission (“SEC”) under the Investment Company Act of 1940, as amended (“1940 Act”). The Fund is a diversified open-end management investment company.
Class A shares are sold with a front-end sales charge of up to 5.50%. Class B shares were sold with a contingent deferred sales charge which is assessed on the lesser of the per share net asset value (“NAV”) of the shares at the time of redemption or the original purchase price, and declines from up to 5.00% to zero depending on the period of time the shares are held (see note below regarding the closing of Class B shares). Class C shares are sold with a contingent deferred sales charge of up to 1.00% on shares redeemed within twelve months of purchase. Class I shares are sold without sales charges to certain eligible investors primarily through advisory fee-based wrap programs. Class R3, R4 and R5 shares, which are offered to employer-sponsored retirement plans, and Class Y shares, which are sold to certain eligible institutional investors, are sold without a sales charge. All classes of shares have identical voting, redemption, dividend, liquidation and other rights and the same terms and conditions, with the exceptions that each class may have different expenses, which may affect performance, and that Class B shares automatically convert to Class A shares after 8 years.
No new or additional investments are allowed in Class B shares of the Fund (including investments through any systematic investment plan). Existing shareholders of Class B shares may continue to hold their Class B shares, exchange their Class B shares for Class B shares of another Hartford Fund (as permitted by existing exchange privileges), or redeem their Class B shares as described in the Fund’s prospectus. Reinstatement privileges with respect to Class B shares will continue under the current policy. For investors electing to reinvest capital gains and dividends, any such capital gains or dividends on Class B shares will continue to be reinvested in Class B shares of the Fund. All Class B share attributes, including the 12b-1 fee, contingent deferred sales charge schedule, and conversion to Class A shares, remain unchanged.
| 2. | Significant Accounting Policies: |
The following is a summary of significant accounting policies of the Fund in the preparation of its financial statements, which are in accordance with United States Generally Accepted Accounting Principles (“U.S. GAAP”). The preparation of financial statements in accordance with U.S. GAAP may require management to make estimates and assumptions that affect the reported amounts of assets and liabilities and disclosure of contingent assets and liabilities at the date of the financial statements and the reported amounts of increases and decreases in net assets from operations during the reporting period. Actual results could differ from those estimates.
| a) | Determination of Net Asset Value – The NAV of each class of the Fund’s shares is determined as of the close of regular trading (normally 4:00 p.m. Eastern Time) (the “NYSE Close”) on each day that the New York Stock Exchange (the “Exchange”) is open (“Valuation Date”). Information that becomes known to the Fund after the NAV has been calculated on a particular day will not generally be used to retroactively adjust the NAV determined earlier that day. |
| b) | Investment Valuation and Fair Value Measurements – For purposes of calculating the NAV, portfolio investments and other assets held by the Fund's portfolio for which market quotes are readily available are valued at market value. Market value is generally determined on the basis of last reported sales prices or official close price. If no sales are reported, market value is based on quotes obtained from a quotation reporting system, established market makers, or independent pricing services. If market prices are not readily available or are deemed unreliable, the Fund will use the fair value of the investment as determined in good faith under policies and procedures established by and under the supervision of the |
Company’s Board of Directors. Market quotes are considered not readily available where there is an absence of current or reliable market-based data (e.g., trade information or indicative market quotes), including where events occur after the close of the relevant market, but prior to the NYSE Close, that materially affect the values of the Fund’s portfolio investments or assets. In addition, market quotes are considered not readily available when, due to extraordinary circumstances, the exchanges or markets on which the investments trade do not open for trading for the entire day and no other market prices are available. In addition, prices of foreign equities that are principally traded on certain foreign markets may be adjusted daily pursuant to a fair value pricing service approved by the Board of Directors in order to reflect an adjustment for the factors occurring after the close of certain foreign markets but before the NYSE Close. Investments that are primarily traded on foreign markets may trade on days that are not business days of the Fund. The value of the foreign investments in which the Fund invests may change on days when a shareholder will not be able to purchase or redeem shares of the Fund. Fair value pricing is subjective in nature and the use of fair value pricing by the Fund may cause the NAV of its shares to differ significantly from the NAV that would have been calculated using market prices at the close of the exchange on which a portfolio investment is primarily traded. There can be no assurance that the Fund could obtain the fair market value assigned to an investment if the Fund were to sell the investment at approximately the time at which the Fund determines its NAV.
Investments valued in currencies other than U.S. dollars are converted to U.S. dollars using exchange rates obtained from independent pricing services for calculation of the NAV. As a result, the NAV of the Fund’s shares may be affected by changes in the value of currencies in relation to the U.S. dollar. The value of investments traded in markets outside the United States or denominated in currencies other than the U.S. dollar may be affected significantly on a day that the NYSE is closed and the market value may change on days when an investor is not able to purchase, redeem or exchange shares of the Fund.
Foreign currency contracts represent agreements to exchange currencies on specific future dates at predetermined rates. Foreign currency contracts are valued using foreign currency exchange rates and forward rates as provided by an independent pricing service on the Valuation Date.
Financial instruments for which prices are not available from an independent pricing service may be valued using market quotations obtained from one or more dealers that make markets in the respective financial instrument in accordance with procedures established by the Company’s Board of Directors.
Investments in open-end mutual funds are valued at the respective NAV of each open-end mutual fund on the Valuation Date.
U.S. GAAP defines fair value as the price that the Fund would receive to sell an asset or pay to transfer a liability in an orderly transaction between market participants. The U.S. GAAP fair value measurement standards require disclosure of a fair value hierarchy for each major category of assets and liabilities. Various inputs are used in determining the fair value of the Fund’s investments. These inputs are summarized into three broad hierarchy levels. This hierarchy is based on whether the valuation inputs are observable or unobservable. These levels are:
| · | Level 1 – Quoted prices in active markets for identical investments. Level 1 may include exchange traded instruments, such as domestic equities, some foreign equities, options, futures, mutual funds, exchange traded funds, rights and warrants. |
| · | Level 2 – Observable inputs other than Level 1 prices, such as quoted prices for similar investments; quoted prices in markets that are not active; or other inputs that are observable or can be corroborated by observable market data. Level 2 may include debt investments that are traded less frequently than exchange traded instruments and which are valued using independent pricing services; foreign equities, which are principally traded on certain foreign markets and are adjusted daily pursuant to a fair value pricing service in order to reflect an adjustment for the factors occurring after the close of certain foreign markets but before the NYSE |
| The Hartford Growth Opportunities Fund |
| Notes to Financial Statements – (continued) |
| October 31, 2013 |
| (000’s Omitted) |
Close; senior floating rate interests, which are valued using an aggregate of dealer bids; and short-term investments, which are valued at amortized cost.
| · | Level 3 – Significant unobservable inputs that are supported by limited or no market activity. Level 3 may include financial instruments whose values are determined using indicative market quotes or require significant management judgment or estimation. These unobservable valuation inputs may include estimates for current yields, maturity/duration, prepayment speed, and indicative market quotes for comparable investments along with other assumptions relating to credit quality, collateral value, complexity of the investment structure, general market conditions and liquidity. This category may include investments where trading has been halted or there are certain restrictions on trading. While these investments are priced using unobservable inputs, the valuation of these investments reflects the best available data and management believes the prices are a reasonable representation of exit price. For more information on specific valuation techniques and unobservable inputs, please see table below titled "Quantitative Information about Level 3 Fair Value Measurements". |
The Board of Directors of the Company generally reviews and approves the “Procedures for Valuation of Portfolio Securities” on an annual basis. These procedures define how investments are to be valued, including the formation and activities of a Valuation Committee. The Valuation Committee is responsible for determining in good faith the fair value of investments when the value cannot be obtained from primary pricing services or alternative sources or if the valuation of an investment as provided by the primary pricing service or alternative source is believed not to reflect the investment’s fair value as of the Valuation Date. Voting members of the Valuation Committee include the Fund’s Treasurer or designee and a Vice President of the investment manager or designee. An Assistant Vice President of the Fund with legal expertise or designee is also included on the Valuation Committee as a non-voting advisory member. In addition, the Fund’s Chief Compliance Officer shall designate a member of the compliance group to attend Valuation Committee meetings as a non-voting resource, to monitor for and provide guidance with respect to compliance with these procedures. Two members of the Valuation Committee or their designees, representing different departments, shall constitute a quorum for purposes of permitting the Valuation Committee to take action. The Valuation Committee will consider all relevant factors in determining an investment’s fair value, and may seek the advice of the Fund’s sub-adviser, knowledgeable brokers, and legal counsel in making such determination. The Valuation Committee reports to the Audit Committee of the Company’s Board of Directors. The Audit Committee receives quarterly written reports which include details of all fair-valued investments, including the reason for the fair valuation, and an indication, when possible, of the accuracy of the valuation by disclosing the next available reliable public price quotation or the disposition price of such investments (the “look-back” test). The Board of Directors then must consider for ratification all of the fair value determinations made during the previous quarter.
Valuation levels are not necessarily indicative of the risk associated with investing in such investments. Individual investments within any of the above mentioned asset classes may be assigned a different hierarchical level than those presented above, as individual circumstances dictate.
For additional information, refer to the Investment Valuation Hierarchy Level Summary and the Level 3 roll-forward reconciliation, if applicable, which follow the Schedule of Investments.
Quantitative Information about Level 3 Fair Value Measurements:
| Security Type/Valuation Technique | | Unobservable Input (1) | | Quantitative Input | | Fair Value at October
31, 2013 | |
| Common Stocks: | | | | | | | | |
| Cost | | Recent trade price | | $4.39, 8/15/2013 | | $ | 13,812 | |
| Intrinsic value | | Illiquidity discount | | 10% | | | 21,576 | |
| Parity to common stock | | Illiquidity discount | | 10% adjusted for restriction period | | | 24,423 | |
| Warrants: | | | | | | | | |
| Intrinsic value | | Illiquidity discount | | 10% | | | 87 | |
| Total | | | | | | $ | 59,898 | |
(1) Significant changes to any observable inputs may result in a significant change to the fair value.
| c) | Investment Transactions and Investment Income – Investment transactions are recorded as of the trade date (the date the order to buy or sell is executed) for financial reporting purposes. Investments purchased or sold on a when-issued or delayed-delivery basis may be settled a month or more after the trade date. Realized gains and losses are determined on the basis of identified cost. |
Dividend income from domestic securities is accrued on the ex-dividend date. In general, dividend income from foreign securities is recorded on the ex-date; however, dividend notifications in certain foreign jurisdictions may not be available in a timely manner and as a result, the Fund will record the dividend as soon as the relevant details (i.e., rate per share, payment date, shareholders of record, etc.) are publicly available. Interest income, including amortization of premium and accretion of discounts, is accrued on a daily basis.
| d) | Foreign Currency Transactions – Assets and liabilities denominated in currencies other than U.S. dollars are translated into U.S. dollars at the exchange rates in effect on the valuation date. Purchases and sales of investments, income and expenses are translated into U.S. dollars at the exchange rates on the dates of such transactions. |
The Fund does not isolate that portion of portfolio investment valuation resulting from fluctuations in the foreign currency exchange rates from the fluctuations arising from changes in the market prices of investments held. Exchange rate fluctuations are included with the net realized and unrealized gain or loss on investments in the accompanying financial statements.
Net realized foreign exchange gains or losses arise from sales of foreign currencies and the difference between asset and liability amounts initially stated in foreign currencies and the U.S. dollar value of the amounts actually received or paid. Net unrealized foreign exchange gains or losses arise from changes in the value of other assets and liabilities at the end of the reporting period, resulting from changes in the exchange rates.
| e) | Joint Trading Account – The Fund may invest cash balances into a joint trading account that may be invested in one or more repurchase agreements. |
| f) | Fund Share Valuation and Dividend Distributions to Shareholders – Orders for the Fund’s shares are executed in accordance with the investment instructions of the shareholders. The NAV of the Fund’s shares is determined as of the close of business on each business day of the Exchange. The NAV is determined separately for each class of shares of the Fund by dividing the Fund’s net assets attributable to that class by the number of shares of the class outstanding. Each class of shares offered by the Fund has equal rights as to assets and voting privileges (except that shareholders of a class have exclusive voting rights regarding any matter relating solely to that class of shares). Income and non-class specific expenses are allocated daily to each class on the basis of the relative net assets of the class. Realized and unrealized gains and losses are allocated daily based on the relative net assets of each class of shares of the Fund. |
| The Hartford Growth Opportunities Fund |
| Notes to Financial Statements – (continued) |
| October 31, 2013 |
| (000’s Omitted) |
Orders for the purchase of the Fund’s shares received prior to the close of the Exchange on any day the Exchange is open for business are priced at the NAV determined as of the close of the Exchange. Orders received after the close of the Exchange, or on a day on which the Exchange and/or the Fund is not open for business, are priced at the next determined NAV.
Dividends are declared pursuant to a policy adopted by the Company’s Board of Directors based upon the investment performance of the Fund. The policy of the Fund is to pay dividends from net investment income and realized gains, if any, at least once a year.
Distributions from net investment income, net realized gains and capital are determined in accordance with federal income tax regulations, which may differ from U.S. GAAP with respect to character and timing. These differences may include but are not limited to losses deferred due to wash sale adjustments, foreign currency gains and losses, adjustments related to Passive Foreign Investment Companies (“PFICs”), Real Estate Investment Trusts (“REITs”), Regulated Investment Companies (“RICs”), certain derivatives and partnerships. Permanent book and federal income tax basis differences relating to shareholder distributions will result in reclassifications to certain of the Fund’s capital accounts (see Federal Income Taxes: Reclassification of Capital Accounts note).
| 3. | Securities and Other Investments: |
| a) | Repurchase Agreements – A repurchase agreement is an agreement by which a counterparty agrees to sell an investment and agrees to repurchase the investment sold from the buyer at a mutually agreed upon time and price. During the period of the repurchase agreement, the counterparty will deposit cash and or securities in a third party custodial account to serve as collateral. At the time the Fund enters into a repurchase agreement, the value of the underlying collateral, including accrued interest, will be equal to or exceed the value of the repurchase agreement. Repurchase agreements expose the Fund to counterparty risk - that is, the risk that the counterparty will not fulfill its obligations. To minimize counterparty risk, the investments that serve to collateralize the repurchase agreement are held by the Fund’s custodian in book entry or physical form in the custodial account of the Fund or in a third party custodial account. Repurchase agreements are valued at cost plus accrued interest, which approximates fair value. The Fund, as shown on the Schedule of Investments, had outstanding repurchase agreements as of October 31, 2013. |
| b) | Illiquid and Restricted Investments – The Fund is permitted to invest up to 15% of its net assets in illiquid investments. Illiquid investments are those that may not be sold or disposed of in the ordinary course of business within seven days, at approximately the price used to determine the Fund’s NAV. The Fund may not be able to sell illiquid investments when its sub-adviser considers it desirable to do so or may have to sell such investments at a price that is lower than the price that could be obtained if the investments were more liquid. A sale of illiquid investments may require more time and may result in higher dealer discounts and other selling expenses than does the sale of those that are liquid. Illiquid investments also may be more difficult to value due to the unavailability of reliable market quotations for such investments, and an investment in them may have an adverse impact on the Fund’s NAV. The Fund may also purchase certain restricted investments that can only be resold to certain qualified investors and may be determined to be liquid pursuant to policies and guidelines established by the Company’s Board of Directors. The Fund, as shown on the Schedule of Investments, had illiquid and/or restricted investments as of October 31, 2013. |
| c) | Investments Purchased on a When-Issued or Delayed-Delivery Basis – Delivery and payment for investments that have been purchased by the Fund on a forward commitment, or when-issued or delayed-delivery basis, take place beyond the customary settlement period. A fund may dispose of or renegotiate a delayed-delivery transaction after it is entered into, and may sell delayed-delivery investments before they are delivered, which may result in a realized gain or loss. During this period, such investments are subject to market fluctuations, and the Fund identifies investments segregated in its records with a value at least equal to the amount of the commitment. As of October 31, 2013, the Fund had no outstanding when-issued or delayed-delivery investments. |
| 4. | Financial Derivative Instruments: |
The following disclosures contain information on how and why the Fund uses derivative instruments, the credit-risk-related contingent features in certain derivative instruments, and how derivative instruments affect the Fund’s financial position and results of operations. The location and fair value amounts of these instruments on the Statement of Assets and Liabilities and the realized gains and losses and changes in unrealized gains and losses on the Statement of Operations, each categorized by type of derivative contract, are included in the following Additional Derivative Instrument Information footnote. The derivative instruments outstanding as of year-end are disclosed in the notes to or within the Schedule of Investments for purchased options, if applicable. The amounts of realized gains and losses and changes in unrealized gains and losses on derivative instruments during the year are disclosed in the Statement of Operations.
| a) | Foreign Currency Contracts – The Fund may enter into foreign currency contracts that obligate the Fund to purchase or sell currencies at specified future dates. Foreign currency contracts are used to hedge the currency exposure associated with some or all of the Fund’s investments and/or as part of an investment strategy. Foreign currency contracts are marked to market daily and the change in value is recorded by the Fund as an unrealized gain or loss. The Fund will record a realized gain or loss when the foreign currency contract is settled. |
Foreign currency contracts involve elements of market risk in excess of the amounts reflected in the Statement of Assets and Liabilities. In addition, risks may arise upon entering into these contracts from the potential inability of the counterparties to meet the terms of the contracts and from unanticipated movements in the value of the foreign currencies relative to the U.S. dollar. The Fund had no outstanding foreign currency contracts as of October 31, 2013.
| b) | Options Contracts – An option contract is a contract sold by one party to another party that offers the buyer the right, but not the obligation, to buy (call) or sell (put) an investment or other financial asset at an agreed-upon price during a specific period of time or on a specific date. The Fund may write (sell) covered call and put options on futures, swaps (“swaptions”), securities, commodities or currencies. “Covered” means that so long as the Fund is obligated as the writer of an option, it will own either the underlying investments or currency or an option to purchase the same underlying investments or currency having an expiration date of the covered option and an exercise price equal to or less than the exercise price of the covered option, or will pledge cash or other liquid investments having a value equal to or greater than the fluctuating market value of the option investment or currency. Writing put options increases the Fund’s exposure to the underlying instrument. Writing call options decreases the Fund’s exposure to the underlying instrument. Premiums received from writing options that expire are treated as realized gains. Premiums received from writing options that are exercised or closed are added to the proceeds or offset amounts paid on the underlying futures, swap, investment or currency transaction to determine the realized gain or loss. The Fund as a writer of an option has no control over whether the underlying instrument may be sold (call) or purchased (put) and as a result bears the market risk of an unfavorable change in the price of the instrument underlying the written option. There is the risk the Fund may not be able to enter into a closing transaction because of an illiquid market. The Fund may also purchase put and call options. Purchasing call options increases the Fund’s exposure to the underlying instrument. Purchasing put options decreases the Fund’s exposure to the underlying instrument. The Fund pays a premium, which is included on the Fund’s Statement of Assets and Liabilities as an investment and is subsequently marked to market to reflect the current value of the option. Premiums paid for purchasing options that expire are treated as realized losses. Certain options may be purchased with premiums to be determined on a future date. The premiums for these options are based upon implied volatility parameters at specified terms. The risk associated with purchasing put and call options is generally limited to the premium paid. Premiums paid for purchasing options that are exercised or closed are added to the amounts paid or offset against the proceeds on the underlying investment transaction to determine the realized gain or loss. Entering into over-the-counter options also exposes the Fund to counterparty risk. Counterparty risk is the possibility that the counterparty to the agreements may default on its obligation to perform or disagree as to the meaning of the contractual terms in the agreements. The Fund, as shown on the Schedule of Investments, had outstanding purchased options contracts as of October 31, 2013. The Fund had no outstanding written options contracts as of October 31, 2013 or transactions involving written options contracts for the year ended October 31, 2013. |
| The Hartford Growth Opportunities Fund |
| Notes to Financial Statements – (continued) |
| October 31, 2013 |
| (000’s Omitted) |
| c) | Additional Derivative Instrument Information: |
Fair Value of Derivative Instruments on the Statement of Assets and Liabilities as of October 31, 2013:
| | | Risk Exposure Category | |
| | | Interest Rate
Contracts | | | Foreign
Exchange
Contracts | | | Credit
Contracts | | | Equity
Contracts | | | Commodity
Contracts | | | Other
Contracts | | | Total | |
| Assets: | | | | | | | | | | | | | | | | | | | | | | | | | | | | |
| Investments in securities, at value (purchased options), market value | | $ | — | | | $ | — | | | $ | — | | | $ | 237 | | | $ | — | | | $ | — | | | $ | 237 | |
| Total | | $ | — | | | $ | — | | | $ | — | | | $ | 237 | | | $ | — | | | $ | — | | | $ | 237 | |
The volume of derivatives that is presented in the Schedule of Investments is consistent with the derivative activity during the year ended October 31, 2013.
The Effect of Derivative Instruments on the Statement of Operations for the year ended October 31, 2013:
| | | Risk Exposure Category | |
| | | Interest Rate
Contracts | | | Foreign
Exchange
Contracts | | | Credit
Contracts | | | Equity
Contracts | | | Commodity
Contracts | | | Other
Contracts | | | Total | |
| Realized Gain on Derivatives Recognized as a Result of Operations: |
| Net realized gain on foreign currency contracts | | $ | — | | | $ | 418 | | | $ | — | | | $ | — | | | $ | — | | | $ | — | | | $ | 418 | |
| Total | | $ | — | | | $ | 418 | | | $ | — | | | $ | — | | | $ | — | | | $ | — | | | $ | 418 | |
| | | | | | | | | | | | | | | | | | | | | | | | | | | | | |
| Net Change in Unrealized Appreciation (Depreciation) on Derivatives Recognized as a Result of Operations: |
| Net change in unrealized depreciation of purchased options | | $ | — | | | $ | — | | | $ | — | | | $ | (1,496 | ) | | $ | — | | | $ | — | | | $ | (1,496 | ) |
| Total | | $ | — | | | $ | — | | | $ | — | | | $ | (1,496 | ) | | $ | — | | | $ | — | | | $ | (1,496 | ) |
The Fund may be exposed to counterparty risk, or the risk that an institution or other entity with which the Fund has unsettled or open transactions will default.
If the Fund invests directly in foreign currencies or in securities that trade in, and receive revenues in, foreign currencies, or in derivatives that provide exposure to foreign currencies, it will be subject to the risk that those currencies will decline in value relative to the base currency of the Fund, or, in the case of hedging positions, that the Fund’s base currency will decline in value relative to the currency being hedged. Currency rates in foreign countries may fluctuate significantly over short periods of time for a number of reasons, including changes in interest rates, intervention (or the failure to intervene) by U.S. or foreign governments, central banks or supranational entities, such as the International Monetary Fund, or by the imposition of currency controls or other political developments in the United States or abroad. As a result, the Fund’s investments in foreign currency denominated securities may reduce the returns of the Fund. The market values of equity securities, such as common stocks and preferred stocks, or equity related investments, such as futures and options, may decline due to general market conditions which are not specifically related to a particular company, such as real or perceived adverse economic conditions, changes in the general outlook for corporate earnings, changes in interest or currency rates or adverse investor sentiment generally. The market value of equity securities may also decline due to factors which affect a particular industry or industries, such as labor shortages or increased production costs and competitive conditions within an industry. Equity securities and equity related investments generally have greater market price volatility than fixed income securities.
| a) | Federal Income Taxes – For federal income tax purposes, the Fund intends to continue to qualify as a RIC under Subchapter M of the Internal Revenue Code (“IRC”) by distributing substantially all of its taxable net investment income and net realized capital gains to its shareholders and otherwise complying with the requirements of the IRC. The Fund has distributed substantially all of its income and capital gains in prior years, if applicable, and intends to distribute substantially all of its income and capital gains during the calendar year ending December 31, 2013. Accordingly, no provision for federal income or excise taxes has been made in the accompanying financial statements. Distributions from short-term capital gains are treated as ordinary income distributions for federal income tax purposes. |
| b) | Net Investment Income (Loss), Net Realized Gains (Losses) and Distributions – Net investment income (loss) and net realized gains (losses) may differ for financial statement and tax purposes primarily because of losses deferred due to wash sale adjustments, foreign currency gains and losses, adjustments related to PFICs, REITs, RICs, certain derivatives and partnerships. The character of distributions made during the year from net investment income or net realized gains may differ from their ultimate characterization for federal income tax purposes. Also, due to the timing of dividend distributions, the fiscal year in which amounts are distributed may differ from the year that the income or realized gains (losses) were recorded by the Fund. |
| c) | Components of Distributable Earnings – The Fund’s components of distributable earnings (deficit) on a tax basis at October 31, 2013, are as follows: |
| | | Amount | |
| Undistributed Long-Term Capital Gain | | $ | 103,085 | |
| Accumulated Capital Losses | | | (5,357 | ) |
| Unrealized Appreciation * | | | 388,942 | |
| Total Accumulated Earnings | | $ | 486,670 | |
| * | Differences between book-basis and tax-basis unrealized appreciation (depreciation) may be attributable to the losses deferred due to wash sale adjustments, foreign currency gains and losses, adjustments related to PFICs, REITs, RICs, certain derivatives and partnerships. |
| d) | Reclassification of Capital Accounts – The Fund may record reclassifications in its capital accounts. These reclassifications have no impact on the total net assets of the Fund. The reclassifications are a result of permanent differences between U.S. GAAP and tax accounting for such items as foreign currency, PFICs, expiration or utilization of capital loss carryforwards or net operating losses. Adjustments are made to reflect the impact these items have on current and future distributions to shareholders. Therefore, the source of the Fund’s distributions may be shown in the accompanying Statement of Changes in Net Assets as from undistributed net investment income, from accumulated net realized gains on investments or from capital depending on the type of book and tax differences that exist. For the year ended October 31, 2013, the Fund recorded reclassifications to increase (decrease) the accounts listed below: |
| | | Amount | |
| Undistributed Net Investment Income | | $ | 7,330 | |
| Accumulated Net Realized Gain (Loss) | | | 1,065 | |
| Capital Stock and Paid-in-Capital | | | (8,395 | ) |
| e) | Capital Loss Carryforward – On December 22, 2010, the Regulated Investment Company Modernization Act of 2010 (the “Act”) was enacted, which made changes to the capital loss carryforward rules. The changes are effective for taxable years beginning after the date of enactment. Under the Act, funds are permitted to carry forward capital losses for an unlimited period. However, any losses incurred during those future taxable years will be required to be utilized prior to |
| The Hartford Growth Opportunities Fund |
| Notes to Financial Statements – (continued) |
| October 31, 2013 |
| (000’s Omitted) |
the losses incurred in pre-enactment taxable years, which carry an expiration date. As a result of this ordering rule, pre-enactment capital loss carryforwards may be more likely to expire unused. Additionally, post-enactment capital loss carryforwards retain their character as either short-term or long-term capital losses rather than being considered all short-term as permitted under prior regulation.
The Fund had no capital loss carryforward for U.S. federal income tax purposes as of October 31, 2013.
During the year ended October 31, 2013, the Fund utilized $289,150 of prior year capital loss carryforwards.
As of October 31, 2013, the Fund elected to defer the following Late-Year Ordinary Losses:
| | | Amount | |
| Ordinary Income | | $ | 5,357 | |
| f) | Accounting for Uncertainty in Income Taxes – The Fund has adopted financial reporting rules that require the Fund to analyze all open tax years, as defined by the statute of limitations, for all major jurisdictions. Generally, tax authorities can examine all tax returns filed for the last three years. The Fund does not have an examination in progress. |
The Fund has reviewed all open tax years and major jurisdictions and concluded that these financial reporting rules had no effect on the Fund’s financial position or results of operations. There is no tax liability resulting from unrecognized tax benefits relating to uncertain income tax positions taken or expected to be taken on the tax return for the fiscal year ended October 31, 2013. The Fund is also not aware of any tax positions for which it is reasonably possible that the total amounts of unrecognized tax benefits will significantly change in the next twelve months.
| a) | Investment Management Agreement – Effective January 1, 2013, Hartford Funds Management Company, LLC (“HFMC”) replaced Hartford Investment Financial Services, LLC (“HIFSCO”) as the Fund’s investment manager. HFMC and HIFSCO are both indirect wholly owned subsidiaries of The Hartford Financial Services Group, Inc. (“The Hartford”). As of January 1, 2013, HFMC serves as investment manager to the Fund pursuant to an Investment Management Agreement with the Company. For the calendar year ended December 31, 2012, HIFSCO served as the Fund’s investment manager pursuant to a separate agreement between HIFSCO and the Company. The replacement of HIFSCO with HFMC did not result in any change to (i) the contractual terms of, including the fees payable under, the Fund’s investment management agreements; or (ii) the day-to-day management of the Fund. The investment manager has overall investment supervisory responsibility for the Fund. In addition, the investment manager provides administrative personnel, services, equipment, facilities and office space for proper operation of the Fund. HFMC has contracted with Wellington Management Company, LLP (“Wellington Management”) under a sub-advisory agreement for the provision of day-to-day investment management services to the Fund in accordance with the Fund’s investment objective and policies. The Fund pays a fee to the investment manager, a portion of which may be used to compensate Wellington Management. |
The schedule below reflects the rates of compensation paid to the investment manager for investment management services rendered as of October 31, 2013; the rates are accrued daily and paid monthly:
| Average Daily Net Assets | | Annual Fee | |
| On first $250 million | | | 0.8000 | % |
| On next $4.75 billion | | | 0.7000 | % |
| On next $5 billion | | | 0.6975 | % |
| Over $10 billion | | | 0.6950 | % |
| b) | Accounting Services Agreement – Effective January 1, 2013, HFMC replaced Hartford Life Insurance Company (“HLIC”) as provider of accounting services to the Fund. HLIC provided accounting services for the Fund for the calendar year ended December 31, 2012. The replacement of HLIC with HFMC did not result in any changes to the fund accounting services provided to the Fund or the fees charged to the Fund for such services. Pursuant to the Fund Accounting Agreement between HFMC and the Company, on behalf of the Fund, HFMC provides accounting services to the Fund and receives monthly compensation based on the Fund’s average daily net assets at the rates set forth below. The Fund’s accounting services fees are accrued daily and paid monthly. |
| Average Daily Net Assets | | Annual Fee | |
| On first $5 billion | | | 0.012 | % |
| Over $5 billion | | | 0.010 | % |
| c) | Operating Expenses – Allocable expenses incurred by the Company are allocated to each Fund and allocated to classes within the Fund in proportion to the average daily net assets of the Fund and each class, except where allocation of certain expenses is more fairly made directly to the Fund or to specific classes within a Fund. As of October 31, 2013, HFMC contractually limited the total operating expenses of this Fund, exclusive of taxes, interest expense, brokerage commissions, acquired fund fees and expenses and extraordinary expenses, through February 28, 2014 as follows: |
| Class A | | | Class B | | | Class C | | | Class I | | | Class R3 | | | Class R4 | | | Class R5 | | | Class Y | |
| | 1.21% | | | | 1.96% | | | | 1.96% | | | | 0.96% | | | | 1.45% | | | | 1.15% | | | | 0.85% | | | | 0.85% | |
| d) | Fees Paid Indirectly – The Fund has entered into agreements with State Street Global Markets, LLC and Russell Implementation Services, Inc. to partially recapture non-discounted trade commissions. Such rebates are used to pay a portion of the Fund’s expenses. In addition, the Fund’s custodian bank has agreed to reduce its fees when the Fund maintains cash on deposit in a non-interest-bearing custody account. For the year ended October 31, 2013, these amounts, if any, are included in the Statement of Operations. |
The ratio of expenses to average net assets in the accompanying financial highlights excludes the reduction in expenses related to fees paid indirectly. The annualized expense ratio after waivers for the period listed below reflecting the reduction for fees paid indirectly is as follows:
| | | Year Ended
October 31, 2013 | |
| Class A | | | 1.18 | % |
| Class B | | | 1.96 | |
| Class C | | | 1.90 | |
| Class I | | | 0.92 | |
| Class R3 | | | 1.45 | |
| Class R4 | | | 1.15 | |
| Class R5 | | | 0.85 | |
| Class Y | | | 0.75 | |
| e) | Distribution and Service Plan for Class A, B, C, R3 and R4 Shares – Effective June 14, 2013, HIFSCO was renamed Hartford Funds Distributors, LLC (“HFD”). HFD is the principal underwriter and distributor of the Fund. HFD is engaged in distribution activities, which include marketing and distribution of shares through broker/dealers, financing distribution costs and maintaining financial books and records. For the year ended October 31, 2013, HFD received front-end load sales charges of $2,100 and contingent deferred sales charges of $33 from the Fund. |
The Fund has adopted a Distribution and Service Plan in accordance with Rule 12b-1 of the 1940 Act to compensate the distributor (HFD) for activities intended to result in the sale and distribution of Class A, B, C, R3 and R4 shares and for providing services for shareholders. The Rule 12b-1 plan applicable to Class A shares of the Fund provides for payment
| The Hartford Growth Opportunities Fund |
| Notes to Financial Statements – (continued) |
| October 31, 2013 |
| (000’s Omitted) |
of a Rule 12b-1 fee of 0.25% of average daily net assets. Some or all of the fee may be used for shareholder servicing expenses with the remainder used for distribution expenses. Some or the entire Rule 12b-1 fee for Class B shares may be remitted to broker/dealers for distribution and/or shareholder account services. Under the Class B Plan, the Fund pays the distributor 1.00% of the average daily net assets of Class B shares that are outstanding for 8 years or less, 0.25% of which is a fee for services provided to existing shareholders with the remainder used for distribution expenses. After eight years, Class B shares convert to Class A shares. Upon conversion to Class A shares, the Class A plan described above will apply to those shares. Under the Class C Plan, the Fund pays the distributor 1.00% of the average daily net assets of Class C shares outstanding, 0.25% of which is intended as a fee for services provided to existing shareholders with the remainder used for distribution expenses. For Class C shares, some or the entire fee may be remitted to broker/dealers for distribution and/or shareholder account services. Class R3 shares have a distribution fee of 0.50% of average daily net assets and Class R4 shares have a distribution fee of 0.25% of average daily net assets. For Class R3 and R4 shares, some or the entire fee may be remitted to broker/dealers for distribution and/or shareholder account services. The Fund’s 12b-1 fees are accrued daily and paid monthly.
| f) | Other Related Party Transactions – Certain officers of the Fund are directors and/or officers of the investment manager and/or The Hartford or its subsidiaries. For the year ended October 31, 2013, a portion of the Fund’s Chief Compliance Officer’s compensation was paid by all of the investment companies in the Hartford fund complex. The portion allocated to the Fund was in the amount of $2. Hartford Administrative Services Company (“HASCO”), an indirect wholly-owned subsidiary of The Hartford, provides transfer agent services to the Fund. HASCO has contractually agreed to reimburse any portion of the transfer agency fees over 0.30% of average daily net assets per fiscal year for each class. For providing such services, HASCO is compensated on a per account basis that varies by account type, except with respect to Class Y, for which it is compensated based on average daily net assets. The amount paid to HASCO and any related contractual reimbursement amounts, if applicable, can be found in the Statement of Operations. These fees are accrued daily and paid monthly. |
Administrative services fees are paid to HASCO for third-party recordkeeping services that are payable as a percentage of net assets in the amount of 0.20%, 0.15% and 0.10% for Classes R3, R4 and R5 shares, respectively. The total administrative services fees are shown on the Statement of Operations. These fees are accrued daily and paid monthly.
| 8. | Investment Transactions: |
For the year ended October 31, 2013, the Fund's aggregate purchases and sales of investment securities (excluding short-term investments) were as follows:
| | | Amount | |
| Cost of Purchases Excluding U.S. Government Obligations | | $ | 2,693,175 | |
| Sales Proceeds Excluding U.S. Government Obligations | | | 2,639,592 | |
| 9. | Capital Share Transactions: |
The following information is for the year ended October 31, 2013, and the year ended October 31, 2012:
| | | For the Year Ended October 31, 2013 | | | For the Year Ended October 31, 2012 | |
| | | Shares Sold* | | | Shares Issued
for Reinvested
Dividends | | | Shares
Redeemed | | | Net Increase
(Decrease) of
Shares | | | Shares Sold | | | Shares Issued
for Reinvested
Dividends | | | Shares
Redeemed | | | Net Increase
(Decrease) of
Shares | |
| Class A | | | | | | | | | | | | | | | | | | | | | | | | | | | | | | | | |
| Shares | | | 4,679 | | | | — | | | | (4,573 | ) | | | 106 | | | | 2,544 | | | | — | | | | (6,282 | ) | | | (3,738 | ) |
| Amount | | $ | 157,035 | | | $ | — | | | $ | (152,915 | ) | | $ | 4,120 | | | $ | 72,018 | | | $ | — | | | $ | (174,004 | ) | | $ | (101,986 | ) |
| Class B | | | | | | | | | | | | | | | | | | | | | | | | | | | | | | | | |
| Shares | | | 78 | | | | — | | | | (282 | ) | | | (204 | ) | | | 56 | | | | — | | | | (397 | ) | | | (341 | ) |
| Amount | | $ | 2,257 | | | $ | — | | | $ | (7,447 | ) | | $ | (5,190 | ) | | $ | 1,248 | | | $ | — | | | $ | (8,695 | ) | | $ | (7,447 | ) |
| Class C | | | | | | | | | | | | | | | | | | | | | | | | | | | | | | | | |
| Shares | | | 1,454 | | | | — | | | | (910 | ) | | | 544 | | | | 608 | | | | — | | | | (1,527 | ) | | | (919 | ) |
| Amount | | $ | 39,655 | | | $ | — | | | $ | (24,186 | ) | | $ | 15,469 | | | $ | 13,759 | | | $ | — | | | $ | (33,170 | ) | | $ | (19,411 | ) |
| Class I | | | | | | | | | | | | | | | | | | | | | | | | | | | | | | | | |
| Shares | | | 15,156 | | | | — | | | | (12,173 | ) | | | 2,983 | | | | 13,344 | | | | — | | | | (13,671 | ) | | | (327 | ) |
| Amount | | $ | 525,939 | | | $ | — | | | $ | (417,369 | ) | | $ | 108,570 | | | $ | 380,872 | | | $ | — | | | $ | (383,047 | ) | | $ | (2,175 | ) |
| Class R3 | | | | | | | | | | | | | | | | | | | | | | | | | | | | | | | | |
| Shares | | | 228 | | | | — | | | | (166 | ) | | | 62 | | | | 235 | | | | — | | | | (169 | ) | | | 66 | |
| Amount | | $ | 7,834 | | | $ | — | | | $ | (5,618 | ) | | $ | 2,216 | | | $ | 6,735 | | | $ | — | | | $ | (4,844 | ) | | $ | 1,891 | |
| Class R4 | | | | | | | | | | | | | | | | | | | | | | | | | | | | | | | | |
| Shares | | | 232 | | | | — | | | | (380 | ) | | | (148 | ) | | | 317 | | | | — | | | | (410 | ) | | | (93 | ) |
| Amount | | $ | 8,052 | | | $ | — | | | $ | (13,189 | ) | | $ | (5,137 | ) | | $ | 8,917 | | | $ | — | | | $ | (11,722 | ) | | $ | (2,805 | ) |
| Class R5 | | | | | | | | | | | | | | | | | | | | | | | | | | | | | | | | |
| Shares | | | 157 | | | | — | | | | (140 | ) | | | 17 | | | | 148 | | | | — | | | | (188 | ) | | | (40 | ) |
| Amount | | $ | 5,485 | | | $ | — | | | $ | (4,890 | ) | | $ | 595 | | | $ | 4,348 | | | $ | — | | | $ | (5,422 | ) | | $ | (1,074 | ) |
| Class Y | | | | | | | | | | | | | | | | | | | | | | | | | | | | | | | | |
| Shares | | | 400 | | | | — | | | | (490 | ) | | | (90 | ) | | | 540 | | | | — | | | | (2,640 | ) | | | (2,100 | ) |
| Amount | | $ | 22,859 | | | $ | — | | | $ | (27,330 | ) | | $ | (4,471 | ) | | $ | 15,636 | | | $ | — | | | $ | (76,424 | ) | | $ | (60,788 | ) |
| Total | | | | | | | | | | | | | | | | | | | | | | | | | | | | | | | | |
| Shares | | | 22,384 | | | | — | | | | (19,114 | ) | | | 3,270 | | | | 17,792 | | | | — | | | | (25,284 | ) | | | (7,492 | ) |
| Amount | | $ | 769,116 | | | $ | — | | | $ | (652,944 | ) | | $ | 116,172 | | | $ | 503,533 | | | $ | — | | | $ | (697,328 | ) | | $ | (193,795 | ) |
* Includes shares issued from merger. Please see table immediately following for details.
| | | Shares Issued from Merger | |
| | | For the Year Ended October 31, 2013 | |
| | | Shares | | | Amount | |
| Class A | | | 826 | | | $ | 26,790 | |
| Class B | | | 35 | | | | 909 | |
| Class C | | | 249 | | | | 6,406 | |
| Class I | | | 17 | | | | 573 | |
| Class R3 | | | 5 | | | | 154 | |
| Class R4 | | | 4 | | | | 125 | |
| Class R5 | | | 4 | | | | 126 | |
| Class Y | | | 26 | | | | 903 | |
| | | | 1,166 | | | $ | 35,986 | |
| The Hartford Growth Opportunities Fund |
| Notes to Financial Statements – (continued) |
| October 31, 2013 |
| (000’s Omitted) |
The following reflects the conversion of Class B shares into Class A shares (reflected as Class A shares sold) for the year ended October 31, 2013, and the year ended October 31, 2012:
| | | Shares | | | Dollars | |
| For the Year Ended October 31, 2013 | | | 44 | | | | $1,471 | |
| For the Year Ended October 31, 2012 | | | 66 | | | | $1,829 | |
The Fund is one of several Hartford funds that participate in a $500 million committed revolving line of credit facility. The facility is to be used for temporary or emergency purposes. Under the arrangement, the funds are required to own securities having a market value in excess of 300% of the total bank borrowings. The interest rate on borrowings varies depending on the nature of the loan. The facility also requires a fee to be paid based on the amount of the commitment. This commitment fee is allocated to all of the funds participating in the line of credit based on the average net assets of the funds. During the year ended October 31, 2013, the Fund did not have any borrowings under this facility.
Reorganization of The Hartford Fundamental Growth Fund into the Fund: At a Special Meeting of Shareholders held on December 17, 2012, the shareholders of The Hartford Fundamental Growth Fund approved a proposed Plan of Reorganization providing for the acquisition of all the assets and liabilities of The Hartford Fundamental Growth Fund (“Target Fund”) by the Fund (“Acquiring Fund”).
Under the terms of the Plan of Reorganization, and pursuant to the approval by the shareholders of The Hartford Fundamental Growth Fund, the assets were acquired by the Fund on February 22, 2013 (“the merger date”). The Fund acquired the assets of The Fundamental Growth Fund in exchange for shares in the Fund, which were distributed pro rata by The Hartford Fundamental Growth Fund to shareholders on the merger date, in complete liquidation of The Hartford Fundamental Growth Fund.
This merger was accomplished by tax free exchange as detailed below:
| | | Net assets of Target
Fund on Merger
Date | | | Net assets of
Acquiring Fund
immediately before
merger | | | Net assets of
Acquiring
Fund
immediately
after merger | | | Target Fund shares
exchanged | | | Acquiring Fund
shares issued to the
Target Fund's
shareholders | |
| | | | | | | | | | | | | | | | |
| Class A | | $ | 26,790 | | | $ | 810,633 | | | $ | 837,423 | | | | 2,793 | | | | 826 | |
| Class B | | | 909 | | | | 23,436 | | | | 24,345 | | | | 105 | | | | 35 | |
| Class C | | | 6,406 | | | | 134,786 | | | | 141,192 | | | | 743 | | | | 249 | |
| Class I | | | 573 | | | | 1,018,343 | | | | 1,018,916 | | | | 59 | | | | 17 | |
| Class R3 | | | 154 | | | | 19,361 | | | | 19,515 | | | | 16 | | | | 5 | |
| Class R4 | | | 125 | | | | 40,011 | | | | 40,136 | | | | 12 | | | | 4 | |
| Class R5 | | | 126 | | | | 16,678 | | | | 16,804 | | | | 13 | | | | 4 | |
| Class Y | | | 903 | | | | 53,960 | | | | 54,863 | | | | 90 | | | | 26 | |
| Total | | $ | 35,986 | | | $ | 2,117,208 | | | $ | 2,153,194 | | | | 3,831 | | | | 1,166 | |
The Hartford Fundamental Growth Fund had the following unrealized appreciation, accumulated net realized losses and capital stock as of the merger date:
| Fund | | Undistributed
Income | | | Unrealized
Appreciation
(Depreciation) | | | Accumulated
Net Realized
Gains
(Losses) | | | Capital Stock | | | Total | |
| Target Fund | | $ | — | | | $ | 2,958 | | | $ | (894 | ) | | $ | 33,922 | | | $ | 35,986 | |
Assuming the acquisition had been completed on November 1, 2012, the beginning of the annual reporting period of the Funds, the Fund’s pro forma results of operations for the year ended October 31, 2013, are as follows:
| Fund | | Net Investment Loss | | | Net gain on investments | | | Net increase in net assets
resulting from operations | |
| Acquiring Fund | | $ | (4,566 | ) | | $ | 607,439 | | | $ | 602,873 | |
Because the combined investment portfolios have been managed as a single integrated portfolio since the acquisition was completed, it is not practical to separate the amounts of revenue and earnings of The Hartford Fundamental Growth Fund that have been included in the Fund’s Statement of Operations since the merger date.
| 12. | Industry Classifications: |
Other than the industry classifications “Other Investment Pools and Funds” and “Exchange Traded Funds,” equity industry classifications used in this report are the Global Industry Classification Standard, which was developed by and is the exclusive property and service mark of MSCI, Inc. and Standard & Poor’s.
| 13. | Pending Legal Proceedings: |
On February 25, 2011, Jennifer L. Kasilag, Louis Mellinger, Judith M. Menendez, Jacqueline M. Robinson, and Linda A. Russell filed a derivative lawsuit against Hartford Investment Financial Services, LLC (“HIFSCO”)(now known as Hartford Funds Distributors, LLC) on behalf of six Hartford retail mutual funds in the United States District Court for the District of New Jersey, alleging that HIFSCO received excessive advisory and distribution fees in violation of its statutory fiduciary duty under Section 36(b) of the 1940 Act when serving as investment manager and principal underwriter, respectively, to the Hartford retail mutual funds. HIFSCO moved to dismiss and, in September 2011, the motion was granted in part and denied in part, with leave to amend the complaint. In November 2011, plaintiffs filed an amended complaint on behalf of certain Hartford retail mutual funds, The Hartford Global Health Fund (now known as The Hartford Healthcare Fund), The Hartford Conservative Allocation Fund, The Hartford Growth Opportunities Fund, The Hartford Inflation Plus Fund, The Hartford Advisers Fund (now known as The Hartford Balanced Fund), and The Hartford Capital Appreciation Fund. Plaintiffs seek to rescind the investment management agreements and distribution plans between HIFSCO and these funds and to recover the total fees charged thereunder or, in the alternative, to recover any improper compensation HIFSCO received, in addition to lost earnings. HIFSCO filed a partial motion to dismiss the amended complaint and, in December 2012, the court dismissed without prejudice the claims regarding distribution fees and denied the motion with respect to the advisory fees claims. HIFSCO disputes the allegations and intends to defend the advisory fee claims vigorously.
Although this action was purportedly filed on behalf of certain of the Hartford Funds, none of the Hartford Funds is itself a defendant to the suit. For this reason, no accrual for litigation relating to this matter has been recorded in the financial statements of the Fund.
| The Hartford Growth Opportunities Fund |
| Notes to Financial Statements – (continued) |
| October 31, 2013 |
| (000’s Omitted) |
Under the Company’s organizational documents, the Company shall indemnify its officers and directors to the full extent required or permitted under Maryland General Corporation Law and the federal securities laws. In addition, the Company, on behalf of the Fund, may enter into contracts that contain a variety of indemnifications. The Company’s maximum exposure under these arrangements is unknown. However, as of the date of these financial statements, the Company has not had prior claims or losses pursuant to these contracts and expects the risk of loss to be remote.
| 15. | Recent Accounting Pronouncement: |
In January 2013, the Financial Accounting Standards Board (FASB) issued Accounting Standards Update (ASU) No. 2013-01, Clarifying the Scope of Disclosures about Offsetting Assets and Liabilities, which clarified ASU No. 2011-11, Disclosures about Offsetting Assets and Liabilities. The objective of ASU 2013-01 is to enhance disclosure requirements on the offsetting of financial assets and liabilities. ASU 2013-01 limits the scope of the new balance sheet offsetting disclosures to derivatives, repurchase agreements and securities lending transactions to the extent that they are (1) offset in the financial statements or (2) subject to an enforceable master netting arrangement or similar agreement. The effective date of ASU 2013-01 is for annual periods beginning on or after January 1, 2013 and interim periods within those annual periods. At this time, management is evaluating the implications of this guidance and the impact it will have on the Fund’s financial statements and footnote disclosures, if any.
At a meeting held on December 13, 2013, the Board of Directors of The Hartford Mutual Funds II, Inc. approved an Agreement and Plan of Reorganization relating to the reorganization of The Hartford Growth Fund, a series of The Hartford Mutual Funds II, Inc., into the Fund. The Reorganization does not require shareholder approval. The Reorganization is expected to occur on or about April 7, 2014.
| The Hartford Growth Opportunities Fund |
| Financial Highlights |
| - Selected Per-Share Data - (A) | | - Ratios and Supplemental Data - | |
| Class | | Net Asset
Value at
Beginning
of Period | | | Net
Investment
Income
(Loss) | | | Net
Realized
and
Unrealized
Gain
(Loss) on
Invest-
ments | | | Total from
Investment
Operations | | | Dividends
from Net
Investment
Income | | | Distribu-
tions
from
Realized
Capital
Gains | | | Total
Dividends
and
Distributions | | | Net Asset
Value at
End of
Period | | | Total
Return(B) | | | Net Assets
at End of
Period
(000's) | | | Ratio of
Expenses
to
Average
Net
Assets
Before
Adjust-
ments(C) | | | Ratio of
Expenses
to
Average
Net
Assets
After
Adjust-
ments(C) | | | Ratio of
Net
Investment
Income to
Average
Net Assets | |
| | | | | | | | | | | | | | | | | | | | | | | | | | | | | | | | | | | | | | | | |
| For the Year Ended October 31, 2013 |
| A | | $ | 29.60 | | | $ | (0.10 | ) | | $ | 9.18 | | | $ | 9.08 | | | $ | – | | | $ | – | | | $ | – | | | $ | 38.68 | | | | 30.68 | % | | $ | 982,699 | | | | 1.19 | % | | | 1.19 | % | | | (0.30 | )% |
| B | | | 23.43 | | | | (0.28 | ) | | | 7.23 | | | | 6.95 | | | | – | | | | – | | | | – | | | | 30.38 | | | | 29.66 | | | | 24,296 | | | | 2.11 | | | | 1.96 | | | | (1.05 | ) |
| C | | | 23.52 | | | | (0.27 | ) | | | 7.26 | | | | 6.99 | | | | – | | | | – | | | | – | | | | 30.51 | | | | 29.72 | | | | 176,392 | | | | 1.90 | | | | 1.90 | | | | (1.01 | ) |
| I | | | 30.14 | | | | (0.01 | ) | | | 9.36 | | | | 9.35 | | | | – | | | | – | | | | – | | | | 39.49 | | | | 31.02 | | | | 1,288,778 | | | | 0.92 | | | | 0.92 | | | | (0.03 | ) |
| R3 | | | 30.09 | | | | (0.19 | ) | | | 9.31 | | | | 9.12 | | | | – | | | | – | | | | – | | | | 39.21 | | | | 30.31 | | | | 24,924 | | | | 1.46 | | | | 1.45 | | | | (0.56 | ) |
| R4 | | | 30.64 | | | | (0.09 | ) | | | 9.51 | | | | 9.42 | | | | – | | | | – | | | | – | | | | 40.06 | | | | 30.74 | | | | 44,353 | | | | 1.15 | | | | 1.15 | | | | (0.25 | ) |
| R5 | | | 31.09 | | | | 0.01 | | | | 9.66 | | | | 9.67 | | | | – | | | | – | | | | – | | | | 40.76 | | | | 31.10 | | | | 20,243 | | | | 0.85 | | | | 0.85 | | | | 0.04 | |
| Y | | | 31.25 | | | | 0.05 | | | | 9.72 | | | | 9.77 | | | | – | | | | – | | | | – | | | | 41.02 | | | | 31.26 | | | | 57,712 | | | | 0.75 | | | | 0.75 | | | | 0.14 | |
| | | | | | | | | | | | | | | | | | | | | | | | | | | | | | | | | | | | | | | | | | | | | | | | | | | | | |
| For the Year Ended October 31, 2012 |
| A | | $ | 25.98 | | | $ | (0.15 | ) | | $ | 3.77 | | | $ | 3.62 | | | $ | – | | | $ | – | | | $ | – | | | $ | 29.60 | | | | 13.93 | % | | $ | 748,795 | | | | 1.23 | % | | | 1.21 | % | | | (0.54 | )% |
| B | | | 20.72 | | | | (0.28 | ) | | | 2.99 | | | | 2.71 | | | | – | | | | – | | | | – | | | | 23.43 | | | | 13.08 | | | | 23,529 | | | | 2.15 | | | | 1.96 | | | | (1.29 | ) |
| C | | | 20.80 | | | | (0.28 | ) | | | 3.00 | | | | 2.72 | | | | – | | | | – | | | | – | | | | 23.52 | | | | 13.08 | | | | 123,174 | | | | 1.93 | | | | 1.93 | | | | (1.26 | ) |
| I | | | 26.39 | | | | (0.08 | ) | | | 3.83 | | | | 3.75 | | | | – | | | | – | | | | – | | | | 30.14 | | | | 14.21 | | | | 893,563 | | | | 0.95 | | | | 0.95 | | | | (0.28 | ) |
| R3 | | | 26.48 | | | | (0.22 | ) | | | 3.83 | | | | 3.61 | | | | – | | | | – | | | | – | | | | 30.09 | | | | 13.63 | | | | 17,259 | | | | 1.48 | | | | 1.45 | | | | (0.78 | ) |
| R4 | | | 26.89 | | | | (0.14 | ) | | | 3.89 | | | | 3.75 | | | | – | | | | – | | | | – | | | | 30.64 | | | | 13.95 | | | | 38,458 | | | | 1.16 | | | | 1.15 | | | | (0.47 | ) |
| R5 | | | 27.20 | | | | (0.05 | ) | | | 3.94 | | | | 3.89 | | | | – | | | | – | | | | – | | | | 31.09 | | | | 14.30 | | | | 14,935 | | | | 0.86 | | | | 0.85 | | | | (0.17 | ) |
| Y | | | 27.32 | | | | (0.03 | ) | | | 3.96 | | | | 3.93 | | | | – | | | | – | | | | – | | | | 31.25 | | | | 14.39 | | | | 46,782 | | | | 0.76 | | | | 0.76 | | | | (0.09 | ) |
| | | | | | | | | | | | | | | | | | | | | | | | | | | | | | | | | | | | | | | | | | | | | | | | | | | | | |
| For the Year Ended October 31, 2011 |
| A(D) | | $ | 24.78 | | | $ | 0.02 | | | $ | 1.18 | | | $ | 1.20 | | | $ | – | | | $ | – | | | $ | – | | | $ | 25.98 | | | | 4.84 | % | | $ | 754,532 | | | | 1.22 | % | | | 1.22 | % | | | 0.06 | % |
| B | | | 19.93 | | | | (0.29 | ) | | | 1.08 | | | | 0.79 | | | | – | | | | – | | | | – | | | | 20.72 | | | | 3.96 | | | | 27,884 | | | | 2.13 | | | | 2.04 | | | | (1.32 | ) |
| C | | | 19.98 | | | | (0.26 | ) | | | 1.08 | | | | 0.82 | | | | – | | | | – | | | | – | | | | 20.80 | | | | 4.10 | | | | 128,016 | | | | 1.92 | | | | 1.92 | | | | (1.20 | ) |
| I | | | 25.10 | | | | (0.06 | ) | | | 1.35 | | | | 1.29 | | | | – | | | | – | | | | – | | | | 26.39 | | | | 5.14 | | | | 791,091 | | | | 0.92 | | | | 0.92 | | | | (0.22 | ) |
| R3 | | | 25.31 | | | | (0.20 | ) | | | 1.37 | | | | 1.17 | | | | – | | | | – | | | | – | | | | 26.48 | | | | 4.62 | | | | 13,444 | | | | 1.48 | | | | 1.45 | | | | (0.74 | ) |
| R4 | | | 25.63 | | | | (0.12 | ) | | | 1.38 | | | | 1.26 | | | | – | | | | – | | | | – | | | | 26.89 | | | | 4.92 | | | | 36,249 | | | | 1.16 | | | | 1.15 | | | | (0.43 | ) |
| R5 | | | 25.85 | | | | (0.04 | ) | | | 1.39 | | | | 1.35 | | | | – | | | | – | | | | – | | | | 27.20 | | | | 5.22 | | | | 14,132 | | | | 0.86 | | | | 0.85 | | | | (0.15 | ) |
| Y | | | 25.94 | | | | (0.01 | ) | | | 1.39 | | | | 1.38 | | | | – | | | | – | | | | – | | | | 27.32 | | | | 5.32 | | | | 98,278 | | | | 0.76 | | | | 0.76 | | | | (0.04 | ) |
| | | | | | | | | | | | | | | | | | | | | | | | | | | | | | | | | | | | | | | | | | | | | | | | | | | | | |
| For the Year Ended October 31, 2010 |
| A | | $ | 20.69 | | | $ | (0.13 | ) | | $ | 4.22 | | | $ | 4.09 | | | $ | – | | | $ | – | | | $ | – | | | $ | 24.78 | | | | 19.77 | % | | $ | 431,465 | | | | 1.35 | % | | | 1.32 | % | | | (0.57 | )% |
| B | | | 16.77 | | | | (0.25 | ) | | | 3.41 | | | | 3.16 | | | | – | | | | – | | | | – | | | | 19.93 | | | | 18.84 | | | | 34,559 | | | | 2.18 | | | | 2.07 | | | | (1.33 | ) |
| C | | | 16.78 | | | | (0.23 | ) | | | 3.43 | | | | 3.20 | | | | – | | | | – | | | | – | | | | 19.98 | | | | 19.07 | | | | 156,903 | | | | 1.95 | | | | 1.95 | | | | (1.21 | ) |
| I | | | 20.91 | | | | (0.05 | ) | | | 4.28 | | | | 4.23 | | | | (0.04 | ) | | | – | | | | (0.04 | ) | | | 25.10 | | | | 20.23 | | | | 495,439 | | | | 0.93 | | | | 0.93 | | | | (0.22 | ) |
| R3 | | | 21.17 | | | | (0.18 | ) | | | 4.32 | | | | 4.14 | | | | – | | | | – | | | | – | | | | 25.31 | | | | 19.56 | | | | 10,772 | | | | 1.49 | | | | 1.49 | | | | (0.77 | ) |
| R4 | | | 21.37 | | | | (0.10 | ) | | | 4.36 | | | | 4.26 | | | | – | | | | – | | | | – | | | | 25.63 | | | | 19.93 | | | | 42,770 | | | | 1.17 | | | | 1.17 | | | | (0.44 | ) |
| R5 | | | 21.52 | | | | (0.03 | ) | | | 4.40 | | | | 4.37 | | | | (0.04 | ) | | | – | | | | (0.04 | ) | | | 25.85 | | | | 20.34 | | | | 14,203 | | | | 0.87 | | | | 0.87 | | | | (0.14 | ) |
| Y | | | 21.59 | | | | (0.01 | ) | | | 4.42 | | | | 4.41 | | | | (0.06 | ) | | | – | | | | (0.06 | ) | | | 25.94 | | | | 20.44 | | | | 136,662 | | | | 0.77 | | | | 0.77 | | | | (0.04 | ) |
See Portfolio Turnover information on the next page.
| The Hartford Growth Opportunities Fund |
| Financial Highlights – (continued) |
| - Selected Per-Share Data - (A) | | - Ratios and Supplemental Data - | |
| Class | | Net Asset
Value at
Beginning
of Period | | | Net
Investment
Income
(Loss) | | | Net
Realized
and
Unrealized
Gain
(Loss) on
Invest-
ments | | | Total from
Investment
Operations | | | Dividends
from Net
Investment
Income | | | Distribu-
tions
from
Realized
Capital
Gains | | | Total
Dividends
and
Distributions | | | Net Asset
Value at
End of
Period | | | Total
Return(B) | | | Net Assets
at End of
Period
(000's) | | | Ratio of
Expenses
to
Average
Net
Assets
Before
Adjust-
ments(C) | | | Ratio of
Expenses
to
Average
Net
Assets
After
Adjust-
ments(C) | | | Ratio of
Net
Investment
Income to
Average
Net Assets | |
| | | | | | | | | | | | | | | | | | | | | | | | | | | | | | | | | | | | | | | | |
| For the Year Ended October 31, 2009 (E) |
| A | | $ | 18.60 | | | $ | 0.02 | | | $ | 2.07 | | | $ | 2.09 | | | $ | – | | | $ | – | | | $ | – | | | $ | 20.69 | | | | 11.24 | % | | $ | 746,980 | | | | 1.47 | % | | | 1.24 | % | | | 0.11 | % |
| B | | | 15.16 | | | | (0.09 | ) | | | 1.70 | | | | 1.61 | | | | – | | | | – | | | | – | | | | 16.77 | | | | 10.62 | | | | 36,371 | | | | 2.36 | | | | 1.84 | | | | (0.53 | ) |
| C | | | 15.21 | | | | (0.13 | ) | | | 1.70 | | | | 1.57 | | | | – | | | | – | | | | – | | | | 16.78 | | | | 10.32 | | | | 173,788 | | | | 2.04 | | | | 2.04 | | | | (0.72 | ) |
| I | | | 18.74 | | | | 0.02 | | | | 2.15 | | | | 2.17 | | | | – | | | | – | | | | – | | | | 20.91 | | | | 11.58 | | | | 360,198 | | | | 0.99 | | | | 0.99 | | | | 0.23 | |
| R3 | | | 19.08 | | | | (0.04 | ) | | | 2.13 | | | | 2.09 | | | | – | | | | – | | | | – | | | | 21.17 | | | | 10.95 | | | | 8,468 | | | | 1.55 | | | | 1.55 | | | | (0.28 | ) |
| R4 | | | 19.19 | | | | 0.01 | | | | 2.17 | | | | 2.18 | | | | – | | | | – | | | | – | | | | 21.37 | | | | 11.36 | | | | 35,421 | | | | 1.21 | | | | 1.21 | | | | 0.05 | |
| R5 | | | 19.28 | | | | 0.02 | | | | 2.22 | | | | 2.24 | | | | – | | | | – | | | | – | | | | 21.52 | | | | 11.62 | | | | 11,967 | | | | 0.92 | | | | 0.92 | | | | 0.20 | |
| Y | | | 19.31 | | | | 0.10 | | | | 2.18 | | | | 2.28 | | | | – | | | | – | | | | – | | | | 21.59 | | | | 11.81 | | | | 172,228 | | | | 0.80 | | | | 0.80 | | | | 0.50 | |
| (A) | Information presented relates to a share outstanding throughout the indicated period. Net investment income (loss) per share amounts are calculated based on average shares outstanding unless otherwise noted. |
| (B) | Assumes initial investment at net asset value at the beginning of each period, reinvestment of all distributions, the complete redemption of the investment at net asset value at the end of each period and no sales charge. Total return would be reduced if sales charges were taken into account. |
| (C) | Adjustments include waivers and reimbursements, if applicable. Ratios do not include fees paid indirectly (see Expenses in the accompanying Notes to Financial Statements). |
| (D) | Class L was merged into Class A on August 5, 2011. |
| (E) | Net investment income (loss) per share amounts have been calculated using the SEC method. |
| | | Portfolio Turnover
Rate for
All Share Classes | |
| For the Year Ended October 31, 2013 | | | 120 | %(A) |
| For the Year Ended October 31, 2012 | | | 116 | |
| For the Year Ended October 31, 2011 | | | 121 | |
| For the Year Ended October 31, 2010 | | | 115 | |
| For the Year Ended October 31, 2009 | | | 137 | |
| (A) | During the year ended October 31, 2013, The Hartford Growth Opportunities Fund incurred $2.8 million in sales of securities held associated with the transition of assets from The Hartford Fundamental Growth Fund, which merged into the Fund on February 22, 2013. These sales are excluded from the portfolio turnover rate calculation. |
| Report of Independent Registered Public Accounting Firm |
| The Board of Directors and Shareholders of |
| The Hartford Mutual Funds II, Inc. |
We have audited the accompanying statement of assets and liabilities, including the schedule of investments, of The Hartford Growth Opportunities Fund (one of the portfolios constituting The Hartford Mutual Funds II, Inc. (the Funds)) as of October 31, 2013, and the related statement of operations for the year then ended, the statements of changes in net assets for each of the two years in the period then ended, and the financial highlights for each of the five years in the period then ended. These financial statements and financial highlights are the responsibility of the Funds’ management. Our responsibility is to express an opinion on these financial statements and financial highlights based on our audits.
We conducted our audits in accordance with the standards of the Public Company Accounting Oversight Board (United States). Those standards require that we plan and perform the audit to obtain reasonable assurance about whether the financial statements and financial highlights are free of material misstatement. We were not engaged to perform an audit of the Funds’ internal control over financial reporting. Our audits included consideration of internal control over financial reporting as a basis for designing audit procedures that are appropriate in the circumstances, but not for the purpose of expressing an opinion on the effectiveness of the Funds’ internal control over financial reporting. Accordingly, we express no such opinion. An audit also includes examining, on a test basis, evidence supporting the amounts and disclosures in the financial statements and financial highlights, assessing the accounting principles used and significant estimates made by management, and evaluating the overall financial statement presentation. Our procedures included confirmation of securities owned as of October 31, 2013, by correspondence with the custodian and brokers or by other appropriate auditing procedures where replies from brokers were not received. We believe that our audits provide a reasonable basis for our opinion.
In our opinion, the financial statements and financial highlights referred to above present fairly, in all material respects, the financial position of The Hartford Growth Opportunities Fund of The Hartford Mutual Funds II, Inc. at October 31, 2013, the results of its operations for the year then ended, the changes in its net assets for each of the two years in the period then ended, and the financial highlights for each of the five years in the period then ended, in conformity with U.S. generally accepted accounting principles.
Minneapolis, MN
December 18, 2013
| The Hartford Growth Opportunities Fund |
| Directors and Officers (Unaudited) |
The Board of Directors of the Company appoints officers who are responsible for the day-to-day operations of the Fund and who execute policies formulated by the Directors. Each director serves until his or her death, resignation, or retirement or until the next annual meeting of shareholders is held or until his or her successor is elected and qualifies.
Directors and officers who are employed by or who have a financial interest in The Hartford are considered “interested” persons of the Fund pursuant to the 1940 Act. Each officer and two of the Company’s directors, as noted in the chart below, are “interested” persons of the Fund. Each director serves as a director for The Hartford Mutual Funds, Inc., The Hartford Mutual Funds II, Inc., Hartford Series Fund, Inc., and Hartford HLS Series Fund II, Inc., and as a trustee for The Hartford Alternative Strategies Fund, which, as of October 31, 2013, collectively consist of 89 funds. Correspondence may be sent to directors and officers c/o Hartford Funds, P.O. Box 2999, Hartford, Connecticut 06104-2999, except that correspondence to Mr. Annoni, Mr. Dressen, Ms. Fagely and Ms. Quade may be sent to 500 Bielenberg Drive, Woodbury, Minnesota 55125 and correspondence to Mr. Davey and Mr. Melcher may be sent to 5 Radnor Corporate Center, Suite 300, 100 Matsonford Road, Radnor, Pennsylvania 19087.
The table below sets forth, for each director and officer, his or her name, year of birth, current position with the Company and date first elected or appointed to The Hartford Mutual Funds, Inc. (“MF”) and The Hartford Mutual Funds II, Inc. (“MF2”), principal occupation, and, for directors, other directorships held. The Fund’s statement of additional information contains further information on the directors and is available free of charge by calling 1-888-843-7824 or writing to Hartford Funds, P.O. Box 64387, St. Paul, MN 55164-0387.
Information on the aggregate remuneration paid to the directors of the Company can be found in the Statement of Operations herein. The Fund pays to The Hartford a portion of the Chief Compliance Officer’s compensation, but does not pay salaries or compensation to any of its other officers or directors who are employed by The Hartford.
Non-Interested Directors
Lynn S. Birdsong (1946) Director since 2003, Co-Chairman of the Investment Committee
Mr. Birdsong is a private investor. Mr. Birdsong currently serves as a Director of the Sovereign High Yield Investment Company (April 2010 to current). Mr. Birdsong currently serves as an Independent Director of Nomura Partners Funds, Inc. (formerly, The Japan Fund) (March 2003 to current). From 1979 to 2002, Mr. Birdsong was a managing director of Zurich Scudder Investments, an investment management firm. During his employment with Scudder, Mr. Birdsong was an Interested Director of The Japan Fund. Since 1981, Mr. Birdsong has been a partner in Birdsong Company, an advertising specialty firm.
Robert M. Gavin, Jr. (1940) Director since 2002 (MF) and 1986 (MF2), Chairman of the Board since 2004
Dr. Gavin is an educational consultant. Prior to September 1, 2001, he was President of Cranbrook Education Community and prior to July 1996, he was President of Macalester College, St. Paul, Minnesota.
Duane E. Hill (1945) Director since 2001 (MF) and 2002 (MF2), Chairman of the Nominating Committee
Mr. Hill is Partner of TSG Ventures L.P., a private equity investment company. Mr. Hill is a former partner of TSG Capital Group, a private equity investment firm that served as sponsor and lead investor in leveraged buyouts of middle market companies.
Sandra S. Jaffee (1941) Director since 2005
Ms. Jaffee is the founder and Chief Executive Officer of a private company, Homeworks Concierge, LLC, which provides residential property management services in Westchester County, New York (January 2012 to present). Ms. Jaffee served as Chairman (2008 to 2009) and Chief Executive Officer of Fortent (formerly Searchspace Group), a leading provider of compliance/regulatory technology to financial institutions from August 2005 to August 2009. Ms. Jaffee currently serves as a member of the Board of Directors of Broadridge Financial Solutions as well as a Trustee of Muhlenberg College.
William P. Johnston (1944) Director since 2005, Chairman of the Compliance Committee
In February 2008, Mr. Johnston was elected to the Board of Directors of HCR-ManorCare, Inc. In August 2007, Mr. Johnston was elected to the Board of Directors of LifeCare Holdings, Inc. In July 2006, Mr. Johnston was elected to the Board of Directors of MultiPlan, Inc. and served as a director (July 2006 to August 2010). In June 2006, Mr. Johnston was appointed as Senior Advisor to The Carlyle Group, a global private equity and alternative asset investment firm. In May 2006, Mr. Johnston was elected to the Supervisory Board of Fresenius Medical Care AG & Co. KGaA, after its acquisition of Renal Care Group, Inc. in March 2006.
Phillip O. Peterson (1944) Director since 2002 (MF) and 2000 (MF2), Chairman of the Audit Committee
Mr. Peterson is a mutual fund industry consultant. He was a partner of KPMG LLP (an accounting firm) until July 1999. Mr. Peterson joined William Blair Funds in February 2007 as a member of the Board of Trustees. Mr. Peterson also joined the Board of Trustees of Symetra Variable Mutual Funds Trust as a trustee in February 2012.
Lemma W. Senbet (1946) Director since 2005
Dr. Senbet is the William E. Mayer Chair Professor of Finance and Director, Center for Financial Policy, at the University of Maryland, Robert H. Smith School of Business. He was chair of the Finance Department from 1998 to 2006. Previously he was a chaired professor of finance at the University of Wisconsin-Madison. Also, he was director of the Fortis Funds from March 2000 to July 2002. Dr. Senbet served the finance profession in various capacities, including as director of the American Finance Association and President of the Western Finance Association. In 2006, Dr. Senbet was inducted Fellow of Financial Management Association International for his career-long distinguished scholarship and professional service.
Interested Directors and Officers
James E. Davey (1964) Director since 2012, President and Chief Executive Officer since 2010
Mr. Davey serves as Executive Vice President of Hartford Life Insurance Company (“HLIC”) and The Hartford Financial Services Group, Inc. Additionally, Mr. Davey serves as Chairman of the Board and Manager of Hartford Funds Distributors, LLC (“HFD”) and Director and Chairman of the Board of Hartford Administrative Services Company (“HASCO”). Mr. Davey also serves as Manager, President and Chairman of the Board for Hartford Funds Management Company, LLC (“HFMC”). Mr. Davey joined The Hartford in 2002.
Lowndes A. Smith (1939) Director since 1996 (MF) and 2002 (MF2), Co-Chairman of the Investment Committee
Mr. Smith served as Vice Chairman of The Hartford from February 1997 to January 2002, as President and Chief Executive Officer of Hartford Life, Inc. from February 1997 to January 2002, and as President and Chief Operating Officer of The Hartford Life Insurance Companies from January 1989 to January 2002. Mr. Smith serves as a Director of White Mountains Insurance Group, Ltd., One Beacon Insurance and Symetra Financial and as Managing Director of Whittington Gray Associates.
Other Officers
Mark A. Annoni (1964) Vice President, Controller and Treasurer since 2012
Mr. Annoni serves as the Assistant Vice President of HLIC (February 2004 to present). Mr. Annoni joined The Hartford in April 2001 as part of The Hartford’s acquisition of Fortis Financial Group (“Fortis”).
Michael R. Dressen (1963) AML Compliance Officer since 2011
Mr. Dressen currently serves as Assistant Vice President of HLIC. He also serves as Chief Compliance Officer and AML Compliance Officer of HASCO and as AML Officer of HFD. Mr. Dressen joined The Hartford in 2005 from State Farm Insurance Companies where he held various positions related to mutual funds, variable products, and property casualty insurance.
Tamara L. Fagely (1958) Vice President since 2002 (MF) and 1993 (MF2) (1)
Currently, Ms. Fagely is President and a Director of HASCO, Chief Administrative Officer and Manager of HFMC and a Vice President of HLIC. Ms. Fagely served as a Vice President of HASCO (1998-2013) and Chief Financial Officer of HASCO (2006-2013). She served as Assistant Vice President of HLIC from December 2001 through March 2005. In addition, Ms. Fagely is Manager and Chief Operating Officer of HFD.
(1) Ms. Fagley will be retiring on December 31, 2013.
Edward P. Macdonald (1967) Vice President, Secretary and Chief Legal Officer since 2005
Mr. Macdonald serves as Vice President of HLIC and Vice President, Chief Legal Officer and Secretary of HFD and HASCO. Mr. Macdonald also serves as Manager, Vice President, Chief Legal Officer and Secretary of HFMC. Mr. Macdonald joined The Hartford in 2005.
Joseph G. Melcher (1973) Vice President and Chief Compliance Officer since 2013
Mr. Melcher currently serves as Vice President of HFMC and HFD. Mr. Melcher joined The Hartford in 2012 from Touchstone Investments, a member of the Western & Southern Financial Group, where he held the position of Vice President and Chief Compliance Officer from 2010 through 2012 and Assistant Vice President, Compliance from 2005 to 2010.
Vernon J. Meyer (1964) Vice President since 2006
Mr. Meyer serves as Senior Vice President of HLIC. He also serves as Senior Vice President of HFMC and HFD. Mr. Meyer joined The Hartford in 2004.
| The Hartford Growth Opportunities Fund |
| Directors and Officers (Unaudited) – (continued) |
Laura S. Quade (1969) Vice President since 2012
Ms. Quade currently serves as Vice President of HASCO and is a Director of Mutual Fund Service Operations. She also serves as Director, Enterprise Operations of HFD and HLIC. Ms. Quade joined The Hartford in 2001 as part of The Hartford’s acquisition of Fortis.
Martin A. Swanson (1962) Vice President since 2010
Mr. Swanson is a Vice President of HLIC. Mr. Swanson also serves as Vice President and Chief Marketing Officer for HFD. Prior to joining HLIC in 1998, Mr. Swanson was a Vice President at PaineWebber, Inc.
HOW TO OBTAIN A COPY OF THE FUND’S PROXY VOTING POLICIES AND VOTING RECORDS (UNAUDITED)
A description of the policies and procedures that the Fund uses to determine how to vote proxies relating to portfolio securities and information about how the Fund voted proxies relating to portfolio securities during the most recent twelve-month period ended June 30 are available (1) without charge, upon request, by calling 888-843-7824 and (2) on the SEC’s website at http://www.sec.gov.
QUARTERLY PORTFOLIO HOLDINGS INFORMATION (UNAUDITED)
The Fund files a complete schedule of portfolio holdings with the SEC for the first and third quarters of each fiscal year on Form N-Q. The Fund’s Forms N-Q are available (1) without charge, upon request, by calling 888-843-7824 and (2) on the SEC’s website at http://www.sec.gov. The Form N-Q may be reviewed and copied at the SEC’s Public Reference Room in Washington, DC. Information on the operation of the Public Reference Room may be obtained by calling 1-800-SEC-0330.
| The Hartford Growth Opportunities Fund |
| Federal Tax Information (Unaudited) |
For the fiscal year ended October 31, 2013, there is no further federal tax information required for this Fund.
| The Hartford Growth Opportunities Fund |
| Expense Example (Unaudited) |
Your Fund's Expenses
As a shareholder of the Fund, you incur two types of costs: (1) transaction costs, including sales charges (loads) on purchase payments, if any, and contingent deferred sales charges (CDSC), if any, and (2) ongoing costs, including investment management fees, distribution and/or service (12b-1) fees, if any, and other fund expenses. This example is intended to help you understand your ongoing costs (in dollars) of investing in the Fund and to compare these costs with the ongoing costs of investing in other mutual funds. The example is based on an investment of $1,000 invested at the beginning of the period and held for the period of April 30, 2013 through October 31, 2013.
Actual Expenses
The first set of columns of the table below provides information about actual account values and actual expenses. You may use the information in this column, together with the amount you invested, to estimate the expenses that you paid over the period. Simply divide your account value by $1,000 (for example, an $8,600 account value divided by $1,000 = 8.6), then multiply the result by the number in the line under the heading entitled “Expenses Paid During Period” to estimate the expenses you paid on your account during this period.
Hypothetical Example for Comparison Purposes
The second set of columns of the table below provides information about hypothetical account values and hypothetical expenses based on the Fund's actual expense ratio and an assumed rate of return of 5% per year before expenses, which is not the Fund's actual return. The hypothetical account values and expenses may not be used to estimate the actual ending account balance or expenses you paid for the period. You may use this information to compare the ongoing costs of investing in the Fund and other funds. To do so, compare this 5% hypothetical example with the 5% hypothetical examples that appear in the shareholder reports of the other funds.
Please note that the expenses shown in the table are meant to highlight your ongoing costs only and do not reflect any transactional costs, such as sales charges (loads) and CDSC. Therefore, the second set of columns of the table is useful in comparing ongoing costs only, and will not help you determine the relative total costs of owning different funds. In addition, if these transactional costs were included, your costs would be higher. Expenses are equal to the Fund's annualized expense ratios multiplied by average account value over the period, multiplied by 184/365 (to reflect the one-half year period).
| | | Actual return | | | Hypothetical (5% return before expenses) | | | | | | | | |
| | | Beginning
Account Value
April 30, 2013 | | | Ending Account
Value
October 31, 2013 | | | Expenses paid
during the period
April 30, 2013
through
October 31, 2013 | | | Beginning
Account Value
April 30, 2013 | | | Ending Account
Value
October 31, 2013 | | | Expenses paid
during the
period
April 30, 2013
through
October 31, 2013 | | | Annualized
expense
ratio | | | Days in
the
current
1/2
year | | Days
in the
full
year |
| Class A | | $ | 1,000.00 | | | $ | 1,156.00 | | | $ | 6.39 | | | $ | 1,000.00 | | | $ | 1,019.28 | | | $ | 5.98 | | | | 1.18 | % | | 184 | | 365 |
| Class B | | $ | 1,000.00 | | | $ | 1,151.20 | | | $ | 10.64 | | | $ | 1,000.00 | | | $ | 1,015.32 | | | $ | 9.96 | | | | 1.96 | | | 184 | | 365 |
| Class C | | $ | 1,000.00 | | | $ | 1,151.30 | | | $ | 10.29 | | | $ | 1,000.00 | | | $ | 1,015.64 | | | $ | 9.64 | | | | 1.90 | | | 184 | | 365 |
| Class I | | $ | 1,000.00 | | | $ | 1,157.40 | | | $ | 5.01 | | | $ | 1,000.00 | | | $ | 1,020.56 | | | $ | 4.69 | | | | 0.92 | | | 184 | | 365 |
| Class R3 | | $ | 1,000.00 | | | $ | 1,154.30 | | | $ | 7.88 | | | $ | 1,000.00 | | | $ | 1,017.89 | | | $ | 7.38 | | | | 1.45 | | | 184 | | 365 |
| Class R4 | | $ | 1,000.00 | | | $ | 1,156.10 | | | $ | 6.25 | | | $ | 1,000.00 | | | $ | 1,019.40 | | | $ | 5.86 | | | | 1.15 | | | 184 | | 365 |
| Class R5 | | $ | 1,000.00 | | | $ | 1,157.60 | | | $ | 4.63 | | | $ | 1,000.00 | | | $ | 1,020.92 | | | $ | 4.33 | | | | 0.85 | | | 184 | | 365 |
| Class Y | | $ | 1,000.00 | | | $ | 1,158.40 | | | $ | 4.10 | | | $ | 1,000.00 | | | $ | 1,021.41 | | | $ | 3.84 | | | | 0.75 | | | 184 | | 365 |
| The Hartford Growth Opportunities Fund |
| Approval of Investment Management and Investment Sub-Advisory Agreements (Unaudited) |
Section 15(c) of the Investment Company Act of 1940, as amended (the “1940 Act”), requires that each mutual fund’s board of directors, including a majority of those directors who are not “interested persons” of the mutual fund, as defined in the 1940 Act (the “Independent Directors”), annually review and consider the continuation of the mutual fund’s investment advisory and sub-advisory agreements. At its meeting held on August 6-7, 2013, the Board of Directors (the “Board”) of The Hartford Mutual Funds II, Inc., including each of the Independent Directors, unanimously voted to approve the continuation of the investment management agreement for The Hartford Growth Opportunities Fund (the “Fund”) with Hartford Funds Management Company, LLC (“HFMC”) and the continuation of the investment sub-advisory agreement between HFMC and the Fund’s sub-adviser, Wellington Management Company, LLP (the “Sub-adviser,” and together with HFMC, the “Advisers”) (collectively, the “Agreements”).
In the months preceding the August 6-7, 2013 meeting, the Board requested, received, and reviewed written responses from the Advisers to questions posed to them on behalf of the Independent Directors and supporting materials relating to those questions and responses. The Board considered information furnished to the Board at its meetings throughout the year, as well as information specifically prepared in connection with the annual approval of the Agreements at the Board’s meetings held on June 18-19, 2013 and August 6-7, 2013. Information provided to the Board at its meetings throughout the year included, among other things, reports on Fund performance, legal and compliance matters, sales and marketing activity, shareholder services, and the other services provided to the Fund by the Advisers and their affiliates. The Board also received in-person presentations by Fund officers and representatives of HFMC at the Board’s meetings on June 18-19, 2013 and August 6-7, 2013 concerning the Agreements.
The Independent Directors, advised by independent legal counsel, engaged two service providers to assist them with evaluating the Agreements with respect to the Fund. Lipper Inc. (“Lipper”), an independent provider of investment company data, was retained to provide the Board with reports on how the Fund’s contractual management fees, actual management fees, other non-management fees, overall expense ratios and investment performance compared to those of mutual funds with similar investment objectives. The Independent Directors also engaged an independent financial services consulting firm (the “Consultant”) to assist them in evaluating the Fund’s management fees, sub-advisory fees, other non-management fees, overall expense ratios and investment performance.
In determining whether to continue the Agreements for the Fund, the members of the Board reviewed and evaluated information and factors they believed to be relevant and appropriate in light of the information that the Board deemed necessary and appropriate through the exercise of its reasonable business judgment. While individual members of the Board may have weighed certain factors differently, the Board’s determination to continue the Agreements was based on a comprehensive consideration of all information provided to the Board throughout the year and specifically with respect to the continuation of the Agreements. A more detailed discussion of the factors the Board considered with respect to its approval of the Agreements is provided below.
Nature, Extent, and Quality of Services Provided by the Advisers
The Board requested and considered information concerning the nature, extent, and quality of the services provided to the Fund by the Advisers. The Board considered, among other things, the terms of the Agreements and the range of services provided by the Advisers. The Board considered the Advisers’ professional personnel who provide services to the Fund, including each Adviser’s ability and experience in attracting and retaining qualified personnel to service the Fund. The Board considered each Adviser’s reputation and overall financial strength, as well as its willingness to consider and implement organizational and operational changes designed to improve services to the Fund. In addition, the Board considered the quality of each Adviser’s communications with the Board and responsiveness to Board inquiries.
The Board also requested and evaluated information concerning each Adviser’s regulatory and compliance environment. In this regard, the Board requested and reviewed information on each Adviser’s compliance policies and procedures, compliance history, and a report from the Fund’s Chief Compliance Officer on each Adviser’s compliance with applicable laws and regulations, including responses to regulatory developments and compliance issues raised by regulators. The Board also noted the Advisers’ support of the Fund’s compliance control structure, particularly the resources devoted by the Advisers in support of the Fund’s obligations pursuant to Rule 38a-1 under the 1940 Act.
| The Hartford Growth Opportunities Fund |
| Approval of Investment Management and Investment Sub-Advisory Agreements (Unaudited) – (continued) |
With respect to HFMC, the Board noted that under the Agreements, HFMC is responsible for the management of the Fund, including overseeing fund operations and service providers, and provides administrative services to the Fund as well as investment advisory services in connection with selecting, monitoring and supervising the Sub-adviser. The Board considered HFMC’s ongoing monitoring of people, process and performance, including its quarterly reviews of each of the Hartford Funds, semi-annual meetings with the leaders of each Fund’s portfolio management team, and oversight of the Funds’ approximately 60 portfolio managers. The Board recognized that HFMC has demonstrated a record of making changes to the management and/or strategies of the Funds when warranted. The Board considered HFMC’s oversight of the Sub-adviser’s investment approach and results, process for monitoring best execution of portfolio trades by the Sub-adviser, and approach to risk management with respect to the Fund and the service providers to the Fund. The Board also considered HFMC’s oversight of compliance with the Fund’s objective and policies as well as with applicable laws and regulations, noting that regulatory and other developments had over time led to an increase in the scope of HFMC’s services in this regard.
In addition, the Board considered HFMC’s ongoing commitment to review and rationalize the Hartford Funds product line-up and the expenses that HFMC had incurred in connection with fund combinations in recent years. The Board considered that HFMC or its affiliates are responsible for providing the Fund’s officers.
With respect to the Sub-adviser, who provides day-to-day portfolio management services, the Board considered the quality of the Fund’s portfolio managers, the Sub-adviser’s other investment personnel, its investment philosophy and process, investment research capabilities and resources, performance record, trade execution capabilities and experience. The Board considered the experience of the Fund’s portfolio managers, the number of accounts managed by the portfolio managers, and the Sub-adviser’s method for compensating the portfolio managers.
Based on these considerations, the Board concluded that it was satisfied with the nature, extent and quality of the services provided to the Fund by HFMC and the Sub-adviser.
Performance of the Fund and the Advisers
The Board considered the investment performance of the Fund. In this regard, the Board reviewed the performance of the Fund over different time periods presented in the materials and evaluated HFMC’s analysis of the Fund’s performance for these time periods. The Board considered information and materials provided to the Board by the Advisers concerning Fund performance, as well as information from Lipper comparing the investment performance of the Fund to an appropriate benchmark and universe of peer funds. The Board noted that the Fund’s performance was in the 1st quintile of its performance universe for the 1-year period, the 3rd quintile for the 3-year period and the 4th quintile for the 5-year period. The Board also noted that the Fund’s performance was above its benchmark for the 1-year period, in line with its benchmark for the 3-year period and below its benchmark for the 5-year period.
The Board considered the detailed investment analytics reports provided by Hartford Funds’ Investment Advisory Group throughout the year. These reports include, among other things, information on the Fund’s gross and net returns, the Fund’s investment performance relative to an appropriate benchmark and peer group, various statistics concerning the Fund’s portfolio, and a narrative summary of various factors affecting Fund performance. The Board considered the Advisers’ cooperation with the Investment Committee, which assists the Board in evaluating the performance of the Fund at periodic meetings throughout the year. The Board also considered the analysis provided by the Consultant relating to the Fund’s performance track record.
In light of all the considerations noted above, the Board concluded that it had continued confidence in HFMC’s and the Sub-adviser’s overall capabilities to manage the Fund.
Costs of the Services and Profitability of the Advisers
The Board reviewed information regarding HFMC’s cost to provide investment management and related services to the Fund and HFMC’s profitability, both overall and for the Fund, on a pre-tax basis without regard to distribution expenses. The Board also requested and reviewed information about the profitability to HFMC and its affiliates from all services provided to the Fund and all aspects of their relationship with the Fund. The Board also requested and received information relating to the operations and profitability of the Sub-adviser.
The Board considered the Consultant’s review of the profitability calculations utilized by HFMC in connection with the continuation of the investment management agreement, noting the Consultant’s view that Hartford Funds’ process for calculating and reporting Fund profitability is reasonable. In this regard, the Board noted that the Consultant had previously performed a full review of this process and reported that such process is sound and well within common industry practice.
Based on these considerations, the Board concluded that the profits anticipated to be realized by the Advisers and their affiliates from their relationships with the Fund would not be excessive.
Comparison of Fees and Services Provided by the Advisers
The Board considered comparative information with respect to the management fees to be paid by the Fund to HFMC and the total expense ratios of the Fund. The Board also considered comparative information with respect to the sub-advisory fees to be paid by HFMC to the Sub-adviser. In this regard, the Board requested and reviewed information from HFMC and the Sub-adviser relating to the management and sub-advisory fees, including the sub-advisory fee schedule for the Fund, and total operating expenses for the Fund. With respect to the sub-advisory fee schedule, the Board considered representations from HFMC and the Sub-adviser that the Sub-adviser’s fees were negotiated at arm’s length. The Board also reviewed information from Lipper comparing the Fund’s contractual management fees, actual management fees and overall expense ratios relative to a group of funds selected by Lipper, in consultation with the Consultant, and a broader universe of funds selected by Lipper. The Board noted that the Fund’s contractual management fee was in the 4th quintile of its expense group, while its actual management fee and total expenses (less 12b-1 and shareholder service fees) were in the 2nd quintile. The Board also noted that the Fund has an automatically renewable contractual expense cap on each share class, which HFMC has temporarily agreed to lower for certain share classes through February 28, 2014. The Board noted that this arrangement resulted in reimbursement of certain expenses incurred in 2012.
While the Board recognized that comparisons between the Fund and peer funds are imprecise, given the differing service levels and characteristics of mutual funds and the different business models and cost structures of the Advisers, the comparative information provided by Lipper assisted the Board in evaluating the reasonableness of the Fund’s management and sub-advisory fees and total operating expenses. In addition, the Board considered the analysis and recommendations of the Consultant relating to the Fund’s management and sub-advisory fees and total operating expenses.
Based on these considerations, the Board concluded that the Fund’s fees and total operating expenses, in conjunction with the information about quality of services, profitability, economies of scale, and other matters discussed, were reasonable in light of the services provided.
Economies of Scale
The Board requested and considered information regarding the Advisers’ realization of economies of scale with respect to the Fund and whether the fee levels reflect these economies of scale for the benefit of the Fund’s shareholders. The Board reviewed the breakpoints in the management fee schedule for the Fund, which reduce fee rates as Fund assets grow over time. The Board recognized that a fund with assets beyond the last breakpoint level will continue to benefit from economies of scale because additional assets are charged the lowest breakpoint fee resulting in lower overall effective management fee rates. The Board also considered that expense limitations and fee waivers that reduce the Fund’s expenses at all asset levels can have the same effect as breakpoints in sharing economies of scale with shareholders and provide protection from an increase in expenses if Fund assets decline. The Board recognized that a fee schedule that reaches a lower breakpoint quickly provides shareholders with the benefit of anticipated or potential economies of scale. The Board also considered that HFMC has been active in managing expenses, which has resulted in benefits being realized by shareholders as assets within the Hartford Funds family of funds have grown over time, including through lower transfer agent costs and other operating expenses.
The Board reviewed and evaluated materials from Lipper showing how management fee schedules of peer funds reflect economies of scale for the benefit of shareholders as a peer fund’s assets hypothetically increase over time. Based on information provided by HFMC, Lipper, and the Consultant, the Board recognized that there is no uniform methodology for establishing breakpoints or uniform pattern in asset levels that trigger breakpoints or the amounts of breakpoints triggered.
| The Hartford Growth Opportunities Fund |
| Approval of Investment Management and Investment Sub-Advisory Agreements (Unaudited) – (continued) |
After considering all of the information available to it, the Board concluded that it was satisfied with the extent to which economies of scale would be shared for the benefit of the Fund’s shareholders based on currently available information and the effective advisory fees and expense ratios for the Fund at its current and reasonably anticipated asset levels. The Board noted, however, that it would continue to monitor future growth in Fund assets and the appropriateness of additional breakpoints.
Other Benefits
The Board considered other benefits to the Advisers and their affiliates from their relationships with the Fund.
The Board reviewed information noting that HFMC receives fees for fund accounting and related services from the Fund, and the Board considered information on profits to HFMC for such services. The Board also considered that Hartford Administrative Services Company (“HASCO”), the Fund’s transfer agent and an affiliate of HFMC, receives transfer agency compensation from the Fund, and the Board reviewed information on the profitability of the Fund’s transfer agency function to HASCO. The Board considered information provided by HASCO indicating that the transfer agent fees charged by HASCO to the Fund were fair and reasonable based on publicly available information.
The Board also considered that Hartford Funds Distributors, LLC (“HFD”), an affiliate of HFMC, serves as principal underwriter of the Fund. As principal underwriter, HFD receives 12b-1 fees from the Fund and receives all or a portion of the sales charges on sales or redemptions of certain classes of shares. The Board also noted that certain affiliates of HFD distribute shares of the Fund and receive compensation in that connection.
The Board considered benefits to the Sub-adviser from its use of the Fund’s brokerage commissions to obtain soft dollar research, and representations from HFMC and the Sub-adviser that the Sub-adviser would not make any revenue-sharing payments or any other type of distribution payments to HFMC or its affiliates.
The Board considered the benefits to shareholders of being part of the Hartford Funds family of funds, including the right to exchange investments between the same class of funds without a sales charge, the ability to reinvest Fund dividends into other funds in the family, and the ability to combine holdings in the Fund with holdings in other funds to obtain a reduced sales charge. The Board considered HFMC’s efforts to provide investors in the family with a broad range of investment styles and asset classes and its entrepreneurial risk in initiating new funds to expand these opportunities for shareholders.
* * * *
Based upon its review of these various factors, among others, the Board concluded that it is in the best interests of the Fund and its shareholders for the Board to approve the Agreements for an additional year. In reaching this decision, the Board did not assign relative weights to the factors discussed above or deem any one or group of them to be controlling in and of themselves. In connection with their deliberations, the Independent Directors met separately in executive session on several occasions, with independent legal counsel and the Consultant, to review the relevant materials and consider their responsibilities under relevant laws and regulations.
| The Hartford Growth Opportunities Fund |
| Main Risks (Unaudited) |
The main risks of investing in the Fund are described below.
Market, Selection, and Strategy Risk: The Fund’s share price may fluctuate due to market risk and/or security selections that may underperform the market or relevant benchmarks. If the sub-adviser’s investment strategy does not perform as expected, the Fund could underperform its peers or lose money. There is no guarantee the Fund will achieve its stated objective.
Growth Investing Risk: Growth investments can be volatile, and may fail to increase earnings or grow as quickly as anticipated. Growth-style investing falls in and out of favor, which may result in periods of underperformance.
Foreign Investment Risk: Foreign investments can be riskier than U.S. investments. Potential risks include currency risk that may result from unfavorable exchange rates, liquidity risk if decreased demand for a security makes it difficult to sell at the desired price, and risks that stem from substantially lower trading volume on foreign markets.
Mid-cap Stock Risk: Mid-cap stocks are generally more volatile and risky and may be less liquid than large-cap stocks because they may have limited operating histories, narrow product lines, and focus on niche markets.
Active Trading Risk: Actively trading investments may result in higher costs and higher taxable income.
HARTFORDFUNDS
hartfordfunds.com
This information is written in connection with the promotion or marketing of the matter(s) addressed in this material.
This report is submitted for the general information of the shareholders of the Fund. It is not authorized for distribution unless preceded or accompanied by a current prospectus for the Fund.
The information cannot be used or relied upon for the purpose of avoiding IRS penalties. These materials are not intended to provide tax, accounting or legal advice. As with all matters of a tax or legal nature, you should consult your own tax or legal counsel for advice.
Investors should carefully consider the investment objectives, risks, charges, and expenses of Hartford Funds before investing. This and other information can be found in the prospectus and summary prospectus, which can be obtained by calling 888-843-7824 (retail) or 877-836-5854 (institutional). Investors should read them carefully before they invest.
Hartford Funds are underwritten and distributed by Hartford Funds Distributors, LLC.
MFAR-GO13 12/13 113983-1 Printed in U.S.A. ©2013 The Hartford, Hartford, CT 06155
HARTFORDFUNDS
| THE HARTFORD SMALLCAP GROWTH FUND
2013 Annual Report |
The Hartford SmallCap Growth Fund
Table of Contents
The views expressed in the Fund’s Manager Discussion under ‘‘Why did the Fund perform this way?’’ and ‘‘What is the outlook?’’ are views of the Fund’s sub-adviser and portfolio management team through the end of the period and are subject to change based on market and other conditions. The Fund’s Manager Discussion is for informational purposes only and does not represent an offer, recommendation or solicitation to buy, hold or sell any security. The specific securities identified and described, if any, do not represent all of the securities purchased or sold and you should not assume that investments in the securities identified and discussed will be profitable.
| The Hartford SmallCap Growth Fund inception 01/04/1988 |
| (sub-advised by Wellington Management Company, LLP) |
| |
| Investment objective – Seeks long-term capital appreciation. |
Performance Overview 10/31/03 - 10/31/13
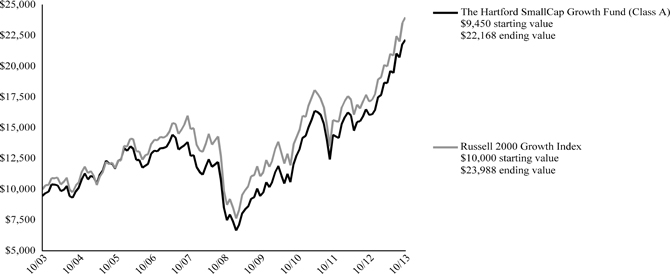
The chart above represents the hypothetical growth of a $10,000 investment in Class A which includes a sales charge. Growth results in classes other than Class A will vary from what is seen above due to differences in the expenses charged to those share classes.
Average Annual Total Returns (as of 10/31/13)
| | | 1 Year | | | 5 Years | | | 10 Years | |
| SmallCap Growth A# | | | 38.13% | | | | 21.03% | | | | 8.90% | |
| SmallCap Growth A## | | | 30.54% | | | | 19.67% | | | | 8.29% | |
| SmallCap Growth B# | | | 37.12% | | | | 20.19% | | | | 8.32%* | |
| SmallCap Growth B## | | | 32.12% | | | | 19.99% | | | | 8.32%* | |
| SmallCap Growth C# | | | 37.21% | | | | 20.12% | | | | 8.07% | |
| SmallCap Growth C## | | | 36.21% | | | | 20.12% | | | | 8.07% | |
| SmallCap Growth I# | | | 38.66% | | | | 21.30% | | | | 9.06% | |
| SmallCap Growth R3# | | | 37.90% | | | | 20.72% | | | | 8.85% | |
| SmallCap Growth R4# | | | 38.31% | | | | 21.04% | | | | 9.05% | |
| SmallCap Growth R5# | | | 38.70% | | | | 21.40% | | | | 9.27% | |
| SmallCap Growth Y# | | | 38.85% | | | | 21.49% | | | | 9.33% | |
| Russell 2000 Growth Index | | | 39.84% | | | | 19.27% | | | | 9.14% | |
| * | Class B shares convert to Class A shares after 8 years. The return shown reflects the conversion to Class A shares, which had different operating expenses, for the period after conversion. |
PERFORMANCE DATA QUOTED REPRESENTS PAST PERFORMANCE AND DOES NOT GUARANTEE FUTURE RESULTS. The investment return and principal value of the investment will fluctuate so that investors’ shares, when redeemed, may be worth more or less than their original cost. Current performance may be lower or higher than the performance data quoted. To obtain performance data current to the most recent month-end, please visit our website www.hartfordfunds.com.
The initial investment in Class A shares reflects the maximum sales charge of 5.50% and returns for Classes B and C reflect a contingent deferred sales charge of 5.00% and 1.00%, respectively.
Total returns presented above were calculated using the Fund’s net asset value available to shareholders for sale or redemption of Fund shares on October 31, 2013, which may exclude investment transactions as of this date. All share class returns assume the reinvestment of all distributions at net asset value and the deduction of all fund expenses.
Effective 9/30/09, Class B shares of the Fund were closed to new investments. Performance information includes performance under the Fund’s previous sub-adviser, Hartford Investment Management Company, using a modified strategy. On or about July 21, 2010, Hartford Investment Management Company no longer served as the sub-adviser to the Fund.
Class I shares commenced operations on 8/31/06. Performance prior to that date is that of the Fund's Class A shares (excluding sales charges), which had different operating expenses. Class R3, R4 and R5 shares commenced operations on 12/22/06. Performance prior to that date is that of the Fund's Class Y shares which had different operating expenses.
Russell 2000 Growth Index is an unmanaged index of those Russell 2000 Index growth companies with higher price-to-book ratios and higher forecasted growth values. (The Russell 2000 Index is a broad-based unmanaged index comprised of 2,000 of the smallest U.S.-domiciled company common stocks (on the basis of capitalization) that are traded in the United States on the New York Stock Exchange, NYSE MKT LLC and Nasdaq.)
You cannot invest directly in an index.
The chart and table do not reflect the deductions of taxes that a shareholder would pay on Fund distributions or the redemption of Fund shares.
Performance information may reflect historical or current expense waivers/reimbursements from the investment adviser, without which performance would have been lower. For information on current expense waivers/reimbursements, please see the prospectus.
| The Hartford SmallCap Growth Fund |
| Manager Discussion |
| October 31, 2013 (Unaudited) |
Operating Expenses*
| | | Net | | | Gross | |
| SmallCap Growth Class A | | | 1.40% | | | | 1.48% | |
| SmallCap Growth Class B | | | 2.15% | | | | 2.44% | |
| SmallCap Growth Class C | | | 2.15% | | | | 2.17% | |
| SmallCap Growth Class I | | | 1.11% | | | | 1.11% | |
| SmallCap Growth Class R3 | | | 1.60% | | | | 1.67% | |
| SmallCap Growth Class R4 | | | 1.30% | | | | 1.32% | |
| SmallCap Growth Class R5 | | | 1.00% | | | | 1.05% | |
| SmallCap Growth Class Y | | | 0.89% | | | | 0.89% | |
| * | As of the Fund's current prospectus dated March 1, 2013. Actual expenses may be higher. Please see accompanying Financial Highlights for expense ratios for the year ended October 31, 2013. |
Gross expenses are the Fund's total annual operating expenses shown in the Fund's most recent prospectus. Net expenses are the Fund's total annual operating expenses shown in the Fund's most recent prospectus and reflect contractual expense reimbursements in instances when these reductions reduce the Fund's gross expenses. Contractual reimbursements remain in effect until February 28, 2014 and automatically renew for one-year terms unless terminated.
All investments are subject to risk including the possible loss of principal. For a discussion of the Fund’s risks, please see the Main Risks section. For more detailed information on the risks associated with an investment in the Fund, please see the prospectus.
| Portfolio Managers | |
| Mammen Chally, CFA | David J. Elliot, CFA |
| Vice President and Equity Portfolio Manager | Vice President, Co-Director of Quantitative Investments, Director of Quantitative Portfolio Management and Portfolio Manager |
How did the Fund perform?
The Class A shares of The Hartford SmallCap Growth Fund returned 38.13%, before sales charge, for the twelve-month period ended October 31, 2013, underperforming the Fund’s benchmark, the Russell 2000 Growth Index, which returned 39.84% for the same period. The Fund outperformed the 37.51% average return of the Lipper Small-Cap Growth Funds peer group, a group of funds with investment strategies similar to those of the Fund.
Why did the Fund perform this way?
Despite clear signs of political dysfunction in Washington, U.S. equities surged during the period (+27%) and reached a new all-time high during October (as measured by the S&P 500 Index). From its closing low on March 9, 2009, the S&P 500 ended October 2013 up over 159%. There have been a few hiccups during the rally, including in August 2013, where U.S. stocks suffered their worst month of the year amid heightened geopolitical risks stemming from the widening conflict in Syria. In September, the Federal Open Market Committee’s decision to leave the pace of its monthly asset purchases unchanged at $85 billion surprised many investors and contributed to the burgeoning risk appetites among many market participants. This continued highly accommodative monetary policy, along with solid earnings results and an upward trending housing market, overshadowed the 16-day government shutdown and near breach of the U.S. debt ceiling. Investors applauded the last-minute deal to end the fiscal stalemate in Washington; however, the U.S. Congress only extended the debt ceiling until February 7 and funded the government through January 15, so we may revisit the political dysfunction early in 2014. Investors also cheered the nomination of Janet Yellen to become the next head of the U.S. Federal Reserve (Fed); she is widely viewed as more likely to maintain the Fed’s current monetary policy than outgoing chairman Ben Bernanke.
Small cap (+36%) stocks outperformed large cap stocks (+27%) during the period, as measured by the Russell 2000 and S&P 500 Indices, respectively. Value (+29%) stocks performed in line with Growth (+29%) stocks during the period, as measured by the Russell 3000 Value and Russell 3000 Growth Indices. All 10 sectors in the Russell 2000 Growth Index had positive returns during the period. The Industrials (+45%), Consumer Staples (+43%), and Telecommunication Services (+43%) sectors performed best, while Utilities (+9%), Materials (+25%), and Financials (+37%) lagged on a relative basis.
Sector allocation, driven by our bottom-up stock selection, was a main driver of relative underperformance during the period, in part due to an overweight to the Utilities sector and an underweight to the Telecommunication Services sector. A modest cash position also detracted from relative results in an upward trending equity market. Security selection modestly contributed to relative performance during the period. Positive security selection within Industrials, Consumer Discretionary, and Health Care more than offset negative selection within the Information Technology, Financials, and Consumer Staples sectors.
The top relative detractors included Model N (Information Technology), LivePerson (Information Technology), and Elizabeth Arden (Consumer Staples). Rigel Pharmaceutical (Health Care) was among the Fund’s top detractors on an absolute basis. Shares of Model N, a provider of revenue
| The Hartford SmallCap Growth Fund |
| Manager Discussion – (continued) |
| October 31, 2013 (Unaudited) |
management solutions for the life science and technology industries, declined during the period after the company lowered its 2014 fiscal year revenue outlook due to sales execution issues, along with the departure of its head of sales. LivePerson provides online engagement solutions that facilitate real-time assistance. Shares declined following soft earnings guidance and news the company would acquire Australian cloud communication solution provider Engage. Shares of Elizabeth Arden, a beauty products company, declined after management issued disappointing earnings guidance for the fiscal second quarter.
The top absolute and relative contributors to performance were Ubiquiti Networks (Information Technology), NPS Pharmaceuticals (Health Care), and Fifth & Pacific (Consumer Discretionary). Ubiquiti Networks designs, manufactures, and sells broadband wireless solutions worldwide. Shares rose as the firm reported better-than-expected revenue and earnings for the second quarter of 2013. Additionally, management significantly increased revenue and earnings guidance for the third quarter. Shares of NPS Pharmaceuticals, a U.S.-based drug developer focused on creating and marketing "orphan drugs" for the treatment of rare diseases, increased due to a strong launch for the company's Gattex drug. Fifth & Pacific is a designer of retail-based premium apparel and accessories brands. Fifth & Pacific results exceeded market expectations with new data indicating a stabilization of corporate costs and strong wholesale growth at Kate Spade and Lucky Jeans.
Derivatives are not used in a significant manner in this Fund and did not have a material impact on performance during the period.
What is the outlook?
U.S. Federal government spending has been consolidating this year, and we expect the recent partial government shutdown will cut into fourth quarter activity. Still, we expect the U.S. economy should still be in the sweet spot of its expansion phase with stronger growth (albeit modest absolute growth), a lower fiscal deficit, but limited inflationary pressures. It has been five years since the global financial crisis, giving the U.S. credit system, what we believe to be, ample time for healing. The combination of a reduction in household debt and historic lows in interest rates has resulted in a reduction of household debt burdens that we believe usually mark the beginning of a consumer spending recovery. U.S. consumer spending seemed to soften over the last few months, and we expect it could continue to soften in the months ahead. In our opinion, this scenario is even more likely if the government budget and debt ceiling crisis resumes in early 2014. However, we are encouraged by strength in employment trends and cautiously optimistic that the consumer slowdown is a temporary phenomenon that will reverse in 2014.
At the end of the period, the Fund’s largest overweights were to Industrials, Energy, and Financials, while the Fund remained underweight to the Health Care, Information Technology, and Consumer Staples sectors relative to the benchmark.
| Diversification by Sector |
| as of October 31, 2013 |
| Sector | | Percentage of
Net Assets | |
| Equity Securities | | | | |
| Consumer Discretionary | | | 16.8 | % |
| Consumer Staples | | | 4.3 | |
| Energy | | | 4.9 | |
| Financials | | | 10.3 | |
| Health Care | | | 17.9 | |
| Industrials | | | 17.4 | |
| Information Technology | | | 22.2 | |
| Materials | | | 4.3 | |
| Services | | | 0.2 | |
| Utilities | | | 0.3 | |
| Total | | | 98.6 | % |
| Short-Term Investments | | | 1.7 | |
| Other Assets and Liabilities | | | (0.3 | ) |
| Total | | | 100.0 | % |
A sector may be comprised of several industries. For Fund compliance purposes, the Fund may not use the same classification system and these sector classifications are used for reporting ease.
| The Hartford SmallCap Growth Fund |
| Schedule of Investments |
| October 31, 2013 |
| (000’s Omitted) |
| Shares or Principal Amount | | Market Value ╪ | |
| COMMON STOCKS - 96.1% | | | | |
| | | | | Automobiles and Components - 1.7% | | | | |
| | 166 | | | Dana Holding Corp. | | $ | 3,255 | |
| | 99 | | | Tenneco Automotive, Inc. ● | | | 5,243 | |
| | | | | | | | 8,498 | |
| | | | | Banks - 2.0% | | | | |
| | 5 | | | Bofi Holding, Inc. ● | | | 278 | |
| | 110 | | | EverBank Financial Corp. | | | 1,659 | |
| | 85 | | | First Merchants Corp. | | | 1,606 | |
| | 62 | | | Flushing Financial Corp. | | | 1,251 | |
| | 40 | | | MGIC Investment Corp. ● | | | 326 | |
| | 6 | | | Nationstar Mortgage Holdings, Inc. ● | | | 293 | |
| | 5 | | | Ocwen Financial Corp. ● | | | 301 | |
| | 103 | | | Umpqua Holdings Corp. | | | 1,687 | |
| | 51 | | | Wintrust Financial Corp. | | | 2,234 | |
| | | | | | | | 9,635 | |
| | | | | Capital Goods - 12.0% | | | | |
| | 62 | | | A.O. Smith Corp. | | | 3,220 | |
| | 78 | | | AAON, Inc. | | | 2,100 | |
| | 17 | | | Aceto Corp. | | | 266 | |
| | 37 | | | Acuity Brands, Inc. | | | 3,721 | |
| | 28 | | | Aircastle Ltd. | | | 521 | |
| | 15 | | | Albany International Corp. Class A | | | 537 | |
| | 90 | | | Altra Holdings, Inc. | | | 2,746 | |
| | 48 | | | Applied Industrial Technologies, Inc. | | | 2,287 | |
| | 62 | | | Astronics Corp. ● | | | 3,058 | |
| | 12 | | | Astronics Corp. Class B | | | 602 | |
| | 55 | | | AZZ, Inc. | | | 2,483 | |
| | 27 | | | Belden, Inc. | | | 1,805 | |
| | 35 | | | Chart Industries, Inc. ● | | | 3,758 | |
| | 6 | | | Coleman Cable, Inc. | | | 140 | |
| | 7 | | | DXP Enterprises, Inc. ● | | | 634 | |
| | 12 | | | EnerSys, Inc. | | | 816 | |
| | 12 | | | Enpro Industries, Inc. ● | | | 712 | |
| | 20 | | | Esterline Technologies Corp. ● | | | 1,620 | |
| | 25 | | | Franklin Electric Co., Inc. | | | 935 | |
| | 10 | | | General Cable Corp. | | | 326 | |
| | 150 | | | GrafTech International Ltd. ● | | | 1,337 | |
| | 67 | | | Heico Corp. | | | 3,570 | |
| | 2 | | | John Bean Technologies Corp. | | | 63 | |
| | 38 | | | Lennox International, Inc. | | | 2,952 | |
| | 25 | | | Lindsay Corp. | | | 1,899 | |
| | 39 | | | Meritor, Inc. ● | | | 267 | |
| | 63 | | | Moog, Inc. Class A ● | | | 3,774 | |
| | 79 | | | Mueller Water Products, Inc. | | | 679 | |
| | 5 | | | National Presto Industries, Inc. | | | 360 | |
| | 50 | | | Polypore International, Inc. ● | | | 2,278 | |
| | 4 | | | Proto Laboratories, Inc. ● | | | 294 | |
| | 48 | | | Sun Hydraulics Corp. | | | 1,918 | |
| | 55 | | | Taser International, Inc. ● | | | 969 | |
| | 34 | | | Teledyne Technologies, Inc. ● | | | 3,009 | |
| | 10 | | | Trex Co., Inc. ● | | | 695 | |
| | 50 | | | Trimas Corp. ● | | | 1,907 | |
| | 2 | | | Woodward, Inc. | | | 92 | |
| | 12 | | | Xerium Technologies, Inc. ● | | | 139 | |
| | | | | | | | 58,489 | |
| | | | | Commercial and Professional Services - 3.5% | | | | |
| | 8 | | | Barrett Business Services, Inc. | | | 650 | |
| | 90 | | | Deluxe Corp. | | | 4,216 | |
| | 12 | | | Enernoc, Inc. ● | | | 201 | |
| | 44 | | | Exponent, Inc. | | | 3,354 | |
| | 81 | | | GP Strategies Corp. ● | | | 2,270 | |
| | 7 | | | Kforce, Inc. | | | 144 | |
| | 87 | | | On Assignment, Inc. ● | | | 2,953 | |
| | 19 | | | RPX Corp. ● | | | 330 | |
| | 34 | | | Steelcase, Inc. | | | 552 | |
| | 10 | | | Sykes Enterprises, Inc. ● | | | 191 | |
| | 6 | | | UniFirst Corp. | | | 617 | |
| | 33 | | | Wageworks, Inc. ● | | | 1,705 | |
| | | | | | | | 17,183 | |
| | | | | Consumer Durables and Apparel - 3.8% | | | | |
| | 54 | | | Arctic Cat, Inc. | | | 2,853 | |
| | 24 | | | Blyth, Inc. | | | 334 | |
| | 22 | | | Brunswick Corp. | | | 997 | |
| | 5 | | | Cherokee, Inc. | | | 74 | |
| | 128 | | | Fifth & Pacific Cos., Inc. ● | | | 3,395 | |
| | 17 | | | Iconix Brand Group, Inc. ● | | | 624 | |
| | 28 | | | La-Z-Boy, Inc. | | | 651 | |
| | 201 | | | Leapfrog Enterprises, Inc. ● | | | 1,718 | |
| | 41 | | | Nautilus Group, Inc. ● | | | 329 | |
| | 8 | | | Polaris Industries, Inc. | | | 1,032 | |
| | 46 | | | Skullcandy, Inc. ● | | | 291 | |
| | 110 | | | Steven Madden Ltd. ● | | | 4,018 | |
| | 5 | | | Sturm Ruger & Co., Inc. | | | 314 | |
| | 79 | | | Taylor Morrison Home Corp. ● | | | 1,763 | |
| | | | | | | | 18,393 | |
| | | | | Consumer Services - 5.6% | | | | |
| | 8 | | | American Public Education, Inc. ● | | | 320 | |
| | 136 | | | Bloomin' Brands, Inc. ● | | | 3,395 | |
| | 33 | | | Boyd Gaming Corp. ● | | | 343 | |
| | 17 | | | Bravo Brio Restaurant Group ● | | | 252 | |
| | 11 | | | Bridgepoint Education, Inc. ● | | | 214 | |
| | 62 | | | Brinker International, Inc. | | | 2,734 | |
| | 27 | | | Buffalo Wild Wings, Inc. ● | | | 3,806 | |
| | 17 | | | Caesars Entertainment Corp. ● | | | 293 | |
| | 14 | | | Caesars Entertainment Corp. Rights † | | | 32 | |
| | 12 | | | Capella Education Co. ● | | | 756 | |
| | 23 | | | Cheesecake Factory, Inc. | | | 1,087 | |
| | 79 | | | Del Frisco's Restaurant Group, Inc. ● | | | 1,438 | |
| | 15 | | | Domino's Pizza, Inc. | | | 972 | |
| | 4 | | | Grand Canyon Education, Inc. ● | | | 175 | |
| | 126 | | | Ignite Restaurant Group, Inc. ● | | | 2,022 | |
| | 10 | | | ITT Educational Services, Inc. ● | | | 385 | |
| | 10 | | | Krispy Kreme Doughnuts, Inc. ● | | | 235 | |
| | 66 | | | Marriott Vacations Worldwide Corp. ● | | | 3,317 | |
| | 16 | | | Multimedia Games Holding Co., Inc. ● | | | 530 | |
| | 67 | | | Sotheby's Holdings | | | 3,475 | |
| | 5 | | | Strayer Education, Inc. | | | 210 | |
| | 40 | | | Texas Roadhouse, Inc. | | | 1,094 | |
| | | | | | | | 27,085 | |
| | | | | Diversified Financials - 1.6% | | | | |
| | 30 | | | BGC Partners, Inc. | | | 157 | |
| | 1 | | | Credit Acceptance Corp. ● | | | 142 | |
| | 121 | | | DFC Global Corp. ● | | | 1,468 | |
| | 21 | | | FXCM, Inc. | | | 344 | |
| | 8 | | | Green Dot Corp. ● | | | 161 | |
| | 45 | | | HFF, Inc. | | | 1,104 | |
| | 35 | | | Portfolio Recovery Associates, Inc. ● | | | 2,092 | |
| | 6 | | | Regional Management Corp. ● | | | 198 | |
The accompanying notes are an integral part of these financial statements.
| The Hartford SmallCap Growth Fund |
| Schedule of Investments – (continued) |
| October 31, 2013 |
| (000’s Omitted) |
| Shares or Principal Amount | | Market Value ╪ | |
| COMMON STOCKS - 96.1% - (continued) | | | | |
| | | | | Diversified Financials - 1.6% - (continued) | | | | |
| | 13 | | | Springleaf Holdings, Inc. ● | | $ | 272 | |
| | 33 | | | Walter Investment Management Corp. ● | | | 1,265 | |
| | 23 | | | Wisdomtree Investment, Inc. ● | | | 323 | |
| | 1 | | | World Acceptance Corp. ● | | | 135 | |
| | | | | | | | 7,661 | |
| | | | | Energy - 4.9% | | | | |
| | 9 | | | Carrizo Oil & Gas, Inc. ● | | | 390 | |
| | 8 | | | CVR Energy, Inc. | | | 302 | |
| | 7 | | | Delek U.S. Holdings, Inc. | | | 181 | |
| | 131 | | | Energy XXI (Bermuda) Ltd. | | | 3,798 | |
| | 53 | | | EPL Oil & Gas, Inc. ● | | | 1,702 | |
| | 65 | | | Exco Resources, Inc. | | | 353 | |
| | 23 | | | Goodrich Petroleum Corp. ● | | | 526 | |
| | 102 | | | ION Geophysical Corp. ● | | | 472 | |
| | 104 | | | Jones Energy, Inc. ● | | | 1,662 | |
| | 116 | | | Kodiak Oil & Gas Corp. ● | | | 1,510 | |
| | 75 | | | PBF Energy, Inc. | | | 1,979 | |
| | 5 | | | REX American Resources Corp. ● | | | 133 | |
| | 130 | | | Rex Energy Corp. ● | | | 2,787 | |
| | 70 | | | Rosetta Resources, Inc. ● | | | 4,220 | |
| | 7 | | | Seacor Holdings, Inc. | | | 636 | |
| | 43 | | | SemGroup Corp. | | | 2,623 | |
| | 19 | | | Synergy Resources Corp. ● | | | 199 | |
| | 63 | | | Vaalco Energy, Inc. ● | | | 331 | |
| | | | | | | | 23,804 | |
| | | | | Food and Staples Retailing - 1.9% | | | | |
| | 79 | | | Casey's General Stores, Inc. | | | 5,752 | |
| | 68 | | | Natural Grocers by Vitamin Cottage, Inc. ● | | | 2,716 | |
| | 94 | | | Rite Aid Corp. ● | | | 500 | |
| | 33 | | | Supervalu, Inc. ● | | | 235 | |
| | | | | | | | 9,203 | |
| | | | | Food, Beverage and Tobacco - 1.0% | | | | |
| | 126 | | | Darling International, Inc. ● | | | 2,925 | |
| | 6 | | | Lancaster Colony Corp. | | | 473 | |
| | 32 | | | Pilgrim's Pride Corp. ● | | | 450 | |
| | 9 | | | TreeHouse Foods, Inc. ● | | | 681 | |
| | 10 | | | Vector Group Ltd. | | | 165 | |
| | | | | | | | 4,694 | |
| | | | | Health Care Equipment and Services - 8.5% | | | | |
| | 23 | | | ABIOMED, Inc. ● | | | 549 | |
| | 6 | | | Addus Homecare Corp. ● | | | 145 | |
| | 24 | | | Align Technology, Inc. ● | | | 1,353 | |
| | 6 | | | Anika Therapeutics, Inc. ● | | | 170 | |
| | 7 | | | Atrion Corp. | | | 1,900 | |
| | 12 | | | Centene Corp. ● | | | 670 | |
| | 7 | | | Computer Programs & Systems, Inc. | | | 422 | |
| | 63 | | | Corvel Corp. ● | | | 2,624 | |
| | 40 | | | Cyberonics, Inc. ● | | | 2,337 | |
| | 10 | | | Cynosure, Inc. Class A ● | | | 214 | |
| | 137 | | | Dexcom, Inc. ● | | | 3,948 | |
| | 13 | | | Ensign Group, Inc. | | | 545 | |
| | 21 | | | Gentiva Health Services, Inc. ● | | | 235 | |
| | 170 | | | Globus Medical, Inc. ● | | | 3,263 | |
| | 114 | | | HealthSouth Corp. | | | 3,993 | |
| | 19 | | | Heartware International, Inc. ● | | | 1,405 | |
| | 43 | | | ICU Medical, Inc. ● | | | 2,685 | |
| | 18 | | | Magellan Health Services, Inc. ● | | | 1,045 | |
| | 7 | | | Medidata Solutions, Inc. ● | | | 761 | |
| | 12 | | | Molina Healthcare, Inc. ● | | | 370 | |
| | 23 | | | NuVasive, Inc. ● | | | 715 | |
| | 31 | | | Orthofix International N.V. ● | | | 635 | |
| | 9 | | | Providence Service Corp. ● | | | 254 | |
| | 45 | | | Quality Systems, Inc. | | | 1,029 | |
| | 38 | | | Team Health Holdings ● | | | 1,656 | |
| | 20 | | | Triple-S Management Corp., Class B ● | | | 354 | |
| | 84 | | | U.S. Physical Therapy, Inc. | | | 2,669 | |
| | 136 | | | Vascular Solutions, Inc. ● | | | 2,663 | |
| | 38 | | | Wellcare Health Plans, Inc. ● | | | 2,566 | |
| | | | | | | | 41,175 | |
| | | | | Household and Personal Products - 1.4% | | | | |
| | 64 | | | Elizabeth Arden, Inc. ● | | | 2,326 | |
| | 12 | | | Inter Parfums, Inc. | | | 419 | |
| | 7 | | | Medifast, Inc. ● | | | 173 | |
| | 6 | | | Nu Skin Enterprises, Inc. Class A | | | 713 | |
| | 97 | | | Prestige Brands Holdings, Inc. ● | | | 3,021 | |
| | 5 | | | Usana Health Sciences, Inc. ● | | | 314 | |
| | | | | | | | 6,966 | |
| | | | | Insurance - 1.5% | | | | |
| | 10 | | | American Equity Investment Life Holding Co. | | | 212 | |
| | 59 | | | Amerisafe, Inc. | | | 2,260 | |
| | 14 | | | AmTrust Financial Services, Inc. | | | 540 | |
| | 5 | | | Argo Group International Holdings Ltd. | | | 210 | |
| | 3 | | | Enstar Group Ltd. ● | | | 408 | |
| | 22 | | | Greenlight Capital Re Ltd. Class A ● | | | 690 | |
| | 16 | | | Maiden Holdings Ltd. | | | 180 | |
| | 24 | | | Montpelier Re Holdings Ltd. | | | 652 | |
| | 49 | | | Protective Life Corp. | | | 2,255 | |
| | | | | | | | 7,407 | |
| | | | | Materials - 4.3% | | | | |
| | 4 | | | Advanced Emissions Solutions, Inc. ● | | | 151 | |
| | 4 | | | AEP Industries, Inc. ● | | | 238 | |
| | 12 | | | Clearwater Paper Corp. ● | | | 621 | |
| | 23 | | | Ferro Corp. ● | | | 296 | |
| | 12 | | | FutureFuel Corp. | | | 204 | |
| | 72 | | | Gold Resource Corp. | | | 374 | |
| | 342 | | | Graphic Packaging Holding Co. ● | | | 2,874 | |
| | 238 | | | Headwaters, Inc. ● | | | 2,080 | |
| | 12 | | | Innospec, Inc. | | | 534 | |
| | 12 | | | KapStone Paper & Packaging Corp. | | | 603 | |
| | 22 | | | Landec Corp. ● | | | 261 | |
| | 19 | | | Minerals Technologies, Inc. | | | 1,083 | |
| | 61 | | | Olin Corp. | | | 1,363 | |
| | 7 | | | OM Group, Inc. ● | | | 231 | |
| | 175 | | | Omnova Solutions, Inc. ● | | | 1,524 | |
| | 118 | | | PolyOne Corp. | | | 3,563 | |
| | 17 | | | Schweitzer-Mauduit International, Inc. | | | 1,071 | |
| | 53 | | | Silgan Holdings, Inc. | | | 2,374 | |
| | 7 | | | Stepan Co. | | | 383 | |
| | 50 | | | SunCoke Energy, Inc. ● | | | 1,004 | |
| | 33 | | | Verso Paper Corp. ● | | | 24 | |
| | 14 | | | Walter Energy, Inc. | | | 216 | |
| | | | | | | | 21,072 | |
| | | | | Media - 0.3% | | | | |
| | 52 | | | Entravision Communications Corp. Class A | | | 348 | |
| | 6 | | | Shutterstock, Inc. ● | | | 389 | |
| | 5 | | | Sinclair Broadcast Group, Inc. Class A | | | 154 | |
| | 59 | | | Tremor Video, Inc. ● | | | 569 | |
| | | | | | | | 1,460 | |
The accompanying notes are an integral part of these financial statements.
| Shares or Principal Amount | | Market Value ╪ | |
| COMMON STOCKS - 96.1% - (continued) | | | | |
| | | | | Pharmaceuticals, Biotechnology and Life Sciences - 9.4% | | | | |
| | 11 | | | Acadia Pharmaceuticals, Inc. ● | | $ | 259 | |
| | 58 | | | Acorda Therapeutics, Inc. ● | | | 1,784 | |
| | 39 | | | Agios Pharmaceuticals, Inc. ● | | | 907 | |
| | 82 | | | Alkermes plc ● | | | 2,873 | |
| | 39 | | | Alnylam Pharmaceuticals, Inc. ● | | | 2,221 | |
| | 11 | | | AMAG Pharmaceuticals, Inc. ● | | | 308 | |
| | 10 | | | Arena Pharmaceuticals, Inc. ● | | | 45 | |
| | 141 | | | Bruker Corp. ● | | | 2,873 | |
| | 212 | | | Cadence Pharmaceuticals, Inc. ● | | | 1,045 | |
| | 7 | | | Cubist Pharmaceuticals, Inc. ● | | | 460 | |
| | 16 | | | Cumberland Pharmaceuticals, Inc. ● | | | 79 | |
| | 58 | | | Cytokinetics, Inc. ● | | | 349 | |
| | 49 | | | Durata Therapeutics, Inc. ● | | | 478 | |
| | 43 | | | Emergent Biosolutions, Inc. ● | | | 832 | |
| | 341 | | | Exelixis, Inc. ● | | | 1,683 | |
| | 13 | | | Genomic Health, Inc. ● | | | 389 | |
| | 69 | | | Hyperion Therapeutics, Inc. ● | | | 1,379 | |
| | 121 | | | Immunogen, Inc. ● | | | 1,993 | |
| | 36 | | | Immunomedics, Inc. ● | | | 137 | |
| | 64 | | | Infinity Pharmaceuticals, Inc. ● | | | 872 | |
| | 9 | | | Insys Therapeutics, Inc. ● | | | 359 | |
| | 91 | | | Ironwood Pharmaceuticals, Inc. ● | | | 877 | |
| | 15 | | | Isis Pharmaceuticals, Inc. ● | | | 509 | |
| | 20 | | | Lannet, Inc. ● | | | 475 | |
| | 30 | | | Luminex Corp. ● | | | 587 | |
| | 112 | | | Medicines Co. ● | | | 3,807 | |
| | 90 | | | NPS Pharmaceuticals, Inc. ● | | | 2,576 | |
| | 84 | | | PAREXEL International Corp. ● | | | 3,836 | |
| | 139 | | | PDL Biopharma, Inc. | | | 1,124 | |
| | 51 | | | Portola Pharmaceuticals, Inc. ● | | | 1,120 | |
| | 16 | | | Pozen, Inc. ● | | | 99 | |
| | 34 | | | Puma Biotechnology, Inc. ● | | | 1,315 | |
| | 8 | | | Questcor Pharmaceuticals, Inc. | | | 479 | |
| | 20 | | | Repligen Corp. ● | | | 219 | |
| | 32 | | | Salix Pharmaceuticals Ltd. ● | | | 2,324 | |
| | 29 | | | Santarus, Inc. ● | | | 670 | |
| | 12 | | | Sarepta Therapeutics, Inc. ● | | | 467 | |
| | 88 | | | Sciclone Pharmaceuticals, Inc. ● | | | 418 | |
| | 11 | | | Sucampo Pharmaceuticals, Inc. Class A ● | | | 69 | |
| | 36 | | | Sunesis Pharmaceuticals, Inc. ● | | | 179 | |
| | 61 | | | Tesaro, Inc. ● | | | 2,356 | |
| | 154 | | | Xenoport, Inc. ● | | | 805 | |
| | 55 | | | XOMA Corp. ● | | | 249 | |
| | | | | | | | 45,885 | |
| | | | | Real Estate - 2.7% | | | | |
| | 72 | | | Altisource Residential Corp. | | | 1,906 | |
| | 34 | | | American Realty Capital Properties, Inc. | | | 455 | |
| | 44 | | | Apollo Residential Mortgage, Inc. REIT | | | 669 | |
| | 60 | | | Coresite Realty Corp. REIT | | | 1,952 | |
| | 150 | | | Glimcher Realty Trust REIT | | | 1,533 | |
| | 24 | | | Mid-America Apartment Communities, Inc. REIT | | | 1,574 | |
| | 4 | | | National Health Investors, Inc. REIT | | | 225 | |
| | 85 | | | Ramco-Gershenson Properties Trust REIT | | | 1,378 | |
| | 44 | | | Sabra Healthcare REIT, Inc. | | | 1,183 | |
| | 177 | | | Sunstone Hotel Investors, Inc. REIT | | | 2,346 | |
| | | | | | | | 13,221 | |
| | | | | Retailing - 5.4% | | | | |
| | 8 | | | ANN, Inc. ● | | | 286 | |
| | 17 | | | Buckle (The), Inc. | | | 837 | |
| | 49 | | | Core-Mark Holding Co., Inc. | | | 3,466 | |
| | 31 | | | DSW, Inc. | | | 2,685 | |
| | 21 | | | Express, Inc. ● | | | 476 | |
| | 52 | | | Five Below, Inc. ● | | | 2,511 | |
| | 35 | | | Group 1 Automotive, Inc. | | | 2,265 | |
| | 10 | | | Hhgregg, Inc. ● | | | 149 | |
| | 76 | | | HSN, Inc. | | | 4,004 | |
| | 16 | | | Kirklands, Inc. ● | | | 286 | |
| | 9 | | | Lumber Liquidators Holdings, Inc. ● | | | 982 | |
| | 68 | | | Mattress Firm Holding Corp. ● | | | 2,039 | |
| | 32 | | | Nutrisystem, Inc. | | | 594 | |
| | 42 | | | Office Depot, Inc. ● | | | 235 | |
| | 25 | | | Orbitz Worldwide, Inc. ● | | | 233 | |
| | 8 | | | Overstock.com, Inc. ● | | | 185 | |
| | 27 | | | PetMed Express, Inc. | | | 395 | |
| | 215 | | | Pier 1 Imports, Inc. | | | 4,497 | |
| | 8 | | | Select Comfort Corp. ● | | | 146 | |
| | | | | | | | 26,271 | |
| | | | | Semiconductors and Semiconductor Equipment - 2.2% | | | | |
| | 38 | | | Entropic Communications, Inc. ● | | | 164 | |
| | 273 | | | GT Advanced Technologies, Inc. ● | | | 2,047 | |
| | 47 | | | Kulicke & Soffa Industries, Inc. ● | | | 609 | |
| | 33 | | | Lattice Semiconductor Corp. ● | | | 170 | |
| | 105 | | | Nanometrics, Inc. ● | | | 1,952 | |
| | 38 | | | Silicon Image, Inc. ● | | | 201 | |
| | 314 | | | SunEdison, Inc. ● | | | 2,921 | |
| | 13 | | | SunPower Corp. ● | | | 377 | |
| | 65 | | | TriQuint Semiconductor, Inc. ● | | | 514 | |
| | 75 | | | Ultratech Stepper, Inc. ● | | | 1,790 | |
| | | | | | | | 10,745 | |
| | | | | Software and Services - 16.2% | | | | |
| �� | 6 | | | Advent Software, Inc. | | | 215 | |
| | 94 | | | Aspen Technology, Inc. ● | | | 3,595 | |
| | 17 | | | AVG Technologies N.V. ● | | | 346 | |
| | 61 | | | Blackhawk Network Holdings, Inc. ● | | | 1,390 | |
| | 103 | | | Carbonite, Inc. ● | | | 1,359 | |
| | 58 | | | Cass Information Systems, Inc. | | | 3,300 | |
| | 31 | | | Commvault Systems, Inc. ● | | | 2,407 | |
| | 7 | | | comScore, Inc. ● | | | 179 | |
| | 15 | | | Comverse, Inc. ● | | | 464 | |
| | 35 | | | CSG Systems International, Inc. | | | 967 | |
| | 45 | | | Cvent, Inc. ● | | | 1,404 | |
| | 12 | | | CyrusOne, Inc. | | | 224 | |
| | 14 | | | Dice Holdings, Inc. ● | | | 103 | |
| | 35 | | | Digital River, Inc. ● | | | 619 | |
| | 19 | | | Egain Communications Corp. ● | | | 222 | |
| | 33 | | | Ellie Mae, Inc. ● | | | 964 | |
| | 80 | | | Exlservice Holdings, Inc. ● | | | 2,304 | |
| | 65 | | | Fair Isaac, Inc. | | | 3,730 | |
| | 66 | | | Fleetmatics Group Ltd. ● | | | 2,109 | |
| | 21 | | | Global Cash Access, Inc. ● | | | 173 | |
| | 81 | | | Heartland Payment Systems, Inc. | | | 3,280 | |
| | 156 | | | Higher One Holdings, Inc. ● | | | 1,241 | |
| | 52 | | | Imperva, Inc. ● | | | 1,977 | |
| | 88 | | | j2 Global, Inc. | | | 4,854 | |
| | 64 | | | LivePerson, Inc. ● | | | 601 | |
| | 48 | | | Manhattan Associates, Inc. ● | | | 5,141 | |
| | 212 | | | Mitek Systems, Inc. ● | | | 1,124 | |
| | 113 | | | Model N, Inc. ● | | | 1,019 | |
| | 87 | | | Netscout Systems, Inc. ● | | | 2,452 | |
The accompanying notes are an integral part of these financial statements.
| The Hartford SmallCap Growth Fund |
| Schedule of Investments – (continued) |
| October 31, 2013 |
| (000’s Omitted) |
| Shares or Principal Amount | | Market Value ╪ | |
| COMMON STOCKS - 96.1% - (continued) | | | | |
| | | | | Software and Services - 16.2% - (continued) | | | | |
| | 22 | | | NIC, Inc. | | $ | 547 | |
| | 58 | | | Opentable, Inc. ● | | | 4,019 | |
| | 24 | | | Pegasystems, Inc. | | | 931 | |
| | 110 | | | PTC, Inc. ● | | | 3,055 | |
| | 29 | | | QLIK Technologies, Inc. ● | | | 745 | |
| | 14 | | | Rosetta Stone, Inc. ● | | | 205 | |
| | 210 | | | Sapient Corp. ● | | | 3,316 | |
| | 27 | | | Silver Spring Networks, Inc. ● | | | 595 | |
| | 20 | | | Solarwinds, Inc. ● | | | 709 | |
| | 27 | | | Solera Holdings, Inc. | | | 1,491 | |
| | 14 | | | SS&C Technologies Holdings, Inc. ● | | | 562 | |
| | 9 | | | Stamps.com, Inc. ● | | | 404 | |
| | 65 | | | Synacor, Inc. ● | | | 152 | |
| | 11 | | | Syntel, Inc. | | | 901 | |
| | 76 | | | TiVo, Inc. ● | | | 1,006 | |
| | 17 | | | Travelzoo, Inc. ● | | | 362 | |
| | 44 | | | Tyler Corp. ● | | | 4,268 | |
| | 11 | | | Unisys Corp. ● | | | 290 | |
| | 31 | | | ValueClick, Inc. ● | | | 596 | |
| | 14 | | | Vistaprint N.V. ● | | | 778 | |
| | 52 | | | WebMD Health Corp. ● | | | 1,816 | |
| | 43 | | | WEX, Inc. ● | | | 4,031 | |
| | 32 | | | XO Group, Inc. ● | | | 447 | |
| | | | | | | | 78,989 | |
| | | | | Technology Hardware and Equipment - 3.8% | | | | |
| | 24 | | | Aruba Networks, Inc. ● | | | 444 | |
| | 14 | | | Audience, Inc. ● | | | 154 | |
| | 29 | | | Calix, Inc. ● | | | 298 | |
| | 78 | | | CDW Corp. of Delaware ● | | | 1,717 | |
| | 24 | | | Ciena Corp. ● | | | 556 | |
| | 16 | | | Coherent, Inc. | | | 1,054 | |
| | 22 | | | Comtech Telecommunications Corp. | | | 668 | |
| | 9 | | | Cray, Inc. ● | | | 208 | |
| | 37 | | | FEI Co. | | | 3,257 | |
| | 13 | | | Interdigital, Inc. | | | 484 | |
| | 88 | | | Oplink Communications, Inc. ● | | | 1,611 | |
| | 79 | | | Plantronics, Inc. | | | 3,375 | |
| | 9 | | | Plexus Corp. ● | | | 352 | |
| | 15 | | | Silicon Graphics International Corp. ● | | | 197 | |
| | 90 | | | Ubiquiti Networks, Inc. | | | 3,466 | |
| | 9 | | | ViaSat, Inc. ● | | | 602 | |
| | | | | | | | 18,443 | |
| | | | | Telecommunication Services - 0.2% | | | | |
| | 22 | | | IDT Corp. Class B | | | 479 | |
| | 22 | | | Inteliquent, Inc. | | | 284 | |
| | 12 | | | magicJack VocalTec Ltd. ● | | | 133 | |
| | | | | | | | 896 | |
| | | | | Transportation - 1.9% | | | | |
| | 4 | | | Alaska Air Group, Inc. | | | 282 | |
| | 2 | | | Allegiant Travel Co. | | | 167 | |
| | 108 | | | Avis Budget Group, Inc. ● | | | 3,395 | |
| | 80 | | | Celadon Group, Inc. | | | 1,487 | |
| | 43 | | | Hawaiian Holdings, Inc. ● | | | 355 | |
| | 14 | | | Heartland Express, Inc. | | | 205 | |
| | 87 | | | Marten Transport Ltd. | | | 1,534 | |
| | 3 | | | Park-Ohio Holdings Corp. ● | | | 141 | |
| | 20 | | | Republic Airways Holdings, Inc. ● | | | 231 | |
| | 13 | | | SkyWest, Inc. | | | 197 | |
| | 13 | | | Spirit Airlines, Inc. ● | | | 552 | |
| | 23 | | | Swift Transportation Co. ● | | | 497 | |
| | | | | | | | 9,043 | |
| | | | | Utilities - 0.3% | | | | |
| | 31 | | | UNS Energy Corp. | | | 1,518 | |
| | | | | | | | | |
| | | | | Total common stocks | | | | |
| | | | | (cost $383,020) | | $ | 467,736 | |
| | | | | | | | | |
| EXCHANGE TRADED FUNDS - 2.5% | | | | |
| | | | | Other Investment Pools and Funds - 2.5% | | | | |
| | 96 | | | iShares Russell 2000 Growth Index Fund | | $ | 12,222 | |
| | | | | | | | | |
| | | | | Total exchange traded funds | | | | |
| | | | | (cost $12,268) | | $ | 12,222 | |
| | | | | | | | | |
| | | | | Total long-term investments | | | | |
| | | | | (cost $395,288) | | $ | 479,958 | |
| | | | | | | | | |
| SHORT-TERM INVESTMENTS - 1.7% | | | | |
| Repurchase Agreements - 1.7% | | | | |
| | | | | Bank of America Merrill Lynch TriParty
Repurchase Agreement (maturing on
11/01/2013 in the amount of $654,
collateralized by FHLMC 4.50%, 2040,
FNMA 1.92% - 4.00%, 2036 - 2043, value
of $667) | | | | |
| $ | 654 | | | 0.10%, 10/31/2013 | | $ | 654 | |
| | | | | Bank of Montreal TriParty Repurchase
Agreement (maturing on 11/01/2013 in the
amount of $226, collateralized by FHLMC
4.00%, 2043, FNMA 2.00% - 6.00%, 2020 -
2043, GNMA 3.00%, 2043, value of $231) | | | | |
| | 226 | | | 0.09%, 10/31/2013 | | | 226 | |
| | | | | Barclays Capital TriParty Repurchase
Agreement (maturing on 11/01/2013 in the
amount of $1,048, collateralized by U.S.
Treasury Note 0.25% - 4.00%, 2015, value
of $1,069) | | | | |
| | 1,048 | | | 0.08%, 10/31/2013 | | | 1,048 | |
| | | | | Citigroup Global Markets, Inc. TriParty
Repurchase Agreement (maturing on
11/01/2013 in the amount of $2,973,
collateralized by U.S. Treasury Bill 0.01% -
0.35%, 2013 - 2014, U.S. Treasury Bond
2.75% - 8.75%, 2017 - 2042, U.S. Treasury
Note 0.25% - 4.75%, 2013 - 2022, value of
$3,032) | | | | |
| | 2,973 | | | 0.09%, 10/31/2013 | | | 2,973 | |
| | | | | Deutsche Bank Securities TriParty Repurchase
Agreement (maturing on 11/01/2013 in the
amount of $1,199, collateralized by
FHLMC 2.50% - 7.50%, 2026 - 2043,
FNMA 3.00% - 7.00%, 2026 - 2043,
GNMA 2.67% - 5.00%, 2024 - 2048, value
of $1,223) | | | | |
| | 1,199 | | | 0.12%, 10/31/2013 | | | 1,199 | |
The accompanying notes are an integral part of these financial statements.
| Shares or Principal Amount | | | | | Market Value ╪ | |
| SHORT-TERM INVESTMENTS - 1.7% - (continued) |
| Repurchase Agreements - 1.7% - (continued) |
| | | | | RBS Securities, Inc. TriParty Repurchase
Agreement (maturing on 11/01/2013 in the
amount of $707, collateralized by U.S.
Treasury Note 0.75% - 2.63%, 2014 - 2021,
value of $722) | | | | | | | | |
| $ | 707 | | | 0.09%, 10/31/2013 | | | | | | $ | 707 | |
| | | | | TD Securities TriParty Repurchase Agreement
(maturing on 11/01/2013 in the amount of
$1,245, collateralized by FNMA 2.50% -
4.00%, 2027 - 2042, GNMA 2.50%, 2043,
value of $1,272) | | | | | | | | |
| | 1,245 | | | 0.10%, 10/31/2013 | | | | | | | 1,245 | |
| | | | | UBS Securities, Inc. Repurchase Agreement
(maturing on 11/01/2013 in the amount of
$6, collateralized by U.S. Treasury Note
0.63%, 2017, value of $6) | | | | | | | | |
| | 6 | | | 0.09%, 10/31/2013 | | | | | | | 6 | |
| | | | | | | | | | | | 8,058 | |
| | | | | Total short-term investments | | | | | | | | |
| | | | | (cost $8,058) | | | | | | $ | 8,058 | |
| | | | | | | | | | | | | |
| | | | | Total investments | | | | | | | | |
| | | | | (cost $403,346) ▲ | | | 100.3 | % | | $ | 488,016 | |
| | | | | Other assets and liabilities | | | (0.3 | )% | | | (1,539 | ) |
| | | | | Total net assets | | | 100.0 | % | | $ | 486,477 | |
| Note: | Percentage of investments as shown is the ratio of the total market value to total net assets. |
| ▲ | At October 31, 2013, the cost of securities for federal income tax purposes was $405,033 and the aggregate gross unrealized appreciation and depreciation based on that cost were: |
| Unrealized Appreciation | | $ | 96,260 | |
| Unrealized Depreciation | | | (13,277 | ) |
| Net Unrealized Appreciation | | $ | 82,983 | |
| † | These securities were valued in good faith at fair value as determined under policies and procedures established by and under the supervision of the Company's Board of Directors. At October 31, 2013, the aggregate value of these securities was $32, which rounds to zero percent of total net assets. |
| ╪ | See Significant Accounting Policies of accompanying Notes to Financial Statements regarding valuation of securities. |
| GLOSSARY: (abbreviations used in preceding Schedule of Investments) |
| |
| Other Abbreviations: |
| FHLMC | Federal Home Loan Mortgage Corp. |
| FNMA | Federal National Mortgage Association |
| GNMA | Government National Mortgage Association |
| REIT | Real Estate Investment Trust |
The accompanying notes are an integral part of these financial statements.
| The Hartford SmallCap Growth Fund |
| Investment Valuation Hierarchy Level Summary |
| October 31, 2013 |
| (000’s Omitted) |
| | | Total | | | Level 1 ♦ | | | Level 2 ♦ | | | Level 3 | |
| Assets: | | | | | | | | | | | | | | | | |
| Common Stocks ‡ | | $ | 467,736 | | | $ | 467,704 | | | $ | – | | | $ | 32 | |
| Exchange Traded Funds | | | 12,222 | | | | 12,222 | | | | – | | | | – | |
| Short-Term Investments | | | 8,058 | | | | – | | | | 8,058 | | | | – | |
| Total | | $ | 488,016 | | | $ | 479,926 | | | $ | 8,058 | | | $ | 32 | |
| ♦ | For the year ended October 31, 2013, there were no transfers between Level 1 and Level 2. |
| ‡ | The Fund has all or primarily all of the equity securities categorized in a particular level. Refer to the Schedule of Investments for further industry breakout. |
Following is a reconciliation of Level 3 assets for which significant unobservable inputs were used to determine fair value:
| | | Balance
as of
October
31, 2012 | | | Realized
Gain
(Loss) | | | Change in
Unrealized
Appreciation
(Depreciation) | | | Net
Amortization | | | Purchases | | | Sales | | | Transfers
Into
Level 3 | | | Transfers Out of
Level 3 | | | Balance
as of
October
31, 2013 | |
| Assets: | | | | | | | | | | | | | | | | | | | | | | | | | | | | | | | | | | | | |
| Common Stocks | | $ | — | | | $ | — | | | $ | 32 | * | | $ | — | | | $ | — | | | $ | — | | | $ | — | | | $ | — | | | $ | 32 | |
| Total | | $ | — | | | $ | — | | | $ | 32 | | | $ | — | | | $ | — | | | $ | — | | | $ | — | | | $ | — | | | $ | 32 | |
| * | Change in unrealized appreciation (depreciation) in the current period relating to assets still held at October 31, 2013 was $32. |
| Note: | For purposes of reporting transfers between different hierarchy levels, both transfers in and out of each level, as applicable, are shown as if they occurred at the beginning of the period. |
The accompanying notes are an integral part of these financial statements.
| The Hartford SmallCap Growth Fund |
| Statement of Assets and Liabilities |
| October 31, 2013 (Unaudited) |
| (000’s Omitted) |
| Assets: | | | | |
| Investments in securities, at market value (cost $403,346) | | $ | 488,016 | |
| Cash | | | 2 | |
| Receivables: | | | | |
| Investment securities sold | | | 4,177 | |
| Fund shares sold | | | 1,598 | |
| Dividends and interest | | | 49 | |
| Other assets | | | 62 | |
| Total assets | | | 493,904 | |
| Liabilities: | | | | |
| Payables: | | | | |
| Investment securities purchased | | | 6,686 | |
| Fund shares redeemed | | | 560 | |
| Investment management fees | | | 73 | |
| Administrative fees | | | 1 | |
| Distribution fees | | | 20 | |
| Accrued expenses | | | 87 | |
| Total liabilities | | | 7,427 | |
| Net assets | | $ | 486,477 | |
| Summary of Net Assets: | | | | |
| Capital stock and paid-in-capital | | $ | 367,705 | |
| Distributions in excess of net investment income | | | (61 | ) |
| Accumulated net realized gain | | | 34,163 | |
| Unrealized appreciation of investments | | | 84,670 | |
| Net assets | | $ | 486,477 | |
| | | | | |
| Shares authorized | | | 27,000,000 | |
| Par value | | $ | 0.0001 | |
| Class A: Net asset value per share/Maximum offering price per share | | | $47.96/$50.75 | |
| Shares outstanding | | | 4,729 | |
| Net assets | | $ | 226,795 | |
| Class B: Net asset value per share | | $ | 40.45 | |
| Shares outstanding | | | 113 | |
| Net assets | | $ | 4,552 | |
| Class C: Net asset value per share | | $ | 40.08 | |
| Shares outstanding | | | 830 | |
| Net assets | | $ | 33,255 | |
| Class I: Net asset value per share | | $ | 48.67 | |
| Shares outstanding | | | 1,471 | |
| Net assets | | $ | 71,601 | |
| Class R3: Net asset value per share | | $ | 48.17 | |
| Shares outstanding | | | 172 | |
| Net assets | | $ | 8,280 | |
| Class R4: Net asset value per share | | $ | 49.06 | |
| Shares outstanding | | | 355 | |
| Net assets | | $ | 17,412 | |
| Class R5: Net asset value per share | | $ | 50.07 | |
| Shares outstanding | | | 71 | |
| Net assets | | $ | 3,579 | |
| Class Y: Net asset value per share | | $ | 50.36 | |
| Shares outstanding | | | 2,403 | |
| Net assets | | $ | 121,003 | |
The accompanying notes are an integral part of these financial statements.
| The Hartford SmallCap Growth Fund |
| Statement of Operations |
| For the Year Ended October 31, 2013 |
| (000’s Omitted) |
| Investment Income: | | | | |
| Dividends | | $ | 3,213 | |
| Interest | | | 5 | |
| Total investment income | | | 3,218 | |
| | | | | |
| Expenses: | | | | |
| Investment management fees | | | 2,625 | |
| Administrative services fees | | | | |
| Class R3 | | | 11 | |
| Class R4 | | | 11 | |
| Class R5 | | | 1 | |
| Transfer agent fees | | | | |
| Class A | | | 509 | |
| Class B | | | 23 | |
| Class C | | | 42 | |
| Class I | | | 68 | |
| Class R3 | | | 1 | |
| Class R4 | | | 1 | |
| Class R5 | | | — | |
| Class Y | | | 1 | |
| Distribution fees | | | | |
| Class A | | | 464 | |
| Class B | | | 45 | |
| Class C | | | 202 | |
| Class R3 | | | 26 | |
| Class R4 | | | 18 | |
| Custodian fees | | | 3 | |
| Accounting services fees | | | 52 | |
| Registration and filing fees | | | 90 | |
| Board of Directors' fees | | | 7 | |
| Audit fees | | | 14 | |
| Other expenses | | | 51 | |
| Total expenses (before waivers and fees paid indirectly) | | | 4,265 | |
| Expense waivers | | | — | |
| Transfer agent fee waivers | | | (10 | ) |
| Commission recapture | | | (9 | ) |
| Custodian fee offset | | | — | |
| Total waivers and fees paid indirectly | | | (19 | ) |
| Total expenses, net | | | 4,246 | |
| Net Investment Loss | | | (1,028 | ) |
| Net Realized Gain on Investments: | | | | |
| Net realized gain on investments | | | 39,346 | |
| Net Realized Gain on Investments | | | 39,346 | |
| Net Changes in Unrealized Appreciation of Investments: | | | | |
| Net unrealized appreciation of investments | | | 63,731 | |
| Net Changes in Unrealized Appreciation of Investments | | | 63,731 | |
| Net Gain on Investments | | | 103,077 | |
| Net Increase in Net Assets Resulting from Operations | | $ | 102,049 | |
The accompanying notes are an integral part of these financial statements.
| The Hartford SmallCap Growth Fund |
| Statement of Changes in Net Assets |
| |
| (000’s Omitted) |
| | | For the
Year Ended
October 31, 2013 | | | For the
Year Ended
October 31, 2012 | |
| Operations: | | | | | | | | |
| Net investment loss | | $ | (1,028 | ) | | $ | (1,538 | ) |
| Net realized gain on investments | | | 39,346 | | | | 37,887 | |
| Net unrealized appreciation (depreciation) of investments | | | 63,731 | | | | (11,816 | ) |
| Net Increase in Net Assets Resulting from Operations | | | 102,049 | | | | 24,533 | |
| Capital Share Transactions: | | | | | | | | |
| Class A | | | 12,864 | | | | (15,447 | ) |
| Class B | | | (1,605 | ) | | | (2,875 | ) |
| Class C | | | 13,693 | | | | (152 | ) |
| Class I | | | 38,931 | | | | 9,820 | |
| Class R3 | | | 2,943 | | | | 2,551 | |
| Class R4 | | | 11,156 | | | | 567 | |
| Class R5 | | | 2,885 | | | | 87 | |
| Class Y | | | 60,511 | | | | (97,509 | ) |
| Net increase (decrease) from capital share transactions | | | 141,378 | | | | (102,958 | ) |
| Net Increase (Decrease) in Net Assets | | | 243,427 | | | | (78,425 | ) |
| Net Assets: | | | | | | | | |
| Beginning of period | | | 243,050 | | | | 321,475 | |
| End of period | | $ | 486,477 | | | $ | 243,050 | |
| Undistributed (distribution in excess of) net investment income | | $ | (61 | ) | | $ | (1,495 | ) |
The accompanying notes are an integral part of these financial statements.
| The Hartford SmallCap Growth Fund |
| Notes to Financial Statements |
| October 31, 2013 |
| (000’s Omitted) |
The Hartford Mutual Funds II, Inc. (“Company”) is an open-end management investment company comprised of five portfolios. Financial statements for The Hartford SmallCap Growth Fund (the “Fund”), a series of the Company, are included in this report.
The Company is organized under the laws of the State of Maryland and is registered with the Securities and Exchange Commission ("SEC") under the Investment Company Act of 1940, as amended ("1940 Act"). The Fund’s portfolio managers are Mammen Chally (78.18%) and David J. Elliot (21.82%). The Fund is a diversified open-end management investment company.
Class A shares are sold with a front-end sales charge of up to 5.50%. Class B shares were sold with a contingent deferred sales charge which is assessed on the lesser of the per share net asset value (“NAV”) of the shares at the time of redemption or the original purchase price, and declines from up to 5.00% to zero depending on the period of time the shares are held (see note below regarding the closing of Class B shares). Class C shares are sold with a contingent deferred sales charge of up to 1.00% on shares redeemed within twelve months of purchase. Class I shares are sold without sales charges to certain eligible investors primarily through advisory fee-based wrap programs. Class R3, R4 and R5 shares, which are offered to employer-sponsored retirement plans, and Class Y shares, which are sold to certain eligible institutional investors, are sold without a sales charge. All classes of shares have identical voting, redemption, dividend, liquidation and other rights and the same terms and conditions, with the exceptions that each class may have different expenses, which may affect performance, and that Class B shares automatically convert to Class A shares after 8 years.
No new or additional investments are allowed in Class B shares of the Fund (including investments through any systematic investment plan). Existing shareholders of Class B shares may continue to hold their Class B shares, exchange their Class B shares for Class B shares of another Hartford Fund (as permitted by existing exchange privileges), or redeem their Class B shares as described in the Fund’s prospectus. Reinstatement privileges with respect to Class B shares will continue under the current policy. For investors electing to reinvest capital gains and dividends, any such capital gains or dividends on Class B shares will continue to be reinvested in Class B shares of the Fund. All Class B share attributes, including the 12b-1 fee, contingent deferred sales charge schedule, and conversion to Class A shares, remain unchanged.
| 2. | Significant Accounting Policies: |
The following is a summary of significant accounting policies of the Fund in the preparation of its financial statements, which are in accordance with United States Generally Accepted Accounting Principles (“U.S. GAAP”). The preparation of financial statements in accordance with U.S. GAAP may require management to make estimates and assumptions that affect the reported amounts of assets and liabilities and disclosure of contingent assets and liabilities at the date of the financial statements and the reported amounts of increases and decreases in net assets from operations during the reporting period. Actual results could differ from those estimates.
| a) | Determination of Net Asset Value – The NAV of each class of the Fund’s shares is determined as of the close of regular trading (normally 4:00 p.m. Eastern Time) (the “NYSE Close”) on each day that the New York Stock Exchange (the “Exchange”) is open (“Valuation Date”). Information that becomes known to the Fund after the NAV has been calculated on a particular day will not generally be used to retroactively adjust the NAV determined earlier that day. |
| b) | Investment Valuation and Fair Value Measurements – For purposes of calculating the NAV, portfolio investments and other assets held by the Fund's portfolio for which market quotes are readily available are valued at market value. Market value is generally determined on the basis of last reported sales prices or official close price. If no sales are reported, market value is based on quotes obtained from a quotation reporting system, established market makers, or independent |
pricing services. If market prices are not readily available or are deemed unreliable, the Fund will use the fair value of the investment as determined in good faith under policies and procedures established by and under the supervision of the Company’s Board of Directors. Market quotes are considered not readily available where there is an absence of current or reliable market-based data (e.g., trade information or indicative market quotes), including where events occur after the close of the relevant market, but prior to the NYSE Close, that materially affect the values of the Fund’s portfolio investments or assets. In addition, market quotes are considered not readily available when, due to extraordinary circumstances, the exchanges or markets on which the investments trade do not open for trading for the entire day and no other market prices are available. In addition, prices of foreign equities that are principally traded on certain foreign markets may be adjusted daily pursuant to a fair value pricing service approved by the Board of Directors in order to reflect an adjustment for the factors occurring after the close of certain foreign markets but before the NYSE Close. Investments that are primarily traded on foreign markets may trade on days that are not business days of the Fund. The value of the foreign investments in which the Fund invests may change on days when a shareholder will not be able to purchase or redeem shares of the Fund. Fair value pricing is subjective in nature and the use of fair value pricing by the Fund may cause the NAV of its shares to differ significantly from the NAV that would have been calculated using market prices at the close of the exchange on which a portfolio investment is primarily traded. There can be no assurance that the Fund could obtain the fair market value assigned to an investment if the Fund were to sell the investment at approximately the time at which the Fund determines its NAV.
Financial instruments for which prices are not available from an independent pricing service may be valued using market quotations obtained from one or more dealers that make markets in the respective financial instrument in accordance with procedures established by the Company’s Board of Directors.
U.S. GAAP defines fair value as the price that the Fund would receive to sell an asset or pay to transfer a liability in an orderly transaction between market participants. The U.S. GAAP fair value measurement standards require disclosure of a fair value hierarchy for each major category of assets and liabilities. Various inputs are used in determining the fair value of the Fund’s investments. These inputs are summarized into three broad hierarchy levels. This hierarchy is based on whether the valuation inputs are observable or unobservable. These levels are:
| · | Level 1 – Quoted prices in active markets for identical investments. Level 1 may include exchange traded instruments, such as domestic equities, some foreign equities, options, futures, mutual funds, exchange traded funds, rights and warrants. |
| · | Level 2 – Observable inputs other than Level 1 prices, such as quoted prices for similar investments; quoted prices in markets that are not active; or other inputs that are observable or can be corroborated by observable market data. Level 2 may include debt investments that are traded less frequently than exchange traded instruments and which are valued using independent pricing services; foreign equities, which are principally traded on certain foreign markets and are adjusted daily pursuant to a fair value pricing service in order to reflect an adjustment for the factors occurring after the close of certain foreign markets but before the NYSE Close; senior floating rate interests, which are valued using an aggregate of dealer bids; and short-term investments, which are valued at amortized cost. |
| · | Level 3 – Significant unobservable inputs that are supported by limited or no market activity. Level 3 may include financial instruments whose values are determined using indicative market quotes or require significant management judgment or estimation. These unobservable valuation inputs may include estimates for current yields, maturity/duration, prepayment speed, and indicative market quotes for comparable investments along with other assumptions relating to credit quality, collateral value, complexity of the investment structure, general market conditions and liquidity. This category may include investments where trading has been halted or there are certain restrictions on trading. While these investments are priced using unobservable inputs, the valuation of these investments reflects the best available data and management believes the prices are a reasonable representation of exit price. |
| The Hartford SmallCap Growth Fund |
| Notes to Financial Statements – (continued) |
| October 31, 2013 |
| (000’s Omitted) |
The Board of Directors of the Company generally reviews and approves the “Procedures for Valuation of Portfolio Securities” on an annual basis. These procedures define how investments are to be valued, including the formation and activities of a Valuation Committee. The Valuation Committee is responsible for determining in good faith the fair value of investments when the value cannot be obtained from primary pricing services or alternative sources or if the valuation of an investment as provided by the primary pricing service or alternative source is believed not to reflect the investment’s fair value as of the Valuation Date. Voting members of the Valuation Committee include the Fund’s Treasurer or designee and a Vice President of the investment manager or designee. An Assistant Vice President of the Fund with legal expertise or designee is also included on the Valuation Committee as a non-voting advisory member. In addition, the Fund’s Chief Compliance Officer shall designate a member of the compliance group to attend Valuation Committee meetings as a non-voting resource, to monitor for and provide guidance with respect to compliance with these procedures. Two members of the Valuation Committee or their designees, representing different departments, shall constitute a quorum for purposes of permitting the Valuation Committee to take action. The Valuation Committee will consider all relevant factors in determining an investment’s fair value, and may seek the advice of the Fund’s sub-adviser, knowledgeable brokers, and legal counsel in making such determination. The Valuation Committee reports to the Audit Committee of the Company’s Board of Directors. The Audit Committee receives quarterly written reports which include details of all fair-valued investments, including the reason for the fair valuation, and an indication, when possible, of the accuracy of the valuation by disclosing the next available reliable public price quotation or the disposition price of such investments (the “look-back” test). The Board of Directors then must consider for ratification all of the fair value determinations made during the previous quarter.
Valuation levels are not necessarily indicative of the risk associated with investing in such investments. Individual investments within any of the above mentioned asset classes may be assigned a different hierarchical level than those presented above, as individual circumstances dictate.
For additional information, refer to the Investment Valuation Hierarchy Level Summary and the Level 3 roll-forward reconciliation, if applicable, which follow the Schedule of Investments.
| c) | Investment Transactions and Investment Income – Investment transactions are recorded as of the trade date (the date the order to buy or sell is executed) for financial reporting purposes. Investments purchased or sold on a when-issued or delayed-delivery basis may be settled a month or more after the trade date. Realized gains and losses are determined on the basis of identified cost. |
Dividend income from domestic securities is accrued on the ex-dividend date. In general, dividend income from foreign securities is recorded on the ex-date; however, dividend notifications in certain foreign jurisdictions may not be available in a timely manner and as a result, the Fund will record the dividend as soon as the relevant details (i.e., rate per share, payment date, shareholders of record, etc.) are publicly available. Interest income, including amortization of premium and accretion of discounts, is accrued on a daily basis.
| d) | Joint Trading Account – The Fund may invest cash balances into a joint trading account that may be invested in one or more repurchase agreements. |
| e) | Fund Share Valuation and Dividend Distributions to Shareholders – Orders for the Fund’s shares are executed in accordance with the investment instructions of the shareholders. The NAV of the Fund’s shares is determined as of the close of business on each business day of the Exchange. The NAV is determined separately for each class of shares of the Fund by dividing the Fund’s net assets attributable to that class by the number of shares of the class outstanding. Each class of shares offered by the Fund has equal rights as to assets and voting privileges (except that shareholders of a class have exclusive voting rights regarding any matter relating solely to that class of shares). Income and non-class specific expenses are allocated daily to each class on the basis of the relative net assets of the class. Realized and unrealized gains and losses are allocated daily based on the relative net assets of each class of shares of the Fund. |
Orders for the purchase of the Fund’s shares received prior to the close of the Exchange on any day the Exchange is open for business are priced at the NAV determined as of the close of the Exchange. Orders received after the close of the Exchange, or on a day on which the Exchange and/or the Fund is not open for business, are priced at the next determined NAV.
Dividends are declared pursuant to a policy adopted by the Company’s Board of Directors based upon the investment performance of the Fund. The policy of the Fund is to pay dividends from net investment income and realized gains, if any, at least once a year.
Distributions from net investment income, net realized capital gains and capital are determined in accordance with federal income tax regulations, which may differ from U.S. GAAP with respect to character and timing. These differences may include but are not limited to losses deferred due to wash sale adjustments, foreign currency gains and losses, adjustments related to Passive Foreign Investment Companies (“PFICs”), Real Estate Investment Trusts (“REITs”), Regulated Investment Companies (“RICs”), certain derivatives and partnerships. Permanent book and federal income tax basis differences relating to shareholder distributions will result in reclassifications to certain of the Fund’s capital accounts (see Federal Income Taxes: Reclassification of Capital Accounts note).
| 3. | Securities and Other Investments: |
| a) | Repurchase Agreements – A repurchase agreement is an agreement by which a counterparty agrees to sell an investment and agrees to repurchase the investment sold from the buyer at a mutually agreed upon time and price. During the period of the repurchase agreement, the counterparty will deposit cash and or securities in a third party custodial account to serve as collateral. At the time the Fund enters into a repurchase agreement, the value of the underlying collateral, including accrued interest, will be equal to or exceed the value of the repurchase agreement. Repurchase agreements expose the Fund to counterparty risk - that is, the risk that the counterparty will not fulfill its obligations. To minimize counterparty risk, the investments that serve to collateralize the repurchase agreement are held by the Fund’s custodian in book entry or physical form in the custodial account of the Fund or in a third party custodial account. Repurchase agreements are valued at cost plus accrued interest, which approximates fair value. The Fund, as shown on the Schedule of Investments, had outstanding repurchase agreements as of October 31, 2013. |
The Fund may be exposed to counterparty risk, or the risk that an institution or other entity with which the Fund has unsettled or open transactions will default.
The market values of equity securities, such as common stocks and preferred stocks, or equity related investments, such as futures and options, may decline due to general market conditions which are not specifically related to a particular company, such as real or perceived adverse economic conditions, changes in the general outlook for corporate earnings, changes in interest or currency rates or adverse investor sentiment generally. The market value of equity securities may also decline due to factors which affect a particular industry or industries, such as labor shortages or increased production costs and competitive conditions within an industry. Equity securities and equity related investments generally have greater market price volatility than fixed income securities.
| a) | Federal Income Taxes – For federal income tax purposes, the Fund intends to continue to qualify as a RIC under Subchapter M of the Internal Revenue Code (“IRC”) by distributing substantially all of its taxable net investment income and net realized capital gains to its shareholders and otherwise complying with the requirements of the IRC. The Fund has distributed substantially all of its income and capital gains in prior years, if applicable, and intends to distribute |
| The Hartford SmallCap Growth Fund |
| Notes to Financial Statements – (continued) |
| October 31, 2013 |
| (000’s Omitted) |
substantially all of its income and capital gains during the calendar year ending December 31, 2013. Accordingly, no provision for federal income or excise taxes has been made in the accompanying financial statements. Distributions from short-term capital gains are treated as ordinary income distributions for federal income tax purposes.
| b) | Net Investment Income (Loss), Net Realized Gains (Losses) and Distributions – Net investment income (loss) and net realized gains (losses) may differ for financial statement and tax purposes primarily because of losses deferred due to wash sale adjustments, foreign currency gains and losses, adjustments related to PFICs, REITs, RICs, certain derivatives and partnerships. The character of distributions made during the year from net investment income or net realized gains may differ from their ultimate characterization for federal income tax purposes. Also, due to the timing of dividend distributions, the fiscal year in which amounts are distributed may differ from the year that the income or realized gains (losses) were recorded by the Fund. |
| c) | Components of Distributable Earnings – The Fund’s components of distributable earnings (deficit) on a tax basis at October 31, 2013, are as follows: |
| | | Amount | |
| Undistributed Ordinary Income | | $ | 11,827 | |
| Undistributed Long-Term Capital Gain | | | 23,962 | |
| Unrealized Appreciation * | | | 82,983 | |
| Total Accumulated Earnings | | $ | 118,772 | |
| * | Differences between book-basis and tax-basis unrealized appreciation (depreciation) may be attributable to the losses deferred due to wash sale adjustments, foreign currency gains and losses, adjustments related to PFICs, REITs, RICs, certain derivatives and partnerships. |
| d) | Reclassification of Capital Accounts – The Fund may record reclassifications in its capital accounts. These reclassifications have no impact on the total net assets of the Fund. The reclassifications are a result of permanent differences between U.S. GAAP and tax accounting for such items as foreign currency, PFICs, expiration or utilization of capital loss carryforwards or net operating losses. Adjustments are made to reflect the impact these items have on current and future distributions to shareholders. Therefore, the source of the Fund’s distributions may be shown in the accompanying Statement of Changes in Net Assets as from undistributed net investment income, from accumulated net realized gains on investments or from capital depending on the type of book and tax differences that exist. For the year ended October 31, 2013, the Fund recorded reclassifications to increase (decrease) the accounts listed below: |
| | | Amount | |
| Undistributed Net Investment Income | | $ | 2,462 | |
| Accumulated Net Realized Gain (Loss) | | | (2,450 | ) |
| Capital Stock and Paid-in-Capital | | | (12 | ) |
| e) | Capital Loss Carryforward – On December 22, 2010, the Regulated Investment Company Modernization Act of 2010 (the “Act”) was enacted, which made changes to the capital loss carryforward rules. The changes are effective for taxable years beginning after the date of enactment. Under the Act, funds are permitted to carry forward capital losses for an unlimited period. However, any losses incurred during those future taxable years will be required to be utilized prior to the losses incurred in pre-enactment taxable years, which carry an expiration date. As a result of this ordering rule, pre-enactment capital loss carryforwards may be more likely to expire unused. Additionally, post-enactment capital loss carryforwards retain their character as either short-term or long-term capital losses rather than being considered all short-term as permitted under prior regulation. |
The Fund had no capital loss carryforward for U.S. federal income tax purposes as of October 31, 2013.
During the year ended October 31, 2013, the Fund utilized $514 of prior year capital loss carryforwards.
| f) | Accounting for Uncertainty in Income Taxes – The Fund has adopted financial reporting rules that require the Fund to analyze all open tax years, as defined by the statute of limitations, for all major jurisdictions. Generally, tax authorities can examine all tax returns filed for the last three years. The Fund does not have an examination in progress. |
The Fund has reviewed all open tax years and major jurisdictions and concluded that these financial reporting rules had no effect on the Fund’s financial position or results of operations. There is no tax liability resulting from unrecognized tax benefits relating to uncertain income tax positions taken or expected to be taken on the tax return for the fiscal year ended October 31, 2013. The Fund is also not aware of any tax positions for which it is reasonably possible that the total amounts of unrecognized tax benefits will significantly change in the next twelve months.
| a) | Investment Management Agreement – Effective January 1, 2013, Hartford Funds Management Company, LLC (“HFMC”) replaced Hartford Investment Financial Services, LLC (“HIFSCO”) as the Fund’s investment manager. HFMC and HIFSCO are both indirect wholly owned subsidiaries of The Hartford Financial Services Group, Inc. (“The Hartford”). As of January 1, 2013, HFMC serves as investment manager to the Fund pursuant to an Investment Management Agreement with the Company. For the calendar year ended December 31, 2012, HIFSCO served as the Fund’s investment manager pursuant to a separate agreement between HIFSCO and the Company. The replacement of HIFSCO with HFMC did not result in any change to (i) the contractual terms of, including the fees payable under, the Fund’s investment management agreements; or (ii) the day-to-day management of the Fund. The investment manager has overall investment supervisory responsibility for the Fund. In addition, the investment manager provides administrative personnel, services, equipment, facilities and office space for proper operation of the Fund. HFMC has contracted with Wellington Management Company, LLP (“Wellington Management”) under a sub-advisory agreement for the provision of day-to-day investment management services to the Fund in accordance with the Fund’s investment objective and policies. The Fund pays a fee to the investment manager, a portion of which may be used to compensate Wellington Management. |
The schedule below reflects the rates of compensation paid to the investment manager for investment management services rendered as of October 31, 2013; the rates are accrued daily and paid monthly:
| Average Daily Net Assets | | Annual Fee | |
| On first $100 million | | | 0.90 | % |
| On next $150 million | | | 0.80 | % |
| On next $250 million | | | 0.70 | % |
| On next $4.5 billion | | | 0.65 | % |
| On next $5 billion | | | 0.63 | % |
| Over $10 billion | | | 0.62 | % |
| The Hartford SmallCap Growth Fund |
| Notes to Financial Statements – (continued) |
| October 31, 2013 |
| (000’s Omitted) |
| b) | Accounting Services Agreement – Effective January 1, 2013, HFMC replaced Hartford Life Insurance Company (“HLIC”) as provider of accounting services to the Fund. HLIC provided accounting services for the Fund for the calendar year ended December 31, 2012. The replacement of HLIC with HFMC did not result in any changes to the fund accounting services provided to the Fund or the fees charged to the Fund for such services. Pursuant to the Fund Accounting Agreement between HFMC and the Company, on behalf of the Fund, HFMC provides accounting services to the Fund and receives monthly compensation based on the Fund’s average daily net assets at the rates set forth below. The Fund’s accounting services fees are accrued daily and paid monthly. |
| Average Daily Net Assets | | Annual Fee | |
| On first $5 billion | | | 0.016 | % |
| On next $5 billion | | | 0.014 | % |
| Over $10 billion | | | 0.012 | % |
Effective November 1, 2013, the new accounting services fees schedule based on the Fund’s average daily net assets is as follows:
| Average Daily Net Assets | | Annual Fee | |
| On first $5 billion | | | 0.016 | % |
| On next $5 billion | | | 0.013 | % |
| Over $10 billion | | | 0.010 | % |
| c) | Operating Expenses – Allocable expenses incurred by the Company are allocated to each Fund and allocated to classes within the Fund in proportion to the average daily net assets of the Fund and each class, except where allocation of certain expenses is more fairly made directly to the Fund or to specific classes within a Fund. As of October 31, 2013, HFMC contractually limited the total operating expenses of this Fund, exclusive of taxes, interest expense, brokerage commissions, acquired fund fees and expenses and extraordinary expenses, through February 28, 2014 as follows: |
| Class A | | | Class B | | | Class C | | | Class I | | | Class R3 | | | Class R4 | | | Class R5 | | | Class Y | |
| | 1.40% | | | | 2.15% | | | | 2.15% | | | | 1.15% | | | | 1.60% | | | | 1.30% | | | | 1.00% | | | | 0.95% | |
| d) | Fees Paid Indirectly – The Fund has entered into agreements with State Street Global Markets, LLC and Russell Implementation Services, Inc. to partially recapture non-discounted trade commissions. Such rebates are used to pay a portion of the Fund’s expenses. In addition, the Fund’s custodian bank has agreed to reduce its fees when the Fund maintains cash on deposit in a non-interest-bearing custody account. For the year ended October 31, 2013, these amounts, if any, are included in the Statement of Operations. |
The ratio of expenses to average net assets in the accompanying financial highlights excludes the reduction in expenses related to fees paid indirectly. The annualized expense ratio after waivers for the period listed below reflecting the reduction for fees paid indirectly is as follows:
| | | Year Ended
October 31, 2013 | |
| Class A | | | 1.40 | % |
| Class B | | | 2.15 | |
| Class C | | | 2.08 | |
| Class I | | | 1.04 | |
| Class R3 | | | 1.59 | |
| Class R4 | | | 1.27 | |
| Class R5 | | | 0.97 | |
| Class Y | | | 0.87 | |
| e) | Distribution and Service Plan for Class A, B, C, R3 and R4 Shares – Effective June 14, 2013, HIFSCO was renamed Hartford Funds Distributors, LLC (“HFD”). HFD is the principal underwriter and distributor of the Fund. HFD is engaged in distribution activities, which include marketing and distribution of shares through broker/dealers, financing distribution costs and maintaining financial books and records. For the year ended October 31, 2013, HFD received front-end load sales charges of $465 and contingent deferred sales charges of $4 from the Fund. |
The Fund has adopted a Distribution and Service Plan in accordance with Rule 12b-1 of the 1940 Act to compensate the distributor (HFD) for activities intended to result in the sale and distribution of Class A, B, C, R3 and R4 shares and for providing services for shareholders. The Rule 12b-1 plan applicable to Class A shares of the Fund provides for payment of a Rule 12b-1 fee of 0.25% of average daily net assets. Some or all of the fee may be used for shareholder servicing expenses with the remainder used for distribution expenses. Some or the entire Rule 12b-1 fee for Class B shares may be remitted to broker/dealers for distribution and/or shareholder account services. Under the Class B Plan, the Fund pays the distributor 1.00% of the average daily net assets of Class B shares that are outstanding for 8 years or less, 0.25% of which is a fee for services provided to existing shareholders with the remainder used for distribution expenses. After eight years, Class B shares convert to Class A shares. Upon conversion to Class A shares, the Class A plan described above will apply to those shares. Under the Class C Plan, the Fund pays the distributor 1.00% of the average daily net assets of Class C shares outstanding, 0.25% of which is intended as a fee for services provided to existing shareholders with the remainder used for distribution expenses. For Class C shares, some or the entire fee may be remitted to broker/dealers for distribution and/or shareholder account services. Class R3 shares have a distribution fee of 0.50% of average daily net assets and Class R4 shares have a distribution fee of 0.25% of average daily net assets. For Class R3 and R4 shares, some or the entire fee may be remitted to broker/dealers for distribution and/or shareholder account services. The Fund’s 12b-1 fees are accrued daily and paid monthly.
| f) | Other Related Party Transactions – Certain officers of the Fund are directors and/or officers of the investment manager and/or The Hartford or its subsidiaries. For the year ended October 31, 2013, a portion of the Fund’s Chief Compliance Officer’s compensation was paid by all of the investment companies in the Hartford fund complex. The portion allocated to the Fund rounds to zero. Hartford Administrative Services Company (“HASCO”), an indirect wholly-owned subsidiary of The Hartford, provides transfer agent services to the Fund. HASCO has contractually agreed to reimburse any portion of the transfer agency fees over 0.30% of average daily net assets per fiscal year for each class. For providing such services, HASCO is compensated on a per account basis that varies by account type, except with respect to Class Y, for which it is compensated based on average daily net assets. The amount paid to HASCO and any related contractual reimbursement amounts, if applicable, can be found in the Statement of Operations. These fees are accrued daily and paid monthly. |
Administrative services fees are paid to HASCO for third-party recordkeeping services that are payable as a percentage of net assets in the amount of 0.20%, 0.15% and 0.10% for Classes R3, R4 and R5 shares, respectively. The total administrative services fees are shown on the Statement of Operations. These fees are accrued daily and paid monthly.
| The Hartford SmallCap Growth Fund |
| Notes to Financial Statements – (continued) |
| October 31, 2013 |
| (000’s Omitted) |
| g) | Payment from Affiliate – On July 28, 2010, the Fund was reimbursed by HASCO $242 relating to a trading error. |
The total return in the accompanying financial highlights includes a payment from affiliate. Had the payment from affiliate been excluded, the impact and total return for the periods listed below would have been as follows:
| | | Impact from Payment from Affiliate for
trading error for the
Year Ended
October 31, 2010 | | | Total Return Excluding Payment from
Affiliate for the Year Ended
October 31, 2010 | |
| Class A | | | 0.14 | % | | | 34.77 | % |
| Class B | | | 0.16 | | | | 33.70 | |
| Class C | | | 0.16 | | | | 33.76 | |
| Class I | | | 0.14 | | | | 35.13 | |
| Class Y | | | 0.14 | | | | 35.38 | |
| Class R3 | | | 0.14 | | | | 34.43 | |
| Class R4 | | | 0.14 | | | | 34.84 | |
| Class R5 | | | 0.14 | | | | 35.25 | |
As of October 31, 2013, affiliates of The Hartford had ownership of shares in the Fund as follows:
| | | Percentage
of Class | |
| Class R5 | | | 6 | % |
| 8. | Investment Transactions: |
For the year ended October 31, 2013, the Fund's aggregate purchases and sales of investment securities (excluding short-term investments) were as follows:
| | | Amount | |
| Cost of Purchases Excluding U.S. Government Obligations | | $ | 425,196 | |
| Sales Proceeds Excluding U.S. Government Obligations | | | 289,077 | |
| 9. | Capital Share Transactions: |
The following information is for the year ended October 31, 2013, and the year ended October 31, 2012:
| | | For the Year Ended October 31, 2013 | | | For the Year Ended October 31, 2012 | |
| | | Shares Sold | | | Shares Issued
for Reinvested
Dividends | | | Shares
Redeemed | | | Net Increase
(Decrease) of
Shares | | | Shares Sold | | | Shares Issued
for Reinvested
Dividends | | | Shares
Redeemed | | | Net Increase
(Decrease) of
Shares | |
| Class A | | | | | | | | | | | | | | | | | | | | | | | | | | | | | | | | |
| Shares | | | 1,097 | | | | — | | | | (816 | ) | | | 281 | | | | 540 | | | | — | | | | (1,027 | ) | | | (487 | ) |
| Amount | | $ | 45,638 | | | $ | — | | | $ | (32,774 | ) | | $ | 12,864 | | | $ | 18,262 | | | $ | — | | | $ | (33,709 | ) | | $ | (15,447 | ) |
| Class B | | | | | | | | | | | | | | | | | | | | | | | | | | | | | | | | |
| Shares | | | 9 | | | | — | | | | (57 | ) | | | (48 | ) | | | 10 | | | | — | | | | (111 | ) | | | (101 | ) |
| Amount | | $ | 315 | | | $ | — | | | $ | (1,920 | ) | | $ | (1,605 | ) | | $ | 298 | | | $ | — | | | $ | (3,173 | ) | | $ | (2,875 | ) |
| Class C | | | | | | | | | | | | | | | | | | | | | | | | | | | | | | | | |
| Shares | | | 463 | | | | — | | | | (90 | ) | | | 373 | | | | 78 | | | | — | | | | (84 | ) | | | (6 | ) |
| Amount | | $ | 16,783 | | | $ | — | | | $ | (3,090 | ) | | $ | 13,693 | | | $ | 2,236 | | | $ | — | | | $ | (2,388 | ) | | $ | (152 | ) |
| Class I | | | | | | | | | | | | | | | | | | | | | | | | | | | | | | | | |
| Shares | | | 1,348 | | | | — | | | | (468 | ) | | | 880 | | | | 444 | | | | — | | | | (148 | ) | | | 296 | |
| Amount | | $ | 58,817 | | | $ | — | | | $ | (19,886 | ) | | $ | 38,931 | | | $ | 14,823 | | | $ | — | | | $ | (5,003 | ) | | $ | 9,820 | |
| Class R3 | | | | | | | | | | | | | | | | | | | | | | | | | | | | | | | | |
| Shares | | | 94 | | | | — | | | | (27 | ) | | | 67 | | | | 100 | | | | — | | | | (19 | ) | | | 81 | |
| Amount | | $ | 4,065 | | | $ | — | | | $ | (1,122 | ) | | $ | 2,943 | | | $ | 3,199 | | | $ | — | | | $ | (648 | ) | | $ | 2,551 | |
| Class R4 | | | | | | | | | | | | | | | | | | | | | | | | | | | | | | | | |
| Shares | | | 319 | | | | — | | | | (78 | ) | | | 241 | | | | 66 | | | | — | | | | (48 | ) | | | 18 | |
| Amount | | $ | 14,296 | | | $ | — | | | $ | (3,140 | ) | | $ | 11,156 | | | $ | 2,196 | | | $ | — | | | $ | (1,629 | ) | | $ | 567 | |
| Class R5 | | | | | | | | | | | | | | | | | | | | | | | | | | | | | | | | |
| Shares | | | 66 | | | | — | | | | (5 | ) | | | 61 | | | | 3 | | | | — | | | | — | | | | 3 | |
| Amount | | $ | 3,116 | | | $ | — | | | $ | (231 | ) | | $ | 2,885 | | | $ | 95 | | | $ | — | | | $ | (8 | ) | | $ | 87 | |
| Class Y | | | | | | | | | | | | | | | | | | | | | | | | | | | | | | | | |
| Shares | | | 1,879 | | | | — | | | | (627 | ) | | | 1,252 | | | | 890 | | | | — | | | | (3,877 | ) | | | (2,987 | ) |
| Amount | | $ | 87,730 | | | $ | — | | | $ | (27,219 | ) | | $ | 60,511 | | | $ | 30,496 | | | $ | — | | | $ | (128,005 | ) | | $ | (97,509 | ) |
| Total | | | | | | | | | | | | | | | | | | | | | | | | | | | | | | | | |
| Shares | | | 5,275 | | | | — | | | | (2,168 | ) | | | 3,107 | | | | 2,131 | | | | — | | | | (5,314 | ) | | | (3,183 | ) |
| Amount | | $ | 230,760 | | | $ | — | | | $ | (89,382 | ) | | $ | 141,378 | | | $ | 71,605 | | | $ | — | | | $ | (174,563 | ) | | $ | (102,958 | ) |
The following reflects the conversion of Class B shares into Class A shares (reflected as Class A shares sold) for the year ended October 31, 2013, and the year ended October 31, 2012:
| | | Shares | | | Dollars | |
| For the Year Ended October 31, 2013 | | | 19 | | | | $740 | |
| For the Year Ended October 31, 2012 | | | 32 | | | | $1,069 | |
The Fund is one of several Hartford funds that participate in a $500 million committed revolving line of credit facility. The facility is to be used for temporary or emergency purposes. Under the arrangement, the funds are required to own securities having a market value in excess of 300% of the total bank borrowings. The interest rate on borrowings varies depending on the nature of the loan. The facility also requires a fee to be paid based on the amount of the commitment. This commitment fee is allocated to all of the funds participating in the line of credit based on the average net assets of the funds. During the year ended October 31, 2013, the Fund did not have any borrowings under this facility.
| The Hartford SmallCap Growth Fund |
| Notes to Financial Statements – (continued) |
| October 31, 2013 |
| (000’s Omitted) |
| 11. | Industry Classifications: |
Other than the industry classifications “Other Investment Pools and Funds” and “Exchange Traded Funds,” equity industry classifications used in this report are the Global Industry Classification Standard, which was developed by and is the exclusive property and service mark of MSCI, Inc. and Standard & Poor’s.
| 12. | Pending Legal Proceedings: |
On February 25, 2011, Jennifer L. Kasilag, Louis Mellinger, Judith M. Menendez, Jacqueline M. Robinson, and Linda A. Russell filed a derivative lawsuit against Hartford Investment Financial Services, LLC (“HIFSCO”)(now known as Hartford Funds Distributors, LLC) on behalf of six Hartford retail mutual funds in the United States District Court for the District of New Jersey, alleging that HIFSCO received excessive advisory and distribution fees in violation of its statutory fiduciary duty under Section 36(b) of the 1940 Act when serving as investment manager and principal underwriter, respectively, to the Hartford retail mutual funds. HIFSCO moved to dismiss and, in September 2011, the motion was granted in part and denied in part, with leave to amend the complaint. In November 2011, plaintiffs filed an amended complaint on behalf of certain Hartford retail mutual funds, The Hartford Global Health Fund (now known as The Hartford Healthcare Fund), The Hartford Conservative Allocation Fund, The Hartford Growth Opportunities Fund, The Hartford Inflation Plus Fund, The Hartford Advisers Fund (now known as The Hartford Balanced Fund), and The Hartford Capital Appreciation Fund. Plaintiffs seek to rescind the investment management agreements and distribution plans between HIFSCO and these funds and to recover the total fees charged thereunder or, in the alternative, to recover any improper compensation HIFSCO received, in addition to lost earnings. HIFSCO filed a partial motion to dismiss the amended complaint and, in December 2012, the court dismissed without prejudice the claims regarding distribution fees and denied the motion with respect to the advisory fees claims. HIFSCO disputes the allegations and intends to defend the advisory fee claims vigorously.
Although this action was purportedly filed on behalf of certain of the Hartford Funds, none of the Hartford Funds is itself a defendant to the suit. For this reason, no accrual for litigation relating to this matter has been recorded in the financial statements of the Fund.
Under the Company’s organizational documents, the Company shall indemnify its officers and directors to the full extent required or permitted under Maryland General Corporation Law and the federal securities laws. In addition, the Company, on behalf of the Fund, may enter into contracts that contain a variety of indemnifications. The Company’s maximum exposure under these arrangements is unknown. However, as of the date of these financial statements, the Company has not had prior claims or losses pursuant to these contracts and expects the risk of loss to be remote.
| 14. | Recent Accounting Pronouncement: |
In January 2013, the Financial Accounting Standards Board (FASB) issued Accounting Standards Update (ASU) No. 2013-01, Clarifying the Scope of Disclosures about Offsetting Assets and Liabilities, which clarified ASU No. 2011-11, Disclosures about Offsetting Assets and Liabilities. The objective of ASU 2013-01 is to enhance disclosure requirements on the offsetting of financial assets and liabilities. ASU 2013-01 limits the scope of the new balance sheet offsetting disclosures to derivatives, repurchase agreements and securities lending transactions to the extent that they are (1) offset in the financial statements or (2) subject to an enforceable master netting arrangement or similar agreement. The effective date of ASU 2013-01 is for annual periods beginning on or after January 1, 2013 and interim periods within those annual periods. At this time, management is evaluating the implications of this guidance and the impact it will have on the Fund’s financial statements and footnote disclosures, if any.
| The Hartford SmallCap Growth Fund |
| Financial Highlights |
| | | - Selected Per-Share Data - (A) | | | - Ratios and Supplemental Data - | |
| Class | | Net Asset
Value at
Beginning
of Period | | | Net
Investment
Income
(Loss) | | | Net
Realized
and
Unrealized
Gain
(Loss) on
Invest-
ments | | | Total from
Investment
Operations | | | Dividends
from Net
Investment
Income | | | Distribu-
tions
from
Realized
Capital
Gains | | | Total
Dividends
and
Distributions | | | Net Asset
Value at
End of
Period | | | Total
Return(B) | | | Net
Assets at
End of
Period
(000's) | | | Ratio of
Expenses
to
Average
Net
Assets
Before
Adjust-
ments(C) | | | Ratio of
Expenses
to
Average
Net
Assets
After
Adjust-
ments(C) | | | Ratio of
Net
Investment
Income to
Average
Net Assets | |
| | | | | | | | | | | | | | | | | | | | | | | | | | | | | | | | | | | | | | | | |
| For the Year Ended October 31, 2013 |
| A | | $ | 34.72 | | | $ | (0.15 | ) | | $ | 13.39 | | | $ | 13.24 | | | $ | – | | | $ | – | | | $ | – | | | $ | 47.96 | | | | 38.13 | % | | $ | 226,795 | | | | 1.40 | % | | | 1.40 | % | | | (0.37 | )% |
| B | | | 29.50 | | | | (0.36 | ) | | | 11.31 | | | | 10.95 | | | | – | | | | – | | | | – | | | | 40.45 | | | | 37.12 | | | | 4,552 | | | | 2.40 | | | | 2.15 | | | | (1.05 | ) |
| C | | | 29.21 | | | | (0.40 | ) | | | 11.27 | | | | 10.87 | | | | – | | | | – | | | | – | | | | 40.08 | | | | 37.21 | | | | 33,255 | | | | 2.08 | | | | 2.08 | | | | (1.13 | ) |
| I | | | 35.10 | | | | (0.05 | ) | | | 13.62 | | | | 13.57 | | | | – | | | | – | | | | – | | | | 48.67 | | | | 38.66 | | | | 71,601 | | | | 1.04 | | | | 1.04 | | | | (0.13 | ) |
| R3 | | | 34.93 | | | | (0.26 | ) | | | 13.50 | | | | 13.24 | | | | – | | | | – | | | | – | | | | 48.17 | | | | 37.90 | | | | 8,280 | | | | 1.59 | | | | 1.59 | | | | (0.62 | ) |
| R4 | | | 35.47 | | | | (0.19 | ) | | | 13.78 | | | | 13.59 | | | | – | | | | – | | | | – | | | | 49.06 | | | | 38.31 | | | | 17,412 | | | | 1.27 | | | | 1.27 | | | | (0.44 | ) |
| R5 | | | 36.10 | | | | (0.10 | ) | | | 14.07 | | | | 13.97 | | | | – | | | | – | | | | – | | | | 50.07 | | | | 38.70 | | | | 3,579 | | | | 0.97 | | | | 0.97 | | | | (0.22 | ) |
| Y | | | 36.27 | | | | 0.03 | | | | 14.06 | | | | 14.09 | | | | – | | | | – | | | | – | | | | 50.36 | | | | 38.85 | | | | 121,003 | | | | 0.87 | | | | 0.87 | | | | 0.07 | |
| | | | | | | | | | | | | | | | | | | | | | | | | | | | | | | | | | | | | | | | | | | | | | | | | | | | | |
| For the Year Ended October 31, 2012 |
| A | | $ | 31.27 | | | $ | (0.22 | ) | | $ | 3.67 | | | $ | 3.45 | | | $ | – | | | $ | – | | | $ | – | | | $ | 34.72 | | | | 11.03 | % | | $ | 154,415 | | | | 1.48 | % | | | 1.40 | % | | | (0.65 | )% |
| B | | | 26.77 | | | | (0.40 | ) | | | 3.13 | | | | 2.73 | | | | – | | | | – | | | | – | | | | 29.50 | | | | 10.20 | | | | 4,747 | | | | 2.44 | | | | 2.15 | | | | (1.41 | ) |
| C | | | 26.51 | | | | (0.40 | ) | | | 3.10 | | | | 2.70 | | | | – | | | | – | | | | – | | | | 29.21 | | | | 10.18 | | | | 13,343 | | | | 2.17 | | | | 2.15 | | | | (1.40 | ) |
| I | | | 31.52 | | | | (0.11 | ) | | | 3.69 | | | | 3.58 | | | | – | | | | – | | | | – | | | | 35.10 | | | | 11.36 | | | | 20,730 | | | | 1.11 | | | | 1.11 | | | | (0.33 | ) |
| R3 | | | 31.53 | | | | (0.27 | ) | | | 3.67 | | | | 3.40 | | | | – | | | | – | | | | – | | | | 34.93 | | | | 10.78 | | | | 3,672 | | | | 1.67 | | | | 1.60 | | | | (0.80 | ) |
| R4 | | | 31.91 | | | | (0.19 | ) | | | 3.75 | | | | 3.56 | | | | – | | | | – | | | | – | | | | 35.47 | | | | 11.16 | | | | 4,053 | | | | 1.32 | | | | 1.30 | | | | (0.54 | ) |
| R5 | | | 32.38 | | | | (0.08 | ) | | | 3.80 | | | | 3.72 | | | | – | | | | – | | | | – | | | | 36.10 | | | | 11.49 | | | | 345 | | | | 1.05 | | | | 1.00 | | | | (0.24 | ) |
| Y | | | 32.51 | | | | (0.06 | ) | | | 3.82 | | | | 3.76 | | | | – | | | | – | | | | – | | | | 36.27 | | | | 11.57 | | | | 41,745 | | | | 0.89 | | | | 0.89 | | | | (0.18 | ) |
| | | | | | | | | | | | | | | | | | | | | | | | | | | | | | | | | | | | | | | | | | | | | | | | | | | | | |
| For the Year Ended October 31, 2011 |
| A(D) | | $ | 27.59 | | | $ | (0.29 | ) | | $ | 3.97 | | | $ | 3.68 | | | $ | – | | | $ | – | | | $ | – | | | $ | 31.27 | | | | 13.34 | % | | $ | 154,303 | | | | 1.48 | % | | | 1.40 | % | | | (0.93 | )% |
| B | | | 23.80 | | | | (0.40 | ) | | | 3.37 | | | | 2.97 | | | | – | | | | – | | | | – | | | | 26.77 | | | | 12.48 | | | | 7,018 | | | | 2.39 | | | | 2.15 | | | | (1.46 | ) |
| C | | | 23.57 | | | | (0.40 | ) | | | 3.34 | | | | 2.94 | | | | – | | | | – | | | | – | | | | 26.51 | | | | 12.47 | | | | 12,285 | | | | 2.18 | | | | 2.15 | | | | (1.47 | ) |
| I | | | 27.73 | | | | (0.14 | ) | | | 3.93 | | | | 3.79 | | | | – | | | | – | | | | – | | | | 31.52 | | | | 13.67 | | | | 9,312 | | | | 1.10 | | | | 1.10 | | | | (0.43 | ) |
| R3 | | | 27.87 | | | | (0.30 | ) | | | 3.96 | | | | 3.66 | | | | – | | | | – | | | | – | | | | 31.53 | | | | 13.13 | | | | 763 | | | | 1.69 | | | | 1.60 | | | | (0.93 | ) |
| R4 | | | 28.13 | | | | (0.20 | ) | | | 3.98 | | | | 3.78 | | | | – | | | | – | | | | – | | | | 31.91 | | | | 13.44 | | | | 3,059 | | | | 1.30 | | | | 1.30 | | | | (0.62 | ) |
| R5 | | | 28.46 | | | | (0.11 | ) | | | 4.03 | | | | 3.92 | | | | – | | | | – | | | | – | | | | 32.38 | | | | 13.77 | | | | 227 | | | | 1.03 | | | | 1.00 | | | | (0.33 | ) |
| Y | | | 28.54 | | | | (0.07 | ) | | | 4.04 | | | | 3.97 | | | | – | | | | – | | | | – | | | | 32.51 | | | | 13.91 | | | | 134,508 | | | | 0.89 | | | | 0.89 | | | | (0.22 | ) |
| | | | | | | | | | | | | | | | | | | | | | | | | | | | | | | | | | | | | | | | | | | | | | | | | | | | | |
| For the Year Ended October 31, 2010 |
| A | | $ | 20.45 | | | $ | (0.15 | )(E) | | $ | 7.27 | | | $ | 7.14 | | | $ | – | | | $ | – | | | $ | – | | | $ | 27.59 | | | | 34.91 | %(F) | | $ | 53,548 | | | | 1.62 | % | | | 1.40 | % | | | (0.64 | )% |
| B | | | 17.78 | | | | (0.29 | )(E) | | | 6.29 | | | | 6.02 | | | | – | | | | – | | | | – | | | | 23.80 | | | | 33.86 | (F) | | | 8,398 | | | | 2.59 | | | | 2.15 | | | | (1.39 | ) |
| C | | | 17.60 | | | | (0.29 | )(E) | | | 6.24 | | | | 5.97 | | | | – | | | | – | | | | – | | | | 23.57 | | | | 33.92 | (F) | | | 11,084 | | | | 2.34 | | | | 2.15 | | | | (1.39 | ) |
| I | | | 20.50 | | | | (0.09 | )(E) | | | 7.30 | | | | 7.23 | | | | – | | | | – | | | | – | | | | 27.73 | | | | 35.27 | (F) | | | 5,384 | | | | 1.23 | | | | 1.15 | | | | (0.39 | ) |
| R3 | | | 20.71 | | | | (0.22 | )(E) | | | 7.35 | | | | 7.16 | | | | – | | | | – | | | | – | | | | 27.87 | | | | 34.57 | (F) | | | 367 | | | | 1.77 | | | | 1.63 | | | | (0.90 | ) |
| R4 | | | 20.84 | | | | (0.14 | )(E) | | | 7.40 | | | | 7.29 | | | | – | | | | – | | | | – | | | | 28.13 | | | | 34.98 | (F) | | | 2,831 | | | | 1.38 | | | | 1.33 | | | | (0.58 | ) |
| R5 | | | 21.02 | | | | (0.06 | )(E) | | | 7.47 | | | | 7.44 | | | | – | | | | – | | | | – | | | | 28.46 | | | | 35.39 | (F) | | | 132 | | | | 1.09 | | | | 1.05 | | | | (0.26 | ) |
| Y | | | 21.06 | | | | (0.04 | )(E) | | | 7.49 | | | | 7.48 | | | | – | | | | – | | | | – | | | | 28.54 | | | | 35.52 | (F) | | | 93,908 | | | | 0.95 | | | | 0.95 | | | | (0.18 | ) |
See Portfolio Turnover information on the next page.
| The Hartford SmallCap Growth Fund |
| Financial Highlights – (continued) |
| | | - Selected Per-Share Data - (A) | | | - Ratios and Supplemental Data - | |
| Class | | Net Asset
Value at
Beginning
of Period | | | Net
Investment
Income
(Loss) | | | Net
Realized
and
Unrealized
Gain
(Loss) on
Invest-
ments | | | Total from
Investment
Operations | | | Dividends
from Net
Investment
Income | | | Distribu-
tions
from
Realized
Capital
Gains | | | Total
Dividends
and
Distributions | | | Net Asset
Value at
End of
Period | | | Total
Return(B) | | | Net
Assets at
End of
Period
(000's) | | | Ratio of
Expenses
to
Average
Net
Assets
Before
Adjust-
ments(C) | | | Ratio of
Expenses
to
Average
Net
Assets
After
Adjust-
ments(C) | | | Ratio of
Net
Investment
Income to
Average
Net Assets | |
| | | | | | | | | | | | | | | | | | | | | | | | | | | | | | | | | | | | | | | | |
| For the Year Ended October 31, 2009 (G) |
| A | | $ | 18.47 | | | $ | (0.05 | ) | | $ | 2.03 | | | $ | 1.98 | | | $ | – | | | $ | – | | | $ | – | | | $ | 20.45 | | | | 10.72 | % | | $ | 45,036 | | | | 1.89 | % | | | 1.07 | % | | | (0.26 | )% |
| B | | | 16.13 | | | | (0.11 | ) | | | 1.76 | | | | 1.65 | | | | – | | | | – | | | | – | | | | 17.78 | | | | 10.23 | | | | 8,042 | | | | 2.97 | | | | 1.50 | | | | (0.68 | ) |
| C | | | 16.03 | | | | (0.17 | ) | | | 1.74 | | | | 1.57 | | | | – | | | | – | | | | – | | | | 17.60 | | | | 9.79 | | | | 9,800 | | | | 2.60 | | | | 1.87 | | | | (1.05 | ) |
| I | | | 18.53 | | | | (0.05 | ) | | | 2.02 | | | | 1.97 | | | | – | | | | – | | | | – | | | | 20.50 | | | | 10.63 | | | | 4,456 | | | | 1.37 | | | | 1.08 | | | | (0.28 | ) |
| R3 | | | 18.79 | | | | (0.11 | ) | | | 2.03 | | | | 1.92 | | | | – | | | | – | | | | – | | | | 20.71 | | | | 10.22 | | | | 192 | | | | 1.85 | | | | 1.65 | | | | (0.91 | ) |
| R4 | | | 18.88 | | | | (0.09 | ) | | | 2.05 | | | | 1.96 | | | | – | | | | – | | | | – | | | | 20.84 | | | | 10.38 | | | | 1,868 | | | | 1.42 | | | | 1.35 | | | | (0.54 | ) |
| R5 | | | 18.99 | | | | (0.05 | ) | | | 2.08 | | | | 2.03 | | | | – | | | | – | | | | – | | | | 21.02 | | | | 10.69 | | | | 1,321 | | | | 1.12 | | | | 1.05 | | | | (0.34 | ) |
| Y | | | 19.03 | | | | 0.01 | | | | 2.02 | | | | 2.03 | | | | – | | | | – | | | | – | | | | 21.06 | | | | 10.67 | | | | 8,042 | | | | 1.02 | | | | 1.02 | | | | 0.04 | |
| (A) | Information presented relates to a share outstanding throughout the indicated period. Net investment income (loss) per share amounts are calculated based on average shares outstanding unless otherwise noted. |
| (B) | Assumes initial investment at net asset value at the beginning of each period, reinvestment of all distributions, the complete redemption of the investment at net asset value at the end of each period and no sales charge. Total return would be reduced if sales charges were taken into account. |
| (C) | Adjustments include waivers and reimbursements, if applicable. Ratios do not include fees paid indirectly (see Expenses in the accompanying Notes to Financial Statements). |
| (D) | Class L was merged into Class A on August 5, 2011. |
| (E) | The impact of the Payment from Affiliate per share was $0.02 for Class A, Class B, Class C and Class I and $0.03 for Class R3, Class R4, Class R5 and ClassY. |
| (F) | Total return without the inclusion of the Payments from (to) Affiliate, can be found in Expenses in the accompanying Notes to Financial Statements. |
| (G) | Net investment income (loss) per share amounts have been calculated using the SEC method. |
| | | Portfolio Turnover
Rate for
All Share Classes | |
| For the Year Ended October 31, 2013 | | | 90 | % |
| For the Year Ended October 31, 2012 | | | 73 | |
| For the Year Ended October 31, 2011 | | | 70 | |
| For the Year Ended October 31, 2010 | | | 137 | |
| For the Year Ended October 31, 2009 | | | 84 | |
| Report of Independent Registered Public Accounting Firm |
| The Board of Directors and Shareholders of |
| The Hartford Mutual Funds II, Inc. |
We have audited the accompanying statement of assets and liabilities, including the schedule of investments, of The Hartford SmallCap Growth Fund (one of the portfolios constituting The Hartford Mutual Funds II, Inc. (the Funds)) as of October 31, 2013, and the related statement of operations for the year then ended, the statements of changes in net assets for each of the two years in the period then ended, and the financial highlights for each of the five years in the period then ended. These financial statements and financial highlights are the responsibility of the Funds’ management. Our responsibility is to express an opinion on these financial statements and financial highlights based on our audits.
We conducted our audits in accordance with the standards of the Public Company Accounting Oversight Board (United States). Those standards require that we plan and perform the audit to obtain reasonable assurance about whether the financial statements and financial highlights are free of material misstatement. We were not engaged to perform an audit of the Funds’ internal control over financial reporting. Our audits included consideration of internal control over financial reporting as a basis for designing audit procedures that are appropriate in the circumstances, but not for the purpose of expressing an opinion on the effectiveness of the Funds’ internal control over financial reporting. Accordingly, we express no such opinion. An audit also includes examining, on a test basis, evidence supporting the amounts and disclosures in the financial statements and financial highlights, assessing the accounting principles used and significant estimates made by management, and evaluating the overall financial statement presentation. Our procedures included confirmation of securities owned as of October 31, 2013, by correspondence with the custodian and brokers or by other appropriate auditing procedures where replies from brokers were not received. We believe that our audits provide a reasonable basis for our opinion.
In our opinion, the financial statements and financial highlights referred to above present fairly, in all material respects, the financial position of The Hartford SmallCap Growth Fund of The Hartford Mutual Funds II, Inc. at October 31, 2013, the results of its operations for the year then ended, the changes in its net assets for each of the two years in the period then ended, and the financial highlights for each of the five years in the period then ended, in conformity with U.S. generally accepted accounting principles.
Minneapolis, MN
December 18, 2013
| The Hartford SmallCap Growth Fund |
| Directors and Officers (Unaudited) |
The Board of Directors of the Company appoints officers who are responsible for the day-to-day operations of the Fund and who execute policies formulated by the Directors. Each director serves until his or her death, resignation, or retirement or until the next annual meeting of shareholders is held or until his or her successor is elected and qualifies.
Directors and officers who are employed by or who have a financial interest in The Hartford are considered “interested” persons of the Fund pursuant to the 1940 Act. Each officer and two of the Company’s directors, as noted in the chart below, are “interested” persons of the Fund. Each director serves as a director for The Hartford Mutual Funds, Inc., The Hartford Mutual Funds II, Inc., Hartford Series Fund, Inc., and Hartford HLS Series Fund II, Inc., and as a trustee for The Hartford Alternative Strategies Fund, which, as of October 31, 2013, collectively consist of 89 funds. Correspondence may be sent to directors and officers c/o Hartford Funds, P.O. Box 2999, Hartford, Connecticut 06104-2999, except that correspondence to Mr. Annoni, Mr. Dressen, Ms. Fagely and Ms. Quade may be sent to 500 Bielenberg Drive, Woodbury, Minnesota 55125 and correspondence to Mr. Davey and Mr. Melcher may be sent to 5 Radnor Corporate Center, Suite 300, 100 Matsonford Road, Radnor, Pennsylvania 19087.
The table below sets forth, for each director and officer, his or her name, year of birth, current position with the Company and date first elected or appointed to The Hartford Mutual Funds, Inc. (“MF”) and The Hartford Mutual Funds II, Inc. (“MF2”), principal occupation, and, for directors, other directorships held. The Fund’s statement of additional information contains further information on the directors and is available free of charge by calling 1-888-843-7824 or writing to Hartford Funds, P.O. Box 64387, St. Paul, MN 55164-0387.
Information on the aggregate remuneration paid to the directors of the Company can be found in the Statement of Operations herein. The Fund pays to The Hartford a portion of the Chief Compliance Officer’s compensation, but does not pay salaries or compensation to any of its other officers or directors who are employed by The Hartford.
Non-Interested Directors
Lynn S. Birdsong (1946) Director since 2003, Co-Chairman of the Investment Committee
Mr. Birdsong is a private investor. Mr. Birdsong currently serves as a Director of the Sovereign High Yield Investment Company (April 2010 to current). Mr. Birdsong currently serves as an Independent Director of Nomura Partners Funds, Inc. (formerly, The Japan Fund) (March 2003 to current). From 1979 to 2002, Mr. Birdsong was a managing director of Zurich Scudder Investments, an investment management firm. During his employment with Scudder, Mr. Birdsong was an Interested Director of The Japan Fund. Since 1981, Mr. Birdsong has been a partner in Birdsong Company, an advertising specialty firm.
Robert M. Gavin, Jr. (1940) Director since 2002 (MF) and 1986 (MF2), Chairman of the Board since 2004
Dr. Gavin is an educational consultant. Prior to September 1, 2001, he was President of Cranbrook Education Community and prior to July 1996, he was President of Macalester College, St. Paul, Minnesota.
Duane E. Hill (1945) Director since 2001 (MF) and 2002 (MF2), Chairman of the Nominating Committee
Mr. Hill is Partner of TSG Ventures L.P., a private equity investment company. Mr. Hill is a former partner of TSG Capital Group, a private equity investment firm that served as sponsor and lead investor in leveraged buyouts of middle market companies.
Sandra S. Jaffee (1941) Director since 2005
Ms. Jaffee is the founder and Chief Executive Officer of a private company, Homeworks Concierge, LLC, which provides residential property management services in Westchester County, New York (January 2012 to present). Ms. Jaffee served as Chairman (2008 to 2009) and Chief Executive Officer of Fortent (formerly Searchspace Group), a leading provider of compliance/regulatory technology to financial institutions from August 2005 to August 2009. Ms. Jaffee currently serves as a member of the Board of Directors of Broadridge Financial Solutions as well as a Trustee of Muhlenberg College.
William P. Johnston (1944) Director since 2005, Chairman of the Compliance Committee
In February 2008, Mr. Johnston was elected to the Board of Directors of HCR-ManorCare, Inc. In August 2007, Mr. Johnston was elected to the Board of Directors of LifeCare Holdings, Inc. In July 2006, Mr. Johnston was elected to the Board of Directors of MultiPlan, Inc. and served as a director (July 2006 to August 2010). In June 2006, Mr. Johnston was appointed as Senior Advisor to The Carlyle Group, a global private equity and alternative asset investment firm. In May 2006, Mr. Johnston was elected to the Supervisory Board of Fresenius Medical Care AG & Co. KGaA, after its acquisition of Renal Care Group, Inc. in March 2006.
Phillip O. Peterson (1944) Director since 2002 (MF) and 2000 (MF2), Chairman of the Audit Committee
Mr. Peterson is a mutual fund industry consultant. He was a partner of KPMG LLP (an accounting firm) until July 1999. Mr. Peterson joined William Blair Funds in February 2007 as a member of the Board of Trustees. Mr. Peterson also joined the Board of Trustees of Symetra Variable Mutual Funds Trust as a trustee in February 2012.
Lemma W. Senbet (1946) Director since 2005
Dr. Senbet is the William E. Mayer Chair Professor of Finance and Director, Center for Financial Policy, at the University of Maryland, Robert H. Smith School of Business. He was chair of the Finance Department from 1998 to 2006. Previously he was a chaired professor of finance at the University of Wisconsin-Madison. Also, he was director of the Fortis Funds from March 2000 to July 2002. Dr. Senbet served the finance profession in various capacities, including as director of the American Finance Association and President of the Western Finance Association. In 2006, Dr. Senbet was inducted Fellow of Financial Management Association International for his career-long distinguished scholarship and professional service.
Interested Directors and Officers
James E. Davey (1964) Director since 2012, President and Chief Executive Officer since 2010
Mr. Davey serves as Executive Vice President of Hartford Life Insurance Company (“HLIC”) and The Hartford Financial Services Group, Inc. Additionally, Mr. Davey serves as Chairman of the Board and Manager of Hartford Funds Distributors, LLC (“HFD”) and Director and Chairman of the Board of Hartford Administrative Services Company (“HASCO”). Mr. Davey also serves as Manager, President and Chairman of the Board for Hartford Funds Management Company, LLC (“HFMC”). Mr. Davey joined The Hartford in 2002.
Lowndes A. Smith (1939) Director since 1996 (MF) and 2002 (MF2), Co-Chairman of the Investment Committee
Mr. Smith served as Vice Chairman of The Hartford from February 1997 to January 2002, as President and Chief Executive Officer of Hartford Life, Inc. from February 1997 to January 2002, and as President and Chief Operating Officer of The Hartford Life Insurance Companies from January 1989 to January 2002. Mr. Smith serves as a Director of White Mountains Insurance Group, Ltd., One Beacon Insurance and Symetra Financial and as Managing Director of Whittington Gray Associates.
Other Officers
Mark A. Annoni (1964) Vice President, Controller and Treasurer since 2012
Mr. Annoni serves as the Assistant Vice President of HLIC (February 2004 to present). Mr. Annoni joined The Hartford in April 2001 as part of The Hartford’s acquisition of Fortis Financial Group (“Fortis”).
Michael R. Dressen (1963) AML Compliance Officer since 2011
Mr. Dressen currently serves as Assistant Vice President of HLIC. He also serves as Chief Compliance Officer and AML Compliance Officer of HASCO and as AML Officer of HFD. Mr. Dressen joined The Hartford in 2005 from State Farm Insurance Companies where he held various positions related to mutual funds, variable products, and property casualty insurance.
Tamara L. Fagely (1958) Vice President since 2002 (MF) and 1993 (MF2) (1)
Currently, Ms. Fagely is President and a Director of HASCO, Chief Administrative Officer and Manager of HFMC and a Vice President of HLIC. Ms. Fagely served as a Vice President of HASCO (1998-2013) and Chief Financial Officer of HASCO (2006-2013). She served as Assistant Vice President of HLIC from December 2001 through March 2005. In addition, Ms. Fagely is Manager and Chief Operating Officer of HFD.
(1) Ms. Fagley will be retiring on December 31, 2013.
Edward P. Macdonald (1967) Vice President, Secretary and Chief Legal Officer since 2005
Mr. Macdonald serves as Vice President of HLIC and Vice President, Chief Legal Officer and Secretary of HFD and HASCO. Mr. Macdonald also serves as Manager, Vice President, Chief Legal Officer and Secretary of HFMC. Mr. Macdonald joined The Hartford in 2005.
Joseph G. Melcher (1973) Vice President and Chief Compliance Officer since 2013
Mr. Melcher currently serves as Vice President of HFMC and HFD. Mr. Melcher joined The Hartford in 2012 from Touchstone Investments, a member of the Western & Southern Financial Group, where he held the position of Vice President and Chief Compliance Officer from 2010 through 2012 and Assistant Vice President, Compliance from 2005 to 2010.
Vernon J. Meyer (1964) Vice President since 2006
Mr. Meyer serves as Senior Vice President of HLIC. He also serves as Senior Vice President of HFMC and HFD. Mr. Meyer joined The Hartford in 2004.
| The Hartford SmallCap Growth Fund |
| Directors and Officers (Unaudited) – (continued) |
Laura S. Quade (1969) Vice President since 2012
Ms. Quade currently serves as Vice President of HASCO and is a Director of Mutual Fund Service Operations. She also serves as Director, Enterprise Operations of HFD and HLIC. Ms. Quade joined The Hartford in 2001 as part of The Hartford’s acquisition of Fortis.
Martin A. Swanson (1962) Vice President since 2010
Mr. Swanson is a Vice President of HLIC. Mr. Swanson also serves as Vice President and Chief Marketing Officer for HFD. Prior to joining HLIC in 1998, Mr. Swanson was a Vice President at PaineWebber, Inc.
HOW TO OBTAIN A COPY OF THE FUND’S PROXY VOTING POLICIES AND VOTING RECORDS (UNAUDITED)
A description of the policies and procedures that the Fund uses to determine how to vote proxies relating to portfolio securities and information about how the Fund voted proxies relating to portfolio securities during the most recent twelve-month period ended June 30 are available (1) without charge, upon request, by calling 888-843-7824 and (2) on the SEC’s website at http://www.sec.gov.
QUARTERLY PORTFOLIO HOLDINGS INFORMATION (UNAUDITED)
The Fund files a complete schedule of portfolio holdings with the SEC for the first and third quarters of each fiscal year on Form N-Q. The Fund’s Forms N-Q are available (1) without charge, upon request, by calling 888-843-7824 and (2) on the SEC’s website at http://www.sec.gov. The Form N-Q may be reviewed and copied at the SEC’s Public Reference Room in Washington, DC. Information on the operation of the Public Reference Room may be obtained by calling 1-800-SEC-0330.
| The Hartford SmallCap Growth Fund |
| Federal Tax Information (Unaudited) |
For the fiscal year ended October 31, 2013, there is no further federal tax information required for this Fund.
| The Hartford SmallCap Growth Fund |
| Expense Example (Unaudited) |
Your Fund's Expenses
As a shareholder of the Fund, you incur two types of costs: (1) transaction costs, including sales charges (loads) on purchase payments, if any, and contingent deferred sales charges (CDSC), if any, and (2) ongoing costs, including investment management fees, distribution and/or service (12b-1) fees, if any, and other fund expenses. This example is intended to help you understand your ongoing costs (in dollars) of investing in the Fund and to compare these costs with the ongoing costs of investing in other mutual funds. The example is based on an investment of $1,000 invested at the beginning of the period and held for the period of April 30, 2013 through October 31, 2013.
Actual Expenses
The first set of columns of the table below provides information about actual account values and actual expenses. You may use the information in this column, together with the amount you invested, to estimate the expenses that you paid over the period. Simply divide your account value by $1,000 (for example, an $8,600 account value divided by $1,000 = 8.6), then multiply the result by the number in the line under the heading entitled “Expenses Paid During Period” to estimate the expenses you paid on your account during this period.
Hypothetical Example for Comparison Purposes
The second set of columns of the table below provides information about hypothetical account values and hypothetical expenses based on the Fund's actual expense ratio and an assumed rate of return of 5% per year before expenses, which is not the Fund's actual return. The hypothetical account values and expenses may not be used to estimate the actual ending account balance or expenses you paid for the period. You may use this information to compare the ongoing costs of investing in the Fund and other funds. To do so, compare this 5% hypothetical example with the 5% hypothetical examples that appear in the shareholder reports of the other funds.
Please note that the expenses shown in the table are meant to highlight your ongoing costs only and do not reflect any transactional costs, such as sales charges (loads) and CDSC. Therefore, the second set of columns of the table is useful in comparing ongoing costs only, and will not help you determine the relative total costs of owning different funds. In addition, if these transactional costs were included, your costs would be higher. Expenses are equal to the Fund's annualized expense ratios multiplied by average account value over the period, multiplied by 184/365 (to reflect the one-half year period).
| | | Actual return | | | Hypothetical (5% return before expenses) | | | | | | | | |
| | | Beginning
Account Value
April 30, 2013 | | | Ending Account
Value
October 31, 2013 | | | Expenses paid
during the period
April 30, 2013
through
October 31, 2013 | | | Beginning
Account Value
April 30, 2013 | | | Ending Account
Value
October 31, 2013 | | | Expenses paid
during the
period
April 30, 2013
through
October 31, 2013 | | | Annualized
expense
ratio | | | Days in
the
current
1/2
year | | Days
in the
full
year |
| Class A | | $ | 1,000.00 | | | $ | 1,188.30 | | | $ | 7.72 | | | $ | 1,000.00 | | | $ | 1,018.15 | | | $ | 7.12 | | | | 1.40 | % | | 184 | | 365 |
| Class B | | $ | 1,000.00 | | | $ | 1,183.40 | | | $ | 11.84 | | | $ | 1,000.00 | | | $ | 1,014.36 | | | $ | 10.93 | | | | 2.15 | | | 184 | | 365 |
| Class C | | $ | 1,000.00 | | | $ | 1,184.40 | | | $ | 11.23 | | | $ | 1,000.00 | | | $ | 1,014.92 | | | $ | 10.36 | | | | 2.04 | | | 184 | | 365 |
| Class I | | $ | 1,000.00 | | | $ | 1,190.60 | | | $ | 5.60 | | | $ | 1,000.00 | | | $ | 1,020.09 | | | $ | 5.17 | | | | 1.01 | | | 184 | | 365 |
| Class R3 | | $ | 1,000.00 | | | $ | 1,187.00 | | | $ | 8.64 | | | $ | 1,000.00 | | | $ | 1,017.30 | | | $ | 7.97 | | | | 1.57 | | | 184 | | 365 |
| Class R4 | | $ | 1,000.00 | | | $ | 1,189.00 | | | $ | 6.89 | | | $ | 1,000.00 | | | $ | 1,018.91 | | | $ | 6.36 | | | | 1.25 | | | 184 | | 365 |
| Class R5 | | $ | 1,000.00 | | | $ | 1,190.70 | | | $ | 5.28 | | | $ | 1,000.00 | | | $ | 1,020.38 | | | $ | 4.87 | | | | 0.96 | | | 184 | | 365 |
| Class Y | | $ | 1,000.00 | | | $ | 1,191.40 | | | $ | 4.67 | | | $ | 1,000.00 | | | $ | 1,020.94 | | | $ | 4.31 | | | | 0.85 | | | 184 | | 365 |
| The Hartford SmallCap Growth Fund |
| Approval of Investment Management and Investment Sub-Advisory Agreements (Unaudited) |
Section 15(c) of the Investment Company Act of 1940, as amended (the “1940 Act”), requires that each mutual fund’s board of directors, including a majority of those directors who are not “interested persons” of the mutual fund, as defined in the 1940 Act (the “Independent Directors”), annually review and consider the continuation of the mutual fund’s investment advisory and sub-advisory agreements. At its meeting held on August 6-7, 2013, the Board of Directors (the “Board”) of The Hartford Mutual Funds II, Inc., including each of the Independent Directors, unanimously voted to approve the continuation of the investment management agreement for The Hartford SmallCap Growth Fund (the “Fund”) with Hartford Funds Management Company, LLC (“HFMC”) and the continuation of the investment sub-advisory agreement between HFMC and the Fund’s sub-adviser, Wellington Management Company, LLP (the “Sub-adviser,” and together with HFMC, the “Advisers”) (collectively, the “Agreements”).
In the months preceding the August 6-7, 2013 meeting, the Board requested, received, and reviewed written responses from the Advisers to questions posed to them on behalf of the Independent Directors and supporting materials relating to those questions and responses. The Board considered information furnished to the Board at its meetings throughout the year, as well as information specifically prepared in connection with the annual approval of the Agreements at the Board’s meetings held on June 18-19, 2013 and August 6-7, 2013. Information provided to the Board at its meetings throughout the year included, among other things, reports on Fund performance, legal and compliance matters, sales and marketing activity, shareholder services, and the other services provided to the Fund by the Advisers and their affiliates. The Board also received in-person presentations by Fund officers and representatives of HFMC at the Board’s meetings on June 18-19, 2013 and August 6-7, 2013 concerning the Agreements.
The Independent Directors, advised by independent legal counsel, engaged two service providers to assist them with evaluating the Agreements with respect to the Fund. Lipper Inc. (“Lipper”), an independent provider of investment company data, was retained to provide the Board with reports on how the Fund’s contractual management fees, actual management fees, other non-management fees, overall expense ratios and investment performance compared to those of mutual funds with similar investment objectives. The Independent Directors also engaged an independent financial services consulting firm (the “Consultant”) to assist them in evaluating the Fund’s management fees, sub-advisory fees, other non-management fees, overall expense ratios and investment performance.
In determining whether to continue the Agreements for the Fund, the members of the Board reviewed and evaluated information and factors they believed to be relevant and appropriate in light of the information that the Board deemed necessary and appropriate through the exercise of its reasonable business judgment. While individual members of the Board may have weighed certain factors differently, the Board’s determination to continue the Agreements was based on a comprehensive consideration of all information provided to the Board throughout the year and specifically with respect to the continuation of the Agreements. A more detailed discussion of the factors the Board considered with respect to its approval of the Agreements is provided below.
Nature, Extent, and Quality of Services Provided by the Advisers
The Board requested and considered information concerning the nature, extent, and quality of the services provided to the Fund by the Advisers. The Board considered, among other things, the terms of the Agreements and the range of services provided by the Advisers. The Board considered the Advisers’ professional personnel who provide services to the Fund, including each Adviser’s ability and experience in attracting and retaining qualified personnel to service the Fund. The Board considered each Adviser’s reputation and overall financial strength, as well as its willingness to consider and implement organizational and operational changes designed to improve services to the Fund. In addition, the Board considered the quality of each Adviser’s communications with the Board and responsiveness to Board inquiries.
The Board also requested and evaluated information concerning each Adviser’s regulatory and compliance environment. In this regard, the Board requested and reviewed information on each Adviser’s compliance policies and procedures, compliance history, and a report from the Fund’s Chief Compliance Officer on each Adviser’s compliance with applicable laws and regulations, including responses to regulatory developments and compliance issues raised by regulators. The Board also noted the Advisers’ support of the Fund’s compliance control structure, particularly the resources devoted by the Advisers in support of the Fund’s obligations pursuant to Rule 38a-1 under the 1940 Act.
| The Hartford SmallCap Growth Fund |
| Approval of Investment Management and Investment Sub-Advisory Agreements (Unaudited) – (continued) |
With respect to HFMC, the Board noted that under the Agreements, HFMC is responsible for the management of the Fund, including overseeing fund operations and service providers, and provides administrative services to the Fund as well as investment advisory services in connection with selecting, monitoring and supervising the Sub-adviser. The Board considered HFMC’s ongoing monitoring of people, process and performance, including its quarterly reviews of each of the Hartford Funds, semi-annual meetings with the leaders of each Fund’s portfolio management team, and oversight of the Funds’ approximately 60 portfolio managers. The Board recognized that HFMC has demonstrated a record of making changes to the management and/or strategies of the Funds when warranted. The Board considered HFMC’s oversight of the Sub-adviser’s investment approach and results, process for monitoring best execution of portfolio trades by the Sub-adviser, and approach to risk management with respect to the Fund and the service providers to the Fund. The Board also considered HFMC’s oversight of compliance with the Fund’s objective and policies as well as with applicable laws and regulations, noting that regulatory and other developments had over time led to an increase in the scope of HFMC’s services in this regard.
In addition, the Board considered HFMC’s ongoing commitment to review and rationalize the Hartford Funds product line-up and the expenses that HFMC had incurred in connection with fund combinations in recent years. The Board considered that HFMC or its affiliates are responsible for providing the Fund’s officers.
With respect to the Sub-adviser, who provides day-to-day portfolio management services, the Board considered the quality of the Fund’s portfolio managers, the Sub-adviser’s other investment personnel, its investment philosophy and process, investment research capabilities and resources, performance record, trade execution capabilities and experience. The Board considered the experience of the Fund’s portfolio managers, the number of accounts managed by the portfolio managers, and the Sub-adviser’s method for compensating the portfolio managers.
Based on these considerations, the Board concluded that it was satisfied with the nature, extent and quality of the services provided to the Fund by HFMC and the Sub-adviser.
Performance of the Fund and the Advisers
The Board considered the investment performance of the Fund. In this regard, the Board reviewed the performance of the Fund over different time periods presented in the materials and evaluated HFMC’s analysis of the Fund’s performance for these time periods. The Board considered information and materials provided to the Board by the Advisers concerning Fund performance, as well as information from Lipper comparing the investment performance of the Fund to an appropriate benchmark and universe of peer funds. The Board noted that the Fund’s performance was in the 2nd quintile of its performance universe for the 1-year period and the 1st quintile for the 3- and 5-year periods. The Board also noted that the Fund’s performance was above its benchmark for the 1-, 3- and 5-year periods.
The Board considered the detailed investment analytics reports provided by Hartford Funds’ Investment Advisory Group throughout the year. These reports include, among other things, information on the Fund’s gross and net returns, the Fund’s investment performance relative to an appropriate benchmark and peer group, various statistics concerning the Fund’s portfolio, and a narrative summary of various factors affecting Fund performance. The Board considered the Advisers’ cooperation with the Investment Committee, which assists the Board in evaluating the performance of the Fund at periodic meetings throughout the year. The Board also considered the analysis provided by the Consultant relating to the Fund’s performance track record.
In light of all the considerations noted above, the Board concluded that it had continued confidence in HFMC’s and the Sub-adviser’s overall capabilities to manage the Fund.
Costs of the Services and Profitability of the Advisers
The Board reviewed information regarding HFMC’s cost to provide investment management and related services to the Fund and HFMC’s profitability, both overall and for the Fund, on a pre-tax basis without regard to distribution expenses. The Board also requested and reviewed information about the profitability to HFMC and its affiliates from all services provided to the Fund and all aspects of their relationship with the Fund. The Board also requested and received information relating to the operations and profitability of the Sub-adviser.
The Board considered the Consultant’s review of the profitability calculations utilized by HFMC in connection with the continuation of the investment management agreement, noting the Consultant’s view that Hartford Funds’ process for calculating and reporting Fund profitability is reasonable. In this regard, the Board noted that the Consultant had previously performed a full review of this process and reported that such process is sound and well within common industry practice.
Based on these considerations, the Board concluded that the profits anticipated to be realized by the Advisers and their affiliates from their relationships with the Fund would not be excessive.
Comparison of Fees and Services Provided by the Advisers
The Board considered comparative information with respect to the management fees to be paid by the Fund to HFMC and the total expense ratios of the Fund. The Board also considered comparative information with respect to the sub-advisory fees to be paid by HFMC to the Sub-adviser. In this regard, the Board requested and reviewed information from HFMC and the Sub-adviser relating to the management and sub-advisory fees, including the sub-advisory fee schedule for the Fund, and total operating expenses for the Fund. With respect to the sub-advisory fee schedule, the Board considered representations from HFMC and the Sub-adviser that the Sub-adviser’s fees were negotiated at arm’s length. The Board also reviewed information from Lipper comparing the Fund’s contractual management fees, actual management fees and overall expense ratios relative to a group of funds selected by Lipper, in consultation with the Consultant, and a broader universe of funds selected by Lipper. The Board noted that the Fund’s contractual and actual management fees were in the 2nd quintile of its expense group, while its total expenses (less 12b-1 and shareholder service fees) were in the 3rd quintile. The Board also noted that the Fund has an automatically renewable contractual expense cap on each share class, which resulted in reimbursement of certain expenses incurred in 2012.
While the Board recognized that comparisons between the Fund and peer funds are imprecise, given the differing service levels and characteristics of mutual funds and the different business models and cost structures of the Advisers, the comparative information provided by Lipper assisted the Board in evaluating the reasonableness of the Fund’s management and sub-advisory fees and total operating expenses. In addition, the Board considered the analysis and recommendations of the Consultant relating to the Fund’s management and sub-advisory fees and total operating expenses.
Based on these considerations, the Board concluded that the Fund’s fees and total operating expenses, in conjunction with the information about quality of services, profitability, economies of scale, and other matters discussed, were reasonable in light of the services provided.
Economies of Scale
The Board requested and considered information regarding the Advisers’ realization of economies of scale with respect to the Fund and whether the fee levels reflect these economies of scale for the benefit of the Fund’s shareholders. The Board reviewed the breakpoints in the management fee schedule for the Fund, which reduce fee rates as Fund assets grow over time. The Board recognized that a fund with assets beyond the last breakpoint level will continue to benefit from economies of scale because additional assets are charged the lowest breakpoint fee resulting in lower overall effective management fee rates. The Board also considered that expense limitations and fee waivers that reduce the Fund’s expenses at all asset levels can have the same effect as breakpoints in sharing economies of scale with shareholders and provide protection from an increase in expenses if Fund assets decline. The Board recognized that a fee schedule that reaches a lower breakpoint quickly provides shareholders with the benefit of anticipated or potential economies of scale. The Board also considered that HFMC has been active in managing expenses, which has resulted in benefits being realized by shareholders as assets within the Hartford Funds family of funds have grown over time, including through lower transfer agent costs and other operating expenses.
The Board reviewed and evaluated materials from Lipper showing how management fee schedules of peer funds reflect economies of scale for the benefit of shareholders as a peer fund’s assets hypothetically increase over time. Based on information provided by HFMC, Lipper, and the Consultant, the Board recognized that there is no uniform methodology for establishing breakpoints or uniform pattern in asset levels that trigger breakpoints or the amounts of breakpoints triggered.
| The Hartford SmallCap Growth Fund |
| Approval of Investment Management and Investment Sub-Advisory Agreements (Unaudited) – (continued) |
After considering all of the information available to it, the Board concluded that it was satisfied with the extent to which economies of scale would be shared for the benefit of the Fund’s shareholders based on currently available information and the effective advisory fees and expense ratios for the Fund at its current and reasonably anticipated asset levels. The Board noted, however, that it would continue to monitor future growth in Fund assets and the appropriateness of additional breakpoints.
Other Benefits
The Board considered other benefits to the Advisers and their affiliates from their relationships with the Fund.
The Board reviewed information noting that HFMC receives fees for fund accounting and related services from the Fund, and the Board considered information on profits to HFMC for such services. The Board also considered that Hartford Administrative Services Company (“HASCO”), the Fund’s transfer agent and an affiliate of HFMC, receives transfer agency compensation from the Fund, and the Board reviewed information on the profitability of the Fund’s transfer agency function to HASCO. The Board considered information provided by HASCO indicating that the transfer agent fees charged by HASCO to the Fund were fair and reasonable based on publicly available information.
The Board also considered that Hartford Funds Distributors, LLC (“HFD”), an affiliate of HFMC, serves as principal underwriter of the Fund. As principal underwriter, HFD receives 12b-1 fees from the Fund and receives all or a portion of the sales charges on sales or redemptions of certain classes of shares. The Board also noted that certain affiliates of HFD distribute shares of the Fund and receive compensation in that connection.
The Board considered benefits to the Sub-adviser from its use of the Fund’s brokerage commissions to obtain soft dollar research, and representations from HFMC and the Sub-adviser that the Sub-adviser would not make any revenue-sharing payments or any other type of distribution payments to HFMC or its affiliates.
The Board considered the benefits to shareholders of being part of the Hartford Funds family of funds, including the right to exchange investments between the same class of funds without a sales charge, the ability to reinvest Fund dividends into other funds in the family, and the ability to combine holdings in the Fund with holdings in other funds to obtain a reduced sales charge. The Board considered HFMC’s efforts to provide investors in the family with a broad range of investment styles and asset classes and its entrepreneurial risk in initiating new funds to expand these opportunities for shareholders.
* * * *
Based upon its review of these various factors, among others, the Board concluded that it is in the best interests of the Fund and its shareholders for the Board to approve the Agreements for an additional year. In reaching this decision, the Board did not assign relative weights to the factors discussed above or deem any one or group of them to be controlling in and of themselves. In connection with their deliberations, the Independent Directors met separately in executive session on several occasions, with independent legal counsel and the Consultant, to review the relevant materials and consider their responsibilities under relevant laws and regulations.
| The Hartford SmallCap Growth Fund |
| Main Risks (Unaudited) |
The main risks of investing in the Fund are described below.
Market, Selection, and Strategy Risk: The Fund’s share price may fluctuate due to market risk and/or security selections that may underperform the market or relevant benchmarks. If the sub-adviser’s investment strategy does not perform as expected, the Fund could underperform its peers or lose money. There is no guarantee the Fund will achieve its stated objective.
Small-cap Stock Risk: Small-cap stocks are generally more volatile and risky and may be less liquid than large-cap stocks because they may have limited operating histories, narrow product lines, and focus on niche markets.
Growth Investing Risk: Growth investments can be volatile, and may fail to increase earnings or grow as quickly as anticipated. Growth-style investing falls in and out of favor, which may result in periods of underperformance.
Foreign Investment Risk: Foreign investments can be riskier than U.S. investments. Potential risks include currency risk that may result from unfavorable exchange rates, liquidity risk if decreased demand for a security makes it difficult to sell at the desired price, and risks that stem from substantially lower trading volume on foreign markets.
Active Trading Risk: Actively trading investments may result in higher costs and higher taxable income.
HARTFORDFUNDS
hartfordfunds.com
This information is written in connection with the promotion or marketing of the matter(s) addressed in this material.
This report is submitted for the general information of the shareholders of the Fund. It is not authorized for distribution unless preceded or accompanied by a current prospectus for the Fund.
The information cannot be used or relied upon for the purpose of avoiding IRS penalties. These materials are not intended to provide tax, accounting or legal advice. As with all matters of a tax or legal nature, you should consult your own tax or legal counsel for advice.
Investors should carefully consider the investment objectives, risks, charges, and expenses of Hartford Funds before investing. This and other information can be found in the prospectus and summary prospectus, which can be obtained by calling 888-843-7824 (retail) or 877-836-5854 (institutional). Investors should read them carefully before they invest.
Hartford Funds are underwritten and distributed by Hartford Funds Distributors, LLC.
MFAR-SCG13 12/13 113998-1 Printed in U.S.A. ©2013 The Hartford, Hartford, CT 06155
HARTFORDFUNDS
| THE HARTFORD MUNICIPAL REAL RETURN FUND
2013 Annual Report |
The Hartford Municipal Real Return Fund
Table of Contents
The views expressed in the Fund’s Manager Discussion under ‘‘Why did the Fund perform this way?’’ and ‘‘What is the outlook?’’ are views of the Fund’s sub-adviser and portfolio management team through the end of the period and are subject to change based on market and other conditions. The Fund’s Manager Discussion is for informational purposes only and does not represent an offer, recommendation or solicitation to buy, hold or sell any security. The specific securities identified and described, if any, do not represent all of the securities purchased or sold and you should not assume that investments in the securities identified and discussed will be profitable.
| The Hartford Municipal Real Return Fund inception 06/02/1986 |
| (sub-advised by Wellington Management Company, LLP) |
| |
| Investment objective – Seeks to provide current income exempt from federal income tax and after-tax inflation- adjusted total returns. |
Performance Overview 10/31/03 - 10/31/13
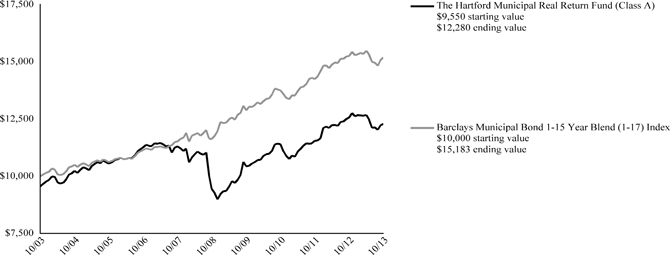
The chart above represents the hypothetical growth of a $10,000 investment in Class A which includes a sales charge. Growth results in classes other than Class A will vary from what is seen above due to differences in the expenses charged to those share classes.
| Average Annual Total Returns (as of 10/31/13) |
| | | 1 Year | | | 5 Years | | | 10 Years | |
| Municipal Real Return A# | | | -2.30% | | | | 5.39% | | | | 2.55% | |
| Municipal Real Return A## | | | -6.70% | | | | 4.43% | | | | 2.08% | |
| Municipal Real Return B# | | | -3.05% | | | | 4.61% | | | | 1.95%* | |
| Municipal Real Return B## | | | -7.82% | | | | 4.27% | | | | 1.95%* | |
| Municipal Real Return C# | | | -3.05% | | | | 4.62% | | | | 1.80% | |
| Municipal Real Return C## | | | -4.00% | | | | 4.62% | | | | 1.80% | |
| Municipal Real Return I# | | | -2.05% | | | | 5.65% | | | | 2.73% | |
| Municipal Real Return Y# | | | -1.94% | | | | 5.69% | | | | 2.77% | |
| Barclays Municipal Bond 1-15 Year Blend (1-17) Index | | | -0.41% | | | | 5.49% | | | | 4.26% | |
| * | Class B shares convert to Class A shares after 8 years. The return shown reflects the conversion to Class A shares, which had different operating expenses, for the period after conversion. |
PERFORMANCE DATA QUOTED REPRESENTS PAST PERFORMANCE AND DOES NOT GUARANTEE FUTURE RESULTS. The investment return and principal value of the investment will fluctuate so that investors’ shares, when redeemed, may be worth more or less than their original cost. Current performance may be lower or higher than the performance data quoted. To obtain performance data current to the most recent month-end, please visit our website www.hartfordfunds.com.
The initial investment in Class A shares reflects the maximum sales charge of 4.50% and returns for Classes B and C reflect a contingent deferred sales charge of 5.00% and 1.00%, respectively.
Total returns presented above were calculated using the Fund’s net asset value available to shareholders for sale or redemption of Fund shares on October 31, 2013, which may exclude investment transactions as of this date. All share class returns assume the reinvestment of all distributions at net asset value and the deduction of all fund expenses.
Effective 9/30/09, Class B shares of the Fund were closed to new investments.
Class I shares commenced operations on 5/31/07. Performance prior to that date is that of the Fund’s Class A shares (excluding sales charges), which had different operating expenses.
Performance information includes performance under the Fund’s previous sub-adviser, Hartford Investment Management Company, using a modified strategy. As of March 5, 2012, Hartford Investment Management Company no longer served as the sub-adviser to the Fund.
Barclays Municipal Bond 1-15 Year Blend (1-17) Index is a sub-index of the Barclays Municipal Bond Index. It is a rules-based market value-weighted index of bonds with maturities of one year to 17 years engineered for the tax-exempt bond market.
You cannot invest directly in an index.
The chart and table do not reflect the deductions of taxes that a shareholder would pay on Fund distributions or the redemption of Fund shares.
Performance information may reflect historical or current expense waivers/reimbursements from the investment adviser, without which performance would have been lower. For information on current expense waivers/reimbursements, please see the prospectus.
| The Hartford Municipal Real Return Fund |
| Manager Discussion |
| October 31, 2013 (Unaudited) |
| Operating Expenses* |
| | | Net | | | Gross | |
| Municipal Real Return Class A | | | 0.87% | | | | 0.89% | |
| Municipal Real Return Class B | | | 1.62% | | | | 1.70% | |
| Municipal Real Return Class C | | | 1.62% | | | | 1.64% | |
| Municipal Real Return Class I | | | 0.62% | | | | 0.66% | |
| Municipal Real Return Class Y | | | 0.60% | | | | 0.60% | |
| * | As of the Fund's current prospectus dated March 1, 2013. Actual expenses may be higher. Please see accompanying Financial Highlights for expense ratios for the year ended October 31, 2013. |
Gross expenses are the Fund's total annual operating expenses shown in the Fund's most recent prospectus. Net expenses are the Fund's total annual operating expenses shown in the Fund's most recent prospectus and reflect contractual expense reimbursements in instances when these reductions reduce the Fund's gross expenses. Contractual reimbursements remain in effect until February 28, 2014 and automatically renew for one-year terms unless terminated.
All investments are subject to risk including the possible loss of principal. For a discussion of the Fund’s risks, please see the Main Risks section. For more detailed information on the risks associated with an investment in the Fund, please see the prospectus.
| Portfolio Managers | | |
| Timothy D. Haney, CFA | Brad W. Libby | Lindsay T. Politi |
| Vice President and Fixed Income Portfolio Manager | Vice President and Fixed Income Credit Analyst | Vice President and Fixed Income Portfolio Manager |
How did the Fund perform?
The Class A shares of The Hartford Municipal Real Return Fund returned -2.30%, before sales charge, for the twelve-month period ended October 31, 2013, underperforming the Fund’s benchmark, the Barclays Municipal Bond 1-15 Year Blend (1-17) Index, which returned -0.41% for the same period. The Fund also underperformed the -1.25% average return of the Lipper Intermediate Municipal Debt Funds peer group, a group of funds with investment strategies similar to those of the Fund.
Why did the Fund perform this way?
Central bank easing policies and signs of a gradual global economic recovery supported the positive tone in financial markets in the early part of the period. However, heightened global political uncertainties and renewed worries over the European sovereign debt crisis, driven by the Italian elections and the Cyprus bailout measures also dominated headlines. Fixed income risk assets experienced mixed performance with major global government bond yields increasing over the twelve-month period. Japanese yields were a notable exception as yields continued to fall due to the Bank of Japan’s unprecedented monetary easing measures which were undertaken in line with Prime Minister Shinzo Abe's bid to revitalize the economy. Speculation that the U.S. Federal Reserve (Fed) would cut stimulus sooner than expected caused increased volatility in financial markets in May/June. As a result, most major global government bond yields surged as market participants grappled with the implications of a liquidity withdrawal despite a subdued global economic outlook. However, most global government bond yields declined towards the end of the period based on expectations of prolonged Fed stimulus as well as expectations that the European Central Bank would potentially cut interest rates due to weak, below-target European inflation data.
The U.S. Treasury yield curve steepened over the twelve-month period as short term yields were flat to slightly down while longer-term yields rose. Many of the major fixed income sectors, with the exception of commercial mortgage backed securities (CMBS), high yield, and bank loans, posted negative absolute returns due to the rise in rates. Most sectors outperformed Treasuries on a duration-adjusted basis as credit spreads tightened.
Despite that, municipal bonds underperformed duration-equivalent Treasuries over the most recent quarter. After much speculation, the city of Detroit filed for bankruptcy in July, becoming the largest U.S. city ever to do so. The initial impact on the municipal market was minimal, as the filing was not entirely unexpected. To the extent that rising rates along with negative headlines from stressed issuers such as Puerto Rico and Detroit continue to spur fund outflows, we expect municipal bonds to underperform Treasuries and credit spreads are likely to widen, at least temporarily. Net negative supply should help offset this dynamic, as we believe borrowers are likely to remain reluctant to start new projects. We also expect that refinancings should diminish with rising rates. Also, we expect that crossover buyers should continue to limit episodes of underperformance. The Fund’s inflation overlay – which is implemented via Consumer Price Index (CPI) swap derivatives – was the primary detractor from benchmark-relative performance, as inflation expectations decreased over the period. An overweight allocation to High Yield Revenue Bonds also detracted from benchmark-relative results, while selection within the sector was positive. Within Investment Grade Revenue Bonds, security selection in the tobacco sector detracted on a relative basis, while selection within Multiple Utilities was additive. Yield curve positioning also contributed positively to relative returns during the period.
What is the outlook?
We expect U.S. economic momentum to be modestly positive, however, the timing of Fed tapering and the U.S.
| The Hartford Municipal Real Return Fund |
| Manager Discussion – (continued) |
| October 31, 2013 (Unaudited) |
fiscal debate create uncertainty. We ended the period with a portfolio constructed with the expectation of moderate economic growth. Net new supply is expected to remain muted versus historic levels, while we expect mutual funds could continue to experience outflows. At the end of the period we favored a neutral duration posture.
As of October 31, 2013 spreads on most municipal credit sectors were tighter year to date, but average spread levels were wider due to the outsize effects of Puerto Rico widening. We believe that municipal credit is attractive relative to corporates on an after tax basis. Our outlook for state general obligation bonds (GOs) is cautiously optimistic, as credit repair continues at the state level (with the exception of Illinois). We were slightly more negative on GOs of local issuers as of the end of the period, where it appears that some issuers will remain under stress. Revenue bond fundamentals are on a slightly positive trend, especially in the special-tax, toll-road, airport, and health care sectors. We ended the period underweight in GOs, especially at the local municipality level. We ended the period overweight in health care, toll roads, and airports.
In the near term, we do not expect meaningful increases in the CPI, as the market is not currently experiencing significant wage pressures or prolonged increases in rental levels. Longer term, we expect headline inflation to rise in the next 18–24 months on the heels of modest economic growth and increased consumer activity. We ended the period with a relatively neutral posture on the inflation overlay with the hedge ratio at approximately 80% on a contribution to duration basis.
Distribution by Credit Quality
as of October 31, 2013
| Credit Rating * | | Percentage of
Net Assets | |
| Aaa / AAA | | | 2.9 | % |
| Aa / AA | | | 25.4 | |
| A | | | 46.6 | |
| Baa / BBB | | | 11.1 | |
| Ba / BB | | | 3.3 | |
| B | | | 0.7 | |
| Unrated | | | 7.4 | |
| Non-Debt Securities and Other Short-Term Instruments | | | 2.0 | |
| Other Assets and Liabilities | | | 0.5 | |
| Total | | | 100.0 | % |
| * | Does not apply to the Fund itself. Based upon Moody’s and S&P long-term credit ratings for the Fund’s holdings as of date noted. If Moody's and S&P assign different ratings to a holding, the lower rating is used. "Unrated" includes fixed-income securities (other than cash-like Short-Term Instruments and U.S. Government Agencies and Securities) for which Moody’s and S&P have not issued long-term credit ratings. Although Moody's and S&P individually rate U.S. Government Agencies and Securities, these securities, if any, are included in the "U.S. Government Agencies and Securities" category for the purposes of the table. |
Distribution by State
as of October 31, 2013
| State | | Percentage of
Net Assets | |
| Alabama | | | 2.3 | % |
| Alaska | | | 0.5 | |
| Arizona | | | 0.9 | |
| California | | | 17.3 | |
| Colorado | | | 0.4 | |
| Delaware | | | 0.7 | |
| District of Columbia | | | 2.3 | |
| Florida | | | 8.3 | |
| Georgia | | | 4.2 | |
| Hawaii | | | 0.3 | |
| Idaho | | | 0.8 | |
| Illinois | | | 7.1 | |
| Indiana | | | 2.2 | |
| Kentucky | | | 1.2 | |
| Louisiana | | | 3.0 | |
| Massachusetts | | | 0.1 | |
| Michigan | | | 1.7 | |
| Minnesota | | | 0.6 | |
| Missouri | | | 0.3 | |
| Nebraska | | | 0.5 | |
| Nevada | | | 2.2 | |
| New Jersey | | | 1.0 | |
| New Mexico | | | 0.1 | |
| New York | | | 8.0 | |
| North Carolina | | | 0.4 | |
| North Dakota | | | 1.0 | |
| Ohio | | | 2.1 | |
| Oklahoma | | | 1.2 | |
| Other U.S. Territories | | | 2.5 | |
| Pennsylvania | | | 3.1 | |
| Rhode Island | | | 1.5 | |
| South Carolina | | | 0.5 | |
| Tennessee | | | 0.5 | |
| Texas | | | 8.9 | |
| Vermont | | | 0.3 | |
| Virginia | | | 0.8 | |
| Washington | | | 4.6 | |
| West Virginia | | | 2.3 | |
| Wisconsin | | | 1.8 | |
| Short-Term Investments | | | 2.0 | |
| Other Assets and Liabilities | | | 0.5 | |
| Total | | | 100.0 | % |
| The Hartford Municipal Real Return Fund |
| Schedule of Investments |
| October 31, 2013 |
| (000’s Omitted) |
| Shares or Principal Amount | | Market Value ╪ | |
| MUNICIPAL BONDS - 97.5% | |
| | | | | Alabama - 2.3% | | | | |
| | | | | Alabama State 21st Century Auth TOB Settlement Rev | | | | |
| $ | 1,100 | | | 4.00%, 06/01/2016 | | $ | 1,173 | |
| | 1,500 | | | 5.00%, 06/01/2017 | | | 1,668 | |
| | | | | Mobile, AL, Industrial Development Board Pollution, Alabama Power Co | | | | |
| | 1,815 | | | 1.65%, 06/01/2034 | | | 1,810 | |
| | | | | | | | 4,651 | |
| | | | | Alaska - 0.5% | | | | |
| | | | | Alaska Municipal Bond Bank Auth GO | | | | |
| | 375 | | | 5.75%, 09/01/2033 | | | 416 | |
| | | | | Anchorage, AK, GO | | | | |
| | 610 | | | 5.25%, 08/01/2028 | | | 672 | |
| | | | | | | | 1,088 | |
| | | | | Arizona - 0.9% | | | | |
| | | | | Arizona State Health Fac Auth Hospital System Rev | | | | |
| | 1,000 | | | 5.00%, 02/01/2020 | | | 1,073 | |
| | | | | Estrella Mountain Ranch, AZ, Community Fac Dist GO | | | | |
| | 265 | | | 6.20%, 07/15/2032 | | | 258 | |
| | | | | Sundance, AZ, Community Fac Dist | | | | |
| | 284 | | | 7.13%, 07/01/2027 ■ | | | 280 | |
| | | | | Vistancia, AZ, Community Fac Dist GO | | | | |
| | 200 | | | 6.75%, 07/15/2022 | | | 200 | |
| | | | | | | | 1,811 | |
| | | | | California - 17.3% | | | | |
| | | | | California State Communities DA Rev | | | | |
| | 250 | | | 0.00%, 07/01/2037 ● | | | — | |
| | 570 | | | 0.96%, 04/01/2036 Δ | | | 402 | |
| | 3,535 | | | 5.00%, 10/01/2022 - 11/01/2029 | | | 3,916 | |
| | | | | California State Corona-Norco University | | | | |
| | 1,530 | | | 4.00%, 09/01/2019 | | | 1,609 | |
| | | | | California State Dept Water Resources Supply Rev | | | | |
| | 500 | | | 5.00%, 05/01/2022 | | | 576 | |
| | | | | California State GO | | | | |
| | 3,515 | | | 6.50%, 04/01/2033 | | | 4,190 | |
| | | | | California State Health Fac FA Rev | | | | |
| | 350 | | | 5.00%, 07/01/2043 | | | 395 | |
| | | | | California State Pollution Control FA | | | | |
| | 2,250 | | | 1.88%, 04/01/2025 | | | 2,258 | |
| | | | | California State Public Works Board Lease Rev | | | | |
| | 1,500 | | | 5.25%, 10/01/2022 | | | 1,743 | |
| | | | | California State Public Works Board, State University Trustees | | | | |
| | 170 | | | 6.13%, 04/01/2029 | | | 197 | |
| | | | | El Dorado, CA, Irrigation Dist | | | | |
| | 300 | | | 5.38%, 08/01/2024 | | | 328 | |
| | | | | Golden State Tobacco Securitization Agency | | | | |
| | 425 | | | 5.00%, 06/01/2017 | | | 462 | |
| | | | | Huntington Park, CA, Public FA Rev | | | | |
| | 400 | | | 5.25%, 09/01/2019 | | | 419 | |
| | | | | Irvine, CA, Emprovement Bond Act | | | | |
| | 1,000 | | | 4.00%, 09/02/2019 | | | 1,060 | |
| | | | | Los Angeles, CA, Airport Rev | | | | |
| | 1,100 | | | 5.00%, 01/01/2020 | | | 1,239 | |
| | | | | Oakland, CA, Airport Rev | | | | |
| 1,000 | | | 5.00%, 05/01/2026 | | | 1,057 | |
| | | | | Palm Springs, CA, Community Redev Agency | | | | |
| | 535 | | | 5.50%, 09/01/2023 | | | 536 | |
| | | | | San Bernardino, CA, Community College Dist GO | | | | |
| | 500 | | | 6.38%, 08/01/2026 | | | 625 | |
| | | | | San Bernardino, CA, Unif School Dist GO | | | | |
| | 725 | | | 5.00%, 08/01/2020 | | | 840 | |
| | | | | San Buenaventura, CA, Rev | | | | |
| | 500 | | | 5.25%, 12/01/2017 | | | 526 | |
| | | | | San Diego, CA, Redev Agency, Centre City Sub Pkg | | | | |
| | 200 | | | 5.25%, 09/01/2026 | | | 200 | |
| | | | | San Francisco City & County, CA, Redev FA | | | | |
| | 1,120 | | | 6.50%, 08/01/2032 | | | 1,247 | |
| | | | | San Jose, CA, Redev Agency | | | | |
| | 1,000 | | | 6.50%, 08/01/2019 | | | 1,126 | |
| | | | | Santa Cruz County, CA, Redev Agency | | | | |
| | 665 | | | 6.63%, 09/01/2029 | | | 745 | |
| | | | | Santa Margarita, CA, Water Dist Special Tax | | | | |
| | 1,000 | | | 5.00%, 09/01/2024 - 09/01/2025 | | | 1,007 | |
| | | | | Southern California State Public Power Auth | | | | |
| | 500 | | | 5.00%, 07/01/2023 | | | 567 | |
| | | | | Temecula, CA, Redev Agency Tax Allocation Rev | | | | |
| | 240 | | | 5.63%, 12/15/2038 | | | 243 | |
| | | | | Torrance, CA, USD GO | | | | |
| | 1,500 | | | 5.50%, 08/01/2025 | | | 1,707 | |
| | | | | Tuolumne, CA, Wind Proj Auth Rev | | | | |
| | 1,000 | | | 5.88%, 01/01/2029 | | | 1,116 | |
| | | | | Twin Rivers, CA, Unif School Dist Cops | | | | |
| | 700 | | | 3.20%, 06/01/2035 | | | 693 | |
| | | | | University of California | | | | |
| | 1,000 | | | 5.25%, 05/15/2027 | | | 1,125 | |
| | | | | Ventura County, CA, Certificates of Participation | | | | |
| | 1,250 | | | 5.63%, 08/15/2027 | | | 1,359 | |
| | | | | Washington Township, CA, Health Care Dist Rev | | | | |
| | 1,000 | | | 6.00%, 07/01/2029 | | | 1,060 | |
| | | | | | | | 34,573 | |
| | | | | Colorado - 0.4% | | | | |
| | | | | University of Colorado Enterprise Rev | | | | |
| | 600 | | | 5.75%, 06/01/2028 | | | 696 | |
| | | | | | | | | |
| | | | | Delaware - 0.7% | | | | |
| | | | | Delaware State Transportation Auth | | | | |
| | 1,180 | | | 5.00%, 07/01/2025 | | | 1,323 | |
| | | | | | | | | |
| | | | | District of Columbia - 2.3% | | | | |
| | | | | District of Columbia University Rev | | | | |
| | 3,000 | | | 5.25%, 04/01/2034 ╦ | | | 3,349 | |
| | | | | Metropolitan Washington, DC, Airport Auth System Rev | | | | |
| | 1,035 | | | 5.00%, 10/01/2022 | | | 1,181 | |
| | | | | | | | 4,530 | |
The accompanying notes are an integral part of these financial statements.
| The Hartford Municipal Real Return Fund |
| Schedule of Investments – (continued) |
| October 31, 2013 |
| (000’s Omitted) |
| Shares or Principal Amount | | Market Value ╪ | |
| MUNICIPAL BONDS - 97.5% - (continued) | |
| | | | | Florida - 8.3% | | | | |
| | | | | Broward County, FL, Airport System Rev | | | | |
| $ | 2,435 | | | 5.00%, 10/01/2016 - 10/01/2021 | | $ | 2,723 | |
| | | | | Greater Orlando, FL, Aviation Auth | | | | |
| | 2,500 | | | 5.00%, 10/01/2021 - 10/01/2024 | | | 2,802 | |
| | | | | Jacksonville, FL, Econ Development Commission Obligor: Florida Proton Therapy Institute, Inc | | | | |
| | 2,000 | | | 6.25%, 09/01/2027 | | | 2,137 | |
| | | | | Jacksonville, FL, Sales Tax Rev | | | | |
| | 640 | | | 5.00%, 10/01/2018 | | | 733 | |
| | | | | Miami Beach, FL, Health Fac Auth | | | | |
| | 190 | | | 5.00%, 11/15/2020 | | | 207 | |
| | | | | Miami-Dade County, FL, Aviation Rev | | | | |
| | 900 | | | 4.00%, 10/01/2017 | | | 985 | |
| | 1,000 | | | 5.00%, 10/01/2018 | | �� | 1,141 | |
| | | | | Miami-Dade County, FL, Educational Fac Auth | | | | |
| | 2,000 | | | 5.75%, 04/01/2028 | | | 2,142 | |
| | | | | Palm Beach County, FL, School Board | | | | |
| | 955 | | | 5.00%, 08/01/2025 | | | 1,057 | |
| | | | | River Bend Community Development Dist, Capital Improvement Rev | | | | |
| | 880 | | | 0.00%, 11/01/2015 ● | | | 202 | |
| | | | | Tampa Bay, FL, Regional Water Supply Auth | | | | |
| | 2,000 | | | 5.00%, 10/01/2019 | | | 2,379 | |
| | | | | | | | 16,508 | |
| | | | | Georgia - 4.2% | | | | |
| | | | | Atlanta, GA, Airport Passenger Fac Charge Rev | | | | |
| | 2,000 | | | 5.00%, 01/01/2023 | | | 2,227 | |
| | | | | Atlanta, GA, Water & Wastewater Rev | | | | |
| | 1,500 | | | 6.00%, 11/01/2022 | | | 1,789 | |
| | | | | Floyd County, GA, DA | | | | |
| | 2,000 | | | 0.85%, 07/01/2022 Δ | | | 1,999 | |
| | | | | Fulton County, GA, School Dist GO | | | | |
| | 1,105 | | | 5.38%, 01/01/2018 | | | 1,293 | |
| | | | | Georgia Municipal Electric Auth, Power Rev (Prerefunded with US Gov't Securities) | | | | |
| | 55 | | | 6.50%, 01/01/2017 | | | 57 | |
| | | | | Georgia State Municipal Elec Auth | | | | |
| | 945 | | | 6.50%, 01/01/2017 | | | 1,023 | |
| | | | | | | | 8,388 | |
| | | | | Hawaii - 0.3% | | | | |
| | | | | Hawaii State Harbor System Rev | | | | |
| | 500 | | | 5.38%, 01/01/2020 | | | 515 | |
| | | | | | | | | |
| | | | | Idaho - 0.8% | | | | |
| | | | | Idaho State Bond Bank Auth Rev | | | | |
| | 1,470 | | | 5.63%, 09/15/2026 | | | 1,666 | |
| | | | | | | | | |
| | | | | Illinois - 7.1% | | | | |
| | | | | Chicago, IL, O'Hare International Airport Rev | | | | |
| | 2,540 | | | 5.00%, 01/01/2015 - 01/01/2026 | | | 2,685 | |
| | 1,000 | | | 5.25%, 01/01/2027 | | | 1,006 | |
| | | | | Hampshire, IL, Special Service Area #13, Tuscany Woods Proj | | | | |
| | 1,725 | | | 0.00%, 03/01/2037 ● | | | 776 | |
| | | | | Huntley, IL, Special Service #9 | | | | |
| | 1,500 | | | 5.10%, 03/01/2028 | | | 1,603 | |
| | | | | Illinois State FA Rev | | | | |
| 1,000 | | | 5.00%, 10/01/2023 | | | 1,150 | |
| | | | | Illinois State GO | | | | |
| | 1,000 | | | 5.00%, 01/01/2022 | | | 1,059 | |
| | 2,000 | | | 5.25%, 01/01/2021 | | | 2,212 | |
| | | | | Illinois State Toll Highway Auth | | | | |
| | 1,060 | | | 5.00%, 01/01/2023 - 01/01/2027 | | | 1,153 | |
| | | | | Railsplitter, IL, Tobacco Settlement Auth | | | | |
| | 1,000 | | | 5.50%, 06/01/2023 | | | 1,080 | |
| | | | | Springfield, IL, Water Rev | | | | |
| | 500 | | | 5.25%, 03/01/2026 | | | 553 | |
| | | | | Wauconda, IL, Special Service Area #1 Special Tax Liberty Lakes Proj | | | | |
| | 947 | | | 6.63%, 03/01/2033 | | | 961 | |
| | | | | | | | 14,238 | |
| | | | | Indiana - 2.2% | | | | |
| | | | | Indiana State Housing & Community DA | | | | |
| | 1,365 | | | 4.55%, 07/01/2027 ╦ | | | 1,393 | |
| | | | | Indianapolis, IN, Airport Auth Rev | | | | |
| | 1,650 | | | 5.10%, 01/15/2017 | | | 1,800 | |
| | | | | University of Southern Indiana | | | | |
| | 1,070 | | | 5.00%, 10/01/2022 - 10/01/2023 | | | 1,179 | |
| | | | | | | | 4,372 | |
| | | | | Kentucky - 1.2% | | | | |
| | | | | Louisville & Jefferson County, KY | | | | |
| | 1,220 | | | 1.65%, 10/01/2033 Δ | | | 1,235 | |
| | | | | Louisville & Jefferson County, KY, Metropolitan Government Rev | | | | |
| | 1,085 | | | 5.00%, 12/01/2023 | | | 1,230 | |
| | | | | | | | 2,465 | |
| | | | | Louisiana - 3.0% | | | | |
| | | | | Louisiana State Citizens Property PSFG Corp | | | | |
| | 1,475 | | | 5.00%, 06/01/2016 | | | 1,607 | |
| | | | | Louisiana State Office Fac Corp Lease Rev | | | | |
| | 2,500 | | | 5.00%, 11/01/2021 | | | 2,862 | |
| | | | | Louisiana Tobacco Settlement Financing Corp | | | | |
| | 1,500 | | | 5.00%, 05/15/2026 | | | 1,556 | |
| | | | | | | | 6,025 | |
| | | | | Massachusetts - 0.1% | | | | |
| | | | | Massachusetts State Development Fin Agency Rev | | | | |
| | 200 | | | 5.00%, 07/01/2014 | | | 205 | |
| | | | | | | | | |
| | | | | Michigan - 1.7% | | | | |
| | | | | Detroit, MI, Water Supply System Ref Rev | | | | |
| | 1,750 | | | 6.50%, 07/01/2015 | | | 1,790 | |
| | | | | Grand Valley, MI, State University Rev | | | | |
| | 1,500 | | | 5.50%, 12/01/2027 | | | 1,623 | |
| | | | | | | | 3,413 | |
| | | | | Minnesota - 0.6% | | | | |
| | | | | University of Minnesota (Prerefunded with State & Local Gov't Securities) | | | | |
| | 1,000 | | | 5.75%, 07/01/2018 | | | 1,212 | |
| | | | | | | | | |
| | | | | Missouri - 0.3% | | | | |
| | | | | Stone Canyon, MO, Community Improvement Dist Rev | | | | |
| | 1,000 | | | 0.00%, 04/01/2027 ⌂● | | | 520 | |
The accompanying notes are an integral part of these financial statements.
| Shares or Principal Amount | | Market Value ╪ | |
| MUNICIPAL BONDS - 97.5% - (continued) | |
| | | | | Nebraska - 0.5% | | | | |
| | | | | Central Plains, NE, Energy Proj Gas Rev | | | | |
| $ | 1,000 | | | 5.00%, 09/01/2015 | | $ | 1,071 | |
| | | | | | | | | |
| | | | | Nevada - 2.2% | | | | |
| | | | | Clark County, NV, School Dist GO | | | | |
| | 1,000 | | | 5.00%, 06/15/2020 | | | 1,071 | |
| | | | | Nevada State GO | | | | |
| | 2,870 | | | 5.00%, 08/01/2019 | | | 3,379 | |
| | | | | | | | 4,450 | |
| | | | | New Jersey - 1.0% | | | | |
| | | | | New Jersey State Econ DA | | | | |
| | 885 | | | 4.88%, 09/15/2019 | | | 855 | |
| | | | | New Jersey State Econ DA Lease Rev | | | | |
| | 1,000 | | | 5.00%, 09/01/2021 | | | 1,146 | |
| | | | | | | | 2,001 | |
| | | | | New Mexico - 0.1% | | | | |
| | | | | Cabezon, NM, Public Improvement Dist | | | | |
| | 240 | | | 5.20%, 09/01/2015 | | | 241 | |
| | | | | | | | | |
| | | | | New York - 8.0% | | | | |
| | | | | Metropolitan Transportation Auth, NY, Rev | | | | |
| | 3,000 | | | 5.25%, 11/15/2023 | | | 3,388 | |
| | | | | New York State Dormitory Auth Rev | | | | |
| | 1,000 | | | 5.00%, 03/15/2022 | | | 1,168 | |
| | | | | New York State Dormitory Auth, Teacher's College | | | | |
| | 2,000 | | | 5.38%, 03/01/2029 | | | 2,114 | |
| | | | | New York State Dormitory Auth, Upstate Community College | | | | |
| | 250 | | | 5.25%, 07/01/2021 | | | 257 | |
| | | | | New York State Thruway Auth | | | | |
| | 2,500 | | | 5.00%, 04/01/2021 | | | 2,950 | |
| | | | | New York, NY, GO | | | | |
| | 1,000 | | | 6.25%, 10/15/2028 | | | 1,172 | |
| | | | | Newburth, NY, GO | | | | |
| | 1,255 | | | 5.00%, 06/15/2017 - 06/15/2018 | | | 1,329 | |
| | | | | Ulster County, NY, IDA Kingston Regional Senior Living Proj | | | | |
| | 4,475 | | | 6.00%, 09/15/2027 | | | 3,502 | |
| | | | | | | | 15,880 | |
| | | | | North Carolina - 0.4% | | | | |
| | | | | Mecklenburg County, NC, Certificate of Participation School Improvements | | | | |
| | 795 | | | 5.00%, 02/01/2024 | | | 888 | |
| | | | | | | | | |
| | | | | North Dakota - 1.0% | | | | |
| | | | | North Dakota State FA | | | | |
| | 1,750 | | | 5.00%, 10/01/2022 ‡ | | | 2,052 | |
| | | | | | | | | |
| | | | | Ohio - 2.1% | | | | |
| | | | | Cuyahoga, OH, Community College Dist | | | | |
| | 1,200 | | | 5.00%, 08/01/2027 | | | 1,307 | |
| | | | | Hamilton, OH, School Dist Improvement GO | | | | |
| | 1,270 | | | 6.15%, 12/01/2016 | | | 1,458 | |
| | | | | Ohio State Solid Waste Rev | | | | |
| | 1,500 | | | 2.25%, 11/01/2022 | | | 1,516 | |
| | | | | | | | 4,281 | |
| | | | | Oklahoma - 1.2% | | | | |
| | | | | Norman, OK, Regional Hospital Auth Rev | | | | |
| 2,310 | | | 5.25%, 09/01/2019 | | | 2,416 | |
| | | | | | | | | |
| | | | | Other U.S. Territories - 2.5% | | | | |
| | | | | Guam Government Business Privilege Tax Rev | | | | |
| | 1,500 | | | 5.00%, 01/01/2027 | | | 1,595 | |
| | | | | Guam Government Power Auth Rev | | | | |
| | 2,000 | | | 5.00%, 10/01/2021 - 10/01/2023 | | | 2,279 | |
| | | | | Puerto Rico Highway & Transportation | | | | |
| | 500 | | | 5.50%, 07/01/2015 | | | 488 | |
| | | | | University Virgin Islands | | | | |
| | 270 | | | 5.13%, 12/01/2022 | | | 284 | |
| | 225 | | | 5.25%, 12/01/2023 - 12/01/2024 | | | 237 | |
| | | | | | | | 4,883 | |
| | | | | Pennsylvania - 3.1% | | | | |
| | | | | Monroeville, PA, FA University of Pittsburg Medical Center Rev | | | | |
| | 500 | | | 4.00%, 02/15/2016 | | | 535 | |
| | | | | Pennsylvania State Turnpike Commission Rev | | | | |
| | 665 | | | 6.00%, 06/01/2028 | | | 754 | |
| | | | | Philadelphia, PA, GO | | | | |
| | 1,000 | | | 5.25%, 08/01/2019 | | | 1,149 | |
| | | | | Pittsburgh, PA, School Dist GO | | | | |
| | 2,320 | | | 5.00%, 09/01/2021 - 09/01/2023 | | | 2,645 | |
| | | | | Susquehanna, PA, Regional Airport Auth System Rev | | | | |
| | 1,000 | | | 5.00%, 01/01/2018 | | | 1,056 | |
| | | | | | | | 6,139 | |
| | | | | Rhode Island - 1.5% | | | | |
| | | | | Cranston, RI, GO | | | | |
| | 1,410 | | | 5.00%, 07/01/2018 | | | 1,582 | |
| | | | | Rhode Island St Health & Educational Bldg Corp | | | | |
| | 1,215 | | | 5.00%, 05/15/2018 ☼ | | | 1,365 | |
| | | | | | | | 2,947 | |
| | | | | South Carolina - 0.5% | | | | |
| | | | | South Carolina St Jobs-Econ Development Auth Hospital Rev | | | | |
| | 1,000 | | | 5.25%, 08/01/2024 | | | 1,063 | |
| | | | | | | | | |
| | | | | Tennessee - 0.5% | | | | |
| | | | | Johnson City, TN, Health & Educational Fac Board Hospital Rev | | | | |
| | 1,000 | | | 5.50%, 07/01/2031 | | | 1,021 | |
| | | | | | | | | |
| | | | | Texas - 8.9% | | | | |
| | | | | Dallas-Fort Worth, TX, International Airport Rev | | | | |
| | 750 | | | 5.00%, 11/01/2023 | | | 806 | |
| | | | | Houston, TX, Utility System Rev | | | | |
| | 2,000 | | | 6.00%, 11/15/2036 | | | 2,220 | |
| | | | | Kerrville, TX, Health Fac Development Corp Hospital Rev | | | | |
| | 935 | | | 5.00%, 08/15/2015 | | | 980 | |
| | | | | Love Field, TX, Airport Modernization Corp Special Fac Rev | | | | |
| | 1,000 | | | 5.00%, 11/01/2015 | | | 1,051 | |
The accompanying notes are an integral part of these financial statements.
| The Hartford Municipal Real Return Fund |
| Schedule of Investments – (continued) |
| October 31, 2013 |
| (000’s Omitted) |
| Shares or Principal Amount | | Market Value ╪ | |
| MUNICIPAL BONDS - 97.5% - (continued) | |
| | | | | Texas - 8.9% - (continued) | | | | |
| | | | | Lower Colorado River Auth Rev (Prerefunded with State & Local Gov't Securities) | | | | |
| $ | 1,965 | | | 7.25%, 05/15/2037 | | $ | 2,173 | |
| | | | | North Texas Tollway Auth Rev | | | | |
| | 1,055 | | | 1.95%, 01/01/2038 | | | 1,018 | |
| | 1,000 | | | 5.00%, 09/01/2023 | | | 1,148 | |
| | 3,000 | | | 6.00%, 01/01/2025 | | | 3,390 | |
| | | | | San Antonio, TX, Airport System Rev | | | | |
| | 1,000 | | | 5.00%, 07/01/2016 | | | 1,101 | |
| | | | | Tarrant County, TX, Culturall Education Fac | | | | |
| | 1,000 | | | 6.25%, 11/15/2029 | | | 1,122 | |
| | | | | Texas State Municipal Gas Acquisition & Supply Cor | | | | |
| | 1,000 | | | 5.25%, 12/15/2017 | | | 1,112 | |
| | | | | Texas State Transportation Commission Turnpike System Rev | | | | |
| | 635 | | | 1.25%, 08/15/2042 | | | 637 | |
| | | | | Travis County, TX, Health Fac, Querencia Barton Creek Project | | | | |
| | 1,000 | | | 5.65%, 11/15/2035 | | | 939 | |
| | | | | | | | 17,697 | |
| | | | | Vermont - 0.3% | | | | |
| | | | | Vermont State Econ DA Waste | | | | |
| | 600 | | | 4.75%, 04/01/2036 ■ | | | 576 | |
| | | | | | | | | |
| | | | | Virginia - 0.8% | | | | |
| | | | | Virginia State Resources Auth Infrastructure | | | | |
| | 500 | | | 5.00%, 11/01/2024 | | | 562 | |
| | | | | Virginia Tobacco Settlement Funding Corp (Prerefunded with US Gov't Securities) | | | | |
| | 1,010 | | | 5.50%, 06/01/2026 ╦ | | | 1,066 | |
| | | | | | | | 1,628 | |
| | | | | Washington - 4.6% | | | | |
| | | | | FYI Properties, WA, Lease Rev | | | | |
| | 2,285 | | | 5.50%, 06/01/2034 | | | 2,433 | |
| | | | | Grant County, WA, Utility Dist #2 | | | | |
| | 3,260 | | | 5.00%, 01/01/2020 - 01/01/2021 | | | 3,703 | |
| | | | | Tobacco Settlement Auth, WA, Rev | | | | |
| | 1,500 | | | 5.00%, 06/01/2023 | | | 1,673 | |
| | | | | Washington State, Health Care Fac Auth | | | | |
| | 1,175 | | | 5.00%, 10/01/2042 | | | 1,334 | |
| | | | | | | | 9,143 | |
| | | | | West Virginia - 2.3% | | | | |
| | | | | West Virginia State Econ DA Lease Rev | | | | |
| | 2,585 | | | 5.00%, 06/01/2019 - 06/01/2020 | | | 3,015 | |
| | | | | West Virginia State Econ DA Solid Waste Disposal Fac | | | | |
| | 1,500 | | | 2.25%, 01/01/2041 | | | 1,514 | |
| | | | | | | | 4,529 | |
| | | | | Wisconsin - 1.8% | | | | |
| | | | | Wisconsin State GO | | | | |
| | 125 | | | 5.75%, 05/01/2033 | | | 137 | |
| | 865 | | | 6.00%, 05/01/2036 | | | | | | | 953 | |
| | | | | Wisconsin State Health & Educational Fac Auth Rev | | | | | | | | |
| 2,265 | | | 5.00%, 02/15/2026 | | | | | | | 2,438 | |
| | | | | | | | | | | | 3,528 | |
| | | | | Total municipal bonds | | | | | | | | |
| | | | | (cost $190,982) | | | | | | $ | 194,633 | |
| | | | | | | | | | | | | |
| | | | | Total long-term investments | | | | | | | | |
| | | | | (cost $190,982) | | | | | | $ | 194,633 | |
| | | | | | | | | | | | | |
| SHORT-TERM INVESTMENTS - 2.0% |
| | | | | Investment Pools and Funds - 2.0% | | | | | | | | |
| | 3,913 | | | JP Morgan Tax Free Money Market Fund | | | | | | $ | 3,913 | |
| | | | | | | | | | | | | |
| | | | | Total short-term investments | | | | | | | | |
| | | | | (cost $3,913) | | | | | | $ | 3,913 | |
| | | | | | | | | | | | | |
| | | | | Total investments | | | | | | | | |
| | | | | (cost $194,895) ▲ | | | 99.5 | % | | $ | 198,546 | |
| | | | | Other assets and liabilities | | | 0.5 | % | | | 982 | |
| | | | | Total net assets | | | 100.0 | % | | $ | 199,528 | |
The accompanying notes are an integral part of these financial statements.
| Note: | Percentage of investments as shown is the ratio of the total market value to total net assets. |
| ▲ | Also represents cost for tax purposes. |
| ● | Non-income producing. For long-term debt securities, items identified are in default as to payment of interest and/or principal. |
| ☼ | This security, or a portion of this security, was purchased on a when-issued, delayed-delivery or delayed-draw basis. The cost of these securities was $1,360 at October 31, 2013. |
| ‡ | This security, or a portion of this security, has been segregated to cover funding requirements on investment transactions settling in the future. |
| ╦ | This security, or a portion of this security, has been pledged as collateral in connection with swap contracts. The Fund has also pledged $4,167 of cash as collateral in connection with swap contracts. |
| Δ | Variable rate securities; the rate reported is the coupon rate in effect at October 31, 2013. |
| ■ | Securities issued within terms of a private placement memorandum, exempt from registration under Rule 144A under the Securities Act of 1933, as amended, and may be sold only to qualified institutional buyers. Unless otherwise indicated, these holdings are determined to be liquid. At October 31, 2013, the aggregate value of these securities was $856, which represents 0.4% of total net assets. |
| ⌂ | The following securities are considered illiquid. Illiquid securities are often purchased in private placement transactions, are often not registered under the Securities Act of 1933 and may have contractual restrictions on resale. A security may also be considered illiquid if the security lacks a readily available market or if its valuation has not changed for a certain period of time. |
| Period Acquired | | Shares/ Par | | | Security | | | Cost Basis | |
| 04/2007 | | $ | 1,000 | | | Stone Canyon, MO, Community Improvement Dist Rev, 0.00%, 04/01/2027 | | $ | 990 | |
At October 31, 2013, the aggregate value of these securities was $520, which represents 0.3% of total net assets.
The accompanying notes are an integral part of these financial statements.
| The Hartford Municipal Real Return Fund |
| Schedule of Investments – (continued) |
| October 31, 2013 |
| (000’s Omitted) |
Interest Rate Swap Contracts Outstanding at October 31, 2013
| Counterparty | | Payments made by Fund | | Payments received by Fund | | Notional
Amount * | | | Expiration
Date | | | Upfront
Premiums
Paid/
(Received) | | | Market
Value ╪ | | | Unrealized
Appreciation/
(Depreciation) | |
| BCLY | | 1.98% Fixed | | CPURNSA 229.35 | | | 8,750 | | | | 09/11/14 | | | $ | – | | | $ | (54 | ) | | $ | (54 | ) |
| BCLY | | 2.09% Fixed | | CPURNSA 231.37 | | | 25,350 | | | | 12/14/15 | | | | – | | | | (413 | ) | | | (413 | ) |
| BCLY | | 2.22% Fixed | | CPURNSA 226.79 | | | 12,925 | | | | 04/05/15 | | | | – | | | | (236 | ) | | | (236 | ) |
| BCLY | | 2.65% Fixed | | CPURNSA 219.28 | | | 10,500 | | | | 03/04/18 | | | | – | | | | (434 | ) | | | (434 | ) |
| BCLY | | 2.75% Fixed | | CPURNSA 219.24 | | | 7,000 | | | | 03/03/21 | | | | – | | | | (342 | ) | | | (342 | ) |
| BCLY | | 2.98% Fixed | | CPURNSA 219.41 | | | 5,750 | | | | 03/08/26 | | | | – | | | | (407 | ) | | | (407 | ) |
| BOA | | 2.45% Fixed | | CPURNSA 226.34 | | | 7,800 | | | | 03/22/17 | | | | – | | | | (245 | ) | | | (245 | ) |
| CBK | | 2.34% Fixed | | CPURNSA 232.04 | | | 525 | | | | 04/15/18 | | | | – | | | | (11 | ) | | | (11 | ) |
| CSI | | 2.82% Fixed | | CPURNSA 230.07 | | | 2,500 | | | | 02/08/23 | | | | – | | | | (107 | ) | | | (107 | ) |
| DEUT | | 1.40% Fixed | | CPURNSA 226.04 | | | 7,000 | | | | 10/07/14 | | | | – | | | | 47 | | | | 47 | |
| DEUT | | 2.40% Fixed | | CPURNSA 226.02 | | | 7,800 | | | | 03/12/17 | | | | – | | | | (219 | ) | | | (219 | ) |
| DEUT | | 2.48% Fixed | | CPURNSA 232.72 | | | 2,300 | | | | 07/15/23 | | | | – | | | | (1 | ) | | | (1 | ) |
| JPM | | 2.33% Fixed | | CPURNSA 225.91 | | | 7,000 | | | | 09/30/21 | | | | – | | | | (60 | ) | | | (60 | ) |
| JPM | | 2.34% Fixed | | CPURNSA 219.28 | | | 3,600 | | | | 03/04/14 | | | | – | | | | (26 | ) | | | (26 | ) |
| JPM | | 2.75% Fixed | | CPURNSA 219.24 | | | 7,000 | | | | 03/03/21 | | | | – | | | | (342 | ) | | | (342 | ) |
| JPM | | 2.97% Fixed | | CPURNSA 220.69 | | | 6,800 | | | | 04/14/26 | | | | – | | | | (469 | ) | | | (469 | ) |
| MSC | | 2.60% Fixed | | CPURNSA 233.07 | | | 6,450 | | | | 08/08/23 | | | | – | | | | (76 | ) | | | (76 | ) |
| UBS | | 2.07% Fixed | | CPURNSA 229.92 | | | 9,925 | | | | 07/19/17 | | | | – | | | | (110 | ) | | | (110 | ) |
| UBS | | 2.65% Fixed | | CPURNSA 219.28 | | | 5,250 | | | | 03/04/18 | | | | – | | | | (217 | ) | | | (217 | ) |
| UBS | | 2.71% Fixed | | CPURNSA 220.65 | | | 1,750 | | | | 04/13/16 | | | | – | | | | (71 | ) | | | (71 | ) |
| UBS | | 2.75% Fixed | | CPURNSA 219.24 | | | 7,000 | | | | 03/03/21 | | | | – | | | | (342 | ) | | | (342 | ) |
| UBS | | 2.79% Fixed | | CPURNSA 220.65 | | | 7,800 | | | | 04/13/18 | | | | – | | | | (416 | ) | | | (416 | ) |
| UBS | | 2.95% Fixed | | CPURNSA 219.38 | | | 5,750 | | | | 03/07/26 | | | | – | | | | (372 | ) | | | (372 | ) |
| | | | | | | | | | | | | | | $ | – | | | $ | (4,923 | ) | | $ | (4,923 | ) |
* Notional shown in U.S. dollars unless otherwise noted.
| ╪ | See Significant Accounting Policies of accompanying Notes to Financial Statements regarding valuation of securities. |
| GLOSSARY: (abbreviations used in preceding Schedule of Investments) |
| |
| Counterparty Abbreviations: |
| BCLY | Barclays | |
| BOA | Banc of America Securities LLC |
| CBK | Citibank NA | |
| CSI | Credit Suisse International |
| DEUT | Deutsche Bank Securities, Inc. |
| JPM | JP Morgan Chase & Co. | |
| MSC | Morgan Stanley | |
| UBS | UBS AG | |
| | |
| Index Abbreviations: |
| CPURNSA | Consumer Price All Urban Non-Seasonally Adjusted |
| | | |
| Municipal Bond Abbreviations: |
| DA | Development Authority | |
| FA | Finance Authority | |
| GO | General Obligation | |
| IDA | Industrial Development Authority |
| PSFG | Public School Fund Guarantee |
| Rev | Revenue | |
| TOB | Tender Option Bond | |
| USD | United School District | |
The accompanying notes are an integral part of these financial statements.
| The Hartford Municipal Real Return Fund |
| Investment Valuation Hierarchy Level Summary |
| October 31, 2013 |
| (000’s Omitted) |
| | | Total | | | Level 1 ♦ | | | Level 2 ♦ | | | Level 3 | |
| Assets: | | | | | | | | | | | | | | | | |
| Municipal Bonds | | | 194,633 | | | | – | | | | 194,633 | | | | – | |
| Short-Term Investments | | | 3,913 | | | | 3,913 | | | | – | | | | – | |
| Total | | $ | 198,546 | | | $ | 3,913 | | | $ | 194,633 | | | $ | – | |
| Interest Rate Swaps * | | | 47 | | | | – | | | | 47 | | | | – | |
| Total | | $ | 47 | | | $ | – | | | $ | 47 | | | $ | – | |
| Liabilities: | | | | | | | | | | | | | | | | |
| Interest Rate Swaps * | | | 4,970 | | | | – | | | | 4,970 | | | | – | |
| Total | | $ | 4,970 | | | $ | – | | | $ | 4,970 | | | $ | – | |
| ♦ | For the year ended October 31, 2013, there were no transfers between Level 1 and Level 2. |
| * | Derivative instruments not reflected in the Schedule of Investments are valued at the unrealized appreciation/depreciation on the investments. |
| Note: | For purposes of reporting transfers between different hierarchy levels, both transfers in and out of each level, as applicable, are shown as if they occurred at the beginning of the period. |
The accompanying notes are an integral part of these financial statements.
| The Hartford Municipal Real Return Fund |
| Statement of Assets and Liabilities |
| October 31, 2013 |
| (000’s Omitted) |
| Assets: | | | | |
| Investments in securities, at market value (cost $194,895) | | $ | 198,546 | |
| Cash | | | 4,167 | * |
| Unrealized appreciation on OTC swap contracts | | | 47 | |
| Receivables: | | | | |
| Investment securities sold | | | 2,718 | |
| Fund shares sold | | | 85 | |
| Dividends and interest | | | 2,505 | |
| Other assets | | | 43 | |
| Total assets | | | 208,111 | |
| Liabilities: | | | | |
| Unrealized depreciation on OTC swap contracts | | | 4,970 | |
| Payables: | | | | |
| Investment securities purchased | | | 3,155 | |
| Fund shares redeemed | | | 334 | |
| Investment management fees | | | 19 | |
| Dividends | | | 51 | |
| Distribution fees | | | 14 | |
| Accrued expenses | | | 31 | |
| Other liabilities | | | 9 | |
| Total liabilities | | | 8,583 | |
| Net assets | | $ | 199,528 | |
| Summary of Net Assets: | | | | |
| Capital stock and paid-in-capital | | $ | 244,127 | |
| Undistributed net investment income | | | 42 | |
| Accumulated net realized loss | | | (43,369 | ) |
| Unrealized depreciation of investments | | | (1,272 | ) |
| Net assets | | $ | 199,528 | |
| | | | | |
| Shares authorized | | | 19,300,000 | |
| Par value | | $ | 0.0001 | |
| Class A: Net asset value per share/Maximum offering price per share | | | $9.27/$9.71 | |
| Shares outstanding | | | 13,372 | |
| Net assets | | $ | 124,008 | |
| Class B: Net asset value per share | | $ | 9.19 | |
| Shares outstanding | | | 239 | |
| Net assets | | $ | 2,194 | |
| Class C: Net asset value per share | | $ | 9.22 | |
| Shares outstanding | | | 4,141 | |
| Net assets | | $ | 38,185 | |
| Class I: Net asset value per share | | $ | 9.29 | |
| Shares outstanding | | | 1,375 | |
| Net assets | | $ | 12,776 | |
| Class Y: Net asset value per share | | $ | 9.25 | |
| Shares outstanding | | | 2,419 | |
| Net assets | | $ | 22,365 | |
* Cash of $4,167 was pledged as collateral for open swap contracts at October 31, 2013.
The accompanying notes are an integral part of these financial statements.
| The Hartford Municipal Real Return Fund |
Statement of Operations |
For the Year Ended October 31, 2013 |
| (000’s Omitted) |
| Investment Income: | | | | |
| Interest | | $ | 7,927 | |
| Total investment income | | | 7,927 | |
| | | | | |
| Expenses: | | | | |
| Investment management fees | | | 1,180 | |
| Transfer agent fees | | | | |
| Class A | | | 74 | |
| Class B | | | 4 | |
| Class C | | | 22 | |
| Class I | | | 11 | |
| Class Y | | | — | |
| Distribution fees | | | | |
| Class A | | | 362 | |
| Class B | | | 28 | |
| Class C | | | 453 | |
| Custodian fees | | | 11 | |
| Accounting services fees | | | 38 | |
| Registration and filing fees | | | 76 | |
| Board of Directors' fees | | | 7 | |
| Audit fees | | | 13 | |
| Other expenses | | | 34 | |
| Total expenses (before waivers and fees paid indirectly) | | | 2,313 | |
| Expense waivers | | | (60 | ) |
| Custodian fee offset | | | — | |
| Total waivers and fees paid indirectly | | | (60 | ) |
| Total expenses, net | | | 2,253 | |
| Net Investment Income | | | 5,674 | |
| Net Realized Loss on Investments and Other Financial Instruments: | | | | |
| Net realized gain on investments | | | 540 | |
| Net realized loss on swap contracts | | | (690 | ) |
| Net Realized Loss on Investments and Other Financial Instruments | | | (150 | ) |
| Net Changes in Unrealized Depreciation of Investments and Other Financial Instruments: | | | | |
| Net unrealized depreciation of investments | | | (8,177 | ) |
| Net unrealized depreciation of swap contracts | | | (3,507 | ) |
| Net Changes in Unrealized Depreciation of Investments and Other Financial Instruments | | | (11,684 | ) |
| Net Loss on Investments and Other Financial Instruments | | | (11,834 | ) |
| Net Decrease in Net Assets Resulting from Operations | | $ | (6,160 | ) |
The accompanying notes are an integral part of these financial statements.
| The Hartford Municipal Real Return Fund |
| Statement of Changes in Net Assets |
| |
| (000’s Omitted) |
| | | For the
Year Ended
October 31, 2013 | | | For the
Year Ended
October 31, 2012 | |
| Operations: | | | | | | | | |
| Net investment income | | $ | 5,674 | | | $ | 6,824 | |
| Net realized gain (loss) on investments and other financial instruments | | | (150 | ) | | | 7,650 | |
| Net unrealized appreciation (depreciation) of investments and other financial instruments | | | (11,684 | ) | | | 5,938 | |
| Net Increase (Decrease) in Net Assets Resulting from Operations | | | (6,160 | ) | | | 20,412 | |
| Distributions to Shareholders: | | | | | | | | |
| From net investment income | | | | | | | | |
| Class A | | | (3,614 | ) | | | (4,326 | ) |
| Class B | | | (50 | ) | | | (91 | ) |
| Class C | | | (798 | ) | | | (1,002 | ) |
| Class I | | | (486 | ) | | | (496 | ) |
| Class Y | | | (703 | ) | | | (932 | ) |
| Total distributions | | | (5,651 | ) | | | (6,847 | ) |
| Capital Share Transactions: | | | | | | | | |
| Class A | | | (26,707 | ) | | | 11,842 | |
| Class B | | | (1,169 | ) | | | (1,298 | ) |
| Class C | | | (9,315 | ) | | | 4,045 | |
| Class I | | | (6,314 | ) | | | 8,527 | |
| Class Y | | | (3,972 | ) | | | (3,767 | ) |
| Net increase (decrease) from capital share transactions | | | (47,477 | ) | | | 19,349 | |
| Net Increase (Decrease) in Net Assets | | | (59,288 | ) | | | 32,914 | |
| Net Assets: | | | | | | | | |
| Beginning of period | | | 258,816 | | | | 225,902 | |
| End of period | | $ | 199,528 | | | $ | 258,816 | |
| Undistributed (distribution in excess of) net investment income | | $ | 42 | | | $ | 19 | |
The accompanying notes are an integral part of these financial statements.
| The Hartford Municipal Real Return Fund |
| Notes to Financial Statements |
| October 31, 2013 |
| (000’s Omitted) |
The Hartford Mutual Funds II, Inc. (“Company”) is an open-end management investment company comprised of five portfolios. Financial statements for The Hartford Municipal Real Return Fund (the “Fund”), a series of the Company, are included in this report.
The Company is organized under the laws of the State of Maryland and is registered with the Securities and Exchange Commission (“SEC”) under the Investment Company Act of 1940, as amended (“1940 Act”). The Fund is a diversified open-end management investment company.
Class A shares are sold with a front-end sales charge of up to 4.50%. Class B shares were sold with a contingent deferred sales charge which is assessed on the lesser of the per share net asset value (“NAV”) of the shares at the time of redemption or the original purchase price, and declines from up to 5.00% to zero depending on the period of time the shares are held (see note below regarding the closing of Class B shares). Class C shares are sold with a contingent deferred sales charge of up to 1.00% on shares redeemed within twelve months of purchase. Class I shares are sold without sales charges to certain eligible investors primarily through advisory fee-based wrap programs. Class Y shares, which are sold to certain eligible institutional investors, are sold without a sales charge. All classes of shares have identical voting, redemption, dividend, liquidation and other rights and the same terms and conditions, with the exceptions that each class may have different expenses, which may affect performance, and that Class B shares automatically convert to Class A shares after 8 years.
No new or additional investments are allowed in Class B shares of the Fund (including investments through any systematic investment plan). Existing shareholders of Class B shares may continue to hold their Class B shares, exchange their Class B shares for Class B shares of another Hartford Fund (as permitted by existing exchange privileges), or redeem their Class B shares as described in the Fund’s prospectus. Reinstatement privileges with respect to Class B shares will continue under the current policy. For investors electing to reinvest capital gains and dividends, any such capital gains or dividends on Class B shares will continue to be reinvested in Class B shares of the Fund. All Class B share attributes, including the 12b-1 fee, contingent deferred sales charge schedule, and conversion to Class A shares, remain unchanged.
| 2. | Significant Accounting Policies: |
The following is a summary of significant accounting policies of the Fund in the preparation of its financial statements, which are in accordance with United States Generally Accepted Accounting Principles (“U.S. GAAP”). The preparation of financial statements in accordance with U.S. GAAP may require management to make estimates and assumptions that affect the reported amounts of assets and liabilities and disclosure of contingent assets and liabilities at the date of the financial statements and the reported amounts of increases and decreases in net assets from operations during the reporting period. Actual results could differ from those estimates.
| a) | Determination of Net Asset Value – The NAV of each class of the Fund’s shares is determined as of the close of regular trading (normally 4:00 p.m. Eastern Time) (the “NYSE Close”) on each day that the New York Stock Exchange (the “Exchange”) is open (“Valuation Date”). Information that becomes known to the Fund after the NAV has been calculated on a particular day will not generally be used to retroactively adjust the NAV determined earlier that day. |
| b) | Investment Valuation and Fair Value Measurements – For purposes of calculating the NAV, portfolio investments and other assets held by the Fund's portfolio for which market quotes are readily available are valued at market value. Market value is generally determined on the basis of last reported sales prices or official close price. If no sales are reported, market value is based on quotes obtained from a quotation reporting system, established market makers, or independent pricing services. If market prices are not readily available or are deemed unreliable, the Fund will use the fair value of the investment as determined in good faith under policies and procedures established by and under the supervision of the Company's Board of Directors. Market quotes are considered not readily available where there is an absence of current |
| The Hartford Municipal Real Return Fund |
| Notes to Financial Statements – (continued) |
| October 31, 2013 |
| (000’s Omitted) |
or reliable market-based data (e.g., trade information or indicative market quotes), including where events occur after the close of the relevant market, but prior to the NYSE Close that materially affect the values of the Fund's portfolio investments or assets. In addition, market quotes are considered not readily available when, due to extraordinary circumstances, the exchanges or markets on which the investments trade do not open for trading for the entire day and no other market prices are available. There can be no assurance that the Fund could obtain the fair market value assigned to an investment if the Fund were to sell the investment at approximately the time at which the Fund determines its NAV.
Fixed income investments (other than short-term obligations) and non-exchange traded derivatives held by the Fund are normally valued on the basis of quotes obtained from brokers and dealers or independent pricing services in accordance with procedures established by the Company’s Board of Directors. Prices obtained from independent pricing services use information provided by market makers or estimates of market values through accepted market modeling, trading and pricing conventions. Inputs to the models may include, but are not limited to, prepayment speeds, pricing spread, yield, trade information, dealer quotes, market color, cash flow models and the bond’s terms and conditions. Generally, the Fund may use fair valuation in regard to fixed income investments when the Fund holds defaulted or distressed investments or investments in a company in which a reorganization is pending. Short-term investments maturing in 60 days or less are generally valued at amortized cost, if their original term to maturity was 60 days or less, or by amortizing their value on the 61st day prior to maturity, if the original term to maturity exceeded 60 days.
Investments in open-end mutual funds are valued at the respective NAV of each open-end mutual fund on the Valuation Date.
Financial instruments for which prices are not available from an independent pricing service may be valued using market quotations obtained from one or more dealers that make markets in the respective financial instrument in accordance with procedures established by the Company’s Board of Directors.
U.S. GAAP defines fair value as the price that the Fund would receive to sell an asset or pay to transfer a liability in an orderly transaction between market participants. The U.S. GAAP fair value measurement standards require disclosure of a fair value hierarchy for each major category of assets and liabilities. Various inputs are used in determining the fair value of the Fund’s investments. These inputs are summarized into three broad hierarchy levels. This hierarchy is based on whether the valuation inputs are observable or unobservable. These levels are:
| · | Level 1 – Quoted prices in active markets for identical investments. Level 1 may include exchange traded instruments, such as domestic equities, some foreign equities, options, futures, mutual funds, exchange traded funds, rights and warrants. |
| · | Level 2 – Observable inputs other than Level 1 prices, such as quoted prices for similar investments; quoted prices in markets that are not active; or other inputs that are observable or can be corroborated by observable market data. Level 2 may include debt investments that are traded less frequently than exchange traded instruments and which are valued using independent pricing services; foreign equities, which are principally traded on certain foreign markets and are adjusted daily pursuant to a fair value pricing service in order to reflect an adjustment for the factors occurring after the close of certain foreign markets but before the NYSE Close; senior floating rate interests, which are valued using an aggregate of dealer bids; and short-term investments, which are valued at amortized cost. |
| · | Level 3 – Significant unobservable inputs that are supported by limited or no market activity. Level 3 may include financial instruments whose values are determined using indicative market quotes or require significant management judgment or estimation. These unobservable valuation inputs may include estimates for current yields, maturity/duration, prepayment speed, and indicative market quotes for comparable investments along with other assumptions relating to credit quality, collateral value, complexity of the investment structure, general market conditions and liquidity. This category may include investments where trading has been halted or there are certain restrictions on trading. While these investments are priced using unobservable inputs, the valuation of these investments reflects the best available data and management believes the prices are a reasonable representation of exit price. |
The Board of Directors of the Company generally reviews and approves the “Procedures for Valuation of Portfolio Securities” on an annual basis. These procedures define how investments are to be valued, including the formation and activities of a Valuation Committee. The Valuation Committee is responsible for determining in good faith the fair value of investments when the value cannot be obtained from primary pricing services or alternative sources or if the valuation of an investment as provided by the primary pricing service or alternative source is believed not to reflect the investment’s fair value as of the Valuation Date. Voting members of the Valuation Committee include the Fund’s Treasurer or designee and a Vice President of the investment manager or designee. An Assistant Vice President of the Fund with legal expertise or designee is also included on the Valuation Committee as a non-voting advisory member. In addition, the Fund’s Chief Compliance Officer shall designate a member of the compliance group to attend Valuation Committee meetings as a non-voting resource, to monitor for and provide guidance with respect to compliance with these procedures. Two members of the Valuation Committee or their designees, representing different departments, shall constitute a quorum for purposes of permitting the Valuation Committee to take action. The Valuation Committee will consider all relevant factors in determining an investment’s fair value, and may seek the advice of the Fund’s sub-adviser, knowledgeable brokers, and legal counsel in making such determination. The Valuation Committee reports to the Audit Committee of the Company’s Board of Directors. The Audit Committee receives quarterly written reports which include details of all fair-valued investments, including the reason for the fair valuation, and an indication, when possible, of the accuracy of the valuation by disclosing the next available reliable public price quotation or the disposition price of such investments (the “look-back” test). The Board of Directors then must consider for ratification all of the fair value determinations made during the previous quarter.
Valuation levels are not necessarily indicative of the risk associated with investing in such investments. Individual investments within any of the above mentioned asset classes may be assigned a different hierarchical level than those presented above, as individual circumstances dictate.
For additional information, refer to the Investment Valuation Hierarchy Level Summary and the Level 3 roll-forward reconciliation, if applicable, which follow the Schedule of Investments.
| c) | Investment Transactions and Investment Income – Investment transactions are recorded as of the trade date (the date the order to buy or sell is executed) for financial reporting purposes. Investments purchased or sold on a when-issued or delayed-delivery basis may be settled a month or more after the trade date. Realized gains and losses are determined on the basis of identified cost. |
Dividend income is accrued on the ex-dividend date. Interest income, including amortization of premium and accretion of discounts, is accrued on a daily basis.
| d) | Fund Share Valuation and Dividend Distributions to Shareholders – Orders for the Fund’s shares are executed in accordance with the investment instructions of the shareholders. The NAV of the Fund’s shares is determined as of the close of business on each business day of the Exchange. The NAV is determined separately for each class of shares of the Fund by dividing the Fund’s net assets attributable to that class by the number of shares of the class outstanding. Each class of shares offered by the Fund has equal rights as to assets and voting privileges (except that shareholders of a class have exclusive voting rights regarding any matter relating solely to that class of shares). Income and non-class specific expenses are allocated daily to each class on the basis of the relative net assets of the class. Realized and unrealized gains and losses are allocated daily based on the relative net assets of each class of shares of the Fund. |
Orders for the purchase of the Fund’s shares received prior to the close of the Exchange on any day the Exchange is open for business are priced at the NAV determined as of the close of the Exchange. Orders received after the close of the Exchange, or on a day on which the Exchange and/or the Fund is not open for business, are priced at the next determined NAV.
| The Hartford Municipal Real Return Fund |
| Notes to Financial Statements – (continued) |
| October 31, 2013 |
| (000’s Omitted) |
Dividends are declared pursuant to a policy adopted by the Company’s Board of Directors based upon the investment performance of the Fund. Normally, dividends from net investment income are declared daily and paid monthly. Dividends from realized gains, if any, are paid at least once a year.
Distributions from net investment income, net realized gains and capital are determined in accordance with federal income tax regulations, which may differ from U.S. GAAP with respect to character and timing. These differences may include but are not limited to losses deferred due to wash sale adjustments, foreign currency gains and losses, adjustments related to Passive Foreign Investment Companies (“PFICs”), Real Estate Investment Trusts (“REITs”), Regulated Investment Companies (“RICs”), certain derivatives and partnerships. Permanent book and federal income tax basis differences relating to shareholder distributions will result in reclassifications to certain of the Fund’s capital accounts (see Federal Income Taxes: Reclassification of Capital Accounts note).
| 3. | Securities and Other Investments: |
| a) | Illiquid and Restricted Investments – The Fund is permitted to invest up to 15% of its net assets in illiquid investments. Illiquid investments are those that may not be sold or disposed of in the ordinary course of business within seven days, at approximately the price used to determine the Fund’s NAV. The Fund may not be able to sell illiquid investments when its sub-adviser considers it desirable to do so or may have to sell such investments at a price that is lower than the price that could be obtained if the investments were more liquid. A sale of illiquid investments may require more time and may result in higher dealer discounts and other selling expenses than does the sale of those that are liquid. Illiquid investments also may be more difficult to value due to the unavailability of reliable market quotations for such investments, and an investment in them may have an adverse impact on the Fund’s NAV. The Fund may also purchase certain restricted investments that can only be resold to certain qualified investors and may be determined to be liquid pursuant to policies and guidelines established by the Company’s Board of Directors. The Fund, as shown on the Schedule of Investments, had illiquid and/or restricted investments as of October 31, 2013. |
| b) | Investments Purchased on a When-Issued or Delayed-Delivery Basis – Delivery and payment for investments that have been purchased by the Fund on a forward commitment, or when-issued or delayed-delivery basis, take place beyond the customary settlement period. A fund may dispose of or renegotiate a delayed-delivery transaction after it is entered into, and may sell delayed-delivery investments before they are delivered, which may result in a realized gain or loss. During this period, such investments are subject to market fluctuations, and the Fund identifies investments segregated in its records with a value at least equal to the amount of the commitment. The Fund, as shown on the Schedule of Investments, had when-issued or delayed-delivery investments as of October 31, 2013. |
| 4. | Financial Derivative Instruments: |
The following disclosures contain information on how and why the Fund uses derivative instruments, the credit-risk-related contingent features in certain derivative instruments, and how derivative instruments affect the Fund’s financial position and results of operations. The location and fair value amounts of these instruments on the Statement of Assets and Liabilities and the realized gains and losses and changes in unrealized gains and losses on the Statement of Operations, each categorized by type of derivative contract, are included in the following Additional Derivative Instrument Information footnote. The derivative instruments outstanding as of year-end are disclosed in the notes to or within the Schedule of Investments for purchased options, if applicable. The amounts of realized gains and losses and changes in unrealized gains and losses on derivative instruments during the year are disclosed in the Statement of Operations.
| a) | Swap Contracts – The Fund may invest in swap contracts. Swap contracts are agreements to exchange or swap investment cash flows, assets, foreign currencies or market-linked returns at specified, future intervals. Swap contracts are either privately negotiated in the over-the-counter market (“OTC swaps”) or executed in a multilateral or other trade facility platform, such as a registered exchange (“centrally cleared swaps”). The Fund may enter into credit default, total return, cross-currency, interest rate, inflation and other forms of swap contracts to manage its exposure to credit, |
currency, interest rate, commodity and inflation risk. Swap contracts are also used to gain exposure to certain markets. In connection with these contracts, investments or cash may be identified as collateral or margin in accordance with the terms of the respective swap contracts to provide assets of value and recourse in the event of default or bankruptcy/insolvency.
Swaps are valued based on custom valuations furnished by an independent pricing service. Swaps for which prices are not available from an independent pricing service are valued in accordance with procedures established by the Company’s Board of Directors. Changes in market value, if any, are reflected as a component of net changes in unrealized appreciation or depreciation on the Statement of Operations. Daily changes in valuation of centrally cleared swaps, if any, are recorded as a receivable or payable for the change in value as appropriate (“variation margin”) on the Statement of Assets and Liabilities. Realized gains or losses on centrally cleared swaps are recorded upon the termination of the swap. OTC swap payments received or made at the beginning of the measurement period are reflected as such on the Statement of Assets and Liabilities and represent premiums paid or received upon entering into the swap contract to compensate for differences between the stated terms of the swap contract and prevailing market conditions (credit spreads, currency exchange rates, interest rates and other relevant factors). These upfront premiums are recorded as realized gains or losses on the Statement of Operations upon termination or maturity of the swap. A liquidation payment received or made at the termination or maturity of the swap is recorded as a realized gain or loss on the Statement of Operations. Net periodic payments received or paid by the Fund are included as part of realized gains or losses on the Statement of Operations.
Entering into these contracts involves, to varying degrees, elements of credit and market risk in excess of the amounts recognized on the Statement of Assets and Liabilities. Such risks involve the possibility that there will be no liquid market for these contracts, that the counterparty to the contracts may default on its obligation to perform or disagree as to the meaning of contractual terms in the contracts, and that there may be unfavorable changes in market conditions, credit spreads, currency exchange rates, interest rates and other relevant factors.
The Fund’s maximum risk of loss from counterparty credit risk is the discounted net value of the cash flows to be received from the counterparty over the contract’s remaining life, and current market value, to the extent that amount is positive. The risk is mitigated by having a master netting arrangement between the Fund and the counterparty, which allows for the netting of payments made or received (although such amounts are presented on a gross basis within the Statement of Assets and Liabilities, as applicable) as well as the posting of collateral to the Fund to cover the Fund’s exposure to the counterparty. In a centrally cleared swap, while the Fund enters into an agreement with a clearing broker to execute contracts with a counterparty, the performance of the swap is guaranteed by the central clearinghouse, which reduces the Fund’s exposure to credit risk. The Fund is still exposed to the credit risk of the clearing broker and clearinghouse. The clearinghouse attempts to minimize this risk to all of its participants through the use of mandatory margin requirements, minimum daily cash settlements, and other procedures designed to protect counterparties utilizing the clearinghouse. Likewise, the clearing broker reduces its risk through margin requirements and required segregation of customer balances.
Interest Rate Swap Contracts – The Fund is subject to interest rate risk exposure in the normal course of pursuing its investment objectives. Because the Fund holds fixed rate bonds, the value of these bonds may decrease if interest rates rise. To help hedge against this risk and to maintain its ability to generate income at prevailing market rates, the Fund may enter into interest rate swap contracts. In a typical interest rate swap, one party agrees to make regular payments equal to a floating interest rate, based on a specified interest rate or inflation benchmark (e.g. London Interbank Offered Rate (“LIBOR”)), multiplied by a “notional principal amount”, in return for payments equal to a fixed rate multiplied by the same amount, for a specific period of time. The net interest received or paid on interest rate swap contracts is recorded as a realized gain or loss. Interest rate swaps are marked to market daily and the change, if any, is recorded as an unrealized gain or loss in the Statement of Operations. When the interest rate swap contract is terminated early, the Fund records a realized gain or loss equal to the difference between the current realized value and the expected cash flows.
| The Hartford Municipal Real Return Fund |
| Notes to Financial Statements – (continued) |
| October 31, 2013 |
| (000’s Omitted) |
If an interest rate swap contract provides for payments in different currencies, the parties might agree to exchange the notional principal amount as well. Interest rate swaps may also depend on other prices or rates, such as the value of an index or mortgage prepayment rates. The risks of interest rate swaps include changes in market conditions which will affect the value of the contract or the cash flows and the possible inability of the counterparty to fulfill its obligations under the contract. The Fund’s maximum risk of loss from counterparty credit risk is the discounted net value of the cash flows to be received from the counterparty over the contract’s remaining life, to the extent that amount is positive. The Fund, as shown on the Schedule of Investments, had outstanding interest rate swap contracts as of October 31, 2013.
| b) | Additional Derivative Instrument Information: |
| Fair Value of Derivative Instruments on the Statement of Assets and Liabilities as of October 31, 2013: |
| | | Risk Exposure Category | |
| | | Interest Rate
Contracts | | | Foreign
Exchange
Contracts | | | Credit
Contracts | | | Equity
Contracts | | | Commodity
Contracts | | | Other
Contracts | | | Total | |
| Assets: | | | | | | | | | | | | | | | | | | | | | | | | | | | | |
| Unrealized appreciation on OTC swap contracts | | $ | 47 | | | $ | — | | | $ | — | | | $ | — | | | $ | — | | | $ | — | | | $ | 47 | |
| Total | | $ | 47 | | | $ | — | | | $ | — | | | $ | — | | | $ | — | | | $ | — | | | $ | 47 | |
| | | | | | | | | | | | | | | | | | | | | | | | | | | | | |
| Liabilities: | | | | | | | | | | | | | | | | | | | | | | | | | | | | |
| Unrealized depreciation on OTC swap contracts | | $ | 4,970 | | | $ | — | | | $ | — | | | $ | — | | | $ | — | | | $ | — | | | $ | 4,970 | |
| Total | | $ | 4,970 | | | $ | — | | | $ | — | | | $ | — | | | $ | — | | | $ | — | | | $ | 4,970 | |
| The volume of derivatives that is presented in the Schedule of Investments is consistent with the derivative activity during the year ended October 31, 2013. |
| The Effect of Derivative Instruments on the Statement of Operations for the year ended October 31, 2013: |
| | | Risk Exposure Category | |
| | | Interest Rate
Contracts | | | Foreign
Exchange
Contracts | | | Credit
Contracts | | | Equity
Contracts | | | Commodity
Contracts | | | Other
Contracts | | | Total | |
| Realized Loss on Derivatives Recognized as a Result of Operations: |
| Net realized loss on swap contracts | | $ | (690 | ) | | $ | — | | | $ | — | | | $ | — | | | $ | — | | | $ | — | | | $ | (690 | ) |
| Total | | $ | (690 | ) | | $ | — | | | $ | — | | | $ | — | | | $ | — | | | $ | — | | | $ | (690 | ) |
| | | | | | | | | | | | | | | | | | | | | | | | | | | | | |
| Net Change in Unrealized Appreciation (Depreciation) on Derivatives Recognized as a Result of Operations: |
| Net change in unrealized depreciation of swap contracts | | $ | (3,507 | ) | | $ | — | | | $ | — | | | $ | — | | | $ | — | | | $ | — | | | $ | (3,507 | ) |
| Total | | $ | (3,507 | ) | | $ | — | | | $ | — | | | $ | — | | | $ | — | | | $ | — | | | $ | (3,507 | ) |
Credit risk depends largely on the perceived financial health of bond issuers. In general, the credit rating is inversely related to the credit risk of the issuer. Higher rated bonds generally are deemed to have less credit risk, while lower or unrated bonds are deemed to have higher risk of default. The share price, yield and total return of a fund that holds securities with higher credit risk may be more volatile than those of a fund that holds bonds with lower credit risk. Similar to credit risk, the Fund may be exposed to counterparty risk, or the risk that an institution or other entity with which the Fund has unsettled or open transactions will default.
The Fund’s investments expose the Fund to various risks including, but not limited to, interest rate, prepayment and extension risks. Interest rate risk is the risk that fixed income securities will decline in value because of changes in
interest rates. As nominal interest rates rise, the values of certain fixed income securities held by the Fund are likely to decrease. A nominal interest rate can be described as the sum of a real interest rate and an expected inflation rate. Fixed income securities with longer durations tend to be more sensitive to changes in interest rates, usually making them more volatile than securities with shorter durations. Duration is useful primarily as a measure of the sensitivity of a fixed income security’s market price to interest rate (i.e. yield) movements. In addition, securities are subject to extension risk. Rising interest rates may cause prepayments to occur at a slower than expected rate, thereby effectively lengthening the maturity of the security and making the security more sensitive to interest rate changes.
| a) | Federal Income Taxes – For federal income tax purposes, the Fund intends to continue to qualify as a RIC under Subchapter M of the Internal Revenue Code (“IRC”) by distributing substantially all of its taxable net investment income and net realized capital gains to its shareholders and otherwise complying with the requirements of the IRC. The Fund has distributed substantially all of its income and capital gains in prior years, if applicable, and intends to distribute substantially all of its income and capital gains during the calendar year ending December 31, 2013. Accordingly, no provision for federal income or excise taxes has been made in the accompanying financial statements. Distributions from short-term capital gains are treated as ordinary income distributions for federal income tax purposes. |
| b) | Net Investment Income (Loss), Net Realized Gains (Losses) and Distributions – Net investment income (loss) and net realized gains (losses) may differ for financial statement and tax purposes primarily because of losses deferred due to wash sale adjustments, foreign currency gains and losses, adjustments related to PFICs, REITs, RICs, certain derivatives and partnerships. The character of distributions made during the year from net investment income or net realized gains may differ from their ultimate characterization for federal income tax purposes. Also, due to the timing of dividend distributions, the fiscal year in which amounts are distributed may differ from the year that the income or realized gains (losses) were recorded by the Fund. |
| c) | Distributions and Components of Distributable Earnings – The tax character of distributions paid by the Fund for the periods indicated is as follows (as adjusted for dividends payable, if applicable): |
| | | For the Year Ended
October 31, 2013 | | | For the Year Ended
October 31, 2012 | |
| Tax Exempt Income † | | $ | 5,666 | | | $ | 6,867 | |
| Ordinary Income | | | — | | | | 6 | |
| † | The Fund designates these distributions as exempt interest pursuant to IRC Sec. 852(b)(5). |
As of October 31, 2013, the Fund’s components of distributable earnings (deficit) on a tax basis were as follows:
| | | Amount | |
| Undistributed Ordinary Income | | $ | 93 | |
| Accumulated Capital Losses * | | | (43,369 | ) |
| Unrealized Depreciation † | | | (1,272 | ) |
| Total Accumulated Deficit | | $ | (44,548 | ) |
| * | The Fund has capital loss carryforwards that are identified in the Capital Loss Carryforward note that follows. |
| † | Differences between book-basis and tax-basis unrealized appreciation (depreciation) may be attributable to the losses deferred due to wash sale adjustments, foreign currency gains and losses, adjustments related to PFICs, REITs, RICs, certain derivatives and partnerships. |
| The Hartford Municipal Real Return Fund |
| Notes to Financial Statements – (continued) |
| October 31, 2013 |
| (000’s Omitted) |
| d) | Reclassification of Capital Accounts – The Fund may record reclassifications in its capital accounts. These reclassifications have no impact on the total net assets of the Fund. The reclassifications are a result of permanent differences between U.S. GAAP and tax accounting for such items as foreign currency, PFICs, expiration or utilization of capital loss carryforwards or net operating losses. Adjustments are made to reflect the impact these items have on current and future distributions to shareholders. Therefore, the source of the Fund’s distributions may be shown in the accompanying Statement of Changes in Net Assets as from undistributed net investment income, from accumulated net realized gains on investments or from capital depending on the type of book and tax differences that exist. For the year ended October 31, 2013, the Fund had no reclassifications. |
| e) | Capital Loss Carryforward – On December 22, 2010, the Regulated Investment Company Modernization Act of 2010 (the “Act”) was enacted, which made changes to the capital loss carryforward rules. The changes are effective for taxable years beginning after the date of enactment. Under the Act, funds are permitted to carry forward capital losses for an unlimited period. However, any losses incurred during those future taxable years will be required to be utilized prior to the losses incurred in pre-enactment taxable years, which carry an expiration date. As a result of this ordering rule, pre-enactment capital loss carryforwards may be more likely to expire unused. Additionally, post-enactment capital loss carryforwards retain their character as either short-term or long-term capital losses rather than being considered all short-term as permitted under prior regulation. |
At October 31, 2013 (tax-year-end), the Fund had capital loss carryforwards for U.S. federal income tax purposes as follows:
| | | Amount | |
| Short-Term Capital Loss Carryforward | | $ | 150 | |
| Total | | $ | 150 | |
Capital loss carryforwards with expiration:
| Year of Expiration | | Amount | |
| 2016 | | $ | 18,856 | |
| 2017 | | | 16,621 | |
| 2018 | | | 6,088 | |
| 2019 | | | 1,654 | |
| Total | | $ | 43,219 | |
As a result of mergers in the Fund, certain provisions in the IRC may limit future utilization of capital losses.
| f) | Accounting for Uncertainty in Income Taxes – The Fund has adopted financial reporting rules that require the Fund to analyze all open tax years, as defined by the statute of limitations, for all major jurisdictions. Generally, tax authorities can examine all tax returns filed for the last three years. The Fund does not have an examination in progress. |
The Fund has reviewed all open tax years and major jurisdictions and concluded that these financial reporting rules had no effect on the Fund’s financial position or results of operations. There is no tax liability resulting from unrecognized tax benefits relating to uncertain income tax positions taken or expected to be taken on the tax return for the fiscal year ended October 31, 2013. The Fund is also not aware of any tax positions for which it is reasonably possible that the total amounts of unrecognized tax benefits will significantly change in the next twelve months.
| a) | Investment Management Agreement – Effective January 1, 2013, Hartford Funds Management Company, LLC (“HFMC”) replaced Hartford Investment Financial Services, LLC (“HIFSCO”) as the Fund’s investment manager. HFMC and HIFSCO are both indirect wholly owned subsidiaries of The Hartford Financial Services Group, Inc. (“The |
Hartford”). As of January 1, 2013, HFMC serves as investment manager to the Fund pursuant to an Investment Management Agreement with the Company. For the calendar year ended December 31, 2012, HIFSCO served as the Fund’s investment manager pursuant to a separate agreement between HIFSCO and the Company. The replacement of HIFSCO with HFMC did not result in any change to (i) the contractual terms of, including the fees payable under, the Fund’s investment management agreements; or (ii) the day-to-day management of the Fund. The investment manager has overall investment supervisory responsibility for the Fund. In addition, the investment manager provides administrative personnel, services, equipment, facilities and office space for proper operation of the Fund. HFMC has contracted with Wellington Management Company, LLP (“Wellington Management”) under a sub-advisory agreement for the provision of day-to-day investment management services to the Fund in accordance with the Fund’s investment objective and policies. The Fund pays a fee to the investment manager, a portion of which may be used to compensate Wellington Management.
The schedule below reflects the rates of compensation paid to the investment manager for investment management services rendered as of October 31, 2013; the rates are accrued daily and paid monthly:
| Average Daily Net Assets | | Annual Fee | |
| On first $500 million | | | 0.50% | |
| On next $500 million | | | 0.45% | |
| On next $1.5 billion | | | 0.44% | |
| On next $2.5 billion | | | 0.43% | |
| On next $5 billion | | | 0.42% | |
| Over $10 billion | | | 0.41% | |
%
| b) | Accounting Services Agreement – Effective January 1, 2013, HFMC replaced Hartford Life Insurance Company (“HLIC”) as provider of accounting services to the Fund. HLIC provided accounting services for the Fund for the calendar year ended December 31, 2012. The replacement of HLIC with HFMC did not result in any changes to the fund accounting services provided to the Fund or the fees charged to the Fund for such services. Pursuant to the Fund Accounting Agreement between HFMC and the Company, on behalf of the Fund, HFMC provides accounting services to the Fund and receives monthly compensation based on the Fund’s average daily net assets at the rates set forth below. The Fund’s accounting services fees are accrued daily and paid monthly. |
| Average Daily Net Assets | | Annual Fee | |
| On first $5 billion | | | 0.016% | |
| On next $5 billion | | | 0.014% | |
| Over $10 billion | | | 0.012% | |
Effective November 1, 2013, the new accounting services fees schedule based on the Fund’s average daily net assets is as follows:
| Average Daily Net Assets | | Annual Fee | |
| On first $5 billion | | | 0.016% | |
| On next $5 billion | | | 0.013% | |
| Over $10 billion | | | 0.010% | |
| The Hartford Municipal Real Return Fund |
| Notes to Financial Statements – (continued) |
| October 31, 2013 |
| (000’s Omitted) |
| c) | Operating Expenses – Allocable expenses incurred by the Company are allocated to each Fund and allocated to classes within the Fund in proportion to the average daily net assets of the Fund and each class, except where allocation of certain expenses is more fairly made directly to the Fund or to specific classes within a Fund. As of October 31, 2013, HFMC contractually limited the total operating expenses of this Fund, exclusive of taxes, interest expense, brokerage commissions, acquired fund fees and expenses and extraordinary expenses, through February 28, 2014 as follows: |
| Class A | | | Class B | | | Class C | | | Class I | | | Class Y | |
| | 0.85% | | | | 1.60% | | | | 1.60% | | | | 0.60% | | | | 0.60% | |
| d) | Fees Paid Indirectly – The Fund’s custodian bank has agreed to reduce its fees when the Fund maintains cash on deposit in a non-interest-bearing custody account. For the year ended October 31, 2013, this amount, if any, is included in the Statement of Operations. |
The ratio of expenses to average net assets in the accompanying financial highlights excludes the reduction in expenses related to fees paid indirectly. The annualized expense ratio after waivers for the period listed below reflecting the reduction for fees paid indirectly is as follows:
| | | Year Ended
October 31, 2013 | |
| Class A | | | 0.85% | |
| Class B | | | 1.60 | |
| Class C | | | 1.60 | |
| Class I | | | 0.60 | |
| Class Y | | | 0.58 | |
| e) | Distribution and Service Plan for Class A, B and C Shares – Effective June 14, 2013, HIFSCO was renamed Hartford Funds Distributors, LLC (“HFD”). HFD is the principal underwriter and distributor of the Fund. HFD is engaged in distribution activities, which include marketing and distribution of shares through broker/dealers, financing distribution costs and maintaining financial books and records. For the year ended October 31, 2013, HFD received front-end load sales charges of $350 and contingent deferred sales charges of $19 from the Fund. |
The Fund has adopted a Distribution and Service Plan in accordance with Rule 12b-1 of the 1940 Act to compensate the distributor (HFD) for activities intended to result in the sale and distribution of Class A, B and C shares and for providing services for shareholders. The Rule 12b-1 plan applicable to Class A shares of the Fund provides for payment of a Rule 12b-1 fee of 0.25% of average daily net assets. Some or all of the fee may be used for shareholder servicing expenses with the remainder used for distribution expenses. Some or the entire Rule 12b-1 fee for Class B shares may be remitted to broker/dealers for distribution and/or shareholder account services. Under the Class B Plan, the Fund pays the distributor 1.00% of the average daily net assets of Class B shares that are outstanding for 8 years or less, 0.25% of which is a fee for services provided to existing shareholders with the remainder used for distribution expenses. After eight years, Class B shares convert to Class A shares. Upon conversion to Class A shares, the Class A plan described above will apply to those shares. Under the Class C Plan, the Fund pays the distributor 1.00% of the average daily net assets of Class C shares outstanding, 0.25% of which is intended as a fee for services provided to existing shareholders with the remainder used for distribution expenses. For Class C shares, some or the entire fee may be remitted to broker/dealers for distribution and/or shareholder account services. The Fund’s 12b-1 fees are accrued daily and paid monthly.
| f) | Other Related Party Transactions – Certain officers of the Fund are directors and/or officers of the investment manager and/or The Hartford or its subsidiaries. For the year ended October 31, 2013, a portion of the Fund’s Chief Compliance Officer’s compensation was paid by all of the investment companies in the Hartford fund complex. The portion allocated to the Fund rounds to zero. Hartford Administrative Services Company (“HASCO”), an indirect wholly-owned subsidiary of The Hartford, provides transfer agent services to the Fund. HASCO has contractually agreed to reimburse any portion of the transfer agency fees over 0.30% of average daily net assets per fiscal year for each class. For |
providing such services, HASCO is compensated on a per account basis that varies by account type, except with respect to Class Y, for which it is compensated based on average daily net assets. The amount paid to HASCO and any related contractual reimbursement amounts, if applicable, can be found in the Statement of Operations. These fees are accrued daily and paid monthly.
| 8. | Investment Transactions: |
For the year ended October 31, 2013, the Fund's aggregate purchases and sales of investment securities (excluding short-term investments) were as follows:
| | | Amount | |
| Cost of Purchases Excluding U.S. Government Obligations | | $ | 44,029 | |
| Sales Proceeds Excluding U.S. Government Obligations | | | 87,904 | |
| 9. | Capital Share Transactions: |
The following information is for the year ended October 31, 2013, and the year ended October 31, 2012:
| | | For the Year Ended October 31, 2013 | | | For the Year Ended October 31, 2012 | |
| | | Shares Sold | | | Shares Issued
for Reinvested
Dividends | | | Shares
Redeemed | | | Net Increase
(Decrease) of
Shares | | | Shares Sold | | | Shares Issued
for Reinvested
Dividends | | | Shares
Redeemed | | | Net Increase
(Decrease) of
Shares | |
| Class A | | | | | | | | | | | | | | | | | | | | | | | | | | | | | | | | |
| Shares | | | 3,371 | | | | 350 | | | | (6,576 | ) | | | (2,855 | ) | | | 4,701 | | | | 414 | | | | (3,858 | ) | | | 1,257 | |
| Amount | | $ | 32,333 | | | $ | 3,329 | | | $ | (62,369 | ) | | $ | (26,707 | ) | | $ | 44,550 | | | $ | 3,936 | | | $ | (36,644 | ) | | $ | 11,842 | |
| Class B | | | | | | | | | | | | | | | | | | | | | | | | | | | | | | | | |
| Shares | | | 2 | | | | 5 | | | | (131 | ) | | | (124 | ) | | | 13 | | | | 8 | | | | (158 | ) | | | (137 | ) |
| Amount | | $ | 17 | | | $ | 46 | | | $ | (1,232 | ) | | $ | (1,169 | ) | | $ | 117 | | | $ | 79 | | | $ | (1,494 | ) | | $ | (1,298 | ) |
| Class C | | | | | | | | | | | | | | | | | | | | | | | | | | | | | | | | |
| Shares | | | 708 | | | | 62 | | | | (1,774 | ) | | | (1,004 | ) | | | 1,416 | | | | 83 | | | | (1,075 | ) | | | 424 | |
| Amount | | $ | 6,811 | | | $ | 593 | | | $ | (16,719 | ) | | $ | (9,315 | ) | | $ | 13,432 | | | $ | 788 | | | $ | (10,175 | ) | | $ | 4,045 | |
| Class I | | | | | | | | | | | | | | | | | | | | | | | | | | | | | | | | |
| Shares | | | 1,253 | | | | 43 | | | | (1,978 | ) | | | (682 | ) | | | 1,576 | | | | 42 | | | | (718 | ) | | | 900 | |
| Amount | | $ | 12,143 | | | $ | 410 | | | $ | (18,867 | ) | | $ | (6,314 | ) | | $ | 15,008 | | | $ | 398 | | | $ | (6,879 | ) | | $ | 8,527 | |
| Class Y | | | | | | | | | | | | | | | | | | | | | | | | | | | | | | | | |
| Shares | | | 7 | | | | 59 | | | | (486 | ) | | | (420 | ) | | | 45 | | | | 76 | | | | (516 | ) | | | (395 | ) |
| Amount | | $ | 68 | | | $ | 562 | | | $ | (4,602 | ) | | $ | (3,972 | ) | | $ | 425 | | | $ | 724 | | | $ | (4,916 | ) | | $ | (3,767 | ) |
| Total | | | | | | | | | | | | | | | | | | | | | | | | | | | | | | | | |
| Shares | | | 5,341 | | | | 519 | | | | (10,945 | ) | | | (5,085 | ) | | | 7,751 | | | | 623 | | | | (6,325 | ) | | | 2,049 | |
| Amount | | $ | 51,372 | | | $ | 4,940 | | | $ | (103,789 | ) | | $ | (47,477 | ) | | $ | 73,532 | | | $ | 5,925 | | | $ | (60,108 | ) | | $ | 19,349 | |
The following reflects the conversion of Class B shares into Class A shares (reflected as Class A shares sold) for the year ended October 31, 2013, and the year ended October 31, 2012:
| | | Shares | | | Dollars | |
| For the Year Ended October 31, 2013 | | | 11 | | | $ | 104 | |
| For the Year Ended October 31, 2012 | | | 21 | | | $ | 196 | |
The Fund is one of several Hartford funds that participate in a $500 million committed revolving line of credit facility. The facility is to be used for temporary or emergency purposes. Under the arrangement, the funds are required to own securities having a market value in excess of 300% of the total bank borrowings. The interest rate on borrowings varies depending on the nature of the loan. The facility also requires a fee to be paid based on the amount of the commitment. This commitment fee is allocated to all of the funds participating in the line of credit based on the average net assets of the funds. During the year ended October 31, 2013, the Fund did not have any borrowings under this facility.
| The Hartford Municipal Real Return Fund |
| Notes to Financial Statements – (continued) |
| October 31, 2013 |
| (000’s Omitted) |
| 11. | Pending Legal Proceedings: |
On February 25, 2011, Jennifer L. Kasilag, Louis Mellinger, Judith M. Menendez, Jacqueline M. Robinson, and Linda A. Russell filed a derivative lawsuit against Hartford Investment Financial Services, LLC (“HIFSCO”)(now known as Hartford Funds Distributors, LLC) on behalf of six Hartford retail mutual funds in the United States District Court for the District of New Jersey, alleging that HIFSCO received excessive advisory and distribution fees in violation of its statutory fiduciary duty under Section 36(b) of the 1940 Act when serving as investment manager and principal underwriter, respectively, to the Hartford retail mutual funds. HIFSCO moved to dismiss and, in September 2011, the motion was granted in part and denied in part, with leave to amend the complaint. In November 2011, plaintiffs filed an amended complaint on behalf of certain Hartford retail mutual funds, The Hartford Global Health Fund (now known as The Hartford Healthcare Fund), The Hartford Conservative Allocation Fund, The Hartford Growth Opportunities Fund, The Hartford Inflation Plus Fund, The Hartford Advisers Fund (now known as The Hartford Balanced Fund), and The Hartford Capital Appreciation Fund. Plaintiffs seek to rescind the investment management agreements and distribution plans between HIFSCO and these funds and to recover the total fees charged thereunder or, in the alternative, to recover any improper compensation HIFSCO received, in addition to lost earnings. HIFSCO filed a partial motion to dismiss the amended complaint and, in December 2012, the court dismissed without prejudice the claims regarding distribution fees and denied the motion with respect to the advisory fees claims. HIFSCO disputes the allegations and intends to defend the advisory fee claims vigorously.
Although this action was purportedly filed on behalf of certain of the Hartford Funds, none of the Hartford Funds is itself a defendant to the suit. For this reason, no accrual for litigation relating to this matter has been recorded in the financial statements of the Fund.
Under the Company’s organizational documents, the Company shall indemnify its officers and directors to the full extent required or permitted under Maryland General Corporation Law and the federal securities laws. In addition, the Company, on behalf of the Fund, may enter into contracts that contain a variety of indemnifications. The Company’s maximum exposure under these arrangements is unknown. However, as of the date of these financial statements, the Company has not had prior claims or losses pursuant to these contracts and expects the risk of loss to be remote.
| 13. | Recent Accounting Pronouncement: |
In January 2013, the Financial Accounting Standards Board (FASB) issued Accounting Standards Update (ASU) No. 2013-01, Clarifying the Scope of Disclosures about Offsetting Assets and Liabilities, which clarified ASU No. 2011-11, Disclosures about Offsetting Assets and Liabilities. The objective of ASU 2013-01 is to enhance disclosure requirements on the offsetting of financial assets and liabilities. ASU 2013-01 limits the scope of the new balance sheet offsetting disclosures to derivatives, repurchase agreements and securities lending transactions to the extent that they are (1) offset in the financial statements or (2) subject to an enforceable master netting arrangement or similar agreement. The effective date of ASU 2013-01 is for annual periods beginning on or after January 1, 2013 and interim periods within those annual periods. At this time, management is evaluating the implications of this guidance and the impact it will have on the Fund’s financial statements and footnote disclosures, if any.
| The Hartford Municipal Real Return Fund |
| Financial Highlights |
| | | - Selected Per-Share Data - (A) | | | - Ratios and Supplemental Data - | |
| Class | | Net Asset
Value at
Beginning
of Period | | | Net Investment Income
(Loss) | | | Net
Realized
and
Unrealized
Gain
(Loss) on
Invest-
ments | | | Total from
Investment
Operations | | | Dividends
from Net
Investment Income | | | Distribu-
tions
from
Realized
Capital
Gains | | | Total
Dividends
and
Distributions | | | Net
Asset
Value at
End of
Period | | | Total
Return(B) | | | Net Assets
at End of
Period
(000's) | | | Ratio of
Expenses
to
Average
Net
Assets
Before
Adjust-
ments(C) | | | Ratio of
Expenses
to
Average
Net
Assets
After
Adjust-
ments(C) | | | Ratio of
Net
Investment Income to
Average
Net Assets | |
| | | | | | | | | | | | | | | | | | | | | | | | | | | | | | | | | | | | | | | | | | | | | | | | | | | | | |
| For the Year Ended October 31, 2013 |
| A | | $ | 9.73 | | | $ | 0.24 | | | $ | (0.46 | ) | | $ | (0.22 | ) | | $ | (0.24 | ) | | $ | – | | | $ | (0.24 | ) | | $ | 9.27 | | | | (2.30 | )% | | $ | 124,008 | | | | 0.88 | % | | | 0.85 | % | | | 2.51 | % |
| B | | | 9.65 | | | | 0.17 | | | | (0.46 | ) | | | (0.29 | ) | | | (0.17 | ) | | | – | | | | (0.17 | ) | | | 9.19 | | | | (3.05 | ) | | | 2,194 | | | | 1.71 | | | | 1.60 | | | | 1.76 | |
| C | | | 9.68 | | | | 0.17 | | | | (0.46 | ) | | | (0.29 | ) | | | (0.17 | ) | | | – | | | | (0.17 | ) | | | 9.22 | | | | (3.05 | ) | | | 38,185 | | | | 1.62 | | | | 1.60 | | | | 1.76 | |
| I | | | 9.75 | | | | 0.26 | | | | (0.46 | ) | | | (0.20 | ) | | | (0.26 | ) | | | – | | | | (0.26 | ) | | | 9.29 | | | | (2.05 | ) | | | 12,776 | | | | 0.64 | | | | 0.60 | | | | 2.75 | |
| Y | | | 9.70 | | | | 0.26 | | | | (0.44 | ) | | | (0.18 | ) | | | (0.27 | ) | | | – | | | | (0.27 | ) | | | 9.25 | | | | (1.94 | ) | | | 22,365 | | | | 0.58 | | | | 0.58 | | | | 2.78 | |
| | | | | | | | | | | | | | | | | | | | | | | | | | | | | | | | | | | | | | | | | | | | | | | | | | | | | |
| For the Year Ended October 31, 2012 |
| A | | $ | 9.20 | | | $ | 0.27 | | | $ | 0.54 | | | $ | 0.81 | | | $ | (0.28 | ) | | $ | – | | | $ | (0.28 | ) | | $ | 9.73 | | | | 8.87 | % | | $ | 157,918 | | | | 0.87 | % | | | 0.85 | % | | | 2.89 | % |
| B | | | 9.13 | | | | 0.21 | | | | 0.52 | | | | 0.73 | | | | (0.21 | ) | | | – | | | | (0.21 | ) | | | 9.65 | | | | 8.03 | | | | 3,497 | | | | 1.68 | | | | 1.60 | | | | 2.18 | |
| C | | | 9.15 | | | | 0.20 | | | | 0.54 | | | | 0.74 | | | | (0.21 | ) | | | – | | | | (0.21 | ) | | | 9.68 | | | | 8.11 | | | | 49,791 | | | | 1.62 | | | | 1.60 | | | | 2.13 | |
| I | | | 9.22 | | | | 0.29 | | | | 0.54 | | | | 0.83 | | | | (0.30 | ) | | | – | | | | (0.30 | ) | | | 9.75 | | | | 9.12 | | | | 20,061 | | | | 0.64 | | | | 0.60 | | | | 3.07 | |
| Y | | | 9.18 | | | | 0.30 | | | | 0.52 | | | | 0.82 | | | | (0.30 | ) | | | – | | | | (0.30 | ) | | | 9.70 | | | | 9.08 | | | | 27,549 | | | | 0.58 | | | | 0.58 | | | | 3.18 | |
| | | | | | | | | | | | | | | | | | | | | | | | | | | | | | | | | | | | | | | | | | | | | | | | | | | | | |
| For the Year Ended October 31, 2011 (D) |
| A(E) | | $ | 9.50 | | | $ | 0.41 | | | $ | (0.30 | ) | | $ | 0.11 | | | $ | (0.41 | ) | | $ | – | | | $ | (0.41 | ) | | $ | 9.20 | | | | 1.28 | % | | $ | 137,766 | | | | 0.90 | % | | | 0.85 | % | | | 4.52 | % |
| B | | | 9.43 | | | | 0.34 | | | | (0.30 | ) | | | 0.04 | | | | (0.34 | ) | | | – | | | | (0.34 | ) | | | 9.13 | | | | 0.54 | | | | 4,565 | | | | 1.70 | | | | 1.60 | | | | 3.75 | |
| C | | | 9.46 | | | | 0.34 | | | | (0.31 | ) | | | 0.03 | | | | (0.34 | ) | | | – | | | | (0.34 | ) | | | 9.15 | | | | 0.43 | | | | 43,214 | | | | 1.64 | | | | 1.60 | | | | 3.72 | |
| I | | | 9.52 | | | | 0.43 | | | | (0.30 | ) | | | 0.13 | | | | (0.43 | ) | | | – | | | | (0.43 | ) | | | 9.22 | | | | 1.53 | | | | 10,671 | | | | 0.64 | | | | 0.60 | | | | 4.71 | |
| Y | | | 9.48 | | | | 0.43 | | | | (0.30 | ) | | | 0.13 | | | | (0.43 | ) | | | – | | | | (0.43 | ) | | | 9.18 | | | | 1.54 | | | | 29,686 | | | | 0.60 | | | | 0.60 | | | | 4.73 | |
| | | | | | | | | | | | | | | | | | | | | | | | | | | | | | | | | | | | | | | | | | | | | | | | | | | | | |
| For the Year Ended October 31, 2010 (D) |
| A | | $ | 9.11 | | | $ | 0.43 | | | $ | 0.40 | | | $ | 0.83 | | | $ | (0.44 | ) | | $ | – | | | $ | (0.44 | ) | | $ | 9.50 | | | | 9.26 | % | | $ | 156,092 | | | | 0.86 | % | | | 0.85 | % | | | 4.69 | % |
| B | | | 9.04 | | | | 0.36 | | | | 0.40 | | | | 0.76 | | | | (0.37 | ) | | | – | | | | (0.37 | ) | | | 9.43 | | | | 8.53 | | | | 7,376 | | | | 1.67 | | | | 1.60 | | | | 3.94 | |
| C | | | 9.07 | | | | 0.36 | | | | 0.40 | | | | 0.76 | | | | (0.37 | ) | | | – | | | | (0.37 | ) | | | 9.46 | | | | 8.50 | | | | 47,918 | | | | 1.62 | | | | 1.60 | | | | 3.94 | |
| I | | | 9.13 | | | | 0.46 | | | | 0.39 | | | | 0.85 | | | | (0.46 | ) | | | – | | | | (0.46 | ) | | | 9.52 | | | | 9.52 | | | | 8,343 | | | | 0.62 | | | | 0.60 | | | | 4.93 | |
| Y | | | 9.09 | | | | 0.46 | | | | 0.39 | | | | 0.85 | | | | (0.46 | ) | | | – | | | | (0.46 | ) | | | 9.48 | | | | 9.59 | | | | 33,050 | | | | 0.57 | | | | 0.57 | | | | 4.97 | |
| | | | | | | | | | | | | | | | | | | | | | | | | | | | | | | | | | | | | | | | | | | | | | | | | | | | | |
| For the Year Ended October 31, 2009 (D) |
| A | | $ | 8.67 | | | $ | 0.43 | | | $ | 0.44 | | | $ | 0.87 | | | $ | (0.43 | ) | | $ | – | | | $ | (0.43 | ) | | $ | 9.11 | | | | 10.48 | % | | $ | 151,639 | | | | 0.89 | % | | | 0.85 | % | | | 4.96 | % |
| B | | | 8.61 | | | | 0.36 | | | | 0.44 | | | | 0.80 | | | | (0.37 | ) | | | – | | | | (0.37 | ) | | | 9.04 | | | | 9.62 | | | | 8,623 | | | | 1.70 | | | | 1.60 | | | | 4.21 | |
| C | | | 8.63 | | | | 0.37 | | | | 0.44 | | | | 0.81 | | | | (0.37 | ) | | | – | | | | (0.37 | ) | | | 9.07 | | | | 9.72 | | | | 42,730 | | | | 1.65 | | | | 1.60 | | | | 4.23 | |
| I | | | 8.69 | | | | 0.45 | | | | 0.45 | | | | 0.90 | | | | (0.46 | ) | | | – | | | | (0.46 | ) | | | 9.13 | | | | 10.74 | | | | 6,899 | | | | 0.65 | | | | 0.60 | | | | 5.24 | |
| Y | | | 8.65 | | | | 0.45 | | | | 0.45 | | | | 0.90 | | | | (0.46 | ) | | | – | | | | (0.46 | ) | | | 9.09 | | | | 10.79 | | | | 33,239 | | | | 0.59 | | | | 0.59 | | | | 5.22 | |
See Portfolio Turnover information on the next page.
| The Hartford Municipal Real Return Fund |
| Financial Highlights – (continued) |
| (A) | Information presented relates to a share outstanding throughout the indicated period. Net investment income (loss) per share amounts are calculated based on average shares outstanding unless otherwise noted. |
| (B) | Assumes initial investment at net asset value at the beginning of each period, reinvestment of all distributions, the complete redemption of the investment at net asset value at the end of each period and no sales charge. Total return would be reduced if sales charges were taken into account. |
| (C) | Adjustments include waivers and reimbursements, if applicable. Ratios do not include fees paid indirectly (see Expenses in the accompanying Notes to Financial Statements). |
| (D) | Net investment income (loss) per share amounts have been calculated using the SEC method. |
| (E) | Class L was merged into Class A on August 5, 2011. |
| | | Portfolio Turnover
Rate for
All Share Classes | |
| For the Year Ended October 31, 2013 | | | 20% | |
| For the Year Ended October 31, 2012 | | | 61 | |
| For the Year Ended October 31, 2011 | | | 29 | |
| For the Year Ended October 31, 2010 | | | 19 | |
| For the Year Ended October 31, 2009 | | | 46 | |
| Report of Independent Registered Public Accounting Firm |
| The Board of Directors and Shareholders of |
| The Hartford Mutual Funds II, Inc. |
We have audited the accompanying statement of assets and liabilities, including the schedule of investments, of The Hartford Municipal Real Return Fund (one of the portfolios constituting The Hartford Mutual Funds II, Inc. (the Funds)) as of October 31, 2013, and the related statement of operations for the year then ended, the statements of changes in net assets for each of the two years in the period then ended, and the financial highlights for each of the five years in the period then ended. These financial statements and financial highlights are the responsibility of the Funds’ management. Our responsibility is to express an opinion on these financial statements and financial highlights based on our audits.
We conducted our audits in accordance with the standards of the Public Company Accounting Oversight Board (United States). Those standards require that we plan and perform the audit to obtain reasonable assurance about whether the financial statements and financial highlights are free of material misstatement. We were not engaged to perform an audit of the Funds’ internal control over financial reporting. Our audits included consideration of internal control over financial reporting as a basis for designing audit procedures that are appropriate in the circumstances, but not for the purpose of expressing an opinion on the effectiveness of the Funds’ internal control over financial reporting. Accordingly, we express no such opinion. An audit also includes examining, on a test basis, evidence supporting the amounts and disclosures in the financial statements and financial highlights, assessing the accounting principles used and significant estimates made by management, and evaluating the overall financial statement presentation. Our procedures included confirmation of securities owned as of October 31, 2013, by correspondence with the custodian and brokers or by other appropriate auditing procedures where replies from brokers were not received. We believe that our audits provide a reasonable basis for our opinion.
In our opinion, the financial statements and financial highlights referred to above present fairly, in all material respects, the financial position of The Hartford Municipal Real Return Fund of The Hartford Mutual Funds II, Inc. at October 31, 2013, the results of its operations for the year then ended, the changes in its net assets for each of the two years in the period then ended, and the financial highlights for each of the five years in the period then ended, in conformity with U.S. generally accepted accounting principles.
| | |
| | |
| Minneapolis, MN | |
| December 18, 2013 | |
| The Hartford Municipal Real Return Fund |
| Directors and Officers (Unaudited) |
The Board of Directors of the Company appoints officers who are responsible for the day-to-day operations of the Fund and who execute policies formulated by the Directors. Each director serves until his or her death, resignation, or retirement or until the next annual meeting of shareholders is held or until his or her successor is elected and qualifies.
Directors and officers who are employed by or who have a financial interest in The Hartford are considered “interested” persons of the Fund pursuant to the 1940 Act. Each officer and two of the Company’s directors, as noted in the chart below, are “interested” persons of the Fund. Each director serves as a director for The Hartford Mutual Funds, Inc., The Hartford Mutual Funds II, Inc., Hartford Series Fund, Inc., and Hartford HLS Series Fund II, Inc., and as a trustee for The Hartford Alternative Strategies Fund, which, as of October 31, 2013, collectively consist of 89 funds. Correspondence may be sent to directors and officers c/o Hartford Funds, P.O. Box 2999, Hartford, Connecticut 06104-2999, except that correspondence to Mr. Annoni, Mr. Dressen, Ms. Fagely and Ms. Quade may be sent to 500 Bielenberg Drive, Woodbury, Minnesota 55125 and correspondence to Mr. Davey and Mr. Melcher may be sent to 5 Radnor Corporate Center, Suite 300, 100 Matsonford Road, Radnor, Pennsylvania 19087.
The table below sets forth, for each director and officer, his or her name, year of birth, current position with the Company and date first elected or appointed to The Hartford Mutual Funds, Inc. (“MF”) and The Hartford Mutual Funds II, Inc. (“MF2”), principal occupation, and, for directors, other directorships held. The Fund’s statement of additional information contains further information on the directors and is available free of charge by calling 1-888-843-7824 or writing to Hartford Funds, P.O. Box 64387, St. Paul, MN 55164-0387.
Information on the aggregate remuneration paid to the directors of the Company can be found in the Statement of Operations herein. The Fund pays to The Hartford a portion of the Chief Compliance Officer’s compensation, but does not pay salaries or compensation to any of its other officers or directors who are employed by The Hartford.
Non-Interested Directors
Lynn S. Birdsong (1946) Director since 2003, Co-Chairman of the Investment Committee
Mr. Birdsong is a private investor. Mr. Birdsong currently serves as a Director of the Sovereign High Yield Investment Company (April 2010 to current). Mr. Birdsong currently serves as an Independent Director of Nomura Partners Funds, Inc. (formerly, The Japan Fund) (March 2003 to current). From 1979 to 2002, Mr. Birdsong was a managing director of Zurich Scudder Investments, an investment management firm. During his employment with Scudder, Mr. Birdsong was an Interested Director of The Japan Fund. Since 1981, Mr. Birdsong has been a partner in Birdsong Company, an advertising specialty firm.
Robert M. Gavin, Jr. (1940) Director since 2002 (MF) and 1986 (MF2), Chairman of the Board since 2004
Dr. Gavin is an educational consultant. Prior to September 1, 2001, he was President of Cranbrook Education Community and prior to July 1996, he was President of Macalester College, St. Paul, Minnesota.
Duane E. Hill (1945) Director since 2001 (MF) and 2002 (MF2), Chairman of the Nominating Committee
Mr. Hill is Partner of TSG Ventures L.P., a private equity investment company. Mr. Hill is a former partner of TSG Capital Group, a private equity investment firm that served as sponsor and lead investor in leveraged buyouts of middle market companies.
Sandra S. Jaffee (1941) Director since 2005
Ms. Jaffee is the founder and Chief Executive Officer of a private company, Homeworks Concierge, LLC, which provides residential property management services in Westchester County, New York (January 2012 to present). Ms. Jaffee served as Chairman (2008 to 2009) and Chief Executive Officer of Fortent (formerly Searchspace Group), a leading provider of compliance/regulatory technology to financial institutions from August 2005 to August 2009. Ms. Jaffee currently serves as a member of the Board of Directors of Broadridge Financial Solutions as well as a Trustee of Muhlenberg College.
William P. Johnston (1944) Director since 2005, Chairman of the Compliance Committee
In February 2008, Mr. Johnston was elected to the Board of Directors of HCR-ManorCare, Inc. In August 2007, Mr. Johnston was elected to the Board of Directors of LifeCare Holdings, Inc. In July 2006, Mr. Johnston was elected to the Board of Directors of MultiPlan, Inc. and served as a director (July 2006 to August 2010). In June 2006, Mr. Johnston was appointed as Senior Advisor to The Carlyle Group, a global private equity and alternative asset investment firm. In May 2006, Mr. Johnston was elected to the Supervisory Board of Fresenius Medical Care AG & Co. KGaA, after its acquisition of Renal Care Group, Inc. in March 2006.
Phillip O. Peterson (1944) Director since 2002 (MF) and 2000 (MF2), Chairman of the Audit Committee
Mr. Peterson is a mutual fund industry consultant. He was a partner of KPMG LLP (an accounting firm) until July 1999. Mr. Peterson joined William Blair Funds in February 2007 as a member of the Board of Trustees. Mr. Peterson also joined the Board of Trustees of Symetra Variable Mutual Funds Trust as a trustee in February 2012.
Lemma W. Senbet (1946) Director since 2005
Dr. Senbet is the William E. Mayer Chair Professor of Finance and Director, Center for Financial Policy, at the University of Maryland, Robert H. Smith School of Business. He was chair of the Finance Department from 1998 to 2006. Previously he was a chaired professor of finance at the University of Wisconsin-Madison. Also, he was director of the Fortis Funds from March 2000 to July 2002. Dr. Senbet served the finance profession in various capacities, including as director of the American Finance Association and President of the Western Finance Association. In 2006, Dr. Senbet was inducted Fellow of Financial Management Association International for his career-long distinguished scholarship and professional service.
Interested Directors and Officers
James E. Davey (1964) Director since 2012, President and Chief Executive Officer since 2010
Mr. Davey serves as Executive Vice President of Hartford Life Insurance Company (“HLIC”) and The Hartford Financial Services Group, Inc. Additionally, Mr. Davey serves as Chairman of the Board and Manager of Hartford Funds Distributors, LLC (“HFD”) and Director and Chairman of the Board of Hartford Administrative Services Company (“HASCO”). Mr. Davey also serves as Manager, President and Chairman of the Board for Hartford Funds Management Company, LLC (“HFMC”). Mr. Davey joined The Hartford in 2002.
Lowndes A. Smith (1939) Director since 1996 (MF) and 2002 (MF2), Co-Chairman of the Investment Committee
Mr. Smith served as Vice Chairman of The Hartford from February 1997 to January 2002, as President and Chief Executive Officer of Hartford Life, Inc. from February 1997 to January 2002, and as President and Chief Operating Officer of The Hartford Life Insurance Companies from January 1989 to January 2002. Mr. Smith serves as a Director of White Mountains Insurance Group, Ltd., One Beacon Insurance and Symetra Financial and as Managing Director of Whittington Gray Associates.
Other Officers
Mark A. Annoni (1964) Vice President, Controller and Treasurer since 2012
Mr. Annoni serves as the Assistant Vice President of HLIC (February 2004 to present). Mr. Annoni joined The Hartford in April 2001 as part of The Hartford’s acquisition of Fortis Financial Group (“Fortis”).
Michael R. Dressen (1963) AML Compliance Officer since 2011
Mr. Dressen currently serves as Assistant Vice President of HLIC. He also serves as Chief Compliance Officer and AML Compliance Officer of HASCO and as AML Officer of HFD. Mr. Dressen joined The Hartford in 2005 from State Farm Insurance Companies where he held various positions related to mutual funds, variable products, and property casualty insurance.
Tamara L. Fagely (1958) Vice President since 2002 (MF) and 1993 (MF2) (1)
Currently, Ms. Fagely is President and a Director of HASCO, Chief Administrative Officer and Manager of HFMC and a Vice President of HLIC. Ms. Fagely served as a Vice President of HASCO (1998-2013) and Chief Financial Officer of HASCO (2006-2013). She served as Assistant Vice President of HLIC from December 2001 through March 2005. In addition, Ms. Fagely is Manager and Chief Operating Officer of HFD.
(1) Ms. Fagley will be retiring on December 31, 2013.
Edward P. Macdonald (1967) Vice President, Secretary and Chief Legal Officer since 2005
Mr. Macdonald serves as Vice President of HLIC and Vice President, Chief Legal Officer and Secretary of HFD and HASCO. Mr. Macdonald also serves as Manager, Vice President, Chief Legal Officer and Secretary of HFMC. Mr. Macdonald joined The Hartford in 2005.
Joseph G. Melcher (1973) Vice President and Chief Compliance Officer since 2013
Mr. Melcher currently serves as Vice President of HFMC and HFD. Mr. Melcher joined The Hartford in 2012 from Touchstone Investments, a member of the Western & Southern Financial Group, where he held the position of Vice President and Chief Compliance Officer from 2010 through 2012 and Assistant Vice President, Compliance from 2005 to 2010.
Vernon J. Meyer (1964) Vice President since 2006
Mr. Meyer serves as Senior Vice President of HLIC. He also serves as Senior Vice President of HFMC and HFD. Mr. Meyer joined The Hartford in 2004.
| The Hartford Municipal Real Return Fund |
| Directors and Officers (Unaudited) – (continued) |
Laura S. Quade (1969) Vice President since 2012
Ms. Quade currently serves as Vice President of HASCO and is a Director of Mutual Fund Service Operations. She also serves as Director, Enterprise Operations of HFD and HLIC. Ms. Quade joined The Hartford in 2001 as part of The Hartford’s acquisition of Fortis.
Martin A. Swanson (1962) Vice President since 2010
Mr. Swanson is a Vice President of HLIC. Mr. Swanson also serves as Vice President and Chief Marketing Officer for HFD. Prior to joining HLIC in 1998, Mr. Swanson was a Vice President at PaineWebber, Inc.
HOW TO OBTAIN A COPY OF THE FUND’S PROXY VOTING POLICIES AND VOTING RECORDS (UNAUDITED)
A description of the policies and procedures that the Fund uses to determine how to vote proxies relating to portfolio securities and information about how the Fund voted proxies relating to portfolio securities during the most recent twelve-month period ended June 30 are available (1) without charge, upon request, by calling 888-843-7824 and (2) on the SEC’s website at http://www.sec.gov.
QUARTERLY PORTFOLIO HOLDINGS INFORMATION (UNAUDITED)
The Fund files a complete schedule of portfolio holdings with the SEC for the first and third quarters of each fiscal year on Form N-Q. The Fund’s Forms N-Q are available (1) without charge, upon request, by calling 888-843-7824 and (2) on the SEC’s website at http://www.sec.gov. The Form N-Q may be reviewed and copied at the SEC’s Public Reference Room in Washington, DC. Information on the operation of the Public Reference Room may be obtained by calling 1-800-SEC-0330.
| The Hartford Municipal Real Return Fund |
| Federal Tax Information (Unaudited) |
For the fiscal year ended October 31, 2013, there is no further federal tax information required for this Fund.
| The Hartford Municipal Real Return Fund |
| Expense Example (Unaudited) |
Your Fund's Expenses
As a shareholder of the Fund, you incur two types of costs: (1) transaction costs, including sales charges (loads) on purchase payments, if any, and contingent deferred sales charges (CDSC), if any, and (2) ongoing costs, including investment management fees, distribution and/or service (12b-1) fees, if any, and other fund expenses. This example is intended to help you understand your ongoing costs (in dollars) of investing in the Fund and to compare these costs with the ongoing costs of investing in other mutual funds. The example is based on an investment of $1,000 invested at the beginning of the period and held for the period of April 30, 2013 through October 31, 2013.
Actual Expenses
The first set of columns of the table below provides information about actual account values and actual expenses. You may use the information in this column, together with the amount you invested, to estimate the expenses that you paid over the period. Simply divide your account value by $1,000 (for example, an $8,600 account value divided by $1,000 = 8.6), then multiply the result by the number in the line under the heading entitled “Expenses Paid During Period” to estimate the expenses you paid on your account during this period.
Hypothetical Example for Comparison Purposes
The second set of columns of the table below provides information about hypothetical account values and hypothetical expenses based on the Fund's actual expense ratio and an assumed rate of return of 5% per year before expenses, which is not the Fund's actual return. The hypothetical account values and expenses may not be used to estimate the actual ending account balance or expenses you paid for the period. You may use this information to compare the ongoing costs of investing in the Fund and other funds. To do so, compare this 5% hypothetical example with the 5% hypothetical examples that appear in the shareholder reports of the other funds.
Please note that the expenses shown in the table are meant to highlight your ongoing costs only and do not reflect any transactional costs, such as sales charges (loads) and CDSC. Therefore, the second set of columns of the table is useful in comparing ongoing costs only, and will not help you determine the relative total costs of owning different funds. In addition, if these transactional costs were included, your costs would be higher. Expenses are equal to the Fund's annualized expense ratios multiplied by average account value over the period, multiplied by 184/365 (to reflect the one-half year period).
| | | Actual return | | | Hypothetical (5% return before expenses) | | | | | | | | | | |
| | | Beginning
Account Value
April 30, 2013 | | | Ending Account
Value
October 31, 2013 | | | Expenses paid
during the period
April 30, 2013
through
October 31, 2013 | | | Beginning
Account Value
April 30, 2013 | | | Ending Account
Value
October 31, 2013 | | | Expenses paid
during the
period
April 30, 2013
through
October 31, 2013 | | | Annualized
expense
ratio | | | Days in
the
current
1/2
year | | | Days
in the
full
year | |
| Class A | | $ | 1,000.00 | | | $ | 969.30 | | | $ | 4.22 | | | $ | 1,000.00 | | | $ | 1,020.92 | | | $ | 4.33 | | | | 0.85 | % | | 184 | | | 365 | |
| Class B | | $ | 1,000.00 | | | $ | 965.40 | | | $ | 7.92 | | | $ | 1,000.00 | | | $ | 1,017.14 | | | $ | 8.13 | | | | 1.60 | | | 184 | | | 365 | |
| Class C | | $ | 1,000.00 | | | $ | 965.40 | | | $ | 7.92 | | | $ | 1,000.00 | | | $ | 1,017.14 | | | $ | 8.13 | | | | 1.60 | | | 184 | | | 365 | |
| Class I | | $ | 1,000.00 | | | $ | 970.60 | | | $ | 2.98 | | | $ | 1,000.00 | | | $ | 1,022.18 | | | $ | 3.06 | | | | 0.60 | | | 184 | | | 365 | |
| Class Y | | $ | 1,000.00 | | | $ | 970.50 | | | $ | 2.93 | | | $ | 1,000.00 | | | $ | 1,022.24 | | | $ | 3.00 | | | | 0.59 | | | 184 | | | 365 | |
| The Hartford Municipal Real Return Fund |
| Approval of Investment Management and Investment Sub-Advisory Agreements (Unaudited) |
Section 15(c) of the Investment Company Act of 1940, as amended (the “1940 Act”), requires that each mutual fund’s board of directors, including a majority of those directors who are not “interested persons” of the mutual fund, as defined in the 1940 Act (the “Independent Directors”), annually review and consider the continuation of the mutual fund’s investment advisory and sub-advisory agreements. At its meeting held on August 6-7, 2013, the Board of Directors (the “Board”) of The Hartford Mutual Funds II, Inc., including each of the Independent Directors, unanimously voted to approve the continuation of the investment management agreement for The Hartford Municipal Real Return Fund (the “Fund”) with Hartford Funds Management Company, LLC (“HFMC”) and the continuation of the investment sub-advisory agreement between HFMC and the Fund’s sub-adviser, Wellington Management Company, LLP (“Wellington Management” or the “Sub-adviser,” and together with HFMC, the “Advisers”) (collectively, the “Agreements”).
In the months preceding the August 6-7, 2013 meeting, the Board requested, received, and reviewed written responses from the Advisers to questions posed to them on behalf of the Independent Directors and supporting materials relating to those questions and responses. The Board considered information furnished to the Board at its meetings throughout the year, as well as information specifically prepared in connection with the annual approval of the Agreements at the Board’s meetings held on June 18-19, 2013 and August 6-7, 2013. Information provided to the Board at its meetings throughout the year included, among other things, reports on Fund performance, legal and compliance matters, sales and marketing activity, shareholder services, and the other services provided to the Fund by the Advisers and their affiliates. The Board also received in-person presentations by Fund officers and representatives of HFMC at the Board’s meetings on June 18-19, 2013 and August 6-7, 2013 concerning the Agreements.
The Independent Directors, advised by independent legal counsel, engaged two service providers to assist them with evaluating the Agreements with respect to the Fund. Lipper Inc. (“Lipper”), an independent provider of investment company data, was retained to provide the Board with reports on how the Fund’s contractual management fees, actual management fees, other non-management fees, overall expense ratios and investment performance compared to those of mutual funds with similar investment objectives. The Independent Directors also engaged an independent financial services consulting firm (the “Consultant”) to assist them in evaluating the Fund’s management fees, sub-advisory fees, other non-management fees, overall expense ratios and investment performance.
In determining whether to continue the Agreements for the Fund, the members of the Board reviewed and evaluated information and factors they believed to be relevant and appropriate in light of the information that the Board deemed necessary and appropriate through the exercise of its reasonable business judgment. While individual members of the Board may have weighed certain factors differently, the Board’s determination to continue the Agreements was based on a comprehensive consideration of all information provided to the Board throughout the year and specifically with respect to the continuation of the Agreements. A more detailed discussion of the factors the Board considered with respect to its approval of the Agreements is provided below.
Nature, Extent, and Quality of Services Provided by the Advisers
The Board requested and considered information concerning the nature, extent, and quality of the services provided to the Fund by the Advisers. The Board considered, among other things, the terms of the Agreements and the range of services provided by the Advisers. The Board considered the Advisers’ professional personnel who provide services to the Fund, including each Adviser’s ability and experience in attracting and retaining qualified personnel to service the Fund. The Board considered each Adviser’s reputation and overall financial strength, as well as its willingness to consider and implement organizational and operational changes designed to improve services to the Fund. In addition, the Board considered the quality of each Adviser’s communications with the Board and responsiveness to Board inquiries.
The Board also requested and evaluated information concerning each Adviser’s regulatory and compliance environment. In this regard, the Board requested and reviewed information on each Adviser’s compliance policies and procedures, compliance history, and a report from the Fund’s Chief Compliance Officer on each Adviser’s compliance with applicable laws and regulations, including responses to regulatory developments and compliance issues raised by regulators. The Board also noted the Advisers’ support of the Fund’s compliance control structure, particularly the resources devoted by the Advisers in support of the Fund’s obligations pursuant to Rule 38a-1 under the 1940 Act.
| The Hartford Municipal Real Return Fund |
| Approval of Investment Management and Investment Sub-Advisory Agreements (Unaudited) – (continued) |
With respect to HFMC, the Board noted that under the Agreements, HFMC is responsible for the management of the Fund, including overseeing fund operations and service providers, and provides administrative services to the Fund as well as investment advisory services in connection with selecting, monitoring and supervising the Sub-adviser. The Board considered HFMC’s ongoing monitoring of people, process and performance, including its quarterly reviews of each of the Hartford Funds, semi-annual meetings with the leaders of each Fund’s portfolio management team, and oversight of the Funds’ approximately 60 portfolio managers. The Board recognized that HFMC has demonstrated a record of making changes to the management and/or strategies of the Funds when warranted. The Board considered HFMC’s oversight of the Sub-adviser’s investment approach and results, process for monitoring best execution of portfolio trades by the Sub-adviser, and approach to risk management with respect to the Fund and the service providers to the Fund. The Board also considered HFMC’s oversight of compliance with the Fund’s objective and policies as well as with applicable laws and regulations, noting that regulatory and other developments had over time led to an increase in the scope of HFMC’s services in this regard.
In addition, the Board considered HFMC’s ongoing commitment to review and rationalize the Hartford Funds product line-up and the expenses that HFMC had incurred in connection with fund combinations in recent years. The Board considered that HFMC or its affiliates are responsible for providing the Fund’s officers.
With respect to the Sub-adviser, who provides day-to-day portfolio management services, the Board considered the quality of the Fund’s portfolio managers, the Sub-adviser’s other investment personnel, its investment philosophy and process, investment research capabilities and resources, performance record, trade execution capabilities and experience. The Board considered the experience of the Fund’s portfolio managers, the number of accounts managed by the portfolio managers, and the Sub-adviser’s method for compensating the portfolio managers.
Based on these considerations, the Board concluded that it was satisfied with the nature, extent and quality of the services provided to the Fund by HFMC and the Sub-adviser.
Performance of the Fund and the Advisers
The Board considered the investment performance of the Fund. In this regard, the Board reviewed the performance of the Fund over different time periods presented in the materials and evaluated HFMC’s analysis of the Fund’s performance for these time periods. The Board considered information and materials provided to the Board by the Advisers concerning Fund performance, as well as information from Lipper comparing the investment performance of the Fund to an appropriate benchmark and universe of peer funds. The Board noted that the Fund’s performance was in the 3rd quintile of its performance universe for the 1-year period, the 2nd quintile for the 3-year period and the 5th quintile for the 5-year period. The Board also noted that the Fund’s performance was above its benchmark for the 1- and 3-year periods and below its benchmark for the 5-year period. In considering the Fund’s performance record, the Board noted that the Fund had transitioned to Wellington Management as sub-adviser in 2012.
The Board considered the detailed investment analytics reports provided by Hartford Funds’ Investment Advisory Group throughout the year. These reports include, among other things, information on the Fund’s gross and net returns, the Fund’s investment performance relative to an appropriate benchmark and peer group, various statistics concerning the Fund’s portfolio, and a narrative summary of various factors affecting Fund performance. The Board considered the Advisers’ cooperation with the Investment Committee, which assists the Board in evaluating the performance of the Fund at periodic meetings throughout the year. The Board also considered the analysis provided by the Consultant relating to the Fund’s performance track record.
In light of all the considerations noted above, the Board concluded that it had continued confidence in HFMC’s and the Sub-adviser’s overall capabilities to manage the Fund.
Costs of the Services and Profitability of the Advisers
The Board reviewed information regarding HFMC’s cost to provide investment management and related services to the Fund and HFMC’s profitability, both overall and for the Fund, on a pre-tax basis without regard to distribution expenses. The Board also requested and reviewed information about the profitability to HFMC and its affiliates from all services provided to the Fund and all aspects of their relationship with the Fund. The Board also requested and received information relating to the operations and profitability of the Sub-adviser.
The Board considered the Consultant’s review of the profitability calculations utilized by HFMC in connection with the continuation of the investment management agreement, noting the Consultant’s view that Hartford Funds’ process for calculating and reporting Fund profitability is reasonable. In this regard, the Board noted that the Consultant had previously performed a full review of this process and reported that such process is sound and well within common industry practice.
Based on these considerations, the Board concluded that the profits anticipated to be realized by the Advisers and their affiliates from their relationships with the Fund would not be excessive.
Comparison of Fees and Services Provided by the Advisers
The Board considered comparative information with respect to the management fees to be paid by the Fund to HFMC and the total expense ratios of the Fund. The Board also considered comparative information with respect to the sub-advisory fees to be paid by HFMC to the Sub-adviser. In this regard, the Board requested and reviewed information from HFMC and the Sub-adviser relating to the management and sub-advisory fees, including the sub-advisory fee schedule for the Fund, and total operating expenses for the Fund. With respect to the sub-advisory fee schedule, the Board considered representations from HFMC and the Sub-adviser that the Sub-adviser’s fees were negotiated at arm’s length. The Board also reviewed information from Lipper comparing the Fund’s contractual management fees, actual management fees and overall expense ratios relative to a group of funds selected by Lipper, in consultation with the Consultant, and a broader universe of funds selected by Lipper. The Board noted that the Fund’s contractual management fee was in the 1st quintile of its expense group, while its actual management fee was in the 4th quintile and its total expenses (less 12b-1 and shareholder service fees) were in the 2nd quintile. The Board also noted that the Fund has an automatically renewable contractual expense cap on each share class, which resulted in reimbursement of certain expenses incurred in 2012.
While the Board recognized that comparisons between the Fund and peer funds are imprecise, given the differing service levels and characteristics of mutual funds and the different business models and cost structures of the Advisers, the comparative information provided by Lipper assisted the Board in evaluating the reasonableness of the Fund’s management and sub-advisory fees and total operating expenses. In addition, the Board considered the analysis and recommendations of the Consultant relating to the Fund’s management and sub-advisory fees and total operating expenses.
Based on these considerations, the Board concluded that the Fund’s fees and total operating expenses, in conjunction with the information about quality of services, profitability, economies of scale, and other matters discussed, were reasonable in light of the services provided.
Economies of Scale
The Board requested and considered information regarding the Advisers’ realization of economies of scale with respect to the Fund and whether the fee levels reflect these economies of scale for the benefit of the Fund’s shareholders. The Board reviewed the breakpoints in the management fee schedule for the Fund, which reduce fee rates as Fund assets grow over time. The Board recognized that a fund with assets beyond the last breakpoint level will continue to benefit from economies of scale because additional assets are charged the lowest breakpoint fee resulting in lower overall effective management fee rates. The Board also considered that expense limitations and fee waivers that reduce the Fund’s expenses at all asset levels can have the same effect as breakpoints in sharing economies of scale with shareholders and provide protection from an increase in expenses if Fund assets decline. The Board recognized that a fee schedule that reaches a lower breakpoint quickly provides shareholders with the benefit of anticipated or potential economies of scale. The Board also considered that HFMC has been active in managing expenses, which has resulted in benefits being realized by shareholders as assets within the Hartford Funds family of funds have grown over time, including through lower transfer agent costs and other operating expenses.
The Board reviewed and evaluated materials from Lipper showing how management fee schedules of peer funds reflect economies of scale for the benefit of shareholders as a peer fund’s assets hypothetically increase over time. Based on information provided by HFMC, Lipper, and the Consultant, the Board recognized that there is no uniform methodology for establishing breakpoints or uniform pattern in asset levels that trigger breakpoints or the amounts of breakpoints triggered.
| The Hartford Municipal Real Return Fund |
| Approval of Investment Management and Investment Sub-Advisory Agreements (Unaudited) – (continued) |
After considering all of the information available to it, the Board concluded that it was satisfied with the extent to which economies of scale would be shared for the benefit of the Fund’s shareholders based on currently available information and the effective advisory fees and expense ratios for the Fund at its current and reasonably anticipated asset levels. The Board noted, however, that it would continue to monitor future growth in Fund assets and the appropriateness of additional breakpoints.
Other Benefits
The Board considered other benefits to the Advisers and their affiliates from their relationships with the Fund.
The Board reviewed information noting that HFMC receives fees for fund accounting and related services from the Fund, and the Board considered information on profits to HFMC for such services. The Board also considered that Hartford Administrative Services Company (“HASCO”), the Fund’s transfer agent and an affiliate of HFMC, receives transfer agency compensation from the Fund, and the Board reviewed information on the profitability of the Fund’s transfer agency function to HASCO. The Board considered information provided by HASCO indicating that the transfer agent fees charged by HASCO to the Fund were fair and reasonable based on publicly available information.
The Board also considered that Hartford Funds Distributors, LLC (“HFD”), an affiliate of HFMC, serves as principal underwriter of the Fund. As principal underwriter, HFD receives 12b-1 fees from the Fund and receives all or a portion of the sales charges on sales or redemptions of certain classes of shares. The Board also noted that certain affiliates of HFD distribute shares of the Fund and receive compensation in that connection.
The Board considered the benefits, if any, to the Sub-adviser from any use of the Fund’s brokerage commissions to obtain soft dollar research, and representations from HFMC and the Sub-adviser that the Sub-adviser would not make any revenue-sharing payments or any other type of distribution payments to HFMC or its affiliates.
The Board considered the benefits to shareholders of being part of the Hartford Funds family of funds, including the right to exchange investments between the same class of funds without a sales charge, the ability to reinvest Fund dividends into other funds in the family, and the ability to combine holdings in the Fund with holdings in other funds to obtain a reduced sales charge. The Board considered HFMC’s efforts to provide investors in the family with a broad range of investment styles and asset classes and its entrepreneurial risk in initiating new funds to expand these opportunities for shareholders.
* * * *
Based upon its review of these various factors, among others, the Board concluded that it is in the best interests of the Fund and its shareholders for the Board to approve the Agreements for an additional year. In reaching this decision, the Board did not assign relative weights to the factors discussed above or deem any one or group of them to be controlling in and of themselves. In connection with their deliberations, the Independent Directors met separately in executive session on several occasions, with independent legal counsel and the Consultant, to review the relevant materials and consider their responsibilities under relevant laws and regulations.
| The Hartford Municipal Real Return Fund |
| Main Risks (Unaudited) |
The main risks of investing in the Fund are described below.
Market, Selection, and Strategy Risk: The Fund’s share price may fluctuate due to market risk and/or security selections that may underperform the market or relevant benchmarks. If the sub-adviser’s investment strategy does not perform as expected, the Fund could underperform its peers or lose money. There is no guarantee the Fund will achieve its stated objective.
Muni Bond Risk: Municipal securities are subject to interest rate risk (the risk that the value of an investment decreases when interest rates rise), credit risk (the risk that the issuing company of a security is unable to pay interest and principal when due), call risk (the risk that an investment may be redeemed early), and risks related to changes in the tax-exempt status of the securities.
Derivatives Risk: Investments in derivatives can be volatile. Potential risks include currency risk, leverage risk (the risk that small market movements may result in large changes in the value of an investment), liquidity risk, index risk, pricing risk, and counterparty risk (the risk that the counterparty may be unwilling or unable to honor its obligations).
AMT Risk: Income from the Fund may be subject to income tax, including the Alternative Minimum Tax.
Active Trading Risk: Actively trading investments may result in higher costs and higher taxable income.
HARTFORDFUNDS
hartfordfunds.com
This information is written in connection with the promotion or marketing of the matter(s) addressed in this material.
This report is submitted for the general information of the shareholders of the Fund. It is not authorized for distribution unless preceded or accompanied by a current prospectus for the Fund.
The information cannot be used or relied upon for the purpose of avoiding IRS penalties. These materials are not intended to provide tax, accounting or legal advice. As with all matters of a tax or legal nature, you should consult your own tax or legal counsel for advice.
Investors should carefully consider the investment objectives, risks, charges, and expenses of Hartford Funds before investing. This and other information can be found in the prospectus and summary prospectus, which can be obtained by calling 888-843-7824 (retail) or 877-836-5854 (institutional). Investors should read them carefully before they invest.
Hartford Funds are underwritten and distributed by Hartford Funds Distributors, LLC.
MFAR-MRR13 12/13 113995-1 Printed in U.S.A. ©2013 The Hartford, Hartford, CT 06155
HARTFORDFUNDS
| THE HARTFORD VALUE OPPORTUNITIES FUND
2013 Annual Report |
The Hartford Value Opportunities Fund
Table of Contents
The views expressed in the Fund’s Manager Discussion under ‘‘Why did the Fund perform this way?’’ and ‘‘What is the outlook?’’ are views of the Fund’s sub-adviser and portfolio management team through the end of the period and are subject to change based on market and other conditions. The Fund’s Manager Discussion is for informational purposes only and does not represent an offer, recommendation or solicitation to buy, hold or sell any security. The specific securities identified and described, if any, do not represent all of the securities purchased or sold and you should not assume that investments in the securities identified and discussed will be profitable.
| The Hartford Value Opportunities Fund inception 01/02/1996 |
| (sub-advised by Wellington Management Company, LLP) |
| |
| Investment objective – Seeks capital appreciation. |
Performance Overview 10/31/03 - 10/31/13
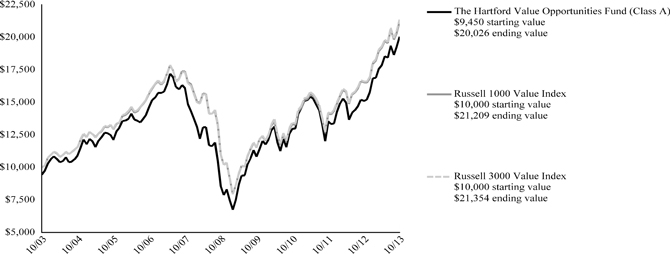
The chart above represents the hypothetical growth of a $10,000 investment in Class A which includes a sales charge. Growth results in classes other than Class A will vary from what is seen above due to differences in the expenses charged to those share classes.
Average Annual Total Returns (as of 10/31/13)
| | | 1 Year | | | 5 Years | | | 10 Years | |
| Value Opportunities A# | | | 32.53 | % | | | 18.52 | % | | | 7.80 | % |
| Value Opportunities A## | | | 25.24 | % | | | 17.18 | % | | | 7.19 | % |
| Value Opportunities B# | | | 31.50 | % | | | 17.71 | % | | | 7.23 | %* |
| Value Opportunities B## | | | 26.50 | % | | | 17.50 | % | | | 7.23 | %* |
| Value Opportunities C# | | | 31.59 | % | | | 17.61 | % | | | 7.00 | % |
| Value Opportunities C## | | | 30.59 | % | | | 17.61 | % | | | 7.00 | % |
| Value Opportunities I# | | | 32.93 | % | | | 18.80 | % | | | 8.01 | % |
| Value Opportunities R3# | | | 32.31 | % | | | 18.22 | % | | | 7.70 | % |
| Value Opportunities R4# | | | 32.62 | % | | | 18.56 | % | | | 7.92 | % |
| Value Opportunities R5# | | | 33.06 | % | | | 18.92 | % | | | 8.15 | % |
| Value Opportunities Y# | | | 33.06 | % | | | 18.93 | % | | | 8.20 | % |
| Russell 1000 Value Index | | | 28.29 | % | | | 14.06 | % | | | 7.81 | % |
| Russell 3000 Value Index | | | 28.64 | % | | | 14.12 | % | | | 7.88 | % |
| * | Class B shares convert to Class A shares after 8 years. The return shown reflects the conversion to Class A shares, which had different operating expenses, for the period after conversion. |
PERFORMANCE DATA QUOTED REPRESENTS PAST PERFORMANCE AND DOES NOT GUARANTEE FUTURE RESULTS. The investment return and principal value of the investment will fluctuate so that investors’ shares, when redeemed, may be worth more or less than their original cost. Current performance may be lower or higher than the performance data quoted. To obtain performance data current to the most recent month-end, please visit our website www.hartfordfunds.com.
The initial investment in Class A shares reflects the maximum sales charge of 5.50% and returns for Classes B and C reflect a contingent deferred sales charge of 5.00% and 1.00%, respectively.
Total returns presented above were calculated using the Fund’s net asset value available to shareholders for sale or redemption of Fund shares on October 31, 2013, which may exclude investment transactions as of this date. All share class returns assume the reinvestment of all distributions at net asset value and the deduction of all fund expenses.
Effective 9/30/09, Class B shares of the Fund were closed to new investments.
Class I shares commenced operations on 8/31/06. Performance prior to that date is that of the Fund's Class A shares (excluding sales charges), which had different operating expenses. Class R3, R4 and R5 shares commenced operations on 12/22/06. Performance prior to that date is that of the Fund's Class Y shares which had different operating expenses.
Russell 1000 Value Index is an unmanaged index measuring the performance of those Russell 1000 Index companies with lower price-to-book ratios and lower forecasted growth values. The Russell 1000 Index is an unmanaged index that measures the performance of the 1,000 largest companies in the Russell 3000 Index, which measures the performance of the 3,000 largest U.S. companies, based on total market capitalizations.
Russell 3000 Value Index is an unmanaged index measuring the performance of those Russell 3000 Index companies with lower price-to-book ratios and lower forecasted growth values. (The Russell 3000 Index is an unmanaged index that measures the performance of the 3,000 largest U.S. companies based on total market capitalization.)
You cannot invest directly in an index.
The chart and table do not reflect the deductions of taxes that a shareholder would pay on Fund distributions or the redemption of Fund shares.
Performance information may reflect historical or current expense waivers/reimbursements from the investment adviser, without which performance would have been lower. For information on current expense waivers/reimbursements, please see the prospectus.
| The Hartford Value Opportunities Fund |
| Manager Discussion |
| October 31, 2013 (Unaudited) |
Operating Expenses*
| | | Net | | | Gross | |
| Value Opportunities Class A | | | 1.35% | | | | 1.50% | |
| Value Opportunities Class B | | | 2.10% | | | | 2.44% | |
| Value Opportunities Class C | | | 2.10% | | | | 2.17% | |
| Value Opportunities Class I | | | 1.10% | | | | 1.11% | |
| Value Opportunities Class R3 | | | 1.55% | | | | 1.70% | |
| Value Opportunities Class R4 | | | 1.25% | | | | 1.33% | |
| Value Opportunities Class R5 | | | 0.95% | | | | 1.05% | |
| Value Opportunities Class Y | | | 0.90% | | | | 0.92% | |
| * | As of the Fund's current prospectus dated March 1, 2013. Actual expenses may be higher. Please see accompanying Financial Highlights for expense ratios for the year ended October 31, 2013. |
Gross expenses are the Fund's total annual operating expenses shown in the Fund's most recent prospectus. Net expenses are the Fund's total annual operating expenses shown in the Fund's most recent prospectus and reflect contractual expense reimbursements in instances when these reductions reduce the Fund's gross expenses. Contractual reimbursements remain in effect until February 28, 2014 and automatically renew for one-year terms unless terminated.
All investments are subject to risk including the possible loss of principal. For a discussion of the Fund’s risks, please see the Main Risks section. For more detailed information on the risks associated with an investment in the Fund, please see the prospectus.
| Portfolio Managers | |
| James N. Mordy | David W. Palmer, CFA |
| Senior Vice President and Equity Portfolio Manager | Senior Vice President and Equity Portfolio Manager |
How did the Fund perform?
The Class A shares of The Hartford Value Opportunities Fund returned 32.53%, before sales charge, for the twelve-month period ended October 31, 2013, outperforming the Fund’s benchmark, the Russell 3000 Value Index, which returned 28.64% for the same period. The Fund also outperformed the 30.49% average return of the Lipper Multi Cap Value Fund peer group, a group of funds with investment strategies similar to those of the Fund.
Why did the Fund perform this way?
Despite clear signs of political dysfunction in Washington, U.S. equities surged during the period (+27%) and reached a new all-time high during October (as measured by the S&P 500 Index). From its closing low on March 9, 2009, the S&P 500 ended October 2013 up over 159%. There have been a few hiccups during the rally, including in August 2013, where U.S. stocks suffered their worst month of the year amid heightened geopolitical risks stemming from the widening conflict in Syria. In September, the Federal Open Market Committee’s decision to leave the pace of its monthly asset purchases unchanged at $85 billion surprised many investors and contributed to the burgeoning risk appetites among many market participants. This continued highly accommodative monetary policy, along with solid earnings results and an upward trending housing market, overshadowed the 16-day government shutdown and near breach of the U.S. debt ceiling. Investors applauded the last-minute deal to end the fiscal stalemate in Washington; however, the U.S. Congress only extended the debt ceiling until February 7 and funded the government through January 15, so we may revisit the dysfunctional political situation early in 2014. Investors also cheered the nomination of Janet Yellen to become the next head of the U.S. Federal Reserve (Fed); she is widely viewed as more likely to maintain the Fed’s current monetary policy than outgoing chairman Ben Bernanke.
All ten sectors within the Russell 3000 Value Index posted positive returns during the period. Information Technology (+49%), Consumer Discretionary (+44%), and Industrials (+38%) were top performers while Utilities (+11%), Telecommunication Services (+12%), and Energy (+17%) lagged on a relative basis.
Security selection was the primary driver of the Fund’s relative outperformance. Security selection was strongest within Financials, Health Care, and Energy and weakest in Information Technology, Consumer Discretionary, and Utilities. Sector allocation, a fall-out of the bottom-up stock selection process, also contributed to relative returns due primarily to an overweight to Information Technology. A modest cash position detracted in an upward trending environment.
The largest contributors to relative performance were Exxon Mobil (Energy), Halliburton (Energy), and WuXi Pharmatech (Health Care). Not holding Exxon Mobil for most of the period was a positive, as the stock meaningfully lagged the sector and the broad market. Following this poor performance we initiated a new position at the end of October. Shares of Halliburton, a U.S.-based oilfield services provider, rose given strong demand growth for pressure pumping equipment from shale oil gas in the U.S.. Shares of WuXi, a China-based laboratory services provider, rose during the period as accelerating fundamentals in the company’s 2013 second quarter results exceeded both consensus expectations and management guidance. The company also had positive results in its toxicology and biologics services as well as an
| The Hartford Value Opportunities Fund |
| Manager Discussion – (continued) |
| October 31, 2013 (Unaudited) |
improving margin profile which contributed to positive results. Top contributors to absolute results also included Bank of America, a multinational bank and brokerage company, and Unum, a provider of disability insurance products in the United States and United Kingdom.
The largest detractors from both absolute and relative performance included VeriFone Systems (Information Technology), Barrick Gold (Materials), and Aeropostale (Consumer Discretionary). Shares of VeriFone Systems, a manufacturer of point-of-sale payment terminals, fell after the company missed revenue guidance due to execution missteps, customer delays, and share losses. Shares of Barrick Gold, a Canadian-based gold exploration and mining company, declined as the spot price of gold fell, reducing earnings forecasts. Shares of Aeropostale, a mall-based, specialty retailer of casual apparel and accessories, fell after the company failed to respond to a shift in customer preferences.
Derivatives are not used in a significant manner in this Fund and did not have a material impact on performance during the period.
What is the outlook?
For all the angst over potential “tapering” of bond purchases by the Fed, we believe there are significant pressures on the Fed to continue buying, and inflation remains muted, keeping access to money relatively easy and providing a bid for equities. This view contributes to our largely pro-cyclical positioning. On the whole we believe the portfolio is favorably exposed to stocks that should benefit from economic expansion. At the same time, we recognize that much of the developed world is in an “Age of Experiments” in its monetary policies, and we have favored proven businesses as a result. During the period, purchases in Materials and Financials and sales in Health Care were balanced by sales in Technology and purchases in Consumer Staples.
At the end of the period, the Fund was most overweight in Materials, Information Technology and Energy and most underweight in Industrials, Financials and Utilities relative to the benchmark.
| Diversification by Sector |
| as of October 31, 2013 |
| Sector | | Percentage of
Net Assets | |
| Equity Securities | | | | |
| Consumer Discretionary | | | 6.5 | % |
| Consumer Staples | | | 6.2 | |
| Energy | | | 17.3 | |
| Financials | | | 26.3 | |
| Health Care | | | 12.1 | |
| Industrials | | | 7.2 | |
| Information Technology | | | 12.7 | |
| Materials | | | 6.9 | |
| Services | | | 0.7 | |
| Utilities | | | 3.6 | |
| Total | | | 99.5 | % |
| Short-Term Investments | | | 1.1 | |
| Other Assets and Liabilities | | | (0.6 | ) |
| Total | | | 100.0 | % |
A sector may be comprised of several industries. For Fund compliance purposes, the Fund may not use the same classification system and these sector classifications are used for reporting ease.
| The Hartford Value Opportunities Fund |
| Schedule of Investments |
| October 31, 2013 |
| (000’s Omitted) |
| Shares or Principal Amount | | Market Value ╪ | |
| COMMON STOCKS - 99.5% | | | | |
| | | | | Automobiles and Components - 0.4% | | | | |
| | 38 | | | Ford Motor Co. | | $ | 652 | |
| | | | | | | | | |
| | | | | Banks - 4.6% | | | | |
| | 36 | | | PNC Financial Services Group, Inc. | | | 2,640 | |
| | 103 | | | Wells Fargo & Co. | | | 4,384 | |
| | | | | | | | 7,024 | |
| | | | | Capital Goods - 2.7% | | | | |
| | 4 | | | Esterline Technologies Corp. ● | | | 337 | |
| | 45 | | | KBR, Inc. | | | 1,564 | |
| | 26 | | | WESCO International, Inc. ● | | | 2,188 | |
| | | | | | | | 4,089 | |
| | | | | Commercial and Professional Services - 0.8% | | | | |
| | 74 | | | Knoll, Inc. | | | 1,218 | |
| | | | | | | | | |
| | | | | Consumer Durables and Apparel - 2.2% | | | | |
| | 67 | | | Electrolux AB Series B | | | 1,642 | |
| | 77 | | | Vera Bradley, Inc. ● | | | 1,710 | |
| | | | | | | | 3,352 | |
| | | | | Consumer Services - 1.0% | | | | |
| | 23 | | | Wyndham Worldwide Corp. | | | 1,547 | |
| | | | | | | | | |
| | | | | Diversified Financials - 8.5% | | | | |
| | 8 | | | Ameriprise Financial, Inc. | | | 770 | |
| | 29 | | | Citigroup, Inc. | | | 1,405 | |
| | 86 | | | JP Morgan Chase & Co. | | | 4,414 | |
| | 51 | | | Julius Baer Group Ltd. | | | 2,509 | |
| | 42 | | | LPL Financial Holdings, Inc. | | | 1,707 | |
| | 19 | | | Nasdaq OMX Group, Inc. | | | 684 | |
| | 26 | | | Northern Trust Corp. | | | 1,439 | |
| | 74 | | | Solar Cayman Ltd. ⌂■●† | | | 5 | |
| | | | | | | | 12,933 | |
| | | | | Energy - 17.3% | | | | |
| | 11 | | | Anadarko Petroleum Corp. | | | 1,036 | |
| | 33 | | | Baker Hughes, Inc. | | | 1,944 | |
| | 96 | | | Canadian Natural Resources Ltd. ADR | | | 3,036 | |
| | 118 | | | Cobalt International Energy, Inc. ● | | | 2,741 | |
| | 35 | | | Exxon Mobil Corp. | | | 3,092 | |
| | 58 | | | Halliburton Co. | | | 3,073 | |
| | 53 | | | Inpex Corp. | | | 614 | |
| | 45 | | | National Oilwell Varco, Inc. | | | 3,621 | |
| | 25 | | | Newfield Exploration Co. ● | | | 764 | |
| | 4 | | | Pioneer Natural Resources Co. | | | 758 | |
| | 72 | | | QEP Resources, Inc. | | | 2,374 | |
| | 63 | | | Southwestern Energy Co. ● | | | 2,332 | |
| | 70 | | | Trican Well Service Ltd. | | | 976 | |
| | | | | | | | 26,361 | |
| | | | | Food and Staples Retailing - 1.4% | | | | |
| | 29 | | | Wal-Mart Stores, Inc. | | | 2,187 | |
| | | | | | | | | |
| | | | | Food, Beverage and Tobacco - 4.8% | | | | |
| | 17 | | | Bunge Ltd. Finance Corp. | | | 1,405 | |
| | 71 | | | Imperial Tobacco Group plc | | | 2,648 | |
| | 117 | | | Maple Leaf Foods, Inc. | | | 1,728 | |
| | 30 | | | Molson Coors Brewing Co. | | | 1,627 | |
| | | | | | | | 7,408 | |
| | | | | Health Care Equipment and Services - 3.2% | | | | |
| | 48 | | | Aetna, Inc. | | | 3,035 | |
| | 27 | | | UnitedHealth Group, Inc. | | | 1,836 | |
| | | | | | | | 4,871 | |
| | | | | Insurance - 7.1% | | | | |
| | 52 | | | American International Group, Inc. | | | 2,696 | |
| | 91 | | | MetLife, Inc. | | | 4,296 | |
| | 14 | | | Principal Financial Group, Inc. | | | 658 | |
| | 33 | | | Reinsurance Group of America, Inc. | | | 2,361 | |
| | 25 | | | Unum Group | | | 786 | |
| | | | | | | | 10,797 | |
| | | | | Materials - 6.9% | | | | |
| | 35 | | | Ball Corp. | | | 1,701 | |
| | 53 | | | Barrick Gold Corp. | | | 1,026 | |
| | 85 | | | Cabot Corp. | | | 3,977 | |
| | 24 | | | Celanese Corp. | | | 1,361 | |
| | 34 | | | Reliance Steel & Aluminum | | | 2,492 | |
| | | | | | | | 10,557 | |
| | | | | Pharmaceuticals, Biotechnology and Life Sciences - 8.9% | | | | |
| | 91 | | | Almirall S.A. | | | 1,366 | |
| | 51 | | | Bristol-Myers Squibb Co. | | | 2,657 | |
| | 31 | | | Eli Lilly & Co. | | | 1,559 | |
| | 103 | | | Merck & Co., Inc. | | | 4,637 | |
| | 8 | | | Roche Holding AG | | | 2,196 | |
| | 16 | | | Vertex Pharmaceuticals, Inc. ● | | | 1,149 | |
| | | | | | | | 13,564 | |
| | | | | Real Estate - 6.1% | | | | |
| | 18 | | | AvalonBay Communities, Inc. REIT | | | 2,213 | |
| | 17 | | | Boston Properties, Inc. REIT | | | 1,708 | |
| | 35 | | | Equity Lifestyle Properties, Inc. REIT | | | 1,330 | |
| | 41 | | | Hatteras Financial Corp. REIT | | | 747 | |
| | 25 | | | Plum Creek Timber Co., Inc. REIT | | | 1,126 | |
| | 20 | | | Realogy Holdings Corp. ● | | | 814 | |
| | 45 | | | Weyerhaeuser Co. REIT | | | 1,356 | |
| | | | | | | | 9,294 | |
| | | | | Retailing - 2.9% | | | | |
| | 118 | | | Aeropostale, Inc. ● | | | 1,099 | |
| | 572 | | | Allstar Co. ⌂●† | | | 1,052 | |
| | 24 | | | GNC Holdings, Inc. | | | 1,417 | |
| | 15 | | | Kohl's Corp. | | | 830 | |
| | | | | | | | 4,398 | |
| | | | | Semiconductors and Semiconductor Equipment - 6.3% | | | | |
| | 27 | | | Avago Technologies Ltd. | | | 1,240 | |
| | 47 | | | Intel Corp. | | | 1,139 | |
| | 76 | | | Maxim Integrated Products, Inc. | | | 2,257 | |
| | 2 | | | Samsung Electronics Co., Ltd. | | | 2,436 | |
| | 100 | | | Skyworks Solutions, Inc. ● | | | 2,570 | |
| | | | | | | | 9,642 | |
| | | | | Software and Services - 1.8% | | | | |
| | 118 | | | Activision Blizzard, Inc. | | | 1,962 | |
| | 37 | | | Booz Allen Hamilton Holding Corp. | | | 728 | |
| | | | | | | | 2,690 | |
| | | | | Technology Hardware and Equipment - 4.6% | | | | |
| | 14 | | | Arrow Electronics, Inc. ● | | | 677 | |
| | 125 | | | Cisco Systems, Inc. | | | 2,810 | |
| | 121 | | | EMC Corp. | | | 2,903 | |
| | 34 | | | Juniper Networks, Inc. ● | | | 639 | |
| | | | | | | | 7,029 | |
| | | | | Telecommunication Services - 0.7% | | | | |
| | 310 | | | Vodafone Group plc | | | 1,135 | |
| | | | | | | | | |
| | | | | Transportation - 3.7% | | | | |
| | 97 | | | Knight Transportation, Inc. | | | 1,652 | |
| | 23 | | | Norfolk Southern Corp. | | | 2,004 | |
The accompanying notes are an integral part of these financial statements.
| The Hartford Value Opportunities Fund |
| Schedule of Investments – (continued) |
| October 31, 2013 |
| (000’s Omitted) |
| Shares or Principal Amount | | | | | | Market Value ╪ | |
| COMMON STOCKS - 99.5% - (continued) | | | | | | | | |
| | | | | Transportation - 3.7% - (continued) | | | | | | | | |
| | 21 | | | United Parcel Service, Inc. Class B | | | | | | $ | 2,071 | |
| | | | | | | | | | | | 5,727 | |
| | | | | Utilities - 3.6% | | | | | | | | |
| | 31 | | | Entergy Corp. | | | | | | | 1,996 | |
| | 337 | | | Snam S.p.A. | | | | | | | 1,739 | |
| | 62 | | | Xcel Energy, Inc. | | | | | | | 1,801 | |
| | | | | | | | | | | | 5,536 | |
| | | | | Total common stocks | | | | | | | | |
| | | | | (cost $132,096) | | | | | | $ | 152,011 | |
| | | | | | | | | | | | | |
| | | | | Total long-term investments | | | | | | | | |
| | | | | (cost $132,096) | | | | | | $ | 152,011 | |
| | | | | | | | | | | | | |
| SHORT-TERM INVESTMENTS - 1.1% | | | | | | | | |
| Repurchase Agreements - 1.1% | | | | | | | | |
| | | | | Bank of America Merrill Lynch TriParty
Repurchase Agreement (maturing on
11/01/2013 in the amount of $138,
collateralized by FHLMC 4.50%, 2040,
FNMA 1.92% - 4.00%, 2036 - 2043, value
of $140) | | | | | | | | |
| $ | 137 | | | 0.10%, 10/31/2013 | | | | | | $ | 137 | |
| | | | | Bank of Montreal TriParty Repurchase
Agreement (maturing on 11/01/2013 in the
amount of $48, collateralized by FHLMC
4.00%, 2043, FNMA 2.00% - 6.00%, 2020 -
2043, GNMA 3.00%, 2043, value of $49) | | | | | | | | |
| | 48 | | | 0.09%, 10/31/2013 | | | | | | | 48 | |
| | | | | Barclays Capital TriParty Repurchase
Agreement (maturing on 11/01/2013 in the
amount of $221, collateralized by U.S.
Treasury Note 0.25% - 4.00%, 2015, value
of $225) | | | | | | | | |
| | 221 | | | 0.08%, 10/31/2013 | | | | | | | 221 | |
| | | | | Citigroup Global Markets, Inc. TriParty
Repurchase Agreement (maturing on
11/01/2013 in the amount of $626,
collateralized by U.S. Treasury Bill 0.01% -
0.35%, 2013 - 2014, U.S. Treasury Bond
2.75% - 8.75%, 2017 - 2042, U.S. Treasury
Note 0.25% - 4.75%, 2013 - 2022, value of
$638) | | | | | | | | |
| | 626 | | | 0.09%, 10/31/2013 | | | | | | | 626 | |
| | | | | Deutsche Bank Securities TriParty Repurchase
Agreement (maturing on 11/01/2013 in the
amount of $252, collateralized by FHLMC
2.50% - 7.50%, 2026 - 2043, FNMA 3.00%
- 7.00%, 2026 - 2043, GNMA 2.67% -
5.00%, 2024 - 2048, value of $257) | | | | | | | | |
| | 252 | | | 0.12%, 10/31/2013 | | | | | | | 252 | |
| | | | | RBS Securities, Inc. TriParty Repurchase
Agreement (maturing on 11/01/2013 in the
amount of $149, collateralized by U.S.
Treasury Note 0.75% - 2.63%, 2014 - 2021,
value of $152) | | | | | | | | |
| | 149 | | | 0.09%, 10/31/2013 | | | | | | | 149 | |
| | | | TD Securities TriParty Repurchase Agreement
(maturing on 11/01/2013 in the amount of
$262, collateralized by FNMA 2.50% -
4.00%, 2027 - 2042, GNMA 2.50%, 2043,
value of $268) | | | | | | | | |
| | 262 | | | 0.10%, 10/31/2013 | | | | | | | 262 | |
| | | | | UBS Securities, Inc. Repurchase Agreement
(maturing on 11/01/2013 in the amount of
$1, collateralized by U.S. Treasury Note
0.63%, 2017, value of $1) | | | | | | | | |
| | 1 | | | 0.09%, 10/31/2013 | | | | | | | 1 | |
| | | | | | | | | | | | 1,696 | |
| | | | | Total short-term investments | | | | | | | | |
| | | | | (cost $1,696) | | | | | | $ | 1,696 | |
| | | | | | | | | | | | | |
| | | | | Total investments | | | | | | | | |
| | | | | (cost $133,792) ▲ | | | 100.6 | % | | $ | 153,707 | |
| | | | | Other assets and liabilities | | | (0.6 | )% | | | (903 | ) |
| | | | | Total net assets | | | 100.0 | % | | $ | 152,804 | |
The accompanying notes are an integral part of these financial statements.
| Note: | Percentage of investments as shown is the ratio of the total market value to total net assets. |
Prices of foreign equities that are principally traded on certain foreign markets may be adjusted daily pursuant to a fair value pricing service approved by the Board of Directors in order to reflect an adjustment for factors occurring after the close of certain foreign markets but before the close of the New York Stock Exchange.
| ▲ | At October 31, 2013, the cost of securities for federal income tax purposes was $134,515 and the aggregate gross unrealized appreciation and depreciation based on that cost were: |
| Unrealized Appreciation | | $ | 22,301 | |
| Unrealized Depreciation | | | (3,109 | ) |
| Net Unrealized Appreciation | | $ | 19,192 | |
| † | These securities were valued in good faith at fair value as determined under policies and procedures established by and under the supervision of the Company's Board of Directors. At October 31, 2013, the aggregate value of these securities was $1,057, which represents 0.7% of total net assets. This amount excludes securities that are principally traded in certain foreign markets and whose prices are adjusted pursuant to a third party pricing service methodology approved by the Board of Directors. |
| ■ | Securities issued within terms of a private placement memorandum, exempt from registration under Rule 144A under the Securities Act of 1933, as amended, and may be sold only to qualified institutional buyers. Unless otherwise indicated, these holdings are determined to be liquid. At October 31, 2013, the aggregate value of these securities was $5, which rounds to zero percent of total net assets. |
| ⌂ | The following securities are considered illiquid. Illiquid securities are often purchased in private placement transactions, are often not registered under the Securities Act of 1933 and may have contractual restrictions on resale. A security may also be considered illiquid if the security lacks a readily available market or if its valuation has not changed for a certain period of time. |
| Period Acquired | | Shares/ Par | | | Security | | Cost Basis | |
| 08/2011 | | | 572 | | | Allstar Co. | | $ | 338 | |
| 03/2007 | | | 74 | | | Solar Cayman Ltd. - 144A | | | 22 | |
At October 31, 2013, the aggregate value of these securities was $1,057, which represents 0.7% of total net assets.
| Foreign Currency Contracts Outstanding at October 31, 2013 |
| |
| Currency | | Buy / Sell | | Delivery Date | | Counterparty | | Contract Amount | | | Market Value ╪ | | | Unrealized
Appreciation/
(Depreciation) | |
| CAD | | Buy | | 11/05/2013 | | DEUT | | $ | 1 | | | $ | 1 | | | $ | – | |
| CHF | | Buy | | 11/05/2013 | | CSFB | | | 4 | | | | 4 | | | | – | |
| GBP | | Buy | | 11/05/2013 | | BOA | | | 6 | | | | 6 | | | | – | |
| SEK | | Buy | | 11/05/2013 | | BOA | | | 3 | | | | 3 | | | | – | |
| | | | | | | | | | | | | | | | | $ | – | |
| ╪ | See Significant Accounting Policies of accompanying Notes to Financial Statements regarding valuation of securities. |
The accompanying notes are an integral part of these financial statements.
| The Hartford Value Opportunities Fund |
| Schedule of Investments – (continued) |
| October 31, 2013 |
| (000’s Omitted) |
| GLOSSARY: (abbreviations used in preceding Schedule of Investments) |
| |
| Counterparty Abbreviations: |
| BOA | Banc of America Securities LLC |
| CSFB | Credit Suisse First Boston Corp. |
| DEUT | Deutsche Bank Securities, Inc. |
| | |
| Currency Abbreviations: |
| CAD | Canadian Dollar | |
| CHF | Swiss Franc | |
| GBP | British Pound | |
| SEK | Swedish Krona | |
| |
| Other Abbreviations: |
| ADR | American Depositary Receipt |
| FHLMC | Federal Home Loan Mortgage Corp. |
| FNMA | Federal National Mortgage Association |
| GNMA | Government National Mortgage Association |
| REIT | Real Estate Investment Trust |
The accompanying notes are an integral part of these financial statements.
| The Hartford Value Opportunities Fund |
| Investment Valuation Hierarchy Level Summary |
| October 31, 2013 |
| (000’s Omitted) |
| | | Total | | | Level 1 ♦ | | | Level 2 ♦ | | | Level 3 | |
| Assets: | | | | | | | | | | | | | | | | |
| Common Stocks | | | | | | | | | | | | | | | | |
| Automobiles and Components | | $ | 652 | | | $ | 652 | | | $ | – | | | $ | – | |
| Banks | | | 7,024 | | | | 7,024 | | | | – | | | | – | |
| Capital Goods | | | 4,089 | | | | 4,089 | | | | – | | | | – | |
| Commercial and Professional Services | | | 1,218 | | | | 1,218 | | | | – | | | | – | |
| Consumer Durables and Apparel | | | 3,352 | | | | 1,710 | | | | 1,642 | | | | – | |
| Consumer Services | | | 1,547 | | | | 1,547 | | | | – | | | | – | |
| Diversified Financials | | | 12,933 | | | | 10,419 | | | | 2,509 | | | | 5 | |
| Energy | | | 26,361 | | | | 25,747 | | | | 614 | | | | – | |
| Food and Staples Retailing | | | 2,187 | | | | 2,187 | | | | – | | | | – | |
| Food, Beverage and Tobacco | | | 7,408 | | | | 4,760 | | | | 2,648 | | | | – | |
| Health Care Equipment and Services | | | 4,871 | | | | 4,871 | | | | – | | | | – | |
| Insurance | | | 10,797 | | | | 10,797 | | | | – | | | | – | |
| Materials | | | 10,557 | | | | 10,557 | | | | – | | | | – | |
| Pharmaceuticals, Biotechnology and Life Sciences | | | 13,564 | | | | 10,002 | | | | 3,562 | | | | – | |
| Real Estate | | | 9,294 | | | | 9,294 | | | | – | | | | – | |
| Retailing | | | 4,398 | | | | 3,346 | | | | – | | | | 1,052 | |
| Semiconductors and Semiconductor Equipment | | | 9,642 | | | | 7,206 | | | | 2,436 | | | | – | |
| Software and Services | | | 2,690 | | | | 2,690 | | | | – | | | | – | |
| Technology Hardware and Equipment | | | 7,029 | | | | 7,029 | | | | – | | | | – | |
| Telecommunication Services | | | 1,135 | | | | – | | | | 1,135 | | | | – | |
| Transportation | | | 5,727 | | | | 5,727 | | | | – | | | | – | |
| Utilities | | | 5,536 | | | | 3,797 | | | | 1,739 | | | | – | |
| Total | | | 152,011 | | | | 134,669 | | | | 16,285 | | | | 1,057 | |
| Short-Term Investments | | | 1,696 | | | | – | | | | 1,696 | | | | – | |
| Total | | $ | 153,707 | | | $ | 134,669 | | | $ | 17,981 | | | $ | 1,057 | |
| Foreign Currency Contracts* | | | – | | | | – | | | | – | | | | – | |
| Total | | $ | – | | | $ | – | | | $ | – | | | $ | – | |
| Liabilities: | | | | | | | | | | | | | | | | |
| Foreign Currency Contracts* | | | – | | | | – | | | | – | | | | – | |
| Total | | $ | – | | | $ | – | | | $ | – | | | $ | – | |
| ♦ | For the year ended October 31, 2013, investments valued at $794 were transferred from Level 2 to Level 1, and there were no transfers from Level 1 to Level 2. Investments are transferred between Level 1 and Level 2 for a variety of reasons including, but not limited to: |
| 1) | Foreign equities for which a fair value price is more representative of exit value than the local market close (transfer into Level 2). Foreign equities for which the local market close is more representative of exit value (transfer into Level 1). |
| 2) | U.S. Treasury securities that no longer represent the most recent issue (transfer into Level 2). |
| 3) | Equity investments with no observable trading but a bid or close price is used (transfer into Level 2). Equity investments using observable quoted prices in an active market (transfer into Level 1). |
| * | Derivative instruments not reflected in the Schedule of Investments are valued at the unrealized appreciation/depreciation on the investments. |
| Following is a reconciliation of Level 3 assets for which significant unobservable inputs were used to determine fair value: |
| |
| | | Balance
as of
October
31, 2012 | | | Realized
Gain
(Loss) | | | Change in
Unrealized
Appreciation
(Depreciation) | | | Net
Amortization | | | Purchases | | | Sales | | | Transfers
Into
Level 3 | | | Transfers
Out of
Level 3 | | | Balance
as of
October
31, 2013 | |
| Assets: | | | | | | | | | | | | | | | | | | | | | | | | | | | | | | | | | | | | |
| Common Stocks | | $ | 1,008 | | | $ | — | | | $ | 293 | * | | $ | — | | | $ | — | | | $ | (244 | ) | | $ | — | | | $ | — | | | $ | 1,057 | |
| Total | | $ | 1,008 | | | $ | — | | | $ | 293 | | | $ | — | | | $ | — | | | $ | (244 | ) | | $ | — | | | $ | — | | | $ | 1,057 | |
| * | Change in unrealized appreciation (depreciation) in the current period relating to assets still held at October 31, 2013 was $293. |
| Note: | For purposes of reporting transfers between different hierarchy levels, both transfers in and out of each level, as applicable, are shown as if they occurred at the beginning of the period. |
The accompanying notes are an integral part of these financial statements.
| The Hartford Value Opportunities Fund |
| Statement of Assets and Liabilities |
| October 31, 2013 |
| (000’s Omitted) |
| Assets: | | | | |
| Investments in securities, at market value (cost $133,792) | | $ | 153,707 | |
| Cash | | | — | |
| Unrealized appreciation on foreign currency contracts | | | — | |
| Receivables: | | | | |
| Investment securities sold | | | 2,109 | |
| Fund shares sold | | | 196 | |
| Dividends and interest | | | 127 | |
| Other assets | | | 55 | |
| Total assets | | | 156,194 | |
| Liabilities: | | | | |
| Unrealized depreciation on foreign currency contracts | | | — | |
| Payables: | | | | |
| Investment securities purchased | | | 3,190 | |
| Fund shares redeemed | | | 119 | |
| Investment management fees | | | 23 | |
| Administrative fees | | | — | |
| Distribution fees | | | 9 | |
| Accrued expenses | | | 49 | |
| Total liabilities | | | 3,390 | |
| Net assets | | $ | 152,804 | |
| Summary of Net Assets: | | | | |
| Capital stock and paid-in-capital | | $ | 167,503 | |
| Undistributed net investment income | | | 665 | |
| Accumulated net realized loss | | | (35,280 | ) |
| Unrealized appreciation of investments and the translation of assets and liabilities denominated in foreign currency | | | 19,916 | |
| Net assets | | $ | 152,804 | |
| | | | | |
| Shares authorized | | | 27,000,000 | |
| Par value | | $ | 0.0001 | |
| Class A: Net asset value per share/Maximum offering price per share | | | $18.31/$19.38 | |
| Shares outstanding | | | 6,455 | |
| Net assets | | $ | 118,203 | |
| Class B: Net asset value per share | | $ | 16.36 | |
| Shares outstanding | | | 234 | |
| Net assets | | $ | 3,825 | |
| Class C: Net asset value per share | | $ | 16.29 | |
| Shares outstanding | | | 679 | |
| Net assets | | $ | 11,059 | |
| Class I: Net asset value per share | | $ | 18.12 | |
| Shares outstanding | | | 436 | |
| Net assets | | $ | 7,908 | |
| Class R3: Net asset value per share | | $ | 18.50 | |
| Shares outstanding | | | 80 | |
| Net assets | | $ | 1,480 | |
| Class R4: Net asset value per share | | $ | 18.64 | |
| Shares outstanding | | | 390 | |
| Net assets | | $ | 7,271 | |
| Class R5: Net asset value per share | | $ | 18.76 | |
| Shares outstanding | | | 102 | |
| Net assets | | $ | 1,909 | |
| Class Y: Net asset value per share | | $ | 18.82 | |
| Shares outstanding | | | 61 | |
| Net assets | | $ | 1,149 | |
The accompanying notes are an integral part of these financial statements.
| The Hartford Value Opportunities Fund |
| Statement of Operations |
| For the Year Ended October 31, 2013 |
| (000’s Omitted) |
| Investment Income: | | | | |
| Dividends | | $ | 2,688 | |
| Interest | | | 2 | |
| Less: Foreign tax withheld | | | (59 | ) |
| Total investment income | | | 2,631 | |
| | | | | |
| Expenses: | | | | |
| Investment management fees | | | 1,026 | |
| Administrative services fees | | | | |
| Class R3 | | | 2 | |
| Class R4 | | | 10 | |
| Class R5 | | | 2 | |
| Transfer agent fees | | | | |
| Class A | | | 275 | |
| Class B | | | 20 | |
| Class C | | | 22 | |
| Class I | | | 10 | |
| Class R3 | | | 1 | |
| Class R4 | | | — | |
| Class R5 | | | — | |
| Class Y | | | — | |
| Distribution fees | | | | |
| Class A | | | 250 | |
| Class B | | | 42 | |
| Class C | | | 97 | |
| Class R3 | | | 6 | |
| Class R4 | | | 17 | |
| Custodian fees | | | 3 | |
| Accounting services fees | | | 18 | |
| Registration and filing fees | | | 85 | |
| Board of Directors' fees | | | 4 | |
| Audit fees | | | 12 | |
| Other expenses | | | 37 | |
| Total expenses (before waivers and fees paid indirectly) | | | 1,939 | |
| Expense waivers | | | (99 | ) |
| Transfer agent fee waivers | | | (8 | ) |
| Commission recapture | | | (5 | ) |
| Custodian fee offset | | | — | |
| Total waivers and fees paid indirectly | | | (112 | ) |
| Total expenses, net | | | 1,827 | |
| Net Investment Income | | | 804 | |
| Net Realized Gain on Investments and Foreign Currency Transactions: | | | | |
| Net realized gain on investments | | | 16,455 | |
| Net realized loss on foreign currency contracts | | | (47 | ) |
| Net realized gain on other foreign currency transactions | | | 36 | |
| Net Realized Gain on Investments and Foreign Currency Transactions | | | 16,444 | |
| Net Changes in Unrealized Appreciation of Investments and Foreign Currency Transactions: | | | | |
| Net unrealized appreciation of investments | | | 18,394 | |
| Net unrealized appreciation of foreign currency contracts | | | — | |
| Net unrealized appreciation on translation of other assets and liabilities in foreign currencies | | | 1 | |
| Net Changes in Unrealized Appreciation of Investments and Foreign Currency Transactions | | | 18,395 | |
| Net Gain on Investments and Foreign Currency Transactions | | | 34,839 | |
| Net Increase in Net Assets Resulting from Operations | | $ | 35,643 | |
The accompanying notes are an integral part of these financial statements.
| The Hartford Value Opportunities Fund |
| Statement of Changes in Net Assets |
| |
| (000’s Omitted) |
| | | For the
Year Ended
October 31, 2013 | | | For the
Year Ended
October 31, 2012 | |
| Operations: | | | | | | | | |
| Net investment income | | $ | 804 | | | $ | 1,914 | |
| Net realized gain on investments and foreign currency transactions | | | 16,444 | | | | 3,674 | |
| Net unrealized appreciation of investments and foreign currency transactions | | | 18,395 | | | | 7,508 | |
| Net Increase in Net Assets Resulting from Operations | | | 35,643 | | | | 13,096 | |
| Distributions to Shareholders: | | | | | | | | |
| From net investment income | | | | | | | | |
| Class A | | | (1,297 | ) | | | (767 | ) |
| Class B | | | (35 | ) | | | (8 | ) |
| Class C | | | (80 | ) | | | (27 | ) |
| Class I | | | (62 | ) | | | (45 | ) |
| Class R3 | | | (18 | ) | | | (8 | ) |
| Class R4 | | | (93 | ) | | | (63 | ) |
| Class R5 | | | (22 | ) | | | (3 | ) |
| Class Y | | | (18 | ) | | | (445 | ) |
| Total distributions | | | (1,625 | ) | | | (1,366 | ) |
| Capital Share Transactions: | | | | | | | | |
| Class A | | | 5,976 | | | | (8,883 | ) |
| Class B | | | (1,709 | ) | | | (1,962 | ) |
| Class C | | | (361 | ) | | | (2,311 | ) |
| Class I | | | 2,357 | | | | 1,118 | |
| Class R3 | | | (280 | ) | | | 358 | |
| Class R4 | | | (518 | ) | | | (511 | ) |
| Class R5 | | | 205 | | | | 1,039 | |
| Class Y | | | (238 | ) | | | (33,510 | ) |
| Net increase (decrease) from capital share transactions | | | 5,432 | | | | (44,662 | ) |
| Net Increase (Decrease) in Net Assets | | | 39,450 | | | | (32,932 | ) |
| Net Assets: | | | | | | | | |
| Beginning of period | | | 113,354 | | | | 146,286 | |
| End of period | | $ | 152,804 | | | $ | 113,354 | |
| Undistributed (distribution in excess of) net investment income | | $ | 665 | | | $ | 1,623 | |
The accompanying notes are an integral part of these financial statements.
| The Hartford Value Opportunities Fund |
| Notes to Financial Statements |
| October 31, 2013 |
| (000’s Omitted) |
The Hartford Mutual Funds II, Inc. (“Company”) is an open-end management investment company comprised of five portfolios. Financial statements for The Hartford Value Opportunities Fund (the “Fund”), a series of the Company, are included in this report.
The Company is organized under the laws of the State of Maryland and is registered with the Securities and Exchange Commission (“SEC”) under the Investment Company Act of 1940, as amended (“1940 Act”). The Fund is a diversified open-end management investment company.
Class A shares are sold with a front-end sales charge of up to 5.50%. Class B shares were sold with a contingent deferred sales charge which is assessed on the lesser of the per share net asset value (“NAV”) of the shares at the time of redemption or the original purchase price, and declines from up to 5.00% to zero depending on the period of time the shares are held (see note below regarding the closing of Class B shares). Class C shares are sold with a contingent deferred sales charge of up to 1.00% on shares redeemed within twelve months of purchase. Class I shares are sold without sales charges to certain eligible investors primarily through advisory fee-based wrap programs. Class R3, R4 and R5 shares, which are offered to employer-sponsored retirement plans, and Class Y shares, which are sold to certain eligible institutional investors, are sold without a sales charge. All classes of shares have identical voting, redemption, dividend, liquidation and other rights and the same terms and conditions, with the exceptions that each class may have different expenses, which may affect performance, and that Class B shares automatically convert to Class A shares after 8 years.
No new or additional investments are allowed in Class B shares of the Fund (including investments through any systematic investment plan). Existing shareholders of Class B shares may continue to hold their Class B shares, exchange their Class B shares for Class B shares of another Hartford Fund (as permitted by existing exchange privileges), or redeem their Class B shares as described in the Fund’s prospectus. Reinstatement privileges with respect to Class B shares will continue under the current policy. For investors electing to reinvest capital gains and dividends, any such capital gains or dividends on Class B shares will continue to be reinvested in Class B shares of the Fund. All Class B share attributes, including the 12b-1 fee, contingent deferred sales charge schedule, and conversion to Class A shares, remain unchanged.
| 2. | Significant Accounting Policies: |
The following is a summary of significant accounting policies of the Fund in the preparation of its financial statements, which are in accordance with United States Generally Accepted Accounting Principles (“U.S. GAAP”). The preparation of financial statements in accordance with U.S. GAAP may require management to make estimates and assumptions that affect the reported amounts of assets and liabilities and disclosure of contingent assets and liabilities at the date of the financial statements and the reported amounts of increases and decreases in net assets from operations during the reporting period. Actual results could differ from those estimates.
| a) | Determination of Net Asset Value – The NAV of each class of the Fund’s shares is determined as of the close of regular trading (normally 4:00 p.m. Eastern Time) (the “NYSE Close”) on each day that the New York Stock Exchange (the “Exchange”) is open (“Valuation Date”). Information that becomes known to the Fund after the NAV has been calculated on a particular day will not generally be used to retroactively adjust the NAV determined earlier that day. |
| b) | Investment Valuation and Fair Value Measurements – For purposes of calculating the NAV, portfolio investments and other assets held by the Fund's portfolio for which market quotes are readily available are valued at market value. Market value is generally determined on the basis of last reported sales prices or official close price. If no sales are reported, market value is based on quotes obtained from a quotation reporting system, established market makers, or independent pricing services. If market prices are not readily available or are deemed unreliable, the Fund will use the fair value of the investment as determined in good faith under policies and procedures established by and under the supervision of the Company’s Board of Directors. Market quotes are considered not readily available where there is an absence of current or reliable market-based data (e.g., trade information or indicative market quotes), including where events occur after the |
| The Hartford Value Opportunities Fund |
| Notes to Financial Statements |
| October 31, 2013 |
| (000’s Omitted) |
close of the relevant market, but prior to the NYSE Close, that materially affect the values of the Fund’s portfolio investments or assets. In addition, market quotes are considered not readily available when, due to extraordinary circumstances, the exchanges or markets on which the investments trade do not open for trading for the entire day and no other market prices are available. In addition, prices of foreign equities that are principally traded on certain foreign markets may be adjusted daily pursuant to a fair value pricing service approved by the Board of Directors in order to reflect an adjustment for the factors occurring after the close of certain foreign markets but before the NYSE Close. Investments that are primarily traded on foreign markets may trade on days that are not business days of the Fund. The value of the foreign investments in which the Fund invests may change on days when a shareholder will not be able to purchase or redeem shares of the Fund. Fair value pricing is subjective in nature and the use of fair value pricing by the Fund may cause the NAV of its shares to differ significantly from the NAV that would have been calculated using market prices at the close of the exchange on which a portfolio investment is primarily traded. There can be no assurance that the Fund could obtain the fair market value assigned to an investment if the Fund were to sell the investment at approximately the time at which the Fund determines its NAV.
Investments valued in currencies other than U.S. dollars are converted to U.S. dollars using exchange rates obtained from independent pricing services for calculation of the NAV. As a result, the NAV of the Fund’s shares may be affected by changes in the value of currencies in relation to the U.S. dollar. The value of investments traded in markets outside the United States or denominated in currencies other than the U.S. dollar may be affected significantly on a day that the NYSE is closed and the market value may change on days when an investor is not able to purchase, redeem or exchange shares of the Fund.
Foreign currency contracts represent agreements to exchange currencies on specific future dates at predetermined rates. Foreign currency contracts are valued using foreign currency exchange rates and forward rates as provided by an independent pricing service on the Valuation Date.
Financial instruments for which prices are not available from an independent pricing service may be valued using market quotations obtained from one or more dealers that make markets in the respective financial instrument in accordance with procedures established by the Company’s Board of Directors.
U.S. GAAP defines fair value as the price that the Fund would receive to sell an asset or pay to transfer a liability in an orderly transaction between market participants. The U.S. GAAP fair value measurement standards require disclosure of a fair value hierarchy for each major category of assets and liabilities. Various inputs are used in determining the fair value of the Fund’s investments. These inputs are summarized into three broad hierarchy levels. This hierarchy is based on whether the valuation inputs are observable or unobservable. These levels are:
| · | Level 1 – Quoted prices in active markets for identical investments. Level 1 may include exchange traded instruments, such as domestic equities, some foreign equities, options, futures, mutual funds, exchange traded funds, rights and warrants. |
| · | Level 2 – Observable inputs other than Level 1 prices, such as quoted prices for similar investments; quoted prices in markets that are not active; or other inputs that are observable or can be corroborated by observable market data. Level 2 may include debt investments that are traded less frequently than exchange traded instruments and which are valued using independent pricing services; foreign equities, which are principally traded on certain foreign markets and are adjusted daily pursuant to a fair value pricing service in order to reflect an adjustment for the factors occurring after the close of certain foreign markets but before the NYSE Close; senior floating rate interests, which are valued using an aggregate of dealer bids; and short-term investments, which are valued at amortized cost. |
| · | Level 3 – Significant unobservable inputs that are supported by limited or no market activity. Level 3 may include financial instruments whose values are determined using indicative market quotes or require significant management judgment or estimation. These unobservable valuation inputs may include estimates for current yields, maturity/duration, prepayment speed, and indicative market quotes for comparable investments along with other assumptions relating to credit quality, collateral value, complexity of the investment structure, |
general market conditions and liquidity. This category may include investments where trading has been halted or there are certain restrictions on trading. While these investments are priced using unobservable inputs, the valuation of these investments reflects the best available data and management believes the prices are a reasonable representation of exit price.
The Board of Directors of the Company generally reviews and approves the “Procedures for Valuation of Portfolio Securities” on an annual basis. These procedures define how investments are to be valued, including the formation and activities of a Valuation Committee. The Valuation Committee is responsible for determining in good faith the fair value of investments when the value cannot be obtained from primary pricing services or alternative sources or if the valuation of an investment as provided by the primary pricing service or alternative source is believed not to reflect the investment’s fair value as of the Valuation Date. Voting members of the Valuation Committee include the Fund’s Treasurer or designee and a Vice President of the investment manager or designee. An Assistant Vice President of the Fund with legal expertise or designee is also included on the Valuation Committee as a non-voting advisory member. In addition, the Fund’s Chief Compliance Officer shall designate a member of the compliance group to attend Valuation Committee meetings as a non-voting resource, to monitor for and provide guidance with respect to compliance with these procedures. Two members of the Valuation Committee or their designees, representing different departments, shall constitute a quorum for purposes of permitting the Valuation Committee to take action. The Valuation Committee will consider all relevant factors in determining an investment’s fair value, and may seek the advice of the Fund’s sub-adviser, knowledgeable brokers, and legal counsel in making such determination. The Valuation Committee reports to the Audit Committee of the Company’s Board of Directors. The Audit Committee receives quarterly written reports which include details of all fair-valued investments, including the reason for the fair valuation, and an indication, when possible, of the accuracy of the valuation by disclosing the next available reliable public price quotation or the disposition price of such investments (the “look-back” test). The Board of Directors then must consider for ratification all of the fair value determinations made during the previous quarter.
Valuation levels are not necessarily indicative of the risk associated with investing in such investments. Individual investments within any of the above mentioned asset classes may be assigned a different hierarchical level than those presented above, as individual circumstances dictate.
For additional information, refer to the Investment Valuation Hierarchy Level Summary and the Level 3 roll-forward reconciliation, if applicable, which follow the Schedule of Investments.
| c) | Investment Transactions and Investment Income – Investment transactions are recorded as of the trade date (the date the order to buy or sell is executed) for financial reporting purposes. Investments purchased or sold on a when-issued or delayed-delivery basis may be settled a month or more after the trade date. Realized gains and losses are determined on the basis of identified cost. |
Dividend income from domestic securities is accrued on the ex-dividend date. In general, dividend income from foreign securities is recorded on the ex-date; however, dividend notifications in certain foreign jurisdictions may not be available in a timely manner and as a result, the Fund will record the dividend as soon as the relevant details (i.e., rate per share, payment date, shareholders of record, etc.) are publicly available. Interest income, including amortization of premium and accretion of discounts, is accrued on a daily basis.
| d) | Foreign Currency Transactions – Assets and liabilities denominated in currencies other than U.S. dollars are translated into U.S. dollars at the exchange rates in effect on the valuation date. Purchases and sales of investments, income and expenses are translated into U.S. dollars at the exchange rates on the dates of such transactions. |
The Fund does not isolate that portion of portfolio investment valuation resulting from fluctuations in the foreign currency exchange rates from the fluctuations arising from changes in the market prices of investments held. Exchange
| The Hartford Value Opportunities Fund |
| Notes to Financial Statements |
| October 31, 2013 |
| (000’s Omitted) |
rate fluctuations are included with the net realized and unrealized gain or loss on investments in the accompanying financial statements.
Net realized foreign exchange gains or losses arise from sales of foreign currencies and the difference between asset and liability amounts initially stated in foreign currencies and the U.S. dollar value of the amounts actually received or paid. Net unrealized foreign exchange gains or losses arise from changes in the value of other assets and liabilities at the end of the reporting period, resulting from changes in the exchange rates.
| e) | Joint Trading Account – The Fund may invest cash balances into a joint trading account that may be invested in one or more repurchase agreements. |
| f) | Fund Share Valuation and Dividend Distributions to Shareholders – Orders for the Fund’s shares are executed in accordance with the investment instructions of the shareholders. The NAV of the Fund’s shares is determined as of the close of business on each business day of the Exchange. The NAV is determined separately for each class of shares of the Fund by dividing the Fund’s net assets attributable to that class by the number of shares of the class outstanding. Each class of shares offered by the Fund has equal rights as to assets and voting privileges (except that shareholders of a class have exclusive voting rights regarding any matter relating solely to that class of shares). Income and non-class specific expenses are allocated daily to each class on the basis of the relative net assets of the class. Realized and unrealized gains and losses are allocated daily based on the relative net assets of each class of shares of the Fund. |
Orders for the purchase of the Fund’s shares received prior to the close of the Exchange on any day the Exchange is open for business are priced at the NAV determined as of the close of the Exchange. Orders received after the close of the Exchange, or on a day on which the Exchange and/or the Fund is not open for business, are priced at the next determined NAV.
Dividends are declared pursuant to a policy adopted by the Company’s Board of Directors based upon the investment performance of the Fund. The policy of the Fund is to pay dividends from net investment income and realized gains, if any, at least once a year.
Distributions from net investment income, net realized gains and capital are determined in accordance with federal income tax regulations, which may differ from U.S. GAAP with respect to character and timing. These differences may include but are not limited to losses deferred due to wash sale adjustments, foreign currency gains and losses, adjustments related to Passive Foreign Investment Companies (“PFICs”), Real Estate Investment Trusts (“REITs”), Regulated Investment Companies (“RICs”), certain derivatives and partnerships. Permanent book and federal income tax basis differences relating to shareholder distributions will result in reclassifications to certain of the Fund’s capital accounts (see Federal Income Taxes: Reclassification of Capital Accounts note).
| 3. | Securities and Other Investments: |
| a) | Repurchase Agreements – A repurchase agreement is an agreement by which a counterparty agrees to sell an investment and agrees to repurchase the investment sold from the buyer at a mutually agreed upon time and price. During the period of the repurchase agreement, the counterparty will deposit cash and or securities in a third party custodial account to serve as collateral. At the time the Fund enters into a repurchase agreement, the value of the underlying collateral, including accrued interest, will be equal to or exceed the value of the repurchase agreement. Repurchase agreements expose the Fund to counterparty risk - that is, the risk that the counterparty will not fulfill its obligations. To minimize counterparty risk, the investments that serve to collateralize the repurchase agreement are held by the Fund’s custodian in book entry or physical form in the custodial account of the Fund or in a third party custodial account. Repurchase agreements are valued at cost plus accrued interest, which approximates fair value. The Fund, as shown on the Schedule of Investments, had outstanding repurchase agreements as of October 31, 2013. |
| b) | Illiquid and Restricted Investments – The Fund is permitted to invest up to 15% of its net assets in illiquid investments. Illiquid investments are those that may not be sold or disposed of in the ordinary course of business within seven days, at approximately the price used to determine the Fund’s NAV. The Fund may not be able to sell illiquid investments when its sub-adviser considers it desirable to do so or may have to sell such investments at a price that is lower than the price that could be obtained if the investments were more liquid. A sale of illiquid investments may require more time and may result in higher dealer discounts and other selling expenses than does the sale of those that are liquid. Illiquid investments also may be more difficult to value due to the unavailability of reliable market quotations for such investments, and an investment in them may have an adverse impact on the Fund’s NAV. The Fund may also purchase certain restricted investments that can only be resold to certain qualified investors and may be determined to be liquid pursuant to policies and guidelines established by the Company’s Board of Directors. The Fund, as shown on the Schedule of Investments, had illiquid and/or restricted investments as of October 31, 2013. |
| c) | Investments Purchased on a When-Issued or Delayed-Delivery Basis – Delivery and payment for investments that have been purchased by the Fund on a forward commitment, or when-issued or delayed-delivery basis, take place beyond the customary settlement period. A fund may dispose of or renegotiate a delayed-delivery transaction after it is entered into, and may sell delayed-delivery investments before they are delivered, which may result in a realized gain or loss. During this period, such investments are subject to market fluctuations, and the Fund identifies investments segregated in its records with a value at least equal to the amount of the commitment. As of October 31, 2013, the Fund had no outstanding when-issued or delayed-delivery investments. |
| 4. | Financial Derivative Instruments: |
The following disclosures contain information on how and why the Fund uses derivative instruments, the credit-risk-related contingent features in certain derivative instruments, and how derivative instruments affect the Fund’s financial position and results of operations. The location and fair value amounts of these instruments on the Statement of Assets and Liabilities and the realized gains and losses and changes in unrealized gains and losses on the Statement of Operations, each categorized by type of derivative contract, are included in the following Additional Derivative Instrument Information footnote. The derivative instruments outstanding as of year-end are disclosed in the notes to or within the Schedule of Investments for purchased options, if applicable. The amounts of realized gains and losses and changes in unrealized gains and losses on derivative instruments during the year are disclosed in the Statement of Operations.
| a) | Foreign Currency Contracts – The Fund may enter into foreign currency contracts that obligate the Fund to purchase or sell currencies at specified future dates. Foreign currency contracts are used to hedge the currency exposure associated with some or all of the Fund’s investments and/or as part of an investment strategy. Foreign currency contracts are marked to market daily and the change in value is recorded by the Fund as an unrealized gain or loss. The Fund will record a realized gain or loss when the foreign currency contract is settled. |
Foreign currency contracts involve elements of market risk in excess of the amounts reflected in the Statement of Assets and Liabilities. In addition, risks may arise upon entering into these contracts from the potential inability of the counterparties to meet the terms of the contracts and from unanticipated movements in the value of the foreign currencies relative to the U.S. dollar. The Fund had outstanding foreign currency contracts as shown on the Schedule of Investments as of October 31, 2013.
| The Hartford Value Opportunities Fund |
| Notes to Financial Statements |
| October 31, 2013 |
| (000’s Omitted) |
| b) | Additional Derivative Instrument Information: |
Fair Value of Derivative Instruments on the Statement of Assets and Liabilities as of October 31, 2013:
| | | Risk Exposure Category | |
| | | Interest Rate
Contracts | | | Foreign
Exchange
Contracts | | | Credit
Contracts | | | Equity
Contracts | | | Commodity
Contracts | | | Other
Contracts | | | Total | |
| Assets: | | | | | | | | | | | | | | | | | | | | | | | | | | | | |
| Unrealized appreciation on foreign currency contracts | | $ | — | | | $ | — | | | $ | — | | | $ | — | | | $ | — | | | $ | — | | | $ | — | |
| Total | | $ | — | | | $ | — | | | $ | — | | | $ | — | | | $ | — | | | $ | — | | | $ | — | |
| | | | | | | | | | | | | | | | | | | | | | | | | | | | | |
| Liabilities: | | | | | | | | | | | | | | | | | | | | | | | | | | | | |
| Unrealized depreciation on foreign currency contracts | | $ | — | | | $ | — | | | $ | — | | | $ | — | | | $ | — | | | $ | — | | | $ | — | |
| Total | | $ | — | | | $ | — | | | $ | — | | | $ | — | | | $ | — | | | $ | — | | | $ | — | |
The volume of derivative activity was minimal during the year ended October 31, 2013.
The Effect of Derivative Instruments on the Statement of Operations for the year ended October 31, 2013:
| | | Risk Exposure Category | |
| | | Interest Rate
Contracts | | | Foreign
Exchange
Contracts | | | Credit
Contracts | | | Equity
Contracts | | | Commodity
Contracts | | | Other
Contracts | | | Total | |
| Realized Loss on Derivatives Recognized as a Result of Operations: |
| Net realized loss on foreign currency contracts | | $ | — | | | $ | (47 | ) | | $ | — | | | $ | — | | | $ | — | | | $ | — | | | $ | (47 | ) |
| Total | | $ | — | | | $ | (47 | ) | | $ | — | | | $ | — | | | $ | — | | | $ | — | | | $ | (47 | ) |
| | | | | | | | | | | | | | | | | | | | | | | | | | | | | |
| Net Change in Unrealized Appreciation (Depreciation) on Derivatives Recognized as a Result of Operations: |
| Net change in unrealized appreciation of foreign currency contracts | | $ | — | | | $ | — | | | $ | — | | | $ | — | | | $ | — | | | $ | — | | | $ | — | |
| Total | | $ | — | | | $ | — | | | $ | — | | | $ | — | | | $ | — | | | $ | — | | | $ | — | |
The Fund may be exposed to counterparty risk, or the risk that an institution or other entity with which the Fund has unsettled or open transactions will default.
If the Fund invests directly in foreign currencies or in securities that trade in, and receive revenues in, foreign currencies, or in derivatives that provide exposure to foreign currencies, it will be subject to the risk that those currencies will decline in value relative to the base currency of the Fund, or, in the case of hedging positions, that the Fund’s base currency will decline in value relative to the currency being hedged. Currency rates in foreign countries may fluctuate significantly over short periods of time for a number of reasons, including changes in interest rates, intervention (or the failure to intervene) by U.S. or foreign governments, central banks or supranational entities, such as the International Monetary Fund, or by the imposition of currency controls or other political developments in the United States or abroad. As a result, the Fund’s investments in foreign currency denominated securities may reduce the returns of the Fund. The market values of equity securities, such as common stocks and preferred stocks, or equity related investments, such as futures and options, may decline due to general market conditions which are not specifically related to a particular company, such as real or perceived adverse economic conditions, changes in the general outlook for corporate earnings, changes in interest or currency rates or adverse investor sentiment generally. The market value of equity securities may also decline due to factors which affect a particular industry or industries, such as labor shortages or increased production costs and competitive conditions within an industry. Equity securities and equity related investments generally have greater market price volatility than fixed income securities.
| a) | Federal Income Taxes – For federal income tax purposes, the Fund intends to continue to qualify as a RIC under Subchapter M of the Internal Revenue Code (“IRC”) by distributing substantially all of its taxable net investment income and net realized capital gains to its shareholders and otherwise complying with the requirements of the IRC. The Fund has distributed substantially all of its income and capital gains in prior years, if applicable, and intends to distribute substantially all of its income and capital gains during the calendar year ending December 31, 2013. Accordingly, no provision for federal income or excise taxes has been made in the accompanying financial statements. Distributions from short-term capital gains are treated as ordinary income distributions for federal income tax purposes. |
| b) | Net Investment Income (Loss), Net Realized Gains (Losses) and Distributions – Net investment income (loss) and net realized gains (losses) may differ for financial statement and tax purposes primarily because of losses deferred due to wash sale adjustments, foreign currency gains and losses, adjustments related to PFICs, REITs, RICs, certain derivatives and partnerships. The character of distributions made during the year from net investment income or net realized gains may differ from their ultimate characterization for federal income tax purposes. Also, due to the timing of dividend distributions, the fiscal year in which amounts are distributed may differ from the year that the income or realized gains (losses) were recorded by the Fund. |
| c) | Distributions and Components of Distributable Earnings – The tax character of distributions paid by the Fund for the periods indicated is as follows (as adjusted for dividends payable, if applicable): |
| | | For the Year Ended
October 31, 2013 | | | For the Year Ended
October 31, 2012 | |
| Ordinary Income | | $ | 1,625 | | | $ | 1,366 | |
As of October 31, 2013, the Fund’s components of distributable earnings (deficit) on a tax basis were as follows:
| | | Amount | |
| Undistributed Ordinary Income | | $ | 666 | |
| Accumulated Capital Losses * | | | (34,557 | ) |
| Unrealized Appreciation † | | | 19,192 | |
| Total Accumulated Deficit | | $ | (14,699 | ) |
| * | The Fund has capital loss carryforwards that are identified in the Capital Loss Carryforward note that follows. |
| † | Differences between book-basis and tax-basis unrealized appreciation (depreciation) may be attributable to the losses deferred due to wash sale adjustments, foreign currency gains and losses, adjustments related to PFICs, REITs, RICs, certain derivatives and partnerships. |
| d) | Reclassification of Capital Accounts – The Fund may record reclassifications in its capital accounts. These reclassifications have no impact on the total net assets of the Fund. The reclassifications are a result of permanent differences between U.S. GAAP and tax accounting for such items as foreign currency, PFICs, expiration or utilization of capital loss carryforwards or net operating losses. Adjustments are made to reflect the impact these items have on current and future distributions to shareholders. Therefore, the source of the Fund’s distributions may be shown in the accompanying Statement of Changes in Net Assets as from undistributed net investment income, from accumulated net realized gains on investments or from capital depending on the type of book and tax differences that exist. For the year ended October 31, 2013, the Fund recorded reclassifications to increase (decrease) the accounts listed below: |
| | | Amount | |
| Undistributed Net Investment Income | | $ | (137 | ) |
| Accumulated Net Realized Gain (Loss) | | | 137 | |
| The Hartford Value Opportunities Fund |
| Notes to Financial Statements |
| October 31, 2013 |
| (000’s Omitted) |
| e) | Capital Loss Carryforward – On December 22, 2010, the Regulated Investment Company Modernization Act of 2010 (the “Act”) was enacted, which made changes to the capital loss carryforward rules. The changes are effective for taxable years beginning after the date of enactment. Under the Act, funds are permitted to carry forward capital losses for an unlimited period. However, any losses incurred during those future taxable years will be required to be utilized prior to the losses incurred in pre-enactment taxable years, which carry an expiration date. As a result of this ordering rule, pre-enactment capital loss carryforwards may be more likely to expire unused. Additionally, post-enactment capital loss carryforwards retain their character as either short-term or long-term capital losses rather than being considered all short-term as permitted under prior regulation. |
At October 31, 2013 (tax-year-end), the Fund had capital loss carryforwards for U.S. federal income tax purposes as follows:
| Year of Expiration | | Amount | |
| 2017 | | $ | 34,557 | |
| Total | | $ | 34,557 | |
During the year ended October 31, 2013, the Fund utilized $16,241 of prior year capital loss carryforwards.
| f) | Accounting for Uncertainty in Income Taxes – The Fund has adopted financial reporting rules that require the Fund to analyze all open tax years, as defined by the statute of limitations, for all major jurisdictions. Generally, tax authorities can examine all tax returns filed for the last three years. The Fund does not have an examination in progress. |
The Fund has reviewed all open tax years and major jurisdictions and concluded that these financial reporting rules had no effect on the Fund’s financial position or results of operations. There is no tax liability resulting from unrecognized tax benefits relating to uncertain income tax positions taken or expected to be taken on the tax return for the fiscal year ended October 31, 2013. The Fund is also not aware of any tax positions for which it is reasonably possible that the total amounts of unrecognized tax benefits will significantly change in the next twelve months.
| a) | Investment Management Agreement – Effective January 1, 2013, Hartford Funds Management Company, LLC (“HFMC”) replaced Hartford Investment Financial Services, LLC (“HIFSCO”) as the Fund’s investment manager. HFMC and HIFSCO are both indirect wholly owned subsidiaries of The Hartford Financial Services Group, Inc. (“The Hartford”). As of January 1, 2013, HFMC serves as investment manager to the Fund pursuant to an Investment Management Agreement with the Company. For the calendar year ended December 31, 2012, HIFSCO served as the Fund’s investment manager pursuant to a separate agreement between HIFSCO and the Company. The replacement of HIFSCO with HFMC did not result in any change to (i) the contractual terms of, including the fees payable under, the Fund’s investment management agreements; or (ii) the day-to-day management of the Fund. The investment manager has overall investment supervisory responsibility for the Fund. In addition, the investment manager provides administrative personnel, services, equipment, facilities and office space for proper operation of the Fund. HFMC has contracted with Wellington Management Company, LLP (“Wellington Management”) under a sub-advisory agreement for the provision of day-to-day investment management services to the Fund in accordance with the Fund’s investment objective and policies. The Fund pays a fee to the investment manager, a portion of which may be used to compensate Wellington Management. |
The schedule below reflects the rates of compensation paid to the investment manager for investment management services rendered as of October 31, 2013; the rates are accrued daily and paid monthly:
| Average Daily Net Assets | | Annual Fee | |
| On first $100 million | | | 0.8000 | % |
| On next $150 million | | | 0.7500 | % |
| On next $4.75 billion | | | 0.7000 | % |
| On next $5 billion | | | 0.6975 | % |
| Over $10 billion | | | 0.6950 | % |
| b) | Accounting Services Agreement – Effective January 1, 2013, HFMC replaced Hartford Life Insurance Company (“HLIC”) as provider of accounting services to the Fund. HLIC provided accounting services for the Fund for the calendar year ended December 31, 2012. The replacement of HLIC with HFMC did not result in any changes to the fund accounting services provided to the Fund or the fees charged to the Fund for such services. Pursuant to the Fund Accounting Agreement between HFMC and the Company, on behalf of the Fund, HFMC provides accounting services to the Fund and receives monthly compensation based on the Fund’s average daily net assets at the rates set forth below. The Fund’s accounting services fees are accrued daily and paid monthly. |
| Average Daily Net Assets | | Annual Fee | |
| On first $5 billion | | | 0.014 | % |
| On next $5 billion | | | 0.012 | % |
| Over $10 billion | | | 0.010 | % |
| c) | Operating Expenses – Allocable expenses incurred by the Company are allocated to each Fund and allocated to classes within the Fund in proportion to the average daily net assets of the Fund and each class, except where allocation of certain expenses is more fairly made directly to the Fund or to specific classes within a Fund. As of October 31, 2013, HFMC contractually limited the total operating expenses of this Fund, exclusive of taxes, interest expense, brokerage commissions, acquired fund fees and expenses and extraordinary expenses, through February 28, 2014 as follows: |
| Class A | | | Class B | | | Class C | | | Class I | | | Class R3 | | | Class R4 | | | Class R5 | | | Class Y | |
| | 1.35% | | | | 2.10% | | | | 2.10% | | | | 1.10% | | | | 1.55% | | | | 1.25% | | | | 0.95% | | | | 0.90% | |
| d) | Fees Paid Indirectly – The Fund has entered into agreements with State Street Global Markets, LLC and Russell Implementation Services, Inc. to partially recapture non-discounted trade commissions. Such rebates are used to pay a portion of the Fund’s expenses. In addition, the Fund’s custodian bank has agreed to reduce its fees when the Fund maintains cash on deposit in a non-interest-bearing custody account. For the year ended October 31, 2013, these amounts, if any, are included in the Statement of Operations. |
The ratio of expenses to average net assets in the accompanying financial highlights excludes the reduction in expenses related to fees paid indirectly. The annualized expense ratio after waivers for the period listed below reflecting the reduction for fees paid indirectly is as follows:
| | | Year Ended
October 31, 2013 | |
| Class A | | | 1.35 | % |
| Class B | | | 2.10 | |
| Class C | | | 2.10 | |
| Class I | | | 1.06 | |
| Class R3 | | | 1.55 | |
| Class R4 | | | 1.25 | |
| Class R5 | | | 0.95 | |
| Class Y | | | 0.90 | |
| The Hartford Value Opportunities Fund |
| Notes to Financial Statements |
| October 31, 2013 |
| (000’s Omitted) |
| e) | Distribution and Service Plan for Class A, B, C, R3 and R4 Shares – Effective June 14, 2013, HIFSCO was renamed Hartford Funds Distributors, LLC (“HFD”). HFD is the principal underwriter and distributor of the Fund. HFD is engaged in distribution activities, which include marketing and distribution of shares through broker/dealers, financing distribution costs and maintaining financial books and records. For the year ended October 31, 2013, HFD received front-end load sales charges of $411 and contingent deferred sales charges of $2 from the Fund. |
The Fund has adopted a Distribution and Service Plan in accordance with Rule 12b-1 of the 1940 Act to compensate the distributor (HFD) for activities intended to result in the sale and distribution of Class A, B, C, R3 and R4 shares and for providing services for shareholders. The Rule 12b-1 plan applicable to Class A shares of the Fund provides for payment of a Rule 12b-1 fee of 0.25% of average daily net assets. Some or all of the fee may be used for shareholder servicing expenses with the remainder used for distribution expenses. Some or the entire Rule 12b-1 fee for Class B shares may be remitted to broker/dealers for distribution and/or shareholder account services. Under the Class B Plan, the Fund pays the distributor 1.00% of the average daily net assets of Class B shares that are outstanding for 8 years or less, 0.25% of which is a fee for services provided to existing shareholders with the remainder used for distribution expenses. After eight years, Class B shares convert to Class A shares. Upon conversion to Class A shares, the Class A plan described above will apply to those shares. Under the Class C Plan, the Fund pays the distributor 1.00% of the average daily net assets of Class C shares outstanding, 0.25% of which is intended as a fee for services provided to existing shareholders with the remainder used for distribution expenses. For Class C shares, some or the entire fee may be remitted to broker/dealers for distribution and/or shareholder account services. Class R3 shares have a distribution fee of 0.50% of average daily net assets and Class R4 shares have a distribution fee of 0.25% of average daily net assets. For Class R3 and R4 shares, some or the entire fee may be remitted to broker/dealers for distribution and/or shareholder account services. The Fund’s 12b-1 fees are accrued daily and paid monthly.
| f) | Other Related Party Transactions – Certain officers of the Fund are directors and/or officers of the investment manager and/or The Hartford or its subsidiaries. For the year ended October 31, 2013, a portion of the Fund’s Chief Compliance Officer’s compensation was paid by all of the investment companies in the Hartford fund complex. The portion allocated to the Fund rounds to zero. Hartford Administrative Services Company (“HASCO”), an indirect wholly-owned subsidiary of The Hartford, provides transfer agent services to the Fund. HASCO has contractually agreed to reimburse any portion of the transfer agency fees over 0.30% of average daily net assets per fiscal year for each class. For providing such services, HASCO is compensated on a per account basis that varies by account type, except with respect to Class Y, for which it is compensated based on average daily net assets. The amount paid to HASCO and any related contractual reimbursement amounts, if applicable, can be found in the Statement of Operations. These fees are accrued daily and paid monthly. |
Administrative services fees are paid to HASCO for third-party recordkeeping services that are payable as a percentage of net assets in the amount of 0.20%, 0.15% and 0.10% for Classes R3, R4 and R5 shares, respectively. The total administrative services fees are shown on the Statement of Operations. These fees are accrued daily and paid monthly.
As of October 31, 2013, affiliates of The Hartford had ownership of shares in the Fund as follows:
| | | Percentage
of Class | |
| Class Y | | | 8 | % |
| 9. | Investment Transactions: |
For the year ended October 31, 2013, the Fund's aggregate purchases and sales of investment securities (excluding short-term investments) were as follows:
| | | Amount | |
| Cost of Purchases Excluding U.S. Government Obligations | | $ | 109,155 | |
| Sales Proceeds Excluding U.S. Government Obligations | | | 103,469 | |
| 10. | Capital Share Transactions: |
The following information is for the year ended October 31, 2013, and the year ended October 31, 2012:
| | | For the Year Ended October 31, 2013 | | | For the Year Ended October 31, 2012 | |
| | | Shares Sold | | | Shares Issued
for Reinvested
Dividends | | | Shares
Redeemed | | | Net Increase
(Decrease) of
Shares | | | Shares Sold | | | Shares Issued
for Reinvested
Dividends | | | Shares
Redeemed | | | Net Increase
(Decrease) of
Shares | |
| Class A | | | | | | | | | | | | | | | | | | | | | | | | | | | | | | | | |
| Shares | | | 1,637 | | | | 88 | | | | (1,422 | ) | | | 303 | | | | 822 | | | | 60 | | | | (1,551 | ) | | | (669 | ) |
| Amount | | $ | 27,591 | | | $ | 1,287 | | | $ | (22,902 | ) | | $ | 5,976 | | | $ | 10,943 | | | $ | 748 | | | $ | (20,574 | ) | | $ | (8,883 | ) |
| Class B | | | | | | | | | | | | | | | | | | | | | | | | | | | | | | | | |
| Shares | | | 20 | | | | 3 | | | | (139 | ) | | | (116 | ) | | | 18 | | | | 1 | | | | (184 | ) | | | (165 | ) |
| Amount | | $ | 293 | | | $ | 34 | | | $ | (2,036 | ) | | $ | (1,709 | ) | | $ | 205 | | | $ | 8 | | | $ | (2,175 | ) | | $ | (1,962 | ) |
| Class C | | | | | | | | | | | | | | | | | | | | | | | | | | | | | | | | |
| Shares | | | 124 | | | | 6 | | | | (162 | ) | | | (32 | ) | | | 59 | | | | 2 | | | | (255 | ) | | | (194 | ) |
| Amount | | $ | 1,880 | | | $ | 74 | | | $ | (2,315 | ) | | $ | (361 | ) | | $ | 711 | | | $ | 23 | | | $ | (3,045 | ) | | $ | (2,311 | ) |
| Class I | | | | | | | | | | | | | | | | | | | | | | | | | | | | | | | | |
| Shares | | | 349 | | | | 4 | | | | (205 | ) | | | 148 | | | | 169 | | | | 3 | | | | (86 | ) | | | 86 | |
| Amount | | $ | 5,522 | | | $ | 57 | | | $ | (3,222 | ) | | $ | 2,357 | | | $ | 2,211 | | | $ | 40 | | | $ | (1,133 | ) | | $ | 1,118 | |
| Class R3 | | | | | | | | | | | | | | | | | | | | | | | | | | | | | | | | |
| Shares | | | 59 | | | | 1 | | | | (82 | ) | | | (22 | ) | | | 48 | | | | — | | | | (19 | ) | | | 29 | |
| Amount | | $ | 960 | | | $ | 13 | | | $ | (1,253 | ) | | $ | (280 | ) | | $ | 618 | | | $ | 8 | | | $ | (268 | ) | | $ | 358 | |
| Class R4 | | | | | | | | | | | | | | | | | | | | | | | | | | | | | | | | |
| Shares | | | 97 | | | | 6 | | | | (135 | ) | | | (32 | ) | | | 95 | | | | 5 | | | | (132 | ) | | | (32 | ) |
| Amount | | $ | 1,618 | | | $ | 93 | | | $ | (2,229 | ) | | $ | (518 | ) | | $ | 1,262 | | | $ | 63 | | | $ | (1,836 | ) | | $ | (511 | ) |
| Class R5 | | | | | | | | | | | | | | | | | | | | | | | | | | | | | | | | |
| Shares | | | 34 | | | | 2 | | | | (24 | ) | | | 12 | | | | 80 | | | | — | | | | (7 | ) | | | 73 | |
| Amount | | $ | 556 | | | $ | 22 | | | $ | (373 | ) | | $ | 205 | | | $ | 1,137 | | | $ | 3 | | | $ | (101 | ) | | $ | 1,039 | |
| Class Y | | | | | | | | | | | | | | | | | | | | | | | | | | | | | | | | |
| Shares | | | 90 | | | | 1 | | | | (105 | ) | | | (14 | ) | | | 175 | | | | 35 | | | | (2,756 | ) | | | (2,546 | ) |
| Amount | | $ | 1,576 | | | $ | 18 | | | $ | (1,832 | ) | | $ | (238 | ) | | $ | 2,407 | | | $ | 445 | | | $ | (36,362 | ) | | $ | (33,510 | ) |
| Total | | | | | | | | | | | | | | | | | | | | | | | | | | | | | | | | |
| Shares | | | 2,410 | | | | 111 | | | | (2,274 | ) | | | 247 | | | | 1,466 | | | | 106 | | | | (4,990 | ) | | | (3,418 | ) |
| Amount | | $ | 39,996 | | | $ | 1,598 | | | $ | (36,162 | ) | | $ | 5,432 | | | $ | 19,494 | | | $ | 1,338 | | | $ | (65,494 | ) | | $ | (44,662 | ) |
The following reflects the conversion of Class B shares into Class A shares (reflected as Class A shares sold) for the year ended October 31, 2013, and the year ended October 31, 2012:
| | | Shares | | | Dollars | |
| For the Year Ended October 31, 2013 | | | 43 | | | $ | 709 | |
| For the Year Ended October 31, 2012 | | | 32 | | | $ | 429 | |
| The Hartford Value Opportunities Fund |
| Notes to Financial Statements |
| October 31, 2013 |
| (000’s Omitted) |
The Fund is one of several Hartford funds that participate in a $500 million committed revolving line of credit facility. The facility is to be used for temporary or emergency purposes. Under the arrangement, the funds are required to own securities having a market value in excess of 300% of the total bank borrowings. The interest rate on borrowings varies depending on the nature of the loan. The facility also requires a fee to be paid based on the amount of the commitment. This commitment fee is allocated to all of the funds participating in the line of credit based on the average net assets of the funds. During the year ended October 31, 2013, the Fund did not have any borrowings under this facility.
| 12. | Industry Classifications: |
Other than the industry classifications “Other Investment Pools and Funds” and “Exchange Traded Funds,” equity industry classifications used in this report are the Global Industry Classification Standard, which was developed by and is the exclusive property and service mark of MSCI, Inc. and Standard & Poor’s.
| 13. | Pending Legal Proceedings: |
On February 25, 2011, Jennifer L. Kasilag, Louis Mellinger, Judith M. Menendez, Jacqueline M. Robinson, and Linda A. Russell filed a derivative lawsuit against Hartford Investment Financial Services, LLC (“HIFSCO”)(now known as Hartford Funds Distributors, LLC) on behalf of six Hartford retail mutual funds in the United States District Court for the District of New Jersey, alleging that HIFSCO received excessive advisory and distribution fees in violation of its statutory fiduciary duty under Section 36(b) of the 1940 Act when serving as investment manager and principal underwriter, respectively, to the Hartford retail mutual funds. HIFSCO moved to dismiss and, in September 2011, the motion was granted in part and denied in part, with leave to amend the complaint. In November 2011, plaintiffs filed an amended complaint on behalf of certain Hartford retail mutual funds, The Hartford Global Health Fund (now known as The Hartford Healthcare Fund), The Hartford Conservative Allocation Fund, The Hartford Growth Opportunities Fund, The Hartford Inflation Plus Fund, The Hartford Advisers Fund (now known as The Hartford Balanced Fund), and The Hartford Capital Appreciation Fund. Plaintiffs seek to rescind the investment management agreements and distribution plans between HIFSCO and these funds and to recover the total fees charged thereunder or, in the alternative, to recover any improper compensation HIFSCO received, in addition to lost earnings. HIFSCO filed a partial motion to dismiss the amended complaint and, in December 2012, the court dismissed without prejudice the claims regarding distribution fees and denied the motion with respect to the advisory fees claims. HIFSCO disputes the allegations and intends to defend the advisory fee claims vigorously.
Although this action was purportedly filed on behalf of certain of the Hartford Funds, none of the Hartford Funds is itself a defendant to the suit. For this reason, no accrual for litigation relating to this matter has been recorded in the financial statements of the Fund.
Under the Company’s organizational documents, the Company shall indemnify its officers and directors to the full extent required or permitted under Maryland General Corporation Law and the federal securities laws. In addition, the Company, on behalf of the Fund, may enter into contracts that contain a variety of indemnifications. The Company’s maximum exposure under these arrangements is unknown. However, as of the date of these financial statements, the Company has not had prior claims or losses pursuant to these contracts and expects the risk of loss to be remote.
| 15. | Recent Accounting Pronouncement: |
In January 2013, the Financial Accounting Standards Board (FASB) issued Accounting Standards Update (ASU) No. 2013-01, Clarifying the Scope of Disclosures about Offsetting Assets and Liabilities, which clarified ASU No. 2011-11, Disclosures about Offsetting Assets and Liabilities. The objective of ASU 2013-01 is to enhance disclosure requirements on the offsetting of financial assets and liabilities. ASU 2013-01 limits the scope of the new balance sheet offsetting disclosures to derivatives, repurchase agreements and securities lending transactions to the extent that they are (1) offset in the financial statements or (2) subject to an enforceable master netting arrangement or similar agreement. The effective date of ASU 2013-01 is for annual periods beginning on or after January 1, 2013 and interim periods within those annual periods. At this time, management is evaluating the implications of this guidance and the impact it will have on the Fund’s financial statements and footnote disclosures, if any.
At a meeting held on December 13, 2013, the Board of Directors of The Hartford Mutual Funds, Inc. and The Hartford Mutual Funds II, Inc. approved an Agreement and Plan of Reorganization relating to the reorganization of The Hartford Value Fund, a series of The Hartford Mutual Funds, Inc., into the Fund, a series of The Hartford Mutual Funds II, Inc. The Reorganization does not require shareholder approval. The Reorganization is expected to occur on or about April 7, 2014.
| The Hartford Value Opportunities Fund |
| Financial Highlights |
| | | - Selected Per-Share Data - (A) | | | - Ratios and Supplemental Data - | |
| Class | | Net Asset
Value at
Beginning
of Period | | | Net
Investment
Income
(Loss) | | | Net
Realized
and
Unrealized
Gain
(Loss) on
Invest-
ments | | | Total from
Investment
Operations | | | Dividends
from Net
Investment
Income | | | Distribu-
tions
from
Realized
Capital
Gains | | | Total
Dividends
and
Distributions | | | Net Asset
Value at
End of
Period | | | Total
Return(B) | | | Net
Assets at
End of
Period
(000's) | | | Ratio of
Expenses
to
Average
Net
Assets
Before
Adjust-
ments(C) | | | Ratio of
Expenses
to
Average
Net
Assets
After
Adjust-
ments(C) | | | Ratio of
Net
Investment
Income to
Average
Net Assets | |
| | | | | | | | | | | | | | | | | | | | | | | | | | | | | | | | | | | | | | | | |
| For the Year Ended October 31, 2013 |
| A | | $ | 14.02 | | | $ | 0.11 | | | $ | 4.40 | | | $ | 4.51 | | | $ | (0.22 | ) | | $ | – | | | $ | (0.22 | ) | | $ | 18.31 | | | | 32.53 | % | | $ | 118,203 | | | | 1.44 | % | | | 1.35 | % | | | 0.67 | % |
| B | | | 12.54 | | | | – | | | | 3.93 | | | | 3.93 | | | | (0.11 | ) | | | – | | | | (0.11 | ) | | | 16.36 | | | | 31.50 | | | | 3,825 | | | | 2.39 | | | | 2.10 | | | | (0.03 | ) |
| C | | | 12.49 | | | | (0.01 | ) | | | 3.93 | | | | 3.92 | | | | (0.12 | ) | | | – | | | | (0.12 | ) | | | 16.29 | | | | 31.59 | | | | 11,059 | | | | 2.13 | | | | 2.10 | | | | (0.07 | ) |
| I | | | 13.87 | | | | 0.16 | | | | 4.34 | | | | 4.50 | | | | (0.25 | ) | | | – | | | | (0.25 | ) | | | 18.12 | | | | 32.93 | | | | 7,908 | | | | 1.07 | | | | 1.06 | | | | 0.95 | |
| R3 | | | 14.16 | | | | 0.08 | | | | 4.45 | | | | 4.53 | | | | (0.19 | ) | | | – | | | | (0.19 | ) | | | 18.50 | | | | 32.31 | | | | 1,480 | | | | 1.68 | | | | 1.55 | | | | 0.49 | |
| R4 | | | 14.27 | | | | 0.13 | | | | 4.47 | | | | 4.60 | | | | (0.23 | ) | | | – | | | | (0.23 | ) | | | 18.64 | | | | 32.62 | | | | 7,271 | | | | 1.32 | | | | 1.25 | | | | 0.78 | |
| R5 | | | 14.36 | | | | 0.18 | | | | 4.50 | | | | 4.68 | | | | (0.28 | ) | | | – | | | | (0.28 | ) | | | 18.76 | | | | 33.06 | | | | 1,909 | | | | 1.02 | | | | 0.95 | | | | 1.08 | |
| Y | | | 14.41 | | | | 0.19 | | | | 4.50 | | | | 4.69 | | | | (0.28 | ) | | | – | | | | (0.28 | ) | | | 18.82 | | | | 33.06 | | | | 1,149 | | | | 0.91 | | | | 0.90 | | | | 1.17 | |
| | | | | | | | | | | | | | | | | | | | | | | | | | | | | | | | | | | | | | | | | | | | | | | | | | | | | |
| For the Year Ended October 31, 2012 |
| A | | $ | 12.68 | | | $ | 0.19 | | | $ | 1.27 | | | $ | 1.46 | | | $ | (0.12 | ) | | $ | – | | | $ | (0.12 | ) | | $ | 14.02 | | | | 11.60 | % | | $ | 86,261 | | | | 1.50 | % | | | 1.35 | % | | | 1.44 | % |
| B | | | 11.33 | | | | 0.08 | | | | 1.15 | | | | 1.23 | | | | (0.02 | ) | | | – | | | | (0.02 | ) | | | 12.54 | | | | 10.85 | | | | 4,388 | | | | 2.44 | | | | 2.10 | | | | 0.65 | |
| C | | | 11.31 | | | | 0.08 | | | | 1.13 | | | | 1.21 | | | | (0.03 | ) | | | – | | | | (0.03 | ) | | | 12.49 | | | | 10.74 | | | | 8,880 | | | | 2.17 | | | | 2.10 | | | | 0.67 | |
| I | | | 12.57 | | | | 0.22 | | | | 1.25 | | | | 1.47 | | | | (0.17 | ) | | | – | | | | (0.17 | ) | | | 13.87 | | | | 11.87 | | | | 3,995 | | | | 1.11 | | | | 1.09 | | | | 1.70 | |
| R3 | | | 12.81 | | | | 0.18 | | | | 1.27 | | | | 1.45 | | | | (0.10 | ) | | | – | | | | (0.10 | ) | | | 14.16 | | | | 11.38 | | | | 1,443 | | | | 1.70 | | | | 1.55 | | | | 1.31 | |
| R4 | | | 12.90 | | | | 0.21 | | | | 1.30 | | | | 1.51 | | | | (0.14 | ) | | | – | | | | (0.14 | ) | | | 14.27 | | | | 11.81 | | | | 6,015 | | | | 1.33 | | | | 1.25 | | | | 1.55 | |
| R5 | | | 12.99 | | | | 0.31 | | | | 1.24 | | | | 1.55 | | | | (0.18 | ) | | | – | | | | (0.18 | ) | | | 14.36 | | | | 12.08 | | | | 1,296 | | | | 1.05 | | | | 0.95 | | | | 2.25 | |
| Y | | | 13.05 | | | | 0.24 | | | | 1.30 | | | | 1.54 | | | | (0.18 | ) | | | – | | | | (0.18 | ) | | | 14.41 | | | | 12.00 | | | | 1,076 | | | | 0.92 | | | | 0.90 | | | | 1.77 | |
| | | | | | | | | | | | | | | | | | | | | | | | | | | | | | | | | | | | | | | | | | | | | | | | | | | | | |
| For the Year Ended October 31, 2011 (D) |
| A(E) | | $ | 12.15 | | | $ | 0.09 | | | $ | 0.45 | | | $ | 0.54 | | | $ | (0.01 | ) | | $ | – | | | $ | (0.01 | ) | | $ | 12.68 | | | | 4.41 | % | | $ | 86,456 | | | | 1.46 | % | | | 1.35 | % | | | 0.81 | % |
| B | | | 10.94 | | | | (0.02 | ) | | | 0.41 | | | | 0.39 | | | | – | | | | – | | | | – | | | | 11.33 | | | | 3.56 | | | | 5,838 | | | | 2.39 | | | | 2.10 | | | | (0.10 | ) |
| C | | | 10.91 | | | | (0.01 | ) | | | 0.41 | | | | 0.40 | | | | – | | | | – | | | | – | | | | 11.31 | | | | 3.67 | | | | 10,227 | | | | 2.15 | | | | 2.10 | | | | (0.09 | ) |
| I | | | 12.04 | | | | 0.14 | | | | 0.44 | | | | 0.58 | | | | (0.05 | ) | | | – | | | | (0.05 | ) | | | 12.57 | | | | 4.80 | | | | 2,535 | | | | 1.03 | | | | 1.01 | | | | 1.06 | |
| R3 | | | 12.30 | | | | 0.07 | | | | 0.44 | | | | 0.51 | | | | – | | | | – | | | | – | | | | 12.81 | | | | 4.15 | | | | 934 | | | | 1.68 | | | | 1.55 | | | | 0.45 | |
| R4 | | | 12.37 | | | | 0.10 | | | | 0.45 | | | | 0.55 | | | | (0.02 | ) | | | – | | | | (0.02 | ) | | | 12.90 | | | | 4.47 | | | | 5,865 | | | | 1.31 | | | | 1.25 | | | | 0.75 | |
| R5 | | | 12.45 | | | | 0.13 | | | | 0.47 | | | | 0.60 | | | | (0.06 | ) | | | – | | | | (0.06 | ) | | | 12.99 | | | | 4.81 | | | | 221 | | | | 1.05 | | | | 0.95 | | | | 1.04 | |
| Y | | | 12.51 | | | | 0.14 | | | | 0.47 | | | | 0.61 | | | | (0.07 | ) | | | – | | | | (0.07 | ) | | | 13.05 | | | | 4.82 | | | | 34,210 | | | | 0.91 | | | | 0.90 | | | | 1.08 | |
| | | | | | | | | | | | | | | | | | | | | | | | | | | | | | | | | | | | | | | | | | | | | | | | | | | | | |
| For the Year Ended October 31, 2010 |
| A | | $ | 10.19 | | | $ | 0.04 | | | $ | 1.97 | | | $ | 2.01 | | | $ | (0.05 | ) | | $ | – | | | $ | (0.05 | ) | | $ | 12.15 | | | | 19.78 | % | | $ | 69,397 | | | | 1.46 | % | | | 1.35 | % | | | 0.34 | % |
| B | | | 9.21 | | | | (0.04 | ) | | | 1.78 | | | | 1.74 | | | | (0.01 | ) | | | – | | | | (0.01 | ) | | | 10.94 | | | | 18.89 | | | | 7,069 | | | | 2.42 | | | | 2.10 | | | | (0.40 | ) |
| C | | | 9.18 | | | | (0.04 | ) | | | 1.77 | | | | 1.73 | | | | – | | | | – | | | | – | | | | 10.91 | | | | 18.85 | | | | 10,954 | | | | 2.18 | | | | 2.10 | | | | (0.41 | ) |
| I | | | 10.09 | | | | 0.07 | | | | 1.94 | | | | 2.01 | | | | (0.06 | ) | | | – | | | | (0.06 | ) | | | 12.04 | | | | 20.00 | | | | 1,494 | | | | 1.05 | | | | 1.05 | | | | 0.64 | |
| R3 | | | 10.30 | | | | 0.01 | | | | 2.00 | | | | 2.01 | | | | (0.01 | ) | | | – | | | | (0.01 | ) | | | 12.30 | | | | 19.56 | | | | 1,021 | | | | 1.67 | | | | 1.58 | | | | 0.10 | |
| R4 | | | 10.37 | | | | 0.05 | | | | 2.00 | | | | 2.05 | | | | (0.05 | ) | | | – | | | | (0.05 | ) | | | 12.37 | | | | 19.79 | | | | 5,147 | | | | 1.31 | | | | 1.28 | | | | 0.39 | |
| R5 | | | 10.43 | | | | 0.07 | | | | 2.03 | | | | 2.10 | | | | (0.08 | ) | | | – | | | | (0.08 | ) | | | 12.45 | | | | 20.17 | | | | 154 | | | | 1.07 | | | | 0.98 | | | | 0.65 | |
| Y | | | 10.47 | | | | 0.08 | | | | 2.04 | | | | 2.12 | | | | (0.08 | ) | | | – | | | | (0.08 | ) | | | 12.51 | | | | 20.28 | | | | 29,098 | | | | 0.91 | | | | 0.91 | | | | 0.73 | |
See Portfolio Turnover information on the next page.
| | | - Selected Per-Share Data - (A) | | | - Ratios and Supplemental Data - | |
| Class | | Net Asset
Value at
Beginning
of Period | | | Net
Investment
Income
(Loss) | | | Net
Realized
and
Unrealized
Gain
(Loss) on
Invest-
ments | | | Total from
Investment
Operations | | | Dividends
from Net
Investment
Income | | | Distribu-
tions
from
Realized
Capital
Gains | | | Total
Dividends
and
Distributions | | | Net Asset
Value at
End of
Period | | | Total
Return(B) | | | Net
Assets at
End of
Period
(000's) | | | Ratio of
Expenses
to
Average
Net
Assets
Before
Adjust-
ments(C) | | | Ratio of
Expenses
to
Average
Net
Assets
After
Adjust-
ments(C) | | | Ratio of
Net
Investment
Income to
Average
Net Assets | |
| | | | | | | | | | | | | | | | | | | | | | | | | | | | | | | | | | | | | | | | |
| For the Year Ended October 31, 2009 |
| A | | $ | 8.22 | | | $ | 0.06 | | | $ | 2.06 | | | $ | 2.12 | | | $ | (0.15 | ) | | $ | – | | | $ | (0.15 | ) | | $ | 10.19 | | | | 26.41 | % | | $ | 67,577 | | | | 1.66 | % | | | 1.20 | % | | | 0.67 | % |
| B | | | 7.42 | | | | 0.02 | | | | 1.87 | | | | 1.89 | | | | (0.10 | ) | | | – | | | | (0.10 | ) | | | 9.21 | | | | 25.90 | | | | 7,903 | | | | 2.74 | | | | 1.63 | | | | 0.26 | |
| C | | | 7.38 | | | | (0.01 | ) | | | 1.86 | | | | 1.85 | | | | (0.05 | ) | | | – | | | | (0.05 | ) | | | 9.18 | | | | 25.33 | | | | 10,158 | | | | 2.39 | | | | 1.98 | | | | (0.07 | ) |
| I | | | 8.15 | | | | 0.06 | | | | 2.05 | | | | 2.11 | | | | (0.17 | ) | | | – | | | | (0.17 | ) | | | 10.09 | | | | 26.68 | | | | 1,416 | | | | 1.17 | | | | 1.10 | | | | 0.71 | |
| R3 | | | 8.33 | | | | 0.02 | | | | 2.09 | | | | 2.11 | | | | (0.14 | ) | | | – | | | | (0.14 | ) | | | 10.30 | | | | 25.97 | | | | 784 | | | | 1.78 | | | | 1.60 | | | | 0.28 | |
| R4 | | | 8.39 | | | | 0.04 | | | | 2.11 | | | | 2.15 | | | | (0.17 | ) | | | – | | | | (0.17 | ) | | | 10.37 | | | | 26.38 | | | | 3,551 | | | | 1.36 | | | | 1.30 | | | | 0.50 | |
| R5 | | | 8.44 | | | | 0.07 | | | | 2.12 | | | | 2.19 | | | | (0.20 | ) | | | – | | | | (0.20 | ) | | | 10.43 | | | | 26.77 | | | | 12 | | | | 1.12 | | | | 1.00 | | | | 0.77 | |
| Y | | | 8.48 | | | | 0.11 | | | | 2.08 | | | | 2.19 | | | | (0.20 | ) | | | – | | | | (0.20 | ) | | | 10.47 | | | | 26.76 | | | | 7,195 | | | | 0.96 | | | | 0.96 | | | | 1.20 | |
| (A) | Information presented relates to a share outstanding throughout the indicated period. Net investment income (loss) per share amounts are calculated based on average shares outstanding unless otherwise noted. |
| (B) | Assumes initial investment at net asset value at the beginning of each period, reinvestment of all distributions, the complete redemption of the investment at net asset value at the end of each period and no sales charge. Total return would be reduced if sales charges were taken into account. |
| (C) | Adjustments include waivers and reimbursements, if applicable. Ratios do not include fees paid indirectly (see Expenses in the accompanying Notes to Financial Statements). |
| (D) | Net investment income (loss) per share amounts have been calculated using the SEC method. |
| (E) | Class L was merged into Class A on August 5, 2011. |
| | | Portfolio Turnover
Rate for
All Share Classes | |
| For the Year Ended October 31, 2013 | | | 81 | % |
| For the Year Ended October 31, 2012 | | | 56 | |
| For the Year Ended October 31, 2011 | | | 70 | |
| For the Year Ended October 31, 2010 | | | 87 | |
| For the Year Ended October 31, 2009 | | | 90 | |
| Report of Independent Registered Public Accounting Firm |
| The Board of Directors and Shareholders of |
| The Hartford Mutual Funds II, Inc. |
We have audited the accompanying statement of assets and liabilities, including the schedule of investments, of The Hartford Value Opportunities Fund (one of the portfolios constituting The Hartford Mutual Funds II, Inc. (the Funds)) as of October 31, 2013, and the related statement of operations for the year then ended, the statements of changes in net assets for each of the two years in the period then ended, and the financial highlights for each of the five years in the period then ended. These financial statements and financial highlights are the responsibility of the Funds’ management. Our responsibility is to express an opinion on these financial statements and financial highlights based on our audits.
We conducted our audits in accordance with the standards of the Public Company Accounting Oversight Board (United States). Those standards require that we plan and perform the audit to obtain reasonable assurance about whether the financial statements and financial highlights are free of material misstatement. We were not engaged to perform an audit of the Funds’ internal control over financial reporting. Our audits included consideration of internal control over financial reporting as a basis for designing audit procedures that are appropriate in the circumstances, but not for the purpose of expressing an opinion on the effectiveness of the Funds’ internal control over financial reporting. Accordingly, we express no such opinion. An audit also includes examining, on a test basis, evidence supporting the amounts and disclosures in the financial statements and financial highlights, assessing the accounting principles used and significant estimates made by management, and evaluating the overall financial statement presentation. Our procedures included confirmation of securities owned as of October 31, 2013, by correspondence with the custodian and brokers or by other appropriate auditing procedures where replies from brokers were not received. We believe that our audits provide a reasonable basis for our opinion.
In our opinion, the financial statements and financial highlights referred to above present fairly, in all material respects, the financial position of The Hartford Value Opportunities Fund of The Hartford Mutual Funds II, Inc. at October 31, 2013, the results of its operations for the year then ended, the changes in its net assets for each of the two years in the period then ended, and the financial highlights for each of the five years in the period then ended, in conformity with U.S. generally accepted accounting principles.
| | |
| | |
| Minneapolis, MN | |
| December 18, 2013 | |
| The Hartford Value Opportunities Fund |
| Directors and Officers (Unaudited) |
The Board of Directors of the Company appoints officers who are responsible for the day-to-day operations of the Fund and who execute policies formulated by the Directors. Each director serves until his or her death, resignation, or retirement or until the next annual meeting of shareholders is held or until his or her successor is elected and qualifies.
Directors and officers who are employed by or who have a financial interest in The Hartford are considered “interested” persons of the Fund pursuant to the 1940 Act. Each officer and two of the Company’s directors, as noted in the chart below, are “interested” persons of the Fund. Each director serves as a director for The Hartford Mutual Funds, Inc., The Hartford Mutual Funds II, Inc., Hartford Series Fund, Inc., and Hartford HLS Series Fund II, Inc., and as a trustee for The Hartford Alternative Strategies Fund, which, as of October 31, 2013, collectively consist of 89 funds. Correspondence may be sent to directors and officers c/o Hartford Funds, P.O. Box 2999, Hartford, Connecticut 06104-2999, except that correspondence to Mr. Annoni, Mr. Dressen, Ms. Fagely and Ms. Quade may be sent to 500 Bielenberg Drive, Woodbury, Minnesota 55125 and correspondence to Mr. Davey and Mr. Melcher may be sent to 5 Radnor Corporate Center, Suite 300, 100 Matsonford Road, Radnor, Pennsylvania 19087.
The table below sets forth, for each director and officer, his or her name, year of birth, current position with the Company and date first elected or appointed to The Hartford Mutual Funds, Inc. (“MF”) and The Hartford Mutual Funds II, Inc. (“MF2”), principal occupation, and, for directors, other directorships held. The Fund’s statement of additional information contains further information on the directors and is available free of charge by calling 1-888-843-7824 or writing to Hartford Funds, P.O. Box 64387, St. Paul, MN 55164-0387.
Information on the aggregate remuneration paid to the directors of the Company can be found in the Statement of Operations herein. The Fund pays to The Hartford a portion of the Chief Compliance Officer’s compensation, but does not pay salaries or compensation to any of its other officers or directors who are employed by The Hartford.
Non-Interested Directors
Lynn S. Birdsong (1946) Director since 2003, Co-Chairman of the Investment Committee
Mr. Birdsong is a private investor. Mr. Birdsong currently serves as a Director of the Sovereign High Yield Investment Company (April 2010 to current). Mr. Birdsong currently serves as an Independent Director of Nomura Partners Funds, Inc. (formerly, The Japan Fund) (March 2003 to current). From 1979 to 2002, Mr. Birdsong was a managing director of Zurich Scudder Investments, an investment management firm. During his employment with Scudder, Mr. Birdsong was an Interested Director of The Japan Fund. Since 1981, Mr. Birdsong has been a partner in Birdsong Company, an advertising specialty firm.
Robert M. Gavin, Jr. (1940) Director since 2002 (MF) and 1986 (MF2), Chairman of the Board since 2004
Dr. Gavin is an educational consultant. Prior to September 1, 2001, he was President of Cranbrook Education Community and prior to July 1996, he was President of Macalester College, St. Paul, Minnesota.
Duane E. Hill (1945) Director since 2001 (MF) and 2002 (MF2), Chairman of the Nominating Committee
Mr. Hill is Partner of TSG Ventures L.P., a private equity investment company. Mr. Hill is a former partner of TSG Capital Group, a private equity investment firm that served as sponsor and lead investor in leveraged buyouts of middle market companies.
Sandra S. Jaffee (1941) Director since 2005
Ms. Jaffee is the founder and Chief Executive Officer of a private company, Homeworks Concierge, LLC, which provides residential property management services in Westchester County, New York (January 2012 to present). Ms. Jaffee served as Chairman (2008 to 2009) and Chief Executive Officer of Fortent (formerly Searchspace Group), a leading provider of compliance/regulatory technology to financial institutions from August 2005 to August 2009. Ms. Jaffee currently serves as a member of the Board of Directors of Broadridge Financial Solutions as well as a Trustee of Muhlenberg College.
William P. Johnston (1944) Director since 2005, Chairman of the Compliance Committee
In February 2008, Mr. Johnston was elected to the Board of Directors of HCR-ManorCare, Inc. In August 2007, Mr. Johnston was elected to the Board of Directors of LifeCare Holdings, Inc. In July 2006, Mr. Johnston was elected to the Board of Directors of MultiPlan, Inc. and served as a director (July 2006 to August 2010). In June 2006, Mr. Johnston was appointed as Senior Advisor to The Carlyle Group, a global private equity and alternative asset investment firm. In May 2006, Mr. Johnston was elected to the Supervisory Board of Fresenius Medical Care AG & Co. KGaA, after its acquisition of Renal Care Group, Inc. in March 2006.
Phillip O. Peterson (1944) Director since 2002 (MF) and 2000 (MF2), Chairman of the Audit Committee
Mr. Peterson is a mutual fund industry consultant. He was a partner of KPMG LLP (an accounting firm) until July 1999. Mr. Peterson joined William Blair Funds in February 2007 as a member of the Board of Trustees. Mr. Peterson also joined the Board of Trustees of Symetra Variable Mutual Funds Trust as a trustee in February 2012.
| The Hartford Value Opportunities Fund |
| Directors and Officers (Unaudited) – (continued) |
Lemma W. Senbet (1946) Director since 2005
Dr. Senbet is the William E. Mayer Chair Professor of Finance and Director, Center for Financial Policy, at the University of Maryland, Robert H. Smith School of Business. He was chair of the Finance Department from 1998 to 2006. Previously he was a chaired professor of finance at the University of Wisconsin-Madison. Also, he was director of the Fortis Funds from March 2000 to July 2002. Dr. Senbet served the finance profession in various capacities, including as director of the American Finance Association and President of the Western Finance Association. In 2006, Dr. Senbet was inducted Fellow of Financial Management Association International for his career-long distinguished scholarship and professional service.
Interested Directors and Officers
James E. Davey (1964) Director since 2012, President and Chief Executive Officer since 2010
Mr. Davey serves as Executive Vice President of Hartford Life Insurance Company (“HLIC”) and The Hartford Financial Services Group, Inc. Additionally, Mr. Davey serves as Chairman of the Board and Manager of Hartford Funds Distributors, LLC (“HFD”) and Director and Chairman of the Board of Hartford Administrative Services Company (“HASCO”). Mr. Davey also serves as Manager, President and Chairman of the Board for Hartford Funds Management Company, LLC (“HFMC”). Mr. Davey joined The Hartford in 2002.
Lowndes A. Smith (1939) Director since 1996 (MF) and 2002 (MF2), Co-Chairman of the Investment Committee
Mr. Smith served as Vice Chairman of The Hartford from February 1997 to January 2002, as President and Chief Executive Officer of Hartford Life, Inc. from February 1997 to January 2002, and as President and Chief Operating Officer of The Hartford Life Insurance Companies from January 1989 to January 2002. Mr. Smith serves as a Director of White Mountains Insurance Group, Ltd., One Beacon Insurance and Symetra Financial and as Managing Director of Whittington Gray Associates.
Other Officers
Mark A. Annoni (1964) Vice President, Controller and Treasurer since 2012
Mr. Annoni serves as the Assistant Vice President of HLIC (February 2004 to present). Mr. Annoni joined The Hartford in April 2001 as part of The Hartford’s acquisition of Fortis Financial Group (“Fortis”).
Michael R. Dressen (1963) AML Compliance Officer since 2011
Mr. Dressen currently serves as Assistant Vice President of HLIC. He also serves as Chief Compliance Officer and AML Compliance Officer of HASCO and as AML Officer of HFD. Mr. Dressen joined The Hartford in 2005 from State Farm Insurance Companies where he held various positions related to mutual funds, variable products, and property casualty insurance.
Tamara L. Fagely (1958) Vice President since 2002 (MF) and 1993 (MF2) (1)
Currently, Ms. Fagely is President and a Director of HASCO, Chief Administrative Officer and Manager of HFMC and a Vice President of HLIC. Ms. Fagely served as a Vice President of HASCO (1998-2013) and Chief Financial Officer of HASCO (2006-2013). She served as Assistant Vice President of HLIC from December 2001 through March 2005. In addition, Ms. Fagely is Manager and Chief Operating Officer of HFD.
(1) Ms. Fagley will be retiring on December 31, 2013.
Edward P. Macdonald (1967) Vice President, Secretary and Chief Legal Officer since 2005
Mr. Macdonald serves as Vice President of HLIC and Vice President, Chief Legal Officer and Secretary of HFD and HASCO. Mr. Macdonald also serves as Manager, Vice President, Chief Legal Officer and Secretary of HFMC. Mr. Macdonald joined The Hartford in 2005.
Joseph G. Melcher (1973) Vice President and Chief Compliance Officer since 2013
Mr. Melcher currently serves as Vice President of HFMC and HFD. Mr. Melcher joined The Hartford in 2012 from Touchstone Investments, a member of the Western & Southern Financial Group, where he held the position of Vice President and Chief Compliance Officer from 2010 through 2012 and Assistant Vice President, Compliance from 2005 to 2010.
Vernon J. Meyer (1964) Vice President since 2006
Mr. Meyer serves as Senior Vice President of HLIC. He also serves as Senior Vice President of HFMC and HFD. Mr. Meyer joined The Hartford in 2004.
Laura S. Quade (1969) Vice President since 2012
Ms. Quade currently serves as Vice President of HASCO and is a Director of Mutual Fund Service Operations. She also serves as Director, Enterprise Operations of HFD and HLIC. Ms. Quade joined The Hartford in 2001 as part of The Hartford’s acquisition of Fortis.
Martin A. Swanson (1962) Vice President since 2010
Mr. Swanson is a Vice President of HLIC. Mr. Swanson also serves as Vice President and Chief Marketing Officer for HFD. Prior to joining HLIC in 1998, Mr. Swanson was a Vice President at PaineWebber, Inc.
HOW TO OBTAIN A COPY OF THE FUND’S PROXY VOTING POLICIES AND VOTING RECORDS (UNAUDITED)
A description of the policies and procedures that the Fund uses to determine how to vote proxies relating to portfolio securities and information about how the Fund voted proxies relating to portfolio securities during the most recent twelve-month period ended June 30 are available (1) without charge, upon request, by calling 888-843-7824 and (2) on the SEC’s website at http://www.sec.gov.
QUARTERLY PORTFOLIO HOLDINGS INFORMATION (UNAUDITED)
The Fund files a complete schedule of portfolio holdings with the SEC for the first and third quarters of each fiscal year on Form N-Q. The Fund’s Forms N-Q are available (1) without charge, upon request, by calling 888-843-7824 and (2) on the SEC’s website at http://www.sec.gov. The Form N-Q may be reviewed and copied at the SEC’s Public Reference Room in Washington, DC. Information on the operation of the Public Reference Room may be obtained by calling 1-800-SEC-0330.
| The Hartford Value Opportunities Fund |
| Federal Tax Information (Unaudited) |
For the fiscal year ended October 31, 2013, there is no further federal tax information required for this Fund.
| The Hartford Value Opportunities Fund |
| Expense Example (Unaudited) |
Your Fund's Expenses
As a shareholder of the Fund, you incur two types of costs: (1) transaction costs, including sales charges (loads) on purchase payments, if any, and contingent deferred sales charges (CDSC), if any, and (2) ongoing costs, including investment management fees, distribution and/or service (12b-1) fees, if any, and other fund expenses. This example is intended to help you understand your ongoing costs (in dollars) of investing in the Fund and to compare these costs with the ongoing costs of investing in other mutual funds. The example is based on an investment of $1,000 invested at the beginning of the period and held for the period of April 30, 2013 through October 31, 2013.
Actual Expenses
The first set of columns of the table below provides information about actual account values and actual expenses. You may use the information in this column, together with the amount you invested, to estimate the expenses that you paid over the period. Simply divide your account value by $1,000 (for example, an $8,600 account value divided by $1,000 = 8.6), then multiply the result by the number in the line under the heading entitled “Expenses Paid During Period” to estimate the expenses you paid on your account during this period.
Hypothetical Example for Comparison Purposes
The second set of columns of the table below provides information about hypothetical account values and hypothetical expenses based on the Fund's actual expense ratio and an assumed rate of return of 5% per year before expenses, which is not the Fund's actual return. The hypothetical account values and expenses may not be used to estimate the actual ending account balance or expenses you paid for the period. You may use this information to compare the ongoing costs of investing in the Fund and other funds. To do so, compare this 5% hypothetical example with the 5% hypothetical examples that appear in the shareholder reports of the other funds.
Please note that the expenses shown in the table are meant to highlight your ongoing costs only and do not reflect any transactional costs, such as sales charges (loads) and CDSC. Therefore, the second set of columns of the table is useful in comparing ongoing costs only, and will not help you determine the relative total costs of owning different funds. In addition, if these transactional costs were included, your costs would be higher. Expenses are equal to the Fund's annualized expense ratios multiplied by average account value over the period, multiplied by 184/365 (to reflect the one-half year period).
| | | Actual return | | | Hypothetical (5% return before expenses) | | | | | | | | | | |
| | | Beginning
Account Value
April 30, 2013 | | | Ending Account
Value
October 31, 2013 | | | Expenses paid
during the period
April 30, 2013
through
October 31, 2013 | | | Beginning
Account Value
April 30, 2013 | | | Ending Account
Value
October 31, 2013 | | | Expenses paid
during the
period
April 30, 2013
through
October 31, 2013 | | | Annualized
expense
ratio | | | Days in
the
current
1/2
year | | | Days
in the
full
year | |
| Class A | | $ | 1,000.00 | | | $ | 1,120.60 | | | $ | 7.22 | | | $ | 1,000.00 | | | $ | 1,018.40 | | | $ | 6.87 | | | | 1.35 | % | | 184 | | | 365 | |
| Class B | | $ | 1,000.00 | | | $ | 1,116.00 | | | $ | 11.21 | | | $ | 1,000.00 | | | $ | 1,014.61 | | | $ | 10.67 | | | | 2.10 | | | 184 | | | 365 | |
| Class C | | $ | 1,000.00 | | | $ | 1,116.50 | | | $ | 11.21 | | | $ | 1,000.00 | | | $ | 1,014.61 | | | $ | 10.67 | | | | 2.10 | | | 184 | | | 365 | |
| Class I | | $ | 1,000.00 | | | $ | 1,122.00 | | | $ | 5.61 | | | $ | 1,000.00 | | | $ | 1,019.91 | | | $ | 5.34 | | | | 1.05 | | | 184 | | | 365 | |
| Class R3 | | $ | 1,000.00 | | | $ | 1,119.90 | | | $ | 8.29 | | | $ | 1,000.00 | | | $ | 1,017.39 | | | $ | 7.89 | | | | 1.55 | | | 184 | | | 365 | |
| Class R4 | | $ | 1,000.00 | | | $ | 1,120.90 | | | $ | 6.69 | | | $ | 1,000.00 | | | $ | 1,018.90 | | | $ | 6.37 | | | | 1.25 | | | 184 | | | 365 | |
| Class R5 | | $ | 1,000.00 | | | $ | 1,122.70 | | | $ | 5.09 | | | $ | 1,000.00 | | | $ | 1,020.41 | | | $ | 4.84 | | | | 0.95 | | | 184 | | | 365 | |
| Class Y | | $ | 1,000.00 | | | $ | 1,122.20 | | | $ | 4.82 | | | $ | 1,000.00 | | | $ | 1,020.66 | | | $ | 4.59 | | | | 0.90 | | | 184 | | | 365 | |
| The Hartford Value Opportunities Fund |
| Approval of Investment Management and Investment Sub-Advisory Agreements (Unaudited) |
Section 15(c) of the Investment Company Act of 1940, as amended (the “1940 Act”), requires that each mutual fund’s board of directors, including a majority of those directors who are not “interested persons” of the mutual fund, as defined in the 1940 Act (the “Independent Directors”), annually review and consider the continuation of the mutual fund’s investment advisory and sub-advisory agreements. At its meeting held on August 6-7, 2013, the Board of Directors (the “Board”) of The Hartford Mutual Funds II, Inc., including each of the Independent Directors, unanimously voted to approve the continuation of the investment management agreement for The Hartford Value Opportunities Fund (the “Fund”) with Hartford Funds Management Company, LLC (“HFMC”) and the continuation of the investment sub-advisory agreement between HFMC and the Fund’s sub-adviser, Wellington Management Company, LLP (the “Sub-adviser,” and together with HFMC, the “Advisers”) (collectively, the “Agreements”).
In the months preceding the August 6-7, 2013 meeting, the Board requested, received, and reviewed written responses from the Advisers to questions posed to them on behalf of the Independent Directors and supporting materials relating to those questions and responses. The Board considered information furnished to the Board at its meetings throughout the year, as well as information specifically prepared in connection with the annual approval of the Agreements at the Board’s meetings held on June 18-19, 2013 and August 6-7, 2013. Information provided to the Board at its meetings throughout the year included, among other things, reports on Fund performance, legal and compliance matters, sales and marketing activity, shareholder services, and the other services provided to the Fund by the Advisers and their affiliates. The Board also received in-person presentations by Fund officers and representatives of HFMC at the Board’s meetings on June 18-19, 2013 and August 6-7, 2013 concerning the Agreements.
The Independent Directors, advised by independent legal counsel, engaged two service providers to assist them with evaluating the Agreements with respect to the Fund. Lipper Inc. (“Lipper”), an independent provider of investment company data, was retained to provide the Board with reports on how the Fund’s contractual management fees, actual management fees, other non-management fees, overall expense ratios and investment performance compared to those of mutual funds with similar investment objectives. The Independent Directors also engaged an independent financial services consulting firm (the “Consultant”) to assist them in evaluating the Fund’s management fees, sub-advisory fees, other non-management fees, overall expense ratios and investment performance.
In determining whether to continue the Agreements for the Fund, the members of the Board reviewed and evaluated information and factors they believed to be relevant and appropriate in light of the information that the Board deemed necessary and appropriate through the exercise of its reasonable business judgment. While individual members of the Board may have weighed certain factors differently, the Board’s determination to continue the Agreements was based on a comprehensive consideration of all information provided to the Board throughout the year and specifically with respect to the continuation of the Agreements. A more detailed discussion of the factors the Board considered with respect to its approval of the Agreements is provided below.
Nature, Extent, and Quality of Services Provided by the Advisers
The Board requested and considered information concerning the nature, extent, and quality of the services provided to the Fund by the Advisers. The Board considered, among other things, the terms of the Agreements and the range of services provided by the Advisers. The Board considered the Advisers’ professional personnel who provide services to the Fund, including each Adviser’s ability and experience in attracting and retaining qualified personnel to service the Fund. The Board considered each Adviser’s reputation and overall financial strength, as well as its willingness to consider and implement organizational and operational changes designed to improve services to the Fund. In addition, the Board considered the quality of each Adviser’s communications with the Board and responsiveness to Board inquiries.
The Board also requested and evaluated information concerning each Adviser’s regulatory and compliance environment. In this regard, the Board requested and reviewed information on each Adviser’s compliance policies and procedures, compliance history, and a report from the Fund’s Chief Compliance Officer on each Adviser’s compliance with applicable laws and regulations, including responses to regulatory developments and compliance issues raised by regulators. The Board also noted the Advisers’ support of the Fund’s compliance control structure, particularly the resources devoted by the Advisers in support of the Fund’s obligations pursuant to Rule 38a-1 under the 1940 Act.
With respect to HFMC, the Board noted that under the Agreements, HFMC is responsible for the management of the Fund, including overseeing fund operations and service providers, and provides administrative services to the Fund as well as investment advisory services in connection with selecting, monitoring and supervising the Sub-adviser. The Board considered HFMC’s ongoing monitoring of people, process and performance, including its quarterly reviews of each of the Hartford Funds, semi-annual meetings with the leaders of each Fund’s portfolio management team, and oversight of the Funds’ approximately 60 portfolio managers. The Board recognized that HFMC has demonstrated a record of making changes to the management and/or strategies of the Funds when warranted. The Board considered HFMC’s oversight of the Sub-adviser’s investment approach and results, process for monitoring best execution of portfolio trades by the Sub-adviser, and approach to risk management with respect to the Fund and the service providers to the Fund. The Board also considered HFMC’s oversight of compliance with the Fund’s objective and policies as well as with applicable laws and regulations, noting that regulatory and other developments had over time led to an increase in the scope of HFMC’s services in this regard.
In addition, the Board considered HFMC’s ongoing commitment to review and rationalize the Hartford Funds product line-up and the expenses that HFMC had incurred in connection with fund combinations in recent years. The Board considered that HFMC or its affiliates are responsible for providing the Fund’s officers.
With respect to the Sub-adviser, who provides day-to-day portfolio management services, the Board considered the quality of the Fund’s portfolio managers, the Sub-adviser’s other investment personnel, its investment philosophy and process, investment research capabilities and resources, performance record, trade execution capabilities and experience. The Board considered the experience of the Fund’s portfolio managers, the number of accounts managed by the portfolio managers, and the Sub-adviser’s method for compensating the portfolio managers.
Based on these considerations, the Board concluded that it was satisfied with the nature, extent and quality of the services provided to the Fund by HFMC and the Sub-adviser.
Performance of the Fund and the Advisers
The Board considered the investment performance of the Fund. In this regard, the Board reviewed the performance of the Fund over different time periods presented in the materials and evaluated HFMC’s analysis of the Fund’s performance for these time periods. The Board considered information and materials provided to the Board by the Advisers concerning Fund performance, as well as information from Lipper comparing the investment performance of the Fund to an appropriate benchmark and universe of peer funds. The Board noted that the Fund’s performance was in the 3rd quintile of its performance universe for the 1- and 3-year periods and the 1st quintile for the 5-year period. The Board also noted that the Fund’s performance was below its benchmark for the 1-year period, in line with its benchmark for the 3-year period and above its benchmark for the 5-year period.
The Board considered the detailed investment analytics reports provided by Hartford Funds’ Investment Advisory Group throughout the year. These reports include, among other things, information on the Fund’s gross and net returns, the Fund’s investment performance relative to an appropriate benchmark and peer group, various statistics concerning the Fund’s portfolio, and a narrative summary of various factors affecting Fund performance. The Board considered the Advisers’ cooperation with the Investment Committee, which assists the Board in evaluating the performance of the Fund at periodic meetings throughout the year. The Board also considered the analysis provided by the Consultant relating to the Fund’s performance track record.
In light of all the considerations noted above, the Board concluded that it had continued confidence in HFMC’s and the Sub-adviser’s overall capabilities to manage the Fund.
Costs of the Services and Profitability of the Advisers
The Board reviewed information regarding HFMC’s cost to provide investment management and related services to the Fund and HFMC’s profitability, both overall and for the Fund, on a pre-tax basis without regard to distribution expenses. The Board also requested and reviewed information about the profitability to HFMC and its affiliates from all services provided to the Fund and all aspects of their relationship with the Fund. The Board also requested and received information relating to the operations and profitability of the Sub-adviser.
| The Hartford Value Opportunities Fund |
| Approval of Investment Management and Investment Sub-Advisory Agreements (Unaudited) – (continued) |
The Board considered the Consultant’s review of the profitability calculations utilized by HFMC in connection with the continuation of the investment management agreement, noting the Consultant’s view that Hartford Funds’ process for calculating and reporting Fund profitability is reasonable. In this regard, the Board noted that the Consultant had previously performed a full review of this process and reported that such process is sound and well within common industry practice.
Based on these considerations, the Board concluded that the profits anticipated to be realized by the Advisers and their affiliates from their relationships with the Fund would not be excessive.
Comparison of Fees and Services Provided by the Advisers
The Board considered comparative information with respect to the management fees to be paid by the Fund to HFMC and the total expense ratios of the Fund. The Board also considered comparative information with respect to the sub-advisory fees to be paid by HFMC to the Sub-adviser. In this regard, the Board requested and reviewed information from HFMC and the Sub-adviser relating to the management and sub-advisory fees, including the sub-advisory fee schedule for the Fund, and total operating expenses for the Fund. With respect to the sub-advisory fee schedule, the Board considered representations from HFMC and the Sub-adviser that the Sub-adviser’s fees were negotiated at arm’s length. The Board also reviewed information from Lipper comparing the Fund’s contractual management fees, actual management fees and overall expense ratios relative to a group of funds selected by Lipper, in consultation with the Consultant, and a broader universe of funds selected by Lipper. The Board noted that the Fund’s contractual management fee was in the 3rd quintile of its expense group, while its actual management fee was in the 2nd quintile and its total expenses (less 12b-1 and shareholder service fees) were in the 4th quintile. The Board also noted that the Fund has an automatically renewable contractual expense cap on each share class, which resulted in reimbursement of certain expenses incurred in 2012.
While the Board recognized that comparisons between the Fund and peer funds are imprecise, given the differing service levels and characteristics of mutual funds and the different business models and cost structures of the Advisers, the comparative information provided by Lipper assisted the Board in evaluating the reasonableness of the Fund’s management and sub-advisory fees and total operating expenses. In addition, the Board considered the analysis and recommendations of the Consultant relating to the Fund’s management and sub-advisory fees and total operating expenses.
Based on these considerations, the Board concluded that the Fund’s fees and total operating expenses, in conjunction with the information about quality of services, profitability, economies of scale, and other matters discussed, were reasonable in light of the services provided.
Economies of Scale
The Board requested and considered information regarding the Advisers’ realization of economies of scale with respect to the Fund and whether the fee levels reflect these economies of scale for the benefit of the Fund’s shareholders. The Board reviewed the breakpoints in the management fee schedule for the Fund, which reduce fee rates as Fund assets grow over time. The Board recognized that a fund with assets beyond the last breakpoint level will continue to benefit from economies of scale because additional assets are charged the lowest breakpoint fee resulting in lower overall effective management fee rates. The Board also considered that expense limitations and fee waivers that reduce the Fund’s expenses at all asset levels can have the same effect as breakpoints in sharing economies of scale with shareholders and provide protection from an increase in expenses if Fund assets decline. The Board recognized that a fee schedule that reaches a lower breakpoint quickly provides shareholders with the benefit of anticipated or potential economies of scale, although the Board noted that the Fund’s current low asset levels have kept the Fund from fully realizing this benefit. The Board also considered that HFMC has been active in managing expenses, which has resulted in benefits being realized by shareholders as assets within the Hartford Funds family of funds have grown over time, including through lower transfer agent costs and other operating expenses.
The Board reviewed and evaluated materials from Lipper showing how management fee schedules of peer funds reflect economies of scale for the benefit of shareholders as a peer fund’s assets hypothetically increase over time. Based on information provided by HFMC, Lipper, and the Consultant, the Board recognized that there is no uniform methodology for establishing breakpoints or uniform pattern in asset levels that trigger breakpoints or the amounts of breakpoints triggered.
After considering all of the information available to it, the Board concluded that it was satisfied with the extent to which economies of scale would be shared for the benefit of the Fund’s shareholders based on currently available information and the effective advisory fees and expense ratios for the Fund at its current and reasonably anticipated asset levels. The Board noted, however, that it would continue to monitor future growth in Fund assets and the appropriateness of additional breakpoints.
Other Benefits
The Board considered other benefits to the Advisers and their affiliates from their relationships with the Fund.
The Board reviewed information noting that HFMC receives fees for fund accounting and related services from the Fund, and the Board considered information on profits to HFMC for such services. The Board also considered that Hartford Administrative Services Company (“HASCO”), the Fund’s transfer agent and an affiliate of HFMC, receives transfer agency compensation from the Fund, and the Board reviewed information on the profitability of the Fund’s transfer agency function to HASCO. The Board considered information provided by HASCO indicating that the transfer agent fees charged by HASCO to the Fund were fair and reasonable based on publicly available information.
The Board also considered that Hartford Funds Distributors, LLC (“HFD”), an affiliate of HFMC, serves as principal underwriter of the Fund. As principal underwriter, HFD receives 12b-1 fees from the Fund and receives all or a portion of the sales charges on sales or redemptions of certain classes of shares. The Board also noted that certain affiliates of HFD distribute shares of the Fund and receive compensation in that connection.
The Board considered benefits to the Sub-adviser from its use of the Fund’s brokerage commissions to obtain soft dollar research, and representations from HFMC and the Sub-adviser that the Sub-adviser would not make any revenue-sharing payments or any other type of distribution payments to HFMC or its affiliates.
The Board considered the benefits to shareholders of being part of the Hartford Funds family of funds, including the right to exchange investments between the same class of funds without a sales charge, the ability to reinvest Fund dividends into other funds in the family, and the ability to combine holdings in the Fund with holdings in other funds to obtain a reduced sales charge. The Board considered HFMC’s efforts to provide investors in the family with a broad range of investment styles and asset classes and its entrepreneurial risk in initiating new funds to expand these opportunities for shareholders.
* * * *
Based upon its review of these various factors, among others, the Board concluded that it is in the best interests of the Fund and its shareholders for the Board to approve the Agreements for an additional year. In reaching this decision, the Board did not assign relative weights to the factors discussed above or deem any one or group of them to be controlling in and of themselves. In connection with their deliberations, the Independent Directors met separately in executive session on several occasions, with independent legal counsel and the Consultant, to review the relevant materials and consider their responsibilities under relevant laws and regulations.
| The Hartford Value Opportunities Fund |
| Main Risks (Unaudited) |
The main risks of investing in the Fund are described below.
Market, Selection, and Strategy Risk: The Fund’s share price may fluctuate due to market risk and/or security selections that may underperform the market or relevant benchmarks. If the sub-adviser’s investment strategy does not perform as expected, the Fund could underperform its peers or lose money. There is no guarantee the Fund will achieve its stated objective.
Value Investing Risk: Value investments are considered to be undervalued, but they may never attain their potential value. Value-style investing falls in and out of favor, which may result in periods of underperformance.
Small/Mid-cap Stock Risk: Small- and mid-cap stocks are generally more volatile and risky and may be less liquid than large-cap stocks because they may have limited operating histories, narrow product lines, and focus on niche markets.
Foreign Investment Risk: Foreign investments can be riskier than U.S. investments. Potential risks include currency risk that may result from unfavorable exchange rates, liquidity risk if decreased demand for a security makes it difficult to sell at the desired price, and risks that stem from substantially lower trading volume on foreign markets.
HARTFORDFUNDS
hartfordfunds.com
This information is written in connection with the promotion or marketing of the matter(s) addressed in this material.
This report is submitted for the general information of the shareholders of the Fund. It is not authorized for distribution unless preceded or accompanied by a current prospectus for the Fund.
The information cannot be used or relied upon for the purpose of avoiding IRS penalties. These materials are not intended to provide tax, accounting or legal advice. As with all matters of a tax or legal nature, you should consult your own tax or legal counsel for advice.
Investors should carefully consider the investment objectives, risks, charges, and expenses of Hartford Funds before investing. This and other information can be found in the prospectus and summary prospectus, which can be obtained by calling 888-843-7824 (retail) or 877-836-5854 (institutional). Investors should read them carefully before they invest.
Hartford Funds are underwritten and distributed by Hartford Funds Distributors, LLC.
MFAR-VO13 12/13 114014-1 Printed in U.S.A. ©2013 The Hartford, Hartford, CT 06155
Item 2. Code of Ethics.
| | (a) | The registrant, as of the end of the period covered by this report, has adopted a code of ethics that applies to the registrant’s principal executive officer, principal financial officer, principal accounting officer or controller, or persons performing similar functions, regardless of whether these individuals are employed by the registrant or a third party. A copy of the code of ethics is filed herewith. |
| | (c) | There have been no amendments, during the period covered by this report, to a provision of the code of ethics that applies to the registrant’s principal executive officer, principal financial officer, principal accounting officer or controller, or persons performing similar functions, regardless of whether these individuals are employed by the registrant or a third party, and that relates to any element of the code of ethics description. |
| | (d) | The registrant has not granted any waivers, including an implicit waiver, from a provision of the code of ethics that applies to the registrant’s principal executive officer, principal financial officer, principal accounting officer or controller, or persons performing similar functions, regardless of whether these individuals are employed by the registrant or a third party, that relates to one or more of the items set forth in paragraph (b) of this item’s instructions. |
Item 3. Audit Committee Financial Expert.
The Board of Directors of the Registrant has designated Phillip O. Peterson as an Audit Committee Financial Expert. Mr. Peterson is considered by the Board to be an independent director.
Item 4. Principal Accountant Fees and Services.
| | (a) | Audit Fees: The aggregate fees billed for each of the last two fiscal years for professional services rendered by the principal accountant for the audit of the registrant’s annual financial statements or services that are normally provided by the accountant in connection with statutory and regulatory filings or engagements for those fiscal years were: $68,365 for the fiscal year ended October 31, 2012; $68,785 for the fiscal year ended October 31, 2013. |
| | (b) | Audit Related Fees: The aggregate fees billed in each of the last two fiscal years for assurance and related services by the principal accountant that are reasonably related to the performance of the audit of the registrant’s financial statements and are not reported under paragraph (a) of this Item were: $3,659 for the fiscal year ended October 31, 2012; $2,261 for the fiscal year ended October 31, 2013. Audit-related services principally in connection with Rule 17Ad-13 under the Securities and Exchange Act of 1934. |
| | (c) | Tax Fees: The aggregate fees billed in each of the last two fiscal years for professional services rendered by the principal accountant for tax compliance, tax advice, and tax planning were: $16,575 for the fiscal year ended October 31, 2012; $22,323 for the fiscal year ended October 31, 2013. Tax-related services are principally in connection with, but not limited to, general tax services, excise tax and Passive Foreign Investment Company (PFIC) analysis. |
| | (d) | All Other Fees: The aggregate fees billed in each of the last two fiscal years for products and services provided by the principal accountant, other than the services reported in paragraphs (a) through (c) of this Item were: $0 for the fiscal year ended October 31, 2012; $0 for the fiscal year ended October 31, 2013. |
| | (e) | (1) The Pre-Approval Policies and Procedures (the “Policy”) adopted by the Audit Committee of the Registrant (also, the “Fund”) sets forth the procedures pursuant to which services performed by the Independent Auditor for the Registrant may be pre-approved. The following are some main provisions from the Policy. |
| 1. | The Audit Committee must pre-approve all audit services and non-audit services that the Independent Auditor provides to the Fund. |
| 2. | The Audit Committee must pre-approve any engagement of the Independent Auditor to provide non-audit services to any Service Affiliate (which is defined to include any entity controlling, controlled by, or under common control with the investment adviser that provides ongoing services to the Fund) during the period of the Independent Auditor’s engagement to provide audit services to the Fund, if the non-audit services to the Service Affiliate directly impact the Fund’s operations and financial reporting. |
| 3. | The Audit Committee shall pre-approve certain non-audit services to the Fund and its Service Affiliates pursuant to procedures set forth in the Policy. |
| 4. | The Audit Committee, from time to time, may designate one or more of its members who are Independent Directors (each a “Designated Member”) to consider, on the Audit Committee’s behalf, any non-audit services, whether to the Fund or to any Service Affiliate, that have not been pre-approved by the Audit Committee. In considering any requested non-audit services or proposed material change in such services, the Designated Member shall not authorize services which would exceed $50,000 in fees for such services. Any action by the Designated Member in approving a requested non-audit service shall be reported to the Audit Committee not later than at its next scheduled meeting. |
| 5. | The Independent Auditor may not provide specified prohibited non-audit services set forth in the Policy to the Fund, the Fund’s investment adviser, the Service Affiliates or any other member of the investment company complex. |
| | (e) | (2) One hundred percent of the services described in items 4(b) through 4(d) were approved in accordance with the Audit Committee's Pre-Approval Policy. As a result, none of such services was approved pursuant to paragraph (c) (7) (i) (c) of Rule 2-01 of Regulation S-X. |
| | (f) | None of the hours expended on the principal accountant's engagement to audit the registrant's financial statements for the year ended October 31, 2013, were attributed to work performed by persons other than the principal accountant's full-time, permanent employees. |
| | (g) | The aggregate non-audit fees billed by the registrant’s accountant for services rendered to the registrant, and rendered to the registrant’s investment adviser (not including any sub-adviser whose role is primarily portfolio management and is subcontracted with or overseen by another investment adviser), and any entity controlling, controlled by, or under common control with the adviser that provides ongoing services to the registrant for each of the last two fiscal years of the registrant were: Non-Audit Fees: $1,325,075 for the fiscal year ended October 31, 2012; $3,499,424 for the fiscal year ended October 31, 2013. |
| | (h) | The registrant’s audit committee of the board of directors has considered whether the provision of non-audit services that were rendered to the registrant’s investment adviser (not including any sub-adviser whose role is primarily portfolio management and is subcontracted with or overseen by another investment adviser), and any entity controlling, controlled by, or under common control with the investment adviser that provides ongoing services to the registrant that were not pre-approved pursuant to paragraph (c)(7)(ii) of Rule 2-01 of Regulation S-X is compatible with maintaining the principal accountant’s independence. |
Item 5. Audit Committee of Listed Registrants.
Not applicable.
Item 6. Investments
| (a) | The Schedule of Investments is included as part of the annual report filed under Item 1 of this form. |
Item 7. Disclosure of Proxy Voting Policies and Procedures for Closed-End Management Investment Companies.
Not applicable.
Item 8. Portfolio Managers of Closed-End Management Investment Companies.
Not applicable.
Item 9. Purchases of Equity Securities by Closed-End Management Investment Company and Affiliated Purchasers.
Not applicable.
Item 10. Submission of Matters to a Vote of Security Holders
There have been no material changes to the procedures by which shareholders may recommend nominees to the registrant’s board of directors since registrant last provided disclosure in response to this requirement.
Item 11. Controls and Procedures.
| (a) | The registrant’s principal executive and principal financial officers, or persons performing similar functions, have concluded that the registrant’s disclosure controls and procedures (as defined in Rule 30a-3(c) under the Investment Company Act of 1940, as amended (the “1940 Act”) (17 CFR 270.30a-3(c))) are generally effective to provide reasonable assurance, as of a date within 90 days of the filing date of the report that includes the disclosure required by this paragraph, based on their evaluation of these controls and procedures required by Rule 30a-3(b) under the 1940 Act (17 CFR 270.30a-3(b)) and Rules 13a-15(b) or 15d-15(b) under the Securities Exchange Act of 1934, as amended (17 CFR 240.13a-15(b) or 240.15d-15(b)). |
| (b) | There were no changes in the registrant’s internal control over financial reporting (as defined in Rule 30a-3(d) under the 1940 Act (17 CFR 270.30a-3(d)) that occurred during the registrant’s second fiscal quarter of the period covered by this report that have materially affected, or is reasonably likely to materially affect, the registrant’s internal control over financial reporting. |
Item 12. Exhibits.
(a)(1) Code of Ethics
(a)(2) Certifications pursuant to Rule 30a-2(a) under the 1940 Act and Section 302 of the Sarbanes-Oxley Act of 2002 are attached hereto.
(a)(3) Not applicable
(b) Certifications pursuant to Rule 30a-2(b) under the 1940 Act and Section 906 of the Sarbanes-Oxley Act of 2002 are attached hereto.
SIGNATURES
Pursuant to the requirements of the Securities Exchange Act of 1934 and the Investment Company Act of 1940, the registrant has duly caused this report to be signed on its behalf by the undersigned, thereunto duly authorized.
| | | | THE HARTFORD MUTUAL FUNDS II, INC. |
| | | | | |
| | | | | |
| | | | | |
| Date: | December 11, 2013 | | By: | /s/ James E. Davey |
| | | | | James E. Davey, President and |
| | | | | Chief Executive Officer |
| | | | | |
Pursuant to the requirements of the Securities Exchange Act of 1934 and the Investment Company Act of 1940, this report has been signed below by the following persons on behalf of the registrant and in the capacities and on the dates indicated.
| Date: | December 11, 2013 | | By: | /s/ James E. Davey |
| | | | | James E. Davey, President and |
| | | | | Chief Executive Officer |
| | | | | |
| Date: | December 11, 2013 | | By: | /s/ Mark A. Annoni |
| | | | | Mark A. Annoni, Vice President, |
| | | | | Treasurer and Controller |
| | | | | |