UNITED STATES
SECURITIES AND EXCHANGE COMMISSION
Washington, D.C. 20549
FORM N-CSR
CERTIFIED SHAREHOLDER REPORT OF REGISTERED MANAGEMENT INVESTMENT COMPANIES
Investment Company Act file number: 811-00558
THE HARTFORD MUTUAL FUNDS II, INC.
(Exact name of registrant as specified in charter)
P. O. Box 2999, Hartford, Connecticut 06104-2999
(Address of Principal Executive Offices)
Edward P. Macdonald, Esquire
Life Law Unit
The Hartford Financial Services Group, Inc.
200 Hopmeadow Street
Simsbury, Connecticut 06089
(Name and Address of Agent for Service)
Registrant’s telephone number, including area code: (860) 843-9934
Date of fiscal year end: October 31st
Date of reporting period: November 1, 2009 – April 30, 2010
Form N-CSR is to be used by management investment companies to file reports with the Commission not later than 10 days after the transmission to stockholders of any report that is required to be transmitted to stockholders under Rule 30e-1 under the Investment Company Act of 1940 (17 CFR 270.30e-1). The Commission may use the information provided on Form N-CSR in its regulatory, disclosure review, inspection, and policymaking roles.
A registrant is required to disclose the information specified by Form N-CSR, and the Commission will make this information public. A registrant is not required to respond to the collection of information contained in Form N-CSR unless the Form displays a currently valid Office of Management and Budget ("OMB") control number. Please direct comments concerning the accuracy of the information collection burden estimate and any suggestions for reducing the burden to Secretary, Securities and Exchange Commission, 450 Fifth Street, NW, Washington, DC 20549-0609. The OMB has reviewed this collection of information under the clearance requirements of 44 U.S.C. § 3507.
THE HARTFORD MUTUAL FUNDS 2010 Semi Annual Report The Hartford Growth Fund |
The Hartford Growth Fund
| |
| Manager Discussions (Unaudited) | 2 |
| Financial Statements | |
| 4 |
| 6 |
| 7 |
| 8 |
| 9 |
| 10 |
| 20 |
| 23 |
| 25 |
| 25 |
| 26 |
The Hartford Growth Fund inception 06/08/1949
(subadvised by Wellington Management Company, LLP)
Investment objective – Seeks long-term capital appreciation.
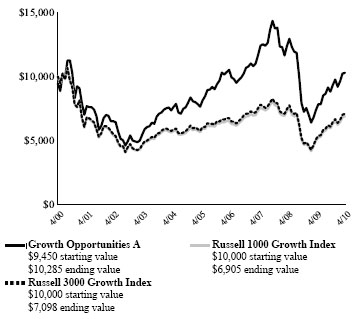
Performance Overview(1) 4/30/00 - 4/30/10
Growth of a $10,000 investment in Class A which includes Sales Charge
Russell 1000 Growth Index is an unmanaged index which measures the performance of those Russell 1000 Index companies with higher price-to-book ratios and higher forecasted growth values.
You cannot invest directly in an index.
The value of shares will fluctuate so that, when redeemed, shares may be worth more or less than their original cost. The chart and table do not reflect the deduction of taxes that a shareholder would pay on fund distributions or the redemption of fund shares.
Performance information may reflect historical or current expense waivers/reimbursements from the investment adviser, without which performance would have been lower. For information on current expense waivers/reimbursements, please see the prospectus.
Average Annual Total Returns(2,3,4,5) (as of 4/30/10)
| | 6 | 1 | 5 | 10 |
| | Month† | Year | Year | Year |
| | | | | |
| Growth A# | 16.29% | 35.92% | 2.80% | -0.19% |
| Growth A## | | 28.44% | 1.64% | -0.75% |
| Growth B# | 15.79% | 34.99% | 2.09% | NA* |
| Growth B## | | 29.99% | 1.75% | NA* |
| Growth C# | 15.79% | 34.86% | 2.06% | -0.89% |
| Growth C## | | 33.86% | 2.06% | -0.89% |
| Growth I# | 16.50% | 36.36% | 3.07% | NA |
| Growth L# | 16.39% | 36.11% | 3.04% | 0.02% |
| Growth L## | | 29.65% | 2.04% | -0.47% |
| Growth R3# | 16.09% | 35.47% | 2.76% | NA |
| Growth R4# | 16.23% | 35.87% | 2.99% | NA |
| Growth R5# | 15.91% | 35.74% | 3.10% | NA |
| Growth Y# | 16.52% | 36.49% | 3.28% | NA |
| Russell 1000 Growth Index | 15.79% | 38.16% | 4.05% | -3.63% |
| * | 10 year returns are not applicable for Class B because after 8 years Class B converts to Class A. |
PAST PERFORMANCE IS NOT INDICATIVE OF FUTURE RESULTS.
| (1) | Growth of a $10,000 investment in Classes B, C, I, L, R3, R4, R5 and Y shares will vary from results seen above due to differences in the expenses charged to these share classes. |
| (2) | The initial investment in Classes A and L shares reflects the maximum sales charge and Classes B and C reflect CDSC. |
| (3) | Total returns presented above were calculated using the Fund's net asset value available to shareholders for sale or redemption of Fund shares on April 30, 2010, which excludes investment transactions as of this date. |
| (4) | Effective 9/30/09, Class B shares of The Hartford Mutual Funds are closed to new investments. |
| (5) | Classes A, B, C and Y shares were offered beginning on 2/19/02. Performance prior to that date for Class A is that of the Fund's Class L shares and for Class C is that of the Fund's Class N shares, which had lower operating expenses. Performance prior to 2/19/02 would have been lower if Classes A and C shares expenses were applied during that period. (Class N shares are no longer offered.) Class I shares commenced operations on 8/31/06. Performance prior to 8/31/06 reflects Class A performance. Classes R3, R4 and R5 shares commenced operations on 12/22/06. Performance prior to 12/22/06 reflects Class Y performance. The Fund’s performance information prior to 4/1/01 reflects when the Fund was managed by a previous investment adviser. |
Portfolio Managers
Andrew J. Shilling, CFA
Senior Vice President, Partner
How did the Fund perform?
The Class A shares of The Hartford Growth Fund returned 16.29%, before sales charge, for the six-month period ended April 30, 2010, outperforming its benchmark, the Russell 1000 Growth Index, which returned 15.79% for the same period. The Fund outperformed the 14.77% return of the average fund in the Lipper Large-Cap Growth Funds peer group, a group of funds with investment strategies similar to those of the Fund.
Why did the Fund perform this way?
U.S. equities posted positive results during the period, extending a nearly 14-month long market rally. Throughout the period, extraordinary government measures helped to stabilize global economies and markets, and as the period progressed, investor confidence grew amid accommodative monetary policy, better-than-expected corporate earnings, and improving economic data, providing a favorable backdrop for equities.
Though all sectors of the Russell 1000 Growth Index had a positive return for the period, performance varied across sectors, with relative strength in Industrials (+27%), Consumer Discretionary (+25%), and Telecommunication Services (+19%) and relative weakness in Utilities (+2%), Energy (+6%), and Consumer Staples (+8%). Growth stocks (+16%) slightly underperformed Value stocks (+18%), as measured by the Russell 1000 Growth and Russell 1000 Value indices.
The Fund’s outperformance versus its benchmark was primarily due to sector positioning, which is a fallout of the bottom-up (i.e. stock by stock fundamental research) stock selection process. In particular, an underweight (i.e. the Fund’s sector position was less than the benchmark position) position in Consumer Staples and overweight (i.e. the Fund’s sector position was greater than the benchmark position) positions in Industrials and Consumer Discretionary helped relative results. The Fund also benefited from strong security selection in Energy. However, this was offset by weaker stock selection in Information Technology and Financials.
Top contributors to benchmark-relative returns were MGM Mirage (Consumer Discretionary), Boeing (Industrials), and Lincoln National (Financials). Shares of gaming and casino resort operator MGM Mirage moved higher as investor sentiment shifted toward a recovery outlook for Las Vegas operations and a more positive valuation of the firm’s joint venture in Macau. Chicago-based aircraft supplier and defense contractor Boeing continued to successfully move forward with its flight tests of the new Dreamliner airplane, driving shares higher. Shares of Lincoln National moved higher as core results for the fourth quarter were ahead of expectations in nearly all businesses and it appeared likely the company could repay its Troubled Asset Relief Program (TARP) funding without a material impact on earnings per share. Apple (Information Technology) and Cisco Systems (Information Technology) were also top contributors to absolute (i.e. total return) returns.
Goldman Sachs (Financials), McAfee (Information Technology), and UBS (Financials) were the top detractors from relative performance during the period. Shares of investment bank Goldman Sachs declined sharply at the end of the period amid news of a civil lawsuit and potential criminal investigation by the U.S. government. McAfee, a security technology company, saw its share price decline amid steep profit declines. Shares of Switzerland-based investment bank and money manager UBS sold off amid expectations of a near-term decline in trading profits and due to client outflows related to the tax forgiveness program for offshore U.S. accounts. Qualcomm (Information Technology) was a top detractor from absolute (i.e. total return) performance.
What is the outlook?
March 2010 marked the one year anniversary of recession-induced lows in global capital markets. Since the bottom in early 2009, risk assets have rebounded strongly, while global economies continue to show signs of stabilizing as unprecedented fiscal and monetary stimulus programs work their way through the system. During the first quarter of 2010, U.S. retail sales showed surprising strength and manufacturing data indicated improvements in both new orders and employment. However, some areas of weakness persisted, such as U.S. unemployment, which remains high, and the housing market, which remains fragile even as declines appear to be moderating. These areas contributed to continued weakness in consumer confidence data.
In this environment we continue to focus our efforts on stock-by-stock fundamental research, picking one stock at a time based upon the attractiveness of each company’s fundamentals and valuation. As a result of this bottom-up stock selection, at the end of the period our largest overweight positions versus the benchmark were Information Technology, Financials, and Consumer Discretionary. Consumer Staples, Health Care, and Utilities were the Fund’s largest underweight positions at the end of the period.
| Diversification by Industry | | | |
| as of April 30, 2010 | | | |
| | | Percentage of | |
| Industry (Sector) | | Net Assets | |
| Automobiles & Components (Consumer | | | |
| Discretionary) | | | 4.1 | % |
| Banks (Financials) | | | 4.7 | |
| Capital Goods (Industrials) | | | 13.2 | |
| Consumer Durables & Apparel (Consumer | | | | |
| Discretionary) | | | 1.9 | |
| Consumer Services (Consumer Discretionary) | | | 4.3 | |
| Diversified Financials (Financials) | | | 5.5 | |
| Energy (Energy) | | | 5.7 | |
| Health Care Equipment & Services (Health Care) | | | 1.0 | |
| Insurance (Financials) | | | 3.9 | |
| Materials (Materials) | | | 4.0 | |
| Pharmaceuticals, Biotechnology & Life Sciences | | | | |
| (Health Care) | | | 1.8 | |
| Retailing (Consumer Discretionary) | | | 6.1 | |
| Semiconductors & Semiconductor Equipment | | | | |
| (Information Technology) | | | 5.9 | |
| Software & Services (Information Technology) | | | 18.7 | |
| Technology Hardware & Equipment (Information | | | | |
| Technology) | | | 18.3 | |
| Transportation (Industrials) | | | 0.6 | |
| Short-Term Investments | | | 0.4 | |
| Other Assets and Liabilities | | | (0.1 | ) |
| Total | | | 100.0 | % |
April 30, 2010 (Unaudited)
| Shares or Principal Amount | | Market Value ╪ | |
| COMMON STOCKS - 99.7% | | | |
| | | Automobiles & Components - 4.1% | | | |
| | 521 | | Ford Motor Co. ● | | $ | 6,779 | |
| | 396 | | Harley-Davidson, Inc. | | | 13,383 | |
| | 270 | | Johnson Controls, Inc. | | | 9,083 | |
| | | | | | | 29,245 | |
| | | | Banks - 4.7% | | | | |
| | 291 | | Itau Unibanco Banco Multiplo S.A. ADR | | | 6,302 | |
| | 205 | | SunTrust Banks, Inc. | | | 6,060 | |
| | 652 | | Wells Fargo & Co. | | | 21,589 | |
| | | | | | | 33,951 | |
| | | | Capital Goods - 13.2% | | | | |
| | 161 | | Boeing Co. | | | 11,662 | |
| | 26 | | Caterpillar, Inc. | | | 1,766 | |
| | 73 | | Cummins, Inc. | | | 5,239 | |
| | 90 | | Eaton Corp. | | | 6,954 | |
| | 87 | | General Dynamics Corp. | | | 6,626 | |
| | 156 | | Honeywell International, Inc. | | | 7,415 | |
| | 192 | | Illinois Tool Works, Inc. | | | 9,799 | |
| | 274 | | Ingersoll-Rand plc | | | 10,122 | |
| | 535 | | Masco Corp. | | | 8,686 | |
| | 330 | | PACCAR, Inc. | | | 15,338 | |
| | 39 | | Precision Castparts Corp. | | | 5,021 | |
| | 57 | | Siemens AG ADR | | | 5,553 | |
| | | | | | | 94,181 | |
| | | | Consumer Durables & Apparel - 1.9% | | | | |
| | 124 | | Coach, Inc. | | | 5,169 | |
| | 585 | | D.R. Horton, Inc. | | | 8,593 | |
| | | | | | | 13,762 | |
| | | | Consumer Services - 4.3% | | | | |
| | 131 | | Apollo Group, Inc. Class A ● | | | 7,545 | |
| | 626 | | International Game Technology | | | 13,189 | |
| | 519 | | MGM Mirage, Inc. ● | | | 8,246 | |
| | 54 | | Starbucks Corp. | | | 1,415 | |
| | | | | | | 30,395 | |
| | | | Diversified Financials - 5.5% | | | | |
| | 213 | | Ameriprise Financial, Inc. | | | 9,874 | |
| | 111 | | Goldman Sachs Group, Inc. | | | 16,131 | |
| | 232 | | Moody's Corp. | | | 5,734 | |
| | 513 | | UBS AG | | | 7,941 | |
| | | | | | | 39,680 | |
| | | | Energy - 5.7% | | | | |
| | 157 | | Consol Energy, Inc. | | | 7,035 | |
| | 148 | | Halliburton Co. | | | 4,546 | |
| | 152 | | Hess Corp. | | | 9,679 | |
| | 124 | | National Oilwell Varco, Inc. | | | 5,443 | |
| | 204 | | Schlumberger Ltd. | | | 14,596 | |
| | | | | | | 41,299 | |
| | | | Health Care Equipment & Services - 1.0% | | | | |
| | 144 | | Covidien plc | | | 6,917 | |
| | | | | | | | |
| | | | Insurance - 3.9% | | | | |
| | 828 | | Lincoln National Corp. | | | 25,318 | |
| | 126 | | Progressive Corp. | | | 2,530 | |
| | | | | | | 27,848 | |
| | | | Materials - 4.0% | | | | |
| | 155 | | Barrick Gold Corp. | | | 6,746 | |
| | 111 | | BHP Billiton Ltd. ADR | | | 8,099 | |
| | 83 | | Freeport-McMoRan Copper & Gold, Inc. | | | 6,250 | |
| | 148 | | Mosaic Co. | | | 7,590 | |
| | | | | | | 28,685 | |
| | | | Pharmaceuticals, Biotechnology & Life Sciences - 1.8% | |
| | 119 | | Celgene Corp. ● | | | 7,350 | |
| | 95 | | Teva Pharmaceutical Industries Ltd. ADR | | | 5,581 | |
| | | | | | | 12,931 | |
| | | | Retailing - 6.1% | | | | |
| | 46 | | Amazon.com, Inc. ● | | | 6,347 | |
| | 165 | | Kohl's Corp. ● | | | 9,049 | |
| | 388 | | Lowe's Co., Inc. | | | 10,534 | |
| | 334 | | Staples, Inc. | | | 7,857 | |
| | 172 | | Target Corp. | | | 9,772 | |
| | | | | | | 43,559 | |
| | | | Semiconductors & Semiconductor Equipment - 5.9% | |
| | 297 | | Altera Corp. | | | 7,521 | |
| | 268 | | Analog Devices, Inc. | | | 8,032 | |
| | 749 | | Intel Corp. | | | 17,094 | |
| | 363 | | Texas Instruments, Inc. | | | 9,439 | |
| | | | | | | 42,086 | |
| | | | Software & Services - 18.7% | | | | |
| | 131 | | Accenture plc | | | 5,735 | |
| | 278 | | BMC Software, Inc. ● | | | 10,949 | |
| | 119 | | Citrix Systems, Inc. ● | | | 5,610 | |
| | 514 | | eBay, Inc. ● | | | 12,242 | |
| | 32 | | Google, Inc. ● | | | 16,914 | |
| | 52 | | Mastercard, Inc. | | | 12,916 | |
| | 155 | | McAfee, Inc. ● | | | 5,387 | |
| | 917 | | Microsoft Corp. | | | 28,014 | |
| | 906 | | Oracle Corp. | | | 23,418 | |
| | 137 | | VeriSign, Inc. ● | | | 3,733 | |
| | 539 | | Western Union Co. | | | 9,837 | |
| | | | | | | 134,755 | |
| | | | Technology Hardware & Equipment - 18.3% | |
| | 141 | | Apple, Inc. ● | | | 36,909 | |
| | 1,230 | | Cisco Systems, Inc. ● | | | 33,107 | |
| | 580 | | Dell, Inc. ● | | | 9,385 | |
| | 843 | | EMC Corp. ● | | | 16,030 | |
| | 394 | | Juniper Networks, Inc. ● | | | 11,193 | |
| | 542 | | NetApp, Inc. ● | | | 18,804 | |
| | 165 | | Qualcomm, Inc. | | | 6,390 | |
| | | | | | | 131,818 | |
| | | | Transportation - 0.6% | | | | |
| | 48 | | FedEx Corp. | | | 4,328 | |
| | | | | | | | |
| | | | Total common stocks | | | | |
| | | | (cost $583,136) | | $ | 715,440 | |
| | | | | | | | |
| | | | Total long-term investments | | | | |
| | | | (cost $583,136) | | $ | 715,440 | |
The accompanying notes are an integral part of these financial statements.
| Shares or Principal Amount | | Market Value ╪ | |
| SHORT-TERM INVESTMENTS - 0.4% | | | | |
| | | Repurchase Agreements - 0.4% | | | | |
| | | BNP Paribas Securities Corp. TriParty Joint | | | |
| | | Repurchase Agreement (maturing on | | | | |
| | | 05/03/2010 in the amount of $302, | | | | |
| | | collateralized by FHLMC 4.00% - 7.50%, | | | |
| | | 2012 - 2040, FNMA 4.00% - 6.50%, 2010 - | | | |
| | | 2040, value of $308) | | | | |
| $ | 302 | | 0.20%, 04/30/2010 | | | $ | 302 | |
| | | | Deutsche Bank Securities TriParty Joint | | | | | |
| | | | Repurchase Agreement (maturing on | | | | | |
| | | | 05/03/2010 in the amount of $1,124, | | | | | |
| | | | collateralized by FNMA 3.50% - 9.00%, | | | | |
| | | | 2013 - 2048, value of $1,147) | | | | | |
| | 1,123 | | 0.20%, 04/30/2010 | | | | 1,123 | |
| | | | JP Morgan Chase TriParty Joint Repurchase | | | | |
| | | | Agreement (maturing on 05/03/2010 in the | | | | |
| | | | amount of $347, collateralized by FHLMC | | | | |
| | | | 6.00% - 6.50%, 2038, value of $353) | | | | | |
| | 347 | | 0.20%, 04/30/2010 | | | | 347 | |
| | | | Morgan Stanley & Co., Inc. TriParty Joint | | | | |
| | | | Repurchase Agreement (maturing on | | | | | |
| | | | 05/03/2010 in the amount of $702, | | | | | |
| | | | collateralized by FHLMC 4.00% - 6.50%, | | | | |
| | | | 2017 - 2040, FNMA 3.50% - 6.50%, 2018 - | | | | |
| | | | 2040, value of $717) | | | | | |
| | 702 | | 0.19%, 04/30/2010 | | | | 702 | |
| | | | UBS Securities, Inc. Repurchase Agreement | | | | |
| | | | (maturing on 05/03/2010 in the amount of | | | | |
| | | | $5, collateralized by U.S. Treasury Bond | | | | |
| | | | 7.63%, 2022, value of $5) | | | | | |
| | 5 | | 0.18%, 04/30/2010 | | | | 5 | |
| | | | UBS Securities, Inc. TriParty Joint Repurchase | | | | |
| | | | Agreement (maturing on 05/03/2010 in the | | | | |
| | | | amount of $411, collateralized by U.S. | | | | |
| | | | Treasury Note 3.00%, 2017, value of $419) | | | | |
| | 411 | | 0.20%, 04/30/2010 | | | | 411 | |
| | | | | | | | 2,890 | |
| | | | Total short-term investments | | | | | |
| | | | (cost $2,890) | | | $ | 2,890 | |
| | | | | | | | | |
| | | | Total investments | | | | | |
| | | | (cost $586,026) ▲ | 100.1% | | $ | 718,330 | |
| | | | Other assets and liabilities | (0.1)% | | | (365 | ) |
| | | | Total net assets | 100.0% | | $ | 717,965 | |
| Note: | Percentage of investments as shown is the ratio of the total market value to total net assets. Market value of investments in foreign securities represents 5.6% of total net assets at April 30, 2010. |
Foreign securities that are principally traded on certain foreign markets are adjusted daily pursuant to a third party pricing service methodology approved by the Board of Directors in order to reflect an adjustment for factors occurring after the close of the foreign market but before the close of the New York Stock Exchange.
| ▲ | At April 30, 2010, the cost of securities for federal income tax purposes was $602,282 and the aggregate gross unrealized appreciation and depreciation based on that cost were: |
| Unrealized Appreciation | | $ | 137,295 | |
| Unrealized Depreciation | | | (21,247 | ) |
| Net Unrealized Appreciation | | $ | 116,048 | |
| ● | Currently non-income producing. |
| ╪ | See Significant Accounting Policies of accompanying Notes to Financial Statements regarding valuation of securities. |
The accompanying notes are an integral part of these financial statements.
April 30, 2010 (Unaudited)
| | | Total | | | Level 1♦ | | | Level 2♦ | | | Level 3 | |
| Assets: | | | | | | | | | | | | |
| Common Stocks ‡ | | $ | 715,440 | | | $ | 707,499 | | | $ | 7,941 | | | $ | – | |
| Short-Term Investments | | | 2,890 | | | | – | | | | 2,890 | | | | – | |
| Total | | $ | 718,330 | | | $ | 707,499 | | | $ | 10,831 | | | $ | – | |
| ♦ | For the period ended April 30, 2010, there were no significant transfers between Level 1 and Level 2. |
| ‡ | The Fund has all or primarily all of these equity securities categorized in a single level. Refer to the Schedule of Investments for further industry breakout. |
The accompanying notes are an integral part of these financial statements.
April 30, 2010 (Unaudited)
| Assets: | | | |
| Investments in securities, at market value (cost $586,026) | | $ | 718,330 | |
| Cash | | | — | |
| Receivables: | | | | |
| Investment securities sold | | | 3,214 | |
| Fund shares sold | | | 514 | |
| Dividends and interest | | | 440 | |
| Other assets | | | 123 | |
| Total assets | | | 722,621 | |
| Liabilities: | | | | |
| Payables: | | | | |
| Investment securities purchased | | | 3,629 | |
| Fund shares redeemed | | | 726 | |
| Investment management fees | | | 60 | |
| Administrative fees | | | — | |
| Distribution fees | | | 21 | |
| Accrued expenses | | | 220 | |
| Total liabilities | | | 4,656 | |
| Net assets | | $ | 717,965 | |
| Summary of Net Assets: | | | | |
| Capital stock and paid-in-capital | | $ | 738,401 | |
| Accumulated net investment loss | | | (755 | ) |
| Accumulated net realized loss on investments and foreign currency transactions | | | (151,990 | ) |
| Unrealized appreciation of investments and the translation of assets and liabilities denominated in foreign currency | | | 132,309 | |
| Net assets | | $ | 717,965 | |
| Shares authorized | | | 27,000,000 | |
| Par value | | $ | 0.0001 | |
Class A: Net asset value per share/Maximum offering price per share | | | $15.78/$16.70 | |
| Shares outstanding | | | 17,777 | |
| Net assets | | $ | 280,448 | |
Class B: Net asset value per share | | $ | 13.27 | |
| Shares outstanding | | | 1,484 | |
| Net assets | | $ | 19,694 | |
Class C: Net asset value per share | | $ | 13.27 | |
| Shares outstanding | | | 3,537 | |
| Net assets | | $ | 46,930 | |
Class I: Net asset value per share | | $ | 15.93 | |
| Shares outstanding | | | 3,912 | |
| Net assets | | $ | 62,312 | |
Class L: Net asset value per share/Maximum offering price per share | | | $16.10/$16.90 | |
| Shares outstanding | | | 12,125 | |
| Net assets | | $ | 195,210 | |
Class R3: Net asset value per share | | $ | 16.06 | |
| Shares outstanding | | | 13 | |
| Net assets | | $ | 206 | |
Class R4: Net asset value per share | | $ | 16.22 | |
| Shares outstanding | | | 194 | |
| Net assets | | $ | 3,148 | |
Class R5: Net asset value per share | | $ | 16.28 | |
| Shares outstanding | | | 8 | |
| Net assets | | $ | 131 | |
Class Y: Net asset value per share | | $ | 16.41 | |
| Shares outstanding | | | 6,698 | |
| Net assets | | $ | 109,886 | |
The accompanying notes are an integral part of these financial statements.
For the Six-Month Period Ended April 30, 2010 (Unaudited)
| Investment Income: | | | |
| Dividends | | $ | 3,446 | |
| Interest | | | 6 | |
| Less: Foreign tax withheld | | | (62 | ) |
| Total investment income | | | 3,390 | |
| | | | | |
| Expenses: | | | | |
| Investment management fees | | | 2,600 | |
| Administrative services fees | | | 2 | |
| Transfer agent fees | | | 449 | |
| Distribution fees | | | | |
| Class A | | | 341 | |
| Class B | | | 98 | |
| Class C | | | 231 | |
| Class L | | | 233 | |
| Class R3 | | | — | |
| Class R4 | | | 4 | |
| Custodian fees | | | 7 | |
| Accounting services fees | | | 42 | |
| Registration and filing fees | | | 63 | |
| Board of Directors' fees | | | 2 | |
| Audit fees | | | 12 | |
| Other expenses | | | 133 | |
| Total expenses (before waivers and fees paid indirectly) | | | 4,217 | |
| Expense waivers | | | (45 | ) |
| Transfer agent fee waivers | | | (17 | ) |
| Commission recapture | | | (13 | ) |
| Custodian fee offset | | | — | |
| Total waivers and fees paid indirectly | | | (75 | ) |
| Total expenses, net | | | 4,142 | |
| Net Investment Loss | | | (752 | ) |
| Net Realized Gain on Investments and Foreign Currency Transactions: | | | | |
| Net realized gain on investments in securities | | | 35,251 | |
| Net realized gain on forward foreign currency contracts | | | 75 | |
| Net realized loss on other foreign currency transactions | | | (74 | ) |
| Net Realized Gain on Investments and Foreign Currency Transactions | | | 35,252 | |
Net Changes in Unrealized Appreciation of Investments and Foreign Currency Transactions: | | | | |
| Net unrealized appreciation of investments | | | 70,209 | |
| Net unrealized depreciation on translation of other assets and liabilities in foreign currencies | | | (3 | ) |
Net Changes in Unrealized Appreciation of Investments and Foreign Currency Transactions | | | 70,206 | |
| Net Gain on Investments and Foreign Currency Transactions | | | 105,458 | |
| Net Increase in Net Assets Resulting from Operations | | $ | 104,706 | |
The accompanying notes are an integral part of these financial statements.
| | | For the Six-Month | | | | |
| | | Period Ended | | | For the | |
| | | April 30, 2010 | | | Year Ended | |
| | | (Unaudited) | | | October 31, 2009 | |
| Operations: | | | | | | |
| Net investment income (loss) | | $ | (752 | ) | | $ | 1,329 | |
| Net realized gain (loss) on investments and foreign currency transactions | | | 35,252 | | | | (160,105 | ) |
| Net unrealized appreciation of investments and foreign currency transactions | | | 70,206 | | | | 262,584 | |
| Net Increase In Net Assets Resulting From Operations | | | 104,706 | | | | 103,808 | |
| Distributions to Shareholders: | | | | | | | | |
| From net investment income | | | | | | | | |
| Class I | | | (239 | ) | | | — | |
| Class L | | | (500 | ) | | | — | |
| Class R3 | | | — | | | | — | |
| Class R4 | | | (5 | ) | | | — | |
| Class R5 | | | (1 | ) | | | — | |
| Class Y | | | (509 | ) | | | — | |
| Total distributions | | | (1,254 | ) | | | — | |
| Capital Share Transactions: | | | | | | | | |
| Class A | | | (21,438 | ) | | | (79,462 | ) |
| Class B | | | (2,529 | ) | | | (3,364 | ) |
| Class C | | | (4,470 | ) | | | (8,149 | ) |
| Class I | | | (802 | ) | | | (750 | ) |
| Class L | | | (10,570 | ) | | | (18,332 | ) |
| Class R3 | | | 15 | | | | 85 | |
| Class R4 | | | 194 | | | | 786 | |
| Class R5 | | | 25 | | | | 27 | |
| Class Y | | | (5,805 | ) | | | (29,680 | ) |
| Net decrease from capital share transactions | | | (45,380 | ) | | | (138,839 | ) |
| Net Increase (Decrease) In Net Assets | | | 58,072 | | | | (35,031 | ) |
| Net Assets: | | | | | | | | |
| Beginning of period | | | 659,893 | | | | 694,924 | |
| End of period | | $ | 717,965 | | | $ | 659,893 | |
| Accumulated undistributed (distribution in excess of) net investment income (loss) | | $ | (755 | ) | | $ | 1,251 | |
The accompanying notes are an integral part of these financial statements.
April 30, 2010 (Unaudited)
The Hartford Mutual Funds II, Inc. (“Company”) is an open-end management investment company comprised of five portfolios. Financial statements for The Hartford Growth Fund (the “Fund”), a series of the Company, are included in this report.
The Company is organized under the laws of the State of Maryland and is registered with the Securities and Exchange Commission (“SEC”) under the Investment Company Act of 1940, as amended (“1940 Act”). The Fund is a diversified open-end management investment company.
Class A shares are sold with a front-end sales charge of up to 5.50%. Class B shares were sold with a contingent deferred sales charge which is assessed on the lesser of the per share net asset value (“NAV”) of the shares at the time of redemption or the original purchase price, and declines from up to 5.00% to zero depending on the period of time the shares are held (See note below regarding the closing of Class B shares). Class C shares are sold with a contingent deferred sales charge of up to 1.00% on shares redeemed within twelve months of purchase. Class I shares are sold without sales charges to certain eligible investors through advisory fee-based wrap programs. Class L shares are sold with a sales charge of up to 4.75%. Classes R3, R4 and R5 shares, which are offered to employer-sponsored retirement plans, and Class Y shares, which are sold to certain eligible institutional investors, are sold without a sales charge. All classes of shares have identical voting, redemption, dividend, liquidation and other rights and the same terms and conditions, with the exceptions that each class may have different expenses, which may affect performance, and that Class B shares automatically convert to Class A shares after 8 years.
No new or additional investments are allowed in Class B shares of The Hartford Mutual Funds (including investments through any systematic investment plan). Existing shareholders of Class B shares may continue to hold their Class B shares, exchange their Class B shares for Class B shares of another Hartford Mutual Fund (as permitted by existing exchange privileges), or redeem their Class B shares as described in the Fund’s prospectus. Reinstatement privileges with respect to Class B shares will continue under the current policy. For investors electing to reinvest capital gains and dividends, any such capital gains or dividends on Class B shares will continue to be reinvested in Class B shares of the Fund. All Class B share attributes, including the 12b-1 fee, contingent deferred sales charge schedule, and conversion to Class A shares remain unchanged.
| 2. | Significant Accounting Policies: |
The following is a summary of significant accounting policies of the Fund, which are in accordance with U.S. Generally Accepted Accounting Principles (“GAAP”).
| | a) | Security Transactions and Investment Income – Security transactions are recorded on the trade date (the date the order to buy or sell is executed). Security gains and losses are determined on the basis of identified cost. |
Dividend income is accrued as of the ex-dividend date, except that certain dividends for foreign securities where the ex-dividend date may have passed are recorded as soon as the Fund is informed of the dividend in the exercise of reasonable diligence. Interest income, including amortization of premium and accretion of discounts, is accrued on a daily basis.
| | b) | Security Valuation – The Fund generally uses market prices in valuing portfolio securities. If market prices are not readily available or are deemed unreliable, the Fund will use the fair value of the security as determined in good faith under policies and procedures established by and under the supervision of the Fund’s Board of Directors. Market prices may be deemed unreliable, for example, if a security is thinly traded or if an event has occurred after the close of the security’s primary market, but before the close of the New York Stock Exchange (the “Exchange”) (generally 4:00 p.m. Eastern Time, referred to as the “Valuation Time”) that is expected to affect the value of the portfolio security. The circumstances in which the Fund may use fair value pricing include, among others: (i) the occurrence of events that are |
significant to a particular issuer, such as mergers, restructuring or defaults; (ii) the occurrence of events that are significant to an entire market, such as natural disasters in a particular region or governmental actions; (iii) trading restrictions on securities; (iv) thinly traded securities and (v) market events such as trading halts and early market closings. In addition, with respect to the valuation of stocks primarily traded on foreign markets, the Fund uses a fair value pricing service approved by the Fund’s Board of Directors, which employs quantitative models that evaluate changes in the value of foreign market proxies (e.g., futures contracts, American Depositary Receipts, exchange traded funds (“ETF’s”)) after the close of the foreign markets but before the Valuation Time. Securities that are primarily traded on foreign markets may trade on days that are not business days of the Fund. The value of the foreign securities in which the Fund invests may change on days when a shareholder will not be able to purchase or redeem shares of the Fund. Fair value pricing is subjective in nature and the use of fair value pricing by the Fund may cause the NAV of its shares to differ significantly from the NAV that would have been calculated using market prices at the close of the exchange on which a portfolio security is primarily traded but before the Valuation Time. There can be no assurance that the Fund could obtain the fair value assigned to a security if the Fund were to sell the security at approximately the time at which the Fund determines its NAV.
Exchange-traded equity securities are valued at the last reported sale price on the exchange or market on which the security is primarily traded (the “Primary Market”) at the Valuation Time. If the security did not trade on the Primary Market, it may be valued at the Valuation Time at the last reported sale price on another exchange where it trades. The value of an equity security not traded on any exchange but traded on the Nasdaq Stock Market, Inc. (“Nasdaq”) or another over-the-counter market shall be valued at the last reported sale price or official closing price on the exchange or market on which the security is traded as of the Valuation Time.
Foreign-denominated assets, including investment securities, and liabilities are translated from the local currency into U.S. dollars using exchange rates obtained from an independent third party as of the Fund’s Valuation Time.
Financial instruments for which prices are not available from an independent pricing service are valued using market quotations obtained from one or more dealers that make markets in securities in accordance with procedures established by the Fund’s Board of Directors.
Forward foreign currency contracts represent agreements to exchange currencies on specific future dates at predetermined rates. Forward foreign currency contracts are valued using foreign currency exchange rates and forward rates on the Valuation Date from an independent pricing service.
Other derivative or contractual type instruments shall be valued using market prices if such instruments trade on an exchange or market. If such instruments do not trade on an exchange or market, such instruments shall be valued at a price at which the counterparty to such contract would repurchase the instrument. In the event that the counterparty cannot provide a price, such valuation may be determined in accordance with procedures established by the Fund’s Board of Directors.
Various inputs are used in determining the value of the Fund’s investments. These inputs are summarized into three broad hierarchy levels. This hierarchy is based on whether the valuation inputs are observable or unobservable. These levels are:
| | ● | Level 1 – Quoted prices in active markets for identical securities. Level 1 may include exchange-traded instruments such as domestic equities, some foreign equities, options, futures, mutual funds, ETF’s, and rights and warrants. |
| | ● | Level 2 – Observable inputs other than Level 1 prices, such as quoted prices for similar securities; quoted prices in markets that are not active; or other inputs that are observable or can be corroborated by observable market data for substantially the full term of the security. Level 2 may include debt securities that are traded less frequently than exchange-traded instruments and that are valued using third party pricing services; foreign equities, whose value is determined using a multi-factor regression model with inputs that are observable in the market; and money market instruments, which are carried at amortized cost. |
Notes to Financial Statements – (continued)
April 30, 2010 (Unaudited)
| | ● | Level 3 – Significant unobservable inputs that are supported by little or no market activity. Level 3 may include financial instruments whose values are determined using broker quotes or require significant management judgment or estimation. These unobservable valuation inputs may include estimates for current yields, maturity/duration, prepayment speed, and broker quotes for comparable securities along with other assumptions relating to credit quality, collateral value, complexity of the security structure, general market conditions and liquidity. This category may include securities where trading has been halted or there are certain restrictions on trading. While these securities are priced using unobservable inputs, the valuation of these securities reflects the best available data and management believes the prices are a reasonable representation of exit price. |
Individual securities within any of the above mentioned asset classes may be assigned a different hierarchical level than those presented above, as individual circumstances dictate.
During the six-month period ended April 30, 2010, the Fund held no Level 3 securities, therefore no reconciliation of Level 3 securities is presented.
Refer to the Investment Valuation Hierarchy Level Summary found following the Schedule of Investments.
| | c) | Foreign Currency Transactions – Assets and liabilities denominated in currencies other than U.S. dollars are translated into U.S. dollars at the exchange rates in effect on the valuation date. Purchases and sales of investment securities, income and expenses are translated into U.S. dollars at the exchange rates on the dates of such transactions. |
The Fund does not isolate that portion of portfolio security valuation resulting from fluctuations in the foreign currency exchange rates from the fluctuations arising from changes in the market prices of securities held. Exchange rate fluctuations are included with the net realized and unrealized gain or loss on investments in the accompanying financial statements.
Net realized foreign exchange gains or losses arise from sales of foreign currencies and the difference between asset and liability amounts initially stated in foreign currencies and the U.S. dollar value of the amounts actually received or paid. Net unrealized foreign exchange gains or losses arise from changes in the value of other assets and liabilities at the end of the reporting period, resulting from changes in the exchange rates.
| | d) | Joint Trading Account – Pursuant to an exemptive order issued by the SEC, the Fund may transfer uninvested cash balances into a joint trading account managed by Wellington Management Company, LLP (“Wellington”). These balances may be invested in one or more repurchase agreements and/or short-term money market instruments. |
| | e) | Repurchase Agreements – A repurchase agreement is an agreement by which a counterparty agrees to sell a security and agrees to repurchase the security sold at a mutually agreed upon time and price. At the time the Fund enters into a repurchase agreement, the value of the underlying collateral security(ies), including accrued interest, will be equal to or exceed the value of the repurchase agreement. To minimize counterparty risk, the securities that serve to collateralize the repurchase agreement are held by the Fund's custodian in book entry or physical form in the custodial account of the Fund or in a third party custodial account. Repurchase agreements are valued at cost plus accrued interest. The Fund, as shown on the Schedule of Investments, had outstanding repurchase agreements as of April 30, 2010. |
| | f) | Forward Foreign Currency Contracts – The Fund may enter into forward foreign currency contracts that obligate the Fund to purchase or sell currencies at specified future dates. Forward foreign currency contracts may be used to hedge against adverse fluctuations in exchange rates between currencies. |
Forward foreign currency contracts involve elements of market risk in excess of the amounts reflected in the Statement of Assets and Liabilities. In addition, risks may arise upon entering into these contracts from the potential inability of the counterparties to meet the terms of the contracts and from unanticipated movements in the value of the foreign currencies relative to the U.S. dollar. The Fund had no outstanding forward foreign currency contracts as of April 30, 2010.
| | g) | Fund Share Valuation and Dividend Distributions to Shareholders – Orders for the Fund’s shares are executed in accordance with the investment instructions of the shareholders. The NAV of the Fund’s shares is determined as of the close of each business day of the Exchange. The NAV is determined separately for each class of the Fund by dividing the Fund’s net assets attributable to that class by the number of shares of the class outstanding. Orders for the purchase of the Fund’s shares prior to the close of the Exchange on any day on which the Exchange is open for business are priced at the NAV determined as of the close of the Exchange. Orders after the close of the Exchange, or on a day on which the Exchange and/or the Fund is not open for business, are priced at the next determined NAV. |
The Fund intends to distribute substantially all of its net investment income and net realized capital gains to shareholders no less frequently than once a year. Normally, dividends from net investment income of the Fund are declared and paid annually. Unless shareholders specify otherwise, all dividends will be automatically reinvested in additional full or fractional shares of the Fund.
Distributions from net investment income, realized capital gains and capital are determined in accordance with federal income tax regulations, which may differ from U.S. GAAP with respect to character and timing. These differences may include but are not limited to losses deferred due to wash sale adjustments, foreign currency gains and losses, adjustments related to Passive Foreign Investment Companies (“PFICs”), Real Estate Investment Trusts (“REITs”), Regulated Investment Companies (“RICs”), certain derivatives and partnerships. Permanent book and federal income tax basis differences relating to shareholder distributions will result in reclassifications to certain of the Fund’s capital accounts (see Federal Income Taxes: Reclassification of Capital Accounts footnote).
| | h) | Use of Estimates – The preparation of financial statements in conformity with U.S. GAAP requires management to make estimates and assumptions that affect the reported amounts of assets and liabilities as of the date of the financial statements and the reported amounts of income and expenses during the period. Operating results in the future could vary from the amounts derived from management’s estimates. |
| | i) | Additional Derivative Instrument(s) Information |
The volume of derivative activity was minimal during the six-month period ended April 30, 2010.
Realized Gain/Loss and Change in Unrealized Appreciation (Depreciation) on Derivative Instruments for the six-month period ended April 30, 2010:
| | Amount of Realized Gain or (Loss) on Derivatives Recognized in Income | |
| | | | | | | | | | | | Forward | | | | | | | |
| | | Written | | | Purchased | | | | | | Currency | | | | | | | |
| Risk Exposure Category | Options | | | Options | | | Futures | | | Contracts | | | Swaps | | | Total | |
| Foreign exchange contracts | | $ | — | | | $ | — | | | $ | — | | | $ | 75 | | | $ | — | | | $ | 75 | |
| Total | | $ | — | | | $ | — | | | $ | — | | | $ | 75 | | | $ | — | | | $ | 75 | |
| | j) | Indemnifications – Under the Company’s organizational documents, the Company shall indemnify its officers and directors to the full extent required or permitted under Maryland General Corporation Law and the federal securities law. In addition, the Company, on behalf of the Fund, may enter into contracts that contain a variety of indemnifications. The Company’s maximum exposure under these arrangements is unknown. However, the Company has not had prior claims or losses pursuant to these contracts and expects the risk of loss to be remote. |
| | a) | Federal Income Taxes – For federal income tax purposes, the Fund intends to continue to qualify as a RIC under Subchapter M of the Internal Revenue Code (“IRC”) by distributing substantially all of its taxable net investment income |
Notes to Financial Statements – (continued)
April 30, 2010 (Unaudited)
| | | and net realized capital gains to its shareholders and otherwise complying with the requirements of RICs. The Fund has distributed substantially all of its income and capital gains in prior years and intends to distribute substantially all of its income and capital gains during the calendar year ending December 31, 2010. Accordingly, no provision for federal income or excise taxes has been made in the accompanying financial statements. Distributions from short-term capital gains are treated as ordinary income distributions for federal income tax purposes. |
| | | |
| | b) | Net Investment Income (Loss), Net Realized Gains (Losses) – Net investment income (loss) and net realized gains (losses) may differ for financial statement and tax purposes primarily because of losses deferred due to wash sale adjustments, foreign currency gains and losses, adjustments related to PFICs, REITs, RICs, certain derivatives and partnerships. The character of distributions made during the year from net investment income or net realized gains may differ from their ultimate characterization for federal income tax purposes. Also, due to the timing of dividend distributions, the fiscal year in which amounts are distributed may differ from the year that the income or realized gains (losses) were recorded by the Fund. |
| | c) | Distributions and Components of Distributable Earnings – The tax character of distributions paid by the Fund for the periods indicated is as follows (as adjusted for dividends payable): |
| | For the Year Ended | | | For the Year Ended | |
| | October 31, 2009 | | | October 31, 2008 | |
| Ordinary Income | | $ | — | | | $ | 9,424 | |
| Long-Term Capital Gains * | | | — | | | | 81,619 | |
| | * | The Fund designates these distributions as long-term capital gain dividends pursuant to IRC code Sec. 852(b)(3)(C). |
As of October 31, 2009, the Fund’s components of distributable earnings (deficit) on a tax basis were as follows:
| | | Amount | |
| Undistributed Ordinary Income | | $ | 1,251 | |
| Accumulated Capital Losses * | | | (170,986 | ) |
Unrealized Appreciation † | | | 45,847 | |
| Total Accumulated Deficit | | $ | (123,888 | ) |
| | * | The Fund has capital loss carryforwards that are identified in the Capital Loss Carryforward note that follows. |
| | † | The differences between book-basis and tax-basis unrealized appreciation (depreciation) may be attributable to the losses deferred due to wash sale adjustments, foreign currency gains and losses, adjustments related to PFICs, REITs, RICs, certain derivatives and partnerships. |
| | d) | Reclassification of Capital Accounts – The Fund may record reclassifications in its capital accounts. These reclassifications have no impact on the total net assets of the Fund. The reclassifications are a result of permanent differences between GAAP and tax accounting for such items as net operating losses that reduce distribution requirements. Adjustments are made to reflect the impact these items have on current and future distributions to shareholders. Therefore, the source of the Fund’s distributions may be shown in the accompanying Statement of Changes in Net Assets as from net investment income, from net realized gains on investments or from capital depending on the type of book and tax differences that exist. For the year ended October 31, 2009, the Fund recorded reclassifications to increase (decrease) the accounts listed below: |
| | | Amount | |
| Undistributed Net Investment Income | | $ | (78 | ) |
| Accumulated Net Realized Gain | | | 78 | |
| | e) | Capital Loss Carryforward – At October 31, 2009 (tax-year-end), the Fund had capital loss carryforwards for U.S. federal income tax purposes of approximately: |
| Year of Expiration | | Amount | |
| 2016 | | $ | 21,260 | |
| 2017 | | | 149,726 | |
| Total | | $ | 170,986 | |
| | f) | Accounting for Uncertainty in Income Taxes – Management has evaluated all open tax years and has determined there is no impact to the Fund’s financial statements related to uncertain tax positions. Generally, tax authorities can examine all tax returns filed for the last three years. |
| | a) | Investment Management Agreement – Hartford Investment Financial Services, LLC (“HIFSCO”) serves as investment manager to the Fund pursuant to an Investment Management Agreement with the Company. As investment manager, HIFSCO has overall investment supervisory responsibility for the Fund. In addition, HIFSCO provides administrative personnel, services, equipment, facilities and office space for proper operation of the Fund. HIFSCO has contracted with Wellington for the provision of day-to-day investment management services to the Fund in accordance with the Fund’s investment objective and policies. The Fund pays a fee to HIFSCO, a portion of which may be used to compensate Wellington. |
The schedule below reflects the rates of compensation paid to HIFSCO for investment management services rendered during the six-month period ended April 30, 2010; the rates are accrued daily and paid monthly:
| Average Daily Net Assets | Annual Fee | |
| On first $100 million | 0.9000% | |
| On next $150 million | 0.8000% | |
| On next $4.75 billion | 0.7000% | |
| On next $5 billion | 0.6975% | |
| Over $10 billion | 0.6950% | |
| | b) | Accounting Services Agreement – Pursuant to the Fund Accounting Agreement between Hartford Life Insurance Company (“HLIC”) and the Fund, HLIC provides accounting services to the Fund and receives monthly compensation on the Fund’s average net assets. The Fund’s accounting services fees are accrued daily and paid monthly. |
| Average Daily Net Assets | Annual Fee | |
| On first $5 billion | 0.012% | |
| Over $5 billion | 0.010% | |
| | c) | Operating Expenses – Allocable expenses incurred by the Company are allocated to each Fund and allocated to classes within the Fund in proportion to the average daily net assets of the Fund and each class, except where allocation of certain expenses is more fairly made directly to the Fund or to specific classes within a Fund. During the six-month period ended April 30, 2010, HIFSCO has contractually limited the total operating expenses of this Fund, exclusive of taxes, interest expense, brokerage commissions, certain distribution expenses and extraordinary expenses as follows: |
| Class A | Class B | Class C | Class I | Class L | Class R3 | Class R4 | Class R5 | Class Y |
| 1.30% | 2.05% | 2.05% | 1.05% | 1.42% | 1.55% | 1.25% | 0.95% | 0.95% |
Notes to Financial Statements – (continued)
April 30, 2010 (Unaudited)
| | d) | Fees Paid Indirectly – The Fund has entered into agreements with State Street Global Markets, LLC and Russell Implementation Services Inc. to partially recapture non-discounted trade commissions. Such rebates are used to pay a portion of the Fund’s expenses. In addition, the Fund’s custodian bank has also agreed to reduce its fees when the Fund maintains cash on deposit in a non-interest-bearing custody account. For the six-month period ended April 30, 2010, these amounts are included in the Statement of Operations. |
The ratio of expenses to average net assets in the accompanying financial highlights excludes the reduction in expenses related to fees paid indirectly. Had the fees paid indirectly been included, the annualized expense ratio for the periods listed below would have been as follows:
| | | Annualized | | | | | | | | | | | | | | | | |
| | | Six-Month | | | | | | | | | | | | | | | | |
| | | Period | | | Year Ended | | | Year Ended | | | Year Ended | | | Year Ended | | | Year Ended | |
| | | Ended April | | | October 31, | | | October 31, | | | October 31, | | | October 31, | | | October 31, | |
| | | | 30, 2010 | | | 2009 | | | 2008 | | | 2007 | | | 2006 | | | 2005 | |
| Class A Shares | | | 1.30% | | | | 1.23% | | | | 1.27% | | | | 1.27% | | | | 1.31% | | | | 1.31% | |
| Class B Shares | | | 2.05 | | | | 1.68 | | | | 1.91 | | | | 2.08 | | | | 2.08 | | | | 2.13 | |
| Class C Shares | | | 2.00 | | | | 2.04 | | | | 1.97 | | | | 1.98 | | | | 2.00 | | | | 2.03 | |
| Class I Shares | | | 0.91 | | | | 0.93 | | | | 0.89 | | | | 0.90 | | | | 0.91* | | | | | |
| Class L Shares | | | 1.06 | | | | 1.06 | | | | 1.03 | | | | 1.04 | | | | 1.03 | | | | 1.04 | |
| Class R3 Shares | | | 1.55 | | | | 1.54 | | | | 1.55 | | | | 1.57† | | | | | | | | | |
| Class R4 Shares | | | 1.23 | | | | 1.22 | | | | 1.20 | | | | 1.18† | | | | | | | | | |
| Class R5 Shares | | | 0.95 | | | | 0.94 | | | | 0.92 | | | | 0.91† | | | | | | | | | |
| Class Y Shares | | | 0.83 | | | | 0.83 | | | | 0.80 | | | | 0.81 | | | | 0.81 | | | | 0.83 | |
| | * | From August 31, 2006 (commencement of operations), through October 31, 2006. |
| | † | From December 22, 2006 (commencement of operations), through October 31, 2007. |
| | e) | Distribution and Service Plan for Class A, B, C, L, R3 and R4 Shares – HIFSCO is the principal underwriter and distributor of the Fund. HIFSCO is engaged in distribution activities, which include marketing and distribution of shares through broker-dealers, financing distribution costs and maintaining financial books and records. For the six-month period ended April 30, 2010, HIFSCO received front-end load sales charges of $232 and contingent deferred sales charges of $17 from the Fund. |
The Fund has adopted a Distribution and Service Plan in accordance with Rule 12b-1 of the Investment Company Act of 1940, as amended, to compensate the distributor (HIFSCO) for activities intended to result in the sale and distribution of Classes A, B, C, L, R3 and R4 shares and for providing services for shareholders. The Rule 12b-1 plan applicable to Class A shares of the Fund provides for payment of a Rule 12b-1 fee of up to 0.35% of average daily net assets; however, the Board of Directors has currently authorized 12b-1 payments of up to 0.25%. Some or all of the fee may be used for shareholder servicing expenses with the remainder used for distribution expenses. Some or the entire Rule 12b-1 fee for Class B shares may be remitted to broker-dealers for distribution and/or shareholder account services. Under the Class B Plan, the Fund pays the distributor 1.00% of the average daily net assets of Class B shares that are outstanding for 8 years or less, 0.25% of which is a fee for services provided to existing shareholders with the remainder used for distribution expenses. After eight years, Class B shares convert to Class A shares. Upon conversion to Class A shares, the Class A plan described above will apply to those shares. Under the Class C Plan, the Fund pays the distributor 1.00% of the average daily net assets of Class C shares outstanding, 0.25% of which is intended as a fee for services provided to existing shareholders with the remainder used for distribution expenses. For Class C shares, some or the entire fee may be remitted to broker-dealers for distribution and/or shareholder account services. Class L has a distribution fee of 0.25%. Class R3 shares have a distribution fee of 0.50% and Class R4 shares have a distribution fee of 0.25%. For Classes R3 and R4 shares, some or the entire fee may be remitted to broker dealers for distribution and/or shareholder account services. The Fund’s 12b-1 fees are accrued daily and paid monthly.
For the six-month period ended April 30, 2010, total sales commissions paid to affiliated brokers/dealers of The Hartford for distributing the Fund’s shares were $33. These commissions are in turn paid to sales representatives of the broker/dealers.
| | f) | Other Related Party Transactions – Certain officers of the Fund are directors and/or officers of HIFSCO and/or The Hartford or its subsidiaries. For the six-month period ended April 30, 2010, a portion of the Fund’s chief compliance officer’s salary was paid by all the investment companies in the Hartford fund complex. The portion allocated to the Fund rounds to zero. Hartford Administrative Services Company (“HASCO”), an indirect wholly owned subsidiary of The Hartford, provides transfer agent services to the Fund. HASCO has contractually agreed to reimburse any portion of the transfer agency fees over 0.30% of average daily net assets per fiscal year for all classes. HASCO was compensated $444 for providing such services. These fees are accrued daily and paid monthly. |
Administrative services fees are paid to HASCO for third-party recordkeeping services that are payable as a percentage of net assets in the amount of 0.20%, 0.15% and 0.10% for Classes R3, R4 and R5 shares, respectively. The total administrative services fees are shown on the Statement of Operations. These fees are accrued daily and paid monthly.
| | g) | Payments from Affiliate – The total return in the accompanying financial highlights includes payment from affiliates. Had the payment from affiliates been excluded, the total return for the periods listed below would have been as follows: |
| | | Impact from | | | Total Return | |
| | | Payment from | | | Excluding | |
| | | Affiliate for SEC | | | Payment from | |
| | | Settlement for the | | | Affiliate for the | |
| | | Year Ended | | | Year Ended | |
| Class A | | | 0.01% | | | | 23.90% | |
| Class B | | | 0.01 | | | | 23.00 | |
| Class C | | | 0.01 | | | | 23.08 | |
| Class I | | | 0.01 | | | | 24.35 | |
| Class L | | | 0.01 | | | | 24.20 | |
| Class Y | | | 0.01 | | | | 24.50 | |
| 5. | Investment Transactions: |
For the six-month period ended April 30, 2010, the Fund's aggregate purchases and sales of investment securities (excluding short-term investments) were as follows:
| | | Amount | |
| Cost of Purchases Excluding U.S. Government Obligations | | $ | 198,298 | |
| Sales Proceeds Excluding U.S. Government Obligations | | | 244,979 | |
As of April 30, 2010, affiliates of The Hartford had ownership of shares in the Funds as follows:
Notes to Financial Statements – (continued)
April 30, 2010 (Unaudited)
| 7. | Capital Share Transactions: |
The following information is for the six-month period ended April 30, 2010 and the year ended October 31, 2009:
| | | For the Six-Month Period Ended April 30, 2010 | | | For the Year Ended October 31, 2009 | |
| | | | | | Shares | | | | | | Shares | | | Net | | | | | | Shares | | | | | | Shares | | | Net | |
| | | | | | Issued for | | | | | | Issued | | | Increase | | | | | | Issued for | | | | | | Issued | | | Increase | |
| | | Shares | | | Reinvested | | | Shares | | | from | | | (Decrease) | | | Shares | | | Reinvested | | | Shares | | | from | | | (Decrease) | |
| | | Sold | | | Dividends | | | Redeemed | | | Merger | | | of Shares | | | Sold | | | Dividends | | | Redeemed | | | Merger | | | of Shares | |
Class A | | | | | | | | | | | | | | | | | | | | | | | | | | | | | | |
Shares | | | 1,059 | | | | — | | | | (2,500 | ) | | | — | | | | (1,441 | ) | | | 10,597 | | | | — | | | | (16,584 | ) | | | — | | | | (5,987 | ) |
Amount | | $ | 15,744 | | | $ | — | | | $ | (37,182 | ) | | $ | — | | | $ | (21,438 | ) | | $ | 113,197 | | | $ | — | | | $ | (192,659 | ) | | $ | — | | | $ | (79,462 | ) |
| Class B | | | | | | | | | | | | | | | | | | | | | | | | | | | | | | | | | | | | | | | | |
Shares | | | 6 | | | | — | | | | (208 | ) | | | — | | | | (202 | ) | | | 165 | | | | — | | | | (507 | ) | | | — | | | | (342 | ) |
Amount | | $ | 77 | | | $ | — | | | $ | (2,606 | ) | | $ | — | | | $ | (2,529 | ) | | $ | 1,564 | | | $ | — | | | $ | (4,928 | ) | | $ | — | | | $ | (3,364 | ) |
| Class C | | | | | | | | | | | | | | | | | | | | | | | | | | | | | | | | | | | | | | | | |
Shares | | | 169 | | | | — | | | | (526 | ) | | | — | | | | (357 | ) | | | 577 | | | | — | | | | (1,425 | ) | | | — | | | | (848 | ) |
Amount | | $ | 2,105 | | | $ | — | | | $ | (6,575 | ) | | $ | — | | | $ | (4,470 | ) | | $ | 5,532 | | | $ | — | | | $ | (13,681 | ) | | $ | — | | | $ | (8,149 | ) |
| Class I | | | | | | | | | | | | | | | | | | | | | | | | | | | | | | | | | | | | | | | | |
Shares | | | 489 | | | | 15 | | | | (556 | ) | | | — | | | | (52 | ) | | | 1,305 | | | | — | | | | (1,462 | ) | | | — | | | | (157 | ) |
Amount | | $ | 7,329 | | | $ | 221 | | | $ | (8,352 | ) | | $ | — | | | $ | (802 | ) | | $ | 16,060 | | | $ | — | | | $ | (16,810 | ) | | $ | — | | | $ | (750 | ) |
| Class L | | | | | | | | | | | | | | | | | | | | | | | | | | | | | | | | | | | | | | | | |
Shares | | | 113 | | | | 32 | | | | (846 | ) | | | — | | | | (701 | ) | | | 273 | | | | — | | | | (1,849 | ) | | | — | | | | (1,576 | ) |
Amount | | $ | 1,733 | | | $ | 479 | | | $ | (12,782 | ) | | $ | — | | | $ | (10,570 | ) | | $ | 3,225 | | | $ | — | | | $ | (21,557 | ) | | $ | — | | | $ | (18,332 | ) |
| Class R3 | | | | | | | | | | | | | | | | | | | | | | | | | | | | | | | | | | | | | | | | |
Shares | | | 2 | | | | — | | | | (1 | ) | | | — | | | | 1 | | | | 8 | | | | — | | | | — | | | | — | | | | 8 | |
Amount | | $ | 31 | | | $ | — | | | $ | (16 | ) | | $ | — | | | $ | 15 | | | $ | 91 | | | $ | — | | | $ | (6 | ) | | $ | — | | | $ | 85 | |
| Class R4 | | | | | | | | | | | | | | | | | | | | | | | | | | | | | | | | | | | | | | | | |
Shares | | | 22 | | | | — | | | | (10 | ) | | | — | | | | 12 | | | | 85 | | | | — | | | | (20 | ) | | | — | | | | 65 | |
Amount | | $ | 347 | | | $ | 5 | | | $ | (158 | ) | | $ | — | | | $ | 194 | | | $ | 1,041 | | | $ | — | | | $ | (255 | ) | | $ | — | | | $ | 786 | |
| Class R5 | | | | | | | | | | | | | | | | | | | | | | | | | | | | | | | | | | | | | | | | |
Shares | | | 9 | | | | — | | | | (7 | ) | | | — | | | | 2 | | | | 2 | | | | — | | | | — | | | | — | | | | 2 | |
Amount | | $ | 128 | | | $ | — | | | $ | (103 | ) | | $ | — | | | $ | 25 | | | $ | 28 | | | $ | — | | | $ | (1 | ) | | $ | — | | | $ | 27 | |
| Class Y | | | | | | | | | | | | | | | | | | | | | | | | | | | | | | | | | | | | | | | | |
Shares | | | 274 | | | | 33 | | | | (676 | ) | | | — | | | | (369 | ) | | | 668 | | | | — | | | | (3,249 | ) | | | — | | | | (2,581 | ) |
Amount | | $ | 4,196 | | | $ | 508 | | | $ | (10,509 | ) | | $ | — | | | $ | (5,805 | ) | | $ | 7,871 | | | $ | — | | | $ | (37,551 | ) | | $ | — | | | $ | (29,680 | ) |
The following reflects the conversion of Class B Shares into Class A Shares (reflected as Class A Shares issued) for the six-month period ended April 30, 2010 and the year ended October 31, 2009:
| | | Shares | | | Dollars | |
| For the Six-Month Period Ended April 30, 2010 | | | 26 | | | $ | 402 | |
| For the Year Ended October 31, 2009 | | | 45 | | | $ | 523 | |
The Fund is one of several Hartford Funds that participate in a $500 million committed revolving line of credit facility. The facility is to be used for temporary or emergency purposes. Under the arrangement, the Fund is required to own securities having a market value in excess of 300% of the total bank borrowings. The interest rate on borrowings varies depending on the nature of the loan. The facility also requires a fee to be paid based on the amount of the commitment. This fee is allocated to all the Funds participating in the line of credit based on the average net assets of the Funds. During the six-month period ended April 30, 2010, the Fund did not have any borrowings under this facility.
| 9. | Industry Classifications: |
Other than the industry classifications “Other Investment Pools and Funds” and “Exchange Traded Funds”, equity industry classifications used in this report are the Global Industry Classification Standard, which was developed by and is the exclusive property and service mark of MSCI, Inc. and Standard & Poor’s.
Management has evaluated subsequent events and determined that no additional items require recording or disclosure.
[This page is intentionally left blank]
| - Selected Per-Share Data (A) - - |
Class | | Net Asset Value at Beginning of Period | | | Net Investment Income (Loss) | | | Payments from (to) Affiliate | | | Net Realized and Unrealized Gain (Loss) on Investments | | | Total from Investment Operations | | | Dividends from Net Investment Income | | | Distributions from Realized Capital Gains | | | Distributions from Capital | | | Total Distributions | | | Net Increase (Decrease) in Net Asset Value | | | Net Asset Value at End of Period | |
For the Six-Month Period Ended April 30, 2010 (Unaudited) (E) | | | | | | | | | | | | | | | | | | | | |
A | | $ | 13.57 | | | $ | (0.02 | ) | | $ | – | | | $ | 2.23 | | | $ | 2.21 | | | $ | – | | | $ | – | | | $ | – | | | $ | – | | | $ | 2.21 | | | $ | 15.78 | |
B | | | 11.46 | | | | (0.07 | ) | | | – | | | | 1.88 | | | | 1.81 | | | | – | | | | – | | | | – | | | | – | | | | 1.81 | | | | 13.27 | |
C | | | 11.46 | | | | (0.06 | ) | | | – | | | | 1.87 | | | | 1.81 | | | | – | | | | – | | | | – | | | | – | | | | 1.81 | | | | 13.27 | |
I | | | 13.73 | | | | 0.01 | | | | – | | | | 2.25 | | | | 2.26 | | | | (0.06 | ) | | | – | | | | – | | | | (0.06 | ) | | | 2.20 | | | | 15.93 | |
L | | | 13.87 | | | | (0.01 | ) | | | – | | | | 2.28 | | | | 2.27 | | | | (0.04 | ) | | | – | | | | – | | | | (0.04 | ) | | | 2.23 | | | | 16.10 | |
R3 | | | 13.84 | | | | (0.04 | ) | | | – | | | | 2.27 | | | | 2.23 | | | | (0.01 | ) | | | – | | | | – | | | | (0.01 | ) | | | 2.22 | | | | 16.06 | |
R4 | | | 13.98 | | | | (0.02 | ) | | | – | | | | 2.29 | | | | 2.27 | | | | (0.03 | ) | | | – | | | | – | | | | (0.03 | ) | | | 2.24 | | | | 16.22 | |
R5 | | | 14.10 | | | | – | | | | – | | | | 2.24 | | | | 2.24 | | | | (0.06 | ) | | | – | | | | – | | | | (0.06 | ) | | | 2.18 | | | | 16.28 | |
Y | | | 14.15 | | | | 0.01 | | | | – | | | | 2.32 | | | | 2.33 | | | | (0.07 | ) | | | – | | | | – | | | | (0.07 | ) | | | 2.26 | | | | 16.41 | |
For the Year Ended October 31, 2009 | | | | | | | | | | | | | | | | | | | | | | | | | | | | | | | | | | | | |
A | | | 11.59 | | | | 0.02 | | | | – | | | | 1.96 | | | | 1.98 | | | | – | | | | – | | | | – | | | | – | | | | 1.98 | | | | 13.57 | |
B | | | 9.83 | | | | (0.03 | ) | | | – | | | | 1.66 | | | | 1.63 | | | | – | | | | – | | | | – | | | | – | | | | 1.63 | | | | 11.46 | |
C | | | 9.86 | | | | (0.07 | ) | | | – | | | | 1.67 | | | | 1.60 | | | | – | | | | – | | | | – | | | | – | | | | 1.60 | | | | 11.46 | |
I | | | 11.69 | | | | 0.05 | | | | – | | | | 1.99 | | | | 2.04 | | | | – | | | | – | | | | – | | | | – | | | | 2.04 | | | | 13.73 | |
L | | | 11.83 | | | | 0.04 | | | | – | | | | 2.00 | | | | 2.04 | | | | – | | | | – | | | | – | | | | – | | | | 2.04 | | | | 13.87 | |
R3 | | | 11.86 | | | | (0.02 | ) | | | – | | | | 2.00 | | | | 1.98 | | | | – | | | | – | | | | – | | | | – | | | | 1.98 | | | | 13.84 | |
R4 | | | 11.94 | | | | 0.01 | | | | – | | | | 2.03 | | | | 2.04 | | | | – | | | | – | | | | – | | | | – | | | | 2.04 | | | | 13.98 | |
R5 | | | 12.00 | | | | 0.04 | | | | – | | | | 2.06 | | | | 2.10 | | | | – | | | | – | | | | – | | | | – | | | | 2.10 | | | | 14.10 | |
Y | | | 12.03 | | | | 0.08 | | | | – | | | | 2.04 | | | | 2.12 | | | | – | | | | – | | | | – | | | | – | | | | 2.12 | | | | 14.15 | |
For the Year Ended October 31, 2008 (E) | | | | | | | | | | | | | | | | | | | | | | | | | | | | | | | | | | | |
A | | | 21.25 | | | | (0.05 | ) | | | – | | | | (8.03 | ) | | | (8.08 | ) | | | – | | | | (1.58 | ) | | | – | | | | (1.58 | ) | | | (9.66 | ) | | | 11.59 | |
B | | | 18.39 | | | | (0.13 | ) | | | – | | | | (6.85 | ) | | | (6.98 | ) | | | – | | | | (1.58 | ) | | | – | | | | (1.58 | ) | | | (8.56 | ) | | | 9.83 | |
C | | | 18.45 | | | | (0.14 | ) | | | – | | | | (6.87 | ) | | | (7.01 | ) | | | – | | | | (1.58 | ) | | | – | | | | (1.58 | ) | | | (8.59 | ) | | | 9.86 | |
I | | | 21.34 | | | | 0.02 | | | | – | | | | (8.09 | ) | | | (8.07 | ) | | | – | | | | (1.58 | ) | | | – | | | | (1.58 | ) | | | (9.65 | ) | | | 11.69 | |
L | | | 21.60 | | | | – | | | | – | | | | (8.19 | ) | | | (8.19 | ) | | | – | | | | (1.58 | ) | | | – | | | | (1.58 | ) | | | (9.77 | ) | | | 11.83 | |
R3 | | | 21.76 | | | | (0.08 | ) | | | – | | | | (8.24 | ) | | | (8.32 | ) | | | – | | | | (1.58 | ) | | | – | | | | (1.58 | ) | | | (9.90 | ) | | | 11.86 | |
R4 | | | 21.82 | | | | (0.03 | ) | | | – | | | | (8.27 | ) | | | (8.30 | ) | | | – | | | | (1.58 | ) | | | – | | | | (1.58 | ) | | | (9.88 | ) | | | 11.94 | |
R5 | | | 21.87 | | | | 0.02 | | | | – | | | | (8.31 | ) | | | (8.29 | ) | | | – | | | | (1.58 | ) | | | – | | | | (1.58 | ) | | | (9.87 | ) | | | 12.00 | |
Y | | | 21.90 | | | | 0.04 | | | | – | | | | (8.33 | ) | | | (8.29 | ) | | | – | | | | (1.58 | ) | | | – | | | | (1.58 | ) | | | (9.87 | ) | | | 12.03 | |
For the Year Ended October 31, 2007 | | | | | | | | | | | | | | | | | | | | | | | | | | | | | | | | | | | | |
A | | | 18.45 | | | | (0.07 | ) | | | – | | | | 4.17 | | | | 4.10 | | | | – | | | | (1.30 | ) | | | – | | | | (1.30 | ) | | | 2.80 | | | | 21.25 | |
B | | | 16.25 | | | | (0.21 | ) | | | – | | | | 3.65 | | | | 3.44 | | | | – | | | | (1.30 | ) | | | – | | | | (1.30 | ) | | | 2.14 | | | | 18.39 | |
C | | | 16.29 | | | | (0.19 | ) | | | – | | | | 3.65 | | | | 3.46 | | | | – | | | | (1.30 | ) | | | – | | | | (1.30 | ) | | | 2.16 | | | | 18.45 | |
I | | | 18.46 | | | | – | | | | – | | | | 4.18 | | | | 4.18 | | | | – | | | | (1.30 | ) | | | – | | | | (1.30 | ) | | | 2.88 | | | | 21.34 | |
L(I) | | | 18.69 | | | | (0.05 | ) | | | – | | | | 4.26 | | | | 4.21 | | | | – | | | | (1.30 | ) | | | – | | | | (1.30 | ) | | | 2.91 | | | | 21.60 | |
R3(J) | | | 18.15 | | | | (0.08 | ) | | | – | | | | 3.69 | | | | 3.61 | | | | – | | | | – | | | | – | | | | – | | | | 3.61 | | | | 21.76 | |
R4(J) | | | 18.15 | | | | (0.01 | ) | | | – | | | | 3.68 | | | | 3.67 | | | | – | | | | – | | | | – | | | | – | | | | 3.67 | | | | 21.82 | |
R5(J) | | | 18.15 | | | | – | | | | – | | | | 3.72 | | | | 3.72 | | | | – | | | | – | | | | – | | | | – | | | | 3.72 | | | | 21.87 | |
Y | | | 18.89 | | | | 0.02 | | | | – | | | | 4.29 | | | | 4.31 | | | | – | | | | (1.30 | ) | | | – | | | | (1.30 | ) | | | 3.01 | | | | 21.90 | |
For the Year Ended October 31, 2006 | | | | | | | | | | | | | | | | | | | | | | | | | | | | | | | | | | | | |
A | | | 17.32 | | | | (0.07 | ) | | | – | | | | 1.20 | | | | 1.13 | | | | – | | | | – | | | | – | | | | – | | | | 1.13 | | | | 18.45 | |
B | | | 15.38 | | | | (0.20 | ) | | | – | | | | 1.07 | | | | 0.87 | | | | – | | | | – | | | | – | | | | – | | | | 0.87 | | | | 16.25 | |
C | | | 15.40 | | | | (0.18 | ) | | | – | | | | 1.07 | | | | 0.89 | | | | – | | | | – | | | | – | | | | – | | | | 0.89 | | | | 16.29 | |
I(K) | | | 17.64 | | | | – | | | | – | | | | 0.82 | | | | 0.82 | | | | – | | | | – | | | | – | | | | – | | | | 0.82 | | | | 18.46 | |
L | | | 17.50 | | | | (0.02 | ) | | | – | | | | 1.21 | | | | 1.19 | | | | – | | | | – | | | | – | | | | – | | | | 1.19 | | | | 18.69 | |
Y | | | 17.65 | | | | 0.01 | | | | – | | | | 1.23 | | | | 1.24 | | | | – | | | | – | | | | – | | | | – | | | | 1.24 | | | | 18.89 | |
For the Year Ended October 31, 2005 | | | | | | | | | | | | | | | | | | | | | | | | | | | | | | | | | | | | |
A | | | 16.19 | | | | (0.04 | ) | | | – | | | | 1.17 | | | | 1.13 | | | | – | | | | – | | | | – | | | | – | | | | 1.13 | | | | 17.32 | |
B | | | 14.49 | | | | (0.15 | ) | | | – | | | | 1.04 | | | | 0.89 | | | | – | | | | – | | | | – | | | | – | | | | 0.89 | | | | 15.38 | |
C | | | 14.50 | | | | (0.13 | ) | | | – | | | | 1.03 | | | | 0.90 | | | | – | | | | – | | | | – | | | | – | | | | 0.90 | | | | 15.40 | |
L | | | 16.32 | | | | 0.01 | | | | – | | | | 1.17 | | | | 1.18 | | | | – | | | | – | | | | – | | | | – | | | | 1.18 | | | | 17.50 | |
Y | | | 16.42 | | | | 0.01 | | | | – | | | | 1.22 | | | | 1.23 | | | | – | | | | – | | | | – | | | | – | | | | 1.23 | | | | 17.65 | |
| - Ratios and Supplemental Data - - |
Total Return(B) | | Net Assets at End of Period (000's) | | | Ratio of Expenses to Average Net Assets Before Waivers and Reimbursements and Including Expenses not Subject to Cap(C) | | Ratio of Expenses to Average Net Assets After Waivers and Reimbursements and Including Expenses not Subject to Cap(C) | | Ratio of Expenses to Average Net Assets After Waivers and Reimbursements and Excluding Expenses not Subject to Cap(C) | | Ratio of Net Investment Income to Average Net Assets | | Portfolio Turnover Rate(D) | |
| | | | | | | | | | | | | | | | | | | | | | | | | | | |
| | 16.29 | %(F) | | $ | 280,448 | | | | 1.32 | %(G) | | | 1.30 | %(G) | | | 1.30 | %(G) | | | (0.32 | )%(G) | | | 29 | % |
| | 15.79 | (F) | | | 19,694 | | | | 2.30 | (G) | | | 2.05 | (G) | | | 2.05 | (G) | | | (1.06 | ) (G) | | | – | |
| | 15.79 | (F) | | | 46,930 | | | | 2.01 | (G) | | | 2.01 | (G) | | | 2.01 | (G) | | | (1.02 | ) (G) | | | – | |
| | 16.50 | (F) | | | 62,312 | | | | 0.91 | (G) | | | 0.91 | (G) | | | 0.91 | (G) | | | 0.07 | (G) | | | – | |
| | 16.39 | (F) | | | 195,210 | | | | 1.07 | (G) | | | 1.06 | (G) | | | 1.06 | (G) | | | (0.08 | ) (G) | | | – | |
| | 16.09 | (F) | | | 206 | | | | 1.64 | (G) | | | 1.55 | (G) | | | 1.55 | (G) | | | (0.58 | ) (G) | | | – | |
| | 16.23 | (F) | | | 3,148 | | | | 1.23 | (G) | | | 1.23 | (G) | | | 1.23 | (G) | | | (0.25 | ) (G) | | | – | |
| | 15.91 | (F) | | | 131 | | | | 0.96 | (G) | | | 0.95 | (G) | | | 0.95 | (G) | | | 0.01 | (G) | | | – | |
| | 16.52 | (F) | | | 109,886 | | | | 0.83 | (G) | | | 0.83 | (G) | | | 0.83 | (G) | | | 0.15 | (G) | | | – | |
| | | | | | | | | | | | | | | | | | | | | | | | | | | |
| | 17.08 | | | | 260,833 | | | | 1.44 | | | | 1.24 | | | | 1.24 | | | | 0.15 | | | | 94 | |
| | 16.58 | | | | 19,319 | | | | 2.49 | | | | 1.69 | | | | 1.69 | | | | (0.30 | ) | | | – | |
| | 16.23 | | | | 44,604 | | | | 2.09 | | | | 2.05 | | | | 2.05 | | | | (0.67 | ) | | | – | |
| | 17.45 | | | | 54,433 | | | | 0.94 | | | | 0.94 | | | | 0.94 | | | | 0.43 | | | | – | |
| | 17.24 | | | | 177,922 | | | | 1.08 | | | | 1.07 | | | | 1.07 | | | | 0.31 | | | | – | |
| | 16.69 | | | | 163 | | | | 1.73 | | | | 1.55 | | | | 1.55 | | | | (0.25 | ) | | | – | |
| | 17.09 | | | | 2,541 | | | | 1.23 | | | | 1.23 | | | | 1.23 | | | | 0.12 | | | | – | |
| | 17.50 | | | | 91 | | | | 0.96 | | | | 0.95 | | | | 0.95 | | | | 0.39 | | | | – | |
| | 17.62 | | | | 99,987 | | | | 0.84 | | | | 0.84 | | | | 0.84 | | | | 0.56 | | | | – | |
| | | | | | | | | | | | | | | | | | | | | | | | | | | |
| | (40.77 | ) | | | 292,129 | | | | 1.27 | | | | 1.27 | | | | 1.27 | | | | (0.27 | ) | | | 106 | |
| | (41.16 | ) | | | 19,936 | | | | 2.24 | | | | 1.91 | | | | 1.91 | | | | (0.91 | ) | | | – | |
| | (41.19 | ) | | | 46,757 | | | | 1.97 | | | | 1.97 | | | | 1.97 | | | | (0.96 | ) | | | – | |
| | (40.53 | ) | | | 48,174 | | | | 0.89 | | | | 0.89 | | | | 0.89 | | | | 0.14 | | | | – | |
| | (40.61 | ) | | | 170,321 | | | | 1.05 | | | | 1.03 | | | | 1.03 | | | | (0.03 | ) | | | – | |
| | (40.93 | ) | | | 53 | | | | 1.71 | | | | 1.55 | | | | 1.55 | | | | (0.51 | ) | | | – | |
| | (40.70 | ) | | | 1,394 | | | | 1.20 | | | | 1.20 | | | | 1.20 | | | | (0.17 | ) | | | – | |
| | (40.56 | ) | | | 51 | | | | 0.92 | | | | 0.92 | | | | 0.92 | | | | 0.09 | | | | – | |
| | (40.50 | ) | | | 116,109 | | | | 0.80 | | | | 0.80 | | | | 0.80 | | | | 0.21 | | | | – | |
| | | | | | | | | | | | | | | | | | | | | | | | | | | |
| | 23.92 | (H) | | | 627,677 | | | | 1.27 | | | | 1.27 | | | | 1.27 | | | | (0.35 | ) | | | 89 | |
| | 23.02 | (H) | | | 41,359 | | | | 2.22 | | | | 2.09 | | | | 2.09 | | | | (1.17 | ) | | | – | |
| | 23.10 | (H) | | | 85,303 | | | | 1.98 | | | | 1.98 | | | | 1.98 | | | | (1.06 | ) | | | – | |
| | 24.37 | (H) | | | 35,626 | | | | 0.91 | | | | 0.91 | | | | 0.91 | | | | 0.02 | | | | – | |
| | 24.22 | (H) | | | 323,581 | | | | 1.06 | | | | 1.05 | | | | 1.05 | | | | (0.27 | ) | | | – | |
| | 19.89 | (F) | | | 16 | | | | 1.56 | (G) | | | 1.56 | (G) | | | 1.56 | (G) | | | (0.67 | ) (G) | | | – | |
| | 20.22 | (F) | | | 282 | | | | 1.17 | (G) | | | 1.17 | (G) | | | 1.17 | (G) | | | (0.28 | ) (G) | | | – | |
| | 20.50 | (F) | | | 63 | | | | 0.90 | (G) | | | 0.90 | (G) | | | 0.90 | (G) | | | (0.01 | ) (G) | | | – | |
| | 24.52 | (H) | | | 103,251 | | | | 0.81 | | | | 0.81 | | | | 0.81 | | | | 0.10 | | | | – | |
| | | | | | | | | | | | | | | | | | | | | | | | | | | |
| | 6.52 | | | | 707,000 | | | | 1.34 | | | | 1.33 | | | | 1.33 | | | | (0.38 | ) | | | 92 | |
| | 5.66 | | | | 44,064 | | | | 2.22 | | | | 2.09 | | | | 2.09 | | | | (1.14 | ) | | | – | |
| | 5.78 | | | | 85,469 | | | | 2.02 | | | | 2.02 | | | | 2.02 | | | | (1.07 | ) | | | – | |
| | 4.65 | (F) | | | 1,961 | | | | 0.96 | (G) | | | 0.96 | (G) | | | 0.96 | (G) | | | (0.52 | ) (G) | | | – | |
| | 6.80 | | | | 274,890 | | | | 1.05 | | | | 1.05 | | | | 1.05 | | | | (0.10 | ) | | | – | |
| | 7.03 | | | | 130,594 | | | | 0.83 | | | | 0.83 | | | | 0.83 | | | | 0.08 | | | | – | |
| | | | | | | | | | | | | | | | | | | | | | | | | | | |
| | 6.98 | | | | 635,057 | | | | 1.40 | | | | 1.33 | | | | 1.33 | | | | (0.30 | ) | | | 77 | |
| | 6.14 | | | | 46,251 | | | | 2.27 | | | | 2.15 | | | | 2.15 | | | | (1.09 | ) | | | – | |
| | 6.21 | | | | 82,481 | | | | 2.05 | | | | 2.05 | | | | 2.05 | | | | (1.01 | ) | | | – | |
| | 7.23 | | | | 295,731 | | | | 1.06 | | | | 1.06 | | | | 1.06 | | | | 0.05 | | | | – | |
| | 7.49 | | | | 52,992 | | | | 0.85 | | | | 0.85 | | | | 0.85 | | | | 0.10 | | | | – | |
| The Hartford Growth Fund |
| Financial Highlights – (continued) |
| (A) | Information presented relates to a share outstanding throughout the indicated period. |
| (B) | Assumes initial investment at net asset value at the beginning of each period, reinvestment of all distributions, the complete redemption of the investment at net asset value at the end of each period and no sales charge. Total return would be reduced if sales charges were taken into account. |
| (C) | Ratios do not include fees paid indirectly (See Expenses in the accompanying Notes to Financial Statements). |
| (D) | Portfolio turnover rate is calculated on the basis of the Fund as a whole without distinguishing between the classes of shares issued. |
| (E) | Per share amounts have been calculated using average shares outstanding method. |
| (H) | Total return without the inclusion of the Payments from (to) Affiliate, can be found in Expenses in the accompanying Notes to Financial Statements. |
| (I) | Classes H, M and N were merged into Class L on February 9, 2007. |
| (J) | Commenced operations on December 22, 2006. |
| (K) | Commenced operations on August 31, 2006. |
The Board of Directors appoints officers who are responsible for the day-to-day operations of the Fund and who execute policies formulated by the Directors. Each director serves until his or her death, resignation, or retirement or until the next annual meeting of shareholders is held or until his or her successor is elected and qualifies.
Directors and officers who are employed by or who have a financial interest in The Hartford are considered “interested” persons of the Fund pursuant to the Investment Company Act of 1940, as amended. Each officer and two of the Funds’ directors, as noted in the chart below, are “interested” persons of the Fund. Each director serves as a director for The Hartford Mutual Funds, Inc., The Hartford Mutual Funds II, Inc., The Hartford Income Shares Fund, Inc., Hartford Series Fund, Inc., and Hartford HLS Series Fund II, Inc., which, as of April 30, 2010, collectively consist of 85 funds. Correspondence may be sent to directors and officers c/o Hartford Mutual Funds, P.O. Box 2999, Hartford, Connecticut 06104-2999, except that correspondence to Ms. Fagely may be sent to 500 Bielenberg Drive, Woodbury, Minnesota 55125.
The table below sets forth, for each director and officer, his or her name, year of birth, current position with the Fund and date first elected or appointed to The Hartford Mutual Funds, Inc. (“MF”) and The Hartford Mutual Funds II, Inc. (“MF2”), principal occupation, and, for directors, other directorships held. The Fund’s statement of additional information contains further information on the directors and is available free of charge by calling 1-888-843-7824 or writing to Hartford Mutual Funds, P.O. Box 64387, St. Paul, MN 55164-0387.
Information on the aggregate remuneration paid to the directors of the Fund can be found in the Statement of Operations herein. The Fund pays to The Hartford a portion of the Chief Compliance Officer’s compensation, but does not pay salaries or compensation to any of its other officers or directors who are employed by The Hartford.
Non-Interested Directors
Lynn S. Birdsong (1946) Director since 2003, Co-Chairman of the Investment Committee
Mr. Birdsong is a private investor. Since 2003, Mr. Birdsong has been an independent director of The Japan Fund. From 2003 to March 2005, Mr. Birdsong was an independent director of the Atlantic Whitehall Funds. From 1979 to 2002, Mr. Birdsong was a managing director of Zurich Scudder Investments, an investment management firm. During his employment with Scudder, Mr. Birdsong was an interested director of The Japan Fund. Since 1981, Mr. Birdsong has been a partner in Birdsong Company, an advertising specialty firm.
Robert M. Gavin, Jr. (1940) Director since 2002 (MF) and 1986 (MF2), Chairman of the Board since 2004
Dr. Gavin is an educational consultant. Prior to September 1, 2001, he was President of Cranbrook Education Community and prior to July 1996, he was President of Macalester College, St. Paul, Minnesota.
Duane E. Hill (1945) Director since 2001 (MF) and 2002 (MF2), Chairman of the Nominating Committee
Mr. Hill is Partner of TSG Ventures L.P., a private equity investment company. Mr. Hill is a former partner of TSG Capital Group, a private equity investment firm that served as sponsor and lead investor in leveraged buyouts of middle market companies.
Sandra S. Jaffee (1941) Director since 2005
Ms. Jaffee served as Chairman (2008 to 2009) and Chief Executive Officer of Fortent (formerly Searchspace Group), a leading provider of compliance/regulatory technology to financial institutions from August 2005 to August 2009. From August 2004 to August 2005, Ms. Jaffee served as an Entrepreneur in Residence with Warburg Pincus, a private equity firm. From September 1995 to July 2004, Ms. Jaffee served as Executive Vice President at Citigroup, where she was President and Chief Executive Officer of Citibank’s Global Securities Services (1995 to 2003).
William P. Johnston (1944) Director since 2005, Chairman of the Compliance Committee
In June 2006, Mr. Johnston was appointed as Senior Advisor to The Carlyle Group, a global private equity investment firm. In July 2006, Mr. Johnston was elected to the Board of Directors of MultiPlan, Inc. In August 2007, Mr. Johnston was elected to the Board of Directors of LifeCare Holdings, Inc. In February 2008, Mr. Johnston was elected to the Board of Directors of HCR-ManorCare, Inc. In May 2006, Mr. Johnston was elected to the Supervisory Board of Fresenius Medical Care AG & Co. KGaA, after its acquisition of Renal Care Group, Inc. in March 2006. Mr. Johnston joined Renal Care Group in November 2002 as a member of the Board of Directors and served as Chairman of the Board from March 2003 through March 2006. From September 1987 to December 2002, Mr. Johnston was with Equitable Securities Corporation (and its successors, SunTrust Equitable Securities and SunTrust Robinson Humphrey) serving in various investment banking and managerial positions, including Managing Director and Head of Investment Banking, Chief Executive Officer and Vice Chairman. Mr. Johnston was a member of the law firm of Waller Lansden Dortch & Davis from 1969 until 1986.
| The Hartford Growth Fund |
| Directors and Officers (Unaudited) – (continued) |
Phillip O. Peterson (1944) Director since 2002 (MF) and 2000 (MF2), Chairman of the Audit Committee
Mr. Peterson is a mutual fund industry consultant. He was a partner of KPMG LLP (an accounting firm) until July 1999. Mr. Peterson joined William Blair Funds in February 2007 as a member of the Board of Trustees. From January 2004 to April 2005, Mr. Peterson served as Independent President of the Strong Mutual Funds.
Lemma W. Senbet (1946) Director since 2005
Dr. Senbet is the William E. Mayer Chair Professor of Finance and Director, Center for Financial Policy, at the University of Maryland, Robert H. Smith School of Business. He was chair of the Finance Department during 1998 to 2006. Previously he was a chaired professor of finance at the University of Wisconsin-Madison. Also, he was director of the Fortis Funds from March 2000 to July 2002. Dr. Senbet served the finance profession in various capacities, including as director of the American Finance Association and President of the Western Finance Association. In 2006, Dr. Senbet was inducted Fellow of Financial Management Association International for his career-long distinguished scholarship and professional service.
Interested Directors and Officers
Lowndes A. Smith (1939) Director since 1996 (MF) and 2002 (MF2), Co-Chairman of the Investment Committee
Mr. Smith served as Vice Chairman of The Hartford from February 1997 to January 2002, as President and Chief Executive Officer of Hartford Life, Inc. from February 1997 to January 2002, and as President and Chief Operating Officer of The Hartford Life Insurance Companies from January 1989 to January 2002. Mr. Smith serves as a Director of White Mountains Insurance Group, Ltd., One Beacon Insurance, Symetra Financial and as a Managing Director of Whittington Gray Associates.
John C. Walters* (1962) Director since 2008
Mr. Walters currently serves as President, Chief Executive Officer and Director for Hartford Life, Inc. (“HL, Inc.”). Mr. Walters also serves as President, Chairman of the Board, Chief Executive Officer and Director for Hartford Life Insurance Company (“Hartford Life”), and as Executive Vice President of The Hartford. In addition, Mr. Walters is a Manager of HL Investment Advisors, LLC (“HL Advisors”). Mr. Walters previously served as President of the U.S. Wealth Management Division of HL, Inc. (2006-2007) and as Co-Chief Operating Officer of Hartford Life (2007-2008).
* Mr. Walters previously served as President and Chief Executive Officer of the Fund (2007 to 2009).
Other Officers
Robert M. Arena, Jr. (1968) President and Chief Executive Officer since 2009 (served as Vice President of the Fund (2006 - 2009)) Mr. Arena serves as Executive Vice President of Hartford Life. Additionally, Mr. Arena is Senior Vice President and Director of Hartford Administrative Services Company, (“HASCO”), President, Chief Executive Officer and Manager of Hartford Investment Financial Services, LLC (“HIFSCO”) and President, Chief Executive Officer and Manager of HL Advisors. Mr. Arena joined The Hartford in 2004.
Tamara L. Fagely (1958) Vice President, Treasurer and Controller since 2002 (MF) 1993 (MF2)
Ms. Fagely has been a Vice President of HASCO since 1998 and Chief Financial Officer since 2006. Currently Ms. Fagely is a Vice President of Hartford Life. She served as Assistant Vice President of Hartford Life from December 2001 through March 2005. In addition, Ms. Fagely is Controller and Chief Financial Officer of HIFSCO.
Brian Ferrell (1962) AML Compliance Officer since 2008
Mr. Ferrell has served as Assistant Vice President and AML Compliance Officer for The Hartford since 2006, and as AML Compliance Officer for HASCO and Hartford Investor Services Company, LLC (“HISC”) since 2008. Prior to joining The Hartford in 2006, Mr. Ferrell held various positions at the U.S. Department of the Treasury (the “Treasury”) from 2001 to 2006, where he served as Chief Counsel for the Treasury’s Financial Crimes Enforcement Network from 2005 - 2006.
Dr. Robert J. Froehlich (1953) Senior Managing Director since 2009
Dr. Froehlich joined The Hartford as Senior Managing Director in September 2009. Prior to joining The Hartford, Dr. Froehlich served as Vice Chairman of Deutsche Asset Management from 1997 - 2009.
Thomas D. Jones, III (1965) Vice President and Chief Compliance Officer since 2006
Mr. Jones serves as Chief Compliance Officer for the Hartford Mutual Funds and Vice President and Director of Securities Compliance for The Hartford. Mr. Jones joined The Hartford in 2006 from SEI Investments, where he served as Chief Compliance Officer for its mutual funds and investment advisers. Prior to joining SEI, Mr. Jones was First Vice President and Compliance Director for Merrill Lynch Investment Managers (Americas) (“MLIM”), where he worked from 1992-2004.
Edward P. Macdonald (1967) Vice President, Secretary and Chief Legal Officer since 2005
Mr. Macdonald serves as Assistant Vice President of Hartford Life and Chief Legal Officer and Vice President of HIFSCO. He also serves as Vice President and Secretary of HASCO, and Chief Legal Officer, Secretary and Vice President of HL Advisors. Mr. Macdonald joined The Hartford in 2005.
Vernon J. Meyer (1964) Vice President since 2006
Mr. Meyer serves as Senior Vice President of Hartford Life. He also serves as Senior Vice President of HIFSCO and HL Advisors. Mr. Meyer joined The Hartford in 2004.
D. Keith Sloane (1960) Vice President since 2009
Mr. Sloane is a Senior Vice President of Hartford Life. Additionally, Mr. Sloane currently serves as Senior Vice President of HIFSCO, HL Advisors, and HASCO. Prior to joining The Hartford in 2007, Mr. Sloane was Director of product marketing and led the mutual fund business for Wachovia Securities (“Wachovia”) in their investment products group. Mr. Sloane joined Wachovia in 1995.
Jane Wolak (1961) Vice President since 2009
Ms. Wolak currently serves as Vice President of Hartford Life. Ms. Wolak joined Hartford Life as Vice President, Retail Product Services in May 2007. She is also Vice President of HASCO. Previously, Ms. Wolak was with Sun Life Financial where she held the position of Vice President, Service Center Operations from 2001 – 2007.
A description of the policies and procedures that the Fund uses to determine how to vote proxies relating to portfolio securities and a record of how the Fund voted any proxies for the twelve-month period ended June 30, 2009 is available (1) without charge, upon request, by calling 888-843-7824 and (2) on the Securities and Exchange Commission’s website at http://www.sec.gov.
The Fund files a complete schedule of portfolio holdings with the Commission for the first and third quarters of each fiscal year on Form N-Q. The Fund’s Forms are available (1) without charge, upon request, by calling 888-843-7824 and (2) on the Securities and Exchange Commission’s website at http://www.sec.gov. The Form N-Q may be reviewed and copied at the Commission’s Public Reference Room in Washington, DC. Information on the operation of the Public Reference Room may be obtained by calling 1-800-SEC-0330.
Your Fund's Expenses
As a shareholder of the Fund, you incur two types of costs: (1) transaction costs, including sales charges (loads) on purchase payments and contingent deferred sales charges (CDSC) (2) ongoing costs including management fees; distribution fees; and other fund expenses. This example is intended to help you understand your ongoing costs (in dollars) of investing in the Fund and to compare these costs with the ongoing costs of investing in other mutual funds. The example is based on an investment of $1,000 invested at the beginning of the period and held for the period of October 31, 2009 through April 30, 2010.
Actual Expenses
The first set of columns of the table below provides information about actual account values and actual expenses. You may use the information in this column, together with the amount you invested, to estimate the expenses that you paid over the period. Simply divide your account value by $1,000 (for example, an $8,600 account value divided by $1,000 = 8.6), then multiply the result by the number in the line under the heading entitled "Expenses Paid During Period" to estimate the expenses you paid on your account during this period.
Hypothetical Example for Comparison Purposes
The second set of columns of the table below provides information about hypothetical account values and hypothetical expenses based on the Fund's actual expense ratio and an assumed rate of return of 5% per year before expenses, which is not the Fund's actual return. The hypothetical account values and expenses may not be used to estimate the actual ending account balance or expenses you paid for the period. You may use this information to compare the ongoing costs of investing in the Fund and other funds. To do so, compare this 5% hypothetical example with the 5% hypothetical examples that appear in the shareholder reports of the other funds.
Please note that the expenses shown in the table are meant to highlight your ongoing costs only and do not reflect any transactional costs, such as sales charges (loads) and CDSC. Therefore, the second set of columns of the table is useful in comparing ongoing costs only, and will not help you determine the relative total costs of owning different funds. In addition, if these transactional costs were included, your costs would be higher. Expenses are equal to the Fund's annualized expense ratios multiplied by average account value over the period, multiplied by 181/365 (to reflect the one-half year period).
| | | Actual return | | | Hypothetical (5% return before expenses) | | | | | | | | | | |
| | | Beginning Account Value October 31, 2009 | | | Ending Account Value April 30, 2010 | | | Expenses paid during the period October 31, 2009 throughApril 30, 2010 | | | Beginning Account Value October 31, 2009 | | | Ending Account Value April 30, 2010 | | | Expenses paid during the period October 31, 2009 through April 30, 2010 | | | Annualized expense ratio | | | Days in the current 1/2 year | | | Days in the full year | |
| Class A | | $ | 1,000.00 | | | $ | 1,162.90 | | | $ | 6.97 | | | $ | 1,000.00 | | | $ | 1,018.35 | | | $ | 6.51 | | | | 1.30 | % | | | 181 | | | | 365 | |
| Class B | | $ | 1,000.00 | | | $ | 1,157.90 | | | $ | 10.97 | | | $ | 1,000.00 | | | $ | 1,014.63 | | | $ | 10.24 | | | | 2.05 | | | | 181 | | | | 365 | |
| Class C | | $ | 1,000.00 | | | $ | 1,157.90 | | | $ | 10.75 | | | $ | 1,000.00 | | | $ | 1,014.83 | | | $ | 10.04 | | | | 2.01 | | | | 181 | | | | 365 | |
| Class I | | $ | 1,000.00 | | | $ | 1,165.00 | | | $ | 4.88 | | | $ | 1,000.00 | | | $ | 1,020.28 | | | $ | 4.56 | | | | 0.91 | | | | 181 | | | | 365 | |
| Class L | | $ | 1,000.00 | | | $ | 1,163.90 | | | $ | 5.69 | | | $ | 1,000.00 | | | $ | 1,019.54 | | | $ | 5.31 | | | | 1.06 | | | | 181 | | | | 365 | |
| Class R3 | | $ | 1,000.00 | | | $ | 1,160.90 | | | $ | 8.30 | | | $ | 1,000.00 | | | $ | 1,017.11 | | | $ | 7.75 | | | | 1.55 | | | | 181 | | | | 365 | |
| Class R4 | | $ | 1,000.00 | | | $ | 1,162.30 | | | $ | 6.59 | | | $ | 1,000.00 | | | $ | 1,018.70 | | | $ | 6.16 | | | | 1.23 | | | | 181 | | | | 365 | |
| Class R5 | | $ | 1,000.00 | | | $ | 1,159.10 | | | $ | 5.09 | | | $ | 1,000.00 | | | $ | 1,020.08 | | | $ | 4.76 | | | | 0.95 | | | | 181 | | | | 365 | |
| Class Y | | $ | 1,000.00 | | | $ | 1,165.20 | | | $ | 4.46 | | | $ | 1,000.00 | | | $ | 1,020.68 | | | $ | 4.16 | | | | 0.83 | | | | 181 | | | | 365 | |
This information is written in connection with the promotion or marketing of the matter(s) addressed in this material. The information cannot be used or relied upon for the purpose of avoiding IRS penalties. These materials are not intended to provide tax, accounting or legal advice. As with all matters of a tax or legal nature, you should consult your own tax or legal counsel for advice.
You should carefully consider investment objectives, risks, and charges and expenses of The Hartford Mutual Funds before investing. This and other information can be found in the Fund's prospectus, which can be obtained from your investment representative or by calling 888-843-7824. Please read it carefully before you invest or send money.
The Hartford Mutual Funds are underwritten and distributed by Hartford Investment Financial Services, LLC.
“The Hartford” is The Hartford Financial Services Group, Inc., and its subsidiaries.
Mutual fund inception dates range from 1949 to date. The Hartford Mutual Funds are not a subsidiary of The Hartford but are underwritten, distributed by, and advised by subsidiaries of The Hartford. Investments in The Hartford Mutual Funds are not guaranteed by The Hartford or any other entity.
MFSAR-G10 6/10 MUT 8759 Printed in U.S.A. ©2010 The Hartford, Hartford, CT 06115 | |
| | |
| | |
THE HARTFORD MUTUAL FUNDS 2010 Semi Annual Report The Hartford Growth Opportunities Fund |
The Hartford Growth Opportunities Fund
| |
| Manager Discussions (Unaudited) | 2 |
| Financial Statements | |
| 4 |
| 6 |
| 7 |
| 8 |
| 9 |
| 10 |
| 22 |
| 25 |
| 27 |
| 27 |
| 28 |
The Hartford Growth Opportunities Fund inception 03/31/1963
(subadvised by Wellington Management Company, LLP)
Investment objective – Seeks capital appreciation.
Performance Overview(1) 4/30/00 - 4/30/10
Growth of a $10,000 investment in Class A which includes Sales Charge
Russell 1000 Growth Index is an unmanaged index which measures the performance of those Russell 1000 Index companies with higher price-to-book ratios and higher forecasted growth values.
Russell 3000 Growth Index is an unmanaged index which measures the performance of those Russell 3000 Index companies with higher price-to-book ratios and higher forecasted growth values.
You cannot invest directly in an index.
The value of shares will fluctuate so that, when redeemed, shares may be worth more or less than their original cost. The chart and table do not reflect the deduction of taxes that a shareholder would pay on fund distributions or the redemption of fund shares.
Performance information may reflect historical or current expense waivers/reimbursements from the investment adviser, without which performance would have been lower. For information on current expense waivers/reimbursements, please see the prospectus.
Average Annual Total Returns(2,3,4,5) (as of 4/30/10)
| | 6 | 1 | 5 | 10 |
| | Month† | Year | Year | Year |
| | | | | |
| Growth Opportunities A# | 16.58% | 39.18% | 6.11% | 0.85% |
| Growth Opportunities A## | | 31.53% | 4.92% | 0.28% |
| Growth Opportunities B# | 16.10% | 38.28% | 5.31% | NA* |
| Growth Opportunities B## | | 33.28% | 5.01% | NA* |
| Growth Opportunities C# | 16.21% | 38.20% | 5.34% | 0.14% |
| Growth Opportunities C## | | 37.20% | 5.34% | 0.14% |
| Growth Opportunities I# | 16.77% | 39.69% | 6.41% | NA |
| Growth Opportunities L# | 16.73% | 39.56% | 6.36% | 1.07% |
| Growth Opportunities L## | | 32.94% | 5.33% | 0.58% |
| Growth Opportunities R3# | 16.44% | 38.87% | 6.09% | NA |
| Growth Opportunities R4# | 16.61% | 39.37% | 6.34% | NA |
| Growth Opportunities R5# | 16.80% | 39.71% | 6.53% | NA |
| Growth Opportunities Y# | 16.86% | 39.94% | 6.61% | NA |
| Russell 1000 Growth Index | 15.79% | 38.16% | 4.05% | -3.63% |
| Russell 3000 Growth Index | 16.50% | 38.69% | 4.22% | -3.37% |
| * | 10 year returns are not applicable for Class B because after 8 years Class B converts to Class A. |
PAST PERFORMANCE IS NOT INDICATIVE OF FUTURE RESULTS.
| (1) | Growth of a $10,000 investment in Classes B, C, I, L, R3, R4, R5 and Y shares will vary from results seen above due to differences in the expenses charged to these share classes. |
| (2) | The initial investment in Classes A and L shares reflects the maximum sales charge and Classes B and C reflect CDSC. |
| (3) | Total returns presented above were calculated using the Fund's net asset value available to shareholders for sale or redemption of Fund shares on April 30, 2010, which excludes investment transactions as of this date. |
| (4) | Effective 9/30/09, Class B shares of The Hartford Mutual Funds are closed to new investments. |
| (5) | Classes A, B, C and Y shares were offered beginning on 2/19/02. Performance prior to that date for Class A is that of the Fund's Class L shares and for Class C is that of the Fund's Class N shares, which had lower operating expenses. Performance prior to 2/19/02 would have been lower if Classes A and C shares expenses were applied during that period. (Class N shares are no longer offered.) Class I shares commenced operations on 8/31/06. Performance prior to 8/31/06 reflects Class A performance. Classes R3, R4 and R5 shares commenced operations on 12/22/06. Performance prior to 12/22/06 reflects Class Y performance. The Fund’s performance information prior to 4/1/01 reflects when the Fund was managed by a previous investment adviser. |
| Portfolio Managers | | |
| Michael T. Carmen, CFA, CPA | Mario E. Abularach, CFA, CMT | Stephen Mortimer |
| Senior Vice President, Partner | Vice President | Senior Vice President |
How did the Fund perform?
The Class A shares of The Hartford Growth Opportunities Fund returned 16.58%, before sales charge, for the six-month period ended April 30, 2010, performing in-line with the benchmark, the Russell 3000 Growth Index, which returned 16.50% and outperforming its other benchmark, the Russell 1000 Growth Index, which returned 15.79% for the same period. The Fund underperformed the 17.09% return of the average fund in the Lipper Multi-Cap Growth Funds peer group, a group of funds with investment strategies similar to those of the Fund.
Why did the Fund perform this way?
U.S. equities posted positive results during the period, extending a nearly 14-month long market rally. Throughout the period, extraordinary government measures helped to stabilize global economies and markets, and as the period progressed, investor confidence grew amid accommodative monetary policy, better-than-expected corporate earnings, and improving economic data, providing a favorable backdrop for equities.
In this environment, large cap stocks (+16%) underperformed mid cap stocks (+26%) and small cap stocks (+28%) during the period, as measured by the S&P 500, S&P MidCap 400, and Russell 2000 indices, respectively. Growth (+17%) slightly underperformed Value (+19%), as measured by the Russell 3000 Growth and Russell 3000 Value indices, respectively. All ten sectors of the Russell 3000 Growth Index had positive returns, with Industrials, Consumer Discretionary, and Financials leading the way while Utilities, Energy, and Consumer Staples rose the least.
The Fund benefited from strong security selection in Information Technology, Materials, and Energy. This was partially offset by weaker selection in Financials, Consumer Staples, and Consumer Discretionary. Sector weight positioning, the result of bottom-up (i.e. stock by stock fundamental research) stock selection decisions, also contributed positively to relative performance due to an overweight (i.e. the Fund’s sector position was greater than the benchmark position) position in Consumer Discretionary and an underweight (i.e. the Fund’s sector position was less than the benchmark position) position in Consumer Staples.
The largest contributors to relative performance included SanDisk (Information Technology), Ford Motor Company (Consumer Discretionary) and Cliffs Natural Resources (Materials). Shares of SanDisk, a manufacturer of flash storage products, rose as the company posted better-than-expected results on favorable NAND flash supply/demand dynamics driven by strong demand for smart phones and other consumer devices. Automobile and truck manufacturer Ford’s stock rose as the company’s strong line-up drove full-year market share gains as well as continued improvement in transaction prices and margins. Cliffs Natural Resources, an iron ore mining company, saw its share price rise as the company reported above-consensus quarterly results and indicated a stronger year ahead, driven by attractive iron ore pricing and good cost controls. Apple (Information Technology) was a top contributor to absolute (i.e. total return) performance during the period.
Top detractors from relative performance during the period included Green Mountain Coffee (Consumer Staples), UBS (Financials), and Goldman Sachs (Financials). Shares of Green Mountain Coffee fell sharply toward the end of the period despite strong second quarter earnings amid concerns over the future growth outlook for the company. Shares of Switzerland-based investment bank and money manager UBS sold off amid expectations of a near term decline in trading profits and due to client outflows related to the tax forgiveness program for offshore U.S. accounts. Shares of investment bank Goldman Sachs declined sharply at the end of the period amid news of a civil lawsuit and potential criminal investigation by the U.S. government. Qualcomm (Information Technology) and Avon Products (Consumer Staples) were also top detractors from absolute performance during the period.
What is the outlook?
March 2010 marked the one year anniversary of recession-induced lows in global capital markets. Since the bottom in early 2009, risk assets have rebounded strongly while global economies continue to show signs of stabilizing as unprecedented fiscal and monetary stimulus work their way through the system. During the first quarter of 2010, U.S. retail sales showed surprising strength and manufacturing data indicated improvements in both new orders and employment. Areas of weakness persist, however, U.S. employment, while stabilizing, remains moribund, contributing to continued weakness in consumer confidence data. The housing market remains fragile, although declines appear to be moderating.
We continue to focus our research efforts on identifying stocks of companies whose future growth is underpriced. At the end of the period, our bottom-up decisions resulted in overweights in the Consumer Discretionary, Information Technology, and Industrials sectors and underweights in the Consumer Staples, Materials, and Utilities sectors relative to the Russell 3000 Growth Index.
| Diversification by Industry | | | |
| as of April 30, 2010 | | | |
| | | Percentage of | |
| Industry (Sector) | | Net Assets | |
| Automobiles & Components (Consumer | | | |
| Discretionary) | | | 2.6 | % |
| Capital Goods (Industrials) | | | 9.2 | |
| Consumer Durables & Apparel (Consumer | | | | |
| Discretionary) | | | 2.7 | |
| Consumer Services (Consumer Discretionary) | | | 0.8 | |
| Diversified Financials (Financials) | | | 3.6 | |
| Energy (Energy) | | | 4.7 | |
| Food, Beverage & Tobacco (Consumer Staples) | | | 1.5 | |
| Health Care Equipment & Services (Health Care) | | | 6.5 | |
| Insurance (Financials) | | | 1.2 | |
| Materials (Materials) | | | 1.5 | |
| Media (Consumer Discretionary) | | | 1.1 | |
| Pharmaceuticals, Biotechnology & Life Sciences | | | | |
| (Health Care) | | | 9.1 | |
| Real Estate (Financials) | | | 1.0 | |
| Retailing (Consumer Discretionary) | | | 10.0 | |
| Semiconductors & Semiconductor Equipment | | | | |
| (Information Technology) | | | 5.5 | |
| Software & Services (Information Technology) | | | 12.5 | |
| Technology Hardware & Equipment (Information | | | | |
| Technology) | | | 17.4 | |
| Telecommunication Services (Services) | | | 1.1 | |
| Transportation (Industrials) | | | 3.1 | |
| Short-Term Investments | | | 5.3 | |
| Other Assets and Liabilities | | | (0.4 | ) |
| Total | | | 100.0 | % |
| The Hartford Growth Opportunities Fund |
April 30, 2010 (Unaudited)
| Shares or Principal Amount | | Market Value ╪ | |
| COMMON STOCKS - 95.1% | | | |
| | | Automobiles & Components - 2.6% | | | |
| | 2,173 | | Ford Motor Co. ● | | $ | 28,295 | |
| | 785 | | Johnson Controls, Inc. | | | 26,371 | |
| | | | | | | 54,666 | |
| | | | Capital Goods - 9.2% | | | | |
| | 376 | | Boeing Co. | | | 27,219 | |
| | 481 | | Honeywell International, Inc. | | | 22,852 | |
| | 444 | | Illinois Tool Works, Inc. | | | 22,699 | |
| | 1,185 | | Ingersoll-Rand plc | | | 43,810 | |
| | 252 | | Lockheed Martin Corp. | | | 21,367 | |
| | 1,950 | | Masco Corp. | | | 31,655 | |
| | 352 | | Rockwell Collins, Inc. | | | 22,900 | |
| | | | | | | 192,502 | |
| | | | Consumer Durables & Apparel - 2.7% | | | | |
| | 675 | | Coach, Inc. | | | 28,169 | |
| | 938 | | Jarden Corp. | | | 30,137 | |
| | | | | | | 58,306 | |
| | | | Consumer Services - 0.8% | | | | |
| | 1,119 | | MGM Mirage, Inc. ● | | | 17,786 | |
| | | | | | | | |
| | | | Diversified Financials - 3.6% | | | | |
| | 651 | | Ameriprise Financial, Inc. | | | 30,157 | |
| | 914 | | Invesco Ltd. | | | 21,004 | |
| | 1,543 | | UBS AG | | | 23,897 | |
| | | | | | | 75,058 | |
| | | | Energy - 4.7% | | | | |
| | 196 | | Apache Corp. | | | 19,925 | |
| | 434 | | Baker Hughes, Inc. | | | 21,616 | |
| | 463 | | Consol Energy, Inc. | | | 20,664 | |
| | 544 | | National Oilwell Varco, Inc. | | | 23,943 | |
| | 259 | | Peabody Energy Corp. | | | 12,110 | |
| | | | | | | 98,258 | |
| | | | Food, Beverage & Tobacco - 1.5% | | | | |
| | 446 | | Green Mountain Coffee Roasters ● | | | 32,438 | |
| | | | | | | | |
| | | | Health Care Equipment & Services - 6.5% | | | | |
| | 812 | | Aetna, Inc. | | | 24,001 | |
| | 622 | | CIGNA Corp. | | | 19,935 | |
| | 175 | | Edwards Lifesciences Corp. ● | | | 18,018 | |
| | 1,492 | | Hologic, Inc. ● | | | 26,669 | |
| | 59 | | Intuitive Surgical, Inc. ● | | | 21,094 | |
| | 936 | | UnitedHealth Group, Inc. | | | 28,364 | |
| | | | | | | 138,081 | |
| | | | Insurance - 1.2% | | | | |
| | 1,526 | | Genworth Financial, Inc. ● | | | 25,203 | |
| | | | | | | | |
| | | | Materials - 1.5% | | | | |
| | 401 | | Mosaic Co. | | | 20,482 | |
| | 192 | | Rio Tinto plc | | | 9,904 | |
| | | | | | | 30,386 | |
| | | | Media - 1.1% | | | | |
| | 578 | | DreamWorks Animation SKG, Inc. ● | | | 22,925 | |
| | | | | |
| | | | Pharmaceuticals, Biotechnology & Life Sciences - 9.1% | |
| | 755 | | Amylin Pharmaceuticals, Inc. ● | | | 15,581 | |
| | 544 | | Auxilium Pharmaceuticals, Inc. ● | | | 19,370 | |
| | 275 | | Celgene Corp. ● | | | 17,061 | |
| | 592 | | Elan Corp. plc ADR ● | | | 3,975 | |
| | 944 | | Mylan, Inc. ● | | | 20,794 | |
| | 1,229 | | Pfizer, Inc. | | | 20,547 | |
| | 966 | | Shionogi & Co., Ltd. | | | 17,436 | |
| | 385 | | Teva Pharmaceutical Industries Ltd. ADR | | | 22,599 | |
| | 581 | | Thermo Fisher Scientific, Inc. ● | | | 32,096 | |
| | 504 | | Watson Pharmaceuticals, Inc. ● | | | 21,573 | |
| | | | | | | 191,032 | |
| | | | Real Estate - 1.0% | | | | |
| | 4,020 | | Wharf Holdings Ltd. | | | 21,741 | |
| | | | | | | | |
| | | | Retailing - 10.0% | | | | |
| | 486 | | Advance Automotive Parts, Inc. | | | 21,937 | |
| | 276 | | Dufry Group | | | 23,597 | |
| | 1,328 | | Gap, Inc. | | | 32,851 | |
| | 465 | | Kohl's Corp. ● | | | 25,581 | |
| | 509 | | Ross Stores, Inc. | | | 28,504 | |
| | 634 | | Staples, Inc. | | | 14,913 | |
| | 539 | | Target Corp. | | | 30,625 | |
| | 818 | | Urban Outfitters, Inc. ● | | | 30,695 | |
| | | | | | | 208,703 | |
| | | | Semiconductors & Semiconductor Equipment - 5.5% | |
| | 1,004 | | Broadcom Corp. Class A | | | 34,624 | |
| | 964 | | Marvell Technology Group Ltd. ● | | | 19,900 | |
| | 1,583 | | Maxim Integrated Products, Inc. | | | 30,746 | |
| | 1,888 | | NVIDIA Corp. ● | | | 29,686 | |
| | | | | | | 114,956 | |
| | | | Software & Services - 12.5% | | | | |
| | 868 | | Adobe Systems, Inc. ● | | | 29,159 | |
| | 508 | | Amadeus IT Holding S.A. ● | | | 8,124 | |
| | 562 | | BMC Software, Inc. ● | | | 22,140 | |
| | 661 | | Citrix Systems, Inc. ● | | | 31,076 | |
| | 412 | | Cognizant Technology Solutions Corp. ● | | | 21,081 | |
| | 1,166 | | eBay, Inc. ● | | | 27,760 | |
| | 268 | | Equinix, Inc. ● | | | 26,984 | |
| | 774 | | Microsoft Corp. | | | 23,623 | |
| | 2,050 | | Oracle Corp. | | | 52,969 | |
| | 202 | | Visa, Inc. | | | 18,217 | |
| | | | | | | 261,133 | |
| | | | Technology Hardware & Equipment - 17.4% | | | | |
| | 483 | | Apple, Inc. ● | | | 126,121 | |
| | 1,253 | | Cisco Systems, Inc. ● | | | 33,728 | |
| | 1,687 | | Dell, Inc. ● | | | 27,302 | |
| | 1,300 | | EMC Corp. ● | | | 24,704 | |
| | 2,081 | | Hughes Telematics, Inc. ● | | | 6,670 | |
| | 778 | | Juniper Networks, Inc. ● | | | 22,092 | |
| | 675 | | Qualcomm, Inc. | | | 26,160 | |
| | 337 | | Research In Motion Ltd. ● | | | 23,998 | |
| | 819 | | SanDisk Corp. ● | | | 32,662 | |
| | 2,247 | | Seagate Technology ● | | | 41,272 | |
| | | | | | | 364,709 | |
| | | | Telecommunication Services - 1.1% | | | | |
| | 564 | | American Tower Corp. Class A ● | | | 23,005 | |
| | | | | | | | |
| | | | Transportation - 3.1% | | | | |
| | 659 | | Expeditors International of Washington, Inc. | | | 26,860 | |
The accompanying notes are an integral part of these financial statements.
| Shares or Principal Amount | | Market Value ╪ | |
| COMMON STOCKS - 95.1% - (continued) | | | | | |
| | | | Transportation - 3.1% - (continued) | | | | | |
| | 433 | | | FedEx Corp. | | | | $ | 38,974 | |
| | | | | | | | | | 65,834 | |
| | | | | Total common stocks | | | | | | |
| | | | | (cost $1,689,270) | | | | $ | 1,996,722 | |
| | | | | | | | | | | |
| | | | | Total long-term investments | | | | | | |
| | | | | (cost $1,689,270) | | | | $ | 1,996,722 | |
| | | | | | | |
| SHORT-TERM INVESTMENTS - 5.3% | | | | | | |
| | | | | Repurchase Agreements - 5.3% | | | | | | |
| | | | | BNP Paribas Securities Corp. TriParty Joint | | | | |
| | | | | Repurchase Agreement (maturing on | | | | |
| | | | | 05/03/2010 in the amount of $11,505, | | | | |
| | | | | collateralized by FHLMC 4.00% - 7.50%, | | | | |
| | | | | 2012 - 2040, FNMA 4.00% - 6.50%, 2010 | | | | |
| | | | | - 2040, value of $11,735) | | | | | | |
| $ | 11,505 | | | 0.20%, 04/30/2010 | | | | $ | 11,505 | |
| | | | | Deutsche Bank Securities TriParty Joint | | | | |
| | | | | Repurchase Agreement (maturing on | | | | |
| | | | | 05/03/2010 in the amount of $42,901, | | | | |
| | | | | collateralized by FNMA 3.50% - 9.00%, | | | | |
| | | | | 2013 - 2048, value of $43,758) | | | | | | |
| | 42,900 | | | 0.20%, 04/30/2010 | | | | | 42,900 | |
| | | | | JP Morgan Chase TriParty Joint Repurchase | | | | |
| | | | | Agreement (maturing on 05/03/2010 in the | | | | |
| | | | | amount of $13,225, collateralized by | | | | |
| | | | | FHLMC 6.00% - 6.50%, 2038, value of | | | | |
| | | | | $13,489) | | | | | |
| | 13,225 | | | 0.20%, 04/30/2010 | | | | | 13,225 | |
| | | | | Morgan Stanley & Co., Inc. TriParty Joint | | | | |
| | | | | Repurchase Agreement (maturing on | | | | |
| | | | | 05/03/2010 in the amount of $26,780, | | | | |
| | | | | collateralized by FHLMC 4.00% - 6.50%, | | | | |
| | | | | 2017 - 2040, FNMA 3.50% - 6.50%, 2018 | | | | |
| | | | | - 2040, value of $27,367) | | | | | | |
| | 26,779 | | | 0.19%, 04/30/2010 | | | | | 26,779 | |
| | | | | UBS Securities, Inc. Repurchase Agreement | | | | |
| | | | | (maturing on 05/03/2010 in the amount of | | | | |
| | | | | $185, collateralized by U.S. Treasury Bond | | | | |
| | | | | 7.63%, 2022, value of $190) | | | | | | |
| | 185 | | | 0.18%, 04/30/2010 | | | | | 185 | |
| | | | | UBS Securities, Inc. TriParty Joint | | | | | | |
| | | | | Repurchase Agreement (maturing on | | | | |
| | | | | 05/03/2010 in the amount of $15,684, | | | | |
| | | | | collateralized by U.S. Treasury Note | | | | | | |
| | | | | 3.00%, 2017, value of $15,998) | | | | | | |
| | 15,684 | | | 0.20%, 04/30/2010 | | | | | 15,684 | |
| | | | | | | | | | | 110,278 | |
| | | | | Total short-term investments | | | | | | |
| | | | | (cost $110,278) | | | | $ | 110,278 | |
| | | | | | | | | | | |
| | | | | Total investments | | | | | | |
| | | | | (cost $1,799,548) ▲ | | 100.4 | % | $ | 2,107,000 | |
| | | | | Other assets and liabilities | | (0.4 | )% | | (9,242 | ) |
| | | | | Total net assets | | 100.0 | % | $ | 2,097,758 | |
| Note: | Percentage of investments as shown is the ratio of the total market value to total net assets. Market value of investments in foreign securities represents 7.4% of total net assets at April 30, 2010. |
Foreign securities that are principally traded on certain foreign markets are adjusted daily pursuant to a third party pricing service methodology approved by the Board of Directors in order to reflect an adjustment for factors occurring after the close of the foreign market but before the close of the New York Stock Exchange.
| ▲ | At April 30, 2010, the cost of securities for federal income tax purposes was $1,812,161 and the aggregate gross unrealized appreciation and depreciation based on that cost were: |
| Unrealized Appreciation | | $ | 357,315 | |
| Unrealized Depreciation | | | (62,476 | ) |
| Net Unrealized Appreciation | | $ | 294,839 | |
| ● | Currently non-income producing. |
Forward Foreign Currency Contracts Outstanding at April 30, 2010
| | | | | | | | | | Unrealized | |
| | | Market | | | Contract | | Delivery | | Appreciation/ | |
| Description | | Value ╪ | | | Amount | | Date | | (Depreciation) | |
| Euro (Buy) | | $ | 7,447 | | | $ | 7,376 | | 05/03/10 | | | $ | 71 | |
| Japanese Yen (Buy) | | | 1,004 | | | | 1,001 | | 07/13/10 | | | | 3 | |
| Japanese Yen (Sell) | | | 17,703 | | | | 17,819 | | 07/13/10 | | | | 116 | |
| | | | | | | | | | | | | $ | 190 | |
| ╪ | See Significant Accounting Policies of accompanying Notes to Financial Statements regarding valuation of securities. |
The accompanying notes are an integral part of these financial statements.
| The Hartford Growth Opportunities Fund |
April 30, 2010 (Unaudited)
| | | Total | | | Level 1♦ | | | Level 2♦ | | | Level 3 | |
| Assets: | | | | | | | | | | | | |
| Common Stocks ‡ | | $ | 1,996,722 | | | $ | 1,910,051 | | | $ | 86,671 | | | $ | – | |
| Short-Term Investments | | | 110,278 | | | | – | | | | 110,278 | | | | – | |
| Total | | $ | 2,107,000 | | | $ | 1,910,051 | | | $ | 196,949 | | | $ | – | |
| Forward Foreign Currency Contracts * | | | 190 | | | | – | | | | 190 | | | | – | |
| Total | | $ | 190 | | | $ | – | | | $ | 190 | | | $ | – | |
| ♦ | For the period ended April 30, 2010, there were no significant transfers between Level 1 and Level 2. |
| | |
| ‡ | The Fund has all or primarily all of these equity securities categorized in a single level. Refer to the Schedule of Investments for further industry breakout. |
| | |
| * | Derivative instruments not reflected in the Schedule of Investments are valued at the unrealized appreciation/depreciation on the investments. |
| The Hartford Growth Opportunities Fund |
April 30, 2010 (Unaudited)
| Assets: | | | |
| Investments in securities, at market value (cost $1,799,548) | | $ | 2,107,000 | |
| Cash | | | 3 | |
| Foreign currency on deposit with custodian (cost $–) | | | — | |
| Unrealized appreciation on forward foreign currency contracts | | | 190 | |
| Receivables: | | | | |
| Fund shares sold | | | 6,245 | |
| Dividends and interest | | | 471 | |
| Other assets | | | 169 | |
| Total assets | | | 2,114,078 | |
| Liabilities: | | | | |
| Payables: | | | | |
| Investment securities purchased | | | 12,084 | |
| Fund shares redeemed | | | 3,223 | |
| Investment management fees | | | 168 | |
| Administrative fees | | | 1 | |
| Distribution fees | | | 57 | |
| Accrued expenses | | | 787 | |
| Total liabilities | | | 16,320 | |
| Net assets | | $ | 2,097,758 | |
| Summary of Net Assets: | | | | |
| Capital stock and paid-in-capital | | $ | 2,585,967 | |
| Accumulated net investment loss | | | (4,841 | ) |
| Accumulated net realized loss on investments and foreign currency transactions | | | (790,944 | ) |
| Unrealized appreciation of investments and the translation of assets and liabilities denominated in foreign currency | | | 307,576 | |
| Net assets | | $ | 2,097,758 | |
| | | | | |
| | | | | |
| Shares authorized | | | 23,750,000 | |
| Par value | | $ | 0.0001 | |
Class A: Net asset value per share/Maximum offering price per share | | | $24.12/$25.52 | |
| Shares outstanding | | | 27,410 | |
| Net assets | | $ | 661,081 | |
Class B: Net asset value per share | | $ | 19.47 | |
| Shares outstanding | | | 1,960 | |
| Net assets | | $ | 38,153 | |
Class C: Net asset value per share | | $ | 19.50 | |
| Shares outstanding | | | 9,138 | |
| Net assets | | $ | 178,192 | |
Class I: Net asset value per share | | $ | 24.38 | |
| Shares outstanding | | | 21,267 | |
| Net assets | | $ | 518,428 | |
Class L: Net asset value per share/Maximum offering price per share | | | $24.75/$25.98 | |
| Shares outstanding | | | 17,754 | |
| Net assets | | $ | 439,328 | |
Class R3: Net asset value per share | | $ | 24.65 | |
| Shares outstanding | | | 431 | |
| Net assets | | $ | 10,627 | |
Class R4: Net asset value per share | | $ | 24.92 | |
| Shares outstanding | | | 1,678 | |
| Net assets | | $ | 41,805 | |
Class R5: Net asset value per share | | $ | 25.09 | |
| Shares outstanding | | | 551 | |
| Net assets | | $ | 13,816 | |
Class Y: Net asset value per share | | $ | 25.17 | |
| Shares outstanding | | | 7,800 | |
| Net assets | | $ | 196,328 | |
The accompanying notes are an integral part of these financial statements.
| The Hartford Growth Opportunities Fund |
For the Six-Month Period Ended April 30, 2010 (Unaudited)
| Investment Income: | | | |
| Dividends | | $ | 7,917 | |
| Interest | | | 50 | |
| Less: Foreign tax withheld | | | (155 | ) |
| Total investment income | | | 7,812 | |
| | | | | |
| Expenses: | | | | |
| Investment management fees | | | 7,570 | |
| Administrative services fees | | | 46 | |
| Transfer agent fees | | | 2,058 | |
| Distribution fees | | | | |
| Class A | | | 969 | |
| Class B | | | 190 | |
| Class C | | | 895 | |
| Class L | | | 534 | |
| Class R3 | | | 24 | |
| Class R4 | | | 49 | |
| Custodian fees | | | 15 | |
| Accounting services fees | | | 127 | |
| Registration and filing fees | | | 109 | |
| Board of Directors' fees | | | 29 | |
| Audit fees | | | 29 | |
| Other expenses | | | 400 | |
| Total expenses (before waivers and fees paid indirectly) | | | 13,044 | |
| Expense waivers | | | (26 | ) |
| Transfer agent fee waivers | | | (264 | ) |
| Commission recapture | | | (46 | ) |
| Custodian fee offset | | | — | |
| Total waivers and fees paid indirectly | | | (336 | ) |
| Total expenses, net | | | 12,708 | |
| Net Investment Loss | | | (4,896 | ) |
| Net Realized Gain on Investments and Foreign Currency Transactions: | | | | |
| Net realized gain on investments in securities | | | 185,891 | |
| Net realized loss on forward foreign currency contracts | | | (1,064 | ) |
| Net realized gain on other foreign currency transactions | | | 372 | |
| Net Realized Gain on Investments and Foreign Currency Transactions | | | 185,199 | |
Net Changes in Unrealized Appreciation of Investments and Foreign Currency Transactions: | | | | |
| Net unrealized appreciation of investments | | | 141,672 | |
| Net unrealized appreciation of forward foreign currency contracts | | | 276 | |
| Net unrealized depreciation on translation of other assets and liabilities in foreign currencies | | | (183 | ) |
Net Changes in Unrealized Appreciation of Investments and Foreign Currency Transactions | | | 141,765 | |
| Net Gain on Investments and Foreign Currency Transactions | | | 326,964 | |
| Net Increase in Net Assets Resulting from Operations | | $ | 322,068 | |
The accompanying notes are an integral part of these financial statements.
| The Hartford Growth Opportunities Fund |
| | | For the Six-Month | | | | |
| | | Period Ended | | | For the | |
| | | April 30, 2010 | | | Year Ended | |
| | | (Unaudited) | | | October 31, 2009 | |
| Operations: | | | | | | |
| Net investment income (loss) | | $ | (4,896 | ) | | $ | 1,748 | |
| Net realized gain (loss) on investments and foreign currency transactions | | | 185,199 | | | | (585,319 | ) |
| Net unrealized appreciation of investments and foreign currency transactions | | | 141,765 | | | | 752,697 | |
| Net Increase In Net Assets Resulting From Operations | | | 322,068 | | | | 169,126 | |
| Distributions to Shareholders: | | | | | | | | |
| From net investment income | | | | | | | | |
| Class I | | | (629 | ) | | | — | |
| Class L | | | (152 | ) | | | — | |
| Class R5 | | | (24 | ) | | | — | |
| Class Y | | | (463 | ) | | | — | |
| Total distributions | | | (1,268 | ) | | | — | |
| Capital Share Transactions: | | | | | | | | |
| Class A | | | (207,567 | ) | | | (460,639 | ) |
| Class B | | | (3,902 | ) | | | (5,031 | ) |
| Class C | | | (22,510 | ) | | | (41,773 | ) |
| Class I | | | 95,331 | | | | 217,341 | |
| Class L | | | (26,865 | ) | | | (37,045 | ) |
| Class R3 | | | 741 | | | | 2,114 | |
| Class R4 | | | 484 | | | | 12,092 | |
| Class R5 | | | (140 | ) | | | 7,524 | |
| Class Y | | | (4,751 | ) | | | 19,806 | |
| Net decrease from capital share transactions | | | (169,179 | ) | | | (285,611 | ) |
| Net Increase (Decrease) In Net Assets | | | 151,621 | | | | (116,485 | ) |
| Net Assets: | | | | | | | | |
| Beginning of period | | | 1,946,137 | | | | 2,062,622 | |
| End of period | | $ | 2,097,758 | | | $ | 1,946,137 | |
| Accumulated undistributed (distribution in excess of) net investment income (loss) | | $ | (4,841 | ) | | $ | 1,323 | |
The accompanying notes are an integral part of these financial statements.
| The Hartford Growth Opportunities Fund |
April 30, 2010 (Unaudited)
The Hartford Mutual Funds II, Inc. (“Company”) is an open-end management investment company comprised of five portfolios. Financial statements for The Hartford Growth Opportunities Fund (the “Fund”), a series of the Company, are included in this report.
The Company is organized under the laws of the State of Maryland and is registered with the Securities and Exchange Commission (“SEC”) under the Investment Company Act of 1940, as amended (“1940 Act”). The Fund is a diversified open-end management investment company.
Class A shares are sold with a front-end sales charge of up to 5.50%. Class B shares were sold with a contingent deferred sales charge which is assessed on the lesser of the per share net asset value (“NAV”) of the shares at the time of redemption or the original purchase price, and declines from up to 5.00% to zero depending on the period of time the shares are held (See note below regarding the closing of Class B shares). Class C shares are sold with a contingent deferred sales charge of up to 1.00% on shares redeemed within twelve months of purchase. Class I shares are sold without sales charges to certain eligible investors through advisory fee-based wrap programs. Class L shares are sold with a sales charge of up to 4.75%. Classes R3, R4 and R5 shares, which are offered to employer-sponsored retirement plans, and Class Y shares, which are sold to certain eligible institutional investors, are sold without a sales charge. All classes of shares have identical voting, redemption, dividend, liquidation and other rights and the same terms and conditions, with the exceptions that each class may have different expenses, which may affect performance, and that Class B shares automatically convert to Class A shares after 8 years.
No new or additional investments are allowed in Class B shares of The Hartford Mutual Funds (including investments through any systematic investment plan). Existing shareholders of Class B shares may continue to hold their Class B shares, exchange their Class B shares for Class B shares of another Hartford Mutual Fund (as permitted by existing exchange privileges), or redeem their Class B shares as described in the Fund’s prospectus. Reinstatement privileges with respect to Class B shares will continue under the current policy. For investors electing to reinvest capital gains and dividends, any such capital gains or dividends on Class B shares will continue to be reinvested in Class B shares of the Fund. All Class B share attributes, including the 12b-1 fee, contingent deferred sales charge schedule, and conversion to Class A shares remain unchanged.
| 2. | Significant Accounting Policies: |
The following is a summary of significant accounting policies of the Fund, which are in accordance with U.S. Generally Accepted Accounting Principles (“GAAP”).
| | a) | Security Transactions and Investment Income – Security transactions are recorded on the trade date (the date the order to buy or sell is executed). Security gains and losses are determined on the basis of identified cost. |
Dividend income is accrued as of the ex-dividend date, except that certain dividends for foreign securities where the ex-dividend date may have passed are recorded as soon as the Fund is informed of the dividend in the exercise of reasonable diligence. Interest income, including amortization of premium and accretion of discounts, is accrued on a daily basis.
| | b) | Security Valuation – The Fund generally uses market prices in valuing portfolio securities. If market prices are not readily available or are deemed unreliable, the Fund will use the fair value of the security as determined in good faith under policies and procedures established by and under the supervision of the Fund’s Board of Directors. Market prices may be deemed unreliable, for example, if a security is thinly traded or if an event has occurred after the close of the security’s primary market, but before the close of the New York Stock Exchange (the “Exchange”) (generally 4:00 p.m. Eastern Time, referred to as the “Valuation Time”) that is expected to affect the value of the portfolio security. The circumstances in which the Fund may use fair value pricing include, among others: (i) the occurrence of events that are significant to a particular issuer, such as mergers, restructuring or defaults; (ii) the occurrence of events that are |
significant to an entire market, such as natural disasters in a particular region or governmental actions; (iii) trading restrictions on securities; (iv) thinly traded securities and (v) market events such as trading halts and early market closings. In addition, with respect to the valuation of stocks primarily traded on foreign markets, the Fund uses a fair value pricing service approved by the Fund’s Board of Directors, which employs quantitative models that evaluate changes in the value of foreign market proxies (e.g., futures contracts, American Depositary Receipts, exchange traded funds (“ETF’s”)) after the close of the foreign markets but before the Valuation Time. Securities that are primarily traded on foreign markets may trade on days that are not business days of the Fund. The value of the foreign securities in which the Fund invests may change on days when a shareholder will not be able to purchase or redeem shares of the Fund. Fair value pricing is subjective in nature and the use of fair value pricing by the Fund may cause the NAV of its shares to differ significantly from the NAV that would have been calculated using market prices at the close of the exchange on which a portfolio security is primarily traded but before the Valuation Time. There can be no assurance that the Fund could obtain the fair value assigned to a security if the Fund were to sell the security at approximately the time at which the Fund determines its NAV.
Exchange-traded equity securities are valued at the last reported sale price on the exchange or market on which the security is primarily traded (the “Primary Market”) at the Valuation Time. If the security did not trade on the Primary Market, it may be valued at the Valuation Time at the last reported sale price on another exchange where it trades. The value of an equity security not traded on any exchange but traded on the Nasdaq Stock Market, Inc. (“Nasdaq”) or another over-the-counter market shall be valued at the last reported sale price or official closing price on the exchange or market on which the security is traded as of the Valuation Time.
Foreign-denominated assets, including investment securities, and liabilities are translated from the local currency into U.S. dollars using exchange rates obtained from an independent third party as of the Fund’s Valuation Time.
Financial instruments for which prices are not available from an independent pricing service are valued using market quotations obtained from one or more dealers that make markets in securities in accordance with procedures established by the Fund’s Board of Directors.
Forward foreign currency contracts represent agreements to exchange currencies on specific future dates at predetermined rates. Forward foreign currency contracts are valued using foreign currency exchange rates and forward rates on the Valuation Date from an independent pricing service.
Other derivative or contractual type instruments shall be valued using market prices if such instruments trade on an exchange or market. If such instruments do not trade on an exchange or market, such instruments shall be valued at a price at which the counterparty to such contract would repurchase the instrument. In the event that the counterparty cannot provide a price, such valuation may be determined in accordance with procedures established by the Fund’s Board of Directors.
Various inputs are used in determining the value of the Fund’s investments. These inputs are summarized into three broad hierarchy levels. This hierarchy is based on whether the valuation inputs are observable or unobservable. These levels are:
| | ● | Level 1 – Quoted prices in active markets for identical securities. Level 1 may include exchange-traded instruments such as domestic equities, some foreign equities, options, futures, mutual funds, ETF’s, and rights and warrants. |
| | | Level 2 – Observable inputs other than Level 1 prices, such as quoted prices for similar securities; quoted prices in markets that are not active; or other inputs that are observable or can be corroborated by observable market data for substantially the full term of the security. Level 2 may include debt securities that are traded less frequently than exchange-traded instruments and that are valued using third party pricing services; foreign equities, whose value is determined using a multi-factor regression model with inputs that are observable in the market; and money market instruments, which are carried at amortized cost. |
| The Hartford Growth Opportunities Fund |
Notes to Financial Statements – (continued)
April 30, 2010 (Unaudited)
| | | Level 3 – Significant unobservable inputs that are supported by little or no market activity. Level 3 may include financial instruments whose values are determined using broker quotes or require significant management judgment or estimation. These unobservable valuation inputs may include estimates for current yields, maturity/duration, prepayment speed, and broker quotes for comparable securities along with other assumptions relating to credit quality, collateral value, complexity of the security structure, general market conditions and liquidity. This category may include securities where trading has been halted or there are certain restrictions on trading. While these securities are priced using unobservable inputs, the valuation of these securities reflects the best available data and management believes the prices are a reasonable representation of exit price. |
Individual securities within any of the above mentioned asset classes may be assigned a different hierarchical level than those presented above, as individual circumstances dictate.
During the six-month period ended April 30, 2010, the Fund held no Level 3 securities, therefore no reconciliation of Level 3 securities is presented.
Refer to the Investment Valuation Hierarchy Level Summary found following the Schedule of Investments.
| | c) | Foreign Currency Transactions – Assets and liabilities denominated in currencies other than U.S. dollars are translated into U.S. dollars at the exchange rates in effect on the valuation date. Purchases and sales of investment securities, income and expenses are translated into U.S. dollars at the exchange rates on the dates of such transactions. |
The Fund does not isolate that portion of portfolio security valuation resulting from fluctuations in the foreign currency exchange rates from the fluctuations arising from changes in the market prices of securities held. Exchange rate fluctuations are included with the net realized and unrealized gain or loss on investments in the accompanying financial statements.
Net realized foreign exchange gains or losses arise from sales of foreign currencies and the difference between asset and liability amounts initially stated in foreign currencies and the U.S. dollar value of the amounts actually received or paid. Net unrealized foreign exchange gains or losses arise from changes in the value of other assets and liabilities at the end of the reporting period, resulting from changes in the exchange rates.
| | d) | Joint Trading Account – Pursuant to an exemptive order issued by the SEC, the Fund may transfer uninvested cash balances into a joint trading account managed by Wellington Management Company, LLP (“Wellington”). These balances may be invested in one or more repurchase agreements and/or short-term money market instruments. |
| | e) | Repurchase Agreements – A repurchase agreement is an agreement by which a counterparty agrees to sell a security and agrees to repurchase the security sold at a mutually agreed upon time and price. At the time the Fund enters into a repurchase agreement, the value of the underlying collateral security(ies), including accrued interest, will be equal to or exceed the value of the repurchase agreement. To minimize counterparty risk, the securities that serve to collateralize the repurchase agreement are held by the Fund's custodian in book entry or physical form in the custodial account of the Fund or in a third party custodial account. Repurchase agreements are valued at cost plus accrued interest. The Fund, as shown on the Schedule of Investments, had outstanding repurchase agreements as of April 30, 2010. |
| | f) | Forward Foreign Currency Contracts – The Fund may enter into forward foreign currency contracts that obligate the Fund to purchase or sell currencies at specified future dates. Forward foreign currency contracts may be used to hedge against adverse fluctuations in exchange rates between currencies. |
Forward foreign currency contracts involve elements of market risk in excess of the amounts reflected in the Statement of Assets and Liabilities. In addition, risks may arise upon entering into these contracts from the potential inability of the counterparties to meet the terms of the contracts and from unanticipated movements in the value of the foreign currencies relative to the U.S. dollar. The Fund had outstanding forward foreign currency contracts as shown on the Schedule of Investments as of April 30, 2010.
| | g) | Indexed Securities – The Fund may invest in indexed securities whose values are linked to changes in interest rates, indices, or other underlying instruments. The Fund may use these securities to increase or decrease its exposure to different underlying instruments and to gain exposure to markets that might be difficult to invest in using conventional securities. Indexed securities may be more volatile than their underlying instruments, but any loss is limited to the amount of the original investment and there may be a limit to the potential appreciation of the investment. The Fund had no investments in indexed securities as of April 30, 2010. |
| | h) | Fund Share Valuation and Dividend Distributions to Shareholders – Orders for the Fund’s shares are executed in accordance with the investment instructions of the shareholders. The NAV of the Fund’s shares is determined as of the close of each business day of the Exchange. The NAV is determined separately for each class of the Fund by dividing the Fund’s net assets attributable to that class by the number of shares of the class outstanding. Orders for the purchase of the Fund’s shares prior to the close of the Exchange on any day on which the Exchange is open for business are priced at the NAV determined as of the close of the Exchange. Orders after the close of the Exchange, or on a day on which the Exchange and/or the Fund is not open for business, are priced at the next determined NAV. |
The Fund intends to distribute substantially all of its net investment income and net realized capital gains to shareholders no less frequently than once a year. Normally, dividends from net investment income of the Fund are declared and paid annually. Unless shareholders specify otherwise, all dividends will be automatically reinvested in additional full or fractional shares of the Fund.
Distributions from net investment income, realized capital gains and capital are determined in accordance with federal income tax regulations, which may differ from U.S. GAAP with respect to character and timing. These differences may include but are not limited to losses deferred due to wash sale adjustments, foreign currency gains and losses, adjustments related to Passive Foreign Investment Companies (“PFICs”), Real Estate Investment Trusts (“REITs”), Regulated Investment Companies (“RICs”), certain derivatives and partnerships. Permanent book and federal income tax basis differences relating to shareholder distributions will result in reclassifications to certain of the Fund’s capital accounts (see Federal Income Taxes: Reclassification of Capital Accounts footnote).
| | i) | Illiquid and Restricted Securities – The Fund is permitted to invest up to 15% of its net assets in illiquid securities. “Illiquid Securities” are those that may not be sold or disposed of in the ordinary course of business within seven days, at approximately the price used to determine the Fund’s NAV. The Fund may not be able to sell illiquid securities or other investments when its sub-adviser considers it desirable to do so or may have to sell such securities or investments at a price that is lower than the price that could be obtained if the securities or investments were more liquid. A sale of illiquid securities or other investments may require more time and may result in higher dealer discounts and other selling expenses than does the sale of those that are liquid. Illiquid securities and investments also may be more difficult to value, due to the unavailability of reliable market quotations for such securities or investments, and an investment in them may have an adverse impact on the Fund’s NAV. The Fund may also purchase certain restricted securities, commonly known as Rule 144A securities, that can be resold to institutions and which may be determined to be liquid pursuant to policies and guidelines established by the Fund’s Board of Directors. The Fund had no illiquid or restricted securities as of April 30, 2010. |
| | j) | Securities Purchased on a When-Issued or Delayed-Delivery Basis – Delivery and payment for securities that have been purchased by the Fund on a forward commitment, or when-issued or delayed-delivery basis, take place beyond the customary settlement period. During this period, such securities are subject to market fluctuations, and the Fund identifies securities segregated in its records with value at least equal to the amount of the commitment. As of April 30, 2010, the Fund had no outstanding when-issued or delayed delivery securities. |
| | k) | Use of Estimates – The preparation of financial statements in conformity with U.S. GAAP requires management to make estimates and assumptions that affect the reported amounts of assets and liabilities as of the date of the financial statements and the reported amounts of income and expenses during the period. Operating results in the future could vary from the amounts derived from management’s estimates. |
| The Hartford Growth Opportunities Fund |
Notes to Financial Statements – (continued)
April 30, 2010 (Unaudited)
| | l) | Additional Derivative Instrument(s) Information |
Derivative Instrument(s) as of April 30, 2010.
| | Asset Derivatives | Liability Derivatives |
| Risk Exposure Category | Statement of Assets and Liabilities Location | Statement of Assets and Liabilities Location |
| | | | | |
| Foreign exchange contracts | Unrealized appreciation on forwardforeign currency contracts | $ | 190 | |
The volume of derivatives that is presented in the Schedule of Investments is consistent with the derivative activity during the six-month period ended April 30, 2010.
Realized Gain/Loss and Change in Unrealized Appreciation (Depreciation) on Derivative Instruments for the six-month period ended April 30, 2010:
| Amount of Realized Gain or (Loss) on Derivatives Recognized in Income | |
| | | | | | | | | | | Forward | | | | | | | |
| | Written | | | Purchased | | | | | Currency | | | | | | | |
| Risk Exposure Category | Options | | | Options | | | Futures | | Contracts | | | Swaps | | | Total | |
| Foreign exchange contracts | | $ | — | | | $ | — | | | $ | — | | | $ | (1,064 | ) | | $ | — | | | $ | (1,064 | ) |
| Total | | $ | — | | | $ | — | | | $ | — | | | $ | (1,064 | ) | | $ | — | | | $ | (1,064 | ) |
Change in Unrealized Appreciation or (Depreciation) on Derivatives Recognized in Income | |
| | | | | | | | | | | | | | Forward | | | | | | | | | |
| | Written | | | Purchased | | | | | | Currency | | | | | | | | | |
| Risk Exposure Category | Options | | | Options | | | Futures | | Contracts | | | Swaps | | | Total | |
| Foreign exchange contracts | | | — | | | | — | | | | — | | | | 276 | | | | — | | | $ | 276 | |
| Total | | $ | — | | | $ | — | | | $ | — | | | $ | 276 | | | $ | — | | | $ | 276 | |
| | m) | Indemnifications – Under the Company’s organizational documents, the Company shall indemnify its officers and directors to the full extent required or permitted under Maryland General Corporation Law and the federal securities law. |
In addition, the Company, on behalf of the Fund, may enter into contracts that contain a variety of indemnifications. The Company’s maximum exposure under these arrangements is unknown. However, the Company has not had prior claims or losses pursuant to these contracts and expects the risk of loss to be remote.
| | a) | Federal Income Taxes – For federal income tax purposes, the Fund intends to continue to qualify as a RIC under Subchapter M of the Internal Revenue Code (“IRC”) by distributing substantially all of its taxable net investment income and net realized capital gains to its shareholders and otherwise complying with the requirements of RICs. The Fund has distributed substantially all of its income and capital gains in prior years and intends to distribute substantially all of its income and capital gains during the calendar year ending December 31, 2010. Accordingly, no provision for federal income or excise taxes has been made in the accompanying financial statements. Distributions from short-term capital gains are treated as ordinary income distributions for federal income tax purposes. |
| | b) | Net Investment Income (Loss), Net Realized Gains (Losses) – Net investment income (loss) and net realized gains (losses) may differ for financial statement and tax purposes primarily because of losses deferred due to wash sale adjustments, foreign currency gains and losses, adjustments related to PFICs, REITs, RICs, certain derivatives and partnerships. The character of distributions made during the year from net investment income or net realized gains may differ from their ultimate characterization for federal income tax purposes. Also, due to the timing of dividend distributions, the fiscal year in which amounts are distributed may differ from the year that the income or realized gains (losses) were recorded by the Fund. |
| | c) | Distributions and Components of Distributable Earnings – The tax character of distributions paid by the Fund for the periods indicated is as follows (as adjusted for dividends payable): |
| | | For the Year Ended | | | For the Year Ended | |
| | | October 31, 2009 | | | October 31, 2008 | |
| Ordinary Income | | $ | — | | | $ | 161,438 | |
| Long-Term Capital Gains * | | | — | | | | 100,232 | |
| | * | The Fund designates these distributions as long-term capital gain dividends pursuant to IRC code Sec. 852(b)(3)(C). |
As of October 31, 2009, the Fund’s components of distributable earnings (deficit) on a tax basis were as follows:
| | | Amount | |
| Undistributed Ordinary Income | | $ | 1,265 | |
| Accumulated Capital Losses * | | | (963,530 | ) |
Unrealized Appreciation † | | | 153,256 | |
| Total Accumulated Deficit | | $ | (809,009 | ) |
| | * | The Fund has capital loss carryforwards that are identified in the Capital Loss Carryforward note that follows. |
| | † | The differences between book-basis and tax-basis unrealized appreciation (depreciation) may be attributable to the losses deferred due to wash sale adjustments, foreign currency gains and losses, adjustments related to PFICs, REITs, RICs, certain derivatives and partnerships. |
| | d) | Reclassification of Capital Accounts – The Fund may record reclassifications in its capital accounts. These reclassifications have no impact on the total net assets of the Fund. The reclassifications are a result of permanent differences between GAAP and tax accounting for such items as net operating losses that reduce distribution requirements. Adjustments are made to reflect the impact these items have on current and future distributions to shareholders. Therefore, the source of the Fund’s distributions may be shown in the accompanying Statement of Changes in Net Assets as from net investment income, from net realized gains on investments or from capital depending on the type of book and tax differences that exist. For the year ended October 31, 2009, the Fund recorded reclassifications to increase (decrease) the accounts listed below: |
| | | Amount | |
| Undistributed Net Investment Income | | $ | (359 | ) |
| Accumulated Net Realized Gain | | | 186 | |
| Paid-in-Capital | | | 173 | |
| | e) | Capital Loss Carryforward – At October 31, 2009 (tax-year-end), the Fund had capital loss carryforwards for U.S. federal income tax purposes of approximately: |
| Year of Expiration | | Amount | |
| 2016 | | $ | 333,785 | |
| 2017 | | | 629,745 | |
| Total | | $ | 963,530 | |
| | f) | Accounting for Uncertainty in Income Taxes – Management has evaluated all open tax years and has determined there is no impact to the Fund’s financial statements related to uncertain tax positions. Generally, tax authorities can examine all tax returns filed for the last three years. |
| The Hartford Growth Opportunities Fund |
Notes to Financial Statements – (continued)
April 30, 2010 (Unaudited)
| | a) | Investment Management Agreement – Hartford Investment Financial Services, LLC (“HIFSCO”) serves as investment manager to the Fund pursuant to an Investment Management Agreement with the Company. As investment manager, HIFSCO has overall investment supervisory responsibility for the Fund. In addition, HIFSCO provides administrative personnel, services, equipment, facilities and office space for proper operation of the Fund. HIFSCO has contracted with Wellington for the provision of day-to-day investment management services to the Fund in accordance with the Fund’s investment objective and policies. The Fund pays a fee to HIFSCO, a portion of which may be used to compensate Wellington. |
The schedule below reflects the rates of compensation paid to HIFSCO for investment management services rendered during the six-month period ended April 30, 2010; the rates are accrued daily and paid monthly:
| Average Daily Net Assets | Annual Fee | |
| On first $100 million | 0.9000% | |
| On next $150 million | 0.8000% | |
| On next $4.75 billion | 0.7000% | |
| On next $5 billion | 0.6975% | |
| Over $10 billion | 0.6950% | |
| | b) | Accounting Services Agreement – Pursuant to the Fund Accounting Agreement between Hartford Life Insurance Company (“HLIC”) and the Fund, HLIC provides accounting services to the Fund and receives monthly compensation on the Fund’s average net assets. The Fund’s accounting services fees are accrued daily and paid monthly. |
| Average Daily Net Assets | Annual Fee | |
| On first $5 billion | 0.012% | |
| Over $5 billion | 0.010% | |
| | c) | Operating Expenses – Allocable expenses incurred by the Company are allocated to each Fund and allocated to classes within the Fund in proportion to the average daily net assets of the Fund and each class, except where allocation of certain expenses is more fairly made directly to the Fund or to specific classes within a Fund. During the six-month period ended April 30, 2010, HIFSCO has contractually limited the total operating expenses of this Fund, exclusive of taxes, interest expense, brokerage commissions, certain distribution expenses and extraordinary expenses as follows: |
| Class A | Class B | Class C | Class I | Class L | Class R3 | Class R4 | Class R5 | Class Y |
| 1.36% | 2.11% | 2.11% | 1.11% | 1.45% | 1.61% | 1.31% | 1.01% | 1.01% |
| | d) | Fees Paid Indirectly – The Fund has entered into agreements with State Street Global Markets, LLC and Russell Implementation Services Inc. to partially recapture non-discounted trade commissions. Such rebates are used to pay a portion of the Fund’s expenses. In addition, the Fund’s custodian bank has also agreed to reduce its fees when the Fund maintains cash on deposit in a non-interest-bearing custody account. For the six-month period ended April 30, 2010, these amounts are included in the Statement of Operations. |
The ratio of expenses to average net assets in the accompanying financial highlights excludes the reduction in expenses related to fees paid indirectly. Had the fees paid indirectly been included, the annualized expense ratio for the periods listed below would have been as follows:
| | | Annualized | | | | | | | | | | | | | | | | |
| | | Six-Month | | | | | | | | | | | | | | | | |
| | | Period | | | Year Ended | | | Year Ended | | | Year Ended | | | Year Ended | | | Year Ended | |
| | | Ended April | | | October 31, | | | October 31, | | | October 31, | | | October 31, | | | October 31, | |
| | | 30, 2010 | | | 2009 | | | 2008 | | | 2007 | | | 2006 | | | 2005 | |
| Class A Shares | | | 1.34 | % | | | 1.22 | % | | | 1.30 | % | | | 1.31 | % | | | 1.18 | % | | | 1.30 | % |
| Class B Shares | | | 2.08 | | | | 1.82 | | | | 2.05 | | | | 2.10 | | | | 2.05 | | | | 2.08 | |
| Class C Shares | | | 1.96 | | | | 2.02 | | | | 1.92 | | | | 1.97 | | | | 2.05 | | | | 2.07 | |
| Class I Shares | | | 0.95 | | | | 0.97 | | | | 0.85 | | | | 0.86 | | | | 1.11 | * | | | | |
| Class L Shares | | | 1.02 | | | | 1.02 | | | | 1.00 | | | | 1.03 | | | | 1.04 | | | | 1.02 | |
| Class R3 Shares | | | 1.51 | | | | 1.53 | | | | 1.51 | | | | 1.57 | † | | | | | | | | |
| Class R4 Shares | | | 1.18 | | | | 1.18 | | | | 1.18 | | | | 1.23 | † | | | | | | | | |
| Class R5 Shares | | | 0.89 | | | | 0.89 | | | | 0.93 | | | | 0.92 | † | | | | | | | | |
| Class Y Shares | | | 0.78 | | | | 0.78 | | | | 0.77 | | | | 0.79 | | | | 0.81 | | | | 0.82 | |
| | * | From August 31, 2006 (commencement of operations), through October 31, 2006. |
| | † | From December 22, 2006 (commencement of operations), through October 31, 2007. |
| | e) | Distribution and Service Plan for Class A, B, C, L, R3 and R4 Shares – HIFSCO is the principal underwriter and distributor of the Fund. HIFSCO is engaged in distribution activities, which include marketing and distribution of shares through broker-dealers, financing distribution costs and maintaining financial books and records. For the six-month period ended April 30, 2010, HIFSCO received front-end load sales charges of $502 and contingent deferred sales charges of $51 from the Fund. |
The Fund has adopted a Distribution and Service Plan in accordance with Rule 12b-1 of the Investment Company Act of 1940, as amended, to compensate the distributor (HIFSCO) for activities intended to result in the sale and distribution of Classes A, B, C, L, R3 and R4 shares and for providing services for shareholders. The Rule 12b-1 plan applicable to Class A shares of the Fund provides for payment of a Rule 12b-1 fee of up to 0.35% of average daily net assets; however, the Board of Directors has currently authorized 12b-1 payments of up to 0.25%. Some or all of the fee may be used for shareholder servicing expenses with the remainder used for distribution expenses. Some or the entire Rule 12b-1 fee for Class B shares may be remitted to broker-dealers for distribution and/or shareholder account services. Under the Class B Plan, the Fund pays the distributor 1.00% of the average daily net assets of Class B shares that are outstanding for 8 years or less, 0.25% of which is a fee for services provided to existing shareholders with the remainder used for distribution expenses. After eight years, Class B shares convert to Class A shares. Upon conversion to Class A shares, the Class A plan described above will apply to those shares. Under the Class C Plan, the Fund pays the distributor 1.00% of the average daily net assets of Class C shares outstanding, 0.25% of which is intended as a fee for services provided to existing shareholders with the remainder used for distribution expenses. For Class C shares, some or the entire fee may be remitted to broker-dealers for distribution and/or shareholder account services. Class L has a distribution fee of 0.25%. Class R3 shares have a distribution fee of 0.50% and Class R4 shares have a distribution fee of 0.25%. For Classes R3 and R4 shares, some or the entire fee may be remitted to broker dealers for distribution and/or shareholder account services. The Fund’s 12b-1 fees are accrued daily and paid monthly.
For the six-month period ended April 30, 2010, total sales commissions paid to affiliated brokers/dealers of The Hartford for distributing the Fund’s shares were $73. These commissions are in turn paid to sales representatives of the broker/dealers.
| | f) | Other Related Party Transactions – Certain officers of the Fund are directors and/or officers of HIFSCO and/or The Hartford or its subsidiaries. For the six-month period ended April 30, 2010, a portion of the Fund’s chief compliance officer’s salary was paid by all the investment companies in the Hartford fund complex. The portion allocated to the Fund was in the amount of $1. Hartford Administrative Services Company (“HASCO”), an indirect wholly owned subsidiary of The Hartford, provides transfer agent services to the Fund. HASCO has contractually agreed to reimburse any portion of the transfer agency fees over 0.30% of average daily net assets per fiscal year for all classes. HASCO was compensated $1,773 for providing such services. These fees are accrued daily and paid monthly. |
| The Hartford Growth Opportunities Fund |
Notes to Financial Statements – (continued)
April 30, 2010 (Unaudited)
Administrative services fees are paid to HASCO for third-party recordkeeping services that are payable as a percentage of net assets in the amount of 0.20%, 0.15% and 0.10% for Classes R3, R4 and R5 shares, respectively. The total administrative services fees are shown on the Statement of Operations. These fees are accrued daily and paid monthly.
| | g) | Payments from Affiliate – The total return in the accompanying financial highlights includes payment from affiliates. Had the payment from affiliates been excluded, the total return for the periods listed below would have been as follows: |
| | | Impact from | | | Total Return | | |
| | | Payment from | | | Excluding | | |
| | | Affiliate for SEC | | | Payment from | | |
| | | Settlement for the | | | Affiliate for the | | |
| | | Year Ended | | | Year Ended | | |
| | | October 31, 2007 | | | October 31, 2007 | | |
| Class A | | | 0.03 | % | | | 40.34 | % | |
| Class B | | | 0.04 | | | | 39.24 | | |
| Class C | | | 0.04 | | | | 39.35 | | |
| Class I | | | 0.03 | | | | 40.84 | | |
| Class L | | | 0.03 | | | | 40.72 | | |
| Class Y | | | 0.03 | | | | 41.02 | | |
| 5. | Investment Transactions: |
For the six-month period ended April 30, 2010, the Fund's aggregate purchases and sales of investment securities (excluding short-term investments) were as follows:
| | | Amount | |
| Cost of Purchases Excluding U.S. Government Obligations | | $ | 1,330,363 | |
| Sales Proceeds Excluding U.S. Government Obligations | | | 1,430,997 | |
| 6. | Capital Share Transactions: |
The following information is for the six-month period ended April 30, 2010 and the year ended October 31, 2009:
| | For the Six-Month Period Ended April 30, 2010 | | | For the Year Ended October 31, 2009 | |
| | | | | | Shares | | | | | | Shares | | | Net | | | | | | Shares | | | | | | Shares | | | Net | |
| | | | | | Issued for | | | | | | Issued | | | Increase | | | | | | Issued for | | | | | | Issued | | | Increase | |
| | | Shares | | | Reinvested | | | Shares | | | from | | | (Decrease) | | | Shares | | | Reinvested | | | Shares | | | from | | | (Decrease) | |
| | | Sold | | | Dividends | | | Redeemed | | | Merger | | | of Shares | | | Sold | | | Dividends | | | Redeemed | | | Merger | | | of Shares | |
| Class A | | | | | | | | | | | | | | | | | | | | | | | | | | | | | | |
Shares | | | 3,915 | | | | — | | | | (12,602 | ) | | | — | | | | (8,687 | ) | | | 22,375 | | | | — | | | | (47,862 | ) | | | — | | | | (25,487 | ) |
Amount | | $ | 89,755 | | | $ | — | | | $ | (297,322 | ) | | $ | — | | | $ | (207,567 | ) | | $ | 389,494 | | | $ | — | | | $ | (850,133 | ) | | $ | — | | | $ | (460,639 | ) |
Class B | | | | | | | | | | | | | | | | | | | | | | | | | | | | | | | | | | | | | | | | |
Shares | | | 20 | | | | — | | | | (229 | ) | | | — | | | | (209 | ) | | | 299 | | | | — | | | | (648 | ) | | | — | | | | (349 | ) |
Amount | | $ | 370 | | | $ | — | | | $ | (4,272 | ) | | $ | — | | | $ | (3,902 | ) | | $ | 4,216 | | | $ | — | | | $ | (9,247 | ) | | $ | — | | | $ | (5,031 | ) |
Class C | | | | | | | | | | | | | | | | | | | | | | | | | | | | | | | | | | | | | | | | |
Shares | | | 523 | | | | — | | | | (1,740 | ) | | | — | | | | (1,217 | ) | | | 2,604 | | | | — | | | | (5,477 | ) | | | — | | | | (2,873 | ) |
Amount | | $ | 9,756 | | | $ | — | | | $ | (32,266 | ) | | $ | — | | | $ | (22,510 | ) | | $ | 37,010 | | | $ | — | | | $ | (78,783 | ) | | $ | — | | | $ | (41,773 | ) |
Class I | | | | | | | | | | | | | | | | | | | | | | | | | | | | | | | | | | | | | | | | |
Shares | | | 7,370 | | | | 18 | | | | (3,349 | ) | | | — | | | | 4,039 | | | | 16,997 | | | | — | | | | (6,116 | ) | | | — | | | | 10,881 | |
Amount | | $ | 172,268 | | | $ | 415 | | | $ | (77,352 | ) | | $ | — | | | $ | 95,331 | | | $ | 328,781 | | | $ | — | | | $ | (111,440 | ) | | $ | — | | | $ | 217,341 | |
Class L | | | | | | | | | | | | | | | | | | | | | | | | | | | | | | | | | | | | | | | | |
Shares | | | 159 | | | | 6 | | | | (1,307 | ) | | | — | | | | (1,142 | ) | | | 372 | | | | — | | | | (2,423 | ) | | | — | | | | (2,051 | ) |
Amount | | $ | 3,731 | | | $ | 149 | | | $ | (30,745 | ) | | $ | — | | | $ | (26,865 | ) | | $ | 6,754 | | | $ | — | | | $ | (43,799 | ) | | $ | — | | | $ | (37,045 | ) |
Class R3 | | | | | | | | | | | | | | | | | | | | | | | | | | | | | | | | | | | | | | | | |
Shares | | | 114 | | | | — | | | | (83 | ) | | | — | | | | 31 | | | | 272 | | | | — | | | | (154 | ) | | | — | | | | 118 | |
Amount | | $ | 2,683 | | | $ | — | | | $ | (1,942 | ) | | $ | — | | | $ | 741 | | | $ | 4,932 | | | $ | — | | | $ | (2,818 | ) | | $ | — | | | $ | 2,114 | |
Class R4 | | | | | | | | | | | | | | | | | | | | | | | | | | | | | | | | | | | | | | | | |
Shares | | | 144 | | | | — | | | | (124 | ) | | | — | | | | 20 | | | | 838 | | | | — | | | | (177 | ) | | | — | | | | 661 | |
Amount | | $ | 3,398 | | | $ | — | | | $ | (2,914 | ) | | $ | — | | | $ | 484 | | | $ | 15,433 | | | $ | — | | | $ | (3,341 | ) | | $ | — | | | $ | 12,092 | |
Class R5 | | | | | | | | | | | | | | | | | | | | | | | | | | | | | | | | | | | | | | | | |
Shares | | | 78 | | | | 1 | | | | (84 | ) | | | — | | | | (5 | ) | | | 466 | | | | — | | | | (74 | ) | | | — | | | | 392 | |
Amount | | $ | 1,844 | | | $ | 23 | | | $ | (2,007 | ) | | $ | — | | | $ | (140 | ) | | $ | 8,977 | | | $ | — | | | $ | (1,453 | ) | | $ | — | | | $ | 7,524 | |
Class Y | | | | | | | | | | | | | | | | | | | | | | | | | | | | | | | | | | | | | | | | |
Shares | | | 632 | | | | 18 | | | | (827 | ) | | | — | | | | (177 | ) | | | 3,091 | | | | — | | | | (2,002 | ) | | | — | | | | 1,089 | |
Amount | | $ | 14,935 | | | $ | 427 | | | $ | (20,113 | ) | | $ | — | | | $ | (4,751 | ) | | $ | 54,480 | | | $ | — | | | $ | (34,674 | ) | | $ | — | | | $ | 19,806 | |
The following reflects the conversion of Class B Shares into Class A Shares (reflected as Class A Shares issued) for the six-month period ended April 30, 2010 and the year ended October 31, 2009:
| | | Shares | | | Dollars | |
| For the Six-Month Period Ended April 30, 2010 | | | 28 | | | $ | 671 | |
| For the Year Ended October 31, 2009 | | | 29 | | | $ | 526 | |
The Fund is one of several Hartford Funds that participate in a $500 million committed revolving line of credit facility. The facility is to be used for temporary or emergency purposes. Under the arrangement, the Fund is required to own securities having a market value in excess of 300% of the total bank borrowings. The interest rate on borrowings varies depending on the nature of the loan. The facility also requires a fee to be paid based on the amount of the commitment. This fee is allocated to all the Funds participating in the line of credit based on the average net assets of the Funds. During the six-month period ended April 30, 2010, the Fund did not have any borrowings under this facility.
| The Hartford Growth Opportunities Fund |
Notes to Financial Statements – (continued)
April 30, 2010 (Unaudited)
| 8. | Industry Classifications: |
Other than the industry classifications “Other Investment Pools and Funds” and “Exchange Traded Funds”, equity industry classifications used in this report are the Global Industry Classification Standard, which was developed by and is the exclusive property and service mark of MSCI, Inc. and Standard & Poor’s.
Management has evaluated subsequent events and determined that no additional items require recording or disclosure.
[This page is intentionally left blank]
| The Hartford Growth Opportunities Fund |
|
| - Selected Per-Share Data (A) - |
Class | | Net Asset Value at Beginning of Period | | | Net Investment Income (Loss) | | | Payments from (to) Affiliate | | | Net Realized and Unrealized Gain (Loss) on Investments | | | Total from Investment Operations | | | Dividends from Net Investment Income | | | Distributions from Realized Capital Gains | | | Distributions from Capital | | | Total Distributions | | | Net Increase (Decrease) in Net Asset Value | | | Net Asset Value at End of Period | |
| For the Six-Month Period Ended April 30, 2010 (Unaudited) | | | | | | | | | | | | | | | | | | | | |
| A | | $ | 20.69 | | | $ | (0.08 | ) | | $ | – | | | $ | 3.51 | | | $ | 3.43 | | | $ | – | | | $ | – | | | $ | – | | | $ | – | | | $ | 3.43 | | | $ | 24.12 | |
| B | | | 16.77 | | | | (0.13 | ) | | | – | | | | 2.83 | | | | 2.70 | | | | – | | | | – | | | | – | | | | – | | | | 2.70 | | | | 19.47 | |
| C | | | 16.78 | | | | (0.13 | ) | | | – | | | | 2.85 | | | | 2.72 | | | | – | | | | – | | | | – | | | | – | | | | 2.72 | | | | 19.50 | |
| I | | | 20.91 | | | | (0.02 | ) | | | – | | | | 3.53 | | | | 3.51 | | | | (0.04 | ) | | | – | | | | – | | | | (0.04 | ) | | | 3.47 | | | | 24.38 | |
| L | | | 21.21 | | | | (0.03 | ) | | | – | | | | 3.58 | | | | 3.55 | | | | (0.01 | ) | | | – | | | | – | | | | (0.01 | ) | | | 3.54 | | | | 24.75 | |
| R3 | | | 21.17 | | | | (0.09 | ) | | | – | | | | 3.57 | | | | 3.48 | | | | – | | | | – | | | | – | | | | – | | | | 3.48 | | | | 24.65 | |
| R4 | | | 21.37 | | | | (0.05 | ) | | | – | | | | 3.60 | | | | 3.55 | | | | – | | | | – | | | | – | | | | – | | | | 3.55 | | | | 24.92 | |
| R5 | | | 21.52 | | | | (0.02 | ) | | | – | | | | 3.63 | | | | 3.61 | | | | (0.04 | ) | | | – | | | | – | | | | (0.04 | ) | | | 3.57 | | | | 25.09 | |
| Y | | | 21.59 | | | | (0.01 | ) | | | – | | | | 3.65 | | | | 3.64 | | | | (0.06 | ) | | | – | | | | – | | | | (0.06 | ) | | | 3.58 | | | | 25.17 | |
| | | | | | | | | | | | | | | | | | | | | | | | | | | | | | | | | | | | | | |
| For the Year Ended October 31, 2009 | | | | | | | | | | | | | | | | | | | | | | | | | | | | | | | | | | | | | |
| A | | | 18.60 | | | | 0.02 | | | | – | | | | 2.07 | | | | 2.09 | | | | – | | | | – | | | | – | | | | – | | | | 2.09 | | | | 20.69 | |
| B | | | 15.16 | | | | (0.09 | ) | | | – | | | | 1.70 | | | | 1.61 | | | | – | | | | – | | | | – | | | | – | | | | 1.61 | | | | 16.77 | |
| C | | | 15.21 | | | | (0.13 | ) | | | – | | | | 1.70 | | | | 1.57 | | | | – | | | | – | | | | – | | | | – | | | | 1.57 | | | | 16.78 | |
| I | | | 18.74 | | | | 0.02 | | | | – | | | | 2.15 | | | | 2.17 | | | | – | | | | – | | | | – | | | | – | | | | 2.17 | | | | 20.91 | |
| L | | | 19.02 | | | | 0.05 | | | | – | | | | 2.14 | | | | 2.19 | | | | – | | | | – | | | | – | | | | – | | | | 2.19 | | | | 21.21 | |
| R3 | | | 19.08 | | | | (0.04 | ) | | | – | | | | 2.13 | | | | 2.09 | | | | – | | | | – | | | | – | | | | – | | | | 2.09 | | | | 21.17 | |
| R4 | | | 19.19 | | | | 0.01 | | | | – | | | | 2.17 | | | | 2.18 | | | | – | | | | – | | | | – | | | | – | | | | 2.18 | | | | 21.37 | |
| R5 | | | 19.28 | | | | 0.02 | | | | – | | | | 2.22 | | | | 2.24 | | | | – | | | | – | | | | – | | | | – | | | | 2.24 | | | | 21.52 | |
| Y | | | 19.31 | | | | 0.10 | | | | – | | | | 2.18 | | | | 2.28 | | | | – | | | | – | | | | – | | | | – | | | | 2.28 | | | | 21.59 | |
| | | | | | | | | | | | | | | | | | | | | | | | | | | | | | | | | |
| For the Year Ended October 31, 2008 (G) | | | | | | | | | | | | | | | | | | | | | | | | | | | | | | | | |
| A | | | 38.24 | | | | (0.05 | ) | | | – | | | | (15.21 | ) | | | (15.26 | ) | | | – | | | | (4.38 | ) | | | – | | | | (4.38 | ) | | | (19.64 | ) | | | 18.60 | |
| B | | | 32.23 | | | | (0.22 | ) | | | – | | | | (12.47 | ) | | | (12.69 | ) | | | – | | | | (4.38 | ) | | | – | | | | (4.38 | ) | | | (17.07 | ) | | | 15.16 | |
| C | | | 32.27 | | | | (0.19 | ) | | | – | | | | (12.49 | ) | | | (12.68 | ) | | | – | | | | (4.38 | ) | | | – | | | | (4.38 | ) | | | (17.06 | ) | | | 15.21 | |
| I | | | 38.39 | | | | 0.07 | | | | – | | | | (15.25 | ) | | | (15.18 | ) | | | (0.09 | ) | | | (4.38 | ) | | | – | | | | (4.47 | ) | | | (19.65 | ) | | | 18.74 | |
| L | | | 38.91 | | | | 0.03 | | | | – | | | | (15.53 | ) | | | (15.50 | ) | | | (0.01 | ) | | | (4.38 | ) | | | – | | | | (4.39 | ) | | | (19.89 | ) | | | 19.02 | |
| R3 | | | 39.18 | | | | (0.11 | ) | | | – | | | | (15.61 | ) | | | (15.72 | ) | | | – | | | | (4.38 | ) | | | – | | | | (4.38 | ) | | | (20.10 | ) | | | 19.08 | |
| R4 | | | 39.33 | | | | (0.02 | ) | | | – | | | | (15.68 | ) | | | (15.70 | ) | | | (0.06 | ) | | | (4.38 | ) | | | – | | | | (4.44 | ) | | | (20.14 | ) | | | 19.19 | |
| R5 | | | 39.39 | | | | 0.06 | | | | – | | | | (15.72 | ) | | | (15.66 | ) | | | (0.07 | ) | | | (4.38 | ) | | | – | | | | (4.45 | ) | | | (20.11 | ) | | | 19.28 | |
| Y | | | 39.43 | | | | 0.10 | | | | – | | | | (15.76 | ) | | | (15.66 | ) | | | (0.08 | ) | | | (4.38 | ) | | | – | | | | (4.46 | ) | | | (20.12 | ) | | | 19.31 | |
| | | | | | | | | | | | | | | | | | | | | | | | | | | | | | | | | | | |
| For the Year Ended October 31, 2007 | | | | | | | | | | | | | | | | | | | | | | | | | | | | | | | | | | |
| A | | | 29.33 | | | | (0.03 | ) | | | 0.01 | | | | 11.05 | | | | 11.03 | | | | – | | | | (2.12 | ) | | | – | | | | (2.12 | ) | | | 8.91 | | | | 38.24 | |
| B | | | 25.23 | | | | (0.20 | ) | | | 0.01 | | | | 9.31 | | | | 9.12 | | | | – | | | | (2.12 | ) | | | – | | | | (2.12 | ) | | | 7.00 | | | | 32.23 | |
| C | | | 25.24 | | | | (0.10 | ) | | | – | | | | 9.25 | | | | 9.15 | | | | – | | | | (2.12 | ) | | | – | | | | (2.12 | ) | | | 7.03 | | | | 32.27 | |
| I | | | 29.34 | | | | 0.01 | | | | – | | | | 11.16 | | | | 11.17 | | | | – | | | | (2.12 | ) | | | – | | | | (2.12 | ) | | | 9.05 | | | | 38.39 | |
| L(I) | | | 29.73 | | | | 0.04 | | | | 0.01 | | | | 11.25 | | | | 11.30 | | | | – | | | | (2.12 | ) | | | – | | | | (2.12 | ) | | | 9.18 | | | | 38.91 | |
| R3(J) | | | 29.39 | | | | (0.08 | ) | | | – | | | | 9.87 | | | | 9.79 | | | | – | | | | – | | | | – | | | | – | | | | 9.79 | | | | 39.18 | |
| R4(J) | | | 29.39 | | | | (0.01 | ) | | | – | | | | 9.95 | | | | 9.94 | | | | – | | | | – | | | | – | | | | – | | | | 9.94 | | | | 39.33 | |
| R5(J) | | | 29.39 | | | | – | | | | – | | | | 10.00 | | | | 10.00 | | | | – | | | | – | | | | – | | | | – | | | | 10.00 | | | | 39.39 | |
| Y(I) | | | 30.04 | | | | 0.15 | | | | 0.01 | | | | 11.35 | | | | 11.51 | | | | – | | | | (2.12 | ) | | | – | | | | (2.12 | ) | | | 9.39 | | | | 39.43 | |
| | | | | | | | | | | | | | | | | | | | | | | | | | | | | | | | | | | |
| For the Year Ended October 31, 2006 | | | | | | | | | | | | | | | | | | | | | | | | | | | | | | | | | | |
| A | | | 27.84 | | | | (0.07 | ) | | | – | | | | 3.59 | | | | 3.52 | | | | – | | | | (2.03 | ) | | | – | | | | (2.03 | ) | | | 1.49 | | | | 29.33 | |
| B | | | 24.42 | | | | (0.25 | ) | | | – | | | | 3.09 | | | | 2.84 | | | | – | | | | (2.03 | ) | | | – | | | | (2.03 | ) | | | 0.81 | | | | 25.23 | |
| C | | | 24.42 | | | | (0.23 | ) | | | – | | | | 3.08 | | | | 2.85 | | | | – | | | | (2.03 | ) | | | – | | | | (2.03 | ) | | | 0.82 | | | | 25.24 | |
| I(K) | | | 27.95 | | | | (0.01 | ) | | | – | | | | 1.40 | | | | 1.39 | | | | – | | | | – | | | | – | | | | – | | | | 1.39 | | | | 29.34 | |
| L | | | 28.17 | | | | (0.06 | ) | | | – | | | | 3.65 | | | | 3.59 | | | | – | | | | (2.03 | ) | | | – | | | | (2.03 | ) | | | 1.56 | | | | 29.73 | |
| Y | | | 28.37 | | | | 0.02 | | | | – | | | | 3.68 | | | | 3.70 | | | | – | | | | (2.03 | ) | | | – | | | | (2.03 | ) | | | 1.67 | | | | 30.04 | |
| | | | | | | | | | | | | | | | | | | | | | | | | | | | | | | | | | |
| For the Year Ended October 31, 2005 | | | | | | | | | | | | | | | | | | | | | | | | | | | | | | | | | |
| A | | | 23.49 | | | | (0.06 | ) | | | – | | | | 4.41 | | | | 4.35 | | | | – | | | | – | | | | – | | | | – | | | | 4.35 | | | | 27.84 | |
| B | | | 20.77 | | | | (0.25 | ) | | | – | | | | 3.90 | | | | 3.65 | | | | – | | | | – | | | | – | | | | – | | | | 3.65 | | | | 24.42 | |
| C | | | 20.77 | | | | (0.25 | ) | | | – | | | | 3.90 | | | | 3.65 | | | | – | | | | – | | | | – | | | | – | | | | 3.65 | | | | 24.42 | |
| L | | | 23.71 | | | | (0.06 | ) | | | – | | | | 4.52 | | | | 4.46 | | | | – | | | | – | | | | – | | | | – | | | | 4.46 | | | | 28.17 | |
| Y | | | 23.82 | | | | – | | | | – | | | | 4.55 | | | | 4.55 | | | | – | | | | – | | | | – | | | | – | | | | 4.55 | | | | 28.37 | |
- Ratios and Supplemental Data - |
Total Return(B) | | Net Assets at End of Period (000's) | | | Ratio of Expenses to Average Net Assets Before Waivers and Reimbursements and Including Expenses not Subject to Cap(C) | | Ratio of Expenses to Average Net Assets After Waivers and Reimbursements and Including Expenses not Subject to Cap(C) | | Ratio of Expenses to Average Net Assets After Waivers and Reimbursements and Excluding Expenses not Subject to Cap(C) | | Ratio of Net Investment Income to Average Net Assets | | Portfolio Turnover Rate(D) |
| | | | | | | | | | | | | | | | | | | | | | | | | | |
| | 16.58 | %(E) | | $ | 661,081 | | | | 1.40 | %(F) | | | 1.34 | %(F) | | | 1.34 | %(F) | | | (0.58 | )%(F) | | | 67 | % |
| | 16.10 | (E) | | | 38,153 | | | | 2.19 | (F) | | | 2.08 | (F) | | | 2.08 | (F) | | | (1.34 | ) (F) | | | – | |
| | 16.21 | (E) | | | 178,192 | | | | 1.96 | (F) | | | 1.96 | (F) | | | 1.96 | (F) | | | (1.21 | ) (F) | | | – | |
| | 16.77 | (E) | | | 518,428 | | | | 0.96 | (F) | | | 0.96 | (F) | | | 0.96 | (F) | | | (0.24 | ) (F) | | | – | |
| | 16.73 | (E) | | | 439,328 | | | | 1.03 | (F) | | | 1.02 | (F) | | | 1.02 | (F) | | | (0.28 | ) (F) | | | – | |
| | 16.44 | (E) | | | 10,627 | | | | 1.51 | (F) | | | 1.51 | (F) | | | 1.51 | (F) | | | (0.78 | ) (F) | | | – | |
| | 16.61 | (E) | | | 41,805 | | | | 1.19 | (F) | | | 1.19 | (F) | | | 1.19 | (F) | | | (0.45 | ) (F) | | | – | |
| | 16.80 | (E) | | | 13,816 | | | | 0.89 | (F) | | | 0.89 | (F) | | | 0.89 | (F) | | | (0.15 | ) (F) | | | – | |
| | 16.86 | (E) | | | 196,328 | | | | 0.79 | (F) | | | 0.79 | (F) | | | 0.79 | (F) | | | (0.05 | ) (F) | | | – | |
| | | | | | | | | | | | | | | | | | | | | | | | | | | |
| | | | | | | | | | | | | | | | | | | | | | | | | | | |
| | 11.24 | | | | 746,980 | | | | 1.47 | | | | 1.24 | | | | 1.24 | | | | 0.11 | | | | 137 | |
| | 10.62 | | | | 36,371 | | | | 2.36 | | | | 1.84 | | | | 1.84 | | | | (0.53 | ) | | | – | |
| | 10.32 | | | | 173,788 | | | | 2.04 | | | | 2.04 | | | | 2.04 | | | | (0.72 | ) | | | – | |
| | 11.58 | | | | 360,198 | | | | 0.99 | | | | 0.99 | | | | 0.99 | | | | 0.23 | | | | – | |
| | 11.51 | | | | 400,716 | | | | 1.05 | | | | 1.04 | | | | 1.04 | | | | 0.27 | | | | – | |
| | 10.95 | | | | 8,468 | | | | 1.55 | | | | 1.55 | | | | 1.55 | | | | (0.28 | ) | | | – | |
| | 11.36 | | | | 35,421 | | | | 1.21 | | | | 1.21 | | | | 1.21 | | | | 0.05 | | | | – | |
| | 11.62 | | | | 11,967 | | | | 0.92 | | | | 0.92 | | | | 0.92 | | | | 0.20 | | | | – | |
| | 11.81 | | | | 172,228 | | | | 0.80 | | | | 0.80 | | | | 0.80 | | | | 0.50 | | | | – | |
| | | | | | | | | | | | | | | | | | | | | | | | | | | |
| | | | | | | | | | | | | | | | | | | | | | | | | | | |
| | (44.66 | ) | | | 1,145,281 | | | | 1.31 | | | | 1.31 | | | | 1.31 | | | | (0.19 | ) | | | 142 | |
| | (45.07 | ) | | | 38,167 | | | | 2.13 | | | | 2.05 | | | | 2.05 | | | | (0.93 | ) | | | – | |
| | (44.97 | ) | | | 201,128 | | | | 1.93 | | | | 1.93 | | | | 1.93 | | | | (0.81 | ) | | | – | |
| | (44.35 | ) | | | 118,918 | | | | 0.86 | | | | 0.86 | | | | 0.86 | | | | 0.25 | | | | – | |
| | (44.50 | ) | | | 398,391 | | | | 1.02 | | | | 1.01 | | | | 1.01 | | | | 0.11 | | | | – | |
| | (44.77 | ) | | | 5,391 | | | | 1.52 | | | | 1.52 | | | | 1.52 | | | | (0.39 | ) | | | – | |
| | (44.60 | ) | | | 19,129 | | | | 1.19 | | | | 1.19 | | | | 1.19 | | | | (0.08 | ) | | | – | |
| | (44.41 | ) | | | 3,169 | | | | 0.93 | | | | 0.93 | | | | 0.93 | | | | 0.22 | | | | – | |
| | (44.38 | ) | | | 133,048 | | | | 0.78 | | | | 0.78 | | | | 0.78 | | | | 0.34 | | | | – | |
| | | | | | | | | | | | | | | | | | | | | | | | | | | |
| | | | | | | | | | | | | | | | | | | | | | | | | | | |
| | 40.39 | (H) | | | 989,969 | | | | 1.42 | | | | 1.31 | | | | 1.31 | | | | (0.12 | ) | | | 120 | |
| | 39.29 | (H) | | | 56,396 | | | | 2.18 | | | | 2.11 | | | | 2.11 | | | | (0.88 | ) | | | – | |
| | 39.40 | (H) | | | 201,274 | | | | 1.98 | | | | 1.98 | | | | 1.98 | | | | (0.82 | ) | | | – | |
| | 40.89 | (H) | | | 40,678 | | | | 0.86 | | | | 0.86 | | | | 0.86 | | | | 0.09 | | | | – | |
| | 40.77 | (H) | | | 789,757 | | | | 1.05 | | | | 1.04 | | | | 1.04 | | | | 0.12 | | | | – | |
| | 33.31 | (E) | | | 322 | | | | 1.58 | (F) | | | 1.58 | (F) | | | 1.58 | (F) | | | (0.69 | ) (F) | | | – | |
| | 33.82 | (E) | | | 3,402 | | | | 1.23 | (F) | | | 1.23 | (F) | | | 1.23 | (F) | | | (0.18 | ) (F) | | | – | |
| | 34.03 | (E) | | | 81 | | | | 0.92 | (F) | | | 0.92 | (F) | | | 0.92 | (F) | | | 0.01 | (F) | | | – | |
| | 41.07 | (H) | | | 138,065 | | | | 0.80 | | | | 0.80 | | | | 0.80 | | | | 0.53 | | | | – | |
| | | | | | | | | | | | | | | | | | | | | | | | | | | |
| | | | | | | | | | | | | | | | | | | | | | | | | | | |
| | 13.35 | | | | 420,220 | | | | 1.60 | | | | 1.20 | | | | 1.20 | | | | (0.31 | ) | | | 131 | |
| | 12.36 | | | | 33,670 | | | | 2.26 | | | | 2.08 | | | | 2.08 | | | | (1.18 | ) | | | – | |
| | 12.40 | | | | 47,366 | | | | 2.09 | | | | 2.07 | | | | 2.07 | | | | (1.17 | ) | | | – | |
| | 4.97 | (E) | | | 74 | | | | 1.15 | (F) | | | 1.11 | (F) | | | 1.11 | (F) | | | (0.43 | ) (F) | | | – | |
| | 13.45 | | | | 570,541 | | | | 1.07 | | | | 1.07 | | | | 1.07 | | | | (0.18 | ) | | | – | |
| | 13.76 | | | | 73,685 | | | | 0.85 | | | | 0.83 | | | | 0.83 | | | | 0.08 | | | | – | |
| | | | | | | | | | | | | | | | | | | | | | | | | | | |
| | | | | | | | | | | | | | | | | | | | | | | | | | | |
| | 18.52 | | | | 222,682 | | | | 1.54 | | | | 1.36 | | | | 1.36 | | | | (0.45 | ) | | | 156 | |
| | 17.57 | | | | 20,002 | | | | 2.39 | | | | 2.15 | | | | 2.15 | | | | (1.27 | ) | | | – | |
| | 17.57 | | | | 18,842 | | | | 2.13 | | | | 2.13 | | | | 2.13 | | | | (1.26 | ) | | | – | |
| | 18.81 | | | | 556,462 | | | | 1.09 | | | | 1.09 | | | | 1.09 | | | | (0.22 | ) | | | – | |
| | 19.10 | | | | 28,441 | | | | 0.88 | | | | 0.88 | | | | 0.88 | | | | – | | | | – | |
| The Hartford Growth Opportunities Fund |
| Financial Highlights – (continued) |
| (A) | Information presented relates to a share outstanding throughout the indicated period. |
| (B) | Assumes initial investment at net asset value at the beginning of each period, reinvestment of all distributions, the complete redemption of the investment at net asset value at the end of each period and no sales charge. Total return would be reduced if sales charges were taken into account. |
| (C) | Ratios do not include fees paid indirectly (See Expenses in the accompanying Notes to Financial Statements). |
| (D) | Portfolio turnover rate is calculated on the basis of the Fund as a whole without distinguishing between the classes of shares issued. |
| (G) | Per share amounts have been calculated using average shares outstanding method. |
| (H) | Total return without the inclusion of the Payments from (to) Affiliate, can be found in Expenses in the accompanying Notes to Financial Statements. |
| (I) | Classes H, M and N were merged into Class L and Class Z was merged into Class Y on February 9, 2007. |
| (J) | Commenced operations on December 22, 2006. |
| (K) | Commenced operations on August 31, 2006. |
| The Hartford Growth Opportunities Fund |
|
The Board of Directors appoints officers who are responsible for the day-to-day operations of the Fund and who execute policies formulated by the Directors. Each director serves until his or her death, resignation, or retirement or until the next annual meeting of shareholders is held or until his or her successor is elected and qualifies.
Directors and officers who are employed by or who have a financial interest in The Hartford are considered “interested” persons of the Fund pursuant to the Investment Company Act of 1940, as amended. Each officer and two of the Funds’ directors, as noted in the chart below, are “interested” persons of the Fund. Each director serves as a director for The Hartford Mutual Funds, Inc., The Hartford Mutual Funds II, Inc., The Hartford Income Shares Fund, Inc., Hartford Series Fund, Inc., and Hartford HLS Series Fund II, Inc., which, as of April 30, 2010, collectively consist of 85 funds. Correspondence may be sent to directors and officers c/o Hartford Mutual Funds, P.O. Box 2999, Hartford, Connecticut 06104-2999, except that correspondence to Ms. Fagely may be sent to 500 Bielenberg Drive, Woodbury, Minnesota 55125.
The table below sets forth, for each director and officer, his or her name, year of birth, current position with the Fund and date first elected or appointed to The Hartford Mutual Funds, Inc. (“MF”) and The Hartford Mutual Funds II, Inc. (“MF2”), principal occupation, and, for directors, other directorships held. The Fund’s statement of additional information contains further information on the directors and is available free of charge by calling 1-888-843-7824 or writing to Hartford Mutual Funds, P.O. Box 64387, St. Paul, MN 55164-0387.
Information on the aggregate remuneration paid to the directors of the Fund can be found in the Statement of Operations herein. The Fund pays to The Hartford a portion of the Chief Compliance Officer’s compensation, but does not pay salaries or compensation to any of its other officers or directors who are employed by The Hartford.
Non-Interested Directors
Lynn S. Birdsong (1946) Director since 2003, Co-Chairman of the Investment Committee
Mr. Birdsong is a private investor. Since 2003, Mr. Birdsong has been an independent director of The Japan Fund. From 2003 to March 2005, Mr. Birdsong was an independent director of the Atlantic Whitehall Funds. From 1979 to 2002, Mr. Birdsong was a managing director of Zurich Scudder Investments, an investment management firm. During his employment with Scudder, Mr. Birdsong was an interested director of The Japan Fund. Since 1981, Mr. Birdsong has been a partner in Birdsong Company, an advertising specialty firm.
Robert M. Gavin, Jr. (1940) Director since 2002 (MF) and 1986 (MF2), Chairman of the Board since 2004
Dr. Gavin is an educational consultant. Prior to September 1, 2001, he was President of Cranbrook Education Community and prior to July 1996, he was President of Macalester College, St. Paul, Minnesota.
Duane E. Hill (1945) Director since 2001 (MF) and 2002 (MF2), Chairman of the Nominating Committee
Mr. Hill is Partner of TSG Ventures L.P., a private equity investment company. Mr. Hill is a former partner of TSG Capital Group, a private equity investment firm that served as sponsor and lead investor in leveraged buyouts of middle market companies.
Sandra S. Jaffee (1941) Director since 2005
Ms. Jaffee served as Chairman (2008 to 2009) and Chief Executive Officer of Fortent (formerly Searchspace Group), a leading provider of compliance/regulatory technology to financial institutions from August 2005 to August 2009. From August 2004 to August 2005, Ms. Jaffee served as an Entrepreneur in Residence with Warburg Pincus, a private equity firm. From September 1995 to July 2004, Ms. Jaffee served as Executive Vice President at Citigroup, where she was President and Chief Executive Officer of Citibank’s Global Securities Services (1995 to 2003).
William P. Johnston (1944) Director since 2005, Chairman of the Compliance Committee
In June 2006, Mr. Johnston was appointed as Senior Advisor to The Carlyle Group, a global private equity investment firm. In July 2006, Mr. Johnston was elected to the Board of Directors of MultiPlan, Inc. In August 2007, Mr. Johnston was elected to the Board of Directors of LifeCare Holdings, Inc. In February 2008, Mr. Johnston was elected to the Board of Directors of HCR-ManorCare, Inc. In May 2006, Mr. Johnston was elected to the Supervisory Board of Fresenius Medical Care AG & Co. KGaA, after its acquisition of Renal Care Group, Inc. in March 2006. Mr. Johnston joined Renal Care Group in November 2002 as a member of the Board of Directors and served as Chairman of the Board from March 2003 through March 2006. From September 1987 to December 2002, Mr. Johnston was with Equitable Securities Corporation (and its successors, SunTrust Equitable Securities and SunTrust Robinson Humphrey) serving in various investment banking and managerial positions, including Managing Director and Head of Investment Banking, Chief Executive Officer and Vice Chairman. Mr. Johnston was a member of the law firm of Waller Lansden Dortch & Davis from 1969 until 1986.
| The Hartford Growth Opportunities Fund |
| Directors and Officers (Unaudited) – (continued) |
Phillip O. Peterson (1944) Director since 2002 (MF) and 2000 (MF2), Chairman of the Audit Committee
Mr. Peterson is a mutual fund industry consultant. He was a partner of KPMG LLP (an accounting firm) until July 1999. Mr. Peterson joined William Blair Funds in February 2007 as a member of the Board of Trustees. From January 2004 to April 2005, Mr. Peterson served as Independent President of the Strong Mutual Funds.
Lemma W. Senbet (1946) Director since 2005
Dr. Senbet is the William E. Mayer Chair Professor of Finance and Director, Center for Financial Policy, at the University of Maryland, Robert H. Smith School of Business. He was chair of the Finance Department during 1998 to 2006. Previously he was a chaired professor of finance at the University of Wisconsin-Madison. Also, he was director of the Fortis Funds from March 2000 to July 2002. Dr. Senbet served the finance profession in various capacities, including as director of the American Finance Association and President of the Western Finance Association. In 2006, Dr. Senbet was inducted Fellow of Financial Management Association International for his career-long distinguished scholarship and professional service.
Interested Directors and Officers
Lowndes A. Smith (1939) Director since 1996 (MF) and 2002 (MF2), Co-Chairman of the Investment Committee
Mr. Smith served as Vice Chairman of The Hartford from February 1997 to January 2002, as President and Chief Executive Officer of Hartford Life, Inc. from February 1997 to January 2002, and as President and Chief Operating Officer of The Hartford Life Insurance Companies from January 1989 to January 2002. Mr. Smith serves as a Director of White Mountains Insurance Group, Ltd., One Beacon Insurance, Symetra Financial and as a Managing Director of Whittington Gray Associates.
John C. Walters* (1962) Director since 2008
Mr. Walters currently serves as President, Chief Executive Officer and Director for Hartford Life, Inc. (“HL, Inc.”). Mr. Walters also serves as President, Chairman of the Board, Chief Executive Officer and Director for Hartford Life Insurance Company (“Hartford Life”), and as Executive Vice President of The Hartford. In addition, Mr. Walters is a Manager of HL Investment Advisors, LLC (“HL Advisors”). Mr. Walters previously served as President of the U.S. Wealth Management Division of HL, Inc. (2006-2007) and as Co-Chief Operating Officer of Hartford Life (2007-2008).
* Mr. Walters previously served as President and Chief Executive Officer of the Fund (2007 to 2009).
Other Officers
Robert M. Arena, Jr. (1968) President and Chief Executive Officer since 2009 (served as Vice President of the Fund (2006 - 2009)) Mr. Arena serves as Executive Vice President of Hartford Life. Additionally, Mr. Arena is Senior Vice President and Director of Hartford Administrative Services Company, (“HASCO”), President, Chief Executive Officer and Manager of Hartford Investment Financial Services, LLC (“HIFSCO”) and President, Chief Executive Officer and Manager of HL Advisors. Mr. Arena joined The Hartford in 2004.
Tamara L. Fagely (1958) Vice President, Treasurer and Controller since 2002 (MF) 1993 (MF2)
Ms. Fagely has been a Vice President of HASCO since 1998 and Chief Financial Officer since 2006. Currently Ms. Fagely is a Vice President of Hartford Life. She served as Assistant Vice President of Hartford Life from December 2001 through March 2005. In addition, Ms. Fagely is Controller and Chief Financial Officer of HIFSCO.
Brian Ferrell (1962) AML Compliance Officer since 2008
Mr. Ferrell has served as Assistant Vice President and AML Compliance Officer for The Hartford since 2006, and as AML Compliance Officer for HASCO and Hartford Investor Services Company, LLC (“HISC”) since 2008. Prior to joining The Hartford in 2006, Mr. Ferrell held various positions at the U.S. Department of the Treasury (the “Treasury”) from 2001 to 2006, where he served as Chief Counsel for the Treasury’s Financial Crimes Enforcement Network from 2005 - 2006.
Dr. Robert J. Froehlich (1953) Senior Managing Director since 2009
Dr. Froehlich joined The Hartford as Senior Managing Director in September 2009. Prior to joining The Hartford, Dr. Froehlich served as Vice Chairman of Deutsche Asset Management from 1997 - 2009.
Thomas D. Jones, III (1965) Vice President and Chief Compliance Officer since 2006
Mr. Jones serves as Chief Compliance Officer for the Hartford Mutual Funds and Vice President and Director of Securities Compliance for The Hartford. Mr. Jones joined The Hartford in 2006 from SEI Investments, where he served as Chief Compliance Officer for its mutual funds and investment advisers. Prior to joining SEI, Mr. Jones was First Vice President and Compliance Director for Merrill Lynch Investment Managers (Americas) (“MLIM”), where he worked from 1992-2004.
Edward P. Macdonald (1967) Vice President, Secretary and Chief Legal Officer since 2005
Mr. Macdonald serves as Assistant Vice President of Hartford Life and Chief Legal Officer and Vice President of HIFSCO. He also serves as Vice President and Secretary of HASCO, and Chief Legal Officer, Secretary and Vice President of HL Advisors. Mr. Macdonald joined The Hartford in 2005.
Vernon J. Meyer (1964) Vice President since 2006
Mr. Meyer serves as Senior Vice President of Hartford Life. He also serves as Senior Vice President of HIFSCO and HL Advisors. Mr. Meyer joined The Hartford in 2004.
D. Keith Sloane (1960) Vice President since 2009
Mr. Sloane is a Senior Vice President of Hartford Life. Additionally, Mr. Sloane currently serves as Senior Vice President of HIFSCO, HL Advisors, and HASCO. Prior to joining The Hartford in 2007, Mr. Sloane was Director of product marketing and led the mutual fund business for Wachovia Securities (“Wachovia”) in their investment products group. Mr. Sloane joined Wachovia in 1995.
Jane Wolak (1961) Vice President since 2009
Ms. Wolak currently serves as Vice President of Hartford Life. Ms. Wolak joined Hartford Life as Vice President, Retail Product Services in May 2007. She is also Vice President of HASCO. Previously, Ms. Wolak was with Sun Life Financial where she held the position of Vice President, Service Center Operations from 2001 – 2007.
A description of the policies and procedures that the Fund uses to determine how to vote proxies relating to portfolio securities and a record of how the Fund voted any proxies for the twelve-month period ended June 30, 2009 is available (1) without charge, upon request, by calling 888-843-7824 and (2) on the Securities and Exchange Commission’s website at http://www.sec.gov.
The Fund files a complete schedule of portfolio holdings with the Commission for the first and third quarters of each fiscal year on Form N-Q. The Fund’s Forms are available (1) without charge, upon request, by calling 888-843-7824 and (2) on the Securities and Exchange Commission’s website at http://www.sec.gov. The Form N-Q may be reviewed and copied at the Commission’s Public Reference Room in Washington, DC. Information on the operation of the Public Reference Room may be obtained by calling 1-800-SEC-0330.
| The Hartford Growth Opportunities Fund |
|
Your Fund's Expenses
As a shareholder of the Fund, you incur two types of costs: (1) transaction costs, including sales charges (loads) on purchase payments and contingent deferred sales charges (CDSC) (2) ongoing costs including management fees; distribution fees; and other fund expenses. This example is intended to help you understand your ongoing costs (in dollars) of investing in the Fund and to compare these costs with the ongoing costs of investing in other mutual funds. The example is based on an investment of $1,000 invested at the beginning of the period and held for the period of October 31, 2009 through April 30, 2010.
Actual Expenses
The first set of columns of the table below provides information about actual account values and actual expenses. You may use the information in this column, together with the amount you invested, to estimate the expenses that you paid over the period. Simply divide your account value by $1,000 (for example, an $8,600 account value divided by $1,000 = 8.6), then multiply the result by the number in the line under the heading entitled "Expenses Paid During Period" to estimate the expenses you paid on your account during this period.
Hypothetical Example for Comparison Purposes
The second set of columns of the table below provides information about hypothetical account values and hypothetical expenses based on the Fund's actual expense ratio and an assumed rate of return of 5% per year before expenses, which is not the Fund's actual return. The hypothetical account values and expenses may not be used to estimate the actual ending account balance or expenses you paid for the period. You may use this information to compare the ongoing costs of investing in the Fund and other funds. To do so, compare this 5% hypothetical example with the 5% hypothetical examples that appear in the shareholder reports of the other funds.
Please note that the expenses shown in the table are meant to highlight your ongoing costs only and do not reflect any transactional costs, such as sales charges (loads) and CDSC. Therefore, the second set of columns of the table is useful in comparing ongoing costs only, and will not help you determine the relative total costs of owning different funds. In addition, if these transactional costs were included, your costs would be higher. Expenses are equal to the Fund's annualized expense ratios multiplied by average account value over the period, multiplied by 181/365 (to reflect the one-half year period).
| | | Actual return | | | Hypothetical (5% return before expenses) | | | | | | | | | | |
| | | Beginning Account Value October 31, 2009 | | | Ending Account Value April 30, 2010 | | | Expenses paid during the period October 31, 2009 through April 30, 2010 | | | Beginning Account Value October 31, 2009 | | | Ending Account Value April 30, 2010 | | | Expenses paid during the period October 31, 2009 through April 30, 2010 | | | Annualized expense ratio | | | Days in the current 1/2 year | | | Days in the full year | |
| Class A | | $ | 1,000.00 | | | $ | 1,165.80 | | | $ | 7.20 | | | $ | 1,000.00 | | | $ | 1,018.15 | | | $ | 6.71 | | | | 1.34 | % | | | 181 | | | | 365 | |
| Class B | | $ | 1,000.00 | | | $ | 1,161.00 | | | $ | 11.14 | | | $ | 1,000.00 | | | $ | 1,014.48 | | | $ | 10.39 | | | | 2.08 | | | | 181 | | | | 365 | |
| Class C | | $ | 1,000.00 | | | $ | 1,162.10 | | | $ | 10.51 | | | $ | 1,000.00 | | | $ | 1,015.08 | | | $ | 9.79 | | | | 1.96 | | | | 181 | | | | 365 | |
| Class I | | $ | 1,000.00 | | | $ | 1,167.70 | | | $ | 5.16 | | | $ | 1,000.00 | | | $ | 1,020.03 | | | $ | 4.81 | | | | 0.96 | | | | 181 | | | | 365 | |
| Class L | | $ | 1,000.00 | | | $ | 1,167.30 | | | $ | 5.48 | | | $ | 1,000.00 | | | $ | 1,019.74 | | | $ | 5.11 | | | | 1.02 | | | | 181 | | | | 365 | |
| Class R3 | | $ | 1,000.00 | | | $ | 1,164.40 | | | $ | 8.10 | | | $ | 1,000.00 | | | $ | 1,017.31 | | | $ | 7.55 | | | | 1.51 | | | | 181 | | | | 365 | |
| Class R4 | | $ | 1,000.00 | | | $ | 1,166.10 | | | $ | 6.39 | | | $ | 1,000.00 | | | $ | 1,018.89 | | | $ | 5.96 | | | | 1.19 | | | | 181 | | | | 365 | |
| Class R5 | | $ | 1,000.00 | | | $ | 1,168.00 | | | $ | 4.78 | | | $ | 1,000.00 | | | $ | 1,020.38 | | | $ | 4.46 | | | | 0.89 | | | | 181 | | | | 365 | |
| Class Y | | $ | 1,000.00 | | | $ | 1,168.60 | | | $ | 4.25 | | | $ | 1,000.00 | | | $ | 1,020.88 | | | $ | 3.96 | | | | 0.79 | | | | 181 | | | | 365 | |
This information is written in connection with the promotion or marketing of the matter(s) addressed in this material. The information cannot be used or relied upon for the purpose of avoiding IRS penalties. These materials are not intended to provide tax, accounting or legal advice. As with all matters of a tax or legal nature, you should consult your own tax or legal counsel for advice.
You should carefully consider investment objectives, risks, and charges and expenses of The Hartford Mutual Funds before investing. This and other information can be found in the Fund's prospectus, which can be obtained from your investment representative or by calling 888-843-7824. Please read it carefully before you invest or send money.
The Hartford Mutual Funds are underwritten and distributed by Hartford Investment Financial Services, LLC.
“The Hartford” is The Hartford Financial Services Group, Inc., and its subsidiaries.
Mutual fund inception dates range from 1949 to date. The Hartford Mutual Funds are not a subsidiary of The Hartford but are underwritten, distributed by, and advised by subsidiaries of The Hartford. Investments in The Hartford Mutual Funds are not guaranteed by The Hartford or any other entity.
MFSAR-GO10 6/10 MUT 8759 Printed in U.S.A. ©2010 The Hartford, Hartford, CT 06115 | |
| | |
| | |
THE HARTFORD MUTUAL FUNDS 2010 Semi Annual Report The Hartford SmallCap Growth Fund |
The Hartford SmallCap Growth Fund
| |
| Manager Discussions (Unaudited) | 2 |
| Financial Statements | |
| 4 |
| 10 |
| 11 |
| 12 |
| 13 |
| 14 |
| 26 |
| 29 |
| 31 |
| 31 |
| 32 |
The Hartford SmallCap Growth Fund inception 01/04/1988
(subadvised by Wellington Management Company, LLP
Hartford Investment Management Company)
Investment objective – Seeks long-term capital appreciation.
Performance Overview(1) 4/30/00 - 4/30/10
Growth of a $10,000 investment in Class A which includes Sales Charge
Russell 2000 Growth Index is an unmanaged index of those Russell 2000 Index growth companies with higher price-to-book ratios and higher forecasted growth values.
You cannot invest directly in an index.
The value of shares will fluctuate so that, when redeemed, shares may be worth more or less than their original cost. The chart and table do not reflect the deduction of taxes that a shareholder would pay on fund distributions or the redemption of fund shares.
Performance information may reflect historical or current expense waivers/reimbursements from the investment adviser, without which performance would have been lower. For information on current expense waivers/reimbursements, please see the prospectus.
Average Annual Total Returns(2,3,4,5) (as of 4/30/10)
| | 6 | 1 | 5 | 10 |
| | Month† | Year | Year | Year |
| SmallCap Growth A# | 25.92% | 47.48% | 2.62% | -2.11% |
| SmallCap Growth A## | | 39.37% | 1.47% | -2.66% |
| SmallCap Growth B# | 25.42% | 46.52% | 1.98% | NA* |
| SmallCap Growth B## | | 41.52% | 1.62% | NA* |
| SmallCap Growth C# | 25.51% | 46.29% | 1.80% | -2.82% |
| SmallCap Growth C## | | 45.29% | 1.80% | -2.82% |
| SmallCap Growth I# | 26.10% | 47.63% | 2.70% | NA |
| SmallCap Growth L# | 26.07% | 47.52% | 2.72% | -2.05% |
| SmallCap Growth L## | | 40.52% | 1.72% | -2.53% |
| SmallCap Growth R3# | 25.78% | 46.93% | 2.54% | NA |
| SmallCap Growth R4# | 25.96% | 47.39% | 2.69% | NA |
| SmallCap Growth R5# | 26.17% | 47.83% | 2.89% | NA |
| SmallCap Growth Y# | 26.21% | 47.83% | 2.93% | NA |
| Russell 2000 Growth Index | 25.49% | 45.20% | 6.06% | -0.06% |
| * | 10 year returns are not applicable for Class B because after 8 years Class B converts to Class A. |
PAST PERFORMANCE IS NOT INDICATIVE OF FUTURE RESULTS.
| (1) | Growth of a $10,000 investment in Classes B, C, I, L, R3, R4, R5 and Y shares will vary from results seen above due to differences in the expenses charged to these share classes. |
(2) | The initial investment in Classes A and L shares reflects the maximum sales charge and Classes B and C reflect CDSC. |
| (3) | Total returns presented above were calculated using the Fund's net asset value available to shareholders for sale or redemption of Fund shares on April 30, 2010, which excludes investment transactions as of this date. |
| (4) | Effective 9/30/09, Class B shares of The Hartford Mutual Funds are closed to new investments. |
| (5) | Classes A, B, C and Y shares were offered beginning on 2/19/02. Performance prior to that date for Class A is that of the Fund's Class L shares and for Class C is that of the Fund's Class N shares, which had lower operating expenses. Performance prior to 2/19/02 would have been lower if Classes A and C shares expenses were applied during that period. (Class N shares are no longer offered.) Class I shares commenced operations on 8/31/06. Performance prior to 8/31/06 reflects Class A performance. Classes R3, R4 and R5 shares commenced operations on 12/22/06. Performance prior to 12/22/06 reflects Class Y performance. The Fund’s performance information prior to 4/1/01 reflects when the Fund was managed by a previous investment adviser. |
| Portfolio Managers | | |
| Wellington Management Company, LLP | Hartford Investment Management Company |
| Mammen Chally, CFA | Hugh Whelan, CFA | Kurt Cubbage, CFA |
| Vice President | Managing Director | Vice President |
How did the Fund perform?
The Class A shares of The Hartford SmallCap Growth Fund returned 25.92%, before sales charge, for the six-month period ended April 30, 2010, outperforming its benchmark, the Russell 2000 Growth Index, which returned 25.49%. For the same period, the Fund also outperformed the return of the average fund in the Lipper Small-Cap Growth Funds peer group 25.23%, a group of funds with investment strategies similar to those of the Fund.
Why did the Fund perform this way?
Amid concerns of government spending run amuck, talk of double-dip recessions, and anemic consumers, the markets were sanguine during the period as improving fundamentals among corporations ruled the day. Past cost saving actions set the stage for robust cash flow, high net cash levels, and near unprecedented operating leverage. Increasing sovereign risk concerns and tightening credit conditions in China were not enough to derail the equity markets during the period.
Small-cap stocks (+28%) outperformed mid-cap stocks (+26%) and large-cap stocks (+17%) during the period, as measured by the Russell 2000, S&P MidCap 400, and S&P 500 indices, respectively. Value (+19%) stocks modestly outpaced growth stocks (+17%) during the period, as measured by the Russell 3000 Value and Russell 3000 Growth indices, respectively. All ten sectors in the Russell 2000 Growth Index had positive returns during the period. The Consumer Discretionary (+35%), Consumer Staples (+28%), and Health Care (+26%) sectors performed best, while Utilities (+8%) and Telecommunication Services (+15%) lagged on a relative basis.
Fund performance was driven by stock selection. Outperformance relative to the benchmark reflected strong selection in the Health Care and Energy sectors, which more than offset weaker selection in Consumer Discretionary and Materials. Sector allocation, particularly overweight (i.e. the Fund’s sector position was greater than the benchmark position) allocations to Utilities and Financials, detracted from relative results.
Among the top contributors to relative performance were Salix Pharmaceuticals (Health Care), Rosetta Resources (Energy), and OSI Pharmaceuticals (Health Care). Shares of U.S. specialty pharmaceutical company Salix Pharmaceuticals rose as it received approval for the use of Xifaxan in Hepatic Encephalopathy, expanding beyond the original indication for traveler's diarrhea. Salix also released more detailed, positive Phase 3 data for Xifaxan as a treatment for Irritable Bowel Syndrome. Independent oil & gas company Rosetta Resources benefited from recovering natural gas prices as well as investors’ increasing comfort with the company's transition to an emerging resource play. Shares rose on news that the firm turned a profit in the fourth quarter of 2009. Shares of oncology, diabetes and obesity biotechnology company OSI Pharmaceuticals jumped after Japanese pharmaceutical company Astellas offered to acquire the company at a significant premium to where shares had traded. Skyworks Solutions (Information Technology) was among the top contributors to absolute results.
UAL Corp (Industrials) and Intermune (Health Care) detracted most from relative returns during the period. United Airlines’ parent company UAL Corp’s shares rose sharply during the period amid signs of economic recovery and increasing bookings from premium trans-oceanic and corporate passengers. Not owning the stock in the early part of the period hurt relative performance. Intermune’s shares soared on news that its pulmonary drug Pirfenidone was nearing U.S. Food and Drug Administration (FDA) approval. Not owning this benchmark name also hurt relative returns. Top detractors from absolute returns during the period included XenoPort (Health Care), Telecommunication Systems (Information Technology), and China Natural Gas (Utilities).
What is the outlook?
March 2010 marked the one year anniversary of recession-induced lows in global capital markets. Since the bottom in early 2009, risk assets have rebounded strongly, while global economies continue to show signs of stabilizing as unprecedented fiscal and monetary stimulus programs work their way through the system. During the first quarter of 2010, U.S. retail sales showed surprising strength and manufacturing data indicated improvements in both new orders and employment. Areas of weakness persist, however, U.S. employment, while stabilizing, remains moribund, contributing to continued weakness in consumer confidence data. The housing market remains fragile, although declines appear to be moderating.
The Fund focuses on stock selection as the key driver of returns and uses proprietary fundamental and quantitative research in a disciplined framework to build a portfolio of the most attractive stocks. The Fund ended the period most overweight Telecommunication Services, Materials, and Utilities and most underweight (i.e. the Fund’s sector position was less than the benchmark position) Information Technology, Health Care and Energy relative to the Russell 2000 Growth Index.
At April 30, 2010, 77% of the Fund’s assets were managed by Wellington Management Company, LLC and 23% of the Fund’s assets were managed by Hartford Investment Management Company.
| Diversification by Industry | | | |
| as of April 30, 2010 | | | |
| | | Percentage of |
| Industry (Sector) | | Net Assets |
| Automobiles & Components (Consumer | | | |
Discretionary) | | | 1.3 | % |
| Banks (Financials) | | | 1.9 | |
| Capital Goods (Industrials) | | | 9.3 | |
| Commercial & Professional Services (Industrials) | | | 3.5 | |
| Consumer Durables & Apparel (Consumer | | | | |
Discretionary) | | | 4.6 | |
| Consumer Services (Consumer Discretionary) | | | 3.2 | |
| Diversified Financials (Financials) | | | 1.6 | |
| Energy (Energy) | | | 3.8 | |
| Food & Staples Retailing (Consumer Staples) | | | 0.1 | |
| Food, Beverage & Tobacco (Consumer Staples) | | | 1.4 | |
| Health Care Equipment & Services (Health Care) | | | 10.8 | |
| Household & Personal Products (Consumer Staples) | | | 1.3 | |
| Insurance (Financials) | | | 1.1 | |
| Materials (Materials) | | | 3.3 | |
| Media (Consumer Discretionary) | | | 1.6 | |
| Other Investment Pools and Funds (Financials) | | | 0.7 | |
| Pharmaceuticals, Biotechnology & Life Sciences | | | | |
(Health Care) | | | 12.6 | |
| Real Estate (Financials) | | | 1.1 | |
| Retailing (Consumer Discretionary) | | | 6.4 | |
| Semiconductors & Semiconductor Equipment | | | | |
(Information Technology) | | | 4.2 | |
| Software & Services (Information Technology) | | | 14.1 | |
| Technology Hardware & Equipment (Information | | | | |
Technology) | | | 6.6 | |
| Telecommunication Services (Services) | | | 2.4 | |
| Transportation (Industrials) | | | 1.9 | |
| Utilities (Utilities) | | | 0.7 | |
| Short-Term Investments | | | 0.8 | |
| Other Assets and Liabilities | | | (0.3 | ) |
| Total | | | 100.0 | % |
| The Hartford SmallCap Growth Fund |
April 30, 2010 (Unaudited)
| Shares or Principal Amount | | Market Value ╪ | |
| COMMON STOCKS - 98.8% | | | |
| | | Automobiles & Components - 1.3% | | | |
| | 54 | | Amerigon, Inc. ● | | $ | 531 | |
| | 47 | | ArvinMeritor, Inc. ● | | | 715 | |
| | 11 | | Cooper Tire & Rubber Co. | | | 225 | |
| | 3 | | Drew Industries ● | | | 88 | |
| | 3 | | Federal Mogul Corp. ● | | | 58 | |
| | 5 | | Standard Motor Products | | | 57 | |
| | 28 | | Tenneco Automotive, Inc. ● | | | 732 | |
| | | | | | | 2,406 | |
| | | | Banks - 1.9% | | | | |
| | 23 | | Columbia Banking Systems, Inc. | | | 515 | |
| | 23 | | Danvers Bancorp, Inc. | | | 379 | |
| | 34 | | Flushing Financial Corp. | | | 464 | |
| | 6 | | Nara Bancorp, Inc. ● | | | 55 | |
| | 31 | | Ocwen Financial Corp. ● | | | 362 | |
| | 21 | | Signature Bank ● | | | 844 | |
| | 12 | | Southside Bancshares, Inc. | | | 263 | |
| | 53 | | Western Alliance Bancorp ● | | | 458 | |
| | | | | | | 3,340 | |
| | | | Capital Goods - 9.3% | | | | |
| | 17 | | A.O. Smith Corp. | | | 883 | |
| | 14 | | Aaon, Inc. | | | 334 | |
| | 5 | | Actuant Corp. Class A | | | 115 | |
| | 22 | | Acuity Brands, Inc. | | | 1,005 | |
| | – | | Ampco-Pittsburgh Corp. | | | 3 | |
| | 7 | | Apogee Enterprises | | | 89 | |
| | 29 | | Applied Signal Technology | | | 534 | |
| | 4 | | AZZ, Inc. | | | 170 | |
| | 6 | | Beacon Roofing Supply, Inc. ● | | | 143 | |
| | 28 | | Belden, Inc. | | | 758 | |
| | 4 | | Blount International ● | | | 50 | |
| | 3 | | Carlisle Cos., Inc. | | | 126 | |
| | 37 | | Ceradyne, Inc. ● | | | 824 | |
| | 38 | | Chart Industries, Inc. ● | | | 879 | |
| | 2 | | Colfax Corp. ● | | | 22 | |
| | 4 | | Crane Co. | | | 130 | |
| | 4 | | Cubic Corp. | | | 144 | |
| | 8 | | EMCOR Group, Inc. ● | | | 227 | |
| | 1 | | Energy Recovery, Inc. ● | | | 6 | |
| | 28 | | Esterline Technologies Corp. ● | | | 1,562 | |
| | 13 | | Force Protection, Inc. ● | | | 71 | |
| | 27 | | Gencorp, Inc. ● | | | 165 | |
| | 2 | | GeoEye, Inc. ● | | | 52 | |
| | 65 | | GrafTech International Ltd. ● | | | 1,093 | |
| | 2 | | Graham Corp. | | | 44 | |
| | 127 | | GT Solar International, Inc. ● | | | 738 | |
| | 6 | | Harbin Electric, Inc. ● | | | 123 | |
| | 3 | | Heico Corp. | | | 124 | |
| | 6 | | Hexcel Corp. ● | | | 99 | |
| | 2 | | Hubbell, Inc. Class B | | | 87 | |
| | 4 | | II-VI, Inc. ● | | | 129 | |
| | 6 | | Joy Global, Inc. | | | 346 | |
| | 4 | | Kaman Corp. | | | 105 | |
| | 16 | | Lennox International, Inc. | | | 711 | |
| | 10 | | Lindsay Corp. | | | 389 | |
| | 9 | | MasTec, Inc. ● | | | 115 | |
| | 1 | | Michael Baker Corp. ● | | | 29 | |
| | 1 | | Middleby Corp. ● | | | 90 | |
| | 21 | | Moog, Inc. Class A ● | | | 795 | |
| | 8 | | Orbital Sciences Corp. ● | | | 141 | |
| | 2 | | Pall Corp. | | | 90 | |
| | 20 | | Powell Industries, Inc. ● | | | 685 | |
| | 1 | | Raven Industries | | | 25 | |
| | 4 | | Robbins & Myers, Inc. | | | 93 | |
| | 5 | | Simpson Manufacturing Co., Inc. | | | 181 | |
| | 1 | | Sterling Construction Co., Inc. ● | | | 14 | |
| | – | | Sun Hydraulics Corp. | | | 8 | |
| | 20 | | Teledyne Technologies, Inc. ● | | | 890 | |
| | 2 | | Thomas & Betts Corp. ● | | | 77 | |
| | 3 | | Toro Co. | | | 151 | |
| | 14 | | TransDigm Group, Inc. | | | 752 | |
| | 2 | | Watsco, Inc. | | | 126 | |
| | 6 | | Woodward Governor Co. | | | 194 | |
| | | | | | | 16,736 | |
| | | | Commercial & Professional Services - 3.5% | | | | |
| | 5 | | American Reprographics Co. LLC ● | | | 50 | |
| | 71 | | APAC TeleServices, Inc. ● | | | 409 | |
| | 4 | | ATC Technology Corp. ● | | | 87 | |
| | 20 | | Brink's Co. | | | 530 | |
| | 6 | | Cenveo, Inc. ● | | | 52 | |
| | 7 | | Consolidated Graphics, Inc. ● | | | 293 | |
| | 31 | | Deluxe Corp. | | | 643 | |
| | 2 | | Healthcare Services Group, Inc. | | | 47 | |
| | 8 | | Herman Miller, Inc. | | | 167 | |
| | 3 | | HNI Corp. | | | 80 | |
| | 4 | | Huron Consulting Group, Inc. ● | | | 93 | |
| | 8 | | Interface, Inc. | | | 99 | |
| | 35 | | Knoll, Inc. | | | 484 | |
| | 1 | | McGrath RentCorp | | | 25 | |
| | 4 | | Rollins, Inc. | | | 96 | |
| | 46 | | Sykes Enterprises, Inc. ● | | | 1,052 | |
| | 5 | | Tetra Tech, Inc. ● | | | 132 | |
| | 39 | | Towers Watson & Co. | | | 1,894 | |
| | 1 | | US Ecology, Inc. | | | 21 | |
| | | | | | | 6,254 | |
| | | | Consumer Durables & Apparel - 4.6% | | | | |
| | 44 | | Carter's, Inc. ● | | | 1,430 | |
| | 2 | | Deckers Outdoor Corp. ● | | | 216 | |
| | 6 | | Fossil, Inc. ● | | | 240 | |
| | 3 | | G-III Appareal Group Ltd. ● | | | 95 | |
| | 32 | | Iconix Brand Group, Inc. ● | | | 552 | |
| | 82 | | Liz Claiborne, Inc. ● | | | 712 | |
| | 4 | | Lululemon Athletica, Inc. ● | | | 136 | |
| | 4 | | Maidenform Brands, Inc. ● | | | 93 | |
| | 1 | | National Presto Industries, Inc. | | | 115 | |
| | 1 | | Oxford Industries, Inc. | | | 28 | |
| | 3 | | Polaris Industries, Inc. | | | 161 | |
| | 2 | | Steven Madden Ltd. ● | | | 101 | |
| | 6 | | Sturm Ruger & Co., Inc. | | | 104 | |
| | 3 | | Tempur-Pedic International, Inc. ● | | | 89 | |
| | 6 | | Timberland Co. Class A ● | | | 127 | |
| | 44 | | True Religion Apparel, Inc. ● | | | 1,380 | |
| | 31 | | Tupperware Brands Corp. | | | 1,568 | |
| | 3 | | Under Armour, Inc. Class A ● | | | 101 | |
| | 2 | | Unifirst Corp. | | | 82 | |
| | 14 | | Warnaco Group, Inc. ● | | | 685 | |
| | 5 | | Wolverine World Wide, Inc. | | | 160 | |
| | | | | | | 8,175 | |
The accompanying notes are an integral part of these financial statements.
| Shares or Principal Amount | | Market Value ╪ | |
| COMMON STOCKS - 98.8% - (continued) | | | |
| | | Consumer Services - 3.2% | | | |
| | 26 | | Bally Technologies, Inc. ● | | $ | 1,214 | |
| | 4 | | Brinker International, Inc. | | | 71 | |
| | 1 | | Capella Education Co. ● | | | 124 | |
| | 2 | | CEC Entertainment, Inc. ● | | | 84 | |
| | 43 | | Cheesecake Factory, Inc. ● | | | 1,161 | |
| | 8 | | CKE Restaurants, Inc. | | | 103 | |
| | 10 | | Corinthian Colleges, Inc. ● | | | 155 | |
| | 3 | | Cracker Barrel Old Country Store, Inc. | | | 166 | |
| | 22 | | Denny's Corp. ● | | | 72 | |
| | 10 | | ITT Educational Services, Inc. ● | | | 965 | |
| | 29 | | P.F. Chang's China Bistro, Inc. ● | | | 1,267 | |
| | 6 | | Sotheby's Holdings | | | 206 | |
| | 1 | | Steiner Leisure Ltd. ● | | | 61 | |
| | 6 | | Texas Roadhouse, Inc. ● | | | 90 | |
| | 3 | | Wyndham Worldwide Corp. | | | 83 | |
| | | | | | | 5,822 | |
| | | | Diversified Financials - 1.6% | | | | |
| | 10 | | Advance America Cash Advance Centers, Inc. | | | 57 | |
| | 9 | | BGC Partners, Inc. | | | 57 | |
| | 5 | | Calamos Asset Management, Inc. | | | 61 | |
| | 33 | | Ezcorp, Inc. ● | | | 689 | |
| | 6 | | First Cash Financial Services, Inc. ● | | | 121 | |
| | 59 | | GFI Group, Inc. | | | 405 | |
| | 7 | | Life Partners Holdings, Inc. | | | 153 | |
| | 2 | | MarketAxess Holdings, Inc. | | | 37 | |
| | 2 | | Portfolio Recovery Associate ● | | | 101 | |
| | 4 | | Riskmetrics Group, Inc. ● | | | 90 | |
| | 18 | | Stifel Financial ● | | | 1,020 | |
| | | | | | | 2,791 | |
| | | | Energy - 3.8% | | | | |
| | 4 | | Alon USA Energy, Inc. | | | 29 | |
| | 2 | | Atlas Energy, Inc. | | | 73 | |
| | 15 | | Cal Dive International, Inc. ● | | | 96 | |
| | 2 | | Carbo Ceramics, Inc. | | | 124 | |
| | 5 | | Cloud Peak Energy, Inc. ● | | | 86 | |
| | 45 | | Complete Production Services, Inc. ● | | | 678 | |
| | 102 | | CVR Energy, Inc. ● | | | 869 | |
| | 3 | | Dresser-Rand Group, Inc. ● | | | 93 | |
| | 2 | | Dril-Quip, Inc. ● | | | 108 | |
| | 6 | | Geokinetics, Inc. ● | | | 49 | |
| | 7 | | James River Coal Co. ● | | | 129 | |
| | 1 | | Lufkin Industries, Inc. | | | 82 | |
| | 6 | | Matrix Service Co. ● | | | 62 | |
| | 2 | | Natural Gas Services Group ● | | | 37 | |
| | 7 | | Overseas Shipholding Group, Inc. | | | 335 | |
| | 5 | | Patterson-UTI Energy, Inc. | | | 70 | |
| | 18 | | Pioneer Drilling Co. ● | | | 130 | |
| | 87 | | Rosetta Resources, Inc. ● | | | 2,154 | |
| | 3 | | RPC, Inc. | | | 41 | |
| | 14 | | St. Mary Land & Exploration Co. | | | 544 | |
| | 8 | | Tesoro Corp. | | | 99 | |
| | 11 | | TETRA Technologies, Inc. ● | | | 130 | |
| | 84 | | Vaalco Energy, Inc. | | | 473 | |
| | 11 | | Willbros Group, Inc. ● | | | 140 | |
| | 7 | | World Fuel Services Corp. | | | 191 | |
| | | | | | | 6,822 | |
| | | | Food & Staples Retailing - 0.1% | | | | |
| | 3 | | Casey's General Stores, Inc. | | | 106 | |
| | 4 | | United Natural Foods, Inc. ● | | | 137 | |
| | | | | | | 243 | |
| | | | Food, Beverage & Tobacco - 1.4% | | | | |
| | 3 | | American Italian Pasta Co. ● | | | 125 | |
| | 2 | | Boston Beer Co., Inc. Class A ● | | | 99 | |
| | 4 | | Cal-Maine Foods, Inc. | | | 137 | |
| | 112 | | Darling International, Inc. ● | | | 1,061 | |
| | 3 | | Diamond Foods, Inc. | | | 113 | |
| | 2 | | J&J Snack Foods Corp. | | | 99 | |
| | 3 | | Lancaster Colony Corp. | | | 141 | |
| | 3 | | Sanderson Farms, Inc. | | | 142 | |
| | 41 | | Zhongpin, Inc. ● | | | 525 | |
| | | | | | | 2,442 | |
| | | | Health Care Equipment & Services - 10.8% | | | | |
| | 13 | | Align Technology, Inc. ● | | | 222 | |
| | 1 | | Almost Family, Inc. ● | | | 63 | |
| | 2 | | Amedisys, Inc. ● | | | 133 | |
| | 53 | | American Medical Systems Holdings ● | | | 950 | |
| | 5 | | Amerigroup Corp. ● | | | 165 | |
| | 67 | | Angiodynamics, Inc. ● | | | 1,077 | |
| | 8 | | Beckman Coulter, Inc. | | | 474 | |
| | 4 | | Bio-Reference Laboratories ● | | | 98 | |
| | 10 | | Bioscrip, Inc. ● | | | 87 | |
| | 5 | | Cantel Medical Corp. | | | 92 | |
| | 5 | | Catalyst Health Solutions ● | | | 191 | |
| | 5 | | Centene Corp. ● | | | 107 | |
| | 16 | | Coninucare Corp. ● | | | 54 | |
| | 38 | | Corvel Corp. ● | | | 1,269 | |
| | – | | CryoLife, Inc. ● | | | 3 | |
| | 71 | | Cyberonics, Inc. ● | | | 1,387 | |
| | 76 | | Dexcom, Inc. ● | | | 830 | |
| | 39 | | Eclipsys Corp. ● | | | 805 | |
| | 3 | | Emergency Medical Services ● | | | 150 | |
| | 4 | | Gentiva Health Services, Inc. ● | | | 119 | |
| | 2 | | Haemonetics Corp. ● | | | 101 | |
| | 19 | | Hanger Orthopedic Group, Inc. ● | | | 352 | |
| | 53 | | HealthSouth Corp. ● | | | 1,079 | |
| | 74 | | Healthspring, Inc. ● | | | 1,303 | |
| | 9 | | Immucor, Inc. ● | | | 194 | |
| | 2 | | Integra LifeSciences Holdings Corp. ● | | | 108 | |
| | 4 | | Invacare Corp. | | | 106 | |
| | 3 | | inVentiv Health, Inc. ● | | | 80 | |
| | 4 | | Kensey Nash Corp. ● | | | 88 | |
| | 32 | | Masimo Corp. | | | 740 | |
| | 5 | | MedAssets, Inc. ● | | | 123 | |
| | 1 | | Medical Action Industries, Inc. ● | | | 18 | |
| | 6 | | Micrus Endovascular Corp. ● | | | 120 | |
| | 2 | | Neogen Corp. ● | | | 60 | |
| | 2 | | NuVasive, Inc. ● | | | 80 | |
| | 10 | | Odyssey HealthCare, Inc. ● | | | 210 | |
| | 5 | | Omnicell, Inc. ● | | | 69 | |
| | 30 | | Orthofix International N.V. ● | | | 1,029 | |
| | 36 | | Owens & Minor, Inc. | | | 1,130 | |
| | 1 | | Providence Service Corp. ● | | | 10 | |
| | 4 | | PSS World Medical, Inc. ● | | | 98 | |
| | 1 | | Quality Systems | | | 87 | |
| | 6 | | Quidel Corp. ● | | | 89 | |
| | 1 | | Rehabcare Group, Inc. ● | | | 24 | |
| | 7 | | RTI Biologics, Inc. ● | | | 28 | |
The accompanying notes are an integral part of these financial statements.
| The Hartford SmallCap Growth Fund |
Schedule of Investments – (continued)
April 30, 2010 (Unaudited)
| Shares or Principal Amount | | Market Value ╪ | |
| COMMON STOCKS - 98.8% - (continued) | | | |
| | | Health Care Equipment & Services - 10.8% - (continued) | |
| | 4 | | Sirona Dental Systems, Inc. ● | | $ | 165 | |
| | 2 | | Somanetics Corp. ● | | | 30 | |
| | 7 | | STERIS Corp. | | | 217 | |
| | 36 | | Symmetry Medical, Inc. ● | | | 421 | |
| | 3 | | Thoratec Corp. ● | | | 146 | |
| | 14 | | Triple-S Management Corp., Class B ● | | | 260 | |
| | 20 | | U.S. Physical Therapy, Inc. ● | | | 349 | |
| | 15 | | Volcano Corp. ● | | | 358 | |
| | 27 | | Wellcare Health Plans, Inc. ● | | | 776 | |
| | 39 | | Zoll Medical Corp. ● | | | 1,183 | |
| | | | | | | 19,507 | |
| | | | Household & Personal Products - 1.3% | | | | |
| | 23 | | American Oriental Bioengineering, Inc. ● | | | 92 | |
| | 5 | | China Sky One Medical, Inc. ● | | | 66 | |
| | 3 | | Herbalife Ltd. | | | 163 | |
| | 3 | | Medifast, Inc. ● | | | 85 | |
| | 1 | | NBTY, Inc. ● | | | 59 | |
| | 60 | | Nu Skin Enterprises, Inc. Class A | | | 1,813 | |
| | 2 | | WD40 Co. | | | 56 | |
| | | | | | | 2,334 | |
| | | | Insurance - 1.1% | | | | |
| | 24 | | Allied World Assurance Holdings Ltd. | | | 1,028 | |
| | 38 | | Amerisafe, Inc. ● | | | 652 | |
| | 3 | | Endurance Specialty Holdings Ltd. | | | 100 | |
| | 2 | | FBL Financial Group Class A | | | 49 | |
| | 2 | | RLI Corp. | | | 87 | |
| | 3 | | Universal Insurance Holdings, Inc. | | | 14 | |
| | – | | Validus Holdings Ltd. | | | 4 | |
| | | | | | | 1,934 | |
| | | | Materials - 3.3% | | | | |
| | 2 | | Ashland, Inc. | | | 125 | |
| | 3 | | Balchem Corp. | | | 78 | |
| | 17 | | Boise, Inc. ● | | | 117 | |
| | 4 | | Calgon Carbon Corp. ● | | | 63 | |
| | 3 | | Clearwater Paper Corp. ● | | | 180 | |
| | 34 | | Georgia Gulf Corp. ● | | | 692 | |
| | – | | Koppers Holdings, Inc. | | | 3 | |
| | 1 | | Lubrizol Corp. | | | 120 | |
| | 1 | | Newmarket Corp. | | | 114 | |
| | 36 | | Olin Corp. | | | 758 | |
| | 10 | | Omnova Solutions, Inc. ● | | | 80 | |
| | 11 | | PolyOne Corp. ● | | | 130 | |
| | 18 | | Rock Tenn Co. Class A | | | 908 | |
| | 33 | | Silgan Holdings, Inc. | | | 1,967 | |
| | 2 | | Stepan Co. | | | 143 | |
| | 7 | | W.R. Grace & Co. ● | | | 191 | |
| | 3 | | Wausau Paper Corp. ● | | | 28 | |
| | 9 | | Worthington Industries, Inc. | | | 146 | |
| | 3 | | Zep, Inc. | | | 63 | |
| | | | | | | 5,906 | |
| | | | Media - 1.6% | | | | |
| | 63 | | Arbitron, Inc. | | | 1,944 | |
| | 5 | | Cinemark Holdings, Inc. | | | 99 | |
| | 8 | | Dolan Media Co. ● | | | 98 | |
| | 2 | | John Wiley & Sons, Inc. Class A | | | 76 | |
| | 70 | | LodgeNet Interactive Corp. ● | | | 464 | |
| | 8 | | New York Times Co. Class A ● | | | 83 | |
| | 4 | | Valassis Communications, Inc. ● | | | 129 | |
| | | | | | | 2,893 | |
| | | | Pharmaceuticals, Biotechnology & Life Sciences - 12.6% | |
| | 2 | | Alexion Pharmaceuticals, Inc. ● | | | 106 | |
| | 113 | | Alkermes, Inc. ● | | | 1,473 | |
| | 162 | | Arena Pharmaceuticals, Inc. ● | | | 527 | |
| | – | | Biomarin Pharmaceutical, Inc. ● | | | 3 | |
| | 4 | | Bio-Rad Laboratories, Inc. Class A ● | | | 458 | |
| | 42 | | Bruker Corp. ● | | | 636 | |
| | 98 | | Cadence Pharmaceuticals, Inc. ● | | | 958 | |
| | 96 | | Celera Corp. ● | | | 715 | |
| | 73 | | Celldex Therapeutics, Inc. ● | | | 596 | |
| | 57 | | Cepheid, Inc. ● | | | 1,133 | |
| | 3 | | Charles River Laboratories International, Inc. ● | | | 93 | |
| | 85 | | Cubist Pharmaceuticals, Inc. ● | | | 1,900 | |
| | 23 | | Cypress Bioscience ● | | | 115 | |
| | 193 | | Cytokinetics, Inc. ● | | | 621 | |
| | 5 | | Emergent Biosolutions, Inc. ● | | | 86 | |
| | 8 | | Enzon, Inc. ● | | | 81 | |
| | 6 | | Exelixis, Inc. ● | | | 36 | |
| | 5 | | Genomic Health, Inc. ● | | | 74 | |
| | 8 | | Hi-Technology Pharmacal Co., Inc. ● | | | 200 | |
| | 12 | | Human Genome Sciences, Inc. ● | | | 329 | |
| | 5 | | Impax Laboratories, Inc. ● | | | 94 | |
| | 69 | | Inspire Pharmaceuticals, Inc. ● | | | 473 | |
| | 8 | | Isis Pharmaceuticals, Inc. ● | | | 82 | |
| | 4 | | Kendle International, Inc. ● | | | 74 | |
| | – | | KV Pharmaceutical Co. ● | | | – | |
| | 7 | | Martek Biosciences Corp. ● | | | 152 | |
| | 88 | | Medicines Co. ● | | | 646 | |
| | 6 | | Medicis Pharmaceutical Corp. Class A | | | 151 | |
| | 1 | | Millipore Corp. ● | | | 93 | |
| | 6 | | Nektar Therapeutics ● | | | 88 | |
| | 45 | | Onyx Pharmaceuticals, Inc. ● | | | 1,291 | |
| | 35 | | PAREXEL International Corp. ● | | | 835 | |
| | 32 | | PDL Biopharma, Inc. | | | 186 | |
| | 2 | | Perrigo Co. | | | 97 | |
| | 32 | | Pharmasset, Inc. ● | | | 1,034 | |
| | 12 | | Questcor Pharmaceuticals ● | | | 116 | |
| | 69 | | Regeneron Pharmaceuticals, Inc. ● | | | 1,755 | |
| | 69 | | Rigel Pharmaceuticals, Inc. ● | | | 532 | |
| | 62 | | Salix Pharmaceuticals Ltd. ● | | | 2,494 | |
| | 12 | | Santarus, Inc. ● | | | 39 | |
| | 13 | | Sciclone Pharmaceuticals, Inc. ● | | | 55 | |
| | 118 | | Seattle Genetics, Inc. ● | | | 1,484 | |
| | – | | Synta Pharmaceuticals Corp. ● | | | 2 | |
| | 7 | | ViroPharma, Inc. ● | | | 93 | |
| | 15 | | Watson Pharmaceuticals, Inc. ● | | | 621 | |
| | 10 | | Zymogenetics, Inc. ● | | | 62 | |
| | | | | | | 22,689 | |
| | | | Real Estate - 1.1% | | | | |
| | 65 | | Anworth Mortgage Asset Corp. | | | 433 | |
| | 34 | | Colonial Properties Trust | | | 530 | |
| | 22 | | DuPont Fabros Technology, Inc. | | | 494 | |
| | 2 | | Equity Lifestyle Properties, Inc. | | | 102 | |
| | 39 | | MFA Mortgage Investments, Inc. | | | 274 | |
The accompanying notes are an integral part of these financial statements.
| Shares or Principal Amount | | Market Value ╪ | |
| COMMON STOCKS - 98.8% - (continued) | | | |
| | | Real Estate - 1.1% - (continued) | | | |
| | 2 | | PS Business Parks, Inc. | | $ | 100 | |
| | | | | | | 1,933 | |
| | | | Retailing - 6.4% | | | | |
| | 6 | | 99 Cents Only Stores ● | | | 95 | |
| | 3 | | Barnes & Noble, Inc. | | | 73 | |
| | 5 | | Big 5 Sporting Goods Corp. | | | 81 | |
| | 25 | | Big Lots, Inc. ● | | | 962 | |
| | 3 | | Cato Corp. | | | 73 | |
| | 26 | | Citi Trends, Inc. ● | | | 869 | |
| | 4 | | Collective Brands, Inc. ● | | | 94 | |
| | 29 | | Core-Mark Holding Co., Inc. ● | | | 888 | |
| | 6 | | Dress Barn, Inc. ● | | | 166 | |
| | 12 | | Drugstore.com, Inc. ● | | | 43 | |
| | 6 | | DSW, Inc. ● | | | 193 | |
| | 21 | | Gymboree Corp. ● | | | 1,044 | |
| | 5 | | Hibbett Sports, Inc. ● | | | 132 | |
| | 4 | | HSN, Inc. ● | | | 135 | |
| | 4 | | J. Crew Group, Inc. ● | | | 187 | |
| | 4 | | Jo-Ann Stores, Inc. ● | | | 161 | |
| | 18 | | Joseph A. Bank Clothiers, Inc. ● | | | 1,114 | |
| | 8 | | Kirklands, Inc. ● | | | 174 | |
| | 3 | | Monroe Muffler, Inc. | | | 99 | |
| | 4 | | Netflix, Inc. ● | | | 415 | |
| | 38 | | Nutri/System, Inc. | | | 729 | |
| | 10 | | OfficeMax, Inc. ● | | | 193 | |
| | 42 | | Overstock.com, Inc. ● | | | 771 | |
| | 5 | | PetMed Express, Inc. | | | 107 | |
| | 3 | | PetSmart, Inc. | | | 93 | |
| | 35 | | Shutterfly, Inc. ● | | | 824 | |
| | 9 | | Sonic Automotive, Inc. ● | | | 91 | |
| | 9 | | Stein Mart, Inc. ● | | | 83 | |
| | 9 | | The Finish Line, Inc. | | | 144 | |
| | 3 | | Tractor Supply Co. | | | 201 | |
| | 5 | | Ulta Salon, Cosmetics & Fragrances, Inc. ● | | | 119 | |
| | 119 | | Wet Seal, Inc. Class A ● | | | 563 | |
| | 3 | | Williams-Sonoma, Inc. | | | 88 | |
| | 28 | | Zumiez, Inc. ● | | | 512 | |
| | | | | | | 11,516 | |
| | | | Semiconductors & Semiconductor Equipment - 4.2% | |
| | 19 | | Amkor Technology, Inc. ● | | | 145 | |
| | 35 | | Atheros Communications, Inc. ● | | | 1,376 | |
| | – | | Diodes, Inc. ● | | | 2 | |
| | 5 | | FEI Co. ● | | | 114 | |
| | 4 | | Hittite Microwave Corp. ● | | | 187 | |
| | 11 | | Kopin Corp. ● | | | 48 | |
| | 19 | | Lattice Semiconductor Corp. ● | | | 101 | |
| | 8 | | Microsemi Corp. ● | | | 137 | |
| | 67 | | MIPS Technologies, Inc. Class A ● | | | 335 | |
| | 92 | | ON Semiconductor Corp. ● | | | 734 | |
| | 240 | | RF Micro Devices, Inc. ● | | | 1,349 | |
| | 154 | | Skyworks Solutions, Inc. ● | | | 2,601 | |
| | 22 | | Tessera Technologies, Inc. ● | | | 445 | |
| | | | | | | 7,574 | |
| | | | Software & Services - 14.1% | | | | |
| | 4 | | ACI Worldwide, Inc. ● | | | 73 | |
| | 10 | | Acxiom Corp. ● | | | 182 | |
| | 2 | | Advent Software, Inc. ● | | | 80 | |
| | 36 | | ArcSight, Inc. ● | | | 809 | |
| | 158 | | Art Technology Group, Inc. ● | | | 677 | |
| | 39 | | AsiaInfo Holdings, Inc. ● | | | 1,097 | |
| | 5 | | Blackbaud, Inc. | | | 121 | |
| | 4 | | Blackboard, Inc. ● | | | 154 | |
| | 7 | | Bottomline Technologies, Inc. ● | | | 113 | |
| | 7 | | Broadridge Financial Solutions, Inc. | | | 168 | |
| | 40 | | Commvault Systems, Inc. ● | | | 844 | |
| | 2 | | Concur Technologies, Inc. ● | | | 91 | |
| | 33 | | Constant Contact, Inc. ● | | | 848 | |
| | 45 | | CSG Systems International, Inc. ● | | | 1,020 | |
| | 4 | | Digital River, Inc. ● | | | 104 | |
| | 4 | | DivX, Inc. ● | | | 30 | |
| | 6 | | Double-Take Software, Inc. ● | | | 68 | |
| | 23 | | Earthlink, Inc. | | | 206 | |
| | 7 | | EPIQ Systems, Inc. ● | | | 89 | |
| | 2 | | Forrester Research, Inc. ● | | | 64 | |
| | 5 | | Gartner, Inc. Class A ● | | | 131 | |
| | 12 | | Global Cash Access, Inc. ● | | | 107 | |
| | 3 | | Global Payments, Inc. | | | 116 | |
| | 59 | | Informatica Corp. ● | | | 1,482 | |
| | 2 | | Interactive Intelligence, Inc. ● | | | 47 | |
| | 47 | | j2 Global Communications, Inc. ● | | | 1,143 | |
| | 8 | | Jack Henry & Associates, Inc. | | | 209 | |
| | 28 | | JDA Software Group, Inc. ● | | | 809 | |
| | 3 | | Logmein, Inc. ● | | | 74 | |
| | 5 | | Manhattan Associates, Inc. ● | | | 142 | |
| | 3 | | MAXIMUS, Inc. | | | 196 | |
| | 19 | | Mercadolibre, Inc. ● | | | 973 | |
| | 49 | | Net 1 UEPS Technologies, Inc. ● | | | 799 | |
| | 5 | | North American Equity | | | 34 | |
| | 3 | | Opnet Technologies, Inc. | | | 54 | |
| | 37 | | Parametric Technology Corp. ● | | | 691 | |
| | 1 | | Pegasystems, Inc. | | | 41 | |
| | 3 | | Perficient, Inc. ● | | | 42 | |
| | 28 | | Quest Software, Inc. ● | | | 492 | |
| | 48 | | Rackspace Hosting, Inc. ● | | | 867 | |
| | 7 | | Radiant Systems, Inc. ● | | | 95 | |
| | 15 | | Red Hat, Inc. ● | | | 445 | |
| | 29 | | RightNow Technologies, Inc. ● | | | 474 | |
| | 13 | | S1 Corp. ● | | | 80 | |
| | 120 | | Sapient Corp. | | | 1,224 | |
| | 35 | | Solera Holdings, Inc. | | | 1,353 | |
| | 8 | | SonicWALL, Inc. ● | | | 81 | |
| | 22 | | Sourcefire, Inc. w/Rights ● | | | 481 | |
| | 7 | | Taleo Corp. Class A ● | | | 185 | |
| | 59 | | TeleCommunication Systems, Inc. Class A ● | | | 407 | |
| | 5 | | TeleTech Holdings, Inc. ● | | | 90 | |
| | 92 | | Tibco Software, Inc. ● | | | 1,050 | |
| | 21 | | TiVo, Inc. ● | | | 371 | |
| | 5 | | Total System Services, Inc. | | | 85 | |
| | 2 | | Tyler Corp. ● | | | 27 | |
| | 4 | | Unisys Corp. ● | | | 104 | |
| | 100 | | United Online, Inc. | | | 794 | |
| | 12 | | Valueclick, Inc. ● | | | 127 | |
| | 3 | | Vasco Data Security International ● | | | 18 | |
| | 60 | | VeriFone Holdings, Inc. ● | | | 1,145 | |
| | 6 | | Websense, Inc. ● | | | 142 | |
| | 35 | | Wright Express Corp. ● | | | 1,195 | |
| | | | | | | 25,260 | |
The accompanying notes are an integral part of these financial statements.
| The Hartford SmallCap Growth Fund |
Schedule of Investments – (continued)
April 30, 2010 (Unaudited)
| Shares or Principal Amount | | Market Value ╪ | |
| COMMON STOCKS - 98.8% - (continued) | | | |
| | | Technology Hardware & Equipment - 6.6% | | | |
| | 13 | | ADC Telecommunications, Inc. ● | | $ | 101 | |
| | 3 | | ADTRAN, Inc. | | | 83 | |
| | 18 | | Arris Group, Inc. ● | | | 216 | |
| | 8 | | AVX Corp. | | | 124 | |
| | 49 | | Benchmark Electronics, Inc. ● | | | 1,070 | |
| | 3 | | Blue Coat Systems, Inc. ● | | | 106 | |
| | 9 | | Brightpoint, Inc. ● | | | 72 | |
| | – | | Cognex Corp. | | | 7 | |
| | 3 | | Comtech Telecommunications Corp. ● | | | 85 | |
| | 3 | | DG Fastchannel, Inc. ● | | | 90 | |
| | 2 | | DTS, Inc. ● | | | 81 | |
| | 10 | | Emulex Corp. ● | | | 113 | |
| | 6 | | Insight Enterprises, Inc. ● | | | 88 | |
| | 19 | | Interdigital, Inc. ● | | | 531 | |
| | – | | Intermec, Inc. ● | | | 5 | |
| | 29 | | Multi-Fineline Electronix, Inc. ● | | | 747 | |
| | 1 | | National Instruments Corp. | | | 26 | |
| | 62 | | Netezza Corp. ● | | | 842 | |
| | 1 | | Netgear, Inc. ● | | | 14 | |
| | 1 | | Novatel Wireless, Inc. ● | | | 5 | |
| | 57 | | Oplink Communications, Inc. ● | | | 856 | |
| | 5 | | Osi Systems, Inc. ● | | | 128 | |
| | 37 | | Plantronics, Inc. | | | 1,218 | |
| | 29 | | Polycom, Inc. ● | | | 937 | |
| | 55 | | QLogic Corp. ● | | | 1,063 | |
| | 47 | | Quantum Corp. ● | | | 136 | |
| | 64 | | Riverbed Technology, Inc. ● | | | 1,979 | |
| | 16 | | Silicon Graphics International ● | | | 163 | |
| | 6 | | Stratasys, Inc. ● | | | 131 | |
| | 3 | | SYNNEX Corp. ● | | | 90 | |
| | 2 | | ViaSat, Inc. ● | | | 86 | |
| | 11 | | Vishay Intertechnology, Inc. ● | | | 113 | |
| | 34 | | Xyratex Ltd. ● | | | 606 | |
| | | | | | | 11,912 | |
| | | | Telecommunication Services - 2.4% | | | | |
| | 20 | | AboveNet, Inc. ● | | | 1,022 | |
| | 13 | | Alaska Communication Systems Holdings, Inc. | | | 109 | |
| | 28 | | Atlantic Tele-Network, Inc. | | | 1,518 | |
| | 36 | | Cincinnati Bell, Inc. ● | | | 120 | |
| | 5 | | Consolidated Communications Holdings, Inc. | | | 94 | |
| | 29 | | Frontier Communications Corp. | | | 231 | |
| | 2 | | Global Crossing Ltd. ● | | | 32 | |
| | 5 | | Iowa Telecommunications Services, Inc. | | | 80 | |
| | 20 | | NTELOS Holdings Corp. | | | 387 | |
| | 26 | | PAETEC Holding Corp. ● | | | 127 | |
| | 7 | | Premiere Global Services, Inc. ● | | | 62 | |
| | 19 | | Syniverse Holdings, Inc. ● | | | 380 | |
| | 4 | | TW Telecom, Inc. ● | | | 78 | |
| | 5 | | USA Mobility, Inc. | | | 67 | |
| | | | | | | 4,307 | |
| | | | Transportation - 1.9% | | | | |
| | 16 | | AirTran Holdings, Inc. ● | | | 86 | |
| | 11 | | Avis Budget Group, Inc. ● | | | 163 | |
| | 16 | | Hawaiian Holdings, Inc. ● | | | 111 | |
| | 21 | | Marten Transport Ltd. ● | | | 450 | |
| | 70 | | UAL Corp. ● | | | 1,518 | |
| | 43 | | Werner Enterprises, Inc. | | | 953 | |
| | | | | | | 3,281 | |
| | | | Utilities - 0.7% | | | | |
| | 11 | | CenterPoint Energy, Inc. | | | 162 | |
| | 2 | | New Jersey Resources Corp. | | | 72 | |
| | 3 | | Piedmont Natural Gas | | | 89 | |
| | 28 | | UniSource Energy Corp. | | | 940 | |
| | | | | | | 1,263 | |
| | | | Total common stocks | | | | |
| | | | (cost $145,797) | | $ | 177,340 | |
| | | | | |
| EXCHANGE TRADED FUNDS - 0.7% | | | | |
| | | | Other Investment Pools and Funds - 0.7% | | | | |
| | 16 | | iShares Russell 2000 Growth Index Fund | | $ | 1,229 | |
| | | | | | | | |
| | | | Total exchange traded funds | | | | |
| | | | (cost $1,184) | | $ | 1,229 | |
| | | | | | | | |
| | | | Total long-term investments | | | | |
| | | | (cost $146,981) | | $ | 178,569 | |
| | | | | |
| SHORT-TERM INVESTMENTS - 0.8% | | | | |
| | | | Repurchase Agreements - 0.8% | | | | |
| | | | BNP Paribas Securities Corp. Repurchase | | | | |
| | | | Agreement (maturing on 05/03/2010 in the | | | | |
| | | | amount of $342, collateralized by U.S. | | | | |
| | | | Treasury Bond 5.25%, 2029, U.S. Treasury | | | | |
| | | | Note 0.88%, 2011, value of $351) | | | | |
| $ | 341 | | 0.18%, 04/30/2010 | | $ | 341 | |
| | | | BNP Paribas Securities Corp. TriParty Joint | | | | |
| | | | Repurchase Agreement (maturing on | | | | |
| | | | 05/03/2010 in the amount of $60, | | | | |
| | | | collateralized by FHLMC 4.00% - 7.50%, | | | | |
| | | | 2012 - 2040, FNMA 4.00% - 6.50%, 2010 - | | | | |
| | | | 2040, value of $61) | | | | |
| | 60 | | 0.20%, 04/30/2010 | | | 60 | |
| | | | Deutsche Bank Securities TriParty Joint | | | | |
| | | | Repurchase Agreement (maturing on | | | | |
| | | | 05/03/2010 in the amount of $223, | | | | |
| | | | collateralized by FNMA 3.50% - 9.00%, | | | | |
| | | | 2013 - 2048, value of $228) | | | | |
| | 223 | | 0.20%, 04/30/2010 | | | 223 | |
| | | | JP Morgan Chase TriParty Joint Repurchase | | | | |
| | | | Agreement (maturing on 05/03/2010 in the | | | | |
| | | | amount of $69, collateralized by FHLMC | | | | |
| | | | 6.00% - 6.50%, 2038, value of $70) | | | | |
| | 69 | | 0.20%, 04/30/2010 | | | 69 | |
| | | | Morgan Stanley & Co., Inc. TriParty Joint | | | | |
| | | | Repurchase Agreement (maturing on | | | | |
| | | | 05/03/2010 in the amount of $139, | | | | |
| | | | collateralized by FHLMC 4.00% - 6.50%, | | | | |
| | | | 2017 - 2040, FNMA 3.50% - 6.50%, 2018 - | | | | |
| | | | 2040, value of $142) | | | | |
| | 139 | | 0.19%, 04/30/2010 | | | 139 | |
The accompanying notes are an integral part of these financial statements.
| Shares or Principal Amount | | Market Value ╪ | |
| SHORT-TERM INVESTMENTS - 0.8% - (continued) | | | |
| | | Repurchase Agreements - 0.8% - (continued) | | | |
| | | RBS Greenwich Capital Markets TriParty Joint | | | |
| | | Repurchase Agreement (maturing on | | | | |
| | | 05/03/2010 in the amount of $138, | | | | |
| | | collateralized by U.S. Treasury Note 1.25% | | | |
| | | - 1.50%, 2010, value of $140) | | | | |
| $ | 138 | | 0.18%, 04/30/2010 | | | $ | 138 | |
| | | | UBS Securities, Inc. TriParty Joint | | | | | |
| | | | Repurchase Agreement (maturing on | | | | | |
| | | | 05/03/2010 in the amount of $338, | | | | | |
| | | | collateralized by U.S. Treasury Note 1.75% | | | | |
| | | | - 3.00%, 2014 - 2017, value of $345) | | | | | |
| | 338 | | 0.19%, 04/30/2010 | | | | 338 | |
| | | | UBS Securities, Inc. Repurchase Agreement | | | | |
| | | | (maturing on 05/03/2010 in the amount of | | | | |
| | | | $1, collateralized by U.S. Treasury Bond | | | | |
| | | | 7.63%, 2022, value of $1) | | | | | |
| | 1 | | 0.18%, 04/30/2010 | | | | 1 | |
| | | | UBS Securities, Inc. TriParty Joint Repurchase | | | | |
| | | | Agreement (maturing on 05/03/2010 in the | | | | |
| | | | amount of $82, collateralized by U.S. | | | | | |
| | | | Treasury Note 3.00%, 2017, value of $83) | | | | |
| | 82 | | 0.20%, 04/30/2010 | | | | 82 | |
| | | | | | | | 1,391 | |
| | | | U.S. Treasury Bills - 0.0% | | | | | |
| | 90 | | 0.15%, 07/15/2010□○ | | | | 90 | |
| | | | | | | | | |
| | | | Total short-term investments | | | | | |
| | | | (cost $1,481) | | | $ | 1,481 | |
| | | | | | | | | |
| | | | Total investments | | | | | |
| | | | (cost $148,462) ▲ | 100.3 | % | $ | 180,050 | |
| | | | Other assets and liabilities | (0.3 | )% | | (514 | ) |
| | | | Total net assets | 100.0 | % | $ | 179,536 | |
| Note: | Percentage of investments as shown is the ratio of the total market value to total net assets. Market value of investments in foreign securities represents 1.3% of total net assets at April 30, 2010. |
| | Foreign securities that are principally traded on certain foreign markets are adjusted daily pursuant to a third party pricing service methodology approved by the Board of Directors in order to reflect an adjustment for factors occurring after the close of the foreign market but before the close of the New York Stock Exchange. |
▲ | At April 30, 2010, the cost of securities for federal income tax purposes was $150,583 and the aggregate gross unrealized appreciation and depreciation based on that cost were: |
| | Unrealized Appreciation | | $ | 40,629 | |
| | Unrealized Depreciation | | | (11,162 | ) |
| | Net Unrealized Appreciation | | $ | 29,467 | |
● | Currently non-income producing. |
○ | The interest rate disclosed for these securities represents the effective yield on the date of the acquisition. |
□ | Security pledged as initial margin deposit for open futures contracts at April 30, 2010. |
Futures Contracts Outstanding at April 30, 2010
| | Description | Number of Contracts* | Position | Expiration Month | Unrealized Appreciation/ (Depreciation) |
| | Russell 2000 Mini | 11 | Long | Jun 2010 | $ | 27 |
| | * | The number of contracts does not omit 000's. |
| ╪ | See Significant Accounting Policies of accompanying Notes to Financial Statements regarding valuation of securities. |
The accompanying notes are an integral part of these financial statements.
| The Hartford SmallCap Growth Fund |
April 30, 2010 (Unaudited)
| | | Total | | | Level 1♦ | | | Level 2♦ | | | Level 3 | |
| Assets: | | | | | | | | | | | | |
| Common Stocks ‡ | | $ | 177,340 | | | $ | 177,340 | | | $ | – | | | $ | – | |
| Exchange Traded Funds | | | 1,229 | | | | 1,229 | | | | – | | | | – | |
| Short-Term Investments | | | 1,481 | | | | – | | | | 1,481 | | | | – | |
| Total | | $ | 180,050 | | | $ | 178,569 | | | $ | 1,481 | | | $ | – | |
| Futures * | | | 27 | | | | 27 | | | | – | | | | – | |
| Total | | $ | 27 | | | $ | 27 | | | $ | – | | | $ | – | |
| ♦ | For the period ended April 30, 2010, there were no significant transfers between Level 1 and Level 2. |
‡ | The Fund has all or primarily all of these equity securities categorized in a single level. Refer to the Schedule of Investments for further industry breakout. |
| * | Derivative instruments not reflected in the Schedule of Investments are valued at the unrealized appreciation/depreciation on the investments. |
The accompanying notes are an integral part of these financial statements.
| The Hartford SmallCap Growth Fund |
April 30, 2010 (Unaudited)
| Assets: | | | |
| Investments in securities, at market value (cost $148,462) | | $ | 180,050 | |
| Cash | | | 1 | |
| Receivables: | | | | |
| Investment securities sold | | | 500 | |
| Fund shares sold | | | 57 | |
| Dividends and interest | | | 41 | |
| Other assets | | | 126 | |
| Total assets | | | 180,775 | |
| Liabilities: | | | | |
| Payables: | | | | |
| Investment securities purchased | | | 883 | |
| Fund shares redeemed | | | 248 | |
| Investment management fees | | | 17 | |
| Administrative fees | | | — | |
| Distribution fees | | | 7 | |
| Variation margin | | | 24 | |
| Accrued expenses | | | 60 | |
| Total liabilities | | | 1,239 | |
| Net assets | | $ | 179,536 | |
| Summary of Net Assets: | | | | |
| Capital stock and paid-in-capital | | $ | 248,146 | |
| Accumulated net investment loss | | | (444 | ) |
| Accumulated net realized loss on investments | | | (99,781 | ) |
| Unrealized appreciation of investments | | | 31,615 | |
| Net assets | | $ | 179,536 | |
| | | | | |
| Shares authorized | | | 27,000,000 | |
| Par value | | $ | 0.0001 | |
Class A: Net asset value per share/Maximum offering price per share | | | $25.75/$27.25 | |
| Shares outstanding | | | 2,066 | |
| Net assets | | $ | 53,196 | |
Class B: Net asset value per share | | $ | 22.30 | |
| Shares outstanding | | | 406 | |
| Net assets | | $ | 9,060 | |
Class C: Net asset value per share | | $ | 22.09 | |
| Shares outstanding | | | 517 | |
| Net assets | | $ | 11,409 | |
Class I: Net asset value per share | | $ | 25.85 | |
| Shares outstanding | | | 208 | |
| Net assets | | $ | 5,388 | |
Class L: Net asset value per share/Maximum offering price per share | | | $25.92/$27.21 | |
| Shares outstanding | | | 3,392 | |
| Net assets | | $ | 87,920 | |
Class R3: Net asset value per share | | $ | 26.05 | |
| Shares outstanding | | | 11 | |
| Net assets | | $ | 287 | |
Class R4: Net asset value per share | | $ | 26.25 | |
| Shares outstanding | | | 93 | |
| Net assets | | $ | 2,444 | |
Class R5: Net asset value per share | | $ | 26.52 | |
| Shares outstanding | | | 60 | |
| Net assets | | $ | 1,600 | |
Class Y: Net asset value per share | | $ | 26.58 | |
| Shares outstanding | | | 310 | |
| Net assets | | $ | 8,232 | |
The accompanying notes are an integral part of these financial statements.
| The Hartford SmallCap Growth Fund |
For the Six-Month Period Ended April 30, 2010 (Unaudited)
| Investment Income: | | | |
Dividends | | $ | 696 | |
Interest | | | 2 | |
Total investment income | | | 698 | |
| | | | | |
| Expenses: | | | | |
Investment management fees | | | 718 | |
Administrative services fees | | | 3 | |
Transfer agent fees | | | 153 | |
Distribution fees | | | | |
Class A | | | 61 | |
Class B | | | 43 | |
Class C | | | 53 | |
Class L | | | 102 | |
Class R3 | | | 1 | |
Class R4 | | | 3 | |
Custodian fees | | | 12 | |
Accounting services fees | | | 13 | |
Registration and filing fees | | | 43 | |
Board of Directors' fees | | | 3 | |
Audit fees | | | 5 | |
Other expenses | | | 34 | |
Total expenses (before waivers and fees paid indirectly) | | | 1,247 | |
Expense waivers | | | (57 | ) |
Transfer agent fee waivers | | | (45 | ) |
Commission recapture | | | (3 | ) |
Custodian fee offset | | | — | |
Total waivers and fees paid indirectly | | | (105 | ) |
Total expenses, net | | | 1,142 | |
| Net Investment Loss | | | (444 | ) |
| Net Realized Gain on Investments and Other Financial Instruments: | | | | |
Net realized gain on investments in securities | | | 8,120 | |
Net realized gain on futures | | | 132 | |
| Net Realized Gain on Investments and Other Financial Instruments | | | 8,252 | |
Net Changes in Unrealized Appreciation of Investments and Other Financial Instruments: | | | | |
Net unrealized appreciation of investments | | | 30,754 | |
Net unrealized appreciation of futures | | | 43 | |
Net Changes in Unrealized Appreciation of Investments and Other Financial Instruments | | | 30,797 | |
| Net Gain on Investments and Other Finanical Instruments | | | 39,049 | |
| Net Increase in Net Assets Resulting from Operations | | $ | 38,605 | |
The accompanying notes are an integral part of these financial statements.
| The Hartford SmallCap Growth Fund |
| | | For the Six-Month | | | | |
| | | Period Ended | | | For the | |
| | | April 30, 2010 | | | Year Ended | |
| | | (Unaudited) | | | October 31, 2009 | |
| Operations: | | | | | | |
| Net investment loss | | $ | (444 | ) | | $ | (576 | ) |
| Net realized gain (loss) on investments and other financial instruments | | | 8,252 | | | | (57,323 | ) |
| Net unrealized appreciation of investments and other financial instruments | | | 30,797 | | | | 67,765 | |
| Net Increase In Net Assets Resulting From Operations | | | 38,605 | | | | 9,866 | |
| Capital Share Transactions: | | | | | | | | |
| Class A | | | (3,179 | ) | | | (36,969 | ) |
| Class B | | | (940 | ) | | | (1,246 | ) |
| Class C | | | (767 | ) | | | (1,470 | ) |
| Class I | | | (237 | ) | | | 863 | |
| Class L | | | (5,661 | ) | | | (6,555 | ) |
| Class R3 | | | 40 | | | | 131 | |
| Class R4 | | | 96 | | | | 395 | |
| Class R5 | | | (67 | ) | | | 1,006 | |
| Class Y | | | (1,842 | ) | | | (19,339 | ) |
| Net decrease from capital share transactions | | | (12,557 | ) | | | (63,184 | ) |
| Net Increase (Decrease) In Net Assets | | | 26,048 | | | | (53,318 | ) |
| Net Assets: | | | | | | | | |
| Beginning of period | | | 153,488 | | | | 206,806 | |
| End of period | | $ | 179,536 | | | $ | 153,488 | |
| Accumulated undistributed (distribution in excess of) net investment income (loss) | | $ | (444 | ) | | $ | — | |
The accompanying notes are an integral part of these financial statements.
| The Hartford SmallCap Growth Fund |
April 30, 2010 (Unaudited)
The Hartford Mutual Funds II, Inc. (“Company”) is an open-end management investment company comprised of five portfolios. Financial statements for The Hartford SmallCap Growth Fund (the “Fund”), a series of the Company, are included in this report.
The Company is organized under the laws of the State of Maryland and is registered with the Securities and Exchange Commission (“SEC”) under the Investment Company Act of 1940, as amended (“1940 Act”). The Fund is a diversified open-end management investment company.
Class A shares are sold with a front-end sales charge of up to 5.50%. Class B shares were sold with a contingent deferred sales charge which is assessed on the lesser of the per share net asset value (“NAV”) of the shares at the time of redemption or the original purchase price, and declines from up to 5.00% to zero depending on the period of time the shares are held (See note below regarding the closing of Class B shares). Class C shares are sold with a contingent deferred sales charge of up to 1.00% on shares redeemed within twelve months of purchase. Class I shares are sold without sales charges to certain eligible investors through advisory fee-based wrap programs. Class L shares are sold with a sales charge of up to 4.75%. Classes R3, R4 and R5 shares, which are offered to employer-sponsored retirement plans, and Class Y shares, which are sold to certain eligible institutional investors, are sold without a sales charge. All classes of shares have identical voting, redemption, dividend, liquidation and other rights and the same terms and conditions, with the exceptions that each class may have different expenses, which may affect performance, and except that Class B shares automatically convert to Class A shares after 8 years.
No new or additional investments are allowed in Class B shares of The Hartford Mutual Funds (including investments through any systematic investment plan). Existing shareholders of Class B shares may continue to hold their Class B shares, exchange their Class B shares for Class B shares of another Hartford Mutual Fund (as permitted by existing exchange privileges), or redeem their Class B shares as described in the Fund’s prospectus. Reinstatement privileges with respect to Class B shares will continue under the current policy. For investors electing to reinvest capital gains and dividends, any such capital gains or dividends on Class B shares will continue to be reinvested in Class B shares of the Fund. All Class B share attributes, including the 12b-1 fee, contingent deferred sales charge schedule, and conversion to Class A shares remain unchanged.
2. | Significant Accounting Policies: |
The following is a summary of significant accounting policies of the Fund, which are in accordance with U.S. Generally Accepted Accounting Principles (“GAAP”).
| a) | Security Transactions and Investment Income – Security transactions are recorded on the trade date (the date the order to buy or sell is executed). Security gains and losses are determined on the basis of identified cost. |
Dividend income is accrued as of the ex-dividend date, except that certain dividends for foreign securities where the ex-dividend date may have passed are recorded as soon as the Fund is informed of the dividend in the exercise of reasonable diligence. Interest income, including amortization of premium and accretion of discounts, is accrued on a daily basis.
| b) | Security Valuation – The Fund generally uses market prices in valuing portfolio securities. If market prices are not readily available or are deemed unreliable, the Fund will use the fair value of the security as determined in good faith under policies and procedures established by and under the supervision of the Fund’s Board of Directors. Market prices may be deemed unreliable, for example, if a security is thinly traded or if an event has occurred after the close of the security’s primary market, but before the close of the New York Stock Exchange (the “Exchange”) (generally 4:00 p.m. |
Eastern Time, referred to as the “Valuation Time”) that is expected to affect the value of the portfolio security. The circumstances in which the Fund may use fair value pricing include, among others: (i) the occurrence of events that are significant to a particular issuer, such as mergers, restructuring or defaults; (ii) the occurrence of events that are
significant to an entire market, such as natural disasters in a particular region or governmental actions; (iii) trading restrictions on securities; (iv) thinly traded securities and (v) market events such as trading halts and early market closings. In addition, with respect to the valuation of stocks primarily traded on foreign markets, the Fund uses a fair value pricing service approved by the Fund’s Board of Directors, which employs quantitative models that evaluate changes in the value of foreign market proxies (e.g., futures contracts, American Depositary Receipts, exchange traded funds (“ETF’s”)) after the close of the foreign markets but before the Valuation Time. Securities that are primarily traded on foreign markets may trade on days that are not business days of the Fund. The value of the foreign securities in which the Fund invests may change on days when a shareholder will not be able to purchase or redeem shares of the Fund. Fair value pricing is subjective in nature and the use of fair value pricing by the Fund may cause the NAV of its shares to differ significantly from the NAV that would have been calculated using market prices at the close of the exchange on which a portfolio security is primarily traded but before the Valuation Time. There can be no assurance that the Fund could obtain the fair value assigned to a security if the Fund were to sell the security at approximately the time at which the Fund determines its NAV.
Exchange-traded equity securities are valued at the last reported sale price on the exchange or market on which the security is primarily traded (the “Primary Market”) at the Valuation Time. If the security did not trade on the Primary Market, it may be valued at the Valuation Time at the last reported sale price on another exchange where it trades. The value of an equity security not traded on any exchange but traded on the Nasdaq Stock Market, Inc. (“Nasdaq”) or another over-the-counter market shall be valued at the last reported sale price or official closing price on the exchange or market on which the security is traded as of the Valuation Time.
Foreign-denominated assets, including investment securities, and liabilities are translated from the local currency into U.S. dollars using exchange rates obtained from an independent third party as of the Fund’s Valuation Time.
Options contracts on securities, currencies, indices, futures contracts, commodities and other instruments shall be valued at their last reported sale price at the Valuation Time on the Primary Market on which the instrument is primarily traded. If the instrument did not trade on the Primary Market, it may be valued at the most recent sale price at the Valuation Time on another exchange or market where it did trade. If it is not possible to determine the last reported sale price on the Primary Market or another exchange or market at the Valuation Time, the value of the security shall be taken to be the most recent mean between bid and asked prices on such exchange or market at the Valuation Time. Absent both bid and asked prices on such exchange, the bid price may be used.
Futures contracts are valued at the most recent settlement price reported by an exchange on which, over time, they are traded most extensively. If a settlement price is not available, futures contracts will be valued at the most recent trade price as of the Valuation Time. If there were no trades, the contract shall be valued at the mean of the closing bid and asked prices as of the Valuation Time.
Financial instruments for which prices are not available from an independent pricing service are valued using market quotations obtained from one or more dealers that make markets in securities in accordance with procedures established by the Fund’s Board of Directors.
Forward foreign currency contracts represent agreements to exchange currencies on specific future dates at predetermined rates. Forward foreign currency contracts are valued using foreign currency exchange rates and forward rates on the Valuation Date from an independent pricing service.
Other derivative or contractual type instruments shall be valued using market prices if such instruments trade on an exchange or market. If such instruments do not trade on an exchange or market, such instruments shall be valued at a price at which the counterparty to such contract would repurchase the instrument. In the event that the counterparty cannot provide a price, such valuation may be determined in accordance with procedures established by the Fund’s Board of Directors.
| The Hartford SmallCap Growth Fund |
Notes to Financial Statements – (continued)
April 30, 2010 (Unaudited)
Various inputs are used in determining the value of the Fund’s investments. These inputs are summarized into three broad hierarchy levels. This hierarchy is based on whether the valuation inputs are observable or unobservable. These levels are:
| | · | Level 1 – Quoted prices in active markets for identical securities. Level 1 may include exchange-traded instruments such as domestic equities, some foreign equities, options, futures, mutual funds, ETF’s, and rights and warrants. |
| | · | Level 2 – Observable inputs other than Level 1 prices, such as quoted prices for similar securities; quoted prices in markets that are not active; or other inputs that are observable or can be corroborated by observable market data for substantially the full term of the security. Level 2 may include debt securities that are traded less frequently than exchange-traded instruments and that are valued using third party pricing services; foreign equities, whose value is determined using a multi-factor regression model with inputs that are observable in the market; and money market instruments, which are carried at amortized cost. |
| | · | Level 3 – Significant unobservable inputs that are supported by little or no market activity. Level 3 may include financial instruments whose values are determined using broker quotes or require significant management judgment or estimation. These unobservable valuation inputs may include estimates for current yields, maturity/duration, prepayment speed, and broker quotes for comparable securities along with other assumptions relating to credit quality, collateral value, complexity of the security structure, general market conditions and liquidity. This category may include securities where trading has been halted or there are certain restrictions on trading. While these securities are priced using unobservable inputs, the valuation of these securities reflects the best available data and management believes the prices are a reasonable representation of exit price. |
Individual securities within any of the above mentioned asset classes may be assigned a different hierarchical level than those presented above, as individual circumstances dictate.
During the six-month period ended April 30, 2010, the Fund held no Level 3 securities, therefore no reconciliation of Level 3 securities is presented.
Refer to the Investment Valuation Hierarchy Level Summary found following the Schedule of Investments.
| c) | Foreign Currency Transactions – Assets and liabilities denominated in currencies other than U.S. dollars are translated into U.S. dollars at the exchange rates in effect on the valuation date. Purchases and sales of investment securities, income and expenses are translated into U.S. dollars at the exchange rates on the dates of such transactions. |
The Fund does not isolate that portion of portfolio security valuation resulting from fluctuations in the foreign currency exchange rates from the fluctuations arising from changes in the market prices of securities held. Exchange rate fluctuations are included with the net realized and unrealized gain or loss on investments in the accompanying financial statements.
Net realized foreign exchange gains or losses arise from sales of foreign currencies and the difference between asset and liability amounts initially stated in foreign currencies and the U.S. dollar value of the amounts actually received or paid. Net unrealized foreign exchange gains or losses arise from changes in the value of other assets and liabilities at the end of the reporting period, resulting from changes in the exchange rates.
| d) | Joint Trading Account – Pursuant to an exemptive order issued by the SEC, the Fund may transfer uninvested cash balances into a joint trading account managed by Hartford Investment Management Company (“Hartford Investment Management”) or Wellington Management Company, LLP (“Wellington”). These balances may be invested in one or more repurchase agreements and/or short-term money market instruments. |
| e) | Repurchase Agreements – A repurchase agreement is an agreement by which a counterparty agrees to sell a security and agrees to repurchase the security sold at a mutually agreed upon time and price. At the time the Fund enters into a repurchase agreement, the value of the underlying collateral security(ies), including accrued interest, will be equal to or |
| | exceed the value of the repurchase agreement. To minimize counterparty risk, the securities that serve to collateralize the repurchase agreement are held by the Fund's custodian in book entry or physical form in the custodial account of the Fund or in a third party custodial account. Repurchase agreements are valued at cost plus accrued interest. The Fund, as shown on the Schedule of Investments, had outstanding repurchase agreements as of April 30, 2010. |
| | f) | Forward Foreign Currency Contracts – The Fund may enter into forward foreign currency contracts that obligate the Fund to purchase or sell currencies at specified future dates. Forward foreign currency contracts may be used to hedge against adverse fluctuations in exchange rates between currencies. |
| | Forward foreign currency contracts involve elements of market risk in excess of the amounts reflected in the Statement of Assets and Liabilities. In addition, risks may arise upon entering into these contracts from the potential inability of the counterparties to meet the terms of the contracts and from unanticipated movements in the value of the foreign currencies relative to the U.S. dollar. The Fund had no outstanding forward foreign currency contracts as of April 30, 2010. |
| g) | Indexed Securities – The Fund may invest in indexed securities whose values are linked to changes in interest rates, indices, or other underlying instruments. The Fund may use these securities to increase or decrease its exposure to different underlying instruments and to gain exposure to markets that might be difficult to invest in using conventional securities. Indexed securities may be more volatile than their underlying instruments, but any loss is limited to the amount of the original investment and there may be a limit to the potential appreciation of the investment. The Fund, as shown in the Schedule of Investments under Exchange Traded Funds, had investments in indexed securities as of April 30, 2010. |
| h) | Fund Share Valuation and Dividend Distributions to Shareholders – Orders for the Fund’s shares are executed in accordance with the investment instructions of the shareholders. The NAV of the Fund’s shares is determined as of the close of each business day of the Exchange. The NAV is determined separately for each class of the Fund by dividing the Fund’s net assets attributable to that class by the number of shares of the class outstanding. Orders for the purchase of the Fund’s shares prior to the close of the Exchange on any day on which the Exchange is open for business are priced at the NAV determined as of the close of the Exchange. Orders after the close of the Exchange, or on a day on which the Exchange and/or the Fund is not open for business, are priced at the next determined NAV. |
| | The Fund intends to distjribute substantially all of its net investment income and net realized capital gains to shareholders no less frequently than once a year. Normally, dividends from net investment income of the Fund are declared and paid annually. Unless shareholders specify otherwise, all dividends will be automatically reinvested in additional full or fractional shares of the Fund. |
| | Distributions from net injvestment income, realized capital gains and capital are determined in accordance with federal income tax regulations, which may differ from U.S. GAAP with respect to character and timing. These differences may include but are not limited to losses deferred due to wash sale adjustments, foreign currency gains and losses, adjustments related to Passive Foreign Investment Companies (“PFICs”), Real Estate Investment Trusts (“REITs”), Regulated Investment Companies (“RICs”), certain derivatives and partnerships. Permanent book and federal income tax basis differences relating to shareholder distributions will result in reclassifications to certain of the Fund’s capital accounts (see Federal Income Taxes: Reclassification of Capital Accounts footnote). |
| | i) | Use of Estimates – The preparation of financial statements in conformity with U.S. GAAP requires management to make estimates and assumptions that affect the reported amoujnts of assets and liabilities as of the date of the financial statements and the reported amounts of income and expenses during the period. Operating results in the future could vary from the amounts derived from management’s estimates. |
| The Hartford SmallCap Growth Fund |
Notes to Financial Statements – (continued)
April 30, 2010 (Unaudited)
| | j) | Additional Derivative Instrument(s) Information |
Derivative Instrument(s) as of April 30, 2010.
| | | Asset Derivatives | | | Liability Derivatives |
| | Risk Exposure Category | Statement of Assets and Liabilities Location | | | Statement of Assets and Liabilities Location |
| | Equity contracts | Summary of Net Assets - Unrealized | 27 | | |
| | | appreciation | | | |
The volume of derivatives that is presented in the Schedule of Investments is consistent with the derivative activity during the six-month period ended April 30, 2010.
Realized Gain/Loss and Change in Unrealized Appreciation (Depreciation) on Derivative Instruments for the six-month period ended April 30, 2010:
| Amount of Realized Gain or (Loss) on Derivatives Recognized in Income | |
| Risk Exposure Category | | Written Options | | | Purchased Options | | | Futures | | | Forward Currency Contracts | | | Swaps | | | Total | |
| Equity contracts | | $ | — | | | $ | — | | | $ | 132 | | | $ | — | | | $ | — | | | $ | 132 | |
| Total | | $ | — | | | $ | — | | | $ | 132 | | | $ | — | | | $ | — | | | $ | 132 | |
| Change in Unrealized Appreciation or (Depreciation) on Derivatives Recognized in Income | |
Risk Exposure Category | | Written Options | | | Purchased Options | | | Futures | | | Forward Currency Contracts | | | Swaps | | | Total | |
| Equity contracts | | | — | | | | — | | | | 43 | | | | — | | | | — | | | $ | 43 | |
| Total | | $ | — | | | $ | — | | | $ | 43 | | | $ | — | | | $ | — | | | $ | 43 | |
| k) | Indemnifications – Under the Company’s organizational documents, the Company shall indemnify its officers and directors to the full extent required or permitted under Maryland General Corporation Law and the federal securities law. |
In addition, the Company, on behalf of the Fund, may enter into contracts that contain a variety of indemnifications. The Company’s maximum exposure under these arrangements is unknown. However, the Company has not had prior claims or losses pursuant to these contracts and expects the risk of loss to be remote.
The Fund is subject to equity price risk, interest rate risk and foreign currency exchange rate risk in the normal course of pursuing its investment objectives. The Fund may invest in futures and options contracts in order to gain exposure to or hedge against changes in the value of equities, interest rates or foreign currencies. A futures contract is an agreement between two parties to buy and sell an asset at a set price on a future date. When the Fund enters into such futures contracts, it is required to deposit with a futures commission merchant an amount of “initial margin” of cash, commercial paper or U.S. Treasury Bills. Subsequent payments, called variation margin, to and from the broker, are made on a daily basis as the price of the underlying asset fluctuates, making the long and short positions in the futures contract more or less valuable (i.e., mark-to-market), which results in an unrealized gain or loss to the Fund.
At any time prior to the expiration of the futures contract, the Fund may close the position by taking an opposite position, which would effectively terminate the position in the futures contract. A final determination of variation margin is then made, additional cash is required to be paid by or released to the Fund and the Fund realizes a gain or loss.
The use of futures contracts involves elements of market risk, which may exceed the amounts recognized in the Statement of Assets and Liabilities. Changes in the value of the futures contracts may decrease the effectiveness of the Fund’s strategy and potentially result in loss. With futures, there is minimal counterparty risk to the Fund since futures
| | are exchange traded through a clearing house. The clearing house requires sufficient collateral to cover margins. The Fund, as shown on the Schedule of Investments, had outstanding futures contracts as of April 30, 2010. |
| | An option contract is a contract sold by one party to another party that offers the buyer the right, but not the obligation, to buy (call) or sell (put) a security or other financial asset at an agreed-upon price during a specific period of time or on a specific date. The premium paid by the Fund for the purchase of a call or put option is included in the Fund’s Statement of Assets and Liabilities as an investment and subsequently “marked-to-market” through net unrealized appreciation (depreciation) of options to reflect the current market value of the option as of the end of the reporting period. |
| | The Fund may write (sell) covered options. “Covered” means that so long as the Fund is obligated as the writer of an option, it will own either the underlying securities or currency or an option to purchase the same underlying securities or currency having an expiration date of the covered option and an exercise price equal to or less than the exercise price of the covered option, or will pledge cash or other liquid securities having a value equal to or greater than the fluctuating market value of the option securities or currencies. The Fund receives a premium for writing a call or put option, which is recorded on the Fund’s Statement of Assets and Liabilities and subsequently “marked-to-market” through net unrealized appreciation (depreciation) of options. There is a risk of loss from a change in the value of such options, which may exceed the related premiums received. The maximum amount of loss with respect to the Fund’s written put option is the cost of buying the underlying security or currency. The maximum loss may be offset by proceeds received from selling the underlying securities or currency. As of April 30, 2010, there were no outstanding option contracts. |
| a) | Federal Income Taxes – For federal income tax purposes, the Fund intends to continue to qualify as a RIC under Subchapter M of the Internal Revenue Code (“IRC”) by distributing substantially all of its taxable net investment income and net realized capital gains to its shareholders and otherwise complying with the requirements of RICs. The Fund has distributed substantially all of its income and capital gains in prior years and intends to distribute substantially all of its income and capital gains during the calendar year ending December 31, 2010. Accordingly, no provision for federal income or excise taxes has been made in the accompanying financial statements. Distributions from short-term capital gains are treated as ordinary income distributions for federal income tax purposes. |
| b) | Net Investment Income (Loss), Net Realized Gains (Losses) – Net investment income (loss) and net realized gains (losses) may differ for financial statement and tax purposes primarily because of losses deferred due to wash sale adjustments, foreign currency gains and losses, adjustments related to PFICs, REITs, RICs, certain derivatives and partnerships. The character of distributions made during the year from net investment income or net realized gains may differ from their ultimate characterization for federal income tax purposes. Also, due to the timing of dividend distributions, the fiscal year in which amounts are distributed may differ from the year that the income or realized gains (losses) were recorded by the Fund. |
| c) | Distributions and Components of Distributable Earnings – The tax character of distributions paid by the Fund for the periods indicated is as follows (as adjusted for dividends payable): |
| | | | For the Year Ended October 31, 2009 | | | For the Year Ended October 31, 2008 | |
| | Ordinary Income | | $ | — | | | $ | 5,569 | |
| | Long-Term Capital Gains * | | | — | | | | 33,708 | |
* The Fund designates these distributions as long-term capital gain dividends pursuant to IRC code Sec. 852(b)(3)(C).
| The Hartford SmallCap Growth Fund |
Notes to Financial Statements – (continued)
April 30, 2010 (Unaudited)
As of October 31, 2009, the Fund’s components of distributable earnings (deficit) on a tax basis were as follows:
| | | | Amount | |
| | Accumulated Capital Losses * | | $ | (105,928 | ) |
| | Unrealized Depreciation † | | | (1,287 | ) |
| | Total Accumulated Deficit | | $ | (107,215 | ) |
| * | The Fund has capital loss carryforwards that are identified in the Capital Loss Carryforward note that follows. |
| † | The differences between book-basis and tax-basis unrealized appreciation (depreciation) may be attributable to the losses deferred due to wash sale adjustments, foreign currency gains and losses, adjustments related to PFICs, REITs, RICs, certain derivatives and partnerships. |
| d) | Reclassification of Capital Accounts – The Fund may record reclassifications in its capital accounts. These reclassifications have no impact on the total net assets of the Fund. The reclassifications are a result of permanent differences between GAAP and tax accounting for such items as net operating losses that reduce distribution requirements. Adjustments are made to reflect the impact these items have on current and future distributions to shareholders. Therefore, the source of the Fund’s distributions may be shown in the accompanying Statement of Changes in Net Assets as from net investment income, from net realized gains on investments or from capital depending on the type of book and tax differences that exist. For the year ended October 31, 2009, the Fund recorded reclassifications to increase (decrease) the accounts listed below: |
| | | | Amount | |
| | Undistributed Net Investment Income | | $ | 576 | |
| | Accumulated Net Realized Gain | | | 109 | |
| | Paid-in-Capital | | | (685 | ) |
| e) | Capital Loss Carryforward – At October 31, 2009 (tax-year-end), the Fund had capital loss carryforwards for U.S. federal income tax purposes of approximately: |
| | Year of Expiration | | Amount | |
| | 2016 | | $ | 46,989 | |
| | 2017 | | | 58,939 | |
| | Total | | $ | 105,928 | |
| | f) | Accounting for Uncertainty in Income Taxes – Management has evaluated all open tax years and has determined there is no impact to the Fund’s financial statements related to uncertain tax positions. Generally, tax authorities can examine all tax returns filed for the last three years. |
| a) | Investment Management Agreement – Hartford Investment Financial Services, LLC (“HIFSCO”) serves as investment manager to the Fund pursuant to an Investment Management Agreement with the Company. As investment manager, HIFSCO has overall investment supervisory responsibility for the Fund. In addition, HIFSCO provides administrative personnel, services, equipment, facilities and office space for proper operation of the Fund. HIFSCO has contracted with Hartford Investment Management and Wellington for the provision of day-to-day investment management services to the Fund in accordance with the Fund’s investment objective and policies. The Fund pays a fee to HIFSCO, a portion of which may be used to compensate Hartford Investment Management and Wellington. |
| | The schedule below reflects the rates of compensation paid to HIFSCO for investment management services rendered during the six-month period ended April 30, 2010; the rates are accrued daily and paid monthly: |
| Average Daily Net Assets | Annual Fee |
| On first $100 million | 0.90% |
| On next $150 million | 0.80% |
| On next $250 million | 0.70% |
| On next $4.5 billion | 0.65% |
| On next $5 billion | 0.63% |
| Over $10 billion | 0.62% |
| b) | Accounting Services Agreement – Pursuant to the Fund Accounting Agreement between Hartford Life Insurance Company (“HLIC”) and the Fund, HLIC provides accounting services to the Fund and receives monthly compensation on the Fund’s average net assets. The Fund’s accounting services fees are accrued daily and paid monthly. |
| Average Daily Net Assets | Annual Fee |
| On first $5 billion | 0.016% |
| On next $5 billion | 0.014% |
| Over $10 billion | 0.012% |
| c) | Operating Expenses – Allocable expenses incurred by the Company are allocated to each Fund and allocated to classes within the Fund in proportion to the average daily net assets of the Fund and each class, except where allocation of certain expenses is more fairly made directly to the Fund or to specific classes within a Fund. During the six-month period ended April 30, 2010, HIFSCO has contractually limited the total operating expenses of this Fund, exclusive of taxes, interest expense, brokerage commissions, certain distribution expenses and extraordinary expenses as follows: |
| Class A | Class B | Class C | Class I | Class L | Class R3 | Class R4 | Class R5 | Class Y |
| 1.40% | 2.15% | 2.15% | 1.15% | 1.25% | 1.65% | 1.35% | 1.05% | 1.05% |
| d) | Fees Paid Indirectly – The Fund has entered into agreements with State Street Global Markets, LLC and Russell Implementation Services Inc. to partially recapture non-discounted trade commissions. Such rebates are used to pay a portion of the Fund’s expenses. In addition, the Fund’s custodian bank has also agreed to reduce its fees when the Fund maintains cash on deposit in a non-interest-bearing custody account. For the six-month period ended April 30, 2010, these amounts are included in the Statement of Operations. |
| | The ratio of expenses to average net assets in the accompanying financial highlights excludes the reduction in expenses related to fees paid indirectly. Had the fees paid indirectly been included, the annualized expense ratio for the periods listed below would have been as follows: |
| | | Annualized Six-Month Period Ended April 30, 2010 | | Year Ended October 31, 2009 | | Year Ended October 31, 2008 | | Year Ended October 31, 2007 | | Year Ended October 31, 2006 | | Year Ended October 31, 2005 |
| Class A Shares | | | 1.40 | % | | | 1.07 | % | | | 1.20 | % | | | 1.30 | % | | | 1.34 | % | | | 1.38 | % |
| Class B Shares | | | 2.15 | | | | 1.49 | | | | 1.83 | | | | 2.00 | | | | 2.00 | | | | 2.13 | |
| Class C Shares | | | 2.15 | | | | 1.86 | | | | 2.10 | | | | 2.14 | | | | 2.13 | | | | 2.13 | |
| Class I Shares | | | 1.15 | | | | 1.08 | | | | 1.15 | | | | 1.15 | | | | 1.15 | * | | | | |
| Class L Shares | | | 1.23 | | | | 1.24 | | | | 1.12 | | | | 1.15 | | | | 1.13 | | | | 1.20 | |
| Class R3 Shares | | | 1.65 | | | | 1.64 | | | | 1.46 | | | | 1.65 | † | | | | | | | | |
| Class R4 Shares | | | 1.35 | | | | 1.34 | | | | 1.28 | | | | 1.35 | † | | | | | | | | |
| Class R5 Shares | | | 1.05 | | | | 1.04 | | | | 1.03 | | | | 1.05 | † | | | | | | | | |
| Class Y Shares | | | 0.99 | | | | 1.02 | | | | 0.89 | | | | 0.93 | | | | 0.90 | | | | 0.97 | |
| | * From August 31, 2006 (commencement of operations), through October 31, 2006. |
| | † From December 22, 2006 (commencement of operations), through October 31, 2007. |
| The Hartford SmallCap Growth Fund |
Notes to Financial Statements – (continued)
April 30, 2010 (Unaudited)
| e) | Distribution and Service Plan for Class A, B, C, L, R3 and R4 Shares – HIFSCO is the principal underwriter and distributor of the Fund. HIFSCO is engaged in distribution activities, which include marketing and distribution of shares through broker-dealers, financing distribution costs and maintaining financial books and records. For the six-month period ended April 30, 2010, HIFSCO received front-end load sales charges of $81 and contingent deferred sales charges of $8 from the Fund. |
The Fund has adopted a Distribution and Service Plan in accordance with Rule 12b-1 of the Investment Company Act of 1940, as amended, to compensate the distributor (HIFSCO) for activities intended to result in the sale and distribution of Classes A, B, C, L, R3 and R4 shares and for providing services for shareholders. The Rule 12b-1 plan applicable to Class A shares of the Fund provides for payment of a Rule 12b-1 fee of up to 0.35% of average daily net assets; however, the Board of Directors has currently authorized 12b-1 payments of up to 0.25%. Some or all of the fee may be used for shareholder servicing expenses with the remainder used for distribution expenses. Some or the entire Rule 12b-1 fee for Class B shares may be remitted to broker-dealers for distribution and/or shareholder account services. Under the Class B Plan, the Fund pays the distributor 1.00% of the average daily net assets of Class B shares that are outstanding for 8 years or less, 0.25% of which is a fee for services provided to existing shareholders with the remainder used for distribution expenses. After eight years, Class B shares convert to Class A shares. Upon conversion to Class A shares, the Class A plan described above will apply to those shares. Under the Class C Plan, the Fund pays the distributor 1.00% of the average daily net assets of Class C shares outstanding, 0.25% of which is intended as a fee for services provided to existing shareholders with the remainder used for distribution expenses. For Class C shares, some or the entire fee may be remitted to broker-dealers for distribution and/or shareholder account services. Class L has a distribution fee of 0.25%. Class R3 shares have a distribution fee of 0.50% and Class R4 shares have a distribution fee of 0.25%. For Classes R3 and R4 shares, some or the entire fee may be remitted to broker dealers for distribution and/or shareholder account services. The Fund’s 12b-1 fees are accrued daily and paid monthly.
For the six-month period ended April 30, 2010, total sales commissions paid to affiliated brokers/dealers of The Hartford for distributing the Fund’s shares were $21. These commissions are in turn paid to sales representatives of the broker/dealers.
| f) | Other Related Party Transactions – Certain officers of the Fund are directors and/or officers of HIFSCO and/or The Hartford or its subsidiaries. For the six-month period ended April 30, 2010, a portion of the Fund’s chief compliance officer’s salary was paid by all the investment companies in the Hartford fund complex. The portion allocated to the Fund rounds to zero. Hartford Administrative Services Company (“HASCO”), an indirect wholly owned subsidiary of The Hartford, provides transfer agent services to the Fund. HASCO has contractually agreed to reimburse any portion of the transfer agency fees over 0.30% of average daily net assets per fiscal year for all classes. HASCO was compensated $124 for providing such services. These fees are accrued daily and paid monthly. |
Administrative services fees are paid to HASCO for third-party recordkeeping services that are payable as a percentage of net assets in the amount of 0.20%, 0.15% and 0.10% for Classes R3, R4 and R5 shares, respectively. The total administrative services fees are shown on the Statement of Operations. These fees are accrued daily and paid monthly.
| g) | Payments from Affiliate – The total return in the accompanying financial highlights includes payment from affiliates. Had the payment from affiliates been excluded, the total return for the periods listed below would have been as follows: |
| | Impact from Payment from Affiliate for SEC Settlement for the Year Ended October 31, 2007 | | Total Return Excluding Payment from Affiliate for the Year Ended October 31, 2007 |
| Class A | 0.01% | | 7.17% |
| Class B | 0.01 | | 6.43 |
| Class C | 0.01 | | 6.33 |
| Class I | 0.01 | | 7.36 |
| Class L | 0.01 | | 7.40 |
| Class Y | 0.01 | | 7.60 |
6. | Investment Transactions: |
For the six-month period ended April 30, 2010, the Fund's aggregate purchases and sales of investment securities (excluding short-term investments) were as follows:
| | | | Amount | |
| | Cost of Purchases Excluding U.S. Government Obligations | | $ | 54,383 | |
| | Sales Proceeds Excluding U.S. Government Obligations | | | 66,291 | |
7. | Capital Share Transactions: |
The following information is for the six-month period ended April 30, 2010 and the year ended October 31, 2009:
| | | For the Six-Month Period Ended April 30, 2010 | | | For the Year Ended October 31, 2009 | |
| | | Shares Sold | | | Shares Issued for Reinvested Dividends | | | Shares Redeemed | | | Shares Issued from Merger | | | Net Increase (Decrease) of Shares | | | Shares Sold | | | Shares Issued for Reinvested Dividends | | | Shares Redeemed | | | Shares Issued from Merger | | | Net Increase (Decrease) of Shares | |
| Class A | | | | | | | | | | | | | | | | | | | | | | | | | | | | | | | | | | | | | | | | |
Shares | | | 164 | | | | — | | | | (300 | ) | | | — | | | | (136 | ) | | | 442 | | | | — | | | | (2,477 | ) | | | — | | | | (2,035 | ) |
Amount | | $ | 3,804 | | | $ | — | | | $ | (6,983 | ) | | $ | — | | | $ | (3,179 | ) | | $ | 7,726 | | | $ | — | | | $ | (44,695 | ) | | $ | — | | | $ | (36,969 | ) |
| Class B | | | | | | | | | | | | | | | | | | | | | | | | | | | | | | | | | | | | | | | | |
Shares | | | 3 | | | | — | | | | (49 | ) | | | — | | | | (46 | ) | | | 40 | | | | — | | | | (124 | ) | | | — | | | | (84 | ) |
Amount | | $ | 51 | | | $ | — | | | $ | (991 | ) | | $ | — | | | $ | (940 | ) | | $ | 630 | | | $ | — | | | $ | (1,876 | ) | | $ | — | | | $ | (1,246 | ) |
| Class C | | | | | | | | | | | | | | | | | | | | | | | | | | | | | | | | | | | | | | | | |
Shares | | | 51 | | | | — | | | | (91 | ) | | | — | | | | (40 | ) | | | 121 | | | | — | | | | (217 | ) | | | — | | | | (96 | ) |
Amount | | $ | 1,045 | | | $ | — | | | $ | (1,812 | ) | | $ | — | | | $ | (767 | ) | | $ | 1,807 | | | $ | — | | | $ | (3,277 | ) | | $ | — | | | $ | (1,470 | ) |
| Class I | | | | | | | | | | | | | | | | | | | | | | | | | | | | | | | | | | | | | | | | |
Shares | | | 23 | | | | — | | | | (32 | ) | | | — | | | | (9 | ) | | | 114 | | | | — | | | | (67 | ) | | | — | | | | 47 | |
Amount | | $ | 524 | | | $ | — | | | $ | (761 | ) | | $ | — | | | $ | (237 | ) | | $ | 2,031 | | | $ | — | | | $ | (1,168 | ) | | $ | — | | | $ | 863 | |
| Class L | | | | | | | | | | | | | | | | | | | | | | | | | | | | | | | | | | | | | | | | |
Shares | | | 51 | | | | — | | | | (293 | ) | | | — | | | | (242 | ) | | | 125 | | | | — | | | | (495 | ) | | | — | | | | (370 | ) |
Amount | | $ | 1,199 | | | $ | — | | | $ | (6,860 | ) | | $ | — | | | $ | (5,661 | ) | | $ | 2,190 | | | $ | — | | | $ | (8,745 | ) | | $ | — | | | $ | (6,555 | ) |
| Class R3 | | | | | | | | | | | | | | | | | | | | | | | | | | | | | | | | | | | | | | | | |
Shares | | | 3 | | | | — | | | | (1 | ) | | | — | | | | 2 | | | | 10 | | | | — | | | | (1 | ) | | | — | | | | 9 | |
Amount | | $ | 76 | | | $ | — | | | $ | (36 | ) | | $ | — | | | $ | 40 | | | $ | 156 | | | $ | — | | | $ | (25 | ) | | $ | — | | | $ | 131 | |
| Class R4 | | | | | | | | | | | | | | | | | | | | | | | | | | | | | | | | | | | | | | | | |
Shares | | | 14 | | | | — | | | | (11 | ) | | | — | | | | 3 | | | | 44 | | | | — | | | | (23 | ) | | | — | | | | 21 | |
Amount | | $ | 340 | | | $ | — | | | $ | (244 | ) | | $ | — | | | $ | 96 | | | $ | 845 | | | $ | — | | | $ | (450 | ) | | $ | — | | | $ | 395 | |
| Class R5 | | | | | | | | | | | | | | | | | | | | | | | | | | | | | | | | | | | | | | | | |
Shares | | | 8 | | | | — | | | | (11 | ) | | | — | | | | (3 | ) | | | 66 | | | | — | | | | (5 | ) | | | — | | | | 61 | |
Amount | | $ | 208 | | | $ | — | | | $ | (275 | ) | | $ | — | | | $ | (67 | ) | | $ | 1,100 | | | $ | — | | | $ | (94 | ) | | $ | — | | | $ | 1,006 | |
| Class Y | | | | | | | | | | | | | | | | | | | | | | | | | | | | | | | | | | | | | | | | |
Shares | | | 34 | | | | — | | | | (106 | ) | | | — | | | | (72 | ) | | | 178 | | | | — | | | | (1,391 | ) | | | — | | | | (1,213 | ) |
Amount | | $ | 819 | | | $ | — | | | $ | (2,661 | ) | | $ | — | | | $ | (1,842 | ) | | $ | 3,178 | | | $ | — | | | $ | (22,517 | ) | | $ | — | | | $ | (19,339 | ) |
| The Hartford SmallCap Growth Fund |
Notes to Financial Statements – (continued)
April 30, 2010 (Unaudited)
The following reflects the conversion of Class B Shares into Class A Shares (reflected as Class A Shares issued) for the six-month period ended April 30, 2010 and the year ended October 31, 2009:
| | | | Shares | | | Dollars | |
| | For the Six-Month Period Ended April 30, 2010 | | | 6 | | | $ | 158 | |
| | For the Year Ended October 31, 2009 | | | 11 | | | $ | 191 | |
The Fund is one of several Hartford Funds that participate in a $500 million committed revolving line of credit facility. The facility is to be used for temporary or emergency purposes. Under the arrangement, the Fund is required to own securities having a market value in excess of 300% of the total bank borrowings. The interest rate on borrowings varies depending on the nature of the loan. The facility also requires a fee to be paid based on the amount of the commitment. This fee is allocated to all the Funds participating in the line of credit based on the average net assets of the Funds. During the six-month period ended April 30, 2010, the Fund did not have any borrowings under this facility.
9. | Industry Classifications: |
Other than the industry classifications “Other Investment Pools and Funds” and “Exchange Traded Funds”, equity industry classifications used in this report are the Global Industry Classification Standard, which was developed by and is the exclusive property and service mark of MSCI, Inc. and Standard & Poor’s.
10. Subsequent Events:
Management has evaluated subsequent events and determined that no additional items require recording or disclosure.
[This page intentionally left blank]
| The Hartford SmallCap Growth Fund |
| Class | | Net Asset Value at Beginning of Period | | | Net Investment Income (Loss) | | | Payments from (to) Affiliate | | | Net Realized and Unrealized Gain (Loss) on Investments | | | Total from Investment Operations | | | Dividends from Net Investment Income | | | Distributions from Realized Capital Gains | | | Distributions from Capital | | | Total Distributions | | | Net Increase (Decrease) in Net Asset Value | | | Net Asset Value at and of Period | |
| | | | | | | | | | | | | | | | | |
| For the Six-Month Period Ended April 30, 2010 (Unaudited) | | | | | | | | | | | | | | | | |
| A | | $ | 20.45 | | | $ | (0.07 | ) | | $ | – | | | $ | 5.37 | | | $ | 5.30 | | | $ | – | | | $ | – | | | $ | – | | | $ | – | | | $ | 5.30 | | | $ | 25.75 | |
| B | | | 17.78 | | | | (0.14 | ) | | | – | | | | 4.66 | | | | 4.52 | | | | – | | | | – | | | | – | | | | – | | | | 4.52 | | | | 22.30 | |
| C | | | 17.60 | | | | (0.13 | ) | | | – | | | | 4.62 | | | | 4.49 | | | | – | | | | – | | | | – | | | | – | | | | 4.49 | | | | 22.09 | |
| I | | | 20.50 | | | | (0.04 | ) | | | – | | | | 5.39 | | | | 5.35 | | | | – | | | | – | | | | – | | | | – | | | | 5.35 | | | | 25.85 | |
| L | | | 20.56 | | | | (0.05 | ) | | | – | | | | 5.41 | | | | 5.36 | | | | – | | | | – | | | | – | | | | – | | | | 5.36 | | | | 25.92 | |
| R3 | | | 20.71 | | | | (0.10 | ) | | | – | | | | 5.44 | | | | 5.34 | | | | – | | | | – | | | | – | | | | – | | | | 5.34 | | | | 26.05 | |
| R4 | | | 20.84 | | | | (0.06 | ) | | | – | | | | 5.47 | | | | 5.41 | | | | – | | | | – | | | | – | | | | – | | | | 5.41 | | | | 26.25 | |
| R5 | | | 21.02 | | | | (0.03 | ) | | | – | | | | 5.53 | | | | 5.50 | | | | – | | | | – | | | | – | | | | – | | | | 5.50 | | | | 26.52 | |
| Y | | | 21.06 | | | | (0.02 | ) | | | – | | | | 5.54 | | | | 5.52 | | | | – | | | | – | | | | – | | | | – | | | | 5.52 | | | | 26.58 | |
| | | | | | | | | | | | | | | | | | | | | | | | | | |
| For the Year Ended October 31, 2009 | | | | | | | | | | | | | | | | | | | | | | | | | |
| A | | | 18.47 | | | | (0.05 | ) | | | – | | | | 2.03 | | | | 1.98 | | | | – | | | | – | | | | – | | | | – | | | | 1.98 | | | | 20.45 | |
| B | | | 16.13 | | | | (0.11 | ) | | | – | | | | 1.76 | | | | 1.65 | | | | – | | | | – | | | | – | | | | – | | | | 1.65 | | | | 17.78 | |
| C | | | 16.03 | | | | (0.17 | ) | | | – | | | | 1.74 | | | | 1.57 | | | | – | | | | – | | | | – | | | | – | | | | 1.57 | | | | 17.60 | |
| I | | | 18.53 | | | | (0.05 | ) | | | – | | | | 2.02 | | | | 1.97 | | | | – | | | | – | | | | – | | | | – | | | | 1.97 | | | | 20.50 | |
| L | | | 18.62 | | | | (0.08 | ) | | | – | | | | 2.02 | | | | 1.94 | | | | – | | | | – | | | | – | | | | – | | | | 1.94 | | | | 20.56 | |
| R3 | | | 18.79 | | | | (0.11 | ) | | | – | | | | 2.03 | | | | 1.92 | | | | – | | | | – | | | | – | | | | – | | | | 1.92 | | | | 20.71 | |
| R4 | | | 18.88 | | | | (0.09 | ) | | | – | | | | 2.05 | | | | 1.96 | | | | – | | | | – | | | | – | | | | – | | | | 1.96 | | | | 20.84 | |
| R5 | | | 18.99 | | | | (0.05 | ) | | | – | | | | 2.08 | | | | 2.03 | | | | – | | | | – | | | | – | | | | – | | | | 2.03 | | | | 21.02 | |
| Y | | | 19.03 | | | | 0.01 | | | | – | | | | 2.02 | | | | 2.03 | | | | – | | | | – | | | | – | | | | – | | | | 2.03 | | | | 21.06 | |
| | | | | | | | | | | | | | | | | | | | | | | | | | |
| For the Year Ended October 31, 2008 | | | | | | | | | | | | | | | | | | | | | | | | | |
| A | | | 33.57 | | | | (0.07 | ) | | | – | | | | (11.68 | ) | | | (11.75 | ) | | | – | | | | (3.35 | ) | | | – | | | | (3.35 | ) | | | (15.10 | ) | | | 18.47 | |
| B | | | 29.93 | | | | (0.21 | ) | | | – | | | | (10.24 | ) | | | (10.45 | ) | | | – | | | | (3.35 | ) | | | – | | | | (3.35 | ) | | | (13.80 | ) | | | 16.13 | |
| C | | | 29.85 | | | | (0.29 | ) | | | – | | | | (10.18 | ) | | | (10.47 | ) | | | – | | | | (3.35 | ) | | | – | | | | (3.35 | ) | | | (13.82 | ) | | | 16.03 | |
| I | | | 33.64 | | | | (0.04 | ) | | | – | | | | (11.72 | ) | | | (11.76 | ) | | | – | | | | (3.35 | ) | | | – | | | | (3.35 | ) | | | (15.11 | ) | | | 18.53 | |
| L | | | 33.78 | | | | (0.05 | ) | | | – | | | | (11.76 | ) | | | (11.81 | ) | | | – | | | | (3.35 | ) | | | – | | | | (3.35 | ) | | | (15.16 | ) | | | 18.62 | |
| R3 | | | 34.16 | | | | (0.12 | ) | | | – | | | | (11.90 | ) | | | (12.02 | ) | | | – | | | | (3.35 | ) | | | – | | | | (3.35 | ) | | | (15.37 | ) | | | 18.79 | |
| R4 | | | 34.26 | | | | (0.06 | ) | | | – | | | | (11.97 | ) | | | (12.03 | ) | | | – | | | | (3.35 | ) | | | – | | | | (3.35 | ) | | | (15.38 | ) | | | 18.88 | |
| R5 | | | 34.34 | | | | (0.02 | ) | | | – | | | | (11.98 | ) | | | (12.00 | ) | | | – | | | | (3.35 | ) | | | – | | | | (3.35 | ) | | | (15.35 | ) | | | 18.99 | |
| Y | | | 34.38 | | | | 0.02 | | | | – | | | | (12.02 | ) | | | (12.00 | ) | | | – | | | | (3.35 | ) | | | – | | | | (3.35 | ) | | | (15.35 | ) | | | 19.03 | |
| | | | | | | | | | | | | | | | | | | | | | | | | | |
| For the Year Ended October 31, 2007 | | | | | | | | | | | | | | | | | | | | | | | | | |
| A | | | 31.32 | | | | (0.13 | ) | | | – | | | | 2.38 | | | | 2.25 | | | | – | | | | – | | | | – | | | | – | | | | 2.25 | | | | 33.57 | |
| B | | | 28.12 | | | | (0.31 | ) | | | – | | | | 2.12 | | | | 1.81 | | | | – | | | | – | | | | – | | | | – | | | | 1.81 | | | | 29.93 | |
| C | | | 28.07 | | | | (0.35 | ) | | | – | | | | 2.13 | | | | 1.78 | | | | – | | | | – | | | | – | | | | – | | | | 1.78 | | | | 29.85 | |
| I | | | 31.33 | | | | (0.03 | ) | | | – | | | | 2.34 | | | | 2.31 | | | | – | | | | – | | | | – | | | | – | | | | 2.31 | | | | 33.64 | |
| L(H) | | | 31.45 | | | | (0.13 | ) | | | – | | | | 2.46 | | | | 2.33 | | | | – | | | | – | | | | – | | | | – | | | | 2.33 | | | | 33.78 | |
| R3(I) | | | 32.34 | | | | (0.19 | ) | | | – | | | | 2.01 | | | | 1.82 | | | | – | | | | – | | | | – | | | | – | | | | 1.82 | | | | 34.16 | |
| R4(I) | | | 32.34 | | | | (0.02 | ) | | | – | | | | 1.94 | | | | 1.92 | | | | – | | | | – | | | | – | | | | – | | | | 1.92 | | | | 34.26 | |
| R5(I) | | | 32.34 | | | | (0.01 | ) | | | – | | | | 2.01 | | | | 2.00 | | | | – | | | | – | | | | – | | | | – | | | | 2.00 | | | | 34.34 | |
| Y | | | 31.95 | | | | 0.02 | | | | – | | | | 2.41 | | | | 2.43 | | | | – | | | | – | | | | – | | | | – | | | | 2.43 | | | | 34.38 | |
| | | | | | | | | | | | | | | | | | | | | | | | | | |
| For the Year Ended October 31, 2006 | | | | | | | | | | | | | | | | | | | | | | | | | |
| A | | | 28.30 | | | | (0.06 | ) | | | – | | | | 3.08 | | | | 3.02 | | | | – | | | | – | | | | – | | | | – | | | | 3.02 | | | | 31.32 | |
| B | | | 25.57 | | | | (0.26 | ) | | | – | | | | 2.81 | | | | 2.55 | | | | – | | | | – | | | | – | | | | – | | | | 2.55 | | | | 28.12 | |
| C | | | 25.56 | | | | (0.27 | ) | | | – | | | | 2.78 | | | | 2.51 | | | | – | | | | – | | | | – | | | | – | | | | 2.51 | | | | 28.07 | |
| I(J) | | | 28.90 | | | | (0.01 | ) | | | – | | | | 2.44 | | | | 2.43 | | | | – | | | | – | | | | – | | | | – | | | | 2.43 | | | | 31.33 | |
| L | | | 28.36 | | | | (0.02 | ) | | | – | | | | 3.11 | | | | 3.09 | | | | – | | | | – | | | | – | | | | – | | | | 3.09 | | | | 31.45 | |
| Y | | | 28.74 | | | | 0.04 | | | | – | | | | 3.17 | | | | 3.21 | | | | – | | | | – | | | | – | | | | – | | | | 3.21 | | | | 31.95 | |
| | | | | | | | | | | | | | | | | | | | | | | | | | |
| For the Year Ended October 31, 2005 | | | | | | | | | | | | | | | | | | | | | | | | | |
| A | | | 24.60 | | | | (0.15 | ) | | | – | | | | 3.85 | | | | 3.70 | | | | – | | | | – | | | | – | | | | – | | | | 3.70 | | | | 28.30 | |
| B | | | 22.39 | | | | (0.32 | ) | | | – | | | | 3.50 | | | | 3.18 | | | | – | | | | – | | | | – | | | | – | | | | 3.18 | | | | 25.57 | |
| C | | | 22.39 | | | | (0.28 | ) | | | – | | | | 3.45 | | | | 3.17 | | | | – | | | | – | | | | – | | | | – | | | | 3.17 | | | | 25.56 | |
| L | | | 24.60 | | | | (0.13 | ) | | | – | | | | 3.89 | | | | 3.76 | | | | – | | | | – | | | | – | | | | – | | | | 3.76 | | | | 28.36 | |
| Y | | | 24.88 | | | | (0.04 | ) | | | – | | | | 3.90 | | | | 3.86 | | | | – | | | | – | | | | – | | | | – | | | | 3.86 | | | | 28.74 | |
| |
| - Ratios and Supplemental Data - |
| Total Return(B) | | Net Assets at End of Period (000's) | | Ratio of Expenses to Average Net Assets Before Waivers and Reimbursements and Including Expenses not Subject to Cap(C) | | Ratio of Expenses to Average Net Assets After Waivers and Reimbursements and Including Expenses not Subject to Cap(C) | | Ratio of Expenses to Average Net Assets After Waivers and Reimbursements and Excluding Expenses not Subject to Cap(C) | | Ratio of Net Investment Income to Average Net Assets | | Portfolio Turnover Rate(D) |
| | | | | | | | | | | | | | | | | | | | |
| | | | | | | | | | | | | | | | | | | | |
| | 25.92 | %(E) | | $ | 53,196 | | | | 1.64 | %(F) | | | 1.40 | %(F) | | | 1.40 | %(F) | | | (0.56 | )%(F) | | | 33 | % |
| | 25.42 | (E) | | | 9,060 | | | | 2.62 | (F) | | | 2.15 | (F) | | | 2.15 | (F) | | | (1.31 | ) (F) | | | – | |
| | 25.51 | (E) | | | 11,409 | | | | 2.37 | (F) | | | 2.15 | (F) | | | 2.15 | (F) | | | (1.32 | ) (F) | | | – | |
| | 26.10 | (E) | | | 5,388 | | | | 1.26 | (F) | | | 1.15 | (F) | | | 1.15 | (F) | | | (0.31 | ) (F) | | | – | |
| | 26.07 | (E) | | | 87,920 | | | | 1.24 | (F) | | | 1.23 | (F) | | | 1.23 | (F) | | | (0.39 | ) (F) | | | – | |
| | 25.78 | (E) | | | 287 | | | | 1.80 | (F) | | | 1.65 | (F) | | | 1.65 | (F) | | | (0.84 | ) (F) | | | – | |
| | 25.96 | (E) | | | 2,444 | | | | 1.40 | (F) | | | 1.35 | (F) | | | 1.35 | (F) | | | (0.52 | ) (F) | | | – | |
| | 26.17 | (E) | | | 1,600 | | | | 1.09 | (F) | | | 1.05 | (F) | | | 1.05 | (F) | | | (0.22 | ) (F) | | | – | |
| | 26.21 | (E) | | | 8,232 | | | | 0.99 | (F) | | | 0.99 | (F) | | | 0.99 | (F) | | | (0.15 | ) (F) | | | – | |
| | | | | | | | | | | | | | | | | | | | | | | | | | | |
| | | | | | | | | | | | | | | | | | | | | | | | | | | |
| | 10.72 | | | | 45,036 | | | | 1.89 | | | | 1.07 | | | | 1.07 | | | | (0.26 | ) | | | 84 | |
| | 10.23 | | | | 8,042 | | | | 2.97 | | | | 1.50 | | | | 1.50 | | | | (0.68 | ) | | | – | |
| | 9.79 | | | | 9,800 | | | | 2.60 | | | | 1.87 | | | | 1.87 | | | | (1.05 | ) | | | – | |
| | 10.63 | | | | 4,456 | | | | 1.37 | | | | 1.08 | | | | 1.08 | | | | (0.28 | ) | | | – | |
| | 10.42 | | | | 74,731 | | | | 1.27 | | | | 1.25 | | | | 1.25 | | | | (0.44 | ) | | | – | |
| | 10.22 | | | | 192 | | | | 1.85 | | | | 1.65 | | | | 1.65 | | | | (0.91 | ) | | | – | |
| | 10.38 | | | | 1,868 | | | | 1.42 | | | | 1.35 | | | | 1.35 | | | | (0.54 | ) | | | – | |
| | 10.69 | | | | 1,321 | | | | 1.12 | | | | 1.05 | | | | 1.05 | | | | (0.34 | ) | | | – | |
| | 10.67 | | | | 8,042 | | | | 1.02 | | | | 1.02 | | | | 1.02 | | | | 0.04 | | | | – | |
| | | | | | | | | | | | | | | | | | | | | | | | | | | |
| | | | | | | | | | | | | | | | | | | | | | | | | | | |
| | (38.35 | ) | | | 78,279 | | | | 1.64 | | | | 1.20 | | | | 1.20 | | | | (0.25 | ) | | | 103 | |
| | (38.71 | ) | | | 8,645 | | | | 2.51 | | | | 1.83 | | | | 1.83 | | | | (0.88 | ) | | | – | |
| | (38.90 | ) | | | 10,472 | | | | 2.25 | | | | 2.10 | | | | 2.10 | | | | (1.14 | ) | | | – | |
| | (38.29 | ) | | | 3,159 | | | | 1.17 | | | | 1.15 | | | | 1.15 | | | | (0.21 | ) | | | – | |
| | (38.28 | ) | | | 74,539 | | | | 1.14 | | | | 1.12 | | | | 1.12 | | | | (0.17 | ) | | | – | |
| | (38.49 | ) | | | 9 | | | | 2.08 | | | | 1.46 | | | | 1.46 | | | | (0.52 | ) | | | – | |
| | (38.40 | ) | | | 1,298 | | | | 1.28 | | | | 1.28 | | | | 1.28 | | | | (0.39 | ) | | | – | |
| | (38.20 | ) | | | 44 | | | | 1.03 | | | | 1.03 | | | | 1.03 | | | | (0.14 | ) | | | – | |
| | (38.15 | ) | | | 30,361 | | | | 0.89 | | | | 0.89 | | | | 0.89 | | | | 0.06 | | | | – | |
| | | | | | | | | | | | | | | | | | | | | | | | | | | |
| | | | | | | | | | | | | | | | | | | | | | | | | | | |
| | 7.18 | (G) | | | 162,102 | | | | 1.62 | | | | 1.31 | | | | 1.31 | | | | (0.26 | ) | | | 105 | |
| | 6.44 | (G) | | | 17,352 | | | | 2.42 | | | | 2.00 | | | | 2.00 | | | | (0.95 | ) | | | – | |
| | 6.34 | (G) | | | 23,778 | | | | 2.21 | | | | 2.15 | | | | 2.15 | | | | (1.10 | ) | | | – | |
| | 7.37 | (G) | | | 4,614 | | | | 1.21 | | | | 1.15 | | | | 1.15 | | | | (0.17 | ) | | | – | |
| | 7.41 | (G) | | | 137,702 | | | | 1.17 | | | | 1.15 | | | | 1.15 | | | | (0.37 | ) | | | – | |
| | 5.63 | (E) | | | 11 | | | | 1.69 | (F) | | | 1.65 | (F) | | | 1.65 | (F) | | | (0.65 | ) (F) | | | – | |
| | 5.94 | (E) | | | 309 | | | | 1.40 | (F) | | | 1.35 | (F) | | | 1.35 | (F) | | | (0.43 | ) (F) | | | – | |
| | 6.18 | (E) | | | 11 | | | | 1.09 | (F) | | | 1.05 | (F) | | | 1.05 | (F) | | | (0.05 | ) (F) | | | – | |
| | 7.61 | (G) | | | 46,466 | | | | 0.93 | | | | 0.93 | | | | 0.93 | | | | 0.12 | | | | – | |
| | | | | | | | | | | | | | | | | | | | | | | | | | | |
| | | | | | | | | | | | | | | | | | | | | | | | | | | |
| | 10.67 | | | | 228,776 | | | | 1.56 | | | | 1.36 | | | | 1.36 | | | | (0.30 | ) | | | 86 | |
| | 9.97 | | | | 19,078 | | | | 2.39 | | | | 2.02 | | | | 2.02 | | | | (0.95 | ) | | | – | |
| | 9.82 | | | | 24,070 | | | | 2.25 | | | | 2.15 | | | | 2.15 | | | | (1.08 | ) | | | – | |
| | 8.41 | (E) | | | 239 | | | | 1.28 | (F) | | | 1.15 | (F) | | | 1.15 | (F) | | | (0.43 | ) (F) | | | – | |
| | 10.90 | | | | 118,452 | | | | 1.15 | | | | 1.15 | | | | 1.15 | | | | (0.08 | ) | | | – | |
| | 11.17 | | | | 107,906 | | | | 0.92 | | | | 0.92 | | | | 0.92 | | | | 0.15 | | | | – | |
| | | | | | | | | | | | | | | | | | | | | | | | | | | |
| | | | | | | | | | | | | | | | | | | | | | | | | | | |
| | 15.04 | | | | 66,403 | | | | 1.62 | | | | 1.40 | | | | 1.40 | | | | (0.65 | ) | | | 81 | |
| | 14.20 | | | | 16,230 | | | | 2.51 | | | | 2.15 | | | | 2.15 | | | | (1.40 | ) | | | – | |
| | 14.16 | | | | 15,668 | | | | 2.33 | | | | 2.15 | | | | 2.15 | | | | (1.40 | ) | | | – | |
| | 15.28 | | | | 119,114 | | | | 1.21 | | | | 1.21 | | | | 1.21 | | | | (0.46 | ) | | | – | |
| | 15.52 | | | | 55,933 | | | | 0.98 | | | | 0.98 | | | | 0.98 | | | | (0.23 | ) | | | – | |
| The Hartford SmallCap Growth Fund |
Financial Highlights – (continued)
| (A) | Information presented relates to a share outstanding throughout the indicated period. |
| (B) | Assumes initial investment at net asset value at the beginning of each period, reinvestment of all distributions, the complete redemption of the investment at net asset value at the end of each period and no sales charge. Total return would be reduced if sales charges were taken into account. |
| (C) | Ratios do not include fees paid indirectly (See Expenses in the accompanying Notes to Financial Statements). |
| (D) | Portfolio turnover rate is calculated on the basis of the Fund as a whole without distinguishing between the classes of shares issued. |
| (G) | Total return without the inclusion of the Payments from (to) Affiliate, can be found in Expenses in the accompanying Notes to Financial Statements. |
| (H) | Classes H, M and N were merged into Class L on February 9, 2007. |
| (I) | Commenced operations on December 22, 2006. |
| (J) | Commenced operations on August 31, 2006. |
| The Hartford SmallCap Growth Fund |
The Board of Directors appoints officers who are responsible for the day-to-day operations of the Fund and who execute policies formulated by the Directors. Each director serves until his or her death, resignation, or retirement or until the next annual meeting of shareholders is held or until his or her successor is elected and qualifies.
Directors and officers who are employed by or who have a financial interest in The Hartford are considered “interested” persons of the Fund pursuant to the Investment Company Act of 1940, as amended. Each officer and two of the Funds’ directors, as noted in the chart below, are “interested” persons of the Fund. Each director serves as a director for The Hartford Mutual Funds, Inc., The Hartford Mutual Funds II, Inc., The Hartford Income Shares Fund, Inc., Hartford Series Fund, Inc., and Hartford HLS Series Fund II, Inc., which, as of April 30, 2010, collectively consist of 85 funds. Correspondence may be sent to directors and officers c/o Hartford Mutual Funds, P.O. Box 2999, Hartford, Connecticut 06104-2999, except that correspondence to Ms. Fagely may be sent to 500 Bielenberg Drive, Woodbury, Minnesota 55125.
The table below sets forth, for each director and officer, his or her name, year of birth, current position with the Fund and date first elected or appointed to The Hartford Mutual Funds, Inc. (“MF”) and The Hartford Mutual Funds II, Inc. (“MF2”), principal occupation, and, for directors, other directorships held. The Fund’s statement of additional information contains further information on the directors and is available free of charge by calling 1-888-843-7824 or writing to Hartford Mutual Funds, P.O. Box 64387, St. Paul, MN 55164-0387.
Information on the aggregate remuneration paid to the directors of the Fund can be found in the Statement of Operations herein. The Fund pays to The Hartford a portion of the Chief Compliance Officer’s compensation, but does not pay salaries or compensation to any of its other officers or directors who are employed by The Hartford.
Non-Interested Directors
Lynn S. Birdsong (1946) Director since 2003, Co-Chairman of the Investment Committee
Mr. Birdsong is a private investor. Since 2003, Mr. Birdsong has been an independent director of The Japan Fund. From 2003 to March 2005, Mr. Birdsong was an independent director of the Atlantic Whitehall Funds. From 1979 to 2002, Mr. Birdsong was a managing director of Zurich Scudder Investments, an investment management firm. During his employment with Scudder, Mr. Birdsong was an interested director of The Japan Fund. Since 1981, Mr. Birdsong has been a partner in Birdsong Company, an advertising specialty firm.
Robert M. Gavin, Jr. (1940) Director since 2002 (MF) and 1986 (MF2), Chairman of the Board since 2004
Dr. Gavin is an educational consultant. Prior to September 1, 2001, he was President of Cranbrook Education Community and prior to July 1996, he was President of Macalester College, St. Paul, Minnesota.
Duane E. Hill (1945) Director since 2001 (MF) and 2002 (MF2), Chairman of the Nominating Committee
Mr. Hill is Partner of TSG Ventures L.P., a private equity investment company. Mr. Hill is a former partner of TSG Capital Group, a private equity investment firm that served as sponsor and lead investor in leveraged buyouts of middle market companies.
Sandra S. Jaffee (1941) Director since 2005
Ms. Jaffee served as Chairman (2008 to 2009) and Chief Executive Officer of Fortent (formerly Searchspace Group), a leading provider of compliance/regulatory technology to financial institutions from August 2005 to August 2009. From August 2004 to August 2005, Ms. Jaffee served as an Entrepreneur in Residence with Warburg Pincus, a private equity firm. From September 1995 to July 2004, Ms. Jaffee served as Executive Vice President at Citigroup, where she was President and Chief Executive Officer of Citibank’s Global Securities Services (1995 to 2003).
William P. Johnston (1944) Director since 2005, Chairman of the Compliance Committee
In June 2006, Mr. Johnston was appointed as Senior Advisor to The Carlyle Group, a global private equity investment firm. In July 2006, Mr. Johnston was elected to the Board of Directors of MultiPlan, Inc. In August 2007, Mr. Johnston was elected to the Board of Directors of LifeCare Holdings, Inc. In February 2008, Mr. Johnston was elected to the Board of Directors of HCR-ManorCare, Inc. In May 2006, Mr. Johnston was elected to the Supervisory Board of Fresenius Medical Care AG & Co. KGaA, after its acquisition of Renal Care Group, Inc. in March 2006. Mr. Johnston joined Renal Care Group in November 2002 as a member of the Board of Directors and served as Chairman of the Board from March 2003 through March 2006. From September 1987 to December 2002, Mr. Johnston was with Equitable Securities Corporation (and its successors, SunTrust Equitable Securities and SunTrust Robinson Humphrey) serving in various investment banking and managerial positions, including Managing Director and Head of Investment Banking, Chief Executive Officer and Vice Chairman. Mr. Johnston was a member of the law firm of Waller Lansden Dortch & Davis from 1969 until 1986.
| The Hartford SmallCap Growth Fund |
Directors and Officers (Unaudited) – (continued)
Phillip O. Peterson (1944) Director since 2002 (MF) and 2000 (MF2), Chairman of the Audit Committee
Mr. Peterson is a mutual fund industry consultant. He was a partner of KPMG LLP (an accounting firm) until July 1999. Mr. Peterson joined William Blair Funds in February 2007 as a member of the Board of Trustees. From January 2004 to April 2005, Mr. Peterson served as Independent President of the Strong Mutual Funds.
Lemma W. Senbet (1946) Director since 2005
Dr. Senbet is the William E. Mayer Chair Professor of Finance and Director, Center for Financial Policy, at the University of Maryland, Robert H. Smith School of Business. He was chair of the Finance Department during 1998 to 2006. Previously he was a chaired professor of finance at the University of Wisconsin-Madison. Also, he was director of the Fortis Funds from March 2000 to July 2002. Dr. Senbet served the finance profession in various capacities, including as director of the American Finance Association and President of the Western Finance Association. In 2006, Dr. Senbet was inducted Fellow of Financial Management Association International for his career-long distinguished scholarship and professional service.
Interested Directors and Officers
Lowndes A. Smith (1939) Director since 1996 (MF) and 2002 (MF2), Co-Chairman of the Investment Committee
Mr. Smith served as Vice Chairman of The Hartford from February 1997 to January 2002, as President and Chief Executive Officer of Hartford Life, Inc. from February 1997 to January 2002, and as President and Chief Operating Officer of The Hartford Life Insurance Companies from January 1989 to January 2002. Mr. Smith serves as a Director of White Mountains Insurance Group, Ltd., One Beacon Insurance, Symetra Financial and as a Managing Director of Whittington Gray Associates.
John C. Walters* (1962) Director since 2008
Mr. Walters currently serves as President, Chief Executive Officer and Director for Hartford Life, Inc. (“HL, Inc.”). Mr. Walters also serves as President, Chairman of the Board, Chief Executive Officer and Director for Hartford Life Insurance Company (“Hartford Life”), and as Executive Vice President of The Hartford. In addition, Mr. Walters is a Manager of HL Investment Advisors, LLC (“HL Advisors”). Mr. Walters previously served as President of the U.S. Wealth Management Division of HL, Inc. (2006-2007) and as Co-Chief Operating Officer of Hartford Life (2007-2008).
* Mr. Walters previously served as President and Chief Executive Officer of the Fund (2007 to 2009).
Other Officers
Robert M. Arena, Jr. (1968) President and Chief Executive Officer since 2009 (served as Vice President of the Fund (2006 - - 2009))
Mr. Arena serves as Executive Vice President of Hartford Life. Additionally, Mr. Arena is Senior Vice President and Director of Hartford Administrative Services Company, (“HASCO”), President, Chief Executive Officer and Manager of Hartford Investment Financial Services, LLC (“HIFSCO”) and President, Chief Executive Officer and Manager of HL Advisors. Mr. Arena joined The Hartford in 2004.
Tamara L. Fagely (1958) Vice President, Treasurer and Controller since 2002 (MF) 1993 (MF2)
Ms. Fagely has been a Vice President of HASCO since 1998 and Chief Financial Officer since 2006. Currently Ms. Fagely is a Vice President of Hartford Life. She served as Assistant Vice President of Hartford Life from December 2001 through March 2005. In addition, Ms. Fagely is Controller and Chief Financial Officer of HIFSCO.
Brian Ferrell (1962) AML Compliance Officer since 2008
Mr. Ferrell has served as Assistant Vice President and AML Compliance Officer for The Hartford since 2006, and as AML Compliance Officer for HASCO and Hartford Investor Services Company, LLC (“HISC”) since 2008. Prior to joining The Hartford in 2006, Mr. Ferrell held various positions at the U.S. Department of the Treasury (the “Treasury”) from 2001 to 2006, where he served as Chief Counsel for the Treasury’s Financial Crimes Enforcement Network from 2005 - 2006.
Dr. Robert J. Froehlich (1953) Senior Managing Director since 2009
Dr. Froehlich joined The Hartford as Senior Managing Director in September 2009. Prior to joining The Hartford, Dr. Froehlich served as Vice Chairman of Deutsche Asset Management from 1997 - 2009.
Thomas D. Jones, III (1965) Vice President and Chief Compliance Officer since 2006
Mr. Jones serves as Chief Compliance Officer for the Hartford Mutual Funds and Vice President and Director of Securities Compliance for The Hartford. Mr. Jones joined The Hartford in 2006 from SEI Investments, where he served as Chief Compliance Officer for its mutual funds and investment advisers. Prior to joining SEI, Mr. Jones was First Vice President and Compliance Director for Merrill Lynch Investment Managers (Americas) (“MLIM”), where he worked from 1992-2004.
Edward P. Macdonald (1967) Vice President, Secretary and Chief Legal Officer since 2005
Mr. Macdonald serves as Assistant Vice President of Hartford Life and Chief Legal Officer and Vice President of HIFSCO. He also serves as Vice President and Secretary of HASCO, and Chief Legal Officer, Secretary and Vice President of HL Advisors. Mr. Macdonald joined The Hartford in 2005.
Vernon J. Meyer (1964) Vice President since 2006
Mr. Meyer serves as Senior Vice President of Hartford Life. He also serves as Senior Vice President of HIFSCO and HL Advisors. Mr. Meyer joined The Hartford in 2004.
D. Keith Sloane (1960) Vice President since 2009
Mr. Sloane is a Senior Vice President of Hartford Life. Additionally, Mr. Sloane currently serves as Senior Vice President of HIFSCO, HL Advisors, and HASCO. Prior to joining The Hartford in 2007, Mr. Sloane was Director of product marketing and led the mutual fund business for Wachovia Securities (“Wachovia”) in their investment products group. Mr. Sloane joined Wachovia in 1995.
Jane Wolak (1961) Vice President since 2009
Ms. Wolak currently serves as Vice President of Hartford Life. Ms. Wolak joined Hartford Life as Vice President, Retail Product Services in May 2007. She is also Vice President of HASCO. Previously, Ms. Wolak was with Sun Life Financial where she held the position of Vice President, Service Center Operations from 2001 – 2007.
A description of the policies and procedures that the Fund uses to determine how to vote proxies relating to portfolio securities and a record of how the Fund voted any proxies for the twelve-month period ended June 30, 2009 is available (1) without charge, upon request, by calling 888-843-7824 and (2) on the Securities and Exchange Commission’s website at http://www.sec.gov.
The Fund files a complete schedule of portfolio holdings with the Commission for the first and third quarters of each fiscal year on Form N-Q. The Fund’s Forms are available (1) without charge, upon request, by calling 888-843-7824 and (2) on the Securities and Exchange Commission’s website at http://www.sec.gov. The Form N-Q may be reviewed and copied at the Commission’s Public Reference Room in Washington, DC. Information on the operation of the Public Reference Room may be obtained by calling 1-800-SEC-0330.
| The Hartford SmallCap Growth Fund |
Your Fund's Expenses
As a shareholder of the Fund, you incur two types of costs: (1) transaction costs, including sales charges (loads) on purchase payments and contingent deferred sales charges (CDSC) (2) ongoing costs including management fees; distribution fees; and other fund expenses. This example is intended to help you understand your ongoing costs (in dollars) of investing in the Fund and to compare these costs with the ongoing costs of investing in other mutual funds. The example is based on an investment of $1,000 invested at the beginning of the period and held for the period of October 31, 2009 through April 30, 2010.
Actual Expenses
The first set of columns of the table below provides information about actual account values and actual expenses. You may use the information in this column, together with the amount you invested, to estimate the expenses that you paid over the period. Simply divide your account value by $1,000 (for example, an $8,600 account value divided by $1,000 = 8.6), then multiply the result by the number in the line under the heading entitled "Expenses Paid During Period" to estimate the expenses you paid on your account during this period.
Hypothetical Example for Comparison Purposes
The second set of columns of the table below provides information about hypothetical account values and hypothetical expenses based on the Fund's actual expense ratio and an assumed rate of return of 5% per year before expenses, which is not the Fund's actual return. The hypothetical account values and expenses may not be used to estimate the actual ending account balance or expenses you paid for the period. You may use this information to compare the ongoing costs of investing in the Fund and other funds. To do so, compare this 5% hypothetical example with the 5% hypothetical examples that appear in the shareholder reports of the other funds.
Please note that the expenses shown in the table are meant to highlight your ongoing costs only and do not reflect any transactional costs, such as sales charges (loads) and CDSC. Therefore, the second set of columns of the table is useful in comparing ongoing costs only, and will not help you determine the relative total costs of owning different funds. In addition, if these transactional costs were included, your costs would be higher. Expenses are equal to the Fund's annualized expense ratios multiplied by average account value over the period, multiplied by 181/365 (to reflect the one-half year period).
| | | Actual return | | | Hypothetical (5% return before expenses) | | | | | | | | | | |
| | | Beginning Account Value October 31, 2009 | | | Ending Account Value April 30, 2010 | | | Expenses paid during the period October 31, 2009 through April 30, 2010 | | | Beginning Account Value October 31, 2009 | | | Ending Account Value April 30, 2010 | | | Expenses paid during the period October 31, 2009 through April 30, 2010 | | | Annualized expense ratio | | | Days in the current 1/2 year | | | Days in the full year | |
| Class A | | $ | 1,000.00 | | | $ | 1,259.20 | | | $ | 7.84 | | | $ | 1,000.00 | | | $ | 1,017.85 | | | $ | 7.00 | | | | 1.40 | % | | | 181 | | | | 365 | |
| Class B | | $ | 1,000.00 | | | $ | 1,254.20 | | | $ | 12.02 | | | $ | 1,000.00 | | | $ | 1,014.13 | | | $ | 10.74 | | | | 2.15 | | | | 181 | | | | 365 | |
| Class C | | $ | 1,000.00 | | | $ | 1,255.10 | | | $ | 12.02 | | | $ | 1,000.00 | | | $ | 1,014.13 | | | $ | 10.74 | | | | 2.15 | | | | 181 | | | | 365 | |
| Class I | | $ | 1,000.00 | | | $ | 1,261.00 | | | $ | 6.45 | | | $ | 1,000.00 | | | $ | 1,019.09 | | | $ | 5.76 | | | | 1.15 | | | | 181 | | | | 365 | |
| Class L | | $ | 1,000.00 | | | $ | 1,260.70 | | | $ | 6.89 | | | $ | 1,000.00 | | | $ | 1,018.70 | | | $ | 6.16 | | | | 1.23 | | | | 181 | | | | 365 | |
| Class R3 | | $ | 1,000.00 | | | $ | 1,257.80 | | | $ | 9.24 | | | $ | 1,000.00 | | | $ | 1,016.61 | | | $ | 8.25 | | | | 1.65 | | | | 181 | | | | 365 | |
| Class R4 | | $ | 1,000.00 | | | $ | 1,259.60 | | | $ | 7.56 | | | $ | 1,000.00 | | | $ | 1,018.10 | | | $ | 6.76 | | | | 1.35 | | | | 181 | | | | 365 | |
| Class R5 | | $ | 1,000.00 | | | $ | 1,261.70 | | | $ | 5.89 | | | $ | 1,000.00 | | | $ | 1,019.59 | | | $ | 5.26 | | | | 1.05 | | | | 181 | | | | 365 | |
| Class Y | | $ | 1,000.00 | | | $ | 1,262.10 | | | $ | 5.55 | | | $ | 1,000.00 | | | $ | 1,019.89 | | | $ | 4.96 | | | | 0.99 | | | | 181 | | | | 365 | |
This information is written in connection with the promotion or marketing of the matter(s) addressed in this material. The information cannot be used or relied upon for the purpose of avoiding IRS penalties. These materials are not intended to provide tax, accounting or legal advice. As with all matters of a tax or legal nature, you should consult your own tax or legal counsel for advice.
You should carefully consider investment objectives, risks, and charges and expenses of The Hartford Mutual Funds before investing. This and other information can be found in the Fund's prospectus, which can be obtained from your investment representative or by calling 888-843-7824. Please read it carefully before you invest or send money.
The Hartford Mutual Funds are underwritten and distributed by Hartford Investment Financial Services, LLC.
“The Hartford” is The Hartford Financial Services Group, Inc., and its subsidiaries.
Mutual fund inception dates range from 1949 to date. The Hartford Mutual Funds are not a subsidiary of The Hartford but are underwritten, distributed by, and advised by subsidiaries of The Hartford. Investments in The Hartford Mutual Funds are not guaranteed by The Hartford or any other entity.
MFSAR-SCG10 6/10 MUT 8759 Printed in U.S.A. ©2010 The Hartford, Hartford, CT 06115 | |
| | |
| | |
THE HARTFORD MUTUAL FUNDS 2010 Semi Annual Report The Hartford Tax-Free National Fund |
The Hartford Tax-Free National Fund
| Manager Discussions (Unaudited) | | 2 |
| Financial Statements | | |
| | 5 |
| | 12 |
| | 13 |
| | 14 |
| | 15 |
| | 16 |
| | 24 |
| | 26 |
| | 28 |
| | 28 |
| | 29 |
The Hartford Tax-Free National Fund inception 06/02/1986
(subadvised by Hartford Investment Management Company)
Investment objective – Seeks to provide current income exempt from federal income tax with capital appreciation as a secondary objective.
Performance Overview(1) 4/30/00 - 4/30/10
Growth of a $10,000 investment in Class A which includes Sales Charge
Barclays Capital Municipal Bond Index is an unmanaged index of municipal bonds with maturities greater than two years.
You cannot invest directly in an index.
The value of shares will fluctuate so that, when redeemed, shares may be worth more or less than their original cost. The chart and table do not reflect the deduction of taxes that a shareholder would pay on fund distributions or the redemption of fund shares.
Performance information may reflect historical or current expense waivers/reimbursements from the investment adviser, without which performance would have been lower. For information on current expense waivers/reimbursements, please see the prospectus.
Average Annual Total Returns(2,3,4,5) (as of 4/30/10)
| | 6 | 1 | 5 | 10 |
| | Month† | Year | Year | Year |
| Tax-Free National A# | 4.31% | 13.85% | 0.82% | 3.76% |
| Tax-Free National A## | | 8.72% | -0.11% | 3.29% |
| Tax-Free National B# | 3.85% | 12.87% | 0.05% | NA* |
| Tax-Free National B## | | 7.87% | -0.28% | NA* |
| Tax-Free National C# | 3.84% | 12.96% | 0.07% | 2.97% |
| Tax-Free National C## | | 11.96% | 0.07% | 2.97% |
| Tax-Free National I# | 4.32% | 14.11% | 0.98% | NA |
| Tax-Free National L# | 4.24% | 13.83% | 0.81% | 3.71% |
| Tax-Free National L## | | 8.71% | -0.12% | 3.24% |
| Tax-Free National Y# | 4.35% | 14.06% | 1.00% | NA |
| Barclays Capital Municipal Bond | 3.68% | 8.85% | 4.51% | 5.77% |
| Index | | | | |
| * | 10 year returns are not applicable for Class B because after 8 years Class B converts to Class A. |
PAST PERFORMANCE IS NOT INDICATIVE OF FUTURE RESULTS.
| (1) | Growth of a $10,000 investment in Classes B, C, I, L and Y shares will vary from results seen above due to differences in the expenses charged to these share classes. |
| (2) | The initial investment in Classes A and L shares reflects the maximum sales charge and Classes B and C reflect CDSC. |
| (3) | Total returns presented above were calculated using the Fund's net asset value available to shareholders for sale or redemption of Fund shares on April 30, 2010, which excludes investment transactions as of this date. |
| (4) | Effective 9/30/09, Class B shares of The Hartford Mutual Funds are closed to new investments. |
| (5) | Classes A, B, C and Y shares were offered beginning on 2/19/02. Performance prior to that date for Class A is that of the Fund's Class E shares and for Class C is that of the Fund's Class N shares, which had lower operating expenses. Performance prior to 2/19/02 would have been lower if Classes A and C shares expenses were applied during that period. (Classes E and N shares are no longer offered.) Class I shares commenced operations on 5/31/07. Performance prior to 5/31/07 reflects Class A performance. The Fund’s performance information prior to 4/1/01 reflects when the Fund was managed by a previous investment adviser. |
| Portfolio Managers | |
| Christopher Bade | Joseph Darcy |
| Vice President | Executive Vice President |
How did the Fund perform?
The Class A shares of The Hartford Tax-Free National Fund returned 4.31%, before sales charge, for the six-month period ended April 30, 2010, versus its benchmark, the Barclays Capital Municipal Bond Index, which returned 3.68%, and the 3.85% average return of the Lipper General Municipal Debt Funds category, a group of funds with investment strategies similar to those of the Fund.
Why did the Fund perform this way?
The Fund’s outperformance during the period was attributed mainly to its benchmark overweight to lower rated revenue bonds, which contributed positively to performance as credit spreads tightened (i.e. short and long term interest rates moving closer together) for riskier spread products (i.e. issues yielding more than Treasuries). Investor demand for greater income
generating assets and a greater tolerance for risk has remained unabated since mid-2009 despite the fundamental challenges in the municipal market. The Barclays Capital Non-investment Grade Municipal Bond Index outperformed the Barclays Capital Municipal Bond Index by 3.0% over the past six months.
Although the Fund has generally been overweight (i.e. the Fund’s sector position was greater than the benchmark position) lower rated bonds, we did reduce this exposure during the period. It has been and continues to be our investment strategy to increase the overall credit quality of the Fund to help reduce volatility during this credit cycle, since we expect fundamentals to remain weak throughout 2010. Furthermore, the risk premium (incremental yield for taking additional risk in the market) is not as attractive as it once was for lower rated bonds given that credit spreads have tightened considerably for high yield products since early last year.
An overweight to health care, education, industrial revenue and special tax bonds helped performance as credit spreads tightened in these sectors during the period. Secured airline bonds and higher quality special assessment bonds also added to performance as these bonds continued to rally off their technical lows based on greater demand for risk and limited high yield supply.
The Fund’s overweight to longer maturity bonds helped performance given the acute supply and demand dynamics on the long end caused by the scarcity of tax-exempt paper.
State of California and Puerto Rico General Obligation and Lease bonds also supported performance as spreads tightened for this paper later in the period based on improving economic conditions and revenue performance, resulting in a market view that believes the worst may be over for these credits.
Drags on performance over the quarter included lower rated local General Obligation (GO) bonds, which are suffering from state cuts and the ongoing economic and fiscal challenges, as well as two underperforming Colorado metropolitan districts that have experienced significant losses in assessed valuations due to declines in real estate values related to the housing crisis.
Long average life tobacco bonds also underperformed during the quarter, specifically in March, as credit spreads widened for these bonds in anticipation of greater than forecasted declines in tobacco consumption, resulting in lower Master Settlement Agreement payments reported in April. These settlement payments, which began in 2000, are made by participating tobacco manufacturers to the states in perpetuity with total payments estimated at more than $246 billion over the first 25 years. This sector is highly technical, and thus, we have reduced exposure over the past year to minimize such volatility.
What is your Outlook?
We will remain selective on new purchases as credit conditions remain weak, tax-exempt yields are at historical lows, credit spreads are tighter and pricing is not as attractive as it once was versus taxable alternatives. However, we still believe there are good opportunities in the market given that the yield curve is still steep and spreads are still wide from a historical perspective.
We will continue to be guided by a conservative bias on credit and execute geographic/sector diversification. We will look to buy essential service revenue bonds and avoid credits in states with weaker economies and challenging fiscal stress. We will continue to extend duration in 2010 with additional purchases out longer on the municipal curve for incremental yield and total return opportunities given the strong technical on the long end.
We still prefer 20+ years where the municipal curve is steep and the technical conditions are most acute given the presence of Build America Bonds (BABs) that continue to replace traditional tax exempts. That said, we are conscious of the likelihood of inflation and rising rates at some point, and we will look to maintain an appropriate level of overall duration while still benefiting from the opportunities available on the long end of the curve. We also expect to continue reducing our exposure to high yield bonds to help limit the Fund’s credit volatility given our continued negative fundamental outlook.
| Distribution by Credit Quality | | | |
| as of April 30, 2010 | | | |
| | | Percentage of | |
| | | Long Term | |
| Rating * | | Holdings | |
| AAA / Aaa | | | 9.8 | % |
| AA / Aa | | | 25.5 | |
| A / A | | | 31.9 | |
| BBB / Baa | | | 13.2 | |
| BB / Ba | | | 2.3 | |
| B / B | | | 1.6 | |
| Not Rated | | | 15.7 | |
| Total | | | 100.0 | % |
| * | Split rated bonds are categorized using the highest rating. |
| Diversification by Industry | | | |
| as of April 30, 2010 | | | |
| | | Percentage of | |
| Industry | | Net Assets | |
| Airport Revenues | | | 4.2 | % |
| General Obligations | | | 14.0 | |
| Health Care/Services | | | 16.9 | |
| Higher Education (Univ., Dorms, etc.) | | | 17.9 | |
| Housing (HFA'S, etc.) | | | 3.9 | |
| Industrial | | | 1.9 | |
| Miscellaneous | | | 5.4 | |
| Prerefunded | | | 4.4 | |
| Public Facilities | | | 0.8 | |
| Special Tax Assessment | | | 5.5 | |
| Tax Allocation | | | 5.0 | |
| Transportation | | | 5.4 | |
| Utilities - Electric | | | 6.6 | |
| Utilities - Water and Sewer | | | 5.7 | |
| Short-Term Investments | | | 1.7 | |
| Other Assets and Liabilities | | | 0.7 | |
| Total | | | 100.0 | % |
| Distribution by State | | | |
| as of April 30, 2010 | | | |
| | | Percentage of | |
| State | | Net Assets | |
| Alabama | | | 0.8 | % |
| Alaska | | | 0.5 | |
| Arizona | | | 2.4 | |
| California | | | 16.3 | |
| Colorado | | | 2.7 | |
| Delaware | | | 0.7 | |
| District of Columbia | | | 2.7 | |
| Florida | | | 6.9 | |
| Georgia | | | 3.8 | |
| Hawaii | | | 0.4 | |
| Idaho | | | 0.7 | |
| Illinois | | | 5.8 | |
| Indiana | | | 1.6 | |
| Louisiana | | | 1.6 | |
| Michigan | | | 3.6 | |
| Minnesota | | | 5.3 | |
| Missouri | | | 1.0 | |
| Nebraska | | | 1.0 | |
| Nevada | | | 0.4 | |
| New Hampshire | | | 0.3 | |
| New Jersey | | | 1.6 | |
| New Mexico | | | 0.7 | |
| New York | | | 8.1 | |
| North Carolina | | | 0.4 | |
| Ohio | | | 1.9 | |
| Oklahoma | | | 0.4 | |
| Other U.S. Territories | | | 1.3 | |
| Pennsylvania | | | 2.5 | |
| Rhode Island | | | 1.0 | |
| South Dakota | | | 0.9 | |
| Tennessee | | | 0.8 | |
| Texas | | | 11.3 | |
| Virginia | | | 1.2 | |
| Washington | | | 3.7 | |
| Wisconsin | | | 2.0 | |
| Wyoming | | | 1.3 | |
| Short-Term Investments | | | 1.7 | |
| Other Assets and Liabilities | | | 0.7 | |
| Total | | | 100.0 | % |
| The Hartford Tax-Free National Fund |
|
| April 30, 2010 (Unaudited) |
| (000’s Omitted) |
| Shares or Principal Amount | | Market Value ╪ | |
| MUNICIPAL BONDS - 97.6% | | | |
| | | | Alabama - 0.8% | | | |
| | | | Huntsville, AL, GO | | | |
| $ | | 1,855 | | 5.25%, 05/01/2022 | | $ | 1,975 | |
| | | | | | | | | |
| | | | | Alaska - 0.5% | | | | |
| | | | | Alaska Municipal Bond Bank Auth GO | | | | |
| | | 375 | | 5.75%, 09/01/2033 | | | 396 | |
| | | | | Anchorage, AK, GO | | | | |
| | | 610 | | 5.25%, 08/01/2028 | | | 666 | |
| | | | | | | | 1,062 | |
| | | | | Arizona - 2.4% | | | | |
| | | | | Arizona Sundance Community Fac Dist, Special Assess Rev #2 | | | | |
| | | 349 | | 7.13%, 07/01/2027 ■ | | | 331 | |
| | | | | Estrella Mountain, AZ, Ranch Community GO | | | | |
| | | 265 | | 6.20%, 07/15/2032 | | | 249 | |
| | | | | Pima County, AZ, Charter Schools Proj | | | | |
| | | 990 | | 5.75%, 07/01/2016 | | | 951 | |
| | | | | Pima County, AZ, Noah Webster Basic School | | | | |
| | | 1,000 | | 5.60%, 12/15/2019 | | | 947 | |
| | | | | Salt River Proj Arizona Agricultural | | | | |
| | | 3,000 | | 5.00%, 01/01/2034 | | | 3,170 | |
| | | | | Vistancia, AZ, Community Fac Dist GO | | | | |
| | | 200 | | 6.75%, 07/15/2022 | | | 206 | |
| | | | | | | | 5,854 | |
| | | | | California - 16.3% | | | | |
| | | | | Aliso Viejo, CA, Community Fac Dist Special Tax | | | | |
| | | 500 | | 6.00%, 09/01/2038 | | | 425 | |
| | | | | Beumont, CA, FA (Prefrefunded with State & Local Gov't Securities) | | | | |
| | | 50 | | 7.25%, 09/01/2020 | | | 52 | |
| | | | | Burbank, CA, FA Rev South San Fernando Redev Proj | | | | |
| | | 350 | | 5.50%, 12/01/2023 | | | 329 | |
| | | | | California Educational Fac Auth, La Verne University | | | | |
| | | 180 | | 5.00%, 06/01/2031 | | | 163 | |
| | | | | California Educational Fac Auth, Pitzer College | | | | |
| | | 630 | | 5.00%, 04/01/2030 | | | 633 | |
| | | | | California Health Fac FA, Catholic Healthcare West | | | | |
| | | 250 | | 5.25%, 07/01/2023 | | | 255 | |
| | | | | California Public Works Board Lease Rev | | | | |
| | | 1,000 | | 5.75%, 10/01/2030 | | | 1,020 | |
| | | | | California Public Works Board, Dept of Health Services Richmond Lab | | | | |
| | | 300 | | 5.00%, 11/01/2030 | | | 281 | |
| | | | | California Public Works Board, Dept of Mental Health Patton | | | | |
| | | 200 | | 5.38%, 04/01/2028 | | | 200 | |
| | | | | California State | | | | |
| | | 665 | | 5.50%, 03/01/2040 | | | 690 | |
| | | | | California State Dept of Water Resources Supply Rev | | | | |
| | | 500 | | 5.00%, 05/01/2022 | | | 546 | |
| | | | | California State Enterprise Auth, Sewer FA Rev AMT | | | | |
| | | 500 | | 5.30%, 09/01/2047 | | | 466 | |
| | | | | California State GO | | | | |
| | | 3,515 | | 6.50%, 04/01/2033 | | | 3,946 | |
| | | | | California State Public Works Board | | | | |
| | | 500 | | 6.00%, 03/01/2035 | | | 518 | |
| | | 170 | | 6.13%, 04/01/2029 | | | 181 | |
| | | 2,000 | | 6.25%, 04/01/2034 | | | 2,133 | |
| | | 1,000 | | 6.38%, 11/01/2034 | | | 1,072 | |
| | | | | California Statewide Community DA, | | | | |
| | | | | California Baptist University | | | | |
| | | 1,000 | | 5.50%, 11/01/2038 | | | 798 | |
| | | | | California Statewide Community DA, CHF-Irvine, LLC | | | | |
| | | 700 | | 5.75%, 05/15/2032 | | | 704 | |
| | | | | California Statewide Community DA, Health Services Rev | | | | |
| | | 250 | | 6.00%, 10/01/2023 | | | 260 | |
| | | | | California Statewide Community DA, Huntington Park Rev | | | | |
| | | 600 | | 5.15%, 07/01/2030 | | | 458 | |
| | | | | California Statewide Community DA, Thomas Jefferson School of Law | | | | |
| | | 500 | | 7.25%, 10/01/2032 | | | 522 | |
| | | | | California Statewide Community DA, Windrush School | | | | |
| | | 250 | | 5.50%, 07/01/2037 | | | 195 | |
| | | | | Capistrano, CA, USD Community Fac Dist Special Tax #90-2 Talega (Prerefunded with State & Local Gov't Securities) | | | | |
| | | 250 | | 5.90%, 09/01/2020 | | | 289 | |
| | | | | Carlsbad, CA, Special Tax | | | | |
| | | 260 | | 6.05%, 09/01/2028 | | | 238 | |
| | | | | Chula Vista, CA, IDR Daily San Diego Gas | | | | |
| | | 300 | | 5.30%, 07/01/2021 | | | 330 | |
| | | | | Contra Costa County, CA, Public FA Tax Allocation | | | | |
| | | 70 | | 5.63%, 08/01/2033 | | | 65 | |
| | | | | Corona, CA, Redev Agency Tax Allocation | | | | |
| | | 300 | | 4.50%, 11/01/2032 ‡ | | | 277 | |
| | | | | El Dorado Irrigation Dist | | | | |
| | | 300 | | 5.38%, 08/01/2024 | | | 327 | |
| | | | | Fontana, CA, Redev Agency Tax Allocation Ref, Jurupa Hills Redev Proj | | | | |
| | | 400 | | 5.50%, 10/01/2027 | | | 400 | |
| | | | | Huntington Park, CA, Public FA Rev Ref | | | | |
| | | 400 | | 5.25%, 09/01/2019 ‡ | | | 431 | |
| | | | | Indio, CA, Public Improvement Act Special Assessment #2002-3 GO | | | | |
| | | 95 | | 6.35%, 09/02/2027 | | | 96 | |
| | | | | Kern County, CA, Tobacco Securitization Agency | | | | |
| | | 955 | | 6.00%, 06/01/2029 | | | 950 | |
| | | | | Lake Tahoe USD | | | | |
| | | 8,000 | | 6.38%, 08/01/2045 ☼ | | | 2,174 | |
| | | | | Lathrop, CA, FA Rev Water Supply Proj | | | | |
| | | 1,000 | | 6.00%, 06/01/2035 | | | 971 | |
| | | | | Los Alamitos, CA, University GO | | | | |
| | | 500 | | 5.50%, 08/01/2033 | | | 537 | |
| | | | | Madera, CA, Redev Agency Tax Rev | | | | |
| | | 750 | | 5.25%, 09/01/2030 | | | 707 | |
The accompanying notes are an integral part of these financial statements.
| The Hartford Tax-Free National Fund |
| Schedule of Investments – (continued) |
| April 30, 2010 (Unaudited) |
| (000’s Omitted) |
| Shares or Principal Amount | | Market Value ╪ | |
| MUNICIPAL BONDS - 97.6% - (continued) | | | |
| | | | California - 16.3% - (continued) | | | |
| | | | Modesto, CA, Irrigation Dist | | | |
| $ | | 500 | | 5.50%, 07/01/2035 | | $ | 515 | |
| | | | | Morongo Band of Mission Indians Enterprise Rev | | | | |
| | | 2,655 | | 6.50%, 03/01/2028 ■ | | | 2,490 | |
| | | | | Palm Springs, CA, Community Redev Agency | | | | |
| | | 535 | | 5.50%, 09/01/2023 | | | 545 | |
| | | | | Port of Oakland, CA, GO (Prerefunded with State & Local Gov't Securities) | | | | |
| | | 20 | | 5.75%, 11/01/2022 | | | 20 | |
| | | | | Port of Oakland, CA, Transportation FA | | | | |
| | | 2,540 | | 5.75%, 11/01/2022 | | | 2,542 | |
| | | | | Rancho Mirage, CA, Joint Powers FA Rev, Eisenhower Medical Center | | | | |
| | | 500 | | 5.00%, 07/01/2038 | | | 465 | |
| | | | | San Bernardino, CA, Community College Dist GO | | | | |
| | | 500 | | 6.38%, 08/01/2026 | | | 583 | |
| | | | | San Diego, CA, Public Fac FA Water Rev | | | | |
| | | 500 | | 5.25%, 08/01/2038 | | | 525 | |
| | | | | San Diego, CA, Redev Agency Tax Allocation, North Park Redev Proj | | | | |
| | | 175 | | 5.30%, 09/01/2016 | | | 175 | |
| | | | | San Diego, CA, Redev Agency, Centre City Sub Pkg | | | | |
| | | 200 | | 5.25%, 09/01/2026 | | | 192 | |
| | | | | San Francisco City & County, CA, Redev Agency | | | | |
| | | 1,120 | | 6.50%, 08/01/2032 | | | 1,187 | |
| | | | | Santa Cruz County, CA, Redev Agency | | | | |
| | | 665 | | 6.63%, 09/01/2029 | | | 723 | |
| | | | | Santa Margarita, CA, Water Dist Special Tax Community Fac Dist (Prerefunded with State & Local Gov't Securities) | | | | |
| | | 200 | | 6.00%, 09/01/2030 | | | 231 | |
| | | | | Southern California Public Power Auth | | | | |
| | | 500 | | 5.00%, 07/01/2023 | | | 542 | |
| | | | | Temecula, CA, Redev Agency Tax Allocation Rev | | | | |
| | | 250 | | 5.63%, 12/15/2038 | | | 211 | |
| | | | | Torrance, CA, USD GO | | | | |
| | | 1,500 | | 5.50%, 08/01/2025 | | | 1,672 | |
| | | | | Tuolumne Wind Proj Auth Rev | | | | |
| | | 1,000 | | 5.88%, 01/01/2029 | | | 1,092 | |
| | | | | Ventura County, CA, Certificates of Participation | | | | |
| | | 1,250 | | 5.63%, 08/15/2027 | | | 1,350 | |
| | | | | Washington Township, CA, Health Care Dist Rev | | | | |
| | | 500 | | 5.00%, 07/01/2037 | | | 453 | |
| | | 1,000 | | 6.00%, 07/01/2029 | | | 1,043 | |
| | | | | | | | 40,195 | |
| | | | | Colorado - 2.7% | | | | |
| | | | | Adams County, CO | | | | |
| | | 1,000 | | 5.13%, 12/01/2029 | | | 1,043 | |
| | | | | Antelope Heights, CO, Metro Dist GO | | | | |
| | | 1,125 | | 5.00%, 12/01/2037 | | | 830 | |
| | | | | Colorado Educational & Cultural Fac Auth, Charter School Banning Lewis | | | | |
| | | 990 | | 6.13%, 12/15/2035 ■ | | | 903 | |
| | | | | Denver, CO, Rendezvous Residential Metro Dist GO | | | | |
| | | 600 | | 5.38%, 12/01/2021 | | | 481 | |
| | | | | Ebert, CO, Metropolitan Dist GO | | | | |
| | | 3,000 | | 5.35%, 12/01/2037 | | | 2,113 | |
| | | | | Reata, CO, North Metro Dist GO | | | | |
| | | 1,000 | | 5.50%, 12/01/2032 ⌂ | | | 685 | |
| | | | | University of Colorado Enterprise Rev | | | | |
| | | 600 | | 5.75%, 06/01/2028 | | | 677 | |
| | | | | | | | 6,732 | |
| | | | | Delaware - 0.7% | | | | |
| | | | | Delaware Transportation Auth | | | | |
| | | 1,180 | | 5.00%, 07/01/2025 | | | 1,306 | |
| | | | | New Castle County, DE, DA GO | | | | |
| | | 500 | | 5.00%, 07/15/2033 | | | 539 | |
| | | | | | | | 1,845 | |
| | | | | District of Columbia - 2.7% | | | | |
| | | | | Dist of Columbia University Rev | | | | |
| | | 3,000 | | 5.25%, 04/01/2034 | | | 3,120 | |
| | | | | Metropolitan Washington, DC, Airport Auth | | | | |
| | | 2,500 | | 5.50%, 10/01/2027 | | | 2,543 | |
| | | | | Washington, DC, Metropolitan Area Transit | | | | |
| | | 1,000 | | 5.13%, 07/01/2032 | | | 1,056 | |
| | | | | | | | 6,719 | |
| | | | | Florida - 6.9% | | | | |
| | | | | Bellalgo, FL, Education Fac Benefits Dist Capital | | | | |
| | | 45 | | 5.85%, 05/01/2022 | | | 42 | |
| | | | | Clearwater Water and Sewer Rev | | | | |
| | | 2,500 | | 5.25%, 12/01/2039 | | | 2,570 | |
| | | | | Colonial Country Club Community Development Dist, Capital Improvement Rev | | | | |
| | | 470 | | 6.40%, 05/01/2033 | | | 486 | |
| | | | | Florida Village Community Development | | | | |
| | | 945 | | 6.50%, 05/01/2033 | | | 965 | |
| | | | | Florida Village Community Development Dist No 8 | | | | |
| | | 1,135 | | 6.38%, 05/01/2038 | | | 1,007 | |
| | | | | Jacksonville, FL, Econ Development Community Health Care Fac | | | | |
| | | 3,000 | | 6.25%, 09/01/2027 | | | 2,925 | |
| | | | | Lee County, FL, IDA | | | | |
| | | 1,500 | | 5.25%, 06/15/2027 | | | 1,184 | |
| | | | | Miami-Dade County, FL, Aviation Rev | | | | |
| | | 1,645 | | 5.50%, 10/01/2036 | | | 1,674 | |
| | | | | Miami-Dade County, FL, Educational Facilities Auth | | | | |
| | | 2,000 | | 5.75%, 04/01/2028 | | | 2,090 | |
| | | | | Palm Beach County, FL, Health FA Rev Waterford Proj | | | | |
| | | 3,300 | | 5.75%, 11/15/2026 | | | 3,080 | |
| | | | | River Bend Community Development Dist, Capital Improvement Rev | | | | |
| | | 915 | | 0.00%, 11/01/2015 ⌂● | | | 551 | |
The accompanying notes are an integral part of these financial statements.
| Shares or Principal Amount | | Market Value ╪ | |
| MUNICIPAL BONDS - 97.6% - (continued) | | | |
| | | | Florida - 6.9% - (continued) | | | |
| | | | Rolling Hills Community Development Dist | | | |
| $ | | 65 | | 5.45%, 05/01/2037 ⌂ | | $ | 47 | |
| | | | | University Square Community Development | | | | |
| | | 495 | | 5.88%, 05/01/2038 | | | 428 | |
| | | | | | | | 17,049 | |
| | | | | Georgia - 3.8% | | | | |
| | | | | Atlanta Water & Wastewater Rev | | | | |
| | | 1,500 | | 6.00%, 11/01/2022 | | | 1,649 | |
| | | | | Dekalb County, GA, DA | | | | |
| | | 1,000 | | 6.00%, 07/01/2034 | | | 1,100 | |
| | | | | Fulton County, GA, School Dist GO | | | | |
| | | 1,105 | | 5.38%, 01/01/2018 | | | 1,293 | |
| | | | | Fulton County, GA, Water & Sewer Rev FGIC Part (Prerefunded with State & Local Gov't Securities) | | | | |
| | | 1,500 | | 6.38%, 01/01/2014 | | | 1,663 | |
| | | | | Gainesville & Hall County, GA, Hospital Auth GO | | | | |
| | | 1,500 | | 5.25%, 02/15/2045 | | | 1,503 | |
| | | | | Georgia Municipal Electric Auth, Power Rev | | | | |
| | | 945 | | 6.50%, 01/01/2017 | | | 1,100 | |
| | | | | Georgia Municipal Electric Auth, Power Rev (Prerefunded with US Gov't Securities) | | | | |
| | | 55 | | 6.50%, 01/01/2017 | | | 65 | |
| | | | | Marietta, GA, DA | | | | |
| | | 1,000 | | 7.00%, 06/15/2030 | | | 982 | |
| | | | | | | | 9,355 | |
| | | | | Hawaii - 0.4% | | | | |
| | | | | Hawaii State | | | | |
| | | 1,000 | | 5.00%, 07/01/2039 | | | 992 | |
| | | | | | | | | |
| | | | | Idaho - 0.7% | | | | |
| | | | | Idaho Board Bank Auth | | | | |
| | | 1,470 | | 5.63%, 09/15/2026 | | | 1,671 | |
| | | | | | | | | |
| | | | | Illinois - 5.8% | | | | |
| | | | | Chicago, IL, Tax Increment Allocation Jr Lien Pilsen Redev B | | | | |
| | | 1,000 | | 6.75%, 06/01/2022 ⌂ | | | 953 | |
| | | | | Hampshire, IL, Special Service Area #13, Tuscany Woods Proj | | | | |
| | | 1,800 | | 5.75%, 03/01/2037 ⌂ | | | 1,093 | |
| | | | | Hampshire, IL, Special Service Area #16, Prairie Ridge Proj | | | | |
| | | 800 | | 6.00%, 03/01/2046 | | | 561 | |
| | | | | Huntley, IL, Special Service Area #9 | | | | |
| | | 1,500 | | 5.10%, 03/01/2028 ‡ | | | 1,532 | |
| | | | | Illinois Education FA, Augustana College, Ser A | | | | |
| | | 1,000 | | 5.70%, 10/01/2032 | | | 1,007 | |
| | | | | Illinois FA Rev | | | | |
| | | 800 | | 5.25%, 11/01/2039 | | | 807 | |
| | | 2,930 | | 5.38%, 07/01/2033 - 08/15/2039 | | | 2,959 | |
| | | 1,000 | | 5.50%, 04/01/2039 | | | 1,001 | |
| | | 310 | | 6.25%, 02/01/2033 | | | 329 | |
| | | | | Plano, IL, Lakewood Springs Proj Special Services Area | | | | |
| | | 497 | | 6.10%, 03/01/2035 | | | 398 | |
| | | | | Round Lake, IL, Special Tax Rev | | | | |
| | | 955 | | 4.70%, 03/01/2033 | | | 959 | |
| | | | | Round Lake, IL, Special Tax Rev (Prerefunded with State & Local Gov't Securities) | | | | |
| | | 494 | | 6.70%, 03/01/2033 | | | 561 | |
| | | | | Springfield, IL, Water Rev | | | | |
| | | 500 | | 5.25%, 03/01/2026 | | | 538 | |
| | | | | Wauconda, IL, Special Service Area #1 Special Tax Liberty Lakes Proj | | | | |
| | | 1,000 | | 6.63%, 03/01/2033 | | | 938 | |
| | | | | Yorkville, IL, United City Special Service Area Tax Raintree Village Proj | | | | |
| | | 929 | | 6.88%, 03/01/2033 | | | 891 | |
| | | | | | | | 14,527 | |
| | | | | Indiana - 1.6% | | | | |
| | | | | Indiana FA Hospital Rev | | | | |
| | | 2,000 | | 6.75%, 03/01/2035 | | | 2,092 | |
| | | | | Indiana Municipal Power Agency | | | | |
| | | 500 | | 5.75%, 01/01/2034 | | | 522 | |
| | | | | University of Southern Indiana | | | | |
| | | 1,070 | | 5.00%, 10/01/2022 - 10/01/2023 | | | 1,150 | |
| | | | | | | | 3,764 | |
| | | | | Louisiana - 1.6% | | | | |
| | | | | Louisiana Public Fac Auth | | | | |
| | | 2,500 | | 6.75%, 07/01/2039 | | | 2,726 | |
| | | | | Louisiana Public Fac Auth, Oschner Clinic Foundation Proj (Prerefunded with US Gov't Securities) | | | | |
| | | 500 | | 5.50%, 05/15/2027 | | | 575 | |
| | | | | Louisiana Public Fac Auth, Susla Fac, Inc. | | | | |
| | | 1,000 | | 5.75%, 07/01/2039 ⌂ | | | 692 | |
| | | | | | | | 3,993 | |
| | | | | Michigan - 3.6% | | | | |
| | | | | Detroit, MI, GO | | | | |
| | | 1,700 | | 5.00%, 04/01/2016 | | | 1,562 | |
| | | | | Detroit, MI, Water Supply System Ref Rev FGIC | | | | |
| | | 1,750 | | 6.50%, 07/01/2015 | | | 1,943 | |
| | | | | Grand Valley State University | | | | |
| | | 1,500 | | 5.50%, 12/01/2027 | | | 1,593 | |
| | | | | Michigan Hospital FA, Rev Ref Henry Ford Health System (Prerefunded with State &Local Gov't Securities) | | | | |
| | | 500 | | 5.63%, 03/01/2017 | | | 558 | |
| | | | | Michigan Public Educational Facilities Auth | | | | |
| | | 695 | | 7.00%, 12/01/2039 | | | 700 | |
| | | | | Michigan State Hospital FA, McLaren Health Care | | | | |
| | | 2,000 | | 5.63%, 05/15/2028 | | | 2,042 | |
| | | | | Michigan Tobacco Settlement FA Ser A | | | | |
| | | 1,000 | | 6.00%, 06/01/2048 | | | 762 | |
| | | | | | | | 9,160 | |
| | | | | Minnesota - 5.3% | | | | |
| | | | | Baytown Township, MN | | | | |
| | | 250 | | 7.00%, 08/01/2038 | | | 240 | |
| | | | | Chaska, MN, Electric Rev Ref Generating Fac | | | | |
| | | 500 | | 5.00%, 10/01/2030 | | | 515 | |
The accompanying notes are an integral part of these financial statements.
| The Hartford Tax-Free National Fund |
| Schedule of Investments – (continued) |
| April 30, 2010 (Unaudited) |
| (000’s Omitted) |
| Shares or Principal Amount | | Market Value ╪ | |
| MUNICIPAL BONDS - 97.6% - (continued) | | | |
| | | | Minnesota - 5.3% - (continued) | | | |
| | | | Falcon Heights, MN, Lease Rev | | | |
| $ | | 225 | | 6.00%, 11/01/2037 | | $ | 185 | |
| | | | | Golden Valley, MN, Calvary Center Apts Proj AMT | | | | |
| | | 500 | | 4.85%, 12/20/2041 | | | 477 | |
| | | | | Illinois FA Rev | | | | |
| | | 2,000 | | 5.75%, 04/01/2024 | | | 2,078 | |
| | | | | Minneapolis & St Paul, MN, Airport Commission FGIC AMT | | | | |
| | | 1,000 | | 5.63%, 01/01/2018 | | | 1,013 | |
| | | | | Minneapolis, MN, Parking Assessment GO | | | | |
| | | 250 | | 5.00%, 12/01/2020 | | | 267 | |
| | | | | Minneapolis, MN, Tax Increment Grant Park Proj | | | | |
| | | 350 | | 5.35%, 02/01/2030 | | | 291 | |
| | | | | Minnesota Agricultural Society, State Fair Rev | | | | |
| | | 835 | | 5.13%, 09/15/2023 | | | 857 | |
| | | | | Minnesota Intermediate School Dist Lease Rev | | | | |
| | | 368 | | 5.30%, 11/01/2032 | | | 364 | |
| | | | | Ramsey, MN, Lease Rev Pact Charter School Proj | | | | |
| | | 750 | | 6.50%, 12/01/2022 | | | 688 | |
| | | | | Rosemount, MN, ISD #196 GO MBIA | | | | |
| | | 1,950 | | 5.70%, 04/01/2015 | | | 1,677 | |
| | | | | St Paul, MN, Housing & Redev Auth, Achieve Language Academy | | | | |
| | | 800 | | 6.75%, 12/01/2022 | | | 770 | |
| | | | | St Paul, MN, Housing & Redev Auth, Hmong Academy Proj | | | | |
| | | 1,000 | | 6.00%, 09/01/2036 | | | 780 | |
| | | | | St Paul, MN, Housing & Redev Auth, Hope Community Academy Proj | | | | |
| | | 450 | | 6.25%, 12/01/2019 | | | 406 | |
| | | | | St Paul, MN, Housing & Redev Auth, Lease Rev | | | | |
| | | 860 | | 6.00%, 12/01/2018 | | | 806 | |
| | | | | St Paul, MN, PA Lease Rev | | | | |
| | | 500 | | 5.00%, 12/01/2019 | | | 533 | |
| | | | | Stillwater, MN, Multifamily Housing Rev AMT | | | | |
| | | 400 | | 5.38%, 02/01/2032 | | | 310 | |
| | | | | University of Minnesota (Prerefunded with State & Local Gov't Securities) | | | | |
| | | 1,000 | | 5.75%, 07/01/2018 | | | 1,204 | |
| | | | | | | | 13,461 | |
| | | | | Missouri - 1.0% | | | | |
| | | | | Branson Hills, MO, Infrastructure Fac | | | | |
| | | 650 | | 5.50%, 04/01/2027 | | | 515 | |
| | | | | Lees Summit, MO, IDA Kensington Farms Improvement Proj | | | | |
| | | 1,000 | | 5.75%, 03/01/2029 | | | 809 | |
| | | | | St Louis, MO, IDA Confluence Academy Proj | | | | |
| | | 550 | | 5.35%, 06/15/2032 | | | 421 | |
| | | | | Stone Canyon, MO, Community Improvement Proj | | | | |
| | | 1,000 | | 5.75%, 04/01/2027 | | | 788 | |
| | | | | | | | 2,533 | |
| | | | | Nebraska - 1.0% | | | | |
| | | | | Nebraska Public Power Dist Rev | | | | |
| | | 2,500 | | 5.00%, 01/01/2033 | | | 2,566 | |
| | | | | | | | | |
| | | | | Nevada - 0.4% | | | | |
| | | | | Clark County, NV, Airport Rev | | | | |
| | | 1,000 | | 5.75%, 07/01/2042 | | | 1,044 | |
| | | | | | | | | |
| | | | | New Hampshire - 0.3% | | | | |
| | | | | New Hampshire Health & Education Fac, Elliot Hospital | | | | |
| | | 715 | | 5.60%, 10/01/2022 | | | 718 | |
| | | | | | | | | |
| | | | | New Jersey - 1.6% | | | | |
| | | | | New Jersey Health Care Facilities FA Rev | | | | |
| | | 2,145 | | 5.75%, 10/01/2031 | | | 2,316 | |
| | | | | New Jersey Tobacco Settlement Financing Corp | | | | |
| | | 1,500 | | 5.00%, 06/01/2041 | | | 1,040 | |
| | | | | New Jersey Transportation Trust Fund Auth | | | | |
| | | 2,500 | | 6.05%, 12/15/2029 | | | 858 | |
| | | | | | | | 4,214 | |
| | | | | New Mexico - 0.7% | | | | |
| | | | | Cabezon, NM, Public Improvement Dist | | | | |
| | | 665 | | 5.20%, 09/01/2015 | | | 628 | |
| | | | | New Mexico Hospital Equipment Loan Council | | | | |
| | | 1,040 | | 5.00%, 08/01/2039 | | | 1,048 | |
| | | | | | | | 1,676 | |
| | | | | New York - 8.1% | | | | |
| | | | | Albany, NY, IDA Civic Fac Rev | | | | |
| | | 250 | | 5.00%, 07/01/2037 | | | 228 | |
| | | | | Erie County, NY, IDA Applied Tech Charter School Proj | | | | |
| | | 800 | | 6.75%, 06/01/2025 | | | 757 | |
| | | | | Erie County, NY, IDA Global Concepts Charter School Proj | | | | |
| | | 495 | | 6.25%, 10/01/2037 | | | 412 | |
| | | | | Nassau County, NY, IDA Continuing Care Retirement, Amsterdam at Harborside, Ser A | | | | |
| | | 1,500 | | 6.50%, 01/01/2027 | | | 1,469 | |
| | | | | New York City Health & Hospital Corp | | | | |
| | | 500 | | 5.50%, 02/15/2023 | | | 538 | |
| | | | | New York Dorm Auth, Fordham University FGIC | | | | |
| | | 80 | | 5.00%, 07/01/2020 | | | 83 | |
| | | | | New York Dorm Auth, Mount St Mary College | | | | |
| | | 400 | | 5.00%, 07/01/2027 | | | 401 | |
| | | | | New York Dorm Auth, Rochester University | | | | |
| | | 135 | | 5.25%, 07/01/2022 | | | 142 | |
| | | | | New York Dorm Auth, State University Dorm Fac (Prerefunded with US Gov't Securities) | | | | |
| | | 450 | | 5.00%, 07/01/2032 | | | 491 | |
| | | | | New York Dorm Auth, Upstate Community College | | | | |
| | | 250 | | 5.25%, 07/01/2021 | | | 268 | |
The accompanying notes are an integral part of these financial statements.
| Shares or Principal Amount | | Market Value ╪ | |
| MUNICIPAL BONDS - 97.6% - (continued) | | | |
| | | | New York - 8.1% - (continued) | | | |
| | | | New York Energy Research & DA, Elec Fac | | | |
| | | | Rev Adj Long Island Lighting Co Proj | | | |
| $ | | 250 | | 5.30%, 08/01/2025 | | $ | 251 | |
| | | | | New York Environmental Fac Corp | | | | |
| | | 450 | | 5.00%, 07/15/2026 | | | 474 | |
| | | | | New York Metropolitan Transportation Auth | | | | |
| | | 450 | | 5.13%, 11/15/2031 | | | 462 | |
| | | | | New York State Dormitory Auth, Rev Non St | | | | |
| | | 2,000 | | 5.38%, 03/01/2029 | | | 2,120 | |
| | | | | New York Tobacco Settlement FA | | | | |
| | | 400 | | 5.50%, 06/01/2022 | | | 428 | |
| | | | | New York, NY, GO | | | | |
| | | 1,000 | | 6.25%, 10/15/2028 | | | 1,168 | |
| | | | | New York, NY, GO (Prerefunded with US Gov't Securities) | | | | |
| | | 45 | | 5.75%, 03/01/2019 | | | 51 | |
| | | | | New York, NY, IDA American Airlines JFK International Airport AMT | | | | |
| | | 860 | | 7.13%, 08/01/2011 | | | 869 | |
| | | 1,400 | | 8.00%, 08/01/2012 | | | 1,440 | |
| | | | | New York, NY, IDA Civic Fac Rev, YMCA of Greater NY Proj | | | | |
| | | 250 | | 5.25%, 08/01/2021 | | | 252 | |
| | | | | New York, NY, Transitional FA Future Tax Secured | | | | |
| | | 450 | | 5.00%, 08/01/2023 | | | 472 | |
| | | | | Otsego County, NY, IDA Civic Fac Rev Hartwick College Proj | | | | |
| | | 200 | | 6.00%, 07/01/2011 | | | 201 | |
| | | | | Rensselaer County, NY, Industrial Improvements | | | | |
| | | 200 | | 5.00%, 01/01/2036 | | | 204 | |
| | | | | Seneca Nation Indians Capital Improvement Special Tax | | | | |
| | | 1,160 | | 5.00%, 12/01/2023 ■ | | | 998 | |
| | | | | St Lawrence, NY, IDA Civic Fac Rev, Clarkson University Proj | | | | |
| | | 450 | | 5.00%, 07/01/2023 | | | 461 | |
| | | | | Suffolk County, NY, Jeffersons Ferry Proj | | | | |
| | | 500 | | 5.00%, 11/01/2028 | | | 443 | |
| | | | | Ulster County, NY, IDA Kingston Regional Senior Living Proj | | | | |
| | | 4,475 | | 6.00%, 09/15/2027 | | | 3,783 | |
| | | | | Westchester County, NY, IDA Continuing Care Retirement, Kendal on Hudson Proj | | | | |
| | | 500 | | 6.38%, 01/01/2024 | | | 487 | |
| | | | | | | | 19,353 | |
| | | | | North Carolina - 0.4% | | | | |
| | | | | Mecklenburg County, NC | | | | |
| | | 795 | | 5.00%, 02/01/2024 | | | 868 | |
| | | | | | | | | |
| | | | | Ohio - 1.9% | | | | |
| | | | | Cuyahoga Community College | | | | |
| | | 1,200 | | 5.00%, 08/01/2027 | | | 1,272 | |
| | | | | Hamilton, OH, School Dist Improvement GO | | | | |
| | | 1,270 | | 6.15%, 12/01/2016 | | | 1,541 | |
| | | | | Ohio State Higher Educational Facilities Rev | | | | |
| | | 2,000 | | 5.50%, 12/01/2036 | | | 2,094 | |
| | | | | | | | 4,907 | |
| | | | | Oklahoma - 0.4% | | | | |
| | | | | Tulsa Airports Improvement Trust | | | | |
| | | 1,000 | | 5.38%, 06/01/2024 | | | 1,010 | |
| | | | | | | | | |
| | | | | Other U.S. Territories - 1.3% | | | | |
| | | | | Guam Government | | | | |
| | | 565 | | 5.75%, 12/01/2034 | | | 587 | |
| | | | | Puerto Rico Housing FA | | | | |
| | | 1,000 | | 5.13%, 12/01/2027 | | | 1,032 | |
| | | | | Puerto Rico Sales Tax Financing | | | | |
| | | 1,500 | | 5.50%, 08/01/2042 | | | 1,568 | |
| | | | | University Virgin Islands | | | | |
| | | 270 | | 5.13%, 12/01/2022 | | | 278 | |
| | | 225 | | 5.25%, 12/01/2023 - 12/01/2024 | | | 231 | |
| | | | | | | | 3,696 | |
| | | | | Pennsylvania - 2.5% | | | | |
| | | | | Chester County, PA, GO | | | | |
| | | 1,000 | | 5.00%, 07/15/2029 | | | 1,100 | |
| | | | | Montgomery County, PA, IDA Whitemarsh Continuing Care Proj | | | | |
| | | 800 | | 6.13%, 02/01/2028 | | | 644 | |
| | | | | Pennsylvania State Higher Educational FA Rev | | | | |
| | | 2,145 | | 5.75%, 07/01/2028 | | | 2,105 | |
| | | | | Pennsylvania Turnpike Commission | | | | |
| | | 665 | | 6.00%, 06/01/2028 | | | 750 | |
| | | | | Philadelphia, PA, Municipal Auth GO | | | | |
| | | 750 | | 6.38%, 04/01/2029 | | | 795 | |
| | | 1,000 | | 6.50%, 04/01/2034 | | | 1,052 | |
| | | | | | | | 6,446 | |
| | | | | Rhode Island - 1.0% | | | | |
| | | | | Central Falls, RI, Detention FA Fac Rev | | | | |
| | | 775 | | 6.75%, 01/15/2013 | | | 763 | |
| | | | | Rhode Island Tobacco Settlement Financing Corp | | | | |
| | | 2,000 | | 6.25%, 06/01/2042 | | | 1,912 | |
| | | | | | | | 2,675 | |
| | | | | South Dakota - 0.9% | | | | |
| | | | | South Dakota Housing DA | | | | |
| | | 1,985 | | 6.13%, 05/01/2033 | | | 2,139 | |
| | | | | | | | | |
| | | | | Tennessee - 0.8% | | | | |
| | | | | Johnson City, TN, Health & Educational Facilities | | | | |
| | | 2,000 | | 6.00%, 07/01/2038 | | | 2,026 | |
| | | | | | | | | |
| | | | | Texas - 11.3% | | | | |
| | | | | Corpus Christi, TX, ISD GO | | | | |
| | | 1,525 | | 5.00%, 08/15/2026 | | | 1,653 | |
| | | | | Dallas Fort Worth, TX, International Airport | | | | |
| | | 2,000 | | 6.00%, 11/01/2028 - 11/01/2032 | | | 2,006 | |
| | | | | Harris County, TX, Cultural Education Fac Baylor CLG Medicine | | | | |
| | | 2,145 | | 5.63%, 11/15/2032 | | | 2,011 | |
The accompanying notes are an integral part of these financial statements.
| The Hartford Tax-Free National Fund |
| Schedule of Investments – (continued) |
| April 30, 2010 (Unaudited) |
| (000’s Omitted) |
| Shares or Principal Amount | | | Market Value ╪ | |
| MUNICIPAL BONDS - 97.6% - (continued) | | | | | | | |
| | | | Texas - 11.3% - (continued) | | | | | | | |
| | | | Houston, TX, Airport System Rev | | | | | | | |
| | $ | 1,070 | | 5.50%, 07/01/2034 | | | | | | $ | 1,129 | |
| | | 1,500 | | 6.75%, 07/01/2021 | | | | | | | 1,509 | |
| | | | | Houston, TX, Utility Systems Rev | | | | | | | | |
| | | 2,000 | | 6.00%, 11/15/2036 | | | | | | | 2,259 | |
| | | | | La Vernia, TX, Higher Education | | | | | | | | |
| | | 2,000 | | 6.38%, 08/15/2044 | | | | | | | 2,078 | |
| | | | | Lower Colorado River Auth Rev | | | | | | | | |
| | | 2,000 | | 7.25%, 05/15/2037 | | | | | | | 2,227 | |
| | | | | Mc Lennan County, TX, Public Fac | | | | | | | | |
| | | 2,000 | | 6.63%, 06/01/2035 | | | | | | | 2,186 | |
| | | | | North Texas Tollway Auth | | | | | | | | |
| | | 4,000 | | 6.00%, 01/01/2025 | | | | | | | 4,344 | |
| | | | | Tarrant County, TX, Cultural Education Facilities | | | | | | | | |
| | | 1,000 | | 6.25%, 11/15/2029 | | | | | | | 1,111 | |
| | | | | Texas Private Activity Surface Transportation | | | | | | | | |
| | | 2,000 | | 6.88%, 12/31/2039 | | | | | | | 2,097 | |
| | | | | Travis County, TX, Health Fac, Querencia Barton Creek Project | | | | | | | | |
| | | 1,000 | | 5.65%, 11/15/2035 | | | | | | | 809 | |
| | | | | Tyler, TX, ISD GO | | | | | | | | |
| | | 2,000 | | 5.00%, 02/15/2028 | | | | | | | 2,127 | |
| | | | | | | | | | | | 27,546 | |
| | | | | Virginia - 1.2% | | | | | | | | |
| | | | | Peninsula, VA, Turn Center Community Dev DA | | | | | | | | |
| | | 700 | | 6.45%, 09/01/2037 | | | | | | | 677 | |
| | | | | Virginia State Residential Auth | | | | | | | | |
| | | 500 | | 5.00%, 11/01/2024 | | | | | | | 566 | |
| | | | | Virginia Tobacco Settlement Funding Corp (Prerefunded with US Gov't Securities) | | | | | | | | |
| | | 1,455 | | 5.50%, 06/01/2026 | | | | | | | 1,606 | |
| | | | | | | | | | | | 2,849 | |
| | | | | Washington - 3.7% | | | | | | | | |
| | | | | FYI Properties Lease Rev | | | | | | | | |
| | | 2,285 | | 5.50%, 06/01/2034 | | | | | | | 2,452 | |
| | | | | King County, WA, ISD #210 GO | | | | | | | | |
| | | 670 | | 5.00%, 06/01/2019 | | | | | | | 703 | |
| | | | | Washington State Health Care FA Rev | | | | | | | | |
| | | 2,500 | | 5.63%, 10/01/2038 | | | | | | | 2,577 | |
| | | 2,400 | | 6.13%, 08/15/2037 | | | | | | | 2,473 | |
| | | 835 | | 6.50%, 11/15/2033 | | | | | | | 886 | |
| | | | | | | | | | | | 9,091 | |
| | | | | Wisconsin - 2.0% | | | | | | | | |
| | | | | Badger Tobacco Asset Securitization Corp of WI (Prerefunded with US Gov't Securities) | | | | | | | | |
| | | 2,165 | | 6.13%, 06/01/2027 | | | | | | | 2,321 | |
| | | 1,000 | | 6.38%, 06/01/2032 | | | | | | | 1,111 | |
| | | | | Wisconsin State General Fund GO | | | | | | | | |
| | | 125 | | 5.75%, 05/01/2033 | | | | | | | 136 | |
| | | 865 | | 6.00%, 05/01/2036 | | | | | | | 950 | |
| | | | | | | | | | | | 4,518 | |
| | | | | Wyoming - 1.3% | | | | | | | | |
| | | | | Campbell County, WY, Solid Waste Facilities | | | | | | | | |
| | | 3,000 | | 5.75%, 07/15/2039 | | | | | | | 3,212 | |
| | | | | | | | | | | | | |
| | | | | Total municipal bonds | | | | | | | | |
| | | | | (cost $237,833) | | | | | | $ | 241,441 | |
| | | | | | | | | | | | | |
| | | | | Total long-term investments | | | | | | | | |
| | | | | (cost $237,833) | | | | | | $ | 241,441 | |
| | | | | | | | | | | | | |
| SHORT-TERM INVESTMENTS - 1.7% | | | | | | | | |
| | | | | Investment Pools and Funds - 1.7% | | | | | | | | |
| | | 4,294 | | State Street Bank Tax Free Money Market Fund | | | | | | $ | 4,294 | |
| | | | | | | | | | | | | |
| | | | | Total short-term investments | | | | | | | | |
| | | | | (cost $4,294) | | | | | | $ | 4,294 | |
| | | | | | | | | | | | | |
| | | | | Total investments | | | | | | | | |
| | | | | (cost $242,127) ▲ | | | 99.3 | % | | $ | 245,735 | |
| | | | | Other assets and liabilities | | | 0.7 | % | | | 1,619 | |
| | | | | Total net assets | | | 100.0 | % | | $ | 247,354 | |
| Note: | Percentage of investments as shown is the ratio of the total market value to total net assets. |
| ▲ | At April 30, 2010, the cost of securities for federal income tax purposes was $242,127 and the aggregate gross unrealized appreciation and depreciation based on that cost were: |
| Unrealized Appreciation | | $ | 12,107 | |
| Unrealized Depreciation | | | (8,499 | ) |
| Net Unrealized Appreciation | | $ | 3,608 | |
| ● | Currently non-income producing. For long-term debt securities, items identified are in default as to payment of interest and/or principal. |
| ‡ | This security, or a portion of this security, has been segregated to cover funding requirements on investment transactions settling in the future. |
| ■ | Securities issued within terms of a private placement memorandum, exempt from registration under Rule 144A under the Securities Act of 1933, as amended, and may be sold only to qualified institutional buyers. Pursuant to guidelines adopted by the Board of Directors, these issues are determined to be liquid. The aggregate value of these securities at April 30, 2010, was $4,722, which represents 1.91% of total net assets. |
| ☼ | The cost of securities purchased on a when-issued or delayed delivery basis at April 30, 2010 was $1,984. |
The accompanying notes are an integral part of these financial statements.
| ⌂ | The following securities are considered illiquid. Illiquid securities are often purchased in private placement transactions, are often not registered under the Securities Act of 1933 and may have contractual restrictions on resale. A security may also be considered illiquid if the security lacks a readily available market or if its valuation has not changed for a certain period of time. |
| Period | | Shares/ | | | | | |
| Acquired | | Par | | Security | | Cost Basis | |
| 07/2004 | | $ | 1,000 | | Chicago, IL, Tax Increment Allocation Jr Lien Pilsen Redev B, 6.75%, 06/01/2022 | | $ | 1,000 | |
| 05/2007 | | $ | 1,800 | | Hampshire, IL, Special Service Area #13, Tuscany Woods Proj, 5.75%, 03/01/2037 | | | 1,800 | |
| 07/2007 | | $ | 1,000 | | Louisiana Public Fac Auth, Susla Fac, Inc., 5.75%, 07/01/2039 - 144A | | | 1,006 | |
| 04/2007 | | $ | 1,000 | | Reata, CO, North Metro Dist GO, 5.50%, 12/01/2032 - 144A | | | 1,000 | |
| 11/2007 | | $ | 915 | | River Bend Community Development Dist, Capital Improvement Rev, 0.00%, 11/01/2015 | | | 915 | |
| 11/2006 | | $ | 65 | | Rolling Hills Community Development Dist, 5.45%, 05/01/2037 | | | 65 | |
The aggregate value of these securities at April 30, 2010 was $4,021 which represents 1.63% of total net assets.
| AMT | | – | | Alternative Minimum Tax |
| DA | | – | | Development Authority |
| FA | | – | | Finance Authority |
| FGIC | | – | | Financial Guaranty Insurance Company |
| GO | | – | | General Obligations |
| IDA | | – | | Industrial Development Authority Bond |
| IDR | | – | | Industrial Development Revenue Bond |
| ISD | | – | | Independent School District |
| MBIA | | – | | Municipal Bond Insurance Association |
| PA | | – | | Port Authority |
| USD | | – | | United School District |
| ╪ | See Significant Accounting Policies of accompanying Notes to Financial Statements regarding valuation of securities. |
The accompanying notes are an integral part of these financial statements.
| The Hartford Tax-Free National Fund |
|
| April 30, 2010 (Unaudited) |
| (000’s Omitted) |
| | | Total | | | Level 1♦ | | | Level 2♦ | | | Level 3 | |
| Assets: | | | | | | | | | | | | |
| Municipal Bonds | | $ | 241,441 | | | $ | – | | | $ | 240,923 | | | $ | 518 | |
| Short-Term Investments | | | 4,294 | | | | 4,294 | | | | – | | | | – | |
| Total | | $ | 245,735 | | | $ | 4,294 | | | $ | 240,923 | | | $ | 518 | |
| ♦ | For the period ended April 30, 2010, there were no significant transfers between Level 1 and Level 2. |
Following is a reconciliation of Level 3 assets for which significant unobservable inputs were used to determine fair value:
| | | | | | | | | Change in | | | | | | | | | | | | | | | | |
| | | Balance as | | | | | | Unrealized | | | | | | | | | Transfers | | | Transfers | | | Balance as | |
| | | of October | | | Realized | | | Appreciation | | | | | | | | | Into | | | Out of Level | | | of April 30, | |
| | | 31, 2009 | | | Gain (Loss) | | | (Depreciation) | | | Purchases | | | Sales | | | Level 3 | | | 3 | | | 2010 | |
| Assets: | | | | | | | | | | | | | | | | | | | | | | | | | | |
| Municipal Bonds | | $ | — | | | $ | — | | | $ | 18 | * | | $ | 500 | | | $ | — | | | $ | — | | | $ | — | | | $ | 518 | |
| Total | | $ | — | | | $ | — | | | $ | 18 | | | $ | 500 | | | $ | — | | | $ | — | | | $ | — | | | $ | 518 | |
| * | Change in unrealized gains or losses in the current period relating to assets still held at April 30, 2010 was $18. |
The accompanying notes are an integral part of these financial statements
| The Hartford Tax-Free National Fund |
|
| April 30, 2010 (Unaudited) |
| (000’s Omitted) |
| Assets: | | | |
| Investments in securities, at market value (cost $242,127) | | $ | 245,735 | |
| Cash | | | — | |
| Receivables: | | | | |
| Fund shares sold | | | 212 | |
| Dividends and interest | | | 3,987 | |
| Other assets | | | 121 | |
| Total assets | | | 250,055 | |
| Liabilities: | | | | |
| Payables: | | | | |
| Investment securities purchased | | | 1,984 | |
| Fund shares redeemed | | | 471 | |
| Investment management fees | | | 13 | |
| Dividends | | | 191 | |
| Distribution fees | | | 10 | |
| Accrued expenses | | | 32 | |
| Total liabilities | | | 2,701 | |
| Net assets | | $ | 247,354 | |
| Summary of Net Assets: | | | | |
| Capital stock and paid-in-capital | | $ | 290,787 | |
| Accumulated undistributed net investment income | | | 129 | |
| Accumulated net realized loss on investments | | | (47,170 | ) |
| Unrealized appreciation of investments | | | 3,608 | |
| Net assets | | $ | 247,354 | |
| | | | | |
| Shares authorized | | | 19,300,000 | |
| Par value | | $ | 0.0001 | |
Class A: Net asset value per share/Maximum offering price per share | | | $9.28/$9.72 | |
| Shares outstanding | | | 15,980 | |
| Net assets | | $ | 148,226 | |
Class B: Net asset value per share | | $ | 9.20 | |
| Shares outstanding | | | 884 | |
| Net assets | | $ | 8,133 | |
Class C: Net asset value per share | | $ | 9.23 | |
| Shares outstanding | | | 4,717 | |
| Net assets | | $ | 43,529 | |
Class I: Net asset value per share | | $ | 9.29 | |
| Shares outstanding | | | 788 | |
| Net assets | | $ | 7,323 | |
Class L: Net asset value per share/Maximum offering price per share | | | $9.24/$9.68 | |
| Shares outstanding | | | 795 | |
| Net assets | | $ | 7,352 | |
Class Y: Net asset value per share | | $ | 9.25 | |
| Shares outstanding | | | 3,543 | |
| Net assets | | $ | 32,791 | |
The accompanying notes are an integral part of these financial statements.
| The Hartford Tax-Free National Fund |
|
| For the Six-Month Period Ended April 30, 2010 (Unaudited) |
| (000’s Omitted) |
| Investment Income: | | | |
| Interest | | $ | 7,031 | |
| Total investment income | | | 7,031 | |
| | | | | |
| Expenses: | | | | |
| Investment management fees | | | 621 | |
| Transfer agent fees | | | 51 | |
| Distribution fees | | | | |
| Class A | | | 188 | |
| Class B | | | 41 | |
| Class C | | | 216 | |
| Class L | | | 9 | |
| Custodian fees | | | 3 | |
| Accounting services fees | | | 17 | |
| Registration and filing fees | | | 44 | |
| Board of Directors' fees | | | 4 | |
| Audit fees | | | 5 | |
| Other expenses | | | 25 | |
| Total expenses (before waivers and fees paid indirectly) | | | 1,224 | |
| Expense waivers | | | (29 | ) |
| Custodian fee offset | | | — | |
| Total waivers and fees paid indirectly | | | (29 | ) |
| Total expenses, net | | | 1,195 | |
| Net Investment Income | | | 5,836 | |
| Net Realized Loss on Investments: | | | | |
| Net realized loss on investments in securities | | | (4,042 | ) |
| Net Realized Loss on Investments | | | (4,042 | ) |
| Net Changes in Unrealized Appreciation of Investments: | | | | |
| Net unrealized appreciation of investments | | | 8,512 | |
| Net Changes in Unrealized Appreciation of Investments | | | 8,512 | |
| Net Gain on Investments | | | 4,470 | |
| Net Increase in Net Assets Resulting from Operations | | $ | 10,306 | |
The accompanying notes are an integral part of these financial statements
| The Hartford Tax-Free National Fund |
(000’s Omitted)
| | | For the Six-Month | | | | |
| | | Period Ended | | | For the | |
| | | April 30, 2010 | | | Year Ended | |
| | | (Unaudited) | | | October 31, 2009 | |
| Operations: | | | | | | |
| Net investment income | | $ | 5,836 | | | $ | 10,419 | |
| Net realized loss on investments | | | (4,042 | ) | | | (16,622 | ) |
| Net unrealized appreciation of investments | | | 8,512 | | | | 30,505 | |
| Net Increase In Net Assets Resulting From Operations | | | 10,306 | | | | 24,302 | |
| Distributions to Shareholders: | | | | | | | | |
| From net investment income | | | | | | | | |
| Class A | | | (3,596 | ) | | | (6,616 | ) |
| Class B | | | (168 | ) | | | (315 | ) |
| Class C | | | (874 | ) | | | (1,444 | ) |
| Class I | | | (173 | ) | | | (298 | ) |
| Class L | | | (174 | ) | | | (333 | ) |
| Class Y | | | (825 | ) | | | (1,464 | ) |
| Total distributions | | | (5,810 | ) | | | (10,470 | ) |
| Capital Share Transactions: | | | | | | | | |
| Class A | | | (6,139 | ) | | | 29,626 | * |
| Class B | | | (637 | ) | | | 2,903 | † |
| Class C | | | 21 | | | | 13,317 | ‡ |
| Class I | | | 296 | | | | 1,831 | |
| Class L | | | 32 | | | 1,016 | § |
| Class Y | | | (1,035 | ) | | | 13,063 | ** |
| Net increase (decrease) from capital share transactions | | | (7,462 | ) | | | 61,756 | |
| Net Increase (Decrease) In Net Assets | | | (2,966 | ) | | | 75,588 | |
| Net Assets: | | | | | | | | |
| Beginning of period | | | 250,320 | | | | 174,732 | |
| End of period | | $ | 247,354 | | | $ | 250,320 | |
| Accumulated undistributed (distribution in excess of) net investment income (loss) | | $ | 129 | | | $ | 103 | |
* Includes merger activity in the amount of $38,488.
† Includes merger activity in the amount of $3,184.
‡ Includes merger activity in the amount of $9,178.
§ Includes merger activity in the amount of $2,261.
** Includes merger activity in the amount of $15,883.
The accompanying notes are an integral part of these financial statements.
| The Hartford Tax-Free National Fund |
April 30, 2010 (Unaudited)
(000’s Omitted)
The Hartford Mutual Funds II, Inc. (“Company”) is an open-end management investment company comprised of five portfolios. Financial statements for The Hartford Tax-Free National Fund (the “Fund”), a series of the Company, are included in this report.
The Company is organized under the laws of the State of Maryland and is registered with the Securities and Exchange Commission (“SEC”) under the Investment Company Act of 1940, as amended (“1940 Act”). The Fund is a diversified open-end management investment company.
Class A shares are sold with a front-end sales charge of up to 4.50%. Class B shares were sold with a contingent deferred sales charge which is assessed on the lesser of the per share net asset value (“NAV”) of the shares at the time of redemption or the original purchase price, and declines from up to 5.00% to zero depending on the period of time the shares are held (See note below regarding the closing of Class B shares). Class C shares are sold with a contingent deferred sales charge of up to 1.00% on shares redeemed within twelve months of purchase. Class I shares are sold without sales charges to certain eligible investors through advisory fee-based wrap programs. Class L shares are sold with a sales charge of up to 4.50%. Class Y shares, which are sold to certain eligible institutional investors, are sold without a sales charge. All classes of shares have identical voting, redemption, dividend, liquidation and other rights and the same terms and conditions, with the exceptions that each class may have different expenses, which may affect performance, and that Class B shares automatically convert to Class A shares after 8 years.
No new or additional investments are allowed in Class B shares of The Hartford Mutual Funds (including investments through any systematic investment plan). Existing shareholders of Class B shares may continue to hold their Class B shares, exchange their Class B shares for Class B shares of another Hartford Mutual Fund (as permitted by existing exchange privileges), or redeem their Class B shares as described in the Fund’s prospectus. Reinstatement privileges with respect to Class B shares will continue under the current policy. For investors electing to reinvest capital gains and dividends, any such capital gains or dividends on Class B shares will continue to be reinvested in Class B shares of the Fund. All Class B share attributes, including the 12b-1 fee, contingent deferred sales charge schedule, and conversion to Class A shares remain unchanged.
| 2. | Significant Accounting Policies: |
The following is a summary of significant accounting policies of the Fund, which are in accordance with U.S. Generally Accepted Accounting Principles (“GAAP”).
| a) | Security Transactions and Investment Income – Security transactions are recorded on the trade date (the date the order to buy or sell is executed). Security gains and losses are determined on the basis of identified cost. |
Interest income, including amortization of premium and accretion of discounts, is accrued on a daily basis.
| b) | Security Valuation – The Fund generally uses market prices in valuing portfolio securities. If market prices are not readily available or are deemed unreliable, the Fund will use the fair value of the security as determined in good faith under policies and procedures established by and under the supervision of the Fund’s Board of Directors. Market prices may be deemed unreliable, for example, if a security is thinly traded or if an event has occurred after the close of the security’s primary market, but before the close of the New York Stock Exchange (the “Exchange”) (generally 4:00 p.m. Eastern Time, referred to as the “Valuation Time”) that is expected to affect the value of the portfolio security. The circumstances in which the Fund may use fair value pricing include, among others: (i) the occurrence of events that are significant to a particular issuer, such as mergers, restructuring or defaults; (ii) the occurrence of events that are significant to an entire market, such as natural disasters in a particular region or governmental actions; (iii) trading restrictions on securities; (iv) thinly traded securities and (v) market events such as trading halts and early market closings. Securities that are primarily traded on foreign markets may trade on days that are not business days of the Fund. |
The value of the foreign securities in which the Fund invests may change on days when a shareholder will not be able to purchase or redeem shares of the Fund. Fair value pricing is subjective in nature and the use of fair value pricing by the Fund may cause the NAV of its shares to differ significantly from the NAV that would have been calculated using market prices at the close of the exchange on which a portfolio security is primarily traded but before the Valuation Time. There can be no assurance that the Fund could obtain the fair value assigned to a security if the Fund were to sell the security at approximately the time at which the Fund determines its NAV.
Debt securities (other than short-term obligations) held by the Fund are valued using bid prices or using valuations based on a matrix system (which considers factors such as security prices, yield, maturity and ratings) as provided by independent pricing services. Securities for which prices are not available from an independent pricing service may be valued using market quotations obtained from one or more dealers that make markets in the securities in accordance with procedures established by the Fund’s Board of Directors. Generally, the Fund may use fair valuation in regard to debt securities when the Fund holds defaulted or distressed securities or securities in a company in which a reorganization is pending. Short-term investments with a maturity of more than 60 days when purchased are valued based on market quotations until the remaining days to maturity become less than 61 days. Investments that mature in 60 days or less are generally valued at amortized cost, which approximates market value.
Financial instruments for which prices are not available from an independent pricing service are valued using market quotations obtained from one or more dealers that make markets in securities in accordance with procedures established by the Fund’s Board of Directors.
Other derivative or contractual type instruments shall be valued using market prices if such instruments trade on an exchange or market. If such instruments do not trade on an exchange or market, such instruments shall be valued at a price at which the counterparty to such contract would repurchase the instrument. In the event that the counterparty cannot provide a price, such valuation may be determined in accordance with procedures established by the Fund’s Board of Directors.
Investments in open-end mutual funds are valued at the respective NAV of each open-end mutual fund on the valuation date.
Various inputs are used in determining the value of the Fund’s investments. These inputs are summarized into three broad hierarchy levels. This hierarchy is based on whether the valuation inputs are observable or unobservable. These levels are:
| · | Level 1 – Quoted prices in active markets for identical securities. Level 1 may include exchange-traded instruments such as domestic equities, some foreign equities, options, futures, mutual funds, ETF’s, and rights and warrants. |
| · | Level 2 – Observable inputs other than Level 1 prices, such as quoted prices for similar securities; quoted prices in markets that are not active; or other inputs that are observable or can be corroborated by observable market data for substantially the full term of the security. Level 2 may include debt securities that are traded less frequently than exchange-traded instruments and which are valued using third party pricing services; foreign equities, whose value is determined using a multi-factor regression model with inputs that are observable in the market; and money market instruments, which are carried at amortized cost. |
| · | Level 3 – Significant unobservable inputs that are supported by little or no market activity. Level 3 may include financial instruments whose values are determined using broker quotes or require significant management judgment or estimation. These unobservable valuation inputs may include estimates for current yields, maturity/duration, prepayment speed, and broker quotes for comparable securities along with other assumptions relating to credit quality, collateral value, complexity of the security structure, general market conditions and liquidity. This category may include securities where trading has been halted or there are certain restrictions on trading. While these securities are priced using unobservable inputs, the valuation of these securities reflects the best available data and management believes the prices are a reasonable representation of exit price. |
| The Hartford Tax-Free National Fund |
Notes to Financial Statements – (continued)
April 30, 2010 (Unaudited)
(000’s Omitted)
Individual securities within any of the above mentioned asset classes may be assigned a different hierarchical level than those that presented above, as individual circumstances dictate.
For purposes of the roll forward reconciliation for all Level 3 securities from the beginning of the reporting period to the end of the reporting period, transfers in and out are shown as if they occurred at the beginning of the period.
Refer to the Investment Valuation Hierarchy Level Summary and the Level 3 roll forward reconciliation found following the Schedule of Investments.
| c) | Fund Share Valuation and Dividend Distributions to Shareholders – Orders for the Fund’s shares are executed in accordance with the investment instructions of the shareholders. The NAV of the Fund’s shares is determined as of the close of each business day of the Exchange. The NAV is determined separately for each class of the Fund by dividing the Fund’s net assets attributable to that class by the number of shares of the class outstanding. Orders for the purchase of the Fund’s shares prior to the close of the Exchange on any day on which the Exchange is open for business are priced at the NAV determined as of the close of the Exchange. Orders after the close of the Exchange, or on a day on which the Exchange and/or the Fund is not open for business, are priced at the next determined NAV. |
The Fund intends to distribute substantially all of its net investment income and net realized capital gains to shareholders no less frequently than once a year. Normally, dividends from net investment income of the Fund are declared daily and paid monthly. Dividends are paid on shares beginning on the business day after the day when the funds used to purchase the shares are collected by the transfer agent for the Fund. Unless shareholders specify otherwise, all dividends will be automatically reinvested in additional full or fractional shares of the Fund.
Distributions from net investment income, realized capital gains and capital are determined in accordance with federal income tax regulations, which may differ from U.S. GAAP with respect to character and timing. These differences may include but are not limited to losses deferred due to wash sale adjustments, foreign currency gains and losses, adjustments related to Passive Foreign Investment Companies (“PFICs”), Real Estate Investment Trusts (“REITs”), Regulated Investment Companies (“RICs”), certain derivatives and partnerships. Permanent book and federal income tax basis differences relating to shareholder distributions will result in reclassifications to certain of the Fund’s capital accounts (see Federal Income Taxes: Reclassification of Capital Accounts footnote).
| d) | Illiquid and Restricted Securities – The Fund is permitted to invest up to 15% of its net assets in illiquid securities. “Illiquid Securities” are those that may not be sold or disposed of in the ordinary course of business within seven days, at approximately the price used to determine the Fund’s NAV. The Fund may not be able to sell illiquid securities or other investments when its sub-adviser considers it desirable to do so or may have to sell such securities or investments at a price that is lower than the price that could be obtained if the securities or investments were more liquid. A sale of illiquid securities or other investments may require more time and may result in higher dealer discounts and other selling expenses than does the sale of those that are liquid. Illiquid securities and investments also may be more difficult to value, due to the unavailability of reliable market quotations for such securities or investments, and an investment in them may have an adverse impact on the Fund’s NAV. The Fund may also purchase certain restricted securities, commonly known as Rule 144A securities, that can be resold to institutions and which may be determined to be liquid pursuant to policies and guidelines established by the Fund’s Board of Directors. The Fund, as shown on the Schedule of Investments, had illiquid and/or restricted securities as of April 30, 2010. |
| e) | Securities Purchased on a When-Issued or Delayed-Delivery Basis – Delivery and payment for securities that have been purchased by the Fund on a forward commitment, or when-issued or delayed-delivery basis, take place beyond the customary settlement period. During this period, such securities are subject to market fluctuations, and the Fund identifies securities segregated in its records with value at least equal to the amount of the commitment. The Fund, as shown on the Schedule of Investments, had when-issued or delayed delivery securities as of April 30, 2010. |
| f) | Credit Risk – Credit risk depends largely on the perceived financial health of bond issuers. In general, the credit rating is inversely related to the credit risk of the issuer. Higher rated bonds generally are deemed to have less credit risk, while lower or unrated bonds are deemed to have higher risk of default. The share price, yield and total return of a Fund which holds securities with higher credit risk may be more volatile than funds holding bonds with lower credit risk. |
| g) | Prepayment/Interest Rate Risks – Certain debt securities allow for prepayment of principal without penalty. Securities subject to prepayment risk generally offer less potential for gains when interest rates decline. In addition, with respect to securities, rising interest rates may cause prepayments to occur at a slower than expected rate, thereby effectively lengthening the maturity of the security and making the security more sensitive to interest rate changes. Prepayment risk is a major risk of mortgage-backed securities and certain asset-backed securities. Accordingly, the potential for the value of a debt security to increase in response to interest rate declines is limited. For certain securities, the actual maturity may be less than the stated maturity shown in the Schedule of Investments. As a result, the timing of income recognition relating to these securities may vary based upon the actual maturity. |
The market value of debt securities held by the Fund may be affected by fluctuations in market interest rates. The market value of these investments tends to decline when interest rates rise and tends to increase when interest rates fall.
| h) | Use of Estimates – The preparation of financial statements in conformity with U.S. GAAP requires management to make estimates and assumptions that affect the reported amounts of assets and liabilities as of the date of the financial statements and the reported amounts of income and expenses during the period. Operating results in the future could vary from the amounts derived from management’s estimates. |
| i) | Indemnifications – Under the Company’s organizational documents, the Company shall indemnify its officers and directors to the full extent required or permitted under Maryland General Corporation Law and the federal securities law. In addition, the Company, on behalf of the Fund, may enter into contracts that contain a variety of indemnifications. The Company’s maximum exposure under these arrangements is unknown. However, the Company has not had prior claims or losses pursuant to these contracts and expects the risk of loss to be remote. |
| a) | Federal Income Taxes – For federal income tax purposes, the Fund intends to continue to qualify as a RIC under Subchapter M of the Internal Revenue Code (“IRC”) by distributing substantially all of its taxable net investment income and net realized capital gains to its shareholders and otherwise complying with the requirements of RICs. The Fund has distributed substantially all of its income and capital gains in prior years and intends to distribute substantially all of its income and capital gains during the calendar year ending December 31, 2010. Accordingly, no provision for federal income or excise taxes has been made in the accompanying financial statements. Distributions from short-term capital gains are treated as ordinary income distributions for federal income tax purposes. |
| b) | Net Investment Income (Loss), Net Realized Gains (Losses) – Net investment income (loss) and net realized gains (losses) may differ for financial statement and tax purposes primarily because of losses deferred due to wash sale adjustments, foreign currency gains and losses, adjustments related to PFICs, REITs, RICs, certain derivatives and partnerships. The character of distributions made during the year from net investment income or net realized gains may differ from their ultimate characterization for federal income tax purposes. Also, due to the timing of dividend distributions, the fiscal year in which amounts are distributed may differ from the year that the income or realized gains (losses) were recorded by the Fund. |
| c) | Distributions and Components of Distributable Earnings – The tax character of distributions paid by the Fund for the periods indicated is as follows (as adjusted for dividends payable): |
| The Hartford Tax-Free National Fund |
Notes to Financial Statements – (continued)
April 30, 2010 (Unaudited)
(000’s Omitted)
| | | For the Year Ended | | | For the Year Ended | |
| | | October 31, 2009 | | | October 31, 2008 | |
Tax Exempt Income † | | $ | 10,453 | | | $ | 9,273 | |
| Ordinary Income | | | 8 | | | | — | |
† The Fund designates these distributions as exempt interest pursuant to IRC Sec. 852(b)(5).
As of October 31, 2009, the Fund’s components of distributable earnings (deficit) on a tax basis were as follows:
| | | Amount | |
| Undistributed Ordinary Income | | $ | 307 | |
| Accumulated Capital Losses * | | | (43,128 | ) |
Unrealized Depreciation † | | | (4,904 | ) |
| Total Accumulated Deficit | | $ | (47,725 | ) |
| * | The Fund has capital loss carryforwards that are identified in the Capital Loss Carryforward note that follows. |
| † | The differences between book-basis and tax-basis unrealized appreciation (depreciation) may be attributable to the losses deferred due to wash sale adjustments, foreign currency gains and losses, adjustments related to PFICs, REITs, RICs, certain derivatives and partnerships. |
| d) | Reclassification of Capital Accounts – The Fund may record reclassifications in its capital accounts. These reclassifications have no impact on the total net assets of the Fund. The reclassifications are a result of permanent differences between GAAP and tax accounting for such items as net operating losses that reduce distribution requirements. Adjustments are made to reflect the impact these items have on current and future distributions to shareholders. Therefore, the source of the Fund’s distributions may be shown in the accompanying Statement of Changes in Net Assets as from net investment income, from net realized gains on investments or from capital depending on the type of book and tax differences that exist. For the year ended October 31, 2009, the Fund had no reclassifications. |
| e) | Capital Loss Carryforward – At October 31, 2009 (tax-year-end), the Fund had capital loss carryforwards for U.S. federal income tax purposes of approximately: |
| Year of Expiration | | Amount | |
| 2013 | | $ | 5 | |
| 2014 | | | 433 | |
| 2015 | | | 2,885 | |
| 2016 | | | 23,184 | |
| 2017 | | | 16,621 | |
| Total | | $ | 43,128 | |
As a result of current or past mergers in the Fund, certain provisions in the Internal Revenue Code may limit the future utilization of capital losses.
| f) | Accounting for Uncertainty in Income Taxes – Management has evaluated all open tax years and has determined there is no impact to the Fund’s financial statements related to uncertain tax positions. Generally, tax authorities can examine all tax returns filed for the last three years. |
| a) | Investment Management Agreement – Hartford Investment Financial Services, LLC (“HIFSCO”) serves as investment manager to the Fund pursuant to an Investment Management Agreement with the Company. As investment manager, HIFSCO has overall investment supervisory responsibility for the Fund. In addition, HIFSCO provides administrative personnel, services, equipment, facilities and office space for proper operation of the Fund. HIFSCO has contracted with Hartford Investment Management Company (“Hartford Investment Management”) for the provision of day-to-day investment management services to the Fund in accordance with the Fund’s investment objective and policies. The Fund pays a fee to HIFSCO, a portion of which may be used to compensate Hartford Investment Management. |
The schedule below reflects the rates of compensation paid to HIFSCO for investment management services rendered during the six-month period ended April 30, 2010; the rates are accrued daily and paid monthly:
| Average Daily Net Assets | | Annual Fee | |
| On first $500 million | | | 0.50 | % |
| On next $4.5 billion | | | 0.45 | % |
| On next $5 billion | | | 0.43 | % |
| Over$10 billion | | | 0.42 | % |
| b) | Accounting Services Agreement – Pursuant to the Fund Accounting Agreement between Hartford Life Insurance Company (“HLIC”) and the Fund, HLIC provides accounting services to the Fund and receives monthly compensation on the Fund’s average net assets. The Fund’s accounting services fees are accrued daily and paid monthly. |
| Average Daily Net Assets | | Annual Fee | |
| On first $5 billion | | | 0.014 | % |
| On next $5 billion | | | 0.012 | % |
| Over $10 billion | | | 0.010 | % |
| c) | Operating Expenses – Allocable expenses incurred by the Company are allocated to each Fund and allocated to classes within the Fund in proportion to the average daily net assets of the Fund and each class, except where allocation of certain expenses is more fairly made directly to the Fund or to specific classes within a Fund. During the six-month period ended April 30, 2010, HIFSCO has contractually limited the total operating expenses of this Fund, exclusive of taxes, interest expense, brokerage commissions, certain distribution expenses and extraordinary expenses as follows: |
| | Class A | | | Class B | | | Class C | | | Class I | | | Class L | | | Class Y | |
| | | 0.85 | % | | | 1.60 | % | | | 1.60 | % | | | 0.60 | % | | | 0.80 | % | | | 0.60 | % |
| d) | Fees Paid Indirectly – The Fund’s custodian bank has agreed to reduce its fees when the Fund maintains cash on deposit in the non-interest-bearing custody account. For the six-month period ended April 30, 2010, this amount is included in the Statement of Operations. |
The ratio of expenses to average net assets in the accompanying financial highlights excludes the reduction in expenses related to fees paid indirectly. Had the fees paid indirectly been included, the annualized expense ratio for the periods listed below would have been as follows:
| | | Annualized | | | | | | | | | | | | | | | | |
| | | Six-Month | | | | | | | | | | | | | | | | |
| | | Period | | | Year Ended | | | Year Ended | | | Year Ended | | | Year Ended | | | Year Ended | |
| | | Ended April | | | October 31, | | | October 31, | | | October 31, | | | October 31, | | | October 31, | |
| | | | 30, 2010 | | | 2009 | | | 2008 | | | 2007 | | | 2006 | | | 2005 | |
| Class A Shares | | | 0.85 | % | | | 0.85 | % | | | 0.85 | % | | | 0.85 | % | | | 1.00 | % | | | 1.00 | % |
| Class B Shares | | | 1.60 | | | | 1.60 | | | | 1.60 | | | | 1.60 | | | | 1.75 | | | | 1.75 | |
| Class C Shares | | | 1.60 | | | | 1.60 | | | | 1.60 | | | | 1.60 | | | | 1.75 | | | | 1.75 | |
| Class I Shares | | | 0.60 | | | | 0.60 | | | | 0.60 | | | | 0.60 | * | | | | | | | | |
| Class L Shares | | | 0.80 | | | | 0.80 | | | | 0.80 | | | | 0.86 | | | | 1.05 | | | | 1.05 | |
| Class Y Shares | | | 0.58 | | | | 0.59 | | | | 0.60 | | | | 0.64 | | | | 0.89 | | | | 0.95 | |
* From May 31, 2007 (commencement of operations), through October 31, 2007.
| The Hartford Tax-Free National Fund |
Notes to Financial Statements – (continued)
April 30, 2010 (Unaudited)
| e) | Distribution and Service Plan for Class A, B, C and L Shares – HIFSCO is the principal underwriter and distributor of the Fund. HIFSCO is engaged in distribution activities, which include marketing and distribution of shares through broker-dealers, financing distribution costs and maintaining financial books and records. For the six-month period ended April 30, 2010, HIFSCO received front-end load sales charges of $262 and contingent deferred sales charges of $13 from the Fund. |
The Fund has adopted a Distribution and Service Plan in accordance with Rule 12b-1 of the Investment Company Act of 1940, as amended, to compensate the distributor (HIFSCO) for activities intended to result in the sale and distribution of Classes A, B, C and L shares and for providing services for shareholders. The Rule 12b-1 plan applicable to Class A shares of the Fund provides for payment of a Rule 12b-1 fee of up to 0.35% of average daily net assets; however, the Board of Directors has currently authorized 12b-1 payments of up to 0.25%. Some or all of the fee may be used for shareholder servicing expenses with the remainder used for distribution expenses. Some or the entire Rule 12b-1 fee for Class B shares may be remitted to broker-dealers for distribution and/or shareholder account services. Under the Class B Plan, the Fund pays the distributor 1.00% of the average daily net assets of Class B shares that are outstanding for 8 years or less, 0.25% of which is a fee for services provided to existing shareholders with the remainder used for distribution expenses. After eight years, Class B shares convert to Class A shares. Upon conversion to Class A shares, the Class A plan described above will apply to those shares. Under the Class C Plan, the Fund pays the distributor 1.00% of the average daily net assets of Class C shares outstanding, 0.25% of which is intended as a fee for services provided to existing shareholders with the remainder used for distribution expenses. For Class C shares, some or the entire fee may be remitted to broker-dealers for distribution and/or shareholder account services. Class L has a distribution fee of 0.25%. The Fund’s 12b-1 fees are accrued daily and paid monthly.
For the six-month period ended April 30, 2010, total sales commissions paid to affiliated brokers/dealers of The Hartford for distributing the Fund’s shares were $8. These commissions are in turn paid to sales representatives of the broker/dealers.
| f) | Other Related Party Transactions – Certain officers of the Fund are directors and/or officers of HIFSCO and/or The Hartford or its subsidiaries. For the six-month period ended April 30, 2010, a portion of the Fund’s chief compliance officer’s salary was paid by all the investment companies in the Hartford fund complex. The portion allocated to the Fund rounds to zero. Hartford Administrative Services Company (“HASCO”), an indirect wholly owned subsidiary of The Hartford, provides transfer agent services to the Fund. HASCO has contractually agreed to reimburse any portion of the transfer agency fees over 0.30% of average daily net assets per fiscal year for all classes. HASCO was compensated $53 for providing such services. These fees are accrued daily and paid monthly. |
As of April 30, 2010, affiliates of The Hartford had ownership of shares in the Fund as follows:
| 6. | Investment Transactions: |
For the six-month period ended April 30, 2010, the Fund's aggregate purchases and sales of investment securities (excluding short-term investments) were as follows:
| | | Amount | |
| Cost of Purchases Excluding U.S. Government Obligations | | $ | 19,670 | |
| Sales Proceeds Excluding U.S. Government Obligations | | | 28,270 | |
| 7. | Capital Share Transactions: |
The following information is for the six-month period ended April 30, 2010 and the year ended October 31, 2009:
| | | For the Six-Month Period Ended April 30, 2010 | | | For the Year Ended October 31, 2009 | |
| | | | | | Shares | | | | | | Shares | | | | | | | | | Shares | | | | | | Shares | | | | |
| | | | | | Issued for | | | | | | Issued | | | Net Increase | | | | | | Issued for | | | | | | Issued | | | Net Increase | |
| | | Shares | | | Reinvested | | | Shares | | | from | | | (Decrease) of | | | Shares | | | Reinvested | | | Shares | | | from | | | (Decrease) of | |
| | | Sold | | | Dividends | | | Redeemed | | | Merger | | | Shares | | | Sold | | | Dividends | | | Redeemed | | | Merger | | | Shares | |
| Class A | | | | | | | | | | | | | | | | | | | | | | | | | | | | | | |
| Shares | | | 1,948 | | | | 329 | | | | (2,942 | ) | | | — | | | | (665 | ) | | | 6,305 | | | | 624 | | | | (7,862 | ) | | | 4,486 | | | | 3,553 | |
| Amount | | $ | 17,825 | | | $ | 3,015 | | | $ | (26,979 | ) | | $ | — | | | $ | (6,139 | ) | | $ | 53,944 | | | $ | 5,410 | | | $ | (68,216 | ) | | $ | 38,488 | | | $ | 29,626 | |
| Class B | | | | | | | | | | | | | | | | | | | | | | | | | | | | | | | | | | | | | | | | |
| Shares | | | 27 | | | | 15 | | | | (112 | ) | | | — | | | | (70 | ) | | | 260 | | | | 30 | | | | (319 | ) | | | 376 | | | | 347 | |
| Amount | | $ | 247 | | | $ | 133 | | | $ | (1,017 | ) | | $ | — | | | $ | (637 | ) | | $ | 2,192 | | | $ | 260 | | | $ | (2,733 | ) | | $ | 3,184 | | | $ | 2,903 | |
| Class C | | | | | | | | | | | | | | | | | | | | | | | | | | | | | | | | | | | | | | | | |
| Shares | | | 579 | | | | 67 | | | | (643 | ) | | | — | | | | 3 | | | | 1,966 | | | | 119 | | | | (1,599 | ) | | | 1,073 | | | | 1,559 | |
| Amount | | $ | 5,276 | | | $ | 613 | | | $ | (5,868 | ) | | $ | — | | | $ | 21 | | | $ | 16,764 | | | $ | 1,028 | | | $ | (13,653 | ) | | $ | 9,178 | | | $ | 13,317 | |
| Class I | | | | | | | | | | | | | | | | | | | | | | | | | | | | | | | | | | | | | | | | |
| Shares | | | 82 | | | | 17 | | | | (67 | ) | | | — | | | | 32 | | | | 327 | | | | 31 | | | | (144 | ) | | | — | | | | 214 | |
| Amount | | $ | 754 | | | $ | 154 | | | $ | (612 | ) | | $ | �� | | | $ | 296 | | | $ | 2,843 | | | $ | 271 | | | $ | (1,283 | ) | | $ | — | | | $ | 1,831 | |
| Class L | | | | | | | | | | | | | | | | | | | | | | | | | | | | | | | | | | | | | | | | |
| Shares | | | 3 | | | | 15 | | | | (15 | ) | | | — | | | | 3 | | | | 29 | | | | 30 | | | | (205 | ) | | | 268 | | | | 122 | |
| Amount | | $ | 34 | | | $ | 137 | | | $ | (139 | ) | | $ | — | | | $ | 32 | | | $ | 248 | | | $ | 256 | | | $ | (1,749 | ) | | $ | 2,261 | | | $ | 1,016 | |
| Class Y | | | | | | | | | | | | | | | | | | | | | | | | | | | | | | | | | | | | | | | | |
| Shares | | | 9 | | | | 68 | | | | (191 | ) | | | — | | | | (114 | ) | | | 11 | | | | 123 | | | | (464 | ) | | | 1,879 | | | | 1,549 | |
| Amount | | $ | 85 | | | $ | 618 | | | $ | (1,738 | ) | | $ | — | | | $ | (1,035 | ) | | $ | 89 | | | $ | 1,067 | | | $ | (3,976 | ) | | $ | 15,883 | | | $ | 13,063 | |
The following reflects the conversion of Class B Shares into Class A Shares (reflected as Class A Shares issued) for the six-month period ended April 30, 2010 and the year ended October 31, 2009:
| | | Shares | | | Dollars | |
| For the Six-Month Period Ended April 30, 2010 | | | 7 | | | $ | 60 | |
| For the Year Ended October 31, 2009 | | | 11 | | | $ | 93 | |
The Fund is one of several Hartford Funds that participate in a $500 million committed revolving line of credit facility. The facility is to be used for temporary or emergency purposes. Under the arrangement, the Fund is required to own securities having a market value in excess of 300% of the total bank borrowings. The interest rate on borrowings varies depending on the nature of the loan. The facility also requires a fee to be paid based on the amount of the commitment. This fee is allocated to all the Funds participating in the line of credit based on the average net assets of the Funds. During the six-month period ended April 30, 2010, the Fund did not have any borrowings under this facility.
Management has evaluated subsequent events and determined that no additional items require recording or disclosure.
| The Hartford Tax-Free National Fund |
| - Selected Per-Share Data (A) - |
| | | Net Asset | | | | | | | | | Net Realized | | | | | | | | | | | | | | | | | | Net Increase | | | | |
| | | Value at | | | | | | | | | and Unrealized | | | Total from | | | Dividends from | | | Distributions | | | | | | | | | (Decrease) in | | | Net Asset | |
| | | Beginning of | | | Net Investment | | | Payments from | | | Gain (Loss) on | | | Investment | | | Net Investment | | | from Realized | | | Distributions | | | Total | | | Net Asset | | | Value at End | |
Class | | Period | | | Income (Loss) | | | (to) Affiliate | | | Investments | | | Operations | | | Income | | | Capital Gains | | | from Capital | | | Distributions | | | Value | | | of Period | |
| | | | | | | | | | | | | | | | | |
For the Six-Month Period Ended April 30, 2010 (Unaudited) | | | | | | | | | | | | | | | | |
A | | $ | 9.11 | | | $ | 0.22 | | | $ | – | | | $ | 0.17 | | | $ | 0.39 | | | $ | (0.22 | ) | | $ | – | | | $ | – | | | $ | (0.22 | ) | | $ | 0.17 | | | $ | 9.28 | |
B | | | 9.04 | | | | 0.18 | | | | – | | | | 0.17 | | | | 0.35 | | | | (0.19 | ) | | | – | | | | – | | | | (0.19 | ) | | | 0.16 | | | | 9.20 | |
C | | | 9.07 | | | | 0.18 | | | | – | | | | 0.17 | | | | 0.35 | | | | (0.19 | ) | | | – | | | | – | | | | (0.19 | ) | | | 0.16 | | | | 9.23 | |
I | | | 9.13 | | | | 0.23 | | | | – | | | | 0.16 | | | | 0.39 | | | | (0.23 | ) | | | – | | | | – | | | | (0.23 | ) | | | 0.16 | | | | 9.29 | |
L | | | 9.08 | | | | 0.22 | | | | – | | | | 0.16 | | | | 0.38 | | | | (0.22 | ) | | | – | | | | – | | | | (0.22 | ) | | | 0.16 | | | | 9.24 | |
Y | | | 9.09 | | | | 0.23 | | | | – | | | | 0.16 | | | | 0.39 | | | | (0.23 | ) | | | – | | | | – | | | | (0.23 | ) | | | 0.16 | | | | 9.25 | |
| | | | | | | | | | | | | | | | | | | | | | | | | | | | | | | | | | | | | | |
| For the Year Ended October 31, 2009 | | | | | | | | | | | | | | | | | | | | | | | | | | | | | | | | | | | | | |
A | | | 8.67 | | | | 0.43 | | | | – | | | | 0.44 | | | | 0.87 | | | | (0.43 | ) | | | – | | | | – | | | | (0.43 | ) | | | 0.44 | | | | 9.11 | |
B | | | 8.61 | | | | 0.36 | | | | – | | | | 0.44 | | | | 0.80 | | | | (0.37 | ) | | | – | | | | – | | | | (0.37 | ) | | | 0.43 | | | | 9.04 | |
C | | | 8.63 | | | | 0.37 | | | | – | | | | 0.44 | | | | 0.81 | | | | (0.37 | ) | | | – | | | | – | | | | (0.37 | ) | | | 0.44 | | | | 9.07 | |
I | | | 8.69 | | | | 0.45 | | | | – | | | | 0.45 | | | | 0.90 | | | | (0.46 | ) | | | – | | | | – | | | | (0.46 | ) | | | 0.44 | | | | 9.13 | |
L | | | 8.64 | | | | 0.48 | | | | – | | | | 0.40 | | | | 0.88 | | | | (0.44 | ) | | | – | | | | – | | | | (0.44 | ) | | | 0.44 | | | | 9.08 | |
Y | | | 8.65 | | | | 0.45 | | | | – | | | | 0.45 | | | | 0.90 | | | | (0.46 | ) | | | – | | | | – | | | | (0.46 | ) | | | 0.44 | | | | 9.09 | |
| | | | | | | | | | | | | | | | | | | | | | | | | | | | | | | | | | | | | | |
| For the Year Ended October 31, 2008 (G) | | | | | | | | | | | | | | | | | | | | | | | | | | | | | | | | | | | | | |
A | | | 10.88 | | | | 0.48 | | | | – | | | | (2.21 | ) | | | (1.73 | ) | | | (0.48 | ) | | | – | | | | – | | | | (0.48 | ) | | | (2.21 | ) | | | 8.67 | |
B | | | 10.80 | | | | 0.39 | | | | – | | | | (2.17 | ) | | | (1.78 | ) | | | (0.41 | ) | | | – | | | | – | | | | (0.41 | ) | | | (2.19 | ) | | | 8.61 | |
C | | | 10.83 | | | | 0.39 | | | | – | | | | (2.18 | ) | | | (1.79 | ) | | | (0.41 | ) | | | – | | | | – | | | | (0.41 | ) | | | (2.20 | ) | | | 8.63 | |
I | | | 10.90 | | | | 0.48 | | | | – | | | | (2.18 | ) | | | (1.70 | ) | | | (0.51 | ) | | | – | | | | – | | | | (0.51 | ) | | | (2.21 | ) | | | 8.69 | |
L | | | 10.85 | | | | 0.48 | | | | – | | | | (2.20 | ) | | | (1.72 | ) | | | (0.49 | ) | | | – | | | | – | | | | (0.49 | ) | | | (2.21 | ) | | | 8.64 | |
Y | | | 10.86 | | | | 0.50 | | | | – | | | | (2.20 | ) | | | (1.70 | ) | | | (0.51 | ) | | | – | | | | – | | | | (0.51 | ) | | | (2.21 | ) | | | 8.65 | |
| | | | | | | | | | | | | | | | | | | | | | | | | | | | | | | | | | | | | | |
| For the Year Ended October 31, 2007 | | | | | | | | | | | | | | | | | | | | | | | | | | | | | | | | | | | | | |
A | | | 11.34 | | | | 0.47 | | | | – | | | | (0.44 | ) | | | 0.03 | | | | (0.46 | ) | | | (0.03 | ) | | | – | | | | (0.49 | ) | | | (0.46 | ) | | | 10.88 | |
B | | | 11.26 | | | | 0.38 | | | | – | | | | (0.43 | ) | | | (0.05 | ) | | | (0.38 | ) | | | (0.03 | ) | | | – | | | | (0.41 | ) | | | (0.46 | ) | | | 10.80 | |
C | | | 11.29 | | | | 0.38 | | | | – | | | | (0.43 | ) | | | (0.05 | ) | | | (0.38 | ) | | | (0.03 | ) | | | – | | | | (0.41 | ) | | | (0.46 | ) | | | 10.83 | |
I(H) | | | 11.17 | | | | 0.21 | | | | – | | | | (0.27 | ) | | | (0.06 | ) | | | (0.21 | ) | | | – | | | | – | | | | (0.21 | ) | | | (0.27 | ) | | | 10.90 | |
L(I) | | | 11.31 | | | | 0.48 | | | | – | | | | (0.45 | ) | | | 0.03 | | | | (0.46 | ) | | | (0.03 | ) | | | – | | | | (0.49 | ) | | | (0.46 | ) | | | 10.85 | |
Y(I) | | | 11.32 | | | | 0.51 | | | | – | | | | (0.46 | ) | | | 0.05 | | | | (0.48 | ) | | | (0.03 | ) | | | – | | | | (0.51 | ) | | | (0.46 | ) | | | 10.86 | |
| | | | | | | | | | | | | | | | | | | | | | | | | | | | | | | | | | | | | | |
| For the Year Ended October 31, 2006 | | | | | | | | | | | | | | | | | | | | | | | | | | | | | | | | | | | | | |
A | | | 11.13 | | | | 0.45 | | | | – | | | | 0.29 | | | | 0.74 | | | | (0.45 | ) | | | (0.08 | ) | | | – | | | | (0.53 | ) | | | 0.21 | | | | 11.34 | |
B | | | 11.06 | | | | 0.37 | | | | – | | | | 0.28 | | | | 0.65 | | | | (0.37 | ) | | | (0.08 | ) | | | – | | | | (0.45 | ) | | | 0.20 | | | | 11.26 | |
C | | | 11.09 | | | | 0.37 | | | | – | | | | 0.28 | | | | 0.65 | | | | (0.37 | ) | | | (0.08 | ) | | | – | | | | (0.45 | ) | | | 0.20 | | | | 11.29 | |
L | | | 11.10 | | | | 0.44 | | | | – | | | | 0.29 | | | | 0.73 | | | | (0.44 | ) | | | (0.08 | ) | | | – | | | | (0.52 | ) | | | 0.21 | | | | 11.31 | |
Y | | | 11.11 | | | | 0.46 | | | | – | | | | 0.29 | | | | 0.75 | | | | (0.46 | ) | | | (0.08 | ) | | | – | | | | (0.54 | ) | | | 0.21 | | | | 11.32 | |
| | | | | | | | | | | | | | | | | | | | | | | | | | | | | | |
| For the Year Ended October 31, 2005 (G) | | | | | | | | | | | | | | | | | | | | | | | | | | | | | |
A | | | 11.22 | | | | 0.43 | | | | – | | | | (0.09 | ) | | | 0.34 | | | | (0.43 | ) | | | – | | | | – | | | | (0.43 | ) | | | (0.09 | ) | | | 11.13 | |
B | | | 11.15 | | | | 0.35 | | | | – | | | | (0.09 | ) | | | 0.26 | | | | (0.35 | ) | | | – | | | | – | | | | (0.35 | ) | | | (0.09 | ) | | | 11.06 | |
C | | | 11.18 | | | | 0.35 | | | | – | | | | (0.09 | ) | | | 0.26 | | | | (0.35 | ) | | | – | | | | – | | | | (0.35 | ) | | | (0.09 | ) | | | 11.09 | |
L | | | 11.19 | | | | 0.43 | | | | – | | | | (0.09 | ) | | | 0.34 | | | | (0.43 | ) | | | – | | | | – | | | | (0.43 | ) | | | (0.09 | ) | | | 11.10 | |
Y | | | 11.20 | | | | 0.45 | | | | – | | | | (0.10 | ) | | | 0.35 | | | | (0.44 | ) | | | – | | | | – | | | | (0.44 | ) | | | (0.09 | ) | | | 11.11 | |
| (A) | Information presented relates to a share outstanding throughout the indicated period. |
| (B) | Assumes initial investment at net asset value at the beginning of each period, reinvestment of all distributions, the complete redemption of the investment at net asset value at the end of each period and no sales charge. Total return would be reduced if sales charges were taken into account. |
| (C) | Ratios do not include fees paid indirectly (See Expenses in the accompanying Notes to Financial Statements). |
| (D) | Portfolio turnover rate is calculated on the basis of the Fund as a whole without distinguishing between the classes of shares issued. |
| (G) | Per share amounts have been calculated using average shares outstanding method. |
| (H) | Commenced operations on May 31, 2007. |
| (I) | Classes H, M and N were merged into Class L and Class E was merged into Class Y on February 9, 2007. |
| - Ratios and Supplemental Data - |
| | | | | | | Ratio of Expenses to Average Net | | | Ratio of Expenses to Average Net | | | Ratio of Expenses to Average Net | | | | | | | |
| | | | | | | Assets Before Waivers and | | | Assets After Waivers and | | | Assets After Waivers and | | | Ratio of Net Investment | | | Portfolio | |
| | | | Net Assets at End of | | | Reimbursements and Including | | | Reimbursements and Including | | | Reimbursements and Excluding | | | Income to Average Net | | | Turnover | |
| Total Return(B) | | | Period (000's) | | | Expenses not Subject to Cap(C) | | | Expenses not Subject to Cap(C) | | | Expenses not Subject to Cap(C) | | | Assets | | | Rate(D) | |
| | | | | | | | | | | | | | | | | | | | | | | |
| | | | | | | | | | | | | | | | | | | | | | | |
| 4.31 | %(E) | | $ | 148,226 | | | 0.87 | %(F) | | | 0.85 | %(F) | | 0.85 | %(F) | | | 4.81 | %(F) | | 8 | % |
| 3.85 | (E) | | | 8,133 | | | 1.67 | (F) | | | 1.60 | (F) | | 1.60 | (F) | | | 4.06 | (F) | | – | |
| 3.84 | (E) | | | 43,529 | | | 1.63 | (F) | | | 1.60 | (F) | | 1.60 | (F) | | | 4.06 | (F) | | – | |
| 4.32 | (E) | | | 7,323 | | | 0.63 | (F) | | | 0.60 | (F) | | 0.60 | (F) | | | 5.06 | (F) | | – | |
| 4.24 | (E) | | | 7,352 | | | 0.83 | (F) | | | 0.80 | (F) | | 0.80 | (F) | | | 4.86 | (F) | | – | |
| 4.35 | (E) | | | 32,791 | | | 0.58 | (F) | | | 0.58 | (F) | | 0.58 | (F) | | | 5.08 | (F) | | – | |
| | | | | | | | | | | | | | | | | | | | | | | |
| | | | | | | | | | | | | | | | | | | | | | | |
| 10.48 | | | | 151,639 | | | 0.89 | | | | 0.85 | | | 0.85 | | | | 4.96 | | | 46 | |
| 9.62 | | | | 8,623 | | | 1.70 | | | | 1.60 | | | 1.60 | | | | 4.21 | | | – | |
| 9.72 | | | | 42,730 | | | 1.65 | | | | 1.60 | | | 1.60 | | | | 4.23 | | | – | |
| 10.74 | | | | 6,899 | | | 0.65 | | | | 0.60 | | | 0.60 | | | | 5.24 | | | – | |
| 10.58 | | | | 7,190 | | | 0.84 | | | | 0.80 | | | 0.80 | | | | 5.65 | | | – | |
| 10.79 | | | | 33,239 | | | 0.59 | | | | 0.59 | | | 0.59 | | | | 5.22 | | | – | |
| | | | | | | | | | | | | | | | | | | | | | | |
| | | | | | | | | | | | | | | | | | | | | | | |
| (16.40 | ) | | | 113,542 | | | 0.94 | | | | 0.85 | | | 0.85 | | | | 4.63 | | | 77 | |
| (16.97 | ) | | | 5,223 | | | 1.75 | | | | 1.60 | | | 1.60 | | | | 3.87 | | | – | |
| (17.02 | ) | | | 27,234 | | | 1.70 | | | | 1.60 | | | 1.60 | | | | 3.89 | | | – | |
| (16.16 | ) | | | 4,705 | | | 0.66 | | | | 0.60 | | | 0.60 | | | | 4.89 | | | – | |
| (16.41 | ) | | | 5,790 | | | 0.90 | | | | 0.80 | | | 0.80 | | | | 4.67 | | | – | |
| (16.22 | ) | | | 18,238 | | | 0.65 | | | | 0.60 | | | 0.60 | | | | 4.87 | | | – | |
| | | | | | | | | | | | | | | | | | | | | | | |
| | | | | | | | | | | | | | | | | | | | | | | |
| 0.30 | | | | 115,459 | | | 1.15 | | | | 0.85 | | | 0.85 | | | | 4.20 | | | 43 | |
| (0.45 | ) | | | 6,839 | | | 1.95 | | | | 1.60 | | | 1.60 | | | | 3.43 | | | – | |
| (0.45 | ) | | | 22,467 | | | 1.90 | | | | 1.60 | | | 1.60 | | | | 3.45 | | | – | |
| (0.54 | ) (E) | | | 3,505 | | | 0.87 | (F) | | | 0.60 | (F) | | 0.60 | (F) | | | 4.81 | (F) | | – | |
| 0.28 | | | | 8,380 | | | 1.10 | | | | 0.86 | | | 0.86 | | | | 4.31 | | | – | |
| 0.48 | | | | 26,275 | | | 0.85 | | | | 0.65 | | | 0.65 | | | | 4.78 | | | – | |
| | | | | | | | | | | | | | | | | | | | | | | |
| | | | | | | | | | | | | | | | | | | | | | | |
| 6.82 | | | | 71,876 | | | 1.22 | | | | 1.00 | | | 1.00 | | | | 4.06 | | | 14 | |
| 5.97 | | | | 6,746 | | | 2.00 | | | | 1.75 | | | 1.75 | | | | 3.31 | | | – | |
| 5.95 | | | | 12,889 | | | 1.97 | | | | 1.75 | | | 1.75 | | | | 3.31 | | | – | |
| 6.77 | | | | 7,606 | | | 1.14 | | | | 1.05 | | | 1.05 | | | | 4.01 | | | – | |
| 6.91 | | | | 11 | | | 0.91 | | | | 0.89 | | | 0.89 | | | | 4.17 | | | – | |
| | | | | | | | | | | | | | | | | | | | | | | |
| | | | | | | | | | | | | | | | | | | | | | | |
| 3.10 | | | | 46,163 | | | 1.26 | | | | 1.00 | | | 1.00 | | | | 3.88 | | | 22 | |
| 2.36 | | | | 6,889 | | | 2.03 | | | | 1.75 | | | 1.75 | | | | 3.13 | | | – | |
| 2.35 | | | | 8,496 | | | 1.99 | | | | 1.75 | | | 1.75 | | | | 3.13 | | | – | |
| 3.06 | | | | 7,958 | | | 1.16 | | | | 1.05 | | | 1.05 | | | | 3.83 | | | – | |
| 3.20 | | | | 10 | | | 0.95 | | | | 0.95 | | | 0.95 | | | | 4.04 | | | – | |
| The Hartford Tax-Free National Fund |
The Board of Directors appoints officers who are responsible for the day-to-day operations of the Fund and who execute policies formulated by the Directors. Each director serves until his or her death, resignation, or retirement or until the next annual meeting of shareholders is held or until his or her successor is elected and qualifies.
Directors and officers who are employed by or who have a financial interest in The Hartford are considered “interested” persons of the Fund pursuant to the Investment Company Act of 1940, as amended. Each officer and two of the Funds’ directors, as noted in the chart below, are “interested” persons of the Fund. Each director serves as a director for The Hartford Mutual Funds, Inc., The Hartford Mutual Funds II, Inc., The Hartford Income Shares Fund, Inc., Hartford Series Fund, Inc., and Hartford HLS Series Fund II, Inc., which, as of April 30, 2010, collectively consist of 85 funds. Correspondence may be sent to directors and officers c/o Hartford Mutual Funds, P.O. Box 2999, Hartford, Connecticut 06104-2999, except that correspondence to Ms. Fagely may be sent to 500 Bielenberg Drive, Woodbury, Minnesota 55125.
The table below sets forth, for each director and officer, his or her name, year of birth, current position with the Fund and date first elected or appointed to The Hartford Mutual Funds, Inc. (“MF”) and The Hartford Mutual Funds II, Inc. (“MF2”), principal occupation, and, for directors, other directorships held. The Fund’s statement of additional information contains further information on the directors and is available free of charge by calling 1-888-843-7824 or writing to Hartford Mutual Funds, P.O. Box 64387, St. Paul, MN 55164-0387.
Information on the aggregate remuneration paid to the directors of the Fund can be found in the Statement of Operations herein. The Fund pays to The Hartford a portion of the Chief Compliance Officer’s compensation, but does not pay salaries or compensation to any of its other officers or directors who are employed by The Hartford.
Non-Interested Directors
Lynn S. Birdsong (1946) Director since 2003, Co-Chairman of the Investment Committee
Mr. Birdsong is a private investor. Since 2003, Mr. Birdsong has been an independent director of The Japan Fund. From 2003 to March 2005, Mr. Birdsong was an independent director of the Atlantic Whitehall Funds. From 1979 to 2002, Mr. Birdsong was a managing director of Zurich Scudder Investments, an investment management firm. During his employment with Scudder, Mr. Birdsong was an interested director of The Japan Fund. Since 1981, Mr. Birdsong has been a partner in Birdsong Company, an advertising specialty firm.
Robert M. Gavin, Jr. (1940) Director since 2002 (MF) and 1986 (MF2), Chairman of the Board since 2004
Dr. Gavin is an educational consultant. Prior to September 1, 2001, he was President of Cranbrook Education Community and prior to July 1996, he was President of Macalester College, St. Paul, Minnesota.
Duane E. Hill (1945) Director since 2001 (MF) and 2002 (MF2), Chairman of the Nominating Committee
Mr. Hill is Partner of TSG Ventures L.P., a private equity investment company. Mr. Hill is a former partner of TSG Capital Group, a private equity investment firm that served as sponsor and lead investor in leveraged buyouts of middle market companies.
Sandra S. Jaffee (1941) Director since 2005
Ms. Jaffee served as Chairman (2008 to 2009) and Chief Executive Officer of Fortent (formerly Searchspace Group), a leading provider of compliance/regulatory technology to financial institutions from August 2005 to August 2009. From August 2004 to August 2005, Ms. Jaffee served as an Entrepreneur in Residence with Warburg Pincus, a private equity firm. From September 1995 to July 2004, Ms. Jaffee served as Executive Vice President at Citigroup, where she was President and Chief Executive Officer of Citibank’s Global Securities Services (1995 to 2003).
William P. Johnston (1944) Director since 2005, Chairman of the Compliance Committee
In June 2006, Mr. Johnston was appointed as Senior Advisor to The Carlyle Group, a global private equity investment firm. In July 2006, Mr. Johnston was elected to the Board of Directors of MultiPlan, Inc. In August 2007, Mr. Johnston was elected to the Board of Directors of LifeCare Holdings, Inc. In February 2008, Mr. Johnston was elected to the Board of Directors of HCR-ManorCare, Inc. In May 2006, Mr. Johnston was elected to the Supervisory Board of Fresenius Medical Care AG & Co. KGaA, after its acquisition of Renal Care Group, Inc. in March 2006. Mr. Johnston joined Renal Care Group in November 2002 as a member of the Board of Directors and served as Chairman of the Board from March 2003 through March 2006. From September 1987 to December 2002, Mr. Johnston was with Equitable Securities Corporation (and its successors, SunTrust Equitable Securities and SunTrust Robinson Humphrey) serving in various investment banking and managerial positions, including Managing Director and Head of Investment Banking, Chief Executive Officer and Vice Chairman. Mr. Johnston was a member of the law firm of Waller Lansden Dortch & Davis from 1969 until 1986.
Phillip O. Peterson (1944) Director since 2002 (MF) and 2000 (MF2), Chairman of the Audit Committee
Mr. Peterson is a mutual fund industry consultant. He was a partner of KPMG LLP (an accounting firm) until July 1999. Mr. Peterson joined William Blair Funds in February 2007 as a member of the Board of Trustees. From January 2004 to April 2005, Mr. Peterson served as Independent President of the Strong Mutual Funds.
Lemma W. Senbet (1946) Director since 2005
Dr. Senbet is the William E. Mayer Chair Professor of Finance and Director, Center for Financial Policy, at the University of Maryland, Robert H. Smith School of Business. He was chair of the Finance Department during 1998 to 2006. Previously he was a chaired professor of finance at the University of Wisconsin-Madison. Also, he was director of the Fortis Funds from March 2000 to July 2002. Dr. Senbet served the finance profession in various capacities, including as director of the American Finance Association and President of the Western Finance Association. In 2006, Dr. Senbet was inducted Fellow of Financial Management Association International for his career-long distinguished scholarship and professional service.
Interested Directors and Officers
Lowndes A. Smith (1939) Director since 1996 (MF) and 2002 (MF2), Co-Chairman of the Investment Committee
Mr. Smith served as Vice Chairman of The Hartford from February 1997 to January 2002, as President and Chief Executive Officer of Hartford Life, Inc. from February 1997 to January 2002, and as President and Chief Operating Officer of The Hartford Life Insurance Companies from January 1989 to January 2002. Mr. Smith serves as a Director of White Mountains Insurance Group, Ltd., One Beacon Insurance, Symetra Financial and as a Managing Director of Whittington Gray Associates.
John C. Walters* (1962) Director since 2008
Mr. Walters currently serves as President, Chief Executive Officer and Director for Hartford Life, Inc. (“HL, Inc.”). Mr. Walters also serves as President, Chairman of the Board, Chief Executive Officer and Director for Hartford Life Insurance Company (“Hartford Life”), and as Executive Vice President of The Hartford. In addition, Mr. Walters is a Manager of HL Investment Advisors, LLC (“HL Advisors”). Mr. Walters previously served as President of the U.S. Wealth Management Division of HL, Inc. (2006-2007) and as Co-Chief Operating Officer of Hartford Life (2007-2008).
* Mr. Walters previously served as President and Chief Executive Officer of the Fund (2007 to 2009).
Other Officers
Robert M. Arena, Jr. (1968) President and Chief Executive Officer since 2009 (served as Vice President of the Fund (2006 - 2009))
Mr. Arena serves as Executive Vice President of Hartford Life. Additionally, Mr. Arena is Senior Vice President and Director of Hartford Administrative Services Company, (“HASCO”), President, Chief Executive Officer and Manager of Hartford Investment Financial Services, LLC (“HIFSCO”) and President, Chief Executive Officer and Manager of HL Advisors. Mr. Arena joined The Hartford in 2004.
Tamara L. Fagely (1958) Vice President, Treasurer and Controller since 2002 (MF) 1993 (MF2)
Ms. Fagely has been a Vice President of HASCO since 1998 and Chief Financial Officer since 2006. Currently Ms. Fagely is a Vice President of Hartford Life. She served as Assistant Vice President of Hartford Life from December 2001 through March 2005. In addition, Ms. Fagely is Controller and Chief Financial Officer of HIFSCO.
Brian Ferrell (1962) AML Compliance Officer since 2008
Mr. Ferrell has served as Assistant Vice President and AML Compliance Officer for The Hartford since 2006, and as AML Compliance Officer for HASCO and Hartford Investor Services Company, LLC (“HISC”) since 2008. Prior to joining The Hartford in 2006, Mr. Ferrell held various positions at the U.S. Department of the Treasury (the “Treasury”) from 2001 to 2006, where he served as Chief Counsel for the Treasury’s Financial Crimes Enforcement Network from 2005 - 2006.
Dr. Robert J. Froehlich (1953) Senior Managing Director since 2009
Dr. Froehlich joined The Hartford as Senior Managing Director in September 2009. Prior to joining The Hartford, Dr. Froehlich served as Vice Chairman of Deutsche Asset Management from 1997 - 2009.
Thomas D. Jones, III (1965) Vice President and Chief Compliance Officer since 2006
Mr. Jones serves as Chief Compliance Officer for the Hartford Mutual Funds and Vice President and Director of Securities Compliance for The Hartford. Mr. Jones joined The Hartford in 2006 from SEI Investments, where he served as Chief Compliance Officer for its mutual funds and investment advisers. Prior to joining SEI, Mr. Jones was First Vice President and Compliance Director for Merrill Lynch Investment Managers (Americas) (“MLIM”), where he worked from 1992-2004.
| The Hartford Tax-Free National Fund |
Directors and Officers (Unaudited) – (continued)
Edward P. Macdonald (1967) Vice President, Secretary and Chief Legal Officer since 2005
Mr. Macdonald serves as Assistant Vice President of Hartford Life and Chief Legal Officer and Vice President of HIFSCO. He also serves as Vice President and Secretary of HASCO, and Chief Legal Officer, Secretary and Vice President of HL Advisors. Mr. Macdonald joined The Hartford in 2005.
Vernon J. Meyer (1964) Vice President since 2006
Mr. Meyer serves as Senior Vice President of Hartford Life. He also serves as Senior Vice President of HIFSCO and HL Advisors. Mr. Meyer joined The Hartford in 2004.
D. Keith Sloane (1960) Vice President since 2009
Mr. Sloane is a Senior Vice President of Hartford Life. Additionally, Mr. Sloane currently serves as Senior Vice President of HIFSCO, HL Advisors, and HASCO. Prior to joining The Hartford in 2007, Mr. Sloane was Director of product marketing and led the mutual fund business for Wachovia Securities (“Wachovia”) in their investment products group. Mr. Sloane joined Wachovia in 1995.
Jane Wolak (1961) Vice President since 2009
Ms. Wolak currently serves as Vice President of Hartford Life. Ms. Wolak joined Hartford Life as Vice President, Retail Product Services in May 2007. She is also Vice President of HASCO. Previously, Ms. Wolak was with Sun Life Financial where she held the position of Vice President, Service Center Operations from 2001 – 2007.
A description of the policies and procedures that the Fund uses to determine how to vote proxies relating to portfolio securities and a record of how the Fund voted any proxies for the twelve-month period ended June 30, 2009 is available (1) without charge, upon request, by calling 888-843-7824 and (2) on the Securities and Exchange Commission’s website at http://www.sec.gov.
The Fund files a complete schedule of portfolio holdings with the Commission for the first and third quarters of each fiscal year on Form N-Q. The Fund’s Forms are available (1) without charge, upon request, by calling 888-843-7824 and (2) on the Securities and Exchange Commission’s website at http://www.sec.gov. The Form N-Q may be reviewed and copied at the Commission’s Public Reference Room in Washington, DC. Information on the operation of the Public Reference Room may be obtained by calling 1-800-SEC-0330.
| The Hartford Tax-Free National Fund |
Your Fund's Expenses
As a shareholder of the Fund, you incur two types of costs: (1) transaction costs, including sales charges (loads) on purchase payments and contingent deferred sales charges (CDSC) (2) ongoing costs including management fees; distribution fees; and other fund expenses. This example is intended to help you understand your ongoing costs (in dollars) of investing in the Fund and to compare these costs with the ongoing costs of investing in other mutual funds. The example is based on an investment of $1,000 invested at the beginning of the period and held for the period of October 31, 2009 through April 30, 2010.
Actual Expenses
The first set of columns of the table below provides information about actual account values and actual expenses. You may use the information in this column, together with the amount you invested, to estimate the expenses that you paid over the period. Simply divide your account value by $1,000 (for example, an $8,600 account value divided by $1,000 = 8.6), then multiply the result by the number in the line under the heading entitled "Expenses Paid During Period" to estimate the expenses you paid on your account during this period.
Hypothetical Example for Comparison Purposes
The second set of columns of the table below provides information about hypothetical account values and hypothetical expenses based on the Fund's actual expense ratio and an assumed rate of return of 5% per year before expenses, which is not the Fund's actual return. The hypothetical account values and expenses may not be used to estimate the actual ending account balance or expenses you paid for the period. You may use this information to compare the ongoing costs of investing in the Fund and other funds. To do so, compare this 5% hypothetical example with the 5% hypothetical examples that appear in the shareholder reports of the other funds.
Please note that the expenses shown in the table are meant to highlight your ongoing costs only and do not reflect any transactional costs, such as sales charges (loads) and CDSC. Therefore, the second set of columns of the table is useful in comparing ongoing costs only, and will not help you determine the relative total costs of owning different funds. In addition, if these transactional costs were included, your costs would be higher. Expenses are equal to the Fund's annualized expense ratios multiplied by average account value over the period, multiplied by 181/365 (to reflect the one-half year period).
| | | Actual return | | | Hypothetical (5% return before expenses) | | | | | | | | | | |
| | | | | | | | | Expenses paid | | | | | | | | | Expenses paid | | | | | | Days in | | | | |
| | | | | | | | | during the period | | | | | | | | | during the period | | | | | | the | | | Days | |
| | | Beginning | | | Ending Account | | | October 31, 2009 | | | Beginning | | | Ending Account | | | October 31, | | | Annualized | | | current | | | in the | |
| | | Account Value | | | Value | | | through | | | Account Value | | | Value | | | 2009 through | | | expense | | | 1/2 | | | full | |
| | | October 31, 2009 | | | April 30, 2010 | | | April 30, 2010 | | | October 31, 2009 | | | April 30, 2010 | | | April 30, 2010 | | | ratio | | | year | | | year | |
| Class A | | $ | 1,000.00 | | | $ | 1,043.10 | | | $ | 4.31 | | | $ | 1,000.00 | | | $ | 1,020.58 | | | $ | 4.26 | | | | 0.85 | % | | | 181 | | | | 365 | |
| Class B | | $ | 1,000.00 | | | $ | 1,038.50 | | | $ | 8.09 | | | $ | 1,000.00 | | | $ | 1,016.86 | | | $ | 8.00 | | | | 1.60 | | | | 181 | | | | 365 | |
| Class C | | $ | 1,000.00 | | | $ | 1,038.40 | | | $ | 8.09 | | | $ | 1,000.00 | | | $ | 1,016.86 | | | $ | 8.00 | | | | 1.60 | | | | 181 | | | | 365 | |
| Class I | | $ | 1,000.00 | | | $ | 1,043.20 | | | $ | 3.04 | | | $ | 1,000.00 | | | $ | 1,021.82 | | | $ | 3.01 | | | | 0.60 | | | | 181 | | | | 365 | |
| Class L | | $ | 1,000.00 | | | $ | 1,042.40 | | | $ | 4.05 | | | $ | 1,000.00 | | | $ | 1,020.83 | | | $ | 4.01 | | | | 0.80 | | | | 181 | | | | 365 | |
Class Y | | $ | 1,000.00 | | | $ | 1,043.50 | | | $ | 2.94 | | | $ | 1,000.00 | | | $ | 1,021.92 | | | $ | 2.91 | | | | 0.58 | | | | 181 | | | | 365 | |
This information is written in connection with the promotion or marketing of the matter(s) addressed in this material. The information cannot be used or relied upon for the purpose of avoiding IRS penalties. These materials are not intended to provide tax, accounting or legal advice. As with all matters of a tax or legal nature, you should consult your own tax or legal counsel for advice.
You should carefully consider investment objectives, risks, and charges and expenses of The Hartford Mutual Funds before investing. This and other information can be found in the Fund's prospectus, which can be obtained from your investment representative or by calling 888-843-7824. Please read it carefully before you invest or send money.
The Hartford Mutual Funds are underwritten and distributed by Hartford Investment Financial Services, LLC.
“The Hartford” is The Hartford Financial Services Group, Inc., and its subsidiaries.
Mutual fund inception dates range from 1949 to date. The Hartford Mutual Funds are not a subsidiary of The Hartford but are underwritten, distributed by, and advised by subsidiaries of The Hartford. Investments in The Hartford Mutual Funds are not guaranteed by The Hartford or any other entity.
MFSAR-TFN10 6/10 MUT 8759 Printed in U.S.A. ©2010 The Hartford, Hartford, CT 06115 | |
| | |
| | |
THE HARTFORD MUTUAL FUNDS 2010 Semi Annual Report The Hartford Value Opportunities Fund |
The Hartford Value Opportunities Fund
| Manager Discussions (Unaudited) | | 2 |
| Financial Statements | | |
| | 4 |
| | 7 |
| | 8 |
| | 9 |
| | 10 |
| | 11 |
| | 22 |
| | 25 |
| | 27 |
| | 27 |
| | 28 |
The Hartford Value Opportunities Fund inception 01/02/1996
(subadvised by Wellington Management Company, LLP)
Investment objective – Seeks capital appreciation.
Performance Overview(1) 4/30/00 - 4/30/10
Growth of a $10,000 investment in Class A which includes Sales Charge
Russell 1000 Value Index is an unmanaged index measuring the performance of those Russell 1000 Index companies with lower price-to-book ratios and lower forecasted growth values.
Russell 3000 Value Index is an unmanaged index measuring the performance of those Russell 3000 Index companies with lower price-to-book ratios and lower forecasted growth values.
You cannot invest directly in an index.
The value of shares will fluctuate so that, when redeemed, shares may be worth more or less than their original cost. The chart and table do not reflect the deduction of taxes that a shareholder would pay on fund distributions or the redemption of fund shares.
Performance information may reflect historical or current expense waivers/reimbursements from the investment adviser, without which performance would have been lower. For information on current expense waivers/reimbursements, please see the prospectus.
Average Annual Total Returns(2,3,4,5) (as of 4/30/10)
| | 6 | 1 | 5 | 10 |
| | Month† | Year | Year | Year |
| Value Opportunities A# | 21.42% | 51.62% | 2.58% | 3.80% |
| Value Opportunities A## | | 43.28% | 1.43% | 3.21% |
| Value Opportunities B# | 20.92% | 50.70% | 1.95% | NA* |
| Value Opportunities B## | | 45.70% | 1.66% | NA* |
| Value Opportunities C# | 20.92% | 50.41% | 1.80% | 3.03% |
| Value Opportunities C## | | 49.41% | 1.80% | 3.03% |
| Value Opportunities I# | 21.46% | 52.05% | 2.75% | NA |
| Value Opportunities L# | 21.52% | 51.89% | 2.74% | 3.88% |
| Value Opportunities L## | | 44.68% | 1.74% | 3.37% |
| Value Opportunities R3# | 21.27% | 51.22% | 2.45% | NA |
| Value Opportunities R4# | 21.40% | 51.68% | 2.67% | NA |
| Value Opportunities R5# | 21.48% | 52.11% | 2.86% | NA |
| Value Opportunities Y# | 21.59% | 52.28% | 2.98% | NA |
| Russell 1000 Value Index | 17.77% | 42.28% | 1.93% | 3.48% |
| Russell 3000 Value Index | 18.79% | 43.10% | 2.20% | 3.92% |
| * | 10 year returns are not applicable for Class B because after 8 years Class B converts to Class A. |
PAST PERFORMANCE IS NOT INDICATIVE OF FUTURE RESULTS.
| (1) | Growth of a $10,000 investment in Classes B, C, I, L, R3, R4, R5 and Y shares will vary from results seen above due to differences in the expenses charged to these share classes. |
| (2) | The initial investment in Classes A and L shares reflects the maximum sales charge and Classes B and C reflect CDSC. |
| (3) | Total returns presented above were calculated using the Fund's net asset value available to shareholders for sale or redemption of Fund shares on April 30, 2010, which excludes investment transactions as of this date. |
| (4) | Effective 9/30/09, Class B shares of The Hartford Mutual Funds are closed to new investments. |
| (5) | Classes A, B, C and Y shares were offered beginning on 2/19/02. Performance prior to that date for Class A is that of the Fund's Class L shares and for Class C is that of the Fund's Class N shares, which had lower operating expenses. Performance prior to 2/19/02 would have been lower if Classes A and C shares expenses were applied during that period. (Class N shares are no longer offered.) Class I shares commenced operations on 8/31/06. Performance prior to 8/31/06 reflects Class A performance. Classes R3, R4 and R5 shares commenced operations on 12/22/06. Performance prior to 12/22/06 reflects Class Y performance. The Fund’s performance information prior to 4/1/01 reflects when the Fund was managed by a previous investment adviser. |
| Portfolio Managers | | |
| David R. Fassnacht, CFA | James N. Mordy | David W. Palmer, CFA |
| Senior Vice President, Partner | Senior Vice President, Partner | Vice President |
How did the Fund perform?
The Class A shares of The Hartford Value Opportunities Fund returned 21.42%, before sales charge, for the six-month period ended April 30, 2010, outperforming its benchmarks, the Russell 3000 Value Index, which returned 18.79% and the Russell 1000 Value Index, which returned 17.77% for the same period. The Fund also outperformed the 17.38% return of the average fund in the Lipper
Multi-Cap Value Fund peer group, a group of funds with investment strategies similar to those of the Fund.
Why did the Fund perform this way?
Despite intermittent concerns about global events, including the Greek debt crisis, Chinese bank lending and the U.S. budget deficit, equity markets followed last year’s rally with another upward move, as corporate earnings estimates generally were revised higher. While signs of peaking growth cropped up during the first quarter earnings cycle, and concerns started to percolate over growth prospects for the Euro-area countries, market sentiment remained firm through the end of April. During the period, value stocks, as measured by the Russell 3000 Value Index (18.8%), outpaced growth stocks, as measured by the Russell 3000 Growth Index (16.5%). Large-cap stocks, as measured by the S&P 500 Index (15.7%), lagged smaller-cap stocks, as measured by the Russell 2000 Index (28.2%) and mid-cap stocks, as measured by the S&P MidCap 400 Index (+25.8%).
All ten sectors within the Russell 3000 Value Index posted positive returns during the period. Consumer Discretionary (+39.8%), Industrials (+31.8%), and Materials (+28.3%) were the top performers, on a relative basis, while Telecommunication Services (+7.6%) and Energy (+9.6%) lagged, on a relative basis.
Consistent with our bottom-up (i.e. stock by stock fundamental research) stock selection investment process, positive stock selection was the primary driver of the Fund’s outperformance versus the benchmark. Security selection was strongest in Industrials, Energy, and Information Technology and weakest within Financials, Materials, and Consumer Discretionary. Sector allocation was not as important as stock selection, but still contributed positively to relative returns.
The largest contributors to relative performance were Delta Airlines (Industrials), Exxon Mobil (Energy), and Impax Labs (Health Care). Shares of Delta Airlines rose on signs of improvement in high-margin business travel and improving revenue metrics. Our underweight (i.e. the Fund’s sector postion was less than the benchmark position) position in Exxon Mobil, relative to the benchmark, helped the Fund’s relative performance. Shares of Exxon Mobil declined during the period as the investment community reacted negatively to the announcement of Exxon’s unexpected and dilutive takeover of oil and gas producer XTO Energy. Shares of Impax Labs, a generic and specialty pharmaceutical company, rose following the release of promising trial data on the company’s Parkinson’s drug. In addition, near-term sales were boosted by the failure of competitor Ranbaxy Labs to produce a generic version of Flomax. We sold our position in the stock at the end of the period as it reached our price target. Notable contributors to absolute returns included Bank of America (Financials) and Comcast (Consumer Discretionary).
The largest detractors from relative performance included Everest RE (Financials), Total (Energy), and ACE (Financials). Shares of insurer Everest RE declined due to several catastrophic losses in the first quarter of 2010, which included the Chilean earthquake, the European windstorm Xynthia, and several storms in Australia. Shares of French-domiciled, global integrated oil and gas producer Total lagged after the company’s production guidance and reserve replacement metrics disappointed investors. Shares of global property and casualty insurer ACE declined after the company’s management cited full-year 2010 guidance which was below consensus expectations, a weaker competitive pricing environment and an unusually large number of natural catastrophes globally. Top detractors from absolute returns included Kroger (Consumer Staples) and Solar Cayman (Financials).
What is the outlook?
Given the overall backdrop of positive investor sentiment and embracing of pro-cyclical stocks, we feel a belief in an orderly economic rebound has become consensus. As a result, select stocks in more defensive sectors have become attractively valued, certainly on a risk-reward basis.
Within sectors, as the economic cycle has unfolded, we have also shifted more emphasis to stocks with valuation support from current earnings and cash flows, as opposed to those whose earning power comes only in future years. Rotation away from more commodity-oriented holdings, into more services-and-processing-oriented companies within Information Technology would be an example of this focus.
As always, we seek to balance risk and return to deliver an attractive portfolio to the shareholder. At the end of the period, the Fund was most overweight (i.e. the Fund’s sector position was greater than the benchmark position) in Information Technology and most underweight in Telecommunication Services, relative to the Russell 3000 Value benchmark.
Diversification by Industry
as of April 30, 2010
| | | Percentage of | |
| Industry (Sector) | | Net Assets | |
| Banks (Financials) | | | 3.6 | % |
| Capital Goods (Industrials) | | | 7.8 | |
| Commercial & Professional Services (Industrials) | | | 1.2 | |
| Consumer Durables & Apparel (Consumer Discretionary) | | | 0.7 | |
| Consumer Services (Consumer Discretionary) | | | 1.5 | |
| Diversified Financials (Financials) | | | 10.4 | |
| Energy (Energy) | | | 15.6 | |
| Food & Staples Retailing (Consumer Staples) | | | 1.3 | |
| Food, Beverage & Tobacco (Consumer Staples) | | | 4.7 | |
| Health Care Equipment & Services (Health Care) | | | 3.0 | |
| Insurance (Financials) | | | 12.3 | |
| Materials (Materials) | | | 5.2 | |
| Media (Consumer Discretionary) | | | 2.5 | |
| Pharmaceuticals, Biotechnology & Life Sciences (Health Care) | | | 6.7 | |
| Real Estate (Financials) | | | 0.7 | |
| Retailing (Consumer Discretionary) | | | 3.2 | |
| Semiconductors & Semiconductor Equipment (Information Technology) | | | 0.5 | |
| Software & Services (Information Technology) | | | 4.9 | |
| Technology Hardware & Equipment (Information Technology) | | | 6.4 | |
| Transportation (Industrials) | | | 3.1 | |
| Utilities (Utilities) | | | 3.2 | |
| Short-Term Investments | | | 2.5 | |
| Other Assets and Liabilities | | | (1.0 | ) |
| Total | | | 100.0 | % |
| The Hartford Value Opportunities Fund |
April 30, 2010 (Unaudited)
(000’s Omitted)
| Shares or Principal Amount | | Market Value ╪ | |
| COMMON STOCKS - 98.5% | | | |
| | | Banks - 3.6% | | | |
| | 170 | | Wells Fargo & Co. | | $ | 5,625 | |
| | | | | | | | |
| | | | Capital Goods - 7.8% | | | | |
| | 46 | | AMETEK, Inc. | | | 1,972 | |
| | 76 | | Barnes Group, Inc. | | | 1,589 | |
| | 11 | | General Dynamics Corp. | | | 863 | |
| | 80 | | General Electric Co. | | | 1,516 | |
| | 36 | | Honeywell International, Inc. | | | 1,704 | |
| | 10 | | Lockheed Martin Corp. | | | 840 | |
| | 27 | | Moog, Inc. Class A ● | | | 997 | |
| | 48 | | Pentair, Inc. | | | 1,750 | |
| | 39 | | Terex Corp. ● | | | 1,021 | |
| | | | | | | 12,252 | |
| | | | Commercial & Professional Services - 1.2% | | | | |
| | 46 | | Herman Miller, Inc. | | | 972 | |
| | 104 | | Steelcase, Inc. | | | 856 | |
| | | | | | | 1,828 | |
| | | | Consumer Durables & Apparel - 0.7% | | | | |
| | 49 | | Toll Brothers, Inc. ● | | | 1,106 | |
| | | | | | | | |
| | | | Consumer Services - 1.5% | | | | |
| | 22 | | Apollo Group, Inc. Class A ● | | | 1,252 | |
| | 271 | | Thomas Cook Group plc | | | 1,027 | |
| | | | | | | 2,279 | |
| | | | Diversified Financials - 10.4% | | | | |
| | 79 | | Ameriprise Financial, Inc. | | | 3,667 | |
| | 287 | | Bank of America Corp. | | | 5,114 | |
| | 30 | | Bank of New York Mellon Corp. | | | 937 | |
| | 22 | | JP Morgan Chase & Co. | | | 920 | |
| | 68 | | Oaktree Capital ■● | | | 2,380 | |
| | 30 | | Solar Capital Ltd. ⌂† | | | 629 | |
| | 74 | | Solar Cayman Ltd. ⌂●† | | | 32 | |
| | 60 | | TD Ameritrade Holding Corp. ● | | | 1,191 | |
| | 82 | | UBS AG | | | 1,272 | |
| | 16 | | UBS AG ADR | | | 247 | |
| | | | | | | 16,389 | |
| | | | Energy - 15.6% | | | | |
| | 7 | | Apache Corp. | | | 743 | |
| | 32 | | Baker Hughes, Inc. | | | 1,602 | |
| | 39 | | Canadian Natural Resources Ltd. ADR | | | 2,985 | |
| | 35 | | Chevron Corp. | | | 2,826 | |
| | 58 | | Cobalt International Energy ● | | | 669 | |
| | 45 | | Consol Energy, Inc. | | | 2,015 | |
| | 28 | | Exxon Mobil Corp. | | | 1,880 | |
| | 45 | | Halliburton Co. | | | 1,370 | |
| | 19 | | Newfield Exploration Co. ● | | | 1,094 | |
| | 38 | | Noble Energy, Inc. | | | 2,880 | |
| | 27 | | Overseas Shipholding Group, Inc. | | | 1,367 | |
| | 47 | | SBM Offshore N.V. | | | 934 | |
| | 22 | | Southwestern Energy Co. ● | | | 877 | |
| | 80 | | Tsakos Energy Navigation Ltd. | | | 1,175 | |
| | 124 | | Weatherford International Ltd. ● | | | 2,248 | |
| | | | | | | 24,665 | |
| | | | Food & Staples Retailing - 1.3% | | | | |
| | 65 | | Sysco Corp. | | | 2,063 | |
| | | | | | | | |
| | | | Food, Beverage & Tobacco - 4.7% | | | | |
| | 76 | | Archer Daniels Midland Co. | | | 2,123 | |
| | 71 | | BRF Brasil Foods S.A. ADR | | | 941 | |
| | – | | Japan Tobacco, Inc. | | | 946 | |
| | 34 | | Kraft Foods, Inc. | | | 1,013 | |
| | 53 | | Molson Coors Brewing Co. | | | 2,369 | |
| | | | | | | 7,392 | |
| | | | Health Care Equipment & Services - 3.0% | | | | |
| | 31 | | CIGNA Corp. | | | 987 | |
| | 37 | | Medtronic, Inc. | | | 1,621 | |
| | 35 | | St. Jude Medical, Inc. ● | | | 1,416 | |
| | 22 | | UnitedHealth Group, Inc. | | | 670 | |
| | | | | | | 4,694 | |
| | | | Insurance - 12.3% | | | | |
| | 73 | | ACE Ltd. ‡ | | | 3,899 | |
| | 32 | | Everest Re Group Ltd. | | | 2,453 | |
| | 115 | | Fidelity National Financial, Inc. | | | 1,746 | |
| | 29 | | First American Financial Corp. | | | 1,006 | |
| | 51 | | Platinum Underwriters Holdings Ltd. | | | 1,905 | |
| | 36 | | Principal Financial Group, Inc. | | | 1,049 | |
| | 62 | | Reinsurance Group of America, Inc. | | | 3,206 | |
| | 143 | | Unum Group | | | 3,497 | |
| | 2 | | White Mountains Insurance Group Ltd. | | | 666 | |
| | | | | | | 19,427 | |
| | | | Materials - 5.2% | | | | |
| | 19 | | HeidelbergCement AG | | | 1,160 | |
| | 23 | | Mosaic Co. | | | 1,186 | |
| | 42 | | Owens-Illinois, Inc. ● | | | 1,492 | |
| | 354 | | Rexam plc | | | 1,746 | |
| | 44 | | Vulcan Materials Co. | | | 2,509 | |
| | | | | | | 8,093 | |
| | | | Media - 2.5% | | | | |
| | 77 | | Comcast Corp. Class A | | | 1,516 | |
| | 68 | | Comcast Corp. Special Class A | | | 1,274 | |
| | 66 | | Virgin Media, Inc. | | | 1,168 | |
| | | | | | | 3,958 | |
| | | | Pharmaceuticals, Biotechnology & Life Sciences - 6.7% | | | | |
| | 65 | | Alkermes, Inc. ● | | | 855 | |
| | 35 | | Amgen, Inc. ● | | | 1,990 | |
| | 73 | | Arena Pharmaceuticals, Inc. ● | | | 238 | |
| | 47 | | Daiichi Sankyo Co., Ltd. ☼ | | | 822 | |
| | 154 | | King Pharmaceuticals, Inc. ● | | | 1,508 | |
| | 235 | | Pfizer, Inc. | | | 3,923 | |
| | 7 | | Roche Holding AG | | | 1,087 | |
| | | | | | | 10,423 | |
| | | | Real Estate - 0.7% | | | | |
| | 62 | | Iguatemi Emp de Shopping | | | 1,034 | |
| | | | | | | | |
| | | | Retailing - 3.2% | | | | |
| | 53 | | Home Depot, Inc. | | | 1,882 | |
| | 48 | | Lowe's Co., Inc. | | | 1,302 | |
| | 35 | | Target Corp. | | | 1,968 | |
| | | | | | | 5,152 | |
| | | | Semiconductors & Semiconductor Equipment - 0.5% | | | | |
| | 25 | | Varian Semiconductor Equipment Associates, Inc. ● | | | 817 | |
| | | | | | | | |
| | | | Software & Services - 4.9% | | | | |
| | 30 | | CACI International, Inc. Class A ● | | | 1,409 | |
| | 101 | | Microsoft Corp. | | | 3,069 | |
The accompanying notes are an integral part of these financial statements.
| Shares or Principal Amount | | | Market Value ╪ | |
| COMMON STOCKS - 98.5% - (continued) | | | | |
| | | | Software & Services - 4.9% - (continued) | | | | | | | |
| | | 29 | | Paychex, Inc. | | | | | | $ | 872 | |
| | | 137 | | Western Union Co. | | | | | | | 2,502 | |
| | | | | | | | | | | | 7,852 | |
| | | | | Technology Hardware & Equipment - 6.4% | | | | | | | | |
| | | 76 | | Arrow Electronics, Inc. ● | | | | | | | 2,309 | |
| | | 25 | | Avnet, Inc. ● | | | | | | | 812 | |
| | | 124 | | Cisco Systems, Inc. ● | | | | | | | 3,335 | |
| | | 86 | | Corning, Inc. | | | | | | | 1,650 | |
| | | 251 | | Flextronics International Ltd. ● | | | | | | | 1,944 | |
| | | | | | | | | | | | 10,050 | |
| | | | | Transportation - 3.1% | | | | | | | | |
| | | 109 | | All America Latina Logistica S.A. | | | | | | | 977 | |
| | | 133 | | Delta Air Lines, Inc. ● | | | | | | | 1,606 | |
| | | 35 | | United Parcel Service, Inc. Class B | | | | | | | 2,406 | |
| | | | | | | | | | | | 4,989 | |
| | | | | Utilities - 3.2% | | | | | | | | |
| | | 44 | | Entergy Corp. | | | | | | | 3,593 | |
| | | 63 | | N.V. Energy, Inc. | | | | | | | 785 | |
| | | 24 | | Northeast Utilities | | | | | | | 675 | |
| | | | | | | | | | | | 5,053 | |
| | | | | Total common stocks | | | | | | | | |
| | | | | (cost $137,830) | | | | | | $ | 155,141 | |
| | | | | | | | | | | | | |
| | | | | Total long-term investments | | | | | | | | |
| | | | | (cost $137,830) | | | | | | $ | 155,141 | |
| | | | | | | | | |
| SHORT-TERM INVESTMENTS - 2.5% | | | | | | | | |
| | | | | Repurchase Agreements - 2.5% | | | | | | | | |
| | | | | BNP Paribas Securities Corp. TriParty Joint | | | | | | | | |
| | | | | Repurchase Agreement (maturing on | | | | | | | | |
| | | | | 05/03/2010 in the amount of $414, | | | | | | | | |
| | | | | collateralized by FHLMC 4.00% - 7.50%, | | | | | | | | |
| | | | | 2012 - 2040, FNMA 4.00% - 6.50%, 2010 - | | | | | | | | |
| | | | | 2040, value of $423) | | | | | | | | |
| | $ | 414 | | 0.20%, 04/30/2010 | | | | | | $ | 414 | |
| | | | | Deutsche Bank Securities TriParty Joint | | | | | | | | |
| | | | | Repurchase Agreement (maturing on | | | | | | | | |
| | | | | 05/03/2010 in the amount of $1,545, | | | | | | | | |
| | | | | collateralized by FNMA 3.50% - 9.00%, | | | | | | | | |
| | | | | 2013 - 2048, value of $1,576) | | | | | | | | |
| | | 1,545 | | 0.20%, 04/30/2010 | | | | | | | 1,545 | |
| | | | | JP Morgan Chase TriParty Joint Repurchase | | | | | | | | |
| | | | | Agreement (maturing on 05/03/2010 in the | | | | | | | | |
| | | | | amount of $476, collateralized by FHLMC | | | | | | | | |
| | | | | 6.00% - 6.50%, 2038, value of $486) | | | | | | | | |
| | | 476 | | 0.20%, 04/30/2010 | | | | | | | 476 | |
| | | | | Morgan Stanley & Co., Inc. TriParty Joint | | | | | | | | |
| | | | | Repurchase Agreement (maturing on | | | | | | | | |
| | | | | 05/03/2010 in the amount of $964, | | | | | | | | |
| | | | | collateralized by FHLMC 4.00% - 6.50%, | | | | | | | | |
| | | | | 2017 - 2040, FNMA 3.50% - 6.50%, 2018 - | | | | | | | | |
| | | | | 2040, value of $985) | | | | | | | | |
| | | 964 | | 0.19%, 04/30/2010 | | | | | | | 964 | |
| | | | | UBS Securities, Inc. Repurchase Agreement | | | | | | | | |
| | | | | (maturing on 05/03/2010 in the amount of | | | | | | | | |
| | | | | $7, collateralized by U.S. Treasury Bond | | | | | | | | |
| | | | | 7.63%, 2022, value of $7) | | | | | | | | |
| | | 7 | | 0.18%, 04/30/2010 | | | | | | | 7 | |
| | | | | UBS Securities, Inc. TriParty Joint Repurchase | | | | | | | | |
| | | | | Agreement (maturing on 05/03/2010 in the | | | | | | | | |
| | | | | amount of $565, collateralized by U.S. | | | | | | | | |
| | | | | Treasury Note 3.00%, 2017, value of $576) | | | | | | | | |
| | $ | 565 | | 0.20%, 04/30/2010 | | | | | | $ | 565 | |
| | | | | | | | | | | | 3,971 | |
| | | | | Total short-term investments | | | | | | | | |
| | | | | (cost $3,971) | | | | | | $ | 3,971 | |
| | | | | | | | | | | | | |
| | | | | Total investments | | | | | | | | |
| | | | | (cost $141,801) ▲ | | | 101.0 | % | | $ | 159,112 | |
| | | | | Other assets and liabilities | | | (1.0 | )% | | | (1,595 | ) |
| | | | | Total net assets | | | 100.0 | % | | $ | 157,517 | |
| Note: | Percentage of investments as shown is the ratio of the total market value to total net assets. Market value of investments in foreign securities represents 10.4% of total net assets at April 30, 2010. |
Foreign securities that are principally traded on certain foreign markets are adjusted daily pursuant to a third party pricing service methodology approved by the Board of Directors in order to reflect an adjustment for factors occurring after the close of the foreign market but before the close of the New York Stock Exchange.
| ▲ | At April 30, 2010, the cost of securities for federal income tax purposes was $143,909 and the aggregate gross unrealized appreciation and depreciation based on that cost were: |
| Unrealized Appreciation | | $ | 20,823 | |
| Unrealized Depreciation | | | (5,620 | ) |
| Net Unrealized Appreciation | | $ | 15,203 | |
| † | The aggregate value of securities valued in good faith at fair value as determined under policies and procedures established by and under the supervision of the Fund's Board of Directors at April 30, 2010, was $661, which represents 0.42% of total net assets. This amount excludes securities that are principally traded in certain foreign markets and whose prices are adjusted pursuant to a third party pricing service methodology approved by the Board of Directors. |
| ● | Currently non-income producing. |
| ‡ | This security, or a portion of this security, has been segregated to cover funding requirements on investment transactions settling in the future. |
| ■ | Securities issued within terms of a private placement memorandum, exempt from registration under Rule 144A under the Securities Act of 1933, as amended, and may be sold only to qualified institutional buyers. Pursuant to guidelines adopted by the Board of Directors, these issues are determined to be liquid. The aggregate value of these securities at April 30, 2010, was $2,380, which represents 1.51% of total net assets. |
| ☼ | The cost of securities purchased on a when-issued or delayed delivery basis at April 30, 2010 was $14. |
The accompanying notes are an integral part of these financial statements.
| The Hartford Value Opportunities Fund |
Schedule of Investments – (continued)
April 30, 2010 (Unaudited)
(000’s Omitted)
| ⌂ | The following securities are considered illiquid. Illiquid securities are often purchased in private placement transactions, are often not registered under the Securities Act of 1933 and may have contractual restrictions on resale. A security may also be considered illiquid if the security lacks a readily available market or if its valuation has not changed for a certain period of time. |
| Period | | | Shares/ | | | | | |
| Acquired | | | Par | | Security | | Cost Basis | |
| 03/2007 | | | | 30 | | Solar Capital Ltd. | | $ | 903 | |
| 03/2007 | | | | 74 | | Solar Cayman Ltd. | | | 55 | |
The aggregate value of these securities at April 30, 2010 was $661 which represents 0.42% of total net assets.
Forward Foreign Currency Contracts Outstanding at April 30, 2010
| | | | | | | | | | Unrealized | |
| | | Market | | | Contract | | Delivery | | Appreciation/ | |
| Description | | Value ╪ | | | Amount | | Date | | (Depreciation) | |
| British Pound (Buy) | | $ | 14 | | | $ | 14 | | 05/04/10 | | $ | – | |
| British Pound (Buy) | | | 13 | | | | 13 | | 05/06/10 | | | – | |
| British Pound (Buy) | | | 28 | | | | 28 | | 05/05/10 | | | – | |
| Euro (Buy) | | | 27 | | | | 27 | | 05/03/10 | | | – | |
| Euro (Buy) | | | 29 | | | | 29 | | 05/04/10 | | | – | |
| Japanese Yen (Buy) | | | 14 | | | | 14 | | 05/10/10 | | | – | |
| Japanese Yen (Sell) | | | 1,424 | | | | 1,502 | | 06/16/10 | | | 78 | |
| Swiss Franc (Buy) | | | 19 | | | | 18 | | 05/03/10 | | | 1 | |
| Swiss Franc (Buy) | | | 37 | | | �� | 37 | | 05/04/10 | | | – | |
| Swiss Franc (Buy) | | | 31 | | | | 31 | | 05/05/10 | | | – | |
| | | | | | | | | | | | $ | 79 | |
| ╪ | See Significant Accounting Policies of accompanying Notes to Financial Statements regarding valuation of securities. |
The accompanying notes are an integral part of these financial statements.
| The Hartford Value Opportunities Fund |
April 30, 2010 (Unaudited)
(000’s Omitted)
| | | Total | | | Level 1♦ | | | Level 2♦ | | | Level 3 | |
| Assets: | | | | | | | | | | | | |
| Common Stocks ‡ | | $ | 155,141 | | | $ | 143,106 | | | $ | 8,994 | | | $ | 3,041 | |
| Short-Term Investments | | | 3,971 | | | | – | | | | 3,971 | | | | – | |
| Total | | $ | 159,112 | | | $ | 143,106 | | | $ | 12,965 | | | $ | 3,041 | |
| Forward Foreign Currency Contracts * | | | 79 | | | | – | | | | 79 | | | | – | |
| Total | | $ | 79 | | | $ | – | | | $ | 79 | | | $ | – | |
| Liabilities: | | | | | | | | | | | | | | | | |
| Forward Foreign Currency Contracts * | | | – | | | | – | | | | – | | | | – | |
| Total | | $ | – | | | $ | – | | | $ | – | | | $ | – | |
| ♦ | For the period ended April 30, 2010, there were no significant transfers between Level 1 and Level 2. |
| ‡ | The Fund has all or primarily all of these equity securities categorized in a single level. Refer to the Schedule of Investments for further industry breakout. |
| * | Derivative instruments not reflected in the Schedule of Investments are valued at the unrealized appreciation/depreciation on the investments. |
Following is a reconciliation of Level 3 assets for which significant unobservable inputs were used to determine fair value:
| | | | | | | | | Change in | | | | | | | | | | | | | | | | |
| | | Balance as | | | | | | Unrealized | | | | | | | | | Transfers | | | Transfers | | | Balance as | |
| | | of October | | | Realized | | | Appreciation | | | | | | | | | Into | | | Out of Level | | | of April 30, | |
| | | 31, 2009 | | | Gain (Loss) | | | (Depreciation) | | | Purchases | | | Sales | | | Level 3 | | | 3 | | | 2010 | |
| Assets: | | | | | | | | | | | | | | | | | | | | | | | | | | |
| Common Stock | | $ | 2,843 | | | $ | — | | | $ | 219 | * | | $ | 903 | | | $ | (924 | ) | | $ | — | | | $ | — | | | $ | 3,041 | |
| Total | | $ | 2,843 | | | $ | — | | | $ | 219 | | | $ | 903 | | | $ | (924 | ) | | $ | — | | | $ | — | | | $ | 3,041 | |
* Change in unrealized gains or losses in the current period relating to assets still held at April 30, 2010 was $219.
The accompanying notes are an integral part of these financial statements.
| The Hartford Value Opportunities Fund |
April 30, 2010 (Unaudited)
(000’s Omitted)
| Assets: | | | |
| Investments in securities, at market value (cost $141,801) | | $ | 159,112 | |
| Cash | | | — | |
| Foreign currency on deposit with custodian (cost $7) | | | 7 | |
| Unrealized appreciation on forward foreign currency contracts | | | 79 | |
| Receivables: | | | | |
| Investment securities sold | | | 2,366 | |
| Fund shares sold | | | 313 | |
| Dividends and interest | | | 108 | |
| Other assets | | | 90 | |
| Total assets | | | 162,075 | |
| Liabilities: | | | | |
| Unrealized depreciation on forward foreign currency contracts | | | — | |
| Payables: | | | | |
| Investment securities purchased | | | 4,231 | |
| Fund shares redeemed | | | 255 | |
| Investment management fees | | | 14 | |
| Administrative fees | | | — | |
| Distribution fees | | | 5 | |
| Accrued expenses | | | 53 | |
| Total liabilities | | | 4,558 | |
| Net assets | | $ | 157,517 | |
| Summary of Net Assets: | | | | |
| Capital stock and paid-in-capital | | $ | 221,151 | |
| Accumulated undistributed net investment income | | | 186 | |
| Accumulated net realized loss on investments and foreign currency transactions | | | (81,207 | ) |
| Unrealized appreciation of investments and the translation of assets and liabilities denominated in foreign currency | | | 17,387 | |
| Net assets | | $ | 157,517 | |
| | | | | |
| Shares authorized | | | 27,000,000 | |
| Par value | | $ | 0.0001 | |
Class A: Net asset value per share/Maximum offering price per share | | | $12.32/$13.04 | |
| Shares outstanding | | | 6,606 | |
| Net assets | | $ | 81,355 | |
Class B: Net asset value per share | | $ | 11.13 | |
| Shares outstanding | | | 743 | |
| Net assets | | $ | 8,267 | |
Class C: Net asset value per share | | $ | 11.10 | |
| Shares outstanding | | | 1,084 | |
| Net assets | | $ | 12,033 | |
Class I: Net asset value per share | | $ | 12.19 | |
| Shares outstanding | | | 125 | |
| Net assets | | $ | 1,518 | |
Class L: Net asset value per share/Maximum offering price per share | | | $12.34/$12.96 | |
| Shares outstanding | | | 1,931 | |
| Net assets | | $ | 23,818 | |
Class R3: Net asset value per share | | $ | 12.48 | |
| Shares outstanding | | | 112 | |
| Net assets | | $ | 1,401 | |
Class R4: Net asset value per share | | $ | 12.54 | |
| Shares outstanding | | | 388 | |
| Net assets | | $ | 4,867 | |
Class R5: Net asset value per share | | $ | 12.59 | |
| Shares outstanding | | | 4 | |
| Net assets | | $ | 50 | |
Class Y: Net asset value per share | | $ | 12.65 | |
| Shares outstanding | | | 1,913 | |
| Net assets | | $ | 24,208 | |
The accompanying notes are an integral part of these financial statements.
| The Hartford Value Opportunities Fund |
For the Six-Month Period Ended April 30, 2010 (Unaudited)
(000’s Omitted)
| Investment Income: | | | |
| Dividends | | $ | 1,148 | |
| Interest | | | 2 | |
| Less: Foreign tax withheld | | | (22 | ) |
| Total investment income | | | 1,128 | |
| Expenses: | | | | |
| Investment management fees | | | 534 | |
| Administrative services fees | | | 4 | |
| Transfer agent fees | | | 147 | |
| Distribution fees | | | | |
| Class A | | | 93 | |
| Class B | | | 41 | |
| Class C | | | 55 | |
| Class L | | | 28 | |
| Class R3 | | | 3 | |
| Class R4 | | | 5 | |
| Custodian fees | | | 6 | |
| Accounting services fees | | | 10 | |
| Registration and filing fees | | | 42 | |
| Board of Directors' fees | | | 3 | |
| Audit fees | | | 4 | |
| Other expenses | | | 25 | |
| Total expenses (before waivers and fees paid indirectly) | | | 1,000 | |
| Expense waivers | | | (53 | ) |
| Transfer agent fee waivers | | | (9 | ) |
| Commission recapture | | | (1 | ) |
| Custodian fee offset | | | — | |
| Total waivers and fees paid indirectly | | | (63 | ) |
| Total expenses, net | | | 937 | |
| Net Investment Income | | | 191 | |
| Net Realized Gain on Investments and Foreign Currency Transactions: | | | | |
| Net realized gain on investments in securities | | | 5,188 | |
| Net realized gain on forward foreign currency contracts | | | 20 | |
| Net realized gain on other foreign currency transactions | | | 3 | |
| Net Realized Gain on Investments and Foreign Currency Transactions | | | 5,211 | |
| Net Changes in Unrealized Appreciation of Investments and Foreign Currency Transactions: | | | | |
| Net unrealized appreciation of investments | | | 20,328 | |
| Net unrealized appreciation of forward foreign currency contracts | | | 75 | |
| Net unrealized appreciation on translation of other assets and liabilities in foreign currencies | | | 1 | |
| Net Changes in Unrealized Appreciation of Investments and Foreign Currency Transactions | | | 20,404 | |
| Net Gain on Investments and Foreign Currency Transactions | | | 25,615 | |
| Net Increase in Net Assets Resulting from Operations | | $ | 25,806 | |
The accompanying notes are an integral part of these financial statements.
| The Hartford Value Opportunities Fund |
(000’s Omitted)
| | | For the Six-Month | | | | |
| | | Period Ended | | | For the | |
| | | April 30, 2010 | | | Year Ended | |
| | | (Unaudited) | | | October 31, 2009 | |
| Operations: | | | | | | |
| Net investment income | | $ | 191 | | | $ | 606 | |
| Net realized gain (loss) on investments and foreign currency transactions | | | 5,211 | | | | (35,600 | ) |
| Net unrealized appreciation of investments and foreign currency transactions | | | 20,404 | | | | 56,417 | |
| Net Increase In Net Assets Resulting From Operations | | | 25,806 | | | | 21,423 | |
| Distributions to Shareholders: | | | | | | | | |
| From net investment income | | | | | | | | |
| Class A | | | (316 | ) | | | (1,018 | ) |
| Class B | | | (5 | ) | | | (95 | ) |
| Class C | | | — | | | | (73 | ) |
| Class I | | | (7 | ) | | | (22 | ) |
| Class L | | | (101 | ) | | | (402 | ) |
| Class R3 | | | (1 | ) | | | (12 | ) |
| Class R4 | | | (15 | ) | | | (41 | ) |
| Class R5 | | | — | | | | — | |
| Class Y | | | (55 | ) | | | (82 | ) |
| Total distributions | | | (500 | ) | | | (1,745 | ) |
| Capital Share Transactions: | | | | | | | | |
| Class A | | | (171 | ) | | | (4,136 | ) |
| Class B | | | (1,203 | ) | | | (1,211 | ) |
| Class C | | | (203 | ) | | | (2,757 | ) |
| Class I | | | (169 | ) | | | 77 | |
| Class L | | | (1,592 | ) | | | (2,335 | ) |
| Class R3 | | | 431 | | | | (44 | ) |
| Class R4 | | | 569 | | | | 1,077 | |
| Class R5 | | | 31 | | | | 5 | |
| Class Y | | | 14,800 | | | | (10,677 | ) |
| Net increase (decrease) from capital share transactions | | | 12,493 | | | | (20,001 | ) |
| Net Increase (Decrease) In Net Assets | | | 37,799 | | | | (323 | ) |
| Net Assets: | | | | | | | | |
| Beginning of period | | | 119,718 | | | | 120,041 | |
| End of period | | $ | 157,517 | | | $ | 119,718 | |
| Accumulated undistributed (distribution in excess of) net investment income (loss) | | $ | 186 | | | $ | 495 | |
The accompanying notes are an integral part of these financial statements.
| The Hartford Value Opportunities Fund |
April 30, 2010 (Unaudited)
(000’s Omitted)
The Hartford Mutual Funds II, Inc. (“Company”) is an open-end management investment company comprised of five portfolios. Financial statements for The Hartford Value Opportunities Fund (the “Fund”), a series of the Company, are included in this report.
The Company is organized under the laws of the State of Maryland and is registered with the Securities and Exchange Commission (“SEC”) under the Investment Company Act of 1940, as amended (“1940 Act”). The Fund is a diversified open-end management investment company.
Class A shares are sold with a front-end sales charge of up to 5.50%. Class B shares were sold with a contingent deferred sales charge which is assessed on the lesser of the per share net asset value (“NAV”) of the shares at the time of redemption or the original purchase price, and declines from up to 5.00% to zero depending on the period of time the shares are held (See note below regarding the closing of Class B shares). Class C shares are sold with a contingent deferred sales charge of up to 1.00% on shares redeemed within twelve months of purchase. Class I shares are sold without sales charges to certain eligible investors through advisory fee-based wrap programs. Class L shares are sold with a sales charge of up to 4.75%. Classes R3, R4, and R5 shares, which are offered to employer-sponsored retirement plans, and Class Y shares, which are sold to certain eligible institutional investors, are sold without a sales charge. All classes of shares have identical voting, redemption, dividend, liquidation and other rights and the same terms and conditions, with the exceptions that each class may have different expenses, which may affect performance, and that Class B shares automatically convert to Class A shares after 8 years.
No new or additional investments are allowed in Class B shares of The Hartford Mutual Funds (including investments through any systematic investment plan). Existing shareholders of Class B shares may continue to hold their Class B shares, exchange their Class B shares for Class B shares of another Hartford Mutual Fund (as permitted by existing exchange privileges), or redeem their Class B shares as described in the Fund’s prospectus. Reinstatement privileges with respect to Class B shares will continue under the current policy. For investors electing to reinvest capital gains and dividends, any such capital gains or dividends on Class B shares will continue to be reinvested in Class B shares of the Fund. All Class B share attributes, including the 12b-1 fee, contingent deferred sales charge schedule, and conversion to Class A shares remain unchanged.
| 2. | Significant Accounting Policies: |
The following is a summary of significant accounting policies of the Fund, which are in accordance with U.S. Generally Accepted Accounting Principles (“GAAP”).
| a) | Security Transactions and Investment Income – Security transactions are recorded on the trade date (the date the order to buy or sell is executed). Security gains and losses are determined on the basis of identified cost. |
Dividend income is accrued as of the ex-dividend date, except that certain dividends for foreign securities where the ex-dividend date may have passed are recorded as soon as the Fund is informed of the dividend in the exercise of reasonable diligence. Interest income, including amortization of premium and accretion of discounts, is accrued on a daily basis.
| b) | Security Valuation – The Fund generally uses market prices in valuing portfolio securities. If market prices are not readily available or are deemed unreliable, the Fund will use the fair value of the security as determined in good faith under policies and procedures established by and under the supervision of the Fund’s Board of Directors. Market prices may be deemed unreliable, for example, if a security is thinly traded or if an event has occurred after the close of the security’s primary market, but before the close of the New York Stock Exchange (the “Exchange”) (generally 4:00 p.m. Eastern Time, referred to as the “Valuation Time”) that is expected to affect the value of the portfolio security. The circumstances in which the Fund may use fair value pricing include, among others: (i) the occurrence of events that are significant to a particular issuer, such as mergers, restructuring or defaults; (ii) the occurrence of events that are |
| The Hartford Value Opportunities Fund |
Notes to Financial Statements – (continued)
April 30, 2010 (Unaudited)
(000’s Omitted)
significant to an entire market, such as natural disasters in a particular region or governmental actions; (iii) trading restrictions on securities; (iv) thinly traded securities and (v) market events such as trading halts and early market closings. In addition, with respect to the valuation of stocks primarily traded on foreign markets, the Fund uses a fair value pricing service approved by the Fund’s Board of Directors, which employs quantitative models that evaluate changes in the value of foreign market proxies (e.g., futures contracts, American Depositary Receipts, exchange traded funds (“ETF’s”)) after the close of the foreign markets but before the Valuation Time. Securities that are primarily traded on foreign markets may trade on days that are not business days of the Fund. The value of the foreign securities in which the Fund invests may change on days when a shareholder will not be able to purchase or redeem shares of the Fund. Fair value pricing is subjective in nature and the use of fair value pricing by the Fund may cause the NAV of its shares to differ significantly from the NAV that would have been calculated using market prices at the close of the exchange on which a portfolio security is primarily traded but before the Valuation Time. There can be no assurance that the Fund could obtain the fair value assigned to a security if the Fund were to sell the security at approximately the time at which the Fund determines its NAV.
Exchange-traded equity securities are valued at the last reported sale price on the exchange or market on which the security is primarily traded (the “Primary Market”) at the Valuation Time. If the security did not trade on the Primary Market, it may be valued at the Valuation Time at the last reported sale price on another exchange where it trades. The value of an equity security not traded on any exchange but traded on the Nasdaq Stock Market, Inc. (“Nasdaq”) or another over-the-counter market shall be valued at the last reported sale price or official closing price on the exchange or market on which the security is traded as of the Valuation Time.
Foreign-denominated assets, including investment securities, and liabilities are translated from the local currency into U.S. dollars using exchange rates obtained from an independent third party as of the Fund’s Valuation Time.
Financial instruments for which prices are not available from an independent pricing service are valued using market quotations obtained from one or more dealers that make markets in securities in accordance with procedures established by the Fund’s Board of Directors.
Forward foreign currency contracts represent agreements to exchange currencies on specific future dates at predetermined rates. Forward foreign currency contracts are valued using foreign currency exchange rates and forward rates on the Valuation Date from an independent pricing service.
Other derivative or contractual type instruments shall be valued using market prices if such instruments trade on an exchange or market. If such instruments do not trade on an exchange or market, such instruments shall be valued at a price at which the counterparty to such contract would repurchase the instrument. In the event that the counterparty cannot provide a price, such valuation may be determined in accordance with procedures established by the Fund’s Board of Directors.
Various inputs are used in determining the value of the Fund’s investments. These inputs are summarized into three broad hierarchy levels. This hierarchy is based on whether the valuation inputs are observable or unobservable. These levels are:
| | · | Level 1 – Quoted prices in active markets for identical securities. Level 1 may include exchange-traded instruments such as domestic equities, some foreign equities, options, futures, mutual funds, ETF’s, and rights and warrants. |
| | · | Level 2 – Observable inputs other than Level 1 prices, such as quoted prices for similar securities; quoted prices in markets that are not active; or other inputs that are observable or can be corroborated by observable market data for substantially the full term of the security. Level 2 may include debt securities that are traded less frequently than exchange-traded instruments and which are valued using third party pricing services; foreign equities, whose value is determined using a multi-factor regression model with inputs that are observable in the market; and money market instruments, which are carried at amortized cost. |
| | · | Level 3 – Significant unobservable inputs that are supported by little or no market activity. Level 3 may include financial instruments whose values are determined using broker quotes or require significant management judgment or estimation. These unobservable valuation inputs may include estimates for current yields, maturity/duration, prepayment speed, and broker quotes for comparable securities along with other assumptions relating to credit quality, collateral value, complexity of the security structure, general market conditions and liquidity. This category may include securities where trading has been halted or there are certain restrictions on trading. While these securities are priced using unobservable inputs, the valuation of these securities reflects the best available data and management believes the prices are a reasonable representation of exit price. |
Individual securities within any of the above mentioned asset classes may be assigned a different hierarchical level than those that presented above, as individual circumstances dictate.
For purposes of the roll forward reconciliation for all Level 3 securities from the beginning of the reporting period to the end of the reporting period, transfers in and out are shown as if they occurred at the beginning of the period.
Refer to the Investment Valuation Hierarchy Level Summary and the Level 3 roll forward reconciliation found following the Schedule of Investments.
| c) | Foreign Currency Transactions – Assets and liabilities denominated in currencies other than U.S. dollars are translated into U.S. dollars at the exchange rates in effect on the valuation date. Purchases and sales of investment securities, income and expenses are translated into U.S. dollars at the exchange rates on the dates of such transactions. |
The Fund does not isolate that portion of portfolio security valuation resulting from fluctuations in the foreign currency exchange rates from the fluctuations arising from changes in the market prices of securities held. Exchange rate fluctuations are included with the net realized and unrealized gain or loss on investments in the accompanying financial statements.
Net realized foreign exchange gains or losses arise from sales of foreign currencies and the difference between asset and liability amounts initially stated in foreign currencies and the U.S. dollar value of the amounts actually received or paid. Net unrealized foreign exchange gains or losses arise from changes in the value of other assets and liabilities at the end of the reporting period, resulting from changes in the exchange rates.
| d) | Joint Trading Account – Pursuant to an exemptive order issued by the SEC, the Fund may transfer uninvested cash balances into a joint trading account managed by Wellington Management Company, LLP (“Wellington”). These balances may be invested in one or more repurchase agreements and/or short-term money market instruments. |
| e) | Repurchase Agreements – A repurchase agreement is an agreement by which a counterparty agrees to sell a security and agrees to repurchase the security sold at a mutually agreed upon time and price. At the time the Fund enters into a repurchase agreement, the value of the underlying collateral security(ies), including accrued interest, will be equal to or exceed the value of the repurchase agreement. To minimize counterparty risk, the securities that serve to collateralize the repurchase agreement are held by the Fund's custodian in book entry or physical form in the custodial account of the Fund or in a third party custodial account. Repurchase agreements are valued at cost plus accrued interest. The Fund, as shown on the Schedule of Investments, had outstanding repurchase agreements as of April 30, 2010. |
| f) | Forward Foreign Currency Contracts – The Fund may enter into forward foreign currency contracts that obligate the Fund to purchase or sell currencies at specified future dates. Forward foreign currency contracts may be used to hedge against adverse fluctuations in exchange rates between currencies. |
Forward foreign currency contracts involve elements of market risk in excess of the amounts reflected in the Statement of Assets and Liabilities. In addition, risks may arise upon entering into these contracts from the potential inability of the counterparties to meet the terms of the contracts and from unanticipated movements in the value of the foreign currencies
| The Hartford Value Opportunities Fund |
Notes to Financial Statements – (continued)
April 30, 2010 (Unaudited)
(000’s Omitted)
relative to the U.S. dollar. The Fund had outstanding forward foreign currency contracts as shown on the Schedule of Investments as of April 30, 2010.
| g) | Fund Share Valuation and Dividend Distributions to Shareholders – Orders for the Fund’s shares are executed in accordance with the investment instructions of the shareholders. The NAV of the Fund’s shares is determined as of the close of each business day of the Exchange. The NAV is determined separately for each class of the Fund by dividing the Fund’s net assets attributable to that class by the number of shares of the class outstanding. Orders for the purchase of the Fund’s shares prior to the close of the Exchange on any day on which the Exchange is open for business are priced at the NAV determined as of the close of the Exchange. Orders after the close of the Exchange, or on a day on which the Exchange and/or the Fund is not open for business, are priced at the next determined NAV. |
The Fund intends to distribute substantially all of its net investment income and net realized capital gains to shareholders no less frequently than once a year. Normally, dividends from net investment income of the Fund are declared and paid annually. Unless shareholders specify otherwise, all dividends will be automatically reinvested in additional full or fractional shares of the Fund.
Distributions from net investment income, realized capital gains and capital are determined in accordance with federal income tax regulations, which may differ from U.S. GAAP with respect to character and timing. These differences may include but are not limited to losses deferred due to wash sale adjustments, foreign currency gains and losses, adjustments related to Passive Foreign Investment Companies (“PFICs”), Real Estate Investment Trusts (“REITs”), Regulated Investment Companies (“RICs”), certain derivatives and partnerships. Permanent book and federal income tax basis differences relating to shareholder distributions will result in reclassifications to certain of the Fund’s capital accounts (see Federal Income Taxes: Reclassification of Capital Accounts footnote).
| h) | Illiquid and Restricted Securities – The Fund is permitted to invest up to 15% of its net assets in illiquid securities. “Illiquid Securities” are those that may not be sold or disposed of in the ordinary course of business within seven days, at approximately the price used to determine the Fund’s NAV. The Fund may not be able to sell illiquid securities or other investments when its sub-adviser considers it desirable to do so or may have to sell such securities or investments at a price that is lower than the price that could be obtained if the securities or investments were more liquid. A sale of illiquid securities or other investments may require more time and may result in higher dealer discounts and other selling expenses than does the sale of those that are liquid. Illiquid securities and investments also may be more difficult to value, due to the unavailability of reliable market quotations for such securities or investments, and an investment in them may have an adverse impact on the Fund’s NAV. The Fund may also purchase certain restricted securities, commonly known as Rule 144A securities, that can be resold to institutions and which may be determined to be liquid pursuant to policies and guidelines established by the Fund’s Board of Directors. The Fund, as shown on the Schedule of Investments, had illiquid and/or restricted securities as of April 30, 2010. |
| i) | Securities Purchased on a When-Issued or Delayed-Delivery Basis – Delivery and payment for securities that have been purchased by the Fund on a forward commitment, or when-issued or delayed-delivery basis, take place beyond the customary settlement period. During this period, such securities are subject to market fluctuations, and the Fund identifies securities segregated in its records with value at least equal to the amount of the commitment. The Fund, as shown on the Schedule of Investments, had when-issued or delayed delivery securities as of April 30, 2010. |
| j) | Use of Estimates – The preparation of financial statements in conformity with U.S. GAAP requires management to make estimates and assumptions that affect the reported amounts of assets and liabilities as of the date of the financial statements and the reported amounts of income and expenses during the period. Operating results in the future could vary from the amounts derived from management’s estimates. |
| | k) | Additional Derivative Instrument(s) Information |
Derivative Instrument(s) as of April 30, 2010.
| | | Asset Derivatives | | Liability Derivatives | |
| Risk Exposure Category | | Statement of Assets and Liabilities Location | | Statement of Assets and Liabilities Location | |
Foreign exchange contracts | | Unrealized appreciation on forward foreign currency contracts | | $ | 79 | | Unrealized depreciation on forwardforeign currency contracts | | $ | – | |
The volume of derivatives that is presented in the Schedule of Investments is consistent with the derivative activity during the six-month period ended April 30, 2010.
Realized Gain/Loss and Change in Unrealized Appreciation (Depreciation) on Derivative Instruments for the six-month period ended April 30, 2010:
| Amount of Realized Gain or (Loss) on Derivatives Recognized in Income |
| | | | | | | | | | | | | Forward | | | | | | | |
| | | | | | | Purchased | | | | | | Currency | | | | | | | |
| Risk Exposure Category | | Written Options | | | Options | | | Futures | | | Contracts | | | Swaps | | | Total | |
| Foreign exchange contracts | | | $ | — | | | $ | — | | | $ | — | | | $ | 20 | | | $ | — | | | $ | 20 | |
| Total | | | $ | — | | | $ | — | | | $ | — | | | $ | 20 | | | $ | — | | | $ | 20 | |
| | | | | | |
Change in Unrealized Appreciation or (Depreciation) on Derivatives Recognized in Income |
| | | | | | | | | | | | | | | | Forward | | | | | | | | | |
| | | | | | | | Purchased | | | | | | | Currency | | | | | | | | | |
| Risk Exposure Category | | Written Options | | | Options | | | Futures | | | Contracts | | | Swaps | | | Total | |
| Foreign exchange contracts | | | | — | | | | — | | | | — | | | | 75 | | | | — | | | $ | 75 | |
| Total | | | $ | — | | | $ | — | | | $ | — | | | $ | 75 | | | $ | — | | | $ | 75 | |
| l) | Indemnifications – Under the Company’s organizational documents, the Company shall indemnify its officers and directors to the full extent required or permitted under Maryland General Corporation Law and the federal securities law. In addition, the Company, on behalf of the Fund, may enter into contracts that contain a variety of indemnifications. The Company’s maximum exposure under these arrangements is unknown. However, the Company has not had prior claims or losses pursuant to these contracts and expects the risk of loss to be remote. |
| | a) | Federal Income Taxes – For federal income tax purposes, the Fund intends to continue to qualify as a RIC under Subchapter M of the Internal Revenue Code (“IRC”) by distributing substantially all of its taxable net investment income and net realized capital gains to its shareholders and otherwise complying with the requirements of RICs. The Fund has distributed substantially all of its income and capital gains in prior years and intends to distribute substantially all of its income and capital gains during the calendar year ending December 31, 2010. Accordingly, no provision for federal income or excise taxes has been made in the accompanying financial statements. Distributions from short-term capital gains are treated as ordinary income distributions for federal income tax purposes. |
| | | |
| | b) | Net Investment Income (Loss), Net Realized Gains (Losses) – Net investment income (loss) and net realized gains (losses) may differ for financial statement and tax purposes primarily because of losses deferred due to wash sale adjustments, foreign currency gains and losses, adjustments related to PFICs, REITs, RICs, certain derivatives and partnerships. The character of distributions made during the year from net investment income or net realized gains may differ from their ultimate characterization for federal income tax purposes. Also, due to the timing of dividend distributions, the fiscal year in which amounts are distributed may differ from the year that the income or realized gains (losses) were recorded by the Fund. |
| The Hartford Value Opportunities Fund |
Notes to Financial Statements – (continued)
April 30, 2010 (Unaudited)
(000’s Omitted)
| c) | Distributions and Components of Distributable Earnings – The tax character of distributions paid by the Fund for the periods indicated is as follows (as adjusted for dividends payable): |
| | | For the Year Ended | | | For the Year Ended | |
| | | October 31, 2009 | | | October 31, 2008 | |
| Ordinary Income | | $ | 1,745 | | | $ | 11,033 | |
| Long-Term Capital Gains * | | | — | | | | 30,965 | |
* The Fund designates these distributions as long-term capital gain dividends pursuant to IRC code Sec. 852(b)(3)(C).
As of October 31, 2009, the Fund’s components of distributable earnings (deficit) on a tax basis were as follows:
| | | Amount | |
| Undistributed Ordinary Income | | $ | 495 | |
| Accumulated Capital Losses * | | | (84,311 | ) |
Unrealized Depreciation † | | | (5,124 | ) |
| Total Accumulated Deficit | | $ | (88,940 | ) |
| | * | The Fund has capital loss carryforwards that are identified in the Capital Loss Carryforward note that follows. |
| † | The differences between book-basis and tax-basis unrealized appreciation (depreciation) may be attributable to the losses deferred due to wash sale adjustments, foreign currency gains and losses, adjustments related to PFICs, REITs, RICs, certain derivatives and partnerships. |
| d) | Reclassification of Capital Accounts – The Fund may record reclassifications in its capital accounts. These reclassifications have no impact on the total net assets of the Fund. The reclassifications are a result of permanent differences between GAAP and tax accounting for such items as net operating losses that reduce distribution requirements. Adjustments are made to reflect the impact these items have on current and future distributions to shareholders. Therefore, the source of the Fund’s distributions may be shown in the accompanying Statement of Changes in Net Assets as from net investment income, from net realized gains on investments or from capital depending on the type of book and tax differences that exist. For the year ended October 31, 2009, the Fund recorded reclassifications to increase (decrease) the accounts listed below: |
| | | Amount | |
| Undistributed Net Investment Income | | $ | (298 | ) |
| Accumulated Net Realized Gain | | | 298 | |
| e) | Capital Loss Carryforward – At October 31, 2009 (tax-year-end), the Fund had capital loss carryforwards for U.S. federal income tax purposes of approximately: |
| Year of Expiration | | Amount | |
| 2016 | | $ | 49,188 | |
| 2017 | | | 35,123 | |
| Total | | $ | 84,311 | |
| | f) | Accounting for Uncertainty in Income Taxes – Management has evaluated all open tax years and has determined there is no impact to the Fund’s financial statements related to uncertain tax positions. Generally, tax authorities can examine all tax returns filed for the last three years. |
| | | |
| | a) | Investment Management Agreement – Hartford Investment Financial Services, LLC (“HIFSCO”) serves as investment manager to the Fund pursuant to an Investment Management Agreement with the Company. As investment manager, HIFSCO has overall investment supervisory responsibility for the Fund. In addition, HIFSCO provides administrative personnel, services, equipment, facilities and office space for proper operation of the Fund. HIFSCO has contracted with Wellington for the provision of day-to-day investment management services to the Fund in accordance with the Fund’s investment objective and policies. The Fund pays a fee to HIFSCO, a portion of which may be used to compensate Wellington. |
The schedule below reflects the rates of compensation paid to HIFSCO for investment management services rendered during the six-month period ended April 30, 2010; the rates are accrued daily and paid monthly:
| Average Daily Net Assets | | Annual Fee | |
| On first $100 million | | | 0.8000 | % |
| On next $150 million | | | 0.7500 | % |
| On next $4.75 billion | | | 0.7000 | % |
| On next $5 billion | | | 0.6975 | % |
| Over $10 billion | | | 0.6950 | % |
| b) | Accounting Services Agreement – Pursuant to the Fund Accounting Agreement between Hartford Life Insurance Company (“HLIC”) and the Fund, HLIC provides accounting services to the Fund and receives monthly compensation on the Fund’s average net assets. The Fund’s accounting services fees are accrued daily and paid monthly. |
| Average Daily Net Assets | | Annual Fee | |
| On first $5 billion | | | 0.014 | % |
| On next $5 billion | | | 0.012 | % |
| Over $10 billion | | | 0.010 | % |
| c) | Operating Expenses – Allocable expenses incurred by the Company are allocated to each Fund and allocated to classes within the Fund in proportion to the average daily net assets of the Fund and each class, except where allocation of certain expenses is more fairly made directly to the Fund or to specific classes within a Fund. During the six-month period ended April 30, 2010, HIFSCO has contractually limited the total operating expenses of this Fund, exclusive of taxes, interest expense, brokerage commissions, certain distribution expenses and extraordinary expenses as follows: |
| | Class A | | | Class B | | | Class C | | | Class I | | | Class L | | | Class R3 | | | Class R4 | | | Class R5 | | | Class Y | |
| | | 1.35 | % | | | 2.10 | % | | | 2.10 | % | | | 1.10 | % | | | 1.40 | % | | | 1.60 | % | | | 1.30 | % | | | 1.00 | % | | | 1.00 | % |
| d) | Fees Paid Indirectly – The Fund has entered into agreements with State Street Global Markets, LLC and Russell Implementation Services Inc. to partially recapture non-discounted trade commissions. Such rebates are used to pay a portion of the Fund’s expenses. In addition, the Fund’s custodian bank has also agreed to reduce its fees when the Fund maintains cash on deposit in a non-interest-bearing custody account. For the six-month period ended April 30, 2010, these amounts are included in the Statement of Operations. |
| The Hartford Value Opportunities Fund |
Notes to Financial Statements – (continued)April 30, 2010 (Unaudited)
(000’s Omitted)
The ratio of expenses to average net assets in the accompanying financial highlights excludes the reduction in expenses related to fees paid indirectly. Had the fees paid indirectly been included, the annualized expense ratio for the periods listed below would have been as follows:
| | | Annualized | | | | | | | | | | | | | | | | |
| | | Six-Month | | | | | | | | | | | | | | | | |
| | | Period | | | Year Ended | | | Year Ended | | | Year Ended | | | Year Ended | | | Year Ended | |
| | | Ended April | | | October 31, | | | October 31, | | | October 31, | | | October 31, | | | October 31, | |
| | | 30, 2010 | | | 2009 | | | 2008 | | | 2007 | | | 2006 | | | 2005 | |
| Class A Shares | | | 1.35 | % | | | 1.19 | % | | | 1.40 | % | | | 1.40 | % | | | 1.39 | % | | | 1.39 | % |
| Class B Shares | | | 2.10 | | | | 1.61 | | | | 1.94 | | | | 2.13 | | | | 2.11 | | | | 2.14 | |
| Class C Shares | | | 2.10 | | | | 1.97 | | | | 2.15 | | | | 2.15 | | | | 2.14 | | | | 2.14 | |
| Class I Shares | | | 1.06 | | | | 1.09 | | | | 1.15 | | | | 1.15 | | | | 1.15 | * | | | | |
| Class L Shares | | | 1.15 | | | | 1.19 | | | | 1.20 | | | | 1.24 | | | | 1.22 | | | | 1.30 | |
| Class R3 Shares | | | 1.60 | | | | 1.59 | | | | 1.65 | | | | 1.65 | † | | | | | | | | |
| Class R4 Shares | | | 1.30 | | | | 1.29 | | | | 1.35 | | | | 1.35 | † | | | | | | | | |
| Class R5 Shares | | | 1.00 | | | | 0.99 | | | | 1.05 | | | | 1.05 | † | | | | | | | | |
| Class Y Shares | | | 0.92 | | | | 0.95 | | | | 0.96 | | | | 0.94 | | | | 0.99 | | | | 1.06 | |
| * | From August 31, 2006 (commencement of operations), through October 31, 2006. |
| † | From December 22, 2006 (commencement of operations), through October 31, 2007. |
| e) | Distribution and Service Plan for Class A, B, C, L, R3 and R4 Shares – HIFSCO is the principal underwriter and distributor of the Fund. HIFSCO is engaged in distribution activities, which include marketing and distribution of shares through broker-dealers, financing distribution costs and maintaining financial books and records. For the six-month period ended April 30, 2010, HIFSCO received front-end load sales charges of $173 and contingent deferred sales charges of $9 from the Fund. |
The Fund has adopted a Distribution and Service Plan in accordance with Rule 12b-1 of the Investment Company Act of 1940, as amended, to compensate the distributor (HIFSCO) for activities intended to result in the sale and distribution of Classes A, B, C, L, R3 and R4 shares and for providing services for shareholders. The Rule 12b-1 plan applicable to Class A shares of the Fund provides for payment of a Rule 12b-1 fee of up to 0.35% of average daily net assets; however, the Board of Directors has currently authorized 12b-1 payments of up to 0.25%. Some or all of the fee may be used for shareholder servicing expenses with the remainder used for distribution expenses. Some or the entire Rule 12b-1 fee for Class B shares may be remitted to broker-dealers for distribution and/or shareholder account services. Under the Class B Plan, the Fund pays the distributor 1.00% of the average daily net assets of Class B shares that are outstanding for 8 years or less, 0.25% of which is a fee for services provided to existing shareholders with the remainder used for distribution expenses. After eight years, Class B shares convert to Class A shares. Upon conversion to Class A shares, the Class A plan described above will apply to those shares. Under the Class C Plan, the Fund pays the distributor 1.00% of the average daily net assets of Class C shares outstanding, 0.25% of which is intended as a fee for services provided to existing shareholders with the remainder used for distribution expenses. For Class C shares, some or the entire fee may be remitted to broker-dealers for distribution and/or shareholder account services. Class L has a distribution fee of 0.25%. Class R3 shares have a distribution fee of 0.50% and Class R4 shares have a distribution fee of 0.25%. For Classes R3 and R4 shares, some or the entire fee may be remitted to broker dealers for distribution and/or shareholder account services. The Fund’s 12b-1 fees are accrued daily and paid monthly.
For the six-month period ended April 30, 2010, total sales commissions paid to affiliated brokers/dealers of The Hartford for distributing the Fund’s shares were $9. These commissions are in turn paid to sales representatives of the broker/dealers.
| f) | Other Related Party Transactions – Certain officers of the Fund are directors and/or officers of HIFSCO and/or The Hartford or its subsidiaries. For the six-month period ended April 30, 2010, a portion of the Fund’s chief compliance |
officer’s salary was paid by all the investment companies in the Hartford fund complex. The portion allocated to the Fund rounds to zero. Hartford Administrative Services Company (“HASCO”), an indirect wholly owned subsidiary of The Hartford, provides transfer agent services to the Fund. HASCO has contractually agreed to reimburse any portion of the transfer agency fees over 0.30% of average daily net assets per fiscal year for all classes. HASCO was compensated $139 for providing such services. These fees are accrued daily and paid monthly.
Administrative services fees are paid to HASCO for third-party recordkeeping services that are payable as a percentage of net assets in the amount of 0.20%, 0.15% and 0.10% for Classes R3, R4 and R5 shares, respectively. The total administrative services fees are shown on the Statement of Operations. These fees are accrued daily and paid monthly.
| g) | Payments from Affiliate – The total return in the accompanying financial highlights includes payment from affiliates. Had the payment from affiliates been excluded, the total return for the periods listed below would have been as follows: |
| | | Impact from Payment | | | Total Return | |
| | | from Affiliate for SEC | | | Excluding Payment | |
| | | Settlement for the | | | from Affiliate for the | |
| | | Year Ended | | | Year Ended | |
| | | October 31, 2007 | | | October 31, 2007 | |
| Class A | | | 0.01 | % | | | 9.72 | % |
| Class B | | | 0.01 | | | | 8.89 | |
| Class C | | | 0.01 | | | | 8.90 | |
| Class I | | | 0.01 | | | | 10.07 | |
| Class L | | | 0.01 | | | | 9.91 | |
| Class Y | | | 0.01 | | | | 10.29 | |
As of April 30, 2010, affiliates of The Hartford had ownership of shares in the Fund as follows:
| 6. | Investment Transactions: |
For the six-month period ended April 30, 2010, the Fund's aggregate purchases and sales of investment securities (excluding short-term investments) were as follows:
| | | Amount | |
| Cost of Purchases Excluding U.S. Government Obligations | | $ | 69,809 | |
| Sales Proceeds Excluding U.S. Government Obligations | | | 57,188 | |
| The Hartford Value Opportunities Fund |
Notes to Financial Statements – (continued)April 30, 2010 (Unaudited)
(000’s Omitted)
| 7. | Capital Share Transactions: |
The following information is for the six-month period ended April 30, 2010 and the year ended October 31, 2009:
| | | For the Six-Month Period Ended April 30, 2010 | | | For the Year Ended October 31, 2009 | |
| | | | | | Shares | | | | | | Shares | | | | | | | | | Shares | | | | | | Shares | | | | |
| | | | | | Issued for | | | | | | Issued | | | Net Increase | | | | | | Issued for | | | | | | Issued | | | Net Increase | |
| | | Shares | | | Reinvested | | | Shares | | | from | | | (Decrease) of | | | Shares | | | Reinvested | | | Shares | | | from | | | (Decrease) of | |
| | | Sold | | | Dividends | | | Redeemed | | | Merger | | | Shares | | | Sold | | | Dividends | | | Redeemed | | | Merger | | | Shares | |
| | | | | | | | | | | | | | | | | | | | | | | | | | | | | | | |
| Class A | | | | | | | | | | | | | | | | | | | | | | | | | | | | | | |
Shares | | | 735 | | | | 26 | | | | (786 | ) | | | — | | | | (25 | ) | | | 1,819 | | | | 131 | | | | (2,568 | ) | | | — | | | | (618 | ) |
Amount | | $ | 8,525 | | | $ | 296 | | | $ | (8,992 | ) | | $ | — | | | $ | (171 | ) | | $ | 15,834 | | | $ | 974 | | | $ | (20,944 | ) | | $ | — | | | $ | (4,136 | ) |
| Class B | | | | | | | | | | | | | | | | | | | | | | | | | | | | | | | | | | | | | | | | |
Shares | | | 20 | | | | — | | | | (135 | ) | | | — | | | | (115 | ) | | | 113 | | | | 14 | | | | (295 | ) | | | — | | | | (168 | ) |
Amount | | $ | 208 | | | $ | 5 | | | $ | (1,416 | ) | | $ | — | | | $ | (1,203 | ) | | $ | 865 | | | $ | 92 | | | $ | (2,168 | ) | | $ | — | | | $ | (1,211 | ) |
| Class C | | | | | | | | | | | | | | | | | | | | | | | | | | | | | | | | | | | | | | | | |
Shares | | | 101 | | | | — | | | | (123 | ) | | | — | | | | (22 | ) | | | 174 | | | | 10 | | | | (592 | ) | | | — | | | | (408 | ) |
Amount | | $ | 1,058 | | | $ | — | | | $ | (1,261 | ) | | $ | — | | | $ | (203 | ) | | $ | 1,330 | | | $ | 65 | | | $ | (4,152 | ) | | $ | — | | | $ | (2,757 | ) |
| Class I | | | | | | | | | | | | | | | | | | | | | | | | | | | | | | | | | | | | | | | | |
Shares | | | 26 | | | | 1 | | | | (42 | ) | | | — | | | | (15 | ) | | | 154 | | | | 3 | | | | (157 | ) | | | — | | | | — | |
Amount | | $ | 289 | | | $ | 6 | | | $ | (464 | ) | | $ | — | | | $ | (169 | ) | | $ | 1,468 | | | $ | 22 | | | $ | (1,413 | ) | | $ | — | | | $ | 77 | |
| Class L | | | | | | | | | | | | | | | | | | | | | | | | | | | | | | | | | | | | | | | | |
Shares | | | 29 | | | | 9 | | | | (178 | ) | | | — | | | | (140 | ) | | | 80 | | | | 53 | | | | (411 | ) | | | — | | | | (278 | ) |
Amount | | $ | 338 | | | $ | 100 | | | $ | (2,030 | ) | | $ | — | | | $ | (1,592 | ) | | $ | 652 | | | $ | 394 | | | $ | (3,381 | ) | | $ | — | | | $ | (2,335 | ) |
| Class R3 | | | | | | | | | | | | | | | | | | | | | | | | | | | | | | | | | | | | | | | | |
Shares | | | 48 | | | | — | | | | (12 | ) | | | — | | | | 36 | | | | 54 | | | | 1 | | | | (58 | ) | | | — | | | | (3 | ) |
Amount | | $ | 571 | | | $ | 1 | | | $ | (141 | ) | | $ | — | | | $ | 431 | | | $ | 473 | | | $ | 12 | | | $ | (529 | ) | | $ | — | | | $ | (44 | ) |
| Class R4 | | | | | | | | | | | | | | | | | | | | | | | | | | | | | | | | | | | | | | | | |
Shares | | | 92 | | | | 1 | | | | (47 | ) | | | — | | | | 46 | | | | 164 | | | | 6 | | | | (52 | ) | | | — | | | | 118 | |
Amount | | $ | 1,102 | | | $ | 15 | | | $ | (548 | ) | | $ | — | | | $ | 569 | | | $ | 1,484 | | | $ | 40 | | | $ | (447 | ) | | $ | — | | | $ | 1,077 | |
| Class R5 | | | | | | | | | | | | | | | | | | | | | | | | | | | | | | | | | | | | | | | | |
Shares | | | 3 | | | | — | | | | — | | | | — | | | | 3 | | | | — | | | | — | | | | — | | | | — | | | | — | |
Amount | | $ | 31 | | | $ | — | | | $ | — | | | $ | — | | | $ | 31 | | | $ | 5 | | | $ | — | | | $ | — | | | $ | — | | | $ | 5 | |
| Class Y | | | | | | | | | | | | | | | | | | | | | | | | | | | | | | | | | | | | | | | | |
Shares | | | 1,260 | | | | 5 | | | | (39 | ) | | | — | | | | 1,226 | | | | 408 | | | | 11 | | | | (1,925 | ) | | | — | | | | (1,506 | ) |
Amount | | $ | 15,201 | | | $ | 54 | | | $ | (455 | ) | | $ | — | | | $ | 14,800 | | | $ | 3,992 | | | $ | 82 | | | $ | (14,751 | ) | | $ | — | | | $ | (10,677 | ) |
The following reflects the conversion of Class B Shares into Class A Shares (reflected as Class A Shares issued) for the six-month period ended April 30, 2010 and the year ended October 31, 2009:
| | | Shares | | | Dollars | |
| For the Six-Month Period Ended April 30, 2010 | | | 18 | | | $ | 217 | |
| For the Year Ended October 31, 2009 | | | 28 | | | $ | 235 | |
The Fund is one of several Hartford Funds that participate in a $500 million committed revolving line of credit facility. The facility is to be used for temporary or emergency purposes. Under the arrangement, the Fund is required to own securities having a market value in excess of 300% of the total bank borrowings. The interest rate on borrowings varies depending on the nature of the loan. The facility also requires a fee to be paid based on the amount of the commitment. This fee is allocated to all the Funds participating in the line of credit based on the average net assets of the Funds. During the six-month period ended April 30, 2010, the Fund did not have any borrowings under this facility.
| 9. | Industry Classifications: |
Other than the industry classifications “Other Investment Pools and Funds” and “Exchange Traded Funds”, equity industry classifications used in this report are the Global Industry Classification Standard, which was developed by and is the exclusive property and service mark of MSCI, Inc. and Standard & Poor’s.
Management has evaluated subsequent events and determined that no additional items require recording or disclosure.
| The Hartford Value Opportunities Fund |
- Selected Per-Share Data (A) -
| | | Net Asset | | | | | | | | | Net Realized | | | | | | | | | | | | | | | | | | Net Increase | | | | |
| | | Value at | | | | | | | | | and Unrealized | | | Total from | | | Dividends from | | | Distributions | | | | | | | | | (Decrease) in | | | Net Asset | |
| | | Beginning of | | | Net Investment | | | Payments from | | | Gain (Loss) on | | | Investment | | | Net Investment | | | from Realized | | | Distributions | | | Total | | | Net Asset | | | Value at End | |
Class | | Period | | | Income (Loss) | | | (to) Affiliate | | | Investments | | | Operations | | | Income | | | Capital Gains | | | from Capital | | | Distributions | | | Value | | | of Period | |
| | | | | | | | | | | | | | | | | | | | | | | | | | | | | | | | | | |
| For the Six-Month Period Ended April 30, 2010 (Unaudited) (E) | | | | | | | |
A | | $ | 10.19 | | | $ | 0.02 | | | $ | – | | | $ | 2.16 | | | $ | 2.18 | | | $ | (0.05 | ) | | $ | – | | | $ | – | | | $ | (0.05 | ) | | $ | 2.13 | | | $ | 12.32 | |
B | | | 9.21 | | | | (0.02 | ) | | | – | | | | 1.95 | | | | 1.93 | | | | (0.01 | ) | | | – | | | | – | | | | (0.01 | ) | | | 1.92 | | | | 11.13 | |
C | | | 9.18 | | | | (0.02 | ) | | | – | | | | 1.94 | | | | 1.92 | | | | – | | | | – | | | | – | | | | – | | | | 1.92 | | | | 11.10 | |
I | | | 10.09 | | | | 0.03 | | | | – | | | | 2.13 | | | | 2.16 | | | | (0.06 | ) | | | – | | | | – | | | | (0.06 | ) | | | 2.10 | | | | 12.19 | |
L | | | 10.20 | | | | 0.03 | | | | – | | | | 2.16 | | | | 2.19 | | | | (0.05 | ) | | | – | | | | – | | | | (0.05 | ) | | | 2.14 | | | | 12.34 | |
R3 | | | 10.30 | | | | – | | | | – | | | | 2.19 | | | | 2.19 | | | | (0.01 | ) | | | – | | | | – | | | | (0.01 | ) | | | 2.18 | | | | 12.48 | |
R4 | | | 10.37 | | | | 0.02 | | | | – | | | | 2.20 | | | | 2.22 | | | | (0.05 | ) | | | – | | | | – | | | | (0.05 | ) | | | 2.17 | | | | 12.54 | |
R5 | | | 10.43 | | | | 0.04 | | | | – | | | | 2.19 | | | | 2.23 | | | | (0.07 | ) | | | – | | | | – | | | | (0.07 | ) | | | 2.16 | | | | 12.59 | |
Y | | | 10.47 | | | | 0.04 | | | | – | | | | 2.21 | | | | 2.25 | | | | (0.07 | ) | | | – | | | | – | | | | (0.07 | ) | | | 2.18 | | | | 12.65 | |
| | | | | | | | | | | | | | | | | | | | | | | | | | | | | | | | | | | | | | |
For the Year Ended October 31, 2009 (E) | | | | | | | | | | | | | | | | | | | | | | | | | | | | | | | | | | | | | |
A | | | 8.22 | | | | 0.06 | | | | – | | | | 2.06 | | | | 2.12 | | | | (0.15 | ) | | | – | | | | – | | | | (0.15 | ) | | | 1.97 | | | | 10.19 | |
B | | | 7.42 | | | | 0.02 | | | | – | | | | 1.87 | | | | 1.89 | | | | (0.10 | ) | | | – | | | | – | | | | (0.10 | ) | | | 1.79 | | | | 9.21 | |
C | | | 7.38 | | | | (0.01 | ) | | | – | | | | 1.86 | | | | 1.85 | | | | (0.05 | ) | | | – | | | | – | | | | (0.05 | ) | | | 1.80 | | | | 9.18 | |
I | | | 8.15 | | | | 0.06 | | | | – | | | | 2.05 | | | | 2.11 | | | | (0.17 | ) | | | – | | | | – | | | | (0.17 | ) | | | 1.94 | | | | 10.09 | |
L | | | 8.26 | | | | 0.06 | | | | – | | | | 2.06 | | | | 2.12 | | | | (0.18 | ) | | | – | | | | – | | | | (0.18 | ) | | | 1.94 | | | | 10.20 | |
R3 | | | 8.33 | | | | 0.02 | | | | – | | | | 2.09 | | | | 2.11 | | | | (0.14 | ) | | | – | | | | – | | | | (0.14 | ) | | | 1.97 | | | | 10.30 | |
R4 | | | 8.39 | | | | 0.04 | | | | – | | | | 2.11 | | | | 2.15 | | | | (0.17 | ) | | | – | | | | – | | | | (0.17 | ) | | | 1.98 | | | | 10.37 | |
R5 | | | 8.44 | | | | 0.07 | | | | – | | | | 2.12 | | | | 2.19 | | | | (0.20 | ) | | | – | | | | – | | | | (0.20 | ) | | | 1.99 | | | | 10.43 | |
Y | | | 8.48 | | | | 0.11 | | | | – | | | | 2.08 | | | | 2.19 | | | | (0.20 | ) | | | – | | | | – | | | | (0.20 | ) | | | 1.99 | | | | 10.47 | |
| | | | | | | | | | | | | | | | | | | | | | | | | | | | | | | | | | | | | | |
For the Year Ended October 31, 2008 | | | | | | | | | | | | | | | | | | | | | | | | | | | | | | | | | | | | | |
A | | | 18.24 | | | | 0.09 | | | | – | | | | (7.48 | ) | | | (7.39 | ) | | | (0.04 | ) | | | (2.59 | ) | | | – | | | | (2.63 | ) | | | (10.02 | ) | | | 8.22 | |
B | | | 16.75 | | | | – | | | | – | | | | (6.74 | ) | | | (6.74 | ) | | | – | | | | (2.59 | ) | | | – | | | | (2.59 | ) | | | (9.33 | ) | | | 7.42 | |
C | | | 16.71 | | | | (0.03 | ) | | | – | | | | (6.71 | ) | | | (6.74 | ) | | | – | | | | (2.59 | ) | | | – | | | | (2.59 | ) | | | (9.33 | ) | | | 7.38 | |
I | | | 18.13 | | | | 0.07 | | | | – | | | | (7.37 | ) | | | (7.30 | ) | | | (0.09 | ) | | | (2.59 | ) | | | – | | | | (2.68 | ) | | | (9.98 | ) | | | 8.15 | |
L | | | 18.31 | | | | 0.10 | | | | – | | | | (7.49 | ) | | | (7.39 | ) | | | (0.07 | ) | | | (2.59 | ) | | | – | | | | (2.66 | ) | | | (10.05 | ) | | | 8.26 | |
R3 | | | 18.56 | | | | 0.10 | | | | – | | | | (7.64 | ) | | | (7.54 | ) | | | (0.10 | ) | | | (2.59 | ) | | | – | | | | (2.69 | ) | | | (10.23 | ) | | | 8.33 | |
R4 | | | 18.61 | | | | 0.12 | | | | – | | | | (7.66 | ) | | | (7.54 | ) | | | (0.09 | ) | | | (2.59 | ) | | | – | | | | (2.68 | ) | | | (10.22 | ) | | | 8.39 | |
R5 | | | 18.66 | | | | 0.10 | | | | – | | | | (7.64 | ) | | | (7.54 | ) | | | (0.09 | ) | | | (2.59 | ) | | | – | | | | (2.68 | ) | | | (10.22 | ) | | | 8.44 | |
Y | | | 18.73 | | | | 0.12 | | | | – | | | | (7.67 | ) | | | (7.55 | ) | | | (0.11 | ) | | | (2.59 | ) | | | – | | | | (2.70 | ) | | | (10.25 | ) | | | 8.48 | |
| | | | | | | | | | | | | | | | | | | | | | | | | | | | | | | | | | | | | | |
For the Year Ended October 31, 2007 | | | | | | | | | | | | | | | | | | | | | | | | | | | | | | | | | | | | | |
A | | | 18.26 | | | | 0.08 | | | | – | | | | 1.56 | | | | 1.64 | | | | (0.14 | ) | | | (1.52 | ) | | | – | | | | (1.66 | ) | | | (0.02 | ) | | | 18.24 | |
B | | | 16.92 | | | | (0.04 | ) | | | – | | | | 1.43 | | | | 1.39 | | | | (0.04 | ) | | | (1.52 | ) | | | – | | | | (1.56 | ) | | | (0.17 | ) | | | 16.75 | |
C | | | 16.92 | | | | (0.01 | ) | | | – | | | | 1.40 | | | | 1.39 | | | | (0.08 | ) | | | (1.52 | ) | | | – | | | | (1.60 | ) | | | (0.21 | ) | | | 16.71 | |
I | | | 18.27 | | | | 0.34 | | | | – | | | | 1.36 | | | | 1.70 | | | | (0.32 | ) | | | (1.52 | ) | | | – | | | | (1.84 | ) | | | (0.14 | ) | | | 18.13 | |
L(I) | | | 18.29 | | | | 0.09 | | | | – | | | | 1.59 | | | | 1.68 | | | | (0.14 | ) | | | (1.52 | ) | | | – | | | | (1.66 | ) | | | 0.02 | | | | 18.31 | |
R3(J) | | | 17.74 | | | | – | | | | – | | | | 0.82 | | | | 0.82 | | | | – | | | | – | | | | – | | | | – | | | | 0.82 | | | | 18.56 | |
R4(J) | | | 17.74 | | | | – | | | | – | | | | 0.87 | | | | 0.87 | | | | – | | | | – | | | | – | | | | – | | | | 0.87 | | | | 18.61 | |
R5(J) | | | 17.74 | | | | 0.12 | | | | – | | | | 0.80 | | | | 0.92 | | | | – | | | | – | | | | – | | | | – | | | | 0.92 | | | | 18.66 | |
Y | | | 18.48 | | | | 0.51 | | | | – | | | | 1.26 | | | | 1.77 | | | | – | | | | (1.52 | ) | | | – | | | | (1.52 | ) | | | 0.25 | | | | 18.73 | |
| | | | | | | | | | | | | | | | | | | | | | | | | | | | | | | | | | | | | | |
For the Year Ended October 31, 2006 (E) | | | | | | | | | | | | | | | | | | | | | | | | | | | | | | | | | | | | | |
A | | | 15.56 | | | | 0.09 | | | | – | | | | 3.11 | | | | 3.20 | | | | – | | | | (0.50 | ) | | | – | | | | (0.50 | ) | | | 2.70 | | | | 18.26 | |
B | | | 14.56 | | | | (0.03 | ) | | | – | | | | 2.89 | | | | 2.86 | | | | – | | | | (0.50 | ) | | | – | | | | (0.50 | ) | | | 2.36 | | | | 16.92 | |
C | | | 14.56 | | | | (0.04 | ) | | | – | | | | 2.90 | | | | 2.86 | | | | – | | | | (0.50 | ) | | | – | | | | (0.50 | ) | | | 2.36 | | | | 16.92 | |
I(K) | | | 17.12 | | | | 0.01 | | | | – | | | | 1.14 | | | | 1.15 | | | | – | | | | – | | | | – | | | | – | | | | 1.15 | | | | 18.27 | |
L | | | 15.58 | | | | 0.12 | | | | – | | | | 3.11 | | | | 3.23 | | | | (0.02 | ) | | | (0.50 | ) | | | – | | | | (0.52 | ) | | | 2.71 | | | | 18.29 | |
Y | | | 15.74 | | | | 0.15 | | | | – | | | | 3.15 | | | | 3.30 | | | | (0.06 | ) | | | (0.50 | ) | | | – | | | | (0.56 | ) | | | 2.74 | | | | 18.48 | |
| | | | | | | | | | | | | | | | | | | | | | | | | | | | | | | | | | | | | | |
For the Year Ended October 31, 2005 | | | | | | | | | | | | | | | | | | | | | | | | | | | | | | | | | | | | | |
A | | | 14.06 | | | | 0.03 | | | | – | | | | 1.47 | | | | 1.50 | | | | – | | | | – | | | | – | | | | – | | | | 1.50 | | | | 15.56 | |
B | | | 13.24 | | | | (0.05 | ) | | | – | | | | 1.37 | | | | 1.32 | | | | – | | | | – | | | | – | | | | – | | | | 1.32 | | | | 14.56 | |
C | | | 13.25 | | | | (0.05 | ) | | | – | | | | 1.36 | | | | 1.31 | | | | – | | | | – | | | | – | | | | – | | | | 1.31 | | | | 14.56 | |
L | | | 14.06 | | | | 0.07 | | | | – | | | | 1.45 | | | | 1.52 | | | | – | | | | – | | | | – | | | | – | | | | 1.52 | | | | 15.58 | |
Y | | | 14.17 | | | | 0.05 | | | | – | | | | 1.52 | | | | 1.57 | | | | – | | | | – | | | | – | | | | – | | | | 1.57 | | | | 15.74 | |
- Ratios and Supplemental Data -
| | | | | | | Ratio of Expenses to Average Net | | | Ratio of Expenses to Average Net | | | Ratio of Expenses to Average Net | | | | | | | |
| | | | | | | Assets Before Waivers and | | | Assets After Waivers and | | | Assets After Waivers and | | | Ratio of Net Investment | | | Portfolio | |
| | | | Net Assets at End of | | | Reimbursements and Including | | | Reimbursements and Including | | | Reimbursements and Excluding | | | Income to Average Net | | | Turnover | |
Total Return(B) | | | Period (000's) | | | Expenses not Subject to Cap(C) | | | Expenses not Subject to Cap(C) | | | Expenses not Subject to Cap(C) | | | Assets | | | Rate(D) | |
| | | | | | | | | | | | | | | | | | | | |
| | | | | | | | | | | | | | | | | | | | |
| 21.42 | %(F) | | $ | 81,355 | | | | 1.46 | %(G) | | | 1.35 | %(G) | | | 1.35 | %(G) | | | 0.32 | %(G) | | | 43 | % |
| 20.92 | (F) | | | 8,267 | | | | 2.43 | (G) | | | 2.10 | (G) | | | 2.10 | (G) | | | (0.42 | ) (G) | | | – | |
| 20.92 | (F) | | | 12,033 | | | | 2.19 | (G) | | | 2.10 | (G) | | | 2.10 | (G) | | | (0.43 | ) (G) | | | – | |
| 21.46 | (F) | | | 1,518 | | | | 1.06 | (G) | | | 1.06 | (G) | | | 1.06 | (G) | | | 0.61 | (G) | | | – | |
| 21.52 | (F) | | | 23,818 | | | | 1.17 | (G) | | | 1.15 | (G) | | | 1.15 | (G) | | | 0.52 | (G) | | | – | |
| 21.27 | (F) | | | 1,401 | | | | 1.68 | (G) | | | 1.60 | (G) | | | 1.60 | (G) | | | 0.03 | (G) | | | – | |
| 21.40 | (F) | | | 4,867 | | | | 1.32 | (G) | | | 1.30 | (G) | | | 1.30 | (G) | | | 0.36 | (G) | | | – | |
| 21.48 | (F) | | | 50 | | | | 1.09 | (G) | | | 1.00 | (G) | | | 1.00 | (G) | | | 0.66 | (G) | | | – | |
| 21.59 | (F) | | | 24,208 | | | | 0.92 | (G) | | | 0.92 | (G) | | | 0.92 | (G) | | | 0.69 | (G) | | | – | |
| | | | | | | | | | | | | | | | | | | | | | | | | | |
| | | | | | | | | | | | | | | | | | | | | | | | | | |
| 26.41 | | | | 67,577 | | | | 1.66 | | | | 1.20 | | | | 1.20 | | | | 0.67 | | | | 90 | |
| 25.90 | | | | 7,903 | | | | 2.74 | | | | 1.63 | | | | 1.63 | | | | 0.26 | | | | – | |
| 25.33 | | | | 10,158 | | | | 2.39 | | | | 1.98 | | | | 1.98 | | | | (0.07 | ) | | | – | |
| 26.68 | | | | 1,416 | | | | 1.17 | | | | 1.10 | | | | 1.10 | | | | 0.71 | | | | – | |
| 26.39 | | | | 21,122 | | | | 1.22 | | | | 1.20 | | | | 1.20 | | | | 0.67 | | | | – | |
| 25.97 | | | | 784 | | | | 1.78 | | | | 1.60 | | | | 1.60 | | | | 0.28 | | | | – | |
| 26.38 | | | | 3,551 | | | | 1.36 | | | | 1.30 | | | | 1.30 | | | | 0.50 | | | | – | |
| 26.77 | | | | 12 | | | | 1.12 | | | | 1.00 | | | | 1.00 | | | | 0.77 | | | | – | |
| 26.76 | | | | 7,195 | | | | 0.96 | | | | 0.96 | | | | 0.96 | | | | 1.20 | | | | – | |
| | | | | | | | | | | | | | | | | | | | | | | | | | |
| | | | | | | | | | | | | | | | | | | | | | | | | | |
| (46.75 | ) | | | 59,576 | | | | 1.50 | | | | 1.40 | | | | 1.40 | | | | 0.62 | | | | 65 | |
| (46.99 | ) | | | 7,613 | | | | 2.47 | | | | 1.95 | | | | 1.95 | | | | 0.08 | | | | – | |
| (47.13 | ) | | | 11,167 | | | | 2.21 | | | | 2.15 | | | | 2.15 | | | | (0.12 | ) | | | – | |
| (46.63 | ) | | | 1,139 | | | | 1.22 | | | | 1.15 | | | | 1.15 | | | | 0.99 | | | | – | |
| (46.62 | ) | | | 19,403 | | | | 1.21 | | | | 1.20 | | | | 1.20 | | | | 0.82 | | | | – | |
| (46.93 | ) | | | 657 | | | | 1.72 | | | | 1.65 | | | | 1.65 | | | | 0.30 | | | | – | |
| (46.73 | ) | | | 1,877 | | | | 1.37 | | | | 1.35 | | | | 1.35 | | | | 0.66 | | | | – | |
| (46.57 | ) | | | 6 | | | | 1.07 | | | | 1.05 | | | | 1.05 | | | | 0.96 | | | | – | |
| (46.52 | ) | | | 18,603 | | | | 0.97 | | | | 0.97 | | | | 0.97 | | | | 1.01 | | | | – | |
| | | | | | | | | | | | | | | | | | | | | | | | | | |
| | | | | | | | | | | | | | | | | | | | | | | | | | |
| 9.73 | (H) | | | 157,671 | | | | 1.48 | | | | 1.40 | | | | 1.40 | | | | 0.48 | | | | 77 | |
| 8.90 | (H) | | | 20,792 | | | | 2.38 | | | | 2.13 | | | | 2.13 | | | | (0.25 | ) | | | – | |
| 8.91 | (H) | | | 32,738 | | | | 2.19 | | | | 2.15 | | | | 2.15 | | | | (0.28 | ) | | | – | |
| 10.08 | (H) | | | 4,659 | | | | 1.22 | | | | 1.15 | | | | 1.15 | | | | 0.61 | | | | – | |
| 9.92 | (H) | | | 43,102 | | | | 1.26 | | | | 1.25 | | | | 1.25 | | | | 0.50 | | | | – | |
| 4.62 | (F) | | | 124 | | | | 1.78 | (G) | | | 1.65 | (G) | | | 1.65 | (G) | | | 0.03 | (G) | | | – | |
| 4.90 | (F) | | | 732 | | | | 1.40 | (G) | | | 1.35 | (G) | | | 1.35 | (G) | | | (0.01 | ) (G) | | | – | |
| 5.19 | (F) | | | 11 | | | | 1.17 | (G) | | | 1.05 | (G) | | | 1.05 | (G) | | | 0.75 | (G) | | | – | |
| 10.30 | (H) | | | 26,645 | | | | 0.94 | | | | 0.94 | | | | 0.94 | | | | 1.19 | | | | – | |
| | | | | | | | | | | | | | | | | | | | | | | | | | |
| | | | | | | | | | | | | | | | | | | | | | | | | | |
| 21.12 | | | | 111,324 | | | | 1.52 | | | | 1.40 | | | | 1.40 | | | | 0.51 | | | | 57 | |
| 20.21 | | | | 18,271 | | | | 2.38 | | | | 2.12 | | | | 2.12 | | | | (0.20 | ) | | | – | |
| 20.20 | | | | 22,466 | | | | 2.22 | | | | 2.15 | | | | 2.15 | | | | (0.24 | ) | | | – | |
| 6.72 | (F) | | | 12 | | | | 1.38 | (G) | | | 1.15 | (G) | | | 1.15 | (G) | | | 0.12 | (G) | | | – | |
| 21.31 | | | | 32,983 | | | | 1.23 | | | | 1.23 | | | | 1.23 | | | | 0.68 | | | | – | |
| 21.55 | | | | 102,915 | | | | 1.00 | | | | 1.00 | | | | 1.00 | | | | 0.90 | | | | – | |
| | | | | | | | | | | | | | | | | | | | | | | | | | |
| | | | | | | | | | | | | | | | | | | | | | | | | | |
| 10.67 | | | | 66,368 | | | | 1.62 | | | | 1.40 | | | | 1.40 | | | | 0.27 | | | | 38 | |
| 9.97 | | | | 13,560 | | | | 2.51 | | | | 2.15 | | | | 2.15 | | | | (0.47 | ) | | | – | |
| 9.89 | | | | 13,258 | | | | 2.33 | | | | 2.15 | | | | 2.15 | | | | (0.47 | ) | | | – | |
| 10.81 | | | | 27,674 | | | | 1.30 | | | | 1.30 | | | | 1.30 | | | | 0.45 | | | | – | |
11.08 | | | | 95,974 | | | | 1.07 | | | | 1.07 | | | | 1.07 | | | | 0.55 | | | | – | |
| The Hartford Value Opportunities Fund |
Financial Highlights – (continued)
| (A) | Information presented relates to a share outstanding throughout the indicated period. |
| (B) | Assumes initial investment at net asset value at the beginning of each period, reinvestment of all distributions, the complete redemption of the investment at net asset value at the end of each period and no sales charge. Total return would be reduced if sales charges were taken into account. |
| (C) | Ratios do not include fees paid indirectly (See Expenses in the accompanying Notes to Financial Statements). |
| (D) | Portfolio turnover rate is calculated on the basis of the Fund as a whole without distinguishing between the classes of shares issued. |
| (E) | Per share amounts have been calculated using average shares outstanding method. |
| (F) | Not annualized. |
| (G) | Annualized. |
| (H) | Total return without the inclusion of the Payments from (to) Affiliate, can be found in Expenses in the accompanying Notes to Financial Statements. |
| (I) | Classes H, M and N were merged into Class L on February 9, 2007. |
| (J) | Commenced operations on December 22, 2006. |
| (K) | Commenced operations on August 31, 2006. |
| The Hartford Value Opportunities Fund |
The Board of Directors appoints officers who are responsible for the day-to-day operations of the Fund and who execute policies formulated by the Directors. Each director serves until his or her death, resignation, or retirement or until the next annual meeting of shareholders is held or until his or her successor is elected and qualifies.
Directors and officers who are employed by or who have a financial interest in The Hartford are considered “interested” persons of the Fund pursuant to the Investment Company Act of 1940, as amended. Each officer and two of the Funds’ directors, as noted in the chart below, are “interested” persons of the Fund. Each director serves as a director for The Hartford Mutual Funds, Inc., The Hartford Mutual Funds II, Inc., The Hartford Income Shares Fund, Inc., Hartford Series Fund, Inc., and Hartford HLS Series Fund II, Inc., which, as of April 30, 2010, collectively consist of 85 funds. Correspondence may be sent to directors and officers c/o Hartford Mutual Funds, P.O. Box 2999, Hartford, Connecticut 06104-2999, except that correspondence to Ms. Fagely may be sent to 500 Bielenberg Drive, Woodbury, Minnesota 55125.
The table below sets forth, for each director and officer, his or her name, year of birth, current position with the Fund and date first elected or appointed to The Hartford Mutual Funds, Inc. (“MF”) and The Hartford Mutual Funds II, Inc. (“MF2”), principal occupation, and, for directors, other directorships held. The Fund’s statement of additional information contains further information on the directors and is available free of charge by calling 1-888-843-7824 or writing to Hartford Mutual Funds, P.O. Box 64387, St. Paul, MN 55164-0387.
Information on the aggregate remuneration paid to the directors of the Fund can be found in the Statement of Operations herein. The Fund pays to The Hartford a portion of the Chief Compliance Officer’s compensation, but does not pay salaries or compensation to any of its other officers or directors who are employed by The Hartford.
Non-Interested Directors
Lynn S. Birdsong (1946) Director since 2003, Co-Chairman of the Investment Committee
Mr. Birdsong is a private investor. Since 2003, Mr. Birdsong has been an independent director of The Japan Fund. From 2003 to March 2005, Mr. Birdsong was an independent director of the Atlantic Whitehall Funds. From 1979 to 2002, Mr. Birdsong was a managing director of Zurich Scudder Investments, an investment management firm. During his employment with Scudder, Mr. Birdsong was an interested director of The Japan Fund. Since 1981, Mr. Birdsong has been a partner in Birdsong Company, an advertising specialty firm.
Robert M. Gavin, Jr. (1940) Director since 2002 (MF) and 1986 (MF2), Chairman of the Board since 2004
Dr. Gavin is an educational consultant. Prior to September 1, 2001, he was President of Cranbrook Education Community and prior to July 1996, he was President of Macalester College, St. Paul, Minnesota.
Duane E. Hill (1945) Director since 2001 (MF) and 2002 (MF2), Chairman of the Nominating Committee
Mr. Hill is Partner of TSG Ventures L.P., a private equity investment company. Mr. Hill is a former partner of TSG Capital Group, a private equity investment firm that served as sponsor and lead investor in leveraged buyouts of middle market companies.
Sandra S. Jaffee (1941) Director since 2005
Ms. Jaffee served as Chairman (2008 to 2009) and Chief Executive Officer of Fortent (formerly Searchspace Group), a leading provider of compliance/regulatory technology to financial institutions from August 2005 to August 2009. From August 2004 to August 2005, Ms. Jaffee served as an Entrepreneur in Residence with Warburg Pincus, a private equity firm. From September 1995 to July 2004, Ms. Jaffee served as Executive Vice President at Citigroup, where she was President and Chief Executive Officer of Citibank’s Global Securities Services (1995 to 2003).
William P. Johnston (1944) Director since 2005, Chairman of the Compliance Committee
In June 2006, Mr. Johnston was appointed as Senior Advisor to The Carlyle Group, a global private equity investment firm. In July 2006, Mr. Johnston was elected to the Board of Directors of MultiPlan, Inc. In August 2007, Mr. Johnston was elected to the Board of Directors of LifeCare Holdings, Inc. In February 2008, Mr. Johnston was elected to the Board of Directors of HCR-ManorCare, Inc. In May 2006, Mr. Johnston was elected to the Supervisory Board of Fresenius Medical Care AG & Co. KGaA, after its acquisition of Renal Care Group, Inc. in March 2006. Mr. Johnston joined Renal Care Group in November 2002 as a member of the Board of Directors and served as Chairman of the Board from March 2003 through March 2006. From September 1987 to December 2002, Mr. Johnston was with Equitable Securities Corporation (and its successors, SunTrust Equitable Securities and SunTrust Robinson Humphrey) serving in various investment banking and managerial positions, including Managing Director and Head of Investment Banking, Chief Executive Officer and Vice Chairman. Mr. Johnston was a member of the law firm of Waller Lansden Dortch & Davis from 1969 until 1986.
| The Hartford Value Opportunities Fund |
Directors and Officers (Unaudited) – (continued)
Phillip O. Peterson (1944) Director since 2002 (MF) and 2000 (MF2), Chairman of the Audit Committee
Mr. Peterson is a mutual fund industry consultant. He was a partner of KPMG LLP (an accounting firm) until July 1999. Mr. Peterson joined William Blair Funds in February 2007 as a member of the Board of Trustees. From January 2004 to April 2005, Mr. Peterson served as Independent President of the Strong Mutual Funds.
Lemma W. Senbet (1946) Director since 2005
Dr. Senbet is the William E. Mayer Chair Professor of Finance and Director, Center for Financial Policy, at the University of Maryland, Robert H. Smith School of Business. He was chair of the Finance Department during 1998 to 2006. Previously he was a chaired professor of finance at the University of Wisconsin-Madison. Also, he was director of the Fortis Funds from March 2000 to July 2002. Dr. Senbet served the finance profession in various capacities, including as director of the American Finance Association and President of the Western Finance Association. In 2006, Dr. Senbet was inducted Fellow of Financial Management Association International for his career-long distinguished scholarship and professional service.
Interested Directors and Officers
Lowndes A. Smith (1939) Director since 1996 (MF) and 2002 (MF2), Co-Chairman of the Investment Committee
Mr. Smith served as Vice Chairman of The Hartford from February 1997 to January 2002, as President and Chief Executive Officer of Hartford Life, Inc. from February 1997 to January 2002, and as President and Chief Operating Officer of The Hartford Life Insurance Companies from January 1989 to January 2002. Mr. Smith serves as a Director of White Mountains Insurance Group, Ltd., One Beacon Insurance, Symetra Financial and as a Managing Director of Whittington Gray Associates.
John C. Walters* (1962) Director since 2008
Mr. Walters currently serves as President, Chief Executive Officer and Director for Hartford Life, Inc. (“HL, Inc.”). Mr. Walters also serves as President, Chairman of the Board, Chief Executive Officer and Director for Hartford Life Insurance Company (“Hartford Life”), and as Executive Vice President of The Hartford. In addition, Mr. Walters is a Manager of HL Investment Advisors, LLC (“HL Advisors”). Mr. Walters previously served as President of the U.S. Wealth Management Division of HL, Inc. (2006-2007) and as Co-Chief Operating Officer of Hartford Life (2007-2008).
* Mr. Walters previously served as President and Chief Executive Officer of the Fund (2007 to 2009).
Other Officers
Robert M. Arena, Jr. (1968) President and Chief Executive Officer since 2009 (served as Vice President of the Fund (2006 - 2009))
Mr. Arena serves as Executive Vice President of Hartford Life. Additionally, Mr. Arena is Senior Vice President and Director of Hartford Administrative Services Company, (“HASCO”), President, Chief Executive Officer and Manager of Hartford Investment Financial Services, LLC (“HIFSCO”) and President, Chief Executive Officer and Manager of HL Advisors. Mr. Arena joined The Hartford in 2004.
Tamara L. Fagely (1958) Vice President, Treasurer and Controller since 2002 (MF) 1993 (MF2)
Ms. Fagely has been a Vice President of HASCO since 1998 and Chief Financial Officer since 2006. Currently Ms. Fagely is a Vice President of Hartford Life. She served as Assistant Vice President of Hartford Life from December 2001 through March 2005. In addition, Ms. Fagely is Controller and Chief Financial Officer of HIFSCO.
Brian Ferrell (1962) AML Compliance Officer since 2008
Mr. Ferrell has served as Assistant Vice President and AML Compliance Officer for The Hartford since 2006, and as AML Compliance Officer for HASCO and Hartford Investor Services Company, LLC (“HISC”) since 2008. Prior to joining The Hartford in 2006, Mr. Ferrell held various positions at the U.S. Department of the Treasury (the “Treasury”) from 2001 to 2006, where he served as Chief Counsel for the Treasury’s Financial Crimes Enforcement Network from 2005 - 2006.
Dr. Robert J. Froehlich (1953) Senior Managing Director since 2009
Dr. Froehlich joined The Hartford as Senior Managing Director in September 2009. Prior to joining The Hartford, Dr. Froehlich served as Vice Chairman of Deutsche Asset Management from 1997 - 2009.
Thomas D. Jones, III (1965) Vice President and Chief Compliance Officer since 2006
Mr. Jones serves as Chief Compliance Officer for the Hartford Mutual Funds and Vice President and Director of Securities Compliance for The Hartford. Mr. Jones joined The Hartford in 2006 from SEI Investments, where he served as Chief Compliance Officer for its mutual funds and investment advisers. Prior to joining SEI, Mr. Jones was First Vice President and Compliance Director for Merrill Lynch Investment Managers (Americas) (“MLIM”), where he worked from 1992-2004.
Edward P. Macdonald (1967) Vice President, Secretary and Chief Legal Officer since 2005
Mr. Macdonald serves as Assistant Vice President of Hartford Life and Chief Legal Officer and Vice President of HIFSCO. He also serves as Vice President and Secretary of HASCO, and Chief Legal Officer, Secretary and Vice President of HL Advisors. Mr. Macdonald joined The Hartford in 2005.
Vernon J. Meyer (1964) Vice President since 2006
Mr. Meyer serves as Senior Vice President of Hartford Life. He also serves as Senior Vice President of HIFSCO and HL Advisors. Mr. Meyer joined The Hartford in 2004.
D. Keith Sloane (1960) Vice President since 2009
Mr. Sloane is a Senior Vice President of Hartford Life. Additionally, Mr. Sloane currently serves as Senior Vice President of HIFSCO, HL Advisors, and HASCO. Prior to joining The Hartford in 2007, Mr. Sloane was Director of product marketing and led the mutual fund business for Wachovia Securities (“Wachovia”) in their investment products group. Mr. Sloane joined Wachovia in 1995.
Jane Wolak (1961) Vice President since 2009
Ms. Wolak currently serves as Vice President of Hartford Life. Ms. Wolak joined Hartford Life as Vice President, Retail Product Services in May 2007. She is also Vice President of HASCO. Previously, Ms. Wolak was with Sun Life Financial where she held the position of Vice President, Service Center Operations from 2001 – 2007.
A description of the policies and procedures that the Fund uses to determine how to vote proxies relating to portfolio securities and a record of how the Fund voted any proxies for the twelve-month period ended June 30, 2009 is available (1) without charge, upon request, by calling 888-843-7824 and (2) on the Securities and Exchange Commission’s website at http://www.sec.gov.
The Fund files a complete schedule of portfolio holdings with the Commission for the first and third quarters of each fiscal year on Form N-Q. The Fund’s Forms are available (1) without charge, upon request, by calling 888-843-7824 and (2) on the Securities and Exchange Commission’s website at http://www.sec.gov. The Form N-Q may be reviewed and copied at the Commission’s Public Reference Room in Washington, DC. Information on the operation of the Public Reference Room may be obtained by calling 1-800-SEC-0330.
| The Hartford Value Opportunities Fund |
Your Fund's Expenses
As a shareholder of the Fund, you incur two types of costs: (1) transaction costs, including sales charges (loads) on purchase payments and contingent deferred sales charges (CDSC) (2) ongoing costs including management fees; distribution fees; and other fund expenses. This example is intended to help you understand your ongoing costs (in dollars) of investing in the Fund and to compare these costs with the ongoing costs of investing in other mutual funds. The example is based on an investment of $1,000 invested at the beginning of the period and held for the period of October 31, 2009 through April 30, 2010.
Actual Expenses
The first set of columns of the table below provides information about actual account values and actual expenses. You may use the information in this column, together with the amount you invested, to estimate the expenses that you paid over the period. Simply divide your account value by $1,000 (for example, an $8,600 account value divided by $1,000 = 8.6), then multiply the result by the number in the line under the heading entitled "Expenses Paid During Period" to estimate the expenses you paid on your account during this period.
Hypothetical Example for Comparison Purposes
The second set of columns of the table below provides information about hypothetical account values and hypothetical expenses based on the Fund's actual expense ratio and an assumed rate of return of 5% per year before expenses, which is not the Fund's actual return. The hypothetical account values and expenses may not be used to estimate the actual ending account balance or expenses you paid for the period. You may use this information to compare the ongoing costs of investing in the Fund and other funds. To do so, compare this 5% hypothetical example with the 5% hypothetical examples that appear in the shareholder reports of the other funds.
Please note that the expenses shown in the table are meant to highlight your ongoing costs only and do not reflect any transactional costs, such as sales charges (loads) and CDSC. Therefore, the second set of columns of the table is useful in comparing ongoing costs only, and will not help you determine the relative total costs of owning different funds. In addition, if these transactional costs were included, your costs would be higher. Expenses are equal to the Fund's annualized expense ratios multiplied by average account value over the period, multiplied by 181/365 (to reflect the one-half year period).
| | | Actual return | | | Hypothetical (5% return before expenses) | | | | | | | | | | |
| | | | | | | | | Expenses paid | | | | | | | | | Expenses paid | | | | | | Days in | | | | |
| | | | | | | | | during the period | | | | | | | | | during the period | | | | | | the | | | Days | |
| | | Beginning | | | Ending Account | | | October 31, 2009 | | | Beginning | | | Ending Account | | | October 31, | | | Annualized | | | current | | | in the | |
| | | Account Value | | | Value | | | through | | | Account Value | | | Value | | | 2009 through | | | expense | | | 1/2 | | | full | |
| | | October 31, 2009 | | | April 30, 2010 | | | April 30, 2010 | | | October 31, 2009 | | | April 30, 2010 | | | April 30, 2010 | | | ratio | | | year | | | year | |
| Class A | | $ | 1,000.00 | | | $ | 1,214.20 | | | $ | 7.41 | | | $ | 1,000.00 | | | $ | 1,018.10 | | | $ | 6.76 | | | | 1.35 | % | | | 181 | | | | 365 | |
| Class B | | $ | 1,000.00 | | | $ | 1,209.20 | | | $ | 11.50 | | | $ | 1,000.00 | | | $ | 1,014.38 | | | $ | 10.49 | | | | 2.10 | | | | 181 | | | | 365 | |
| Class C | | $ | 1,000.00 | | | $ | 1,209.20 | | | $ | 11.50 | | | $ | 1,000.00 | | | $ | 1,014.38 | | | $ | 10.49 | | | | 2.10 | | | | 181 | | | | 365 | |
| Class I | | $ | 1,000.00 | | | $ | 1,214.60 | | | $ | 5.82 | | | $ | 1,000.00 | | | $ | 1,019.54 | | | $ | 5.31 | | | | 1.06 | | | | 181 | | | | 365 | |
| Class L | | $ | 1,000.00 | | | $ | 1,215.20 | | | $ | 6.32 | | | $ | 1,000.00 | | | $ | 1,019.09 | | | $ | 5.76 | | | | 1.15 | | | | 181 | | | | 365 | |
| Class R3 | | $ | 1,000.00 | | | $ | 1,212.70 | | | $ | 8.78 | | | $ | 1,000.00 | | | $ | 1,016.86 | | | $ | 8.00 | | | | 1.60 | | | | 181 | | | | 365 | |
| Class R4 | | $ | 1,000.00 | | | $ | 1,214.00 | | | $ | 7.14 | | | $ | 1,000.00 | | | $ | 1,018.35 | | | $ | 6.51 | | | | 1.30 | | | | 181 | | | | 365 | |
| Class R5 | | $ | 1,000.00 | | | $ | 1,214.80 | | | $ | 5.49 | | | $ | 1,000.00 | | | $ | 1,019.84 | | | $ | 5.01 | | | | 1.00 | | | | 181 | | | | 365 | |
Class Y | | $ | 1,000.00 | | | $ | 1,215.90 | | | $ | 5.05 | | | $ | 1,000.00 | | | $ | 1,020.23 | | | $ | 4.61 | | | | 0.92 | | | | 181 | | | | 365 | |
This information is written in connection with the promotion or marketing of the matter(s) addressed in this material. The information cannot be used or relied upon for the purpose of avoiding IRS penalties. These materials are not intended to provide tax, accounting or legal advice. As with all matters of a tax or legal nature, you should consult your own tax or legal counsel for advice.
You should carefully consider investment objectives, risks, and charges and expenses of The Hartford Mutual Funds before investing. This and other information can be found in the Fund's prospectus, which can be obtained from your investment representative or by calling 888-843-7824. Please read it carefully before you invest or send money.
The Hartford Mutual Funds are underwritten and distributed by Hartford Investment Financial Services, LLC.
“The Hartford” is The Hartford Financial Services Group, Inc., and its subsidiaries.
Mutual fund inception dates range from 1949 to date. The Hartford Mutual Funds are not a subsidiary of The Hartford but are underwritten, distributed by, and advised by subsidiaries of The Hartford. Investments in The Hartford Mutual Funds are not guaranteed by The Hartford or any other entity.
MFSAR-VO10 6/10 MUT 8759 Printed in U.S.A. ©2010 The Hartford, Hartford, CT 06115 | |
| | |
| | |
Item 2. Code of Ethics.
Not applicable to this semi-annual filing.
Item 3. Audit Committee Financial Expert.
Not applicable to this semi-annual filing.
Item 4. Principal Accountant Fees and Services.
Not applicable to this semi-annual filing.
Item 5. Audit Committee of Listed Registrants.
Not applicable to this semi-annual filing.
Item 6. Schedule of Investments
The Schedule of Investments is included as part of the semi-annual report filed under Item 1 of this form.
Item 7. Disclosure of Proxy Voting Policies and Procedures for Closed-End Management Investment Companies.
Not applicable.
Item 8. Portfolio Managers of Closed-End Management Investment Companies.
Not applicable.
Item 9. Purchases of Equity Securities by Closed-End Management Investment Company and Affiliated Purchasers.
Not applicable.
Item 10. Submission of Matters to a Vote of Security Holders
There have been no material changes to the procedures by which shareholders may recommend nominees to the registrant’s board of directors since registrant last provided disclosure in response to this requirement.
Item 11. Controls and Procedures.
| | (a) | Based on an evaluation of the Registrant's Disclosure Controls and Procedures as of a date within 90 days of the filing date of this report, the Disclosure Controls and Procedures are effectively designed to ensure that information required to be disclosed by the Registrant is recorded, processed, summarized and reported by the date of this report, including ensuring that information required to be disclosed in the report is accumulated and communicated to the Registrant's management, including the Registrant's officers, as appropriate, to allow timely decisions regarding required disclosure. |
| | (b) | There was no change in the Registrant's internal control over financial reporting that occurred during the Registrant’s last fiscal half year that has materially affected, or is reasonably likely to materially affect, the registrant’s internal control over financial reporting. |
Item 12. Exhibits.
| | 11(a) (2) | Section 302 certifications of the principal executive officer and principal financial officer of Registrant. |
| | (b) | Section 906 certification. |
SIGNATURES
Pursuant to the requirements of the Securities Exchange Act of 1934 and the Investment Company Act of 1940, the registrant has duly caused this report to be signed on its behalf by the undersigned, thereunto duly authorized.
| | THE HARTFORD MUTUAL FUNDS II, INC. | |
| | | | |
| Date: June 14, 2010 | By: | /s/ Robert M. Arena, Jr. | |
| | | Robert M. Arena, Jr. | |
| | | Its: President | |
| | | | |
Pursuant to the requirements of the Securities Exchange Act of 1934 and the Investment Company Act of 1940, this report has been signed below by the following persons on behalf of the registrant and in the capacities and on the dates indicated.
| Date: June 14, 2010 | By: | /s/ Robert M. Arena, Jr. | |
| | | Robert M. Arena, Jr. | |
| | | Its: President | |
| | | | |
| Date: June 14, 2010 | By: | /s/ Tamara L. Fagely | |
| | | Tamara L. Fagely | |
| | | Its: Vice President, Controller and Treasurer | |
| | | | |
EXHIBIT LIST
| 99.CERT | 11(a)(2) | Certifications |
| | | |
| | | (i) Section 302 certification of principal executive officer |
| | | |
| | | (ii) Section 302 certification of principal financial officer |
| | | |
| 99.906CERT | 11(b) | Section 906 certification of principal executive officer and principal financial officer |