UNITED STATES
SECURITIES AND EXCHANGE COMMISSION
Washington, D.C. 20549
FORM N-CSR
CERTIFIED SHAREHOLDER REPORT OF REGISTERED MANAGEMENT
INVESTMENT COMPANIES
Investment Company Act file number: 811-00558
THE HARTFORD MUTUAL FUNDS II, INC.
(Exact name of registrant as specified in charter)
P. O. Box 2999, Hartford, Connecticut 06104-2999
(Address of Principal Executive Offices)
Edward P. Macdonald, Esquire
Life Law Unit
The Hartford Financial Services Group, Inc.
200 Hopmeadow Street
Simsbury, Connecticut 06089
(Name and Address of Agent for Service)
Registrant’s telephone number, including area code: (860) 843-9934
Date of fiscal year end: October 31st
Date of reporting period: November 1, 2011 – April 30, 2012
Form N-CSR is to be used by management investment companies to file reports with the Commission not later than 10 days after the transmission to stockholders of any report that is required to be transmitted to stockholders under Rule 30e-1 under the Investment Company Act of 1940 (17 CFR 270.30e-1). The Commission may use the information provided on Form N-CSR in its regulatory, disclosure review, inspection, and policymaking roles.
A registrant is required to disclose the information specified by Form N-CSR, and the Commission will make this information public. A registrant is not required to respond to the collection of information contained in Form N-CSR unless the Form displays a currently valid Office of Management and Budget ("OMB") control number. Please direct comments concerning the accuracy of the information collection burden estimate and any suggestions for reducing the burden to Secretary, Securities and Exchange Commission, 450 Fifth Street, NW, Washington, DC 20549-0609. The OMB has reviewed this collection of information under the clearance requirements of 44 U.S.C. § 3507.
Item 1. Reports to Stockholders.

THE HARTFORD MUTUAL FUNDS 2012 Semi Annual Report The Hartford Growth Fund |

A MESSAGE FROM THE PRESIDENT
Dear Fellow Shareholders:
I want to take this opportunity to say thank you for investing with The Hartford Mutual Funds. Although it’s not yet clear that the recent market volatility is truly behind us, we believe there are several reasons to remain optimistic about the markets in 2012.
Market Review
Stocks soared in October as a result of solid corporate earnings reports, generally better-than-expected economic data, and renewed hopes for a solution to the eurozone debt crisis. However, November saw some of those gains dissipate due to pessimism about European contagion and its implications for global economic growth. The quarter ended on a positive note, a result of encouraging employment and manufacturing data in December.
The S&P 500 Index was virtually unchanged for the year: 1257.64 on 12/31/2010, and 1257.60 on 12/31/2011. Dividends, however, helped produce a 2.11% total return for the Index for the year.
In 2012, U.S. equities surged in the first quarter, with the S&P 500 up 12.59% as investors shrugged off lingering uncertainty over eurozone sovereign debt and focused instead on improving economic data. Strong corporate earnings news and the Federal Reserve’s pledge to keep interest rates low buoyed investors’ appetites.
The Hartford Mutual Funds Expands Relationship with Wellington Management
We’re very pleased that we are expanding our relationship with Wellington Management which will now serve as the sole sub-adviser for the retail Hartford Mutual Funds including equity, fixed-income, and asset-allocation funds.* One of America’s oldest and largest investment management firms, Wellington Management has resources that span the entire globe, with multiple offices across the U.S. and numerous offices abroad. Wellington Management’s most distinctive strength is its proprietary research, which is shared across the entire organization.
We believe that aligning more closely with a well-respected money manager like Wellington Management puts us in a strong position to drive significant growth and to continue delivering innovative fund strategies to help our investors meet their financial goals.
Thank you again for investing with The Hartford Mutual Funds.

James Davey
President
The Hartford Mutual Funds
*Hartford Investment Management Company will continue to sub-advise The Hartford Money Market Fund.
The Hartford Growth Fund
Table of Contents
The views expressed in the Fund’s Manager Discussion under “Why did the Fund perform this way?” and “What is the outlook?” are views of the Fund’s sub-adviser and portfolio management team through the end of the period and are subject to change based on market and other conditions.
The Hartford Growth Fund inception 06/08/1949
| (sub-advised by Wellington Management Company, LLP) |
| |
| Investment objective – Seeks long-term capital appreciation. |
Performance Overview 4/30/02 - 4/30/12
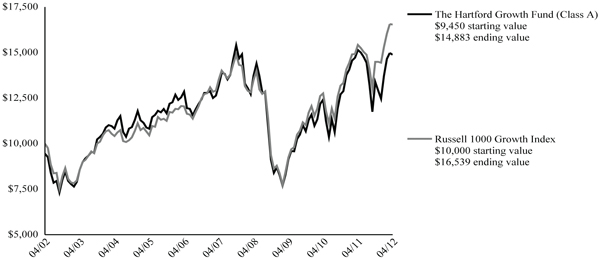
The chart above shows the growth of a $10,000 investment in Class A which includes a sales charge. Growth results in classes other than Class A will vary from what is seen above due to differences in the expenses charged to those share classes.
Average Annual Total Returns (as of 4/30/12)
| | 6 Month† | 1 Year | 5 year | 10 year |
| Growth A# | 11.17% | -1.72% | 2.41% | 4.64% |
| Growth A## | | -7.12% | 1.26% | 4.05% |
| Growth B# | 10.75% | -2.49% | 1.72% | NA* |
| Growth B## | | -7.37% | 1.35% | NA* |
| Growth C# | 10.81% | -2.36% | 1.68% | 3.92% |
| Growth C## | | -3.34% | 1.68% | 3.92% |
| Growth I# | 11.30% | -1.44% | 2.76% | 4.85% |
| Growth R3# | 11.01% | -1.94% | 2.14% | 4.74% |
| Growth R4# | 11.25% | -1.62% | 2.48% | 4.92% |
| Growth R5# | 11.39% | -1.35% | 2.68% | 5.04% |
| Growth Y# | 11.39% | -1.24% | 2.88% | 5.15% |
| Russell 1000 Growth Index | 14.13% | 7.26% | 4.11% | 5.16% |
| * | 10 year returns are not applicable for Class B because after 8 years Class B converts to Class A. |
PAST PERFORMANCE IS NOT INDICATIVE OF FUTURE RESULTS.
The initial investment in Class A shares reflects the maximum sales charge and Classes B and C reflect a contingent deferred sales charge.
Total returns presented above were calculated using the Fund's net asset value available to shareholders for sale or redemption of Fund shares on April 30, 2012, which may exclude investment transactions as of this date.
Effective 9/30/09, Class B shares of The Hartford Mutual Funds were closed to new investments.
Class I shares commenced operations on 8/31/06. Performance prior to that date is that of the Fund's Class A shares (excluding sales charges), which had different operating expenses.Class R3, R4 and R5 shares commenced operations on 12/22/06. Class R3, R4 and R5 share performance prior to that date reflects Class Y share performance and operating expenses.
Russell 1000 Growth Index is an unmanaged index which measures the performance of those Russell 1000 Index companies with higher price-to-book ratios and higher forecasted growth values. (The Russell 1000 Index is an unmanaged index that measures the performance of the 1,000 largest companies in the Russell 3000 Index, which measures the performance of the 3,000 largest U.S. companies based on total market capitalization.)
You cannot invest directly in an index.
The chart represents a hypothetical investment in the Fund. Performance data represents past performance and current performance could be higher or lower.
The value of shares will fluctuate so that, when redeemed, shares may be worth more or less than their original cost. The chart and table do not reflect the deduction of taxes that a shareholder would pay on Fund distributions or the redemption of Fund shares.
Performance information may reflect historical or current expense waivers/reimbursements from the investment adviser, without which performance would have been lower. For information on current expense waivers/reimbursements, please see the prospectus.
| The Hartford Growth Fund |
| Manager Discussion |
| April 30, 2012 (Unaudited) |
| Portfolio Manager |
| Andrew J. Shilling, CFA |
| Senior Vice President and Equity Portfolio Manager |
| |
How did the Fund perform?
The Class A shares of The Hartford Growth Fund returned 11.17%, before sales charges, for the six-month period ended April 30, 2012, underperforming its benchmark, the Russell 1000 Growth Index, which returned 14.13% for the same period. The Fund underperformed the 12.80% return of the average fund in the Lipper Large-Cap Growth Funds peer group, a group of funds with investment strategies similar to those of the Fund.
Why did the Fund perform this way?
U.S. equities moved higher in the period as generally improving economic data and growing consumer confidence helped to counter a persistent slump in housing. Investors mostly shrugged off lingering uncertainty over eurozone sovereign debt, focusing instead on the improving health of the U.S. economy. Strong corporate earnings news and the U.S. Federal Reserve’s pledge to keep interest rates “exceptionally low” until at least late 2014 buoyed investors’ appetites for risk assets. The Greek debt restructuring deal added to investors’ optimism, helping to offset heightened geopolitical risks, a rise in oil prices, and fears of a slowdown in China. In April, U.S. equities retreated for the first time in five months as disappointing employment and GDP data overshadowed continued strength in corporate earnings. In addition, increased political uncertainty in Europe, growing concerns about Spain’s fiscal sustainability, and a less dovish tone from the U.S. Federal Reserve underpinned a rise in risk aversion among investors.
All ten sectors of the Russell 1000 Growth Index had positive returns for the period. Consumer Discretionary (+17%), Information Technology (+17%), and Health Care (+16%) performed the best, while Utilities (+4%) lagged on a relative basis. Growth stocks (+14%) outperformed Value stocks (+12%), as measured by the Russell 1000 Growth and Russell 1000 Value Indices.
Weak security selection in Information Technology, Consumer Staples, and Industrials contributed to underperformance relative to the benchmark. This was partially offset by strong security selection in Financials, Health Care, and Consumer Discretionary. Sector allocation, which is a residual of bottom-up stock selection (i.e. stock by stock fundamental research), contributed positively to relative performance. Positive effects from an overweight (i.e. the Fund’s sector position was greater than the benchmark position) to Information Technology was enough to offset the negative effects of the Fund’s underweight exposure to Financials, Health Care, and Telecommunication Services. A modest cash position detracted in an upward-trending market.
Top detractors from relative performance (i.e. performance of the Fund as measured against the benchmark) during the period were Green Mountain Coffee Roasters (Consumer Staples), Altera (Information Technology), and Abercrombie & Fitch (Consumer Discretionary). Shares of specialty coffee company Green Mountain were volatile during the period due to an earnings miss and investor concerns about whether the business was decelerating and earnings were reliable. Shares of Altera, a semiconductor company specializing in programmable logic devices, lagged following slightly lower revenue guidance. The firm’s first quarter sales declined, in part due to weak orders in the Telecom & Wireless segment, causing the company to miss mid-quarter expectations and lower their numbers. Abercrombie & Fitch, a specialty retailer of casual sportswear apparel, saw its stock price fall as the company experienced negative same store sales at its international flagship stores. Oracle Corporation (Information Technology) was also among the top detractors from absolute performance (i.e. total return).
eBay (Information Technology), Priceline.com (Consumer Discretionary), and Apple (Information Technology) were the top contributors to relative and absolute performance during the period. Shares of eBay, a provider of online marketplaces and payment solutions, saw its share price steadily increase over the period. Continued improvements in the marketplace segment and increased adoption of PayPal by retailers helped drive earnings growth. Shares of Priceline.com, a leading online travel booking and services company, rose after the company announced better-than-expected earnings results and guidance. Strong international booking growth as well as net revenue growth drove improving margins. Shares of Apple moved higher after the company reported better-than-expected quarterly revenue and earnings led by robust sales of the iPhone 4S.
What is the outlook?
Economic data in the United States has improved in recent months. We believe a strengthening job market and improved consumer confidence are helping to offset a stagnant housing market. While we believe economic growth is likely to remain
| The Hartford Growth Fund |
| Manager Discussion – (continued) |
| April 30, 2012 (Unaudited) |
tepid in 2012, this is discounted in valuations, in our view. We believe that the biggest risk to U.S. markets remains a cataclysmic liquidity event in Europe that severely impacts global economic growth and confidence. We view this as a low probability event. We expect a continued modest economic expansion in the U.S., underpinned by falling inflation and only modest fiscal restraint. It appears that the likelihood of a European recession is increasing, but we believe the U.S. can withstand this and continue its slow recovery.
Our investment discipline is focused on investing in areas of strong demand and avoiding areas of oversupply. At the end of the period, our largest overweights were to Information Technology and Consumer Discretionary while we remained underweight to Consumer Staples and Materials, relative to the benchmark.
Diversification by Industry
as of April 30, 2012
| Industry (Sector) | | Percentage of
Net Assets | |
| Automobiles & Components (Consumer Discretionary) | | | 1.5 | % |
| Capital Goods (Industrials) | | | 6.9 | |
| Commercial & Professional Services (Industrials) | | | 0.8 | |
| Consumer Durables & Apparel (Consumer Discretionary) | | | 4.7 | |
| Consumer Services (Consumer Discretionary) | | | 4.1 | |
| Diversified Financials (Financials) | | | 1.3 | |
| Energy (Energy) | | | 8.7 | |
| Food, Beverage & Tobacco (Consumer Staples) | | | 3.3 | |
| Health Care Equipment & Services (Health Care) | | | 5.1 | |
| Materials (Materials) | | | 2.1 | |
| Media (Consumer Discretionary) | | | 4.3 | |
| Pharmaceuticals, Biotechnology & Life Sciences (Health Care) | | | 2.8 | |
| Retailing (Consumer Discretionary) | | | 7.8 | |
| Semiconductors & Semiconductor Equipment (Information Technology) | | | 4.8 | |
| Software & Services (Information Technology) | | | 19.0 | |
| Technology Hardware & Equipment (Information Technology) | | | 18.5 | |
| Transportation (Industrials) | | | 2.8 | |
| Short-Term Investments | | | 1.8 | |
| Other Assets and Liabilities | | | (0.3 | ) |
| Total | | | 100.0 | % |
| The Hartford Growth Fund |
| Schedule of Investments |
| April 30, 2012 (Unaudited) |
| (000’s Omitted) |
| Shares or Principal Amount | Market Value ╪ | |
| COMMON STOCKS - 98.5% | |
| | | | | Automobiles & Components - 1.5% | | | | |
| | 49 | | | Allison Transmission Holdings, Inc. ● | | $ | 1,024 | |
| | 208 | | | Harley-Davidson, Inc. | | | 10,898 | |
| | | | | | | | 11,922 | |
| | | | | Capital Goods - 6.9% | | | | |
| | 184 | | | AMETEK, Inc. | | | 9,260 | |
| | 120 | | | Boeing Co. | | | 9,216 | |
| | 44 | | | Caterpillar, Inc. | | | 4,492 | |
| | 109 | | | Cummins, Inc. | | | 12,657 | |
| | 161 | | | Eaton Corp. | | | 7,741 | |
| | 73 | | | Illinois Tool Works, Inc. | | | 4,188 | |
| | 108 | | | Joy Global, Inc. | | | 7,665 | |
| | | | | | | | 55,219 | |
| | | | | Commercial & Professional Services - 0.8% | | | | |
| | 65 | | | IHS, Inc. ● | | | 6,529 | |
| | | | | | | | | |
| | | | | Consumer Durables & Apparel - 4.7% | | | | |
| | 101 | | | Coach, Inc. | | | 7,393 | |
| | 348 | | | D.R. Horton, Inc. | | | 5,690 | |
| | 86 | | | Fossil, Inc. ● | | | 11,256 | |
| | 102 | | | Lennar Corp. | | | 2,831 | |
| | 21 | | | Michael Kors Holdings Ltd. ● | | | 936 | |
| | 39 | | | PVH Corp. | | | 3,498 | |
| | 12 | | | Ralph Lauren Corp. | | | 2,017 | |
| | 70 | | | Tempur-Pedic International, Inc. ● | | | 4,111 | |
| | | | | | | | 37,732 | |
| | | | | Consumer Services - 4.1% | | | | |
| | 269 | | | Dunkin' Brands Group, Inc. | | | 8,699 | |
| | 55 | | | Las Vegas Sands Corp. | | | 3,045 | |
| | 323 | | | MGM Resorts International ● | | | 4,336 | |
| | 170 | | | Starbucks Corp. | | | 9,756 | |
| | 100 | | | Yum! Brands, Inc. | | | 7,237 | |
| | | | | | | | 33,073 | |
| | | | | Diversified Financials - 1.3% | | | | |
| | 141 | | | American Express Co. | | | 8,485 | |
| | 10 | | | BlackRock, Inc. | | | 1,870 | |
| | | | | | | | 10,355 | |
| | | | | Energy - 8.7% | | | | |
| | 155 | | | Anadarko Petroleum Corp. | | | 11,313 | |
| | 144 | | | Cameron International Corp. ● | | | 7,400 | |
| | 241 | | | Cobalt International Energy ● | | | 6,462 | |
| | 6 | | | Diamond Offshore Drilling, Inc. | | | 401 | |
| | 181 | | | ENSCO International plc | | | 9,913 | |
| | 71 | | | EOG Resources, Inc. | | | 7,762 | |
| | 165 | | | National Oilwell Varco, Inc. | | | 12,482 | |
| | 182 | | | Schlumberger Ltd. | | | 13,525 | |
| | | | | | | | 69,258 | |
| | | | | Food, Beverage & Tobacco - 3.3% | | | | |
| | 538 | | | Green Mountain Coffee Roasters, Inc. ● | | | 26,244 | |
| | | | | | | | | |
| | | | | Health Care Equipment & Services - 5.1% | | | | |
| | 129 | | | Covidien plc | | | 7,102 | |
| | 171 | | | Edwards Lifesciences Corp. ● | | | 14,182 | |
| | 481 | | | Hologic, Inc. ● | | | 9,192 | |
| | 183 | | | UnitedHealth Group, Inc. | | | 10,248 | |
| | | | | | | | 40,724 | |
| | | | | Materials - 2.1% | | | | |
| | 170 | | | Monsanto Co. | | | 12,945 | |
| | 53 | | | Walter Energy, Inc. | | | 3,506 | |
| | | | | | | | 16,451 | |
| | | | | Media - 4.3% | | | | |
| | 738 | | | News Corp. Class A | | | 14,470 | |
| | 4,205 | | | Sirius XM Radio, Inc. w/ Rights ● | | | 9,503 | |
| | 248 | | | Walt Disney Co. | | | 10,693 | |
| | | | | | | | 34,666 | |
| | | | | Pharmaceuticals, Biotechnology & Life Sciences - 2.8% | | | | |
| | 271 | | | Agilent Technologies, Inc. | | | 11,447 | |
| | 208 | | | Gilead Sciences, Inc. ● | | | 10,827 | |
| | | | | | | | 22,274 | |
| | | | | Retailing - 7.8% | | | | |
| | 222 | | | Abercrombie & Fitch Co. Class A | | | 11,142 | |
| | 64 | | | Amazon.com, Inc. ● | | | 14,944 | |
| | 13 | | | AutoZone, Inc. ● | | | 4,972 | |
| | 439 | | | Lowe's Co., Inc. | | | 13,817 | |
| | 22 | | | Priceline.com, Inc. ● | | | 17,042 | |
| | | | | | | | 61,917 | |
| | | | | Semiconductors & Semiconductor Equipment - 4.8% | | | | |
| | 722 | | | Altera Corp. | | | 25,683 | |
| | 349 | | | Broadcom Corp. Class A | | | 12,788 | |
| | | | | | | | 38,471 | |
| | | | | Software & Services - 19.0% | | | | |
| | 79 | | | Alliance Data Systems Corp. ● | | | 10,088 | |
| | 188 | | | BMC Software, Inc. ● | | | 7,765 | |
| | 162 | | | Citrix Systems, Inc. ● | | | 13,890 | |
| | 114 | | | Cognizant Technology Solutions Corp. ● | | | 8,329 | |
| | 824 | | | eBay, Inc. ● | | | 33,820 | |
| | 22 | | | Google, Inc. ● | | | 13,127 | |
| | 24 | | | Mastercard, Inc. | | | 11,040 | |
| | 808 | | | Oracle Corp. | | | 23,747 | |
| | 138 | | | Rovi Corp. ● | | | 3,948 | |
| | 28 | | | Salesforce.com, Inc. ● | | | 4,323 | |
| | 64 | | | Splunk, Inc. | | | 2,166 | |
| | 199 | | | Tibco Software, Inc. ● | | | 6,556 | |
| | 208 | | | VeriSign, Inc. | | | 8,533 | |
| | 43 | | | VMware, Inc. ● | | | 4,796 | |
| | | | | | | | 152,128 | |
| | | | | Technology Hardware & Equipment - 18.5% | | | | |
| | 388 | | | Acme Packet, Inc. ● | | | 10,877 | |
| | 125 | | | Apple, Inc. ● | | | 72,785 | |
| | 818 | | | EMC Corp. ● | | | 23,084 | |
| | 29 | | | F5 Networks, Inc. ● | | | 3,942 | |
| | 511 | | | Juniper Networks, Inc. ● | | | 10,956 | |
| | 186 | | | NetApp, Inc. ● | | | 7,219 | |
| | 295 | | | Qualcomm, Inc. | | | 18,850 | |
| | | | | | | | 147,713 | |
| | | | | Transportation - 2.8% | | | | |
| | 120 | | | C.H. Robinson Worldwide, Inc. | | | 7,198 | |
| | 193 | | | Expeditors International of Washington, Inc. | | | 7,727 | |
| | 136 | | | J.B. Hunt Transport Services, Inc. | | | 7,497 | |
| | | | | | | | 22,422 | |
| | | | | Total common stocks | | | | |
| | | | | (cost $614,979) | | $ | 787,098 | |
| | | | | | | | | |
| | | | | Total long-term investments | | | | |
| | | | | (cost $614,979) | | $ | 787,098 | |
The accompanying notes are an integral part of these financial statements
| The Hartford Growth Fund |
| Schedule of Investments – (continued) |
| April 30, 2012 (Unaudited) |
| (000’s Omitted) |
| Shares or Principal Amount | | | Market Value ╪ | |
| SHORT-TERM INVESTMENTS - 1.8% | | | | | |
| Repurchase Agreements - 1.8% | | | | | |
| | | | | Bank of America Merrill Lynch TriParty Joint
Repurchase Agreement (maturing on
05/01/2012 in the amount of $3,540,
collateralized by FHLB 4.91%, 2015,
FHLMC 2.46% - 3.33%, 2040 - 2042,
FNMA 2.24% - 5.50%, 2024 - 2042, value
of $3,611) | | | | | |
| $ | 3,540 | | | 0.20%, 04/30/2012 | | | $ | 3,540 | |
| | | | | Barclays Capital TriParty Joint Repurchase
Agreement (maturing on 05/01/2012 in the
amount of $4,742, collateralized by
FHLMC 4.00% - 4.50%, 2039 - 2041,
FNMA 3.00% - 5.00%, 2027 - 2040, value
of $4,837) | | |
| | 4,742 | | | 0.20%, 04/30/2012 | | | | 4,742 | |
| | | | | Deutsche Bank Securities TriParty Joint
Repurchase Agreement (maturing on
05/01/2012 in the amount of $1,873,
collateralized by FNMA 3.00% - 7.00%,
2023 - 2042, value of $1,910) | | | | | |
| | 1,873 | | | 0.21%, 04/30/2012 | | | | 1,873 | |
| | | | | TD Securities TriParty Joint Repurchase
Agreement (maturing on 05/01/2012 in the
amount of $1,551, collateralized by FFCB
0.27% - 5.38%, 2012 - 2020, FHLB 0.88% -
1.38%, 2013 - 2014, FHLMC 4.00% -
6.00%, 2014 - 2041, FNMA 4.00% - 4.50%,
2025 - 2042, value of $1,582) | | | | | |
| | 1,551 | | | 0.19%, 04/30/2012 | | | | 1,551 | |
| | | | | UBS Securities, Inc. Joint Repurchase
Agreement (maturing on 05/01/2012 in the
amount of $2, collateralized by U.S.
Treasury Note 0.75%, 2013, value of $2) | | | | | |
| | 2 | | | 0.17%, 04/30/2012 | | | | 2 | |
| | | | | UBS Securities, Inc. TriParty Joint Repurchase
Agreement (maturing on 05/01/2012 in the
amount of $2,546, collateralized by
FHLMC 4.00%, 2026 - 2042, FNMA
2.50% - 4.50%, 2022 - 2042, value of
$2,597) | | | | | |
| | 2,546 | | | 0.21%, 04/30/2012 | | | | 2,546 | |
| | | | | | | | | | | | 14,254 | |
| | | | | Total short-term investments | | | | | | | | |
| | | | | (cost $14,254) | | | | | | $ | 14,254 | |
| | | | | | | | | | | | | |
| | | | | Total investments | | | | | | | | |
| | | | | (cost $629,233) ▲ | | | 100.3 | % | | $ | 801,352 | |
| | | | | Other assets and liabilities | | | (0.3 | )% | | | (2,204 | ) |
| | | | | Total net assets | | | 100.0 | % | | $ | 799,148 | |
The accompanying notes are an integral part of these financial statements
| Note: | Percentage of investments as shown is the ratio of the total market value to total net assets. |
| ▲ | At April 30, 2012, the cost of securities for federal income tax purposes was $632,094 and the aggregate gross unrealized appreciation and depreciation based on that cost were: |
| Unrealized Appreciation | | $ | 193,718 | |
| Unrealized Depreciation | | | (24,460 | ) |
| Net Unrealized Appreciation | | $ | 169,258 | |
| ╪ | See Significant Accounting Policies of accompanying Notes to Financial Statements regarding valuation of securities. |
| GLOSSARY: (abbreviations used in preceding Schedule of Investments) |
| |
| Other Abbreviations: |
| FFCB | Federal Farm Credit Bank |
| FHLB | Federal Home Loan Bank |
| FHLMC | Federal Home Loan Mortgage Corp. |
| FNMA | Federal National Mortgage Association |
The accompanying notes are an integral part of these financial statements
| The Hartford Growth Fund |
| Investment Valuation Hierarchy Level Summary |
| April 30, 2012 (Unaudited) |
| (000’s Omitted) |
| | | Total | | | Level 1 ♦ | | | Level 2 ♦ | | | Level 3 | |
| Assets: | | | | | | | | | | | | | | | | |
| Common Stocks ‡ | | $ | 787,098 | | | $ | 787,098 | | | $ | – | | | $ | – | |
| Short-Term Investments | | | 14,254 | | | | – | | | | 14,254 | | | | – | |
| Total | | $ | 801,352 | | | $ | 787,098 | | | $ | 14,254 | | | $ | – | |
| ♦ | For the six-month period ended April 30, 2012, there were no transfers between Level 1 and Level 2. |
| ‡ | The Fund has all or primarily all of the equity securities categorized in a particular level. Refer to the Schedule of Investments for further industry breakout. |
The accompanying notes are an integral part of these financial statements
| The Hartford Growth Fund |
| Statement of Assets and Liabilities |
| April 30, 2012 (Unaudited) |
| (000’s Omitted) |
| Assets: | | | | |
| Investments in securities, at market value (cost $629,233) | | $ | 801,352 | |
| Cash | | | 3 | |
| Receivables: | | | | |
| Investment securities sold | | | 8,680 | |
| Fund shares sold | | | 813 | |
| Dividends and interest | | | 216 | |
| Other assets | | | 89 | |
| Total assets | | | 811,153 | |
| Liabilities: | | | | |
| Payables: | | | | |
| Investment securities purchased | | | 5,790 | |
| Fund shares redeemed | | | 5,933 | |
| Investment management fees | | | 96 | |
| Administrative fees | | | — | |
| Distribution fees | | | 26 | |
| Accrued expenses | | | 160 | |
| Total liabilities | | | 12,005 | |
| Net assets | | $ | 799,148 | |
| Summary of Net Assets: | | | | |
| Capital stock and paid-in-capital | | $ | 686,382 | |
| Distributions in excess of net investment loss | | | (1,466 | ) |
| Accumulated net realized loss | | | (57,887 | ) |
| Unrealized appreciation of investments and the translation of assets and liabilities denominated in foreign currency | | | 172,119 | |
| Net assets | | $ | 799,148 | |
| | | | | |
| Shares authorized | | | 27,000,000 | |
| Par value | | $ | 0.0001 | |
| Class A: Net asset value per share/Maximum offering price per share | | | $18.91/$20.01 | |
| Shares outstanding | | | 22,424 | |
| Net assets | | $ | 424,019 | |
| Class B: Net asset value per share | | $ | 15.66 | |
| Shares outstanding | | | 722 | |
| Net assets | | $ | 11,308 | |
| Class C: Net asset value per share | | $ | 15.69 | |
| Shares outstanding | | | 2,558 | |
| Net assets | | $ | 40,128 | |
| Class I: Net asset value per share | | $ | 19.21 | |
| Shares outstanding | | | 9,641 | |
| Net assets | | $ | 185,228 | |
| Class R3: Net asset value per share | | $ | 19.16 | |
| Shares outstanding | | | 24 | |
| Net assets | | $ | 469 | |
| Class R4: Net asset value per share | | $ | 19.48 | |
| Shares outstanding | | | 208 | |
| Net assets | | $ | 4,048 | |
| Class R5: Net asset value per share | | $ | 19.66 | |
| Shares outstanding | | | 48 | |
| Net assets | | $ | 946 | |
| Class Y: Net asset value per share | | $ | 19.85 | |
| Shares outstanding | | | 6,699 | |
| Net assets | | $ | 133,002 | |
The accompanying notes are an integral part of these financial statements
| The Hartford Growth Fund |
| Statement of Operations |
| For the Six-Month Period Ended April 30, 2012 (Unaudited) |
| (000’s Omitted) |
| Investment Income: | | | | |
| Dividends | | $ | 2,831 | |
| Interest | | | 14 | |
| Less: Foreign tax withheld | | | (8 | ) |
| Total investment income | | | 2,837 | |
| | | | | |
| Expenses: | | | | |
| Investment management fees | | | 2,721 | |
| Administrative services fees | | | 4 | |
| Transfer agent fees | | | 698 | |
| Distribution fees | | | | |
| Class A | | | 502 | |
| Class B | | | 61 | |
| Class C | | | 193 | |
| Class R3 | | | 1 | |
| Class R4 | | | 5 | |
| Custodian fees | | | 3 | |
| Accounting services fees | | | 44 | |
| Registration and filing fees | | | 72 | |
| Board of Directors' fees | | | 9 | |
| Audit fees | | | 7 | |
| Other expenses | | | 61 | |
| Total expenses (before waivers and fees paid indirectly) | | | 4,381 | |
| Expense waivers | | | (57 | ) |
| Transfer agent fee waivers | | | (11 | ) |
| Commission recapture | | | (10 | ) |
| Total waivers and fees paid indirectly | | | (78 | ) |
| Total expenses, net | | | 4,303 | |
| Net Investment Loss | | | (1,466 | ) |
| Net Realized Gain on Investments: | | | | |
| Net realized gain on investments in securities | | | 28,464 | |
| Net Realized Gain on Investments | | | 28,464 | |
| Net Changes in Unrealized Appreciation of Investments and Foreign Currency Transactions: | | | | |
| Net unrealized appreciation of investments | | | 54,175 | |
| Net unrealized appreciation on translation of other assets and liabilities in foreign currencies | | | 1 | |
| Net Changes in Unrealized Appreciation of Investments and Foreign Currency Transactions | | | 54,176 | |
| Net Gain on Investments and Foreign Currency Transactions | | | 82,640 | |
| Net Increase in Net Assets Resulting from Operations | | $ | 81,174 | |
The accompanying notes are an integral part of these financial statements
| The Hartford Growth Fund |
| Statement of Changes in Net Assets |
| |
| (000’s Omitted) |
| | | For the Six-Month
Period Ended
April 30, 2012
(Unaudited) | | | For the
Year Ended
October 31, 2011 | |
| Operations: | | | | | | | | |
| Net investment loss | | $ | (1,466 | ) | | $ | (1,597 | ) |
| Net realized gain on investments and foreign currency transactions | | | 28,464 | | | | 51,417 | |
| Net unrealized appreciation (depreciation) of investments and foreign currency transactions | | | 54,176 | | | | (12,890 | ) |
| Net Increase In Net Assets Resulting From Operations | | | 81,174 | | | | 36,930 | |
| Capital Share Transactions: | | | | | | | | |
| Class A | | | (23,951 | ) | | | 105,155 | |
| Class B | | | (3,328 | ) | | | (5,074 | ) |
| Class C | | | (3,225 | ) | | | (6,415 | ) |
| Class I | | | 27,498 | | | | 79,116 | |
| Class L* | | | — | | | | (184,338 | ) |
| Class R3 | | | 122 | | | | 61 | |
| Class R4 | | | (290 | ) | | | 230 | |
| Class R5 | | | 161 | | | | 540 | |
| Class Y | | | (4,919 | ) | | | 18,053 | |
| Net increase (decrease) from capital share transactions | | | (7,932 | ) | | | 7,328 | |
| Net Increase In Net Assets | | | 73,242 | | | | 44,258 | |
| Net Assets: | | | | | | | | |
| Beginning of period | | | 725,906 | | | | 681,648 | |
| End of period | | $ | 799,148 | | | $ | 725,906 | |
| Undistributed (distribution in excess of) net investment income (loss) | | $ | (1,466 | ) | | $ | — | |
* Class L merged into Class A on August 5, 2011. Please refer to the Notes to Financial Statements for further details.
The accompanying notes are an integral part of these financial statements
| The Hartford Growth Fund |
| Notes to Financial Statements |
| April 30, 2012 (Unaudited) |
| (000’s Omitted) |
The Hartford Mutual Funds II, Inc. (“Company”) is an open-end management investment company comprised of five portfolios. Financial statements for The Hartford Growth Fund (the “Fund”), a series of the Company, are included in this report.
The Company is organized under the laws of the State of Maryland and is registered with the Securities and Exchange Commission (“SEC”) under the Investment Company Act of 1940, as amended (“1940 Act”). The Fund is a diversified open-end management investment company.
Class A shares are sold with a front-end sales charge of up to 5.50%. Class B shares were sold with a contingent deferred sales charge which is assessed on the lesser of the per share net asset value (“NAV”) of the shares at the time of redemption or the original purchase price, and declines from up to 5.00% to zero depending on the period of time the shares are held (see note below regarding the closing of Class B shares). Class C shares are sold with a contingent deferred sales charge of up to 1.00% on shares redeemed within twelve months of purchase. Class I shares are sold without sales charges to certain eligible investors primarily through advisory fee-based wrap programs. Class R3, R4 and R5 shares, which are offered to employer-sponsored retirement plans, and Class Y shares, which are sold to certain eligible institutional investors, are sold without a sales charge. All classes of shares have identical voting, redemption, dividend, liquidation and other rights and the same terms and conditions, with the exceptions that each class may have different expenses, which may affect performance, and that Class B shares automatically convert to Class A shares after 8 years.
No new or additional investments are allowed in Class B shares of The Hartford Mutual Funds (including investments through any systematic investment plan). Existing shareholders of Class B shares may continue to hold their Class B shares, exchange their Class B shares for Class B shares of another Hartford Mutual Fund (as permitted by existing exchange privileges), or redeem their Class B shares as described in the Fund’s prospectus. Reinstatement privileges with respect to Class B shares will continue under the current policy. For investors electing to reinvest capital gains and dividends, any such capital gains or dividends on Class B shares will continue to be reinvested in Class B shares of the Fund. All Class B share attributes, including the 12b-1 fee, contingent deferred sales charge schedule, and conversion to Class A shares, remain unchanged.
| 2. | Significant Accounting Policies: |
The following is a summary of significant accounting policies of the Fund in the preparation of its financial statements, which are in accordance with the United States Generally Accepted Accounting Principles (“U.S. GAAP”). The preparation of financial statements in accordance with U.S. GAAP may require management to make estimates and assumptions that affect the reported amounts of assets and liabilities and disclosure of contingent assets and liabilities at the date of the financial statements and the reported amounts of increases and decreases in net assets from operations during the reporting period. Actual results could differ from those estimates.
| a) | Determination of Net Asset Value – The NAV of each class of the Fund’s shares is determined as of the close of regular trading (normally 4:00 p.m. Eastern Time) (the “NYSE Close”) on each day that the New York Stock Exchange (the “Exchange”) is open (“Valuation Date”). Information that becomes known to the Fund after the NAV has been calculated on a particular day will not generally be used to retroactively adjust the NAV determined earlier that day. |
| b) | Investment Valuation and Fair Value Measurements – For purposes of calculating the NAV, portfolio investments and other assets held by the Fund's portfolio for which market quotes are readily available are valued at market value. Market value is generally determined on the basis of last reported sales prices or official close price. If no sales are reported, market value is based on quotes obtained from a quotation reporting system, established market makers, or independent pricing services. If market prices are not readily available or are deemed unreliable, the Fund will use the fair value of |
the investment as determined in good faith under policies and procedures established by and under the supervision of the Company’s Board of Directors. Market quotes are considered not readily available where there is an absence of current or reliable market-based data (e.g., trade information or broker quotes), including where events occur after the close of the relevant market, but prior to the NYSE Close that materially affect the values of the Fund’s portfolio investments or assets. In addition, market quotes are considered not readily available when, due to extraordinary circumstances, the exchanges or markets on which the investments trade do not open for trading for the entire day and no other market prices are available. In addition, prices of foreign equities that are principally traded on certain foreign markets are adjusted daily pursuant to a fair value pricing service approved by the Board of Directors in order to reflect an adjustment for the factors occurring after the close of certain foreign markets but before the NYSE Close. Investments that are primarily traded on foreign markets may trade on days that are not business days of the Fund. The value of the foreign investments in which the Fund invests may change on days when a shareholder will not be able to purchase or redeem shares of the Fund. Fair value pricing is subjective in nature and the use of fair value pricing by the Fund may cause the NAV of its shares to differ significantly from the NAV that would have been calculated using market prices at the close of the exchange on which a portfolio investment is primarily traded. There can be no assurance that the Fund could obtain the fair market value assigned to an investment if the Fund were to sell the investment at approximately the time at which the Fund determines its NAV.
Investments valued in currencies other than U.S. dollars are converted to U.S. dollars using exchange rates obtained from independent pricing services for calculation of the NAV. As a result, the NAV of the Fund’s shares may be affected by changes in the value of currencies in relation to the U.S. dollar. The value of investments traded in markets outside the United States or denominated in currencies other than the U.S. dollar may be affected significantly on a day that the NYSE is closed and the market value may change on days when an investor is not able to purchase, redeem or exchange shares of the Fund.
Foreign currency contracts represent agreements to exchange currencies on specific future dates at predetermined rates. Foreign currency contracts are valued using foreign currency exchange rates and forward rates as provided by an independent pricing service on the Valuation Date.
Financial instruments for which prices are not available from an independent pricing service may be valued using market quotations obtained from one or more dealers that make markets in the respective financial instrument in accordance with procedures established by the Company’s Board of Directors.
U.S. GAAP defines fair value as the price that the Fund would receive to sell an asset or pay to transfer a liability in an orderly transaction between market participants. The U.S. GAAP fair value measurement standards require disclosure of a fair value hierarchy for each major category of assets and liabilities. Various inputs are used in determining the fair value of the Fund’s investments. These inputs are summarized into three broad hierarchy levels. This hierarchy is based on whether the valuation inputs are observable or unobservable. These levels are:
| · | Level 1 – Quoted prices in active markets for identical investments. Level 1 may include exchange traded instruments, such as domestic equities, some foreign equities, options, futures, mutual funds, exchange traded funds, rights and warrants. |
| · | Level 2 – Observable inputs other than Level 1 prices, such as quoted prices for similar investments; quoted prices in markets that are not active; or other inputs that are observable or can be corroborated by observable market data. Level 2 may include debt investments that are traded less frequently than exchange traded instruments and which are valued using independent pricing services; foreign equities, which are principally traded on certain foreign markets and are adjusted daily pursuant to a fair value pricing service in order to reflect an adjustment for the factors occurring after the close of certain foreign markets but before the NYSE Close; and short-term investments, which are valued at amortized cost. |
| · | Level 3 – Significant unobservable inputs that are supported by limited or no market activity. Level 3 may include financial instruments whose values are determined using broker quotes or require significant |
| The Hartford Growth Fund |
| Notes to Financial Statements – (continued) |
| April 30, 2012 (Unaudited) |
| (000’s Omitted) |
management judgment or estimation. These unobservable valuation inputs may include estimates for current yields, maturity/duration, prepayment speed, and broker quotes for comparable investments along with other assumptions relating to credit quality, collateral value, complexity of the investment structure, general market conditions and liquidity. This category may include investments where trading has been halted or there are certain restrictions on trading. While these investments are priced using unobservable inputs, the valuation of these investments reflects the best available data and management believes the prices are a reasonable representation of exit price.
Valuation levels are not necessarily indicative of the risk associated with investing in such investments. Individual investments within any of the above mentioned asset classes may be assigned a different hierarchical level than those presented above, as individual circumstances dictate.
During the six-month period ended April 30, 2012, the Fund held no Level 3 investments; therefore, no reconciliation of Level 3 investments is presented.
For additional information, refer to the Investment Valuation Hierarchy Level Summary which follows the Schedule of Investments.
For purposes of reporting transfers between different hierarchy levels, both transfers in and out of each level, as applicable, are shown as if they occurred at the beginning of the period.
| c) | Investment Transactions and Investment Income – Investment transactions are recorded as of the trade date (the date the order to buy or sell is executed) for financial reporting purposes. Investments purchased or sold on a when-issued or delayed-delivery basis may be settled a month or more after the trade date. Realized gains and losses are determined on the basis of identified cost. |
Dividend income is accrued as of the ex-dividend date, except certain dividends from foreign investments where the ex-dividend date may have passed are recorded as soon as the Fund is informed of the dividend. Interest income, including amortization of premium and accretion of discounts, is accrued on a daily basis.
| d) | Foreign Currency Transactions – Assets and liabilities denominated in currencies other than U.S. dollars are translated into U.S. dollars at the exchange rates in effect on the valuation date. Purchases and sales of investments, income, and expenses are translated into U.S. dollars at the exchange rates on the dates of such transactions. |
The Fund does not isolate that portion of portfolio investment valuation resulting from fluctuations in the foreign currency exchange rates from the fluctuations arising from changes in the market prices of investments held. Exchange rate fluctuations are included with the net realized and unrealized gain or loss on investments in the accompanying financial statements.
Net realized foreign exchange gains or losses arise from sales of foreign currencies and the difference between asset and liability amounts initially stated in foreign currencies and the U.S. dollar value of the amounts actually received or paid. Net unrealized foreign exchange gains or losses arise from changes in the value of other assets and liabilities at the end of the reporting period, resulting from changes in the exchange rates.
| e) | Joint Trading Account – The Fund may invest cash balances into a joint trading account that may be invested in one or more repurchase agreements. |
| f) | Fund Share Valuation and Dividend Distributions to Shareholders – Orders for the Fund’s shares are executed in accordance with the investment instructions of the shareholders. The NAV of the Fund’s shares is determined as of the close of business on each business day of the Exchange. The NAV is determined separately for each class of shares of |
the Fund by dividing the Fund’s net assets attributable to that class by the number of shares of the class outstanding. Each class of shares offered by the Fund has equal rights as to assets and voting privileges (except that shareholders of a class have exclusive voting rights regarding any matter relating solely to that class of shares). Income and non-class specific expenses are allocated daily to each class on the basis of the relative net assets of the class. Realized and unrealized capital gains and losses are allocated daily based on the relative net assets of each class of shares of the Fund.
Orders for the purchase of the Fund’s shares received prior to the close of the Exchange on any day the Exchange is open for business are priced at the NAV determined as of the close of the Exchange. Orders received after the close of the Exchange, or on a day on which the Exchange and/or the Fund is not open for business, are priced at the next determined NAV.
Dividends are declared pursuant to a policy adopted by the Company’s Board of Directors based upon the investment performance of the Fund. The policy of the Fund is to pay dividends from net investment income and realized capital gains, if any, at least once a year.
Distributions from net investment income, net realized capital gains and capital are determined in accordance with federal income tax regulations, which may differ from U.S. GAAP with respect to character and timing. These differences may include but are not limited to losses deferred due to wash sale adjustments, foreign currency gains and losses, adjustments related to Passive Foreign Investment Companies (“PFICs”), Real Estate Investment Trusts (“REITs”), Regulated Investment Companies (“RICs”), certain derivatives and partnerships. Permanent book and federal income tax basis differences relating to shareholder distributions will result in reclassifications to certain of the Fund’s capital accounts (see Federal Income Taxes: Reclassification of Capital Accounts note).
| 3. | Securities and Other Investments: |
| a) | Repurchase Agreements – A repurchase agreement is an agreement by which a counterparty agrees to sell an investment and agrees to repurchase the investment sold at a mutually agreed upon time and price. At the time the Fund enters into a repurchase agreement, the value of the underlying collateral, including accrued interest, will be equal to or exceed the value of the repurchase agreement. Repurchase agreements expose the Fund to counterparty risk. To minimize counterparty risk, the investments that serve to collateralize the repurchase agreement are held by the Fund’s custodian in book entry or physical form in the custodial account of the Fund or in a third party custodial account. Repurchase agreements are valued at cost plus accrued interest. The Fund, as shown on the Schedule of Investments, had outstanding repurchase agreements as of April 30, 2012. |
| a) | Counterparty Risk – The Fund may be exposed to counterparty risk, or the risk that an institution or other entity with which the Fund has unsettled or open transactions will default. |
| b) | Market Risks – If the Fund invests directly in foreign currencies or in securities that trade in, and receive revenues in, foreign currencies, or in derivatives that provide exposure to foreign currencies, it will be subject to the risk that those currencies will decline in value relative to the base currency of the Fund, or, in the case of hedging positions, that the Fund’s base currency will decline in value relative to the currency being hedged. Currency rates in foreign countries may fluctuate significantly over short periods of time for a number of reasons, including changes in interest rates, intervention (or the failure to intervene) by U.S. or foreign governments, central banks or supranational entities, such as the International Monetary Fund, or by the imposition of currency controls or other political developments in the United States or abroad. As a result, the Fund’s investments in foreign currency denominated securities may reduce the returns of the Fund. The market values of equity securities, such as common stocks and preferred stocks, or equity related investments, such as futures and options, may decline due to general market conditions which are not specifically related |
| The Hartford Growth Fund |
| Notes to Financial Statements – (continued) |
| April 30, 2012 (Unaudited) |
| (000’s Omitted) |
to a particular company, such as real or perceived adverse economic conditions, changes in the general outlook for corporate earnings, changes in interest or currency rates or adverse investor sentiment generally. The market value of equity securities may also decline due to factors which affect a particular industry or industries, such as labor shortages or increased production costs and competitive conditions within an industry. Equity securities and equity related investments generally have greater market price volatility than fixed income securities.
| a) | Federal Income Taxes – For federal income tax purposes, the Fund intends to continue to qualify as a RIC under Subchapter M of the Internal Revenue Code (“IRC”) by distributing substantially all of its taxable net investment income and net realized capital gains to its shareholders and otherwise complying with the requirements of RICs. The Fund has distributed substantially all of its income and capital gains in prior years, if applicable, and intends to distribute substantially all of its income and capital gains during the calendar year ending December 31, 2012. Accordingly, no provision for federal income or excise taxes has been made in the accompanying financial statements. Distributions from short-term capital gains are treated as ordinary income distributions for federal income tax purposes. |
| b) | Net Investment Income (Loss), Net Realized Gains (Losses) – Net investment income (loss) and net realized gains (losses) may differ for financial statement and tax purposes primarily because of losses deferred due to wash sale adjustments, foreign currency gains and losses, adjustments related to PFICs, REITs, RICs, certain derivatives and partnerships. The character of distributions made during the year from net investment income or net realized gains may differ from their ultimate characterization for federal income tax purposes. Also, due to the timing of dividend distributions, the fiscal year in which amounts are distributed may differ from the year that the income or realized gains (losses) were recorded by the Fund. |
| c) | Distributions and Components of Distributable Earnings – The tax character of distributions paid by the Fund for the periods indicated is as follows (as adjusted for dividends payable): |
| | | For the Year Ended
October 31, 2011 | | | For the Year Ended
October 31, 2010 | |
| Ordinary Income | | $ | — | | | $ | 1,253 | |
As of October 31, 2011, the Fund’s components of distributable earnings (deficit) on a tax basis were as follows:
| | | Amount | |
| Accumulated Capital Losses * | | $ | (83,489 | ) |
| Unrealized Appreciation † | | | 115,081 | |
| Total Accumulated Earnings | | $ | 31,592 | |
| * | The Fund has capital loss carryforwards that are identified in the Capital Loss Carryforward note that follows. |
| † | The differences between book-basis and tax-basis unrealized appreciation (depreciation) may be attributable to the losses deferred due to wash sale adjustments, foreign currency gains and losses, adjustments related to PFICs, REITs, RICs, certain derivatives and partnerships. |
| d) | Reclassification of Capital Accounts – The Fund may record reclassifications in its capital accounts. These reclassifications have no impact on the total net assets of the Fund. The reclassifications are a result of permanent differences between U.S. GAAP and tax accounting for such items as foreign currency, PFICs, expiration or utilization of capital loss carryforwards or net operating losses. Adjustments are made to reflect the impact these items have on current and future distributions to shareholders. Therefore, the source of the Fund’s distributions may be shown in the accompanying Statement of Changes in Net Assets as from undistributed net investment income, from accumulated net |
realized gains on investments or from capital depending on the type of book and tax differences that exist. For the year ended October 31, 2011, the Fund recorded reclassifications to increase (decrease) the accounts listed below:
| | | Amount | |
| Undistributed Net Investment Income | | $ | 1,597 | |
| Accumulated Net Realized Gain (Loss) | | | 65 | |
| Capital Stock and Paid-in-Capital | | | (1,662 | ) |
| e) | Capital Loss Carryforward – On December 22, 2010, the Regulated Investment Company Modernization Act of 2010 (the “Act”) was enacted, which made changes to the capital loss carryforward rules. The changes are effective for taxable years beginning after the date of enactment. Under the Act, funds are permitted to carry forward capital losses for an unlimited period. However, any losses incurred during those future taxable years will be required to be utilized prior to the losses incurred in pre-enactment taxable years, which carry an expiration date. As a result of this ordering rule, pre-enactment capital loss carryforwards may be more likely to expire unused. Additionally, post-enactment capital loss carryforwards retain their character as either short-term or long-term capital losses rather than being considered all short-term as permitted under prior regulation. |
At October 31, 2011 (tax-year-end), the Fund had capital loss carryforwards for U.S. federal income tax purposes as follows:
| Year of Expiration | | Amount | |
| 2017 | | $ | 83,489 | |
| Total | | $ | 83,489 | |
During the year ended October 31, 2011, the Fund utilized $47,565 of prior year capital loss carryforwards.
| f) | Accounting for Uncertainty in Income Taxes – The Fund has adopted financial reporting rules that require the Fund to analyze all open tax years, as defined by the statute of limitations, for all major jurisdictions. Generally, tax authorities can examine all tax returns filed for the last three years. The Fund does not have an examination in progress. |
The Fund has reviewed all open tax years and major jurisdictions and concluded that these financial reporting rules had no effect on the Fund’s financial position or results of operations. There is no tax liability resulting from unrecognized tax benefits relating to uncertain income tax positions taken or expected to be taken on the tax return for the fiscal year ended October 31, 2011. The Fund is also not aware of any tax positions for which it is reasonably possible that the total amounts of unrecognized tax benefits will significantly change in the next twelve months.
| a) | Investment Management Agreement – Hartford Investment Financial Services, LLC (“HIFSCO”), a wholly-owned indirect subsidiary of The Hartford Financial Services Group, Inc. (“The Hartford”), serves as investment manager to the Fund pursuant to an Investment Management Agreement with the Company. As investment manager, HIFSCO has overall investment supervisory responsibility for the Fund. In addition, HIFSCO provides administrative personnel, services, equipment, facilities and office space for proper operation of the Fund. HIFSCO has contracted with Wellington Management Company, LLP (“Wellington Management”) under a sub-advisory agreement for the provision of day-to-day investment management services to the Fund in accordance with the Fund’s investment objective and policies. The Fund pays a fee to HIFSCO, a portion of which may be used to compensate Wellington Management. |
| The Hartford Growth Fund |
| Notes to Financial Statements – (continued) |
| April 30, 2012 (Unaudited) |
| (000’s Omitted) |
The schedule below reflects the rates of compensation paid to HIFSCO for investment management services rendered as of April 30, 2012; the rates are accrued daily and paid monthly:
| Average Daily Net Assets | | Annual Fee | |
| On first $250 million | | | 0.8000 | % |
| On next $4.75 billion | | | 0.7000 | % |
| On next $5 billion | | | 0.6975 | % |
| Over $10 billion | | | 0.6950 | % |
| b) | Accounting Services Agreement – Pursuant to the Fund Accounting Agreement between Hartford Life Insurance Company (“HLIC”) and the Company, on behalf of the Fund, HLIC provides accounting services to the Fund and receives monthly compensation based on the Fund’s average net assets at the rates set forth below. The Fund’s accounting services fees are accrued daily and paid monthly. |
| Average Daily Net Assets | | Annual Fee | |
| On first $5 billion | | | 0.012 | % |
| Over $5 billion | | | 0.010 | % |
| c) | Operating Expenses – Allocable expenses incurred by the Company are allocated to each Fund and allocated to classes within the Fund in proportion to the average daily net assets of the Fund and each class, except where allocation of certain expenses is more fairly made directly to the Fund or to specific classes within a Fund. As of April 30, 2012, HIFSCO contractually limited the total operating expenses of this Fund, exclusive of taxes, interest expense, brokerage commissions, acquired fund fees and expenses and extraordinary expenses as follows: |
| Class A | | | Class B | | | Class C | | | Class I | | | Class R3 | | | Class R4 | | | Class R5 | | | Class Y | |
| | 1.25 | % | | | 2.00 | % | | | 2.00 | % | | | 1.00 | % | | | 1.50 | % | | | 1.20 | % | | | 0.90 | % | | | 0.85 | % |
| d) | Fees Paid Indirectly – The Fund has entered into agreements with State Street Global Markets, LLC and Russell Implementation Services Inc. to partially recapture non-discounted trade commissions. Such rebates are used to pay a portion of the Fund’s expenses. In addition, the Fund’s custodian bank, State Street Bank and Trust Co., has also agreed to reduce its fees when the Fund maintains cash on deposit in a non-interest-bearing custody account. For the six-month period ended April 30, 2012, these amounts, if any, are included in the Statement of Operations. |
The ratio of expenses to average net assets in the accompanying financial highlights excludes the reduction in expenses related to fees paid indirectly. The annualized expense ratio for the period listed below reflecting the reduction for fees paid indirectly is as follows:
| | | Annualized Six-
Month Period
Ended
April 30, 2012 | |
| Class A | | | 1.25 | % |
| Class B | | | 2.00 | |
| Class C | | | 1.96 | |
| Class I | | | 0.98 | |
| Class R3 | | | 1.50 | |
| Class R4 | | | 1.19 | |
| Class R5 | | | 0.90 | |
| Class Y | | | 0.79 | |
| e) | Distribution and Service Plan for Class A, B, C, R3 and R4 Shares – HIFSCO is the principal underwriter and distributor of the Fund. HIFSCO is engaged in distribution activities, which include marketing and distribution of shares through broker-dealers, financing distribution costs and maintaining financial books and records. For the six-month period ended April 30, 2012, HIFSCO received front-end load sales charges of $168 and contingent deferred sales charges of $5 from the Fund. |
The Fund has adopted a Distribution and Service Plan in accordance with Rule 12b-1 of the 1940 Act to compensate the distributor (HIFSCO) for activities intended to result in the sale and distribution of Class A, B, C, R3 and R4 shares and for providing services for shareholders. The Rule 12b-1 plan applicable to Class A shares of the Fund provides for payment of a Rule 12b-1 fee of 0.25% of average daily net assets. Some or all of the fee may be used for shareholder servicing expenses with the remainder used for distribution expenses. Some or the entire Rule 12b-1 fee for Class B shares may be remitted to broker-dealers for distribution and/or shareholder account services. Under the Class B Plan, the Fund pays the distributor 1.00% of the average daily net assets of Class B shares that are outstanding for 8 years or less, 0.25% of which is a fee for services provided to existing shareholders with the remainder used for distribution expenses. After eight years, Class B shares convert to Class A shares. Upon conversion to Class A shares, the Class A plan described above will apply to those shares. Under the Class C Plan, the Fund pays the distributor 1.00% of the average daily net assets of Class C shares outstanding, 0.25% of which is intended as a fee for services provided to existing shareholders with the remainder used for distribution expenses. For Class C shares, some or the entire fee may be remitted to broker-dealers for distribution and/or shareholder account services. Class R3 shares have a distribution fee of 0.50% of average daily net assets and Class R4 shares have a distribution fee of 0.25% of average daily net assets. For Class R3 and R4 shares, some or the entire fee may be remitted to broker dealers for distribution and/or shareholder account services. The Fund’s 12b-1 fees are accrued daily and paid monthly.
For the six-month period ended April 30, 2012, total sales commissions paid to affiliated brokers/dealers of The Hartford for distributing the Fund's shares were $27. These commissions are in turn paid to sales representatives of the broker/dealers.
| f) | Other Related Party Transactions – Certain officers of the Fund are directors and/or officers of HIFSCO and/or The Hartford or its subsidiaries. For the six-month period ended April 30, 2012, a portion of the Fund’s chief compliance officer’s compensation was paid by all of the investment companies in the Hartford fund complex. The portion allocated to the Fund rounds to zero. Hartford Administrative Services Company (“HASCO”), an indirect wholly-owned subsidiary of The Hartford, provides transfer agent services to the Fund. HASCO has contractually agreed to reimburse any portion of the transfer agency fees over 0.30% of average daily net assets per fiscal year for each class. For providing such services, HASCO is compensated on a per account basis that varies by account type, except with respect to Class Y, for which it is compensated based on average daily net assets. The amount paid to HASCO and any related contractual reimbursement amounts, if applicable, can be found in the Statement of Operations. These fees are accrued daily and paid monthly. |
Administrative services fees are paid to HASCO for third-party recordkeeping services that are payable as a percentage of net assets in the amount of 0.20%, 0.15% and 0.10% for Classes R3, R4 and R5 shares, respectively. The total administrative services fees are shown on the Statement of Operations. These fees are accrued daily and paid monthly.
| g) | Payment from Affiliate – On November 8, 2006, the SEC issued an order setting forth the terms of a settlement reached with three subsidiaries of The Hartford that resolved the SEC’s Division of Enforcement’s investigation of aspects of The Hartford’s variable annuity and mutual fund operations related to directed brokerage and revenue sharing. The Hartford settled this matter without admitting or denying the findings of the SEC. |
| The Hartford Growth Fund |
| Notes to Financial Statements – (continued) |
| April 30, 2012 (Unaudited) |
| (000’s Omitted) |
The total return in the accompanying financial highlights includes a payment from affiliate. Had the payment from affiliate been excluded, the impact and total return for the periods listed below would have been as follows:
| | | Impact from Payment from
Affiliate for SEC Settlement for the
Year Ended
October 31, 2007 | | | Total Return Excluding Payment
from Affiliate for the Year Ended
October 31, 2007 | |
| Class A | | | 0.01 | % | | | 23.90 | % |
| Class B | | | 0.01 | | | | 23.00 | |
| Class C | | | 0.01 | | | | 23.08 | |
| Class I | | | 0.01 | | | | 24.35 | |
| Class L | | | 0.01 | | | | 24.20 | |
| Class Y | | | 0.01 | | | | 24.50 | |
As of April 30, 2012, affiliates of The Hartford had ownership of shares in the Fund as follows:
| | | Shares | | | Percentage
of Class | |
| Class R4 | | | 6 | | | | 3 | % |
| Class R5 | | | 7 | | | | 15 | |
| 8. | Investment Transactions: |
For the six-month period ended April 30, 2012, the Fund's aggregate purchases and sales of investment securities (excluding short-term investments) were as follows:
| | | Amount | |
| Cost of Purchases Excluding U.S. Government Obligations | | $ | 165,458 | |
| Sales Proceeds Excluding U.S. Government Obligations | | | 169,881 | |
9. Capital Share Transactions:
The following information is for the six-month period ended April 30, 2012, and the year ended October 31, 2011:
| | | For the Six-Month Period Ended April 30, 2012 | | | For the Year Ended October 31, 2011 | |
| | | Shares
Sold | | | Shares
Issued for
Reinvested
Dividends | | | Shares
Redeemed | | | Shares
Issued
from
Merger | | | Net Increase
(Decrease) of
Shares | | | Shares
Sold | | | Shares
Issued for
Reinvested
Dividends | | | Shares
Redeemed | | | Shares
Issued from
Merger | | | Net Increase
(Decrease) of
Shares | |
| Class A | | | | | | | | | | | | | | | | | | | | | | | | | | | | | | | | | | | | | | | | |
| Shares | | | 794 | | | | — | | | | (2,162 | ) | | | — | | | | (1,368 | ) | | | 2,922 | | | | — | | | | (6,522 | ) | | | 10,830 | | | | 7,230 | |
| Amount | | $ | 13,914 | | | $ | — | | | $ | (37,865 | ) | | $ | — | | | $ | (23,951 | ) | | $ | 52,714 | | | $ | — | | | $ | (115,672 | ) | | $ | 168,113 | | | $ | 105,155 | |
| Class B | | | | | | | | | | | | | | | | | | | | | | | | | | | | | | | | | | | | | | | | |
| Shares | | | 10 | | | | — | | | | (237 | ) | | | — | | | | (227 | ) | | | 52 | | | | — | | | | (399 | ) | | | — | | | | (347 | ) |
| Amount | | $ | 146 | | | $ | — | | | $ | (3,474 | ) | | $ | — | | | $ | (3,328 | ) | | $ | 761 | | | $ | — | | | $ | (5,835 | ) | | $ | — | | | $ | (5,074 | ) |
| Class C | | | | | | | | | | | | | | | | | | | | | | | | | | | | | | | | | | | | | | | | |
| Shares | | | 100 | | | | — | | | | (323 | ) | | | — | | | | (223 | ) | | | 285 | | | | — | | | | (721 | ) | | | — | | | | (436 | ) |
| Amount | | $ | 1,484 | | | $ | — | | | $ | (4,709 | ) | | $ | — | | | $ | (3,225 | ) | | $ | 4,183 | | | $ | — | | | $ | (10,598 | ) | | $ | — | | | $ | (6,415 | ) |
| Class I | | | | | | | | | | | | | | | | | | | | | | | | | | | | | | | | | | | | | | | | |
| Shares | | | 2,439 | | | | — | | | | (877 | ) | | | — | | | | 1,562 | | | | 5,804 | | | | — | | | | (1,371 | ) | | | — | | | | 4,433 | |
| Amount | | $ | 43,321 | | | $ | — | | | $ | (15,823 | ) | | $ | — | | | $ | 27,498 | | | $ | 103,384 | | | $ | — | | | $ | (24,268 | ) | | $ | — | | | $ | 79,116 | |
| Class L | | | | | | | | | | | | | | | | | | | | | | | | | | | | | | | | | | | | | | | | |
| Shares | | | — | | | | — | | | | — | | | | — | | | | — | | | | 172 | | | | — | | | | (1,051 | ) | | | (10,593 | ) | | | (11,472 | ) |
| Amount | | $ | — | | | $ | — | | | $ | — | | | $ | — | | | $ | — | | | $ | 3,138 | | | $ | — | | | $ | (19,363 | ) | | $ | (168,113 | ) | | $ | (184,338 | ) |
| Class R3 | | | | | | | | | | | | | | | | | | | | | | | | | | | | | | | | | | | | | | | | |
| Shares | | | 10 | | | | — | | | | (3 | ) | | | — | | | | 7 | | | | 9 | | | | — | | | | (6 | ) | | | — | | | | 3 | |
| Amount | | $ | 183 | | | $ | — | | | $ | (61 | ) | | $ | — | | | $ | 122 | | | $ | 164 | | | $ | — | | | $ | (103 | ) | | $ | — | | | $ | 61 | |
| Class R4 | | | | | | | | | | | | | | | | | | | | | | | | | | | | | | | | | | | | | | | | |
| Shares | | | 13 | | | | — | | | | (29 | ) | | | — | | | | (16 | ) | | | 47 | | | | — | | | | (34 | ) | | | — | | | | 13 | |
| Amount | | $ | 227 | | | $ | — | | | $ | (517 | ) | | $ | — | | | $ | (290 | ) | | $ | 857 | | | $ | — | | | $ | (627 | ) | | $ | — | | | $ | 230 | |
| Class R5 | | | | | | | | | | | | | | | | | | | | | | | | | | | | | | | | | | | | | | | | |
| Shares | | | 10 | | | | — | | | | (1 | ) | | | — | | | | 9 | | | | 32 | | �� | | — | | | | (1 | ) | | | — | | | | 31 | |
| Amount | | $ | 186 | | | $ | — | | | $ | (25 | ) | | $ | — | | | $ | 161 | | | $ | 555 | | | $ | — | | | $ | (15 | ) | | $ | — | | | $ | 540 | |
| Class Y | | | | | | | | | | | | | | | | | | | | | | | | | | | | | | | | | | | | | | | | |
| Shares | | | 802 | | | | — | | | | (1,073 | ) | | | — | | | | (271 | ) | | | 1,580 | | | | — | | | | (589 | ) | | | — | | | | 991 | |
| Amount | | $ | 14,785 | | | $ | — | | | $ | (19,704 | ) | | $ | — | | | $ | (4,919 | ) | | $ | 28,941 | | | $ | — | | | $ | (10,888 | ) | | $ | — | | | $ | 18,053 | |
| Total | | | | | | | | | | | | | | | | | | | | | | | | | | | | | | | | | | | | | | | | |
| Shares | | | 4,178 | | | | — | | | | (4,705 | ) | | | — | | | | (527 | ) | | | 10,903 | | | | — | | | | (10,694 | ) | | | 237 | | | | 446 | |
| Amount | | $ | 74,246 | | | $ | — | | | $ | (82,178 | ) | | $ | — | | | $ | (7,932 | ) | | $ | 194,697 | | | $ | — | | | $ | (187,369 | ) | | $ | — | | | $ | 7,328 | |
The following reflects the conversion of Class B shares into Class A shares (reflected as Class A shares sold) for the six-month period ended April 30, 2012, and the year ended October 31, 2011:
| | | Shares | | | Dollars | |
| For the Six-Month Period Ended April 30, 2012 | | | 78 | | | $ | 1,382 | |
| For the Year Ended October 31, 2011 | | | 88 | | | $ | 1,544 | |
The Fund is one of several Hartford funds that participate in a $500 million committed revolving line of credit facility. The facility is to be used for temporary or emergency purposes. Under the arrangement, the funds are required to own securities having a market value in excess of 300% of the total bank borrowings. The interest rate on borrowings varies depending on the nature of the loan. The facility also requires a fee to be paid based on the amount of the commitment. This commitment fee is allocated to all of the funds participating in the line of credit based on the average net assets of the funds. During the six-month period ended April 30, 2012, the Fund did not have any borrowings under this facility.
| The Hartford Growth Fund |
| Notes to Financial Statements – (continued) |
| April 30, 2012 (Unaudited) |
| (000’s Omitted) |
At its May 3, 2011, meeting, the Board of Directors of The Hartford Mutual Funds II, Inc. approved the reclassification of Class L shares into Class A shares of the Fund.
Effective with the close of business on August 5, 2011, Class L was merged into Class A. The merger was accomplished by a tax-free exchange as detailed below:
| | | Class A | | | Class L | |
| Shares exchanged | | | N/A | | | | 10,593 | |
| Shares issued - to Class L shareholders | | | 10,830 | | | | N/A | |
| Net assets immediately before merger | | $ | 229,124 | | | $ | 179,517 | |
| Net assets immediately after merger | | $ | 408,641 | | | | N/A | |
| 12. | Industry Classifications: |
Other than the industry classifications “Other Investment Pools and Funds” and “Exchange Traded Funds,” equity industry classifications used in this report are the Global Industry Classification Standard, which was developed by and is the exclusive property and service mark of MSCI, Inc. and Standard & Poor’s.
| 13. | Pending Legal Proceedings: |
On February 25, 2011, Jennifer L. Kasilag, Louis Mellinger, Judith M. Menendez, Jacqueline M. Robinson, and Linda A. Russell filed a derivative lawsuit against HIFSCO on behalf of six funds: The Hartford Global Health Fund (now known as The Hartford Healthcare Fund), The Hartford Conservative Allocation Fund, The Hartford Growth Opportunities Fund, The Hartford Inflation Plus Fund, The Hartford Advisers Fund (now known as The Hartford Balanced Fund) and The Hartford Money Market Fund. The lawsuit, which was filed in the United States District Court for the District of New Jersey, seeks recovery under Section 36(b) of the 1940 Act for the alleged overpayment of investment management and 12b-1 distribution fees to HIFSCO. The plaintiffs seek recovery of the alleged overpayments or, alternatively, rescission of the contracts and restitution of all fees paid, together with lost earnings. On November 14, 2011, the plaintiffs filed an amended complaint, which dropped The Hartford Money Market Fund and added The Hartford Capital Appreciation Fund as a plaintiff. The Hartford intends to vigorously defend the action.
No accrual for litigation relating to this matter has been recorded in the financial statements of the Fund because the Fund is not party to the suit.
Under the Company’s organizational documents, the Company shall indemnify its officers and directors to the full extent required or permitted under Maryland General Corporation Law and the federal securities laws. In addition, the Company, on behalf of the Fund, may enter into contracts that contain a variety of indemnifications. The Company’s maximum exposure under these arrangements is unknown. However, as of the date of these financial statements, the Company has not had prior claims or losses pursuant to these contracts and expects the risk of loss to be remote.
[This page intentionally left blank.]
| The Hartford Growth Fund |
| Financial Highlights |
| - Selected Per-Share Data (A) - |
| Class | | Net Asset
Value at
Beginning of
Period | | | Net Investment
Income (Loss) | | | Payments from
(to) Affiliate | | | Net Realized
and Unrealized
Gain (Loss) on
Investments | | | Total from
Investment
Operations | | | Dividends from
Net Investment
Income | | | Distributions
from Realized
Capital Gains | | | Distributions
from Capital | | | Total
Distributions | | | Net Increase
(Decrease) in
Net Asset
Value | | | Net Asset
Value at End
of Period | |
| | | | | | | | | | | | | | | | | | | | | | | | | | | | | | | | | | |
| For the Six-Month Period Ended April 30, 2012 (Unaudited) |
| A | | $ | 17.01 | | | $ | (0.04 | ) | | $ | – | | | $ | 1.94 | | | $ | 1.90 | | | $ | – | | | $ | – | | | $ | – | | | $ | – | | | $ | 1.90 | | | $ | 18.91 | |
| B | | | 14.14 | | | | (0.10 | ) | | | – | | | | 1.62 | | | | 1.52 | | | | – | | | | – | | | | – | | | | – | | | | 1.52 | | | | 15.66 | |
| C | | | 14.16 | | | | (0.09 | ) | | | – | | | | 1.62 | | | | 1.53 | | | | – | | | | – | | | | – | | | | – | | | | 1.53 | | | | 15.69 | |
| I | | | 17.26 | | | | (0.02 | ) | | | – | | | | 1.97 | | | | 1.95 | | | | – | | | | – | | | | – | | | | – | | | | 1.95 | | | | 19.21 | |
| R3 | | | 17.26 | | | | (0.06 | ) | | | – | | | | 1.96 | | | | 1.90 | | | | – | | | | – | | | | – | | | | – | | | | 1.90 | | | | 19.16 | |
| R4 | | | 17.51 | | | | (0.04 | ) | | | – | | | | 2.01 | | | | 1.97 | | | | – | | | | – | | | | – | | | | – | | | | 1.97 | | | | 19.48 | |
| R5 | | | 17.65 | | | | (0.01 | ) | | | – | | | | 2.02 | | | | 2.01 | | | | – | | | | – | | | | – | | | | – | | | | 2.01 | | | | 19.66 | |
| Y | | | 17.82 | | | | – | | | | – | | | | 2.03 | | | | 2.03 | | | | – | | | | – | | | | – | | | | – | | | | 2.03 | | | | 19.85 | |
| | | | | | | | | | | | | | | | | | | | | | | | | | | | | | | | | | | | | | | | | | | | | |
| For the Year Ended October 31, 2011 |
| A(G) | | | 16.14 | | | | 0.03 | | | | – | | | | 0.84 | | | | 0.87 | | | | – | | | | – | | | | – | | | | – | | | | 0.87 | | | | 17.01 | |
| B | | | 13.53 | | | | (0.18 | ) | | | – | | | | 0.79 | | | | 0.61 | | | | – | | | | – | | | | – | | | | – | | | | 0.61 | | | | 14.14 | |
| C | | | 13.53 | | | | (0.15 | ) | | | – | | | | 0.78 | | | | 0.63 | | | | – | | | | – | | | | – | | | | – | | | | 0.63 | | | | 14.16 | |
| I | | | 16.33 | | | | – | | | | – | | | | 0.93 | | | | 0.93 | | | | – | | | | – | | | | – | | | | – | | | | 0.93 | | | | 17.26 | |
| R3 | | | 16.42 | | | | (0.10 | ) | | | – | | | | 0.94 | | | | 0.84 | | | | – | | | | – | | | | – | | | | – | | | | 0.84 | | | | 17.26 | |
| R4 | | | 16.61 | | | | (0.04 | ) | | | – | | | | 0.94 | | | | 0.90 | | | | – | | | | – | | | | – | | | | – | | | | 0.90 | | | | 17.51 | |
| R5 | | | 16.69 | | | | – | | | | – | | | | 0.96 | | | | 0.96 | | | | – | | | | – | | | | – | | | | – | | | | 0.96 | | | | 17.65 | |
| Y | | | 16.83 | | | | 0.03 | | | | – | | | | 0.96 | | | | 0.99 | | | | – | | | | – | | | | – | | | | – | | | | 0.99 | | | | 17.82 | |
| | | | | | | | | | | | | | | | | | | | | | | | | | | | | | | | | | | | | | | | | | | | | |
| For the Year Ended October 31, 2010 |
| A | | | 13.57 | | | | (0.05 | ) | | | – | | | | 2.62 | | | | 2.57 | | | | – | | | | – | | | | – | | | | – | | | | 2.57 | | | | 16.14 | |
| B | | | 11.46 | | | | (0.16 | ) | | | – | | | | 2.23 | | | | 2.07 | | | | – | | | | – | | | | – | | | | – | | | | 2.07 | | | | 13.53 | |
| C | | | 11.46 | | | | (0.15 | ) | | | – | | | | 2.22 | | | | 2.07 | | | | – | | | | – | | | | – | | | | – | | | | 2.07 | | | | 13.53 | |
| I | | | 13.73 | | | | 0.01 | | | | – | | | | 2.65 | | | | 2.66 | | | | (0.06 | ) | | | – | | | | – | | | | (0.06 | ) | | | 2.60 | | | | 16.33 | |
| R3 | | | 13.84 | | | | (0.07 | ) | | | – | | | | 2.66 | | | | 2.59 | | | | (0.01 | ) | | | – | | | | – | | | | (0.01 | ) | | | 2.58 | | | | 16.42 | |
| R4 | | | 13.98 | | | | (0.03 | ) | | | – | | | | 2.69 | | | | 2.66 | | | | (0.03 | ) | | | – | | | | – | | | | (0.03 | ) | | | 2.63 | | | | 16.61 | |
| R5 | | | 14.10 | | | | 0.01 | | | | – | | | | 2.64 | | | | 2.65 | | | | (0.06 | ) | | | – | | | | – | | | | (0.06 | ) | | | 2.59 | | | | 16.69 | |
| Y | | | 14.15 | | | | 0.03 | | | | – | | | | 2.72 | | | | 2.75 | | | | (0.07 | ) | | | – | | | | – | | | | (0.07 | ) | | | 2.68 | | | | 16.83 | |
| | | | | | | | | | | | | | | | | | | | | | | | | | | | | | | | | | | | | | | | | | | | | |
| For the Year Ended October 31, 2009 |
| A | | | 11.59 | | | | 0.02 | | | | – | | | | 1.96 | | | | 1.98 | | | | – | | | | – | | | | – | | | | – | | | | 1.98 | | | | 13.57 | |
| B | | | 9.83 | | | | (0.03 | ) | | | – | | | | 1.66 | | | | 1.63 | | | | – | | | | – | | | | – | | | | – | | | | 1.63 | | | | 11.46 | |
| C | | | 9.86 | | | | (0.07 | ) | | | – | | | | 1.67 | | | | 1.60 | | | | – | | | | – | | | | – | | | | – | | | | 1.60 | | | | 11.46 | |
| I | | | 11.69 | | | | 0.05 | | | | – | | | | 1.99 | | | | 2.04 | | | | – | | | | – | | | | – | | | | – | | | | 2.04 | | | | 13.73 | |
| R3 | | | 11.86 | | | | (0.02 | ) | | | – | | | | 2.00 | | | | 1.98 | | | | – | | | | – | | | | – | | | | – | | | | 1.98 | | | | 13.84 | |
| R4 | | | 11.94 | | | | 0.01 | | | | – | | | | 2.03 | | | | 2.04 | | | | – | | | | – | | | | – | | | | – | | | | 2.04 | | | | 13.98 | |
| R5 | | | 12.00 | | | | 0.04 | | | | – | | | | 2.06 | | | | 2.10 | | | | – | | | | – | | | | – | | | | – | | | | 2.10 | | | | 14.10 | |
| Y | | | 12.03 | | | | 0.08 | | | | – | | | | 2.04 | | | | 2.12 | | | | – | | | | – | | | | – | | | | – | | | | 2.12 | | | | 14.15 | |
| | | | | | | | | | | | | | | | | | | | | | | | | | | | | | | | | | | | | | | | | | | | | |
| For the Year Ended October 31, 2008 (H) |
| A | | | 21.25 | | | | (0.05 | ) | | | – | | | | (8.03 | ) | | | (8.08 | ) | | | – | | | | (1.58 | ) | | | – | | | | (1.58 | ) | | | (9.66 | ) | | | 11.59 | |
| B | | | 18.39 | | | | (0.13 | ) | | | – | | | | (6.85 | ) | | | (6.98 | ) | | | – | | | | (1.58 | ) | | | – | | | | (1.58 | ) | | | (8.56 | ) | | | 9.83 | |
| C | | | 18.45 | | | | (0.14 | ) | | | – | | | | (6.87 | ) | | | (7.01 | ) | | | – | | | | (1.58 | ) | | | – | | | | (1.58 | ) | | | (8.59 | ) | | | 9.86 | |
| I | | | 21.34 | | | | 0.02 | | | | – | | | | (8.09 | ) | | | (8.07 | ) | | | – | | | | (1.58 | ) | | | – | | | | (1.58 | ) | | | (9.65 | ) | | | 11.69 | |
| R3 | | | 21.76 | | | | (0.08 | ) | | | – | | | | (8.24 | ) | | | (8.32 | ) | | | – | | | | (1.58 | ) | | | – | | | | (1.58 | ) | | | (9.90 | ) | | | 11.86 | |
| R4 | | | 21.82 | | | | (0.03 | ) | | | – | | | | (8.27 | ) | | | (8.30 | ) | | | – | | | | (1.58 | ) | | | – | | | | (1.58 | ) | | | (9.88 | ) | | | 11.94 | |
| R5 | | | 21.87 | | | | 0.02 | | | | – | | | | (8.31 | ) | | | (8.29 | ) | | | – | | | | (1.58 | ) | | | – | | | | (1.58 | ) | | | (9.87 | ) | | | 12.00 | |
| Y | | | 21.90 | | | | 0.04 | | | | – | | | | (8.33 | ) | | | (8.29 | ) | | | – | | | | (1.58 | ) | | | – | | | | (1.58 | ) | | | (9.87 | ) | | | 12.03 | |
| | | | | | | | | | | | | | | | | | | | | | | | | | | | | | | | | | | | | | | | | | | | | |
| For the Year Ended October 31, 2007 |
| A | | | 18.45 | | | | (0.07 | ) | | | – | | | | 4.17 | | | | 4.10 | | | | – | | | | (1.30 | ) | | | – | | | | (1.30 | ) | | | 2.80 | | | | 21.25 | |
| B | | | 16.25 | | | | (0.21 | ) | | | – | | | | 3.65 | | | | 3.44 | | | | – | | | | (1.30 | ) | | | – | | | | (1.30 | ) | | | 2.14 | | | | 18.39 | |
| C | | | 16.29 | | | | (0.19 | ) | | | – | | | | 3.65 | | | | 3.46 | | | | – | | | | (1.30 | ) | | | – | | | | (1.30 | ) | | | 2.16 | | | | 18.45 | |
| I | | | 18.46 | | | | – | | | | – | | | | 4.18 | | | | 4.18 | | | | – | | | | (1.30 | ) | | | – | | | | (1.30 | ) | | | 2.88 | | | | 21.34 | |
| R3(J) | | | 18.15 | | | | (0.08 | ) | | | – | | | | 3.69 | | | | 3.61 | | | | – | | | | – | | | | – | | | | – | | | | 3.61 | | | | 21.76 | |
| R4(J) | | | 18.15 | | | | (0.01 | ) | | | – | | | | 3.68 | | | | 3.67 | | | | – | | | | – | | | | – | | | | – | | | | 3.67 | | | | 21.82 | |
| R5(J) | | | 18.15 | | | | – | | | | – | | | | 3.72 | | | | 3.72 | | | | – | | | | – | | | | – | | | | – | | | | 3.72 | | | | 21.87 | |
| Y | | | 18.89 | | | | 0.02 | | | | – | | | | 4.29 | | | | 4.31 | | | | – | | | | (1.30 | ) | | | – | | | | (1.30 | ) | | | 3.01 | | | | 21.90 | |
| - Ratios and Supplemental Data - |
| Total Return(B) | | | Net Assets at End of
Period (000's) | | | Ratio of Expenses to Average Net
Assets Before Waivers and
Reimbursements and Including
Expenses not Subject to Cap(C) | | | Ratio of Expenses to Average Net
Assets After Waivers and
Reimbursements and Including
Expenses not Subject to Cap(C) | | | Ratio of Expenses to Average Net
Assets After Waivers and
Reimbursements and Excluding
Expenses not Subject to Cap(C) | | | Ratio of Net Investment
Income to Average Net
Assets | | | Portfolio
Turnover
Rate(D) | |
| | | | | | | | | | | | | | | | | | | | |
| | 11.17 | %(E) | | $ | 424,019 | | | | 1.28 | %(F) | | | 1.25 | %(F) | | | 1.25 | %(F) | | | (0.48 | )%(F) | | | 23 | % |
| | 10.75 | (E) | | | 11,308 | | | | 2.26 | (F) | | | 2.00 | (F) | | | 2.00 | (F) | | | (1.22 | )(F) | | | – | |
| | 10.81 | (E) | | | 40,128 | | | | 1.96 | (F) | | | 1.96 | (F) | | | 1.96 | (F) | | | (1.19 | )(F) | | | – | |
| | 11.30 | (E) | | | 185,228 | | | | 0.98 | (F) | | | 0.98 | (F) | | | 0.98 | (F) | | | (0.22 | )(F) | | | – | |
| | 11.01 | (E) | | | 469 | | | | 1.64 | (F) | | | 1.50 | (F) | | | 1.50 | (F) | | | (0.76 | )(F) | | | – | |
| | 11.25 | (E) | | | 4,048 | | | | 1.19 | (F) | | | 1.19 | (F) | | | 1.19 | (F) | | | (0.42 | )(F) | | | – | |
| | 11.39 | (E) | | | 946 | | | | 0.90 | (F) | | | 0.90 | (F) | | | 0.90 | (F) | | | (0.14 | )(F) | | | – | |
| | 11.39 | (E) | | | 133,002 | | | | 0.79 | (F) | | | 0.79 | (F) | | | 0.79 | (F) | | | (0.02 | )(F) | | | – | |
| | | | | | | | | | | | | | | | | | | | | | | | | | | |
| | | | | | | | | | | | | | | | | | | | | | | | | | | |
| | 5.39 | | | | 404,630 | | | | 1.26 | | | | 1.25 | | | | 1.25 | | | | 0.22 | | | | 47 | |
| | 4.51 | | | | 13,411 | | | | 2.22 | | | | 2.05 | | | | 2.05 | | | | (1.03 | ) | | | – | |
| | 4.66 | | | | 39,365 | | | | 1.95 | | | | 1.95 | | | | 1.95 | | | | (0.96 | ) | | | – | |
| | 5.70 | | | | 139,421 | | | | 0.95 | | | | 0.95 | | | | 0.95 | | | | (0.03 | ) | | | – | |
| | 5.12 | | | | 298 | | | | 1.61 | | | | 1.50 | | | | 1.50 | | | | (0.55 | ) | | | – | |
| | 5.42 | | | | 3,918 | | | | 1.19 | | | | 1.19 | | | | 1.19 | | | | (0.21 | ) | | | – | |
| | 5.75 | | | | 689 | | | | 0.91 | | | | 0.90 | | | | 0.90 | | | | (0.03 | ) | | | – | |
| | 5.88 | | | | 124,174 | | | | 0.79 | | | | 0.79 | | | | 0.79 | | | | 0.18 | | | | – | |
| | | | | | | | | | | | | | | | | | | | | | | | | | | |
| | | | | | | | | | | | | | | | | | | | | | | | | | | |
| | 18.94 | | | | 267,340 | | | | 1.29 | | | | 1.29 | | | | 1.29 | | | | (0.32 | ) | | | 57 | |
| | 18.06 | | | | 17,522 | | | | 2.28 | | | | 2.05 | | | | 2.05 | | | | (1.08 | ) | | | – | |
| | 18.06 | | | | 43,521 | | | | 1.99 | | | | 1.99 | | | | 1.99 | | | | (1.02 | ) | | | – | |
| | 19.42 | | | | 59,539 | | | | 0.90 | | | | 0.90 | | | | 0.90 | | | | 0.06 | | | | – | |
| | 18.69 | | | | 233 | | | | 1.62 | | | | 1.53 | | | | 1.53 | | | | (0.58 | ) | | | – | |
| | 19.03 | | | | 3,507 | | | | 1.20 | | | | 1.20 | | | | 1.20 | | | | (0.24 | ) | | | – | |
| | 18.83 | | | | 134 | | | | 0.94 | | | | 0.93 | | | | 0.93 | | | | 0.03 | | | | – | |
| | 19.50 | | | | 100,614 | | | | 0.81 | | | | 0.81 | | | | 0.81 | | | | 0.16 | | | | – | |
| | | | | | | | | | | | | | | | | | | | | | | | | | | |
| | | | | | | | | | | | | | | | | | | | | | | | | | | |
| | 17.08 | | | | 260,833 | | | | 1.44 | | | | 1.24 | | | | 1.24 | | | | 0.15 | | | | 94 | |
| | 16.58 | | | | 19,319 | | | | 2.49 | | | | 1.69 | | | | 1.69 | | | | (0.30 | ) | | | – | |
| | 16.23 | | | | 44,604 | | | | 2.09 | | | | 2.05 | | | | 2.05 | | | | (0.67 | ) | | | – | |
| | 17.45 | | | | 54,433 | | | | 0.94 | | | | 0.94 | | | | 0.94 | | | | 0.43 | | | | – | |
| | 16.69 | | | | 163 | | | | 1.73 | | | | 1.55 | | | | 1.55 | | | | (0.25 | ) | | | – | |
| | 17.09 | | | | 2,541 | | | | 1.23 | | | | 1.23 | | | | 1.23 | | | | 0.12 | | | | – | |
| | 17.50 | | | | 91 | | | | 0.96 | | | | 0.95 | | | | 0.95 | | | | 0.39 | | | | – | |
| | 17.62 | | | | 99,987 | | | | 0.84 | | | | 0.84 | | | | 0.84 | | | | 0.56 | | | | – | |
| | | | | | | | | | | | | | | | | | | | | | | | | | | |
| | | | | | | | | | | | | | | | | | | | | | | | | | | |
| | (40.77 | ) | | | 292,129 | | | | 1.27 | | | | 1.27 | | | | 1.27 | | | | (0.27 | ) | | | 106 | |
| | (41.16 | ) | | | 19,936 | | | | 2.24 | | | | 1.91 | | | | 1.91 | | | | (0.91 | ) | | | – | |
| | (41.19 | ) | | | 46,757 | | | | 1.97 | | | | 1.97 | | | | 1.97 | | | | (0.96 | ) | | | – | |
| | (40.53 | ) | | | 48,174 | | | | 0.89 | | | | 0.89 | | | | 0.89 | | | | 0.14 | | | | – | |
| | (40.93 | ) | | | 53 | | | | 1.71 | | | | 1.55 | | | | 1.55 | | | | (0.51 | ) | | | – | |
| | (40.70 | ) | | | 1,394 | | | | 1.20 | | | | 1.20 | | | | 1.20 | | | | (0.17 | ) | | | – | |
| | (40.56 | ) | | | 51 | | | | 0.92 | | | | 0.92 | | | | 0.92 | | | | 0.09 | | | | – | |
| | (40.50 | ) | | | 116,109 | | | | 0.80 | | | | 0.80 | | | | 0.80 | | | | 0.21 | | | | – | |
| | | | | | | | | | | | | | | | | | | | | | | | | | | |
| | | | | | | | | | | | | | | | | | | | | | | | | | | |
| | 23.92 | (I) | | | 627,677 | | | | 1.27 | | | | 1.27 | | | | 1.27 | | | | (0.35 | ) | | | 89 | |
| | 23.02 | (I) | | | 41,359 | | | | 2.22 | | | | 2.09 | | | | 2.09 | | | | (1.17 | ) | | | – | |
| | 23.10 | (I) | | | 85,303 | | | | 1.98 | | | | 1.98 | | | | 1.98 | | | | (1.06 | ) | | | – | |
| | 24.37 | (I) | | | 35,626 | | | | 0.91 | | | | 0.91 | | | | 0.91 | | | | 0.02 | | | | – | |
| | 19.89 | (E) | | | 16 | | | | 1.56 | (F) | | | 1.56 | (F) | | | 1.56 | (F) | | | (0.67 | )(F) | | | – | |
| | 20.22 | (E) | | | 282 | | | | 1.17 | (F) | | | 1.17 | (F) | | | 1.17 | (F) | | | (0.28 | )(F) | | | – | |
| | 20.50 | (E) | | | 63 | | | | 0.90 | (F) | | | 0.90 | (F) | | | 0.90 | (F) | | | (0.01 | )(F) | | | – | |
| | 24.52 | (I) | | | 103,251 | | | | 0.81 | | | | 0.81 | | | | 0.81 | | | | 0.10 | | | | – | |
| The Hartford Growth Fund |
| Financial Highlights – (continued) |
| (A) | Information presented relates to a share outstanding throughout the indicated period. |
| (B) | Assumes initial investment at net asset value at the beginning of each period, reinvestment of all distributions, the complete redemption of the investment at net asset value at the end of each period and no sales charge. Total return would be reduced if sales charges were taken into account. |
| (C) | Ratios do not include fees paid indirectly (See Expenses in the accompanying Notes to Financial Statements). |
| (D) | Portfolio turnover rate is calculated on the basis of the Fund as a whole without distinguishing between the classes of shares issued. |
| (G) | Class L was merged into Class A on August 5, 2011 (See Class Merger in accompanying Notes to Financial Statements). |
| (H) | Per share amounts have been calculated using average shares outstanding method. |
| (I) | Total return without the inclusion of the Payments from (to) Affiliate, can be found in Expenses in the accompanying Notes to Financial Statements. |
| (J) | Commenced operations on December 22, 2006. |
| The Hartford Growth Fund |
| Directors and Officers (Unaudited) |
The Board of Directors of the Company appoints officers who are responsible for the day-to-day operations of the Fund and who execute policies formulated by the Directors. Each director serves until his or her death, resignation, or retirement or until the next annual meeting of shareholders is held or until his or her successor is elected and qualifies.
Directors and officers who are employed by or who have a financial interest in The Hartford are considered “interested” persons of the Fund pursuant to the 1940 Act. Each officer and two of the Company’s directors, as noted in the chart below, are “interested” persons of the Fund. Each director serves as a director for The Hartford Mutual Funds, Inc., The Hartford Mutual Funds II, Inc., Hartford Series Fund, Inc., and Hartford HLS Series Fund II, Inc., and as a trustee for The Hartford Alternative Strategies Fund, which, as of April 30, 2012, collectively consist of 91 funds. Correspondence may be sent to directors and officers c/o Hartford Mutual Funds, P.O. Box 2999, Hartford, Connecticut 06104-2999, except that correspondence to Mr. Annoni, Mr. Dressen, and Ms. Fagely may be sent to 500 Bielenberg Drive, Woodbury, Minnesota 55125.
The table below sets forth, for each director and officer, his or her name, year of birth, current position with the Company and date first elected or appointed to The Hartford Mutual Funds, Inc. (“MF”) and The Hartford Mutual Funds II, Inc. (“MF2”), principal occupation, and, for directors, other directorships held. The Fund’s statement of additional information contains further information on the directors and is available free of charge by calling 1-888-843-7824 or writing to Hartford Mutual Funds, P.O. Box 64387, St. Paul, MN 55164-0387.
Information on the aggregate remuneration paid to the directors of the Company can be found in the Statement of Operations herein. The Fund pays to The Hartford a portion of the Chief Compliance Officer’s compensation, but does not pay salaries or compensation to any of its other officers or directors who are employed by The Hartford.
Non-Interested Directors
Lynn S. Birdsong (1946) Director since 2003, Co-Chairman of the Investment Committee
Mr. Birdsong is a private investor. Mr. Birdsong currently serves as a Director of the Sovereign High Yield Investment Company (April 2010 to current). Mr. Birdsong currently serves as an Independent Director of Nomura Partners Funds, Inc. (formerly, The Japan Fund) (March 2003 to current). From 1979 to 2002, Mr. Birdsong was a managing director of Zurich Scudder Investments, an investment management firm. During his employment with Scudder, Mr. Birdsong was an Interested Director of The Japan Fund. Since 1981, Mr. Birdsong has been a partner in Birdsong Company, an advertising specialty firm.
Robert M. Gavin, Jr. (1940) Director since 2002 (MF) and 1986 (MF2), Chairman of the Board since 2004
Dr. Gavin is an educational consultant. Prior to September 1, 2001, he was President of Cranbrook Education Community and prior to July 1996, he was President of Macalester College, St. Paul, Minnesota.
Duane E. Hill (1945) Director since 2001 (MF) and 2002 (MF2), Chairman of the Nominating Committee
Mr. Hill is Partner of TSG Ventures L.P., a private equity investment company. Mr. Hill is a former partner of TSG Capital Group, a private equity investment firm that served as sponsor and lead investor in leveraged buyouts of middle market companies.
Sandra S. Jaffee (1941) Director since 2005
Ms. Jaffee is the founder and Chief Executive Officer of a private company, Homeworks Concierge, LLC, which provides residential property management services in Westchester County, New York (January 2012 to present). Ms. Jaffee served as Chairman (2008 to 2009) and Chief Executive Officer of Fortent (formerly Searchspace Group), a leading provider of compliance/regulatory technology to financial institutions from August 2005 to August 2009. Ms. Jaffe currently serves as a member of the Board of Directors of Broadridge Financial Solutions as well as a Trustee of Muhlenberg College.
William P. Johnston (1944) Director since 2005, Chairman of the Compliance Committee
In June 2006, Mr. Johnston was appointed as Senior Advisor to The Carlyle Group, a global private equity investment firm. In August 2007, Mr. Johnston was elected to the Board of Directors of LifeCare Holdings, Inc. In February 2008, Mr. Johnston was elected to the Board of Directors of HCR-ManorCare, Inc. In May 2006, Mr. Johnston was elected to the Supervisory Board of Fresenius Medical Care AG & Co. KGaA, after its acquisition of Renal Care Group, Inc. in March 2006.
Phillip O. Peterson (1944) Director since 2002, (MF) and 2000 (MF2), Chairman of the Audit Committee
Mr. Peterson is a mutual fund industry consultant. He was a partner of KPMG LLP (an accounting firm) until July 1999. Mr. Peterson joined William Blair Funds in February 2007 as a member of the Board of Trustees. Mr. Peterson also joined the Board of Trustees of Symetra Variable Mutual Funds Trust as a trustee in February 2012.
| The Hartford Growth Fund |
| Directors and Officers (Unaudited) – (continued) |
Lemma W. Senbet (1946) Director since 2005
Dr. Senbet is the William E. Mayer Chair Professor of Finance and Director, Center for Financial Policy, at the University of Maryland, Robert H. Smith School of Business. He was chair of the Finance Department from 1998 to 2006. Previously he was a chaired professor of finance at the University of Wisconsin-Madison. Also, he was director of the Fortis Funds from March 2000 to July 2002. Dr. Senbet served the finance profession in various capacities, including as director of the American Finance Association and President of the Western Finance Association. In 2006, Dr. Senbet was inducted Fellow of Financial Management Association International for his career-long distinguished scholarship and professional service.
Interested Directors and Officers
David N. Levenson (1966) Director since 2010
Mr. Levenson currently serves as President of The Hartford’s Wealth Management business. He was appointed to this role in July 2010. Previously, Mr. Levenson served as Executive Vice President of Legacy Holdings for The Hartford from June 2009 to July 2010. From 2006 to 2009, Mr. Levenson was with Hartford Life Insurance K.K. where he served as President and Chief Executive Officer from 2007 to 2009. He served as Managing Director of Hartford Investment Management Company from 2005 to 2006. Additionally, Mr. Levenson serves as Executive Vice President of The Hartford and as President, Director and Chief Executive Officer of Hartford Life Insurance Company (“HLIC”) and Hartford Life, Inc. (“HL Inc.”).
Lowndes A. Smith (1939) Director since 1996, (MF) and 2002 (MF2), Co-Chairman of the Investment Committee
Mr. Smith served as Vice Chairman of The Hartford from February 1997 to January 2002, as President and Chief Executive Officer of HL Inc. from February 1997 to January 2002, and as President and Chief Operating Officer of The Hartford Life Insurance Companies from January 1989 to January 2002. Mr. Smith serves as a Director of White Mountains Insurance Group, Ltd., One Beacon Insurance and Symetra Financial and as Managing Director of Whittington Gray Associates.
Other Officers
James E. Davey (1964) President and Chief Executive Officer since 2010
Mr. Davey serves as Executive Vice President of HLIC. Additionally, Mr. Davey serves as President, Chief Executive Officer and Manager of HIFSCO and President, Chief Executive Officer and Manager of HL Investment Advisors, LLC (“HL Advisors”). Mr. Davey joined The Hartford in 2002.
Mark A. Annoni (1964) Vice President, Controller and Treasurer since 2012*
Mr. Annoni serves as the Assistant Vice President and Director of Investment Finance (February 2004 to present). Mr. Annoni joined The Hartford in April 2001 as part of The Hartford’s acquisition of Fortis Financial Group. Prior to joining The Hartford, Mr. Annoni served as Manager of Mutual Fund Accounting at Fortis Financial Group (July 1997 to April 2001).
* Mr. Annoni was named Vice President, Controller and Treasurer on May 8, 2012.
Michael R. Dressen (1963) AML Compliance Officer since 2011
Mr. Dressen currently serves as Assistant Vice President of HLIC. He also serves as Chief Compliance Officer and AML Compliance Officer of Hartford Administrative Services Company (“HASCO”) and as Assistant Secretary and Compliance Officer of HIFSCO. Mr Dressen joined The Hartford in 2005 from State Farm Insurance Companies where he held various positions related to mutual funds, variable products, and property casualty insurance.
Tamara L. Fagely (1958) Vice President since 2002 (MF) and 1993 (MF2)
Ms. Fagely has been a Vice President of HASCO since 1998 and Chief Financial Officer since 2006. Currently Ms. Fagely is a Vice President of HLIC. She served as Assistant Vice President of HLIC from December 2001 through March 2005. In addition, Ms. Fagely is Controller and Chief Financial Officer of HIFSCO.
Dr. Robert J. Froehlich (1953) Senior Managing Director since 2009
Dr. Froehlich joined The Hartford as Senior Managing Director in September 2009. Prior to joining The Hartford, Dr. Froehlich served as Vice Chairman of Deutsche Asset Management from 1997-2009.
Edward P. Macdonald (1967) Vice President, Secretary and Chief Legal Officer since 2005
Mr. Macdonald serves as Vice President of HLIC and Chief Legal Officer of Mutual Funds and Vice President of HIFSCO. He also serves as Vice President and Secretary of HASCO, and Chief Legal Officer, Secretary and Vice President of HL Advisors. Mr. Macdonald joined The Hartford in 2005.
Vernon J. Meyer (1964) Vice President since 2006
Mr. Meyer serves as Senior Vice President of HLIC. He also serves as Senior Vice President of HIFSCO and HL Advisors. Mr. Meyer joined The Hartford in 2004.
Colleen B. Pernerewski (1969) Vice President and Chief Compliance Officer since 2010
Ms. Pernerewski serves as Vice President and Chief Investment Advisor Compliance Officer of HIFSCO and as Vice President and Chief Compliance Officer of HL Advisors. Ms. Pernerewski serves as Vice President and Chief Compliance Officer of Individual Annuity of HLIC. Ms. Pernerewski joined The Hartford in 2005 from Travelers Life and Annuity where she served as Counsel (2004-2005). Prior to Travelers Life and Annuity, Ms. Pernerewski held the position of Counsel at The Hartford (1998-2004).
Elizabeth L. Schroeder (1966) Vice President since 2010
Ms. Schroeder currently serves as Assistant Vice President of HLIC. Ms. Schroeder joined HLIC in 1991. She is also an Assistant Vice President of HASCO, HIFSCO and HL Advisors.
Martin Swanson (1962) Vice President since 2010
Mr. Swanson is a Vice President of HLIC. Mr. Swanson also serves as Vice President/Marketing for HIFSCO. Prior to joining HLIC in 1998, Mr. Swanson was a Vice President at PaineWebber, Inc.
Jane Wolak (1961) Vice President since 2009
Ms. Wolak currently serves as Senior Vice President of HLIC. Ms. Wolak joined HLIC as Vice President, Retail Product Services in May 2007. She is also Vice President of HASCO. Previously, Ms. Wolak was with Sun Life Financial where she held the position of Vice President, Service Center Operations from 2001-2007.
HOW TO OBTAIN A COPY OF THE FUND’S PROXY VOTING POLICIES AND VOTING RECORDS (UNAUDITED)
A description of the policies and procedures that the Fund uses to determine how to vote proxies relating to portfolio securities and a record of how the Fund voted any proxies for the twelve-month period ended June 30, 2011 are available (1) without charge, upon request, by calling 888-843-7824 and (2) on the SEC’s website at http://www.sec.gov.
QUARTERLY PORTFOLIO HOLDINGS INFORMATION (UNAUDITED)
The Fund files a complete schedule of portfolio holdings with the SEC for the first and third quarters of each fiscal year on Form N-Q. The Fund’s Forms are available (1) without charge, upon request, by calling 888-843-7824 and (2) on the SEC’s website at http://www.sec.gov. The Form N-Q may be reviewed and copied at the SEC’s Public Reference Room in Washington, DC. Information on the operation of the Public Reference Room may be obtained by calling 1-800-SEC-0330.
| The Hartford Growth Fund |
| Expense Example (Unaudited) |
Your Fund's Expenses
As a shareholder of the Fund, you incur two types of costs: (1) transaction costs, including sales charges (loads) on purchase payments and contingent deferred sales charges (CDSC) and (2) ongoing costs, including investment management fees, distribution fees, and other fund expenses. This example is intended to help you understand your ongoing costs (in dollars) of investing in the Fund and to compare these costs with the ongoing costs of investing in other mutual funds. The example is based on an investment of $1,000 invested at the beginning of the period and held for the period of October 31, 2011 through April 30, 2012.
Actual Expenses
The first set of columns of the table below provides information about actual account values and actual expenses. You may use the information in this column, together with the amount you invested, to estimate the expenses that you paid over the period. Simply divide your account value by $1,000 (for example, an $8,600 account value divided by $1,000 = 8.6), then multiply the result by the number in the line under the heading entitled “Expenses Paid During Period” to estimate the expenses you paid on your account during this period.
Hypothetical Example for Comparison Purposes
The second set of columns of the table below provides information about hypothetical account values and hypothetical expenses based on the Fund's actual expense ratio and an assumed rate of return of 5% per year before expenses, which is not the Fund's actual return. The hypothetical account values and expenses may not be used to estimate the actual ending account balance or expenses you paid for the period. You may use this information to compare the ongoing costs of investing in the Fund and other funds. To do so, compare this 5% hypothetical example with the 5% hypothetical examples that appear in the shareholder reports of the other funds.
Please note that the expenses shown in the table are meant to highlight your ongoing costs only and do not reflect any transactional costs, such as sales charges (loads) and CDSC. Therefore, the second set of columns of the table is useful in comparing ongoing costs only, and will not help you determine the relative total costs of owning different funds. In addition, if these transactional costs were included, your costs would be higher. Expenses are equal to the Fund's annualized expense ratios multiplied by average account value over the period, multiplied by 182/366 (to reflect the one-half year period).
| | | Actual return | | | Hypothetical (5% return before expenses) | | | | | | | | | | |
| | | Beginning
Account Value
October 31, 2011 | | | Ending Account
Value
April 30, 2012 | | | Expenses paid
during the period
October 31, 2011
through
April 30, 2012 | | | Beginning
Account Value
October 31, 2011 | | | Ending Account
Value
April 30, 2012 | | | Expenses paid
during the
period
October 31, 2011
through
April 30, 2012 | | | Annualized
expense
ratio | | | Days in
the
current
1/2
year | | | Days
in the
full
year | |
| Class A | | $ | 1,000.00 | | | $ | 1,111.70 | | | $ | 6.56 | | | $ | 1,000.00 | | | $ | 1,018.65 | | | $ | 6.27 | | | | 1.25 | % | | | 182 | | | | 366 | |
| Class B | | $ | 1,000.00 | | | $ | 1,107.50 | | | $ | 10.47 | | | $ | 1,000.00 | | | $ | 1,014.92 | | | $ | 10.01 | | | | 2.00 | | | | 182 | | | | 366 | |
| Class C | | $ | 1,000.00 | | | $ | 1,108.10 | | | $ | 10.28 | | | $ | 1,000.00 | | | $ | 1,015.11 | | | $ | 9.83 | | | | 1.96 | | | | 182 | | | | 366 | |
| Class I | | $ | 1,000.00 | | | $ | 1,113.00 | | | $ | 5.14 | | | $ | 1,000.00 | | | $ | 1,020.00 | | | $ | 4.91 | | | | 0.98 | | | | 182 | | | | 366 | |
| Class R3 | | $ | 1,000.00 | | | $ | 1,110.10 | | | $ | 7.87 | | | $ | 1,000.00 | | | $ | 1,017.40 | | | $ | 7.53 | | | | 1.50 | | | | 182 | | | | 366 | |
| Class R4 | | $ | 1,000.00 | | | $ | 1,112.50 | | | $ | 6.25 | | | $ | 1,000.00 | | | $ | 1,018.95 | | | $ | 5.97 | | | | 1.19 | | | | 182 | | | | 366 | |
| Class R5 | | $ | 1,000.00 | | | $ | 1,113.90 | | | $ | 4.73 | | | $ | 1,000.00 | | | $ | 1,020.39 | | | $ | 4.52 | | | | 0.90 | | | | 182 | | | | 366 | |
| Class Y | | $ | 1,000.00 | | | $ | 1,113.90 | | | $ | 4.14 | | | $ | 1,000.00 | | | $ | 1,020.94 | | | $ | 3.96 | | | | 0.79 | | | | 182 | | | | 366 | |
You should carefully consider investment objectives, risks, and charges and expenses of The Hartford Mutual Funds before investing. This and other information can be found in the Fund’s prospectus or summary prospectus, which can be obtained from your investment representative or by calling 888-843-7824. Please read them carefully before you invest or send money. The Hartford Mutual Funds are underwritten and distributed by Hartford Investment Financial Services LLC. “The Hartford” is The Hartford Financial Services Group, Inc., and its subsidiaries. MFSAR-G12 4/12 110743 Printed in U.S.A. ©2012 The Hartford, Hartford, CT 06155 |  |
THE HARTFORD MUTUAL FUNDS 2012 Semi Annual Report The Hartford Growth Opportunities Fund |
A MESSAGE FROM THE PRESIDENT
Dear Fellow Shareholders:
I want to take this opportunity to say thank you for investing with The Hartford Mutual Funds. Although it’s not yet clear that the recent market volatility is truly behind us, we believe there are several reasons to remain optimistic about the markets in 2012.
Market Review
Stocks soared in October as a result of solid corporate earnings reports, generally better-than-expected economic data, and renewed hopes for a solution to the eurozone debt crisis. However, November saw some of those gains dissipate due to pessimism about European contagion and its implications for global economic growth. The quarter ended on a positive note, a result of encouraging employment and manufacturing data in December.
The S&P 500 Index was virtually unchanged for the year: 1257.64 on 12/31/2010, and 1257.60 on 12/31/2011. Dividends, however, helped produce a 2.11% total return for the Index for the year.
In 2012, U.S. equities surged in the first quarter, with the S&P 500 up 12.59% as investors shrugged off lingering uncertainty over eurozone sovereign debt and focused instead on improving economic data. Strong corporate earnings news and the Federal Reserve’s pledge to keep interest rates low buoyed investors’ appetites.
The Hartford Mutual Funds Expands Relationship with Wellington Management
We’re very pleased that we are expanding our relationship with Wellington Management which will now serve as the sole sub-adviser for the retail Hartford Mutual Funds including equity, fixed-income, and asset-allocation funds.* One of America’s oldest and largest investment management firms, Wellington Management has resources that span the entire globe, with multiple offices across the U.S. and numerous offices abroad. Wellington Management’s most distinctive strength is its proprietary research, which is shared across the entire organization.
We believe that aligning more closely with a well-respected money manager like Wellington Management puts us in a strong position to drive significant growth and to continue delivering innovative fund strategies to help our investors meet their financial goals.
Thank you again for investing with The Hartford Mutual Funds.
James Davey
President
The Hartford Mutual Funds
*Hartford Investment Management Company will continue to sub-advise The Hartford Money Market Fund.
The Hartford Growth Opportunities Fund
Table of Contents
The views expressed in the Fund’s Manager Discussion under ‘‘Why did the Fund perform this way?’’ and ‘‘What is the outlook?’’ are views of the Fund’s sub-adviser and portfolio management team through the end of the period and are subject to change based on market and other conditions.
The Hartford Growth Opportunities Fund inception 03/31/1963
(sub-advised by Wellington Management Company, LLP)
| Investment objective – Seeks capital appreciation. |
Performance Overview 4/30/02 - 4/30/12

The chart above shows the growth of a $10,000 investment in Class A which includes a sales charge. Growth results in classes other than Class A will vary from what is seen above due to differences in the expenses charged to those share classes.
Average Annual Total Returns (as of 4/30/12)
| | 6 Month† | 1 Year | 5 year | 10 year |
| Growth Opportunities A# | 12.32% | -2.34% | 1.31% | 6.67% |
| Growth Opportunities A## | | -7.71% | 0.18% | 6.07% |
| Growth Opportunities B# | 11.92% | -3.05% | 0.57% | NA* |
| Growth Opportunities B## | | -7.90% | 0.23% | NA* |
| Growth Opportunities C# | 11.88% | -3.00% | 0.63% | 5.93% |
| Growth Opportunities C## | | -3.97% | 0.63% | 5.93% |
| Growth Opportunities I# | 12.43% | -2.08% | 1.68% | 6.89% |
| Growth Opportunities R3# | 12.12% | -2.59% | 1.08% | 6.78% |
| Growth Opportunities R4# | 12.31% | -2.27% | 1.44% | 6.97% |
| Growth Opportunities R5# | 12.46% | -1.99% | 1.71% | 7.13% |
| Growth Opportunities Y# | 12.55% | -1.85% | 1.82% | 7.19% |
| Russell 1000 Growth Index | 14.13% | 7.26% | 4.11% | 5.16% |
| Russell 3000 Growth Index | 13.86% | 6.26% | 4.04% | 5.23% |
| * | 10 year returns are not applicable for Class B because after 8 years Class B converts to Class A. |
PAST PERFORMANCE IS NOT INDICATIVE OF FUTURE RESULTS.
The initial investment in Class A shares reflects the maximum sales charge and Classes B and C reflect a contingent deferred sales charge.
Total returns presented above were calculated using the Fund's net asset value available to shareholders for sale or redemption of Fund shares on April 30, 2012, which may exclude investment transactions as of this date.
Effective 9/30/09, Class B shares of The Hartford Mutual Funds were closed to new investments.
Class I shares commenced operations on 8/31/06. Performance prior to that date is that of the Fund's Class A shares (excluding sales charges), which had different operating expenses.Class R3, R4 and R5 shares commenced operations on 12/22/06. Class R3, R4 and R5 share performance prior to that date reflects Class Y share performance and operating expenses.
Russell 1000 Growth Index is an unmanaged index which measures the performance of those Russell 1000 Index companies with higher price-to-book ratios and higher forecasted growth values. (The Russell 1000 Index is an unmanaged index that measures the performance of the 1,000 largest companies in the Russell 3000 Index, which measures the performance of the 3,000 largest U.S. companies based on total market capitalization.)
Russell 3000 Growth Index is an unmanaged index that measures the performance of those Russell 3000 Index companies with higher price-to-book ratios and higher forecasted growth values. (The Russell 3000 Index is an unmanaged index that measures the performance of the 3,000 largest U.S. companies based on total market capitalization.)
You cannot invest directly in an index.
The chart represents a hypothetical investment in the Fund. Performance data represents past performance and current performance could be higher or lower.
The value of shares will fluctuate so that, when redeemed, shares may be worth more or less than their original cost. The chart and table do not reflect the deduction of taxes that a shareholder would pay on Fund distributions or the redemption of Fund shares.
Performance information may reflect historical or current expense waivers/reimbursements from the investment adviser, without which performance would have been lower. For information on current expense waivers/reimbursements, please see the prospectus.
| The Hartford Growth Opportunities Fund |
| Manager Discussion |
| April 30, 2012 (Unaudited) |
| Portfolio Managers | | |
| Michael T. Carmen, CFA | Stephen Mortimer | Mario E. Abularach, CFA |
| Senior Vice President and Equity Portfolio Manager | Senior Vice President and Equity Portfolio Manager | Senior Vice President and Equity Research Analyst |
| | | |
How did the Fund perform?
The Class A shares of The Hartford Growth Opportunities Fund returned 12.32%, before sales charge, for the six-month period ended April 30, 2012, underperforming the benchmark, the Russell 3000 Growth Index, which returned 13.86% for the same period. The Fund outperformed the 11.72% return of the average fund in the Lipper Multi-Cap Growth Funds peer group, a group of funds with investment strategies similar to those of the Fund.
Why did the Fund perform this way?
U.S. equities moved higher in the period as generally improving economic data and growing consumer confidence helped to counter a persistent slump in housing. Investors mostly shrugged off lingering uncertainty over eurozone sovereign debt, focusing instead on the improving health of the U.S. economy. Strong corporate earnings news and the U.S. Federal Reserve’s pledge to keep interest rates “exceptionally low” until at least late 2014 buoyed investors’ appetites for risk assets. The Greek debt restructuring deal added to investors’ optimism, helping to offset heightened geopolitical risks, a rise in oil prices, and fears of a slowdown in China. In April, U.S. equities retreated for the first time in five months as disappointing employment and GDP data overshadowed continued strength in corporate earnings. In addition, increased political uncertainty in Europe, growing concerns about Spain’s fiscal sustainability, and a less dovish tone from the U.S. Federal Reserve underpinned a rise in risk aversion among investors.
Overall equity market performance was positive for the period across all market capitalizations: large cap equities (+13%), mid caps (+12%), and small caps (+11%) all rose as represented by the S&P 500, S&P 400 MidCap, and Russell 2000 Indices, respectively. All ten sectors in the Russell 3000 Growth Index had positive returns, with Consumer Discretionary (+17%), Information Technology (+17%), and Health Care (+16%) leading the way. Utilities (+4%) and Energy (+5%) lagged on a relative basis.
Security selection was the primary driver of relative underperformance for the period. Weak selection within Energy, Consumer Staples, Industrials, and Materials more than offset positive selection in Information Technology and Health Care. Allocation among sectors, a residual of our bottom-up stock selection process (i.e. stock by stock fundamental research), contributed modestly to returns, primarily as a result of an underweight (i.e. the Fund’s sector position was less than the benchmark position) to the underperforming Consumer Staples sector and an overweight in the outperforming Information Technology sector.
The top detractors from relative performance (i.e. performance of the Fund as measured against the benchmark) during the period were Deckers Outdoor (Consumer Discretionary), Chesapeake Energy (Energy), and Weight Watchers International (Consumer Discretionary). Deckers Outdoor is a designer and marketer of fashion-oriented footwear, including the UGG and Teva brands. Shares fell as unseasonably warm winter weather hurt sales and the company issued conservative guidance for 2012 earnings. Shares of Chesapeake Energy, a U.S.-based producer of natural gas, oil, and natural gas liquids, underperformed on concerns that increased spending on leaseholds and capital expenditures would not result in higher production guidance. Detractors from absolute performance (i.e. total return) also included Green Mountain Coffee Roasters (Consumer Staples), a maker of specialty coffees and coffee makers. Shares underperformed after revenue and earnings fell short of expectations.
Top contributors to absolute and relative performance during the period were Priceline.com (Consumer Discretionary), Apple (Information Technology), and Regions Financial (Financials). Shares of Priceline.com, a leading online travel booking and services company, rose after the company announced better-than-expected earnings results and guidance. Shares of consumer electronics company Apple moved higher after the company generated better-than-expected revenue and earnings, led by robust sales of the iPhone 4S and iPad. Regions Financial is a financial holding company offering commercial, retail, and mortgage banking in the South, Midwest, and Texas. The company has a solid and improving capital position and beat consensus earnings estimates during the period, causing the share price to rise.
What is the outlook?
Economic data in the United States has improved in recent months. We believe a strengthening job market and improved consumer confidence are helping to offset a stagnant housing market. While we believe economic growth is likely to remain tepid in 2012, this is discounted in valuations, in our view.
| The Hartford Growth Opportunities Fund |
| Manager Discussion – (continued) |
| April 30, 2012 (Unaudited) |
We believe that the biggest risk to U.S. markets remains a cataclysmic liquidity event in Europe that severely impacts global economic growth and confidence. We view this as a low probability event. We expect a continued modest economic expansion in the U.S., underpinned by falling inflation and only modest fiscal restraint. It appears that the likelihood of a European recession is increasing, but we believe the U.S. can withstand this and continue its slow recovery.
Because the cyclical aspect of the recovery has passed in our view, our focus in the Fund continues to be on secular growth stories, which we define as companies with their own underlying growth drivers. As a result of our bottom-up stock selection process, the Fund ended the period most overweight in Information Technology and Consumer Discretionary and most underweight in Consumer Staples, Industrials, and Materials.
Diversification by Industry
as of April 30, 2012
| Industry (Sector) | | Percentage of
Net Assets | |
| Banks (Financials) | | | 2.1 | % |
| Capital Goods (Industrials) | | | 2.8 | |
| Commercial & Professional Services (Industrials) | | | 1.0 | |
| Consumer Durables & Apparel (Consumer Discretionary) | | | 5.3 | |
| Consumer Services (Consumer Discretionary) | | | 1.0 | |
| Diversified Financials (Financials) | | | 1.6 | |
| Energy (Energy) | | | 8.5 | |
| Health Care Equipment & Services (Health Care) | | | 7.1 | |
| Insurance (Financials) | | | 0.9 | |
| Materials (Materials) | | | 1.4 | |
| Media (Consumer Discretionary) | | | 2.4 | |
| Pharmaceuticals, Biotechnology & Life Sciences (Health Care) | | | 4.1 | |
| Real Estate (Financials) | | | 0.9 | |
| Retailing (Consumer Discretionary) | | | 10.7 | |
| Semiconductors & Semiconductor Equipment (Information Technology) | | | 3.3 | |
| Software & Services (Information Technology) | | | 18.5 | |
| Technology Hardware & Equipment (Information Technology) | | | 17.0 | |
| Telecommunication Services (Services) | | | 0.5 | |
| Transportation (Industrials) | | | 2.0 | |
| Short-Term Investments | | | 5.5 | |
| Other Assets and Liabilities | | | 3.4 | |
| Total | | | 100.0 | % |
| The Hartford Growth Opportunities Fund |
| Schedule of Investments |
| April 30, 2012 (Unaudited) |
| (000’s Omitted) |
| Shares or Principal Amount | | Market Value ╪ | |
| COMMON STOCKS - 91.1% | | | | |
| | | | | Banks - 2.1% | | | | |
| | 243 | | | M&T Bank Corp. | | $ | 21,003 | |
| | 3,237 | | | Regions Financial Corp. | | | 21,820 | |
| | | | | | | | 42,823 | |
| | | | | Capital Goods - 2.8% | | | | |
| | 125 | | | Flowserve Corp. | | | 14,372 | |
| | 312 | | | Fluor Corp. | | | 17,990 | |
| | 411 | | | Pall Corp. | | | 24,519 | |
| | | | | | | | 56,881 | |
| | | | | Commercial & Professional Services - 1.0% | | | | |
| | 198 | | | IHS, Inc. ● | | | 20,006 | |
| | | | | | | | | |
| | | | | Consumer Durables & Apparel - 5.3% | | | | |
| | 109 | | | Coach, Inc. | | | 7,942 | |
| | 635 | | | D.R. Horton, Inc. | | | 10,390 | |
| | 266 | | | Deckers Outdoor Corp. ● | | | 13,548 | |
| | 745 | | | Hanesbrands, Inc. ● | | | 21,022 | |
| | 499 | | | Jarden Corp. | | | 20,943 | |
| | 399 | | | Lennar Corp. | | | 11,081 | |
| | 231 | | | PVH Corp. | | | 20,538 | |
| | | | | | | | 105,464 | |
| | | | | Consumer Services - 1.0% | | | | |
| | — | | | Diamond Resorts LLC ⌂† | | | 19,424 | |
| | | | | | | | | |
| | | | | Diversified Financials - 1.6% | | | | |
| | 99 | | | BlackRock, Inc. | | | 18,966 | |
| | 910 | | | Justice Holdings Ltd. ⌂●† | | | 13,347 | |
| | | | | | | | 32,313 | |
| | | | | Energy - 8.5% | | | | |
| | 261 | | | Anadarko Petroleum Corp. | | | 19,142 | |
| | 165 | | | Apache Corp. | | | 15,796 | |
| | 140 | | | Bumi plc ● | | | 1,177 | |
| | 702 | | | Cabot Oil & Gas Corp. | | | 24,677 | |
| | 329 | | | Cobalt International Energy ● | | | 8,815 | |
| | 281 | | | ENSCO International plc | | | 15,378 | |
| | 167 | | | EOG Resources, Inc. | | | 18,367 | |
| | 821 | | | Genel Energy plc ● | | | 9,395 | |
| | 502 | | | Newfield Exploration Co. ● | | | 18,020 | |
| | 159 | | | Pioneer Natural Resources Co. | | | 18,367 | |
| | 692 | | | Southwestern Energy Co. ● | | | 21,839 | |
| | | | | | | | 170,973 | |
| | | | | Health Care Equipment & Services - 7.1% | | | | |
| | 509 | | | Edwards Lifesciences Corp. ● | | | 42,221 | |
| | 2,052 | | | Hologic, Inc. ● | | | 39,232 | |
| | 27 | | | Intuitive Surgical, Inc. ● | | | 15,565 | |
| | 158 | | | McKesson Corp. | | | 14,468 | |
| | 92 | | | SXC Health Solutions Corp. ● | | | 8,312 | |
| | 381 | | | UnitedHealth Group, Inc. | | | 21,388 | |
| | | | | | | | 141,186 | |
| | | | | Insurance - 0.9% | | | | |
| | 871 | | | Progressive Corp. | | | 18,561 | |
| | | | | | | | | |
| | | | | Materials - 1.4% | | | | |
| | 441 | | | Ball Corp. | | | 18,421 | |
| | 114 | | | Methanex Corp. ADR | | | 4,022 | |
| | 215 | | | Molycorp, Inc. ● | | | 5,826 | |
| | 1,875 | | | Sino Forest Corp. Class A ⌂●† | | | — | |
| | | | | | | | 28,269 | |
| | | | | Media - 2.4% | | | | |
| | 8,634 | | | Sirius XM Radio, Inc. w/ Rights ● | | | 19,514 | |
| | 641 | | | Walt Disney Co. | | | 27,644 | |
| | | | | | | | 47,158 | |
| | | | | Pharmaceuticals, Biotechnology & Life Sciences - 4.1% | | | | |
| | 640 | | | Agilent Technologies, Inc. | | | 26,974 | |
| | 328 | | | Amylin Pharmaceuticals, Inc. ● | | | 8,486 | |
| | 335 | | | Auxilium Pharmaceuticals, Inc. ● | | | 6,005 | |
| | 200 | | | Biogen Idec, Inc. ● | | | 26,850 | |
| | 305 | | | Elan Corp. plc ADR ● | | | 4,206 | |
| | 105 | | | Waters Corp. ● | | | 8,865 | |
| | | | | | | | 81,386 | |
| | | | | Real Estate - 0.9% | | | | |
| | 1,058 | | | Host Hotels & Resorts, Inc. | | | 17,607 | |
| | | | | | | | | |
| | | | | Retailing - 10.7% | | | | |
| | 293 | | | Amazon.com, Inc. ● | | | 67,975 | |
| | 174 | | | Dufry Group | | | 23,680 | |
| | 874 | | | Lowe's Co., Inc. | | | 27,499 | |
| | 61 | | | Priceline.com, Inc. ● | | | 46,740 | |
| | 769 | | | TripAdvisor, Inc. ● | | | 28,849 | |
| | 708 | | | Urban Outfitters, Inc. ● | | | 20,491 | |
| | | | | | | | 215,234 | |
| | | | | Semiconductors & Semiconductor Equipment - 3.3% | | | | |
| | 517 | | | Broadcom Corp. Class A | | | 18,924 | |
| | 1,030 | | | Skyworks Solutions, Inc. ● | | | 27,941 | |
| | 506 | | | Xilinx, Inc. | | | 18,419 | |
| | | | | | | | 65,284 | |
| | | | | Software & Services - 18.5% | | | | |
| | 1,565 | | | Activision Blizzard, Inc. | | | 20,138 | |
| | 2,418 | | | Cadence Design Systems, Inc. ● | | | 28,215 | |
| | 371 | | | Cognizant Technology Solutions Corp. ● | | | 27,231 | |
| | 1,135 | | | eBay, Inc. ● | | | 46,588 | |
| | 266 | | | Equinix, Inc. ● | | | 43,728 | |
| | 358 | | | Fortinet, Inc. ● | | | 9,353 | |
| | 330 | | | LinkedIn Corp. ● | | | 35,795 | |
| | 1,419 | | | Oracle Corp. | | | 41,700 | |
| | 321 | | | Red Hat, Inc. ● | | | 19,141 | |
| | 213 | | | Salesforce.com, Inc. ● | | | 33,247 | |
| | 270 | | | Teradata Corp. ● | | | 18,820 | |
| | 597 | | | Tibco Software, Inc. ● | | | 19,629 | |
| | 551 | | | VeriFone Systems, Inc. ● | | | 26,263 | |
| | | | | | | | 369,848 | |
| | | | | Technology Hardware & Equipment - 17.0% | | | | |
| | 298 | | | Apple, Inc. ● | | | 173,845 | |
| | 2,392 | | | Cisco Systems, Inc. | | | 48,189 | |
| | 1,728 | | | EMC Corp. ● | | | 48,735 | |
| | 75 | | | F5 Networks, Inc. ● | | | 10,071 | |
| | 911 | | | Juniper Networks, Inc. ● | | | 19,527 | |
| | 759 | | | Riverbed Technology, Inc. ● | | | 14,971 | |
| | 453 | | | Trimble Navigation Ltd. ● | | | 24,550 | |
| | | | | | | | 339,888 | |
| | | | | Telecommunication Services - 0.5% | | | | |
| | 2,512 | | | Hughes Telematics, Inc. ● | | | 10,046 | |
| | | | | | | | 10,046 | |
| | | | | Transportation - 2.0% | | | | |
| | 317 | | | C.H. Robinson Worldwide, Inc. | | | 18,920 | |
The accompanying notes are an integral part of these financial statements.
| The Hartford Growth Opportunities Fund |
| Schedule of Investments – (continued) |
| April 30, 2012 (Unaudited) |
| (000’s Omitted) |
| Shares or Principal Amount | | | | Market Value ╪ | |
| COMMON STOCKS - 91.1% - (continued) | | | | | | |
| | | | | Transportation - 2.0% - (continued) | | | | | | |
| | 543 | | | Expeditors International of Washington, Inc. | | | | $ | 21,736 | |
| | | | | | | | | | 40,656 | |
| | | | | Total common stocks | | | | | | |
| | | | | (cost $1,545,311) | | | | $ | 1,823,007 | |
| | | | | | | | | | | |
| | | | | Total long-term investments | | | | | | |
| | | | | (cost $1,545,311) | | | | $ | 1,823,007 | |
| | | | | | | | | | | |
| SHORT-TERM INVESTMENTS - 5.5% | | | | | | |
| Repurchase Agreements - 5.5% | | | | | | |
| | | | | Bank of America Merrill Lynch TriParty
Joint Repurchase Agreement (maturing on
05/01/2012 in the amount of $27,558,
collateralized by FHLB 4.91%, 2015,
FHLMC 2.46% - 3.33%, 2040 - 2042,
FNMA 2.24% - 5.50%, 2024 - 2042, value
of $28,109) | | | | | | |
| $ | 27,558 | | | 0.20%, 04/30/2012 | | | | $ | 27,558 | |
| | | | | Barclays Capital TriParty Joint Repurchase
Agreement (maturing on 05/01/2012 in the
amount of $36,917, collateralized
by FHLMC 4.00% - 4.50%, 2039 - 2041,
FNMA 3.00% - 5.00%, 2027 - 2040, value
of $37,655) | | | | | | |
| | 36,917 | | | 0.20%, 04/30/2012 | | | | | 36,917 | |
| | | | | Deutsche Bank Securities TriParty Joint
Repurchase Agreement (maturing on
05/01/2012 in the amount of $14,581,
collateralized by FNMA 3.00% - 7.00%,
2023 - 2042, value of $14,873) | | | | | | |
| | 14,581 | | | 0.21%, 04/30/2012 | | | | | 14,581 | |
| | | | | TD Securities TriParty Joint Repurchase
Agreement (maturing on 05/01/2012 in the
amount of $12,075, collateralized by
FFCB 0.27% - 5.38%, 2012 - 2020, FHLB
0.88% - 1.38%, 2013 - 2014, FHLMC
4.00% - 6.00%, 2014 - 2041, FNMA
.00% - 4.50%, 2025 - 2042, value of
$12,316) | | | | | | |
| | 12,075 | | | 0.19%, 04/30/2012 | | | | | 12,075 | |
| | | | | UBS Securities, Inc. Joint Repurchase
Agreement (maturing on 05/01/2012 in the
amount of $14, collateralized by U.S.
Treasury Note 0.75%, 2013, value of $14) | | | | | | |
| | 14 | | | 0.17%, 04/30/2012 | | | | | 14 | |
| | | | | UBS Securities, Inc. TriParty Joint
Repurchase Agreement (maturing on
05/01/2012 in the amount of $19,821,
collateralized by FHLMC 4.00%, 2026 -
2042, FNMA 2.50% - 4.50%, 2022 - 2042,
value of $20,217) | | | | | | |
| | 19,821 | | | 0.21%, 04/30/2012 | | | | | 19,821 | |
| | | | | | | | | | 110,966 | |
| | | | | Total short-term investments | | | | | | |
| | | | | (cost $110,966) | | | | $ | 110,966 | |
| | | | | | | | | | | |
| | | | | Total investments | | | | | | |
| | | | | (cost $1,656,277) ▲ | | 96.6 | % | $ | 1,933,973 | |
| | | | | Other assets and liabilities | | 3.4 | % | | 68,946 | |
| | | | | Total net assets | | 100.0 | % | $ | 2,002,919 | |
The accompanying notes are an integral part of these financial statements.
| Note: | Percentage of investments as shown is the ratio of the total market value to total net assets. |
| | Prices of foreign equities that are principally traded on certain foreign markets may be adjusted daily pursuant to a fair value pricing service approved by the Board of Directors in order to reflect an adjustment for factors occurring after the close of certain foreign markets but before the close of the New York Stock Exchange. |
| ▲ | At April 30, 2012, the cost of securities for federal income tax purposes was $1,660,289 and the aggregate gross unrealized appreciation and depreciation based on that cost were: |
| Unrealized Appreciation | | $ | 359,507 | |
| Unrealized Depreciation | | | (85,823 | ) |
| Net Unrealized Appreciation | | $ | 273,684 | |
| † | These securities were valued in good faith at fair value as determined under policies and procedures established by and under the supervision of the Company's Board of Directors. At April 30, 2012, the aggregate value of these securities was $32,771, which represents 1.6% of total net assets. This amount excludes securities that are principally traded in certain foreign markets and whose prices are adjusted pursuant to a third party pricing service methodology approved by the Board of Directors. |
| ⌂ | The following securities are considered illiquid. Illiquid securities are often purchased in private placement transactions, are often not registered under the Securities Act of 1933 and may have contractual restrictions on resale. A security may also be considered illiquid if the security lacks a readily available market or if its valuation has not changed for a certain period of time. |
| Period Acquired | | Shares/ Par | | | Security | | Cost Basis | |
| 07/2011 | | | – | | | Diamond Resorts LLC | | | 17,340 | |
| 02/2011 - 05/2011 | | | 910 | | | Justice Holdings Ltd. | | | 14,611 | |
| 05/2011 - 07/2011 | | | 1,875 | | | Sino Forest Corp. Class A | | | 26,988 | |
| | At April 30, 2012, the aggregate value of these securities was $32,771, which represents 1.6% of total net assets. |
Foreign Currency Contracts Outstanding at April 30, 2012
| Description | | Counterparty | | | Buy / Sell | | | Market Value ╪ | | | Contract
Amount | | | Delivery Date | | | Unrealized
Appreciation/
(Depreciation) | |
| GBP | | CBK | | | | Sell | | | $ | 1,103 | | | $ | 1,106 | | | | 05/02/2012 | | | $ | 3 | |
| GBP | | CBK | | | | Sell | | | | 90 | | | | 90 | | | | 05/01/2012 | | | | – | |
| GBP | | DEUT | | | | Sell | | | | 345 | | | | 345 | | | | 05/03/2012 | | | | – | |
| | | | | | | | | | | | | | | | | | | | | | | $ | 3 | |
| ╪ | See Significant Accounting Policies of accompanying Notes to Financial Statements regarding valuation of securities. |
| GLOSSARY: (abbreviations used in preceding Schedule of Investments) |
| |
| Counterparty Abbreviations: |
| CBK | Citibank NA |
| DEUT | Deutsche Bank Securities, Inc. |
| |
| Currency Abbreviations: |
| GBP | British Pound |
| |
| Other Abbreviations: |
| ADR | American Depositary Receipt |
| FFCB | Federal Farm Credit Bank |
| FHLB | Federal Home Loan Bank |
| FHLMC | Federal Home Loan Mortgage Corp. |
| FNMA | Federal National Mortgage Association |
The accompanying notes are an integral part of these financial statements.
| The Hartford Growth Opportunities Fund |
| Investment Valuation Hierarchy Level Summary |
| April 30, 2012 (Unaudited) |
| (000’s Omitted) |
| | | Total | | | Level 1 ♦ | | | Level 2 ♦ | | | Level 3 | |
| Assets: | | | | | | | | | | | | | | | | |
| Common Stocks ‡ | | $ | 1,823,007 | | | $ | 1,766,556 | | | $ | 23,680 | | | $ | 32,771 | |
| Short-Term Investments | | | 110,966 | | | | – | | | | 110,966 | | | | – | |
| Total | | $ | 1,933,973 | | | $ | 1,766,556 | | | $ | 134,646 | | | $ | 32,771 | |
| Foreign Currency Contracts * | | | 3 | | | | – | | | | 3 | | | | – | |
| Total | | $ | 3 | | | $ | – | | | $ | 3 | | | $ | – | |
| Liabilities: | | | | | | | | | | | | | | | | |
| Foreign Currency Contracts * | | | – | | | | – | | | | – | | | | – | |
| Total | | $ | – | | | $ | – | | | $ | – | | | $ | – | |
| ♦ | For the six-month period ended April 30, 2012, there were no transfers between Level 1 and Level 2. |
| ‡ | The Fund has all or primarily all of the equity securities categorized in a particular level. Refer to the Schedule of Investments for further industry breakout. |
| * | Derivative instruments not reflected in the Schedule of Investments are valued at the unrealized appreciation/depreciation on the investments. |
Following is a reconciliation of Level 3 assets for which significant unobservable inputs were used to determine fair value:
| | | Balance as
of
October
31, 2011 | | | Realized
Gain
(Loss) | | | Change in
Unrealized
Appreciation
(Depreciation) | | | Net
Amortization | | | Purchases | | | Sales | | | Transfers
Into
Level 3 * | | | Transfers
Out of
Level 3 * | | | Balance as
of April
30, 2012 | |
| Assets: | | | | | | | | | | | | | | | | | | | | | | | | | | | | | | | | | | | | |
| Common Stocks | | $ | 37,371 | | | $ | (32 | ) | | $ | 1,834 | † | | $ | — | | | $ | — | | | $ | (170 | ) | | $ | 13,729 | | | $ | (19,961 | ) | | $ | 32,771 | |
| Total | | $ | 37,371 | | | $ | (32 | ) | | $ | 1,834 | | | $ | — | | | $ | — | | | $ | (170 | ) | | $ | 13,729 | | | $ | (19,961 | ) | | $ | 32,771 | |
| * | Investments are transferred into and out of Level 3 for a variety of reasons including, but not limited to: |
| | 1) Investments where trading has been halted (transfer into Level 3) or investments where trading has resumed (transfer out of Level 3). |
| | 2) Broker quoted investments (transfer into Level 3) or quoted prices in active markets (transfer out of Level 3). |
| | 3) Investments that have certain restrictions on trading (transfer into Level 3) or investments where trading restrictions have expired (transfer out of Level 3). |
| † | Change in unrealized appreciation (depreciation) in the current period relating to assets still held at April 30, 2012 was $1,834. |
The accompanying notes are an integral part of these financial statements.
| The Hartford Growth Opportunities Fund |
| Statement of Assets and Liabilities |
| April 30, 2012 (Unaudited) |
| (000’s Omitted) |
| Assets: | | | | |
| Investments in securities, at market value (cost $1,656,277) | | $ | 1,933,973 | |
| Cash | | | 2 | |
| Foreign currency on deposit with custodian (cost $103) | | | 104 | |
| Unrealized appreciation on foreign currency contracts | | | 3 | |
| Receivables: | | | | |
| Investment securities sold | | | 21,723 | |
| Fund shares sold | | | 55,447 | |
| Dividends and interest | | | 505 | |
| Other assets | | | 115 | |
| Total assets | | | 2,011,872 | |
| Liabilities: | | | | |
| Unrealized depreciation on foreign currency contracts | | | — | |
| Payables: | | | | |
| Investment securities purchased | | | 4,854 | |
| Fund shares redeemed | | | 3,459 | |
| Investment management fees | | | 230 | |
| Administrative fees | | | 2 | |
| Distribution fees | | | 59 | |
| Accrued expenses | | | 349 | |
| Total liabilities | | | 8,953 | |
| Net assets | | $ | 2,002,919 | |
| Summary of Net Assets: | | | | |
| Capital stock and paid-in-capital | | $ | 2,151,530 | |
| Distributions in excess of net investment loss | | | (4,368 | ) |
| Accumulated net realized loss | | | (421,941 | ) |
| Unrealized appreciation of investments and the translation of assets and liabilities denominated in foreign currency | | | 277,698 | |
| Net assets | | $ | 2,002,919 | |
| | | | | |
| Shares authorized | | | 23,750,000 | |
| Par value | | $ | 0.0001 | |
| Class A: Net asset value per share/Maximum offering price per share | | | $29.18/$30.88 | |
| Shares outstanding | | | 26,662 | |
| Net assets | | $ | 777,957 | |
| Class B: Net asset value per share | | $ | 23.19 | |
| Shares outstanding | | | 1,125 | |
| Net assets | | $ | 26,084 | |
| Class C: Net asset value per share | | $ | 23.27 | |
| Shares outstanding | | | 5,394 | |
| Net assets | | $ | 125,517 | |
| Class I: Net asset value per share | | $ | 29.67 | |
| Shares outstanding | | | 30,712 | |
| Net assets | | $ | 911,279 | |
| Class R3: Net asset value per share | | $ | 29.69 | |
| Shares outstanding | | | 523 | |
| Net assets | | $ | 15,519 | |
| Class R4: Net asset value per share | | $ | 30.20 | |
| Shares outstanding | | | 1,257 | |
| Net assets | | $ | 37,963 | |
| Class R5: Net asset value per share | | $ | 30.59 | |
| Shares outstanding | | | 473 | |
| Net assets | | $ | 14,459 | |
| Class Y: Net asset value per share | | $ | 30.75 | |
| Shares outstanding | | | 3,062 | |
| Net assets | | $ | 94,141 | |
The accompanying notes are an integral part of these financial statements.
| The Hartford Growth Opportunities Fund |
| Statement of Operations |
| For the Six-Month Period Ended April 30, 2012 (Unaudited) |
| (000’s Omitted) |
| Investment Income: | | | |
| Dividends | | $ | 6,072 | |
| Interest | | | 30 | |
| Less: Foreign tax withheld | | | (125 | ) |
| Total investment income | | | 5,977 | |
| | | | | |
| Expenses: | | | | |
| Investment management fees | | | 6,530 | |
| Administrative services fees | | | 48 | |
| Transfer agent fees | | | 1,769 | |
| Distribution fees | | | | |
| Class A | | | 918 | |
| Class B | | | 130 | |
| Class C | | | 606 | |
| Class R3 | | | 34 | |
| Class R4 | | | 45 | |
| Custodian fees | | | 13 | |
| Accounting services fees | | | 110 | |
| Registration and filing fees | | | 121 | |
| Board of Directors' fees | | | 22 | |
| Audit fees | | | 11 | |
| Other expenses | | | 116 | |
| Total expenses (before waivers and fees paid indirectly) | | | 10,473 | |
| Expense waivers | | | (79 | ) |
| Transfer agent fee waivers | | | (14 | ) |
| Commission recapture | | | (35 | ) |
| Total waivers and fees paid indirectly | | | (128 | ) |
| Total expenses, net | | | 10,345 | |
| Net Investment Loss | | | (4,368 | ) |
| Net Realized Gain on Investments and Foreign Currency Transactions: | | | | |
| Net realized gain on investments in securities | | | 17,575 | |
| Net realized gain on foreign currency contracts | | | 112 | |
| Net realized loss on other foreign currency transactions | | | (114 | ) |
| Net Realized Gain on Investments and Foreign Currency Transactions | | | 17,573 | |
| Net Changes in Unrealized Appreciation of Investments and Foreign Currency Transactions: | | | | |
| Net unrealized appreciation of investments | | | 201,040 | |
| Net unrealized depreciation of foreign currency contracts | | | (12 | ) |
| Net unrealized appreciation on translation of other assets and liabilities in foreign currencies | | | 13 | |
| Net Changes in Unrealized Appreciation of Investments and Foreign Currency Transactions | | | 201,041 | |
| Net Gain on Investments and Foreign Currency Transactions | | | 218,614 | |
| Net Increase in Net Assets Resulting from Operations | | $ | 214,246 | |
The accompanying notes are an integral part of these financial statements
.
| The Hartford Growth Opportunities Fund |
| Statement of Changes in Net Assets |
| |
| (000’s Omitted) |
| | | For the Six-Month
Period Ended
April 30, 2012
(Unaudited) | | | For the
Year Ended
October 31, 2011 | |
| Operations: | | | | | | | | |
| Net investment loss | | $ | (4,368 | ) | | $ | (8,371 | ) |
| Net realized gain on investments and foreign currency transactions | | | 17,573 | | | | 260,982 | |
| Net unrealized appreciation (depreciation) of investments and foreign currency transactions | | | 201,041 | | | | (185,076 | ) |
| Net Increase In Net Assets Resulting From Operations | | | 214,246 | | | | 67,535 | |
| Capital Share Transactions: | | | | | | | | |
| Class A | | | (62,357 | ) | | | 200,204 | |
| Class B | | | (4,677 | ) | | | (8,347 | ) |
| Class C | | | (15,913 | ) | | | (36,671 | ) |
| Class I | | | 26,994 | | | | 298,181 | |
| Class L* | | | — | | | | (352,995 | ) |
| Class R3 | | | 429 | | | | 2,297 | |
| Class R4 | | | (2,664 | ) | | | (9,019 | ) |
| Class R5 | | | (1,310 | ) | | | (1,074 | ) |
| Class Y | | | (15,455 | ) | | | (47,582 | ) |
| Net increase (decrease) from capital share transactions | | | (74,953 | ) | | | 44,994 | |
| Net Increase In Net Assets | | | 139,293 | | | | 112,529 | |
| Net Assets: | | | | | | | | |
| Beginning of period | | | 1,863,626 | | | | 1,751,097 | |
| End of period | | $ | 2,002,919 | | | $ | 1,863,626 | |
| Undistributed (distribution in excess of) net investment income (loss) | | $ | (4,368 | ) | | $ | — | |
| * | Class L merged into Class A on August 5, 2011. Please refer to the Notes to Financial Statements for further details. |
The accompanying notes are an integral part of these financial statements.
| The Hartford Growth Opportunities Fund |
| Notes to Financial Statements |
| April 30, 2012 (Unaudited) |
| (000’s Omitted) |
The Hartford Mutual Funds II, Inc. (“Company”) is an open-end management investment company comprised of five portfolios. Financial statements for The Hartford Growth Opportunities Fund (the “Fund”), a series of the Company, are included in this report.
The Company is organized under the laws of the State of Maryland and is registered with the Securities and Exchange Commission (“SEC”) under the Investment Company Act of 1940, as amended (“1940 Act”). The Fund is a diversified open-end management investment company.
Class A shares are sold with a front-end sales charge of up to 5.50%. Class B shares were sold with a contingent deferred sales charge which is assessed on the lesser of the per share net asset value (“NAV”) of the shares at the time of redemption or the original purchase price, and declines from up to 5.00% to zero depending on the period of time the shares are held (see note below regarding the closing of Class B shares). Class C shares are sold with a contingent deferred sales charge of up to 1.00% on shares redeemed within twelve months of purchase. Class I shares are sold without sales charges to certain eligible investors primarily through advisory fee-based wrap programs. Class R3, R4 and R5 shares, which are offered to employer-sponsored retirement plans, and Class Y shares, which are sold to certain eligible institutional investors, are sold without a sales charge. All classes of shares have identical voting, redemption, dividend, liquidation and other rights and the same terms and conditions, with the exceptions that each class may have different expenses, which may affect performance, and that Class B shares automatically convert to Class A shares after 8 years.
No new or additional investments are allowed in Class B shares of The Hartford Mutual Funds (including investments through any systematic investment plan). Existing shareholders of Class B shares may continue to hold their Class B shares, exchange their Class B shares for Class B shares of another Hartford Mutual Fund (as permitted by existing exchange privileges), or redeem their Class B shares as described in the Fund’s prospectus. Reinstatement privileges with respect to Class B shares will continue under the current policy. For investors electing to reinvest capital gains and dividends, any such capital gains or dividends on Class B shares will continue to be reinvested in Class B shares of the Fund. All Class B share attributes, including the 12b-1 fee, contingent deferred sales charge schedule, and conversion to Class A shares, remain unchanged.
| 2. | Significant Accounting Policies: |
The following is a summary of significant accounting policies of the Fund in the preparation of its financial statements, which are in accordance with the United States Generally Accepted Accounting Principles (“U.S. GAAP”). The preparation of financial statements in accordance with U.S. GAAP may require management to make estimates and assumptions that affect the reported amounts of assets and liabilities and disclosure of contingent assets and liabilities at the date of the financial statements and the reported amounts of increases and decreases in net assets from operations during the reporting period. Actual results could differ from those estimates.
| a) | Determination of Net Asset Value – The NAV of each class of the Fund’s shares is determined as of the close of regular trading (normally 4:00 p.m. Eastern Time) (the “NYSE Close”) on each day that the New York Stock Exchange (the “Exchange”) is open (“Valuation Date”). Information that becomes known to the Fund after the NAV has been calculated on a particular day will not generally be used to retroactively adjust the NAV determined earlier that day. |
| b) | Investment Valuation and Fair Value Measurements – For purposes of calculating the NAV, portfolio investments and other assets held by the Fund's portfolio for which market quotes are readily available are valued at market value. Market value is generally determined on the basis of last reported sales prices or official close price. If no sales are reported, market value is based on quotes obtained from a quotation reporting system, established market makers, or independent pricing services. If market prices are not readily available or are deemed unreliable, the Fund will use the fair value of |
| | the investment as determined in good faith under policies and procedures established by and under the supervision of the Company’s Board of Directors. Market quotes are considered not readily available where there is an absence of current or reliable market-based data (e.g., trade information or broker quotes), including where events occur after the close of the relevant market, but prior to the NYSE Close that materially affect the values of the Fund’s portfolio investments or assets. In addition, market quotes are considered not readily available when, due to extraordinary circumstances, the exchanges or markets on which the investments trade do not open for trading for the entire day and no other market prices are available. In addition, prices of foreign equities that are principally traded on certain foreign markets are adjusted daily pursuant to a fair value pricing service approved by the Board of Directors in order to reflect an adjustment for the factors occurring after the close of certain foreign markets but before the NYSE Close. Investments that are primarily traded on foreign markets may trade on days that are not business days of the Fund. The value of the foreign investments in which the Fund invests may change on days when a shareholder will not be able to purchase or redeem shares of the Fund. Fair value pricing is subjective in nature and the use of fair value pricing by the Fund may cause the NAV of its shares to differ significantly from the NAV that would have been calculated using market prices at the close of the exchange on which a portfolio investment is primarily traded. There can be no assurance that the Fund could obtain the fair market value assigned to an investment if the Fund were to sell the investment at approximately the time at which the Fund determines its NAV. |
Investments valued in currencies other than U.S. dollars are converted to U.S. dollars using exchange rates obtained from independent pricing services for calculation of the NAV. As a result, the NAV of the Fund’s shares may be affected by changes in the value of currencies in relation to the U.S. dollar. The value of investments traded in markets outside the United States or denominated in currencies other than the U.S. dollar may be affected significantly on a day that the NYSE is closed and the market value may change on days when an investor is not able to purchase, redeem or exchange shares of the Fund.
Foreign currency contracts represent agreements to exchange currencies on specific future dates at predetermined rates. Foreign currency contracts are valued using foreign currency exchange rates and forward rates as provided by an independent pricing service on the Valuation Date.
Financial instruments for which prices are not available from an independent pricing service may be valued using market quotations obtained from one or more dealers that make markets in the respective financial instrument in accordance with procedures established by the Company’s Board of Directors.
Investments in open-end mutual funds are valued at the respective NAV of each open-end mutual fund on the Valuation Date.
U.S. GAAP defines fair value as the price that the Fund would receive to sell an asset or pay to transfer a liability in an orderly transaction between market participants. The U.S. GAAP fair value measurement standards require disclosure of a fair value hierarchy for each major category of assets and liabilities. Various inputs are used in determining the fair value of the Fund’s investments. These inputs are summarized into three broad hierarchy levels. This hierarchy is based on whether the valuation inputs are observable or unobservable. These levels are:
| · | Level 1 – Quoted prices in active markets for identical investments. Level 1 may include exchange traded instruments, such as domestic equities, some foreign equities, options, futures, mutual funds, exchange traded funds, rights and warrants. |
| · | Level 2 – Observable inputs other than Level 1 prices, such as quoted prices for similar investments; quoted prices in markets that are not active; or other inputs that are observable or can be corroborated by observable market data. Level 2 may include debt investments that are traded less frequently than exchange traded instruments and which are valued using independent pricing services; foreign equities, which are principally traded on certain foreign markets and are adjusted daily pursuant to a fair value pricing service in order to |
| The Hartford Growth Opportunities Fund |
| Notes to Financial Statements – (continued) |
| April 30, 2012 (Unaudited) |
| (000’s Omitted) |
| | reflect an adjustment for the factors occurring after the close of certain foreign markets but before the NYSE Close; and short-term investments, which are valued at amortized cost. |
| · | Level 3 – Significant unobservable inputs that are supported by limited or no market activity. Level 3 may include financial instruments whose values are determined using broker quotes or require significant management judgment or estimation. These unobservable valuation inputs may include estimates for current yields, maturity/duration, prepayment speed, and broker quotes for comparable investments along with other assumptions relating to credit quality, collateral value, complexity of the investment structure, general market conditions and liquidity. This category may include investments where trading has been halted or there are certain restrictions on trading. While these investments are priced using unobservable inputs, the valuation of these investments reflects the best available data and management believes the prices are a reasonable representation of exit price. |
Valuation levels are not necessarily indicative of the risk associated with investing in such investments. Individual investments within any of the above mentioned asset classes may be assigned a different hierarchical level than those presented above, as individual circumstances dictate.
For additional information, refer to the Investment Valuation Hierarchy Level Summary and the Level 3 roll-forward reconciliation which follow the Schedule of Investments.
For purposes of reporting transfers between different hierarchy levels, both transfers in and out of each level, as applicable, are shown as if they occurred at the beginning of the period.
| c) | Investment Transactions and Investment Income – Investment transactions are recorded as of the trade date (the date the order to buy or sell is executed) for financial reporting purposes. Investments purchased or sold on a when-issued or delayed-delivery basis may be settled a month or more after the trade date. Realized gains and losses are determined on the basis of identified cost. |
Dividend income is accrued as of the ex-dividend date, except certain dividends from foreign investments where the ex-dividend date may have passed are recorded as soon as the Fund is informed of the dividend. Interest income, including amortization of premium and accretion of discounts, is accrued on a daily basis.
| d) | Foreign Currency Transactions – Assets and liabilities denominated in currencies other than U.S. dollars are translated into U.S. dollars at the exchange rates in effect on the valuation date. Purchases and sales of investments, income, and expenses are translated into U.S. dollars at the exchange rates on the dates of such transactions. |
The Fund does not isolate that portion of portfolio investment valuation resulting from fluctuations in the foreign currency exchange rates from the fluctuations arising from changes in the market prices of investments held. Exchange rate fluctuations are included with the net realized and unrealized gain or loss on investments in the accompanying financial statements.
Net realized foreign exchange gains or losses arise from sales of foreign currencies and the difference between asset and liability amounts initially stated in foreign currencies and the U.S. dollar value of the amounts actually received or paid. Net unrealized foreign exchange gains or losses arise from changes in the value of other assets and liabilities at the end of the reporting period, resulting from changes in the exchange rates.
| e) | Joint Trading Account – The Fund may invest cash balances into a joint trading account that may be invested in one or more repurchase agreements. |
| f) | Fund Share Valuation and Dividend Distributions to Shareholders – Orders for the Fund’s shares are executed in accordance with the investment instructions of the shareholders. The NAV of the Fund’s shares is determined as of the close of business on each business day of the Exchange. The NAV is determined separately for each class of shares of |
| | the Fund by dividing the Fund’s net assets attributable to that class by the number of shares of the class outstanding. Each class of shares offered by the Fund has equal rights as to assets and voting privileges (except that shareholders of a class have exclusive voting rights regarding any matter relating solely to that class of shares). Income and non-class specific expenses are allocated daily to each class on the basis of the relative net assets of the class. Realized and unrealized capital gains and losses are allocated daily based on the relative net assets of each class of shares of the Fund. |
Orders for the purchase of the Fund’s shares received prior to the close of the Exchange on any day the Exchange is open for business are priced at the NAV determined as of the close of the Exchange. Orders received after the close of the Exchange, or on a day on which the Exchange and/or the Fund is not open for business, are priced at the next determined NAV.
Dividends are declared pursuant to a policy adopted by the Company’s Board of Directors based upon the investment performance of the Fund. The policy of the Fund is to pay dividends from net investment income and realized capital gains, if any, at least once a year.
Distributions from net investment income, net realized capital gains and capital are determined in accordance with federal income tax regulations, which may differ from U.S. GAAP with respect to character and timing. These differences may include but are not limited to losses deferred due to wash sale adjustments, foreign currency gains and losses, adjustments related to Passive Foreign Investment Companies (“PFICs”), Real Estate Investment Trusts (“REITs”), Regulated Investment Companies (“RICs”), certain derivatives and partnerships. Permanent book and federal income tax basis differences relating to shareholder distributions will result in reclassifications to certain of the Fund’s capital accounts (see Federal Income Taxes: Reclassification of Capital Accounts note).
| 3. | Securities and Other Investments: |
| a) | Repurchase Agreements – A repurchase agreement is an agreement by which a counterparty agrees to sell an investment and agrees to repurchase the investment sold at a mutually agreed upon time and price. At the time the Fund enters into a repurchase agreement, the value of the underlying collateral, including accrued interest, will be equal to or exceed the value of the repurchase agreement. Repurchase agreements expose the Fund to counterparty risk. To minimize counterparty risk, the investments that serve to collateralize the repurchase agreement are held by the Fund’s custodian in book entry or physical form in the custodial account of the Fund or in a third party custodial account. Repurchase agreements are valued at cost plus accrued interest. The Fund, as shown on the Schedule of Investments, had outstanding repurchase agreements as of April 30, 2012. |
| b) | Illiquid and Restricted Investments – The Fund is permitted to invest up to 15% of its net assets in illiquid investments. Illiquid investments are those that may not be sold or disposed of in the ordinary course of business within seven days, at approximately the price used to determine the Fund’s NAV. The Fund may not be able to sell illiquid investments when its sub-adviser considers it desirable to do so or may have to sell such investments at a price that is lower than the price that could be obtained if the investments were more liquid. A sale of illiquid investments may require more time and may result in higher dealer discounts and other selling expenses than does the sale of those that are liquid. Illiquid investments also may be more difficult to value due to the unavailability of reliable market quotations for such investments, and an investment in them may have an adverse impact on the Fund’s NAV. The Fund may also purchase certain restricted investments that can only be resold to certain qualified investors and may be determined to be liquid pursuant to policies and guidelines established by the Company’s Board of Directors. The Fund, as shown on the Schedule of Investments, had illiquid and/or restricted investments as of April 30, 2012. |
| c) | Investments Purchased on a When-Issued or Delayed-Delivery Basis – Delivery and payment for investments that have been purchased by the Fund on a forward commitment, or when-issued or delayed-delivery basis, take place beyond the customary settlement period. A fund may dispose of or renegotiate a delayed-delivery transaction after it is entered into, and may sell delayed-delivery investments before they are delivered, which may result in a realized gain or loss. During |
| The Hartford Growth Opportunities Fund |
| Notes to Financial Statements – (continued) |
| April 30, 2012 (Unaudited) |
| (000’s Omitted) |
this period, such investments are subject to market fluctuations, and the Fund identifies investments segregated in its records with a value at least equal to the amount of the commitment. As of April 30, 2012, the Fund had no outstanding when-issued or delayed delivery investments.
| 4. | Financial Derivative Instruments: |
The following disclosures contain information on how and why the Fund uses derivative instruments, the credit-risk-related contingent features in certain derivative instruments, and how derivative instruments affect the Fund’s financial position and results of operations. The location and fair value amounts of these instruments on the Statement of Assets and Liabilities and the realized gains and losses and changes in unrealized gains and losses on the Statement of Operations, each categorized by type of derivative contract, are included in the following Additional Derivative Instrument Information footnote. The derivative instruments outstanding as of period-end are disclosed in the notes to the Schedule of Investments and the amounts of realized gains and losses and changes in unrealized gains and losses on derivative instruments during the period are disclosed in the Statement of Operations.
| a) | Foreign Currency Contracts – The Fund may enter into foreign currency contracts that obligate the Fund to purchase or sell currencies at specified future dates. Foreign currency contracts are used to hedge the currency exposure associated with some or all of the Fund’s investments and/or as part of an investment strategy. Foreign currency contracts are marked to market daily and the change in value is recorded by the Fund as an unrealized gain or loss. The Fund will record a realized gain or loss when the foreign currency contract is settled. |
Foreign currency contracts involve elements of market risk in excess of the amounts reflected in the Statement of Assets and Liabilities. In addition, risks may arise upon entering into these contracts from the potential inability of the counterparties to meet the terms of the contracts and from unanticipated movements in the value of the foreign currencies relative to the U.S. dollar. The Fund had outstanding foreign currency contracts as shown on the Schedule of Investments as of April 30, 2012.
| b) | Additional Derivative Instrument Information: |
Fair Values of Derivative Instruments on the Statement of Assets and Liabilities as of April 30, 2012:
| | | Risk Exposure Category | |
| | | Interest Rate
Contracts | | | Foreign
Exchange
Contracts | | | Credit
Contracts | | | Equity
Contracts | | | Commodity
Contracts | | | Other
Contracts | | | Total | |
| Assets: | | | | | | | | | | | | | | | | | | | | | | | | | | | | |
| Unrealized appreciation on foreign currency contracts | | $ | — | | | $ | 3 | | | $ | — | | | $ | — | | | $ | — | | | $ | — | | | $ | 3 | |
| Total | | $ | — | | | $ | 3 | | | $ | — | | | $ | — | | | $ | — | | | $ | — | | | $ | 3 | |
| | | | | | | | | | | | | | | | | | | | | | | | | | | | | |
| Liabilities: | | | | | | | | | | | | | | | | | | | | | | | | | | | | |
| Unrealized depreciation on foreign currency contracts | | $ | — | | | $ | — | | | $ | — | | | $ | — | | | $ | — | | | $ | — | | | $ | — | |
| Total | | $ | — | | | $ | — | | | $ | — | | | $ | — | | | $ | — | | | $ | — | | | $ | — | |
The volume of derivatives that is presented in the Schedule of Investments is consistent with the derivative activity during the six-month period ended April 30, 2012.
The Effect of Derivative Instruments on the Statement of Operations for the six-month period ended April 30, 2012:
| | | Risk Exposure Category | |
| | | Interest Rate
Contracts | | | Foreign
Exchange
Contracts | | | Credit
Contracts | | | Equity
Contracts | | | Commodity
Contracts | | | Other
Contracts | | | Total | |
| Realized Gain (Loss) on Derivatives Recognized as a Result of Operations: | | | | | | | | | | | | | | | | | |
| Net realized gain on foreign currency contracts | | $ | — | | | $ | 112 | | | $ | — | | | $ | — | | | $ | — | | | $ | — | | | $ | 112 | |
| Total | | $ | — | | | $ | 112 | | | $ | — | | | $ | — | | | $ | — | | | $ | — | | | $ | 112 | |
| | | | | | | | | | | | | | | | | | | | | | | | | | | | | |
| Net Change in Unrealized Appreciation (Depreciation) on Derivatives Recognized as a Result of Operations: | | | | | | | | | | | | |
| Net change in unrealized depreciation of foreign currency contracts | | $ | — | | | $ | (12 | ) | | $ | — | | | $ | — | | | $ | — | | | $ | — | | | $ | (12 | ) |
| Total | | $ | — | | | $ | (12 | ) | | $ | — | | | $ | — | | | $ | — | | | $ | — | | | $ | (12 | ) |
| a) | Counterparty Risk – The Fund may be exposed to counterparty risk, or the risk that an institution or other entity with which the Fund has unsettled or open transactions will default. |
| b) | Market Risks – If the Fund invests directly in foreign currencies or in securities that trade in, and receive revenues in, foreign currencies, or in derivatives that provide exposure to foreign currencies, it will be subject to the risk that those currencies will decline in value relative to the base currency of the Fund, or, in the case of hedging positions, that the Fund’s base currency will decline in value relative to the currency being hedged. Currency rates in foreign countries may fluctuate significantly over short periods of time for a number of reasons, including changes in interest rates, intervention (or the failure to intervene) by U.S. or foreign governments, central banks or supranational entities, such as the International Monetary Fund, or by the imposition of currency controls or other political developments in the United States or abroad. As a result, the Fund’s investments in foreign currency denominated securities may reduce the returns of the Fund. The market values of equity securities, such as common stocks and preferred stocks, or equity related investments, such as futures and options, may decline due to general market conditions which are not specifically related to a particular company, such as real or perceived adverse economic conditions, changes in the general outlook for corporate earnings, changes in interest or currency rates or adverse investor sentiment generally. The market value of equity securities may also decline due to factors which affect a particular industry or industries, such as labor shortages or increased production costs and competitive conditions within an industry. Equity securities and equity related investments generally have greater market price volatility than fixed income securities. |
| a) | Federal Income Taxes – For federal income tax purposes, the Fund intends to continue to qualify as a RIC under Subchapter M of the Internal Revenue Code (“IRC”) by distributing substantially all of its taxable net investment income and net realized capital gains to its shareholders and otherwise complying with the requirements of RICs. The Fund has distributed substantially all of its income and capital gains in prior years, if applicable, and intends to distribute substantially all of its income and capital gains during the calendar year ending December 31, 2012. Accordingly, no provision for federal income or excise taxes has been made in the accompanying financial statements. Distributions from short-term capital gains are treated as ordinary income distributions for federal income tax purposes. |
| b) | Net Investment Income (Loss), Net Realized Gains (Losses) – Net investment income (loss) and net realized gains (losses) may differ for financial statement and tax purposes primarily because of losses deferred due to wash sale adjustments, foreign currency gains and losses, adjustments related to PFICs, REITs, RICs, certain derivatives and partnerships. The character of distributions made during the year from net investment income or net realized gains may differ from their ultimate characterization for federal income tax purposes. Also, due to the timing of dividend |
| The Hartford Growth Opportunities Fund |
| Notes to Financial Statements – (continued) |
| April 30, 2012 (Unaudited) |
| (000’s Omitted) |
distributions, the fiscal year in which amounts are distributed may differ from the year that the income or realized gains (losses) were recorded by the Fund.
| c) | Distributions and Components of Distributable Earnings – The tax character of distributions paid by the Fund for the periods indicated is as follows (as adjusted for dividends payable): |
| | | For the Year Ended
October 31, 2011 | | | For the Year Ended
October 31, 2010 | |
| Ordinary Income | | $ | — | | | $ | 1,318 | |
As of October 31, 2011, the Fund’s components of distributable earnings (deficit) on a tax basis were as follows:
| | | Amount | |
| Accumulated Capital Losses * | | $ | (435,501 | ) |
| Unrealized Appreciation † | | | 72,644 | |
| Total Accumulated Deficit | | $ | (362,857 | ) |
| | * | The Fund has capital loss carryforwards that are identified in the Capital Loss Carryforward note that follows. |
| | † | The differences between book-basis and tax-basis unrealized appreciation (depreciation) may be attributable to the losses deferred due to wash sale adjustments, foreign currency gains and losses, adjustments related to PFICs, REITs, RICs, certain derivatives and partnerships. |
| d) | Reclassification of Capital Accounts – The Fund may record reclassifications in its capital accounts. These reclassifications have no impact on the total net assets of the Fund. The reclassifications are a result of permanent differences between U.S. GAAP and tax accounting for such items as foreign currency, PFICs, expiration or utilization of capital loss carryforwards or net operating losses. Adjustments are made to reflect the impact these items have on current and future distributions to shareholders. Therefore, the source of the Fund’s distributions may be shown in the accompanying Statement of Changes in Net Assets as from undistributed net investment income, from accumulated net realized gains on investments or from capital depending on the type of book and tax differences that exist. For the year ended October 31, 2011, the Fund recorded reclassifications to increase (decrease) the accounts listed below: |
| | | Amount | |
| Undistributed Net Investment Income | | $ | 8,371 | |
| Accumulated Net Realized Gain (Loss) | | | 1,202 | |
| Capital Stock and Paid-in-Capital | | | (9,573 | ) |
| e) | Capital Loss Carryforward – On December 22, 2010, the Regulated Investment Company Modernization Act of 2010 (the “Act”) was enacted, which made changes to the capital loss carryforward rules. The changes are effective for taxable years beginning after the date of enactment. Under the Act, funds are permitted to carry forward capital losses for an unlimited period. However, any losses incurred during those future taxable years will be required to be utilized prior to the losses incurred in pre-enactment taxable years, which carry an expiration date. As a result of this ordering rule, pre-enactment capital loss carryforwards may be more likely to expire unused. Additionally, post-enactment capital loss carryforwards retain their character as either short-term or long-term capital losses rather than being considered all short-term as permitted under prior regulation. |
At October 31, 2011 (tax-year-end), the Fund had capital loss carryforwards for U.S. federal income tax purposes as follows:
| Year of Expiration | | Amount | |
| 2017 | | $ | 435,501 | |
| Total | | $ | 435,501 | |
During the year ended October 31, 2011, the Fund utilized $262,411 of prior year capital loss carryforwards.
| f) | Accounting for Uncertainty in Income Taxes – The Fund has adopted financial reporting rules that require the Fund to analyze all open tax years, as defined by the statute of limitations, for all major jurisdictions. Generally, tax authorities can examine all tax returns filed for the last three years. The Fund does not have an examination in progress. |
The Fund has reviewed all open tax years and major jurisdictions and concluded that these financial reporting rules had no effect on the Fund’s financial position or results of operations. There is no tax liability resulting from unrecognized tax benefits relating to uncertain income tax positions taken or expected to be taken on the tax return for the fiscal year ended October 31, 2011. The Fund is also not aware of any tax positions for which it is reasonably possible that the total amounts of unrecognized tax benefits will significantly change in the next twelve months.
| a) | Investment Management Agreement – Hartford Investment Financial Services, LLC (“HIFSCO”), a wholly-owned indirect subsidiary of The Hartford Financial Services Group, Inc. (“The Hartford”), serves as investment manager to the Fund pursuant to an Investment Management Agreement with the Company. As investment manager, HIFSCO has overall investment supervisory responsibility for the Fund. In addition, HIFSCO provides administrative personnel, services, equipment, facilities and office space for proper operation of the Fund. HIFSCO has contracted with Wellington Management Company, LLP (“Wellington Management”) under a sub-advisory agreement for the provision of day-to-day investment management services to the Fund in accordance with the Fund’s investment objective and policies. The Fund pays a fee to HIFSCO, a portion of which may be used to compensate Wellington Management. |
The schedule below reflects the rates of compensation paid to HIFSCO for investment management services rendered as of April 30, 2012; the rates are accrued daily and paid monthly:
| Average Daily Net Assets | | Annual Fee | |
| On first $250 million | | | 0.8000 | % |
| On next $4.75 billion | | | 0.7000 | % |
| On next $5 billion | | | 0.6975 | % |
| Over $10 billion | | | 0.6950 | % |
| b) | Accounting Services Agreement – Pursuant to the Fund Accounting Agreement between Hartford Life Insurance Company (“HLIC”) and the Company, on behalf of the Fund, HLIC provides accounting services to the Fund and receives monthly compensation based on the Fund’s average net assets at the rates set forth below. The Fund’s accounting services fees are accrued daily and paid monthly. |
| Average Daily Net Assets | | Annual Fee | |
| On first $5 billion | | | 0.012 | % |
| Over $5 billion | | | 0.010 | % |
| The Hartford Growth Opportunities Fund |
| Notes to Financial Statements – (continued) |
| April 30, 2012 (Unaudited) |
| (000’s Omitted) |
| c) | Operating Expenses – Allocable expenses incurred by the Company are allocated to each Fund and allocated to classes within the Fund in proportion to the average daily net assets of the Fund and each class, except where allocation of certain expenses is more fairly made directly to the Fund or to specific classes within a Fund. As of April 30, 2012, HIFSCO contractually limited the total operating expenses of this Fund, exclusive of taxes, interest expense, brokerage commissions, acquired fund fees and expenses and extraordinary expenses as follows: |
| Class A | | | Class B | | | Class C | | | Class I | | | Class R3 | | | Class R4 | | | Class R5 | | | Class Y | |
| | 1.21 | % | | | 1.96 | % | | | 1.96 | % | | | 0.96 | % | | | 1.45 | % | | | 1.15 | % | | | 0.85 | % | | | 0.85 | % |
| d) | Fees Paid Indirectly – The Fund has entered into agreements with State Street Global Markets, LLC and Russell Implementation Services Inc. to partially recapture non-discounted trade commissions. Such rebates are used to pay a portion of the Fund’s expenses. In addition, the Fund’s custodian bank, State Street Bank and Trust Co., has also agreed to reduce its fees when the Fund maintains cash on deposit in a non-interest-bearing custody account. For the six-month period ended April 30, 2012, these amounts, if any, are included in the Statement of Operations. |
The ratio of expenses to average net assets in the accompanying financial highlights excludes the reduction in expenses related to fees paid indirectly. The annualized expense ratio for the period listed below reflecting the reduction for fees paid indirectly is as follows:
| | | Annualized Six-
Month Period
Ended
April 30, 2012 | |
| Class A | | | 1.21 | % |
| Class B | | | 1.96 | |
| Class C | | | 1.93 | |
| Class I | | | 0.96 | |
| Class R3 | | | 1.45 | |
| Class R4 | | | 1.15 | |
| Class R5 | | | 0.85 | |
| Class Y | | | 0.76 | |
| e) | Distribution and Service Plan for Class A, B, C, R3 and R4 Shares – HIFSCO is the principal underwriter and distributor of the Fund. HIFSCO is engaged in distribution activities, which include marketing and distribution of shares through broker-dealers, financing distribution costs and maintaining financial books and records. For the six-month period ended April 30, 2012, HIFSCO received front-end load sales charges of $393 and contingent deferred sales charges of $38 from the Fund. |
The Fund has adopted a Distribution and Service Plan in accordance with Rule 12b-1 of the 1940 Act to compensate the distributor (HIFSCO) for activities intended to result in the sale and distribution of Class A, B, C, R3 and R4 shares and for providing services for shareholders. The Rule 12b-1 plan applicable to Class A shares of the Fund provides for payment of a Rule 12b-1 fee of 0.25% of average daily net assets. Some or all of the fee may be used for shareholder servicing expenses with the remainder used for distribution expenses. Some or the entire Rule 12b-1 fee for Class B shares may be remitted to broker-dealers for distribution and/or shareholder account services. Under the Class B Plan, the Fund pays the distributor 1.00% of the average daily net assets of Class B shares that are outstanding for 8 years or less, 0.25% of which is a fee for services provided to existing shareholders with the remainder used for distribution expenses. After eight years, Class B shares convert to Class A shares. Upon conversion to Class A shares, the Class A plan described above will apply to those shares. Under the Class C Plan, the Fund pays the distributor 1.00% of the average daily net assets of Class C shares outstanding, 0.25% of which is intended as a fee for services provided to existing shareholders with the remainder used for distribution expenses. For Class C shares, some or the entire fee may be remitted to broker-dealers for distribution and/or shareholder account services. Class R3 shares have a distribution fee of 0.50% of average daily net assets and Class R4 shares have a distribution fee of 0.25% of average daily net assets. For
Class R3 and R4 shares, some or the entire fee may be remitted to broker dealers for distribution and/or shareholder account services. The Fund’s 12b-1 fees are accrued daily and paid monthly.
For the six-month period ended April 30, 2012, total sales commissions paid to affiliated brokers/dealers of The Hartford for distributing the Fund's shares were $65. These commissions are in turn paid to sales representatives of the broker/dealers.
| f) | Other Related Party Transactions – Certain officers of the Fund are directors and/or officers of HIFSCO and/or The Hartford or its subsidiaries. For the six-month period ended April 30, 2012, a portion of the Fund’s chief compliance officer’s compensation was paid by all of the investment companies in the Hartford fund complex. The portion allocated to the Fund was in the amount of $1. Hartford Administrative Services Company (“HASCO”), an indirect wholly-owned subsidiary of The Hartford, provides transfer agent services to the Fund. HASCO has contractually agreed to reimburse any portion of the transfer agency fees over 0.30% of average daily net assets per fiscal year for each class. For providing such services, HASCO is compensated on a per account basis that varies by account type, except with respect to Class Y, for which it is compensated based on average daily net assets. The amount paid to HASCO and any related contractual reimbursement amounts, if applicable, can be found in the Statement of Operations. These fees are accrued daily and paid monthly. |
Administrative services fees are paid to HASCO for third-party recordkeeping services that are payable as a percentage of net assets in the amount of 0.20%, 0.15% and 0.10% for Classes R3, R4 and R5 shares, respectively. The total administrative services fees are shown on the Statement of Operations. These fees are accrued daily and paid monthly.
| g) | Payment from Affiliate – On November 8, 2006, the SEC issued an order setting forth the terms of a settlement reached with three subsidiaries of The Hartford that resolved the SEC’s Division of Enforcement’s investigation of aspects of The Hartford’s variable annuity and mutual fund operations related to directed brokerage and revenue sharing. The Hartford settled this matter without admitting or denying the findings of the SEC. |
The total return in the accompanying financial highlights includes a payment from affiliate. Had the payment from affiliate been excluded, the impact and total return for the periods listed below would have been as follows:
| | | Impact from Payment from
Affiliate for SEC Settlement for
the Year Ended
October 31, 2007 | | | Total Return Excluding Payment
from Affiliate for the Year Ended
October 31, 2007 | |
| Class A | | | 0.03 | % | | | 40.34 | % |
| Class B | | | 0.04 | | | | 39.24 | |
| Class C | | | 0.04 | | | | 39.35 | |
| Class I | | | 0.03 | | | | 40.84 | |
| Class L | | | 0.03 | | | | 40.72 | |
| Class Y | | | 0.03 | | | | 41.02 | |
| 8. | Investment Transactions: |
For the six-month period ended April 30, 2012, the Fund's aggregate purchases and sales of investment securities (excluding short-term investments) were as follows:
| | | Amount | |
| Cost of Purchases Excluding U.S. Government Obligations | | $ | 840,487 | |
| Sales Proceeds Excluding U.S. Government Obligations | | | 1,069,009 | |
| The Hartford Growth Opportunities Fund |
| Notes to Financial Statements – (continued) |
| April 30, 2012 (Unaudited) |
| (000’s Omitted) |
| 9. | Capital Share Transactions: |
The following information is for the six-month period ended April 30, 2012, and the year ended October 31, 2011:
| | | For the Six-Month Period Ended April 30, 2012 | | | For the Year Ended October 31, 2011 | |
| | | Shares
Sold | | | Shares
Issued for
Reinvested
Dividends | | | Shares
Redeemed | | | Shares
Issued
from
Merger | | | Net Increase
(Decrease) of
Shares | | | Shares
Sold | | | Shares
Issued for
Reinvested
Dividends | | | Shares
Redeemed | | | Shares
Issued from
Merger | | | Net Increase
(Decrease) of
Shares | |
| Class A | | | | | | | | | | | | | | | | | | | | | | | | | | | | | | | | | | | | | | | | |
| Shares | | | 1,150 | | | | — | | | | (3,525 | ) | | | — | | | | (2,375 | ) | | | 2,652 | | | | — | | | | (6,839 | ) | | | 15,814 | | | | 11,627 | |
| Amount | | $ | 31,580 | | | $ | — | | | $ | (93,937 | ) | | $ | — | | | $ | (62,357 | ) | | $ | 72,474 | | | $ | — | | | $ | (184,293 | ) | | $ | 312,023 | | | $ | 200,204 | |
| Class B | | | | | | | | | | | | | | | | | | | | | | | | | | | | | | | | | | | | | | | | |
| Shares | | | 28 | | | | — | | | | (248 | ) | | | — | | | | (220 | ) | | | 38 | | | | — | | | | (427 | ) | | | — | | | | (389 | ) |
| Amount | | $ | 595 | | | $ | — | | | $ | (5,272 | ) | | $ | — | | | $ | (4,677 | ) | | $ | 828 | | | $ | — | | | $ | (9,175 | ) | | $ | — | | | $ | (8,347 | ) |
| Class C | | | | | | | | | | | | | | | | | | | | | | | | | | | | | | | | | | | | | | | | |
| Shares | | | 243 | | | | — | | | | (1,005 | ) | | | — | | | | (762 | ) | | | 762 | | | | — | | | | (2,461 | ) | | | — | | | | (1,699 | ) |
| Amount | | $ | 5,256 | | | $ | — | | | $ | (21,169 | ) | | $ | — | | | $ | (15,913 | ) | | $ | 16,856 | | | $ | — | | | $ | (53,527 | ) | | $ | — | | | $ | (36,671 | ) |
| Class I | | | | | | | | | | | | | | | | | | | | | | | | | | | | | | | | | | | | | | | | |
| Shares | | | 7,640 | | | | — | | | | (6,904 | ) | | | — | | | | 736 | | | | 21,958 | | | | — | | | | (11,724 | ) | | | — | | | | 10,234 | |
| Amount | | $ | 212,978 | | | $ | — | | | $ | (185,984 | ) | | $ | — | | | $ | 26,994 | | | $ | 617,676 | | | $ | — | | | $ | (319,495 | ) | | $ | — | | | $ | 298,181 | |
| Class L | | | | | | | | | | | | | | | | | | | | | | | | | | | | | | | | | | | | | | | | |
| Shares | | | — | | | | — | | | | — | | | | — | | | | — | | | | 235 | | | | — | | | | (1,670 | ) | | | (15,385 | ) | | | (16,820 | ) |
| Amount | | $ | — | | | $ | — | | | $ | — | | | $ | — | | | $ | — | | | $ | 6,709 | | | $ | — | | | $ | (47,681 | ) | | $ | (312,023 | ) | | $ | (352,995 | ) |
| Class R3 | | | | | | | | | | | | | | | | | | | | | | | | | | | | | | | | | | | | | | | | |
| Shares | | | 113 | | | | — | | | | (98 | ) | | | — | | | | 15 | | | | 269 | | | | — | | | | (187 | ) | | | — | | | | 82 | |
| Amount | | $ | 3,176 | | | $ | — | | | $ | (2,747 | ) | | $ | — | | | $ | 429 | | | $ | 7,426 | | | $ | — | | | $ | (5,129 | ) | | $ | — | | | $ | 2,297 | |
| Class R4 | | | | | | | | | | | | | | | | | | | | | | | | | | | | | | | | | | | | | | | | |
| Shares | | | 175 | | | | — | | | | (266 | ) | | | — | | | | (91 | ) | | | 296 | | | | — | | | | (617 | ) | | | — | | | | (321 | ) |
| Amount | | $ | 4,716 | | | $ | — | | | $ | (7,380 | ) | | $ | — | | | $ | (2,664 | ) | | $ | 8,244 | | | $ | — | | | $ | (17,263 | ) | | $ | — | | | $ | (9,019 | ) |
| Class R5 | | | | | | | | | | | | | | | | | | | | | | | | | | | | | | | | | | | | | | | | |
| Shares | | | 66 | | | | — | | | | (113 | ) | | | — | | | | (47 | ) | | | 531 | | | | — | | | | (561 | ) | | | — | | | | (30 | ) |
| Amount | | $ | 1,853 | | | $ | — | | | $ | (3,163 | ) | | $ | — | | | $ | (1,310 | ) | | $ | 15,120 | | | $ | — | | | $ | (16,194 | ) | | $ | — | | | $ | (1,074 | ) |
| Class Y | | | | | | | | | | | | | | | | | | | | | | | | | | | | | | | | | | | | | | | | |
| Shares | | | 247 | | | | — | | | | (782 | ) | | | — | | | | (535 | ) | | | 346 | | | | — | | | | (2,018 | ) | | | — | | | | (1,672 | ) |
| Amount | | $ | 6,925 | | | $ | — | | | $ | (22,380 | ) | | $ | — | | | $ | (15,455 | ) | | $ | 9,849 | | | $ | — | | | $ | (57,431 | ) | | $ | — | | | $ | (47,582 | ) |
| Total | | | | | | | | | | | | | | | | | | | | | | | | | | | | | | | | | | | | | | | | |
| Shares | | | 9,662 | | | | — | | | | (12,941 | ) | | | — | | | | (3,279 | ) | | | 27,087 | | | | — | | | | (26,504 | ) | | | 429 | | | | 1,012 | |
| Amount | | $ | 267,079 | | | $ | — | | | $ | (342,032 | ) | | $ | — | | | $ | (74,953 | ) | | $ | 755,182 | | | $ | — | | | $ | (710,188 | ) | | $ | — | | | $ | 44,994 | |
The following reflects the conversion of Class B shares into Class A shares (reflected as Class A shares sold) for the six-month period ended April 30, 2012, and the year ended October 31, 2011:
| | | Shares | | | Dollars | |
| For the Six-Month Period Ended April 30, 2012 | | | 47 | | | $ | 1,263 | |
| For the Year Ended October 31, 2011 | | | 51 | | | $ | 1,346 | |
The Fund is one of several Hartford funds that participate in a $500 million committed revolving line of credit facility. The facility is to be used for temporary or emergency purposes. Under the arrangement, the funds are required to own securities having a market value in excess of 300% of the total bank borrowings. The interest rate on borrowings varies depending on the nature of the loan. The facility also requires a fee to be paid based on the amount of the commitment. This commitment fee is allocated to all of the funds participating in the line of credit based on the average net assets of the funds. During the six-month period ended April 30, 2012, the Fund did not have any borrowings under this facility.
At its May 3, 2011, meeting, the Board of Directors of The Hartford Mutual Funds II, Inc. approved the reclassification of Class L shares into Class A shares of the Fund.
Effective with the close of business on August 5, 2011, Class L was merged into Class A. The merger was accomplished by a tax-free exchange as detailed below:
| | | Class A | | | Class L | |
| Shares exchanged | | | N/A | | | | 15,385 | |
| Shares issued - to Class L shareholders | | | 15,814 | | | | N/A | |
| Net assets immediately before merger | | $ | 371,266 | | | $ | 402,076 | |
| Net assets immediately after merger | | $ | 773,342 | | | | N/A | |
| 12. | Industry Classifications: |
Other than the industry classifications “Other Investment Pools and Funds” and “Exchange Traded Funds,” equity industry classifications used in this report are the Global Industry Classification Standard, which was developed by and is the exclusive property and service mark of MSCI, Inc. and Standard & Poor’s.
| 13. | Pending Legal Proceedings: |
On February 25, 2011, Jennifer L. Kasilag, Louis Mellinger, Judith M. Menendez, Jacqueline M. Robinson, and Linda A. Russell filed a derivative lawsuit against HIFSCO on behalf of six funds: The Hartford Global Health Fund (now known as The Hartford Healthcare Fund), The Hartford Conservative Allocation Fund, The Hartford Growth Opportunities Fund, The Hartford Inflation Plus Fund, The Hartford Advisers Fund (now known as The Hartford Balanced Fund) and The Hartford Money Market Fund. The lawsuit, which was filed in the United States District Court for the District of New Jersey, seeks recovery under Section 36(b) of the 1940 Act for the alleged overpayment of investment management and 12b-1 distribution fees to HIFSCO. The plaintiffs seek recovery of the alleged overpayments or, alternatively, rescission of the contracts and restitution of all fees paid, together with lost earnings. On November 14, 2011, the plaintiffs filed an amended complaint, which dropped The Hartford Money Market Fund and added The Hartford Capital Appreciation Fund as a plaintiff. The Hartford intends to vigorously defend the action.
No accrual for litigation relating to this matter has been recorded in the financial statements of the Fund because the Fund is not party to the suit.
Under the Company’s organizational documents, the Company shall indemnify its officers and directors to the full extent required or permitted under Maryland General Corporation Law and the federal securities laws. In addition, the Company, on behalf of the Fund, may enter into contracts that contain a variety of indemnifications. The Company’s maximum exposure under these arrangements is unknown. However, as of the date of these financial statements, the Company has not had prior claims or losses pursuant to these contracts and expects the risk of loss to be remote.
| The Hartford Growth Opportunities Fund |
| Financial Highlights |
| - Selected Per-Share Data (A) - |
| Class | | Net Asset
Value at
Beginning of
Period | | | Net Investment
Income (Loss) | | | Payments from
(to) Affiliate | | | Net Realized
and Unrealized
Gain (Loss) on
Investments | | | Total from
Investment
Operations | | | Dividends from
Net Investment
Income | | | Distributions
from Realized
Capital Gains | | | Distributions
from Capital | | | Total
Distributions | | | Net Increase
(Decrease) in
Net Asset
Value | | | Net Asset
Value at End
of Period | |
| | | | | | | | | | | | | | | | | | | | | | | | |
| For the Six-Month Period Ended April 30, 2012 (Unaudited) | | | | | | | | | | | | | | | | | | | | | | | |
| A | | $ | 25.98 | | | $ | (0.08 | ) | | $ | – | | | $ | 3.28 | | | $ | 3.20 | | | $ | – | | | $ | – | | | $ | – | | | $ | – | | | $ | 3.20 | | | $ | 29.18 | |
| B | | | 20.72 | | | | (0.15 | ) | | | – | | | | 2.62 | | | | 2.47 | | | | – | | | | – | | | | – | | | | – | | | | 2.47 | | | | 23.19 | |
| C | | | 20.80 | | | | (0.14 | ) | | | – | | | | 2.61 | | | | 2.47 | | | | – | | | | – | | | | – | | | | – | | | | 2.47 | | | | 23.27 | |
| I | | | 26.39 | | | | (0.04 | ) | | | – | | | | 3.32 | | | | 3.28 | | | | – | | | | – | | | | – | | | | – | | | | 3.28 | | | | 29.67 | |
| R3 | | | 26.48 | | | | (0.10 | ) | | | – | | | | 3.31 | | | | 3.21 | | | | – | | | | – | | | | – | | | | – | | | | 3.21 | | | | 29.69 | |
| R4 | | | 26.89 | | | | (0.07 | ) | | | – | | | | 3.38 | | | | 3.31 | | | | – | | | | – | | | | – | | | | – | | | | 3.31 | | | | 30.20 | |
| R5 | | | 27.20 | | | | (0.03 | ) | | | – | | | | 3.42 | | | | 3.39 | | | | – | | | | – | | | | – | | | | – | | | | 3.39 | | | | 30.59 | |
| Y | | | 27.32 | | | | (0.01 | ) | | | – | | | | 3.44 | | | | 3.43 | | | | – | | | | – | | | | – | | | | – | | | | 3.43 | | | | 30.75 | |
| | | | | | | | | | | | | | | | | | | | | | | | | | | | | | | | | | | | | | | | | | | | | |
| For the Year Ended October 31, 2011 (G) | | | | | | | | | | | | | | | | | | | | | | | | | | |
| A(H) | | | 24.78 | | | | 0.02 | | | | – | | | | 1.18 | | | | 1.20 | | | | – | | | | – | | | | – | | | | – | | | | 1.20 | | | | 25.98 | |
| B | | | 19.93 | | | | (0.29 | ) | | | – | | | | 1.08 | | | | 0.79 | | | | – | | | | – | | | | – | | | | – | | | | 0.79 | | | | 20.72 | |
| C | | | 19.98 | | | | (0.26 | ) | | | – | | | | 1.08 | | | | 0.82 | | | | – | | | | – | | | | – | | | | – | | | | 0.82 | | | | 20.80 | |
| I | | | 25.10 | | | | (0.06 | ) | | | – | | | | 1.35 | | | | 1.29 | | | | – | | | | – | | | | – | | | | – | | | | 1.29 | | | | 26.39 | |
| R3 | | | 25.31 | | | | (0.20 | ) | | | – | | | | 1.37 | | | | 1.17 | | | | – | | | | – | | | | – | | | | – | | | | 1.17 | | | | 26.48 | |
| R4 | | | 25.63 | | | | (0.12 | ) | | | – | | | | 1.38 | | | | 1.26 | | | | – | | | | – | | | | – | | | | – | | | | 1.26 | | | | 26.89 | |
| R5 | | | 25.85 | | | | (0.04 | ) | | | – | | | | 1.39 | | | | 1.35 | | | | – | | | | – | | | | – | | | | – | | | | 1.35 | | | | 27.20 | |
| Y | | | 25.94 | | | | (0.01 | ) | | | – | | | | 1.39 | | | | 1.38 | | | | – | | | | – | | | | – | | | | – | | | | 1.38 | | | | 27.32 | |
| | | | | | | | | | | | | | | | | | | | | | | | | | | | | | | | | | | | | | | | | | | | | |
| For the Year Ended October 31, 2010 (G) | | | | | | | | | | | | | | | | | | | | | | | | | | |
| A | | | 20.69 | | | | (0.13 | ) | | | – | | | | 4.22 | | | | 4.09 | | | | – | | | | – | | | | – | | | | – | | | | 4.09 | | | | 24.78 | |
| B | | | 16.77 | | | | (0.25 | ) | | | – | | | | 3.41 | | | | 3.16 | | | | – | | | | – | | | | – | | | | – | | | | 3.16 | | | | 19.93 | |
| C | | | 16.78 | | | | (0.23 | ) | | | – | | | | 3.43 | | | | 3.20 | | | | – | | | | – | | | | – | | | | – | | | | 3.20 | | | | 19.98 | |
| I | | | 20.91 | | | | (0.05 | ) | | | – | | | | 4.28 | | | | 4.23 | | | | (0.04 | ) | | | – | | | | – | | | | (0.04 | ) | | | 4.19 | | | | 25.10 | |
| R3 | | | 21.17 | | | | (0.18 | ) | | | – | | | | 4.32 | | | | 4.14 | | | | – | | | | – | | | | – | | | | – | | | | 4.14 | | | | 25.31 | |
| R4 | | | 21.37 | | | | (0.10 | ) | | | – | | | | 4.36 | | | | 4.26 | | | | – | | | | – | | | | – | | | | – | | | | 4.26 | | | | 25.63 | |
| R5 | | | 21.52 | | | | (0.03 | ) | | | – | | | | 4.40 | | | | 4.37 | | | | (0.04 | ) | | | – | | | | – | | | | (0.04 | ) | | | 4.33 | | | | 25.85 | |
| Y | | | 21.59 | | | | (0.01 | ) | | | – | | | | 4.42 | | | | 4.41 | | | | (0.06 | ) | | | – | | | | – | | | | (0.06 | ) | | | 4.35 | | | | 25.94 | |
| | | | | | | | | | | | | | | | | | | | | | | | | | | | | | | | | | | | | | | | | | | | | |
| For the Year Ended October 31, 2009 | | | | | | | | | | | | | | | | | | | | | | | | | | |
| A | | | 18.60 | | | | 0.02 | | | | – | | | | 2.07 | | | | 2.09 | | | | – | | | | – | | | | – | | | | – | | | | 2.09 | | | | 20.69 | |
| B | | | 15.16 | | | | (0.09 | ) | | | – | | | | 1.70 | | | | 1.61 | | | | – | | | | – | | | | – | | | | – | | | | 1.61 | | | | 16.77 | |
| C | | | 15.21 | | | | (0.13 | ) | | | – | | | | 1.70 | | | | 1.57 | | | | – | | | | – | | | | – | | | | – | | | | 1.57 | | | | 16.78 | |
| I | | | 18.74 | | | | 0.02 | | | | – | | | | 2.15 | | | | 2.17 | | | | – | | | | – | | | | – | | | | – | | | | 2.17 | | | | 20.91 | |
| R3 | | | 19.08 | | | | (0.04 | ) | | | – | | | | 2.13 | | | | 2.09 | | | | – | | | | – | | | | – | | | | – | | | | 2.09 | | | | 21.17 | |
| R4 | | | 19.19 | | | | 0.01 | | | | – | | | | 2.17 | | | | 2.18 | | | | – | | | | – | | | | – | | | | – | | | | 2.18 | | | | 21.37 | |
| R5 | | | 19.28 | | | | 0.02 | | | | – | | | | 2.22 | | | | 2.24 | | | | – | | | | – | | | | – | | | | – | | | | 2.24 | | | | 21.52 | |
| Y | | | 19.31 | | | | 0.10 | | | | – | | | | 2.18 | | | | 2.28 | | | | – | | | | – | | | | – | | | | – | | | | 2.28 | | | | 21.59 | |
| | | | | | | | | | | | | | | | | | | | | | | | | | | | | | | | | | | | | | | | | | | | | |
| For the Year Ended October 31, 2008 (G) | | | | | | | | | | | | | | | | | | | | | | | | | | |
| A | | | 38.24 | | | | (0.05 | ) | | | – | | | | (15.21 | ) | | | (15.26 | ) | | | – | | | | (4.38 | ) | | | – | | | | (4.38 | ) | | | (19.64 | ) | | | 18.60 | |
| B | | | 32.23 | | | | (0.22 | ) | | | – | | | | (12.47 | ) | | | (12.69 | ) | | | – | | | | (4.38 | ) | | | – | | | | (4.38 | ) | | | (17.07 | ) | | | 15.16 | |
| C | | | 32.27 | | | | (0.19 | ) | | | – | | | | (12.49 | ) | | | (12.68 | ) | | | – | | | | (4.38 | ) | | | – | | | | (4.38 | ) | | | (17.06 | ) | | | 15.21 | |
| I | | | 38.39 | | | | 0.07 | | | | – | | | | (15.25 | ) | | | (15.18 | ) | | | (0.09 | ) | | | (4.38 | ) | | | – | | | | (4.47 | ) | | | (19.65 | ) | | | 18.74 | |
| R3 | | | 39.18 | | | | (0.11 | ) | | | – | | | | (15.61 | ) | | | (15.72 | ) | | | – | | | | (4.38 | ) | | | – | | | | (4.38 | ) | | | (20.10 | ) | | | 19.08 | |
| R4 | | | 39.33 | | | | (0.02 | ) | | | – | | | | (15.68 | ) | | | (15.70 | ) | | | (0.06 | ) | | | (4.38 | ) | | | – | | | | (4.44 | ) | | | (20.14 | ) | | | 19.19 | |
| R5 | | | 39.39 | | | | 0.06 | | | | – | | | | (15.72 | ) | | | (15.66 | ) | | | (0.07 | ) | | | (4.38 | ) | | | – | | | | (4.45 | ) | | | (20.11 | ) | | | 19.28 | |
| Y | | | 39.43 | | | | 0.10 | | | | – | | | | (15.76 | ) | | | (15.66 | ) | | | (0.08 | ) | | | (4.38 | ) | | | – | | | | (4.46 | ) | | | (20.12 | ) | | | 19.31 | |
| | | | | | | | | | | | | | | | | | | | | | | | | | | | | | | | | | | | | | | | | | | | | |
| For the Year Ended October 31, 2007 | | | | | | | | | | | | | | | | | | | | | | | | | | |
| A | | | 29.33 | | | | (0.03 | ) | | | 0.01 | | | | 11.05 | | | | 11.03 | | | | – | | | | (2.12 | ) | | | – | | | | (2.12 | ) | | | 8.91 | | | | 38.24 | |
| B | | | 25.23 | | | | (0.20 | ) | | | 0.01 | | | | 9.31 | | | | 9.12 | | | | – | | | | (2.12 | ) | | | – | | | | (2.12 | ) | | | 7.00 | | | | 32.23 | |
| C | | | 25.24 | | | | (0.10 | ) | | | – | | | | 9.25 | | | | 9.15 | | | | – | | | | (2.12 | ) | | | – | | | | (2.12 | ) | | | 7.03 | | | | 32.27 | |
| I | | | 29.34 | | | | 0.01 | | | | – | | | | 11.16 | | | | 11.17 | | | | – | | | | (2.12 | ) | | | – | | | | (2.12 | ) | | | 9.05 | | | | 38.39 | |
| R3(J) | | | 29.39 | | | | (0.08 | ) | | | – | | | | 9.87 | | | | 9.79 | | | | – | | | | – | | | | – | | | | – | | | | 9.79 | | | | 39.18 | |
| R4(J) | | | 29.39 | | | | (0.01 | ) | | | – | | | | 9.95 | | | | 9.94 | | | | – | | | | – | | | | – | | | | – | | | | 9.94 | | | | 39.33 | |
| R5(J) | | | 29.39 | | | | – | | | | – | | | | 10.00 | | | | 10.00 | | | | – | | | | – | | | | – | | | | – | | | | 10.00 | | | | 39.39 | |
| Y(K) | | | 30.04 | | | | 0.15 | | | | 0.01 | | | | 11.35 | | | | 11.51 | | | | – | | | �� | (2.12 | ) | | | – | | | | (2.12 | ) | | | 9.39 | | | | 39.43 | |
| - Ratios and Supplemental Data - |
| Total Return(B) | | | Net Assets at End of
Period (000's) | | | Ratio of Expenses to Average Net
Assets Before Waivers and
Reimbursements and Including
Expenses not Subject to Cap(C) | | | Ratio of Expenses to Average Net
Assets After Waivers and
Reimbursements and Including
Expenses not Subject to Cap(C) | | | Ratio of Expenses to Average Net
Assets After Waivers and
Reimbursements and Excluding
Expenses not Subject to Cap(C) | | | Ratio of Net Investment
Income to Average Net
Assets | | | Portfolio
Turnover
Rate(D) | |
| | | | | | | | | | | | | | | | | | | | |
| | | | | | | | | | | | | | | | | | | | |
| | 12.32 | %(E) | | $ | 777,957 | | | | 1.23 | %(F) | | | 1.21 | %(F) | | | 1.21 | %(F) | | | (0.55 | )%(F) | | | 46 | % |
| | 11.92 | (E) | | | 26,084 | | | | 2.16 | (F) | | | 1.96 | (F) | | | 1.96 | (F) | | | (1.30 | )(F) | | | – | |
| | 11.88 | (E) | | | 125,517 | | | | 1.93 | (F) | | | 1.93 | (F) | | | 1.93 | (F) | | | (1.28 | )(F) | | | – | |
| | 12.43 | (E) | | | 911,279 | | | | 0.96 | (F) | | | 0.96 | (F) | | | 0.96 | (F) | | | (0.30 | )(F) | | | – | |
| | 12.12 | (E) | | | 15,519 | | | | 1.48 | (F) | | | 1.45 | (F) | | | 1.45 | (F) | | | (0.80 | )(F) | | | – | |
| | 12.31 | (E) | | | 37,963 | | | | 1.16 | (F) | | | 1.15 | (F) | | | 1.15 | (F) | | | (0.49 | )(F) | | | – | |
| | 12.46 | (E) | | | 14,459 | | | | 0.86 | (F) | | | 0.85 | (F) | | | 0.85 | (F) | | | (0.19 | )(F) | | | – | |
| | 12.55 | (E) | | | 94,141 | | | | 0.76 | (F) | | | 0.76 | (F) | | | 0.76 | (F) | | | (0.10 | )(F) | | | – | |
| | | | | | | | | | | | | | | | | | | | | | | | | | | |
| | | | | | | | | | | | | | | | | | | | | | | | | | | |
| | 4.84 | | | | 754,532 | | | | 1.22 | | | | 1.22 | | | | 1.22 | | | | 0.06 | | | | 121 | |
| | 3.96 | | | | 27,884 | | | | 2.13 | | | | 2.04 | | | | 2.04 | | | | (1.32 | ) | | | – | |
| | 4.10 | | | | 128,016 | | | | 1.92 | | | | 1.92 | | | | 1.92 | | | | (1.20 | ) | | | – | |
| | 5.14 | | | | 791,091 | | | | 0.92 | | | | 0.92 | | | | 0.92 | | | | (0.22 | ) | | | – | |
| | 4.62 | | | | 13,444 | | | | 1.48 | | | | 1.45 | | | | 1.45 | | | | (0.74 | ) | | | – | |
| | 4.92 | | | | 36,249 | | | | 1.16 | | | | 1.15 | | | | 1.15 | | | | (0.43 | ) | | | – | |
| | 5.22 | | | | 14,132 | | | | 0.86 | | | | 0.85 | | | | 0.85 | | | | (0.15 | ) | | | – | |
| | 5.32 | | | | 98,278 | | | | 0.76 | | | | 0.76 | | | | 0.76 | | | | (0.04 | ) | | | – | |
| | | | | | | | | | | | | | | | | | | | | | | | | | | |
| | | | | | | | | | | | | | | | | | | | | | | | | | | |
| | 19.77 | | | | 431,465 | | | | 1.35 | | | | 1.32 | | | | 1.32 | | | | (0.57 | ) | | | 115 | |
| | 18.84 | | | | 34,559 | | | | 2.18 | | | | 2.07 | | | | 2.07 | | | | (1.33 | ) | | | – | |
| | 19.07 | | | | 156,903 | | | | 1.95 | | | | 1.95 | | | | 1.95 | | | | (1.21 | ) | | | – | |
| | 20.23 | | | | 495,439 | | | | 0.93 | | | | 0.93 | | | | 0.93 | | | | (0.22 | ) | | | – | |
| | 19.56 | | | | 10,772 | | | | 1.49 | | | | 1.49 | | | | 1.49 | | | | (0.77 | ) | | | – | |
| | 19.93 | | | | 42,770 | | | | 1.17 | | | | 1.17 | | | | 1.17 | | | | (0.44 | ) | | | – | |
| | 20.34 | | | | 14,203 | | | | 0.87 | | | | 0.87 | | | | 0.87 | | | | (0.14 | ) | | | – | |
| | 20.44 | | | | 136,662 | | | | 0.77 | | | | 0.77 | | | | 0.77 | | | | (0.04 | ) | | | – | |
| | | | | | | | | | | | | | | | | | | | | | | | | | | |
| | | | | | | | | | | | | | | | | | | | | | | | | | | |
| | 11.24 | | | | 746,980 | | | | 1.47 | | | | 1.24 | | | | 1.24 | | | | 0.11 | | | | 137 | |
| | 10.62 | | | | 36,371 | | | | 2.36 | | | | 1.84 | | | | 1.84 | | | | (0.53 | ) | | | – | |
| | 10.32 | | | | 173,788 | | | | 2.04 | | | | 2.04 | | | | 2.04 | | | | (0.72 | ) | | | – | |
| | 11.58 | | | | 360,198 | | | | 0.99 | | | | 0.99 | | | | 0.99 | | | | 0.23 | | | | – | |
| | 10.95 | | | | 8,468 | | | | 1.55 | | | | 1.55 | | | | 1.55 | | | | (0.28 | ) | | | – | |
| | 11.36 | | | | 35,421 | | | | 1.21 | | | | 1.21 | | | | 1.21 | | | | 0.05 | | | | – | |
| | 11.62 | | | | 11,967 | | | | 0.92 | | | | 0.92 | | | | 0.92 | | | | 0.20 | | | | – | |
| | 11.81 | | | | 172,228 | | | | 0.80 | | | | 0.80 | | | | 0.80 | | | | 0.50 | | | | – | |
| | | | | | | | | | | | | | | | | | | | | | | | | | | |
| | | | | | | | | | | | | | | | | | | | | | | | | | | |
| | (44.66 | ) | | | 1,145,281 | | | | 1.31 | | | | 1.31 | | | | 1.31 | | | | (0.19 | ) | | | 142 | |
| | (45.07 | ) | | | 38,167 | | | | 2.13 | | | | 2.05 | | | | 2.05 | | | | (0.93 | ) | | | – | |
| | (44.97 | ) | | | 201,128 | | | | 1.93 | | | | 1.93 | | | | 1.93 | | | | (0.81 | ) | | | – | |
| | (44.35 | ) | | | 118,918 | | | | 0.86 | | | | 0.86 | | | | 0.86 | | | | 0.25 | | | | – | |
| | (44.77 | ) | | | 5,391 | | | | 1.52 | | | | 1.52 | | | | 1.52 | | | | (0.39 | ) | | | – | |
| | (44.60 | ) | | | 19,129 | | | | 1.19 | | | | 1.19 | | | | 1.19 | | | | (0.08 | ) | | | – | |
| | (44.41 | ) | | | 3,169 | | | | 0.93 | | | | 0.93 | | | | 0.93 | | | | 0.22 | | | | – | |
| | (44.38 | ) | | | 133,048 | | | | 0.78 | | | | 0.78 | | | | 0.78 | | | | 0.34 | | | | – | |
| | | | | | | | | | | | | | | | | | | | | | | | | | | |
| | | | | | | | | | | | | | | | | | | | | | | | | | | |
| | 40.39 | (I) | | | 989,969 | | | | 1.42 | | | | 1.31 | | | | 1.31 | | | | (0.12 | ) | | | 120 | |
| | 39.29 | (I) | | | 56,396 | | | | 2.18 | | | | 2.11 | | | | 2.11 | | | | (0.88 | ) | | | – | |
| | 39.40 | (I) | | | 201,274 | | | | 1.98 | | | | 1.98 | | | | 1.98 | | | | (0.82 | ) | | | – | |
| | 40.89 | (I) | | | 40,678 | | | | 0.86 | | | | 0.86 | | | | 0.86 | | | | 0.09 | | | | – | |
| | 33.31 | (E) | | | 322 | | | | 1.58 | (F) | | | 1.58 | (F) | | | 1.58 | (F) | | | (0.69 | )(F) | | | – | |
| | 33.82 | (E) | | | 3,402 | | | | 1.23 | (F) | | | 1.23 | (F) | | | 1.23 | (F) | | | (0.18 | )(F) | | | – | |
| | 34.03 | (E) | | | 81 | | | | 0.92 | (F) | | | 0.92 | (F) | | | 0.92 | (F) | | | 0.01 | (F) | | | – | |
| | 41.07 | (I) | | | 138,065 | | | | 0.80 | | | | 0.80 | | | | 0.80 | | | | 0.53 | | | | – | |
| The Hartford Growth Opportunities Fund |
| Financial Highlights – (continued) |
| (A) | Information presented relates to a share outstanding throughout the indicated period. |
| (B) | Assumes initial investment at net asset value at the beginning of each period, reinvestment of all distributions, the complete redemption of the investment at net asset value at the end of each period and no sales charge. Total return would be reduced if sales charges were taken into account. |
| (C) | Ratios do not include fees paid indirectly (See Expenses in the accompanying Notes to Financial Statements). |
| (D) | Portfolio turnover rate is calculated on the basis of the Fund as a whole without distinguishing between the classes of shares issued. |
| (G) | Per share amounts have been calculated using average shares outstanding method. |
| (H) | Class L was merged into Class A on August 5, 2011 (See Class Merger in accompanying Notes to Financial Statements). |
| (I) | Total return without the inclusion of the Payments from (to) Affiliate, can be found in Expenses in the accompanying Notes to Financial Statements. |
| (J) | Commenced operations on December 22, 2006. |
| (K) | Classes H, M and N were merged into Class L and Class Z was merged into Class Y on February 9, 2007. |
| The Hartford Growth Opportunities Fund |
| Directors and Officers (Unaudited) |
The Board of Directors of the Company appoints officers who are responsible for the day-to-day operations of the Fund and who execute policies formulated by the Directors. Each director serves until his or her death, resignation, or retirement or until the next annual meeting of shareholders is held or until his or her successor is elected and qualifies.
Directors and officers who are employed by or who have a financial interest in The Hartford are considered “interested” persons of the Fund pursuant to the 1940 Act. Each officer and two of the Company’s directors, as noted in the chart below, are “interested” persons of the Fund. Each director serves as a director for The Hartford Mutual Funds, Inc., The Hartford Mutual Funds II, Inc., Hartford Series Fund, Inc., and Hartford HLS Series Fund II, Inc., and as a trustee for The Hartford Alternative Strategies Fund, which, as of April 30, 2012, collectively consist of 91 funds. Correspondence may be sent to directors and officers c/o Hartford Mutual Funds, P.O. Box 2999, Hartford, Connecticut 06104-2999, except that correspondence to Mr. Annoni, Mr. Dressen, and Ms. Fagely may be sent to 500 Bielenberg Drive, Woodbury, Minnesota 55125.
The table below sets forth, for each director and officer, his or her name, year of birth, current position with the Company and date first elected or appointed to The Hartford Mutual Funds, Inc. (“MF”) and The Hartford Mutual Funds II, Inc. (“MF2”), principal occupation, and, for directors, other directorships held. The Fund’s statement of additional information contains further information on the directors and is available free of charge by calling 1-888-843-7824 or writing to Hartford Mutual Funds, P.O. Box 64387, St. Paul, MN 55164-0387.
Information on the aggregate remuneration paid to the directors of the Company can be found in the Statement of Operations herein. The Fund pays to The Hartford a portion of the Chief Compliance Officer’s compensation, but does not pay salaries or compensation to any of its other officers or directors who are employed by The Hartford.
Non-Interested Directors
Lynn S. Birdsong (1946) Director since 2003, Co-Chairman of the Investment Committee
Mr. Birdsong is a private investor. Mr. Birdsong currently serves as a Director of the Sovereign High Yield Investment Company (April 2010 to current). Mr. Birdsong currently serves as an Independent Director of Nomura Partners Funds, Inc. (formerly, The Japan Fund) (March 2003 to current). From 1979 to 2002, Mr. Birdsong was a managing director of Zurich Scudder Investments, an investment management firm. During his employment with Scudder, Mr. Birdsong was an Interested Director of The Japan Fund. Since 1981, Mr. Birdsong has been a partner in Birdsong Company, an advertising specialty firm.
Robert M. Gavin, Jr. (1940) Director since 2002 (MF) and 1986 (MF2), Chairman of the Board since 2004
Dr. Gavin is an educational consultant. Prior to September 1, 2001, he was President of Cranbrook Education Community and prior to July 1996, he was President of Macalester College, St. Paul, Minnesota.
Duane E. Hill (1945) Director since 2001 (MF) and 2002 (MF2), Chairman of the Nominating Committee
Mr. Hill is Partner of TSG Ventures L.P., a private equity investment company. Mr. Hill is a former partner of TSG Capital Group, a private equity investment firm that served as sponsor and lead investor in leveraged buyouts of middle market companies.
Sandra S. Jaffee (1941) Director since 2005
Ms. Jaffee is the founder and Chief Executive Officer of a private company, Homeworks Concierge, LLC, which provides residential property management services in Westchester County, New York (January 2012 to present). Ms. Jaffee served as Chairman (2008 to 2009) and Chief Executive Officer of Fortent (formerly Searchspace Group), a leading provider of compliance/regulatory technology to financial institutions from August 2005 to August 2009. Ms. Jaffe currently serves as a member of the Board of Directors of Broadridge Financial Solutions as well as a Trustee of Muhlenberg College.
William P. Johnston (1944) Director since 2005, Chairman of the Compliance Committee
In June 2006, Mr. Johnston was appointed as Senior Advisor to The Carlyle Group, a global private equity investment firm. In August 2007, Mr. Johnston was elected to the Board of Directors of LifeCare Holdings, Inc. In February 2008, Mr. Johnston was elected to the Board of Directors of HCR-ManorCare, Inc. In May 2006, Mr. Johnston was elected to the Supervisory Board of Fresenius Medical Care AG & Co. KGaA, after its acquisition of Renal Care Group, Inc. in March 2006.
Phillip O. Peterson (1944) Director since 2002, (MF) and 2000 (MF2), Chairman of the Audit Committee
Mr. Peterson is a mutual fund industry consultant. He was a partner of KPMG LLP (an accounting firm) until July 1999. Mr. Peterson joined William Blair Funds in February 2007 as a member of the Board of Trustees. Mr. Peterson also joined the Board of Trustees of Symetra Variable Mutual Funds Trust as a trustee in February 2012.
| The Hartford Growth Opportunities Fund |
| Directors and Officers (Unaudited) – (continued) |
Lemma W. Senbet (1946) Director since 2005
Dr. Senbet is the William E. Mayer Chair Professor of Finance and Director, Center for Financial Policy, at the University of Maryland, Robert H. Smith School of Business. He was chair of the Finance Department from 1998 to 2006. Previously he was a chaired professor of finance at the University of Wisconsin-Madison. Also, he was director of the Fortis Funds from March 2000 to July 2002. Dr. Senbet served the finance profession in various capacities, including as director of the American Finance Association and President of the Western Finance Association. In 2006, Dr. Senbet was inducted Fellow of Financial Management Association International for his career-long distinguished scholarship and professional service.
Interested Directors and Officers
David N. Levenson (1966) Director since 2010
Mr. Levenson currently serves as President of The Hartford’s Wealth Management business. He was appointed to this role in July 2010. Previously, Mr. Levenson served as Executive Vice President of Legacy Holdings for The Hartford from June 2009 to July 2010. From 2006 to 2009, Mr. Levenson was with Hartford Life Insurance K.K. where he served as President and Chief Executive Officer from 2007 to 2009. He served as Managing Director of Hartford Investment Management Company from 2005 to 2006. Additionally, Mr. Levenson serves as Executive Vice President of The Hartford and as President, Director and Chief Executive Officer of Hartford Life Insurance Company (“HLIC”) and Hartford Life, Inc. (“HL Inc.”).
Lowndes A. Smith (1939) Director since 1996, (MF) and 2002 (MF2), Co-Chairman of the Investment Committee
Mr. Smith served as Vice Chairman of The Hartford from February 1997 to January 2002, as President and Chief Executive Officer of HL Inc. from February 1997 to January 2002, and as President and Chief Operating Officer of The Hartford Life Insurance Companies from January 1989 to January 2002. Mr. Smith serves as a Director of White Mountains Insurance Group, Ltd., One Beacon Insurance and Symetra Financial and as Managing Director of Whittington Gray Associates.
Other Officers
James E. Davey (1964) President and Chief Executive Officer since 2010
Mr. Davey serves as Executive Vice President of HLIC. Additionally, Mr. Davey serves as President, Chief Executive Officer and Manager of HIFSCO and President, Chief Executive Officer and Manager of HL Investment Advisors, LLC (“HL Advisors”). Mr. Davey joined The Hartford in 2002.
Mark A. Annoni (1964) Vice President, Controller and Treasurer since 2012*
Mr. Annoni serves as the Assistant Vice President and Director of Investment Finance (February 2004 to present). Mr. Annoni joined The Hartford in April 2001 as part of The Hartford’s acquisition of Fortis Financial Group. Prior to joining The Hartford, Mr. Annoni served as Manager of Mutual Fund Accounting at Fortis Financial Group (July 1997 to April 2001).
* Mr. Annoni was named Vice President, Controller and Treasurer on May 8, 2012.
Michael R. Dressen (1963) AML Compliance Officer since 2011
Mr. Dressen currently serves as Assistant Vice President of HLIC. He also serves as Chief Compliance Officer and AML Compliance Officer of Hartford Administrative Services Company (“HASCO”) and as Assistant Secretary and Compliance Officer of HIFSCO. Mr Dressen joined The Hartford in 2005 from State Farm Insurance Companies where he held various positions related to mutual funds, variable products, and property casualty insurance.
Tamara L. Fagely (1958) Vice President since 2002 (MF) and 1993 (MF2)
Ms. Fagely has been a Vice President of HASCO since 1998 and Chief Financial Officer since 2006. Currently Ms. Fagely is a Vice President of HLIC. She served as Assistant Vice President of HLIC from December 2001 through March 2005. In addition, Ms. Fagely is Controller and Chief Financial Officer of HIFSCO.
Dr. Robert J. Froehlich (1953) Senior Managing Director since 2009
Dr. Froehlich joined The Hartford as Senior Managing Director in September 2009. Prior to joining The Hartford, Dr. Froehlich served as Vice Chairman of Deutsche Asset Management from 1997-2009.
Edward P. Macdonald (1967) Vice President, Secretary and Chief Legal Officer since 2005
Mr. Macdonald serves as Vice President of HLIC and Chief Legal Officer of Mutual Funds and Vice President of HIFSCO. He also serves as Vice President and Secretary of HASCO, and Chief Legal Officer, Secretary and Vice President of HL Advisors. Mr. Macdonald joined The Hartford in 2005.
Vernon J. Meyer (1964) Vice President since 2006
Mr. Meyer serves as Senior Vice President of HLIC. He also serves as Senior Vice President of HIFSCO and HL Advisors. Mr. Meyer joined The Hartford in 2004.
Colleen B. Pernerewski (1969) Vice President and Chief Compliance Officer since 2010
Ms. Pernerewski serves as Vice President and Chief Investment Advisor Compliance Officer of HIFSCO and as Vice President and Chief Compliance Officer of HL Advisors. Ms. Pernerewski serves as Vice President and Chief Compliance Officer of Individual Annuity of HLIC. Ms. Pernerewski joined The Hartford in 2005 from Travelers Life and Annuity where she served as Counsel (2004-2005). Prior to Travelers Life and Annuity, Ms. Pernerewski held the position of Counsel at The Hartford (1998-2004).
Elizabeth L. Schroeder (1966) Vice President since 2010
Ms. Schroeder currently serves as Assistant Vice President of HLIC. Ms. Schroeder joined HLIC in 1991. She is also an Assistant Vice President of HASCO, HIFSCO and HL Advisors.
Martin Swanson (1962) Vice President since 2010
Mr. Swanson is a Vice President of HLIC. Mr. Swanson also serves as Vice President/Marketing for HIFSCO. Prior to joining HLIC in 1998, Mr. Swanson was a Vice President at PaineWebber, Inc.
Jane Wolak (1961) Vice President since 2009
Ms. Wolak currently serves as Senior Vice President of HLIC. Ms. Wolak joined HLIC as Vice President, Retail Product Services in May 2007. She is also Vice President of HASCO. Previously, Ms. Wolak was with Sun Life Financial where she held the position of Vice President, Service Center Operations from 2001-2007.
HOW TO OBTAIN A COPY OF THE FUND’S PROXY VOTING POLICIES AND VOTING RECORDS (UNAUDITED)
A description of the policies and procedures that the Fund uses to determine how to vote proxies relating to portfolio securities and a record of how the Fund voted any proxies for the twelve-month period ended June 30, 2011 are available (1) without charge, upon request, by calling 888-843-7824 and (2) on the SEC’s website at http://www.sec.gov.
QUARTERLY PORTFOLIO HOLDINGS INFORMATION (UNAUDITED)
The Fund files a complete schedule of portfolio holdings with the SEC for the first and third quarters of each fiscal year on Form N-Q. The Fund’s Forms are available (1) without charge, upon request, by calling 888-843-7824 and (2) on the SEC’s website at http://www.sec.gov. The Form N-Q may be reviewed and copied at the SEC’s Public Reference Room in Washington, DC. Information on the operation of the Public Reference Room may be obtained by calling 1-800-SEC-0330.
| The Hartford Growth Opportunities Fund |
| Expense Example (Unaudited) |
Your Fund's Expenses
As a shareholder of the Fund, you incur two types of costs: (1) transaction costs, including sales charges (loads) on purchase payments and contingent deferred sales charges (CDSC) and (2) ongoing costs, including investment management fees, distribution fees, and other fund expenses. This example is intended to help you understand your ongoing costs (in dollars) of investing in the Fund and to compare these costs with the ongoing costs of investing in other mutual funds. The example is based on an investment of $1,000 invested at the beginning of the period and held for the period of October 31, 2011 through April 30, 2012.
Actual Expenses
The first set of columns of the table below provides information about actual account values and actual expenses. You may use the information in this column, together with the amount you invested, to estimate the expenses that you paid over the period. Simply divide your account value by $1,000 (for example, an $8,600 account value divided by $1,000 = 8.6), then multiply the result by the number in the line under the heading entitled “Expenses Paid During Period” to estimate the expenses you paid on your account during this period.
Hypothetical Example for Comparison Purposes
The second set of columns of the table below provides information about hypothetical account values and hypothetical expenses based on the Fund's actual expense ratio and an assumed rate of return of 5% per year before expenses, which is not the Fund's actual return. The hypothetical account values and expenses may not be used to estimate the actual ending account balance or expenses you paid for the period. You may use this information to compare the ongoing costs of investing in the Fund and other funds. To do so, compare this 5% hypothetical example with the 5% hypothetical examples that appear in the shareholder reports of the other funds.
Please note that the expenses shown in the table are meant to highlight your ongoing costs only and do not reflect any transactional costs, such as sales charges (loads) and CDSC. Therefore, the second set of columns of the table is useful in comparing ongoing costs only, and will not help you determine the relative total costs of owning different funds. In addition, if these transactional costs were included, your costs would be higher. Expenses are equal to the Fund's annualized expense ratios multiplied by average account value over the period, multiplied by 182/366 (to reflect the one-half year period).
| | | Actual return | | | Hypothetical (5% return before expenses) | | | | | | | | | | |
| | | Beginning
Account Value
October 31, 2011 | | | Ending Account
Value
April 30, 2012 | | | Expenses paid
during the period
October 31, 2011
through
April 30, 2012 | | | Beginning
Account Value
October 31, 2011 | | | Ending Account
Value
April 30, 2012 | | | Expenses paid
during the
period
October 31, 2011
through
April 30, 2012 | | | Annualized
expense
ratio | | | Days in
the
current
1/2
year | | | Days
in the
full
year | |
| Class A | | $ | 1,000.00 | | | $ | 1,123.20 | | | $ | 6.39 | | | $ | 1,000.00 | | | $ | 1,018.85 | | | $ | 6.07 | | | | 1.21 | % | | | 182 | | | | 366 | |
| Class B | | $ | 1,000.00 | | | $ | 1,119.20 | | | $ | 10.33 | | | $ | 1,000.00 | | | $ | 1,015.12 | | | $ | 9.82 | | | | 1.96 | | | | 182 | | | | 366 | |
| Class C | | $ | 1,000.00 | | | $ | 1,118.80 | | | $ | 10.19 | | | $ | 1,000.00 | | | $ | 1,015.25 | | | $ | 9.69 | | | | 1.93 | | | | 182 | | | | 366 | |
| Class I | | $ | 1,000.00 | | | $ | 1,124.30 | | | $ | 5.06 | | | $ | 1,000.00 | | | $ | 1,020.10 | | | $ | 4.81 | | | | 0.96 | | | | 182 | | | | 366 | |
| Class R3 | | $ | 1,000.00 | | | $ | 1,121.20 | | | $ | 7.65 | | | $ | 1,000.00 | | | $ | 1,017.65 | | | $ | 7.27 | | | | 1.45 | | | | 182 | | | | 366 | |
| Class R4 | | $ | 1,000.00 | | | $ | 1,123.10 | | | $ | 6.07 | | | $ | 1,000.00 | | | $ | 1,019.15 | | | $ | 5.77 | | | | 1.15 | | | | 182 | | | | 366 | |
| Class R5 | | $ | 1,000.00 | | | $ | 1,124.60 | | | $ | 4.49 | | | $ | 1,000.00 | | | $ | 1,020.64 | | | $ | 4.27 | | | | 0.85 | | | | 182 | | | | 366 | |
| Class Y | | $ | 1,000.00 | | | $ | 1,125.50 | | | $ | 4.01 | | | $ | 1,000.00 | | | $ | 1,021.09 | | | $ | 3.81 | | | | 0.76 | | | | 182 | | | | 366 | |
You should carefully consider investment objectives, risks, and charges and expenses of The Hartford Mutual Funds before investing. This and other information can be found in the Fund’s prospectus or summary prospectus, which can be obtained from your investment representative or by calling 888-843-7824. Please read them carefully before you invest or send money. The Hartford Mutual Funds are underwritten and distributed by Hartford Investment Financial Services LLC. “The Hartford” is The Hartford Financial Services Group, Inc., and its subsidiaries. MFSAR-GO12 4/12 110743 Printed in U.S.A. ©2012 The Hartford, Hartford, CT 06155 | |
THE HARTFORD MUTUAL FUNDS 2012 Semi Annual Report The Hartford Municipal Real Return Fund |
A MESSAGE FROM THE PRESIDENT
Dear Fellow Shareholders:
I want to take this opportunity to say thank you for investing with The Hartford Mutual Funds. Although it’s not yet clear that the recent market volatility is truly behind us, we believe there are several reasons to remain optimistic about the markets in 2012.
Market Review
Stocks soared in October as a result of solid corporate earnings reports, generally better-than-expected economic data, and renewed hopes for a solution to the eurozone debt crisis. However, November saw some of those gains dissipate due to pessimism about European contagion and its implications for global economic growth. The quarter ended on a positive note, a result of encouraging employment and manufacturing data in December.
The S&P 500 Index was virtually unchanged for the year: 1257.64 on 12/31/2010, and 1257.60 on 12/31/2011. Dividends, however, helped produce a 2.11% total return for the Index for the year.
In 2012, U.S. equities surged in the first quarter, with the S&P 500 up 12.59% as investors shrugged off lingering uncertainty over eurozone sovereign debt and focused instead on improving economic data. Strong corporate earnings news and the Federal Reserve’s pledge to keep interest rates low buoyed investors’ appetites.
The Hartford Mutual Funds Expands Relationship with Wellington Management
We’re very pleased that we are expanding our relationship with Wellington Management which will now serve as the sole sub-adviser for the retail Hartford Mutual Funds including equity, fixed-income, and asset-allocation funds.* One of America’s oldest and largest investment management firms, Wellington Management has resources that span the entire globe, with multiple offices across the U.S. and numerous offices abroad. Wellington Management’s most distinctive strength is its proprietary research, which is shared across the entire organization.
We believe that aligning more closely with a well-respected money manager like Wellington Management puts us in a strong position to drive significant growth and to continue delivering innovative fund strategies to help our investors meet their financial goals.
Thank you again for investing with The Hartford Mutual Funds.
James Davey
President
The Hartford Mutual Funds
*Hartford Investment Management Company will continue to sub-advise The Hartford Money Market Fund.
The Hartford Municipal Real Return Fund
Table of Contents
The views expressed in the Fund’s Manager Discussion under ‘‘Why did the Fund perform this way?’’ and ‘‘What is the outlook?’’ are views of the Fund’s sub-adviser and portfolio management team through the end of the period and are subject to change based on market and other conditions.
The Hartford Municipal Real Return Fund inception 06/02/1986
(sub-advised by Wellington Management Company, LLP)
| Investment objective – Seeks to provide current income exempt from federal income tax and after-tax inflation-adjusted total returns. |
Performance Overview 4/30/02 - 4/30/12
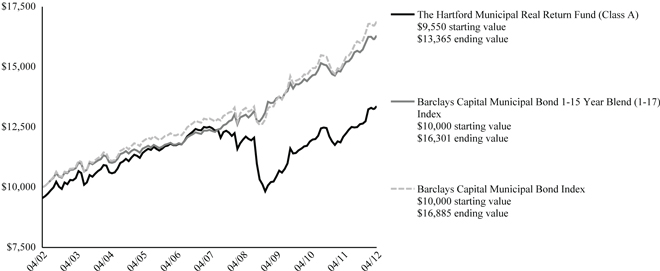
The chart above shows the growth of a $10,000 investment in Class A which includes a sales charge. Growth results in classes other than Class A will vary from what is seen above due to differences in the expenses charged to those share classes.
Average Annual Total Returns (as of 4/30/12)
| | | 6 Month† | | | 1 Year | | | 5 year | | | 10 year | |
| Municipal Real Return A# | | | 5.88 | % | | | 10.47 | % | | | 1.33 | % | | | 3.42 | % |
| Municipal Real Return A## | | | | | | | 5.50 | % | | | 0.40 | % | | | 2.94 | % |
| Municipal Real Return B# | | | 5.43 | % | | | 9.75 | % | | | 0.58 | % | | | NA | * |
| Municipal Real Return B## | | | | | | | 4.75 | % | | | 0.25 | % | | | NA | * |
| Municipal Real Return C# | | | 5.53 | % | | | 9.71 | % | | | 0.58 | % | | | 2.63 | % |
| Municipal Real Return C## | | | | | | | 8.71 | % | | | 0.58 | % | | | 2.63 | % |
| Municipal Real Return I# | | | 6.00 | % | | | 10.72 | % | | | 1.61 | % | | | 3.56 | % |
| Municipal Real Return Y# | | | 6.04 | % | | | 10.79 | % | | | 1.59 | % | | | 3.66 | % |
| Barclays Capital Municipal Bond 1-15 Year Blend (1-17) Index | | | 4.43 | % | | | 8.47 | % | | | 5.65 | % | | | 5.01 | % |
| Barclays Capital Municipal Bond Index | | | 5.50 | % | | | 11.36 | % | | | 5.60 | % | | | 5.38 | % |
| * | 10 year returns are not applicable for Class B because after 8 years Class B converts to Class A. |
PAST PERFORMANCE IS NOT INDICATIVE OF FUTURE RESULTS.
The initial investment in Class A shares reflects the maximum sales charge and Classes B and C reflect a contingent deferred sales charge.
Total returns presented above were calculated using the Fund's net asset value available to shareholders for sale or redemption of Fund shares on April 30, 2012, which may exclude investment transactions as of this date.
Effective 9/30/09, Class B shares of The Hartford Mutual Funds were closed to new investments.
Class I shares commenced operations on 5/31/07. Performance prior to that date is that of the Fund's Class A shares (excluding sales charges), which had different operating expenses.
Performance information includes performance of the Fund’s previous sub-adviser, Hartford Investment Management Company. On or about March 5, 2012, Hartford Investment Management Company no longer serves as the sub-adviser to the Fund.
Includes the Fund’s performance when, prior to March 5, 2012, it utilized a modified investment strategy.
Barclays Capital Municipal Bond 1-15 Year Blend (1-17) Index is a sub-index of the Barclays Capital Municipal Bond Index. It is a rules-based market value-weighted index of bonds with maturities of one year to 17 years engineered for the tax-exempt bond market.
Barclays Capital Municipal Bond Index is an unmanaged index of municipal bonds with maturities greater than two years.
The Fund changed its benchmark from the Barclays Capital Municipal Bond Index to the Barclays Capital Municipal Bond 1-15 Year Blend (1-17) Index because the Fund’s investment manager believes that the Barclays Capital Municipal Bond 1-15 Year Blend (1-17) Index better reflects the Fund’s revised investment strategy.
You cannot invest directly in an index.
The chart represents a hypothetical investment in the Fund. Performance data represents past performance and current performance could be higher or lower.
The value of shares will fluctuate so that, when redeemed, shares may be worth more or less than their original cost. The chart and table do not reflect the deduction of taxes that a shareholder would pay on Fund distributions or the redemption of Fund shares.
Performance information may reflect historical or current expense waivers/reimbursements from the investment adviser, without which performance would have been lower. For information on current expense waivers/reimbursements, please see the prospectus.
| The Hartford Municipal Real Return Fund |
| Manager Discussiond) |
| April 30, 2012 (Unaudited) |
| Portfolio Managers | | |
| Timothy D. Haney, CFA | Brad W. Libby | Lindsay T. Politi |
| Vice President and Fixed Income Portfolio Manager | Vice President and Fixed Income Credit Analyst | Vice President and Fixed Income Portfolio Manager |
As of March 5, 2012, Wellington Management Company, LLP became the sub-adviser for the Fund. As of the same date, Hartford Investment Management Company no longer serves as the sub-adviser to the Fund.
How did the Fund perform?
The Class A shares of The Hartford Municipal Real Return Fund returned 5.88%, before sales charge, for the six-month period ended April 30, 2012, outperforming its benchmarks, the Barclays Capital Municipal Bond 1-15 Year Blend (1-17) Index, which returned 4.43% and the Barclays Capital Municipal Bond Index which returned 5.50% for the same period. The Fund also outperformed the 4.90% return of the average fund in the Lipper Intermediate Municipal Debt Funds peer group, a group of funds with investment strategies similar to those of the Fund.
Why did the Fund perform this way?
The Fund’s performance was driven by favorable duration, yield curve positioning, and sector allocation. The Fund’s longer duration and overweight to the outperforming intermediate maturities supported performance during the period.
Security selection and positioning within the higher yield segment of the fixed income market helped the Fund outperform the benchmark, specifically within the Transportation, Tobacco, Education and Utility sectors. The market saw increased demand for lower rated securities from investors reaching for higher levels of income in this low absolute interest rate environment. An underweight to non-investment grade securities detracted from performance relative to the benchmark.
On March 5, 2012, Wellington Management Company, LLP (Wellington) became sub-adviser of the Fund replacing Hartford Investment Management Company. Wellington has been positioning the Fund’s portfolio as described in the Outlook section below.
What is the outlook?
We believe the U.S. economy is expanding at a moderate pace. Therefore, we have a medium risk posture. The municipal curve has flattened but remains steep. Given the overall slope of the municipal curve, we believe the 5-year portion of the curve is expensive, while the 10-year portion is cheap, and the 20-year portion is fair. We believe the 10-year portion of the curve is attractive from a roll down perspective.
We favor moving to a neutral duration posture with a flattening bias and look for opportunities to move out of the 5-year range.
Tax reform discussions have picked up and changes to the municipal tax exemption have been a topic of conversation. Some contend that the municipal tax exemption disproportionately benefits wealthy individuals and corporations, so it is possible that the exemption will be threatened by fiscal reforms aimed at increasing revenues. Changes to the tax code might entirely remove the exemption or provide for a grandfathering of existing tax-exempt municipals. Any reduction to the tax benefit would likely be negative for demand in the sector, but it is too early to tell whether the exemption is under serious threat, so markets have reacted little in response to potential changes. Flows into municipal mutual funds have been steadily positive and supply remains limited, creating what we believe is a favorable technical environment for the tax-exempt asset class. Supply is expected to remain scarce, but the record low yields in the asset class may cause future inflows to slow.
Municipalities are under stress, but we do not expect widespread defaults. State general-obligation (GO) revenues are improving, but we believe they will be offset by increasing pension and Medicaid expenses. We believe the local GO sector will remain stressed until real estate prices improve. Municipal credit spreads have tightened but remain attractive in our opinion; fundamental research is critical for individual security selection in this sector. At the end of the period, we were underweight GOs, especially at the local level. We retained exposure to municipal spread product, including health care (both investment-grade and high yield), toll roads, and airports. We also favored essential service revenue bonds, such as water, sewer, and electric utilities. At the end of the period, the Fund had approximately 86% in investment-grade municipal securities, 8% in net cash, and 6% in high yield municipal securities.
We believe inflation expectations are reflective of a stable macroeconomic outlook and moderating commodity prices. U.S. growth and unemployment is likely to remain
| The Hartford Municipal Real Return Fund |
| Manager Discussion – (continued) |
| April 30, 2012 (Unaudited) |
challenged, meaning the U.S. Federal Reserve will likely remain accommodative for an extended period of time. We expect inflation to fall over the next 6-12 months, settling in around 2% in mid-2012. At the end of the period we had an inflation hedge, implemented via CPI (consumer price index) swaps, on 67% of the Fund on a contribution to duration (CTD) basis.
Distribution by Credit Quality
as of April 30, 2012
| Credit Rating * | | Percentage of
Net Assets | |
| Aaa / AAA | | | 8.2 | % |
| Aa / AA | | | 35.5 | |
| A | | | 32.1 | |
| Baa / BBB | | | 9.8 | |
| Unrated | | | 8.0 | |
| Non Debt Securities and Other Short-Term Instruments | | | 7.9 | |
| Other Assets & Liabilities | | | (1.5 | ) |
| Total | | | 100.0 | % |
| * | Does not apply to the Fund itself. Based upon Moody’s and S&P long-term credit ratings for the Fund’s holdings as of the date noted. If Moody's and S&P assign different ratings to a holding, the lower rating is used. "Unrated" includes fixed-income securities (other than cash-like short-term instruments and U.S. Government securities) for which Moody’s and S&P have not issued long-term credit ratings. |
Diversification by Industry
as of April 30, 2012
| Industry | | Percentage of
Net Assets | |
| Airport Revenues | | | 4.3 | % |
| General Obligations | | | 16.3 | |
| Health Care/Services | | | 9.3 | |
| Higher Education (Univ., Dorms, etc.) | | | 10.4 | |
| Housing (HFA'S, etc.) | | | 0.4 | |
| Miscellaneous | | | 13.4 | |
| Pollution Control | | | 1.6 | |
| Prerefunded | | | 4.5 | |
| Special Tax Assessment | | | 3.6 | |
| Tax Allocation | | | 6.8 | |
| Transportation | | | 8.0 | |
| Utilities - Combined | | | 1.0 | |
| Utilities - Electric | | | 4.8 | |
| Utilities - Gas | | | 0.9 | |
| Utilities - Water and Sewer | | | 7.0 | |
| Waste Disposal | | | 1.3 | |
| Short-Term Investments | | | 7.9 | |
| Other Assets and Liabilities | | | (1.5 | ) |
| Total | | | 100.0 | % |
| The Hartford Municipal Real Return Fund |
| Schedule of Investments |
| April 30, 2012 (Unaudited) |
| (000’s Omitted) |
| Shares or Principal Amount | | Market Value ╪ | |
MUNICIPAL BONDS - 93.6% | | | | |
| | | | | Alabama - 2.7% | | | | |
| | | | | Alabama State 21st Century Auth Settlement Rev | | | | |
| $ | 1,100 | | | 4.00%, 06/01/2016 | | $ | 1,213 | |
| | 1,500 | | | 5.00%, 06/01/2017 | | | 1,740 | |
| | | | | Huntsville, AL, GO (Prerefunded with State & Local Gov't Securities) | | | | |
| | 1,855 | | | 5.25%, 05/01/2022 ╦ | | | 1,892 | |
| | | | | Mobile, AL, IDA Pollution Obligor: Alabama Power Co | | | | |
| | 1,815 | | | 1.65%, 06/01/2034 | | | 1,820 | |
| | | | | | | | 6,665 | |
| | | | | Alaska - 0.5% | | | | |
| | | | | Alaska Municipal Bond Bank Auth GO | | | | |
| | 375 | | | 5.75%, 09/01/2033 | | | 428 | |
| | | | | Anchorage, AK, GO | | | | |
| | 610 | | | 5.25%, 08/01/2028 | | | 695 | |
| | | | | | | | 1,123 | |
| | | | | Arizona - 0.7% | | | | |
| | | | | Arizona Sundance Community Facilities Dist, Special Assess Rev #2 | | | | |
| | 308 | | | 7.13%, 07/01/2027 ■ | | | 309 | |
| | | | | Estrella Mountain Ranch, AZ, Community Fac Dist GO | | | | |
| | 265 | | | 6.20%, 07/15/2032 | | | 266 | |
| | | | | Vistancia, AZ, Community Fac Dist GO | | | | |
| | 200 | | | 6.75%, 07/15/2022 | | | 201 | |
| | | | | Yavapai County, AZ, IDA Hospital Facility | | | | |
| | 1,000 | | | 4.00%, 10/01/2014 | | | 1,072 | |
| | | | | | | | 1,848 | |
| | | | | California - 15.9% | | | | |
| | | | | California Health Facilities FA, Sutter Health | | | | |
| | 1,110 | | | 5.88%, 08/15/2031 | | | 1,319 | |
| | | | | California Public Works Board, Dept of Health Services Richmond Lab | | | | |
| | 300 | | | 5.00%, 11/01/2030 | | | 308 | |
| | | | | California State Communities DA Rev | | | | |
| | 2,500 | | | 5.00%, 11/01/2029 ☼ | | | 2,884 | |
| | | | | California State Dept Water Resources Supply Rev | | | | |
| | 2,500 | | | 5.00%, 05/01/2019 - 05/01/2022 ‡ | | | 3,047 | |
| | | | | California State Educational Fac Auth Rev | | | | |
| | 630 | | | 5.00%, 04/01/2030 | | | 645 | |
| | | | | California State GO | | | | |
| | 1,000 | | | 5.00%, 10/01/2019 | | | 1,196 | |
| | 3,515 | | | 6.50%, 04/01/2033 | | | 4,304 | |
| | | | | California State Health Fac FA Rev | | | | |
| | 1,000 | | | 5.50%, 11/15/2040 | | | 1,145 | |
| | | | | California State Pollution Control FA | | | | |
| | 2,250 | | | 1.88%, 04/01/2025 | | | 2,247 | |
| | | | | California State Public Works Board Lease Rev | | | | |
| | 1,500 | | | 5.25%, 10/01/2022 | | | 1,760 | |
| | | | | California State Public Works Board, Correctional Facilities Improvement | | | | |
| | 500 | | | 6.00%, 03/01/2035 | | | 561 | |
| | | | | California State Public Works Board, State University Trustees | | | | |
| | 170 | | | 6.13%, 04/01/2029 | | | 199 | |
| | 2,000 | | | 6.25%, 04/01/2034 | | | 2,250 | |
| | | | | California State Public Works Board, Various Capital Projects | | | | |
| | 1,000 | | | 6.38%, 11/01/2034 | | | 1,156 | |
| | | | | California Statewide Community DA, Windrush School | | | | |
| | 250 | | | 0.00%, 07/01/2037 ● | | | 173 | |
| | | | | El Dorado, CA, Irrigation Dist | | | | |
| | 300 | | | 5.38%, 08/01/2024 | | | 338 | |
| | | | | Huntington Park, CA, Public FA Rev | | | | |
| | 400 | | | 5.25%, 09/01/2019 | | | 437 | |
| | | | | Indio, CA, Public Improvement Act Special Assessment #2002-3 GO | | | | |
| | 95 | | | 6.35%, 09/02/2027 | | | 97 | |
| | | | | Los Angeles, CA, Wastewater System Rev | | | | |
| | 2,000 | | | 5.00%, 06/01/2022 | | | 2,396 | |
| | | | | Morongo Band of Mission Indians, CA, Enterprise | | | | |
| | 1,655 | | | 6.50%, 03/01/2028 ■ | | | 1,676 | |
| | | | | Palm Springs, CA, Community Redev Agency | | | | |
| | 535 | | | 5.50%, 09/01/2023 | | | 544 | |
| | | | | Port Oakland, CA, GO | | | | |
| | 1,000 | | | 5.00%, 05/01/2026 | | | 1,057 | |
| | | | | San Bernardino, CA, Community College Dist GO | | | | |
| | 500 | | | 6.38%, 08/01/2026 | | | 614 | |
| | | | | San Diego, CA, Redev Agency, Centre City Sub Pkg | | | | |
| | 200 | | | 5.25%, 09/01/2026 | | | 200 | |
| | | | | San Francisco City & County, CA, Redev FA | | | | |
| | 1,120 | | | 6.50%, 08/01/2032 | | | 1,250 | |
| | | | | Santa Cruz County, CA, Redev Agency | | | | |
| | 665 | | | 6.63%, 09/01/2029 | | | 774 | |
| | | | | Southern California State Public Power Auth | | | | |
| | 500 | | | 5.00%, 07/01/2023 | | | 578 | |
| | | | | Temecula, CA, Redev Agency Tax Allocation Rev | | | | |
| | 245 | | | 5.63%, 12/15/2038 | | | 234 | |
| | | | | Torrance, CA, USD GO | | | | |
| | 1,500 | | | 5.50%, 08/01/2025 | | | 1,741 | |
| | | | | Tuolumne, CA, Wind Proj Auth Rev | | | | |
| | 1,000 | | | 5.88%, 01/01/2029 | | | 1,174 | |
| | | | | Ventura County, CA, Certificates of Participation | | | | |
| | 1,250 | | | 5.63%, 08/15/2027 | | | 1,440 | |
| | | | | Washington Township, CA, Health Care Dist Rev | | | | |
| | 500 | | | 5.00%, 07/01/2037 | | | 516 | |
| | 1,000 | | | 6.00%, 07/01/2029 | | | 1,140 | |
| | | | | | | | 39,400 | |
| | | | | Colorado - 1.0% | | | | |
| | | | | Denver, CO, City & County Airport Rev | | | | |
| | 600 | | | 5.00%, 11/15/2015 | | | 673 | |
| | | | | Regional Transportation Dist, CO, Private | | | | |
| | 1,000 | | | 6.00%, 01/15/2034 | | | 1,100 | |
| | | | | University of Colorado Enterprise Rev | | | | |
| | 600 | | | 5.75%, 06/01/2028 | | | 738 | |
| | | | | | | | 2,511 | |
The accompanying notes are an integral part of these financial statements.
| The Hartford Municipal Real Return Fund |
| Schedule of Investments – (continued) |
| April 30, 2012 (Unaudited) |
| (000’s Omitted) |
| Shares or Principal Amount | | Market Value ╪ | |
MUNICIPAL BONDS - 93.6% - (continued) | | | | |
| | | | | Connecticut - 0.6% | | | | |
| | | | | Connecticut State DA Pollution Control Rev | | | | |
| $ | 1,490 | | | 1.55%, 05/01/2031 | | $ | 1,495 | |
| | | | | | | | | |
| | | | | Delaware - 0.6% | | | | |
| | | | | Delaware State Transportation Auth | | | | |
| | 1,180 | | | 5.00%, 07/01/2025 | | | 1,383 | |
| | | | | | | | | |
| | | | | District of Columbia - 1.3% | | | | |
| | | | | District of Columbia University Rev | | | | |
| | 3,000 | | | 5.25%, 04/01/2034 | | | 3,326 | |
| | | | | | | | | |
| | | | | Florida - 4.9% | | | | |
| | | | | Colonial Country Club Community Development Dist, Capital Improvement Rev | | | | |
| | 455 | | | 6.40%, 05/01/2033 | | | 480 | |
| | | | | Greater Orlando, FL, Aviation Auth | | | | |
| | 2,500 | | | 5.00%, 10/01/2021 - 10/01/2024 ☼ | | | 2,851 | |
| | | | | Jacksonville, FL, Econ Development Community Health Care Fac | | | | |
| | 2,000 | | | 6.25%, 09/01/2027 | | | 2,145 | |
| | | | | Jacksonville, FL, Sales Tax Rev | | | | |
| | 640 | | | 5.00%, 10/01/2018 | | | 746 | |
| | | | | Miami-Dade County, FL, Educational Fac Auth | | | | |
| | 2,000 | | | 5.75%, 04/01/2028 | | | 2,185 | |
| | | | | River Bend Community Development Dist, Capital Improvement Rev | | | | |
| | 880 | | | 0.00%, 11/01/2015 ● | | | 352 | |
| | | | | Tampa Bay, FL, Regional Water Supply Auth | | | | |
| | 2,000 | | | 5.00%, 10/01/2019 | | | 2,473 | |
| | | | | Village, FL Community Development Dist #5 | | | | |
| | 825 | | | 6.50%, 05/01/2033 | | | 846 | |
| | | | | | | | 12,078 | |
| | | | | Georgia - 4.3% | | | | |
| | | | | Atlanta, GA, Airport Passenger Fac Charge Rev | | | | |
| | 2,000 | | | 5.00%, 01/01/2023 | | | 2,306 | |
| | | | | Atlanta, GA, Water & Wastewater Rev | | | | |
| | 1,500 | | | 6.00%, 11/01/2022 | | | 1,838 | |
| | | | | Burke County, GA, DA | | | | |
| | 2,000 | | | 1.25%, 01/01/2052 | | | 1,999 | |
| | | | | Dekalb Newton & Gwinnett Counties, GA, Joint DA | | | | |
| | 1,000 | | | 6.00%, 07/01/2034 | | | 1,133 | |
| | | | | Fulton County, GA, School Dist GO | | | | |
| | 1,105 | | | 5.38%, 01/01/2018 | | | 1,346 | |
| | | | | Fulton County, GA, Water & Sewer Rev FGIC Part (Prerefunded with State & Local Gov't Securities) | | | | |
| | 795 | | | 6.38%, 01/01/2014 | | | 847 | |
| | | | | Georgia Municipal Electric Auth, Power Rev | | | | |
| | 945 | | | 6.50%, 01/01/2017 | | | 1,081 | |
| | | | | Georgia Municipal Electric Auth, Power Rev (Prerefunded with US Gov't Securities) | | | | |
| | 55 | | | 6.50%, 01/01/2017 | | | 62 | |
| | | | | | | | 10,612 | |
| | | | | Hawaii - 0.2% | | | | |
| | | | | Hawaii State Harbor System Rev | | | | |
| | 500 | | | 5.38%, 01/01/2020 | | | 537 | |
| | | | | | | | | |
| | | | | Idaho - 0.7% | | | | |
| | | | | Idaho State Bond Bank Auth Rev | | | | |
| | 1,470 | | | 5.63%, 09/15/2026 | | | 1,726 | |
| | | | | | | | | |
| | | | | Illinois - 5.7% | | | | |
| | | | | Chicago, IL, O'Hare International Airport Rev | | | | |
| | 1,000 | | | 5.25%, 01/01/2027 | | | 1,030 | |
| | | | | Hampshire, IL, Special Service Area #13, Tuscany Woods Proj | | | | |
| | 1,725 | | | 0.00%, 03/01/2037 ● | | | 776 | |
| | | | | Huntley, IL, Special Service #9 | | | | |
| | 1,500 | | | 5.10%, 03/01/2028 | | | 1,593 | |
| | | | | Illinois Education Facilities Auth, Augustana College, Ser A | | | | |
| | 1,270 | | | 5.70%, 10/01/2032 | | | 1,275 | |
| | | | | Illinois State Fin Auth Rev | | | | |
| | 1,000 | | | 5.00%, 11/15/2042 ☼ | | | 1,120 | |
| | | | | Illinois State GO | | | | |
| | 1,000 | | | 5.00%, 01/01/2022 | | | 1,094 | |
| | 2,000 | | | 5.25%, 01/01/2021 | | | 2,275 | |
| | | | | Railsplitter, IL, Tobacco Settlement Auth | | | | |
| | 1,000 | | | 5.50%, 06/01/2023 | | | 1,139 | |
| | | | | Round Lake, IL, Special Tax Rev | | | | |
| | 935 | | | 4.70%, 03/01/2033 | | | 947 | |
| | | | | Round Lake, IL, Special Tax Rev (Prerefunded with State & Local Gov't Securities) | | | | |
| | 473 | | | 6.70%, 03/01/2033 | | | 503 | |
| | | | | Springfield, IL, Water Rev | | | | |
| | 500 | | | 5.25%, 03/01/2026 | | | 568 | |
| | | | | Wauconda, IL, Special Service Area #1 Special Tax Liberty Lakes Proj | | | | |
| | 949 | | | 6.63%, 03/01/2033 | | | 951 | |
| | | | | Yorkville, IL, United City Special Service Area Tax Raintree Village Proj | | | | |
| | 899 | | | 6.88%, 03/01/2033 | | | 916 | |
| | | | | | | | 14,187 | |
| | | | | Indiana - 1.4% | | | | |
| | | | | Indian State FA Hospital Rev | | | | |
| | 2,000 | | | 6.75%, 03/01/2035 | | | 2,127 | |
| | | | | University of Southern Indiana | | | | |
| | 1,070 | | | 5.00%, 10/01/2022 - 10/01/2023 | | | 1,230 | |
| | | | | | | | 3,357 | |
| | | | | Kentucky - 1.0% | | | | |
| | | | | Louisville & Jefferson County, KY Co | | | | |
| | 1,220 | | | 1.65%, 10/01/2033 Δ | | | 1,220 | |
| | | | | Louisville & Jefferson County, KY Metropolitan Government Rev | | | | |
| | 1,085 | | | 5.00%, 12/01/2023 | | | 1,282 | |
| | | | | | | | 2,502 | |
| | | | | Louisiana - 2.7% | | | | |
| | | | | Louisiana State Citizens Property PSFG Corp | | | | |
| | 2,725 | | | 5.00%, 06/01/2012 - 06/01/2016 | | | 2,914 | |
| | | | | Louisiana State Office Fac Corp Lease Rev | | | | |
| | 2,500 | | | 5.00%, 11/01/2021 | | | 3,011 | |
| | | | | Louisiana State Public Facs Auth Rev | | | | |
| | 1,000 | | | 5.75%, 07/01/2039 | | | 819 | |
| | | | | | | | 6,744 | |
The accompanying notes are an integral part of these financial statements.
| Shares or Principal Amount | | Market Value ╪ | |
MUNICIPAL BONDS - 93.6% - (continued) | | | | |
| | | | | Massachusetts - 3.6% | | | | |
| | | | | Massachusetts State Development Fin Agency Rev | | | | |
| $ | 1,000 | | | 2.25%, 12/01/2041 | | $ | 1,023 | |
| | | | | Massachusetts State GO | | | | |
| | 5,000 | | | 0.22%, 03/01/2026 Δ | | | 5,000 | |
| | 3,000 | | | 0.70%, 09/01/2015 Δ | | | 2,999 | |
| | | | | | | | 9,022 | |
| | | | | Michigan - 1.7% | | | | |
| | | | | Detroit, MI, Water Supply System Ref Rev | | | | |
| | 1,750 | | | 6.50%, 07/01/2015 | | | 1,926 | |
| | | | | Grand Valley, MI, State University Rev | | | | |
| | 1,500 | | | 5.50%, 12/01/2027 | | | 1,667 | |
| | | | | Michigan Hospital FA, Rev Ref Henry Ford Health System (Prerefunded with State & Local Gov't Securities) | | | | |
| | 500 | | | 5.63%, 03/01/2017 | | | 522 | |
| | | | | | | | 4,115 | |
| | | | | Minnesota - 2.2% | | | | |
| | | | | Minneapolis, MN, Parking Assessment GO | | | | |
| | 250 | | | 5.00%, 12/01/2020 | | | 257 | |
| | | | | Rochester, MN, Healthcare Fac Rev Obligor: Mayo Clinic | | | | |
| | 1,500 | | | 4.00%, 11/15/2038 | | | 1,717 | |
| | | | | Rosemount, MN, ISD GO | | | | |
| | 1,950 | | | 5.70%, 04/01/2015○ | | | 1,833 | |
| | | | | St Paul, MN, PA Lease Rev | | | | |
| | 500 | | | 5.00%, 12/01/2019 | | | 512 | |
| | | | | University of Minnesota (Prerefunded with State & Local Gov't Securities) | | | | |
| | 1,000 | | | 5.75%, 07/01/2018 | | | 1,254 | |
| | | | | | | | 5,573 | |
| | | | | Missouri - 0.5% | | | | |
| | | | | Branson Hills, MO, Infrastructure Fac | | | | |
| | 650 | | | 5.50%, 04/01/2027 | | | 511 | |
| | | | | Stone Canyon, MO, Community Improvement Dist Rev | | | | |
| | 1,000 | | | 0.00%, 04/01/2027 ● | | | 700 | |
| | | | | | | | 1,211 | |
| | | | | Nebraska - 0.4% | | | | |
| | | | | Nebraska State Proj Rev Bonds | | | | |
| | 1,000 | | | 5.00%, 09/01/2015 | | | 1,092 | |
| | | | | | | | | |
| | | | | Nevada - 1.4% | | | | |
| | | | | Nevada State GO | | | | |
| | 2,870 | | | 5.00%, 08/01/2019 | | | 3,480 | |
| | | | | | | | | |
| | | | | New Jersey - 0.9% | | | | |
| | | | | New Jersey State Econ DA | | | | |
| | 970 | | | 5.00%, 06/15/2018 | | | 1,105 | |
| | | | | New Jersey State Econ DA Lease Rev | | | | |
| | 1,000 | | | 5.00%, 09/01/2021 | | | 1,187 | |
| | | | | | | | 2,292 | |
| | | | | New Mexico - 0.2% | | | | |
| | | | | Cabezon, NM, Public Improvement Dist | | | | |
| | 460 | | | 5.20%, 09/01/2015 | | | 458 | |
| | | | | | | | | |
| | | | | New York - 11.6% | | | | |
| | | | | Erie County, NY, Industrial DA School Fac Rev | | | | |
| | 2,000 | | | 5.00%, 05/01/2018 | | | 2,382 | |
| | | | | Metropolitan Transportation Auth, NY, Rev | | | | |
| | 3,000 | | | 5.25%, 11/15/2023 | | | 3,574 | |
| | | | | New York City, NY, Transitional FA Rev | | | | |
| | 4,000 | | | 0.26%, 08/01/2031 Δ | | | 4,000 | |
| | 4,500 | | | 0.41%, 08/01/2031 Δ | | | 4,500 | |
| | 1,000 | | | 5.00%, 11/01/2022 | | | 1,236 | |
| | | | | New York Dorm Auth, Fordham University FGIC | | | | |
| | 80 | | | 5.00%, 07/01/2020 | | | 80 | |
| | | | | New York Dorm Auth, Upstate Community College | | | | |
| | 250 | | | 5.25%, 07/01/2021 | | | 267 | |
| | | | | New York State Dormitory Auth Rev | | | | |
| | 1,000 | | | 5.00%, 03/15/2022 | | | 1,231 | |
| | | | | New York State Dormitory Auth Rev Obligor: Mount Saint Mary College | | | | |
| | 400 | | | 5.00%, 07/01/2027 | | | 406 | |
| | | | | New York State Dormitory Auth Rev Obligor: Teacher's College | | | | |
| | 2,000 | | | 5.38%, 03/01/2029 | | | 2,234 | |
| | | | | New York State Enviornmental Fac Corp | | | | |
| | 450 | | | 5.00%, 07/15/2026 | | | 454 | |
| �� | | | | New York, NY, GO | | | | |
| | 1,000 | | | 6.25%, 10/15/2028 | | | 1,218 | |
| | | | | New York, NY, GO (Prerefunded with US Gov't Securities) | | | | |
| | 45 | | | 5.75%, 03/01/2019 | | | 47 | |
| | | | | New York, NY, Transitional FA Future Tax Secured (Prerefunded with US Gov't Securities) | | | | |
| | 450 | | | 5.00%, 08/01/2023 | | | 455 | |
| | | | | NY State Thruway Auth | | | | |
| | 2,500 | | | 5.00%, 04/01/2021 | | | 3,070 | |
| | | | | Ulster County, NY, IDA Kingston Regional Senior Living Proj | | | | |
| | 4,475 | | | 6.00%, 09/15/2027 | | | 3,192 | |
| | | | | Westchester County, NY, IDA Continuing Care Retirement, Kendal on Hudson Proj | | | | |
| | 500 | | | 6.38%, 01/01/2024 | | | 503 | |
| | | | | | | | 28,849 | |
| | | | | North Carolina - 0.4% | | | | |
| | | | | Mecklenburg County, NC, Certificate of Participation School Improvements | | | | |
| | 795 | | | 5.00%, 02/01/2024 | | | 915 | |
| | | | | | | | | |
| | | | | North Dakota - 0.9% | | | | |
| | | | | North Dakota State FA | | | | |
| | 1,750 | | | 5.00%, 10/01/2022 | | | 2,176 | |
| | | | | | | | | |
| | | | | Ohio - 1.2% | | | | |
| | | | | Cuyahoga, OH, Community College Dist | | | | |
| | 1,200 | | | 5.00%, 08/01/2027 | | | 1,353 | |
| | | | | Hamilton, OH, School Dist Improvement GO | | | | |
| | 1,270 | | | 6.15%, 12/01/2016 | | | 1,529 | |
| | | | | | | | 2,882 | |
| | | | | Oklahoma - 0.9% | | | | |
| | | | | Oklahoma State Turnpike Auth | | | | |
| | 2,000 | | | 5.00%, 01/01/2029 | | | 2,310 | |
The accompanying notes are an integral part of these financial statements.
| The Hartford Municipal Real Return Fund |
| Schedule of Investments – (continued) |
| April 30, 2012 (Unaudited) |
| (000’s Omitted) |
| Shares or Principal Amount | | Market Value ╪ | |
MUNICIPAL BONDS - 93.6% - (continued) | | | | |
| | | | | Other U.S. Territories - 1.4% | | | | |
| | | | | Guam Government, Limited Obligation Rev Section 30 Ser A | | | | |
| $ | 565 | | | 5.75%, 12/01/2034 | | $ | 597 | |
| | | | | Puerto Rico Housing FA Single Family Rev | | | | |
| | 1,000 | | | 5.13%, 12/01/2027 | | | 1,080 | |
| | | | | Puerto Rico Sales Tax Financing Corp | | | | |
| | 1,000 | | | 5.00%, 08/01/2022 | | | 1,198 | |
| | | | | University Virgin Islands | | | | |
| | 270 | | | 5.13%, 12/01/2022 | | | 302 | |
| | 225 | | | 5.25%, 12/01/2023 - 12/01/2024 | | | 253 | |
| | | | | | | | 3,430 | |
| | | | | Pennsylvania - 3.0% | | | | |
| | | | | Pennsylvania State Higher Educational Fac Auth Rev Obligor: Edinboro University Foundation | | | | |
| | 1,000 | | | 6.00%, 07/01/2043 | | | 1,072 | |
| | | | | Pennsylvania State Turnpike Commission Rev | | | | |
| | 665 | | | 6.00%, 06/01/2028 | | | 774 | |
| | | | | Philadelphia, PA, GO | | | | |
| | 1,000 | | | 5.25%, 08/01/2019 | | | 1,142 | |
| | | | | Philadelphia, PA, Municipal Auth | | | | |
| | 650 | | | 6.38%, 04/01/2029 | | | 720 | |
| | 800 | | | 6.50%, 04/01/2034 | | | 866 | |
| | | | | Pittsburgh, PA, School Dist GO | | | | |
| | 2,320 | | | 5.00%, 09/01/2021 - 09/01/2023 | | | 2,814 | |
| | | | | | | | 7,388 | |
| | | | | Rhode Island - 0.8% | | | | |
| | | | | Central Falls, RI, Detention Fac Corp Rev | | | | |
| | 275 | | | 6.75%, 01/15/2013 | | | 271 | |
| | | | | Cranston, RI, GO | | | | |
| | 1,410 | | | 5.00%, 07/01/2018 | | | 1,612 | |
| | | | | | | | 1,883 | |
| | | | | South Carolina - 0.5% | | | | |
| | | | | South Carolina State Public Service Auth Rev | | | | |
| | 1,000 | | | 5.00%, 01/01/2019 | | | 1,219 | |
| | | | | | | | | |
| | | | | Tennessee - 0.9% | | | | |
| | | | | Johnson City, TN, Health & Educational Fac | | | | |
| | 1,000 | | | 5.50%, 07/01/2031 | | | 1,050 | |
| | | | | Tennessee State GO | | | | |
| | 1,000 | | | 5.00%, 10/01/2022 | | | 1,261 | |
| | | | | | | | 2,311 | |
| | | | | Texas - 9.6% | | | | |
| | | | | Boarne School District | | | | |
| | 1,060 | | | 5.00%, 02/01/2023 ‡ | | | 1,275 | |
| | | | | Dallas-Fort Worth, TX, International Airport Rev | | | | |
| | 740 | | | 6.00%, 11/01/2028 - 11/01/2032 | | | 742 | |
| | | | | Denton, TX, IDS GO | | | | |
| | 1,750 | | | 2.13%, 08/01/2042 | | | 1,812 | |
| | | | | Houston, TX, Utility System Rev | | | | |
| | 2,000 | | | 6.00%, 11/15/2036 | | | 2,374 | |
| | | | | Kerrville Health Facilities Development Corp. | | | | |
| | 935 | | | 5.00%, 08/15/2015 | | | 1,012 | |
| | | | | Killeen, TX, ISD GO | | | | |
| | 1,400 | | | 5.00%, 02/15/2020 ‡ | | | 1,737 | |
| | | | | La Vernia, TX, Higher Education Fin Corp | | | | |
| | 2,000 | | | 6.38%, 08/15/2044 | | | 2,215 | |
| | | | | Lower Colorado River Auth Rev (Prerefunded with State & Local Gov't Securities) | | | | |
| | 1,965 | | | 7.25%, 05/15/2037 | | | 2,365 | |
| | | | | North Texas Tollway Auth Rev | | | | |
| | 1,000 | | | 5.00%, 09/01/2023 | | | 1,208 | |
| | 3,000 | | | 6.00%, 01/01/2025 | | | 3,491 | |
| | | | | Tarrant County, TX, Culturall Education Fac | | | | |
| | 1,000 | | | 6.25%, 11/15/2029 | | | 1,197 | |
| | | | | Texas State Muni Gas Acquisition | | | | |
| | 1,000 | | | 5.25%, 12/15/2017 | | | 1,091 | |
| | | | | Texas State Private Activity Surface Transportation | | | | |
| | 2,000 | | | 6.88%, 12/31/2039 | | | 2,299 | |
| | | | | Travis County, TX, Health Fac, Querencia Barton Creek Project | | | | |
| | 1,000 | | | 5.65%, 11/15/2035 | | | 950 | |
| | | | | | | | 23,768 | |
| | | | | Virginia - 1.1% | | | | |
| | | | | Peninsula Town Ctr, VA, Community DA | | | | |
| | 695 | | | 6.45%, 09/01/2037 | | | 662 | |
| | | | | Virginia State Resources Auth Infrastructure | | | | |
| | 500 | | | 5.00%, 11/01/2024 | | | 588 | |
| | | | | Virginia Tobacco Settlement Funding Corp (Prerefunded with US Gov't Securities) | | | | |
| | 1,455 | | | 5.50%, 06/01/2026 | | | 1,589 | |
| | | | | | | | 2,839 | |
| | | | | Washington - 2.2% | | | | |
| | | | | Energy Northwest, WA, Elec Rev | | | | |
| | 2,500 | | | 5.00%, 07/01/2017 | | | 2,998 | |
| | | | | FYI Properties, WA, Lease Rev | | | | |
| | 2,285 | | | 5.50%, 06/01/2034 | | | 2,545 | |
| | | | | | | | 5,543 | |
| | | | | West Virginia - 1.8% | | | | |
| | | | | West Virginia State Econ DA Lease Rev | | | | |
| | 3,785 | | | 5.00%, 06/01/2018 - 06/01/2020 | | | 4,521 | |
| | | | | | | | 4,521 | |
| | | | | Wisconsin - 0.9% | | | | |
| | | | | Badger Tobacco Asset Securitization Corp of WI (Prerefunded with US Gov't Securities) | | | | |
| | 1,000 | | | 6.38%, 06/01/2032 ‡ | | | 1,005 | |
| | | | | Wisconsin State GO | | | | |
| | 125 | | | 5.75%, 05/01/2033 | | | 150 | |
| | 865 | | | 6.00%, 05/01/2036 | | | 1,042 | |
| | | | | | | | 2,197 | |
| | | | | Wyoming - 1.3% | | | | |
| | | | | Campbell County, WY, Solid Waste Fac Rev | | | | |
| | 3,000 | | | 5.75%, 07/15/2039 | | | 3,329 | |
| | | | | | | | | |
| | | | | Total municipal bonds | | | | |
| | | | | (cost $220,954) | | $ | 232,297 | |
| | | | | | | | | |
| | | | | Total long-term investments | | | | |
| | | | | (cost $220,954) | | $ | 232,297 | |
The accompanying notes are an integral part of these financial statements.
| Shares or Principal Amount | | | | | Market Value ╪ | |
| SHORT-TERM INVESTMENTS - 7.9% | | | | | | |
| | | | | Investment Pools and Funds - 7.9% | | | | | | | |
| 19,547 | | | JP Morgan Tax Free Money Market Fund | | | | | $ | 19,547 | |
| | | | | | | | | | | | |
| | | | | Total short-term investments | | | | | | | |
| | | | | (cost $19,547) | | | | | $ | 19,547 | |
| | | | | | | | | | | | |
| | | | | Total investments | | | | | | | |
| | | | | (cost $240,501) ▲ | | 101.5 | % | | $ | 251,844 | |
| | | | | Other assets and liabilities | | (1.5 | )% | | | (3,798 | ) |
| | | | | Total net assets | | 100.0 | % | | $ | 248,046 | |
Note: Percentage of investments as shown is the ratio of the total market value to total net assets.
| ▲ | Also represents cost for tax purposes. |
| ○ | The interest rate disclosed for these securities represents the effective yield on the date of the acquisition. |
| ● | Non-income producing. For long-term debt securities, items identified are in default as to payment of interest and/or principal. |
| ‡ | This security, or a portion of this security, has been segregated to cover funding requirements on investment transactions settling in the future. |
| ╦ | This security, or a portion of this security, has been pledged as collateral in connection with swap contracts. The Fund has also pledged $1,960 of cash as collateral in connection with swap contracts. |
| Δ | Variable rate securities; the rate reported is the coupon rate in effect at April 30, 2012. |
| ■ | Securities issued within terms of a private placement memorandum, exempt from registration under Rule 144A under the Securities Act of 1933, as amended, and may be sold only to qualified institutional buyers. Unless otherwise indicated, these holdings are determined to be liquid. At April 30, 2012, the aggregate value of these securities was $1,985, which represents 0.8% of total net assets. |
| ☼ | This security, or a portion of this security, was purchased on a when-issued, delayed delivery or delayed draw basis. The cost of these securities was $5,667 at April 30, 2012. |
Interest Rate Swap Contracts Outstanding at April 30, 2012
| Counterparty | | Payments made by
Fund | | Payments received by
Fund | | Notional
Amount | | Expiration
Date | | | Upfront
Premiums
Paid/
(Received) | | Market
Value ╪ | | | Unrealized
Appreciation/
(Depreciation) | |
| BCLY | | 2.22% Fixed | | CPURNSA 226.80 | | $ | 21,775 | | | 04/05/15 | | | $ | – | | $ | (105 | ) | | $ | (105 | ) |
| BCLY | | 2.46% Fixed | | CPURNSA 219.45 | | 3,500 | | | 03/09/13 | | | | – | | | 5 | | | | 5 | |
| BCLY | | 2.65% Fixed | | CPURNSA 219.28 | | 10,500 | | | 03/04/18 | | | | – | | | (139 | ) | | | (139 | ) |
| BCLY | | 2.75% Fixed | | CPURNSA 219.25 | | 7,000 | | | 03/03/21 | | | | – | | | (117 | ) | | | (117 | ) |
| BCLY | | 2.98% Fixed | | CPURNSA 219.41 | | 5,750 | | | 03/08/26 | | | | – | | | (266 | ) | | | (266 | ) |
| BOA | | 2.45% Fixed | | CPURNSA 226.34 | | 7,800 | | | 03/22/17 | | | | – | | | (42 | ) | | | (42 | ) |
| CSI | | 1.19% Fixed | | CPURNSA 226.04 | | 4,000 | | | 10/07/12 | | | | – | | | 36 | | | | 36 | |
| DEUT | | 1.40% Fixed | | CPURNSA 226.04 | | 7,000 | | | 10/07/14 | | | | – | | | 120 | | | | 120 | |
| DEUT | | 2.40% Fixed | | CPURNSA 226.02 | | 7,800 | | | 03/12/17 | | | | – | | | (17 | ) | | | (17 | ) |
| JPM | | 2.33% Fixed | | CPURNSA 225.92 | | 7,000 | | | 09/30/21 | | | | – | | | 156 | | | | 156 | |
| JPM | | 2.34% Fixed | | CPURNSA 219.28 | | 3,600 | | | 03/04/14 | | | | – | | | (2 | ) | | | (2 | ) |
| JPM | | 2.45% Fixed | | CPURNSA 219.25 | | 5,500 | | | 03/03/16 | | | | – | | | (26 | ) | | | (26 | ) |
| JPM | | 2.46% Fixed | | CPURNSA 219.45 | | 3,500 | | | 03/09/13 | | | | – | | | 5 | | | | 5 | |
| JPM | | 2.75% Fixed | | CPURNSA 219.25 | | 7,000 | | | 03/03/21 | | | | – | | | (117 | ) | | | (117 | ) |
| JPM | | 2.97% Fixed | | CPURNSA 220.69 | | 6,800 | | | 04/14/26 | | | | – | | | (305 | ) | | | (305 | ) |
| JPM | | 2.98% Fixed | | CPURNSA 219.28 | | 2,000 | | | 03/04/36 | | | | – | | | (125 | ) | | | (125 | ) |
| UBS | | 2.34% Fixed | | CPURNSA 219.28 | | 7,200 | | | 03/04/14 | | | | – | | | (5 | ) | | | (5 | ) |
| UBS | | 2.65% Fixed | | CPURNSA 219.28 | | 5,250 | | | 03/04/18 | | | | – | | | (69 | ) | | | (69 | ) |
The accompanying notes are an integral part of these financial statements.
| The Hartford Municipal Real Return Fund |
| Schedule of Investments – (continued) |
| April 30, 2012 (Unaudited) |
| (000’s Omitted) |
Interest Rate Swap Contracts Outstanding at April 30, 2012 - (continued)
| Counterparty | | Payments made by
Fund | | Payments received by
Fund | | Notional
Amount | | | Expiration
Date | | Upfront
Premiums
Paid/
(Received) | | | Market
Value ╪ | | | Unrealized
Appreciation/
(Depreciation) | |
| UBS | | 2.71% Fixed | | CPURNSA 220.66 | | $ | 4,600 | | | 04/13/16 | | $ | – | | | $ | (92 | ) | | $ | (92 | ) |
| UBS | | 2.75% Fixed | | CPURNSA 219.25 | | | 7,000 | | | 03/03/21 | | | – | | | | (117 | ) | | | (117 | ) |
| UBS | | 2.79% Fixed | | CPURNSA 220.66 | | | 7,800 | | | 04/13/18 | | | – | | | | (198 | ) | | | (198 | ) |
| UBS | | 2.95% Fixed | | CPURNSA 219.38 | | | 5,750 | | | 03/07/26 | | | – | | | | (230 | ) | | | (230 | ) |
| UBS | | 2.98% Fixed | | CPURNSA 219.28 | | | 2,000 | | | 03/04/36 | | | – | | | | (125 | ) | | | (125 | ) |
| | | | | | | | | | | | | $ | – | | | $ | (1,775 | ) | | $ | (1,775 | ) |
| ╪ | See Significant Accounting Policies of accompanying Notes to Financial Statements regarding valuation of securities. |
| GLOSSARY: (abbreviations used in preceding Schedule of Investments) |
| Counterparty Abbreviations: |
| BCLY | Barclays Capital, Inc. |
| BOA | Banc of America Securities LLC |
| CSI | Credit Suisse International |
| DEUT | Deutsche Bank Securities, Inc. |
| CPURNSA | U.S. CPI Urban Consumers NSA Index |
| Municipal Bond Abbreviations: |
| FGIC | Financial Guaranty Insurance Company |
| IDA | Industrial Development Authority Bond |
| ISD | Independent School District |
| USD | United School District |
The accompanying notes are an integral part of these financial statements.
| The Hartford Municipal Real Return Fund |
| Investment Valuation Hierarchy Level Summary |
| April 30, 2012 (Unaudited) |
| (000’s Omitted) |
| | | Total | | | Level 1 ♦ | | | Level 2 ♦ | | | Level 3 | |
| Assets: | | | | | | | | | | | | | | | | |
| Municipal Bonds | | | 232,297 | | | | – | | | | 232,297 | | | | – | |
| Short-Term Investments | | | 19,547 | | | | 19,547 | | | | – | | | | – | |
| Total | | $ | 251,844 | | | $ | 19,547 | | | $ | 232,297 | | | $ | – | |
| Interest Rate Swaps * | | | 322 | | | | – | | | | 322 | | | | – | |
| Total | | $ | 322 | | | $ | – | | | $ | 322 | | | $ | – | |
| Liabilities: | | | | | | | | | | | | | | | | |
| Interest Rate Swaps * | | | 2,097 | | | | – | | | | 1,046 | | | | 1,051 | |
| Total | | $ | 2,097 | | | $ | – | | | $ | 1,046 | | | $ | 1,051 | |
| ♦ | For the six-month period ended April 30, 2012, there were no transfers between Level 1 and Level 2. |
| * | Derivative instruments not reflected in the Schedule of Investments are valued at the unrealized appreciation/depreciation on the investments. |
Following is a reconciliation of Level 3 assets for which significant unobservable inputs were used to determine fair value:
| | | Balance as
of
October
31, 2011 | | | Realized
Gain
(Loss) | | | Change in
Unrealized
Appreciation
(Depreciation) | | | Net
Amortization | | | Purchases | | | Sales | | | Transfers
Into
Level 3 | | | Transfers
Out of
Level 3 | | | Balance as
of April
30, 2012 | |
| Assets: | | | | | | | | | | | | | | | | | | | | | | | | | | | | | | | | | | | | |
| Swaps* | | $ | 91 | | | $ | — | † | | $ | — | ‡ | | $ | — | | | $ | — | | | $ | — | | | $ | — | | | $ | (91 | ) | | $ | — | |
| Total | | $ | 91 | | | $ | — | | | $ | — | | | $ | — | | | $ | — | | | $ | — | | | $ | — | | | $ | (91 | ) | | $ | — | |
| | | | | | | | | | | | | | | | | | | | | | | | | | | | | | | | | | | | | |
| Liabilities: | | | | | | | | | | | | | | | | | | | | | | | | | | | | | | | | | | | | |
| Swaps* | | $ | (1,873 | ) | | $ | — | † | | $ | 821 | ‡ | | $ | — | | | $ | — | | | $ | — | | | $ | — | | | $ | — | | | $ | (1,051 | ) |
| Total | | $ | (1,873 | ) | | $ | — | | | $ | 821 | | | $ | — | | | $ | — | | | $ | — | | | $ | — | | | $ | — | | | $ | (1,051 | ) |
| * | Derivative instruments not reflected in the Schedule of Investments are valued at the unrealized appreciation/ depreciation on the investment. |
| † | The realized gain (loss) earned for swaps during the period ended April 30, 2012 was $(424). |
| ‡ | Change in unrealized appreciation (depreciation) in the current period relating to assets still held at April 30, 2012 was $138. |
The accompanying notes are an integral part of these financial statements.
| The Hartford Municipal Real Return Fund |
| Statement of Assets and Liabilities |
| April 30, 2012 (Unaudited) |
| (000’s Omitted) |
| Assets: | | | | |
| Investments in securities, at market value (cost $240,501) | | $ | 251,844 | |
| Cash | | | 1,960 | * |
| Unrealized appreciation on swap contracts | | | 322 | |
| Receivables: | | | | |
| Investment securities sold | | | 2,020 | |
| Fund shares sold | | | 727 | |
| Dividends and interest | | | 2,535 | |
| Other assets | | | 51 | |
| Total assets | | | 259,459 | |
| Liabilities: | | | | |
| Unrealized depreciation on swap contracts | | | 2,097 | |
| Payables: | | | | |
| Investment securities purchased | | | 8,763 | |
| Fund shares redeemed | | | 428 | |
| Investment management fees | | | 20 | |
| Dividends | | | 72 | |
| Distribution fees | | | 15 | |
| Accrued expenses | | | 18 | |
| Total liabilities | | | 11,413 | |
| Net assets | | $ | 248,046 | |
| Summary of Net Assets: | | | | |
| Capital stock and paid-in-capital | | $ | 284,707 | |
| Undistributed net investment income | | | 1 | |
| Accumulated net realized loss | | | (46,230 | ) |
| Unrealized appreciation of investments | | | 9,568 | |
| Net assets | | $ | 248,046 | |
| | | | | |
| Shares authorized | | | 19,300,000 | |
| Par value | | $ | 0.0001 | |
| Class A: Net asset value per share/Maximum offering price per share | | | $9.58/$10.03 | |
| Shares outstanding | | | 15,662 | |
| Net assets | | $ | 150,108 | |
| Class B: Net asset value per share | | $ | 9.50 | |
| Shares outstanding | | | 430 | |
| Net assets | | $ | 4,086 | |
| Class C: Net asset value per share | | $ | 9.53 | |
| Shares outstanding | | | 4,884 | |
| Net assets | | $ | 46,554 | |
| Class I: Net asset value per share | | $ | 9.60 | |
| Shares outstanding | | | 1,867 | |
| Net assets | | $ | 17,929 | |
| Class Y: Net asset value per share | | $ | 9.56 | |
| Shares outstanding | | | 3,072 | |
| Net assets | | $ | 29,369 | |
* Cash of $1,960 was pledged as collateral for open swap contracts at April 30, 2012.
The accompanying notes are an integral part of these financial statements.
| The Hartford Municipal Real Return Fund |
| Statement of Operations |
| For the Six-Month Period Ended April 30, 2012 (Unaudited) |
| (000’s Omitted) |
| Investment Income: | | | | |
| Dividends | | $ | 3 | |
| Interest | | | 4,975 | |
| Total investment income | | | 4,978 | |
| | | | | |
| Expenses: | | | | |
| Investment management fees | | | 596 | |
| Transfer agent fees | | | 53 | |
| Distribution fees | | | | |
| Class A | | | 183 | |
| Class B | | | 22 | |
| Class C | | | 222 | |
| Custodian fees | | | 2 | |
| Accounting services fees | | | 19 | |
| Registration and filing fees | | | 42 | |
| Board of Directors' fees | | | 3 | |
| Audit fees | | | 5 | |
| Other expenses | | | 14 | |
| Total expenses (before waivers) | | | 1,161 | |
| Expense waivers | | | (23 | ) |
| Total waivers | | | (23 | ) |
| Total expenses, net | | | 1,138 | |
| Net Investment Income | | | 3,840 | |
| Net Realized Gain on Investments and Other Financial Instruments: | | | | |
| Net realized gain on investments in securities | | | 5,029 | |
| Net realized loss on swap contracts | | | (390 | ) |
| Net Realized Gain on Investments and Other Financial Instruments | | | 4,639 | |
| Net Changes in Unrealized Appreciation of Investments and Other Financial Instruments: | | | | |
| Net unrealized appreciation of investments | | | 4,107 | |
| Net unrealized appreciation of swap contracts | | | 987 | |
| Net Changes in Unrealized Appreciation of Investments and Other Financial Instruments | | | 5,094 | |
| Net Gain on Investments and Other Financial Instruments | | | 9,733 | |
| Net Increase in Net Assets Resulting from Operations | | $ | 13,573 | |
The accompanying notes are an integral part of these financial statements.
| The Hartford Municipal Real Return Fund |
| Statement of Changes in Net Assets |
| |
| (000’s Omitted) |
| | | For the Six-Month
Period Ended
April 30, 2012
(Unaudited) | | | For the
Year Ended
October 31, 2011 | |
| Operations: | | | | | | | | |
| Net investment income | | $ | 3,840 | | | $ | 9,504 | |
| Net realized gain (loss) on investments and other financial instruments | | | 4,639 | | | | (1,653 | ) |
| Net unrealized appreciation (depreciation) of investments and other financial instruments | | | 5,094 | | | | (7,448 | ) |
| Net Increase In Net Assets Resulting From Operations | | | 13,573 | | | | 403 | |
| Distributions to Shareholders: | | | | | | | | |
| From net investment income | | | | | | | | |
| Class A | | | (2,453 | ) | | | (5,704 | ) |
| Class B | | | (58 | ) | | | (217 | ) |
| Class C | | | (585 | ) | | | (1,540 | ) |
| Class I | | | (247 | ) | | | (413 | ) |
| Class L* | | | — | | | | (240 | ) |
| Class Y | | | (538 | ) | | | (1,431 | ) |
| Total distributions | | | (3,881 | ) | | | (9,545 | ) |
| Capital Share Transactions: | | | | | | | | |
| Class A | | | 6,384 | | | | (11,279 | ) |
| Class B | | | (654 | ) | | | (2,529 | ) |
| Class C | | | 1,549 | | | | (2,924 | ) |
| Class I | | | 6,690 | | | | 2,559 | |
| Class L* | | | — | | | | (8,759 | ) |
| Class Y | | | (1,517 | ) | | | (2,261 | ) |
| Net increase (decrease) from capital share transactions | | | 12,452 | | | | (25,193 | ) |
| Net Increase (Decrease) In Net Assets | | | 22,144 | | | | (34,335 | ) |
| Net Assets: | | | | | | | | |
| Beginning of period | | | 225,902 | | | | 260,237 | |
| End of period | | $ | 248,046 | | | $ | 225,902 | |
| Undistributed (distribution in excess of) net investment income (loss) | | $ | 1 | | | $ | 42 | |
* Class L merged into Class A on August 5, 2011. Please refer to the Notes to Financial Statements for further details.
The accompanying notes are an integral part of these financial statements.
| The Hartford Municipal Real Return Fund |
| Notes to Financial Statements |
| April 30, 2012 (Unaudited) |
| (000’s Omitted) |
The Hartford Mutual Funds II, Inc. (“Company”) is an open-end management investment company comprised of five portfolios. Financial statements for The Hartford Municipal Real Return Fund (the “Fund”), a series of the Company, are included in this report.
The Company is organized under the laws of the State of Maryland and is registered with the Securities and Exchange Commission (“SEC”) under the Investment Company Act of 1940, as amended (“1940 Act”). The Fund is a diversified open-end management investment company.
Class A shares are sold with a front-end sales charge of up to 4.50%. Class B shares were sold with a contingent deferred sales charge which is assessed on the lesser of the per share net asset value (“NAV”) of the shares at the time of redemption or the original purchase price, and declines from up to 5.00% to zero depending on the period of time the shares are held (see note below regarding the closing of Class B shares). Class C shares are sold with a contingent deferred sales charge of up to 1.00% on shares redeemed within twelve months of purchase. Class I shares are sold without sales charges to certain eligible investors primarily through advisory fee-based wrap programs. Class Y shares, which are sold to certain eligible institutional investors, are sold without a sales charge. All classes of shares have identical voting, redemption, dividend, liquidation and other rights and the same terms and conditions, with the exceptions that each class may have different expenses, which may affect performance, and that Class B shares automatically convert to Class A shares after 8 years.
No new or additional investments are allowed in Class B shares of The Hartford Mutual Funds (including investments through any systematic investment plan). Existing shareholders of Class B shares may continue to hold their Class B shares, exchange their Class B shares for Class B shares of another Hartford Mutual Fund (as permitted by existing exchange privileges), or redeem their Class B shares as described in the Fund’s prospectus. Reinstatement privileges with respect to Class B shares will continue under the current policy. For investors electing to reinvest capital gains and dividends, any such capital gains or dividends on Class B shares will continue to be reinvested in Class B shares of the Fund. All Class B share attributes, including the 12b-1 fee, contingent deferred sales charge schedule, and conversion to Class A shares, remain unchanged.
| 2. | Significant Accounting Policies: |
The following is a summary of significant accounting policies of the Fund in the preparation of its financial statements, which are in accordance with the United States Generally Accepted Accounting Principles (“U.S. GAAP”). The preparation of financial statements in accordance with U.S. GAAP may require management to make estimates and assumptions that affect the reported amounts of assets and liabilities and disclosure of contingent assets and liabilities at the date of the financial statements and the reported amounts of increases and decreases in net assets from operations during the reporting period. Actual results could differ from those estimates.
| a) | Determination of Net Asset Value – The NAV of each class of the Fund’s shares is determined as of the close of regular trading (normally 4:00 p.m. Eastern Time) (the “NYSE Close”) on each day that the New York Stock Exchange (the “Exchange”) is open (“Valuation Date”). Information that becomes known to the Fund after the NAV has been calculated on a particular day will not generally be used to retroactively adjust the NAV determined earlier that day. |
| b) | Investment Valuation and Fair Value Measurements – For purposes of calculating the NAV, portfolio investments and other assets held by the Fund's portfolio for which market quotes are readily available are valued at market value. Market value is generally determined on the basis of last reported sales prices or official close price. If no sales are reported, market value is based on quotes obtained from a quotation reporting system, established market makers, or independent pricing services. If market prices are not readily available or are deemed unreliable, the Fund will use the fair value of the investment as determined in good faith under policies and procedures established by and under the supervision of the Company's Board of Directors. Market quotes are considered not readily available where there is an absence of current |
| The Hartford Municipal Real Return Fund |
| Notes to Financial Statements – (continued) |
| April 30, 2012 (Unaudited) |
| (000’s Omitted) |
or reliable market-based data (e.g., trade information or broker quotes), including where events occur after the close of the relevant market, but prior to the NYSE Close that materially affect the values of the Fund's portfolio investments or assets. In addition, market quotes are considered not readily available when, due to extraordinary circumstances, the exchanges or markets on which the investments trade do not open for trading for the entire day and no other market prices are available. There can be no assurance that the Fund could obtain the fair market value assigned to an investment if the Fund were to sell the investment at approximately the time at which the Fund determines its NAV.
Fixed income investments (other than short term obligations) and non-exchange traded derivatives held by the Fund are normally valued on the basis of quotes obtained from brokers and dealers or independent pricing services in accordance with procedures established by the Company’s Board of Directors. Prices obtained from independent pricing services use information provided by market makers or estimates of market values obtained from yield data relating to investments with similar characteristics. Generally, the Fund may use fair valuation in regard to fixed income investments when the Fund holds defaulted or distressed investments or investments in a company in which a reorganization is pending. Short-term investments maturing in 60 days or less are generally valued at amortized cost, if their original term to maturity was 60 days or less, or by amortizing their value on the 61st day prior to maturity, if the original term to maturity exceeded 60 days.
Financial instruments for which prices are not available from an independent pricing service may be valued using market quotations obtained from one or more dealers that make markets in the respective financial instrument in accordance with procedures established by the Company’s Board of Directors.
Investments in open-end mutual funds are valued at the respective NAV of each open-end mutual fund on the Valuation Date.
U.S. GAAP defines fair value as the price that the Fund would receive to sell an asset or pay to transfer a liability in an orderly transaction between market participants. The U.S. GAAP fair value measurement standards require disclosure of a fair value hierarchy for each major category of assets and liabilities. Various inputs are used in determining the fair value of the Fund’s investments. These inputs are summarized into three broad hierarchy levels. This hierarchy is based on whether the valuation inputs are observable or unobservable. These levels are:
| · | Level 1 – Quoted prices in active markets for identical investments. Level 1 may include exchange traded instruments, such as domestic equities, some foreign equities, options, futures, mutual funds, exchange traded funds, rights and warrants. |
| · | Level 2 – Observable inputs other than Level 1 prices, such as quoted prices for similar investments; quoted prices in markets that are not active; or other inputs that are observable or can be corroborated by observable market data. Level 2 may include debt investments that are traded less frequently than exchange traded instruments and which are valued using independent pricing services; foreign equities, which are principally traded on certain foreign markets and are adjusted daily pursuant to a fair value pricing service in order to reflect an adjustment for the factors occurring after the close of certain foreign markets but before the NYSE Close; and short-term investments, which are valued at amortized cost. |
| · | Level 3 – Significant unobservable inputs that are supported by limited or no market activity. Level 3 may include financial instruments whose values are determined using broker quotes or require significant management judgment or estimation. These unobservable valuation inputs may include estimates for current yields, maturity/duration, prepayment speed, and broker quotes for comparable investments along with other assumptions relating to credit quality, collateral value, complexity of the investment structure, general market conditions and liquidity. This category may include investments where trading has been halted or there are certain restrictions on trading. While these investments are priced using unobservable inputs, the valuation of these investments reflects the best available data and management believes the prices are a reasonable representation of exit price. |
Valuation levels are not necessarily indicative of the risk associated with investing in such investments. Individual investments within any of the above mentioned asset classes may be assigned a different hierarchical level than those presented above, as individual circumstances dictate.
For additional information, refer to the Investment Valuation Hierarchy Level Summary and the Level 3 roll-forward reconciliation which follow the Schedule of Investments.
For purposes of reporting transfers between different hierarchy levels, both transfers in and out of each level, as applicable, are shown as if they occurred at the beginning of the period.
| c) | Investment Transactions and Investment Income – Investment transactions are recorded as of the trade date (the date the order to buy or sell is executed) for financial reporting purposes. Investments purchased or sold on a when-issued or delayed-delivery basis may be settled a month or more after the trade date. Realized gains and losses are determined on the basis of identified cost. |
Dividend income is accrued as of the ex-dividend date. Interest income, including amortization of premium and accretion of discounts, is accrued on a daily basis.
| d) | Fund Share Valuation and Dividend Distributions to Shareholders – Orders for the Fund’s shares are executed in accordance with the investment instructions of the shareholders. The NAV of the Fund’s shares is determined as of the close of business on each business day of the Exchange. The NAV is determined separately for each class of shares of the Fund by dividing the Fund’s net assets attributable to that class by the number of shares of the class outstanding. Each class of shares offered by the Fund has equal rights as to assets and voting privileges (except that shareholders of a class have exclusive voting rights regarding any matter relating solely to that class of shares). Income and non-class specific expenses are allocated daily to each class on the basis of the relative net assets of the class. Realized and unrealized capital gains and losses are allocated daily based on the relative net assets of each class of shares of the Fund. |
Orders for the purchase of the Fund’s shares received prior to the close of the Exchange on any day the Exchange is open for business are priced at the NAV determined as of the close of the Exchange. Orders received after the close of the Exchange, or on a day on which the Exchange and/or the Fund is not open for business, are priced at the next determined NAV.
Dividends are declared pursuant to a policy adopted by the Company’s Board of Directors based upon the investment performance of the Fund. Normally, dividends from net investment income are declared daily and paid monthly. Dividends from realized capital gains, if any, are paid at least once a year.
Distributions from net investment income, net realized capital gains and capital are determined in accordance with federal income tax regulations, which may differ from U.S. GAAP with respect to character and timing. These differences may include but are not limited to losses deferred due to wash sale adjustments, foreign currency gains and losses, adjustments related to Passive Foreign Investment Companies (“PFICs”), Real Estate Investment Trusts (“REITs”), Regulated Investment Companies (“RICs”), certain derivatives and partnerships. Permanent book and federal income tax basis differences relating to shareholder distributions will result in reclassifications to certain of the Fund’s capital accounts (see Federal Income Taxes: Reclassification of Capital Accounts note).
| 3. | Securities and Other Investments: |
| a) | Illiquid and Restricted Investments – The Fund is permitted to invest up to 15% of its net assets in illiquid investments. Illiquid investments are those that may not be sold or disposed of in the ordinary course of business within seven days, at approximately the price used to determine the Fund’s NAV. The Fund may not be able to sell illiquid investments when its sub-adviser considers it desirable to do so or may have to sell such investments at a price that is lower than the price that could be obtained if the investments were more liquid. A sale of illiquid investments may require more time and |
| The Hartford Municipal Real Return Fund |
| Notes to Financial Statements-(continued) |
| April 30, 2012 (Unaudited) |
| (000’s Omitted) |
may result in higher dealer discounts and other selling expenses than does the sale of those that are liquid. Illiquid investments also may be more difficult to value due to the unavailability of reliable market quotations for such investments, and an investment in them may have an adverse impact on the Fund’s NAV. The Fund may also purchase certain restricted investments that can only be resold to certain qualified investors and may be determined to be liquid pursuant to policies and guidelines established by the Company’s Board of Directors. The Fund, as shown on the Schedule of Investments, had illiquid and/or restricted investments as of April 30, 2012.
| b) | Investments Purchased on a When-Issued or Delayed-Delivery Basis – Delivery and payment for investments that have been purchased by the Fund on a forward commitment, or when-issued or delayed-delivery basis, take place beyond the customary settlement period. A fund may dispose of or renegotiate a delayed-delivery transaction after it is entered into, and may sell delayed-delivery investments before they are delivered, which may result in a realized gain or loss. During this period, such investments are subject to market fluctuations, and the Fund identifies investments segregated in its records with a value at least equal to the amount of the commitment. The Fund, as shown on the Schedule of Investments, had when-issued or delayed delivery investments as of April 30, 2012. |
| 4. | Financial Derivative Instruments:
|
The following disclosures contain information on how and why the Fund uses derivative instruments, the credit-risk-related contingent features in certain derivative instruments, and how derivative instruments affect the Fund’s financial position and results of operations. The location and fair value amounts of these instruments on the Statement of Assets and Liabilities and the realized gains and losses and changes in unrealized gains and losses on the Statement of Operations, each categorized by type of derivative contract, are included in the following Additional Derivative Instrument Information footnote. The derivative instruments outstanding as of period-end are disclosed in the notes to the Schedule of Investments and the amounts of realized gains and losses and changes in unrealized gains and losses on derivative instruments during the period are disclosed in the Statement of Operations.
| a) | Swap Agreements – The Fund may invest in swap agreements. Swap agreements are privately negotiated agreements between the Fund and a counterparty to exchange or swap investment cash flows, assets, foreign currencies or market-linked returns at specified future intervals. The Fund enters into credit default, total return, cross-currency, interest rate, inflation and other forms of swap agreements to manage its exposure to credit, currency, interest rate, commodity and inflation risk. Swap agreements are also used to gain exposure to certain markets. In connection with these agreements, investments or cash may be identified as collateral in accordance with the terms of the respective swap agreements to provide assets of value and recourse in the event of default or bankruptcy/insolvency. Swaps are valued based on custom valuations furnished by an independent pricing service. Swaps for which prices are not available from an independent pricing service are valued in accordance with procedures established by the Company’s Board of Directors, and the change in value, if any, is recorded as an unrealized gain or loss on the Statement of Assets and Liabilities. Payments received or made at the beginning of the measurement period are reflected as such on the Statement of Assets and Liabilities and represent payments made or received upon entering into the swap agreement to compensate for differences between the stated terms of the swap agreement and prevailing market conditions (credit spreads, currency exchange rates, interest rates, and other relevant factors). These upfront payments are recorded as realized gains or losses on the Statement of Operations upon termination or maturity of the swap. A liquidation payment received or made at the termination of the swap and some net periodic payments received or paid by the Fund are recorded as realized gains or losses on the Statement of Operations. Net periodic payments and some upfront payments received or paid by the Fund with regard to interest rate swaps are recorded as increases or decreases to income on the Statement of Operations. Entering into these agreements involves, to varying degrees, elements of credit, market and documentation risk in excess of the amounts recognized on the Statement of Assets and Liabilities. Such risks involve the possibility that there will be no liquid market for these agreements, that the counterparty to the agreements may default on its obligation to perform or disagree as to the meaning of contractual terms in the agreements, and that there may be unfavorable changes in interest rates. The Fund’s maximum risk of loss from counterparty credit risk is the discounted net value of the cash flows to be received from the counterparty over the contract’s remaining life, to the extent that amount is positive. The risk is mitigated by having a master netting arrangement between the Fund and the counterparty, which allows for the netting of |
payments made or received (although such amounts are presented on a gross basis within the Statement of Assets and Liabilities, as applicable) as well as the posting of collateral to the Fund to cover the Fund’s exposure to the counterparty.
Interest Rate Swap Agreements – The Fund is subject to interest rate risk in the normal course of pursuing its investment objectives. Because the Fund holds fixed rate bonds, the value of these bonds may decrease if interest rates rise. To help hedge against this risk and to maintain its ability to generate income at prevailing market rates, the Fund may enter into interest rate swap agreements. In a typical interest rate swap, one party agrees to make regular payments equal to a floating interest rate, based on a specified interest rate benchmark (e.g., London Interbank Offered Rate (“LIBOR”)) or index (e.g., U.S. Consumer Price Index), multiplied by a “notional principal amount”, in return for payments equal to a fixed rate multiplied by the same amount, for a specific period of time. The net interest received or paid on interest rate swap contracts is accrued daily as interest income/expense. Interest rate swaps are marked to market daily and the change, if any, is recorded as an unrealized gain or loss in the Statement of Operations. When the interest rate swap agreement is terminated early, the Fund records a realized gain or loss equal to the difference between the current realized value and the expected cash flows.
If an interest rate swap contract provides for payments in different currencies, the parties might agree to exchange the notional principal amount as well. Interest rate swaps may also depend on other prices or rates, such as the value of an index or mortgage prepayments rates. The risks of interest rate swaps include changes in market conditions which will affect the value of the contract or the cash flows and the possible inability of the counterparty to fulfill its obligations under the agreement. The Fund’s maximum risk of loss from counterparty credit risk is the discounted net value of the cash flows to be received from the counterparty over the agreement’s remaining life, to the extent that the amount is positive. This risk may be mitigated by having a master netting arrangement between the Fund and the counterparty (although such amounts are presented on a gross basis within the Statement of Assets and Liabilities, as applicable) or by posting collateral by the counterparty to the Fund to cover the Fund’s exposure to the counterparty. The Fund, as shown on the Schedule of Investments, had outstanding interest rate swaps as of April 30, 2012.
| b) | Additional Derivative Instrument Information: |
Fair Values of Derivative Instruments on the Statement of Assets and Liabilities as of April 30, 2012:
| | | Risk Exposure Category | |
| | | Interest Rate
Contracts | | | Foreign
Exchange
Contracts | | | Credit
Contracts | | | Equity
Contracts | | | Commodity
Contracts | | | Other
Contracts | | | Total | |
| Assets: | | | | | | | | | | | | | | | | | | | | | | | | | | | | |
| Unrealized appreciation on swap contracts | | $ | 322 | | | $ | — | | | $ | — | | | $ | — | | | $ | — | | | $ | — | | | $ | 322 | |
| Total | | $ | 322 | | | $ | — | | | $ | — | | | $ | — | | | $ | — | | | $ | — | | | $ | 322 | |
| | | | | | | | | | | | | | | | | | | | | | | | | | | | | |
| Liabilities: | | | | | | | | | | | | | | | | | | | | | | | | | | | | |
| Unrealized depreciation on swap contracts | | $ | 2,097 | | | $ | — | | | $ | — | | | $ | — | | | $ | — | | | $ | — | | | $ | 2,097 | |
| Total | | $ | 2,097 | | | $ | — | | | $ | — | | | $ | — | | | $ | — | | | $ | — | | | $ | 2,097 | |
The volume of derivatives that is presented in the Schedule of Investments is consistent with the derivative activity during the six-month period ended April 30, 2012.
| The Hartford Municipal Real Return Fund |
| Notes to Financial Statements-(continued) |
| April 30, 2012 (Unaudited) |
| (000’s Omitted) |
The Effect of Derivative Instruments on the Statement of Operations for the six-month period ended April 30, 2012:
| | | Risk Exposure Category | |
| | | Interest Rate
Contracts | | | Foreign
Exchange
Contracts | | | Credit
Contracts | | | Equity
Contracts | | | Commodity
Contracts | | | Other
Contracts | | | Total | |
| Realized Gain (Loss) on Derivatives Recognized as a Result of Operations: |
| Net realized loss on swap contracts | | $ | (390 | ) | | $ | — | | | $ | — | | | $ | — | | | $ | — | | | $ | — | | | $ | (390 | ) |
| Total | | $ | (390 | ) | | $ | — | | | $ | — | | | $ | — | | | $ | — | | | $ | — | | | $ | (390 | ) |
| | | | | | | | | | | | | | | | | | | | | | | | | | | | | |
| Net Change in Unrealized Appreciation (Depreciation) on Derivatives Recognized as a Result of Operations: |
| Net change in unrealized appreciation of swap contracts | | $ | 987 | | | $ | — | | | $ | — | | | $ | — | | | $ | — | | | $ | — | | | $ | 987 | |
| Total | | $ | 987 | | | $ | — | | | $ | — | | | $ | — | | | $ | — | | | $ | — | | | $ | 987 | |
| a) | Credit and Counterparty Risks – Credit risk depends largely on the perceived financial health of bond issuers. In general, the credit rating is inversely related to the credit risk of the issuer. Higher rated bonds generally are deemed to have less credit risk, while lower or unrated bonds are deemed to have higher risk of default. The share price, yield and total return of a fund that holds securities with higher credit risk may be more volatile than those of a fund that holds bonds with lower credit risk. Similar to credit risk, the Fund may be exposed to counterparty risk, or the risk that an institution or other entity with which the Fund has unsettled or open transactions will default. |
| b) | Market Risks – The Fund’s investments expose the Fund to various risks including, but not limited to, interest rate, prepayment and extension risks. Interest rate risk is the risk that fixed income securities will decline in value because of changes in interest rates. As nominal interest rates rise, the values of certain fixed income securities held by the Fund are likely to decrease. A nominal interest rate can be described as the sum of a real interest rate and an expected inflation rate. Fixed income securities with longer durations tend to be more sensitive to changes in interest rates, usually making them more volatile than securities with shorter durations. Duration is useful primarily as a measure of the sensitivity of a fixed income security’s market price to interest rate (i.e. yield) movements. In addition, securities are subject to extension risk. Rising interest rates may cause prepayments to occur at a slower than expected rate, thereby effectively lengthening the maturity of the security and making the security more sensitive to interest rate changes. |
| a) | Federal Income Taxes – For federal income tax purposes, the Fund intends to continue to qualify as a RIC under Subchapter M of the Internal Revenue Code (“IRC”) by distributing substantially all of its taxable net investment income and net realized capital gains to its shareholders and otherwise complying with the requirements of RICs. The Fund has distributed substantially all of its income and capital gains in prior years, if applicable, and intends to distribute substantially all of its income and capital gains during the calendar year ending December 31, 2012. Accordingly, no provision for federal income or excise taxes has been made in the accompanying financial statements. Distributions from short-term capital gains are treated as ordinary income distributions for federal income tax purposes. |
| b) | Net Investment Income (Loss), Net Realized Gains (Losses) – Net investment income (loss) and net realized gains (losses) may differ for financial statement and tax purposes primarily because of losses deferred due to wash sale adjustments, foreign currency gains and losses, adjustments related to PFICs, REITs, RICs, certain derivatives and partnerships. The character of distributions made during the year from net investment income or net realized gains may differ from their ultimate characterization for federal income tax purposes. Also, due to the timing of dividend distributions, the fiscal year in which amounts are distributed may differ from the year that the income or realized gains (losses) were recorded by the Fund. |
| c) | Distributions and Components of Distributable Earnings – The tax character of distributions paid by the Fund for the periods indicated is as follows (as adjusted for dividends payable): |
| | | For the Year Ended
October 31, 2011 | | | For the Year Ended
October 31, 2010 | |
| Tax Exempt Income † | | $ | 9,598 | | | $ | 11,621 | |
| Ordinary Income | | | 45 | | | | — | |
† The Fund designates these distributions as exempt interest pursuant to IRC Sec. 852(b)(5).
As of October 31, 2011, the Fund’s components of distributable earnings (deficit) on a tax basis were as follows:
| | | Amount | |
| Undistributed Ordinary Income | | $ | 134 | |
| Accumulated Capital Losses * | | | (50,869 | ) |
| Unrealized Appreciation † | | | 4,474 | |
| Total Accumulated Deficit | | $ | (46,261 | ) |
| * | The Fund has capital loss carryforwards that are identified in the Capital Loss Carryforward note that follows. |
| † | The differences between book-basis and tax-basis unrealized appreciation (depreciation) may be attributable to the losses deferred due to wash sale adjustments, foreign currency gains and losses, adjustments related to PFICs, REITs, RICs, certain derivatives and partnerships. |
| d) | Reclassification of Capital Accounts – The Fund may record reclassifications in its capital accounts. These reclassifications have no impact on the total net assets of the Fund. The reclassifications are a result of permanent differences between U.S. GAAP and tax accounting for such items as foreign currency, PFICs, expiration or utilization of capital loss carryforwards or net operating losses. Adjustments are made to reflect the impact these items have on current and future distributions to shareholders. Therefore, the source of the Fund’s distributions may be shown in the accompanying Statement of Changes in Net Assets as from undistributed net investment income, from accumulated net realized gains on investments or from capital depending on the type of book and tax differences that exist. For the year ended October 31, 2011, the Fund had no reclassifications. |
| e) | Capital Loss Carryforward – On December 22, 2010, the Regulated Investment Company Modernization Act of 2010 (the “Act”) was enacted, which made changes to the capital loss carryforward rules. The changes are effective for taxable years beginning after the date of enactment. Under the Act, funds are permitted to carry forward capital losses for an unlimited period. However, any losses incurred during those future taxable years will be required to be utilized prior to the losses incurred in pre-enactment taxable years, which carry an expiration date. As a result of this ordering rule, pre-enactment capital loss carryforwards may be more likely to expire unused. Additionally, post-enactment capital loss carryforwards retain their character as either short-term or long-term capital losses rather than being considered all short-term as permitted under prior regulation. |
| The Hartford Municipal Real Return Fund |
| Notes to Financial Statements-(continued) |
| April 30, 2012 (Unaudited) |
| (000’s Omitted) |
At October 31, 2011 (tax-year-end), the Fund had capital loss carryforwards for U.S. federal income tax purposes as follows:
| Year of Expiration | | | Amount | |
| 2013 | | | $ | 5 | |
| 2014 | | | | 433 | |
| 2015 | | | | 2,885 | |
| 2016 | | | | 23,183 | |
| 2017 | | | | 16,621 | |
| 2018 | | | | 6,088 | |
| 2019 | | | | 1,654 | |
Total | | | $ | 50,869 | |
As a result of mergers in the Fund, certain provisions in the IRC may limit future utilization of capital losses.
| f) | Accounting for Uncertainty in Income Taxes – The Fund has adopted financial reporting rules that require the Fund to analyze all open tax years, as defined by the statute of limitations, for all major jurisdictions. Generally, tax authorities can examine all tax returns filed for the last three years. The Fund does not have an examination in progress. |
The Fund has reviewed all open tax years and major jurisdictions and concluded that these financial reporting rules had no effect on the Fund’s financial position or results of operations. There is no tax liability resulting from unrecognized tax benefits relating to uncertain income tax positions taken or expected to be taken on the tax return for the fiscal year ended October 31, 2011. The Fund is also not aware of any tax positions for which it is reasonably possible that the total amounts of unrecognized tax benefits will significantly change in the next twelve months.
| a) | Investment Management Agreement – Hartford Investment Financial Services, LLC (“HIFSCO”), a wholly-owned indirect subsidiary of The Hartford Financial Services Group, Inc. (“The Hartford”), serves as investment manager to the Fund pursuant to an Investment Management Agreement with the Company. As investment manager, HIFSCO has overall investment supervisory responsibility for the Fund. In addition, HIFSCO provides administrative personnel, services, equipment, facilities and office space for proper operation of the Fund. Effective March 5, 2012, HIFSCO has contracted with Wellington Management Company, LLP under a sub-advisory agreement for the provision of day-to-day investment management services to the Fund in accordance with the Fund’s investment objective and policies. Prior to March 5, 2012, Hartford Investment Management Company was the sub-adviser for the Fund. The Fund pays a fee to HIFSCO, a portion of which may be used to compensate the sub-advisers. |
The schedule below reflects the rates of compensation paid to HIFSCO for investment management services rendered as of April 30, 2012; the rates are accrued daily and paid monthly:
| Average Daily Net Assets | | Annual Fee | |
| On first $500 million | | | 0.50 | % |
| On next $500 million | | | 0.45 | % |
| On next $1.5 billion | | | 0.44 | % |
| On next $2.5 billion | | | 0.43 | % |
| On next $5 billion | | | 0.42 | % |
| Over $10 billion | | | 0.41 | % |
The schedule below reflects the rates of compensation paid to HIFSCO for investment management services rendered during the period October 31, 2011, through February 29, 2012.
| Average Daily Net Assets | | Annual Fee | |
| On first $500 million | | | 0.50 | % |
| On next $4.5 billion | | | 0.45 | % |
| On next $5 billion | | | 0.43 | % |
| Over $10 billion | | | 0.42 | % |
| b) | Accounting Services Agreement – Pursuant to the Fund Accounting Agreement between Hartford Life Insurance Company (“HLIC”) and the Company, on behalf of the Fund, HLIC provides accounting services to the Fund and receives monthly compensation based on the Fund’s average net assets at the rates set forth below. The Fund’s accounting services fees are accrued daily and paid monthly. |
| Average Daily Net Assets | | Annual Fee | |
| On first $5 billion | | | 0.016 | % |
| On next $5 billion | | | 0.014 | % |
| Over $10 billion | | | 0.012 | % |
| c) | Operating Expenses – Allocable expenses incurred by the Company are allocated to each Fund and allocated to classes within the Fund in proportion to the average daily net assets of the Fund and each class, except where allocation of certain expenses is more fairly made directly to the Fund or to specific classes within a Fund. As of April 30, 2012, HIFSCO contractually limited the total operating expenses of this Fund, exclusive of taxes, interest expense, brokerage commissions, acquired fund fees and expenses and extraordinary expenses as follows: |
| Class A | | | Class B | | | Class C | | | Class I | | | Class Y | |
| | 0.85 | % | | | 1.60 | % | | | 1.60 | % | | | 0.60 | % | | | 0.60 | % |
| d) | Distribution and Service Plan for Class A, B and C Shares – HIFSCO is the principal underwriter and distributor of the Fund. HIFSCO is engaged in distribution activities, which include marketing and distribution of shares through broker-dealers, financing distribution costs and maintaining financial books and records. For the six-month period ended April 30, 2012, HIFSCO received front-end load sales charges of $264 and contingent deferred sales charges of $33 from the Fund. |
The Fund has adopted a Distribution and Service Plan in accordance with Rule 12b-1 of the 1940 Act to compensate the distributor (HIFSCO) for activities intended to result in the sale and distribution of Class A, B and C shares and for providing services for shareholders. The Rule 12b-1 plan applicable to Class A shares of the Fund provides for payment of a Rule 12b-1 fee of 0.25% of average daily net assets. Some or all of the fee may be used for shareholder servicing expenses with the remainder used for distribution expenses. Some or the entire Rule 12b-1 fee for Class B shares may be remitted to broker-dealers for distribution and/or shareholder account services. Under the Class B Plan, the Fund pays the distributor 1.00% of the average daily net assets of Class B shares that are outstanding for 8 years or less, 0.25% of which is a fee for services provided to existing shareholders with the remainder used for distribution expenses. After eight years, Class B shares convert to Class A shares. Upon conversion to Class A shares, the Class A plan described above will apply to those shares. Under the Class C Plan, the Fund pays the distributor 1.00% of the average daily net assets of Class C shares outstanding, 0.25% of which is intended as a fee for services provided to existing shareholders with the remainder used for distribution expenses. For Class C shares, some or the entire fee may be remitted to broker-dealers for distribution and/or shareholder account services. The Fund’s 12b-1 fees are accrued daily and paid monthly.
For the six-month period ended April 30, 2012, total sales commissions paid to affiliated brokers/dealers of The Hartford for distributing the Fund's shares were $2. These commissions are in turn paid to sales representatives of the broker/dealers.
| The Hartford Municipal Real Return Fund |
| Notes to Financial Statements-(continued) |
| April 30, 2012 (Unaudited) |
| (000’s Omitted) |
| e) | Other Related Party Transactions – Certain officers of the Fund are directors and/or officers of HIFSCO and/or The Hartford or its subsidiaries. For the six-month period ended April 30, 2012, a portion of the Fund’s chief compliance officer’s compensation was paid by all of the investment companies in the Hartford fund complex. The portion allocated to the Fund rounds to zero. Hartford Administrative Services Company (“HASCO”), an indirect wholly-owned subsidiary of The Hartford, provides transfer agent services to the Fund. HASCO has contractually agreed to reimburse any portion of the transfer agency fees over 0.30% of average daily net assets per fiscal year for each class. For providing such services, HASCO is compensated on a per account basis that varies by account type, except with respect to Class Y, for which it is compensated based on average daily net assets. The amount paid to HASCO and any related contractual reimbursement amounts, if applicable, can be found in the Statement of Operations. These fees are accrued daily and paid monthly. |
| 8. | Investment Transactions:
|
For the six-month period ended April 30, 2012, the Fund's aggregate purchases and sales of investment securities (excluding short-term investments) were as follows:
| | | Amount | |
| Cost of Purchases Excluding U.S. Government Obligations | | $ | 91,101 | |
| Sales Proceeds Excluding U.S. Government Obligations | | | 72,356 | |
| 9. | Capital Share Transactions:
|
The following information is for the six-month period ended April 30, 2012, and the year ended October 31, 2011:
| | | For the Six-Month Period Ended April 30, 2012 | | | For the Year Ended October 31, 2011 | |
| | | Shares Sold | | | Shares
Issued for
Reinvested
Dividends | | | Shares
Redeemed | | | Shares
Issued
from
Merger | | | Net Increase
(Decrease) of
Shares | | | Shares
Sold | | | Shares
Issued for
Reinvested
Dividends | | | Shares
Redeemed | | | Shares
Issued
from
Merger | | | Net Increase
(Decrease) of
Shares | |
| Class A | | | | | | | | | | | | | | | | | | | | | | | | | | | | | | | | | | | | | | | | |
| Shares | | | 2,742 | | | | 236 | | | | (2,286 | ) | | | — | | | | 692 | | | | 4,004 | | | | 560 | | | | (6,740 | ) | | | 723 | | | | (1,453 | ) |
| Amount | | $ | 25,657 | | | $ | 2,226 | | | $ | (21,499 | ) | | $ | — | | | $ | 6,384 | | | $ | 36,513 | | | $ | 5,079 | | | $ | (61,073 | ) | | $ | 8,202 | | | $ | (11,279 | ) |
| Class B | | | | | | | | | | | | | | | | | | | | | | | | | | | | | | | | | | | | | | | | |
| Shares | | | 7 | | | | 5 | | | | (82 | ) | | | — | | | | (70 | ) | | | 21 | | | | 20 | | | | (323 | ) | | | — | | | | (282 | ) |
| Amount | | $ | 66 | | | $ | 49 | | | $ | (769 | ) | | $ | — | | | $ | (654 | ) | | $ | 187 | | | $ | 179 | | | $ | (2,895 | ) | | $ | — | | | $ | (2,529 | ) |
| Class C | | | | | | | | | | | | | | | | | | | | | | | | | | | | | | | | | | | | | | | | |
| Shares | | | 630 | | | | 50 | | | | (517 | ) | | | — | | | | 163 | | | | 1,249 | | | | 131 | | | | (1,727 | ) | | | — | | | | (347 | ) |
| Amount | | $ | 5,921 | | | $ | 465 | | | $ | (4,837 | ) | | $ | — | | | $ | 1,549 | | | $ | 11,342 | | | $ | 1,183 | | | $ | (15,449 | ) | | $ | — | | | $ | (2,924 | ) |
| Class I | | | | | | | | | | | | | | | | | | | | | | | | | | | | | | | | | | | | | | | | |
| Shares | | | 1,078 | | | | 22 | | | | (390 | ) | | | — | | | | 710 | | | | 942 | | | | 35 | | | | (696 | ) | | | — | | | | 281 | |
| Amount | | $ | 10,205 | | | $ | 202 | | | $ | (3,717 | ) | | $ | — | | | $ | 6,690 | | | $ | 8,554 | | | $ | 318 | | | $ | (6,313 | ) | | $ | — | | | $ | 2,559 | |
| Class L | | | | | | | | | | | | | | | | | | | | | | | | | | | | | | | | | | | | | | | | |
| Shares | | | — | | | | — | | | | — | | | | — | | | | — | | | | 6 | | | | 21 | | | | (89 | ) | | | (726 | ) | | | (788 | ) |
| Amount | | $ | — | | | $ | — | | | $ | — | | | $ | — | | | $ | — | | | $ | 54 | | | $ | 187 | | | $ | (798 | ) | | $ | (8,202 | ) | | $ | (8,759 | ) |
| Class Y | | | | | | | | | | | | | | | | | | | | | | | | | | | | | | | | | | | | | | | | |
| Shares | | | 4 | | | | 44 | | | | (210 | ) | | | — | | | | (162 | ) | | | 38 | | | | 121 | | | | (411 | ) | | | — | | | | (252 | ) |
| Amount | | $ | 40 | | | $ | 418 | | | $ | (1,975 | ) | | $ | — | | | $ | (1,517 | ) | | $ | 342 | | | $ | 1,096 | | | $ | (3,699 | ) | | $ | — | | | $ | (2,261 | ) |
| Total | | | | | | | | | | | | | | | | | | | | | | | | | | | | | | | | | | | | | | | | |
| Shares | | | 4,461 | | | | 357 | | | | (3,485 | ) | | | — | | | | 1,333 | | | | 6,260 | | | | 888 | | | | (9,986 | ) | | | (3 | ) | | | (2,841 | ) |
| Amount | | $ | 41,889 | | | $ | 3,360 | | | $ | (32,797 | ) | | $ | — | | | $ | 12,452 | | | $ | 56,992 | | | $ | 8,042 | | | $ | (90,227 | ) | | $ | — | | | $ | (25,193 | ) |
The following reflects the conversion of Class B shares into Class A shares (reflected as Class A shares sold) for the six-month period ended April 30, 2012, and the year ended October 31, 2011:
| | | | Shares | | | Dollars | |
| For the Six-Month Period Ended April 30, 2012 | | | | 19 | | | $ | 183 | |
| For the Year Ended October 31, 2011 | | | | 73 | | | $ | 662 | |
The Fund is one of several Hartford funds that participate in a $500 million committed revolving line of credit facility. The facility is to be used for temporary or emergency purposes. Under the arrangement, the funds are required to own securities having a market value in excess of 300% of the total bank borrowings. The interest rate on borrowings varies depending on the nature of the loan. The facility also requires a fee to be paid based on the amount of the commitment. This commitment fee is allocated to all of the funds participating in the line of credit based on the average net assets of the funds. During the six-month period ended April 30, 2012, the Fund did not have any borrowings under this facility.
At its May 3, 2011, meeting, the Board of Directors of The Hartford Mutual Funds II, Inc. approved the reclassification of Class L shares into Class A shares of the Fund.
Effective with the close of business on August 5, 2011, Class L was merged into Class A. The merger was accomplished by a tax-free exchange as detailed below:
| | | Class A | | | Class L | |
| Shares exchanged | | | N/A | | | | 726 | |
| Shares issued - to Class L shareholders | | | 723 | | | | N/A | |
| Net assets immediately before merger | | $ | 122,513 | | | $ | 6,714 | |
| Net assets immediately after merger | | $ | 129,227 | | | | N/A | |
| 12. | Pending Legal Proceedings: |
On February 25, 2011, Jennifer L. Kasilag, Louis Mellinger, Judith M. Menendez, Jacqueline M. Robinson, and Linda A. Russell filed a derivative lawsuit against HIFSCO on behalf of six funds: The Hartford Global Health Fund (now known as The Hartford Healthcare Fund), The Hartford Conservative Allocation Fund, The Hartford Growth Opportunities Fund, The Hartford Inflation Plus Fund, The Hartford Advisers Fund (now known as The Hartford Balanced Fund) and The Hartford Money Market Fund. The lawsuit, which was filed in the United States District Court for the District of New Jersey, seeks recovery under Section 36(b) of the 1940 Act for the alleged overpayment of investment management and 12b-1 distribution fees to HIFSCO. The plaintiffs seek recovery of the alleged overpayments or, alternatively, rescission of the contracts and restitution of all fees paid, together with lost earnings. On November 14, 2011, the plaintiffs filed an amended complaint, which dropped The Hartford Money Market Fund and added The Hartford Capital Appreciation Fund as a plaintiff. The Hartford intends to vigorously defend the action.
No accrual for litigation relating to this matter has been recorded in the financial statements of the Fund because the Fund is not party to the suit.
Under the Company’s organizational documents, the Company shall indemnify its officers and directors to the full extent required or permitted under Maryland General Corporation Law and the federal securities laws. In addition, the Company, on behalf of the Fund, may enter into contracts that contain a variety of indemnifications. The Company’s maximum exposure under these arrangements is unknown. However, as of the date of these financial statements, the Company has not had prior claims or losses pursuant to these contracts and expects the risk of loss to be remote.
| The Hartford Municipal Real Return Fund |
| Financial Highlights |
| - Selected Per-Share Data (A) - |
| Class | | Net Asset
Value at
Beginning of
Period | | | Net Investment
Income (Loss) | | | Payments From
(to) Affiliate | | | Net Realized
And Unrealized
Gain (Loss) On
Investments | | | Total from
Investment
Operations | | | Dividends from
Net Investment
Income | | | Distributions
from Realized
Capital Gains | | | Distributions
from Capital | | | Total
Distributions | | | Net Increase
(Decrease) In
Net Asset
Value | | | Net Asset
Value at End
of Period | |
| | | | | | | | | | | | | | | | | | |
| For the Six-Month Period Ended April 30, 2012 (Unaudited) | | | | | | | | | | | | | | | | | |
| A | | $ | 9.20 | | | $ | 0.16 | | | $ | — | | | $ | 0.38 | | | $ | 0.54 | | | $ | (0.16 | ) | | $ | — | | | $ | — | | | $ | (0.16 | ) | | $ | 0.38 | | | $ | 9.58 | |
| B | | | 9.13 | | | | 0.12 | | | | — | | | | 0.37 | | | | 0.49 | | | | (0.12 | ) | | | — | | | | — | | | | (0.12 | ) | | | 0.37 | | | | 9.50 | |
| C | | | 9.15 | | | | 0.12 | | | | — | | | | 0.38 | | | | 0.50 | | | | (0.12 | ) | | | — | | | | — | | | | (0.12 | ) | | | 0.38 | | | | 9.53 | |
| I | | | 9.22 | | | | 0.17 | | | | — | | | | 0.38 | | | | 0.55 | | | | (0.17 | ) | | | — | | | | — | | | | (0.17 | ) | | | 0.38 | | | | 9.60 | |
| Y | | | 9.18 | | | | 0.17 | | | | — | | | | 0.38 | | | | 0.55 | | | | (0.17 | ) | | | — | | | | — | | | | (0.17 | ) | | | 0.38 | | | | 9.56 | |
| | | | | | | | | | | | | | | | | | | | | | |
| For the Year Ended October 31, 2011 | | | | | | | | | | | | | | | | | | | | | |
| A(F) | | | 9.50 | | | | 0.41 | | | | — | | | | (0.30 | ) | | | 0.11 | | | | (0.41 | ) | | | — | | | | — | | | | (0.41 | ) | | | (0.30 | ) | | | 9.20 | |
| B | | | 9.43 | | | | 0.34 | | | | — | | | | (0.30 | ) | | | 0.04 | | | | (0.34 | ) | | | — | | | | — | | | | (0.34 | ) | | | (0.30 | ) | | | 9.13 | |
| C | | | 9.46 | | | | 0.34 | | | | — | | | | (0.31 | ) | | | 0.03 | | | | (0.34 | ) | | | — | | | | — | | | | (0.34 | ) | | | (0.31 | ) | | | 9.15 | |
| I | | | 9.52 | | | | 0.43 | | | | — | | | | (0.30 | ) | | | 0.13 | | | | (0.43 | ) | | | — | | | | — | | | | (0.43 | ) | | | (0.30 | ) | | | 9.22 | |
| Y | | | 9.48 | | | | 0.43 | | | | — | | | | (0.30 | ) | | | 0.13 | | | | (0.43 | ) | | | — | | | | — | | | | (0.43 | ) | | | (0.30 | ) | | | 9.18 | |
| | | | | | | | | | | | | | | | | | | | | | |
| For the Year Ended October 31, 2010 | | | | | | | | | | | | | | | | | | | | | |
| A | | | 9.11 | | | | 0.43 | | | | — | | | | 0.40 | | | | 0.83 | | | | (0.44 | ) | | | — | | | | — | | | | (0.44 | ) | | | 0.39 | | | | 9.50 | |
| B | | | 9.04 | | | | 0.36 | | | | — | | | | 0.40 | | | | 0.76 | | | | (0.37 | ) | | | — | | | | — | | | | (0.37 | ) | | | 0.39 | | | | 9.43 | |
| C | | | 9.07 | | | | 0.36 | | | | — | | | | 0.40 | | | | 0.76 | | | | (0.37 | ) | | | — | | | | — | | | | (0.37 | ) | | | 0.39 | | | | 9.46 | |
| I | | | 9.13 | | | | 0.46 | | | | — | | | | 0.39 | | | | 0.85 | | | | (0.46 | ) | | | — | | | | — | | | | (0.46 | ) | | | 0.39 | | | | 9.52 | |
| Y | | | 9.09 | | | | 0.46 | | | | — | | | | 0.39 | | | | 0.85 | | | | (0.46 | ) | | | — | | | | — | | | | (0.46 | ) | | | 0.39 | | | | 9.48 | |
| | | | | | | | | | | | | | | | | | | | | | |
| For the Year Ended October 31, 2009 | | | | | | | | | | | | | | | | | | | | | |
| A | | | 8.67 | | | | 0.43 | | | | — | | | | 0.44 | | | | 0.87 | | | | (0.43 | ) | | | — | | | | — | | | | (0.43 | ) | | | 0.44 | | | | 9.11 | |
| B | | | 8.61 | | | | 0.36 | | | | — | | | | 0.44 | | | | 0.80 | | | | (0.37 | ) | | | — | | | | — | | | | (0.37 | ) | | | 0.43 | | | | 9.04 | |
| C | | | 8.63 | | | | 0.37 | | | | — | | | | 0.44 | | | | 0.81 | | | | (0.37 | ) | | | — | | | | — | | | | (0.37 | ) | | | 0.44 | | | | 9.07 | |
| I | | | 8.69 | | | | 0.45 | | | | — | | | | 0.45 | | | | 0.90 | | | | (0.46 | ) | | | — | | | | — | | | | (0.46 | ) | | | 0.44 | | | | 9.13 | |
| Y | | | 8.65 | | | | 0.45 | | | | — | | | | 0.45 | | | | 0.90 | | | | (0.46 | ) | | | — | | | | — | | | | (0.46 | ) | | | 0.44 | | | | 9.09 | |
| | | | | | | | | | | | | | | | | | | | | | |
| For the Year Ended October 31, 2008 (G) | | | | | | | | | | | | | | | | | | | | | |
| A | | | 10.88 | | | | 0.48 | | | | — | | | | (2.21 | ) | | | (1.73 | ) | | | (0.48 | ) | | | — | | | | — | | | | (0.48 | ) | | | (2.21 | ) | | | 8.67 | |
| B | | | 10.80 | | | | 0.39 | | | | — | | | | (2.17 | ) | | | (1.78 | ) | | | (0.41 | ) | | | — | | | | — | | | | (0.41 | ) | | | (2.19 | ) | | | 8.61 | |
| C | | | 10.83 | | | | 0.39 | | | | — | | | | (2.18 | ) | | | (1.79 | ) | | | (0.41 | ) | | | — | | | | — | | | | (0.41 | ) | | | (2.20 | ) | | | 8.63 | |
| I | | | 10.90 | | | | 0.48 | | | | — | | | | (2.18 | ) | | | (1.70 | ) | | | (0.51 | ) | | | — | | | | — | | | | (0.51 | ) | | | (2.21 | ) | | | 8.69 | |
| Y | | | 10.86 | | | | 0.50 | | | | — | | | | (2.20 | ) | | | (1.70 | ) | | | (0.51 | ) | | | — | | | | — | | | | (0.51 | ) | | | (2.21 | ) | | | 8.65 | |
| | | | | | | | | | | | | | | | | | | | | | |
| For the Year Ended October 31, 2007 | | | | | | | | | | | | | | | | | | | | | |
| A | | | 11.34 | | | | 0.47 | | | | — | | | | (0.44 | ) | | | 0.03 | | | | (0.46 | ) | | | (0.03 | ) | | | — | | | | (0.49 | ) | | | (0.46 | ) | | | 10.88 | |
| B | | | 11.26 | | | | 0.38 | | | | — | | | | (0.43 | ) | | | (0.05 | ) | | | (0.38 | ) | | | (0.03 | ) | | | — | | | | (0.41 | ) | | | (0.46 | ) | | | 10.80 | |
| C | | | 11.29 | | | | 0.38 | | | | — | | | | (0.43 | ) | | | (0.05 | ) | | | (0.38 | ) | | | (0.03 | ) | | | — | | | | (0.41 | ) | | | (0.46 | ) | | | 10.83 | |
| I(H) | | | 11.17 | | | | 0.21 | | | | — | | | | (0.27 | ) | | | (0.06 | ) | | | (0.21 | ) | | | — | | | | — | | | | (0.21 | ) | | | (0.27 | ) | | | 10.90 | |
| Y(I) | | | 11.32 | | | | 0.51 | | | | — | | | | (0.46 | ) | | | 0.05 | | | | (0.48 | ) | | | (0.03 | ) | | | — | | | | (0.51 | ) | | | (0.46 | ) | | | 10.86 | |
| (A) | Information presented relates to a share outstanding throughout the indicated period. |
| (B) | Assumes initial investment at net asset value at the beginning of each period, reinvestment of all distributions, the complete redemption of the investment at net asset value at the end of each period and no sales charge. Total return would be reduced if sales charges were taken into account. |
| (C) | Portfolio turnover rate is calculated on the basis of the Fund as a whole without distinguishing between the classes of shares issued. |
| (F) | Class L was merged into Class A on August 5, 2011 (See Class Merger in accompanying Notes to Financial Statements). |
| (G) | Per share amounts have been calculated using average shares outstanding method. |
| (H) | Commenced operations on May 31, 2007. |
| (I) | Classes H, M and N were merged into Class L and Class E was merged into Class Y on February 9, 2007. |
- Ratios and Supplemental Data -
| Total Return(B) | | Net Assets at End of
Period (000's) | | Ratio of Expenses to Average Net
Assets Before Waivers and
Reimbursements and Including
Expenses not Subject to Cap | | Ratio of Expenses to Average Net
Assets After Waivers and
Reimbursements and Including
Expenses not Subject to Cap | | Ratio of Expenses to Average Net
Assets After Waivers and
Reimbursements and Excluding
Expenses not Subject to Cap | | | Ratio of Net Investment
Income to Average Net
Assets | | | Portfolio Turnover
Rate(C) | |
| | | | | | | | | | | | | | | | | | | | |
| | | | | | | | | | | | | | | | | | | | |
| 5.88 | %(D) | $ | 150,108 | | 0.87 | %(E) | 0.85 | %(E) | | 0.85 | %(E) | | | 3.33 | %(E) | | | 33 | % |
| 5.43 | (D) | | 4,086 | | 1.68 | (E) | 1.60 | (E) | | 1.60 | (E) | | | 2.59 | (E) | | | — | |
| 5.53 | (D) | | 46,554 | | 1.62 | (E) | 1.60 | (E) | | 1.60 | (E) | | | 2.58 | (E) | | | — | |
| 6.00 | (D) | | 17,929 | | 0.64 | (E) | 0.60 | (E) | | 0.60 | (E) | | | 3.55 | (E) | | | — | |
| 6.04 | (D) | | 29,369 | | 0.57 | (E) | 0.57 | (E) | | 0.57 | (E) | | | 3.61 | (E) | | | — | |
| | | | | | | | | | | | | | | | | | | | |
| | | | | | | | | | | | | | | | | | | | |
| 1.28 | | | 137,766 | | 0.90 | | 0.85 | | | 0.85 | | | | 4.52 | | | | 29 | |
| 0.54 | | | 4,565 | | 1.70 | | 1.60 | | | 1.60 | | | | 3.75 | | | | — | |
| 0.43 | | | 43,214 | | 1.64 | | 1.60 | | | 1.60 | | | | 3.72 | | | | — | |
| 1.53 | | | 10,671 | | 0.64 | | 0.60 | | | 0.60 | | | | 4.71 | | | | — | |
| 1.54 | | | 29,686 | | 0.60 | | 0.60 | | | 0.60 | | | | 4.73 | | | | — | |
| | | | | | | | | | | | | | | | | | | | |
| | | | | | | | | | | | | | | | | | | | |
| 9.26 | | | 156,092 | | 0.86 | | 0.85 | | | 0.85 | | | | 4.69 | | | | 19 | |
| 8.53 | | | 7,376 | | 1.67 | | 1.60 | | | 1.60 | | | | 3.94 | | | | — | |
| 8.50 | | | 47,918 | | 1.62 | | 1.60 | | | 1.60 | | | | 3.94 | | | | — | |
| 9.52 | | | 8,343 | | 0.62 | | 0.60 | | | 0.60 | | | | 4.93 | | | | — | |
| 9.59 | | | 33,050 | | 0.57 | | 0.57 | | | 0.57 | | | | 4.97 | | | | — | |
| | | | | | | | | | | | | | | | | | | | |
| | | | | | | | | | | | | | | | | | | | |
| 10.48 | | | 151,639 | | 0.89 | | 0.85 | | | 0.85 | | | | 4.96 | | | | 46 | |
| 9.62 | | | 8,623 | | 1.70 | | 1.60 | | | 1.60 | | | | 4.21 | | | | — | |
| 9.72 | | | 42,730 | | 1.65 | | 1.60 | | | 1.60 | | | | 4.23 | | | | — | |
| 10.74 | | | 6,899 | | 0.65 | | 0.60 | | | 0.60 | | | | 5.24 | | | | — | |
| 10.79 | | | 33,239 | | 0.59 | | 0.59 | | | 0.59 | | | | 5.22 | | | | — | |
| | | | | | | | | | | | | | | | | | | | |
| | | | | | | | | | | | | | | | | | | | |
| (16.40 | ) | | 113,542 | | 0.94 | | 0.85 | | | 0.85 | | | | 4.63 | | | | 77 | |
| (16.97 | ) | | 5,223 | | 1.75 | | 1.60 | | | 1.60 | | | | 3.87 | | | | — | |
| (17.02 | ) | | 27,234 | | 1.70 | | 1.60 | | | 1.60 | | | | 3.89 | | | | — | |
| (16.16 | ) | | 4,705 | | 0.66 | | 0.60 | | | 0.60 | | | | 4.89 | | | | — | |
| (16.22 | ) | | 18,238 | | 0.65 | | 0.60 | | | 0.60 | | | | 4.87 | | | | — | |
| | | | | | | | | | | | | | | | | | | | |
| | | | | | | | | | | | | | | | | | | | |
| 0.30 | | | 115,459 | | 1.15 | | 0.85 | | | 0.85 | | | | 4.20 | | | | 43 | |
| (0.45 | ) | | 6,839 | | 1.95 | | 1.60 | | | 1.60 | | | | 3.43 | | | | — | |
| (0.45 | ) | | 22,467 | | 1.90 | | 1.60 | | | 1.60 | | | | 3.45 | | | | — | |
| (0.54 | )(D) | | 3,505 | | 0.87 | (E) | 0.60 | (E) | | 0.60 | (E) | | | 4.81 | (E) | | | — | |
| 0.48 | | | 26,275 | | 0.85 | | 0.65 | | | 0.65 | | | | 4.78 | | | | — | |
The Hartford Municipal Real Return Fund
Directors and Officers (Unaudited)
The Board of Directors of the Company appoints officers who are responsible for the day-to-day operations of the Fund and who execute policies formulated by the Directors. Each director serves until his or her death, resignation, or retirement or until the next annual meeting of shareholders is held or until his or her successor is elected and qualifies.
Directors and officers who are employed by or who have a financial interest in The Hartford are considered “interested” persons of the Fund pursuant to the 1940 Act. Each officer and two of the Company’s directors, as noted in the chart below, are “interested” persons of the Fund. Each director serves as a director for The Hartford Mutual Funds, Inc., The Hartford Mutual Funds II, Inc., Hartford Series Fund, Inc., and Hartford HLS Series Fund II, Inc., and as a trustee for The Hartford Alternative Strategies Fund, which, as of April 30, 2012, collectively consist of 91 funds. Correspondence may be sent to directors and officers c/o Hartford Mutual Funds, P.O. Box 2999, Hartford, Connecticut 06104-2999, except that correspondence to Mr. Annoni, Mr. Dressen, and Ms. Fagely may be sent to 500 Bielenberg Drive, Woodbury, Minnesota 55125.
The table below sets forth, for each director and officer, his or her name, year of birth, current position with the Company and date first elected or appointed to The Hartford Mutual Funds, Inc. (“MF”) and The Hartford Mutual Funds II, Inc. (“MF2”), principal occupation, and, for directors, other directorships held. The Fund’s statement of additional information contains further information on the directors and is available free of charge by calling 1-888-843-7824 or writing to Hartford Mutual Funds, P.O. Box 64387, St. Paul, MN 55164-0387.
Information on the aggregate remuneration paid to the directors of the Company can be found in the Statement of Operations herein. The Fund pays to The Hartford a portion of the Chief Compliance Officer’s compensation, but does not pay salaries or compensation to any of its other officers or directors who are employed by The Hartford.
Non-Interested Directors
Lynn S. Birdsong (1946) Director since 2003, Co-Chairman of the Investment Committee
Mr. Birdsong is a private investor. Mr. Birdsong currently serves as a Director of the Sovereign High Yield Investment Company (April 2010 to current). Mr. Birdsong currently serves as an Independent Director of Nomura Partners Funds, Inc. (formerly, The Japan Fund) (March 2003 to current). From 1979 to 2002, Mr. Birdsong was a managing director of Zurich Scudder Investments, an investment management firm. During his employment with Scudder, Mr. Birdsong was an Interested Director of The Japan Fund. Since 1981, Mr. Birdsong has been a partner in Birdsong Company, an advertising specialty firm.
Robert M. Gavin, Jr. (1940) Director since 2002 (MF) and 1986 (MF2), Chairman of the Board since 2004
Dr. Gavin is an educational consultant. Prior to September 1, 2001, he was President of Cranbrook Education Community and prior to July 1996, he was President of Macalester College, St. Paul, Minnesota.
Duane E. Hill (1945) Director since 2001 (MF) and 2002 (MF2), Chairman of the Nominating Committee
Mr. Hill is Partner of TSG Ventures L.P., a private equity investment company. Mr. Hill is a former partner of TSG Capital Group, a private equity investment firm that served as sponsor and lead investor in leveraged buyouts of middle market companies.
Sandra S. Jaffee (1941) Director since 2005
Ms. Jaffee is the founder and Chief Executive Officer of a private company, Homeworks Concierge, LLC, which provides residential property management services in Westchester County, New York (January 2012 to present). Ms. Jaffee served as Chairman (2008 to 2009) and Chief Executive Officer of Fortent (formerly Searchspace Group), a leading provider of compliance/regulatory technology to financial institutions from August 2005 to August 2009. Ms. Jaffe currently serves as a member of the Board of Directors of Broadridge Financial Solutions as well as a Trustee of Muhlenberg College.
William P. Johnston (1944) Director since 2005, Chairman of the Compliance Committee
In June 2006, Mr. Johnston was appointed as Senior Advisor to The Carlyle Group, a global private equity investment firm. In August 2007, Mr. Johnston was elected to the Board of Directors of LifeCare Holdings, Inc. In February 2008, Mr. Johnston was elected to the Board of Directors of HCR-ManorCare, Inc. In May 2006, Mr. Johnston was elected to the Supervisory Board of Fresenius Medical Care AG & Co. KGaA, after its acquisition of Renal Care Group, Inc. in March 2006.
Phillip O. Peterson (1944) Director since 2002, (MF) and 2000 (MF2), Chairman of the Audit Committee
Mr. Peterson is a mutual fund industry consultant. He was a partner of KPMG LLP (an accounting firm) until July 1999. Mr. Peterson joined William Blair Funds in February 2007 as a member of the Board of Trustees. Mr. Peterson also joined the Board of Trustees of Symetra Variable Mutual Funds Trust as a trustee in February 2012.
Lemma W. Senbet (1946) Director since 2005
Dr. Senbet is the William E. Mayer Chair Professor of Finance and Director, Center for Financial Policy, at the University of Maryland, Robert H. Smith School of Business. He was chair of the Finance Department from 1998 to 2006. Previously he was a chaired professor of finance at the University of Wisconsin-Madison. Also, he was director of the Fortis Funds from March 2000 to July 2002. Dr. Senbet served the finance profession in various capacities, including as director of the American Finance Association and President of the Western Finance Association. In 2006, Dr. Senbet was inducted Fellow of Financial Management Association International for his career-long distinguished scholarship and professional service.
Interested Directors and Officers
David N. Levenson (1966) Director since 2010
Mr. Levenson currently serves as President of The Hartford’s Wealth Management business. He was appointed to this role in July 2010. Previously, Mr. Levenson served as Executive Vice President of Legacy Holdings for The Hartford from June 2009 to July 2010. From 2006 to 2009, Mr. Levenson was with Hartford Life Insurance K.K. where he served as President and Chief Executive Officer from 2007 to 2009. He served as Managing Director of Hartford Investment Management Company from 2005 to 2006. Additionally, Mr. Levenson serves as Executive Vice President of The Hartford and as President, Director and Chief Executive Officer of Hartford Life Insurance Company (“HLIC”) and Hartford Life, Inc. (“HL Inc.”).
Lowndes A. Smith (1939) Director since 1996, (MF) and 2002 (MF2), Co-Chairman of the Investment Committee
Mr. Smith served as Vice Chairman of The Hartford from February 1997 to January 2002, as President and Chief Executive Officer of HL Inc. from February 1997 to January 2002, and as President and Chief Operating Officer of The Hartford Life Insurance Companies from January 1989 to January 2002. Mr. Smith serves as a Director of White Mountains Insurance Group, Ltd., One Beacon Insurance and Symetra Financial and as Managing Director of Whittington Gray Associates.
Other Officers
James E. Davey (1964) President and Chief Executive Officer since 2010
Mr. Davey serves as Executive Vice President of HLIC. Additionally, Mr. Davey serves as President, Chief Executive Officer and Manager of HIFSCO and President, Chief Executive Officer and Manager of HL Investment Advisors, LLC (“HL Advisors”). Mr. Davey joined The Hartford in 2002.
Mark A. Annoni (1964) Vice President, Controller and Treasurer since 2012*
Mr. Annoni serves as the Assistant Vice President and Director of Investment Finance (February 2004 to present). Mr. Annoni joined The Hartford in April 2001 as part of The Hartford’s acquisition of Fortis Financial Group. Prior to joining The Hartford, Mr. Annoni served as Manager of Mutual Fund Accounting at Fortis Financial Group (July 1997 to April 2001).
* Mr. Annoni was named Vice President, Controller and Treasurer on May 8, 2012.
Michael R. Dressen (1963) AML Compliance Officer since 2011
Mr. Dressen currently serves as Assistant Vice President of HLIC. He also serves as Chief Compliance Officer and AML Compliance Officer of Hartford Administrative Services Company (“HASCO”) and as Assistant Secretary and Compliance Officer of HIFSCO. Mr Dressen joined The Hartford in 2005 from State Farm Insurance Companies where he held various positions related to mutual funds, variable products, and property casualty insurance.
Tamara L. Fagely (1958) Vice President, Controller and Treasurer since 2002 (MF) and 1993 (MF2)
Ms. Fagely has been a Vice President of HASCO since 1998 and Chief Financial Officer since 2006. Currently Ms. Fagely is a Vice President of HLIC. She served as Assistant Vice President of HLIC from December 2001 through March 2005. In addition, Ms. Fagely is Controller and Chief Financial Officer of HIFSCO.
Dr. Robert J. Froehlich (1953) Senior Managing Director since 2009
Dr. Froehlich joined The Hartford as Senior Managing Director in September 2009. Prior to joining The Hartford, Dr. Froehlich served as Vice Chairman of Deutsche Asset Management from 1997-2009.
Edward P. Macdonald (1967) Vice President, Secretary and Chief Legal Officer since 2005
Mr. Macdonald serves as Vice President of HLIC and Chief Legal Officer of Mutual Funds and Vice President of HIFSCO. He also serves as Vice President and Secretary of HASCO, and Chief Legal Officer, Secretary and Vice President of HL Advisors. Mr. Macdonald joined The Hartford in 2005.
The Hartford Municipal Real Return Fund
Directors and Officers (Unaudited) – (continued)
Vernon J. Meyer (1964) Vice President since 2006
Mr. Meyer serves as Senior Vice President of HLIC. He also serves as Senior Vice President of HIFSCO and HL Advisors. Mr. Meyer joined The Hartford in 2004.
Colleen B. Pernerewski (1969) Vice President and Chief Compliance Officer since 2010
Ms. Pernerewski serves as Vice President and Chief Investment Advisor Compliance Officer of HIFSCO and as Vice President and Chief Compliance Officer of HL Advisors. Ms. Pernerewski serves as Vice President and Chief Compliance Officer of Individual Annuity of HLIC. Ms. Pernerewski joined The Hartford in 2005 from Travelers Life and Annuity where she served as Counsel (2004-2005). Prior to Travelers Life and Annuity, Ms. Pernerewski held the position of Counsel at The Hartford (1998-2004).
Elizabeth L. Schroeder (1966) Vice President since 2010
Ms. Schroeder currently serves as Assistant Vice President of HLIC. Ms. Schroeder joined HLIC in 1991. She is also an Assistant Vice President of HASCO, HIFSCO and HL Advisors.
Martin Swanson (1962) Vice President since 2010
Mr. Swanson is a Vice President of HLIC. Mr. Swanson also serves as Vice President/Marketing for HIFSCO. Prior to joining HLIC in 1998, Mr. Swanson was a Vice President at PaineWebber, Inc.
Jane Wolak (1961) Vice President since 2009
Ms. Wolak currently serves as Senior Vice President of HLIC. Ms. Wolak joined HLIC as Vice President, Retail Product Services in May 2007. She is also Vice President of HASCO. Previously, Ms. Wolak was with Sun Life Financial where she held the position of Vice President, Service Center Operations from 2001-2007.
HOW TO OBTAIN A COPY OF THE FUND’S PROXY VOTING POLICIES AND VOTING RECORDS (UNAUDITED)
A description of the policies and procedures that the Fund uses to determine how to vote proxies relating to portfolio securities and a record of how the Fund voted any proxies for the twelve-month period ended June 30, 2011 are available (1) without charge, upon request, by calling 888-843-7824 and (2) on the SEC’s website at http://www.sec.gov.
QUARTERLY PORTFOLIO HOLDINGS INFORMATION (UNAUDITED)
The Fund files a complete schedule of portfolio holdings with the SEC for the first and third quarters of each fiscal year on Form N-Q. The Fund’s Forms are available (1) without charge, upon request, by calling 888-843-7824 and (2) on the SEC’s website at http://www.sec.gov. The Form N-Q may be reviewed and copied at the SEC’s Public Reference Room in Washington, DC. Information on the operation of the Public Reference Room may be obtained by calling 1-800-SEC-0330.
The Hartford Municipal Real Return Fund
Expense Example (Unaudited)
Your Fund's Expenses
As a shareholder of the Fund, you incur two types of costs: (1) transaction costs, including sales charges (loads) on purchase payments and contingent deferred sales charges (CDSC) and (2) ongoing costs, including investment management fees, distribution fees, and other fund expenses. This example is intended to help you understand your ongoing costs (in dollars) of investing in the Fund and to compare these costs with the ongoing costs of investing in other mutual funds. The example is based on an investment of $1,000 invested at the beginning of the period and held for the period of October 31, 2011 through April 30, 2012.
Actual Expenses
The first set of columns of the table below provides information about actual account values and actual expenses. You may use the information in this column, together with the amount you invested, to estimate the expenses that you paid over the period. Simply divide your account value by $1,000 (for example, an $8,600 account value divided by $1,000 = 8.6), then multiply the result by the number in the line under the heading entitled “Expenses Paid During Period” to estimate the expenses you paid on your account during this period.
Hypothetical Example for Comparison Purposes
The second set of columns of the table below provides information about hypothetical account values and hypothetical expenses based on the Fund's actual expense ratio and an assumed rate of return of 5% per year before expenses, which is not the Fund's actual return. The hypothetical account values and expenses may not be used to estimate the actual ending account balance or expenses you paid for the period. You may use this information to compare the ongoing costs of investing in the Fund and other funds. To do so, compare this 5% hypothetical example with the 5% hypothetical examples that appear in the shareholder reports of the other funds.
Please note that the expenses shown in the table are meant to highlight your ongoing costs only and do not reflect any transactional costs, such as sales charges (loads) and CDSC. Therefore, the second set of columns of the table is useful in comparing ongoing costs only, and will not help you determine the relative total costs of owning different funds. In addition, if these transactional costs were included, your costs would be higher. Expenses are equal to the Fund's annualized expense ratios multiplied by average account value over the period, multiplied by 182/366 (to reflect the one-half year period).
| | | Actual return | | | Hypothetical (5% return before expenses) | | | | | | | | | | |
| | | Beginning
Account Value
October 31, 2011 | | | Ending Account
Value
April 30, 2012 | | | Expenses paid
during the period
October 31, 2011
through
April 30, 2012 | | | Beginning
Account Value
October 31, 2011 | | | Ending Account
Value
April 30, 2012 | | | Expenses paid
during the
period
October 31, 2011
through
April 30, 2012 | | | Annualized
expense
ratio | | | Days in
the
current
1/2
year | | | Days
in the
full
year | |
| Class A | | $ | 1,000.00 | | | $ | 1,058.80 | | | $ | 4.35 | | | $ | 1,000.00 | | | $ | 1,020.64 | | | $ | 4.27 | | | | 0.85 | % | | | 182 | | | | 366 | |
| Class B | | $ | 1,000.00 | | | $ | 1,054.30 | | | $ | 8.17 | | | $ | 1,000.00 | | | $ | 1,016.91 | | | $ | 8.02 | | | | 1.60 | | | | 182 | | | | 366 | |
| Class C | | $ | 1,000.00 | | | $ | 1,055.30 | | | $ | 8.18 | | | $ | 1,000.00 | | | $ | 1,016.91 | | | $ | 8.02 | | | | 1.60 | | | | 182 | | | | 366 | |
| Class I | | $ | 1,000.00 | | | $ | 1,060.00 | | | $ | 3.08 | | | $ | 1,000.00 | | | $ | 1,021.88 | | | $ | 3.02 | | | | 0.60 | | | | 182 | | | | 366 | |
| Class Y | | $ | 1,000.00 | | | $ | 1,060.40 | | | $ | 2.94 | | | $ | 1,000.00 | | | $ | 1,022.01 | | | $ | 2.89 | | | | 0.57 | | | | 182 | | | | 366 | |
The Hartford Municipal Real Return Fund
| Approval of Investment Sub-Advisory Agreement (Unaudited) |
Section 15(c) of the Investment Company Act of 1940, as amended (the “1940 Act”), requires that each mutual fund’s board of directors, including a majority of those directors who are not “interested persons” of the mutual fund, as defined in the 1940 Act (the “Independent Directors”), initially approve, and annually review and consider the continuation of, the mutual fund’s investment sub-advisory agreement(s). At its meeting held on February 1, 2012, the Board of Directors (the “Board”) of The Hartford Mutual Funds II, Inc., including each of the Independent Directors, unanimously voted to approve an investment sub-advisory agreement (the “Agreement”) for The Hartford Municipal Real Return Fund (the “Fund”) between Hartford Investment Financial Services, LLC (“HIFSCO”), the Fund’s investment manager, and Wellington Management Company, LLP (“Wellington Management”). The Agreement went into effect on March 5, 2012.
Prior to approving the Agreement, the Board requested, received, and reviewed written responses from HIFSCO and Wellington Management to questions posed to them on behalf of the Independent Directors and supporting materials relating to those questions and responses (the “Adviser Materials”). In addition, the Board received an in-person presentation from Fund officers and representatives of HIFSCO about the proposal to replace Hartford Investment Management Company (“Hartford Investment Management”), the Fund’s current sub-adviser, with Wellington Management. The Board’s Contracts Committee also met in person with members of the proposed portfolio management team for the Fund regarding the capabilities of Wellington Management and the associated benefits to the Fund and its shareholders. In addition, the Board had previously received information with respect to Wellington Management in connection with Wellington Management’s re-approval on August 2-3, 2011 as the sub-adviser to certain other Hartford-sponsored funds.
In determining to approve the Agreement for the Fund, the members of the Board reviewed and evaluated information and factors they believed to be relevant and appropriate in light of the information that the Board deemed necessary and appropriate through the exercise of its reasonable business judgment. While individual members of the Board may have weighed certain factors differently, the Board’s determination to approve the Agreement was based on a comprehensive consideration of all information provided to the Board with respect to the approval of the Agreement. A more detailed discussion of the factors the Board considered with respect to its approval of the Agreement is provided below.
Nature, Extent, And Quality Of Services to be Provided by Wellington Management
The Board requested and considered information concerning the nature, extent, and quality of the services to be provided to the Fund by Wellington Management. The Board considered, among other things, the terms of the Agreement, the range of services to be provided, and Wellington Management’s organizational structure, systems and personnel. The Board also considered Wellington Management’s reputation and overall financial strength, and the Board’s past experience with Wellington Management as sub-adviser for other Hartford-sponsored funds. The Board considered the terms of the “preferred partnership” arrangement pursuant to which Wellington Management would serve as the preferred sub-adviser to the Hartford-sponsored funds, including the benefits of the arrangement for the Fund and other Hartford-sponsored funds.
With respect to Wellington Management’s fixed income capabilities, the Board considered that HIFSCO believes that Wellington Management is a high quality fixed income manager with greater depth and breadth relative to Hartford Investment Management and other peer advisory firms and that Wellington Management has strong investment capabilities with expertise across various investment disciplines. The Board also considered Wellington Management’s global fixed income capabilities, including the number and geographic locations of Wellington Management’s investment personnel. The Board noted that during the past ten years, Wellington Management had been committed to supporting the growth of its fixed income teams by allocating additional resources, personnel and technology to these teams, and also noted that Wellington Management is focused entirely on third-party asset management and has experience managing assets for a diverse set of clients, including fixed income mutual funds, with different objectives and guidelines. In addition, the Board considered Wellington Management’s risk management systems, noting that they are embedded within the firm’s fixed income process.
With respect to the day-to-day portfolio management services to be provided by Wellington Management, the Board considered the Contracts Committee’s meeting with members of the proposed portfolio management team, and Wellington Management’s investment philosophy and process, investment research capabilities and resources, performance record, trade execution capabilities and experience. The Board also considered the experience of the proposed portfolio management team. The Board considered that HIFSCO and Wellington Management proposed certain changes to the Fund’s principal investment strategy in connection with the sub-adviser change.
The Board also considered information previously provided by HIFSCO and Wellington Management regarding Wellington Management’s compliance policies and procedures and compliance history, and received a representation from HIFSCO that the written compliance policies and procedures of Wellington Management are reasonably designed to prevent violations of the federal securities laws.
In considering this information, the Board evaluated not only the information presented to the Board and the Contracts Committee in connection with its consideration of the Agreement, but also the Board’s experience through past interactions with Wellington Management. Based on these considerations, the Board concluded that it was satisfied with the nature, extent and quality of the services to be provided to the Fund by Wellington Management.
Performance of Wellington Management
The Board considered the investment performance of Wellington Management, including, for purposes of considering the investment skill and experience of the proposed portfolio management team, the performance of the Wellington Management composites for accounts with investment objectives, policies and principal investment strategies comparable to one or more components of the Fund’s principal investment strategy. HIFSCO and Wellington Management also provided additional information about the broad range of the portfolio management team’s investment experience and their investment philosophy and process.
Based on these considerations, the Board concluded that it was satisfied that Wellington Management has the capability of providing satisfactory investment performance for the Fund.
Costs of the Services and Profitability of HIFSCO and Wellington Management
The Board reviewed information regarding HIFSCO’s cost to provide investment management and related services to the Fund and the estimated profitability to HIFSCO and its affiliates from all services provided to the Fund and all aspects of their relationship with the Fund both under the sub-advisory arrangement with Hartford Investment Management and assuming implementation of the Agreement with Wellington Management. The Board also requested and received information relating to the operations and profitability of Wellington Management.
Based on these considerations, the Board concluded that the profits anticipated to be realized by HIFSCO, Wellington Management and their affiliates from their relationships with the Fund would not be excessive.
Comparison of Fees and Services
With respect to the sub-advisory fee schedule to be paid to Wellington Management by HIFSCO in respect of the Fund, the Board considered comparative information with respect to the sub-advisory fees to be paid by HIFSCO to Wellington Management. The Board also considered information provided by Wellington Management to the Contracts Committee of the Board about the quality of services to be performed for the Fund and Wellington Management’s investment philosophy. In addition, the Board considered HIFSCO’s representation that it had negotiated Wellington Management’s fees at arm’s length.
The Board considered that, in connection with the sub-adviser change, HIFSCO proposed to add additional breakpoints to the Fund’s contractual management fee schedule with HIFSCO that would result in management fee reductions at certain asset levels. The Board noted that HIFSCO, not the Fund, would pay the sub-advisory fees to Wellington Management.
Based on these considerations, the Board concluded that the Fund’s proposed sub-advisory fees, in conjunction with the information about quality of services, profitability, economies of scale, and other matters discussed, were reasonable in light of the services to be provided.
Economies of Scale
The Board considered the extent to which economies of scale would be realized as the Fund grows and whether the fee levels reflect these economies of scale for the benefit of the Fund’s shareholders. The Board reviewed the breakpoints in the management fee schedule for the Fund, which reduce fee rates as Fund assets grow over time. The Board noted HIFSCO’s
The Hartford Municipal Real Return Fund
Approval of Investment Sub-Advisory Agreement (Unaudited) – (continued)
proposal to add additional breakpoints to the Fund’s management fee schedule in connection with the sub-adviser change, thereby reducing fee rates above certain asset levels.
The Board reviewed relevant information included in the Adviser Materials regarding comparative breakpoint information for other funds in the Fund’s Lipper peer group. Based on these considerations, the Board concluded that it was satisfied with the extent to which economies of scale would be shared for the benefit of the Fund’s shareholders based on currently available information and the effective advisory fees and expense ratios for the Fund at its current and reasonably anticipated asset levels. The Board noted, however, that it would review future growth in Fund assets and the appropriateness of the breakpoints as part of its future annual review of the Agreement and the investment management agreement between the Fund and HIFSCO.
Other Benefits
The Board considered other benefits to Wellington Management and its affiliates from their relationships with the Fund. The Board also considered the benefits, if any, to Wellington Management from any use of the Fund’s brokerage commissions to obtain soft dollar research, and representations from HIFSCO and Wellington Management that Wellington Management would not make any revenue-sharing payments or any other type of distribution payments to HIFSCO or its affiliates.
* * * *
Based upon its review of these various factors, among others, the Board concluded that it is in the best interests of the Fund and its shareholders for the Board to approve the Agreement. In reaching this decision, the Board did not assign relative weights to the factors discussed above or deem any one or group of them to be controlling in and of themselves. In connection with their deliberations, the Independent Directors met separately in executive session, with independent legal counsel, to review the relevant materials and consider their responsibilities under relevant laws and regulations.
You should carefully consider investment objectives, risks, and charges and expenses of The Hartford Mutual Funds before investing. This and other information can be found in the Fund’s prospectus or summary prospectus, which can be obtained from your investment representative or by calling 888-843-7824. Please read them carefully before you invest or send money. The Hartford Mutual Funds are underwritten and distributed by Hartford Investment Financial Services LLC. “The Hartford” is The Hartford Financial Services Group, Inc., and its subsidiaries. MFSAR-MRR12 4/12 110743 Printed in U.S.A. ©2012 The Hartford, Hartford, CT 06155 | |
THE HARTFORD MUTUAL FUNDS 2012 Semi Annual Report The Hartford SmallCap Growth Fund |
A MESSAGE FROM THE PRESIDENT
Dear Fellow Shareholders:
I want to take this opportunity to say thank you for investing with The Hartford Mutual Funds. Although it’s not yet clear that the recent market volatility is truly behind us, we believe there are several reasons to remain optimistic about the markets in 2012.
Market Review
Stocks soared in October as a result of solid corporate earnings reports, generally better-than-expected economic data, and renewed hopes for a solution to the eurozone debt crisis. However, November saw some of those gains dissipate due to pessimism about European contagion and its implications for global economic growth. The quarter ended on a positive note, a result of encouraging employment and manufacturing data in December.
The S&P 500 Index was virtually unchanged for the year: 1257.64 on 12/31/2010, and 1257.60 on 12/31/2011. Dividends, however, helped produce a 2.11% total return for the Index for the year.
In 2012, U.S. equities surged in the first quarter, with the S&P 500 up 12.59% as investors shrugged off lingering uncertainty over eurozone sovereign debt and focused instead on improving economic data. Strong corporate earnings news and the Federal Reserve’s pledge to keep interest rates low buoyed investors’ appetites.
The Hartford Mutual Funds Expands Relationship with Wellington Management
We’re very pleased that we are expanding our relationship with Wellington Management which will now serve as the sole sub-adviser for the retail Hartford Mutual Funds including equity, fixed-income, and asset-allocation funds.* One of America’s oldest and largest investment management firms, Wellington Management has resources that span the entire globe, with multiple offices across the U.S. and numerous offices abroad. Wellington Management’s most distinctive strength is its proprietary research, which is shared across the entire organization.
We believe that aligning more closely with a well-respected money manager like Wellington Management puts us in a strong position to drive significant growth and to continue delivering innovative fund strategies to help our investors meet their financial goals.
Thank you again for investing with The Hartford Mutual Funds.
James Davey
President
The Hartford Mutual Funds
*Hartford Investment Management Company will continue to sub-advise The Hartford Money Market Fund.
The Hartford SmallCap Growth Fund
Table of Contents
The views expressed in the Fund’s Manager Discussion under ‘‘Why did the Fund perform this way?’’ and ‘‘What is the outlook?’’ are views of the Fund’s sub-adviser and portfolio management team through the end of the period and are subject to change based on market and other conditions.
| The Hartford SmallCap Growth Fund inception 01/04/1988 |
| (sub-advised by Wellington Management Company, LLP) |
| |
| Investment objective – Seeks long-term capital appreciation. |
Performance Overview 4/30/02 - 4/30/12
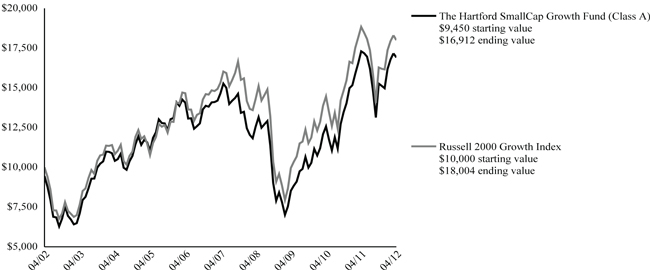
The chart above shows the growth of a $10,000 investment in Class A which includes a sales charge. Growth results in classes other then Class A will vary from what is seen above due to differences in the expenses charged to those share classes.
Average Annual Total Returns (as of 4/30/12)
| | 6 Month† | 1 Year | 5 year | 10 year |
| SmallCap Growth A# | 10.78% | -2.23% | 2.90% | 5.99% |
| SmallCap Growth A## | | -7.61% | 1.74% | 5.39% |
| SmallCap Growth B# | 10.38% | -2.96% | 2.23% | NA* |
| SmallCap Growth B## | | -7.81% | 1.87% | NA* |
| SmallCap Growth C# | 10.37% | -2.95% | 2.09% | 5.19% |
| SmallCap Growth C## | | -3.92% | 2.09% | 5.19% |
| SmallCap Growth I# | 10.95% | -1.91% | 3.07% | 6.09% |
| SmallCap Growth R3# | 10.66% | -2.41% | 2.62% | 6.04% |
| SmallCap Growth R4# | 10.84% | -2.13% | 2.87% | 6.18% |
| SmallCap Growth R5# | 10.99% | -1.83% | 3.17% | 6.34% |
| SmallCap Growth Y# | 11.04% | -1.74% | 3.26% | 6.39% |
| Russell 2000 Growth Index | 10.58% | -4.42% | 3.27% | 6.06% |
| * | 10 year returns are not applicable for Class B because after 8 years Class B converts to Class A. |
PAST PERFORMANCE IS NOT INDICATIVE OF FUTURE RESULTS.
The initial investment in Class A shares reflects the maximum sales charge and Classes B and C reflect a contingent deferred sales charge.
Total returns presented above were calculated using the Fund’s net asset value available to shareholders for sale or redemption of Fund shares on April 30, 2012, which may exclude investment transactions as of this date.
Effective 9/30/09, Class B shares of The Hartford Mutual Funds were closed to new investments.
Class I shares commenced operations on 8/31/06. Performance prior to that date is that of the Fund’s Class A shares (excluding sales charges), which had different operating expenses.Class R3, R4 and R5 shares commenced operations on 12/22/06. Class R3, R4 and R5 share performance prior to that date reflects Class Y share performance and operating expenses.
Russell 2000 Growth Index is an unmanaged index of those Russell 2000 Index growth companies with higher price-to-book ratios and higher forecasted growth values. (The Russell 2000 Index is a broad-based unmanaged index comprised of 2,000 of the smallest U.S.-domiciled company common stocks (on the basis of capitalization) that are traded in the United States on the New York Stock Exchange, American Stock Exchange and Nasdaq.)
You cannot invest directly in an index.
The chart represents a hypothetical investment in the Fund. Performance data represents past performance and current performance could be higher or lower.
The value of shares will fluctuate so that, when redeemed, shares may be worth more or less than their original cost. The chart and table do not reflect the deduction of taxes that a shareholder would pay on Fund distributions or the redemption of Fund shares.
Performance information may reflect historical or current expense waivers/reimbursements from the investment adviser, without which performance would have been lower. For information on current expense waivers/reimbursements, please see the prospectus.
| The Hartford SmallCap Growth Fund |
| Manager Discussion |
| April 30, 2012 (Unaudited) |
| Portfolio Managers | |
| Mammen Chally, CFA | David J. Elliot, CFA |
| Vice President and Equity Portfolio Manager | Vice President, Co-Director of Quantitative Investments, Director of Quantitative Portfolio Management and Portfolio Manager |
| | |
How did the Fund perform?
The Class A shares of The Hartford SmallCap Growth Fund returned 10.78%, before sales charge, for the six-month period ended April 30, 2012, outperforming its benchmark, the Russell 2000 Growth Index, which returned 10.58%. For the same period, the Fund underperformed the return of the average fund in the Lipper Small-Cap Growth Funds peer group of 11.57%, a group of funds with investment strategies similar to those of the Fund.
Why did the Fund perform this way?
U.S. equities moved higher in the period as generally improving economic data and growing consumer confidence helped to counter a persistent slump in housing. Investors mostly shrugged off lingering uncertainty over eurozone sovereign debt, focusing instead on the improving health of the U.S. economy. Strong corporate earnings news and the U.S. Federal Reserve’s pledge to keep interest rates “exceptionally low” until at least late 2014 buoyed investors’ appetites for risk assets. The Greek debt restructuring deal added to investors’ optimism, helping to offset heightened geopolitical risks, a rise in oil prices, and fears of a slowdown in China. In April, U.S. equities retreated for the first time in five months as disappointing employment and GDP (gross domestic product) data overshadowed continued strength in corporate earnings. In addition, increased political uncertainty in Europe, growing concerns about Spain’s fiscal sustainability, and a less dovish tone from the U.S. Federal Reserve underpinned a rise in risk aversion among investors.
Small cap (+11%) stocks underperformed large cap stocks (+13%) during the period, as measured by the Russell 2000 and S&P 500 Indices, respectively. Growth (+10.6%) stocks slightly trailed Value (+11.5%) stocks during the period, as measured by the Russell 2000 Growth and Russell 2000 Value Indices. Nine of ten sectors in the Russell 2000 Growth Index had positive returns during the period. The Health Care (+16%), Consumer Discretionary (+13%), and Financials (+12%) sectors performed best, while Utilities (-4%) and Telecommunication Services (+4%) lagged on a relative basis.
The Fund’s outperformance relative to the benchmark reflected strong selection in the Energy, Materials, and Consumer Discretionary sectors, which offset weaker selection in Health Care and Consumer Staples. Sector allocation, which is a result of bottom-up security selection (i.e. stock by stock fundamental research), was slightly positive for the period. A modest cash position detracted from relative results in an upward trending market.
Among the top contributors to relative performance (i.e. performance of the Fund as measured against the benchmark) were Zoll Medical (Health Care), SolarWinds (Information Technology), and Georgia Gulf (Materials). Shares of Zoll Medical (Health Care) increased in price during the period. The market responded favorably to developments pertaining to the company’s LifeVest wearable defibrillator. SolarWinds, an enterprise software company, also saw its stock rally as the market continued to recognize its favorable prospective rate of growth. Georgia Gulf markets and manufactures chemicals and building products in the United States and internationally. Demand for domestic polyvinyl chloride, commonly known as PVC, grew as a result of better weather conditions; growth in the PVC market is closely linked to activity in the construction industry. In addition, Westlake announced a hostile takeover offer bid that was rejected by Georgia Gulf. Georgia Gulf’s stock price rose substantially during the portion of the period that we held it in the Fund. Top absolute (i.e. total return) contributors for the period also included Salix Pharmaceutical (Health Care).
The top relative detractors included OPNET Technologies (Information Technology); the Fund’s benchmark-relative performance was also hindered by not holding Medivation (Health Care) and Vivus (Health Care), both of which are stocks in the index that surged in price during the period. OPNET Technologies specializes in manufacturing telecommunication transmission products for inter-office networks. The market frowned on the company’s release of lower-than-expected profit and revenue predictions for its fiscal fourth quarter. Investors responded favorably to Medivation, which we did not own, on the announcement of positive results from a phase 3 trial of a new drug, called MDV3100, for prostate cancer patients. Vivus, another stock in the benchmark that we did not hold, also rose substantially during the period. An FDA Advisory Committee recommended that one of the company’s drugs, Qnexa, be granted approval to market as a treatment for obesity. Top detractors from absolute returns during the period included Diamond Foods (Consumer Staples) and Shutterfly (Consumer Discretionary).
| The Hartford SmallCap Growth Fund |
| Manager Discussion – (continued) |
| April 30, 2012 (Unaudited) |
What is the outlook?
Lingering risks cloud the outlook, and we believe they will continue to cause periodic corrections in risky assets. Despite this, the environment has stabilized and long-term volatility is likely to fall. We expect this decline in volatility, particularly when coupled with the market impact of yield-seeking investors, will continue to drive risk appetite. We remain favorably disposed to equities with a growth bias. Since the onset of the global financial crisis, we have become accustomed to a set of relationships among macroeconomic data and the behavior of financial assets. “Risk-on/risk-off” has become common parlance and is associated with certain relationships: a weak dollar and rising commodity prices when risk is on, for example. Similarly, commodities and equities have been highly correlated, as they have been driven by a common factor: easy monetary policy. We would anticipate that many of these relationships will not persist indefinitely.
The Fund focuses on stock selection as the key driver of returns and uses proprietary fundamental and quantitative research in a disciplined framework to build a portfolio of what we consider the most attractive stocks. Sector exposures are residuals from this bottom-up stock selection process and are not explicit management decisions. The Fund ended the period overweight (i.e. the Fund’s sector position was greater than the benchmark position) in Information Technology and Consumer Discretionary and underweight in Financials, Consumer Staples, and Materials relative to the Russell 2000 Growth Index.
Diversification by Industry
as of April 30, 2012
| Industry (Sector) | | Percentage of
Net Assets |
| Automobiles & Components (Consumer Discretionary) | | | 0.8 | % |
| Banks (Financials) | | | 2.6 | |
| Capital Goods (Industrials) | | | 11.5 | |
| Commercial & Professional Services (Industrials) | | | 3.1 | |
| Consumer Durables & Apparel (Consumer Discretionary) | | | 3.4 | |
| Consumer Services (Consumer Discretionary) | | | 2.7 | |
| Diversified Financials (Financials) | | | 1.1 | |
| Energy (Energy) | | | 8.1 | |
| Food & Staples Retailing (Consumer Staples) | | | 0.1 | |
| Food, Beverage & Tobacco (Consumer Staples) | | | 1.3 | |
| Health Care Equipment & Services (Health Care) | | | 7.1 | |
| Household & Personal Products (Consumer Staples) | | | 2.2 | |
| Insurance (Financials) | | | 0.9 | |
| Materials (Materials) | | | 3.8 | |
| Media (Consumer Discretionary) | | | 1.1 | |
| Other Investment Pools and Funds (Financials) | | | 1.8 | |
| Pharmaceuticals, Biotechnology & Life Sciences (Health Care) | | | 12.6 | |
| Real Estate (Financials) | | | 1.8 | |
| Retailing (Consumer Discretionary) | | | 7.5 | |
| Semiconductors & Semiconductor Equipment (Information Technology) | | | 3.6 | |
| Software & Services (Information Technology) | | | 14.9 | |
| Technology Hardware & Equipment (Information Technology) | | | 4.3 | |
| Telecommunication Services (Services) | | | 0.6 | |
| Transportation (Industrials) | | | 1.7 | |
| Utilities (Utilities) | | | 0.4 | |
| Short-Term Investments | | | 1.5 | |
| Other Assets and Liabilities | | | (0.5 | ) |
| Total | | | 100.0 | % |
| The Hartford SmallCap Growth Fund |
| Schedule of Investments |
| April 30, 2012 (Unaudited) |
| (000’s Omitted) |
| Shares or Principal Amount | | Market Value ╪ |
COMMON STOCKS - 97.2% | | | | |
| | | | | Automobiles & Components - 0.8% | | | | |
| | 19 | | | American Axle & Manufacturing Holdings, Inc. ● | | $ | 181 | |
| | 11 | | | Dana Holding Corp. | | | 160 | |
| | 51 | | | Exide Technologies ● | | | 148 | |
| | 72 | | | Tenneco Automotive, Inc. ● | | | 2,205 | |
| | | | | | | | 2,694 | |
| | | | | Banks - 2.6% | | | | |
| | 157 | | | Boston Private Financial Holdings, Inc. | | | 1,460 | |
| | 52 | | | Flushing Financial Corp. | | | 676 | |
| | 73 | | | Nationstar Mortgage Holdings, Inc. ● | | | 1,043 | |
| | 107 | | | Ocwen Financial Corp. ● | | | 1,595 | |
| | 29 | | | Signature Bank ● | | | 1,928 | |
| | 109 | | | Umpqua Holdings Corp. | | | 1,444 | |
| | 21 | | | Walker & Dunlop, Inc. ● | | | 278 | |
| | 21 | | | Wintrust Financial Corp. | | | 741 | |
| | | | | | | | 9,165 | |
| | | | | Capital Goods - 11.5% | | | | |
| | 33 | | | A.O. Smith Corp. | | | 1,558 | |
| | 27 | | | AAON, Inc. | | | 545 | |
| | 29 | | | Actuant Corp. Class A | | | 794 | |
| | 33 | | | Acuity Brands, Inc. | | | 1,845 | |
| | 7 | | | Aerovironment, Inc. ● | | | 161 | |
| | 82 | | | Altra Holdings, Inc. ● | | | 1,505 | |
| | 6 | | | American Science & Engineering, Inc. | | | 366 | |
| | 40 | | | Applied Industrial Technologies, Inc. | | | 1,587 | |
| | 25 | | | AZZ, Inc. | | | 1,313 | |
| | 62 | | | Belden, Inc. | | | 2,169 | |
| | 16 | | | Brady Corp. Class A | | | 493 | |
| | 34 | | | Ceradyne, Inc. | | | 860 | |
| | 51 | | | Chart Industries, Inc. ● | | | 3,930 | |
| | 59 | | | Commercial Vehicles Group, Inc. ● | | | 626 | |
| | 13 | | | Cubic Corp. | | | 582 | |
| | 33 | | | Esterline Technologies Corp. ● | | | 2,232 | |
| | 29 | | | Franklin Electric Co., Inc. | | | 1,434 | |
| | 65 | | | Gencorp, Inc. ● | | | 449 | |
| | 74 | | | GrafTech International Ltd. ● | | | 870 | |
| | 24 | | | Lennox International, Inc. | | | 1,020 | |
| | 19 | | | Lindsay Corp. | | | 1,269 | |
| | 103 | | | Meritor, Inc. ● | | | 669 | |
| | 47 | | | Moog, Inc. Class A ● | | | 2,001 | |
| | 5 | | | National Presto Industries, Inc. | | | 376 | |
| | 64 | | | Nordson Corp. | | | 3,442 | |
| | 31 | | | Orbital Sciences Corp. ● | | | 386 | |
| | 37 | | | Polypore International, Inc. ● | | | 1,395 | |
| | 24 | | | Primoris Services Corp. | | | 352 | |
| | 9 | | | Sauer-Danfoss, Inc. | | | 385 | |
| | 53 | | | Sun Hydraulics Corp. | | | 1,319 | |
| | 81 | | | Taser International, Inc. ● | | | 374 | |
| | 38 | | | Teledyne Technologies, Inc. ● | | | 2,447 | |
| | 78 | | | Trimas Corp. ● | | | 1,720 | |
| | 21 | | | Xerium Technologies, Inc. ● | | | 97 | |
| | | | | | | | 40,571 | |
| | | | | Commercial & Professional Services - 3.1% | | | | |
| | 10 | | | Acacia Research Corp. ● | | | 418 | |
| | 54 | | | Cenveo, Inc. ● | | | 156 | |
| | 11 | | | Corporate Executive Board Co. | | | 439 | |
| | 69 | | | Deluxe Corp. | | | 1,642 | |
| | 47 | | | Exponent, Inc. ● | | | 2,237 | |
| | 22 | | | Herman Miller, Inc. | | | 435 | |
| | 8 | | | Insperity, Inc. | | | 226 | |
| | 10 | | | Intersections, Inc. | | | 125 | |
| | 79 | | | On Assignment, Inc. ● | | | 1,475 | |
| | 34 | | | Portfolio Recovery Associate ● | | | 2,357 | |
| | 12 | | | Quad Graphics, Inc. | | | 167 | |
| | 16 | | | RPX Corp. ● | | | 268 | |
| | 73 | | | Sykes Enterprises, Inc. ● | | | 1,157 | |
| | 2 | | | TMS International Corp. ● | | | 21 | |
| | | | | | | | 11,123 | |
| | | | | Consumer Durables & Apparel - 3.4% | | | | |
| | 31 | | | Arctic Cat, Inc. ● | | | 1,365 | |
| | 1 | | | Blyth, Inc. | | | 118 | |
| | 26 | | | Brunswick Corp. | | | 681 | |
| | 20 | | | Cherokee, Inc. | | | 261 | |
| | 12 | | | Deckers Outdoor Corp. ● | | | 618 | |
| | 45 | | | G-III Apparel Group Ltd. ● | | | 1,214 | |
| | 85 | | | Liz Claiborne, Inc. ● | | | 1,141 | |
| | 27 | | | Polaris Industries, Inc. | | | 2,107 | |
| | 43 | | | Smith & Wesson Holding Corp. ● | | | 358 | |
| | 36 | | | Steven Madden Ltd. ● | | | 1,575 | |
| | 8 | | | Sturm Ruger & Co., Inc. | | | 479 | |
| | 47 | | | True Religion Apparel, Inc. ● | | | 1,288 | |
| | 19 | | | Warnaco Group, Inc. ● | | | 990 | |
| | | | | | | | 12,195 | |
| | | | | Consumer Services - 2.7% | | | | |
| | 7 | | | American Public Education, Inc. ● | | | 247 | |
| | 1 | | | Biglari Holdings, Inc. ● | | | 467 | |
| | 8 | | | Bridgepoint Education, Inc. ● | | | 166 | |
| | 73 | | | Brinker International, Inc. | | | 2,297 | |
| | 12 | | | Caesars Entertainment Corp. ● | | | 179 | |
| | 6 | | | Capella Education Co. ● | | | 183 | |
| | 77 | | | Cheesecake Factory, Inc. ● | | | 2,434 | |
| | 5 | | | Coinstar, Inc. ● | | | 339 | |
| | 13 | | | Domino's Pizza, Inc. | | | 495 | |
| | 7 | | | Papa John's International, Inc. ● | | | 290 | |
| | 9 | | | Shuffle Master, Inc. ● | | | 159 | |
| | 52 | | | Sotheby's Holdings | | | 2,057 | |
| | 2 | | | Strayer Education, Inc. | | | 158 | |
| | | | | | | | 9,471 | |
| | | | | Diversified Financials - 1.1% | | | | |
| | 59 | | | Compass Diversified Holdings | | | 863 | |
| | 90 | | | DFC Global Corp. ● | | | 1,570 | |
| | 15 | | | Ezcorp, Inc. ● | | | 389 | |
| | 9 | | | First Cash Financial Services, Inc. ● | | | 373 | |
| | 16 | | | Nelnet, Inc. | | | 400 | |
| | 17 | | | Netspend Holdings, Inc. ● | | | 133 | |
| | 2 | | | World Acceptance Corp. ● | | | 126 | |
| | | | | | | | 3,854 | |
| | | | | Energy - 8.1% | | | | |
| | 42 | | | Alon USA Energy, Inc. | | | 382 | |
| | 36 | | | ATP Oil & Gas Corp. ● | | | 273 | |
| | 6 | | | Basic Energy Services, Inc. ● | | | 81 | |
| | 51 | | | Berry Petroleum Co. | | | 2,312 | |
| | 13 | | | Cheniere Energy, Inc. ● | | | 242 | |
| | 7 | | | Cloud Peak Energy, Inc. ● | | | 110 | |
| | 12 | | | Contango ORE, Inc. ● | | | 651 | |
| | 83 | | | CVR Energy, Inc. ● | | | 2,524 | |
| | 68 | | | Energy XXI Bermuda Ltd. ● | | | 2,572 | |
| | 16 | | | Global Geophysical Services ● | | | 155 | |
The accompanying notes are an integral part of these financial statements.
| The Hartford SmallCap Growth Fund |
| Schedule of Investments — (continued) |
| April 30, 2012 (Unaudited) |
| (000’s Omitted) |
| Shares or Principal Amount | | Market Value ╪ |
COMMON STOCKS - 97.2% - (continued) | | | | |
| | | | | Energy - 8.1% - (continued) | | | | |
| | 59 | | | Gulfmark Offshore, Inc. ● | | $ | 2,837 | |
| | 39 | | | Hornbeck Offshore Services, Inc. ● | | | 1,626 | |
| | 370 | | | ION Geophysical Corp. ● | | | 2,303 | |
| | 10 | | | Matador Resources Co. ● | | | 117 | |
| | 11 | | | Matrix Service Co. ● | | | 156 | |
| | 38 | | | Petroleum Development Corp. ● | | | 1,317 | |
| | 153 | | | Rentech, Inc. ● | | | 353 | |
| | 112 | | | Rex Energy Corp. ● | | | 1,175 | |
| | 78 | | | Rosetta Resources, Inc. ● | | | 3,922 | |
| | 11 | | | RPC, Inc. | | | 111 | |
| | 72 | | | Stone Energy Corp. ● | | | 2,016 | |
| | 3 | | | Targa Resources Corp. | | | 130 | |
| | 16 | | | TETRA Technologies, Inc. ● | | | 142 | |
| | 183 | | | Vaalco Energy, Inc. ● | | | 1,658 | |
| | 21 | | | W&T Offshore, Inc. | | | 406 | |
| | 23 | | | Western Refining, Inc. | | | 434 | |
| | 96 | | | Willbros Group, Inc. ● | | | 519 | |
| | | | | | | | 28,524 | |
| | | | | Food & Staples Retailing - 0.1% | | | | |
| | 295 | | | Rite Aid Corp. ● | | | 427 | |
| | | | | | | | | |
| | | | | Food, Beverage & Tobacco - 1.3% | | | | |
| | 18 | | | Boston Beer Co., Inc. Class A ● | | | 1,886 | |
| | 153 | | | Darling International, Inc. ● | | | 2,500 | |
| | 14 | | | Omega Protein Corp. ● | | | 97 | |
| | | | | | | | 4,483 | |
| | | | | Health Care Equipment & Services - 7.1% | | | | |
| | 29 | | | Alliance HealthCare Services, Inc. ● | | | 40 | |
| | 80 | | | AngioDynamics, Inc. ● | | | 992 | |
| | 26 | | | ArthroCare Corp. ● | | | 659 | |
| | 3 | | | Athenahealth, Inc. ● | | | 239 | |
| | 5 | | | Atrion Corp. | | | 1,188 | |
| | 17 | | | Centene Corp. ● | | | 682 | |
| | 5 | | | Chemed Corp. | | | 326 | |
| | 8 | | | Computer Programs and Systems, Inc. | | | 501 | |
| | 31 | | | Corvel Corp. ● | | | 1,331 | |
| | 55 | | | Cyberonics, Inc. ● | | | 2,106 | |
| | 123 | | | Dexcom, Inc. ● | | | 1,200 | |
| | 31 | | | Dynavox, Inc. ● | | | 77 | |
| | 38 | | | HealthSouth Corp. ● | | | 849 | |
| | 14 | | | Heartware International, Inc. ● | | | 1,091 | |
| | 60 | | | Masimo Corp. ● | | | 1,332 | |
| | 213 | | | Merge Healthcare, Inc. ● | | | 914 | |
| | 9 | | | Metropolitan Health Networks ● | | | 64 | |
| | 26 | | | Molina Healthcare, Inc. ● | | | 664 | |
| | 84 | | | Owens & Minor, Inc. | | | 2,467 | |
| | 10 | | | Quidel Corp. ● | | | 165 | |
| | 93 | | | RTI Biologics, Inc. ● | | | 325 | |
| | 32 | | | STERIS Corp. | | | 1,002 | |
| | 46 | | | U.S. Physical Therapy, Inc. | | | 1,112 | |
| | 50 | | | Volcano Corp. ● | | | 1,370 | |
| | 70 | | | Wellcare Health Plans, Inc. ● | | | 4,257 | |
| | | | | | | | 24,953 | |
| | | | | Household & Personal Products - 2.2% | | | | |
| | 74 | | | Elizabeth Arden, Inc. ● | | | 2,903 | |
| | 10 | | | Natures Sunshine ● | | | 150 | |
| | 75 | | | Nu Skin Enterprises, Inc. Class A | | | 3,988 | |
| | 17 | | | Spectrum Brands Holdings, Inc. ● | | | 601 | |
| | 8 | | | Usana Health Sciences, Inc. ● | | | 325 | |
| | | | | | | | 7,967 | |
| | | | | Insurance - 0.9% | | | | |
| | 58 | | | Amerisafe, Inc. ● | | | 1,544 | |
| | 23 | | | AmTrust Financial Services, Inc. | | | 613 | |
| | 38 | | | Protective Life Corp. | | | 1,115 | |
| | | | | | | | 3,272 | |
| | | | | Materials - 3.8% | | | | |
| | 13 | | | A. Schulman, Inc. | | | 322 | |
| | 22 | | | Chemtura Corp. ● | | | 374 | |
| | 17 | | | Gold Resource Corp. | | | 458 | |
| | 13 | | | Innospec, Inc. ● | | | 390 | |
| | 7 | | | Koppers Holdings, Inc. | | | 284 | |
| | 44 | | | Kraton Performance Polymers ● | | | 1,138 | |
| | 4 | | | LSB Industries, Inc. ● | | | 136 | |
| | 11 | | | Minerals Technologies, Inc. | | | 766 | |
| | 35 | | | Myers Industries | | | 574 | |
| | 3 | | | Newmarket Corp. | | | 780 | |
| | 13 | | | Noranda Aluminium Holding Corp. | | | 133 | |
| | 70 | | | Olin Corp. | | | 1,472 | |
| | 9 | | | PolyOne Corp. | | | 118 | |
| | 12 | | | Rockwood Holdings, Inc. ● | | | 647 | |
| | 105 | | | Silgan Holdings, Inc. | | | 4,600 | |
| | 27 | | | TPC Group, Inc. ● | | | 1,112 | |
| | 33 | | | Verso Paper Corp. ● | | | 55 | |
| | | | | | | | 13,359 | |
| | | | | Media - 1.1% | | | | |
| | 87 | | | Arbitron, Inc. | | | 3,326 | |
| | 118 | | | Dex One Corp. ● | | | 114 | |
| | 25 | | | Reachlocal, Inc. ● | | | 185 | |
| | 29 | | | Sinclair Broadcast Group, Inc. Class A | | | 296 | |
| | 19 | | | Supermedia, Inc. ● | | | 33 | |
| | | | | | | | 3,954 | |
| | | | | Pharmaceuticals, Biotechnology & Life Sciences - 12.6% | | | | |
| | 50 | | | 3SBio, Inc. ADR ● | | | 655 | |
| | 9 | | | Acorda Therapeutics, Inc. ● | | | 220 | |
| | 163 | | | Alkermes plc ● | | | 2,815 | |
| | 14 | | | Alnylam Pharmaceuticals, Inc. ● | | | 157 | |
| | 77 | | | Ardea Biosciences, Inc. ● | | | 2,450 | |
| | 36 | | | Auxilium Pharmaceuticals, Inc. ● | | | 643 | |
| | 88 | | | Aveo Pharmaceuticals, Inc. ● | | | 1,009 | |
| | 39 | | | BioCryst Pharmaceuticals, Inc. ● | | | 141 | |
| | 34 | | | Biotime, Inc. ● | | | 130 | |
| | 108 | | | Bruker Corp. ● | | | 1,619 | |
| | 148 | | | Cadence Pharmaceuticals, Inc. ● | | | 545 | |
| | 37 | | | Cleveland BioLabs, Inc. ● | | | 73 | |
| | 70 | | | Cubist Pharmaceuticals, Inc. ● | | | 2,961 | |
| | 16 | | | Cumberland Pharmaceuticals, Inc. ● | | | 119 | |
| | 55 | | | Enzon, Inc. ● | | | 343 | |
| | 227 | | | Exelixis, Inc. ● | | | 1,088 | |
| | 54 | | | GTX, Inc. ● | | | 170 | |
| | 13 | | | Idenix Pharmaceutical, Inc. ● | | | 113 | |
| | 136 | | | Immunogen, Inc. ● | | | 1,732 | |
| | 96 | | | Incyte Corp. ● | | | 2,171 | |
| | 124 | | | Ironwood Pharmaceuticals, Inc. ● | | | 1,633 | |
| | 13 | | | Jazz Pharmaceuticals plc ● | | | 669 | |
| | 20 | | | Keryx Biopharmaceuticals, Inc. ● | | | 32 | |
| | 33 | | | Map Pharmaceuticals, Inc. ● | | | 427 | |
| | 153 | | | Medicines Co. ● | | | 3,375 | |
The accompanying notes are an integral part of these financial statements.
| Shares or Principal Amount | | Market Value ╪ |
COMMON STOCKS - 97.2% - (continued) | | | | |
| | | | | Pharmaceuticals, Biotechnology & Life Sciences - 12.6% - (continued) | | | | |
| | 6 | | | Medicis Pharmaceutical Corp. Class A | | $ | 223 | |
| | 23 | | | Momenta Pharmaceuticals, Inc. ● | | | 357 | |
| | 79 | | | Neurocrine Biosciences, Inc. ● | | | 589 | |
| | 231 | | | NPS Pharmaceuticals, Inc. ● | | | 1,651 | |
| | 34 | | | Obagi Medical Products, Inc. ● | | | 446 | |
| | 52 | | | Onyx Pharmaceuticals, Inc. ● | | | 2,386 | |
| | 109 | | | Optimer Pharmaceuticals, Inc. ● | | | 1,619 | |
| | 7 | | | Par Pharmaceutical Cos., Inc. ● | | | 292 | |
| | 54 | | | PAREXEL International Corp. ● | | | 1,448 | |
| | 91 | | | PDL Biopharma, Inc. | | | 574 | |
| | 16 | | | Pharmacyclics, Inc. ● | | | 427 | |
| | 47 | | | Progenics Pharmaceuticals, Inc. ● | | | 515 | |
| | 14 | | | Questcor Pharmaceuticals ● | | | 630 | |
| | 143 | | | Rigel Pharmaceuticals, Inc. ● | | | 1,105 | |
| | 61 | | | Salix Pharmaceuticals Ltd. ● | | | 2,989 | |
| | 27 | | | Santarus, Inc. ● | | | 169 | |
| | 148 | | | Seattle Genetics, Inc. ● | | | 2,922 | |
| | 65 | | | Siga Technologies, Inc. ● | | | 215 | |
| | 30 | | | Spectrum Pharmaceuticals, Inc. ● | | | 314 | |
| | 90 | | | Trius Therapeutics, Inc. ● | | | 481 | |
| | | | | | | | 44,642 | |
| | | | | Real Estate - 1.8% | | | | |
| | 27 | | | CBL & Associates Properties | | | 499 | |
| | 51 | | | Colonial Properties Trust | | | 1,139 | |
| | 50 | | | Coresite Realty Corp. | | | 1,234 | |
| | 34 | | | Extra Space Storage, Inc. | | | 1,029 | |
| | 54 | | | Glimcher Realty Trust | | | 533 | |
| | 122 | | | MFA Mortgage Investments, Inc. | | | 902 | |
| | 42 | | | Omega Healthcare Investors, Inc. | | | 901 | |
| | | | | | | | 6,237 | |
| | | | | Retailing - 7.5% | | | | |
| | 8 | | | Aeropostale, Inc. ● | | | 182 | |
| | 13 | | | ANN, Inc. ● | | | 349 | |
| | 149 | | | Ascena Retail Group, Inc. ● | | | 3,060 | |
| | 11 | | | Buckle (The), Inc. | | | 522 | |
| | 7 | | | Cato Corp. | | | 203 | |
| | 40 | | | Children's Place Retail Stores, Inc. ● | | | 1,829 | |
| | 43 | | | Core-Mark Holding Co., Inc. | | | 1,676 | |
| | 9 | | | Cost Plus, Inc. ● | | | 167 | |
| | 53 | | | DSW, Inc. | | | 2,983 | |
| | 5 | | | Express, Inc. ● | | | 116 | |
| | 14 | | | Francescas Holding Corp. ● | | | 429 | |
| | 54 | | | GNC Holdings, Inc. | | | 2,098 | |
| | 26 | | | Group 1 Automotive, Inc. | | | 1,529 | |
| | 4 | | | Lumber Liquidators Holdings, Inc. ● | | | 124 | |
| | 45 | | | Mattress Firm Holding Corp. ● | | | 1,787 | |
| | 11 | | | Nutri/System, Inc. | | | 130 | |
| | 28 | | | Overstock.com, Inc. ● | | | 167 | |
| | 19 | | | PetMed Express, Inc. | | | 252 | |
| | 32 | | | Pier 1 Imports, Inc. ● | | | 548 | |
| | 66 | | | rue21, Inc. ● | | | 1,989 | |
| | 16 | | | Select Comfort Corp. ● | | | 472 | |
| | 68 | | | Shutterfly, Inc. ● | | | 2,109 | |
| | 13 | | | Systemax, Inc. ● | | | 223 | |
| | 55 | | | Teavana Holdings, Inc. ● | | | 1,158 | |
| | 40 | | | Vitamin Shoppe, Inc. ● | | | 1,898 | |
| | 10 | | | Zumiez, Inc. ● | | | 370 | |
| | | | | | | | 26,370 | |
| | | | | Semiconductors & Semiconductor Equipment - 3.6% | | | | |
| | 25 | | | Amtech Systems, Inc. ● | | | 172 | |
| | 10 | | | Cabot Microelectronics Corp. | | | 358 | |
| | 46 | | | Cymer, Inc. ● | | | 2,400 | |
| | 51 | | | Entegris, Inc. ● | | | 447 | |
| | 54 | | | Entropic Communications, Inc. ● | | | 227 | |
| | 224 | | | GT Advanced Technologies, Inc. ● | | | 1,455 | |
| | 153 | | | Integrated Device Technology, Inc. ● | | | 1,039 | |
| | 28 | | | Kulicke and Soffa Industries, Inc. ● | | | 363 | |
| | 49 | | | LTX-Credence Corp. ● | | | 339 | |
| | 256 | | | Mindspeed Technologies, Inc. ● | | | 1,281 | |
| | 100 | | | Nanometrics, Inc. ● | | | 1,550 | |
| | 81 | | | ON Semiconductor Corp. ● | | | 671 | |
| | 31 | | | Rambus, Inc. ● | | | 157 | |
| | 73 | | | Ultratech Stepper, Inc. ● | | | 2,318 | |
| | | | | | | | 12,777 | |
| | | | | Software & Services - 14.9% | | | | |
| | 17 | | | Actuate Corp. ● | | | 119 | |
| | 75 | | | Ancestry.com, Inc. ● | | | 1,997 | |
| | 24 | | | Bazaarvoice, Inc. ● | | | 482 | |
| | 6 | | | CACI International, Inc. Class A ● | | | 373 | |
| | 39 | | | Carbonite, Inc. ● | | | 312 | |
| | 38 | | | Commvault Systems, Inc. ● | | | 1,975 | |
| | 106 | | | Constant Contact, Inc. ● | | | 2,564 | |
| | 25 | | | CSG Systems International, Inc. ● | | | 366 | |
| | 29 | | | Deltek, Inc. ● | | | 298 | |
| | 94 | | | Dice Holdings, Inc. ● | | | 1,017 | |
| | 16 | | | Digital River, Inc. ● | | | 297 | |
| | 14 | | | Ebix, Inc. | | | 284 | |
| | 2 | | | ExactTarget, Inc. ● | | | 54 | |
| | 14 | | | Fair Isaac, Inc. | | | 592 | |
| | 33 | | | Fortinet, Inc. ● | | | 865 | |
| | 10 | | | Guidance Software, Inc. ● | | | 92 | |
| | 126 | | | Higher One Holdings, Inc. ● | | | 1,992 | |
| | 28 | | | Intralinks Holdings, Inc. ● | | | 130 | |
| | 101 | | | j2 Global, Inc. | | | 2,612 | |
| | 60 | | | JDA Software Group, Inc. ● | | | 1,733 | |
| | 52 | | | Keynote Systems, Inc. | | | 965 | |
| | 175 | | | LivePerson, Inc. ● | | | 2,777 | |
| | 9 | | | Manhattan Associates, Inc. ● | | | 426 | |
| | 9 | | | Mercadolibre, Inc. | | | 861 | |
| | 13 | | | MicroStrategy, Inc. ● | | | 1,884 | |
| | 27 | | | Mitek Systems, Inc. | | | 155 | |
| | 148 | | | Motricity, Inc. ● | | | 153 | |
| | 7 | | | Netscout Systems, Inc. ● | | | 151 | |
| | 9 | | | Opentable, Inc. ● | | | 407 | |
| | 43 | | | Opnet Technologies, Inc. | | | 1,001 | |
| | 91 | | | Parametric Technology Corp. ● | | | 1,970 | |
| | 30 | | | Progress Software Corp. ● | | | 694 | |
| | 12 | | | Proofpoint, Inc. | | | 153 | |
| | 69 | | | QLIK Technologies, Inc. ● | | | 1,978 | |
| | 17 | | | Quest Software, Inc. ● | | | 407 | |
| | 24 | | | Quinstreet, Inc. ● | | | 253 | |
| | 236 | | | Sapient Corp. | | | 2,830 | |
| | 31 | | | SeaChange International, Inc. ● | | | 257 | |
| | 97 | | | Solarwinds, Inc. ● | | | 4,573 | |
| | 30 | | | Solera Holdings, Inc. | | | 1,330 | |
| | 29 | | | Sourcefire, Inc. ● | | | 1,495 | |
| | 9 | | | Splunk, Inc. | | | 316 | |
| | 26 | | | Telenav, Inc. ● | | | 178 | |
| | 43 | | | Tibco Software, Inc. ● | | | 1,405 | |
The accompanying notes are an integral part of these financial statements.
| The Hartford SmallCap Growth Fund |
| Schedule of Investments — (continued) |
| April 30, 2012 (Unaudited) |
| (000’s Omitted) |
| Shares or Principal Amount | | | | | | Market Value ╪ | |
| COMMON STOCKS - 97.2% - (continued) | |
| | | | | Software & Services - 14.9% - (continued) | | | | | | | | |
| | 49 | | | TiVo, Inc. ● | | | | | | $ | 527 | |
| | 23 | | | TNS, Inc. ● | | | | | | | 465 | |
| | 10 | | | Travelzoo, Inc. ● | | | | | | | 257 | |
| | 13 | | | Unisys Corp. ● | | | | | | | 239 | |
| | 22 | | | United Online, Inc. | | | | | | | 102 | |
| | 41 | | | VeriFone Systems, Inc. ● | | | | | | | 1,930 | |
| | 61 | | | Wright Express Corp. ● | | | | | | | 3,876 | |
| | 60 | | | XO Group, Inc. ● | | | | | | | 560 | |
| | | | | | | | | | | | 52,729 | |
| | | | | Technology Hardware & Equipment - 4.3% | | | | | | | | |
| | 82 | | | Aruba Networks, Inc. ● | | | | | | | 1,735 | |
| | 50 | | | Coherent, Inc. ● | | | | | | | 2,628 | |
| | 20 | | | Comtech Telecommunications Corp. | | | | | | | 629 | |
| | 24 | | | Elector Scientific Industries | | | | | | | 338 | |
| | 28 | | | Electronics for Imaging, Inc. ● | | | | | | | 498 | |
| | 44 | | | Extreme Networks, Inc. ● | | | | | | | 168 | |
| | 4 | | | FEI Co. ● | | | | | | | 211 | |
| | 33 | | | Interdigital, Inc. | | | | | | | 925 | |
| | 87 | | | Oplink Communications, Inc. ● | | | | | | | 1,386 | |
| | 71 | | | Plantronics, Inc. | | | | | | | 2,717 | |
| | 7 | | | Plexus Corp. ● | | | | | | | 223 | |
| | 89 | | | Polycom, Inc. ● | | | | | | | 1,177 | |
| | 6 | | | Riverbed Technology, Inc. ● | | | | | | | 113 | |
| | 32 | | | Shoretel, Inc. ● | | | | | | | 153 | |
| | 29 | | | STEC, Inc. ● | | | | | | | 236 | |
| | 15 | | | Ubiquiti Networks, Inc. ● | | | | | | | 502 | |
| | 34 | | | Universal Display Corp. ● | | | | | | | 1,536 | |
| | 12 | | | Zygo Corp. ● | | | | | | | 229 | |
| | | | | | | | | | | | 15,404 | |
| | | | | Telecommunication Services - 0.6% | | | | | | | | |
| | 16 | | | AboveNet, Inc. ● | | | | | | | 1,306 | |
| | 12 | | | Boingo Wireless, Inc. ● | | | | | | | 123 | |
| | 8 | | | Cogent Communication Group, Inc. ● | | | | | | | 150 | |
| | 23 | | | IDT Corp. Class B | | | | | | | 194 | |
| | 45 | | | Leap Wireless International, Inc. ● | | | | | | | 250 | |
| | 10 | | | Lumos Networks Corp. | | | | | | | 89 | |
| | 79 | | | Vonage Holdings Corp. ● | | | | | | | 161 | |
| | | | | | | | | | | | 2,273 | |
| | | | | Transportation - 1.7% | | | | | | | | |
| | 8 | | | Allegiant Travel Co. ● | | | | | | | 452 | |
| | 192 | | | Avis Budget Group, Inc. ● | | | | | | | 2,523 | |
| | 8 | | | Heartland Express, Inc. | | | | | | | 115 | |
| | 31 | | | Marten Transport Ltd. | | | | | | | 660 | |
| | 98 | | | Werner Enterprises, Inc. | | | | | | | 2,314 | |
| | | | | | | | | | | | 6,064 | |
| | | | | Utilities - 0.4% | | | | | | | | |
| | 40 | | | UniSource Energy Corp. | | | | | | | 1,449 | |
| | | | | | | | | | | | | |
| | | | | Total common stocks | | | | | | | | |
| | | | | (cost $296,883) | | | | | | $ | 343,957 | |
| | | | | | | | | | | | | |
| EXCHANGE TRADED FUNDS - 1.8% | | | | | | |
| | | | | Other Investment Pools and Funds - 1.8% | | | | | | | | |
| | 68 | | | iShares Russell 2000 Growth Index Fund | | | | | | $ | 6,330 | |
| | | | | | | | | | | | | |
| | | | | Total exchange traded funds | | | | | | | | |
| | | | | (cost $6,153) | | | | | | $ | 6,330 | |
| | | | | | | | | | | | | |
| | | | | Total long-term investments | | | | | | | | |
| | | | | (cost $303,036) | | | | | | $ | 350,287 | |
| | | | | | | | | | | | | |
| SHORT-TERM INVESTMENTS - 1.5% | | | | | | | | |
| Repurchase Agreements - 1.5% | | | | | | | | |
| | | | | Bank of America Merrill Lynch TriParty Joint
Repurchase Agreement (maturing on
05/01/2012 in the amount of $1,284,
collateralized by FHLB 4.91%, 2015,
FHLMC 2.46% - 3.33%, 2040 - 2042,
FNMA 2.24% - 5.50%, 2024 - 2042, value
of $1,310) | | | | | | | | |
| $ | 1,284 | | | 0.20%, 04/30/2012 | | | | | | $ | 1,284 | |
| | | | | Barclays Capital TriParty Joint Repurchase
Agreement (maturing on 05/01/2012 in the
amount of $1,721, collateralized by
FHLMC 4.00% - 4.50%, 2039 - 2041,
FNMA 3.00% - 5.00%, 2027 - 2040, value
of $1,755) | | | | | | | | |
| | 1,721 | | | 0.20%, 04/30/2012 | | | | | | | 1,721 | |
| | | | | Deutsche Bank Securities TriParty Joint
Repurchase Agreement (maturing on
05/01/2012 in the amount of $680,
collateralized by FNMA 3.00% - 7.00%,
2023 - 2042, value of $693) | | | | | | | | |
| | 679 | | | 0.21%, 04/30/2012 | | | | | | | 679 | |
| | | | | TD Securities TriParty Joint Repurchase
Agreement (maturing on 05/01/2012 in the
amount of $563, collateralized by FFCB
0.27% - 5.38%, 2012 - 2020, FHLB 0.88% -
1.38%, 2013 - 2014, FHLMC 4.00% -
6.00%, 2014 - 2041, FNMA 4.00% - 4.50%,
2025 - 2042, value of $574) | | | | | | | | |
| | 563 | | | 0.19%, 04/30/2012 | | | | | | | 563 | |
| | | | | UBS Securities, Inc. Joint Repurchase
Agreement (maturing on 05/01/2012 in the
amount of $1, collateralized by U.S.
Treasury Note 0.75%, 2013, value of $1) | | | | | | | | |
| | 1 | | | 0.17%, 04/30/2012 | | | | | | | 1 | |
| | | | | UBS Securities, Inc. TriParty Joint Repurchase
Agreement (maturing on 05/01/2012 in the
amount of $924, collateralized by FHLMC
4.00%, 2026 - 2042, FNMA 2.50% - 4.50%,
2022 - 2042, value of $942) | | | | | | | | |
| | 924 | | | 0.21%, 04/30/2012 | | | | | | | 924 | |
| | 5172 | | | | | | | | | | 5,172 | |
| | | | | Total short-term investments | | | | | | | | |
| | | | | (cost $5,172) | | | | | | $ | 5,172 | |
| | | | | | | | | | | | | |
| | | | | Total investments | | | | | | | | |
| | | | | (cost $308,208) ▲ | | | 100.5 | % | | $ | 355,459 | |
| | | | | Other assets and liabilities | | | (0.5 | )% | | | (1,832 | ) |
| | | | | Total net assets | | | 100.0 | % | | $ | 353,627 | |
The accompanying notes are an integral part of these financial statements.
| Note: | Percentage of investments as shown is the ratio of the total market value to total net assets. |
| | |
| | Prices of foreign equities that are principally traded on certain foreign markets may be adjusted daily pursuant to a fair value pricing service approved by the Board of Directors in order to reflect an adjustment for factors occurring after the close of certain foreign markets but before the close of the New York Stock Exchange. |
| ▲ | At April 30, 2012, the cost of securities for federal income tax purposes was $309,613 and the aggregate gross unrealized appreciation and depreciation based on that cost were: |
| Unrealized Appreciation | | $ | 62,713 | |
| Unrealized Depreciation | | | (16,867 | ) |
| Net Unrealized Appreciation | | $ | 45,846 | |
| ╪ | See Significant Accounting Policies of accompanying Notes to Financial Statements regarding valuation of securities. |
| GLOSSARY: (abbreviations used in preceding Schedule of Investments) |
| | |
| Other Abbreviations: |
| ADR | American Depositary Receipt |
| FFCB | Federal Farm Credit Bank |
| FHLB | Federal Home Loan Bank |
| FHLMC | Federal Home Loan Mortgage Corp. |
| FNMA | Federal National Mortgage Association |
The accompanying notes are an integral part of these financial statements.
| The Hartford SmallCap Growth Fund |
| Investment Valuation Hierarchy Level Summary |
| April 30, 2012 (Unaudited) |
| (000’s Omitted) |
| | | Total | | Level 1 ♦ | | Level 2 ♦ | | Level 3 |
| Assets: | | | | | | | | | | | | | | | | |
| Common Stocks ‡ | | $ | 343,957 | | | $ | 343,957 | | | $ | — | | | $ | — | |
| Exchange Traded Funds | | | 6,330 | | | | 6,330 | | | | — | | | | — | |
| Short-Term Investments | | | 5,172 | | | | — | | | | 5,172 | | | | — | |
| Total | | $ | 355,459 | | | $ | 350,287 | | | $ | 5,172 | | | $ | — | |
| ♦ | For the six-month period ended April 30, 2012, there were no transfers between Level 1 and Level 2. |
| ‡ | The Fund has all or primarily all of the equity securities categorized in a particular level. Refer to the Schedule of Investments for further industry breakout. |
The accompanying notes are an integral part of these financial statements.
| The Hartford SmallCap Growth Fund |
| Statement of Assets and Liabilities |
| April 30, 2012 (Unaudited) |
| (000’s Omitted) |
| Assets: | | | | |
| Investments in securities, at market value (cost $308,208) | | $ | 355,459 | |
| Cash | | | 2 | |
| Receivables: | | | | |
| Investment securities sold | | | 8,643 | |
| Fund shares sold | | | 156 | |
| Dividends and interest | | | 51 | |
| Other assets | | | 67 | |
| Total assets | | | 364,378 | |
| Liabilities: | | | | |
| Payables: | | | | |
| Investment securities purchased | | | 10,471 | |
| Fund shares redeemed | | | 155 | |
| Investment management fees | | | 46 | |
| Administrative fees | | | — | |
| Distribution fees | | | 10 | |
| Accrued expenses | | | 69 | |
| Total liabilities | | | 10,751 | |
| Net assets | | $ | 353,627 | |
| Summary of Net Assets: | | | | |
| Capital stock and paid-in-capital | | $ | 327,012 | |
| Distributions in excess of net investment loss | | | (875 | ) |
| Accumulated net realized loss | | | (19,761 | ) |
| Unrealized appreciation of investments | | | 47,251 | |
| Net assets | | $ | 353,627 | |
| | | | | |
| Shares authorized | | | 27,000,000 | |
| Par value | | $ | 0.0001 | |
| Class A: Net asset value per share/Maximum offering price per share | | | $34.64/$36.66 | |
| Shares outstanding | | | 4,657 | |
| Net assets | | $ | 161,298 | |
| Class B: Net asset value per share | | $ | 29.55 | |
| Shares outstanding | | | 195 | |
| Net assets | | $ | 5,766 | |
| Class C: Net asset value per share | | $ | 29.26 | |
| Shares outstanding | | | 479 | |
| Net assets | | $ | 14,025 | |
| Class I: Net asset value per share | | $ | 34.97 | |
| Shares outstanding | | | 273 | |
| Net assets | | $ | 9,556 | |
| Class R3: Net asset value per share | | $ | 34.89 | |
| Shares outstanding | | | 25 | |
| Net assets | | $ | 869 | |
| Class R4: Net asset value per share | | $ | 35.37 | |
| Shares outstanding | | | 91 | |
| Net assets | | $ | 3,201 | |
| Class R5: Net asset value per share | | $ | 35.94 | |
| Shares outstanding | | | 8 | |
| Net assets | | $ | 305 | |
| Class Y: Net asset value per share | | $ | 36.10 | |
| Shares outstanding | | | 4,393 | |
| Net assets | | $ | 158,607 | |
| | | | | |
The accompanying notes are an integral part of these financial statements.
| The Hartford SmallCap Growth Fund |
| Statement of Operations |
| For the Six-Month Period Ended April 30, 2012 (Unaudited) |
| (000’s Omitted) |
| Investment Income: | | | | |
| Dividends | | $ | 1,127 | |
| Interest | | | 2 | |
| Total investment income | | | 1,129 | |
| | | | | |
| Expenses: | | | | |
| Investment management fees | | | 1,336 | |
| Administrative services fees | | | 3 | |
| Transfer agent fees | | | 307 | |
| Distribution fees | | | | |
| Class A | | | 194 | |
| Class B | | | 32 | |
| Class C | | | 65 | |
| Class R3 | | | 2 | |
| Class R4 | | | 4 | |
| Custodian fees | | | 7 | |
| Accounting services fees | | | 26 | |
| Registration and filing fees | | | 55 | |
| Board of Directors' fees | | | 4 | |
| Audit fees | | | 6 | |
| Other expenses | | | 24 | |
| Total expenses (before waivers and fees paid indirectly) | | | 2,065 | |
| Expense waivers | | | (20 | ) |
| Transfer agent fee waivers | | | (37 | ) |
| Commission recapture | | | (4 | ) |
| Total waivers and fees paid indirectly | | | (61 | ) |
| Total expenses, net | | | 2,004 | |
| Net Investment Loss | | | (875 | ) |
| Net Realized Gain on Investments: | | | | |
| Net realized gain on investments in securities | | | 20,978 | |
| Net Realized Gain on Investments | | | 20,978 | |
| Net Changes in Unrealized Appreciation of Investments: | | | | |
| Net unrealized appreciation of investments | | | 14,496 | |
| Net Changes in Unrealized Appreciation of Investments | | | 14,496 | |
| Net Gain on Investments | | | 35,474 | |
| Net Increase in Net Assets Resulting from Operations | | $ | 34,599 | |
The accompanying notes are an integral part of these financial statements.
| The Hartford SmallCap Growth Fund |
| Statement of Changes in Net Assets |
| |
| (000’s Omitted) |
| | | For the Six-Month
Period Ended
April 30, 2012
(Unaudited) | | For the
Year Ended
October 31, 2011 |
| Operations: | | | | | | | | |
| Net investment loss | | $ | (875 | ) | | $ | (1,731 | ) |
| Net realized gain on investments | | | 20,978 | | | | 39,667 | |
| Net unrealized appreciation (depreciation) of investments | | | 14,496 | | | | (899 | ) |
| Net Increase In Net Assets Resulting From Operations | | | 34,599 | | | | 37,037 | |
| Capital Share Transactions: | | | | | | | | |
| Class A | | | (8,714 | ) | | | 114,058 | |
| Class B | | | (1,893 | ) | | | (2,430 | ) |
| Class C | | | 474 | | | | (180 | ) |
| Class I | | | (733 | ) | | | 3,345 | |
| Class L* | | | — | | | | (122,076 | ) |
| Class R3 | | | 33 | | | | 378 | |
| Class R4 | | | (191 | ) | | | (119 | ) |
| Class R5 | | | 49 | | | | 75 | |
| Class Y | | | 8,528 | | | | 26,308 | |
| Net increase (decrease) from capital share transactions | | | (2,447 | ) | | | 19,359 | |
| Net Increase In Net Assets | | | 32,152 | | | | 56,396 | |
| Net Assets: | | | | | | | | |
| Beginning of period | | | 321,475 | | | | 265,079 | |
| End of period | | $ | 353,627 | | | $ | 321,475 | |
| Undistributed (distribution in excess of) net investment income (loss) | | $ | (875 | ) | | $ | — | |
* Class L merged into Class A on August 5, 2011. Please refer to the Notes to Financial Statements for further details.
The accompanying notes are an integral part of these financial statements.
| The Hartford SmallCap Growth Fund |
| Notes to Financial Statements |
| April 30, 2012 (Unaudited) |
| (000’s Omitted) |
The Hartford Mutual Funds II, Inc. (“Company”) is an open-end management investment company comprised of five portfolios. Financial statements for The Hartford SmallCap Growth Fund (the “Fund”), a series of the Company, are included in this report.
The Company is organized under the laws of the State of Maryland and is registered with the Securities and Exchange Commission (“SEC”) under the Investment Company Act of 1940, as amended (“1940 Act”). The Fund is a diversified open-end management investment company.
Class A shares are sold with a front-end sales charge of up to 5.50%. Class B shares were sold with a contingent deferred sales charge which is assessed on the lesser of the per share net asset value (“NAV”) of the shares at the time of redemption or the original purchase price, and declines from up to 5.00% to zero depending on the period of time the shares are held (see note below regarding the closing of Class B shares). Class C shares are sold with a contingent deferred sales charge of up to 1.00% on shares redeemed within twelve months of purchase. Class I shares are sold without sales charges to certain eligible investors primarily through advisory fee-based wrap programs. Class R3, R4 and R5 shares, which are offered to employer-sponsored retirement plans, and Class Y shares, which are sold to certain eligible institutional investors, are sold without a sales charge. All classes of shares have identical voting, redemption, dividend, liquidation and other rights and the same terms and conditions, with the exceptions that each class may have different expenses, which may affect performance, and that Class B shares automatically convert to Class A shares after 8 years.
No new or additional investments are allowed in Class B shares of The Hartford Mutual Funds (including investments through any systematic investment plan). Existing shareholders of Class B shares may continue to hold their Class B shares, exchange their Class B shares for Class B shares of another Hartford Mutual Fund (as permitted by existing exchange privileges), or redeem their Class B shares as described in the Fund’s prospectus. Reinstatement privileges with respect to Class B shares will continue under the current policy. For investors electing to reinvest capital gains and dividends, any such capital gains or dividends on Class B shares will continue to be reinvested in Class B shares of the Fund. All Class B share attributes, including the 12b-1 fee, contingent deferred sales charge schedule, and conversion to Class A shares, remain unchanged.
| 2. | Significant Accounting Policies: |
The following is a summary of significant accounting policies of the Fund in the preparation of its financial statements, which are in accordance with the United States Generally Accepted Accounting Principles (“U.S. GAAP”). The preparation of financial statements in accordance with U.S. GAAP may require management to make estimates and assumptions that affect the reported amounts of assets and liabilities and disclosure of contingent assets and liabilities at the date of the financial statements and the reported amounts of increases and decreases in net assets from operations during the reporting period. Actual results could differ from those estimates.
| a) | Determination of Net Asset Value – The NAV of each class of the Fund’s shares is determined as of the close of regular trading (normally 4:00 p.m. Eastern Time) (the “NYSE Close”) on each day that the New York Stock Exchange (the “Exchange”) is open (“Valuation Date”). Information that becomes known to the Fund after the NAV has been calculated on a particular day will not generally be used to retroactively adjust the NAV determined earlier that day. |
| b) | Investment Valuation and Fair Value Measurements – For purposes of calculating the NAV, portfolio investments and other assets held by the Fund's portfolio for which market quotes are readily available are valued at market value. Market value is generally determined on the basis of last reported sales prices or official close price. If no sales are reported, market value is based on quotes obtained from a quotation reporting system, established market makers, or independent |
| | pricing services. If market prices are not readily available or are deemed unreliable, the Fund will use the fair value of the investment as determined in good faith under policies and procedures established by and under the supervision of the Company’s Board of Directors. Market quotes are considered not readily available where there is an absence of current or reliable market-based data (e.g., trade information or broker quotes), including where events occur after the close of the relevant market, but prior to the NYSE Close that materially affect the values of the Fund’s portfolio investments or assets. In addition, market quotes are considered not readily available when, due to extraordinary circumstances, the exchanges or markets on which the investments trade do not open for trading for the entire day and no other market prices are available. In addition, prices of foreign equities that are principally traded on certain foreign markets are adjusted daily pursuant to a fair value pricing service approved by the Board of Directors in order to reflect an adjustment for the factors occurring after the close of certain foreign markets but before the NYSE Close. Investments that are primarily traded on foreign markets may trade on days that are not business days of the Fund. The value of the foreign investments in which the Fund invests may change on days when a shareholder will not be able to purchase or redeem shares of the Fund. Fair value pricing is subjective in nature and the use of fair value pricing by the Fund may cause the NAV of its shares to differ significantly from the NAV that would have been calculated using market prices at the close of the exchange on which a portfolio investment is primarily traded. There can be no assurance that the Fund could obtain the fair market value assigned to an investment if the Fund were to sell the investment at approximately the time at which the Fund determines its NAV. |
Investments in open-end mutual funds are valued at the respective NAV of each open-end mutual fund on the Valuation Date.
Financial instruments for which prices are not available from an independent pricing service may be valued using market quotations obtained from one or more dealers that make markets in the respective financial instrument in accordance with procedures established by the Company’s Board of Directors.
U.S. GAAP defines fair value as the price that the Fund would receive to sell an asset or pay to transfer a liability in an orderly transaction between market participants. The U.S. GAAP fair value measurement standards require disclosure of a fair value hierarchy for each major category of assets and liabilities. Various inputs are used in determining the fair value of the Fund’s investments. These inputs are summarized into three broad hierarchy levels. This hierarchy is based on whether the valuation inputs are observable or unobservable. These levels are:
| · | Level 1 – Quoted prices in active markets for identical investments. Level 1 may include exchange traded instruments, such as domestic equities, some foreign equities, options, futures, mutual funds, exchange traded funds, rights and warrants. |
| · | Level 2 – Observable inputs other than Level 1 prices, such as quoted prices for similar investments; quoted prices in markets that are not active; or other inputs that are observable or can be corroborated by observable market data. Level 2 may include debt investments that are traded less frequently than exchange traded instruments and which are valued using independent pricing services; foreign equities, which are principally traded on certain foreign markets and are adjusted daily pursuant to a fair value pricing service in order to reflect an adjustment for the factors occurring after the close of certain foreign markets but before the NYSE Close; and short-term investments, which are valued at amortized cost. |
| · | Level 3 – Significant unobservable inputs that are supported by limited or no market activity. Level 3 may include financial instruments whose values are determined using broker quotes or require significant management judgment or estimation. These unobservable valuation inputs may include estimates for current yields, maturity/duration, prepayment speed, and broker quotes for comparable investments along with other assumptions relating to credit quality, collateral value, complexity of the investment structure, general market conditions and liquidity. This category may include investments where trading has been halted or there are certain restrictions on trading. While these investments are priced using unobservable inputs, the valuation of these investments reflects the best available data and management believes the prices are a reasonable representation of exit price. |
| The Hartford SmallCap Growth Fund |
| Notes to Financial Statements - (continued) |
| April 30, 2012 (Unaudited) |
| (000’s Omitted) |
Valuation levels are not necessarily indicative of the risk associated with investing in such investments. Individual investments within any of the above mentioned asset classes may be assigned a different hierarchical level than those presented above, as individual circumstances dictate.
During the six-month period ended April 30, 2012, the Fund held no Level 3 investments; therefore, no reconciliation of Level 3 investments is presented.
For additional information, refer to the Investment Valuation Hierarchy Level Summary which follows the Schedule of Investments.
For purposes of reporting transfers between different hierarchy levels, both transfers in and out of each level, as applicable, are shown as if they occurred at the beginning of the period.
| c) | Investment Transactions and Investment Income – Investment transactions are recorded as of the trade date (the date the order to buy or sell is executed) for financial reporting purposes. Investments purchased or sold on a when-issued or delayed-delivery basis may be settled a month or more after the trade date. Realized gains and losses are determined on the basis of identified cost. |
Dividend income is accrued as of the ex-dividend date, except certain dividends from foreign investments where the ex-dividend date may have passed are recorded as soon as the Fund is informed of the dividend. Interest income, including amortization of premium and accretion of discounts, is accrued on a daily basis.
| d) | Joint Trading Account – The Fund may invest cash balances into a joint trading account that may be invested in one or more repurchase agreements. |
| e) | Fund Share Valuation and Dividend Distributions to Shareholders – Orders for the Fund’s shares are executed in accordance with the investment instructions of the shareholders. The NAV of the Fund’s shares is determined as of the close of business on each business day of the Exchange. The NAV is determined separately for each class of shares of the Fund by dividing the Fund’s net assets attributable to that class by the number of shares of the class outstanding. Each class of shares offered by the Fund has equal rights as to assets and voting privileges (except that shareholders of a class have exclusive voting rights regarding any matter relating solely to that class of shares). Income and non-class specific expenses are allocated daily to each class on the basis of the relative net assets of the class. Realized and unrealized capital gains and losses are allocated daily based on the relative net assets of each class of shares of the Fund. |
Orders for the purchase of the Fund’s shares received prior to the close of the Exchange on any day the Exchange is open for business are priced at the NAV determined as of the close of the Exchange. Orders received after the close of the Exchange, or on a day on which the Exchange and/or the Fund is not open for business, are priced at the next determined NAV.
Dividends are declared pursuant to a policy adopted by the Company’s Board of Directors based upon the investment performance of the Fund. The policy of the Fund is to pay dividends from net investment income and realized capital gains, if any, at least once a year.
Distributions from net investment income, net realized capital gains and capital are determined in accordance with federal income tax regulations, which may differ from U.S. GAAP with respect to character and timing. These differences may include but are not limited to losses deferred due to wash sale adjustments, foreign currency gains and losses, adjustments related to Passive Foreign Investment Companies (“PFICs”), Real Estate Investment Trusts (“REITs”), Regulated Investment Companies (“RICs”), certain derivatives and partnerships. Permanent book and federal
income tax basis differences relating to shareholder distributions will result in reclassifications to certain of the Fund’s capital accounts (see Federal Income Taxes: Reclassification of Capital Accounts note).
3. Securities and Other Investments:
| a) | Repurchase Agreements – A repurchase agreement is an agreement by which a counterparty agrees to sell an investment and agrees to repurchase the investment sold at a mutually agreed upon time and price. At the time the Fund enters into a repurchase agreement, the value of the underlying collateral, including accrued interest, will be equal to or exceed the value of the repurchase agreement. Repurchase agreements expose the Fund to counterparty risk. To minimize counterparty risk, the investments that serve to collateralize the repurchase agreement are held by the Fund’s custodian in book entry or physical form in the custodial account of the Fund or in a third party custodial account. Repurchase agreements are valued at cost plus accrued interest. The Fund, as shown on the Schedule of Investments, had outstanding repurchase agreements as of April 30, 2012. |
4. Principal Risks:
| a) | Counterparty Risk – The Fund may be exposed to counterparty risk, or the risk that an institution or other entity with which the Fund has unsettled or open transactions will default. |
| b) | Market Risks – The market values of equity securities, such as common stocks and preferred stocks, or equity related investments, such as futures and options, may decline due to general market conditions which are not specifically related to a particular company, such as real or perceived adverse economic conditions, changes in the general outlook for corporate earnings, changes in interest or currency rates or adverse investor sentiment generally. The market value of equity securities may also decline due to factors which affect a particular industry or industries, such as labor shortages or increased production costs and competitive conditions within an industry. Equity securities and equity related investments generally have greater market price volatility than fixed income securities. |
5. Federal Income Taxes:
| a) | Federal Income Taxes – For federal income tax purposes, the Fund intends to continue to qualify as a RIC under Subchapter M of the Internal Revenue Code (“IRC”) by distributing substantially all of its taxable net investment income and net realized capital gains to its shareholders and otherwise complying with the requirements of RICs. The Fund has distributed substantially all of its income and capital gains in prior years, if applicable, and intends to distribute substantially all of its income and capital gains during the calendar year ending December 31, 2012. Accordingly, no provision for federal income or excise taxes has been made in the accompanying financial statements. Distributions from short-term capital gains are treated as ordinary income distributions for federal income tax purposes. |
| b) | Net Investment Income (Loss), Net Realized Gains (Losses) – Net investment income (loss) and net realized gains (losses) may differ for financial statement and tax purposes primarily because of losses deferred due to wash sale adjustments, foreign currency gains and losses, adjustments related to PFICs, REITs, RICs, certain derivatives and partnerships. The character of distributions made during the year from net investment income or net realized gains may differ from their ultimate characterization for federal income tax purposes. Also, due to the timing of dividend distributions, the fiscal year in which amounts are distributed may differ from the year that the income or realized gains (losses) were recorded by the Fund. |
| The Hartford SmallCap Growth Fund |
| Notes to Financial Statements - (continued) |
| April 30, 2012 (Unaudited) |
| (000’s Omitted) |
| c) | Components of Distributable Earnings – The Fund’s components of distributable earnings (deficit) on a tax basis at October 31, 2011, are as follows: |
| | | Amount | |
| Accumulated Capital Losses * | | $ | (39,333 | ) |
| Unrealized Appreciation † | | | 31,349 | |
| Total Accumulated Deficit | | $ | (7,984 | ) |
| | * | The Fund has capital loss carryforwards that are identified in the Capital Loss Carryforward note that follows. |
| | † | The differences between book-basis and tax-basis unrealized appreciation (depreciation) may be attributable to the losses deferred due to wash sale adjustments, foreign currency gains and losses, adjustments related to PFICs, REITs, RICs, certain derivatives and partnerships. |
| d) | Reclassification of Capital Accounts – The Fund may record reclassifications in its capital accounts. These reclassifications have no impact on the total net assets of the Fund. The reclassifications are a result of permanent differences between U.S. GAAP and tax accounting for such items as foreign currency, PFICs, expiration or utilization of capital loss carryforwards or net operating losses. Adjustments are made to reflect the impact these items have on current and future distributions to shareholders. Therefore, the source of the Fund’s distributions may be shown in the accompanying Statement of Changes in Net Assets as from undistributed net investment income, from accumulated net realized gains on investments or from capital depending on the type of book and tax differences that exist. For the year ended October 31, 2011, the Fund recorded reclassifications to increase (decrease) the accounts listed below: |
| | | Amount | |
| Undistributed Net Investment Income | | $ | 1,731 | |
| Accumulated Net Realized Gain (Loss) | | | 137 | |
| Capital Stock and Paid-in-Capital | | | (1,868 | ) |
| e) | Capital Loss Carryforward – On December 22, 2010, the Regulated Investment Company Modernization Act of 2010 (the “Act”) was enacted, which made changes to the capital loss carryforward rules. The changes are effective for taxable years beginning after the date of enactment. Under the Act, funds are permitted to carry forward capital losses for an unlimited period. However, any losses incurred during those future taxable years will be required to be utilized prior to the losses incurred in pre-enactment taxable years, which carry an expiration date. As a result of this ordering rule, pre-enactment capital loss carryforwards may be more likely to expire unused. Additionally, post-enactment capital loss carryforwards retain their character as either short-term or long-term capital losses rather than being considered all short-term as permitted under prior regulation. |
At October 31, 2011 (tax-year-end), the Fund had capital loss carryforwards for U.S. federal income tax purposes as follows:
| Year of Expiration | | Amount | |
| 2017 | | $ | 39,333 | |
| Total | | $ | 39,333 | |
During the year ended October 31, 2011, the Fund utilized $39,833 of prior year capital loss carryforwards.
| f) | Accounting for Uncertainty in Income Taxes – The Fund has adopted financial reporting rules that require the Fund to analyze all open tax years, as defined by the statute of limitations, for all major jurisdictions. Generally, tax authorities can examine all tax returns filed for the last three years. The Fund does not have an examination in progress. |
The Fund has reviewed all open tax years and major jurisdictions and concluded that these financial reporting rules had no effect on the Fund’s financial position or results of operations. There is no tax liability resulting from unrecognized tax benefits relating to uncertain income tax positions taken or expected to be taken on the tax return for the fiscal year ended October 31, 2011. The Fund is also not aware of any tax positions for which it is reasonably possible that the total amounts of unrecognized tax benefits will significantly change in the next twelve months.
6. Expenses:
| a) | Investment Management Agreement – Hartford Investment Financial Services, LLC (“HIFSCO”), a wholly-owned indirect subsidiary of The Hartford Financial Services Group, Inc. (“The Hartford”), serves as investment manager to the Fund pursuant to an Investment Management Agreement with the Company. As investment manager, HIFSCO has overall investment supervisory responsibility for the Fund. In addition, HIFSCO provides administrative personnel, services, equipment, facilities and office space for proper operation of the Fund. HIFSCO has contracted with Wellington Management Company, LLP (“Wellington Management”) under a sub-advisory agreement for the provision of day-to-day investment management services to the Fund in accordance with the Fund’s investment objective and policies. The Fund pays a fee to HIFSCO, a portion of which may be used to compensate Wellington Management. |
The schedule below reflects the rates of compensation paid to HIFSCO for investment management services rendered as of April 30, 2012; the rates are accrued daily and paid monthly:
| Average Daily Net Assets | | Annual Fee | |
| On first $100 million | | | 0.90 | % |
| On next $150 million | | | 0.80 | % |
| On next $250 million | | | 0.70 | % |
| On next $4.5 billion | | | 0.65 | % |
| On next $5 billion | | | 0.63 | % |
| Over $10 billion | | | 0.62 | % |
| b) | Accounting Services Agreement – Pursuant to the Fund Accounting Agreement between Hartford Life Insurance Company (“HLIC”) and the Company, on behalf of the Fund, HLIC provides accounting services to the Fund and receives monthly compensation based on the Fund’s average net assets at the rates set forth below. The Fund’s accounting services fees are accrued daily and paid monthly. |
| Average Daily Net Assets | | Annual Fee | |
| On first $5 billion | | | 0.016 | % |
| On next $5 billion | | | 0.014 | % |
| Over $10 billion | | | 0.012 | % |
| c) | Operating Expenses – Allocable expenses incurred by the Company are allocated to each Fund and allocated to classes within the Fund in proportion to the average daily net assets of the Fund and each class, except where allocation of certain expenses is more fairly made directly to the Fund or to specific classes within a Fund. As of April 30, 2012, HIFSCO contractually limited the total operating expenses of this Fund, exclusive of taxes, interest expense, brokerage commissions, acquired fund fees and expenses and extraordinary expenses as follows: |
| Class A | | | Class B | | | Class C | | | Class I | | | Class R3 | | | Class R4 | | | Class R5 | | | Class Y | |
| | 1.40 | % | | | 2.15 | % | | | 2.15 | % | | | 1.15 | % | | | 1.60 | % | | | 1.30 | % | | | 1.00 | % | | | 0.95 | % |
| d) | Fees Paid Indirectly – The Fund has entered into agreements with State Street Global Markets, LLC and Russell Implementation Services Inc. to partially recapture non-discounted trade commissions. Such rebates are used to pay a |
| The Hartford SmallCap Growth Fund |
| Notes to Financial Statements - (continued) |
| April 30, 2012 (Unaudited) |
| (000’s Omitted) |
portion of the Fund’s expenses. In addition, the Fund’s custodian bank, State Street Bank and Trust Co., has also agreed to reduce its fees when the Fund maintains cash on deposit in a non-interest-bearing custody account. For the six-month period ended April 30, 2012, these amounts, if any, are included in the Statement of Operations.
The ratio of expenses to average net assets in the accompanying financial highlights excludes the reduction in expenses related to fees paid indirectly. The annualized expense ratio for the period listed below reflecting the reduction for fees paid indirectly is as follows:
| | | Annualized Six-
Month Period
Ended
April 30, 2012 | |
| Class A | | | 1.40 | % |
| Class B | | | 2.15 | |
| Class C | | | 2.15 | |
| Class I | | | 1.10 | |
| Class R3 | | | 1.60 | |
| Class R4 | | | 1.29 | |
| Class R5 | | | 1.00 | |
| Class Y | | | 0.88 | |
| e) | Distribution and Service Plan for Class A, B, C, R3 and R4 Shares – HIFSCO is the principal underwriter and distributor of the Fund. HIFSCO is engaged in distribution activities, which include marketing and distribution of shares through broker-dealers, financing distribution costs and maintaining financial books and records. For the six-month period ended April 30, 2012, HIFSCO received front-end load sales charges of $90 and contingent deferred sales charges of $5 from the Fund. |
The Fund has adopted a Distribution and Service Plan in accordance with Rule 12b-1 of the 1940 Act to compensate the distributor (HIFSCO) for activities intended to result in the sale and distribution of Class A, B, C, R3 and R4 shares and for providing services for shareholders. The Rule 12b-1 plan applicable to Class A shares of the Fund provides for payment of a Rule 12b-1 fee of 0.25% of average daily net assets. Some or all of the fee may be used for shareholder servicing expenses with the remainder used for distribution expenses. Some or the entire Rule 12b-1 fee for Class B shares may be remitted to broker-dealers for distribution and/or shareholder account services. Under the Class B Plan, the Fund pays the distributor 1.00% of the average daily net assets of Class B shares that are outstanding for 8 years or less, 0.25% of which is a fee for services provided to existing shareholders with the remainder used for distribution expenses. After eight years, Class B shares convert to Class A shares. Upon conversion to Class A shares, the Class A plan described above will apply to those shares. Under the Class C Plan, the Fund pays the distributor 1.00% of the average daily net assets of Class C shares outstanding, 0.25% of which is intended as a fee for services provided to existing shareholders with the remainder used for distribution expenses. For Class C shares, some or the entire fee may be remitted to broker-dealers for distribution and/or shareholder account services. Class R3 shares have a distribution fee of 0.50% of average daily net assets and Class R4 shares have a distribution fee of 0.25% of average daily net assets. For Class R3 and R4 shares, some or the entire fee may be remitted to broker dealers for distribution and/or shareholder account services. The Fund’s 12b-1 fees are accrued daily and paid monthly.
For the six-month period ended April 30, 2012, total sales commissions paid to affiliated brokers/dealers of The Hartford for distributing the Fund's shares were $17. These commissions are in turn paid to sales representatives of the broker/dealers.
| f) | Other Related Party Transactions – Certain officers of the Fund are directors and/or officers of HIFSCO and/or The Hartford or its subsidiaries. For the six-month period ended April 30, 2012, a portion of the Fund’s chief compliance officer’s compensation was paid by all of the investment companies in the Hartford fund complex. The portion allocated |
to the Fund rounds to zero. Hartford Administrative Services Company (“HASCO”), an indirect wholly-owned subsidiary of The Hartford, provides transfer agent services to the Fund. HASCO has contractually agreed to reimburse any portion of the transfer agency fees over 0.30% of average daily net assets per fiscal year for each class. For providing such services, HASCO is compensated on a per account basis that varies by account type, except with respect to Class Y, for which it is compensated based on average daily net assets. The amount paid to HASCO and any related contractual reimbursement amounts, if applicable, can be found in the Statement of Operations. These fees are accrued daily and paid monthly.
Administrative services fees are paid to HASCO for third-party recordkeeping services that are payable as a percentage of net assets in the amount of 0.20%, 0.15% and 0.10% for Classes R3, R4 and R5 shares, respectively. The total administrative services fees are shown on the Statement of Operations. These fees are accrued daily and paid monthly.
| g) | Payment from Affiliates – On July 28, 2010, the Fund was reimbursed by HASCO $242 relating to a trading error. |
On November 8, 2006, the SEC issued an order setting forth the terms of a settlement reached with three subsidiaries of The Hartford that resolved the SEC’s Division of Enforcement’s investigation of aspects of The Hartford’s variable annuity and mutual fund operations related to directed brokerage and revenue sharing. The Hartford settled this matter without admitting or denying the findings of the SEC.
The total return in the accompanying financial highlights includes a payment from affiliate. Had the payment from affiliate been excluded, the impact and total return for the periods listed below would have been as follows:
| | | Impact from
Payment from
Affiliate for trading
error for the
Year Ended
October 31, 2010 | | | Total Return
Excluding Payment
from Affiliate for the
Year Ended
October 31, 2010 | | | Impact from
Payment from
Affiliate for SEC
Settlement for the
Year Ended
October 31, 2007 | | | Total Return
Excluding Payment
from Affiliate for the
Year Ended
October 31, 2007 | |
| Class A | | | 0.14 | % | | | 34.77 | % | | | 0.01 | % | | | 7.17 | % |
| Class B | | | 0.16 | | | | 33.70 | | | | 0.01 | | | | 6.43 | |
| Class C | | | 0.16 | | | | 33.76 | | | | 0.01 | | | | 6.33 | |
| Class I | | | 0.14 | | | | 35.13 | | | | 0.01 | | | | 7.36 | |
| Class L | | | 0.14 | | | | 35.07 | | | | 0.01 | | | | 7.40 | |
| Class Y | | | 0.14 | | | | 35.38 | | | | 0.01 | | | | 7.60 | |
| Class R3 | | | 0.14 | | | | 34.43 | | | | NA | | | | NA | |
| Class R4 | | | 0.14 | | | | 34.84 | | | | NA | | | | NA | |
| Class R5 | | | 0.14 | | | | 35.25 | | | | NA | | | | NA | |
7. Affiliate Holdings:
As of April 30, 2012, affiliates of The Hartford had ownership of shares in the Fund as follows:
| | | Shares | | | Percentage
of Class | |
| Class R5 | | | 4 | | | | 50 | % |
| The Hartford SmallCap Growth Fund |
| Notes to Financial Statements - (continued) |
| April 30, 2012 (Unaudited) |
| (000’s Omitted) |
8. Investment Transactions:
For the six-month period ended April 30, 2012, the Fund's aggregate purchases and sales of investment securities (excluding short-term investments) were as follows:
| | | Amount | |
| Cost of Purchases Excluding U.S. Government Obligations | | $ | 125,849 | |
| Sales Proceeds Excluding U.S. Government Obligations | | | 127,197 | |
9. Capital Share Transactions:
The following information is for the six-month period ended April 30, 2012, and the year ended October 31, 2011:
| | | For the Six-Month Period Ended April 30, 2012 | | | For the Year Ended October 31, 2011 | |
| | | Shares
Sold | | | Shares
Issued for
Reinvested
Dividends | | | Shares
Redeemed | | | Shares
Issued
from
Merger | | | Net Increase
(Decrease) of
Shares | | | Shares
Sold | | | Shares
Issued for
Reinvested
Dividends | | | Shares
Redeemed | | | Shares
Issued from
Merger | | | Net Increase
(Decrease) of
Shares | |
| Class A | | | | | | | | | | | | | | | | | | | | | | | | | | | | | | | | | | | | | | | | |
| Shares | | | 315 | | | | — | | | | (593 | ) | | | — | | | | (278 | ) | | | 761 | | | | — | | | | (740 | ) | | | 2,973 | | | | 2,994 | |
| Amount | | $ | 10,498 | | | $ | — | | | $ | (19,212 | ) | | $ | — | | | $ | (8,714 | ) | | $ | 23,715 | | | $ | — | | | $ | (22,980 | ) | | $ | 113,323 | | | $ | 114,058 | |
| Class B | | | | | | | | | | | | | | | | | | | | | | | | | | | | | | | | | | | | | | | | |
| Shares | | | 6 | | | | — | | | | (73 | ) | | | — | | | | (67 | ) | | | 32 | | | | — | | | | (123 | ) | | | — | | | | (91 | ) |
| Amount | | $ | 182 | | | $ | — | | | $ | (2,075 | ) | | $ | — | | | $ | (1,893 | ) | | $ | 865 | | | $ | — | | | $ | (3,295 | ) | | $ | — | | | $ | (2,430 | ) |
| Class C | | | | | | | | | | | | | | | | | | | | | | | | | | | | | | | | | | | | | | | | |
| Shares | | | 48 | | | | — | | | | (32 | ) | | | — | | | | 16 | | | | 103 | | | | — | | | | (110 | ) | | | — | | | | (7 | ) |
| Amount | | $ | 1,373 | | | $ | — | | | $ | (899 | ) | | $ | — | | | $ | 474 | | | $ | 2,765 | | | $ | — | | | $ | (2,945 | ) | | $ | — | | | $ | (180 | ) |
| Class I | | | | | | | | | | | | | | | | | | | | | | | | | | | | | | | | | | | | | | | | |
| Shares | | | 64 | | | | — | | | | (86 | ) | | | — | | | | (22 | ) | | | 179 | | | | — | | | | (78 | ) | | | — | | | | 101 | |
| Amount | | $ | 2,113 | | | $ | — | | | $ | (2,846 | ) | | $ | — | | | $ | (733 | ) | | $ | 5,814 | | | $ | — | | | $ | (2,469 | ) | | $ | — | | | $ | 3,345 | |
| Class L | | | | | | | | | | | | | | | | | | | | | | | | | | | | | | | | | | | | | | | | |
| Shares | | | — | | | | — | | | | — | | | | — | | | | — | | | | 68 | | | | — | | | | (335 | ) | | | (2,950 | ) | | | (3,217 | ) |
| Amount | | $ | — | | | $ | — | | | $ | — | | | $ | — | | | $ | — | | | $ | 2,220 | | | $ | — | | | $ | (10,973 | ) | | $ | (113,323 | ) | | $ | (122,076 | ) |
| Class R3 | | | | | | | | | | | | | | | | | | | | | | | | | | | | | | | | | | | | | | | | |
| Shares | | | 6 | | | | — | | | | (5 | ) | | | — | | | | 1 | | | | 16 | | | | — | | | | (5 | ) | | | — | | | | 11 | |
| Amount | | $ | 198 | | | $ | — | | | $ | (165 | ) | | $ | — | | | $ | 33 | | | $ | 533 | | | $ | — | | | $ | (155 | ) | | $ | — | | | $ | 378 | |
| Class R4 | | | | | | | | | | | | | | | | | | | | | | | | | | | | | | | | | | | | | | | | |
| Shares | | | 20 | | | | — | | | | (25 | ) | | | — | | | | (5 | ) | | | 25 | | | | — | | | | (30 | ) | | | — | | | | (5 | ) |
| Amount | | $ | 672 | | | $ | — | | | $ | (863 | ) | | $ | — | | | $ | (191 | ) | | $ | 836 | | | $ | — | | | $ | (955 | ) | | $ | — | | | $ | (119 | ) |
| Class R5 | | | | | | | | | | | | | | | | | | | | | | | | | | | | | | | | | | | | | | | | |
| Shares | | | 1 | | | | — | | | | — | | | | — | | | | 1 | | | | 2 | | | | — | | | | — | | | | — | | | | 2 | |
| Amount | | $ | 51 | | | $ | — | | | $ | (2 | ) | | $ | — | | | $ | 49 | | | $ | 82 | | | $ | — | | | $ | (7 | ) | | $ | — | | | $ | 75 | |
| Class Y | | | | | | | | | | | | | | | | | | | | | | | | | | | | | | | | | | | | | | | | |
| Shares | | | 604 | | | | — | | | | (349 | ) | | | — | | | | 255 | | | | 1,658 | | | | — | | | | (810 | ) | | | — | | | | 848 | |
| Amount | | $ | 20,550 | | | $ | — | | | $ | (12,022 | ) | | $ | — | | | $ | 8,528 | | | $ | 52,827 | | | $ | — | | | $ | (26,519 | ) | | $ | — | | | $ | 26,308 | |
| Total | | | | | | | | | | | | | | | | | | | | | | | | | | | | | | | | | | | | | | | | |
| Shares | | | 1,064 | | | | — | | | | (1,163 | ) | | | — | | | | (99 | ) | | | 2,844 | | | | — | | | | (2,231 | ) | | | 23 | | | | 636 | |
| Amount | | $ | 35,637 | | | $ | — | | | $ | (38,084 | ) | | $ | — | | | $ | (2,447 | ) | | $ | 89,657 | | | $ | — | | | $ | (70,298 | ) | | $ | — | | | $ | 19,359 | |
The following reflects the conversion of Class B shares into Class A shares (reflected as Class A shares sold) for the six-month period ended April 30, 2012, and the year ended October 31, 2011:
| | | Shares | | | Dollars | |
| For the Six-Month Period Ended April 30, 2012 | | | 26 | | | $ | 877 | |
| For the Year Ended October 31, 2011 | | | 29 | | | $ | 890 | |
10. Line of Credit:
The Fund is one of several Hartford funds that participate in a $500 million committed revolving line of credit facility. The facility is to be used for temporary or emergency purposes. Under the arrangement, the funds are required to own securities having a market value in excess of 300% of the total bank borrowings. The interest rate on borrowings varies depending on the nature of the loan. The facility also requires a fee to be paid based on the amount of the commitment. This commitment fee is allocated to all of the funds participating in the line of credit based on the average net assets of the funds. During the six-month period ended April 30, 2012, the Fund did not have any borrowings under this facility.
11. Class Merger:
At its May 3, 2011, meeting, the Board of Directors of The Hartford Mutual Funds II, Inc. approved the reclassification of Class L shares into Class A shares of the Fund.
Effective with the close of business on August 5, 2011, Class L was merged into Class A. The merger was accomplished by a tax-free exchange as detailed below:
| | | Class A | | | Class L | |
| Shares exchanged | | | N/A | | | | 2,950 | |
| Shares issued - to Class L shareholders | | | 2,973 | | | | N/A | |
| Net assets immediately before merger | | $ | 57,547 | | | $ | 88,480 | |
| Net assets immediately after merger | | $ | 146,027 | | | | N/A | |
12. Industry Classifications:
Other than the industry classifications “Other Investment Pools and Funds” and “Exchange Traded Funds,” equity industry classifications used in this report are the Global Industry Classification Standard, which was developed by and is the exclusive property and service mark of MSCI, Inc. and Standard & Poor’s.
13. Pending Legal Proceedings:
On February 25, 2011, Jennifer L. Kasilag, Louis Mellinger, Judith M. Menendez, Jacqueline M. Robinson, and Linda A. Russell filed a derivative lawsuit against HIFSCO on behalf of six funds: The Hartford Global Health Fund (now known as The Hartford Healthcare Fund), The Hartford Conservative Allocation Fund, The Hartford Growth Opportunities Fund, The Hartford Inflation Plus Fund, The Hartford Advisers Fund (now known as The Hartford Balanced Fund) and The Hartford Money Market Fund. The lawsuit, which was filed in the United States District Court for the District of New Jersey, seeks recovery under Section 36(b) of the 1940 Act for the alleged overpayment of investment management and 12b-1 distribution fees to HIFSCO. The plaintiffs seek recovery of the alleged overpayments or, alternatively, rescission of the contracts and restitution of all fees paid, together with lost earnings. On November 14, 2011, the plaintiffs filed an amended complaint, which dropped The Hartford Money Market Fund and added The Hartford Capital Appreciation Fund as a plaintiff. The Hartford intends to vigorously defend the action.
No accrual for litigation relating to this matter has been recorded in the financial statements of the Fund because the Fund is not party to the suit.
14. Indemnifications:
Under the Company’s organizational documents, the Company shall indemnify its officers and directors to the full extent required or permitted under Maryland General Corporation Law and the federal securities laws. In addition, the Company, on behalf of the Fund, may enter into contracts that contain a variety of indemnifications. The Company’s maximum exposure under these arrangements is unknown. However, as of the date of these financial statements, the Company has not had prior claims or losses pursuant to these contracts and expects the risk of loss to be remote.
| The Hartford SmallCap Growth Fund |
| Financial Highlights |
| - Selected Per-Share Data (A) - |
| Class | | | Net Asset
Value at
Beginning of
Period | | | Net Investment
Income (Loss) | | | Payments from
(to) Affiliate | | | Net Realized
and Unrealized
Gain (Loss) on
Investments | | | Total from
Investment
Operations | | | Dividends from
Net Investment
Income | | | Distributions
from Realized
Capital Gains | | | Distributions
from Capital | | | Total
Distributions | | | Net Increase
(Decrease) in
Net Asset
Value | | | Net Asset
Value at End
of Period | |
| | | | | | | | | | | | | | | | | | | | | | | | | | | | | | | | | | | |
| For the Six-Month Period Ended April 30, 2012 (Unaudited) | |
| | A | | | $ | 31.27 | | | $ | (0.12 | ) | | $ | – | | | $ | 3.49 | | | $ | 3.37 | | | $ | – | | | $ | – | | | $ | – | | | $ | – | | | $ | 3.37 | | | $ | 34.64 | |
| | B | | | | 26.77 | | | | (0.24 | ) | | | – | | | | 3.02 | | | | 2.78 | | | | – | | | | – | | | | – | | | | – | | | | 2.78 | | | | 29.55 | |
| | C | | | | 26.51 | | | | (0.20 | ) | | | – | | | | 2.95 | | | | 2.75 | | | | – | | | | – | | | | – | | | | – | | | | 2.75 | | | | 29.26 | |
| | I | | | | 31.52 | | | | (0.07 | ) | | | – | | | | 3.52 | | | | 3.45 | | | | – | | | | – | | | | – | | | | – | | | | 3.45 | | | | 34.97 | |
| | R3 | | | | 31.53 | | | | (0.14 | ) | | | – | | | | 3.50 | | | | 3.36 | | | | – | | | | – | | | | – | | | | – | | | | 3.36 | | | | 34.89 | |
| | R4 | | | | 31.91 | | | | (0.10 | ) | | | – | | | | 3.56 | | | | 3.46 | | | | – | | | | – | | | | – | | | | – | | | | 3.46 | | | | 35.37 | |
| | R5 | | | | 32.38 | | | | (0.05 | ) | | | – | | | | 3.61 | | | | 3.56 | | | | – | | | | – | | | | – | | | | – | | | | 3.56 | | | | 35.94 | |
| | Y | | | | 32.51 | | | | (0.03 | ) | | | – | | | | 3.62 | | | | 3.59 | | | | – | | | | – | | | | – | | | | – | | | | 3.59 | | | | 36.10 | |
| | | | | | | | | | | | | | | | | | | | | | | | | | | | | | | | | | | | | | | | | | | | | | | |
| For the Year Ended October 31, 2011 (G) |
| | A(H) | | | | 27.59 | | | | (0.29 | ) | | | – | | | | 3.97 | | | | 3.68 | | | | – | | | | – | | | | – | | | | – | | | | 3.68 | | | | 31.27 | |
| | B | | | | 23.80 | | | | (0.40 | ) | | | – | | | | 3.37 | | | | 2.97 | | | | – | | | | – | | | | – | | | | – | | | | 2.97 | | | | 26.77 | |
| | C | | | | 23.57 | | | | (0.40 | ) | | | – | | | | 3.34 | | | | 2.94 | | | | – | | | | – | | | | – | | | | – | | | | 2.94 | | | | 26.51 | |
| | I | | | | 27.73 | | | | (0.14 | ) | | | – | | | | 3.93 | | | | 3.79 | | | | – | | | | – | | | | – | | | | – | | | | 3.79 | | | | 31.52 | |
| | R3 | | | | 27.87 | | | | (0.30 | ) | | | – | | | | 3.96 | | | | 3.66 | | | | – | | | | – | | | | – | | | | – | | | | 3.66 | | | | 31.53 | |
| | R4 | | | | 28.13 | | | | (0.20 | ) | | | – | | | | 3.98 | | | | 3.78 | | | | – | | | | – | | | | – | | | | – | | | | 3.78 | | | | 31.91 | |
| | R5 | | | | 28.46 | | | | (0.11 | ) | | | – | | | | 4.03 | | | | 3.92 | | | | – | | | | – | | | | – | | | | – | | | | 3.92 | | | | 32.38 | |
| | Y | | | | 28.54 | | | | (0.07 | ) | | | – | | | | 4.04 | | | | 3.97 | | | | – | | | | – | | | | – | | | | – | | | | 3.97 | | | | 32.51 | |
| | | | | | | | | | | | | | | | | | | | | | | | | | | | | | | | | | | | | | | | | | | | | | | |
| For the Year Ended October 31, 2010 (G) |
| | A | | | | 20.45 | | | | (0.15 | ) | | | 0.02 | | | | 7.27 | | | | 7.14 | | | | – | | | | – | | | | – | | | | – | | | | 7.14 | | | | 27.59 | |
| | B | | | | 17.78 | | | | (0.29 | ) | | | 0.02 | | | | 6.29 | | | | 6.02 | | | | – | | | | – | | | | – | | | | – | | | | 6.02 | | | | 23.80 | |
| | C | | | | 17.60 | | | | (0.29 | ) | | | 0.02 | | | | 6.24 | | | | 5.97 | | | | – | | | | – | | | | – | | | | – | | | | 5.97 | | | | 23.57 | |
| | I | | | | 20.50 | | | | (0.09 | ) | | | 0.02 | | | | 7.30 | | | | 7.23 | | | | – | | | | – | | | | – | | | | – | | | | 7.23 | | | | 27.73 | |
| | R3 | | | | 20.71 | | | | (0.22 | ) | | | 0.03 | | | | 7.35 | | | | 7.16 | | | | – | | | | – | | | | – | | | | – | | | | 7.16 | | | | 27.87 | |
| | R4 | | | | 20.84 | | | | (0.14 | ) | | | 0.03 | | | | 7.40 | | | | 7.29 | | | | – | | | | – | | | | – | | | | – | | | | 7.29 | | | | 28.13 | |
| | R5 | | | | 21.02 | | | | (0.06 | ) | | | 0.03 | | | | 7.47 | | | | 7.44 | | | | – | | | | – | | | | – | | | | – | | | | 7.44 | | | | 28.46 | |
| | Y | | | | 21.06 | | | | (0.04 | ) | | | 0.03 | | | | 7.49 | | | | 7.48 | | | | – | | | | – | | | | – | | | | – | | | | 7.48 | | | | 28.54 | |
| | | | | | | | | | | | | | | | | | | | | | | | | | | | | | | | | | | | | | | | | | | | | | | |
| For the Year Ended October 31, 2009 |
| | A | | | | 18.47 | | | | (0.05 | ) | | | – | | | | 2.03 | | | | 1.98 | | | | – | | | | – | | | | – | | | | – | | | | 1.98 | | | | 20.45 | |
| | B | | | | 16.13 | | | | (0.11 | ) | | | – | | | | 1.76 | | | | 1.65 | | | | – | | | | – | | | | – | | | | – | | | | 1.65 | | | | 17.78 | |
| | C | | | | 16.03 | | | | (0.17 | ) | | | – | | | | 1.74 | | | | 1.57 | | | | – | | | | – | | | | – | | | | – | | | | 1.57 | | | | 17.60 | |
| | I | | | | 18.53 | | | | (0.05 | ) | | | – | | | | 2.02 | | | | 1.97 | | | | – | | | | – | | | | – | | | | – | | | | 1.97 | | | | 20.50 | |
| | R3 | | | | 18.79 | | | | (0.11 | ) | | | – | | | | 2.03 | | | | 1.92 | | | | – | | | | – | | | | – | | | | – | | | | 1.92 | | | | 20.71 | |
| | R4 | | | | 18.88 | | | | (0.09 | ) | | | – | | | | 2.05 | | | | 1.96 | | | | – | | | | – | | | | – | | | | – | | | | 1.96 | | | | 20.84 | |
| | R5 | | | | 18.99 | | | | (0.05 | ) | | | – | | | | 2.08 | | | | 2.03 | | | | – | | | | – | | | | – | | | | – | | | | 2.03 | | | | 21.02 | |
| | Y | | | | 19.03 | | | | 0.01 | | | | – | | | | 2.02 | | | | 2.03 | | | | – | | | | – | | | | – | | | | – | | | | 2.03 | | | | 21.06 | |
| | | | | | | | | | | | | | | | | | | | | | | | | | | | | | | | | | | | | | | | | | | | | | | |
| For the Year Ended October 31, 2008 |
| | A | | | | 33.57 | | | | (0.07 | ) | | | – | | | | (11.68 | ) | | | (11.75 | ) | | | – | | | | (3.35 | ) | | | – | | | | (3.35 | ) | | | (15.10 | ) | | | 18.47 | |
| | B | | | | 29.93 | | | | (0.21 | ) | | | – | | | | (10.24 | ) | | | (10.45 | ) | | | – | | | | (3.35 | ) | | | – | | | | (3.35 | ) | | | (13.80 | ) | | | 16.13 | |
| | C | | | | 29.85 | | | | (0.29 | ) | | | – | | | | (10.18 | ) | | | (10.47 | ) | | | – | | | | (3.35 | ) | | | – | | | | (3.35 | ) | | | (13.82 | ) | | | 16.03 | |
| | I | | | | 33.64 | | | | (0.04 | ) | | | – | | | | (11.72 | ) | | | (11.76 | ) | | | – | | | | (3.35 | ) | | | – | | | | (3.35 | ) | | | (15.11 | ) | | | 18.53 | |
| | R3 | | | | 34.16 | | | | (0.12 | ) | | | – | | | | (11.90 | ) | | | (12.02 | ) | | | – | | | | (3.35 | ) | | | – | | | | (3.35 | ) | | | (15.37 | ) | | | 18.79 | |
| | R4 | | | | 34.26 | | | | (0.06 | ) | | | – | | | | (11.97 | ) | | | (12.03 | ) | | | – | | | | (3.35 | ) | | | – | | | | (3.35 | ) | | | (15.38 | ) | | | 18.88 | |
| | R5 | | | | 34.34 | | | | (0.02 | ) | | | – | | | | (11.98 | ) | | | (12.00 | ) | | | – | | | | (3.35 | ) | | | – | | | | (3.35 | ) | | | (15.35 | ) | | | 18.99 | |
| | Y | | | | 34.38 | | | | 0.02 | | | | – | | | | (12.02 | ) | | | (12.00 | ) | | | – | | | | (3.35 | ) | | | – | | | | (3.35 | ) | | | (15.35 | ) | | | 19.03 | |
| | | | | | | | | | | | | | | | | | | | | | | | | | | | | | | | | | | | | | | | | | | | | | | |
| For the Year Ended October 31, 2007 |
| | A | | | | 31.32 | | | | (0.13 | ) | | | – | | | | 2.38 | | | | 2.25 | | | | – | | | | – | | | | – | | | | – | | | | 2.25 | | | | 33.57 | |
| | B | | | | 28.12 | | | | (0.31 | ) | | | – | | | | 2.12 | | | | 1.81 | | | | – | | | | – | | | | – | | | | – | | | | 1.81 | | | | 29.93 | |
| | C | | | | 28.07 | | | | (0.35 | ) | | | – | | | | 2.13 | | | | 1.78 | | | | – | | | | – | | | | – | | | | – | | | | 1.78 | | | | 29.85 | |
| | I | | | | 31.33 | | | | (0.03 | ) | | | – | | | | 2.34 | | | | 2.31 | | | | – | | | | – | | | | – | | | | – | | | | 2.31 | | | | 33.64 | |
| | R3(J) | | | | 32.34 | | | | (0.19 | ) | | | – | | | | 2.01 | | | | 1.82 | | | | – | | | | – | | | | – | | | | – | | | | 1.82 | | | | 34.16 | |
| | R4(J) | | | | 32.34 | | | | (0.02 | ) | | | – | | | | 1.94 | | | | 1.92 | | | | – | | | | – | | | | – | | | | – | | | | 1.92 | | | | 34.26 | |
| | R5(J) | | | | 32.34 | | | | (0.01 | ) | | | – | | | | 2.01 | | | | 2.00 | | | | – | | | | – | | | | – | | | | – | | | | 2.00 | | | | 34.34 | |
| | Y | | | | 31.95 | | | | 0.02 | | | | – | | | | 2.41 | | | | 2.43 | | | | – | | | | – | | | | – | | | | – | | | | 2.43 | | | | 34.38 | |
| - Ratios and Supplemental Data - |
| Total Return(B) | | | Net Assets at End of
Period (000's) | | | Ratio of Expenses to Average Net
Assets Before Waivers and
Reimbursements and Including
Expenses not Subject to Cap(C) | | | Ratio of Expenses to Average Net
Assets After Waivers and
Reimbursements and Including
Expenses not Subject to Cap(C) | | | Ratio of Expenses to Average Net
Assets After Waivers and
Reimbursements and Excluding
Expenses not Subject to Cap(C) | | | Ratio of Net Investment
Income to Average Net
Assets | | | Portfolio
Turnover
Rate(D) | |
| | | | | | | | | | | | | | | | | | | | | | | | | | | |
| | | | | | | | | | | | | | | | | | | | | | | | | | | |
| | 10.78 | %(E) | | $ | 161,298 | | | | 1.46 | %(F) | | | 1.40 | %(F) | | | 1.40 | %(F) | | | (0.72 | )%(F) | | | 38 | % |
| | 10.38 | (E) | | | 5,766 | | | | 2.43 | (F) | | | 2.15 | (F) | | | 2.15 | (F) | | | (1.46 | )(F) | | | – | |
| | 10.37 | (E) | | | 14,025 | | | | 2.16 | (F) | | | 2.15 | (F) | | | 2.15 | (F) | | | (1.47 | )(F) | | | – | |
| | 10.95 | (E) | | | 9,556 | | | | 1.10 | (F) | | | 1.10 | (F) | | | 1.10 | (F) | | | (0.41 | )(F) | | | – | |
| | 10.66 | (E) | | | 869 | | | | 1.70 | (F) | | | 1.60 | (F) | | | 1.60 | (F) | | | (0.91 | )(F) | | | – | |
| | 10.84 | (E) | | | 3,201 | | | | 1.29 | (F) | | | 1.29 | (F) | | | 1.29 | (F) | | | (0.61 | )(F) | | | – | |
| | 10.99 | (E) | | | 305 | | | | 1.03 | (F) | | | 1.00 | (F) | | | 1.00 | (F) | | | (0.32 | )(F) | | | – | |
| | 11.04 | (E) | | | 158,607 | | | | 0.88 | (F) | | | 0.88 | (F) | | | 0.88 | (F) | | | (0.20 | )(F) | | | – | |
| | | | | | | | | | | | | | | | | | | | | | | | | | | |
| | | | | | | | | | | | | | | | | | | | | | | | | | | |
| | 13.34 | | | | 154,303 | | | | 1.48 | | | | 1.40 | | | | 1.40 | | | | (0.93 | ) | | | 70 | |
| | 12.48 | | | | 7,018 | | | | 2.39 | | | | 2.15 | | | | 2.15 | | | | (1.46 | ) | | | – | |
| | 12.47 | | | | 12,285 | | | | 2.18 | | | | 2.15 | | | | 2.15 | | | | (1.47 | ) | | | – | |
| | 13.67 | | | | 9,312 | | | | 1.10 | | | | 1.10 | | | | 1.10 | | | | (0.43 | ) | | | – | |
| | 13.13 | | | | 763 | | | | 1.69 | | | | 1.60 | | | | 1.60 | | | | (0.93 | ) | | | – | |
| | 13.44 | | | | 3,059 | | | | 1.30 | | | | 1.30 | | | | 1.30 | | | | (0.62 | ) | | | – | |
| | 13.77 | | | | 227 | | | | 1.03 | | | | 1.00 | | | | 1.00 | | | | (0.33 | ) | | | – | |
| | 13.91 | | | | 134,508 | | | | 0.89 | | | | 0.89 | | | | 0.89 | | | | (0.22 | ) | | | – | |
| | | | | | | | | | | | | | | | | | | | | | | | | | | |
| | | | | | | | | | | | | | | | | | | | | | | | | | | |
| | 34.91 | (I) | | | 53,548 | | | | 1.62 | | | | 1.40 | | | | 1.40 | | | | (0.64 | ) | | | 137 | |
| | 33.86 | (I) | | | 8,398 | | | | 2.59 | | | | 2.15 | | | | 2.15 | | | | (1.39 | ) | | | – | |
| | 33.92 | (I) | | | 11,084 | | | | 2.34 | | | | 2.15 | | | | 2.15 | | | | (1.39 | ) | | | – | |
| | 35.27 | (I) | | | 5,384 | | | | 1.23 | | | | 1.15 | | | | 1.15 | | | | (0.39 | ) | | | – | |
| | 34.57 | (I) | | | 367 | | | | 1.77 | | | | 1.63 | | | | 1.63 | | | | (0.90 | ) | | | – | |
| | 34.98 | (I) | | | 2,831 | | | | 1.38 | | | | 1.33 | | | | 1.33 | | | | (0.58 | ) | | | – | |
| | 35.39 | (I) | | | 132 | | | | 1.09 | | | | 1.05 | | | | 1.05 | | | | (0.26 | ) | | | – | |
| | 35.52 | (I) | | | 93,908 | | | | 0.95 | | | | 0.95 | | | | 0.95 | | | | (0.18 | ) | | | – | |
| | | | | | | | | | | | | | | | | | | | | | | | | | | |
| | | | | | | | | | | | | | | | | | | | | | | | | | | |
| | 10.72 | | | | 45,036 | | | | 1.89 | | | | 1.07 | | | | 1.07 | | | | (0.26 | ) | | | 84 | |
| | 10.23 | | | | 8,042 | | | | 2.97 | | | | 1.50 | | | | 1.50 | | | | (0.68 | ) | | | – | |
| | 9.79 | | | | 9,800 | | | | 2.60 | | | | 1.87 | | | | 1.87 | | | | (1.05 | ) | | | – | |
| | 10.63 | | | | 4,456 | | | | 1.37 | | | | 1.08 | | | | 1.08 | | | | (0.28 | ) | | | – | |
| | 10.22 | | | | 192 | | | | 1.85 | | | | 1.65 | | | | 1.65 | | | | (0.91 | ) | | | – | |
| | 10.38 | | | | 1,868 | | | | 1.42 | | | | 1.35 | | | | 1.35 | | | | (0.54 | ) | | | – | |
| | 10.69 | | | | 1,321 | | | | 1.12 | | | | 1.05 | | | | 1.05 | | | | (0.34 | ) | | | – | |
| | 10.67 | | | | 8,042 | | | | 1.02 | | | | 1.02 | | | | 1.02 | | | | 0.04 | | | | – | |
| | | | | | | | | | | | | | | | | | | | | | | | | | | |
| | | | | | | | | | | | | | | | | | | | | | | | | | | |
| | (38.35 | ) | | | 78,279 | | | | 1.64 | | | | 1.20 | | | | 1.20 | | | | (0.25 | ) | | | 103 | |
| | (38.71 | ) | | | 8,645 | | | | 2.51 | | | | 1.83 | | | | 1.83 | | | | (0.88 | ) | | | – | |
| | (38.90 | ) | | | 10,472 | | | | 2.25 | | | | 2.10 | | | | 2.10 | | | | (1.14 | ) | | | – | |
| | (38.29 | ) | | | 3,159 | | | | 1.17 | | | | 1.15 | | | | 1.15 | | | | (0.21 | ) | | | – | |
| | (38.49 | ) | | | 9 | | | | 2.08 | | | | 1.46 | | | | 1.46 | | | | (0.52 | ) | | | – | |
| | (38.40 | ) | | | 1,298 | | | | 1.28 | | | | 1.28 | | | | 1.28 | | | | (0.39 | ) | | | – | |
| | (38.20 | ) | | | 44 | | | | 1.03 | | | | 1.03 | | | | 1.03 | | | | (0.14 | ) | | | – | |
| | (38.15 | ) | | | 30,361 | | | | 0.89 | | | | 0.89 | | | | 0.89 | | | | 0.06 | | | | – | |
| | | | | | | | | | | | | | | | | | | | | | | | | | | |
| | | | | | | | | | | | | | | | | | | | | | | | | | | |
| | 7.18 | (I) | | | 162,102 | | | | 1.62 | | | | 1.31 | | | | 1.31 | | | | (0.26 | ) | | | 105 | |
| | 6.44 | (I) | | | 17,352 | | | | 2.42 | | | | 2.00 | | | | 2.00 | | | | (0.95 | ) | | | – | |
| | 6.34 | (I) | | | 23,778 | | | | 2.21 | | | | 2.15 | | | | 2.15 | | | | (1.10 | ) | | | – | |
| | 7.37 | (I) | | | 4,614 | | | | 1.21 | | | | 1.15 | | | | 1.15 | | | | (0.17 | ) | | | – | |
| | 5.63 | (E) | | | 11 | | | | 1.69 | (F) | | | 1.65 | (F) | | | 1.65 | (F) | | | (0.65 | )(F) | | | – | |
| | 5.94 | (E) | | | 309 | | | | 1.40 | (F) | | | 1.35 | (F) | | | 1.35 | (F) | | | (0.43 | )(F) | | | – | |
| | 6.18 | (E) | | | 11 | | | | 1.09 | (F) | | | 1.05 | (F) | | | 1.05 | (F) | | | (0.05 | )(F) | | | – | |
| | 7.61 | (I) | | | 46,466 | | | | 0.93 | | | | 0.93 | | | | 0.93 | | | | 0.12 | | | | – | |
| The Hartford SmallCap Growth Fund |
| Financial Highlights - (continued) |
| (A) | Information presented relates to a share outstanding throughout the indicated period. |
| (B) | Assumes initial investment at net asset value at the beginning of each period, reinvestment of all distributions, the complete redemption of the investment at net asset value at the end of each period and no sales charge. Total return would be reduced if sales charges were taken into account. |
| (C) | Ratios do not include fees paid indirectly (See Expenses in the accompanying Notes to Financial Statements). |
| (D) | Portfolio turnover rate is calculated on the basis of the Fund as a whole without distinguishing between the classes of shares issued. |
| (E) | Not annualized. |
| (F) | Annualized. |
| (G) | Per share amounts have been calculated using average shares outstanding method. |
| (H) | Class L was merged into Class A on August 5, 2011 (See Class Merger in accompanying Notes to Financial Statements). |
| (I) | Total return without the inclusion of the Payments from (to) Affiliate, can be found in Expenses in the accompanying Notes to Financial Statements. |
| (J) | Commenced operations on December 22, 2006. |
| The Hartford SmallCap Growth Fund |
| Directors and Officers (Unaudited) |
The Board of Directors of the Company appoints officers who are responsible for the day-to-day operations of the Fund and who execute policies formulated by the Directors. Each director serves until his or her death, resignation, or retirement or until the next annual meeting of shareholders is held or until his or her successor is elected and qualifies.
Directors and officers who are employed by or who have a financial interest in The Hartford are considered “interested” persons of the Fund pursuant to the 1940 Act. Each officer and two of the Company’s directors, as noted in the chart below, are “interested” persons of the Fund. Each director serves as a director for The Hartford Mutual Funds, Inc., The Hartford Mutual Funds II, Inc., Hartford Series Fund, Inc., and Hartford HLS Series Fund II, Inc., and as a trustee for The Hartford Alternative Strategies Fund, which, as of April 30, 2012, collectively consist of 91 funds. Correspondence may be sent to directors and officers c/o Hartford Mutual Funds, P.O. Box 2999, Hartford, Connecticut 06104-2999, except that correspondence to Mr. Annoni, Mr. Dressen, and Ms. Fagely may be sent to 500 Bielenberg Drive, Woodbury, Minnesota 55125.
The table below sets forth, for each director and officer, his or her name, year of birth, current position with the Company and date first elected or appointed to The Hartford Mutual Funds, Inc. (“MF”) and The Hartford Mutual Funds II, Inc. (“MF2”), principal occupation, and, for directors, other directorships held. The Fund’s statement of additional information contains further information on the directors and is available free of charge by calling 1-888-843-7824 or writing to Hartford Mutual Funds, P.O. Box 64387, St. Paul, MN 55164-0387.
Information on the aggregate remuneration paid to the directors of the Company can be found in the Statement of Operations herein. The Fund pays to The Hartford a portion of the Chief Compliance Officer’s compensation, but does not pay salaries or compensation to any of its other officers or directors who are employed by The Hartford.
Non-Interested Directors
Lynn S. Birdsong (1946) Director since 2003, Co-Chairman of the Investment Committee
Mr. Birdsong is a private investor. Mr. Birdsong currently serves as a Director of the Sovereign High Yield Investment Company (April 2010 to current). Mr. Birdsong currently serves as an Independent Director of Nomura Partners Funds, Inc. (formerly, The Japan Fund) (March 2003 to current). From 1979 to 2002, Mr. Birdsong was a managing director of Zurich Scudder Investments, an investment management firm. During his employment with Scudder, Mr. Birdsong was an Interested Director of The Japan Fund. Since 1981, Mr. Birdsong has been a partner in Birdsong Company, an advertising specialty firm.
Robert M. Gavin, Jr. (1940) Director since 2002 (MF) and 1986 (MF2), Chairman of the Board since 2004
Dr. Gavin is an educational consultant. Prior to September 1, 2001, he was President of Cranbrook Education Community and prior to July 1996, he was President of Macalester College, St. Paul, Minnesota.
Duane E. Hill (1945) Director since 2001 (MF) and 2002 (MF2), Chairman of the Nominating Committee
Mr. Hill is Partner of TSG Ventures L.P., a private equity investment company. Mr. Hill is a former partner of TSG Capital Group, a private equity investment firm that served as sponsor and lead investor in leveraged buyouts of middle market companies.
Sandra S. Jaffee (1941) Director since 2005
Ms. Jaffee is the founder and Chief Executive Officer of a private company, Homeworks Concierge, LLC, which provides residential property management services in Westchester County, New York (January 2012 to present). Ms. Jaffee served as Chairman (2008 to 2009) and Chief Executive Officer of Fortent (formerly Searchspace Group), a leading provider of compliance/regulatory technology to financial institutions from August 2005 to August 2009. Ms. Jaffe currently serves as a member of the Board of Directors of Broadridge Financial Solutions as well as a Trustee of Muhlenberg College.
William P. Johnston (1944) Director since 2005, Chairman of the Compliance Committee
In June 2006, Mr. Johnston was appointed as Senior Advisor to The Carlyle Group, a global private equity investment firm. In August 2007, Mr. Johnston was elected to the Board of Directors of LifeCare Holdings, Inc. In February 2008, Mr. Johnston was elected to the Board of Directors of HCR-ManorCare, Inc. In May 2006, Mr. Johnston was elected to the Supervisory Board of Fresenius Medical Care AG & Co. KGaA, after its acquisition of Renal Care Group, Inc. in March 2006.
Phillip O. Peterson (1944) Director since 2002, (MF) and 2000 (MF2), Chairman of the Audit Committee
Mr. Peterson is a mutual fund industry consultant. He was a partner of KPMG LLP (an accounting firm) until July 1999. Mr. Peterson joined William Blair Funds in February 2007 as a member of the Board of Trustees. Mr. Peterson also joined the Board of Trustees of Symetra Variable Mutual Funds Trust as a trustee in February 2012.
| The Hartford SmallCap Growth Fund |
| Directors and Officers (Unaudited) – (continued) |
Lemma W. Senbet (1946) Director since 2005
Dr. Senbet is the William E. Mayer Chair Professor of Finance and Director, Center for Financial Policy, at the University of Maryland, Robert H. Smith School of Business. He was chair of the Finance Department from 1998 to 2006. Previously he was a chaired professor of finance at the University of Wisconsin-Madison. Also, he was director of the Fortis Funds from March 2000 to July 2002. Dr. Senbet served the finance profession in various capacities, including as director of the American Finance Association and President of the Western Finance Association. In 2006, Dr. Senbet was inducted Fellow of Financial Management Association International for his career-long distinguished scholarship and professional service.
Interested Directors and Officers
David N. Levenson (1966) Director since 2010
Mr. Levenson currently serves as President of The Hartford’s Wealth Management business. He was appointed to this role in July 2010. Previously, Mr. Levenson served as Executive Vice President of Legacy Holdings for The Hartford from June 2009 to July 2010. From 2006 to 2009, Mr. Levenson was with Hartford Life Insurance K.K. where he served as President and Chief Executive Officer from 2007 to 2009. He served as Managing Director of Hartford Investment Management Company from 2005 to 2006. Additionally, Mr. Levenson serves as Executive Vice President of The Hartford and as President, Director and Chief Executive Officer of Hartford Life Insurance Company (“HLIC”) and Hartford Life, Inc. (“HL Inc.”).
Lowndes A. Smith (1939) Director since 1996, (MF) and 2002 (MF2), Co-Chairman of the Investment Committee
Mr. Smith served as Vice Chairman of The Hartford from February 1997 to January 2002, as President and Chief Executive Officer of HL Inc. from February 1997 to January 2002, and as President and Chief Operating Officer of The Hartford Life Insurance Companies from January 1989 to January 2002. Mr. Smith serves as a Director of White Mountains Insurance Group, Ltd., One Beacon Insurance and Symetra Financial and as Managing Director of Whittington Gray Associates.
Other Officers
James E. Davey (1964) President and Chief Executive Officer since 2010
Mr. Davey serves as Executive Vice President of HLIC. Additionally, Mr. Davey serves as President, Chief Executive Officer and Manager of HIFSCO and President, Chief Executive Officer and Manager of HL Investment Advisors, LLC (“HL Advisors”). Mr. Davey joined The Hartford in 2002.
Mark A. Annoni (1964) Vice President, Controller and Treasurer since 2012*
Mr. Annoni serves as the Assistant Vice President and Director of Investment Finance (February 2004 to present). Mr. Annoni joined The Hartford in April 2001 as part of The Hartford’s acquisition of Fortis Financial Group. Prior to joining The Hartford, Mr. Annoni served as Manager of Mutual Fund Accounting at Fortis Financial Group (July 1997 to April 2001).
* Mr. Annoni was named Vice President, Controller and Treasurer on May 8, 2012.
Michael R. Dressen (1963) AML Compliance Officer since 2011
Mr. Dressen currently serves as Assistant Vice President of HLIC. He also serves as Chief Compliance Officer and AML Compliance Officer of Hartford Administrative Services Company (“HASCO”) and as Assistant Secretary and Compliance Officer of HIFSCO. Mr Dressen joined The Hartford in 2005 from State Farm Insurance Companies where he held various positions related to mutual funds, variable products, and property casualty insurance.
Tamara L. Fagely (1958) Vice President since 2002 (MF) and 1993 (MF2)
Ms. Fagely has been a Vice President of HASCO since 1998 and Chief Financial Officer since 2006. Currently Ms. Fagely is a Vice President of HLIC. She served as Assistant Vice President of HLIC from December 2001 through March 2005. In addition, Ms. Fagely is Controller and Chief Financial Officer of HIFSCO.
Dr. Robert J. Froehlich (1953) Senior Managing Director since 2009
Dr. Froehlich joined The Hartford as Senior Managing Director in September 2009. Prior to joining The Hartford, Dr. Froehlich served as Vice Chairman of Deutsche Asset Management from 1997-2009.
Edward P. Macdonald (1967) Vice President, Secretary and Chief Legal Officer since 2005
Mr. Macdonald serves as Vice President of HLIC and Chief Legal Officer of Mutual Funds and Vice President of HIFSCO. He also serves as Vice President and Secretary of HASCO, and Chief Legal Officer, Secretary and Vice President of HL Advisors. Mr. Macdonald joined The Hartford in 2005.
Vernon J. Meyer (1964) Vice President since 2006
Mr. Meyer serves as Senior Vice President of HLIC. He also serves as Senior Vice President of HIFSCO and HL Advisors. Mr. Meyer joined The Hartford in 2004.
Colleen B. Pernerewski (1969) Vice President and Chief Compliance Officer since 2010
Ms. Pernerewski serves as Vice President and Chief Investment Advisor Compliance Officer of HIFSCO and as Vice President and Chief Compliance Officer of HL Advisors. Ms. Pernerewski serves as Vice President and Chief Compliance Officer of Individual Annuity of HLIC. Ms. Pernerewski joined The Hartford in 2005 from Travelers Life and Annuity where she served as Counsel (2004-2005). Prior to Travelers Life and Annuity, Ms. Pernerewski held the position of Counsel at The Hartford (1998-2004).
Elizabeth L. Schroeder (1966) Vice President since 2010
Ms. Schroeder currently serves as Assistant Vice President of HLIC. Ms. Schroeder joined HLIC in 1991. She is also an Assistant Vice President of HASCO, HIFSCO and HL Advisors.
Martin Swanson (1962) Vice President since 2010
Mr. Swanson is a Vice President of HLIC. Mr. Swanson also serves as Vice President/Marketing for HIFSCO. Prior to joining HLIC in 1998, Mr. Swanson was a Vice President at PaineWebber, Inc.
Jane Wolak (1961) Vice President since 2009
Ms. Wolak currently serves as Senior Vice President of HLIC. Ms. Wolak joined HLIC as Vice President, Retail Product Services in May 2007. She is also Vice President of HASCO. Previously, Ms. Wolak was with Sun Life Financial where she held the position of Vice President, Service Center Operations from 2001-2007.
HOW TO OBTAIN A COPY OF THE FUND’S PROXY VOTING POLICIES AND VOTING RECORDS (UNAUDITED)
A description of the policies and procedures that the Fund uses to determine how to vote proxies relating to portfolio securities and a record of how the Fund voted any proxies for the twelve-month period ended June 30, 2011 are available (1) without charge, upon request, by calling 888-843-7824 and (2) on the SEC’s website at http://www.sec.gov.
QUARTERLY PORTFOLIO HOLDINGS INFORMATION (UNAUDITED)
The Fund files a complete schedule of portfolio holdings with the SEC for the first and third quarters of each fiscal year on Form N-Q. The Fund’s Forms are available (1) without charge, upon request, by calling 888-843-7824 and (2) on the SEC’s website at http://www.sec.gov. The Form N-Q may be reviewed and copied at the SEC’s Public Reference Room in Washington, DC. Information on the operation of the Public Reference Room may be obtained by calling 1-800-SEC-0330.
| The Hartford SmallCap Growth Fund |
| Expense Example (Unaudited) |
Your Fund's Expenses
As a shareholder of the Fund, you incur two types of costs: (1) transaction costs, including sales charges (loads) on purchase payments and contingent deferred sales charges (CDSC) and (2) ongoing costs, including investment management fees, distribution fees, and other fund expenses. This example is intended to help you understand your ongoing costs (in dollars) of investing in the Fund and to compare these costs with the ongoing costs of investing in other mutual funds. The example is based on an investment of $1,000 invested at the beginning of the period and held for the period of October 31, 2011 through April 30, 2012.
Actual Expenses
The first set of columns of the table below provides information about actual account values and actual expenses. You may use the information in this column, together with the amount you invested, to estimate the expenses that you paid over the period. Simply divide your account value by $1,000 (for example, an $8,600 account value divided by $1,000 = 8.6), then multiply the result by the number in the line under the heading entitled “Expenses Paid During Period” to estimate the expenses you paid on your account during this period.
Hypothetical Example for Comparison Purposes
The second set of columns of the table below provides information about hypothetical account values and hypothetical expenses based on the Fund's actual expense ratio and an assumed rate of return of 5% per year before expenses, which is not the Fund's actual return. The hypothetical account values and expenses may not be used to estimate the actual ending account balance or expenses you paid for the period. You may use this information to compare the ongoing costs of investing in the Fund and other funds. To do so, compare this 5% hypothetical example with the 5% hypothetical examples that appear in the shareholder reports of the other funds.
Please note that the expenses shown in the table are meant to highlight your ongoing costs only and do not reflect any transactional costs, such as sales charges (loads) and CDSC. Therefore, the second set of columns of the table is useful in comparing ongoing costs only, and will not help you determine the relative total costs of owning different funds. In addition, if these transactional costs were included, your costs would be higher. Expenses are equal to the Fund's annualized expense ratios multiplied by average account value over the period, multiplied by 182/366 (to reflect the one-half year period).
| | | Actual return | | | Hypothetical (5% return before expenses) | | | | | | | | | | |
| | | Beginning
Account Value
October 31, 2011 | | | Ending Account Value
April 30, 2012 | | | Expenses paid during the period
October 31, 2011
through
April 30, 2012 | | | Beginning
Account Value
October 31, 2011 | | | Ending Account Value
April 30, 2012 | | | Expenses paid during the
period
October 31, 2011
through
April 30, 2012 | | | Annualized
expense
ratio | | | Days in
the
current
1/2
year | | | Days in
the full
year | |
| Class A | | $ | 1,000.00 | | | $ | 1,107.80 | | | $ | 7.34 | | | $ | 1,000.00 | | | $ | 1,017.90 | | | $ | 7.02 | | | 1.40 | % | | | 182 | | | | 366 | |
| Class B | | $ | 1,000.00 | | | $ | 1,103.80 | | | $ | 11.24 | | | $ | 1,000.00 | | | $ | 1,014.18 | | | $ | 10.76 | | | 2.15 | | | | 182 | | | | 366 | |
| Class C | | $ | 1,000.00 | | | $ | 1,103.70 | | | $ | 11.25 | | | $ | 1,000.00 | | | $ | 1,014.17 | | | $ | 10.77 | | | 2.15 | | | | 182 | | | | 366 | |
| Class I | | $ | 1,000.00 | | | $ | 1,109.50 | | | $ | 5.76 | | | $ | 1,000.00 | | | $ | 1,019.40 | | | $ | 5.52 | | | 1.10 | | | | 182 | | | | 366 | |
| Class R3 | | $ | 1,000.00 | | | $ | 1,106.60 | | | $ | 8.38 | | | $ | 1,000.00 | | | $ | 1,016.91 | | | $ | 8.03 | | | 1.60 | | | | 182 | | | | 366 | |
| Class R4 | | $ | 1,000.00 | | | $ | 1,108.40 | | | $ | 6.77 | | | $ | 1,000.00 | | | $ | 1,018.44 | | | $ | 6.48 | | | 1.29 | | | | 182 | | | | 366 | |
| Class R5 | | $ | 1,000.00 | | | $ | 1,109.90 | | | $ | 5.25 | | | $ | 1,000.00 | | | $ | 1,019.89 | | | $ | 5.02 | | | 1.00 | | | | 182 | | | | 366 | |
| Class Y | | $ | 1,000.00 | | | $ | 1,110.40 | | | $ | 4.62 | | | $ | 1,000.00 | | | $ | 1,020.48 | | | $ | 4.42 | | | 0.88 | | | | 182 | | | | 366 | |
You should carefully consider investment objectives, risks, and charges and expenses of The Hartford Mutual Funds before investing. This and other information can be found in the Fund’s prospectus or summary prospectus, which can be obtained from your investment representative or by calling 888-843-7824. Please read them carefully before you invest or send money. The Hartford Mutual Funds are underwritten and distributed by Hartford Investment Financial Services LLC. “The Hartford” is The Hartford Financial Services Group, Inc., and its subsidiaries. MFSAR-SCG12 4/12 110743 Printed in U.S.A. ©2012 The Hartford, Hartford, CT 06155 | |
THE HARTFORD MUTUAL FUNDS 2012 Semi Annual Report The Hartford Value Opportunities Fund |
A MESSAGE FROM THE PRESIDENT
Dear Fellow Shareholders:
I want to take this opportunity to say thank you for investing with The Hartford Mutual Funds. Although it’s not yet clear that the recent market volatility is truly behind us, we believe there are several reasons to remain optimistic about the markets in 2012.
Market Review
Stocks soared in October as a result of solid corporate earnings reports, generally better-than-expected economic data, and renewed hopes for a solution to the eurozone debt crisis. However, November saw some of those gains dissipate due to pessimism about European contagion and its implications for global economic growth. The quarter ended on a positive note, a result of encouraging employment and manufacturing data in December.
The S&P 500 Index was virtually unchanged for the year: 1257.64 on 12/31/2010, and 1257.60 on 12/31/2011. Dividends, however, helped produce a 2.11% total return for the Index for the year.
In 2012, U.S. equities surged in the first quarter, with the S&P 500 up 12.59% as investors shrugged off lingering uncertainty over eurozone sovereign debt and focused instead on improving economic data. Strong corporate earnings news and the Federal Reserve’s pledge to keep interest rates low buoyed investors’ appetites.
The Hartford Mutual Funds Expands Relationship with Wellington Management
We’re very pleased that we are expanding our relationship with Wellington Management which will now serve as the sole sub-adviser for the retail Hartford Mutual Funds including equity, fixed-income, and asset-allocation funds.* One of America’s oldest and largest investment management firms, Wellington Management has resources that span the entire globe, with multiple offices across the U.S. and numerous offices abroad. Wellington Management’s most distinctive strength is its proprietary research, which is shared across the entire organization.
We believe that aligning more closely with a well-respected money manager like Wellington Management puts us in a strong position to drive significant growth and to continue delivering innovative fund strategies to help our investors meet their financial goals.
Thank you again for investing with The Hartford Mutual Funds.
James Davey
President
The Hartford Mutual Funds
*Hartford Investment Management Company will continue to sub-advise The Hartford Money Market Fund.
The Hartford Value Opportunities Fund
Table of Contents
| Fund Performance (Unaudited) | 2 |
| Manager Discussion (Unaudited) | 3 |
| Financial Statements | |
| Schedule of Investments at April 30, 2012 (Unaudited) | 5 |
| Investment Valuation Hierarchy Level Summary at April 30, 2012 (Unaudited) | 9 |
| Statement of Assets and Liabilities at April 30, 2012 (Unaudited) | 10 |
| Statement of Operations for the Six-Month Period Ended April 30, 2012 (Unaudited) | 11 |
| Statement of Changes in Net Assets for the Six-Month Period Ended April 30, 2012 (Unaudited), and the Year Ended October 31, 2011 | 12 |
| Notes to Financial Statements (Unaudited) | 13 |
| Financial Highlights (Unaudited) | 26 |
| Directors and Officers (Unaudited) | 29 |
| How to Obtain a Copy of the Fund’s Proxy Voting Policies and Voting Records (Unaudited) | 31 |
| Quarterly Portfolio Holdings Information (Unaudited) | 31 |
| Expense Example (Unaudited) | 32 |
The views expressed in the Fund’s Manager Discussion under ‘‘Why did the Fund perform this way?’’ and ‘‘What is the outlook?’’ are views of the Fund’s sub-adviser and portfolio management team through the end of the period and are subject to change based on market and other conditions.
| The Hartford Value Opportunities Fund inception 01/02/1996 |
| (sub-advised by Wellington Management Company, LLP) | |
| | |
| Investment objective – Seeks capital appreciation. | |
Performance Overview 4/30/02 - 4/30/12
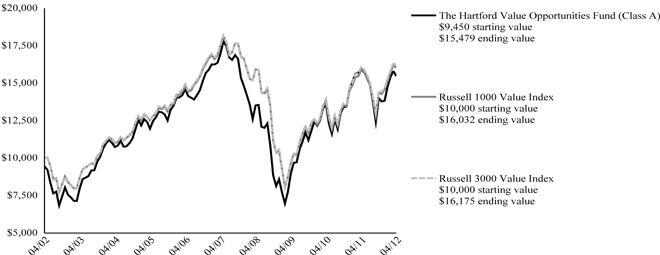
The chart above shows the growth of a $10,000 investment in Class A which includes a sales charge. Growth results in classes other than Class A will vary from what is seen above due to differences in the expenses charged to those share classes.
| Average Annual Total Returns (as of 4/30/12) |
| | | 6 Month† | | | 1 Year | | | 5 year | | | 10 year | |
| Value Opportunities A# | | | 10.56 | % | | | -3.05 | % | | | -1.81 | % | | | 5.05 | % |
| Value Opportunities A## | | | | | | | -8.38 | % | | | -2.91 | % | | | 4.46 | % |
| Value Opportunities B# | | | 10.24 | % | | | -3.78 | % | | | -2.41 | % | | | NA | * |
| Value Opportunities B## | | | | | | | -8.58 | % | | | -2.73 | % | | | NA | * |
| Value Opportunities C# | | | 10.21 | % | | | -3.75 | % | | | -2.54 | % | | | 4.29 | % |
| Value Opportunities C## | | | | | | | -4.71 | % | | | -2.54 | % | | | 4.29 | % |
| Value Opportunities I# | | | 10.74 | % | | | -2.73 | % | | | -1.54 | % | | | 5.21 | % |
| Value Opportunities R3# | | | 10.52 | % | | | -3.23 | % | | | -2.06 | % | | | 5.04 | % |
| Value Opportunities R4# | | | 10.72 | % | | | -2.91 | % | | | -1.76 | % | | | 5.21 | % |
| Value Opportunities R5# | | | 10.83 | % | | | -2.66 | % | | | -1.46 | % | | | 5.38 | % |
| Value Opportunities Y# | | | 10.91 | % | | | -2.60 | % | | | -1.42 | % | | | 5.45 | % |
| Russell 1000 Value Index | | | 11.62 | % | | | 1.03 | % | | | -1.73 | % | | | 4.83 | % |
| Russell 3000 Value Index | | | 11.61 | % | | | 0.61 | % | | | -1.63 | % | | | 4.93 | % |
| † | Not Annualized |
| # | Without sales charge |
| ## | With sales charge |
| * | 10 year returns are not applicable for Class B because after 8 years Class B converts to Class A. |
PAST PERFORMANCE IS NOT INDICATIVE OF FUTURE RESULTS.
The initial investment in Class A shares reflects the maximum sales charge and Classes B and C reflect a contingent deferred sales charge.
Total returns presented above were calculated using the Fund's net asset value available to shareholders for sale or redemption of Fund shares on April 30, 2012, which may exclude investment transactions as of this date.
Effective 9/30/09, Class B shares of The Hartford Mutual Funds were closed to new investments.
Class I shares commenced operations on 8/31/06. Performance prior to that date is that of the Fund's Class A shares (excluding sales charges), which had different operating expenses. Class R3, R4 and R5 shares commenced operations on 12/22/06. Class R3, R4 and R5 share performance prior to that date reflects Class Y share performance and operating expenses.
Russell 1000 Value Index is an unmanaged index measuring the performance of those Russell 1000 Index companies with lower price-to-book ratios and lower forecasted growth values. (The Russell 1000 Index is an unmanaged index that measures the performance of the 1,000 largest companies in the Russell 3000 Index, which measures the performance of the 3,000 largest U.S. companies, based on total market capitalizations.)
Russell 3000 Value Index is an unmanaged index measuring the performance of those Russell 3000 Index companies with lower price-to-book ratios and lower forecasted growth values. (The Russell 3000 Index is an unmanaged index that measures the performance of the 3,000 largest U.S. companies based on total market capitalization.)
You cannot invest directly in an index.
The chart represents a hypothetical investment in the Fund. Performance data represents past performance and current performance could be higher or lower.
The value of shares will fluctuate so that, when redeemed, shares may be worth more or less than their original cost. The chart and table do not reflect the deduction of taxes that a shareholder would pay on Fund distributions or the redemption of Fund shares.
Performance information may reflect historical or current expense waivers/reimbursements from the investment adviser, without which performance would have been lower. For information on current expense waivers/reimbursements, please see the prospectus.
The Hartford Value Opportunities Fund
| Manager Discussion |
| April 30, 2012 (Unaudited) |
| Portfolio Managers | |
| James N. Mordy | David W. Palmer, CFA |
| Senior Vice President and Equity Portfolio Manager | Senior Vice President and Equity Portfolio Manager |
| | |
How did the Fund perform?
The Class A shares of The Hartford Value Opportunities Fund returned 10.56%, before sales charge, for the six-month period ended April 30, 2012, underperforming its benchmark, the Russell 3000 Value Index, which returned 11.61% for the same period. The Fund was in-line with the 10.55% return of the average fund in the Lipper Multi-Cap Value Fund peer group, a group of funds with investment strategies similar to those of the Fund.
Why did the Fund perform this way?
U.S. equities moved higher in the period as generally improving economic data and growing consumer confidence helped to counter a persistent slump in housing. Investors mostly shrugged off lingering uncertainty over eurozone sovereign debt, focusing instead on the improving health of the U.S. economy. Strong corporate earnings news and the U.S. Federal Reserve’s pledge to keep interest rates “exceptionally low” until at least late 2014 buoyed investors’ appetites for risk assets. The Greek debt restructuring deal added to investors’ optimism, helping to offset heightened geopolitical risks, a rise in oil prices, and fears of a slowdown in China. In April, U.S. equities retreated for the first time in five months as disappointing employment and GDP (gross domestic product) data overshadowed continued strength in corporate earnings. In addition, increased political uncertainty in Europe, growing concerns about Spain’s fiscal sustainability, and a less dovish tone from the U.S. Federal Reserve underpinned a rise in risk aversion among investors.
All ten sectors within the Russell 3000 Value Index posted positive returns during the period. Consumer Discretionary (+17%), Financials (+15%), and Industrials (+15%) were top performers while Energy (+3%) and Utilities (+5%) lagged on a relative basis.
Stock selection was the primary driver of the Fund’s relative underperformance. Security selection was strongest in Materials, Health Care, and Financials and weakest within Energy, Consumer Staples, and Consumer Discretionary. Sector allocation, a fall-out of the bottom-up process (i.e. stock by stock fundamental research), also slightly detracted from relative returns.
The largest detractors from relative performance included Southwestern Energy (Energy), CONSOL Energy (Energy), and Kohl’s (Consumer Discretionary). Southwestern Energy is a natural gas producer with core operations in the Fayetteville shale in Arkansas, and a high-growth position in the Pennsylvania Marcellus shale. The share price came under pressure because of poor North American natural gas pricing. Industry oversupply drove spot gas pricing down sharply to encourage producers to slow drilling activity, while an unusually warm winter cut demand. CONSOL Energy, a coal and natural gas producer and energy services provider, also suffered share price declines on the weakness in the natural gas market and after the near-term outlook for coal deteriorated. Shares of Kohl’s, the U.S.-based department store retailer, declined as the company reported disappointing same store sales figures during the period. Shares are attractively priced, and the company recently began paying a dividend and is aggressively buying back stock. Top detractors from absolute returns also included PPH (Financials).
The largest contributors to relative performance (i.e. performance of the Fund as measured against the benchmark) were Cobalt International Energy (Energy), Wells Fargo (Financials), and BB&T (Financials). Leading global exploration and production company Cobalt International Energy saw its share price surge during the period. The company released drilling results for its offshore Angola oil discovery that were much better than expected. We believe a lower risk factor can now be assigned to Cobalt's West African assets, which significantly increases our target value for the stock. With what appear to be multiple attractive targets to be drilled later this year and next, we believe Cobalt offers exposure to some of the best prospects in the industry. Wells Fargo stock recovered over the period thanks to favorable bank stress test results and an increased dividend and share repurchases. We chose to trim this position and take some profits. Wells Fargo was our largest holding at the period’s close. Our position in BB&T also benefited the portfolio during the period. BB&T has made progress on credit and loan growth. In absolute (i.e. total return) terms, Wells Fargo was the top contributor, followed by Cobalt International and BB&T.
What is the outlook?
While coincident economic indicators such as consumer confidence and employment improved, the confluence of rising stock valuations and a flattening in the upward trajectory of several leading indicators led us to reduce some of the more pro-cyclical positions in the Fund. While the U.S.
The Hartford Value Opportunities Fund
| Manager Discussion – (continued) |
| April 30, 2012 (Unaudited) |
still appears to be well-positioned globally, we believe that there is a potential for a moderation of recent positive growth surprises, which can be tied—at least in part—to expiring tax incentives. We remain vigilant for signs of deceleration.
At the end of the period, the Fund was most overweight
(i.e. the Fund’s sector position was greater than the benchmark position) in Health Care and Information Technology and most underweight in Telecommunication Services, Utilities, and Consumer Discretionary relative to the benchmark.
Diversification by Industry
as of April 30, 2012
| Industry (Sector) | | Percentage of
Net Assets | |
| Banks (Financials) | | | 5.0 | % |
| Capital Goods (Industrials) | | | 2.9 | |
| Commercial & Professional Services (Industrials) | | | 0.5 | |
| Consumer Services (Consumer Discretionary) | | | 1.1 | |
| Diversified Financials (Financials) | | | 12.4 | |
| Energy (Energy) | | | 13.2 | |
| Food, Beverage & Tobacco (Consumer Staples) | | | 7.2 | |
| Health Care Equipment & Services (Health Care) | | | 4.8 | |
| Household & Personal Products (Consumer Staples) | | | 1.5 | |
| Insurance (Financials) | | | 8.5 | |
| Materials (Materials) | | | 4.4 | |
| Media (Consumer Discretionary) | | | 2.0 | |
| Pharmaceuticals, Biotechnology & Life Sciences (Health Care) | | | 11.1 | |
| Real Estate (Financials) | | | 1.8 | |
| Retailing (Consumer Discretionary) | | | 3.3 | |
| Software & Services (Information Technology) | | | 6.2 | |
| Technology Hardware & Equipment (Information Technology) | | | 6.0 | |
| Transportation (Industrials) | | | 3.3 | |
| Utilities (Utilities) | | | 3.1 | |
| Short-Term Investments | | | 1.5 | |
| Other Assets and Liabilities | | | 0.2 | |
| Total | | | 100.0 | % |
The Hartford Value Opportunities Fund
| Schedule of Investments |
| April 30, 2012 (Unaudited) |
| (000’s Omitted) |
| Shares or Principal Amount | | Market Value ╪ | |
| COMMON STOCKS - 98.3% | |
| | | | | Banks - 5.0% | | | | |
| | 30 | | | BB&T Corp. | | $ | 968 | |
| | 63 | | | Fifth Third Bancorp | | | 895 | |
| | 176 | | | Wells Fargo & Co. | | | 5,867 | |
| | | | | | | | 7,730 | |
| | | | | Capital Goods - 2.9% | | | | |
| | 17 | | | General Dynamics Corp. | | | 1,114 | |
| | 20 | | | L-3 Communications Holdings, Inc. | | | 1,434 | |
| | 20 | | | PACCAR, Inc. | | | 863 | |
| | 25 | | | Pentair, Inc. | | | 1,094 | |
| | | | | | | | 4,505 | |
| | | | | Commercial & Professional Services - 0.5% | | | | |
| | 55 | | | Knoll, Inc. | | | 815 | |
| | | | | | | | | |
| | | | | Consumer Services - 1.1% | | | | |
| | 53 | | | DeVry, Inc. | | | 1,698 | |
| | | | | | | | | |
| | | | | Diversified Financials - 12.4% | | | | |
| | 32 | | | Ameriprise Financial, Inc. | | | 1,756 | |
| | 371 | | | Bank of America Corp. | | | 3,012 | |
| | 13 | | | BlackRock, Inc. | | | 2,529 | |
| | 31 | | | Goldman Sachs Group, Inc. | | | 3,581 | |
| | 100 | | | JP Morgan Chase & Co. | | | 4,289 | |
| | 76 | | | Nasdaq OMX Group, Inc. ● | | | 1,863 | |
| | 46 | | | NYSE Euronext | | | 1,172 | |
| | 25 | | | Oaktree Capital ⌂■●† | | | 898 | |
| | 74 | | | Solar Cayman Ltd. ⌂■●† | | | 6 | |
| | | | | | | | 19,106 | |
| | | | | Energy - 13.2% | | | | |
| | 12 | | | Anadarko Petroleum Corp. | | | 849 | |
| | 71 | | | Baker Hughes, Inc. | | | 3,114 | |
| | 45 | | | Canadian Natural Resources Ltd. ADR ‡ | | | 1,547 | |
| | 115 | | | Cobalt International Energy ● | | | 3,080 | |
| | 39 | | | Consol Energy, Inc. | | | 1,297 | |
| | 100 | | | Halliburton Co. | | | 3,432 | |
| | — | | | Inpex Corp. | | | 1,156 | |
| | 138 | | | Lone Pine Resources, Inc. ● | | | 820 | |
| | 20 | | | Noble Corp. | | | 765 | |
| | 89 | | | Southwestern Energy Co. ● | | | 2,804 | |
| | 29 | | | Statoilhydro ASA ADR | | | 767 | |
| | 107 | | | Tsakos Energy Navigation Ltd. | | | 676 | |
| | | | | | | | 20,307 | |
| | | | | Food, Beverage & Tobacco - 7.2% | | | | |
| | 105 | | | Archer Daniels Midland Co. | | | 3,228 | |
| | 33 | | | Dr. Pepper Snapple Group | | | 1,347 | |
| | 16 | | | Groupe Danone | | | 1,154 | |
| | 156 | | | Maple Leaf Foods, Inc. w/ Rights | | | 2,041 | |
| | 79 | | | Molson Coors Brewing Co. | | | 3,281 | |
| | | | | | | | 11,051 | |
| | | | | Health Care Equipment & Services - 4.8% | | | | |
| | 26 | | | Covidien plc | | | 1,447 | |
| | 81 | | | Medtronic, Inc. | | | 3,102 | |
| | 67 | | | Universal Health Services, Inc. Class B | | | 2,874 | |
| | | | | | | | 7,423 | |
| | | | | Household & Personal Products - 1.5% | | | | |
| | 32 | | | Energizer Holdings, Inc. ● | | | 2,247 | |
| | | | | | | | | |
| | | | | Insurance - 8.5% | | | | |
| | 15 | | | Everest Re Group Ltd. | | | 1,457 | |
| | 53 | | | Principal Financial Group, Inc. | | | 1,455 | |
| | 62 | | | Progressive Corp. | | | 1,321 | |
| | 42 | | | Reinsurance Group of America, Inc. | | | 2,442 | |
| | 19 | | | StanCorp Financial Group, Inc. | | | 741 | |
| | 31 | | | Swiss Re Ltd. | | | 1,977 | |
| | 156 | | | Unum Group | | | 3,710 | |
| | | | | | | | 13,103 | |
| | | | | Materials - 4.4% | | | | |
| | 27 | | | Akzo Nobel N.V. | | | 1,459 | |
| | 25 | | | Cabot Corp. | | | 1,083 | |
| | 62 | | | Methanex Corp. ADR | | | 2,176 | |
| | 24 | | | Mosaic Co. | | | 1,241 | |
| | 41 | | | Sealed Air Corp. | | | 777 | |
| | | | | | | | 6,736 | |
| | | | | Media - 2.0% | | | | |
| | 39 | | | Comcast Corp. Class A | | | 1,183 | |
| | 11 | | | Comcast Corp. Special Class A | | | 334 | |
| | 39 | | | Time Warner, Inc. | | | 1,468 | |
| | | | | | | | 2,985 | |
| | | | | Pharmaceuticals, Biotechnology & Life Sciences - 11.1% | | | | |
| | 28 | | | Agilent Technologies, Inc. | | | 1,160 | |
| | 142 | | | Almirall S.A. ☼ | | | 1,219 | |
| | 340 | | | Avanir Pharmaceuticals ● | | | 1,038 | |
| | 49 | | | Daiichi Sankyo Co., Ltd. ☼ | | | 838 | |
| | 14 | | | Gilead Sciences, Inc. ● | | | 728 | |
| | 146 | | | Merck & Co., Inc. | | | 5,737 | |
| | 18 | | | Roche Holding AG ☼ | | | 3,358 | |
| | 45 | | | Seattle Genetics, Inc. ● | | | 886 | |
| | 142 | | | WuXi PharmaTech Cayman, Inc. ● | | | 2,048 | |
| | | | | | | | 17,012 | |
| | | | | Real Estate - 1.8% | | | | |
| | 32 | | | Hatteras Financial Corp. | | | 929 | |
| | 88 | | | Weyerhaeuser Co. | | | 1,782 | |
| | | | | | | | 2,711 | |
| | | | | Retailing - 3.3% | | | | |
| | 572 | | | Allstar Co. ⌂† | | | 846 | |
| | 60 | | | Kohl's Corp. | | | 3,013 | |
| | 20 | | | Target Corp. | | | 1,141 | |
| | | | | | | | 5,000 | |
| | | | | Software & Services - 6.2% | | | | |
| | 131 | | | Booz Allen Hamilton Holding Corp. | | | 2,247 | |
| | 43 | | | Microsoft Corp. | | | 1,383 | |
| | 32 | | | Oracle Corp. | | | 938 | |
| | 43 | | | Paychex, Inc. | | | 1,338 | |
| | 196 | | | Western Union Co. | | | 3,593 | |
| | | | | | | | 9,499 | |
| | | | | Technology Hardware & Equipment - 6.0% | | | | |
| | 98 | | | Cisco Systems, Inc. | | | 1,975 | |
| | 48 | | | Corning, Inc. | | | 689 | |
| | 316 | | | Flextronics International Ltd. ● | | | 2,102 | |
| | 54 | | | Harris Corp. | | | 2,477 | |
| | 92 | | | Juniper Networks, Inc. ● | | | 1,978 | |
| | | | | | | | 9,221 | |
| | | | | Transportation - 3.3% | | | | |
| | 100 | | | Knight Transportation, Inc. | | | 1,637 | |
| | 230 | | | Toll Holdings Ltd. | | | 1,395 | |
| | 26 | | | United Parcel Service, Inc. Class B | | | 2,016 | |
| | | | | | | | 5,048 | |
| | | | | Utilities - 3.1% | | | | |
| | 35 | | | Entergy Corp. | | | 2,321 | |
The accompanying notes are an integral part of these financial statements.
The Hartford Value Opportunities Fund
| Schedule of Investments – (continued) |
| April 30, 2012 (Unaudited) |
| (000’s Omitted) |
| Shares or Principal Amount | | | | | | | Market Value ╪ | |
| COMMON STOCKS - 98.3% - (continued) | | | | | | | | |
| | | | | Utilities - 3.1% - (continued) | | | | | | | | |
| | 37 | | | N.V. Energy, Inc. | | | | | | $ | 612 | |
| | 65 | | | UGI Corp. | | | | | | | 1,888 | |
| | | | | | | | | | | | 4,821 | |
| | | | | Total common stocks | | | | | | | | |
| | | | | (cost $144,973) | | | | | | $ | 151,018 | |
| | | | | | | | | | | | | |
| | | | | Total long-term investments | | | | | | | | |
| | | | | (cost $144,973) | | | | | | $ | 151,018 | |
| | | | | | | | | | | | | |
| SHORT-TERM INVESTMENTS - 1.5% |
| Repurchase Agreements - 1.5% |
| | | | | Bank of America Merrill Lynch TriParty Joint
Repurchase Agreement (maturing on
05/01/2012 in the amount of $585,
collateralized by FHLB 4.91%, 2015,
FHLMC 2.46% - 3.33%, 2040 - 2042,
FNMA 2.24% - 5.50%, 2024 - 2042, value
of $597) | | | | | | | | |
| $ | 585 | | | 0.20%, 04/30/2012 | | | | | | $ | 585 | |
| | | | | Barclays Capital TriParty Joint Repurchase
Agreement (maturing on 05/01/2012 in the
amount of $784, collateralized by FHLMC
4.00% - 4.50%, 2039 - 2041, FNMA 3.00%
- 5.00%, 2027 - 2040, value of $800) | | | | | | | | |
| | 784 | | | 0.20%, 04/30/2012 | | | | | | | 784 | |
| | | | | Deutsche Bank Securities TriParty Joint
Repurchase Agreement (maturing on
05/01/2012 in the amount of $310,
collateralized by FNMA 3.00% - 7.00%,
2023 - 2042, value of $316) | | | | | | | | |
| | 310 | | | 0.21%, 04/30/2012 | | | | | | | 310 | |
| | | | | TD Securities TriParty Joint Repurchase
Agreement (maturing on 05/01/2012 in the
amount of $257, collateralized by FFCB
0.27% - 5.38%, 2012 - 2020, FHLB 0.88% -
1.38%, 2013 - 2014, FHLMC 4.00% -
6.00%, 2014 - 2041, FNMA 4.00% - 4.50%,
2025 - 2042, value of $262) | | | | | | | | |
| | 257 | | | 0.19%, 04/30/2012 | | | | | | | 257 | |
| | | | | UBS Securities, Inc. Joint Repurchase
Agreement (maturing on 05/01/2012 in the
amount of $-, collateralized by U.S.
Treasury Note 0.75%, 2013, value of $-) | | | | | | | | |
| | — | | | 0.17%, 04/30/2012 | | | | | | | — | |
| | | | | UBS Securities, Inc. TriParty Joint Repurchase
Agreement (maturing on 05/01/2012 in the
amount of $421, collateralized by FHLMC
4.00%, 2026 - 2042, FNMA 2.50% - 4.50%,
2022 - 2042, value of $429) | | | | | | | | |
| | 421 | | | 0.21%, 04/30/2012 | | | | | | | 421 | |
| | | | | | | | | | | | 2,357 | |
| | | | | Total short-term investments | | | | | | | | |
| | | | | (cost $2,357) | | | | | | $ | 2,357 | |
| | | | | | | | | | | | | |
| | | | | Total investments | | | | | | | | |
| | | | | (cost $147,330) ▲ | | | 99.8 | % | | $ | 153,375 | |
| | | | | Other assets and liabilities | | | 0.2 | % | | | 243 | |
| | | | | Total net assets | | | 100.0 | % | | $ | 153,618 | |
The accompanying notes are an integral part of these financial statements.
| Note: | Percentage of investments as shown is the ratio of the total market value to total net assets. |
| | |
| | Prices of foreign equities that are principally traded on certain foreign markets may be adjusted daily pursuant to a fair value pricing service approved by the Board of Directors in order to reflect an adjustment for factors occurring after the close of certain foreign markets but before the close of the New York Stock Exchange. |
| ▲ | At April 30, 2012, the cost of securities for federal income tax purposes was $148,465 and the aggregate gross unrealized appreciation and depreciation based on that cost were: |
| Unrealized Appreciation | | $ | 14,481 | |
| Unrealized Depreciation | | | (9,571 | ) |
| Net Unrealized Appreciation | | $ | 4,910 | |
| † | These securities were valued in good faith at fair value as determined under policies and procedures established by and under the supervision of the Company's Board of Directors. At April 30, 2012, the aggregate value of these securities was $1,750, which represents 1.1% of total net assets. This amount excludes securities that are principally traded in certain foreign markets and whose prices are adjusted pursuant to a third party pricing service methodology approved by the Board of Directors. |
| ● | Non-income producing. |
| | |
| ‡ | This security, or a portion of this security, has been segregated to cover funding requirements on investment transactions settling in the future. |
| | |
| ■ | Securities issued within terms of a private placement memorandum, exempt from registration under Rule 144A under the Securities Act of 1933, as amended, and may be sold only to qualified institutional buyers. Unless otherwise indicated, these issues are determined to be liquid. At April 30, 2012, the aggregate value of these securities was $904, which represents 0.6% of total net assets. |
| ⌂ | The following securities are considered illiquid. Illiquid securities are often purchased in private placement transactions, are often not registered under the Securities Act of 1933 and may have contractual restrictions on resale. A security may also be considered illiquid if the security lacks a readily available market or if its valuation has not changed for a certain period of time. |
| Period Acquired | | Shares/ Par | | | Security | | Cost Basis | |
| 08/2011 | | | 572 | | | Allstar Co. | | | 582 | |
| 07/2007 - 05/2008 | | | 25 | | | Oaktree Capital - 144A | | | 870 | |
| 03/2007 | | | 74 | | | Solar Cayman Ltd. - 144A | | | 22 | |
| | At April 30, 2012, the aggregate value of these securities was $1,750, which represents 1.1% of total net assets. |
| ☼ | This security, or a portion of this security, was purchased on a when-issued, delayed delivery or delayed draw basis. The cost of these securities was $22 at April 30, 2012. |
Foreign Currency Contracts Outstanding at April 30, 2012
| Description | | | Counterparty | | | Buy / Sell | | Market Value ╪ | | | Contract
Amount | | | Delivery Date | | Unrealized
Appreciation/
(Depreciation) | |
| CHF | | | BCLY | | | Buy | | $ | 14 | | | $ | 14 | | | 05/03/2012 | | $ | — | |
| EUR | | | CBK | | Buy | | | 5 | | | | 5 | | | 05/03/2012 | | | — | |
| JPY | | | CSFB | | | Buy | | | 3 | | | | 3 | | | 05/07/2012 | | | — | |
| | | | | | | | | | | | | | | | | | | | | $ | — | |
| ╪ | See Significant Accounting Policies of accompanying Notes to Financial Statements regarding valuation of securities. |
The accompanying notes are an integral part of these financial statements.
The Hartford Value Opportunities Fund
| Schedule of Investments – (continued) |
| April 30, 2012 (Unaudited) |
| (000’s Omitted) |
| GLOSSARY: (abbreviations used in preceding Schedule of Investments) |
| Counterparty Abbreviations: |
| BCLY | Barclays Capital, Inc. |
| CBK | Citibank NA |
| CSFB | Credit Suisse First Boston Corp. |
| Currency Abbreviations: |
| CHF | Swiss Franc |
| EUR | EURO |
| JPY | Japanese Yen |
| Other Abbreviations: |
| ADR | American Depositary Receipt |
| FFCB | Federal Farm Credit Bank |
| FHLB | Federal Home Loan Bank |
| FHLMC | Federal Home Loan Mortgage Corp. |
| FNMA | Federal National Mortgage Association |
The accompanying notes are an integral part of these financial statements.
The Hartford Value Opportunities Fund
| Investment Valuation Hierarchy Level Summary |
| April 30, 2012 (Unaudited) |
| (000’s Omitted) |
| | | Total | | | Level 1 ♦ | | | Level 2 ♦ | | | Level 3 | |
| Assets: | | | | | | | | | | | | | | | | |
| Common Stocks ‡ | | $ | 151,018 | | | $ | 136,712 | | | $ | 12,556 | | | $ | 1,750 | |
| Short-Term Investments | | | 2,357 | | | | — | | | | 2,357 | | | | — | |
| Total | | $ | 153,375 | | | $ | 136,712 | | | $ | 14,913 | | | $ | 1,750 | |
| Foreign Currency Contracts * | | | — | | | | — | | | | — | | | | — | |
| Total | | $ | — | | | $ | — | | | $ | — | | | $ | — | |
| Liabilities: | | | | | | | | | | | | | | | | |
| Foreign Currency Contracts * | | | — | | | | — | | | | — | | | | — | |
| Total | | $ | — | | | $ | — | | | $ | — | | | $ | — | |
| ♦ | For the six-month period ended April 30, 2012, there were no transfers between Level 1 and Level 2. |
| ‡ | The Fund has all or primarily all of the equity securities categorized in a particular level. Refer to the Schedule of Investments for further industry breakout. |
| * | Derivative instruments not reflected in the Schedule of Investments are valued at the unrealized appreciation/depreciation on the investments. |
| Following is a reconciliation of Level 3 assets for which significant unobservable inputs were used to determine fair value: |
| | | Balance
as of
October
31, 2011 | | | Realized
Gain
(Loss) | | | Change in
Unrealized
Appreciation
(Depreciation) | | | Net
Amortization | | | Purchases | | | Sales | | | Transfers
Into
Level 3 | | | Transfers
Out of
Level 3 | | | Balance
as of
April 30,
2012 | |
| Assets: | | | | | | | | | | | | | | | | | | | | | | | | | | | | | | | | | | | | |
| Common Stocks | | $ | 1,646 | | | $ | — | | | $ | 104 | * | | $ | — | | | $ | — | | | $ | — | | | $ | — | | | $ | — | | | $ | 1,750 | |
| Total | | $ | 1,646 | | | $ | — | | | $ | 104 | | | $ | — | | | $ | — | | | $ | — | | | $ | — | | | $ | — | | | $ | 1,750 | |
| | * | Change in unrealized appreciation (depreciation) in the current period relating to assets still held at April 30, 2012 was $104. |
The accompanying notes are an integral part of these financial statements.
The Hartford Value Opportunities Fund
| Statement of Assets and Liabilities |
| April 30, 2012 (Unaudited) |
| (000’s Omitted) |
| Assets: | | | | |
| Investments in securities, at market value (cost $147,330) | | $ | 153,375 | |
| Cash | | | 1 | |
| Unrealized appreciation on foreign currency contracts | | | — | |
| Receivables: | | | | |
| Investment securities sold | | | 1,092 | |
| Fund shares sold | | | 87 | |
| Dividends and interest | | | 159 | |
| Other assets | | | 63 | |
| Total assets | | | 154,777 | |
| Liabilities: | | | | |
| Unrealized depreciation on foreign currency contracts | | | — | |
| Payables: | | | | |
| Investment securities purchased | | | 922 | |
| Fund shares redeemed | | | 167 | |
| Investment management fees | | | 20 | |
| Administrative fees | | | — | |
| Distribution fees | | | 6 | |
| Accrued expenses | | | 44 | |
| Total liabilities | | | 1,159 | |
| Net assets | | $ | 153,618 | |
| Summary of Net Assets: | | | | |
| Capital stock and paid-in-capital | | $ | 200,545 | |
| Undistributed net investment income | | | 432 | |
| Accumulated net realized loss | | | (53,407 | ) |
| Unrealized appreciation of investments and the translation of assets and liabilities denominated in foreign currency | | | 6,048 | |
| Net assets | | $ | 153,618 | |
| | | | | |
| Shares authorized | | | 27,000,000 | |
| Par value | | $ | 0.0001 | |
| Class A: Net asset value per share/Maximum offering price per share | | | $13.89/$14.70 | |
| Shares outstanding | | | 6,472 | |
| Net assets | | $ | 89,912 | |
| Class B: Net asset value per share | | $ | 12.47 | |
| Shares outstanding | | | 423 | |
| Net assets | | $ | 5,271 | |
| Class C: Net asset value per share | | $ | 12.43 | |
| Shares outstanding | | | 803 | |
| Net assets | | $ | 9,982 | |
| Class I: Net asset value per share | | $ | 13.73 | |
| Shares outstanding | | | 274 | |
| Net assets | | $ | 3,759 | |
| Class R3: Net asset value per share | | $ | 14.05 | |
| Shares outstanding | | | 90 | |
| Net assets | | $ | 1,258 | |
| Class R4: Net asset value per share | | $ | 14.13 | |
| Shares outstanding | | | 471 | |
| Net assets | | $ | 6,651 | |
| Class R5: Net asset value per share | | $ | 14.20 | |
| Shares outstanding | | | 15 | |
| Net assets | | $ | 208 | |
| Class Y: Net asset value per share | | $ | 14.27 | |
| Shares outstanding | | | 2,563 | |
| Net assets | | $ | 36,577 | |
The accompanying notes are an integral part of these financial statements.
The Hartford Value Opportunities Fund
Statement of Operations
| For the Six-Month Period Ended April 30, 2012 (Unaudited) |
| (000’s Omitted) |
| Investment Income: | | | | |
| Dividends | | $ | 1,692 | |
| Interest | | | 1 | |
| Less: Foreign tax withheld | | | (34 | ) |
| Total investment income | | | 1,659 | |
| Expenses: | | | | |
| Investment management fees | | | 577 | |
| Administrative services fees | | | 6 | |
| Transfer agent fees | | | 174 | |
| Distribution fees | | | | |
| Class A | | | 108 | |
| Class B | | | 27 | |
| Class C | | | 50 | |
| Class R3 | | | 3 | |
| Class R4 | | | 8 | |
| Custodian fees | | | 5 | |
| Accounting services fees | | | 10 | |
| Registration and filing fees | | | 52 | |
| Board of Directors' fees | | | 2 | |
| Audit fees | | | 6 | |
| Other expenses | | | 19 | |
| Total expenses (before waivers and fees paid indirectly) | | | 1,047 | |
| Expense waivers | | | (58 | ) |
| Transfer agent fee waivers | | | (22 | ) |
| Commission recapture | | | (1 | ) |
| Total waivers and fees paid indirectly | | | (81 | ) |
| Total expenses, net | | | 966 | |
| Net Investment Income | | | 693 | |
| Net Realized Gain on Investments and Foreign Currency Transactions: | | | | |
| Net realized gain on investments in securities | | | 2,164 | |
| Net realized loss on foreign currency contracts | | | (20 | ) |
| Net realized gain on other foreign currency transactions | | | 14 | |
| Net Realized Gain on Investments and Foreign Currency Transactions | | | 2,158 | |
| Net Changes in Unrealized Appreciation of Investments and Foreign Currency Transactions: | | | | |
| Net unrealized appreciation of investments | | | 12,033 | |
| Net unrealized depreciation of foreign currency contracts | | | (1 | ) |
| Net unrealized appreciation on translation of other assets and liabilities in foreign currencies | | | 3 | |
| Net Changes in Unrealized Appreciation of Investments and Foreign Currency Transactions | | | 12,035 | |
| Net Gain on Investments and Foreign Currency Transactions | | | 14,193 | |
| Net Increase in Net Assets Resulting from Operations | | $ | 14,886 | |
The accompanying notes are an integral part of these financial statements.
The Hartford Value Opportunities Fund
Statement of Changes in Net Assets
| | | For the Six-Month
Period Ended
April 30, 2012
(Unaudited) | | | For the
Year Ended
October 31, 2011 | |
| Operations: | | | | | | | | |
| Net investment income | | $ | 693 | | | $ | 1,014 | |
| Net realized gain on investments and foreign currency transactions | | | 2,158 | | | | 16,893 | |
| Net unrealized appreciation (depreciation) of investments and foreign currency transactions | | | 12,035 | | | | (11,581 | ) |
| Net Increase In Net Assets Resulting From Operations | | | 14,886 | | | | 6,326 | |
| Distributions to Shareholders: | | | | | | | | |
| From net investment income | | | | | | | | |
| Class A | | | (767 | ) | | | (32 | ) |
| Class B | | | (8 | ) | | | — | |
| Class C | | | (27 | ) | | | — | |
| Class I | | | (45 | ) | | | (6 | ) |
| Class L* | | | — | | | | (56 | ) |
| Class R3 | | | (8 | ) | | | — | |
| Class R4 | | | (63 | ) | | | (10 | ) |
| Class R5 | | | (3 | ) | | | (1 | ) |
| Class Y | | | (445 | ) | | | (137 | ) |
| Total distributions | | | (1,366 | ) | | | (242 | ) |
| Capital Share Transactions: | | | | | | | | |
| Class A | | | (4,561 | ) | | | 16,118 | |
| Class B | | | (1,082 | ) | | | (1,542 | ) |
| Class C | | | (1,173 | ) | | | (1,160 | ) |
| Class I | | | 925 | | | | 1,162 | |
| Class L* | | | — | | | | (25,432 | ) |
| Class R3 | | | 213 | | | | (143 | ) |
| Class R4 | | | 185 | | | | 550 | |
| Class R5 | | | (36 | ) | | | 63 | |
| Class Y | | | (659 | ) | | | 3,879 | |
| Net decrease from capital share transactions | | | (6,188 | ) | | | (6,505 | ) |
| Net Increase (Decrease) In Net Assets | | | 7,332 | | | | (421 | ) |
| Net Assets: | | | | | | | | |
| Beginning of period | | | 146,286 | | | | 146,707 | |
| End of period | | $ | 153,618 | | | $ | 146,286 | |
| Undistributed (distribution in excess of) net investment income (loss) | | $ | 432 | | | $ | 1,105 | |
| | * | Class L merged into Class A on August 5, 2011. Please refer to the Notes to Financial Statements for further details. |
The accompanying notes are an integral part of these financial statements.
The Hartford Value Opportunities Fund
| Notes to Financial Statements |
| April 30, 2012 (Unaudited) |
| (000’s Omitted) |
The Hartford Mutual Funds II, Inc. (“Company”) is an open-end management investment company comprised of five portfolios. Financial statements for The Hartford Value Opportunities Fund (the “Fund”), a series of the Company, are included in this report.
The Company is organized under the laws of the State of Maryland and is registered with the Securities and Exchange Commission (“SEC”) under the Investment Company Act of 1940, as amended (“1940 Act”). The Fund is a diversified open-end management investment company.
Class A shares are sold with a front-end sales charge of up to 5.50%. Class B shares were sold with a contingent deferred sales charge which is assessed on the lesser of the per share net asset value (“NAV”) of the shares at the time of redemption or the original purchase price, and declines from up to 5.00% to zero depending on the period of time the shares are held (see note below regarding the closing of Class B shares). Class C shares are sold with a contingent deferred sales charge of up to 1.00% on shares redeemed within twelve months of purchase. Class I shares are sold without sales charges to certain eligible investors primarily through advisory fee-based wrap programs. Class R3, R4 and R5 shares, which are offered to employer-sponsored retirement plans, and Class Y shares, which are sold to certain eligible institutional investors, are sold without a sales charge. All classes of shares have identical voting, redemption, dividend, liquidation and other rights and the same terms and conditions, with the exceptions that each class may have different expenses, which may affect performance, and that Class B shares automatically convert to Class A shares after 8 years.
No new or additional investments are allowed in Class B shares of The Hartford Mutual Funds (including investments through any systematic investment plan). Existing shareholders of Class B shares may continue to hold their Class B shares, exchange their Class B shares for Class B shares of another Hartford Mutual Fund (as permitted by existing exchange privileges), or redeem their Class B shares as described in the Fund’s prospectus. Reinstatement privileges with respect to Class B shares will continue under the current policy. For investors electing to reinvest capital gains and dividends, any such capital gains or dividends on Class B shares will continue to be reinvested in Class B shares of the Fund. All Class B share attributes, including the 12b-1 fee, contingent deferred sales charge schedule, and conversion to Class A shares, remain unchanged.
| 2. | Significant Accounting Policies: |
The following is a summary of significant accounting policies of the Fund in the preparation of its financial statements, which are in accordance with the United States Generally Accepted Accounting Principles (“U.S. GAAP”). The preparation of financial statements in accordance with U.S. GAAP may require management to make estimates and assumptions that affect the reported amounts of assets and liabilities and disclosure of contingent assets and liabilities at the date of the financial statements and the reported amounts of increases and decreases in net assets from operations during the reporting period. Actual results could differ from those estimates.
| | a) | Determination of Net Asset Value – The NAV of each class of the Fund’s shares is determined as of the close of regular trading (normally 4:00 p.m. Eastern Time) (the “NYSE Close”) on each day that the New York Stock Exchange (the “Exchange”) is open (“Valuation Date”). Information that becomes known to the Fund after the NAV has been calculated on a particular day will not generally be used to retroactively adjust the NAV determined earlier that day. |
| | b) | Investment Valuation and Fair Value Measurements – For purposes of calculating the NAV, portfolio investments and other assets held by the Fund's portfolio for which market quotes are readily available are valued at market value. Market value is generally determined on the basis of last reported sales prices or official close price. If no sales are reported, market value is based on quotes obtained from a quotation reporting system, established market makers, or independent pricing services. If market prices are not readily available or are deemed unreliable, the Fund will use the fair value of |
The Hartford Value Opportunities Fund
Notes to Financial Statements – (continued)
| April 30, 2012 (Unaudited) |
| (000’s Omitted) |
the investment as determined in good faith under policies and procedures established by and under the supervision of the Company’s Board of Directors. Market quotes are considered not readily available where there is an absence of current or reliable market-based data (e.g., trade information or broker quotes), including where events occur after the close of the relevant market, but prior to the NYSE Close that materially affect the values of the Fund’s portfolio investments or assets. In addition, market quotes are considered not readily available when, due to extraordinary circumstances, the exchanges or markets on which the investments trade do not open for trading for the entire day and no other market prices are available. In addition, prices of foreign equities that are principally traded on certain foreign markets are adjusted daily pursuant to a fair value pricing service approved by the Board of Directors in order to reflect an adjustment for the factors occurring after the close of certain foreign markets but before the NYSE Close. Investments that are primarily traded on foreign markets may trade on days that are not business days of the Fund. The value of the foreign investments in which the Fund invests may change on days when a shareholder will not be able to purchase or redeem shares of the Fund. Fair value pricing is subjective in nature and the use of fair value pricing by the Fund may cause the NAV of its shares to differ significantly from the NAV that would have been calculated using market prices at the close of the exchange on which a portfolio investment is primarily traded. There can be no assurance that the Fund could obtain the fair market value assigned to an investment if the Fund were to sell the investment at approximately the time at which the Fund determines its NAV.
Investments valued in currencies other than U.S. dollars are converted to U.S. dollars using exchange rates obtained from independent pricing services for calculation of the NAV. As a result, the NAV of the Fund’s shares may be affected by changes in the value of currencies in relation to the U.S. dollar. The value of investments traded in markets outside the United States or denominated in currencies other than the U.S. dollar may be affected significantly on a day that the NYSE is closed and the market value may change on days when an investor is not able to purchase, redeem or exchange shares of the Fund.
Foreign currency contracts represent agreements to exchange currencies on specific future dates at predetermined rates. Foreign currency contracts are valued using foreign currency exchange rates and forward rates as provided by an independent pricing service on the Valuation Date.
Financial instruments for which prices are not available from an independent pricing service may be valued using market quotations obtained from one or more dealers that make markets in the respective financial instrument in accordance with procedures established by the Company’s Board of Directors.
U.S. GAAP defines fair value as the price that the Fund would receive to sell an asset or pay to transfer a liability in an orderly transaction between market participants. The U.S. GAAP fair value measurement standards require disclosure of a fair value hierarchy for each major category of assets and liabilities. Various inputs are used in determining the fair value of the Fund’s investments. These inputs are summarized into three broad hierarchy levels. This hierarchy is based on whether the valuation inputs are observable or unobservable. These levels are:
| | · | Level 1 – Quoted prices in active markets for identical investments. Level 1 may include exchange traded instruments, such as domestic equities, some foreign equities, options, futures, mutual funds, exchange traded funds, rights and warrants. |
| | · | Level 2 – Observable inputs other than Level 1 prices, such as quoted prices for similar investments; quoted prices in markets that are not active; or other inputs that are observable or can be corroborated by observable market data. Level 2 may include debt investments that are traded less frequently than exchange traded instruments and which are valued using independent pricing services; foreign equities, which are principally traded on certain foreign markets and are adjusted daily pursuant to a fair value pricing service in order to reflect an adjustment for the factors occurring after the close of certain foreign markets but before the NYSE Close; and short-term investments, which are valued at amortized cost. |
| | · | Level 3 – Significant unobservable inputs that are supported by limited or no market activity. Level 3 may include financial instruments whose values are determined using broker quotes or require significant |
management judgment or estimation. These unobservable valuation inputs may include estimates for current yields, maturity/duration, prepayment speed, and broker quotes for comparable investments along with other assumptions relating to credit quality, collateral value, complexity of the investment structure, general market conditions and liquidity. This category may include investments where trading has been halted or there are certain restrictions on trading. While these investments are priced using unobservable inputs, the valuation of these investments reflects the best available data and management believes the prices are a reasonable representation of exit price.
Valuation levels are not necessarily indicative of the risk associated with investing in such investments. Individual investments within any of the above mentioned asset classes may be assigned a different hierarchical level than those presented above, as individual circumstances dictate.
For additional information, refer to the Investment Valuation Hierarchy Level Summary and the Level 3 roll-forward reconciliation which follow the Schedule of Investments.
For purposes of reporting transfers between different hierarchy levels, both transfers in and out of each level, as applicable, are shown as if they occurred at the beginning of the period.
| | c) | Investment Transactions and Investment Income – Investment transactions are recorded as of the trade date (the date the order to buy or sell is executed) for financial reporting purposes. Investments purchased or sold on a when-issued or delayed-delivery basis may be settled a month or more after the trade date. Realized gains and losses are determined on the basis of identified cost. |
Dividend income is accrued as of the ex-dividend date, except certain dividends from foreign investments where the ex-dividend date may have passed are recorded as soon as the Fund is informed of the dividend. Interest income, including amortization of premium and accretion of discounts, is accrued on a daily basis.
| | d) | Foreign Currency Transactions – Assets and liabilities denominated in currencies other than U.S. dollars are translated into U.S. dollars at the exchange rates in effect on the valuation date. Purchases and sales of investments, income, and expenses are translated into U.S. dollars at the exchange rates on the dates of such transactions. |
The Fund does not isolate that portion of portfolio investment valuation resulting from fluctuations in the foreign currency exchange rates from the fluctuations arising from changes in the market prices of investments held. Exchange rate fluctuations are included with the net realized and unrealized gain or loss on investments in the accompanying financial statements.
Net realized foreign exchange gains or losses arise from sales of foreign currencies and the difference between asset and liability amounts initially stated in foreign currencies and the U.S. dollar value of the amounts actually received or paid. Net unrealized foreign exchange gains or losses arise from changes in the value of other assets and liabilities at the end of the reporting period, resulting from changes in the exchange rates.
| | e) | Joint Trading Account – The Fund may invest cash balances into a joint trading account that may be invested in one or more repurchase agreements. |
| | f) | Fund Share Valuation and Dividend Distributions to Shareholders – Orders for the Fund’s shares are executed in accordance with the investment instructions of the shareholders. The NAV of the Fund’s shares is determined as of the close of business on each business day of the Exchange. The NAV is determined separately for each class of shares of the Fund by dividing the Fund’s net assets attributable to that class by the number of shares of the class outstanding. Each class of shares offered by the Fund has equal rights as to assets and voting privileges (except that shareholders of a class have exclusive voting rights regarding any matter relating solely to that class of shares). Income and non-class |
The Hartford Value Opportunities Fund
Notes to Financial Statements – (continued)
| April 30, 2012 (Unaudited) |
| (000’s Omitted) |
specific expenses are allocated daily to each class on the basis of the relative net assets of the class. Realized and unrealized capital gains and losses are allocated daily based on the relative net assets of each class of shares of the Fund.
Orders for the purchase of the Fund’s shares received prior to the close of the Exchange on any day the Exchange is open for business are priced at the NAV determined as of the close of the Exchange. Orders received after the close of the Exchange, or on a day on which the Exchange and/or the Fund is not open for business, are priced at the next determined NAV.
Dividends are declared pursuant to a policy adopted by the Company’s Board of Directors based upon the investment performance of the Fund. The policy of the Fund is to pay dividends from net investment income and realized capital gains, if any, at least once a year.
Distributions from net investment income, net realized capital gains and capital are determined in accordance with federal income tax regulations, which may differ from U.S. GAAP with respect to character and timing. These differences may include but are not limited to losses deferred due to wash sale adjustments, foreign currency gains and losses, adjustments related to Passive Foreign Investment Companies (“PFICs”), Real Estate Investment Trusts (“REITs”), Regulated Investment Companies (“RICs”), certain derivatives and partnerships. Permanent book and federal income tax basis differences relating to shareholder distributions will result in reclassifications to certain of the Fund’s capital accounts (see Federal Income Taxes: Reclassification of Capital Accounts note).
| | 3. | Securities and Other Investments: |
| | a) | Repurchase Agreements – A repurchase agreement is an agreement by which a counterparty agrees to sell an investment and agrees to repurchase the investment sold at a mutually agreed upon time and price. At the time the Fund enters into a repurchase agreement, the value of the underlying collateral, including accrued interest, will be equal to or exceed the value of the repurchase agreement. Repurchase agreements expose the Fund to counterparty risk. To minimize counterparty risk, the investments that serve to collateralize the repurchase agreement are held by the Fund’s custodian in book entry or physical form in the custodial account of the Fund or in a third party custodial account. Repurchase agreements are valued at cost plus accrued interest. The Fund, as shown on the Schedule of Investments, had outstanding repurchase agreements as of April 30, 2012. |
| | b) | Illiquid and Restricted Investments – The Fund is permitted to invest up to 15% of its net assets in illiquid investments. Illiquid investments are those that may not be sold or disposed of in the ordinary course of business within seven days, at approximately the price used to determine the Fund’s NAV. The Fund may not be able to sell illiquid investments when its sub-adviser considers it desirable to do so or may have to sell such investments at a price that is lower than the price that could be obtained if the investments were more liquid. A sale of illiquid investments may require more time and may result in higher dealer discounts and other selling expenses than does the sale of those that are liquid. Illiquid investments also may be more difficult to value due to the unavailability of reliable market quotations for such investments, and an investment in them may have an adverse impact on the Fund’s NAV. The Fund may also purchase certain restricted investments that can only be resold to certain qualified investors and may be determined to be liquid pursuant to policies and guidelines established by the Company’s Board of Directors. The Fund, as shown on the Schedule of Investments, had illiquid and/or restricted investments as of April 30, 2012. |
| | c) | Investments Purchased on a When-Issued or Delayed-Delivery Basis – Delivery and payment for investments that have been purchased by the Fund on a forward commitment, or when-issued or delayed-delivery basis, take place beyond the customary settlement period. A fund may dispose of or renegotiate a delayed-delivery transaction after it is entered into, and may sell delayed-delivery investments before they are delivered, which may result in a realized gain or loss. During this period, such investments are subject to market fluctuations, and the Fund identifies investments segregated in its records with a value at least equal to the amount of the commitment. The Fund, as shown on the Schedule of Investments, had when-issued or delayed delivery investments as of April 30, 2012. |
| | 4. | Financial Derivative Instruments: |
The following disclosures contain information on how and why the Fund uses derivative instruments, the credit-risk-related contingent features in certain derivative instruments, and how derivative instruments affect the Fund’s financial position and results of operations. The location and fair value amounts of these instruments on the Statement of Assets and Liabilities and the realized gains and losses and changes in unrealized gains and losses on the Statement of Operations, each categorized by type of derivative contract, are included in the following Additional Derivative Instrument Information footnote. The derivative instruments outstanding as of period-end are disclosed in the notes to the Schedule of Investments and the amounts of realized gains and losses and changes in unrealized gains and losses on derivative instruments during the period are disclosed in the Statement of Operations.
| | a) | Foreign Currency Contracts – The Fund may enter into foreign currency contracts that obligate the Fund to purchase or sell currencies at specified future dates. Foreign currency contracts are used to hedge the currency exposure associated with some or all of the Fund’s investments and/or as part of an investment strategy. Foreign currency contracts are marked to market daily and the change in value is recorded by the Fund as an unrealized gain or loss. The Fund will record a realized gain or loss when the foreign currency contract is settled. |
Foreign currency contracts involve elements of market risk in excess of the amounts reflected in the Statement of Assets and Liabilities. In addition, risks may arise upon entering into these contracts from the potential inability of the counterparties to meet the terms of the contracts and from unanticipated movements in the value of the foreign currencies relative to the U.S. dollar. The Fund had outstanding foreign currency contracts as shown on the Schedule of Investments as of April 30, 2012.
| | b) | Additional Derivative Instrument Information: |
Fair Values of Derivative Instruments on the Statement of Assets and Liabilities as of April 30, 2012:
| | | Risk Exposure Category | |
| | | Interest Rate
Contracts | | Foreign
Exchange
Contracts | | Credit
Contracts | | Equity
Contracts | | Commodity
Contracts | | Other
Contracts | | Total | |
| Assets: | | | | | | | | | | | | | | | |
| Unrealized appreciation on foreign currency contracts | | $ | — | | $ | — | | $ | — | | $ | — | | $ | — | | $ | — | | $ | — | |
| Total | | $ | — | | $ | — | | $ | — | | $ | — | | $ | — | | $ | — | | $ | — | |
| | | | | | | | | | | | | | | | | | | | | | | |
| Liabilities: | | | | | | | | | | | | | | | |
| Unrealized depreciation on foreign currency contracts | | $ | — | | $ | — | | $ | — | | $ | — | | $ | — | | $ | — | | $ | — | |
| Total | | $ | — | | $ | — | | $ | — | | $ | — | | $ | — | | $ | — | | $ | — | |
The volume of derivative activity was minimal during the six-month period ended April 30, 2012.
The Hartford Value Opportunities Fund
| Notes to Financial Statements – (continued) |
| April 30, 2012 (Unaudited) |
| (000’s Omitted) |
The Effect of Derivative Instruments on the Statement of Operations for the six-month period ended April 30, 2012:
| | | Risk Exposure Category | |
| | | Interest Rate
Contracts | | | Foreign
Exchange
Contracts | | | Credit
Contracts | | | Equity
Contracts | | | Commodity
Contracts | | | Other
Contracts | | | Total | |
| Realized Gain (Loss) on Derivatives Recognized as a Result of Operations: |
| Net realized loss on foreign currency contracts | | $ | — | | | $ | (20 | ) | | $ | — | | | $ | — | | | $ | — | | | $ | — | | | $ | (20 | ) |
| Total | | $ | — | | | $ | (20 | ) | | $ | — | | | $ | — | | | $ | — | | | $ | — | | | $ | (20 | ) |
| | | | | | | | | | | | | | | | | | | | | | | | | | | | | |
| Net Change in Unrealized Appreciation (Depreciation) on Derivatives Recognized as a Result of Operations: |
| Net change in unrealized depreciation of foreign currency contracts | | $ | — | | | $ | (1 | ) | | $ | — | | | $ | — | | | $ | — | | | $ | — | | | $ | (1 | ) |
| Total | | $ | — | | | $ | (1 | ) | | $ | — | | | $ | — | | | $ | — | | | $ | — | | | $ | (1 | ) |
| | a) | Counterparty Risk – The Fund may be exposed to counterparty risk, or the risk that an institution or other entity with which the Fund has unsettled or open transactions will default. |
| | b) | Market Risks – If the Fund invests directly in foreign currencies or in securities that trade in, and receive revenues in, foreign currencies, or in derivatives that provide exposure to foreign currencies, it will be subject to the risk that those currencies will decline in value relative to the base currency of the Fund, or, in the case of hedging positions, that the Fund’s base currency will decline in value relative to the currency being hedged. Currency rates in foreign countries may fluctuate significantly over short periods of time for a number of reasons, including changes in interest rates, intervention (or the failure to intervene) by U.S. or foreign governments, central banks or supranational entities, such as the International Monetary Fund, or by the imposition of currency controls or other political developments in the United States or abroad. As a result, the Fund’s investments in foreign currency denominated securities may reduce the returns of the Fund. The market values of equity securities, such as common stocks and preferred stocks, or equity related investments, such as futures and options, may decline due to general market conditions which are not specifically related to a particular company, such as real or perceived adverse economic conditions, changes in the general outlook for corporate earnings, changes in interest or currency rates or adverse investor sentiment generally. The market value of equity securities may also decline due to factors which affect a particular industry or industries, such as labor shortages or increased production costs and competitive conditions within an industry. Equity securities and equity related investments generally have greater market price volatility than fixed income securities. |
6. Federal Income Taxes:
| | a) | Federal Income Taxes – For federal income tax purposes, the Fund intends to continue to qualify as a RIC under Subchapter M of the Internal Revenue Code (“IRC”) by distributing substantially all of its taxable net investment income and net realized capital gains to its shareholders and otherwise complying with the requirements of RICs. The Fund has distributed substantially all of its income and capital gains in prior years, if applicable, and intends to distribute substantially all of its income and capital gains during the calendar year ending December 31, 2012. Accordingly, no provision for federal income or excise taxes has been made in the accompanying financial statements. Distributions from short-term capital gains are treated as ordinary income distributions for federal income tax purposes. |
| | b) | Net Investment Income (Loss), Net Realized Gains (Losses) – Net investment income (loss) and net realized gains (losses) may differ for financial statement and tax purposes primarily because of losses deferred due to wash sale adjustments, foreign currency gains and losses, adjustments related to PFICs, REITs, RICs, certain derivatives and partnerships. The character of distributions made during the year from net investment income or net realized gains may differ from their ultimate characterization for federal income tax purposes. Also, due to the timing of dividend |
distributions, the fiscal year in which amounts are distributed may differ from the year that the income or realized gains (losses) were recorded by the Fund.
| | c) | Distributions and Components of Distributable Earnings – The tax character of distributions paid by the Fund for the periods indicated is as follows (as adjusted for dividends payable): |
| | | For the Year Ended
October 31, 2011 | | | For the Year Ended
October 31, 2010 | |
| Ordinary Income | | $ | 242 | | | $ | 538 | |
As of October 31, 2011, the Fund’s components of distributable earnings (deficit) on a tax basis were as follows:
| | | Amount | |
| Undistributed Ordinary Income | | $ | 1,105 | |
| Accumulated Capital Losses * | | | (54,430 | ) |
| Unrealized Depreciation † | | | (7,122 | ) |
| Total Accumulated Deficit | | $ | (60,447 | ) |
| | * | The Fund has capital loss carryforwards that are identified in the Capital Loss Carryforward note that follows. |
| | † | The differences between book-basis and tax-basis unrealized appreciation (depreciation) may be attributable to the losses deferred due to wash sale adjustments, foreign currency gains and losses, adjustments related to PFICs, REITs, RICs, certain derivatives and partnerships. |
| | d) | Reclassification of Capital Accounts – The Fund may record reclassifications in its capital accounts. These reclassifications have no impact on the total net assets of the Fund. The reclassifications are a result of permanent differences between U.S. GAAP and tax accounting for such items as foreign currency, PFICs, expiration or utilization of capital loss carryforwards or net operating losses. Adjustments are made to reflect the impact these items have on current and future distributions to shareholders. Therefore, the source of the Fund’s distributions may be shown in the accompanying Statement of Changes in Net Assets as from undistributed net investment income, from accumulated net realized gains on investments or from capital depending on the type of book and tax differences that exist. For the year ended October 31, 2011, the Fund recorded reclassifications to increase (decrease) the accounts listed below: |
| | | Amount | |
| Undistributed Net Investment Income | | $ | 28 | |
| Accumulated Net Realized Gain (Loss) | | | (29 | ) |
| Capital Stock and Paid-in-Capital | | | 1 | |
| | e) | Capital Loss Carryforward – On December 22, 2010, the Regulated Investment Company Modernization Act of 2010 (the “Act”) was enacted, which made changes to the capital loss carryforward rules. The changes are effective for taxable years beginning after the date of enactment. Under the Act, funds are permitted to carry forward capital losses for an unlimited period. However, any losses incurred during those future taxable years will be required to be utilized prior to the losses incurred in pre-enactment taxable years, which carry an expiration date. As a result of this ordering rule, pre-enactment capital loss carryforwards may be more likely to expire unused. Additionally, post-enactment capital loss carryforwards retain their character as either short-term or long-term capital losses rather than being considered all short-term as permitted under prior regulation. |
The Hartford Value Opportunities Fund
| Notes to Financial Statements – (continued) |
| April 30, 2012 (Unaudited) |
| (000’s Omitted) |
At October 31, 2011 (tax-year-end), the Fund had capital loss carryforwards for U.S. federal income tax purposes as follows:
| Year of Expiration | | Amount | |
| 2016 | | $ | 19,304 | |
| 2017 | | | 35,126 | |
| Total | | $ | 54,430 | |
During the year ended October 31, 2011, the Fund utilized $16,517 of prior year capital loss carryforwards.
| | f) | Accounting for Uncertainty in Income Taxes – The Fund has adopted financial reporting rules that require the Fund to analyze all open tax years, as defined by the statute of limitations, for all major jurisdictions. Generally, tax authorities can examine all tax returns filed for the last three years. The Fund does not have an examination in progress. |
The Fund has reviewed all open tax years and major jurisdictions and concluded that these financial reporting rules had no effect on the Fund’s financial position or results of operations. There is no tax liability resulting from unrecognized tax benefits relating to uncertain income tax positions taken or expected to be taken on the tax return for the fiscal year ended October 31, 2011. The Fund is also not aware of any tax positions for which it is reasonably possible that the total amounts of unrecognized tax benefits will significantly change in the next twelve months.
| | a) | Investment Management Agreement – Hartford Investment Financial Services, LLC (“HIFSCO”), a wholly-owned indirect subsidiary of The Hartford Financial Services Group, Inc. (“The Hartford”), serves as investment manager to the Fund pursuant to an Investment Management Agreement with the Company. As investment manager, HIFSCO has overall investment supervisory responsibility for the Fund. In addition, HIFSCO provides administrative personnel, services, equipment, facilities and office space for proper operation of the Fund. HIFSCO has contracted with Wellington Management Company, LLP (“Wellington Management”) under a sub-advisory agreement for the provision of day-to-day investment management services to the Fund in accordance with the Fund’s investment objective and policies. The Fund pays a fee to HIFSCO, a portion of which may be used to compensate Wellington Management. |
The schedule below reflects the rates of compensation paid to HIFSCO for investment management services rendered as of April 30, 2012; the rates are accrued daily and paid monthly:
| Average Daily Net Assets | | Annual Fee | |
| On first $100 million | | | 0.8000 | % |
| On next $150 million | | | 0.7500 | % |
| On next $4.75 billion | | | 0.7000 | % |
| On next $5 billion | | | 0.6975 | % |
| Over $10 billion | | | 0.6950 | % |
| | b) | Accounting Services Agreement – Pursuant to the Fund Accounting Agreement between Hartford Life Insurance Company (“HLIC”) and the Company, on behalf of the Fund, HLIC provides accounting services to the Fund and receives monthly compensation based on the Fund’s average net assets at the rates set forth below. The Fund’s accounting services fees are accrued daily and paid monthly. |
| Average Daily Net Assets | | Annual Fee | |
| On first $5 billion | | | 0.014 | % |
| On next $5 billion | | | 0.012 | % |
| Over $10 billion | | | 0.010 | % |
| | c) | Operating Expenses – Allocable expenses incurred by the Company are allocated to each Fund and allocated to classes within the Fund in proportion to the average daily net assets of the Fund and each class, except where allocation of certain expenses is more fairly made directly to the Fund or to specific classes within a Fund. As of April 30, 2012, HIFSCO contractually limited the total operating expenses of this Fund, exclusive of taxes, interest expense, brokerage commissions, acquired fund fees and expenses and extraordinary expenses as follows: |
| Class A | | | Class B | | | Class C | | | Class I | | | Class R3 | | | Class R4 | | | Class R5 | | | Class Y | |
| | 1.35 | % | | | 2.10 | % | | | 2.10 | % | | | 1.10 | % | | | 1.55 | % | | | 1.25 | % | | | 0.95 | % | | | 0.90 | % |
| | d) | Fees Paid Indirectly – The Fund has entered into agreements with State Street Global Markets, LLC and Russell Implementation Services Inc. to partially recapture non-discounted trade commissions. Such rebates are used to pay a portion of the Fund’s expenses. In addition, the Fund’s custodian bank, State Street Bank and Trust Co., has also agreed to reduce its fees when the Fund maintains cash on deposit in a non-interest-bearing custody account. For the six-month period ended April 30, 2012, these amounts, if any, are included in the Statement of Operations. |
The ratio of expenses to average net assets in the accompanying financial highlights excludes the reduction in expenses related to fees paid indirectly. The annualized expense ratio for the period listed below reflecting the reduction for fees paid indirectly is as follows:
| | | Annualized Six-
Month Period
Ended
April 30, 2012 | |
| Class A | | | 1.35 | % |
| Class B | | | 2.10 | |
| Class C | | | 2.10 | |
| Class I | | | 1.10 | |
| Class R3 | | | 1.55 | |
| Class R4 | | | 1.25 | |
| Class R5 | | | 0.95 | |
| Class Y | | | 0.90 | |
| | e) | Distribution and Service Plan for Class A, B, C, R3 and R4 Shares – HIFSCO is the principal underwriter and distributor of the Fund. HIFSCO is engaged in distribution activities, which include marketing and distribution of shares through broker-dealers, financing distribution costs and maintaining financial books and records. For the six-month period ended April 30, 2012, HIFSCO received front-end load sales charges of $92 and contingent deferred sales charges of $3 from the Fund. |
The Fund has adopted a Distribution and Service Plan in accordance with Rule 12b-1 of the 1940 Act to compensate the distributor (HIFSCO) for activities intended to result in the sale and distribution of Class A, B, C, R3 and R4 shares and for providing services for shareholders. The Rule 12b-1 plan applicable to Class A shares of the Fund provides for payment of a Rule 12b-1 fee of 0.25% of average daily net assets. Some or all of the fee may be used for shareholder servicing expenses with the remainder used for distribution expenses. Some or the entire Rule 12b-1 fee for Class B shares may be remitted to broker-dealers for distribution and/or shareholder account services. Under the Class B Plan, the Fund pays the distributor 1.00% of the average daily net assets of Class B shares that are outstanding for 8 years or less, 0.25% of which is a fee for services provided to existing shareholders with the remainder used for distribution expenses. After eight years, Class B shares convert to Class A shares. Upon conversion to Class A shares, the Class A plan described above will apply to those shares. Under the Class C Plan, the Fund pays the distributor 1.00% of the average daily net assets of Class C shares outstanding, 0.25% of which is intended as a fee for services provided to existing shareholders with the remainder used for distribution expenses. For Class C shares, some or the entire fee may be remitted to broker-dealers for distribution and/or shareholder account services. Class R3 shares have a distribution fee of 0.50% of average daily net assets and Class R4 shares have a distribution fee of 0.25% of average daily net assets. For
The Hartford Value Opportunities Fund
| Notes to Financial Statements – (continued) |
| April 30, 2012 (Unaudited) |
| (000’s Omitted) |
Class R3 and R4 shares, some or the entire fee may be remitted to broker dealers for distribution and/or shareholder account services. The Fund’s 12b-1 fees are accrued daily and paid monthly.
For the six-month period ended April 30, 2012, total sales commissions paid to affiliated brokers/dealers of The Hartford for distributing the Fund's shares were $5. These commissions are in turn paid to sales representatives of the broker/dealers.
| | f) | Other Related Party Transactions – Certain officers of the Fund are directors and/or officers of HIFSCO and/or The Hartford or its subsidiaries. For the six-month period ended April 30, 2012, a portion of the Fund’s chief compliance officer’s compensation was paid by all of the investment companies in the Hartford fund complex. The portion allocated to the Fund rounds to zero. Hartford Administrative Services Company (“HASCO”), an indirect wholly-owned subsidiary of The Hartford, provides transfer agent services to the Fund. HASCO has contractually agreed to reimburse any portion of the transfer agency fees over 0.30% of average daily net assets per fiscal year for each class. For providing such services, HASCO is compensated on a per account basis that varies by account type, except with respect to Class Y, for which it is compensated based on average daily net assets. The amount paid to HASCO and any related contractual reimbursement amounts, if applicable, can be found in the Statement of Operations. These fees are accrued daily and paid monthly. |
Administrative services fees are paid to HASCO for third-party recordkeeping services that are payable as a percentage of net assets in the amount of 0.20%, 0.15% and 0.10% for Classes R3, R4 and R5 shares, respectively. The total administrative services fees are shown on the Statement of Operations. These fees are accrued daily and paid monthly.
| | g) | Payment from Affiliate – On November 8, 2006, the SEC issued an order setting forth the terms of a settlement reached with three subsidiaries of The Hartford that resolved the SEC’s Division of Enforcement’s investigation of aspects of The Hartford’s variable annuity and mutual fund operations related to directed brokerage and revenue sharing. The Hartford settled this matter without admitting or denying the findings of the SEC. |
The total return in the accompanying financial highlights includes a payment from affiliate. Had the payment from affiliate been excluded, the impact and total return for the periods listed below would have been as follows:
| | | Impact from Payment from Affiliate for
SEC Settlement for the Year Ended
October 31, 2007 | | | Total Return Excluding
Payment from Affiliate for the
Year Ended
October 31, 2007 | |
| Class A | | | 0.01 | % | | | 9.72 | % |
| Class B | | | 0.01 | | | | 8.89 | |
| Class C | | | 0.01 | | | | 8.90 | |
| Class I | | | 0.01 | | | | 10.07 | |
| Class Y | | | 0.01 | | | | 10.29 | |
8. Affiliate Holdings:
As of April 30, 2012, affiliates of The Hartford had ownership of shares in the Fund as follows:
| | | Shares | | | Percentage
of Class | |
| Class R5 | | | 9 | | | | 60 | % |
9. Investment Transactions:
For the six-month period ended April 30, 2012, the Fund's aggregate purchases and sales of investment securities (excluding short-term investments) were as follows:
| | | Amount | |
| Cost of Purchases Excluding U.S. Government Obligations | | $ | 41,216 | |
| Sales Proceeds Excluding U.S. Government Obligations | | | 47,776 | |
10. Capital Share Transactions:
The following information is for the six-month period ended April 30, 2012, and the year ended October 31, 2011:
| | | For the Six-Month Period Ended April 30, 2012 | | | For the Year Ended October 31, 2011 | |
| | | Shares
Sold | | | Shares
Issued for
Reinvested
Dividends | | | Shares
Redeemed | | | Shares
Issued
from
Merger | | | Net Increase
(Decrease) of
Shares | | | Shares
Sold | | | Shares
Issued for
Reinvested
Dividends | | | Shares
Redeemed | | | Shares
Issued
from
Merger | | | Net Increase
(Decrease) of
Shares | |
| Class A | | | | | | | | | | | | | | | | | | | | | | | | | | | | | | | | | | | | | | | | |
| Shares | | | 509 | | | | 60 | | | | (918 | ) | | | — | | | | (349 | ) | | | 1,147 | | | | 2 | | | | (1,732 | ) | | | 1,691 | | | | 1,108 | |
| Amount | | $ | 6,705 | | | $ | 748 | | | $ | (12,014 | ) | | $ | — | | | $ | (4,561 | ) | | $ | 15,350 | | | $ | 31 | | | $ | (22,680 | ) | | $ | 23,417 | | | $ | 16,118 | |
| Class B | | | | | | | | | | | | | | | | | | | | | | | | | | | | | | | | | | | | | | | | |
| Shares | | | 15 | | | | 1 | | | | (108 | ) | | | — | | | | (92 | ) | | | 29 | | | | — | | | | (160 | ) | | | — | | | | (131 | ) |
| Amount | | $ | 172 | | | $ | 8 | | | $ | (1,262 | ) | | $ | — | | | $ | (1,082 | ) | | $ | 346 | | | $ | — | | | $ | (1,888 | ) | | $ | — | | | $ | (1,542 | ) |
| Class C | | | | | | | | | | | | | | | | | | | | | | | | | | | | | | | | | | | | | | | | |
| Shares | | | 37 | | | | 2 | | | | (141 | ) | | | — | | | | (102 | ) | | | 166 | | | | — | | | | (265 | ) | | | — | | | | (99 | ) |
| Amount | | $ | 445 | | | $ | 23 | | | $ | (1,641 | ) | | $ | — | | | $ | (1,173 | ) | | $ | 1,939 | | | $ | — | | | $ | (3,099 | ) | | $ | — | | | $ | (1,160 | ) |
| Class I | | | | | | | | | | | | | | | | | | | | | | | | | | | | | | | | | | | | | | | | |
| Shares | | | 110 | | | | 3 | | | | (41 | ) | | | — | | | | 72 | | | | 229 | | | | — | | | | (151 | ) | | | — | | | | 78 | |
| Amount | | $ | 1,419 | | | $ | 40 | | | $ | (534 | ) | | $ | — | | | $ | 925 | | | $ | 3,138 | | | $ | 5 | | | $ | (1,981 | ) | | $ | — | | | $ | 1,162 | |
| Class L | | | | | | | | | | | | | | | | | | | | | | | | | | | | | | | | | | | | | | | | |
| Shares | | | — | | | | — | | | | — | | | | — | | | | — | | | | 33 | | | | 4 | | | | (185 | ) | | | (1,689 | ) | | | (1,837 | ) |
| Amount | | $ | — | | | $ | — | | | $ | — | | | $ | — | | | $ | — | | | $ | 452 | | | $ | 55 | | | $ | (2,522 | ) | | $ | (23,417 | ) | | $ | (25,432 | ) |
| Class R3 | | | | | | | | | | | | | | | | | | | | | | | | | | | | | | | | | | | | | | | | |
| Shares | | | 20 | | | | 1 | | | | (4 | ) | | | — | | | | 17 | | | | 35 | | | | — | | | | (45 | ) | | | — | | | | (10 | ) |
| Amount | | $ | 260 | | | $ | 6 | | | $ | (53 | ) | | $ | — | | | $ | 213 | | | $ | 475 | | | $ | — | | | $ | (618 | ) | | $ | — | | | $ | (143 | ) |
| Class R4 | | | | | | | | | | | | | | | | | | | | | | | | | | | | | | | | | | | | | | | | |
| Shares | | | 61 | | | | 5 | | | | (49 | ) | | | — | | | | 17 | | | | 129 | | | | 1 | | | | (92 | ) | | | — | | | | 38 | |
| Amount | | $ | 812 | | | $ | 63 | | | $ | (690 | ) | | $ | — | | | $ | 185 | | | $ | 1,781 | | | $ | 10 | | | $ | (1,241 | ) | | $ | — | | | $ | 550 | |
| Class R5 | | | | | | | | | | | | | | | | | | | | | | | | | | | | | | | | | | | | | | | | |
| Shares | | | 1 | | | | — | | | | (3 | ) | | | — | | | | (2 | ) | | | 5 | | | | — | | | | — | | | | — | | | | 5 | |
| Amount | | $ | 10 | | | $ | 3 | | | $ | (49 | ) | | $ | — | | | $ | (36 | ) | | $ | 64 | | | $ | 1 | | | $ | (2 | ) | | $ | — | | | $ | 63 | |
| Class Y | | | | | | | | | | | | | | | | | | | | | | | | | | | | | | | | | | | | | | | | |
| Shares | | | 141 | | | | 35 | | | | (234 | ) | | | — | | | | (58 | ) | | | 745 | | | | 10 | | | | (460 | ) | | | — | | | | 295 | |
| Amount | | $ | 1,956 | | | $ | 445 | | | $ | (3,060 | ) | | $ | — | | | $ | (659 | ) | | $ | 10,034 | | | $ | 137 | | | $ | (6,292 | ) | | $ | — | | | $ | 3,879 | |
| Total | | | | | | | | | | | | | | | | | | | | | | | | | | | | | | | | | | | | | | | | |
| Shares | | | 894 | | | | 107 | | | | (1,498 | ) | | | — | | | | (497 | ) | | | 2,518 | | | | 17 | | | | (3,090 | ) | | | 2 | | | | (553 | ) |
| Amount | | $ | 11,779 | | | $ | 1,336 | | | $ | (19,303 | ) | | $ | — | | | $ | (6,188 | ) | | $ | 33,579 | | | $ | 239 | | | $ | (40,323 | ) | | $ | — | | | $ | (6,505 | ) |
The following reflects the conversion of Class B shares into Class A shares (reflected as Class A shares sold) for the six-month period ended April 30, 2012, and the year ended October 31, 2011:
| | | Shares | | | Dollars | |
| For the Six-Month Period Ended April 30, 2012 | | | 28 | | | $ | 367 | |
| For the Year Ended October 31, 2011 | | | 37 | | | $ | 482 | |
The Hartford Value Opportunities Fund
| Notes to Financial Statements – (continued) |
April 30, 2012 (Unaudited) (000’s Omitted) |
11. Line of Credit:
The Fund is one of several Hartford funds that participate in a $500 million committed revolving line of credit facility. The facility is to be used for temporary or emergency purposes. Under the arrangement, the funds are required to own securities having a market value in excess of 300% of the total bank borrowings. The interest rate on borrowings varies depending on the nature of the loan. The facility also requires a fee to be paid based on the amount of the commitment. This commitment fee is allocated to all of the funds participating in the line of credit based on the average net assets of the funds. During the six-month period ended April 30, 2012, the Fund did not have any borrowings under this facility.
12. Class Merger:
At its May 3, 2011, meeting, the Board of Directors of The Hartford Mutual Funds II, Inc. approved the reclassification of Class L shares into Class A shares of the Fund.
Effective with the close of business on August 5, 2011, Class L was merged into Class A. The merger was accomplished by a tax-free exchange as detailed below:
| | | Class A | | | Class L | |
| Shares exchanged | | | N/A | | | | 1,689 | |
| Shares issued - to Class L shareholders | | | 1,691 | | | | N/A | |
| Net assets immediately before merger | | $ | 65,527 | | | $ | 20,811 | |
| Net assets immediately after merger | | $ | 86,338 | | | | N/A | |
13. Industry Classifications:
Other than the industry classifications “Other Investment Pools and Funds” and “Exchange Traded Funds,” equity industry classifications used in this report are the Global Industry Classification Standard, which was developed by and is the exclusive property and service mark of MSCI, Inc. and Standard & Poor’s.
14. Pending Legal Proceedings:
On February 25, 2011, Jennifer L. Kasilag, Louis Mellinger, Judith M. Menendez, Jacqueline M. Robinson, and Linda A. Russell filed a derivative lawsuit against HIFSCO on behalf of six funds: The Hartford Global Health Fund (now known as The Hartford Healthcare Fund), The Hartford Conservative Allocation Fund, The Hartford Growth Opportunities Fund, The Hartford Inflation Plus Fund, The Hartford Advisers Fund (now known as The Hartford Balanced Fund) and The Hartford Money Market Fund. The lawsuit, which was filed in the United States District Court for the District of New Jersey, seeks recovery under Section 36(b) of the 1940 Act for the alleged overpayment of investment management and 12b-1 distribution fees to HIFSCO. The plaintiffs seek recovery of the alleged overpayments or, alternatively, rescission of the contracts and restitution of all fees paid, together with lost earnings. On November 14, 2011, the plaintiffs filed an amended complaint, which dropped The Hartford Money Market Fund and added The Hartford Capital Appreciation Fund as a plaintiff. The Hartford intends to vigorously defend the action.
No accrual for litigation relating to this matter has been recorded in the financial statements of the Fund because the Fund is not party to the suit.
15. Indemnifications:
Under the Company’s organizational documents, the Company shall indemnify its officers and directors to the full extent required or permitted under Maryland General Corporation Law and the federal securities laws. In addition, the Company, on behalf of the Fund, may enter into contracts that contain a variety of indemnifications. The Company’s maximum exposure under these arrangements is unknown. However, as of the date of these financial statements, the Company has not had prior claims or losses pursuant to these contracts and expects the risk of loss to be remote.
[This page is intentionally left blank]
The Hartford Value Opportunities Fund
| Financial Highlights |
| - Selected Per-Share Data (A) - |
| Class | | Net Asset
Value at
Beginning of
Period | | | Net Investment
Income (Loss) | | | Payments from
(to) Affiliate | | | Net Realized
and Unrealized
Gain (Loss) on
Investments | | | Total from
Investment
Operations | | | Dividends from
Net Investment
Income | | | Distributions
from Realized
Capital Gains | | | Distributions
from Capital | | | Total
Distributions | | | Net Increase
(Decrease) in
Net Asset
Value | | | Net Asset
Value at End
of Period | |
| | | | | | | | | | | | | | | | | | | | | | | | | | | | | | | | | | |
| For the Six-Month Period Ended April 30, 2012 (Unaudited) (E) | | | | | | | | | |
| A | | $ | 12.68 | | | $ | 0.06 | | | $ | – | | | $ | 1.27 | | | $ | 1.33 | | | $ | (0.12 | ) | | $ | – | | | $ | – | | | $ | (0.12 | ) | | $ | 1.21 | | | $ | 13.89 | |
| B | | | 11.33 | | | | 0.01 | | | | – | | | | 1.15 | | | | 1.16 | | | | (0.02 | ) | | | – | | | | – | | | | (0.02 | ) | | | 1.14 | | | | 12.47 | |
| C | | | 11.31 | | | | 0.01 | | | | – | | | | 1.14 | | | | 1.15 | | | | (0.03 | ) | | | – | | | | – | | | | (0.03 | ) | | | 1.12 | | | | 12.43 | |
| I | | | 12.57 | | | | 0.07 | | | | – | | | | 1.26 | | | | 1.33 | | | | (0.17 | ) | | | – | | | | – | | | | (0.17 | ) | | | 1.16 | | | | 13.73 | |
| R3 | | | 12.81 | | | | 0.05 | | | | – | | | | 1.29 | | | | 1.34 | | | | (0.10 | ) | | | – | | | | – | | | | (0.10 | ) | | | 1.24 | | | | 14.05 | |
| R4 | | | 12.90 | | | | 0.07 | | | | – | | | | 1.30 | | | | 1.37 | | | | (0.14 | ) | | | – | | | | – | | | | (0.14 | ) | | | 1.23 | | | | 14.13 | |
| R5 | | | 12.99 | | | | 0.09 | | | | – | | | | 1.30 | | | | 1.39 | | | | (0.18 | ) | | | – | | | | – | | | | (0.18 | ) | | | 1.21 | | | | 14.20 | |
| Y | | | 13.05 | | | | 0.09 | | | | – | | | | 1.31 | | | | 1.40 | | | | (0.18 | ) | | | – | | | | – | | | | (0.18 | ) | | | 1.22 | | | | 14.27 | |
| | | | | | | | | | | | | | | | | | | | | | | | | | | | | | | | | | | | | | | | | | | | | |
| For the Year Ended October 31, 2011 | | | | | | | | | | | | | | | | | | | | | | | | |
| A(H) | | | 12.15 | | | | 0.09 | | | | – | | | | 0.45 | | | | 0.54 | | | | (0.01 | ) | | | – | | | | – | | | | (0.01 | ) | | | 0.53 | | | | 12.68 | |
| B | | | 10.94 | | | | (0.02 | ) | | | – | | | | 0.41 | | | | 0.39 | | | | – | | | | – | | | | – | | | | – | | | | 0.39 | | | | 11.33 | |
| C | | | 10.91 | | | | (0.01 | ) | | | – | | | | 0.41 | | | | 0.40 | | | | – | | | | – | | | | – | | | | – | | | | 0.40 | | | | 11.31 | |
| I | | | 12.04 | | | | 0.14 | | | | – | | | | 0.44 | | | | 0.58 | | | | (0.05 | ) | | | – | | | | – | | | | (0.05 | ) | | | 0.53 | | | | 12.57 | |
| R3 | | | 12.30 | | | | 0.07 | | | | – | | | | 0.44 | | | | 0.51 | | | | – | | | | – | | | | – | | | | – | | | | 0.51 | | | | 12.81 | |
| R4 | | | 12.37 | | | | 0.10 | | | | – | | | | 0.45 | | | | 0.55 | | | | (0.02 | ) | | | – | | | | – | | | | (0.02 | ) | | | 0.53 | | | | 12.90 | |
| R5 | | | 12.45 | | | | 0.13 | | | | – | | | | 0.47 | | | | 0.60 | | | | (0.06 | ) | | | – | | | | – | | | | (0.06 | ) | | | 0.54 | | | | 12.99 | |
| Y | | | 12.51 | | | | 0.14 | | | | – | | | | 0.47 | | | | 0.61 | | | | (0.07 | ) | | | – | | | | – | | | | (0.07 | ) | | | 0.54 | | | | 13.05 | |
| | | | | | | | | | | | | | | | | | | | | | | | | | | | | | | | | | | | | | | | | | | | | |
| For the Year Ended October 31, 2010 (E) | | | | | | | | | | | | | | | | | | | | | | | | |
| A | | | 10.19 | | | | 0.04 | | | | – | | | | 1.97 | | | | 2.01 | | | | (0.05 | ) | | | – | | | | – | | | | (0.05 | ) | | | 1.96 | | | | 12.15 | |
| B | | | 9.21 | | | | (0.04 | ) | | | – | | | | 1.78 | | | | 1.74 | | | | (0.01 | ) | | | – | | | | – | | | | (0.01 | ) | | | 1.73 | | | | 10.94 | |
| C | | | 9.18 | | | | (0.04 | ) | | | – | | | | 1.77 | | | | 1.73 | | | | – | | | | – | | | | – | | | | – | | | | 1.73 | | | | 10.91 | |
| I | | | 10.09 | | | | 0.07 | | | | – | | | | 1.94 | | | | 2.01 | | | | (0.06 | ) | | | – | | | | – | | | | (0.06 | ) | | | 1.95 | | | | 12.04 | |
| R3 | | | 10.30 | | | | 0.01 | | | | – | | | | 2.00 | | | | 2.01 | | | | (0.01 | ) | | | – | | | | – | | | | (0.01 | ) | | | 2.00 | | | | 12.30 | |
| R4 | | | 10.37 | | | | 0.05 | | | | – | | | | 2.00 | | | | 2.05 | | | | (0.05 | ) | | | – | | | | – | | | | (0.05 | ) | | | 2.00 | | | | 12.37 | |
| R5 | | | 10.43 | | | | 0.07 | | | | – | | | | 2.03 | | | | 2.10 | | | | (0.08 | ) | | | – | | | | – | | | | (0.08 | ) | | | 2.02 | | | | 12.45 | |
| Y | | | 10.47 | | | | 0.08 | | | | – | | | | 2.04 | | | | 2.12 | | | | (0.08 | ) | | | – | | | | – | | | | (0.08 | ) | | | 2.04 | | | | 12.51 | |
| | | | | | | | | | | | | | | | | | | | | | | | | | | | | | | | | | | | | | | | | | | | | |
| For the Year Ended October 31, 2009 (E) | | | | | | | | | | | | | | | | | | | | | | | | |
| A | | | 8.22 | | | | 0.06 | | | | – | | | | 2.06 | | | | 2.12 | | | | (0.15 | ) | | | – | | | | – | | | | (0.15 | ) | | | 1.97 | | | | 10.19 | |
| B | | | 7.42 | | | | 0.02 | | | | – | | | | 1.87 | | | | 1.89 | | | | (0.10 | ) | | | – | | | | – | | | | (0.10 | ) | | | 1.79 | | | | 9.21 | |
| C | | | 7.38 | | | | (0.01 | ) | | | – | | | | 1.86 | | | | 1.85 | | | | (0.05 | ) | | | – | | | | – | | | | (0.05 | ) | | | 1.80 | | | | 9.18 | |
| I | | | 8.15 | | | | 0.06 | | | | – | | | | 2.05 | | | | 2.11 | | | | (0.17 | ) | | | – | | | | – | | | | (0.17 | ) | | | 1.94 | | | | 10.09 | |
| R3 | | | 8.33 | | | | 0.02 | | | | – | | | | 2.09 | | | | 2.11 | | | | (0.14 | ) | | | – | | | | – | | | | (0.14 | ) | | | 1.97 | | | | 10.30 | |
| R4 | | | 8.39 | | | | 0.04 | | | | – | | | | 2.11 | | | | 2.15 | | | | (0.17 | ) | | | – | | | | – | | | | (0.17 | ) | | | 1.98 | | | | 10.37 | |
| R5 | | | 8.44 | | | | 0.07 | | | | – | | | | 2.12 | | | | 2.19 | | | | (0.20 | ) | | | – | | | | – | | | | (0.20 | ) | | | 1.99 | | | | 10.43 | |
| Y | | | 8.48 | | | | 0.11 | | | | – | | | | 2.08 | | | | 2.19 | | | | (0.20 | ) | | | – | | | | – | | | | (0.20 | ) | | | 1.99 | | | | 10.47 | |
| | | | | | | | | | | | | | | | | | | | | | | | | | | | | | | | | | | | | | | | | | | | | |
| For the Year Ended October 31, 2008 | | | | | | | | | | | | | | | | | | | | | | | | |
| A | | | 18.24 | | | | 0.09 | | | | – | | | | (7.48 | ) | | | (7.39 | ) | | | (0.04 | ) | | | (2.59 | ) | | | – | | | | (2.63 | ) | | | (10.02 | ) | | | 8.22 | |
| B | | | 16.75 | | | | – | | | | – | | | | (6.74 | ) | | | (6.74 | ) | | | – | | | | (2.59 | ) | | | – | | | | (2.59 | ) | | | (9.33 | ) | | | 7.42 | |
| C | | | 16.71 | | | | (0.03 | ) | | | – | | | | (6.71 | ) | | | (6.74 | ) | | | – | | | | (2.59 | ) | | | – | | | | (2.59 | ) | | | (9.33 | ) | | | 7.38 | |
| I | | | 18.13 | | | | 0.07 | | | | – | | | | (7.37 | ) | | | (7.30 | ) | | | (0.09 | ) | | | (2.59 | ) | | | – | | | | (2.68 | ) | | | (9.98 | ) | | | 8.15 | |
| R3 | | | 18.56 | | | | 0.10 | | | | – | | | | (7.64 | ) | | | (7.54 | ) | | | (0.10 | ) | | | (2.59 | ) | | | – | | | | (2.69 | ) | | | (10.23 | ) | | | 8.33 | |
| R4 | | | 18.61 | | | | 0.12 | | | | – | | | | (7.66 | ) | | | (7.54 | ) | | | (0.09 | ) | | | (2.59 | ) | | | – | | | | (2.68 | ) | | | (10.22 | ) | | | 8.39 | |
| R5 | | | 18.66 | | | | 0.10 | | | | – | | | | (7.64 | ) | | | (7.54 | ) | | | (0.09 | ) | | | (2.59 | ) | | | – | | | | (2.68 | ) | | | (10.22 | ) | | | 8.44 | |
| Y | | | 18.73 | | | | 0.12 | | | | – | | | | (7.67 | ) | | | (7.55 | ) | | | (0.11 | ) | | | (2.59 | ) | | | – | | | | (2.70 | ) | | | (10.25 | ) | | | 8.48 | |
| | | | | | | | | | | | | | | | | | | | | | | | | | | | | | | | | | | | | | | | | | | | | |
| For the Year Ended October 31, 2007 | | | | | | | | | | | | | | | | | | | | | | | | |
| A | | | 18.26 | | | | 0.08 | | | | – | | | | 1.56 | | | | 1.64 | | | | (0.14 | ) | | | (1.52 | ) | | | – | | | | (1.66 | ) | | | (0.02 | ) | | | 18.24 | |
| B | | | 16.92 | | | | (0.04 | ) | | | – | | | | 1.43 | | | | 1.39 | | | | (0.04 | ) | | | (1.52 | ) | | | – | | | | (1.56 | ) | | | (0.17 | ) | | | 16.75 | |
| C | | | 16.92 | | | | (0.01 | ) | | | – | | | | 1.40 | | | | 1.39 | | | | (0.08 | ) | | | (1.52 | ) | | | – | | | | (1.60 | ) | | | (0.21 | ) | | | 16.71 | |
| I | | | 18.27 | | | | 0.34 | | | | – | | | | 1.36 | | | | 1.70 | | | | (0.32 | ) | | | (1.52 | ) | | | – | | | | (1.84 | ) | | | (0.14 | ) | | | 18.13 | |
| R3(J) | | | 17.74 | | | | – | | | | – | | | | 0.82 | | | | 0.82 | | | | – | | | | – | | | | – | | | | – | | | | 0.82 | | | | 18.56 | |
| R4(J) | | | 17.74 | | | | – | | | | – | | | | 0.87 | | | | 0.87 | | | | – | | | | – | | | | – | | | | – | | | | 0.87 | | | | 18.61 | |
| R5(J) | | | 17.74 | | | | 0.12 | | | | – | | | | 0.80 | | | | 0.92 | | | | – | | | | – | | | | – | | | | – | | | | 0.92 | | | | 18.66 | |
| Y | | | 18.48 | | | | 0.51 | | | | – | | | | 1.26 | | | | 1.77 | | | | – | | | | (1.52 | ) | | | – | | | | (1.52 | ) | | | 0.25 | | | | 18.73 | |
| |
| - Ratios and Supplemental Data - |
| Total Return(B) | | | Net Assets at End of
Period (000's) | | | Ratio of Expenses to Average Net
Assets Before Waivers and
Reimbursements and Including
Expenses not Subject to Cap(C) | | | Ratio of Expenses to Average Net
Assets After Waivers and
Reimbursements and Including
Expenses not Subject to Cap(C) | | | Ratio of Expenses to Average Net
Assets After Waivers and
Reimbursements and Excluding
Expenses not Subject to Cap(C) | | | Ratio of Net Investment
Income to Average Net
Assets | | | Portfolio
Turnover
Rate(D) | |
| | | | | | | | | | | | | | | | | | | | |
| | | | | | | | | | | | | | | | | | | | |
| | 10.56 | %(F) | | $ | 89,912 | | | | 1.49 | %(G) | | | 1.35 | %(G) | | | 1.35 | %(G) | | | 0.91 | %(G) | | | 28 | % |
| | 10.24 | (F) | | | 5,271 | | | | 2.43 | (G) | | | 2.10 | (G) | | | 2.10 | (G) | | | 0.16 | (G) | | | – | |
| | 10.21 | (F) | | | 9,982 | | | | 2.16 | (G) | | | 2.10 | (G) | | | 2.10 | (G) | | | 0.15 | (G) | | | – | |
| | 10.74 | (F) | | | 3,759 | | | | 1.11 | (G) | | | 1.10 | (G) | | | 1.10 | (G) | | | 1.13 | (G) | | | – | |
| | 10.52 | (F) | | | 1,258 | | | | 1.69 | (G) | | | 1.55 | (G) | | | 1.55 | (G) | | | 0.70 | (G) | | | – | |
| | 10.72 | (F) | | | 6,651 | | | | 1.32 | (G) | | | 1.25 | (G) | | | 1.25 | (G) | | | 1.00 | (G) | | | – | |
| | 10.83 | (F) | | | 208 | | | | 1.08 | (G) | | | 0.95 | (G) | | | 0.95 | (G) | | | 1.32 | (G) | | | – | |
| | 10.91 | (F) | | | 36,577 | | | | 0.91 | (G) | | | 0.90 | (G) | | | 0.90 | (G) | | | 1.37 | (G) | | | – | |
| | | | | | | | | | | | | | | | | | | | | | | | | | | |
| | | | | | | | | | | | | | | | | | | | | | | | | | | |
| | 4.41 | | | | 86,456 | | | | 1.46 | | | | 1.35 | | | | 1.35 | | | | 0.81 | | | | 70 | |
| | 3.56 | | | | 5,838 | | | | 2.39 | | | | 2.10 | | | | 2.10 | | | | (0.10 | ) | | | – | |
| | 3.67 | | | | 10,227 | | | | 2.15 | | | | 2.10 | | | | 2.10 | | | | (0.09 | ) | | | – | |
| | 4.80 | | | | 2,535 | | | | 1.03 | | | | 1.01 | | | | 1.01 | | | | 1.06 | | | | – | |
| | 4.15 | | | | 934 | | | | 1.68 | | | | 1.55 | | | | 1.55 | | | | 0.45 | | | | – | |
| | 4.47 | | | | 5,865 | | | | 1.31 | | | | 1.25 | | | | 1.25 | | | | 0.75 | | | | – | |
| | 4.81 | | | | 221 | | | | 1.05 | | | | 0.95 | | | | 0.95 | | | | 1.04 | | | | – | |
| | 4.82 | | | | 34,210 | | | | 0.91 | | | | 0.90 | | | | 0.90 | | | | 1.08 | | | | – | |
| | | | | | | | | | | | | | | | | | | | | | | | | | | |
| | | | | | | | | | | | | | | | | | | | | | | | | | | |
| | 19.78 | | | | 69,397 | | | | 1.46 | | | | 1.35 | | | | 1.35 | | | | 0.34 | | | | 87 | |
| | 18.89 | | | | 7,069 | | | | 2.42 | | | | 2.10 | | | | 2.10 | | | | (0.40 | ) | | | – | |
| | 18.85 | | | | 10,954 | | | | 2.18 | | | | 2.10 | | | | 2.10 | | | | (0.41 | ) | | | – | |
| | 20.00 | | | | 1,494 | | | | 1.05 | | | | 1.05 | | | | 1.05 | | | | 0.64 | | | | – | |
| | 19.56 | | | | 1,021 | | | | 1.67 | | | | 1.58 | | | | 1.58 | | | | 0.10 | | | | – | |
| | 19.79 | | | | 5,147 | | | | 1.31 | | | | 1.28 | | | | 1.28 | | | | 0.39 | | | | – | |
| | 20.17 | | | | 154 | | | | 1.07 | | | | 0.98 | | | | 0.98 | | | | 0.65 | | | | – | |
| | 20.28 | | | | 29,098 | | | | 0.91 | | | | 0.91 | | | | 0.91 | | | | 0.73 | | | | – | |
| | | | | | | | | | | | | | | | | | | | | | | | | | | |
| | | | | | | | | | | | | | | | | | | | | | | | | | | |
| | 26.41 | | | | 67,577 | | | | 1.66 | | | | 1.20 | | | | 1.20 | | | | 0.67 | | | | 90 | |
| | 25.90 | | | | 7,903 | | | | 2.74 | | | | 1.63 | | | | 1.63 | | | | 0.26 | | | | – | |
| | 25.33 | | | | 10,158 | | | | 2.39 | | | | 1.98 | | | | 1.98 | | | | (0.07 | ) | | | – | |
| | 26.68 | | | | 1,416 | | | | 1.17 | | | | 1.10 | | | | 1.10 | | | | 0.71 | | | | – | |
| | 25.97 | | | | 784 | | | | 1.78 | | | | 1.60 | | | | 1.60 | | | | 0.28 | | | | – | |
| | 26.38 | | | | 3,551 | | | | 1.36 | | | | 1.30 | | | | 1.30 | | | | 0.50 | | | | – | |
| | 26.77 | | | | 12 | | | | 1.12 | | | | 1.00 | | | | 1.00 | | | | 0.77 | | | | – | |
| | 26.76 | | | | 7,195 | | | | 0.96 | | | | 0.96 | | | | 0.96 | | | | 1.20 | | | | – | |
| | | | | | | | | | | | | | | | | | | | | | | | | | | |
| | (46.75 | ) | | | 59,576 | | | | 1.50 | | | | 1.40 | | | | 1.40 | | | | 0.62 | | | | 65 | |
| | (46.99 | ) | | | 7,613 | | | | 2.47 | | | | 1.95 | | | | 1.95 | | | | 0.08 | | | | – | |
| | (47.13 | ) | | | 11,167 | | | | 2.21 | | | | 2.15 | | | | 2.15 | | | | (0.12 | ) | | | – | |
| | (46.63 | ) | | | 1,139 | | | | 1.22 | | | | 1.15 | | | | 1.15 | | | | 0.99 | | | | – | |
| | (46.93 | ) | | | 657 | | | | 1.72 | | | | 1.65 | | | | 1.65 | | | | 0.30 | | | | – | |
| | (46.73 | ) | | | 1,877 | | | | 1.37 | | | | 1.35 | | | | 1.35 | | | | 0.66 | | | | – | |
| | (46.57 | ) | | | 6 | | | | 1.07 | | | | 1.05 | | | | 1.05 | | | | 0.96 | | | | – | |
| | (46.52 | ) | | | 18,603 | | | | 0.97 | | | | 0.97 | | | | 0.97 | | | | 1.01 | | | | – | |
| | | | | | | | | | | | | | | | | | | | | | | | | | | |
| | | | | | | | | | | | | | | | | | | | | | | | | | | |
| | 9.73 | (I) | | | 157,671 | | | | 1.48 | | | | 1.40 | | | | 1.40 | | | | 0.48 | | | | 77 | |
| | 8.90 | (I) | | | 20,792 | | | | 2.38 | | | | 2.13 | | | | 2.13 | | | | (0.25 | ) | | | – | |
| | 8.91 | (I) | | | 32,738 | | | | 2.19 | | | | 2.15 | | | | 2.15 | | | | (0.28 | ) | | | – | |
| | 10.08 | (I) | | | 4,659 | | | | 1.22 | | | | 1.15 | | | | 1.15 | | | | 0.61 | | | | – | |
| | 4.62 | (F) | | | 124 | | | | 1.78 | (G) | | | 1.65 | (G) | | | 1.65 | (G) | | | 0.03 | (G) | | | – | |
| | 4.90 | (F) | | | 732 | | | | 1.40 | (G) | | | 1.35 | (G) | | | 1.35 | (G) | | | (0.01 | )(G) | | | – | |
| | 5.19 | (F) | | | 11 | | | | 1.17 | (G) | | | 1.05 | (G) | | | 1.05 | (G) | | | 0.75 | (G) | | | – | |
| | 10.30 | (I) | | | 26,645 | | | | 0.94 | | | | 0.94 | | | | 0.94 | | | | 1.19 | | | | – | |
The Hartford Value Opportunities Fund
| Notes to Financial Statements – (continued) |
April 30, 2012 (Unaudited) (000’s Omitted) |
| (A) | Information presented relates to a share outstanding throughout the indicated period. |
| (B) | Assumes initial investment at net asset value at the beginning of each period, reinvestment of all distributions, the complete redemption of the investment at net asset value at the end of each period and no sales charge. Total return would be reduced if sales charges were taken into account. |
| (C) | Ratios do not include fees paid indirectly (See Expenses in the accompanying Notes to Financial Statements). |
| (D) | Portfolio turnover rate is calculated on the basis of the Fund as a whole without distinguishing between the classes of shares issued. |
| (E) | Per share amounts have been calculated using average shares outstanding method. |
| (F) | Not annualized. |
| (G) | Annualized. |
| (H) | Class L was merged into Class A on August 5, 2011 (See Class Merger in accompanying Notes to Financial Statements). |
| (I) | Total return without the inclusion of the Payments from (to) Affiliate, can be found in Expenses in the accompanying Notes to Financial Statements. |
| (J) | Commenced operations on December 22, 2006. |
The Hartford Value Opportunities Fund
| Directors and Officers (Unaudited) |
The Board of Directors of the Company appoints officers who are responsible for the day-to-day operations of the Fund and who execute policies formulated by the Directors. Each director serves until his or her death, resignation, or retirement or until the next annual meeting of shareholders is held or until his or her successor is elected and qualifies.
Directors and officers who are employed by or who have a financial interest in The Hartford are considered “interested” persons of the Fund pursuant to the 1940 Act. Each officer and two of the Company’s directors, as noted in the chart below, are “interested” persons of the Fund. Each director serves as a director for The Hartford Mutual Funds, Inc., The Hartford Mutual Funds II, Inc., Hartford Series Fund, Inc., and Hartford HLS Series Fund II, Inc., and as a trustee for The Hartford Alternative Strategies Fund, which, as of April 30, 2012, collectively consist of 91 funds. Correspondence may be sent to directors and officers c/o Hartford Mutual Funds, P.O. Box 2999, Hartford, Connecticut 06104-2999, except that correspondence to Mr. Annoni, Mr. Dressen, and Ms. Fagely may be sent to 500 Bielenberg Drive, Woodbury, Minnesota 55125.
The table below sets forth, for each director and officer, his or her name, year of birth, current position with the Company and date first elected or appointed to The Hartford Mutual Funds, Inc. (“MF”) and The Hartford Mutual Funds II, Inc. (“MF2”), principal occupation, and, for directors, other directorships held. The Fund’s statement of additional information contains further information on the directors and is available free of charge by calling 1-888-843-7824 or writing to Hartford Mutual Funds, P.O. Box 64387, St. Paul, MN 55164-0387.
Information on the aggregate remuneration paid to the directors of the Company can be found in the Statement of Operations herein. The Fund pays to The Hartford a portion of the Chief Compliance Officer’s compensation, but does not pay salaries or compensation to any of its other officers or directors who are employed by The Hartford.
Non-Interested Directors
Lynn S. Birdsong (1946) Director since 2003, Co-Chairman of the Investment Committee
Mr. Birdsong is a private investor. Mr. Birdsong currently serves as a Director of the Sovereign High Yield Investment Company (April 2010 to current). Mr. Birdsong currently serves as an Independent Director of Nomura Partners Funds, Inc. (formerly, The Japan Fund) (March 2003 to current). From 1979 to 2002, Mr. Birdsong was a managing director of Zurich Scudder Investments, an investment management firm. During his employment with Scudder, Mr. Birdsong was an Interested Director of The Japan Fund. Since 1981, Mr. Birdsong has been a partner in Birdsong Company, an advertising specialty firm.
Robert M. Gavin, Jr. (1940) Director since 2002 (MF) and 1986 (MF2), Chairman of the Board since 2004
Dr. Gavin is an educational consultant. Prior to September 1, 2001, he was President of Cranbrook Education Community and prior to July 1996, he was President of Macalester College, St. Paul, Minnesota.
Duane E. Hill (1945) Director since 2001 (MF) and 2002 (MF2), Chairman of the Nominating Committee
Mr. Hill is Partner of TSG Ventures L.P., a private equity investment company. Mr. Hill is a former partner of TSG Capital Group, a private equity investment firm that served as sponsor and lead investor in leveraged buyouts of middle market companies.
Sandra S. Jaffee (1941) Director since 2005
Ms. Jaffee is the founder and Chief Executive Officer of a private company, Homeworks Concierge, LLC, which provides residential property management services in Westchester County, New York (January 2012 to present). Ms. Jaffee served as Chairman (2008 to 2009) and Chief Executive Officer of Fortent (formerly Searchspace Group), a leading provider of compliance/regulatory technology to financial institutions from August 2005 to August 2009. Ms. Jaffe currently serves as a member of the Board of Directors of Broadridge Financial Solutions as well as a Trustee of Muhlenberg College.
William P. Johnston (1944) Director since 2005, Chairman of the Compliance Committee
In June 2006, Mr. Johnston was appointed as Senior Advisor to The Carlyle Group, a global private equity investment firm. In August 2007, Mr. Johnston was elected to the Board of Directors of LifeCare Holdings, Inc. In February 2008, Mr. Johnston was elected to the Board of Directors of HCR-ManorCare, Inc. In May 2006, Mr. Johnston was elected to the Supervisory Board of Fresenius Medical Care AG & Co. KGaA, after its acquisition of Renal Care Group, Inc. in March 2006.
Phillip O. Peterson (1944) Director since 2002, (MF) and 2000 (MF2), Chairman of the Audit Committee
Mr. Peterson is a mutual fund industry consultant. He was a partner of KPMG LLP (an accounting firm) until July 1999. Mr. Peterson joined William Blair Funds in February 2007 as a member of the Board of Trustees. Mr. Peterson also joined the Board of Trustees of Symetra Variable Mutual Funds Trust as a trustee in February 2012.
The Hartford Value Opportunities Fund
| Directors and Officers (Unaudited) – (continued) |
Lemma W. Senbet (1946) Director since 2005
Dr. Senbet is the William E. Mayer Chair Professor of Finance and Director, Center for Financial Policy, at the University of Maryland, Robert H. Smith School of Business. He was chair of the Finance Department from 1998 to 2006. Previously he was a chaired professor of finance at the University of Wisconsin-Madison. Also, he was director of the Fortis Funds from March 2000 to July 2002. Dr. Senbet served the finance profession in various capacities, including as director of the American Finance Association and President of the Western Finance Association. In 2006, Dr. Senbet was inducted Fellow of Financial Management Association International for his career-long distinguished scholarship and professional service.
Interested Directors and Officers
David N. Levenson (1966) Director since 2010
Mr. Levenson currently serves as President of The Hartford’s Wealth Management business. He was appointed to this role in July 2010. Previously, Mr. Levenson served as Executive Vice President of Legacy Holdings for The Hartford from June 2009 to July 2010. From 2006 to 2009, Mr. Levenson was with Hartford Life Insurance K.K. where he served as President and Chief Executive Officer from 2007 to 2009. He served as Managing Director of Hartford Investment Management Company from 2005 to 2006. Additionally, Mr. Levenson serves as Executive Vice President of The Hartford and as President, Director and Chief Executive Officer of Hartford Life Insurance Company (“HLIC”) and Hartford Life, Inc. (“HL Inc.”).
Lowndes A. Smith (1939) Director since 1996, (MF) and 2002 (MF2), Co-Chairman of the Investment Committee
Mr. Smith served as Vice Chairman of The Hartford from February 1997 to January 2002, as President and Chief Executive Officer of HL Inc. from February 1997 to January 2002, and as President and Chief Operating Officer of The Hartford Life Insurance Companies from January 1989 to January 2002. Mr. Smith serves as a Director of White Mountains Insurance Group, Ltd., One Beacon Insurance and Symetra Financial and as Managing Director of Whittington Gray Associates.
Other Officers
James E. Davey (1964) President and Chief Executive Officer since 2010
Mr. Davey serves as Executive Vice President of HLIC. Additionally, Mr. Davey serves as President, Chief Executive Officer and Manager of HIFSCO and President, Chief Executive Officer and Manager of HL Investment Advisors, LLC (“HL Advisors”). Mr. Davey joined The Hartford in 2002.
Mark A. Annoni (1964) Vice President, Controller and Treasurer since 2012*
Mr. Annoni serves as the Assistant Vice President and Director of Investment Finance (February 2004 to present). Mr. Annoni joined The Hartford in April 2001 as part of The Hartford’s acquisition of Fortis Financial Group. Prior to joining The Hartford, Mr. Annoni served as Manager of Mutual Fund Accounting at Fortis Financial Group (July 1997 to April 2001).
* Mr. Annoni was named Vice President, Controller and Treasurer on May 8, 2012.
Michael R. Dressen (1963) AML Compliance Officer since 2011
Mr. Dressen currently serves as Assistant Vice President of HLIC. He also serves as Chief Compliance Officer and AML Compliance Officer of Hartford Administrative Services Company (“HASCO”) and as Assistant Secretary and Compliance Officer of HIFSCO. Mr Dressen joined The Hartford in 2005 from State Farm Insurance Companies where he held various positions related to mutual funds, variable products, and property casualty insurance.
Tamara L. Fagely (1958) Vice President since 2002 (MF) and 1993 (MF2)
Ms. Fagely has been a Vice President of HASCO since 1998 and Chief Financial Officer since 2006. Currently Ms. Fagely is a Vice President of HLIC. She served as Assistant Vice President of HLIC from December 2001 through March 2005. In addition, Ms. Fagely is Controller and Chief Financial Officer of HIFSCO.
Dr. Robert J. Froehlich (1953) Senior Managing Director since 2009
Dr. Froehlich joined The Hartford as Senior Managing Director in September 2009. Prior to joining The Hartford, Dr. Froehlich served as Vice Chairman of Deutsche Asset Management from 1997-2009.
Edward P. Macdonald (1967) Vice President, Secretary and Chief Legal Officer since 2005
Mr. Macdonald serves as Vice President of HLIC and Chief Legal Officer of Mutual Funds and Vice President of HIFSCO. He also serves as Vice President and Secretary of HASCO, and Chief Legal Officer, Secretary and Vice President of HL Advisors. Mr. Macdonald joined The Hartford in 2005.
Vernon J. Meyer (1964) Vice President since 2006
Mr. Meyer serves as Senior Vice President of HLIC. He also serves as Senior Vice President of HIFSCO and HL Advisors. Mr. Meyer joined The Hartford in 2004.
Colleen B. Pernerewski (1969) Vice President and Chief Compliance Officer since 2010
Ms. Pernerewski serves as Vice President and Chief Investment Advisor Compliance Officer of HIFSCO and as Vice President and Chief Compliance Officer of HL Advisors. Ms. Pernerewski serves as Vice President and Chief Compliance Officer of Individual Annuity of HLIC. Ms. Pernerewski joined The Hartford in 2005 from Travelers Life and Annuity where she served as Counsel (2004-2005). Prior to Travelers Life and Annuity, Ms. Pernerewski held the position of Counsel at The Hartford (1998-2004).
Elizabeth L. Schroeder (1966) Vice President since 2010
Ms. Schroeder currently serves as Assistant Vice President of HLIC. Ms. Schroeder joined HLIC in 1991. She is also an Assistant Vice President of HASCO, HIFSCO and HL Advisors.
Martin Swanson (1962) Vice President since 2010
Mr. Swanson is a Vice President of HLIC. Mr. Swanson also serves as Vice President/Marketing for HIFSCO. Prior to joining HLIC in 1998, Mr. Swanson was a Vice President at PaineWebber, Inc.
Jane Wolak (1961) Vice President since 2009
Ms. Wolak currently serves as Senior Vice President of HLIC. Ms. Wolak joined HLIC as Vice President, Retail Product Services in May 2007. She is also Vice President of HASCO. Previously, Ms. Wolak was with Sun Life Financial where she held the position of Vice President, Service Center Operations from 2001-2007.
HOW TO OBTAIN A COPY OF THE FUND’S PROXY VOTING POLICIES AND VOTING RECORDS (UNAUDITED)
A description of the policies and procedures that the Fund uses to determine how to vote proxies relating to portfolio securities and a record of how the Fund voted any proxies for the twelve-month period ended June 30, 2011 are available (1) without charge, upon request, by calling 888-843-7824 and (2) on the SEC’s website at http://www.sec.gov.
QUARTERLY PORTFOLIO HOLDINGS INFORMATION (UNAUDITED)
The Fund files a complete schedule of portfolio holdings with the SEC for the first and third quarters of each fiscal year on Form N-Q. The Fund’s Forms are available (1) without charge, upon request, by calling 888-843-7824 and (2) on the SEC’s website at http://www.sec.gov. The Form N-Q may be reviewed and copied at the SEC’s Public Reference Room in Washington, DC. Information on the operation of the Public Reference Room may be obtained by calling 1-800-SEC-0330.
The Hartford Value Opportunities Fund
| Expense Example (Unaudited) |
Your Fund's Expenses
As a shareholder of the Fund, you incur two types of costs: (1) transaction costs, including sales charges (loads) on purchase payments and contingent deferred sales charges (CDSC) and (2) ongoing costs, including investment management fees, distribution fees, and other fund expenses. This example is intended to help you understand your ongoing costs (in dollars) of investing in the Fund and to compare these costs with the ongoing costs of investing in other mutual funds. The example is based on an investment of $1,000 invested at the beginning of the period and held for the period of October 31, 2011 through April 30, 2012.
Actual Expenses
The first set of columns of the table below provides information about actual account values and actual expenses. You may use the information in this column, together with the amount you invested, to estimate the expenses that you paid over the period. Simply divide your account value by $1,000 (for example, an $8,600 account value divided by $1,000 = 8.6), then multiply the result by the number in the line under the heading entitled “Expenses Paid During Period” to estimate the expenses you paid on your account during this period.
Hypothetical Example for Comparison Purposes
The second set of columns of the table below provides information about hypothetical account values and hypothetical expenses based on the Fund's actual expense ratio and an assumed rate of return of 5% per year before expenses, which is not the Fund's actual return. The hypothetical account values and expenses may not be used to estimate the actual ending account balance or expenses you paid for the period. You may use this information to compare the ongoing costs of investing in the Fund and other funds. To do so, compare this 5% hypothetical example with the 5% hypothetical examples that appear in the shareholder reports of the other funds.
Please note that the expenses shown in the table are meant to highlight your ongoing costs only and do not reflect any transactional costs, such as sales charges (loads) and CDSC. Therefore, the second set of columns of the table is useful in comparing ongoing costs only, and will not help you determine the relative total costs of owning different funds. In addition, if these transactional costs were included, your costs would be higher. Expenses are equal to the Fund's annualized expense ratios multiplied by average account value over the period, multiplied by 182/366 (to reflect the one-half year period).
| | | Actual return | | | Hypothetical (5% return before expenses) | | | |
| | | Beginning
Account Value
October 31, 2011 | | | Ending Account
Value
April 30, 2012 | | | Expenses paid
during the period
October 31, 2011
through
April 30, 2012 | | | Beginning
Account Value
October 31, 2011 | | | Ending Account
Value
April 30, 2012 | | | Expenses paid
during the
period
October 31, 2011
through
April 30, 2012 | | | Annualized
expense
ratio | | Days in
the
current
1/2
year | | | Days
in the
full
year | |
| Class A | | $ | 1,000.00 | | | $ | 1,105.60 | | | $ | 7.07 | | | $ | 1,000.00 | | | $ | 1,018.15 | | | $ | 6.77 | | | 1.35 | % | | 182 | | | | 366 | |
| Class B | | $ | 1,000.00 | | | $ | 1,102.40 | | | $ | 10.97 | | | $ | 1,000.00 | | | $ | 1,014.42 | | | $ | 10.51 | | | 2.10 | | | 182 | | | | 366 | |
| Class C | | $ | 1,000.00 | | | $ | 1,102.10 | | | $ | 10.97 | | | $ | 1,000.00 | | | $ | 1,014.42 | | | $ | 10.52 | | | 2.10 | | | 182 | | | | 366 | |
| Class I | | $ | 1,000.00 | | | $ | 1,107.40 | | | $ | 5.75 | | | $ | 1,000.00 | | | $ | 1,019.40 | | | $ | 5.51 | | | 1.10 | | | 182 | | | | 366 | |
| Class R3 | | $ | 1,000.00 | | | $ | 1,105.20 | | | $ | 8.11 | | | $ | 1,000.00 | | | $ | 1,017.15 | | | $ | 7.77 | | | 1.55 | | | 182 | | | | 366 | |
| Class R4 | | $ | 1,000.00 | | | $ | 1,107.20 | | | $ | 6.55 | | | $ | 1,000.00 | | | $ | 1,018.65 | | | $ | 6.27 | | | 1.25 | | | 182 | | | | 366 | |
| Class R5 | | $ | 1,000.00 | | | $ | 1,108.30 | | | $ | 4.97 | | | $ | 1,000.00 | | | $ | 1,020.15 | | | $ | 4.77 | | | 0.95 | | | 182 | | | | 366 | |
| Class Y | | $ | 1,000.00 | | | $ | 1,109.10 | | | $ | 4.72 | | | $ | 1,000.00 | | | $ | 1,020.39 | | | $ | 4.52 | | | 0.90 | | | 182 | | | | 366 | |
You should carefully consider investment objectives, risks, and charges and expenses of The Hartford Mutual Funds before investing. This and other information can be found in the Fund’s prospectus or summary prospectus, which can be obtained from your investment representative or by calling 888-843-7824. Please read them carefully before you invest or send money. The Hartford Mutual Funds are underwritten and distributed by Hartford Investment Financial Services LLC. “The Hartford” is The Hartford Financial Services Group, Inc., and its subsidiaries. MFSAR-VO12 4/12 110743 Printed in U.S.A. ©2012 The Hartford, Hartford, CT 06155 | |
Item 2. Code of Ethics.
Not applicable to this semi-annual filing.
Item 3. Audit Committee Financial Expert.
Not applicable to this semi-annual filing.
Item 4. Principal Accountant Fees and Services.
Not applicable to this semi-annual filing.
Item 5. Audit Committee of Listed Registrants.
Not applicable to this semi-annual filing.
Item 6. Schedule of Investments
The Schedule of Investments is included as part of the semi-annual report filed under Item 1 of this form.
Item 7. Disclosure of Proxy Voting Policies and Procedures for Closed-End Management Investment Companies.
Not applicable.
Item 8. Portfolio Managers of Closed-End Management Investment Companies.
Not applicable.
Item 9. Purchases of Equity Securities by Closed-End Management Investment Company and Affiliated Purchasers.
Not applicable.
Item 10. Submission of Matters to a Vote of Security Holders
There have been no material changes to the procedures by which shareholders may recommend nominees to the registrant’s board of directors since registrant last provided disclosure in response to this requirement.
Item 11. Controls and Procedures.
| (a) | Based on an evaluation of the Registrant's Disclosure Controls and Procedures as of a date within 90 days of the filing date of this report, the Disclosure Controls and Procedures are effectively designed to ensure that information required to be disclosed by the Registrant is recorded, processed, summarized and reported by the date of this report, including ensuring that information required to be disclosed in the report is accumulated and communicated to the Registrant's management, including the Registrant's officers, as appropriate, to allow timely decisions regarding required disclosure. |
| (b) | There was no change in the Registrant's internal control over financial reporting that occurred during the Registrant’s last fiscal half year that has materially affected, or is reasonably likely to materially affect, the registrant’s internal control over financial reporting. |
Item 12. Exhibits.
11(a) (2) Section 302 certifications of the principal executive officer and principal
financial officer of Registrant.
(b) Section 906 certification.
SIGNATURES
Pursuant to the requirements of the Securities Exchange Act of 1934 and the Investment Company Act of 1940, the registrant has duly caused this report to be signed on its behalf by the undersigned, thereunto duly authorized.
| | THE HARTFORD MUTUAL FUNDS II, INC. |
| | | |
| Date: June 12, 2012 | By: | /s/ James E. Davey |
| | | James E. Davey |
| | | Its: President |
Pursuant to the requirements of the Securities Exchange Act of 1934 and the Investment Company Act of 1940, this report has been signed below by the following persons on behalf of the registrant and in the capacities and on the dates indicated.
| Date: June 12, 2012 | By: | /s/ James E. Davey |
| | | James E. Davey |
| | | Its: President |
| | | |
| | | |
| Date: June 12, 2012 | By: | /s/ Mark A. Annoni |
| | | Mark A. Annoni |
| | | Its: Vice President, Controller and Treasurer |
EXHIBIT LIST
| | | |
| 99.CERT | 11(a)(2) | Certifications |
| | | |
| | | (i) Section 302 certification of principal executive officer |
| | | |
| | | (ii) Section 302 certification of principal financial officer |
| | | |
| 99.906CERT | 11(b) | Section 906 certification of principal executive officer and principal financial officer |