UNITED STATES
SECURITIES AND EXCHANGE COMMISSION
Washington, D.C. 20549
FORM N-CSR
CERTIFIED SHAREHOLDER REPORT OF REGISTERED MANAGEMENT
INVESTMENT COMPANIES
Investment Company Act file number: 811-00558
THE HARTFORD MUTUAL FUNDS II, INC.
5 Radnor Corporate Center, Suite 300, 100 Matsonford Road, Radnor, Pennsylvania 19087
Edward P. Macdonald, Esquire
Hartford Funds Management Company, LLC
5 Radnor Corporate Center, Suite 300
100 Matsonford Road
Radnor, Pennsylvania 19087
Registrant’s telephone number, including area code: (610) 386-4068
Date of fiscal year end: October 31
Date of reporting period: April 30, 2015
Form N-CSR is to be used by management investment companies to file reports with the Commission not later than 10 days after the transmission to stockholders of any report that is required to be transmitted to stockholders under Rule 30e-1 under the Investment Company Act of 1940 (17 CFR 270.30e-1). The Commission may use the information provided on Form N-CSR in its regulatory, disclosure review, inspection, and policymaking roles.
A registrant is required to disclose the information specified by Form N-CSR, and the Commission will make this information public. A registrant is not required to respond to the collection of information contained in Form N-CSR unless the Form displays a currently valid Office of Management and Budget (“OMB”) control number. Please direct comments concerning the accuracy of the information collection burden estimate and any suggestions for reducing the burden to Secretary, Securities and Exchange Commission, 100 F Street, NE, Washington, DC 20549. The OMB has reviewed this collection of information under the clearance requirements of 44 U.S.C. § 3507.
Item 1. Reports to Stockholders.
[insert Semi-Annual Report here]

| | |
 | | A MESSAGE FROM THE PRESIDENT Dear Fellow Shareholders: Thank you for investing in Hartford Funds. Market Review The now six-year-old bull market in equities continued through the six months ended April 30, 2015, the period of this report, after notching its sixth-consecutive calendar year of positive returns in 2014. From its financial-crisis low in March 2009, the S&P 500 Index1 has grown more than 200%. Returns have been modest so far in 2015, with the S&P 500 Index gaining just less than 2% through April, yet the Index generally managed to stay in positive territory during the period. |
A stronger U.S. dollar, a result of divergent domestic and foreign central-bank policies, and cheaper oil, due to a supply glut unmatched by demand, were market drivers during the period.
In addition, central banks around the globe continue to play an important role in influencing investor and market movement.
On the domestic front, the U.S. Federal Reserve (Fed) ended its bond-buying quantitative-easing (QE) program in late 2014. Now, investor focus is centered on Fed meetings to determine the timeline for future rate hikes, which is dependent on the rate of economic growth, employment rates, and inflation expectations. Currently, rate increases are expected to take place in late 2015. When the Fed begins to raise rates, the shift is likely to be felt by fixed-income investors in particular, as bonds are generally more sensitive to shifting rates than equities.
Though QE ended in the U.S., it is still in use overseas. The Bank of Japan ramped up their existing QE program to stimulate growth by increasing the amount of purchases in their bond-buying program. The European Central Bank started its own program of bond purchases in early 2015 to lower borrowing costs in hopes of stimulating the sluggish economies in the Eurozone. In particular, Greece remains a source of concern as it tries to negotiate its debt repayment to satisfy its creditors.
As the second half of the year approaches, the continuing role of central banks and macroeconomic events in financial markets serves as an important reminder to maintain a strong relationship with a financial advisor who can help guide you through shifting markets with confidence. Whether you’re seeking growth, income, or a way to mitigate volatility with your investments, your financial advisor can help you find a fit within our family of more than 45 mutual funds that were designed with you, and your investment goals, in mind.
Thank you again for investing with Hartford Funds.

James Davey
President
Hartford Funds
| 1 | The S&P 500 Index is a market capitalization-weighted price index composed of 500 widely held common stocks. |
Hartford Funds – Domestic Equity Funds
Table of Contents
The views expressed in each Fund’s Manager Discussion under “Why did the Fund perform this way?” and “What is the outlook?” are views of the Fund’s sub-adviser and portfolio management team through the end of the period and are subject to change based on market and other conditions. Each Fund’s Manager Discussion is for informational purposes only and does not represent an offer, recommendation or solicitation to buy, hold or sell any security. The specific securities identified and described, if any, do not represent all of the securities purchased or sold and you should not assume that investments in the securities identified and discussed will be profitable.
The Hartford Capital Appreciation Fund inception 07/22/1996
| | |
| (sub-advised by Wellington Management Company LLP) | | Investment objective – The Fund seeks growth of capital. |
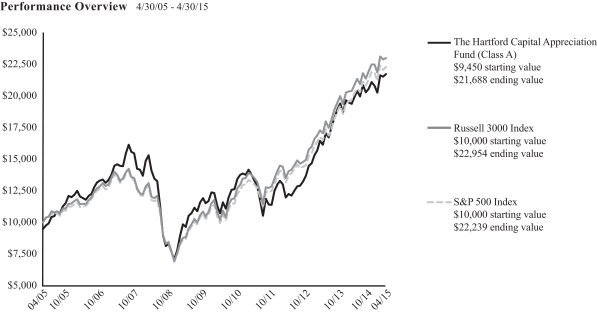
The chart above represents the hypothetical growth of a $10,000 investment in Class A, which includes a sales charge. Growth results in classes other than Class A will vary from what is seen above due to differences in the expenses charged to those share classes.
Average Annual Total Return (as of 4/30/15)
| | | | | | | | | | | | | | | | |
| | | 6 Months1 | | | 1 Year | | | 5 Years | | | 10 Years | |
Capital Appreciation A2 | | | 5.65% | | | | 12.08% | | | | 11.97% | | | | 8.66% | |
Capital Appreciation A3 | | | -0.16% | | | | 5.92% | | | | 10.71% | | | | 8.05% | |
Capital Appreciation B2 | | | 5.19% | | | | 11.13% | | | | 11.03% | | | | 7.96% | 4 |
Capital Appreciation B3 | | | 1.50% | | | | 7.23% | | | | 10.77% | | | | 7.96% | 4 |
Capital Appreciation C2 | | | 5.31% | | | | 11.30% | | | | 11.18% | | | | 7.89% | |
Capital Appreciation C3 | | | 4.56% | | | | 10.51% | | | | 11.18% | | | | 7.89% | |
Capital Appreciation I2 | | | 5.78% | | | | 12.41% | | | | 12.30% | | | | 8.95% | |
Capital Appreciation R32 | | | 5.46% | | | | 11.71% | | | | 11.66% | | | | 8.48% | |
Capital Appreciation R42 | | | 5.64% | | | | 12.08% | | | | 12.01% | | | | 8.77% | |
Capital Appreciation R52 | | | 5.80% | | | | 12.41% | | | | 12.34% | | | | 9.04% | |
Capital Appreciation R62,5 | | | 5.86% | | | | 12.50% | | | | 12.45% | | | | 9.13% | |
Capital Appreciation Y2 | | | 5.84% | | | | 12.48% | | | | 12.45% | | | | 9.13% | |
Russell 3000 Index | | | 4.74% | | | | 12.74% | | | | 14.33% | | | | 8.66% | |
S&P 500 Index | | | 4.40% | | | | 12.98% | | | | 14.33% | | | | 8.32% | |
| 4 | Class B shares convert to Class A shares after 8 years. The return shown reflects the conversion to Class A shares, which had different operating expenses, for the period after conversion. |
| 5 | Inception: 11/07/2014. Cumulative returns not annualized. |
PERFORMANCE DATA QUOTED REPRESENTS PAST PERFORMANCE AND DOES NOT GUARANTEE FUTURE RESULTS. The investment return and principal value of the investment will fluctuate so that investors’ shares, when redeemed, may be worth more or less than their original cost. Current performance may be lower or higher than the performance data quoted. To obtain performance data current to the most recent month-end, please visit our website www.hartfordfunds.com.
The initial investment in Class A shares reflects the maximum sales charge of 5.50% and returns for Class B shares reflect a contingent deferred sales charge of up to 5.00% and declining to zero, depending on the period of time the shares are held. Returns for Class C shares reflect a contingent deferred sales charge of up to 1.00% on shares redeemed within twelve months of purchase.
Total returns presented above were calculated using the Fund’s net asset value available to shareholders for sale or redemption of Fund shares on April 30, 2015, which may exclude investment transactions as of this date. All share class returns assume the reinvestment of all distributions at net asset value and the deduction of all fund expenses.
Effective 9/30/09, Class B shares of the Fund were closed to new investments.
Class I shares commenced operations on 8/31/06. Performance prior to that date is that of the Fund’s Class A shares (excluding sales charges), which had different operating expenses. Class R3, R4 and R5 shares commenced operations on 12/22/06. Performance prior to that date is that of the Fund’s Class Y shares, which had different operating expenses. Class R6 shares commenced operations on 11/07/14. Performance prior to that date is that of the Fund’s Class Y shares, which had different operating expenses.
Russell 3000 Index is an unmanaged index that measures the performance of the 3,000 largest U.S. companies based on total market capitalization.
S&P 500 Index is a market capitalization-weighted price index composed of 500 widely held common stocks.
You cannot invest directly in an index.
The chart and table do not reflect the deductions of taxes that a shareholder would pay on Fund distributions or the redemption of Fund shares.
Performance information may reflect historical or current expense waivers/reimbursements from the investment adviser, without which performance would have been lower. For information on current expense waivers/reimbursements, please see the prospectus.
|
| The Hartford Capital Appreciation Fund |
Manager Discussion
April 30, 2015 (Unaudited)
Operating Expenses*
| | | | | | | | |
| | | Net | | | Gross | |
Captial Appreciation Class A | | | 1.10% | | | | 1.10% | |
Captial Appreciation Class B | | | 1.95% | | | | 1.95% | |
Captial Appreciation Class C | | | 1.81% | | | | 1.81% | |
Captial Appreciation Class I | | | 0.76% | | | | 0.76% | |
Captial Appreciation Class R3 | | | 1.40% | | | | 1.40% | |
Captial Appreciation Class R4 | | | 1.10% | | | | 1.10% | |
Captial Appreciation Class R5 | | | 0.80% | | | | 0.80% | |
Captial Appreciation Class R6 | | | 0.70% | | | | 0.70% | |
Captial Appreciation Class Y | | | 0.70% | | | | 0.70% | |
| * | As shown in the Fund’s current prospectus dated March 1, 2015. Actual expenses may be higher or lower. Please see accompanying Financial Highlights for expense ratios for the six-month period ended April 30, 2015. |
Gross expenses are the Fund’s total annual operating expenses shown in the Fund’s most recent prospectus. Net expenses are the Fund’s total annual operating expenses shown in the Fund’s most recent prospectus and reflect contractual expense reimbursements in instances when these reductions reduce the Fund’s gross expenses. Contractual reimbursements remain in effect until February 29, 2016, and automatically renew for one-year terms unless terminated.
All investments are subject to risk including the possible loss of principal. For a discussion of the Fund’s risks, please see the Main Risks section of this report. For more detailed information on the risks associated with an investment in the Fund, please see the prospectus.
Saul J. Pannell, CFA
Senior Managing Director and Equity Portfolio Manager
Wellington Management Company LLP
Frank D. Catrickes, CFA
Senior Managing Director and Equity Portfolio Manager
Wellington Management Company LLP
Kent M. Stahl, CFA
Senior Managing Director and Director, Investment Strategy and Risk
Wellington Management Company LLP
Gregg R. Thomas, CFA
Senior Managing Director and Director, Risk Management
Wellington Management Company LLP
How did the Fund perform?
The Class A shares of The Hartford Capital Appreciation Fund returned 5.65%, before sales charge, for the six-month period ended April 30, 2015, outperforming the Fund’s benchmarks, the Russell 3000 Index and the S&P 500 Index, which returned 4.74% and 4.40%, respectively, for the same period. The Fund also outperformed the 4.57% average return of the Lipper Multi-Cap Core Funds peer group, a group of funds with investment strategies similar to those of the Fund.
Why did the Fund perform this way?
U.S. equities rose for the period, notwithstanding significant volatility. The S&P 500 Index finished 2014 with strong gains, retreated briefly, but then reached new all-time highs on March 2 and April 24, 2015. The period began strongly with stocks rallying in early November on the heels of positive economic and corporate data points, including a solid corporate earnings season and news that Republicans took control of the U.S. Senate. Stocks pulled back slightly near month-end, led by weakness in the Energy sector associated with the significant decline in oil prices. In December,
U.S. stocks began to rally again but ultimately fell 1.4% during the final two trading days of the year to end the month in the red. Stocks continued to fall in January 2015, which was the worst monthly return for U.S. stocks in a year. Despite a positive overall scorecard, earnings sentiment was fairly negative among many investors, in part due to a strengthening U.S. Dollar adversely affecting exports and making future growth difficult, and some accompanying high-profile earnings guidance disappointments. Equities rebounded in February, posting their best monthly gain since October 2011. The market pulled back again in early March as soft manufacturing data, potentially negative currency- and oil-related earnings, and valuation concerns weighed on investors’ minds. However, risk appetites increased after the March 18 Federal Open Market Committee statement underlined the U.S. Federal Reserve’s (Fed) hesitation to raise rates as U.S. domestic inflation remains subdued and other major central banks have an easing bias. This, as well as a positive earnings season, helped drive stronger returns in April allowing U.S. stocks to end the period with modest gains. Returns varied noticeably by market-cap, as small- and mid-cap stocks outperformed large-cap stocks.
|
| The Hartford Capital Appreciation Fund |
Manager Discussion – (continued)
April 30, 2015 (Unaudited)
Eight of ten sectors in the Russell 3000 Index posted positive returns during the period. Strong performers included the Consumer Discretionary (+11%), Healthcare (+9%) and Information Technology (+7%) sectors, while the Energy (-5%) , Utilities (-1%) and Telecommunication Services (+2%) sectors lagged on a relative basis.
The Fund outperformed the Russell 3000 Index driven primarily by strong stock selection within the Consumer Discretionary, Consumer Staples and Financials sectors. Stock selection within Energy and Information Technology detracted modestly from returns. Sector allocation, a result of bottom-up stock selection, also contributed to results relative to the the Russell 3000 Index driven by our overweight to Information Technology and underweights to Utilities and Financials.
NXP Semiconductor (Information Technology), Sony (Consumer Discretionary) and Uber Technologies (Information Technology) contributed to relative returns over the period. The share price of NXP Semiconductor, a Netherlands-based semiconductor company, moved higher as it continues to maintain its status as a well-positioned semiconductor manufacturer. The stock outperformed over the period following the announcement of a merger with semiconductor company Freescale, which would make the combined company one of the largest firms in the industry. Shares of Sony, a Japan-based manufacturer of electronic equipment for consumers and industry, rose on optimism that the company will emerge stronger after exiting the PC business. Shares of Uber Technologies, a U.S.-based ride-sharing service, increased over the period due to an increase in bookings that came in ahead of projections. Additionally, Baidu, a leading search engine in China, announced that it intends to invest $600 million in Uber and connect its mapping and search features with Uber in China. Apple (Information Technology) and Bristol-Myers (Healthcare) contributed to results on an absolute basis over the period.
The top detractors from relative performance included Micron Technology (Information Technology), Petrobas (Energy), and Pioneer Natural Resources (Energy). Shares of Micron Technology, a U.S.-based semiconductor manufacturer, fell as investors worried about the demand outlook for the DRAM market. Shares of Petrobas, a Brazil-based integrated oil and gas company, fell due to President Dilma Rousseff’s re-election which is viewed negatively for the stock and because the company was forced to delay publication of third quarter earnings results due to an investigation on corruption being conducted by the Brazilian Federal Police. A sharp decline in oil prices further pressured the stock price. U.S.-based independent oil and gas exploration company Pioneer Natural Resources’ shares underperformed amid falling oil prices, as lower crude prices have caused a major retrenchment in oil company exploration and production spending.
Derivatives were not used in a significant manner in this Fund and did not have a material impact on performance during the period.
What is the outlook?
We are constructive about the prospects for 2015. Our research leads us to believe that more opportunities for active managers now exist in equity markets as correlations within indexes move lower and dispersion of returns within sectors increases. As markets for equities continue to deepen, we expect the environment for active management to improve. Despite what we see as valuations that are higher than recent normal levels, we remain constructive on the U.S. Economic fundamentals continue to improve and our growth outlook remains positive. Top line revenue growth, stock specific risk opportunities, and returns on capital have led the way in a modestly rising market year-to-date.
At the end of the period, our largest overweights were to the Healthcare and Information Technology sectors, while our largest underweights were to the Consumer Staples and Energy sectors, relative to the Russell 3000 Index.
Hartford Core Equity Fund inception 04/30/1998
(formerly The Hartford Disciplined Equity Fund)
| | |
| (sub-advised by Wellington Management Company LLP) | | Investment objective – The Fund seeks growth of capital. |
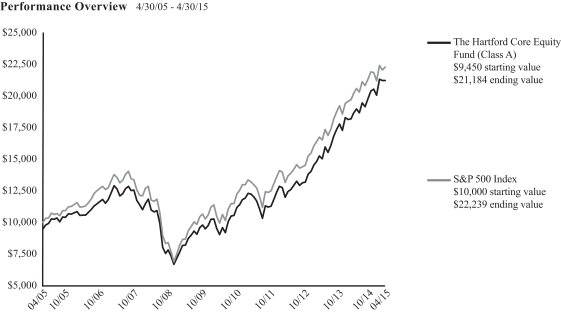
The chart above represents the hypothetical growth of a $10,000 investment in Class A, which includes a sales charge. Growth results in classes other than Class A will vary from what is seen above due to differences in the expenses charged to those share classes.
Average Annual Total Return (as of 4/30/15)
| | | | | | | | | | | | | | | | |
| | | 6 Months1 | | | 1 Year | | | 5 Years | | | 10 Years | |
Core Equity A2 | | | 7.25% | | | | 16.64% | | | | 15.58% | | | | 8.41% | |
Core Equity A3 | | | 1.35% | | | | 10.22% | | | | 14.28% | | | | 7.80% | |
Core Equity B2 | | | 6.87% | | | | 15.74% | | | | 14.71% | | | | 7.83% | 4 |
Core Equity B3 | | | 1.87% | | | | 10.74% | | | | 14.47% | | | | 7.83% | 4 |
Core Equity C2 | | | 6.89% | | | | 15.85% | | | | 14.76% | | | | 7.62% | |
Core Equity C3 | | | 5.89% | | | | 14.85% | | | | 14.76% | | | | 7.62% | |
Core Equity I2,5 | | | 7.30% | | | | 16.69% | | | | 15.59% | | | | 8.41% | |
Core Equity R32 | | | 7.12% | | | | 16.31% | | | | 15.38% | | | | 8.31% | |
Core Equity R42 | | | 7.32% | | | | 16.72% | | | | 15.73% | | | | 8.57% | |
Core Equity R52 | | | 7.43% | | | | 17.07% | | | | 16.07% | | | | 8.85% | |
Core Equity R62,5 | | | 7.45% | | | | 17.06% | | | | 16.11% | | | | 8.91% | |
Core Equity Y2 | | | 7.50% | | | | 17.11% | | | | 16.12% | | | | 8.92% | |
S&P 500 Index | | | 4.40% | | | | 12.98% | | | | 14.33% | | | | 8.32% | |
| 4 | Class B shares convert to Class A shares after 8 years. The return shown reflects the conversion to Class A shares, which had different operating expenses, for the period after conversion. |
| 5 | Inception: 03/31/2015. Cumulative returns not annualized. |
PERFORMANCE DATA QUOTED REPRESENTS PAST PERFORMANCE AND DOES NOT GUARANTEE FUTURE RESULTS. The investment return and principal value of the investment will fluctuate so that investors’ shares, when redeemed, may be worth more or less than their original cost. Current performance may be lower or higher than the performance data quoted. To obtain performance data current to the most recent month-end, please visit our website www.hartfordfunds.com.
The initial investment in Class A shares reflects the maximum sales charge of 5.50% and returns for Class B shares reflect a contingent deferred sales charge of up to 5.00% and declining to zero, depending on the period of time the shares are held. Returns for Class C shares reflect a contingent deferred sales charge of up to 1.00% on shares redeemed within twelve months of purchase.
Total returns presented above were calculated using the Fund’s net asset value available to shareholders for sale or redemption of Fund shares on April 30, 2015, which may exclude investment transactions as of this date. All share class returns assume the reinvestment of all distributions at net asset value and the deduction of all fund expenses.
Effective 9/30/09, Class B shares of the Fund were closed to new investments.
Class R3, R4 and R5 shares commenced operations on 12/22/06. Performance prior to that date is that of the Fund’s Class Y shares, which had different operating expenses. Class I and R6 shares commenced operations on 03/31/15. Performance prior to that date is that of the Fund’s Class Y shares, which had different operating expenses.
S&P 500 Index is a market capitalization-weighted price index composed of 500 widely held common stocks.
You cannot invest directly in an index.
The chart and table do not reflect the deductions of taxes that a shareholder would pay on Fund distributions or the redemption of Fund shares.
Performance information may reflect historical or current expense waivers/reimbursements from the investment adviser, without which performance would have been lower. For information on current expense waivers/reimbursements, please see the prospectus.
|
| Hartford Core Equity Fund |
Manager Discussion
April 30, 2015 (Unaudited)
Operating Expenses*
| | | | | | | | |
| | | Net | | | Gross | |
Core Equity Class A | | | 0.79% | | | | 1.07% | |
Core Equity Class B | | | 1.54% | | | | 2.19% | |
Core Equity Class C | | | 1.54% | | | | 1.76% | |
Core Equity Class I | | | 0.54% | | | | 0.76% | |
Core Equity Class R3 | | | 1.09% | | | | 1.40% | |
Core Equity Class R4 | | | 0.79% | | | | 1.04% | |
Core Equity Class R5 | | | 0.49% | | | | 0.74% | |
Core Equity Class R6 | | | 0.45% | | | | 0.61% | |
Core Equity Class Y | | | 0.49% | | | | 0.61% | |
| * | As shown in the Fund’s current prospectus dated March 1, 2015. Actual expenses may be higher or lower. Please see accompanying Financial Highlights for expense ratios for the six-month period ended April 30, 2015. |
Gross expenses are the Fund’s total annual operating expenses shown in the Fund’s most recent prospectus. Net expenses are the Fund’s total annual operating expenses shown in the Fund’s most recent prospectus and reflect contractual expense reimbursements in instances when these reductions reduce the Fund’s gross expenses. Contractual reimbursements remain in effect until February 29, 2016, and automatically renew for one-year terms unless terminated.
All investments are subject to risk including the possible loss of principal. For a discussion of the Fund’s risks, please see the Main Risks section of this report. For more detailed information on the risks associated with an investment in the Fund, please see the prospectus.
Mammen Chally, CFA
Senior Managing Director and Equity Portfolio Manager
Wellington Management Company LLP
How did the Fund perform?
The Class A shares of the Hartford Core Equity Fund returned 7.25%, before sales charge, for the six-month period ended April 30, 2015, outperforming the Fund’s benchmark, the S&P 500 Index, which returned 4.40% for the same period. The Fund outperformed the 3.92% average return of the Lipper Large-Cap Core Funds peer group, a group of funds with investment strategies similar to those of the Fund.
Why did the Fund perform this way?
U.S. equities rose for the period, notwithstanding significant volatility. The S&P 500 Index finished 2014 with strong gains, retreated briefly, but then reached new all-time highs on March 2 and April 24, 2015. The period began strong with stocks rallying in early November on the heels of positive economic and corporate data points, including a solid corporate earnings season and news that Republicans took control of the U.S. Senate. Stocks pulled back slightly near month-end, led by weakness in the energy sector associated with the significant decline in oil prices. In December, U.S. stocks began to rally again but ultimately fell 1.4% during the final two trading days of the year to end the month in the red. Stocks continued to fall in January 2015, which was the worst monthly return for U.S. stocks in a year. Despite a positive overall scorecard, earnings sentiment was fairly negative among many investors, in part due to a strengthening U.S. Dollar negatively affecting exports and making future growth difficult, and some accompanying high-profile earnings guidance disappointments. Equities rebounded in February, posting their best monthly gain since October 2011. The market pulled back again in early March as soft manufacturing data, potentially negative currency- and oil-related earnings, and valuation concerns weighed on investors’ minds. However, risk appetites increased after the March 18 Federal Open Market Committee statement underlined the
U.S. Federal Reserve’s hesitation to raise rates as U.S. domestic inflation remains subdued and other major central banks have an easing bias. This, as well as a positive earnings season, helped drive stronger returns in April allowing U.S. stocks to end the period with modest gains. Returns varied noticeably by market-cap, as small- and mid-cap stocks outperformed large-cap stocks.
Eight out of ten sectors in the S&P 500 Index rose during the period, with Consumer Discretionary (+12%), Healthcare (+7%), and Information Technology (+6%), performing the best. Energy (-5%) and Utilities (-1%) lagged on a relative basis during the period.
Overall, outperformance versus the S&P 500 Index was driven by strong security selection, primarily within the Consumer Staples, Industrials, and Healthcare sectors. This more than offset negative stock selection within the Consumer Discretionary sector. Sector allocation, a result of the bottom up stock selection process, also contributed to outperformance relative to the S&P 500 Index during the period, in part due to our underweight to Energy and overweight to Consumer Discretionary. This was partially offset by our overweight to Utilities and Consumer Staples. The Fund’s modest cash position detracted from relative performance in an upward-trending market.
The top contributors to relative performance were Omnicare (Healthcare), Dollar Tree (Consumer Discretionary), and AutoZone (Consumer Discretionary). Shares of Omnicare, a healthcare services company offering long term and specialty care services, rose due to news on the potential sale of the company. Shares of Dollar Tree, a U.S.-based discount variety store, rose after the company posted better-than-expected quarterly earnings and increased its guidance for the full fiscal year. Shares of AutoZone, a
|
| Hartford Core Equity Fund |
Manager Discussion – (continued)
April 30, 2015 (Unaudited)
U.S.-based retailer of aftermarket auto parts, moved higher amid solid quarterly earnings and the announcement of an additional $750 million stock buyback authorization. In addition, our position in Apple (Information Technology) was a top contributor to absolute performance.
The top detractors from relative performance were Biogen (Healthcare), Ralph Lauren (Consumer Discretionary), and Amazon.com (Consumer Discretionary). Shares of Biogen, a U.S.-based biotechnology company, underperformed after the firm reported disappointing earnings. Shares of Ralph Lauren, a producer of apparel, accessories, fragrances, and home furnishings, fell during the period after management reported disappointing revenue and earnings, driven in part by a strengthening U.S. Dollar that adversely affected exports. Shares of Amazon.com, a U.S.-based leader in the online e-commerce industry, outperformed after the company posted better than expected quarterly earnings. Not owning this S&P 500 Index-component stock weighed on relative performance during the period. Top absolute detractors also included Qualcomm (Information Technology) and Salix Pharmaceuticals (Healthcare).
Derivatives are not used in a significant manner in this Fund and did not have a material impact on performance during the period.
What is the outlook?
Overall, we continue to find what we consider to be attractively valued stocks with the characteristics we seek. We are cautiously optimistic about the outlook for the U.S. economy and for equity markets, and we continue to monitor policy decisions and economic trends that may impact our holdings. We remain consistent in adhering to our disciplined portfolio construction process that allows us to assess risk, weight individual positions accordingly, and in the process build a portfolio that focuses largely on stock selection for seeking to generate outperformance relative to the S&P 500 Index.
At the end of the period, our largest overweight positions relative to the S&P 500 Index were to Healthcare, Consumer Staples, and Consumer Discretionary, while our largest underweights were in Financials and Energy.
The Hartford Dividend and Growth Fund inception 07/22/1996
| | |
| (sub-advised by Wellington Management Company LLP) | | Investment objective – The Fund seeks a high level of current income consistent with growth of capital. |
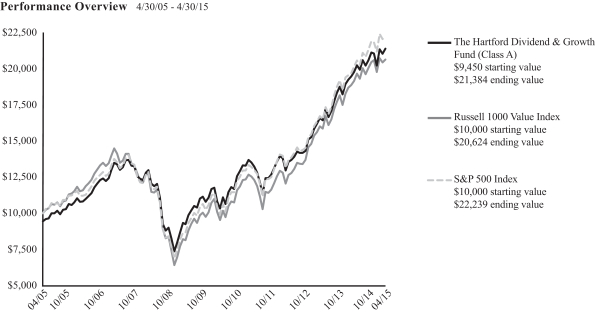
The chart above represents the hypothetical growth of a $10,000 investment in Class A, which includes a sales charge. Growth results in classes other than Class A will vary from what is seen above due to differences in the expenses charged to those share classes.
Average Annual Total Return (as of 4/30/15)
| | | | | | | | | | | | | | | | |
| | | 6 Months1 | | | 1 Year | | | 5 Years | | | 10 Years | |
Dividend & Growth A2 | | | 3.88% | | | | 9.90% | | | | 12.69% | | | | 8.51% | |
Dividend & Growth A3 | | | -1.83% | | | | 3.86% | | | | 11.42% | | | | 7.90% | |
Dividend & Growth B2 | | | 3.41% | | | | 8.88% | | | | 11.69% | | | | 7.76% | 4 |
Dividend & Growth B3 | | | -1.30% | | | | 3.93% | | | | 11.43% | | | | 7.76% | 4 |
Dividend & Growth C2 | | | 3.50% | | | | 9.08% | | | | 11.86% | | | | 7.71% | |
Dividend & Growth C3 | | | 2.56% | | | | 8.10% | | | | 11.86% | | | | 7.71% | |
Dividend & Growth I2 | | | 4.00% | | | | 10.13% | | | | 12.96% | | | | 8.77% | |
Dividend & Growth R32 | | | 3.71% | | | | 9.52% | | | | 12.36% | | | | 8.30% | |
Dividend & Growth R42 | | | 3.89% | | | | 9.89% | | | | 12.71% | | | | 8.61% | |
Dividend & Growth R52 | | | 4.03% | | | | 10.19% | | | | 13.06% | | | | 8.87% | |
Dividend & Growth R62,5 | | | 4.11% | | | | 10.33% | | | | 13.16% | | | | 8.97% | |
Dividend & Growth Y2 | | | 4.07% | | | | 10.28% | | | | 13.15% | | | | 8.96% | |
Russell 1000 Value Index | | | 2.89% | | | | 9.31% | | | | 13.39% | | | | 7.51% | |
S&P 500 Index | | | 4.40% | | | | 12.98% | | | | 14.33% | | | | 8.32% | |
| 4 | Class B shares convert to Class A shares after 8 years. The return shown reflects the conversion to Class A shares, which had different operating expenses, for the period after conversion. |
| 5 | Inception: 11/07/2014. Cumulative returns not annualized. |
PERFORMANCE DATA QUOTED REPRESENTS PAST PERFORMANCE AND DOES NOT GUARANTEE FUTURE RESULTS. The investment return and principal value of the investment will fluctuate so that investors’ shares, when redeemed, may be worth more or less than their original cost. Current performance may be lower or higher than the performance data quoted. To obtain performance data current to the most recent month-end, please visit our website www.hartfordfunds.com.
The initial investment in Class A shares reflects the maximum sales charge of 5.50% and returns for Class B shares reflect a contingent deferred sales charge of up to
5.00% and declining to zero, depending on the period of time the shares are held. Returns for Class C shares reflect a contingent deferred sales charge of up to 1.00% on shares redeemed within twelve months of purchase.
Total returns presented above were calculated using the Fund’s net asset value available to shareholders for sale or redemption of Fund shares on April 30, 2015, which may exclude investment transactions as of this date. All share class returns assume the reinvestment of all distributions at net asset value and the deduction of all fund expenses.
Effective 9/30/09, Class B shares of the Fund were closed to new investments.
Class I shares commenced operations on 8/31/06. Performance prior to that date is that of the Fund’s Class A shares (excluding sales charges), which had different operating expenses. Class R3, R4 and R5 shares commenced operations on 12/22/06. Performance prior to that date is that of the Fund’s Class Y shares, which had different operating expenses. Class R6 shares commenced operations on 11/07/14. Performance prior to that date is that of the Fund’s Class Y shares, which had different operating expenses.
Russell 1000 Value Index is an unmanaged index that measures the performance of those Russell 1000 Index companies with lower price-to-book ratios and lower forecasted growth values. The Russell 1000 Index is an unmanaged index that measures the performance of the 1,000 largest companies in the Russell 3000 Index, which measures the performance of the 3,000 largest U.S. companies, based on total market capitalizations.
S&P 500 Index is a market capitalization-weighted price index composed of 500 widely held common stocks.
You cannot invest directly in an index.
The chart and table do not reflect the deductions of taxes that a shareholder would pay on Fund distributions or the redemption of Fund shares.
Performance information may reflect historical or current expense waivers/reimbursements from the investment adviser, without which performance would have been lower. For information on current expense waivers/reimbursements, please see the prospectus.
|
| The Hartford Dividend and Growth Fund |
Manager Discussion
April 30, 2015 (Unaudited)
Operating Expenses*
| | | | | | | | |
| | | Net | | | Gross | |
Dividend and Growth Class A | | | 1.02% | | | | 1.02% | |
Dividend and Growth Class B | | | 1.94% | | | | 1.96% | |
Dividend and Growth Class C | | | 1.77% | | | | 1.77% | |
Dividend and Growth Class I | | | 0.81% | | | | 0.81% | |
Dividend and Growth Class R3 | | | 1.35% | | | | 1.35% | |
Dividend and Growth Class R4 | | | 1.04% | | | | 1.04% | |
Dividend and Growth Class R5 | | | 0.74% | | | | 0.74% | |
Dividend and Growth Class R6 | | | 0.64% | | | | 0.64% | |
Dividend and Growth Class Y | | | 0.64% | | | | 0.64% | |
| * | As shown in the Fund’s current prospectus dated March 1, 2015. Actual expenses may be higher or lower. Please see accompanying Financial Highlights for expense ratios for the six-month period ended April 30, 2015. |
Gross expenses are the Fund’s total annual operating expenses shown in the Fund’s most recent prospectus. Net expenses are the Fund’s total annual operating expenses shown in the Fund’s most recent prospectus and reflect contractual expense reimbursements in instances when these reductions reduce the Fund’s gross expenses. Contractual reimbursements remain in effect until February 29, 2016, and automatically renew for one-year terms unless terminated.
All investments are subject to risk including the possible loss of principal. For a discussion of the Fund’s risks, please see the Main Risks section of this report. For more detailed information on the risks associated with an investment in the Fund, please see the prospectus.
Edward P. Bousa, CFA
Senior Managing Director and Equity Portfolio Manager
Wellington Management Company LLP
Donald J. Kilbride
Senior Managing Director and Equity Portfolio Manager
Wellington Management Company LLP
Matthew G. Baker
Senior Managing Director and Equity Portfolio Manager
Wellington Management Company LLP
How did the Fund perform?
The Class A shares of The Hartford Dividend and Growth Fund returned 3.88%, before sales charge, for the six-month period ended April 30, 2015, underperforming the Fund’s benchmark, the S&P 500 Index, which returned 4.40% for the same period. The Fund outperformed the 3.0% average return of the Lipper Equity Income Funds peer group, a group of funds with investment strategies similar to those of the Fund.
Why did the Fund perform this way?
U.S. equities rose for the period, notwithstanding significant volatility. The S&P 500 Index finished 2014 with strong gains, retreated briefly, but then reached new all-time highs on March 2 and April 24, 2015. The period began strong with stocks rallying in early November on the heels of positive economic and corporate data points, including a solid corporate earnings season and news that Republicans took control of the U.S. Senate. Stocks pulled back slightly near month-end, led by weakness in the energy sector associated with the significant decline in oil prices. In December, U.S. stocks began to rally again but ultimately fell 1.4% during the final two trading days of the year to end the month in the red. Stocks continued to fall in January 2015, which was the worst monthly return for U.S. stocks in a year. Despite a positive overall scorecard, earnings sentiment was fairly negative among many investors, in part due to a strengthening
U.S. Dollar adversely affecting exports and making future growth difficult, and some accompanying high-profile earnings guidance disappointments. Equities rebounded in February, posting their best monthly gain since October 2011. The market pulled back again in early March as soft manufacturing data, potentially negative currency- and oil-related earnings, and valuation concerns weighed on investors’ minds. However, risk appetites increased after the March 18 Federal Open Market Committee statement underlined the U.S. Federal Reserve’s hesitation to raise rates as U.S. domestic inflation remains subdued and other major central banks have an easing bias. This, as well as a positive earnings season, helped drive stronger returns in April allowing U.S. stocks to end the period with modest gains. Returns varied noticeably by market-cap, as small- and mid-cap stocks outperformed large-cap stocks.
Eight out of ten sectors in the S&P 500 Index rose during the period, with Consumer Discretionary (+12%), Healthcare (+7%), and Information Technology (+6%), performing the best. Energy (-5%) and Utilities (-1%) lagged on a relative basis during the period.
Overall sector allocation, a result of the bottom up stock selection process, detracted from performance relative to the S&P 500 Index during the period, in part due to our underweight to Consumer Discretionary and Information Technology and overweight to
|
| The Hartford Dividend and Growth Fund |
Manager Discussion – (continued)
April 30, 2015 (Unaudited)
Financials. This was partially offset by our overweight to the Healthcare sector. The Fund’s modest cash position detracted from relative performance in an upward-trending market. Security selection in the Industrials and Information Technology sectors contributed to relative performance, while selection in Energy and Financials detracted.
The Fund’s top detractors from performance relative to the S&P 500 Index included Apple (Information Technology), Amazon.com (Information Technology) and Prudential Financial (Financials). Shares of Apple, a designer, manufacturer, and marketer of mobile communications and media devices, rose after the company posted better-than-expected revenue and an increase in gross margins. Being underweight this benchmark-component stock weighed on relative performance during the period. Shares of Amazon.com, a U.S.-based leader in the online e-commerce industry, outperformed after the company posted better than expected quarterly earnings. Not owning this benchmark-component stock weighed on relative performance during the period. Shares of Prudential Financial, a leading provider of insurance and financial services both in the U.S. and globally, underperformed along with the broader financials sector amid an unfavorable interest rate environment and lackluster earnings sentiment. Top absolute detractors also included Exxon Mobil (Energy), Chevron (Energy), and Johnson & Johnson (Healthcare).
The Fund’s top contributors to performance relative to the S&P 500 Index during the period were Equifax (Industrials), Lowe’s (Consumer Discretionary), and CVS (Consumer Staples). Shares of Equifax, a U.S.-based provider of information solutions and human resources business process outsourcing services, outperformed during the period due to acceleration in growth of all business segments, favorable mortgage market conditions, and the smooth integration of recent acquisitions. Shares of Lowe’s, a retailer engaged in the retail sale of home improvement products, rose due to positive trends in home improvement. Shares of CVS, a U.S.-based retail pharmacy, outperformed after the company reaffirmed five-year growth targets and announced a dividend increase and robust share-repurchase forecast. Top absolute performers also included Apple (Information Technology).
Derivatives are not used in a significant manner in this Fund and did not have a material impact on performance during the period.
What is the outlook?
We continue to search for investment ideas that fit with our process and philosophy. We remain focused on the significance of dividends, positive capital stewardship, and franchise value. We believe we have a solid portfolio of undervalued market leaders, stocks in industries with improving supply/demand trends, and solid companies that are temporarily out of favor. At the end of the period, our largest
overweights were to Financials, Industrials, and Healthcare, while we remained underweight consumer Discretionary, Information Technology, and Consumer Staples, relative to the S&P 500 Index.
The Hartford Equity Income Fund inception 08/28/2003
| | |
| (sub-advised by Wellington Management Company LLP) | | Investment objective – The Fund seeks a high level of current income consistent with growth of capital. |
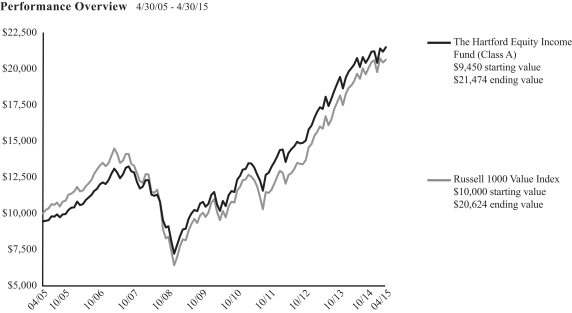
The chart above represents the hypothetical growth of a $10,000 investment in Class A, which includes a sales charge. Growth results in classes other than Class A will vary from what is seen above due to differences in the expenses charged to those share classes.
Average Annual Total Return (as of 4/30/15)
| | | | | | | | | | | | | | | | |
| | | 6 Months1 | | | 1 Year | | | 5 Years | | | 10 Years | |
Equity Income A2 | | | 3.53% | | | | 7.06% | | | | 13.34% | | | | 8.55% | |
Equity Income A3 | | | -2.17% | | | | 1.17% | | | | 12.07% | | | | 7.94% | |
Equity Income B2 | | | 3.45% | | | | 6.91% | | | | 12.69% | | | | 7.84% | 4 |
Equity Income B3 | | | -1.54% | | | | 1.91% | | | | 12.44% | | | | 7.84% | 4 |
Equity Income C2 | | | 3.19% | | | | 6.30% | | | | 12.52% | | | | 7.78% | |
Equity Income C3 | | | 2.19% | | | | 5.30% | | | | 12.52% | | | | 7.78% | |
Equity Income I2 | | | 3.67% | | | | 7.37% | | | | 13.65% | | | | 8.81% | |
Equity Income R32 | | | 3.36% | | | | 6.71% | | | | 12.97% | | | | 8.34% | |
Equity Income R42 | | | 3.56% | | | | 7.07% | | | | 13.32% | | | | 8.62% | |
Equity Income R52 | | | 3.70% | | | | 7.36% | | | | 13.67% | | | | 8.91% | |
Equity Income R62,5 | | | 3.69% | | | | 7.45% | | | | 13.77% | | | | 9.00% | |
Equity Income Y2 | | | 3.68% | | | | 7.45% | | | | 13.77% | | | | 9.00% | |
Russell 1000 Value Index | | | 2.89% | | | | 9.31% | | | | 13.39% | | | | 7.51% | |
| 4 | Class B shares convert to Class A shares after 8 years. The return shown reflects the conversion to Class A shares, which had different operating expenses, for the period after conversion. |
| 5 | Inception: 11/07/2014. Cumulative returns not annualized |
PERFORMANCE DATA QUOTED REPRESENTS PAST PERFORMANCE AND DOES NOT GUARANTEE FUTURE RESULTS. The investment return and principal value of the investment will fluctuate so that investors’ shares, when redeemed, may be worth more or less than their original cost. Current performance may be lower or higher than the performance data quoted. To obtain performance data current to the most recent month-end, please visit our website www.hartfordfunds.com.
The initial investment in Class A shares reflects the maximum sales charge of 5.50% and returns for Class B shares reflect a contingent deferred sales charge of up to
5.00% and declining to zero, depending on the period of time the shares are held. Returns for Class C shares reflect a contingent deferred sales charge of up to 1.00% on shares redeemed within twelve months of purchase.
Total returns presented above were calculated using the Fund’s net asset value available to shareholders for sale or redemption of Fund shares on April 30, 2015, which may exclude investment transactions as of this date. All share class returns assume the reinvestment of all distributions at net asset value and the deduction of all fund expenses.
Effective 9/30/09, Class B shares of the Fund were closed to new investments.
Class I shares commenced operations on 8/31/06. Performance prior to that date is that of the Fund’s Class A shares (excluding sales charges), which had different operating expenses. Class R3, R4 and R5 shares commenced operations on 12/22/06. Performance prior to that date is that of the Fund’s Class Y shares, which had different operating expenses. Class R6 shares commenced operations on 11/07/14. Performance prior to that date is that of the Fund’s Class Y shares, which had different operating expenses.
Russell 1000 Value Index is an unmanaged index that measures the performance of those Russell 1000 Index companies with lower price-to-book ratios and lower forecasted growth values. The Russell 1000 Index is an unmanaged index that measures the performance of the 1,000 largest companies in the Russell 3000 Index, which measures the performance of the 3,000 largest U.S. companies, based on total market capitalizations.
You cannot invest directly in an index.
The chart and table do not reflect the deductions of taxes that a shareholder would pay on Fund distributions or the redemption of Fund shares.
Performance information may reflect historical or current expense waivers/reimbursements from the investment adviser, without which performance would have been lower. For information on current expense waivers/reimbursements, please see the prospectus.
|
| The Hartford Equity Income Fund |
Manager Discussion
April 30, 2015 (Unaudited)
Operating Expenses*
| | | | | | | | |
| | | Net | | | Gross | |
Equity Income Class A | | | 1.03% | | | | 1.03% | |
Equity Income Class B | | | 1.91% | | | | 1.91% | |
Equity Income Class C | | | 1.76% | | | | 1.76% | |
Equity Income Class I | | | 0.76% | | | | 0.76% | |
Equity Income Class R3 | | | 1.37% | | | | 1.37% | |
Equity Income Class R4 | | | 1.06% | | | | 1.06% | |
Equity Income Class R5 | | | 0.76% | | | | 0.76% | |
Equity Income Class R6 | | | 0.66% | | | | 0.66% | |
Equity Income Class Y | | | 0.66% | | | | 0.66% | |
| * | As shown in the Fund’s current prospectus dated March 1, 2015. Actual expenses may be higher or lower. Please see accompanying Financial Highlights for expense ratios for the six-month period ended April 30, 2015. |
Gross expenses are the Fund’s total annual operating expenses shown in the Fund’s most recent prospectus. Net expenses are the Fund’s total annual operating expenses shown in the Fund’s most recent prospectus and reflect contractual expense reimbursements in instances when these reductions reduce the Fund’s gross expenses. Contractual reimbursements remain in effect until February 29, 2016, and automatically renew for one-year terms unless terminated.
All investments are subject to risk including the possible loss of principal. For a discussion of the Fund’s risks, please see the Main Risks section of this report. For more detailed information on the risks associated with an investment in the Fund, please see the prospectus.
W. Michael Reckmeyer, III, CFA
Senior Managing Director and Equity Portfolio Manager
Wellington Management Company LLP
Karen H. Grimes, CFA
Senior Managing Director and Equity Portfolio Manager
Wellington Management Company LLP
Ian R. Link, CFA
Senior Managing Director and Equity Portfolio Manager
Wellington Management Company LLP
How did the Fund perform?
The Class A shares of The Hartford Equity Income Fund returned 3.53%, before sales charge, for the six-month period ended April 30, 2015, outperforming the Fund’s benchmark, the Russell 1000 Value Index, which returned 2.89% for the same period. The Fund also outperformed the 3.0% average return of the Lipper Equity Income Funds peer group, a group of funds with investment strategies similar to those of the Fund.
Why did the Fund perform this way?
U.S. equities rose for the period, notwithstanding significant volatility. The S&P 500 Index finished 2014 with strong gains, retreated briefly, but then reached new all-time highs on March 2 and April 24, 2015. The period began strong with stocks rallying in early November after positive economic and corporate data points, including a solid corporate earnings season and news that Republicans took control of the U.S. Senate. Stocks pulled back slightly near month-end, led by weakness in the Energy sector associated with the significant decline in oil prices. In December, U.S. stocks began to rally again but ultimately fell 1.4% during the final two trading days of the year to end the month in the red. Stocks continued to fall in January 2015, which was the worst monthly return for U.S. stocks in a year. Despite a positive overall scorecard, earnings sentiment was fairly negative among many investors, in part due to a strengthening U.S. Dollar
adversely affecting exports and making future growth difficult, and some accompanying high-profile earnings guidance disappointments. Equities rebounded in February, posting their best monthly gain since October 2011. The market pulled back again in early March as soft manufacturing data, potentially negative currency- and oil-related earnings, and valuation concerns weighed on investors’ minds. However, risk appetites increased after the March 18 Federal Open Market Committee statement underlined the U.S. Federal Reserve’s hesitation to raise rates as U.S. domestic inflation remains subdued and other major central banks have an easing bias. This, as well as a positive earnings season, helped drive stronger returns in April allowing U.S. stocks to end the period with modest gains. Returns varied noticeably by market-cap, as small- and mid-cap stocks outperformed large-cap stocks.
During the period eight out of ten sectors within the Russell 1000 Value Index posted positive absolute returns, with Consumer Discretionary (+11%), Healthcare (+9%), and Industrials (+3%) performing the best. Energy (-6%), Utilities (-1%), and Telecommunication Services (+1%) lagged the index on a relative basis during the period.
Overall, outperformance versus the Russell 1000 Value Index was driven by strong security selection, primarily within the Information
|
| The Hartford Equity Income Fund |
Manager Discussion – (continued)
April 30, 2015 (Unaudited)
Technology and Consumer Staples sectors. This more than offset negative stock selection within Healthcare and Utilities. Sector allocation, driven by our bottom-up stock selection process, modestly detracted from relative returns during the period, primarily due to an underweight to Materials and Healthcare.
Top contributors to relative returns included Kraft Foods (Consumer Staples), Analog Devices (Information Technology), and Home Depot (Consumer Discretionary). Shares of Kraft Foods, a U.S.-based food manufacturer and processor, rose on the back of news that Heinz is to take over the U.S. food manufacturer in a deal which will create one of North America’s biggest food companies and bring together some of the biggest household brands in the U.S., ranging from Heinz ketchup to Jell-O desserts. Shares of Analog Devices, a semiconductor company focused on industrial, communications, and automotive end-markets, rose based on strong earnings reports. Shares of Home Depot, a U.S.-based home improvement retailer, rose due to positive trends in home improvement. Top absolute contributors to performance for the period also included Cisco Systems (Information Technology).
Top detractors from relative performance during the period included Suncor Energy (Energy), National Grid (Utilities), and UnitedHealth (Healthcare). Shares of Suncor, a producer of crude oil, primarily from the oil sands in Alberta, Canada, fell due to a massive decline in oil prices. Shares of National Grid, a U.K.-based regulatory utility with attractive U.S. transmission assets, moved lower during the period due to an uptick in interest rates and improved risk sentiment which caused investors to shift capital away from the traditionally defensive utility sector, weighing on the company’s stock price. Shares of UnitedHealth, a U.S.-based health insurance company, rose after the company announced its plans to purchase Catamaran, a pharmacy-benefit manager company. Not owning this benchmark-component stock weighed on relative performance during the period. Top detractors from absolute performance also included Exxon Mobil (Energy), Johnson & Johnson (Healthcare), and Chevron (Energy).
Derivatives are not used in a significant manner in this Fund and did not have a material impact on performance during the period.
What is the outlook?
We remain cautiously optimistic as we enter the next period. We remain diligent in applying our process to find quality companies with what we consider to be superior dividend yields, total return potential, and discounted valuations. We believe our portfolio holdings are balanced and well-positioned to weather uncertainty in the markets, which we expect to persist in the coming months.
Our sector positioning did not change significantly during the period. At the end of the period, our largest overweights were to the Information Technology, Industrials, and Telecommunication
Services sectors, while our largest underweights were to the Financials and Consumer Discretionary sectors, relative to the Russell 1000 Value Index.
The Hartford Growth Opportunities Fund inception 03/31/1963
| | |
| (sub-advised by Wellington Management Company LLP) | | Investment objective – The Fund seeks capital appreciation. |
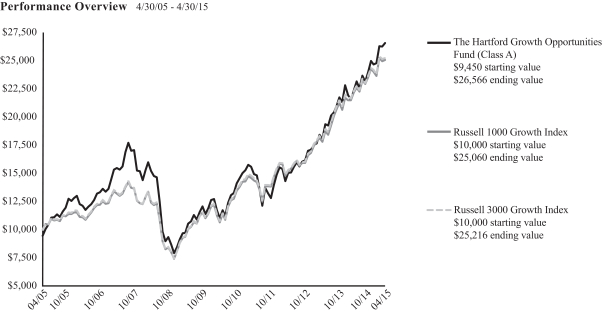
The chart above represents the hypothetical growth of a $10,000 investment in Class A, which includes a sales charge. Growth results in classes other than Class A will vary from what is seen above due to differences in the expenses charged to those share classes.
Average Annual Total Return (as of 4/30/15)
| | | | | | | | | | | | | | | | |
| | | 6 Months1 | | | 1 Year | | | 5 Years | | | 10 Years | |
Growth Opportunities A2 | | | 10.76% | | | | 23.67% | | | | 15.88% | | | | 10.89% | |
Growth Opportunities A3 | | | 4.66% | | | | 16.87% | | | | 14.57% | | | | 10.26% | |
Growth Opportunities B2 | | | 10.26% | | | | 22.59% | | | | 14.95% | | | | 10.21% | 4 |
Growth Opportunities B3 | | | 6.00% | | | | 17.85% | | | | 14.72% | | | | 10.21% | 4 |
Growth Opportunities C2 | | | 10.39% | | | | 22.81% | | | | 15.07% | | | | 10.10% | |
Growth Opportunities C3 | | | 9.54% | | | | 21.86% | | | | 15.07% | | | | 10.10% | |
Growth Opportunities I2 | | | 10.90% | | | | 23.98% | | | | 16.20% | | | | 11.20% | |
Growth Opportunities R32 | | | 10.59% | | | | 23.29% | | | | 15.59% | | | | 10.74% | |
Growth Opportunities R42 | | | 10.74% | | | | 23.69% | | | | 15.94% | | | | 11.04% | |
Growth Opportunities R52 | | | 10.90% | | | | 24.04% | | | | 16.29% | | | | 11.30% | |
Growth Opportunities R62,5 | | | 10.97% | | | | 24.16% | | | | 16.39% | | | | 11.40% | |
Growth Opportunities Y2 | | | 10.96% | | | | 24.14% | | | | 16.39% | | | | 11.40% | |
Russell 1000 Growth Index | | | 6.54% | | | | 16.67% | | | | 15.49% | | | | 9.62% | |
Russell 3000 Growth Index | | | 6.59% | | | | 16.50% | | | | 15.45% | | | | 9.69% | |
| 4 | Class B shares convert to Class A shares after 8 years. The return shown reflects the conversion to Class A shares, which had different operating expenses, for the period after conversion. |
| 5 | Inception: 11/07/2014. Cumulative returns not annualized. |
PERFORMANCE DATA QUOTED REPRESENTS PAST PERFORMANCE AND DOES NOT GUARANTEE FUTURE RESULTS. The investment return and principal value of the investment will fluctuate so that investors’ shares, when redeemed, may be worth more or less than their original cost. Current performance may be lower or higher than the performance data quoted. To obtain performance data current to the most recent month-end, please visit our website www.hartfordfunds.com.
The initial investment in Class A shares reflects the maximum sales charge of 5.50% and returns for Class B shares reflect a contingent deferred sales charge of up to 5.00% and declining to zero, depending on the period of time the shares are held.
Returns for Class C shares reflect a contingent deferred sales charge of up to 1.00% on shares redeemed within twelve months of purchase.
Total returns presented above were calculated using the Fund’s net asset value available to shareholders for sale or redemption of Fund shares on April 30, 2015, which may exclude investment transactions as of this date. All share class returns assume the reinvestment of all distributions at net asset value and the deduction of all fund expenses.
Effective 9/30/09, Class B shares of the Fund were closed to new investments.
Class I shares commenced operations on 8/31/06. Performance prior to that date is that of the Fund’s Class A shares (excluding sales charges), which had different operating expenses. Class R3, R4 and R5 shares commenced operations on 12/22/06. Performance prior to that date is that of the Fund’s Class Y shares, which had different operating expenses. Class R6 shares commenced operations on 11/07/14. Performance prior to that date is that of the Fund’s Class Y shares, which had different operating expenses.
Russell 1000 Growth Index is an unmanaged index that measures the performance of those Russell 1000 Index companies with higher price-to-book ratios and higher forecasted growth values. The Russell 1000 Index is an unmanaged index that measures the performance of the 1,000 largest companies in the Russell 3000 Index, which measures the performance of the 3,000 largest U.S. companies based on total market capitalization.
Russell 3000 Growth Index is an unmanaged index that measures the performance of those Russell 3000 Index companies with higher price-to-book ratios and higher forecasted growth values. The Russell 3000 Index is an unmanaged index that measures the performance of the 3,000 largest U.S. companies based on total market capitalization.
You cannot invest directly in an index.
The chart and table do not reflect the deductions of taxes that a shareholder would pay on Fund distributions or the redemption of Fund shares.
Performance information may reflect historical or current expense waivers/reimbursements from the investment adviser, without which performance would have been lower. For information on current expense waivers/reimbursements, please see the prospectus.
|
| The Hartford Growth Opportunities Fund |
Manager Discussion
April 30, 2015 (Unaudited)
Operating Expenses*
| | | | | | | | |
| | | Net | | | Gross | |
Growth Opportunities Class A | | | 1.15% | | | | 1.15% | |
Growth Opportunities Class B | | | 2.05% | | | | 2.07% | |
Growth Opportunities Class C | | | 1.88% | | | | 1.88% | |
Growth Opportunities Class I | | | 0.91% | | | | 0.91% | |
Growth Opportunities Class R3 | | | 1.45% | | | | 1.46% | |
Growth Opportunities Class R4 | | | 1.15% | | | | 1.15% | |
Growth Opportunities Class R5 | | | 0.85% | | | | 0.85% | |
Growth Opportunities Class R6 | | | 0.75% | | | | 0.75% | |
Growth Opportunities Class Y | | | 0.75% | | | | 0.75% | |
| * | As shown in the Fund’s current prospectus dated March 1, 2015. Actual expenses may be higher or lower. Please see accompanying Financial Highlights for expense ratios for the six-month period ended April 30, 2015. |
Gross expenses are the Fund’s total annual operating expenses shown in the Fund’s most recent prospectus. Net expenses are the Fund’s total annual operating expenses shown in the Fund’s most recent prospectus and reflect contractual expense reimbursements in instances when these reductions reduce the Fund’s gross expenses. Contractual reimbursements remain in effect until February 29, 2016, and automatically renew for one-year terms unless terminated.
All investments are subject to risk including the possible loss of principal. For a discussion of the Fund’s risks, please see the Main Risks section of this report. For more detailed information on the risks associated with an investment in the Fund, please see the prospectus.
Michael T. Carmen, CFA
Senior Managing Director and Equity Portfolio Manager
Wellington Management Company LLP
Stephen Mortimer
Senior Managing Director and Equity Portfolio Manager
Wellington Management Company LLP
Mario E. Abularach, CFA
Senior Managing Director and Equity Research Analyst
Wellington Management Company LLP
How did the Fund perform?
The Class A shares of The Hartford Growth Opportunities Fund returned 10.76%, before sales charge, for the six-month period ended April 30, 2015, outperforming the Fund’s benchmark, the Russell 3000 Growth Index, which returned 6.59% for the same period. The Fund also outperformed the Russell 1000 Growth Index, which returned 6.54% for the same period. The Fund outperformed the 5.57% average return of the Lipper Multi-Cap Growth Funds peer group, a group of funds with investment strategies similar to those of the Fund.
Why did the Fund perform this way?
U.S. equities rose for the period, notwithstanding significant volatility. The S&P 500 Index finished 2014 with strong gains, retreated briefly, but then reached new all-time highs on March 2 and April 24, 2015. The period began strongly with stocks rallying in early November after positive economic and corporate data points, including a solid corporate earnings season and news that Republicans took control of the U.S. Senate. Stocks pulled back slightly near month-end, led by weakness in the Energy sector associated with the significant decline in oil prices. In December, U.S. stocks began to rally again but ultimately fell 1.4% during the final two trading days of the year to end the month in the red. Stocks continued to fall in January 2015, which
was the worst monthly return for U.S. stocks in a year. Despite a positive overall scorecard, earnings sentiment was fairly negative among many investors, in part due to a strengthening U.S. Dollar adversely affecting exports and making future growth difficult, and some accompanying high-profile earnings guidance disappointments. Equities rebounded in February, posting their best monthly gain since October 2011. The market pulled back again in early March as soft manufacturing data, potentially negative currency- and oil-related earnings, and valuation concerns weighed on investors’ minds. However, risk appetites increased after the March 18 Federal Open Market Committee statement underlined the U.S. Federal Reserve’s hesitation to raise rates as U.S. domestic inflation remains subdued and other major central banks have an easing bias. This, as well as a positive earnings season, helped drive stronger returns in April allowing U.S. stocks to end the period with modest gains. Returns varied noticeably by market-cap, as small- and mid-cap stocks outperformed large-cap stocks.
The Russell 3000 Growth Index returned 6.6% over the period. Eight of the ten sectors in the Index rose during the period. Consumer Discretionary (+11%), Information Technology (+8%), and Healthcare (+8%) gained the most while Energy (-4%), Utilities (-1%), and Industrials (+2%) lagged the most on a relative basis over the period.
|
| The Hartford Growth Opportunities Fund |
Manager Discussion – (continued)
April 30, 2015 (Unaudited)
Strong security selection within Information Technology, Consumer Discretionary, and Healthcare was the primary driver of outperformance relative to the Russell 3000 Growth Index during the period, more than offsetting weak selection within Industrials. Sector allocation, a result of our bottom-up stock selection process, detracted slightly from benchmark-relative performance.
Top contributors to relative performance during the period included Uber Technologies (Information Technology), Netflix (Consumer Discretionary), and Amazon (Consumer Discretionary). Private placement Uber Technologies, an innovative mobile application ridesharing service, was the largest contributor during the period. Uber has been expanding and growing at a rapid pace, penetrating new markets and increasing market share on a global scale. We initiated a position in Uber in 2014 and since that time the company has successfully completed additional rounds of financing at substantially increased valuations. Shares of Netflix, a U.S.-based provider of subscription service for television shows and movies via mail and digital streaming, rose due to improved marketing and content costs from global original content licensing, and expectations for long-term subscriber growth and earnings potential. Shares of Amazon, a U.S.-based leader in the online e-commerce industry, rose on healthy results from the U.S. retail side of the business. Amazon, the premier player in the cloud computing sector, with a broad range of networking services, continues to grow in the U.S. at approximately twice the pace of overall e-commerce with nearly 30% market share. Apple (Information Technology) was a top contributor on an absolute basis.
Top relative detractors from performance during the period included Pioneer (Energy), Alibaba (Information Technology), and Baidu (Information Technology). Shares of Pioneer, a U.S.-based independent oil and gas exploration company, detracted from performance relative to the Russell 3000 Growth Index during the period as the rapid decline in oil prices had a strongly negative impact across energy stocks. Shares of Alibaba, a China-based internet company that facilitates the vast majority of e-commerce in China, underperformed during the period due to worries about the slowing Chinese economy and concerns that Chinese consumers will shift to mobile shopping, curtailing advertising revenue. Shares of China-based internet search provider Baidu underperformed as the company reported 2014 fourth quarter earnings that were lower than consensus estimates. Lower earnings were driven by higher than expected selling, general, and administrative expenses, and issued revenue guidance below expectations. Yelp (Information Technology) and Haliburton (Energy) were also top detractors from absolute performance over the period.
Derivatives are not used in a significant manner in this Fund and did not have a material impact on performance during the period.
What is the outlook?
The rally in global equity markets, and particularly growth stocks, continued in the first quarter of 2015. We believe equity markets will continue rewarding quality growth-oriented companies that are attractively valued and provide the potential for future growth for the portfolio. We strongly believe that the portfolio is well-positioned for future growth, with major holdings in what we believe are undervalued stocks trading at attractive multiples. We believe many of these holdings have ample room for future acceleration of earnings and that this growth will ultimately be recognized and compensated for in the market.
At the end of the period, the Fund’s largest sector overweights were Healthcare, Information Technology, and Consumer Discretionary, offsetting underweights to Consumer Staples, Energy, and Telecommunication Services sectors.
The Hartford Healthcare Fund inception 05/01/2000
| | |
| (sub-advised by Wellington Management Company LLP) | | Investment objective – The Fund seeks long-term capital appreciation. |
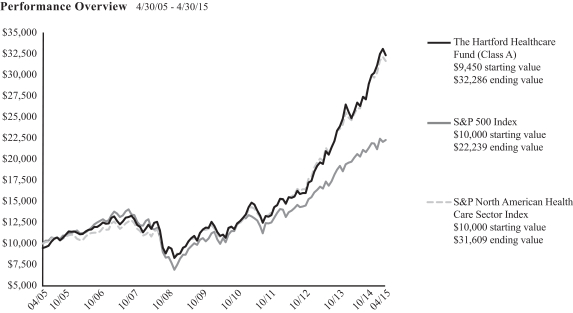
The chart above represents the hypothetical growth of a $10,000 investment in Class A, which includes a sales charge. Growth results in classes other than Class A will vary from what is seen above due to differences in the expenses charged to those share classes.
Average Annual Total Return (as of 4/30/15)
| | | | | | | | | | | | | | | | |
| | | 6 Months1 | | | 1 Year | | | 5 Years | | | 10 Years | |
Healthcare A2 | | | 11.84% | | | | 30.11% | | | | 21.78% | | | | 13.07% | |
Healthcare A3 | | | 5.69% | | | | 22.96% | | | | 20.41% | | | | 12.43% | |
Healthcare B2 | | | 11.39% | | | | 29.03% | | | | 20.77% | | | | 12.37% | 4 |
Healthcare B3 | | | 6.39% | | | | 24.03% | | | | 20.58% | | | | 12.37% | 4 |
Healthcare C2 | | | 11.46% | | | | 29.20% | | | | 20.92% | | | | 12.27% | |
Healthcare C3 | | | 10.46% | | | | 28.20% | | | | 20.92% | | | | 12.27% | |
Healthcare I2 | | | 12.00% | | | | 30.49% | | | | 22.15% | | | | 13.39% | |
Healthcare R32 | | | 11.68% | | | | 29.70% | | | | 21.49% | | | | 12.92% | |
Healthcare R42 | | | 11.84% | | | | 30.08% | | | | 21.86% | | | | 13.24% | |
Healthcare R52 | | | 12.01% | | | | 30.50% | | | | 22.23% | | | | 13.53% | |
Healthcare Y2 | | | 12.04% | | | | 30.59% | | | | 22.33% | | | | 13.60% | |
S&P 500 Index | | | 4.40% | | | | 12.98% | | | | 14.33% | | | | 8.32% | |
S&P North American Health Care Sector Index | | | 9.38% | | | | 28.48% | | | | 21.84% | | | | 12.20% | |
| 4 | Class B shares convert to Class A shares after 8 years. The return shown reflects the conversion to Class A shares, which had different operating expenses, for the period after conversion. |
PERFORMANCE DATA QUOTED REPRESENTS PAST PERFORMANCE AND DOES NOT GUARANTEE FUTURE RESULTS. The investment return and principal value of the investment will fluctuate so that investors’ shares, when redeemed, may be worth more or less than their original cost. Current performance may be lower or higher than the performance data quoted. To obtain performance data current to the most recent month-end, please visit our website www.hartfordfunds.com.
The initial investment in Class A shares reflects the maximum sales charge of 5.50% and returns for Class B shares reflect a contingent deferred sales charge of up to
5.00% and declining to zero, depending on the period of time the shares are held. Returns for Class C shares reflect a contingent deferred sales charge of up to 1.00% on shares redeemed within twelve months of purchase.
Total returns presented above were calculated using the Fund’s net asset value available to shareholders for sale or redemption of Fund shares on April 30, 2015, which may exclude investment transactions as of this date. All share class returns assume the reinvestment of all distributions at net asset value and the deduction of all fund expenses.
Effective 9/30/09, Class B shares of the Fund were closed to new investments.
Class I shares commenced operations on 8/31/06. Performance prior to that date is that of the Fund’s Class A shares (excluding sales charges), which had different operating expenses. Class R3, R4 and R5 shares commenced operations on 12/22/06. Performance prior to that date is that of the Fund’s Class Y shares, which had different operating expenses.
S&P 500 Index is a market capitalization-weighted price index composed of 500 widely held common stocks.
S&P North American Health Care Sector Index is a modified capitalization-weighted index based on United States headquartered health care companies. Stocks in the index are weighted such that each stock is no more than 7.5% of the market capitalization as of the most recent reconstitution date. The companies included in the index must be common stocks and be traded on the NYSE MKT LLC, Nasdaq or the New York Stock Exchange and meet certain established market capitalization levels.
You cannot invest directly in an index.
The chart and table do not reflect the deductions of taxes that a shareholder would pay on Fund distributions or the redemption of Fund shares.
Performance information may reflect historical or current expense waivers/reimbursements from the investment adviser, without which performance would have been lower. For information on current expense waivers/reimbursements, please see the prospectus.
|
| The Hartford Healthcare Fund |
Manager Discussion
April 30, 2015 (Unaudited)
Operating Expenses*
| | | | | | | | |
| | | Net | | | Gross | |
Healthcare Class A | | | 1.33% | | | | 1.33% | |
Healthcare Class B | | | 2.20% | | | | 2.20% | |
Healthcare Class C | | | 2.06% | | | | 2.06% | |
Healthcare Class I | | | 1.05% | | | | 1.05% | |
Healthcare Class R3 | | | 1.64% | | | | 1.64% | |
Healthcare Class R4 | | | 1.34% | | | | 1.34% | |
Healthcare Class R5 | | | 1.05% | | | | 1.05% | |
Healthcare Class Y | | | 0.94% | | | | 0.94% | |
| * | As shown in the Fund’s current prospectus dated March 1, 2015. Actual expenses may be higher or lower. Please see accompanying Financial Highlights for expense ratios for the six-month period ended April 30, 2015. |
Gross expenses are the Fund’s total annual operating expenses shown in the Fund’s most recent prospectus. Net expenses are the Fund’s total annual operating expenses shown in the Fund’s most recent prospectus and reflect contractual expense reimbursements in instances when these reductions reduce the Fund’s gross expenses. Contractual reimbursements remain in effect until February 29, 2016, and automatically renew for one-year terms unless terminated.
All investments are subject to risk including the possible loss of principal. For a discussion of the Fund’s risks, please see the Main Risks section of this report. For more detailed information on the risks associated with an investment in the Fund, please see the prospectus.
Jean M. Hynes, CFA
Senior Managing Director and Global Industry Analyst
Wellington Management Company LLP
Ann C. Gallo
Senior Managing Director and Global Industry Analyst
Wellington Management Company LLP
Kirk J. Mayer, CFA
Senior Managing Director and Global Industry Analyst
Wellington Management Company LLP
Robert L. Deresiewicz
Senior Managing Director and Global Industry Analyst
Wellington Management Company LLP
How did the Fund perform?
The Class A shares of The Hartford Healthcare Fund returned 11.84%, before sales charge, for the six-month period ended April 30, 2015, outperforming the Fund’s benchmark, the S&P North American Health Care Sector Index, which returned 9.38% for the same period. The Fund also outperformed the S&P 500 Index, which returned 4.40% for the same period. The Fund underperformed the 12.59% average return of the average fund in the Lipper Global Health and Biotechnology peer group, a group of funds with investment strategies similar to those of the Fund.
Why did the Fund perform this way?
Health care stocks (+9%) outperformed both the broader U.S. market (+4%) and the global equity market (+5%) during the period, as measured by the S&P North American Health Care, S&P 500, and the MSCI World Indices respectively. Within the S&P North American Health Care Index, four of the five sub-sectors posted positive absolute returns. Biopharma mid-cap (+24%), health services (+15%), and medical technology (+8%) led while biopharma large-cap (+5%) and small-cap (0%) lagged the broader health care index.
The Fund outperformed the S&P North American Health Care Sector Index primarily due to positive stock selection, but sector allocation also contributed. Security selection was strongest in small-cap biopharma names and medical technology during the period. Overweight allocations to mid-cap biopharma names and health services as well as an underweight to large-cap biopharma contributed to relative performance. However, an overweight allocation to small-cap biopharma as well as a modest cash position in an upward trending market environment detracted from relative results during the period.
Holdings of Johnson & Johnson (pharma, biotech, & life sciences), TESARO (pharma, biotech, & life sciences) and NPS Pharmaceuticals (pharma, biotech, & life sciences) contributed most to results relative to the S&P North American Health Care Sector Index. Shares of Johnson & Johnson, a U.S.-based multinational medical devices, pharmaceutical and consumer packaged goods manufacturer, underperformed over the time period as strong results in pharmaceuticals were not enough to offset sluggish growth in their consumer and medical device segments. An underweight to the stock
|
| The Hartford Healthcare Fund |
Manager Discussion – (continued)
April 30, 2015 (Unaudited)
relative to the S&P North American Health Care Sector Index contributed to relative results. Shares of TESARO, an oncology-focused biopharmaceutical company, outperformed over the last six months due to building enthusiasm around an ovarian cancer drug currently undergoing clinical trials. NPS Pharmaceuticals, a U.S.-based biopharmaceutical company focused on developing therapies to treat orphan diseases, saw its stock soar on takeover rumors at the end of 2014 and was subsequently bought out by Shire, a global specialty biopharmaceutical company. Top contributors to absolute performance during the period also included Actavis (pharma, biotech, & life sciences) and Aetna (health care equipment & services).
Valeant Pharmaceuticals (pharma, biotech, & life sciences), Aerie Pharmaceuticals (pharma, biotech, & life sciences), and Pfizer (pharma, biotech, & life sciences) were the top detractors from performance relative to the S&P North American Health Care Sector Index. Shares of Valeant Pharmaceuticals, a multinational specialty pharmaceutical company, rose on strong fourth quarter results and an announcement the company would acquire Salix Pharmaceuticals, a U.S.-based specialist pharmaceutical company. Not owning the strong performing S&P North American Health Care Sector Index constituent weighed on relative returns. Shares of Aerie Pharmaceuticals, a U.S.-based pharmaceutical company, fell dramatically towards the end of the period on news that the company’s lead experimental eye drug candidate had failed to yield positive results in late-stage clinical trials. Not owning S&P North American Health Care Sector Index component Pfizer hurt relative performance as the U.S.-based pharmaceutical company saw shares rise on news of the company’s acquisition of Hospira, a manufacturer of injectable drugs and infusion technologies. Top detractors from absolute performance during the period also included Gilead Sciences (pharma, biotech, & life) and Regulus Therapeutics (pharma, biotech, & life).
Derivatives are not used in a significant manner in this Fund and did not have a material impact on performance during the period.
What is the outlook?
We believe that there continue to be pockets of opportunity in biotech, but after a multi-year run of outstanding performance, near term prospects for the subsector appear to be mixed. We remain vigilant about short-term risk in the subsector and continue to seek what we consider to be attractively-valued mature companies with strong revenue growth, as well as the smaller companies with the most promising pipelines. Our bullish view of biomedical innovation is unchanged and, on that basis, so is our view of the long-term prospects for biotech.
We also remain optimistic about the broad outlook for the Healthcare sector. We believe that biomedical innovation is as robust as it has ever been and should fuel a decade or more of strong earnings growth for the most successful biopharmaceutical companies.
Evolving structures of healthcare markets globally may create clear performance separation between the best and the worst health care services companies. We believe that our approach of evaluating secular themes across a long time horizon will enable us to capitalize on these trends. As is our practice, we will aim to trim stocks on strength and to add on weakness in order to seek to generate favorable returns while minimizing risk.
The Hartford MidCap Fund inception 12/31/1997
| | |
| (sub-advised by Wellington Management Company LLP) | | Investment objective – The Fund seeks long-term growth of capital. |
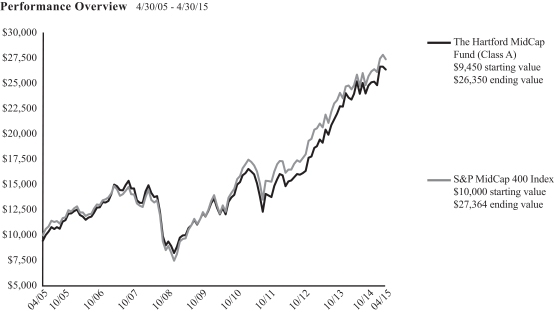
The chart above represents the hypothetical growth of a $10,000 investment in Class A, which includes a sales charge. Growth results in classes other than Class A will vary from what is seen above due to differences in the expenses charged to those share classes.
Average Annual Total Return (as of 4/30/15)
| | | | | | | | | | | | | | | | |
| | | 6 Months1 | | | 1 Year | | | 5 Years | | | 10 Years | |
MidCap A2 | | | 6.38% | | | | 12.68% | | | | 14.14% | | | | 10.80% | |
MidCap A3 | | | 0.53% | | | | 6.48% | | | | 12.86% | | | | 10.17% | |
MidCap B2 | | | 5.91% | | | | 11.74% | | | | 13.16% | | | | 10.09% | 4 |
MidCap B3 | | | 1.27% | | | | 6.85% | | | | 12.91% | | | | 10.09% | 4 |
MidCap C2 | | | 6.00% | | | | 11.90% | | | | 13.34% | | | | 10.04% | |
MidCap C3 | | | 5.07% | | | | 10.92% | | | | 13.34% | | | | 10.04% | |
MidCap I2 | | | 6.48% | | | | 12.99% | | | | 14.43% | | | | 10.99% | |
MidCap R32 | | | 6.21% | | | | 12.35% | | | | 13.82% | | | | 10.83% | |
MidCap R42 | | | 6.40% | | | | 12.69% | | | | 14.18% | | | | 11.03% | |
MidCap R52 | | | 6.53% | | | | 13.03% | | | | 14.52% | | | | 11.23% | |
MidCap R62,5 | | | 6.60% | | | | 13.18% | | | | 14.64% | | | | 11.30% | |
MidCap Y2 | | | 6.57% | | | | 13.15% | | | | 14.64% | | | | 11.30% | |
S&P MidCap 400 Index | | | 6.53% | | | | 12.28% | | | | 14.41% | | | | 10.59% | |
| 4 | Class B shares convert to Class A shares after 8 years. The return shown reflects the conversion to Class A shares, which had different operating expenses, for the period after conversion. |
| 5 | Inception: 11/07/2014. Cumulative returns not annualized. |
PERFORMANCE DATA QUOTED REPRESENTS PAST PERFORMANCE AND DOES NOT GUARANTEE FUTURE RESULTS. The investment return and principal value of the investment will fluctuate so that investors’ shares, when redeemed, may be worth more or less than their original cost. Current performance may be lower or higher than the performance data quoted. To obtain performance data current to the most recent month-end, please visit our website www.hartfordfunds.com.
The initial investment in Class A shares reflects the maximum sales charge of 5.50% and returns for Class B shares reflect a contingent deferred sales charge of up to 5.00% and declining to zero, depending on the period of time the shares are held. Returns for Class C shares reflect a contingent deferred sales charge of up to 1.00% on shares redeemed within twelve months of purchase.
Total returns presented above were calculated using the Fund’s net asset value available to shareholders for sale or redemption of Fund shares on April 30, 2015, which may exclude investment transactions as of this date. All share class returns assume the reinvestment of all distributions at net asset value and the deduction of all fund expenses.
Effective 9/30/09, Class B shares of the Fund were closed to new investments.
Class I shares commenced operations on 2/27/09. Performance prior to that date is that of the Fund’s Class A shares (excluding sales charges), which had different operating expenses. Class R3, R4 and R5 shares commenced operations on 5/29/09. Performance prior to that date is that of the Fund’s Class Y shares which had different operating expenses. Class R6 shares commenced operations on 11/07/14. Performance prior to that date is that of the Fund’s Class Y shares, which had different operating expenses.
S&P MidCap 400 Index is an unmanaged index of common stocks of companies chosen by S&P designed to represent price movements in the mid-cap U.S. equity market.
You cannot invest directly in an index.
The chart and table do not reflect the deductions of taxes that a shareholder would pay on Fund distributions or the redemption of Fund shares.
Performance information may reflect historical or current expense waivers/reimbursements from the investment adviser, without which performance would have been lower. For information on current expense waivers/reimbursements, please see the prospectus.
Manager Discussion
April 30, 2015 (Unaudited)
Operating Expenses*
| | | | | | | | |
| | | Net | | | Gross | |
MidCap Class A | | | 1.15% | | | | 1.15% | |
MidCap Class B | | | 2.05% | | | | 2.05% | |
MidCap Class C | | | 1.88% | | | | 1.88% | |
MidCap Class I | | | 0.90% | | | | 0.90% | |
MidCap Class R3 | | | 1.47% | | | | 1.47% | |
MidCap Class R4 | | | 1.16% | | | | 1.16% | |
MidCap Class R5 | | | 0.86% | | | | 0.86% | |
MidCap Class R6 | | | 0.76% | | | | 0.76% | |
MidCap Class Y | | | 0.76% | | | | 0.76% | |
| * | As shown in the Fund’s current prospectus dated March 1, 2015. Actual expenses may be higher or lower. Please see accompanying Financial Highlights for expense ratios for the six-month period ended April 30, 2015. |
Gross expenses are the Fund’s total annual operating expenses shown in the Fund’s most recent prospectus. Net expenses are the Fund’s total annual operating expenses shown in the Fund’s most recent prospectus and reflect contractual expense reimbursements in instances when these reductions reduce the Fund’s gross expenses. Contractual reimbursements remain in effect until February 29, 2016, and automatically renew for one-year terms unless terminated.
All investments are subject to risk including the possible loss of principal. For a discussion of the Fund’s risks, please see the Main Risks section of this report. For more detailed information on the risks associated with an investment in the Fund, please see the prospectus.
Philip W. Ruedi, CFA
Senior Managing Director and Equity Portfolio Manager
Wellington Management Company LLP
Mark A. Whitaker, CFA
Managing Director and Equity Portfolio Manager
Wellington Management Company LLP
How did the Fund perform?
The Class A shares of The Hartford MidCap Fund returned 6.38%, before sales charge, for the six-month period ended April 30, 2015, underperforming the Fund’s benchmark, the S&P MidCap 400 Index, which returned 6.53% for the same period. The Fund also underperformed the 6.62% average return of the Lipper Mid-Cap Growth Funds peer group, a group of funds with investment strategies similar to those of the Fund.
Why did the Fund perform this way?
U.S. equities rose for the period, notwithstanding significant volatility. The S&P 500 Index finished 2014 with strong gains, retreated briefly, but then reached new all-time highs on March 2 and April 24, 2015. The period began strongly with stocks rallying in early November on the heels of positive economic and corporate data points, including a solid corporate earnings season and news that Republicans took control of the U.S. Senate. Stocks pulled back slightly near month-end, led by weakness in the Energy sector associated with the significant decline in oil prices. In December, U.S. stocks began to rally again but ultimately fell 1.4% during the final two trading days of the year to end the month in the red. Stocks continued to fall in January 2015, which was the worst monthly return for U.S. stocks in a year. Despite a positive overall scorecard, earnings sentiment was fairly negative among many investors, in part due to a strengthening U.S. Dollar adversely affecting exports and making future growth difficult, and some accompanying high-profile earnings guidance disappointments. Equities rebounded in February, posting their best monthly gain since October 2011. The
market pulled back again in early March as soft manufacturing data, potentially negative currency- and oil-related earnings, and valuation concerns weighed on investors’ minds. However, risk appetites increased after the March 18 Federal Open Market Committee statement underlined the U.S. Federal Reserve’s (Fed) hesitation to raise rates as U.S. domestic inflation remains subdued and other major central banks have an easing bias. This, as well as a positive earnings season, helped drive stronger returns in April allowing U.S. stocks to end the period with modest gains. Returns also varied noticeably by market-cap, as mid-cap stocks (+7%) and small-cap stocks (+5%) outperformed large-cap stocks (+4%), as measured by the S&P MidCap 400, Russell 2000, and S&P 500 Indices, respectively. Within the S&P MidCap 400 Index, eight of the ten sectors posted positive returns. The Healthcare (+17%), Information Technology (+11%), and Consumer Staples, (+10%) sectors performed best while Energy (-10%) and Utilities (-2%) lagged.
The Fund underperformed the S&P MidCap 400 Index during the period primarily as a result of weak security selection. Stock selection was weakest in the Consumer Discretionary and Information Technology sectors, which more than offset positive stock selection in Industrials and Financials. Sector allocation, a result of our bottom up stock selection process, contributed to performance during the period due primarily to an overweight to the Healthcare and underweight to the Utilities sectors. Our overweight to Energy and Industrials detracted on a relative basis.
Manager Discussion – (continued)
April 30, 2015 (Unaudited)
Top relative detractors included Yelp (Information Technology), Skyworks Solutions (Information Technology), and HomeAway (Information Technology). Shares of Yelp, a web-based consumer review business, underperformed due to concerns about slowing growth. Skyworks Solutions, a U.S.-based semiconductor supplier with products sold to manufacturers of smart phones and other mobile devices, rose due to the success of the iPhone 6. Not owning this S&P MidCap 400 Index component stock weighed on relative performance during the period. Shares of HomeAway, an online vacation home rental service, declined during the period after management reduced earnings guidance. Top absolute detractors included Apollo Education (Consumer Discretionary).
Top contributors to performance relative to the S&P MidCap 400 Index included Equifax (Industrials), Incyte (Healthcare), and Monster Beverage (Consumer Staples). Shares of Equifax, a U.S.-based credit rating agency, outperformed during the period due to acceleration in growth of all business segments, favorable mortgage market conditions, and the smooth integration of recent acquisitions. Incyte is a drug developer company focused on the treatment of cancers, myelofibrosis, and inflammation. Shares rose on continuing positive news in the field of immuno-oncology, an approach that helps the body’s immune system to target tumors. Shares of Monster Beverage, a U.S.-based maker of energy drinks, outperformed as the company reported fourth quarter earnings that significantly exceeded consensus expectations, driven by higher than expected net revenue growth. Top absolute contributors for the period included Genpact (Information Technology) and Vantiv (Information Technology).
Derivatives were not used in this Fund and did not have an impact on performance during the period.
What is the outlook?
We believe the Fund is well positioned for the current market environment. We ended the period overweight Healthcare, including an allocation to market leading biotech companies and, increasingly, to medical device and service providers. We were modestly overweight Information Technology and Industrials, and we continued to have a small overweight in Energy stocks with what we consider to be strong balance sheets and competitively advantaged assets. Our largest underweight was to the Financials sector, where we continue to believe REITs are fundamentally less attractive than other opportunities.
The Hartford MidCap Value Fund inception 04/30/2001
| | |
| (sub-advised by Wellington Management Company LLP) | | Investment objective – The Fund seeks long-term capital appreciation. |
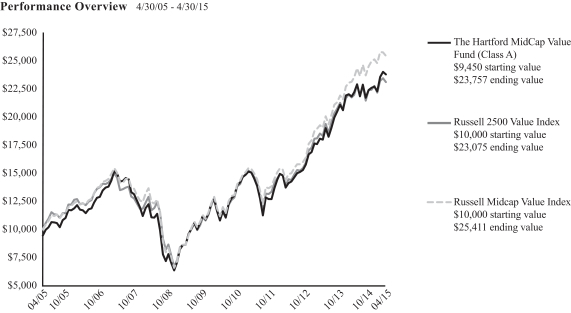
The chart above represents the hypothetical growth of a $10,000 investment in Class A, which includes a sales charge. Growth results in classes other than Class A will vary from what is seen above due to differences in the expenses charged to those share classes.
Average Annual Total Return (as of 4/30/15)
| | | | | | | | | | | | | | | | |
| | | 6 Months1 | | | 1 Year | | | 5 Years | | | 10 Years | |
MidCap Value A2 | | | 6.20% | | | | 8.94% | | | | 13.49% | | | | 9.66% | |
MidCap Value A3 | | | 0.36% | | | | 2.95% | | | | 12.21% | | | | 9.04% | |
MidCap Value B2 | | | 5.69% | | | | 8.01% | | | | 12.61% | | | | 9.02% | 4 |
MidCap Value B3 | | | 1.09% | | | | 3.31% | | | | 12.36% | | | | 9.02% | 4 |
MidCap Value C2 | | | 5.79% | | | | 8.12% | | | | 12.68% | | | | 8.85% | |
MidCap Value C3 | | | 4.87% | | | | 7.18% | | | | 12.68% | | | | 8.85% | |
MidCap Value I2 | | | 6.34% | | | | 9.33% | | | | 13.90% | | | | 9.85% | |
MidCap Value R32 | | | 5.97% | | | | 8.58% | | | | 13.24% | | | | 9.77% | |
MidCap Value R42 | | | 6.16% | | | | 8.95% | | | | 13.59% | | | | 9.94% | |
MidCap Value R52 | | | 6.37% | | | | 9.33% | | | | 13.92% | | | | 10.10% | |
MidCap Value Y2 | | | 6.41% | | | | 9.36% | | | | 14.01% | | | | 10.14% | |
Russell 2500 Value Index | | | 3.14% | | | | 6.28% | | | | 12.46% | | | | 8.72% | |
Russell MidCap Value Index | | | 3.84% | | | | 9.97% | | | | 14.57% | | | | 9.77% | |
| 4 | Class B shares convert to Class A shares after 8 years. The return shown reflects the conversion to Class A shares, which had different operating expenses, for the period after conversion. |
PERFORMANCE DATA QUOTED REPRESENTS PAST PERFORMANCE AND DOES NOT GUARANTEE FUTURE RESULTS. The investment return and principal value of the investment will fluctuate so that investors’ shares, when redeemed, may be worth more or less than their original cost. Current performance may be lower or higher than the performance data quoted. To obtain performance data current to the most recent month-end, please visit our website www.hartfordfunds.com.
The initial investment in Class A shares reflects the maximum sales charge of 5.50% and returns for Class B shares reflect a contingent deferred sales charge of up to
5.00% and declining to zero, depending on the period of time the shares are held. Returns for Class C shares reflect a contingent deferred sales charge of up to 1.00% on shares redeemed within twelve months of purchase.
Total returns presented above were calculated using the Fund’s net asset value available to shareholders for sale or redemption of Fund shares on April 30, 2015, which may exclude investment transactions as of this date. All share class returns assume the reinvestment of all distributions at net asset value and the deduction of all fund expenses.
Effective 9/30/09, Class B shares of the Fund were closed to new investments.
Class I shares commenced operations on 5/28/10. Performance prior to that date is that of the Fund’s Class A shares (excluding sales charges), which had different operating expenses. Class R3, R4 and R5 shares commenced operations on 5/28/10. Performance prior to that date is that of the Fund’s Class Y shares which had different operating expenses.
Russell 2500 Value Index is an unmanaged index that measures the performance of those Russell 2500 Index companies with lower price-to-book ratios and lower forecasted growth values. The Russell 2500 Index is an unmanaged index that measures the performance of the 2,500 smallest U.S. companies based on total market capitalization.
Russell MidCap Value Index measures the performance of the mid-cap value segment of the U.S. equity universe. It includes those Russell MidCap Index companies with lower price-to-book ratios and lower forecasted growth values.
You cannot invest directly in an index.
The chart and table do not reflect the deductions of taxes that a shareholder would pay on Fund distributions or the redemption of Fund shares.
Performance information may reflect historical or current expense waivers/reimbursements from the investment adviser, without which performance would have been lower. For information on current expense waivers/reimbursements, please see the prospectus.
|
| The Hartford MidCap Value Fund |
Manager Discussion
April 30, 2015 (Unaudited)
Operating Expenses*
| | | | | | | | |
| | | Net | | | Gross | |
MidCap Value Class A | | | 1.27% | | | | 1.27% | |
MidCap Value Class B | | | 2.10% | | | | 2.28% | |
MidCap Value Class C | | | 1.99% | | | | 1.99% | |
MidCap Value Class I | | | 0.92% | | | | 0.92% | |
MidCap Value Class R3 | | | 1.53% | | | | 1.53% | |
MidCap Value Class R4 | | | 1.22% | | | | 1.22% | |
MidCap Value Class R5 | | | 0.93% | | | | 0.93% | |
MidCap Value Class Y | | | 0.82% | | | | 0.82% | |
| * | As shown in the Fund’s current prospectus dated March 1, 2015. Actual expenses may be higher or lower. Please see accompanying Financial Highlights for expense ratios for the six-month period ended April 30, 2015. |
Gross expenses are the Fund’s total annual operating expenses shown in the Fund’s most recent prospectus. Net expenses are the Fund’s total annual operating expenses shown in the Fund’s most recent prospectus and reflect contractual expense reimbursements in instances when these reductions reduce the Fund’s gross expenses. Contractual reimbursements remain in effect until February 29, 2016, and automatically renew for one-year terms unless terminated.
All investments are subject to risk including the possible loss of principal. For a discussion of the Fund’s risks, please see the Main Risks section of this report. For more detailed information on the risks associated with an investment in the Fund, please see the prospectus.
James N. Mordy
Senior Managing Director and Equity Portfolio Manager
Wellington Management Company LLP
How did the Fund perform?
The Class A shares of The Hartford MidCap Value Fund returned 6.20%, before sales charge, for the six-month period ended April 30, 2015, outperforming the Fund’s benchmarks, the Russell 2500 Value Index and the Russell MidCap Value Index, which returned 3.14% and 3.84%, respectively, for the same period. The Fund also outperformed the 5.45% average return of the Lipper Mid-Cap Core Fund peer group, a group of funds with investment strategies similar to those of the Fund.
Why did the Fund perform this way?
U.S. equities rose for the period, notwithstanding significant volatility. The S&P 500 Index finished 2014 with strong gains, retreated briefly, but then reached new all-time highs on March 2 and April 24, 2015. The period began strongly with stocks rallying in early November on the heels of positive economic and corporate data points, including a solid corporate earnings season and news that Republicans took control of the U.S. Senate. Stocks pulled back slightly near month-end, led by weakness in the Energy sector associated with the significant decline in oil prices. In December, U.S. stocks began to rally again but ultimately fell 1.4% during the final two trading days of the year to end the month in the red. Stocks continued to fall in January 2015, which was the worst monthly return for U.S. stocks in a year. Despite a positive overall scorecard, earnings sentiment was fairly negative among many investors, in part due to a strengthening U.S. Dollar adversely affecting exports and making future growth difficult, and some accompanying high-profile earnings guidance disappointments. Equities rebounded in February, posting their best monthly gain since October 2011. The market pulled back again in early March as soft manufacturing data, potentially negative currency- and oil-related earnings, and valuation concerns weighed on investors’ minds. However, risk appetites
increased after the March 18 Federal Open Market Committee statement underlined the U.S. Federal Reserve’s (Fed) hesitation to raise rates as U.S. domestic inflation remains subdued and other major central banks have an easing bias. This, as well as a positive earnings season, helped drive stronger returns in April allowing U.S. stocks to end the period with modest gains.
Returns varied noticeably by market-cap during the period, mid-cap equities (+7%) outperformed small-caps (+5%) and large-caps (+4%) as represented by the S&P MidCap 400 MidCap, Russell 2000, and S&P 500 indices, respectively. Returns also varied by style, with the Russell 2500 Value underperforming both the Russell 2500 Growth and the broader Russell 2500 Index. Seven of the ten sectors in the Russell 2500 Value Index gained during the period, with Healthcare (+13%), Consumer Staples (+9%), and Consumer Discretionary (+8%) performing the best. Energy (-14%) and Materials (-1%) lagged during the period.
The Fund’s outperformance relative to the Russell 2500 Value Index was driven primarily by strong security selection within Information Technology, Consumer Discretionary, and Energy, which more than offset unfavorable stock selection within Utilities and Consumer Staples. Overall sector allocation, a result of the stock selection process, contributed to relative returns, in part due to an overweight allocation to Healthcare and an underweight allocation to Utilities.
Top contributors to both absolute returns and returns relative to the Russell 2500 Value Index included NXP Semiconductors (Information Technology), Microsemi (Information Technology), and Diamondback Energy (Energy). The share price of Netherlands-based semiconductor company NXP Semiconductors moved higher following the announcement of a merger with semiconductor
|
| The Hartford MidCap Value Fund |
Manager Discussion – (continued)
April 30, 2015 (Unaudited)
company Freescale, which would make the combined company one of the largest firms in the industry. Shares of Microsemi, a U.S.-based analog and mixed signal semiconductor manufacturer, rose during the period after the firm introduced its second generation highly secure 64 gigabyte solid state drive. Shares of Diamondback Energy, an oil and natural gas company focused on the Permian Basin, rose during the period. The company bolstered its already-strong balance sheet in January with an equity raise that expanded the common share count by over 3%.
Top detractors from absolute returns and returns relative to the Russell 2500 Value Index included Trican Well Services (Energy), Wesco International (Industrials), and Moog (Industrials). Shares of Trican Well Services, a North American supplier of pressure pumping services to the oil and gas industry, fell during the period. Prospects for 2015 have eroded much more quickly than we envisioned, and it now appears the company will have to sell assets to provide some cushion against debt covenants. Shares of Wesco International, a distributor of industrial cabling, electrical, and lighting products, fell after the company reported lackluster earnings results and downward guidance revisions due to low oil prices and the strengthening U.S. dollar. Shares of Moog, a manufacturer of precision motion control products and systems for a broad range of applications in the aerospace, defense and industrial markets, fell due to soft revenue and slower-than-expected growth.
Derivatives were not used in the Fund and did not have a material impact on performance during the period.
What is the outlook?
U.S. economic growth thus far in 2015 has been below trend, with a strengthening U.S. Dollar adversely affecting exports and making future growth difficult and disruptions from cold weather and the west coast port strike. The U.S. consumer appears to be in a strong position, but hasn’t spent as much of the oil price windfall as most expected. We still believe Gross Domestic Product (GDP) growth rate is around 3%, and that the Fed will raise interest rates later this year, but the weak March jobs report and currently negative year-on-year inflation reading appear to significantly reduce the odds of a June move. With quantitative easing stimulus now in place in Europe, the likelihood of policy divergence has been reflected in the currency markets. The Fed will have to carefully consider the risks of further dollar strength. Our macroeconomics group has increased their forecast for European growth to this year. We believe that significant uncertainties remain in China, Russia, Brazil and the other emerging markets. We are slightly more overweight the cyclical sectors than we were at the beginning of the year. In a more uncertain environment, with valuations less attractive in our view than in recent years, we look for continued volatility in the equity markets. This should give us the chance to try to take advantage of opportunities to buy what we consider to be good, well-managed companies at temporarily depressed valuations. At the end of the period, our overweight allocations relative to the Russell 2500 Value
Index were in Materials, Consumer Discretionary, and Information Technology, while our greatest underweights continued to be in Financials and Utilities.
The Hartford Small Company Fund inception 07/22/1996
| | |
| (sub-advised by Wellington Management Company LLP) | | Investment objective – The Fund seeks growth of capital. |
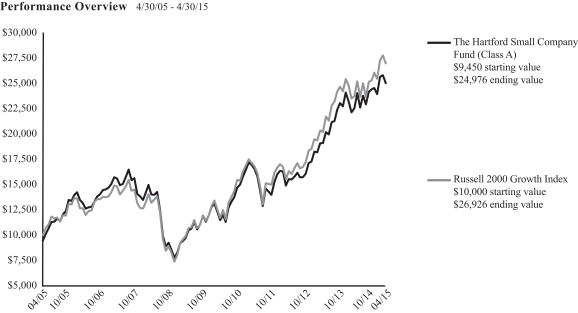
The chart above represents the hypothetical growth of a $10,000 investment in Class A, which includes a sales charge. Growth results in classes other than Class A will vary from what is seen above due to differences in the expenses charged to those share classes.
Average Annual Total Return (as of 4/30/15)
| | | | | | | | | | | | | | | | |
| | | 6 Months1 | | | 1 Year | | | 5 Years | | | 10 Years | |
Small Company A2 | | | 3.51% | | | | 12.88% | | | | 13.71% | | | | 10.21% | |
Small Company A3 | | | -2.18% | | | | 6.67% | | | | 12.43% | | | | 9.59% | |
Small Company B2 | | | 3.13% | | | | 12.03% | | | | 12.85% | | | | 9.61% | 4 |
Small Company B3 | | | -0.96% | | | | 7.58% | | | | 12.60% | | | | 9.61% | 4 |
Small Company C2 | | | 3.14% | | | | 12.06% | | | | 12.90% | | | | 9.41% | |
Small Company C3 | | | 2.32% | | | | 11.17% | | | | 12.90% | | | | 9.41% | |
Small Company I2 | | | 3.63% | | | | 13.17% | | | | 14.01% | | | | 10.46% | |
Small Company R32 | | | 3.40% | | | | 12.62% | | | | 13.51% | | | | 10.10% | |
Small Company R42 | | | 3.54% | | | | 12.96% | | | | 13.86% | | | | 10.39% | |
Small Company R52 | | | 3.72% | | | | 13.33% | | | | 14.19% | | | | 10.65% | |
Small Company R62,5 | | | 3.79% | | | | 13.47% | | | | 14.31% | | | | 10.76% | |
Small Company Y2 | | | 3.75% | | | | 13.42% | | | | 14.30% | | | | 10.76% | |
Russell 2000 Growth Index | | | 7.25% | | | | 14.65% | | | | 14.94% | | | | 10.41% | |
| 4 | Class B shares convert to Class A shares after 8 years. The return shown reflects the conversion to Class A shares, which had different operating expenses, for the period after conversion. |
| 5 | Inception: 11/07/2014. Cumulative returns not annualized. |
PERFORMANCE DATA QUOTED REPRESENTS PAST PERFORMANCE AND DOES NOT GUARANTEE FUTURE RESULTS. The investment return and principal value of the investment will fluctuate so that investors’ shares, when redeemed, may be worth more or less than their original cost. Current performance may be lower or higher than the performance data quoted. To obtain performance data current to the most recent month-end, please visit our website www.hartfordfunds.com.
The initial investment in Class A shares reflects the maximum sales charge of 5.50% and returns for Class B shares reflect a contingent deferred sales charge of up to 5.00% and declining to zero, depending on the period of time the shares are held.
Returns for Class C shares reflect a contingent deferred sales charge of up to 1.00% on shares redeemed within twelve months of purchase.
Total returns presented above were calculated using the Fund’s net asset value available to shareholders for sale or redemption of Fund shares on April 30, 2015, which may exclude investment transactions as of this date. All share class returns assume the reinvestment of all distributions at net asset value and the deduction of all fund expenses.
Effective 9/30/09, Class B shares of the Fund were closed to new investments.
Performance information includes performance under the Fund’s previous sub-adviser, Hartford Investment Management Company. As of July 21, 2010, Hartford Investment Management Company no longer served as the sub-adviser to the Fund.
Class I shares commenced operations on 8/31/06. Performance prior to that date is that of the Fund’s Class A shares (excluding sales charges), which had different operating expenses. Class R3, R4 and R5 shares commenced operations on 12/22/06. Performance prior to that date is that of the Fund’s Class Y shares which had different operating expenses. Class R6 shares commenced operations on 11/07/14. Performance prior to that date is that of the Fund’s Class Y shares, which had different operating expenses.
Russell 2000 Growth Index is an unmanaged index of those Russell 2000 Index growth companies with higher price-to-book ratios and higher forecasted growth values. The Russell 2000 Index is a broad-based unmanaged index comprised of 2,000 of the smallest U.S.-domiciled company common stocks (on the basis of capitalization) that are traded in the United States on the New York Stock Exchange, NYSE MKT LLC and Nasdaq.
You cannot invest directly in an index.
The chart and table do not reflect the deductions of taxes that a shareholder would pay on Fund distributions or the redemption of Fund shares.
Performance information may reflect historical or current expense waivers/reimbursements from the investment adviser, without which performance would have been lower. For information on current expense waivers/reimbursements, please see the prospectus.
|
| The Hartford Small Company Fund |
Manager Discussion
April 30, 2015 (Unaudited)
Operating Expenses*
| | | | | | | | |
| | | Net | | | Gross | |
Small Company Class A | | | 1.34% | | | | 1.34% | |
Small Company Class B | | | 2.15% | | | | 2.29% | |
Small Company Class C | | | 2.05% | | | | 2.05% | |
Small Company Class I | | | 1.10% | | | | 1.10% | |
Small Company Class R3 | | | 1.55% | | | | 1.55% | |
Small Company Class R4 | | | 1.25% | | | | 1.25% | |
Small Company Class R5 | | | 0.95% | | | | 0.97% | |
Small Company Class R6 | | | 0.85% | | | | 0.85% | |
Small Company Class Y | | | 0.85% | | | | 0.85% | |
| * | As shown in the Fund’s current prospectus dated March 1, 2015. Actual expenses may be higher or lower. Please see accompanying Financial Highlights for expense ratios for the six-month period ended April 30, 2015. |
Gross expenses are the Fund’s total annual operating expenses shown in the Fund’s most recent prospectus. Net expenses are the Fund’s total annual operating expenses shown in the Fund’s most recent prospectus and reflect contractual expense reimbursements in instances when these reductions reduce the Fund’s gross expenses. Contractual reimbursements remain in effect until February 29, 2016, and automatically renew for one-year terms unless terminated.
All investments are subject to risk including the possible loss of principal. For a discussion of the Fund’s risks, please see the Main Risks section of this report. For more detailed information on the risks associated with an investment in the Fund, please see the prospectus.
Steven C. Angeli, CFA
Senior Managing Director and Equity Portfolio Manager
Wellington Management Company LLP
Stephen Mortimer
Senior Managing Director and Equity Portfolio Manager
Wellington Management Company LLP
Mario E. Abularach, CFA
Senior Managing Director and Equity Research Analyst
Wellington Management Company LLP
Mammen Chally, CFA
Senior Managing Director and Equity Portfolio Manager
Wellington Management Company LLP
Jamie A. Rome, CFA
Senior Managing Director and Equity Portfolio Manager
Wellington Management Company LLP
How did the Fund perform?
The Class A shares of The Hartford Small Company Fund returned 3.51%, before sales charge, for the six-month period ended April 30, 2015, underperforming the Fund’s benchmark, the Russell 2000 Growth Index, which returned 7.25% for the same period. The Fund also underperformed the 5.85% average return of the Lipper Small Cap Growth Funds peer group, a group of funds with investment strategies similar to those of the Fund.
Why did the Fund perform this way?
U.S. equities rose for the period, notwithstanding significant volatility. The S&P 500 Index finished 2014 with strong gains, retreated briefly, but then reached new all-time highs on March 2 and April 24, 2015. The period began strongly with stocks rallying in early November on the heels of positive economic and corporate data points, including a solid corporate earnings season and news that Republicans took
control of the U.S. Senate. Stocks pulled back slightly near month-end, led by weakness in the Energy sector associated with the significant decline in oil prices. In December, U.S. stocks began to rally again but ultimately fell 1.4% during the final two trading days of the year to end the month in the red. Stocks continued to fall in January 2015, which was the worst monthly return for U.S. stocks in a year. Despite a positive overall scorecard, earnings sentiment was fairly negative among many investors, in part due to a strengthening U.S. Dollar adversely affecting exports and making future growth difficult, and some accompanying high-profile earnings guidance disappointments. Equities rebounded in February, posting their best monthly gain since October 2011. The market pulled back again in early March as soft manufacturing data, potentially negative currency- and oil-related earnings, and valuation concerns weighed on investors’ minds. However, risk appetites increased after the March 18 Federal Open Market Committee statement underlined the
|
| The Hartford Small Company Fund |
Manager Discussion – (continued)
April 30, 2015 (Unaudited)
U.S. Federal Reserve’s hesitation to raise rates as U.S. domestic inflation remains subdued and other major central banks have an easing bias. This, as well as a positive earnings season, helped drive stronger returns in April allowing U.S. stocks to end the period with modest gains.
Large cap stocks (+4%) underperformed both small cap stocks (+5%) and mid cap stocks (+7%) during the period, as measured by the S&P 500, Russell 2000, and S&P MidCap 400 indices respectively. Small cap growth (+7%) stocks outperformed small cap value (+2%) stocks during the period, as measured by the Russell 2000 Growth and Russell 2000 Value indices. Seven out of ten sectors in the Russell 2000 Growth Index had positive returns during the period. The Healthcare (+14%), Utilities (+13%), and Information Technology (+11%) sectors performed best, while Energy (-10%), Consumer Staples (-2%), and Materials (-1%) lagged the broader index.
During the period, security selection was the primary driver of the Fund’s underperformance relative to the Russell 2000 Growth Index. Selection was weakest in the Information Technology and Healthcare sectors, which more than offset positive relative results from stronger selection in the Energy and Materials sectors. Sector allocation, which is the result of bottom-up stock selection, also detracted from relative returns; an underweight to Consumer Staples contributed to relative results but was offset by an underweight to Healthcare and overweight to Industrials, which had a negative impact on relative results.
Top detractors from relative and absolute performance during the period included Mobileye (Information Technology), zulily (Consumer Discretionary), and Vince Holding (Consumer Discretionary). Shares of Mobileye, maker of an Advanced Driver Assistance System that makes cars safer and easier to drive, came under pressure in late 2014 due to concerns about competitive pressure. Online flash sale company zulily saw its shares fall as the company continued to post disappointing results stemming from marketing mis-execution and broader distribution issues. Vince Holding, an apparel vendor primarily focused on high-end department stores, saw shares fall as comparable growth in retail stores was below consensus estimates, which disappointed investors despite strong earnings results overall.
Top contributors to performance relative to the Russell 2000 Growth Index during the period included Freescale Semiconductor (Information Technology), TESARO (Healthcare), and Anacor Pharmaceuticals (Healthcare). Shares of Freescale Semiconductor, a provider of microcontrollers and digital networking processors, rose during the period following an announcement that NXP Semiconductors would acquire the business at a meaningful premium. Shares of TESARO, an oncology-focused biopharmaceutical company, outperformed due to improving expectations regarding the timeline for ongoing clinical trials. Shares of Anacor Pharmaceuticals, a biopharmaceutical company, climbed
after the company announced strong quarterly results well above Wall Street forecasts. Top absolute contributors also included DexCom (Healthcare) and NPS Pharmaceuticals (Healthcare).
Derivatives are not used in a significant manner in this Fund and did not have a material impact on performance during the period.
What is the outlook?
We continue to maintain a cautiously optimistic view of the equity market. Although the pace of industrial growth appears to have slowed in the U.S. during recent months, it appears much of this slack is now being picked up by the consumer as a result of lower unemployment, and the implicit impact of energy price reductions. Appreciation of the U.S. dollar could remain a barrier to growth over the coming year, though small cap stocks historically haven’t had significant currency exposure, such that this would directly impact our investment universe. Though we believe some areas of the market, such as biotech, do look somewhat overbought today, we continue to find what we consider to be compelling investment opportunities across our investment universe.
We view a balanced portfolio as a means to hedge against risk associated with unpredictable events and economic outcomes. The Fund ended the period overweight in the Industrials and Information Technology sectors relative to the Russell 2000 Growth Index. The Fund ended the period most underweight Healthcare and Consumer Staples.
The Hartford Small/Mid Cap Equity Fund inception 01/01/2005
| | |
| (sub-advised by Wellington Management Company LLP) | | Investment objective – The Fund seeks long-term capital appreciation. |
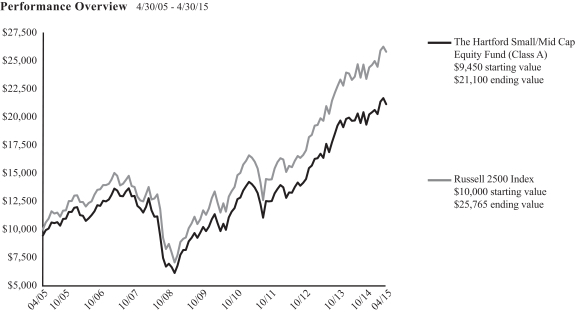
The chart above represents the hypothetical growth of a $10,000 investment in Class A, which includes a sales charge. Growth results in classes other than Class A will vary from what is seen above due to differences in the expenses charged to those share classes.
Average Annual Total Return (as of 4/30/15)
| | | | | | | | | | | | | | | | |
| | | 6 Months1 | | | 1 Year | | | 5 Years | | | 10 Years | |
Small/Mid Cap Equity A2 | | | 4.44% | | | | 7.45% | | | | 13.23% | | | | 8.36% | |
Small/Mid Cap Equity A3 | | | -1.31% | | | | 1.54% | | | | 11.95% | | | | 7.75% | |
Small/Mid Cap Equity B2 | | | 4.09% | | | | 6.70% | | | | 12.37% | | | | 7.84% | 4 |
Small/Mid Cap Equity B3 | | | -0.59% | | | | 1.89% | | | | 12.12% | | | | 7.84% | 4 |
Small/Mid Cap Equity C2 | | | 4.07% | | | | 6.62% | | | | 12.36% | | | | 7.60% | |
Small/Mid Cap Equity C3 | | | 3.13% | | | | 5.66% | | | | 12.36% | | | | 7.60% | |
Small/Mid Cap Equity I2,5 | | | 4.52% | | | | 7.54% | | | | 13.24% | | | | 8.37% | |
Small/Mid Cap Equity R32 | | | 4.39% | | | | 7.26% | | | | 13.21% | | | | 8.57% | |
Small/Mid Cap Equity R42 | | | 4.55% | | | | 7.57% | | | | 13.44% | | | | 8.68% | |
Small/Mid Cap Equity R52 | | | 4.68% | | | | 7.84% | | | | 13.69% | | | | 8.80% | |
Small/Mid Cap Equity Y2 | | | 4.73% | | | | 7.98% | | | | 13.71% | | | | 8.81% | |
Russell 2500 Index | | | 5.64% | | | | 10.70% | | | | 14.01% | | | | 9.93% | |
| 4 | Class B shares convert to Class A shares after 8 years. The return shown reflects the conversion to Class A shares, which had different operating expenses, for the period after conversion. |
| 5 | Inception: 03/31/2015. Cumulative returns not annualized. |
PERFORMANCE DATA QUOTED REPRESENTS PAST PERFORMANCE AND DOES NOT GUARANTEE FUTURE RESULTS. The investment return and principal value of the investment will fluctuate so that investors’ shares, when redeemed, may be worth more or less than their original cost. Current performance may be lower or higher than the performance data quoted. To obtain performance data current to the most recent month-end, please visit our website www.hartfordfunds.com.
The initial investment in Class A shares reflects the maximum sales charge of 5.50% and returns for Class B shares reflect a contingent deferred sales charge of up to 5.00% and declining to zero, depending on the period of time the shares are held.
Returns for Class C shares reflect a contingent deferred sales charge of up to 1.00% on shares redeemed within twelve months of purchase.
Total returns presented above were calculated using the Fund’s net asset value available to shareholders for sale or redemption of Fund shares on April 30, 2015, which may exclude investment transactions as of this date. All share class returns assume the reinvestment of all distributions at net asset value and the deduction of all fund expenses.
Effective 9/30/09, Class B shares of the Fund were closed to new investments.
Class R3, R4 and R5 shares commenced operations on 9/30/11. Performance prior to that date is that of the Fund’s Class Y shares, which had different operating expenses. Class I shares commenced operations on 03/31/15. Performance prior to that date is that of the Fund’s Class Y shares, which had different operating expenses.
Includes the Fund’s performance when it invested, prior to 2/1/10, at least 80% of its assets in common stocks of mid-capitalization companies.
Performance information includes performance under the Fund’s previous sub-adviser, Hartford Investment Management Company. As of June 4, 2012, Hartford Investment Management Company no longer served as the sub-adviser to the Fund.
Russell 2500 Index measures the performance of the small to mid-cap segment of the U.S. equity universe, commonly referred to as “smid” cap. The Russell 2500 Index is a subset of the Russell 3000 Index and includes approximately 2500 of the smallest securities based on a combination of their market capitalization and current index membership.
You cannot invest directly in an index.
The chart and table do not reflect the deductions of taxes that a shareholder would pay on Fund distributions or the redemption of Fund shares.
Performance information may reflect historical or current expense waivers/reimbursements from the investment adviser, without which performance would have been lower. For information on current expense waivers/reimbursements, please see the prospectus.
|
| The Hartford Small/Mid Cap Equity Fund |
Manager Discussion
April 30, 2015 (Unaudited)
Operating Expenses*
| | | | | | | | |
| | | Net | | | Gross | |
Small/Mid Cap Equity Class A | | | 1.30% | | | | 1.41% | |
Small/Mid Cap Equity Class B | | | 2.05% | | | | 2.32% | |
Small/Mid Cap Equity Class C | | | 2.05% | | | | 2.16% | |
Small/Mid Cap Equity Class I | | | 1.05% | | | | 1.10% | |
Small/Mid Cap Equity Class R3 | | | 1.50% | | | | 1.70% | |
Small/Mid Cap Equity Class R4 | | | 1.20% | | | | 1.37% | |
Small/Mid Cap Equity Class R5 | | | 0.90% | | | | 1.05% | |
Small/Mid Cap Equity Class Y | | | 0.85% | | | | 0.96% | |
| * | As shown in the Fund’s current prospectus dated March 1, 2015. Actual expenses may be higher or lower. Please see accompanying Financial Highlights for expense ratios for the six-month period ended April 30, 2015. |
Gross expenses are the Fund’s total annual operating expenses shown in the Fund’s most recent prospectus. Net expenses are the Fund’s total annual operating expenses shown in the Fund’s most recent prospectus and reflect contractual expense reimbursements in instances when these reductions reduce the Fund’s gross expenses. Contractual reimbursements remain in effect until February 29, 2016, and automatically renew for one-year terms unless terminated.
All investments are subject to risk including the possible loss of principal. For a discussion of the Fund’s risks, please see the Main Risks section of this report. For more detailed information on the risks associated with an investment in the Fund, please see the prospectus.
David J. Elliott, CFA
Managing Director, Co-Director, Quantitative Investments and Portfolio Manager
Wellington Management Company LLP
How did the Fund perform?
The Class A shares of The Hartford Small/Mid Cap Equity Fund returned 4.44%, before sales charge, for the six-month period ended April 30, 2015, underperforming the Fund’s benchmark, the Russell 2500 Index, which returned 5.64% for the same period. The Fund outperformed the 3.93% average return of the Lipper Mid-Cap Core Funds peer group a group of funds with investment strategies similar to those of the Fund.
Why did the Fund perform this way?
U.S. equities rose for the period, notwithstanding significant volatility. The S&P 500 Index finished 2014 with strong gains, retreated briefly, but then reached new all-time highs on March 2 and April 24, 2015. The period began strong with stocks rallying in early November on the heels of positive economic and corporate data points, including a solid corporate earnings season and news that Republicans took control of the U.S. Senate. Stocks pulled back slightly near month-end, led by weakness in the Energy sector associated with the significant decline in oil prices. In December, U.S. stocks began to rally again but ultimately fell 1.4% during the final two trading days of the year to end the month in the red. Stocks continued to fall in January 2015, which was the worst monthly return for U.S. stocks in a year. Despite a positive overall scorecard, earnings sentiment was fairly negative among many investors, in part due to a strengthening U.S. Dollar adversely affecting exports and making future growth difficult, and some accompanying high-profile earnings guidance disappointments. Equities rebounded in February, posting their best monthly gain since October 2011. The market pulled back again in early March as soft manufacturing data, potentially negative currency- and oil-related earnings, and valuation concerns weighed on investors’ minds. However, risk appetites increased after the March 18 Federal Open Market Committee statement underlined the
U.S. Federal Reserve’s hesitation to raise rates as U.S. domestic inflation remains subdued and other major central banks have an easing bias. This, as well as a positive earnings season, helped drive stronger returns in April allowing U.S. stocks to end the period with modest gains. Returns varied noticeably by market-cap, as small- and mid-cap stocks outperformed large-cap stocks.
Seven of the ten sectors in the Russell 2500 Index posted positive returns during the period. Strong performers included the Healthcare (+15%), Consumer Discretionary (+10%), and Information Technology (+9%) sectors, while the Energy (-13%), Telecommunications Services (-1%), and Utilities (0%) sectors lagged on an absolute and relative basis.
Security selection drove underperformance relative to the Russell 2500 Index. Weak selection in Materials, Financials, and Healthcare offset stronger stock selection in the Industrials, Information Technology, and Utilities sectors. Overall sector allocation, a fallout of our bottom-up stock selection process, also modestly detracted from returns relative to the Russell 2500 Index during the period due to underweights in the Healthcare, Utilities, and Materials sectors. The Fund’s modest cash position detracted from relative performance in an upward-trending market.
The largest detractors from performance relative to the Russell 2500 Index -relative and absolute performance were VAALCO (Energy), Century Aluminum (Materials), and Sonus Networks (Information Technology). Shares of VAALCO, an independent energy company principally engaged in the acquisition, exploration, development and production of crude oil and natural gas, underperformed due to news that its well off the shore of Angola was holding water and being plugged for the time being. Additionally, repercussions from an
|
| The Hartford Small/Mid Cap Equity Fund |
Manager Discussion – (continued)
April 30, 2015 (Unaudited)
impairment charge as a result of write-down of the fair value of two platforms off the coast of Gabon at the end of 2014 still rippled through the first quarter of 2015, driving an approximately 30% decline in stock value. Shares of Century Aluminum, a U.S.-based holding company engaged in the production of primary aluminum, underperformed due to weakness in aluminum prices (which are under pressure by the strong U.S. dollar) and declining premiums in North America and Europe since the beginning of 2015 driven by weak aluminum prices and Chinese oversupply. Century is also facing operation and labor-related challenges at several smelting facilities. Shares of Sonus Networks, a U.S.-based provider of networked solutions for telecommunications, wireless and cable service providers, underperformed over the period. Sonus preannounced weaker than expected results for the first quarter of 2015 and lowered guidance for 2015 results. The company pointed to orders it no longer expects to receive at the end of the quarter as the reason for the missed results and lowered guidance.
The largest contributors to performance relative to the Russell 2500 Index during the period were Anacor Pharmaceuticals (Healthcare), Alaska Air Group (Industrials), and WABCO Holdings (Industrials). Anacor Pharmaceuticals is a U.S.-based biopharmaceutical company focused on discovering, developing and commercializing small-molecule therapeutics derived from its boron chemistry platform. Shares of Anacor outperformed based on favorable reaction to increased profits and revenues that beat the market’s expectations in the first quarter of 2015. Anacor also narrowed losses and continues to focus on its boron platform product pipeline. Shares of Alaska Air Group, the holding company of Alaska Airlines, Inc. which operates a network of regional air carriers throughout the U.S., Canada and Mexico, outperformed over the period due to expected positive impact from route expansion across the U.S. and Mexico. Shares of WABCO Holdings, a U.S.-based commercial truck parts manufacturer, outperformed as the company issued solid outlook for 2015, and is benefiting from a recovery in the European truck market. Skyworks Solutions (Information Technology) was also a top absolute contributor over the period.
Derivatives are not used in a significant manner in this Fund and did not have a material impact on performance during the period.
What is the outlook?
The Fund seeks to add value by utilizing Wellington Management’s proprietary quantitative research and investment tools in a highly disciplined framework. The Fund focuses on stock selection as the key driver of returns and uses quantitative portfolio optimization techniques to seek to minimize unintended and uncompensated risks. Based on individual stock decisions, the Fund ended the period most overweight the Consumer Discretionary, Information Technology, and Energy sectors and most underweight the Consumer Staples, Materials, and Financials sectors relative to the Russell 2500 Index.
The Hartford SmallCap Growth Fund inception 01/04/1988
| | |
| (sub-advised by Wellington Management Company LLP) | | Investment objective – The Fund seeks long-term capital appreciation. |
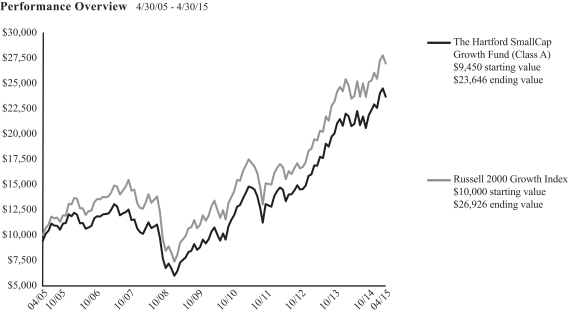
The chart above represents the hypothetical growth of a $10,000 investment in Class A, which includes a sales charge. Growth results in classes other than Class A will vary from what is seen above due to differences in the expenses charged to those share classes.
Average Annual Total Return (as of 4/30/15)
| | | | | | | | | | | | | | | | |
| | | 6 Months1 | | | 1 Year | | | 5 Years | | | 10 Years | |
SmallCap Growth A2 | | | 8.26% | | | | 13.83% | | | | 17.06% | | | | 9.61% | |
SmallCap Growth A3 | | | 2.30% | | | | 7.57% | | | | 15.74% | | | | 8.99% | |
SmallCap Growth B2 | | | 7.77% | | | | 12.89% | | | | 16.16% | | | | 9.02% | 4 |
SmallCap Growth B3 | | | 2.77% | | | | 7.89% | | | | 15.94% | | | | 9.02% | 4 |
SmallCap Growth C2 | | | 7.87% | | | | 13.04% | | | | 16.21% | | | | 8.77% | |
SmallCap Growth C3 | | | 6.87% | | | | 12.04% | | | | 16.21% | | | | 8.77% | |
SmallCap Growth I2 | | | 8.43% | | | | 14.20% | | | | 17.42% | | | | 9.81% | |
SmallCap Growth R32 | | | 8.09% | | | | 13.52% | | | | 16.80% | | | | 9.44% | |
SmallCap Growth R42 | | | 8.28% | | | | 13.89% | | | | 17.16% | | | | 9.69% | |
SmallCap Growth R52 | | | 8.43% | | | | 14.24% | | | | 17.51% | | | | 9.96% | |
SmallCap Growth R62,5 | | | 8.51% | | | | 14.37% | | | | 17.63% | | | | 10.04% | |
SmallCap Growth Y2 | | | 8.49% | | | | 14.35% | | | | 17.62% | | | | 10.03% | |
Russell 2000 Growth Index | | | 7.25% | | | | 14.65% | | | | 14.94% | | | | 10.41% | |
| 4 | Class B shares convert to Class A shares after 8 years. The return shown reflects the conversion to Class A shares, which had different operating expenses, for the period after conversion. |
| 5 | Inception: 11/07/2014. Cumulative returns not annualized. |
PERFORMANCE DATA QUOTED REPRESENTS PAST PERFORMANCE AND DOES NOT GUARANTEE FUTURE RESULTS. The investment return and principal value of the investment will fluctuate so that investors’ shares, when redeemed, may be worth more or less than their original cost. Current performance may be lower or higher than the performance data quoted. To obtain performance data current to the most recent month-end, please visit our website www.hartfordfunds.com.
The initial investment in Class A shares reflects the maximum sales charge of 5.50% and returns for Class B shares reflect a contingent deferred sales charge of up to 5.00% and declining to zero, depending on the period of time the shares are held.
Returns for Class C shares reflect a contingent deferred sales charge of up to 1.00% on shares redeemed within twelve months of purchase.
Total returns presented above were calculated using the Fund’s net asset value available to shareholders for sale or redemption of Fund shares on April 30, 2015, which may exclude investment transactions as of this date. All share class returns assume the reinvestment of all distributions at net asset value and the deduction of all fund expenses.
Effective 9/30/09, Class B shares of the Fund were closed to new investments.
Performance information includes performance under the Fund’s previous sub-adviser, Hartford Investment Management Company. As of July 21, 2010, Hartford Investment Management Company no longer served as the sub-adviser to the Fund.
Class I shares commenced operations on 8/31/06. Performance prior to that date is that of the Fund’s Class A shares (excluding sales charges), which had different operating expenses. Class R3, R4 and R5 shares commenced operations on 12/22/06. Performance prior to that date is that of the Fund’s Class Y shares, which had different operating expenses. Class R6 shares commenced operations on 11/07/14. Performance prior to that date is that of the Fund’s Class Y shares, which had different operating expenses.
Russell 2000 Growth Index is an unmanaged index of those Russell 2000 Index growth companies with higher price-to-book ratios and higher forecasted growth values. The Russell 2000 Index is a broad-based unmanaged index comprised of 2,000 of the smallest U.S.-domiciled company common stocks (on the basis of capitalization) that are traded in the United States on the New York Stock Exchange, NYSE MKT LLC and Nasdaq.
You cannot invest directly in an index.
The chart and table do not reflect the deductions of taxes that a shareholder would pay on Fund distributions or the redemption of Fund shares.
Performance information may reflect historical or current expense waivers/reimbursements from the investment adviser, without which performance would have been lower. For information on current expense waivers/reimbursements, please see the prospectus.
|
| The Hartford SmallCap Growth Fund |
Manager Discussion
April 30, 2015 (Unaudited)
Operating Expenses*
| | | | | | | | |
| | | Net | | | Gross | |
SmallCap Growth Class A | | | 1.28% | | | | 1.28% | |
SmallCap Growth Class B | | | 2.11% | | | | 2.26% | |
SmallCap Growth Class C | | | 1.97% | | | | 1.97% | |
SmallCap Growth Class I | | | 0.97% | | | | 0.97% | |
SmallCap Growth Class R3 | | | 1.53% | | | | 1.53% | |
SmallCap Growth Class R4 | | | 1.22% | | | | 1.22% | |
SmallCap Growth Class R5 | | | 0.91% | | | | 0.91% | |
SmallCap Growth Class R6 | | | 0.81% | | | | 0.81% | |
SmallCap Growth Class Y | | | 0.81% | | | | 0.81% | |
| * | As shown in the Fund’s current prospectus dated March 1, 2015. Actual expenses may be higher or lower. Please see accompanying Financial Highlights for expense ratios for the six-month period ended April 30, 2015. |
Gross expenses are the Fund’s total annual operating expenses shown in the Fund’s most recent prospectus. Net expenses are the Fund’s total annual operating expenses shown in the Fund’s most recent prospectus and reflect contractual expense reimbursements in instances when these reductions reduce the Fund’s gross expenses. Contractual reimbursements remain in effect until February 29, 2016, and automatically renew for one-year terms unless terminated.
All investments are subject to risk including the possible loss of principal. For a discussion of the Fund’s risks, please see the Main Risks section of this report. For more detailed information on the risks associated with an investment in the Fund, please see the prospectus.
Mammen Chally, CFA
Senior Managing Director and Equity Portfolio Manager
Wellington Management Company LLP
David J. Elliott, CFA
Managing Director, Co-Director, Quantitative Investments and Portfolio Manager
Wellington Management Company LLP
How did the Fund perform?
The Class A shares of The Hartford SmallCap Growth Fund returned 8.26%, before sales charge, for the six-month period ended April 30, 2015, outperforming the Fund’s benchmark, the Russell 2000 Growth Index, which returned 7.25% for the same period. The Fund outperformed the 5.85% average return of the Lipper Small-Cap Growth Funds peer group, a group of funds with investment strategies similar to those of the Fund.
Why did the Fund perform this way?
U.S. equities rose for the period, notwithstanding significant volatility. The S&P 500 Index finished 2014 with strong gains, retreated briefly, but then reached new all-time highs on March 2 and April 24, 2015. The period began strong with stocks rallying in early November on the heels of positive economic and corporate data points, including a solid corporate earnings season and news that Republicans took control of the U.S. Senate. Stocks pulled back slightly near month-end, led by weakness in the Energy sector associated with the significant decline in oil prices. In December, U.S. stocks began to rally again but ultimately fell 1.4% during the final two trading days of the year to end the month in the red. Stocks continued to fall in January 2015, which was the worst monthly return for U.S. stocks in a year. Despite a positive overall scorecard, earnings sentiment was fairly negative among many investors, in part due to a strengthening U.S. Dollar adversely affecting exports and making future growth difficult, and some accompanying high-profile earnings guidance disappointments. Equities rebounded in February, posting their best monthly gain since October 2011. The market pulled back again in
early March as soft manufacturing data, potentially negative currency- and oil-related earnings, and valuation concerns weighed on investors’ minds. However, risk appetites increased after the March 18 Federal Open Market Committee statement underlined the U.S. Federal Reserve’s hesitation to raise rates as U.S. domestic inflation remains subdued and other major central banks have an easing bias. This, as well as a positive earnings season, helped drive stronger returns in April allowing U.S. stocks to end the period with modest gains.
Large cap stocks (+4%) underperformed both small cap stocks (+5%) and mid cap stocks (+7%) during the period, as measured by the S&P 500, Russell 2000, and S&P MidCap 400 indices respectively. Small cap growth (+7%) stocks outperformed small cap value (+2%) stocks during the period, as measured by the Russell 2000 Growth and Russell 2000 Value indices. Seven out of ten sectors in the Russell 2000 Growth Index had positive returns during the period. The Healthcare (+14%), Utilities (+13%), and Information Technology (+11%) sectors performed best, while Energy (-10%), Consumer Staples (-2%), and Materials (-1%) lagged the broader index.
Security selection was the primary driver of outperformance relative to the Russell 2000 Growth Index during the period. Positive security selection within Information Technology, Industrials, and Materials more than offset negative selection within the Healthcare and Consumer Discretionary sectors. Sector allocation, driven by our bottom-up stock selection, detracted from relative returns during the
|
| The Hartford SmallCap Growth Fund |
Manager Discussion – (continued)
April 30, 2015 (Unaudited)
period. Negative results from being underweight Healthcare and overweight Consumer Staples were partially offset by our underweight in the Energy sector during the period. A modest cash position detracted in an upward trending market environment.
The top contributors to performance relative to the Russell 2000 Growth Index were Anacor Pharmaceuticals (Healthcare), Hyperion Therapeutics (Healthcare), and DexCom (Healthcare). Shares of Anacor Pharmaceuticals, a biopharmaceutical company, climbed after the company announced strong quarterly results well above Wall Street forecasts. Hyperion Therapeutics focuses on the development and commercialization of therapeutics to treat disorders in the areas of orphan diseases and hepatology. The company saw its shares rise after the announcement of strong quarterly earnings that beat analysts’ estimates and the completion of a phase III clinical trial for one of its drugs. Medical device company DexCom outperformed on positive news flow, including management changes, positive revenue guidance, and FDA approval of a glucose monitoring system. Top absolute contributors to performance for the period also included NPS Pharmaceuticals (Healthcare).
The top detractors from performance relative to the Russell 2000 Growth Index included Vince Holding (Consumer Discretionary), Sonus Networks (Information Technology), and zulily (Consumer Discretionary). Vince Holding is an apparel vendor primarily focused on high-end department stores. The company’s shares fell after comparable growth in retail stores was below consensus estimates, which disappointed investors despite strong overall earnings results. Shares of Sonus Networks, a provider of networked solutions for telecommunications, wireless and cable service providers, fell after the announcement of poor first quarter 2015 results. In addition, management lowered guidance for 2015 results. Online flash sale company zulily saw its shares fall as the company continued to post disappointing results stemming from marketing mis-execution and broader distribution issues. Top absolute detractors from performance for the period also included Puma Biotechnology (Healthcare).
Derivatives are not used in a significant manner in this Fund and did not have a material impact on performance during the period.
What is the outlook?
We believe we are still in a period of moderate global economic growth. First quarter U.S. Gross Domestic Product (GDP) growth will likely be tepid due to several factors making growth difficult, including weather, the strong dollar, and declining energy investment. However, the U.S. consumer is a key beneficiary of low oil prices and a strong U.S. dollar. We observed the savings rate rise recently so it appears that the consumer is thus far saving a large portion of the energy windfall. But, if historical behavior prevails, we believe that this will change and consumers will start to increase spending later in the year. Employment growth continues to track positively, which should also help support consumer confidence and spending. The
U.S. housing market still looks constructive and should be an important growth driver for the economy going forward. Housing starts and residential investment as a percentage of GDP remain well below historical averages; trends we believe should continue to revert toward the mean. Overall, slow and steady growth in the U.S. is still our baseline expectation.
Overall, we continue to find what we consider to be attractively valued stocks with the characteristics we seek. We are cautiously optimistic about the outlook for the U.S. economy and for equity markets, and we continue to monitor policy decisions and economic trends that may impact our holdings. At the end of the period, our largest overweights were to Materials and Consumer Staples while our largest underweights were to the Healthcare and Telecommunication Services sectors, relative to the Russell 2000 Growth Index.
The Hartford Value Opportunities Fund inception 01/02/1996
| | |
| (sub-advised by Wellington Management Company LLP) | | Investment objective – The Fund seeks capital appreciation. |
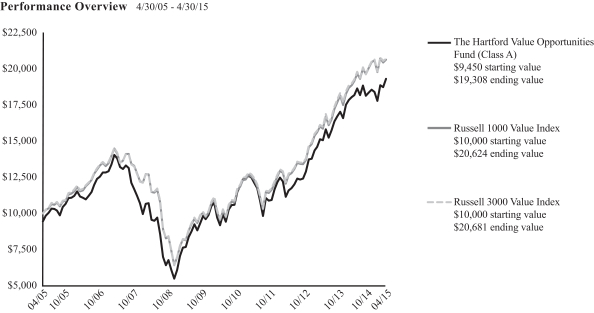
The chart above represents the hypothetical growth of a $10,000 investment in Class A, which includes a sales charge. Growth results in classes other than Class A will vary from what is seen above due to differences in the expenses charged to those share classes.
Average Annual Total Return (as of 4/30/15)
| | | | | | | | | | | | | | | | |
| | | 6 Months1 | | | 1 Year | | | 5 Years | | | 10 Years | |
Value Opportunities A2 | | | 5.26% | | | | 6.99% | | | | 12.46% | | | | 7.41% | |
Value Opportunities A3 | | | -0.53% | | | | 1.10% | | | | 11.19% | | | | 6.80% | |
Value Opportunities B2 | | | 4.86% | | | | 6.20% | | | | 11.63% | | | | 6.85% | 4 |
Value Opportunities B3 | | | 0.03% | | | | 1.31% | | | | 11.37% | | | | 6.85% | 4 |
Value Opportunities C2 | | | 4.88% | | | | 6.23% | | | | 11.64% | | | | 6.61% | |
Value Opportunities C3 | | | 3.92% | | | | 5.26% | | | | 11.64% | | | | 6.61% | |
Value Opportunities I2 | | | 5.45% | | | | 7.36% | | | | 12.82% | | | | 7.67% | |
Value Opportunities R32 | | | 5.14% | | | | 6.70% | | | | 12.21% | | | | 7.22% | |
Value Opportunities R42 | | | 5.33% | | | | 7.03% | | | | 12.57% | | | | 7.50% | |
Value Opportunities R52 | | | 5.44% | | | | 7.34% | | | | 12.90% | | | | 7.77% | |
Value Opportunities Y2 | | | 5.48% | | | | 7.42% | | | | 12.92% | | | | 7.83% | |
Russell 1000 Value Index | | | 2.89% | | | | 9.31% | | | | 13.39% | | | | 7.51% | |
Russell 3000 Value Index | | | 2.82% | | | | 8.96% | | | | 13.15% | | | | 7.54% | |
| 4 | Class B shares convert to Class A shares after 8 years. The return shown reflects the conversion to Class A shares, which had different operating expenses, for the period after conversion. |
PERFORMANCE DATA QUOTED REPRESENTS PAST PERFORMANCE AND DOES NOT GUARANTEE FUTURE RESULTS. The investment return and principal value of the investment will fluctuate so that investors’ shares, when redeemed, may be worth more or less than their original cost. Current performance may be lower or higher than the performance data quoted. To obtain performance data current to the most recent month-end, please visit our website www.hartfordfunds.com.
The initial investment in Class A shares reflects the maximum sales charge of 5.50% and returns for Class B shares reflect a contingent deferred sales charge of up to 5.00% and declining to zero, depending on the period of time the shares are held.
Returns for Class C shares reflect a contingent deferred sales charge of up to 1.00% on shares redeemed within twelve months of purchase.
Total returns presented above were calculated using the Fund’s net asset value available to shareholders for sale or redemption of Fund shares on April 30, 2015, which may exclude investment transactions as of this date. All share class returns assume the reinvestment of all distributions at net asset value and the deduction of all fund expenses.
Effective 9/30/09, Class B shares of the Fund were closed to new investments.
Class I shares commenced operations on 8/31/06. Performance prior to that date is that of the Fund’s Class A shares (excluding sales charges), which had different operating expenses. Class R3, R4 and R5 shares commenced operations on 12/22/06. Performance prior to that date is that of the Fund’s Class Y shares, which had different operating expenses.
Russell 1000 Value Index is an unmanaged index that measures the performance of those Russell 1000 Index companies with lower price-to-book ratios and lower forecasted growth values. The Russell 1000 Index is an unmanaged index that measures the performance of the 1,000 largest companies in the Russell 3000 Index, which measures the performance of the 3,000 largest U.S. companies, based on total market capitalizations.
Russell 3000 Value Index is an unmanaged index that measures the performance of those Russell 3000 Index companies with lower price-to-book ratios and lower forecasted growth values. The Russell 3000 Index is an unmanaged index that measures the performance of the 3,000 largest U.S. companies based on total market capitalization.
You cannot invest directly in an index.
The chart and table do not reflect the deductions of taxes that a shareholder would pay on Fund distributions or the redemption of Fund shares.
Performance information may reflect historical or current expense waivers/reimbursements from the investment adviser, without which performance would have been lower. For information on current expense waivers/reimbursements, please see the prospectus.
|
| The Hartford Value Opportunities Fund |
Manager Discussion
April 30, 2015 (Unaudited)
Operating Expenses*
| | | | | | | | |
| | | Net | | | Gross | |
Value Opportunities Class A | | | 1.24% | | | | 1.24% | |
Value Opportunities Class B | | | 2.10% | | | | 2.26% | |
Value Opportunities Class C | | | 1.94% | | | | 1.94% | |
Value Opportunities Class I | | | 0.86% | | | | 0.86% | |
Value Opportunities Class R3 | | | 1.52% | | | | 1.52% | |
Value Opportunities Class R4 | | | 1.20% | | | | 1.20% | |
Value Opportunities Class R5 | | | 0.87% | | | | 0.87% | |
Value Opportunities Class Y | | | 0.82% | | | | 0.82% | |
| * | As shown in the Fund’s current prospectus dated March 1, 2015. Actual expenses may be higher or lower. Please see accompanying Financial Highlights for expense ratios for the six-month period ended April 30, 2015. |
Gross expenses are the Fund’s total annual operating expenses shown in the Fund’s most recent prospectus. Net expenses are the Fund’s total annual operating expenses shown in the Fund’s most recent prospectus and reflect contractual expense reimbursements in instances when these reductions reduce the Fund’s gross expenses. Contractual reimbursements remain in effect until February 29, 2016, and automatically renew for one-year terms unless terminated.
All investments are subject to risk including the possible loss of principal. For a discussion of the Fund’s risks, please see the Main Risks section of this report. For more detailed information on the risks associated with an investment in the Fund, please see the prospectus.
David W. Palmer, CFA
Senior Managing Director and Equity Portfolio Manager
Wellington Management Company LLP
James N. Mordy
Senior Managing Director and Equity Portfolio Manager
Wellington Management Company LLP
How did the Fund perform?
The Class A shares of The Hartford Value Opportunities Fund returned 5.26%, before sales charge, for the six-month period ended April 30, 2015, outperforming the Fund’s benchmark, the Russell 3000 Value Index, which returned 2.82% for the same period. The Fund outperformed the Russell 1000 Value Index, which returned 2.89% for the same period. The Fund also outperformed the 3.46% average return of the Lipper Multi-Cap Value Fund peer group, a group of funds with investment strategies similar to those of the Fund.
Why did the Fund perform this way?
U.S. equities rose for the period, notwithstanding significant volatility. The S&P 500 Index finished 2014 with strong gains, retreated briefly, but then reached new all-time highs on March 2 and April 24, 2015. The period began strong with stocks rallying in early November after positive economic and corporate data points, including a solid corporate earnings season and news that Republicans took control of the U.S. Senate. Stocks pulled back slightly near month-end, led by weakness in the Energy sector associated with the significant decline in oil prices. In December, U.S. stocks began to rally again but ultimately fell 1.4% during the final two trading days of the year to end the month in the red. Stocks continued to fall in January 2015, which was the worst monthly return for U.S. stocks in a year. Despite a positive overall scorecard, earnings sentiment was fairly negative among many investors, in part due a strengthening U.S. Dollar adversely affecting exports and making future growth difficult, and some accompanying high-profile earnings guidance disappointments.
Equities rebounded in February, posting their best monthly gain since October 2011. The market pulled back again in early March as soft manufacturing data, potentially negative currency- and oil-related earnings, and valuation concerns weighed on investors’ minds. However, risk appetites increased after the March 18 Federal Open Market Committee statement underlined the U.S. Federal Reserve’s hesitation to raise rates as U.S. domestic inflation remains subdued and other major central banks have an easing bias. This, as well as a positive earnings season, helped drive stronger returns in April allowing U.S. stocks to end the period with modest gains. Returns varied noticeably by market-cap, as small- and mid-cap stocks outperformed large-cap stocks.
Eight of ten sectors within the Russell 3000 Value Index posted positive returns during the period. Consumer Discretionary (+10%), Healthcare (+9%), and Industrials (+3%) were top performers while Energy (-6%), Utilities (-1%), and Telecommunication Services (+1%) lagged on a relative basis.
Security selection was the primary driver of the Fund’s relative outperformance. Security selection was strongest within Information Technology, Financials and Healthcare, but this was partially offset by weaker selection in Consumer Discretionary and Materials. Sector allocation, a result of the bottom-up stock selection process, also contributed to relative returns due primarily to an underweight to Utilities and an overweight to Consumer Discretionary.
|
| The Hartford Value Opportunities Fund |
Manager Discussion – (continued)
April 30, 2015 (Unaudited)
The largest contributors to relative performance were TESARO (Healthcare), Exxon Mobil (Energy), and Mylan (Healthcare). Shares of TESARO, an oncology-focused biopharmaceutical company, outperformed due to improving expectations regarding the timeline for ongoing clinical trials. Exxon Mobil, one of the world’s largest integrated oil and gas companies, saw shares underperform as negative sentiment loomed over energy stocks as oil prices tumbled early in the period; not holding this Russell 3000 Value Index constituent contributed to relative performance. Generic and specialty pharmaceutical company Mylan saw shares rise after the company rejected a takeover bid by a competitor. Top contributors on an absolute basis also included Cisco (Information Technology).
The largest detractors from both absolute and relative performance included Vera Bradley (Consumer Discretionary), Trican Well Services (Energy), and National Oilwell Varco (Energy). Shares of Vera Bradley, a U.S.-based designer of handbags and accessories, declined after the company announced weaker-than-expected fourth-quarter results. Shares of Trican Well Services, supplier of pressure pumping services to the oil and gas industry, declined along with the broader energy sector despite beating consensus earnings and revenue estimates. Drilling rig equipment and services provider National Oilwell Varco underperformed, as customers cut back orders, and Wall Street analysts started to discount the ultimate deliverability of the company’s extensive business backlog.
Derivatives are not used in a significant manner in this Fund and did not have a material impact on performance during the period.
What is the outlook?
Commodities continued to be pressured by dollar strength and near-term oversupply, although in some cases we started to see a decoupling of producer equities from the spot prices of crude and other products. Emerging market demand indicators remain relatively soft; however, it is the opinion of Wellington’s macroeconomics group that recovery is finally underway in the Euro area – the team has revised its Euro area 2015 Gross Domestic Product (GDP) growth assumption to 1.7% from 1.2% back in January – and that Japan is starting to benefit from improved currency competitiveness and lower fuel prices, with rising real wages likely to help consumer sentiment. A broadening out of economic growth beyond the U.S. could help portfolio performance in various ways, including slowing the rate of ascent of the dollar, boosting interest rate assumptions for financials, particularly insurers, and improving sentiment around some of the portfolio’s pro-cyclical holdings.
In aggregate, the overall portfolio factor exposures are consistent with their historical ranges since inception, and we continue to find what we consider to be attractively priced equities without assuming what we believe to be uncompensated risks. At the end of the period, the Fund was most overweight Materials, Energy, and Financials and most underweight Consumer Staples, Healthcare, and Utilities relative to the Russell 3000 Value Index.
|
| The Hartford Capital Appreciation Fund |
Diversification by Sector
as of April 30, 2015 (Unaudited)
| | | | |
| Sector | | Percentage of
Net Assets | |
Equity Securities | | | | |
Consumer Discretionary | | | 15.4 | % |
Consumer Staples | | | 4.6 | |
Energy | | | 4.8 | |
Financials | | | 15.3 | |
Health Care | | | 19.4 | |
Industrials | | | 10.2 | |
Information Technology | | | 23.1 | |
Materials | | | 3.5 | |
Telecommunication Services | | | 0.4 | |
Utilities | | | 1.1 | |
| | | | |
Total | | | 97.8 | % |
| | | | |
Short-Term Investments | | | 2.5 | % |
Other Assets & Liabilities | | | (0.3 | ) |
| | | | |
Total | | | 100.0 | % |
| | | | |
A sector may be comprised of several industries. For Fund compliance purposes, the Fund may not use the same classification system and these sector classifications are used for reporting ease.
The accompanying notes are an integral part of these financial statements.
|
| The Hartford Capital Appreciation Fund |
Schedule of Investments
April 30, 2015 (Unaudited)
| | | | | | | | |
Shares or Principal Amount | | Market Value* | |
| COMMON STOCKS - 95.8% | |
| | | | Automobiles & Components - 2.5% | |
| | 1,048,680 | | | Delphi Automotive plc | | $ | 87,040,440 | |
| | 689,172 | | | Fiat Chrysler Automobiles N.V.(1) | | | 10,262,754 | |
| | 4,914,487 | | | Goodyear Tire & Rubber Co. | | | 139,399,424 | |
| | 429,150 | | | Harley-Davidson, Inc. | | | 24,122,521 | |
| | 383,000 | | | Honda Motor Co., Ltd. | | | 12,840,213 | |
| | 176,700 | | | Thor Industries, Inc. | | | 10,632,039 | |
| | 23,400 | | | Winnebago Industries, Inc. | | | 484,614 | |
| | | | | | | | |
| | | | | | | 284,782,005 | |
| | | | | | | | |
| | | | Banks - 5.1% | |
| | 7,816,562 | | | Axis Bank Ltd. | | | 69,776,685 | |
| | 3,623,132 | | | Bank of Ireland(1) | | | 1,400,607 | |
| | 138,672 | | | BNP Paribas S.A. | | | 8,757,313 | |
| | 1,070,973 | | | Citigroup, Inc. | | | 57,104,280 | |
| | 123,911 | | | Grupo Financiero Galicia S.A. ADR | | | 2,730,999 | |
| | 3,612,938 | | | ICICI Bank Ltd. | | | 18,875,232 | |
| | 62,210 | | | ICICI Bank Ltd. ADR | | | 679,955 | |
| | 3,086,554 | | | JP Morgan Chase & Co. | | | 195,255,406 | |
| | 118,254 | | | M&T Bank Corp. | | | 14,151,456 | |
| | 44,404,300 | | | Mizuho Financial Group, Inc. | | | 84,647,012 | |
| | 826,298 | | | PNC Financial Services Group, Inc. | | | 75,796,316 | |
| | 81,400 | | | South State Corp. | | | 5,512,408 | |
| | 250,200 | | | Sumitomo Mitsui Financial Group, Inc. | | | 10,924,880 | |
| | 562,411 | | | Wells Fargo & Co. | | | 30,988,846 | |
| | | | | | | | |
| | | | | | | 576,601,395 | |
| | | | | | | | |
| | | | Capital Goods - 5.5% | |
| | 95,504 | | | 3M Co. | | | 14,935,871 | |
| | 44,537 | | | Acuity Brands, Inc. | | | 7,435,452 | |
| | 2,676,365 | | | AECOM(1) | | | 84,466,079 | |
| | 165,136 | | | Airbus Group N.V. | | | 11,444,271 | |
| | 153,939 | | | Assa Abloy AB Class B | | | 8,930,584 | |
| | 134,949 | | | Danaher Corp. | | | 11,049,624 | |
| | 309,461 | | | DigitalGlobe, Inc.(1) | | | 9,955,360 | |
| | 482,427 | | | Eaton Corp. plc | | | 33,157,208 | |
| | 185,478 | | | Fortune Brands Home & Security, Inc. | | | 8,272,319 | |
| | 150,178 | | | Generac Holdings, Inc.(1) | | | 6,260,921 | |
| | 820,700 | | | General Electric Co. | | | 22,224,556 | |
| | 35,207 | | | HD Supply Holdings, Inc.(1) | | | 1,161,831 | |
| | 141,331 | | | KLX, Inc.(1) | | | 5,923,182 | |
| | 372,334 | | | Lithium Technology Corp.(1)(2)(3) | | | 1,928,690 | |
| | 143,188 | | | Lockheed Martin Corp. | | | 26,718,881 | |
| | 158,934 | | | Northrop Grumman Corp. | | | 24,482,193 | |
| | 248,039 | | | Owens Corning | | | 9,589,188 | |
| | 810,884 | | | Raytheon Co. | | | 84,331,936 | |
| | 278,647 | | | Rexel S.A. | | | 5,251,558 | |
| | 1,212,513 | | | Safran S.A. | | | 88,595,088 | |
| | 40,982 | | | Sulzer AG | | | 4,573,104 | |
| | 76,227 | | | Teledyne Technologies, Inc.(1) | | | 8,001,548 | |
| | 351,937 | | | TransDigm Group, Inc. | | | 74,656,396 | |
| | 518,513 | | | United Technologies Corp. | | | 58,980,854 | |
| | 168,825 | | | WESCO International, Inc.(1) | | | 12,179,036 | |
| | | | | | | | |
| | | | | | | 624,505,730 | |
| | | | | | | | |
| | | | Commercial & Professional Services - 0.7% | |
| | 148,984 | | | Adecco S.A.(1) | | | 12,141,701 | |
| | 146,985 | | | Clean Harbors, Inc.(1) | | | 8,120,921 | |
| | 167,044 | | | Equifax, Inc. | | | 16,191,575 | |
| | 470,650 | | | Herman Miller, Inc. | | | 12,900,517 | |
| | 487,155 | | | Knoll, Inc. | | | 11,092,519 | |
| | 127,700 | | | ManpowerGroup, Inc. | | | 10,896,641 | |
| | | | | | | | |
Shares or Principal Amount | | Market Value* | |
| COMMON STOCKS - 95.8% - (continued) | |
| | | | Commercial & Professional Services - 0.7% - (continued) | |
| | 153,415 | | | Robert Half International, Inc. | | $ | 8,506,862 | |
| | | | | | | | |
| | | | | | | 79,850,736 | |
| | | | | | | | |
| | | | Consumer Durables & Apparel - 2.6% | |
| | 350,600 | | | Asics Corp. | | | 8,996,497 | |
| | 807,705 | | | D.R. Horton, Inc. | | | 20,515,707 | |
| | 779,214 | | | Electrolux AB Series B | | | 23,331,707 | |
| | 197,747 | | | GoPro, Inc. Class A(1) | | | 9,903,170 | |
| | 95,197 | | | Harman International Industries, Inc. | | | 12,411,785 | |
| | 253,362 | | | Kate Spade & Co.(1) | | | 8,284,937 | |
| | 246,111 | | | Luxottica Group S.p.A. | | | 16,208,103 | |
| | 87,511 | | | Michael Kors Holdings Ltd.(1) | | | 5,413,431 | |
| | 3,497,801 | | | PulteGroup, Inc. | | | 67,507,559 | |
| | 1,207,500 | | | Samsonite International S.A. | | | 4,403,955 | |
| | 3,728,690 | | | Sony Corp.(1) | | | 112,724,779 | |
| | 328,015 | | | Vera Bradley, Inc.(1) | | | 4,670,934 | |
| | 42,740 | | | Whirlpool Corp. | | | 7,505,144 | |
| | | | | | | | |
| | | | | | | 301,877,708 | |
| | | | | | | | |
| | | | Consumer Services - 2.7% | |
| | 581,890 | | | American Public Education, Inc.(1) | | | 16,228,912 | |
| | 460,000 | | | Grand Canyon Education, Inc.(1) | | | 20,828,800 | |
| | 510,820 | | | Hilton Worldwide Holdings, Inc.(1) | | | 14,793,347 | |
| | 476,735 | | | Las Vegas Sands Corp. | | | 25,209,747 | |
| | 223,785 | | | LifeLock, Inc.(1) | | | 3,269,499 | |
| | 495,389 | | | McDonald’s Corp. | | | 47,829,808 | |
| | 186,000 | | | Melco Crown Entertainment Ltd. ADR | | | 3,798,120 | |
| | 1,504,900 | | | Norwegian Cruise Line Holdings Ltd.(1) | | | 73,002,699 | |
| | 930,400 | | | Sands China Ltd. | | | 3,792,673 | |
| | 1,148,595 | | | Wyndham Worldwide Corp. | | | 98,090,013 | |
| | | | | | | | |
| | | | | | | 306,843,618 | |
| | | | | | | | |
| | | | Diversified Financials - 4.3% | |
| | 110,270 | | | Ameriprise Financial, Inc. | | | 13,814,626 | |
| | 328,260 | | | Banca Generali S.p.A. | | | 11,017,139 | |
| | 180,737 | | | BlackRock, Inc. | | | 65,777,424 | |
| | 2,422,200 | | | Blackstone Group L.P. | | | 99,213,312 | |
| | 260,500 | | | Hong Kong Exchanges and Clearing Ltd. | | | 9,930,320 | |
| | 392,466 | | | Julius Baer Group Ltd.(1) | | | 20,541,959 | |
| | 288,585 | | | Legg Mason, Inc. | | | 15,194,000 | |
| | 723,695 | | | McGraw Hill Financial, Inc. | | | 75,481,388 | |
| | 592,425 | | | MSCI, Inc. | | | 36,250,486 | |
| | 171,030 | | | Northern Trust Corp. | | | 12,510,845 | |
| | 242,543 | | | Platform Specialty Products Corp.(1) | | | 6,534,108 | |
| | 312,500 | | | PRA Group, Inc.(1) | | | 17,117,187 | |
| | 208,400 | | | Raymond James Financial, Inc. | | | 11,780,852 | |
| | 1,531,312 | | | Springleaf Holdings, Inc.(1) | | | 76,565,600 | |
| | 420,730 | | | Waddell & Reed Financial, Inc. Class A | | | 20,750,404 | |
| | 651,400 | | | Zegona Communications plc(1) | | | 1,399,858 | |
| | | | | | | | |
| | | | | | | 493,879,508 | |
| | | | | | | | |
| | | | Energy - 4.8% | |
| | 340,765 | | | Atwood Oceanics, Inc. | | | 11,374,736 | |
| | 92,654 | | | Baker Hughes, Inc. | | | 6,343,093 | |
| | 1,048,915 | | | BG Group plc | | | 18,999,565 | |
| | 320,461 | | | Cameco Corp. | | | 5,635,973 | |
| | 430,115 | | | Canadian Natural Resources Ltd. | | | 14,301,324 | |
| | 195,693 | | | Chevron Corp. | | | 21,733,665 | |
| | 1,800,543 | | | Cobalt International Energy, Inc.(1) | | | 19,265,810 | |
| | 56,511 | | | Diamondback Energy, Inc.(1) | | | 4,666,113 | |
| | 75,948 | | | Energen Corp. | | | 5,405,219 | |
| | 165,440 | | | Exxon Mobil Corp. | | | 14,454,493 | |
The accompanying notes are an integral part of these financial statements.
|
| The Hartford Capital Appreciation Fund |
Schedule of Investments – (continued)
April 30, 2015 (Unaudited)
| | | | | | | | |
Shares or Principal Amount | | Market Value* | |
| COMMON STOCKS - 95.8% - (continued) | |
| | | | Energy - 4.8% - (continued) | |
| | 3,239,630 | | | Halliburton Co. | | $ | 158,579,888 | |
| | 58,700 | | | Helmerich & Payne, Inc. | | | 4,576,839 | |
| | 248,695 | | | HollyFrontier Corp. | | | 9,644,392 | |
| | 878,881 | | | Imperial Oil Ltd. | | | 38,785,019 | |
| | 1,290,453 | | | Karoon Gas Australia Ltd.(1) | | | 2,780,698 | |
| | 1,066,246 | | | Laredo Petroleum, Inc.(1) | | | 16,846,687 | |
| | 672,300 | | | Malakoff Corp. Bhd(1) | | | 339,784 | |
| | 467,800 | | | Marathon Oil Corp. | | | 14,548,580 | |
| | 2,113,678 | | | McDermott International, Inc.(1) | | | 11,096,809 | |
| | 162,015 | | | National Oilwell Varco, Inc. | | | 8,815,236 | |
| | 185,032 | | | Occidental Petroleum Corp. | | | 14,821,063 | |
| | 335,394 | | | Patterson-UTI Energy, Inc. | | | 7,496,056 | |
| | 337,089 | | | Pioneer Natural Resources Co. | | | 58,242,237 | |
| | 204,840 | | | QEP Resources, Inc. | | | 4,608,900 | |
| | 288,671 | | | Rice Energy, Inc.(1) | | | 7,109,967 | |
| | 922,845 | | | Southwestern Energy Co.(1) | | | 25,867,345 | |
| | 636,765 | | | Suncor Energy, Inc. | | | 20,758,539 | |
| | 34,768 | | | Superior Energy Services, Inc. | | | 886,584 | |
| | 2,860,805 | | | Trican Well Service Ltd. | | | 12,092,918 | |
| | 225,310 | | | Whiting Petroleum Corp.(1) | | | 8,541,502 | |
| | | | | | | | |
| | | | | | | 548,619,034 | |
| | | | | | | | |
| | | | Food & Staples Retailing - 0.6% | |
| | 563,062 | | | CVS Health Corp. | | | 55,906,426 | |
| | 293,610 | | | Seven & I Holdings Co., Ltd. | | | 12,620,624 | |
| | | | | | | | |
| | | | | | | 68,527,050 | |
| | | | | | | | |
| | | | Food, Beverage & Tobacco - 3.2% | |
| | 257,893 | | | Anheuser-Busch InBev N.V. | | | 31,398,028 | |
| | 208,575 | | | Anheuser-Busch InBev N.V. ADR | | | 25,037,343 | |
| | 1,403,365 | | | Coca-Cola Co. | | | 56,920,485 | |
| | 68,209 | | | Diageo plc ADR | | | 7,572,563 | |
| | 1,492,603 | | | Freshpet, Inc.(1) | | | 32,359,633 | |
| | 1,643,556 | | | Greencore Group plc | | | 8,918,885 | |
| | 215,861 | | | Imperial Tobacco Group plc | | | 10,540,600 | |
| | 296,911 | | | Kraft Foods Group, Inc. | | | 25,163,207 | |
| | 2,615,746 | | | Mondelez International, Inc. Class A | | | 100,366,174 | |
| | 333,937 | | | Monster Beverage Corp.(1) | | | 45,786,102 | |
| | 222,312 | | | Post Holdings, Inc.(1) | | | 10,435,325 | |
| | 807,666 | | | Treasury Wine Estates Ltd. | | | 3,542,232 | |
| | 46,731 | | | TreeHouse Foods, Inc.(1) | | | 3,797,361 | |
| | | | | | | | |
| | | | | | | 361,837,938 | |
| | | | | | | | |
| | | | Health Care Equipment & Services - 4.1% | |
| | 277,457 | | | Acadia Healthcare Co., Inc.(1) | | | 19,005,804 | |
| | 215,665 | | | Aetna, Inc. | | | 23,048,119 | |
| | 79,875 | | | Anthem, Inc. | | | 12,055,534 | |
| | 679,597 | | | Becton Dickinson and Co. | | | 95,734,829 | |
| | 362,092 | | | Cardinal Health, Inc. | | | 30,538,839 | |
| | 533,600 | | | CareView Communications, Inc.(1) | | | 208,051 | |
| | 173,416 | | | Envision Healthcare Holdings, Inc.(1) | | | 6,582,871 | |
| | 945,800 | | | Express Scripts Holding Co.(1) | | | 81,717,120 | |
| | 749,764 | | | HCA Holdings, Inc.(1) | | | 55,490,034 | |
| | 499,141 | | | IMS Health Holdings, Inc.(1) | | | 13,771,300 | |
| | 255,800 | | | McKesson Corp. | | | 57,145,720 | |
| | 364,298 | | | Medtronic plc | | | 27,121,986 | |
| | 312,162 | | | UnitedHealth Group, Inc. | | | 34,774,847 | |
| | 122,455 | | | Universal Health Services, Inc. Class B | | | 14,321,112 | |
| | | | | | | | |
| | | | | | | 471,516,166 | |
| | | | | | | | |
| | | | | | | | |
Shares or Principal Amount | | Market Value* | |
| COMMON STOCKS - 95.8% - (continued) | |
| | | | Household & Personal Products - 0.8% | |
| | 347,094 | | | Estee Lauder Cos., Inc. Class A | | $ | 28,215,271 | |
| | 160,197 | | | Procter & Gamble Co. | | | 12,737,263 | |
| | 2,092,402 | | | Svenska Cellulosa AB SCA Class B | | | 52,927,237 | |
| | | | | | | | |
| | | | | | | 93,879,771 | |
| | | | | | | | |
| | | | Insurance - 5.1% | |
| | 519,176 | | | ACE Ltd. | | | 55,546,640 | |
| | 2,822,600 | | | AIA Group Ltd. | | | 18,771,629 | |
| | 3,317,062 | | | American International Group, Inc. | | | 186,717,420 | |
| | 208,500 | | | Arthur J Gallagher & Co. | | | 9,972,555 | |
| | 367,820 | | | Assured Guaranty Ltd. | | | 9,559,642 | |
| | 21,647 | | | Fairfax Financial Holdings Ltd. | | | 11,823,765 | |
| | 322,150 | | | Lincoln National Corp. | | | 18,198,254 | |
| | 19,676 | | | Markel Corp.(1) | | | 14,572,833 | |
| | 1,009,212 | | | Marsh & McLennan Cos., Inc. | | | 56,677,346 | |
| | 993,983 | | | MetLife, Inc. | | | 50,981,388 | |
| | 342,870 | | | Principal Financial Group, Inc. | | | 17,527,514 | |
| | 1,204,000 | | | Prudential Financial, Inc. | | | 98,246,400 | |
| | 396,200 | | | Tokio Marine Holdings, Inc. | | | 16,151,366 | |
| | 194,700 | | | Torchmark Corp. | | | 10,924,617 | |
| | 263,400 | | | Unum Group | | | 8,997,744 | |
| | | | | | | | |
| | | | | | | 584,669,113 | |
| | | | | | | | |
| | | | Materials - 3.5% | |
| | 347,040 | | | Barrick Gold Corp. | | | 4,518,461 | |
| | 7,007 | | | Berry Plastics Group, Inc.(1) | | | 239,780 | |
| | 112,600 | | | Cabot Corp. | | | 4,812,524 | |
| | 239,545 | | | Celanese Corp. Series A | | | 15,896,206 | |
| | 389,819 | | | Constellium N.V. Class A(1) | | | 7,160,975 | |
| | 347,775 | | | Continental Gold Ltd.(1) | | | 634,152 | |
| | 272,226 | | | Dow Chemical Co. | | | 13,883,526 | |
| | 817,001 | | | Gold Resource Corp. | | | 2,753,293 | |
| | 635,563 | | | Holcim Ltd.(1) | | | 51,055,081 | |
| | 265,600 | | | Huntsman Corp. | | | 6,122,080 | |
| | 19,313,200 | | | Ivanhoe Mines Ltd. Class A(1) | | | 18,568,845 | |
| | 793,742 | | | Louisiana-Pacific Corp.(1) | | | 12,096,628 | |
| | 79,765 | | | Martin Marietta Materials, Inc. | | | 11,378,477 | |
| | 306,176 | | | Methanex Corp. | | | 18,434,857 | |
| | 780,355 | | | Norbord, Inc. | | | 15,742,926 | |
| | 1,084,058 | | | Packaging Corp. of America | | | 75,005,973 | |
| | 72,347 | | | Platform Specialty Products Corp.(1) | | | 1,949,028 | |
| | 345,842 | | | Praxair, Inc. | | | 42,168,515 | |
| | 267,805 | | | Reliance Steel & Aluminum Co. | | | 17,332,340 | |
| | 160,445 | | | Rio Tinto plc ADR | | | 7,186,332 | |
| | 590,008 | | | Wacker Chemie AG | | | 73,177,660 | |
| | | | | | | | |
| | | | | | | 400,117,659 | |
| | | | | | | | |
| | | | Media - 0.8% | |
| | 285,995 | | | CBS Corp. Class B | | | 17,768,869 | |
| | 159,336 | | | DISH Network Corp. Class A(1) | | | 10,780,674 | |
| | 56,516 | | | Loral Space & Communications, Inc.(1) | | | 3,899,604 | |
| | 327,995 | | | Quebecor, Inc. Class B | | | 9,020,202 | |
| | 1,517,115 | | | Sky plc | | | 25,014,096 | |
| | 141,393 | | | Tribune Media Co. Class A | | | 7,927,905 | |
| | 410,034 | | | Twenty-First Century Fox, Inc. Class A | | | 13,973,959 | |
| | | | | | | | |
| | | | | | | 88,385,309 | |
| | | | | | | | |
| | | | Pharmaceuticals, Biotechnology & Life Sciences - 15.2% | |
| | 1,026,147 | | | Actavis plc(1) | | | 290,255,940 | |
| | 27,260 | | | Agios Pharmaceuticals, Inc.(1) | | | 2,517,188 | |
| | 312,152 | | | Alkermes plc(1) | | | 17,283,856 | |
| | 62,342 | | | Alnylam Pharmaceuticals, Inc.(1) | | | 6,350,780 | |
| | 87,790 | | | Amgen, Inc. | | | 13,862,919 | |
The accompanying notes are an integral part of these financial statements.
|
| The Hartford Capital Appreciation Fund |
Schedule of Investments – (continued)
April 30, 2015 (Unaudited)
| | | | | | | | |
Shares or Principal Amount | | Market Value* | |
| COMMON STOCKS - 95.8% - (continued) | |
| | | | Pharmaceuticals, Biotechnology & Life Sciences - 15.2% -
(continued) | |
| | 1,275,194 | | | Arena Pharmaceuticals, Inc.(1) | | $ | 5,559,846 | |
| | 1,249,193 | | | AstraZeneca plc | | | 85,727,856 | |
| | 150,425 | | | AstraZeneca plc ADR | | | 10,301,104 | |
| | 375,368 | | | Biogen, Inc.(1) | | | 140,361,356 | |
| | 131,467 | | | BioMarin Pharmaceutical, Inc.(1) | | | 14,730,877 | |
| | 3,200 | | | Blueprint Medicines Corp.(1) | | | 60,384 | |
| | 6,008,611 | | | Bristol-Myers Squibb Co. | | | 382,928,779 | |
| | 181,985 | | | Celgene Corp.(1) | | | 19,665,299 | |
| | 689,310 | | | Eisai Co., Ltd. | | | 45,947,608 | |
| | 76,194 | | | Five Prime Therapeutics, Inc.(1) | | | 1,528,452 | |
| | 200,170 | | | Gilead Sciences, Inc.(1) | | | 20,119,087 | |
| | 338,900 | | | ICON plc(1) | | | 21,804,826 | |
| | 34,988 | | | Illumina, Inc.(1) | | | 6,446,539 | |
| | 239,494 | | | Incyte Corp.(1) | | | 23,269,237 | |
| | 483,482 | | | Johnson & Johnson | | | 47,961,414 | |
| | 229,414 | | | Medivation, Inc.(1) | | | 27,699,446 | |
| | 4,885,000 | | | Merck & Co., Inc. | | | 290,950,600 | |
| | 1,286,921 | | | Mylan N.V.(1) | | | 92,992,911 | |
| | 84,650 | | | Ono Pharmaceutical Co., Ltd. | | | 9,174,293 | |
| | 611,785 | | | Pfizer, Inc. | | | 20,757,865 | |
| | 320,716 | | | Portola Pharmaceuticals, Inc.(1) | | | 11,446,354 | |
| | 59,365 | | | PTC Therapeutics, Inc.(1) | | | 3,487,694 | |
| | 17,877 | | | Puma Biotechnology, Inc.(1) | | | 3,228,229 | |
| | 22,567 | | | Receptos, Inc.(1) | | | 3,325,022 | |
| | 87,816 | | | Regeneron Pharmaceuticals, Inc.(1) | | | 40,172,307 | |
| | 115,124 | | | Regulus Therapeutics, Inc.(1) | | | 1,444,806 | |
| | 89,570 | | | Roche Holding AG | | | 25,630,912 | |
| | 159,776 | | | TESARO, Inc.(1) | | | 8,702,999 | |
| | 1,980,953 | | | TherapeuticsMD, Inc.(1) | | | 12,836,575 | |
| | 197,774 | | | Vertex Pharmaceuticals, Inc.(1) | | | 24,381,579 | |
| | | | | | | | |
| | | | | | | 1,732,914,939 | |
| | | | | | | | |
| | | | Real Estate - 0.7% | |
| | 119,900 | | | American Tower Corp. REIT | | | 11,334,147 | |
| | 78,955 | | | AvalonBay Communities, Inc. REIT | | | 12,975,465 | |
| | 366,690 | | | CBRE Group, Inc. Class A(1) | | | 14,058,895 | |
| | 365,300 | | | Columbia Property Trust, Inc. REIT | | | 9,581,819 | |
| | 480,804 | | | Deutsche Annington Immobilien SE | | | 16,138,240 | |
| | 417,730 | | | Mitsui Fudosan Co., Ltd. | | | 12,383,312 | |
| | 153,417 | | | WeWork Companies, Inc. Class A(1)(2)(3) | | | 2,299,108 | |
| | 193,805 | | | Weyerhaeuser Co. REIT | | | 6,106,795 | |
| | | | | | | | |
| | | | | | | 84,877,781 | |
| | | | | | | | |
| | | | Retailing - 6.3% | |
| | 694,816 | | | Advance Auto Parts, Inc. | | | 99,358,688 | |
| | 288,955 | | | Amazon.com, Inc.(1) | | | 121,875,440 | |
| | 257,629 | | | CarMax, Inc.(1) | | | 17,547,111 | |
| | 1,943,600 | | | Chico’s FAS, Inc. | | | 32,769,096 | |
| | 118,219 | | | CST Brands, Inc. | | | 4,930,914 | |
| | 2,999 | | | Dollar General Corp. | | | 218,057 | |
| | 164,090 | | | Dollar Tree, Inc.(1) | | | 12,538,117 | |
| | 187,300 | | | GNC Holdings, Inc. Class A | | | 8,063,265 | |
| | 2,770,781 | | | Groupon, Inc.(1) | | | 19,173,805 | |
| | 398,820 | | | Home Depot, Inc. | | | 42,665,764 | |
| | 79,548 | | | HSN, Inc. | | | 4,965,386 | |
| | 10,615 | | | JAND Inc. Class A(1)(2)(3) | | | 109,725 | |
| | 158,673 | | | L Brands, Inc. | | | 14,179,019 | |
| | 385,597 | | | Lowe’s Cos., Inc. | | | 26,552,209 | |
| | 547,297 | | | Michaels Cos., Inc.(1) | | | 14,153,100 | |
| | 42,015 | | | Netflix, Inc.(1) | | | 23,381,348 | |
| | | | | | | | |
Shares or Principal Amount | | Market Value* | |
| COMMON STOCKS - 95.8% - (continued) | |
| | | | Retailing - 6.3% - (continued) | |
| | 10,960 | | | Priceline Group, Inc.(1) | | $ | 13,566,398 | |
| | 2,161 | | | Restoration Hardware Holdings, Inc.(1) | | | 186,213 | |
| | 609,930 | | | Signet Jewelers Ltd. | | | 81,809,911 | |
| | 1,543,789 | | | TJX Cos., Inc. | | | 99,636,142 | |
| | 161,835 | | | TripAdvisor, Inc.(1) | | | 13,026,099 | |
| | 2,546,275 | | | Vipshop Holdings Ltd. ADR(1) | | | 72,034,120 | |
| | | | | | | | |
| | | | | | | 722,739,927 | |
| | | | | | | | |
| | | | Semiconductors & Semiconductor Equipment - 5.5% | |
| | 96,598 | | | Applied Materials, Inc. | | | 1,911,674 | |
| | 720,954 | | | Cypress Semiconductor Corp.(1) | | | 9,603,103 | |
| | 32,194,050 | | | GCL-Poly Energy Holdings Ltd.(1) | | | 9,736,510 | |
| | 5,504,707 | | | Intel Corp. | | | 179,178,213 | |
| | 679,442 | | | Maxim Integrated Products, Inc. | | | 22,306,081 | |
| | 2,485,162 | | | Micron Technology, Inc.(1) | | | 69,907,607 | |
| | 1,719,293 | | | NXP Semiconductors N.V.(1) | | | 165,258,443 | |
| | 20,851 | | | Qorvo, Inc.(1) | | | 1,374,289 | |
| | 313,875 | | | SK Hynix, Inc. | | | 13,429,159 | |
| | 1,255,665 | | | Sumco Corp. | | | 18,945,699 | |
| | 319,042 | | | SunEdison Semiconductor Ltd.(1) | | | 7,124,208 | |
| | 1,096,850 | | | SunEdison, Inc.(1) | | | 27,772,242 | |
| | 3,147,329 | | | SunPower Corp.(1) | | | 101,312,521 | |
| | | | | | | | |
| | | | | | | 627,859,749 | |
| | | | | | | | |
| | | | Software & Services - 12.1% | |
| | 557,192 | | | Accenture plc Class A | | | 51,623,839 | |
| | 7,162,910 | | | Activision Blizzard, Inc. | | | 163,421,792 | |
| | 1,026,981 | | | Adobe Systems, Inc.(1) | | | 78,112,175 | |
| | 431,671 | | | Akamai Technologies, Inc.(1) | | | 31,848,686 | |
| | 432,453 | | | Alibaba Group Holding Ltd. ADR(1) | | | 35,154,104 | |
| | 302,330 | | | AOL, Inc.(1) | | | 12,062,967 | |
| | 11,200 | | | Apigee Corp.(1) | | | 162,064 | |
| | 220,927 | | | Automatic Data Processing, Inc. | | | 18,677,169 | |
| | 552,000 | | | Baidu, Inc. ADR(1) | | | 110,554,560 | |
| | 91,200 | | | Blackhawk Network Holdings, Inc.(1) | | | 3,353,424 | |
| | 241,200 | | | Cognizant Technology Solutions Corp. Class A(1) | | | 14,119,848 | |
| | 328,400 | | | CoStar Group, Inc.(1) | | | 67,134,812 | |
| | 948,444 | | | Coupons.com, Inc.(1) | | | 11,884,003 | |
| | 128,520 | | | Envestnet, Inc.(1) | | | 6,587,935 | |
| | 474,300 | | | Everyday Health, Inc.(1) | | | 5,814,918 | |
| | 1,851,597 | | | Facebook, Inc. Class A(1) | | | 145,850,296 | |
| | 538,623 | | | Genpact Ltd.(1) | | | 11,774,299 | |
| | 5,800 | | | GoDaddy, Inc. Class A(1) | | | 145,406 | |
| | 891,012 | | | Gogo, Inc.(1) | | | 18,835,994 | |
| | 27,700 | | | Google, Inc. Class A(1) | | | 15,200,929 | |
| | 370,554 | | | Google, Inc. Class C(1) | | | 199,113,694 | |
| | 162,959 | | | Intuit, Inc. | | | 16,349,676 | |
| | 46,516 | | | LendingClub Corp. PIPE(1)(2)(3) | | | 794,019 | |
| | 3,956,870 | | | Microsoft Corp. | | | 192,462,157 | |
| | 1,710 | | | New Relic, Inc. PIPE(1) | | | 55,558 | |
| | 2,146,822 | | | Optimal Payments plc(1) | | | 9,755,873 | |
| | 560,757 | | | Pandora Media, Inc.(1) | | | 10,003,905 | |
| | 295,852 | | | Salesforce.com, Inc.(1) | | | 21,543,943 | |
| | 792,310 | | | Tencent Holdings Ltd. | | | 16,352,383 | |
| | 234,005 | | | Verint Systems, Inc.(1) | | | 14,374,927 | |
| | 221,371 | | | VeriSign, Inc.(1) | | | 14,059,272 | |
| | 1,189,528 | | | Web.com Group, Inc.(1) | | | 21,851,629 | |
| | 292,188 | | | Workday, Inc. Class A(1) | | | 26,650,467 | |
| | 95,500 | | | Yahoo!, Inc.(1) | | | 4,064,958 | |
| | 429,168 | | | Yelp, Inc.(1) | | | 16,904,928 | |
The accompanying notes are an integral part of these financial statements.
|
| The Hartford Capital Appreciation Fund |
Schedule of Investments – (continued)
April 30, 2015 (Unaudited)
| | | | | | | | |
Shares or Principal Amount | | Market Value* | |
| COMMON STOCKS - 95.8% - (continued) | |
| | | | Software & Services - 12.1% - (continued) | |
| | 164,958 | | | Zillow Group, Inc. Class A(1) | | $ | 16,106,499 | |
| | | | | | | | |
| | | | | | | 1,382,763,108 | |
| | | | | | | | |
| | | | Technology Hardware & Equipment - 4.4% | |
| | 273,198 | | | Amphenol Corp. Class A | | | 15,126,973 | |
| | 1,600,221 | | | Apple, Inc. | | | 200,267,658 | |
| | 534,840 | | | ARRIS Group, Inc.(1) | | | 18,010,737 | |
| | 365,423 | | | Belden, Inc. | | | 30,677,261 | |
| | 559,810 | | | CDW Corp. of Delaware | | | 21,451,919 | |
| | 3,842,919 | | | Cisco Systems, Inc. | | | 110,791,355 | |
| | 125,859 | | | F5 Networks, Inc.(1) | | | 15,357,315 | |
| | 172,730 | | | Hewlett-Packard Co. | | | 5,694,908 | |
| | 37,915 | | | Largan Precision Co., Ltd. | | | 3,799,311 | |
| | 7,573,000 | | | NEC Corp. | | | 25,195,456 | |
| | 1,139,910 | | | ParkerVision, Inc.(1) | | | 775,139 | |
| | 6,732 | | | Samsung Electronics Co., Ltd. | | | 8,831,399 | |
| | 180,312 | | | Stratasys Ltd.(1) | | | 6,752,685 | |
| | 202,569 | | | TE Connectivity Ltd. | | | 13,480,967 | |
| | 456,086 | | | Trimble Navigation Ltd.(1) | | | 11,598,267 | |
| | 126,038 | | | Western Digital Corp. | | | 12,318,954 | |
| | | | | | | | |
| | | | | | | 500,130,304 | |
| | | | | | | | |
| | | | Telecommunication Services - 0.4% | |
| | 543,807 | | | Orange S.A. | | | 8,957,215 | |
| | 91,115 | | | SoftBank Corp. | | | 5,695,626 | |
| | 652,344 | | | Verizon Communications, Inc. | | | 32,904,232 | |
| | | | | | | | |
| | | | | | | 47,557,073 | |
| | | | | | | | |
| | | | Transportation - 3.8% | |
| | 45,597,300 | | | AirAsia Bhd | | | 29,062,437 | |
| | 517,580 | | | American Airlines Group, Inc. | | | 24,991,350 | |
| | 1,854,515 | | | CSX Corp. | | | 66,929,446 | |
| | 417,140 | | | FedEx Corp. | | | 70,734,430 | |
| | 4,470,350 | | | Hertz Global Holdings, Inc.(1) | | | 93,162,094 | |
| | 430,400 | | | Landstar System, Inc. | | | 26,818,224 | |
| | 1,751,244 | | | Swift Transportation Co.(1) | | | 42,380,105 | |
| | 112,317 | | | United Continental Holdings, Inc.(1) | | | 6,709,818 | |
| | 685,820 | | | United Parcel Service, Inc. Class B | | | 68,945,485 | |
| | 607,912 | | | UTi Worldwide, Inc.(1) | | | 5,489,445 | |
| | | | | | | | |
| | | | | | | 435,222,834 | |
| | | | | | | | |
| | | | Utilities - 1.1% | |
| | 27,187,000 | | | China Longyuan Power Group Corp. Ltd. Class H | | | 33,692,644 | |
| | 427,811 | | | Duke Energy Corp. | | | 33,185,299 | |
| | 84,750 | | | Empresa Distribuidora Y Comercializadora Norte ADR(1) | | | 1,206,840 | |
| | 2,442,000 | | | ENN Energy Holdings Ltd. | | | 17,576,008 | |
| | 478,200 | | | Exelon Corp. | | | 16,268,364 | |
| | 66,130 | | | Pampa Energia S.A. ADR(1) | | | 1,076,596 | |
| | 171,000 | | | PG&E Corp. | | | 9,049,320 | |
| | 1,013,865 | | | Snam S.p.A. | | | 5,281,367 | |
| | 318,720 | | | Xcel Energy, Inc. | | | 10,807,795 | |
| | | | | | | | |
| | | | | | | 128,144,233 | |
| | | | | | | | |
| | |
| | | | Total Common Stocks
(cost $9,954,031,468) | | $ | 10,948,102,688 | |
| | | | | | | | |
|
| PREFERRED STOCKS - 1.9% | |
| | | | Consumer Durables & Apparel - 0.0% | |
| | 83,332 | | | One Kings Lane, Inc.(1)(2)(3) | | $ | 1,181,648 | |
| | | | | | | | |
| | | | | | | | |
Shares or Principal Amount | | Market Value* | |
| PREFERRED STOCKS - 1.9% - (continued) | |
| | | | Consumer Services - 0.0% | |
| | 244,180 | | | Draftkings, Inc.(1)(2)(3) | | $ | 395,853 | |
| | | | | | | | |
| | | | Health Care Equipment & Services - 0.1% | |
| | 9,027,618 | | | Invuity, Inc.(1)(2)(3) | | | 6,300,013 | |
| | 95,683 | | | Moderna Therapeutics, Inc.(1)(2)(3) | | | 5,310,694 | |
| | | | | | | | |
| | | | | | | 11,610,707 | |
| | | | | | | | |
| | | | Media - 0.0% | |
| | 25,200 | | | Harvey Weinstein Co. Holdings(1)(2)(3) | | | — | |
| | | | | | | | |
| | | | Real Estate - 0.2% | |
| | 245,862 | | | Redfin Corp. Series G(1)(2)(3) | | | 729,701 | |
| | 762,484 | | | WeWork Companies, Inc. Class D-1(1)(2)(3) | | | 11,426,619 | |
| | 599,094 | | | WeWork Companies, Inc. Class D-2(1)(2)(3) | | | 8,978,049 | |
| | | | | | | | |
| | | | | | | 21,134,369 | |
| | | | | | | | |
| | | | Retailing - 0.5% | |
| | 44,867 | | | Forward Ventures LLC(1)(2)(3) | | | 1,809,935 | |
| | 12,011 | | | Honest Co.(1)(2)(3) | | | 308,442 | |
| | 23,702 | | | JAND Inc. Series D(1)(2)(3) | | | 245,002 | |
| | 770,636 | | | Tory Burch LLC(1)(2)(3) | | | 51,655,704 | |
| | | | | | | | |
| | | | | | | 54,019,083 | |
| | | | | | | | |
| | | | Software & Services - 0.8% | |
| | 50,581 | | | Apigee Corp. PIPE(1)(2)(3) | | | 661,156 | |
| | 143,626 | | | Birst, Inc. Series F(1)(2)(3) | | | 755,013 | |
| | 25,867 | | | Cloudera, Inc.(1)(2)(3) | | | 768,250 | |
| | 18,389 | | | Dropbox, Inc. Series C(1)(2)(3) | | | 316,127 | |
| | 566,622 | | | Essence Holding Group(1)(2)(3) | | | 1,008,587 | |
| | 77,707 | | | Lookout, Inc. Series F(1)(2)(3) | | | 798,828 | |
| | 95,031 | | | MarkLogic Corp. Series F(1)(2)(3) | | | 993,338 | |
| | 28,495 | | | New Relic, Inc. PIPE Series A(1)(2)(3) | | | 904,715 | |
| | 118,110 | | | Nutanix, Inc.(1)(2)(3) | | | 2,101,177 | |
| | 457,210 | | | Pinterest, Inc. Series G(1)(2)(3) | | | 14,770,587 | |
| | 47,064 | | | Sharecare(1)(2)(3) | | | 10,583,894 | |
| | 2,000,820 | | | Uber Technologies, Inc.(1)(2)(3) | | | 59,996,228 | |
| | 58,205 | | | Veracode, Inc.(1)(2)(3) | | | 1,657,678 | |
| | 306,876 | | | Zuora, Inc. Series F(1)(2)(3) | | | 1,049,323 | |
| | | | | | | | |
| | | | | | | 96,364,901 | |
| | | | | | | | |
| | | | Technology Hardware & Equipment - 0.3% | |
| | 1,219,639 | | | Pure Storage, Inc.(1)(2)(3) | | | 20,124,043 | |
| | 5,362,869 | | | Rethink Robotics, Inc.(1)(2)(3) | | | 12,028,379 | |
| | | | | | | | |
| | | | | | | 32,152,422 | |
| | | | | | | | |
| | | | Telecommunication Services - 0.0% | |
| | 1,923 | | | DocuSign, Inc. Series B(1)(2)(3) | | | 36,716 | |
| | 576 | | | DocuSign, Inc. Series B-1(1)(2)(3) | | | 10,998 | |
| | 1,383 | | | DocuSign, Inc. Series D(1)(2)(3) | | | 26,406 | |
| | 35,761 | | | DocuSign, Inc. Series E(1)(2)(3) | | | 682,788 | |
| | 6,398 | | | DocuSign, Inc. Series F(1)(2)(3) | | | 122,158 | |
| | | | | | | | |
| | | | | | | 879,066 | |
| | | | | | | | |
| | |
| | | | Total Preferred Stocks
(cost $226,701,835) | | $ | 217,738,049 | |
| | | | | | | | |
|
| CONVERTIBLE PREFERRED STOCKS - 0.0% | |
| | | | Retailing - 0.0% | |
| | 28,025 | | | Honest Co. Series C(1)(2)(3) | | $ | 719,682 | |
| | | | | | | | |
| | |
| | | | Total Convertible Preferred Stocks
(cost $758,281) | | $ | 719,682 | |
| | | | | | | | |
The accompanying notes are an integral part of these financial statements.
|
| The Hartford Capital Appreciation Fund |
Schedule of Investments – (continued)
April 30, 2015 (Unaudited)
| | | | | | | | |
Shares or Principal Amount | | Market Value* | |
| WARRANTS - 0.1% | |
| | | | Diversified Financials - 0.1% | |
| | 184,498 | | | Platform Specialty Products Corp.(1) | | $ | 4,970,376 | |
| | | | | | | | |
| | |
| | | | Total Warrants
(cost $3,505,462) | | $ | 4,970,376 | |
| | | | | | | | |
|
| RIGHTS - 0.0% | |
| | | | Software & Services - 0.0% | |
| | 1,679,248 | | | Optimal Payments plc(1) | | $ | 3,582,926 | |
| | | | | | | | |
| | |
| | | | Total Rights
(cost $2,143,991) | | $ | 3,582,926 | |
| | | | | | | | |
| | |
| | | | Total Long-Term Investments
(cost $10,187,141,037) | | $ | 11,175,113,721 | |
| | | | | | | | |
|
| SHORT-TERM INVESTMENTS - 2.5% | |
| | | | Other Investment Pools & Funds - 2.5% | |
| | 281,946,919 | | | Fidelity Money Market Class 1 | | $ | 281,946,919 | |
| | | | | | | | |
| | |
| | | | Total Short-Term Investments
(cost $281,946,919) | | $ | 281,946,919 | |
| | | | | | | | |
| | | | | | | | | | |
| | | |
| | Total Investments
(cost $10,469,087,956)^ | | | 100.3 | % | | $ | 11,457,060,640 | |
| | Other Assets and Liabilities | | | (0.3 | )% | | | (30,803,624 | ) |
| | | | | | | | | | |
| | Total Net Assets | | | 100.0 | % | | $ | 11,426,257,016 | |
| | | | | | | | | | |
The accompanying notes are an integral part of these financial statements.
|
| The Hartford Capital Appreciation Fund |
Schedule of Investments – (continued)
April 30, 2015 (Unaudited)
| Note: | Percentage of investments as shown is the ratio of the total market value to total net assets. |
| | Prices of foreign equities that are principally traded on certain foreign markets may be adjusted daily pursuant to a fair value pricing service approved by the Board of Directors in order to reflect an adjustment for factors occurring after the close of certain foreign markets but before the close of the New York Stock Exchange. |
| | The Fund may refer to any one or more of the industry classifications used by one or more widely recognized market indices, ratings group indices and/or as defined by Fund management. Industry classifications may not be identical across all security types. |
| | Other than the industry classifications “Other Investment Pools and Funds” and “Exchange Traded Funds,” equity industry classifications used in this report are the Global Industry Classification Standard, which was developed by and is the exclusive property and service mark of MSCI, Inc. and Standard & Poor’s. |
| | For Fund compliance purposes, the Fund may not use the same classification system shown in this report as these classifications are used for reporting ease. |
| ^ | At April 30, 2015, the cost of securities for federal income tax purposes was $10,486,894,079 and the aggregate gross unrealized appreciation and depreciation based on that cost were: |
| | | | |
Unrealized Appreciation | | $ | 1,282,531,103 | |
Unrealized Depreciation | | | (312,364,542 | ) |
| | | | |
Net Unrealized Appreciation | | $ | 970,166,561 | |
| | | | |
| (1) | Non-income producing. |
| (2) | These securities are valued in good faith at fair value as determined under policies and procedures established by and under the supervision of the Board of Directors. At April 30, 2015, the aggregate fair value of these securities were $223,589,273, which represents 2.0% of total net assets. This amount excludes securities that are principally traded in certain foreign markets and whose prices are adjusted pursuant to a third party pricing service methodology approved by the Board of Directors. |
| (3) | The following securities are considered illiquid. Illiquid securities are often purchased in private placement transactions, are often not registered under the Securities Act of 1933, as amended, and may have contractual restrictions on resale. A security may also be considered illiquid if the security lacks a readily available market or if its valuation has not changed for a certain period of time. |
| | | | | | | | | | |
Period
Acquired | | Shares/Par | | | Security | | Cost | |
| 04/2014 | | | 50,581 | | | Apigee Corp. PIPE Preferred | | $ | 1,079,272 | |
| 03/2015 | | | 143,626 | | | Birst, Inc. Series F Preferred | | | 838,905 | |
| 02/2014 | | | 25,867 | | | Cloudera, Inc. Preferred | | | 376,623 | |
| 02/2014 | | | 1,923 | | | DocuSign, Inc. Series B Preferred | | | 25,253 | |
| 02/2014 | | | 576 | | | DocuSign, Inc. Series B-1 Preferred | | | 7,564 | |
| 02/2014 | | | 1,383 | | | DocuSign, Inc. Series D Preferred | | | 18,162 | |
| 02/2014 | | | 35,761 | | | DocuSign, Inc. Series E Preferred | | | 469,628 | |
| 04/2015 | | | 6,398 | | | DocuSign, Inc. Series F Preferred | | | 122,158 | |
| 12/2014 | | | 244,180 | | | Draftkings, Inc. Preferred | | | 439,837 | |
| 01/2014 | | | 18,389 | | | Dropbox, Inc. Series C Preferred | | | 351,252 | |
| 05/2014 | | | 566,622 | | | Essence Holding Group Preferred | | | 895,999 | |
| 11/2014 | | | 44,867 | | | Forward Ventures LLC Preferred | | | 1,396,764 | |
| 10/2005 | | | 25,200 | | | Harvey Weinstein Co. Holdings Preferred | | | 23,636,380 | |
| 08/2014 | | | 12,011 | | | Honest Co. Preferred | | | 324,985 | |
| 08/2014 | | | 28,025 | | | Honest Co. Series C Convertible Preferred | | | 758,281 | |
| 02/2015 | | | 9,027,618 | | | Invuity, Inc. Preferred | | | 7,000,015 | |
| 04/2015 | | | 10,615 | | | JAND Inc. | | | 121,916 | |
| 04/2015 | | | 23,702 | | | JAND Inc. Series D Preferred | | | 272,225 | |
| 04/2014 | | | 46,516 | | | LendingClub Corp. | | | 473,126 | |
| 08/2014 | | | 372,334 | | | Lithium Technology Corp. | | | 1,814,756 | |
| 07/2014 | | | 77,707 | | | Lookout, Inc. Series F Preferred | | | 887,655 | |
| 04/2015 | | | 95,031 | | | MarkLogic Corp. Series F Preferred | | | 1,103,709 | |
| 12/2014 | | | 95,683 | | | Moderna Therapeutics, Inc. Preferred | | | 5,900,771 | |
| 04/2014 | | | 28,495 | | | New Relic, Inc. PIPE Series A Preferred | | | 808,879 | |
| 08/2014 | | | 118,110 | | | Nutanix, Inc. Preferred | | | 1,582,261 | |
| 01/2014 | | | 83,332 | | | One Kings Lane, Inc. Preferred | | | 1,284,730 | |
| 03/2015 | | | 457,210 | | | Pinterest, Inc. Series G Preferred | | | 16,411,763 | |
| 04/2014 | | | 1,219,639 | | | Pure Storage, Inc. Preferred | | | 19,179,921 | |
| 12/2014 | | | 245,862 | | | Redfin Corp. Series G Preferred | | | 810,779 | |
| 03/2015 | | | 5,362,869 | | | Rethink Robotics, Inc. Preferred | | | 13,365,342 | |
| 03/2015 | | | 47,064 | | | Sharecare Preferred | | | 11,759,882 | |
The accompanying notes are an integral part of these financial statements.
|
| The Hartford Capital Appreciation Fund |
Schedule of Investments – (continued)
April 30, 2015 (Unaudited)
| | | | | | | | | | |
Period
Acquired | | Shares/Par | | | Security | | Cost | |
| 11/2013 | | | 770,636 | | | Tory Burch LLC Preferred | | $ | 60,399,725 | |
| 06/2014 | | | 2,000,820 | | | Uber Technologies, Inc. Preferred | | | 31,038,821 | |
| 08/2014 | | | 58,205 | | | Veracode, Inc. Preferred | | | 1,074,808 | |
| 12/2014 | | | 153,417 | | | WeWork Companies, Inc. | | | 2,554,571 | |
| 12/2014 | | | 762,484 | | | WeWork Companies, Inc. Class D-1 Preferred | | | 12,696,243 | |
| 12/2014 | | | 599,094 | | | WeWork Companies, Inc. Class D-2 Preferred | | | 9,975,610 | |
| 01/2015 | | | 306,876 | | | Zuora, Inc. Series F Preferred | | | 1,165,914 | |
| | | | | | | | | | |
| | | | | | | | $ | 232,424,485 | |
| | | | | | | | | | |
At April 30, 2015, the aggregate value of these securities were $223,589,273, which represents 2.0% of total net assets.
Foreign Currency Contracts Outstanding at April 30, 2015
| | | | | | | | | | | | | | | | | | | | |
Currency | | Buy/Sell | | Delivery
Date | | | Counterparty | | Contract
Amount | | | Market Value* | | | Unrealized
Appreciation/
(Depreciation) | |
EUR | | Buy | | | 05/04/15 | | | DEUT | | $ | 9,503,644 | | | $ | 9,556,838 | | | $ | 53,194 | |
EUR | | Buy | | | 05/05/15 | | | WEST | | | 860,453 | | | | 863,097 | | | | 2,644 | |
EUR | | Buy | | | 06/17/15 | | | RBS | | | 6,290,721 | | | | 6,443,619 | | | | 152,898 | |
EUR | | Sell | | | 05/04/15 | | | DEUT | | | 927,104 | | | | 932,293 | | | | (5,189 | ) |
EUR | | Sell | | | 05/05/15 | | | WEST | | | 1,898,616 | | | | 1,904,450 | | | | (5,834 | ) |
EUR | | Sell | | | 06/17/15 | | | NAB | | | 76,874,164 | | | | 81,246,907 | | | | (4,372,743 | ) |
EUR | | Sell | | | 06/17/15 | | | RBS | | | 76,644,598 | | | | 81,245,783 | | | | (4,601,185 | ) |
GBP | | Buy | | | 05/01/15 | | | HSBC | | | 365,871 | | | | 363,174 | | | | (2,697 | ) |
GBP | | Buy | | | 05/01/15 | | | GSC | | | 4,302,029 | | | | 4,278,891 | | | | (23,138 | ) |
GBP | | Buy | | | 05/05/15 | | | TDB | | | 130,983 | | | | 131,189 | | | | 206 | |
GBP | | Sell | | | 05/01/15 | | | HSBC | | | 800,790 | | | | 794,887 | | | | 5,903 | |
GBP | | Sell | | | 06/17/15 | | | BNP | | | 2,336,649 | | | | 2,396,855 | | | | (60,206 | ) |
GBP | | Sell | | | 06/17/15 | | | BCLY | | | 4,014,649 | | | | 4,089,384 | | | | (74,735 | ) |
GBP | | Sell | | | 06/17/15 | | | RBS | | | 4,012,163 | | | | 4,087,851 | | | | (75,688 | ) |
HKD | | Sell | | | 05/04/15 | | | GSC | | | 46,570 | | | | 46,570 | | | | — | |
JPY | | Buy | | | 05/08/15 | | | DEUT | | | 617,078 | | | | 614,645 | | | | (2,433 | ) |
JPY | | Buy | | | 06/17/15 | | | GSC | | | 5,629,063 | | | | 5,720,104 | | | | 91,041 | |
JPY | | Sell | | | 05/08/15 | | | DEUT | | | 588,798 | | | | 586,476 | | | | 2,322 | |
JPY | | Sell | | | 06/17/15 | | | DEUT | | | 98,128,698 | | | | 99,551,313 | | | | (1,422,615 | ) |
JPY | | Sell | | | 06/17/15 | | | JPM | | | 98,118,973 | | | | 99,551,313 | | | | (1,432,340 | ) |
| | | | | | | | | | | | | | | | | | | | |
Total | | | | | | | | | | | | | | | | | | $ | (11,770,595 | ) |
| | | | | | | | | | | | | | | | | | | | |
| * | See Significant Accounting Policies of accompanying Notes to Financial Statements regarding valuation of securities. |
| | |
| GLOSSARY: (abbreviations used in preceding Schedule of Investments) |
|
| Counterparty Abbreviations: |
BCLY | | Barclays |
BNP | | BNP Paribas Securities Services |
DEUT | | Deutsche Bank Securities, Inc. |
GSC | | Goldman Sachs & Co. |
HSBC | | HSBC Bank USA |
JPM | | JP Morgan Chase & Co. |
NAB | | National Australia Bank Limited |
RBS | | RBS Greenwich Capital |
TDB | | Toronto Dominion Bank |
WEST | | Westpac International |
|
| Currency Abbreviations: |
EUR | | Euro |
GBP | | British Pound |
HKD | | Hong Kong Dollar |
JPY | | Japanese Yen |
| | |
|
| Other Abbreviations: |
ADR | | American Depositary Receipt |
PIPE | | Private Investment in Public Equity |
REIT | | Real Estate Investment Trust |
The accompanying notes are an integral part of these financial statements.
|
| The Hartford Capital Appreciation Fund |
Schedule of Investments – (continued)
April 30, 2015 (Unaudited)
Fair Valuation Summary
The following is a summary of the fair valuations according to the inputs used as of April 30, 2015 in valuing the Fund’s investments.
| | | | | | | | | | | | | | | | |
| | | Total | | | Level 1(1) | | | Level 2(1) | | | Level 3 | |
Assets | | | | | | | | | | | | | | | | |
Common Stocks | | | | | | | | | | | | | | | | |
Automobiles & Components | | $ | 284,782,005 | | | $ | 261,679,038 | | | $ | 23,102,967 | | | $ | — | |
Banks | | | 576,601,395 | | | | 382,219,666 | | | | 194,381,729 | | | | — | |
Capital Goods | | | 624,505,730 | | | | 503,782,435 | | | | 118,794,605 | | | | 1,928,690 | |
Commercial & Professional Services | | | 79,850,736 | | | | 67,709,035 | | | | 12,141,701 | | | | — | |
Consumer Durables & Apparel | | | 301,877,708 | | | | 136,212,667 | | | | 165,665,041 | | | | — | |
Consumer Services | | | 306,843,618 | | | | 303,050,945 | | | | 3,792,673 | | | | — | |
Diversified Financials | | | 493,879,508 | | | | 445,855,982 | | | | 48,023,526 | | | | — | |
Energy | | | 548,619,034 | | | | 526,838,771 | | | | 21,780,263 | | | | — | |
Food & Staples Retailing | | | 68,527,050 | | | | 55,906,426 | | | | 12,620,624 | | | | — | |
Food, Beverage & Tobacco | | | 361,837,938 | | | | 307,438,193 | | | | 54,399,745 | | | | — | |
Health Care Equipment & Services | | | 471,516,166 | | | | 471,516,166 | | | | — | | | | — | |
Household & Personal Products | | | 93,879,771 | | | | 40,952,534 | | | | 52,927,237 | | | | — | |
Insurance | | | 584,669,113 | | | | 549,746,118 | | | | 34,922,995 | | | | — | |
Materials | | | 400,117,659 | | | | 275,884,918 | | | | 124,232,741 | | | | — | |
Media | | | 88,385,309 | | | | 63,371,213 | | | | 25,014,096 | | | | — | |
Pharmaceuticals, Biotechnology & Life Sciences | | | 1,732,914,939 | | | | 1,566,434,270 | | | | 166,480,669 | | | | — | |
Real Estate | | | 84,877,781 | | | | 54,057,121 | | | | 28,521,552 | | | | 2,299,108 | |
Retailing | | | 722,739,927 | | | | 722,630,202 | | | | — | | | | 109,725 | |
Semiconductors & Semiconductor Equipment | | | 627,859,749 | | | | 585,748,381 | | | | 42,111,368 | | | | — | |
Software & Services | | | 1,382,763,108 | | | | 1,355,860,833 | | | | 26,108,256 | | | | 794,019 | |
Technology Hardware & Equipment | | | 500,130,304 | | | | 462,304,138 | | | | 37,826,166 | | | | — | |
Telecommunication Services | | | 47,557,073 | | | | 32,904,232 | | | | 14,652,841 | | | | — | |
Transportation | | | 435,222,834 | | | | 435,222,834 | | | | — | | | | — | |
Utilities | | | 128,144,233 | | | | 71,594,214 | | | | 56,550,019 | | | | — | |
Preferred Stocks | | | 217,738,049 | | | | — | | | | — | | | | 217,738,049 | |
Convertible Preferred Stocks | | | 719,682 | | | | — | | | | — | | | | 719,682 | |
Warrants | | | 4,970,376 | | | | — | | | | 4,970,376 | | | | — | |
Rights | | | 3,582,926 | | | | 3,582,926 | | | | — | | | | — | |
Short-Term Investments | | | 281,946,919 | | | | 281,946,919 | | | | — | | | | — | |
| | | | | | | | | | | | | | | | |
Total | | $ | 11,457,060,640 | | | $ | 9,964,450,177 | | | $ | 1,269,021,190 | | | $ | 223,589,273 | |
| | | | | | | | | | | | | | | | |
Foreign Currency Contracts(2) | | $ | 308,208 | | | $ | — | | | $ | 308,208 | | | $ | — | |
| | | | | | | | | | | | | | | | |
Total | | $ | 308,208 | | | $ | — | | | $ | 308,208 | | | $ | — | |
| | | | | | | | | | | | | | | | |
Liabilities | | | | | | | | | | | | | | | | |
Foreign Currency Contracts(2) | | $ | (12,078,803 | ) | | $ | — | | | $ | (12,078,803 | ) | | $ | — | |
| | | | | | | | | | | | | | | | |
Total | | $ | (12,078,803 | ) | | $ | — | | | $ | (12,078,803 | ) | | $ | — | |
| | | | | | | | | | | | | | | | |
| (1) | For the six-month period ended April 30, 2015, investments valued at $4,970,550 were transferred from Level 1 to Level 2, and investments valued at $31,999,861 were transferred from Level 2 to Level 1. Investments are transferred between Level 1 and Level 2 for a variety of reasons including, but not limited to: |
| | a) | Foreign equities for which a fair value price is more representative of exit value than the local market close (transfer into Level 2). Foreign equities for which the local market close is more representative of exit value (transfer into Level 1). |
| | b) | U.S. Treasury securities that no longer represent the most recent issue (transfer into Level 2). |
| | c) | Equity investments with no observable trading but a bid or mean price is used (transfer into Level 2). Equity investments using observable quoted prices in an active market (transfer into Level 1). |
| (2) | Derivative instruments (excluding purchased and written options, if applicable) are valued at the unrealized appreciation/depreciation on the investments. |
The accompanying notes are an integral part of these financial statements.
|
| The Hartford Capital Appreciation Fund |
Schedule of Investments – (continued)
April 30, 2015 (Unaudited)
The following is a rollforward of the Fund’s investments that were valued using unobservable inputs (Level 3) for the six-month period ended April 30, 2015:
| | | | | | | | | | | | | | | | |
| | | Common Stocks | | | Preferred Stocks | | | Convertible
Preferred Stock | | | Total | |
Beginning balance | | $ | 7,743,635 | | | $ | 106,206,276 | | | $ | 682,453 | | | $ | 114,632,364 | |
Purchases | | | 3,192,715 | | | | 83,259,916 | | | | — | | | | 86,452,631 | |
Sales | | | — | | | | (2,487,170 | ) | | | — | | | | (2,487,170 | ) |
Accrued discounts/(premiums) | | | — | | | | — | | | | — | | | | — | |
Total realized gain/(loss) | | | — | | | | 1,010,161 | | | | — | | | | 1,010,161 | |
Net change in unrealized appreciation/(depreciation) | | | 31,747 | | | | 29,748,866 | | | | 37,229 | | | | 29,817,842 | |
Transfers into Level 3(1) | | | — | | | | — | | | | — | | | | — | |
Transfers out of Level 3(1) | | | (5,836,555 | ) | | | — | | | | — | | | | (5,836,555 | ) |
| | | | | | | | | | | | | | | | |
Ending balance | | $ | 5,131,542 | | | $ | 217,738,049 | | | $ | 719,682 | | | $ | 223,589,273 | |
The change in net unrealized appreciation/(depreciation) relating to the Level 3 investment held at April 30, 2015 was $29,965,543.
| (1) | Investments are transferred into and out of Level 3 for a variety of reasons including, but not limited to: |
| | a) | Investments where trading has been halted (transfer into Level 3) or investments where trading has resumed (transfer out of Level 3). |
| | b) | Broker quoted investments (transfer into Level 3) or quoted prices in active markets (transfer out of Level 3). |
| | c) | Investments that have certain restrictions on trading (transfer into level 3) or investments where trading restrictions have expired (transfer out of Level 3). |
| Note: | For purposes of reporting transfers between different hierarchy levels, both transfers in and out of each level, as applicable, are shown as if they occurred at the beginning of the period. |
The accompanying notes are an integral part of these financial statements.
|
| Hartford Core Equity Fund |
Diversification by Sector
as of April 30, 2015 (Unaudited)
| | | | |
| Sector | | Percentage of
Net Assets | |
Equity Securities | | | | |
Consumer Discretionary | | | 13.7 | % |
Consumer Staples | | | 11.8 | |
Energy | | | 5.1 | |
Financials | | | 9.2 | |
Health Care | | | 19.7 | |
Industrials | | | 7.5 | |
Information Technology | | | 20.5 | |
Materials | | | 3.2 | |
Utilities | | | 4.1 | |
| | | | |
Total | | | 94.8 | % |
| | | | |
Short-Term Investments | | | 4.3 | % |
Other Assets & Liabilities | | | 0.9 | |
| | | | |
Total | | | 100.0 | % |
| | | | |
A sector may be comprised of several industries. For Fund compliance purposes, the Fund may not use the same classification system and these sector classifications are used for reporting ease.
The accompanying notes are an integral part of these financial statements.
|
| Hartford Core Equity Fund |
Schedule of Investments
April 30, 2015 (Unaudited)
| | | | | | | | |
Shares or Principal Amount | | Market Value* | |
| COMMON STOCKS - 94.8% | |
| | | | Banks - 6.0% | |
| | 183,880 | | | EverBank Financial Corp. | | $ | 3,414,651 | |
| | 103,658 | | | JP Morgan Chase & Co. | | | 6,557,405 | |
| | 48,775 | | | PNC Financial Services Group, Inc. | | | 4,474,131 | |
| | | | | | | | |
| | | | | | | 14,446,187 | |
| | | | | | | | |
| | | | Capital Goods - 3.1% | |
| | 39,290 | | | AMETEK, Inc. | | | 2,059,582 | |
| | 27,670 | | | Honeywell International, Inc. | | | 2,792,457 | |
| | 28,730 | | | Illinois Tool Works, Inc. | | | 2,688,553 | |
| | | | | | | | |
| | | | | | | 7,540,592 | |
| | | | | | | | |
| | | | Commercial & Professional Services - 3.6% | |
| | 38,160 | | | Equifax, Inc. | | | 3,698,849 | |
| | 42,680 | | | Nielsen N.V. | | | 1,918,039 | |
| | 40,040 | | | Verisk Analytics, Inc. Class A(1) | | | 3,004,602 | |
| | | | | | | | |
| | | | | | | 8,621,490 | |
| | | | | | | | |
| | | | Consumer Durables & Apparel - 1.2% | |
| | 18,042 | | | PVH Corp. | | | 1,864,640 | |
| | 7,070 | | | Ralph Lauren Corp. | | | 943,209 | |
| | | | | | | | |
| | | | | | | 2,807,849 | |
| | | | | | | �� | |
| | | | Consumer Services - 1.9% | |
| | 3,453 | | | Chipotle Mexican Grill, Inc.(1) | | | 2,145,487 | |
| | 28,687 | | | Starwood Hotels & Resorts Worldwide, Inc. | | | 2,465,648 | |
| | | | | | | | |
| | | | | | | 4,611,135 | |
| | | | | | | | |
| | | | Energy - 5.1% | |
| | 30,240 | | | Anadarko Petroleum Corp. | | | 2,845,584 | |
| | 41,560 | | | Chevron Corp. | | | 4,615,653 | |
| | 24,145 | | | EOG Resources, Inc. | | | 2,389,148 | |
| | 48,945 | | | Halliburton Co. | | | 2,395,858 | |
| | | | | | | | |
| | | | | | | 12,246,243 | |
| | | | | | | | |
| | | | Food & Staples Retailing - 4.7% | |
| | 36,230 | | | Costco Wholesale Corp. | | | 5,182,701 | |
| | 61,940 | | | CVS Health Corp. | | | 6,150,023 | |
| | | | | | | | |
| | | | | | | 11,332,724 | |
| | | | | | | | |
| | | | Food, Beverage & Tobacco - 4.6% | |
| | 70,820 | | | Altria Group, Inc. | | | 3,544,541 | |
| | 122,910 | | | Mondelez International, Inc. Class A | | | 4,716,057 | |
| | 20,658 | | | Monster Beverage Corp.(1) | | | 2,832,418 | |
| | | | | | | | |
| | | | | | | 11,093,016 | |
| | | | | | | | |
| | | | Health Care Equipment & Services - 10.5% | |
| | 33,295 | | | Aetna, Inc. | | | 3,558,237 | |
| | 39,147 | | | Cerner Corp.(1) | | | 2,811,146 | |
| | 60,875 | | | Envision Healthcare Holdings, Inc.(1) | | | 2,310,815 | |
| | 23,765 | | | McKesson Corp. | | | 5,309,101 | |
| | 48,960 | | | Omnicare, Inc. | | | 4,307,501 | |
| | 42,794 | | | UnitedHealth Group, Inc. | | | 4,767,251 | |
| | 22,670 | | | Zimmer Holdings, Inc. | | | 2,490,073 | |
| | | | | | | | |
| | | | | | | 25,554,124 | |
| | | | | | | | |
| | | | Household & Personal Products - 2.5% | |
| | 87,990 | | | Coty, Inc. Class A(1) | | | 2,103,841 | |
| | 49,864 | | | Estee Lauder Cos., Inc. Class A | | | 4,053,445 | |
| | | | | | | | |
| | | | | | | 6,157,286 | |
| | | | | | | | |
| | | | Insurance - 3.2% | |
| | 39,765 | | | ACE Ltd. | | | 4,254,457 | |
| | 63,510 | | | American International Group, Inc. | | | 3,574,978 | |
| | | | | | | | |
| | | | | | | 7,829,435 | |
| | | | | | | | |
| | | | | | | | |
Shares or Principal Amount | | Market Value* | |
| COMMON STOCKS - 94.8% - (continued) | |
| | | | Materials - 3.2% | |
| | 18,890 | | | Airgas, Inc. | | $ | 1,913,179 | |
| | 48,430 | | | Crown Holdings, Inc.(1) | | | 2,627,812 | |
| | 11,665 | | | Sherwin-Williams Co. | | | 3,242,870 | |
| | | | | | | | |
| | | | | | | 7,783,861 | |
| | | | | | | | |
| | | | Media - 1.7% | |
| | 72,255 | | | Comcast Corp. Class A | | | 4,161,165 | |
| | | | | | | | |
| | | | Pharmaceuticals, Biotechnology & Life Sciences - 9.2% | |
| | 16,655 | | | Actavis plc(1) | | | 4,711,033 | |
| | 5,434 | | | Biogen, Inc.(1) | | | 2,031,936 | |
| | 74,685 | | | Bristol-Myers Squibb Co. | | | 4,759,675 | |
| | 62,794 | | | Eli Lilly & Co. | | | 4,513,005 | |
| | 16,250 | | | Gilead Sciences, Inc.(1) | | | 1,633,287 | |
| | 79,027 | | | Merck & Co., Inc. | | | 4,706,848 | |
| | | | | | | | |
| | | | | | | 22,355,784 | |
| | | | | | | | |
| | | | Retailing - 8.9% | |
| | 8,415 | | | AutoZone, Inc.(1) | | | 5,660,434 | |
| | 54,382 | | | Dollar Tree, Inc.(1) | | | 4,155,329 | |
| | 64,920 | | | Lowe’s Cos., Inc. | | | 4,470,391 | |
| | 37,805 | | | Ross Stores, Inc. | | | 3,738,158 | |
| | 54,340 | | | TJX Cos., Inc. | | | 3,507,104 | |
| | | | | | | | |
| | | | | | | 21,531,416 | |
| | | | | | | | |
| | | | Semiconductors & Semiconductor Equipment - 1.0% | |
| | 76,685 | | | Intel Corp. | | | 2,496,097 | |
| | | | | | | | |
| | | | Software & Services - 15.4% | |
| | 35,090 | | | Accenture plc Class A | | | 3,251,089 | |
| | 86,985 | | | Activision Blizzard, Inc. | | | 1,984,563 | |
| | 49,510 | | | Automatic Data Processing, Inc. | | | 4,185,575 | |
| | 22,425 | | | Fiserv, Inc.(1) | | | 1,740,180 | |
| | 100,020 | | | Genpact Ltd.(1) | | | 2,186,437 | |
| | 7,400 | | | Google, Inc. Class A(1) | | | 4,060,898 | |
| | 5,320 | | | Google, Inc. Class C(1) | | | 2,858,413 | |
| | 40,410 | | | Intuit, Inc. | | | 4,054,335 | |
| | 39,855 | | | Jack Henry & Associates, Inc. | | | 2,650,756 | |
| | 31,765 | | | Mastercard, Inc. Class A | | | 2,865,521 | |
| | 116,615 | | | Microsoft Corp. | | | 5,672,154 | |
| | 36,044 | | | Solera Holdings, Inc. | | | 1,748,855 | |
| | | | | | | | |
| | | | | | | 37,258,776 | |
| | | | | | | | |
| | | | Technology Hardware & Equipment - 4.1% | |
| | 54,075 | | | Apple, Inc. | | | 6,767,486 | |
| | 106,500 | | | Cisco Systems, Inc. | | | 3,070,395 | |
| | | | | | | | |
| | | | | | | 9,837,881 | |
| | | | | | | | |
| | | | Transportation - 0.8% | |
| | 11,805 | | | FedEx Corp. | | | 2,001,774 | |
| | | | | | | | |
| | | | Utilities - 4.1% | |
| | 65,235 | | | American Electric Power Co., Inc. | | | 3,709,914 | |
| | 38,990 | | | NextEra Energy, Inc. | | | 3,935,261 | |
| | 39,165 | | | Pinnacle West Capital Corp. | | | 2,396,898 | |
| | | | | | | | |
| | | | | | | 10,042,073 | |
| | | | | | | | |
| | |
| | | | Total Common Stocks
(cost $191,091,579) | | $ | 229,708,908 | |
| | | | | | | | |
| | |
| | | | Total Long-Term Investments
(cost $191,091,579) | | $ | 229,708,908 | |
| | | | | | | | |
The accompanying notes are an integral part of these financial statements.
|
| Hartford Core Equity Fund |
Schedule of Investments – (continued)
April 30, 2015 (Unaudited)
| | | | | | | | |
Shares or Principal Amount | | Market Value* | |
| SHORT-TERM INVESTMENTS - 4.3% | |
| | | | Other Investment Pools & Funds - 4.3% | | | |
| | 10,517,290 | | | Fidelity Money Market Class 1 | | $ | 10,517,290 | |
| | | | | | | | |
| | |
| | | | Total Short-Term Investments
(cost $10,517,290) | | $ | 10,517,290 | |
| | | | | | | | |
| | | | | | | | | | |
| | | |
| | Total Investments
(cost $201,608,869)^ | | | 99.1 | % | | $ | 240,226,198 | |
| | Other Assets and Liabilities | | | 0.9 | % | | | 2,081,492 | |
| | | | | | | | | | |
| | Total Net Assets | | | 100.0 | % | | $ | 242,307,690 | |
| | | | | | | | | | |
The accompanying notes are an integral part of these financial statements.
|
| Hartford Core Equity Fund |
Schedule of Investments – (continued)
April 30, 2015 (Unaudited)
| Note: | Percentage of investments as shown is the ratio of the total market value to total net assets. |
| | Equity industry classifications used in this report are the Global Industry Classification Standard, which was developed by and is the exclusive property and service mark of MSCI, Inc. and Standard & Poor’s. |
| | For Fund compliance purposes, the Fund may not use the same classification system shown in this report as these classifications are used for reporting ease. |
| ^ | At April 30, 2015, the cost of securities for federal income tax purposes was $201,719,907 and the aggregate gross unrealized appreciation and depreciation based on that cost were: |
| | | | |
Unrealized Appreciation | | $ | 40,297,204 | |
Unrealized Depreciation | | | (1,790,913 | ) |
| | | | |
Net Unrealized Appreciation | | $ | 38,506,291 | |
| | | | |
| (1) | Non-income producing. |
Futures Contracts Outstanding at April 30, 2015
| | | | | | | | | | | | | | | | | | | | |
Description | | Number of
Contracts | | | Expiration
Date | | | Notional Amount | | | Market Value* | | | Unrealized
Appreciation/
(Depreciation) | |
Long position contracts: | | | | | | | | | | | | | | | | | | | | |
S&P 500 (E-Mini) Future | | | 69 | | | | 06/19/2015 | | | $ | 7,200,285 | | | $ | 7,172,205 | | | $ | (28,080) | |
| | | | | | | | | | | | | | | | | | | | |
Total futures contracts | | | | | | | | | | | | | | | | | | $ | (28,080) | |
| | | | | | | | | | | | | | | | | | | | |
| * | See Significant Accounting Policies of accompanying Notes to Financial Statements regarding valuation of securities. |
The accompanying notes are an integral part of these financial statements.
|
| Hartford Core Equity Fund |
Schedule of Investments – (continued)
April 30, 2015 (Unaudited)
Fair Valuation Summary
The following is a summary of the fair valuations according to the inputs used as of April 30, 2015 in valuing the Fund’s investments.
| | | | | | | | | | | | | | | | |
| | | Total | | | Level 1(1) | | | Level 2(1) | | | Level 3 | |
Assets | | | | | | | | | | | | | | | | |
Common Stocks | | | | | | | | | | | | | | | | |
Banks | | $ | 14,446,187 | | | $ | 14,446,187 | | | $ | — | | | $ | — | |
Capital Goods | | | 7,540,592 | | | | 7,540,592 | | | | — | | | | — | |
Commercial & Professional Services | | | 8,621,490 | | | | 8,621,490 | | | | — | | | | — | |
Consumer Durables & Apparel | | | 2,807,849 | | | | 2,807,849 | | | | — | | | | — | |
Consumer Services | | | 4,611,135 | | | | 4,611,135 | | | | — | | | | — | |
Energy | | | 12,246,243 | | | | 12,246,243 | | | | — | | | | — | |
Food & Staples Retailing | | | 11,332,724 | | | | 11,332,724 | | | | — | | | | — | |
Food, Beverage & Tobacco | | | 11,093,016 | | | | 11,093,016 | | | | — | | | | — | |
Health Care Equipment & Services | | | 25,554,124 | | | | 25,554,124 | | | | — | | | | — | |
Household & Personal Products | | | 6,157,286 | | | | 6,157,286 | | | | — | | | | — | |
Insurance | | | 7,829,435 | | | | 7,829,435 | | | | — | | | | — | |
Materials | | | 7,783,861 | | | | 7,783,861 | | | | — | | | | — | |
Media | | | 4,161,165 | | | | 4,161,165 | | | | — | | | | — | |
Pharmaceuticals, Biotechnology & Life Sciences | | | 22,355,784 | | | | 22,355,784 | | | | — | | | | — | |
Retailing | | | 21,531,416 | | | | 21,531,416 | | | | — | | | | — | |
Semiconductors & Semiconductor Equipment | | | 2,496,097 | | | | 2,496,097 | | | | — | | | | — | |
Software & Services | | | 37,258,776 | | | | 37,258,776 | | | | — | | | | — | |
Technology Hardware & Equipment | | | 9,837,881 | | | | 9,837,881 | | | | — | | | | — | |
Transportation | | | 2,001,774 | | | | 2,001,774 | | | | — | | | | — | |
Utilities | | | 10,042,073 | | | | 10,042,073 | | | | — | | | | — | |
Short-Term Investments | | | 10,517,290 | | | | 10,517,290 | | | | — | | | | — | |
| | | | | | | | | | | | | | | | |
Total | | $ | 240,226,198 | | | $ | 240,226,198 | | | $ | — | | | $ | — | |
| | | | | | | | | | | | | | | | |
Liabilities | | | | | | | | | | | | | | | | |
Futures Contracts(2) | | $ | (28,080 | ) | | $ | (28,080 | ) | | $ | — | | | $ | — | |
| | | | | | | | | | | | | | | | |
Total | | $ | (28,080 | ) | | $ | (28,080 | ) | | $ | — | | | $ | — | |
| | | | | | | | | | | | | | | | |
| (1) | For the six-month period ended April 30, 2015, there were no transfers between Level 1 and Level 2. |
| Note: | For purposes of reporting transfers between different hierarchy levels, both transfers in and out of each level, as applicable, are shown as if they occurred at the beginning of the period. |
The accompanying notes are an integral part of these financial statements.
|
| The Hartford Dividend and Growth Fund |
Diversification by Sector
as of April 30, 2015 (Unaudited)
| | | | |
| Sector | | Percentage of
Net Assets | |
Equity Securities | | | | |
Consumer Discretionary | | | 6.9 | % |
Consumer Staples | | | 7.1 | |
Energy | | | 9.7 | |
Financials | | | 20.8 | |
Health Care | | | 15.9 | |
Industrials | | | 13.1 | |
Information Technology | | | 15.1 | |
Materials | | | 2.1 | |
Telecommunication Services | | | 2.6 | |
Utilities | | | 3.3 | |
| | | | |
Total | | | 96.6 | % |
| | | | |
Short-Term Investments | | | 3.4 | % |
Other Assets & Liabilities | | | 0.0 | |
| | | | |
Total | | | 100.0 | % |
| | | | |
A sector may be comprised of several industries. For Fund compliance purposes, the Fund may not use the same classification system and these sector classifications are used for reporting ease.
The accompanying notes are an integral part of these financial statements.
|
| The Hartford Dividend and Growth Fund |
Schedule of Investments
April 30, 2015 (Unaudited)
| | | | | | | | |
Shares or Principal Amount | | Market Value* | |
| COMMON STOCKS - 96.6% | |
| | | | Automobiles & Components - 1.6% | |
| | 6,726,110 | | | Ford Motor Co. | | $ | 106,272,538 | |
| | 679,210 | | | Honda Motor Co., Ltd. ADR | | | 22,773,911 | |
| | | | | | | | |
| | | | | | | 129,046,449 | |
| | | | | | | | |
| | | | Banks - 11.8% | |
| | 4,196,471 | | | Bank of America Corp. | | | 66,849,783 | |
| | 960,950 | | | Bank of Nova Scotia | | | 53,015,612 | |
| | 1,887,420 | | | Citigroup, Inc. | | | 100,637,234 | |
| | 3,094,720 | | | JP Morgan Chase & Co. | | | 195,771,987 | |
| | 1,451,441 | | | PNC Financial Services Group, Inc. | | | 133,140,683 | |
| | 1,164,725 | | | US Bancorp | | | 49,931,761 | |
| | 6,532,040 | | | Wells Fargo & Co. | | | 359,915,404 | |
| | | | | | | | |
| | | | | | | 959,262,464 | |
| | | | | | | | |
| | | | Capital Goods - 7.0% | |
| | 800,915 | | | Caterpillar, Inc. | | | 69,583,495 | |
| | 1,118,090 | | | Eaton Corp. plc | | | 76,846,326 | |
| | 2,999,210 | | | General Electric Co. | | | 81,218,607 | |
| | 1,055,060 | | | Honeywell International, Inc. | | | 106,476,655 | |
| | 173,330 | | | Lockheed Martin Corp. | | | 32,343,378 | |
| | 624,440 | | | Raytheon Co. | | | 64,941,760 | |
| | 1,012,620 | | | Textron, Inc. | | | 44,535,027 | |
| | 813,820 | | | United Technologies Corp. | | | 92,572,025 | |
| | | | | | | | |
| | | | | | | 568,517,273 | |
| | | | | | | | |
| | | | Commercial & Professional Services - 2.0% | |
| | 678,145 | | | Equifax, Inc. | | | 65,732,595 | |
| | 2,181,580 | | | Nielsen N.V. | | | 98,040,205 | |
| | | | | | | | |
| | | | | | | 163,772,800 | |
| | | | | | | | |
| | | | Consumer Services - 0.9% | |
| | 462,977 | | | Las Vegas Sands Corp. | | | 24,482,224 | |
| | 611,400 | | | Starwood Hotels & Resorts Worldwide, Inc. | | | 52,549,830 | |
| | | | | | | | |
| | | | | | | 77,032,054 | |
| | | | | | | | |
| | | | Diversified Financials - 2.2% | |
| | 262,330 | | | Ameriprise Financial, Inc. | | | 32,864,703 | |
| | 341,230 | | | BlackRock, Inc. | | | 124,187,246 | |
| | 342,900 | | | Northern Trust Corp. | | | 25,083,135 | |
| | | | | | | | |
| | | | | | | 182,135,084 | |
| | | | | | | | |
| | | | Energy - 9.7% | |
| | 957,980 | | | Anadarko Petroleum Corp. | | | 90,145,918 | |
| | 1,787,900 | | | Chevron Corp. | | | 198,564,174 | |
| | 368,710 | | | EOG Resources, Inc. | | | 36,483,855 | |
| | 1,906,098 | | | Exxon Mobil Corp. | | | 166,535,782 | |
| | 464,980 | | | Halliburton Co. | | | 22,760,771 | |
| | 708,910 | | | Hess Corp. | | | 54,515,179 | |
| | 1,344,900 | | | Imperial Oil Ltd. | | | 59,350,437 | |
| | 2,325,800 | | | Marathon Oil Corp. | | | 72,332,380 | |
| | 495,580 | | | Schlumberger Ltd. | | | 46,886,824 | |
| | 776,090 | | | Total S.A. ADR | | | 41,986,469 | |
| | | | | | | | |
| | | | | | | 789,561,789 | |
| | | | | | | | |
| | | | Food & Staples Retailing - 3.4% | |
| | 1,672,490 | | | CVS Health Corp. | | | 166,061,532 | |
| | 950,250 | | | Wal-Mart Stores, Inc. | | | 74,167,012 | |
| | 432,207 | | | Walgreens Boots Alliance, Inc. | | | 35,842,927 | |
| | | | | | | | |
| | | | | | | 276,071,471 | |
| | | | | | | | |
| | | | Food, Beverage & Tobacco - 3.1% | |
| | 1,910,650 | | | Coca-Cola Co. | | | 77,495,964 | |
| | 1,715,200 | | | Mondelez International, Inc. Class A | | | 65,812,224 | |
| | | | | | | | |
Shares or Principal Amount | | Market Value* | |
| COMMON STOCKS - 96.6% - (continued) | |
| | | | Food, Beverage & Tobacco - 3.1% - (continued) | |
| | 837,235 | | | Philip Morris International, Inc. | | $ | 69,884,005 | |
| | 1,004,535 | | | Unilever N.V. | | | 43,677,182 | |
| | | | | | | | |
| | | | | | | 256,869,375 | |
| | | | | | | | |
| | | | Health Care Equipment & Services - 4.2% | |
| | 1,347,090 | | | Cardinal Health, Inc. | | | 113,613,571 | |
| | 1,876,110 | | | Medtronic plc | | | 139,676,389 | |
| | 811,420 | | | UnitedHealth Group, Inc. | | | 90,392,188 | |
| | | | | | | | |
| | | | | | | 343,682,148 | |
| | | | | | | | |
| | | | Household & Personal Products - 0.6% | |
| | 667,235 | | | Procter & Gamble Co. | | | 53,051,855 | |
| | | | | | | | |
| | | | Insurance - 6.8% | |
| | 1,435,350 | | | ACE Ltd. | | | 153,568,096 | |
| | 441,970 | | | Aflac, Inc. | | | 27,861,789 | |
| | 1,211,800 | | | Marsh & McLennan Cos., Inc. | | | 68,054,688 | |
| | 1,476,200 | | | MetLife, Inc. | | | 75,714,298 | |
| | 1,861,375 | | | Principal Financial Group, Inc. | | | 95,153,490 | |
| | 1,666,590 | | | Prudential Financial, Inc. | | | 135,993,744 | |
| | | | | | | | |
| | | | | | | 556,346,105 | |
| | | | | | | | |
| | | | Materials - 2.1% | |
| | 980,130 | | | Celanese Corp. Series A | | | 65,041,427 | |
| | 1,495,360 | | | Goldcorp, Inc. | | | 28,157,629 | |
| | 1,414,060 | | | International Paper Co. | | | 75,963,303 | |
| | | | | | | | |
| | | | | | | 169,162,359 | |
| | | | | | | | |
| | | | Media - 3.1% | |
| | 3,470,302 | | | Comcast Corp. Class A | | | 200,444,644 | |
| | 1,410,090 | | | Twenty-First Century Fox, Inc. Class A | | | 48,055,867 | |
| | 56,979 | | | Walt Disney Co. | | | 6,194,757 | |
| | | | | | | | |
| | | | | | | 254,695,268 | |
| | | | | | | | |
| | | | Pharmaceuticals, Biotechnology & Life
Sciences - 11.7% | |
| | 1,516,155 | | | AstraZeneca plc ADR | | | 103,826,294 | |
| | 2,262,640 | | | Bristol-Myers Squibb Co. | | | 144,198,047 | |
| | 1,707,180 | | | Eli Lilly & Co. | | | 122,695,027 | |
| | 1,506,727 | | | Johnson & Johnson | | | 149,467,318 | |
| | 4,826,658 | | | Merck & Co., Inc. | | | 287,475,751 | |
| | 4,237,810 | | | Pfizer, Inc. | | | 143,788,893 | |
| | | | | | | | |
| | | | | | | 951,451,330 | |
| | | | | | | | |
| | | | Retailing - 1.3% | |
| | 1,554,220 | | | Lowe’s Cos., Inc. | | | 107,023,589 | |
| | | | | | | | |
| | | | Semiconductors & Semiconductor Equipment - 3.5% | |
| | 680,471 | | | Altera Corp. | | | 28,362,031 | |
| | 1,088,900 | | | Analog Devices, Inc. | | | 67,337,576 | |
| | 4,414,520 | | | Intel Corp. | | | 143,692,626 | |
| | 887,510 | | | Texas Instruments, Inc. | | | 48,111,917 | |
| | | | | | | | |
| | | | | | | 287,504,150 | |
| | | | | | | | |
| | | | Software & Services - 6.9% | |
| | 1,283,395 | | | Accenture plc Class A | | | 118,906,547 | |
| | 228,100 | | | Google, Inc. Class A(1) | | | 125,174,437 | |
| | 5,078,782 | | | Microsoft Corp. | | | 247,031,956 | |
| | 1,632,490 | | | Oracle Corp. | | | 71,209,214 | |
| | | | | | | | |
| | | | | | | 562,322,154 | |
| | | | | | | | |
| | | | Technology Hardware & Equipment - 4.7% | |
| | 1,239,045 | | | Apple, Inc. | | | 155,066,482 | |
| | 840,140 | | | Avnet, Inc. | | | 35,815,168 | |
| | 4,600,700 | | | Cisco Systems, Inc. | | | 132,638,181 | |
| | 578,400 | | | Qualcomm, Inc. | | | 39,331,200 | |
The accompanying notes are an integral part of these financial statements.
|
| The Hartford Dividend and Growth Fund |
Schedule of Investments – (continued)
April 30, 2015 (Unaudited)
| | | | | | | | |
Shares or Principal Amount | | Market Value* | |
| COMMON STOCKS - 96.6% - (continued) | |
| | | | Technology Hardware & Equipment - 4.7% - (continued) | |
| | 258,450 | | | Western Digital Corp. | | $ | 25,260,903 | |
| | | | | | | | |
| | | | | | | 388,111,934 | |
| | | | | | | | |
| | | | Telecommunication Services - 2.6% | |
| | 4,152,600 | | | Verizon Communications, Inc. | | | 209,457,144 | |
| | | | | | | | |
| | | | Transportation - 4.1% | |
| | 1,993,174 | | | CSX Corp. | | | 71,933,649 | |
| | 1,356,680 | | | Delta Air Lines, Inc. | | | 60,562,195 | |
| | 450,310 | | | FedEx Corp. | | | 76,359,067 | |
| | 1,220,573 | | | United Parcel Service, Inc. Class B | | | 122,704,204 | |
| | | | | | | | |
| | | | | | | 331,559,115 | |
| | | | | | | | |
| | | | Utilities - 3.3% | |
| | 1,022,415 | | | Dominion Resources, Inc. | | | 73,286,707 | |
| | 1,850,475 | | | Exelon Corp. | | | 62,953,160 | |
| | 967,305 | | | NextEra Energy, Inc. | | | 97,630,094 | |
| | 1,329,980 | | | NRG Energy, Inc. | | | 33,568,695 | |
| | | | | | | | |
| | | | | | | 267,438,656 | |
| | | | | | | | |
| | |
| | | | Total Common Stocks
(cost $5,661,370,505) | | $ | 7,884,074,566 | |
| | | | | | | | |
| | |
| | | | Total Long-Term Investments
(cost $5,661,370,505) | | $ | 7,884,074,566 | |
| | | | | | | | |
|
| SHORT-TERM INVESTMENTS - 3.4% | |
| | | | Other Investment Pools & Funds - 2.6% | |
| | 209,622,687 | | | BlackRock Liquidity Funds TempFund Portfolio | | $ | 209,622,687 | |
| | | | | | | | |
| | |
| | | | U.S. Government Agencies - 0.8% | | | |
| | | | FHLB | | | | |
| | 66,000,000 | | | 0.07%, 05/22/2015(2) | | | 65,998,812 | |
| | | | | | | | |
| | |
| | | | Total Short-Term Investments
(cost $275,619,895) | | $ | 275,621,499 | |
| | | | | | | | |
| | | | | | | | | | |
| | | |
| | Total Investments
(cost $5,936,990,400)^ | | | 100.0 | % | | $ | 8,159,696,065 | |
| | Other Assets and Liabilities | | | 0.0 | % | | | (1,895,030 | ) |
| | | | | | | | | | |
| | Total Net Assets | | | 100.0 | % | | $ | 8,157,801,035 | |
| | | | | | | | | | |
The accompanying notes are an integral part of these financial statements.
|
| The Hartford Dividend and Growth Fund |
Schedule of Investments – (continued)
April 30, 2015 (Unaudited)
| Note: | Percentage of investments as shown is the ratio of the total market value to total net assets. |
| | Equity industry classifications used in this report are the Global Industry Classification Standard, which was developed by and is the exclusive property and service mark of MSCI, Inc. and Standard & Poor’s. |
| | For Fund compliance purposes, the Fund may not use the same classification system shown in this report as these classifications are used for reporting ease. |
| ^ | At April 30, 2015, the cost of securities for federal income tax purposes was $5,955,112,171 and the aggregate gross unrealized appreciation and depreciation based on that cost were: |
| | | | |
Unrealized Appreciation | | $ | 2,264,374,332 | |
Unrealized Depreciation | | | (59,790,438 | ) |
| | | | |
Net Unrealized Appreciation | | $ | 2,204,583,894 | |
| | | | |
| (1) | Non-income producing. |
| (2) | The interest rate disclosed for this holding is the effective yield on the date of the acquisition. |
| * | See Significant Accounting Policies of accompanying Notes to Financial Statements regarding valuation of securities. |
| | |
| GLOSSARY: (abbreviations used in preceding Schedule of Investments) |
|
| Other Abbreviations: |
ADR | | American Depositary Receipt |
FHLB | | Federal Home Loan Bank |
The accompanying notes are an integral part of these financial statements.
|
| The Hartford Dividend and Growth Fund |
Schedule of Investments – (continued)
April 30, 2015 (Unaudited)
Fair Valuation Summary
The following is a summary of the fair valuations according to the inputs used as of April 30, 2015 in valuing the Fund’s investments.
| | | | | | | | | | | | | | | | |
| | | Total | | | Level 1(1) | | | Level 2(1) | | | Level 3 | |
Assets | | | | | | | | | | | | | | | | |
Common Stocks | | | | | | | | | | | | | | | | |
Automobiles & Components | | $ | 129,046,449 | | | $ | 129,046,449 | | | $ | — | | | $ | — | |
Banks | | | 959,262,464 | | | | 959,262,464 | | | | — | | | | — | |
Capital Goods | | | 568,517,273 | | | | 568,517,273 | | | | — | | | | — | |
Commercial & Professional Services | | | 163,772,800 | | | | 163,772,800 | | | | — | | | | — | |
Consumer Services | | | 77,032,054 | | | | 77,032,054 | | | | — | | | | — | |
Diversified Financials | | | 182,135,084 | | | | 182,135,084 | | | | — | | | | — | |
Energy | | | 789,561,789 | | | | 789,561,789 | | | | — | | | | — | |
Food & Staples Retailing | | | 276,071,471 | | | | 276,071,471 | | | | — | | | | — | |
Food, Beverage & Tobacco | | | 256,869,375 | | | | 256,869,375 | | | | — | | | | — | |
Health Care Equipment & Services | | | 343,682,148 | | | | 343,682,148 | | | | — | | | | — | |
Household & Personal Products | | | 53,051,855 | | | | 53,051,855 | | | | — | | | | — | |
Insurance | | | 556,346,105 | | | | 556,346,105 | | | | — | | | | — | |
Materials | | | 169,162,359 | | | | 169,162,359 | | | | — | | | | — | |
Media | | | 254,695,268 | | | | 254,695,268 | | | | — | | | | — | |
Pharmaceuticals, Biotechnology & Life Sciences | | | 951,451,330 | | | | 951,451,330 | | | | — | | | | — | |
Retailing | | | 107,023,589 | | | | 107,023,589 | | | | — | | | | — | |
Semiconductors & Semiconductor Equipment | | | 287,504,150 | | | | 287,504,150 | | | | — | | | | — | |
Software & Services | | | 562,322,154 | | | | 562,322,154 | | | | — | | | | — | |
Technology Hardware & Equipment | | | 388,111,934 | | | | 388,111,934 | | | | — | | | | — | |
Telecommunication Services | | | 209,457,144 | | | | 209,457,144 | | | | — | | | | — | |
Transportation | | | 331,559,115 | | | | 331,559,115 | | | | — | | | | — | |
Utilities | | | 267,438,656 | | | | 267,438,656 | | | | — | | | | — | |
Short-Term Investments | | | 275,621,499 | | | | 209,622,687 | | | | 65,998,812 | | | | — | |
| | | | | | | | | | | | | | | | |
Total | | $ | 8,159,696,065 | | | $ | 8,093,697,253 | | | $ | 65,998,812 | | | $ | — | |
| | | | | | | | | | | | | | | | |
| (1) | For the six-month period ended April 30, 2015, there were no transfers between Level 1 and Level 2. |
| Note: | For purposes of reporting transfers between different hierarchy levels, both transfers in and out of each level, as applicable, are shown as if they occurred at the beginning of the period. |
The accompanying notes are an integral part of these financial statements.
|
| The Hartford Equity Income Fund |
Diversification by Sector
as of April 30, 2015 (Unaudited)
| | | | |
| Sector | | Percentage of
Net Assets | |
Equity Securities | | | | |
Consumer Discretionary | | | 5.0 | % |
Consumer Staples | | | 8.0 | |
Energy | | | 11.8 | |
Financials | | | 23.8 | |
Health Care | | | 13.7 | |
Industrials | | | 13.2 | |
Information Technology | | | 12.5 | |
Materials | | | 1.6 | |
Telecommunication Services | | | 3.5 | |
Utilities | | | 6.4 | |
| | | | |
Total | | | 99.5 | % |
| | | | |
Short-Term Investments | | | 0.7 | % |
Other Assets & Liabilities | | | (0.2 | ) |
| | | | |
Total | | | 100.0 | % |
| | | | |
A sector may be comprised of several industries. For Fund compliance purposes, the Fund may not use the same classification system and these sector classifications are used for reporting ease.
The accompanying notes are an integral part of these financial statements.
|
| The Hartford Equity Income Fund |
Schedule of Investments
April 30, 2015 (Unaudited)
| | | | | | | | |
Shares or Principal Amount | | Market Value* | |
| COMMON STOCKS - 99.5% | | | |
| | | | Banks - 13.3% | |
| | 1,054,970 | | | BB&T Corp. | | $ | 40,394,801 | |
| | 1,958,340 | | | JP Morgan Chase & Co. | | | 123,884,589 | |
| | 528,305 | | | M&T Bank Corp. | | | 63,222,259 | |
| | 1,032,585 | | | PNC Financial Services Group, Inc. | | | 94,719,022 | |
| | 1,008,290 | | | US Bancorp | | | 43,225,392 | |
| | 2,670,100 | | | Wells Fargo & Co. | | | 147,122,510 | |
| | | | | | | | |
| | | | | | | 512,568,573 | |
| | | | | | | | |
| | | | Capital Goods - 11.6% | |
| | 327,595 | | | 3M Co. | | | 51,232,582 | |
| | 163,200 | | | Caterpillar, Inc. | | | 14,178,816 | |
| | 1,265,385 | | | Eaton Corp. plc | | | 86,969,911 | |
| | 3,175,390 | | | General Electric Co. | | | 85,989,561 | |
| | 365,000 | | | Honeywell International, Inc. | | | 36,835,800 | |
| | 271,610 | | | Illinois Tool Works, Inc. | | | 25,417,264 | |
| | 391,500 | | | Raytheon Co. | | | 40,716,000 | |
| | 380,412 | | | Schneider Electric S.A. | | | 28,435,180 | |
| | 678,460 | | | United Technologies Corp. | | | 77,174,825 | |
| | | | | | | | |
| | | | | | | 446,949,939 | |
| | | | | | | | |
| | | | Commercial & Professional Services - 0.7% | |
| | 518,450 | | | Waste Management, Inc. | | | 25,678,829 | |
| | | | | | | | |
| | | | Consumer Services - 0.9% | |
| | 351,050 | | | McDonald’s Corp. | | | 33,893,878 | |
| | | | | | | | |
| | | | Diversified Financials - 3.4% | |
| | 282,660 | | | Ameriprise Financial, Inc. | | | 35,411,645 | |
| | 204,445 | | | BlackRock, Inc. | | | 74,405,713 | |
| | 550,629 | | | Invesco Ltd. | | | 22,807,053 | |
| | | | | | | | |
| | | | | | | 132,624,411 | |
| | | | | | | | |
| | | | Energy - 11.8% | |
| | 1,036,720 | | | Chevron Corp. | | | 115,138,123 | |
| | 767,500 | | | Enbridge, Inc. | | | 40,163,275 | |
| | 1,098,990 | | | Exxon Mobil Corp. | | | 96,018,756 | |
| | 1,239,200 | | | Marathon Oil Corp. | | | 38,539,120 | |
| | 607,535 | | | Occidental Petroleum Corp. | | | 48,663,554 | |
| | 437,500 | | | Phillips 66 | | | 34,698,125 | |
| | 527,105 | | | Royal Dutch Shell plc Class B | | | 16,875,682 | |
| | 1,923,620 | | | Suncor Energy, Inc. | | | 62,710,012 | |
| | | | | | | | |
| | | | | | | 452,806,647 | |
| | | | | | | | |
| | | | Food & Staples Retailing - 0.7% | |
| | 346,780 | | | Wal-Mart Stores, Inc. | | | 27,066,179 | |
| | | | | | | | |
| | | | Food, Beverage & Tobacco - 6.4% | |
| | 250,400 | | | Anheuser-Busch InBev N.V. ADR | | | 30,058,016 | |
| | 696,114 | | | British American Tobacco plc | | | 38,246,994 | |
| | 923,800 | | | Coca-Cola Co. | | | 37,469,328 | |
| | 278,290 | | | Diageo plc ADR | | | 30,895,756 | |
| | 980,365 | | | Kraft Foods Group, Inc. | | | 83,085,934 | |
| | 322,075 | | | Philip Morris International, Inc. | | | 26,883,600 | |
| | | | | | | | |
| | | | | | | 246,639,628 | |
| | | | | | | | |
| | | | Health Care Equipment & Services - 0.8% | |
| | 428,820 | | | Baxter International, Inc. | | | 29,477,087 | |
| | | | | | | | |
| | | | Household & Personal Products - 0.9% | |
| | 418,805 | | | Procter & Gamble Co. | | | 33,299,186 | |
| | | | | | | | |
| | | | Insurance - 7.1% | |
| | 732,710 | | | ACE Ltd. | | | 78,392,643 | |
| | 1,894,860 | | | Marsh & McLennan Cos., Inc. | | | 106,415,337 | |
| | 962,000 | | | MetLife, Inc. | | | 49,340,980 | |
| | | | | | | | |
Shares or Principal Amount | | Market Value* | |
| COMMON STOCKS - 99.5% - (continued) | | | |
| | | | Insurance - 7.1% - (continued) | |
| | 737,000 | | | Principal Financial Group, Inc. | | $ | 37,675,440 | |
| | | | | | | | |
| | | | | | | 271,824,400 | |
| | | | | | | | |
| | | | Materials - 1.6% | |
| | 718,680 | | | Dow Chemical Co. | | | 36,652,680 | |
| | 511,585 | | | Nucor Corp. | | | 24,996,043 | |
| | | | | | | | |
| | | | | | | 61,648,723 | |
| | | | | | | | |
| | | | Media - 0.9% | |
| | 857,755 | | | Thomson Reuters Corp. | | | 35,219,420 | |
| | | | | | | | |
| | | | Pharmaceuticals, Biotechnology & Life
Sciences - 12.9% | |
| | 574,965 | | | AstraZeneca plc ADR | | | 39,373,603 | |
| | 647,200 | | | Bristol-Myers Squibb Co. | | | 41,246,056 | |
| | 420,600 | | | Eli Lilly & Co. | | | 30,228,522 | |
| | 1,100,850 | | | Johnson & Johnson | | | 109,204,320 | |
| | 2,047,015 | | | Merck & Co., Inc. | | | 121,920,214 | |
| | 231,848 | | | Novartis AG | | | 23,665,216 | |
| | 2,629,776 | | | Pfizer, Inc. | | | 89,228,300 | |
| | 136,719 | | | Roche Holding AG | | | 39,122,838 | |
| | | | | | | | |
| | | | | | | 493,989,069 | |
| | | | | | | | |
| | | | Retailing - 3.2% | |
| | 1,141,960 | | | Home Depot, Inc. | | | 122,166,881 | |
| | | | | | | | |
| | | | Semiconductors & Semiconductor Equipment - 5.5% | |
| | 1,257,470 | | | Analog Devices, Inc. | | | 77,761,945 | |
| | 2,504,330 | | | Intel Corp. | | | 81,515,941 | |
| | 939,666 | | | Maxim Integrated Products, Inc. | | | 30,849,235 | |
| | 377,720 | | | Texas Instruments, Inc. | | | 20,476,201 | |
| | | | | | | | |
| | | | | | | 210,603,322 | |
| | | | | | | | |
| | | | Software & Services - 4.4% | |
| | 2,723,695 | | | Microsoft Corp. | | | 132,480,525 | |
| | 1,440,830 | | | Symantec Corp. | | | 35,912,688 | |
| | | | | | | | |
| | | | | | | 168,393,213 | |
| | | | | | | | |
| | | | Technology Hardware & Equipment - 2.6% | |
| | 3,460,780 | | | Cisco Systems, Inc. | | | 99,774,287 | |
| | | | | | | | |
| | | | Telecommunication Services - 3.5% | |
| | 836,900 | | | BCE, Inc. | | | 36,895,741 | |
| | 1,905,824 | | | Verizon Communications, Inc. | | | 96,129,762 | |
| | | | | | | | |
| | | | | | | 133,025,503 | |
| | | | | | | | |
| | | | Transportation - 0.9% | |
| | 334,870 | | | United Parcel Service, Inc. Class B | | | 33,664,481 | |
| | | | | | | | |
| | | | Utilities - 6.4% | |
| | 450,100 | | | Duke Energy Corp. | | | 34,914,257 | |
| | 811,920 | | | Eversource Energy | | | 39,589,219 | |
| | 3,827,547 | | | National Grid plc | | | 51,493,293 | |
| | 317,460 | | | NextEra Energy, Inc. | | | 32,041,238 | |
| | 1,202,460 | | | UGI Corp. | | | 41,857,633 | |
| | 1,339,200 | | | Xcel Energy, Inc. | | | 45,412,272 | |
| | | | | | | | |
| | | | | | | 245,307,912 | |
| | | | | | | | |
| | |
| | | | Total Common Stocks
(cost $3,053,696,060) | | $ | 3,816,621,568 | |
| | | | | | | | |
| | |
| | | | Total Long-Term Investments
(cost $3,053,696,060) | | $ | 3,816,621,568 | |
| | | | | | | | |
The accompanying notes are an integral part of these financial statements.
|
| The Hartford Equity Income Fund |
Schedule of Investments – (continued)
April 30, 2015 (Unaudited)
| | | | | | | | |
Shares or Principal Amount | | Market Value* | |
| SHORT-TERM INVESTMENTS - 0.7% | |
| | | | Other Investment Pools & Funds - 0.7% | |
| | 25,148,390 | | | Federated Prime Obligations Fund | | $ | 25,148,390 | |
| | | | | | | | |
| | |
| | | | Total Short-Term Investments
(cost $25,148,390) | | $ | 25,148,390 | |
| | | | | | | | |
| | | | | | | | | | |
| | | |
| | Total Investments
(cost $3,078,844,450)^ | | | 100.2 | % | | $ | 3,841,769,958 | |
| | Other Assets and Liabilities | | | (0.2 | )% | | | (7,121,137 | ) |
| | | | | | | | | | |
| | Total Net Assets | | | 100.0 | % | | $ | 3,834,648,821 | |
| | | | | | | | | | |
The accompanying notes are an integral part of these financial statements.
|
| The Hartford Equity Income Fund |
Schedule of Investments – (continued)
April 30, 2015 (Unaudited)
| Note: | Percentage of investments as shown is the ratio of the total market value to total net assets. |
| | Prices of foreign equities that are principally traded on certain foreign markets may be adjusted daily pursuant to a fair value pricing service approved by the Board of Directors in order to reflect an adjustment for factors occurring after the close of certain foreign markets but before the close of the New York Stock Exchange. |
| | Equity industry classifications used in this report are the Global Industry Classification Standard, which was developed by and is the exclusive property and service mark of MSCI, Inc. and Standard & Poor’s. |
| | For Fund compliance purposes, the Fund may not use the same classification system shown in this report as these classifications are used for reporting ease. |
| ^ | At April 30, 2015, the cost of securities for federal income tax purposes was $3,086,991,775 and the aggregate gross unrealized appreciation and depreciation based on that cost were: |
| | | | |
Unrealized Appreciation | | $ | 769,783,488 | |
Unrealized Depreciation | | | (15,005,305 | ) |
| | | | |
Net Unrealized Appreciation | | $ | 754,778,183 | |
| | | | |
| * | See Significant Accounting Policies of accompanying Notes to Financial Statements regarding valuation of securities. |
| | |
| GLOSSARY: (abbreviations used in preceding Schedule of Investments) |
|
| Other Abbreviations: |
ADR | | American Depositary Receipt |
The accompanying notes are an integral part of these financial statements.
|
| The Hartford Equity Income Fund |
Schedule of Investments – (continued)
April 30, 2015 (Unaudited)
Fair Valuation Summary
The following is a summary of the fair valuations according to the inputs used as of April 30, 2015 in valuing the Fund’s investments.
| | | | | | | | | | | | | | | | |
| | | Total | | | Level 1(1) | | | Level 2(1) | | | Level 3 | |
Assets | | | | | | | | | | | | | | | | |
Common Stocks | | | | | | | | | | | | | | | | |
Banks | | $ | 512,568,573 | | | $ | 512,568,573 | | | $ | — | | | $ | — | |
Capital Goods | | | 446,949,939 | | | | 418,514,759 | | | | 28,435,180 | | | | — | |
Commercial & Professional Services | | | 25,678,829 | | | | 25,678,829 | | | | — | | | | — | |
Consumer Services | | | 33,893,878 | | | | 33,893,878 | | | | — | | | | — | |
Diversified Financials | | | 132,624,411 | | | | 132,624,411 | | | | — | | | | — | |
Energy | | | 452,806,647 | | | | 435,930,965 | | | | 16,875,682 | | | | — | |
Food & Staples Retailing | | | 27,066,179 | | | | 27,066,179 | | | | — | | | | — | |
Food, Beverage & Tobacco | | | 246,639,628 | | | | 208,392,634 | | | | 38,246,994 | | | | — | |
Health Care Equipment & Services | | | 29,477,087 | | | | 29,477,087 | | | | — | | | | — | |
Household & Personal Products | | | 33,299,186 | | | | 33,299,186 | | | | — | | | | — | |
Insurance | | | 271,824,400 | | | | 271,824,400 | | | | — | | | | — | |
Materials | | | 61,648,723 | | | | 61,648,723 | | | | — | | | | — | |
Media | | | 35,219,420 | | | | 35,219,420 | | | | — | | | | — | |
Pharmaceuticals, Biotechnology & Life Sciences | | | 493,989,069 | | | | 431,201,015 | | | | 62,788,054 | | | | — | |
Retailing | | | 122,166,881 | | | | 122,166,881 | | | | — | | | | — | |
Semiconductors & Semiconductor Equipment | | | 210,603,322 | | | | 210,603,322 | | | | — | | | | — | |
Software & Services | | | 168,393,213 | | | | 168,393,213 | | | | — | | | | — | |
Technology Hardware & Equipment | | | 99,774,287 | | | | 99,774,287 | | | | — | | | | — | |
Telecommunication Services | | | 133,025,503 | | | | 133,025,503 | | | | — | | | | — | |
Transportation | | | 33,664,481 | | | | 33,664,481 | | | | — | | | | — | |
Utilities | | | 245,307,912 | | | | 193,814,619 | | | | 51,493,293 | | | | — | |
Short-Term Investments | | | 25,148,390 | | | | 25,148,390 | | | | — | | | | — | |
| | | | | | | | | | | | | | | | |
Total | | $ | 3,841,769,958 | | | $ | 3,643,930,755 | | | $ | 197,839,203 | | | $ | — | |
| | | | | | | | | | | | | | | | |
| (1) | For the six-month period ended April 30, 2015, there were no transfers between Level 1 and Level 2. |
| Note: | For purposes of reporting transfers between different hierarchy levels, both transfers in and out of each level, as applicable, are shown as if they occurred at the beginning of the period. |
The accompanying notes are an integral part of these financial statements.
|
| The Hartford Growth Opportunities Fund |
Diversification by Sector
as of April 30, 2015 (Unaudited)
| | | | |
| Sector | | Percentage of
Net Assets | |
Equity Securities | | | | |
Consumer Discretionary | | | 20.1 | % |
Consumer Staples | | | 2.0 | |
Financials | | | 7.6 | |
Health Care | | | 21.2 | |
Industrials | | | 12.6 | |
Information Technology | | | 32.1 | |
Materials | | | 1.9 | |
| | | | |
Total | | | 97.5 | % |
| | | | |
Short-Term Investments | | | 2.7 | % |
Other Assets & Liabilities | | | (0.2 | ) |
| | | | |
Total | | | 100.0 | % |
| | | | |
A sector may be comprised of several industries. For Fund compliance purposes, the Fund may not use the same classification system and these sector classifications are used for reporting ease.
The accompanying notes are an integral part of these financial statements.
|
| The Hartford Growth Opportunities Fund |
Schedule of Investments
April 30, 2015 (Unaudited)
| | | | | | | | |
Shares or Principal Amount | | Market Value* | |
| COMMON STOCKS - 90.6% | |
| | | | Automobiles & Components - 0.8% | |
| | 159,361 | | | Tesla Motors, Inc.(1) | | $ | 36,023,554 | |
| | | | | | | | |
| | | | Capital Goods - 8.8% | |
| | 299,579 | | | Acuity Brands, Inc. | | | 50,014,714 | |
| | 1,426,997 | | | AECOM(1) | | | 45,036,025 | |
| | 586,922 | | | AMETEK, Inc. | | | 30,766,451 | |
| | 783,808 | | | Danaher Corp. | | | 64,178,199 | |
| | 889,699 | | | DigitalGlobe, Inc.(1) | | | 28,621,617 | |
| | 1,169,953 | | | Fortune Brands Home & Security, Inc. | | | 52,179,904 | |
| | 1,149,068 | | | HD Supply Holdings, Inc.(1) | | | 37,919,244 | |
| | 4,106,956 | | | Lithium Technology Corp.(1)(2)(3) | | | 21,274,032 | |
| | 1,028,999 | | | Textron, Inc. | | | 45,255,376 | |
| | | | | | | | |
| | | | | | | 375,245,562 | |
| | | | | | | | |
| | | | Commercial & Professional Services - 0.9% | |
| | 320,387 | | | IHS, Inc. Class A(1) | | | 40,198,957 | |
| | | | | | | | |
| | | | Consumer Durables & Apparel - 3.5% | |
| | 645,953 | | | GoPro, Inc. Class A(1) | | | 32,349,326 | |
| | 290,399 | | | Harman International Industries, Inc. | | | 37,862,221 | |
| | 10,719,360 | | | Samsonite International S.A. | | | 39,095,307 | |
| | 216,313 | | | Whirlpool Corp. | | | 37,984,563 | |
| | | | | | | | |
| | | | | | | 147,291,417 | |
| | | | | | | | |
| | | | Consumer Services - 5.4% | |
| | 59,390 | | | Chipotle Mexican Grill, Inc.(1) | | | 36,901,383 | |
| | 1,789,709 | | | Diamond Resorts International, Inc.(1) | | | 57,288,585 | |
| | 1,389,258 | | | Hilton Worldwide Holdings, Inc.(1) | | | 40,232,912 | |
| | 1,124,786 | | | Starbucks Corp. | | | 55,766,890 | |
| | 438,134 | | | Wyndham Worldwide Corp. | | | 37,416,643 | |
| | | | | | | | |
| | | | | | | 227,606,413 | |
| | | | | | | | |
| | | | Diversified Financials - 3.5% | |
| | 142,669 | | | BlackRock, Inc. | | | 51,922,956 | |
| | 1,478,828 | | | Nomad Holdings Ltd.(1)(2)(3) | | | 26,618,904 | |
| | 562,643 | | | Northern Trust Corp. | | | 41,157,336 | |
| | 1,046,579 | | | Platform Specialty Products Corp.(1) | | | 28,194,838 | |
| | | | | | | | |
| | | | | | | 147,894,034 | |
| | | | | | | | |
| | | | Energy - 0.0% | |
| | 2,187,900 | | | Malakoff Corp. Bhd(1) | | | 1,105,776 | |
| | | | | | | | |
| | | | Food & Staples Retailing - 1.0% | |
| | 894,998 | | | Whole Foods Market, Inc. | | | 42,745,104 | |
| | | | | | | | |
| | | | Food, Beverage & Tobacco - 1.0% | |
| | 315,935 | | | Monster Beverage Corp.(1) | | | 43,317,848 | |
| | | | | | | | |
| | | | Health Care Equipment & Services - 6.5% | |
| | 394,697 | | | Becton Dickinson and Co. | | | 55,600,966 | |
| | 2,929,630 | | | Boston Scientific Corp.(1) | | | 52,206,007 | |
| | 474,373 | | | Cerner Corp.(1) | | | 34,064,725 | |
| | 268,000 | | | DexCom, Inc.(1) | | | 18,108,760 | |
| | 951,752 | | | Envision Healthcare Holdings, Inc.(1) | | | 36,128,506 | |
| | 1,185,474 | | | Hologic, Inc.(1) | | | 39,997,893 | |
| | 78,651 | | | Intuitive Surgical, Inc.(1) | | | 39,009,323 | |
| | | | | | | | |
| | | | | | | 275,116,180 | |
| | | | | | | | |
| | | | Insurance - 1.2% | |
| | 936,694 | | | American International Group, Inc. | | | 52,726,505 | |
| | | | | | | | |
| | | | Materials - 1.9% | |
| | 299,396 | | | Martin Marietta Materials, Inc. | | | 42,708,839 | |
| | 1,362,604 | | | Platform Specialty Products Corp.(1) | | | 36,708,552 | |
| | | | | | | | |
| | | | | | | 79,417,391 | |
| | | | | | | | |
| | | | | | | | |
Shares or Principal Amount | | Market Value* | |
| COMMON STOCKS - 90.6% - (continued) | |
| | | | Media - 1.2% | |
| | 1,556,987 | | | Twenty-First Century Fox, Inc. Class A | | $ | 53,062,117 | |
| | | | | | | | |
| | | | Pharmaceuticals, Biotechnology & Life Sciences - 14.7% | |
| | 282,695 | | | Actavis plc(1) | | | 79,963,108 | |
| | 146,122 | | | Alnylam Pharmaceuticals, Inc.(1) | | | 14,885,448 | |
| | 581,415 | | | AstraZeneca plc | | | 39,900,529 | |
| | 123,028 | | | Biogen, Inc.(1) | | | 46,003,860 | |
| | 37,500 | | | Blueprint Medicines Corp.(1) | | | 707,625 | |
| | 2,289,002 | | | Bristol-Myers Squibb Co. | | | 145,878,097 | |
| | 286,814 | | | Celgene Corp.(1) | | | 30,993,121 | |
| | 345,900 | | | Eisai Co., Ltd. | | | 23,056,792 | |
| | 216,136 | | | Incyte Corp.(1) | | | 20,999,774 | |
| | 811,440 | | | Merck & Co., Inc. | | | 48,329,366 | |
| | 1,209,702 | | | Mylan N.V.(1) | | | 87,413,067 | |
| | 387,593 | | | Novartis AG | | | 39,562,438 | |
| | 102,798 | | | Regeneron Pharmaceuticals, Inc.(1) | | | 47,025,973 | |
| | | | | | | | |
| | | | | | | 624,719,198 | |
| | | | | | | | |
| | | | Real Estate - 2.6% | |
| | 616,471 | | | American Tower Corp. REIT | | | 58,275,004 | |
| | 1,292,144 | | | CBRE Group, Inc. Class A(1) | | | 49,540,801 | |
| | 81,341 | | | WeWork Companies, Inc. Class A(1)(2)(3) | | | 1,218,976 | |
| | | | | | | | |
| | | | | | | 109,034,781 | |
| | | | | | | | |
| | | | Retailing - 7.5% | |
| | 405,402 | | | Advance Auto Parts, Inc. | | | 57,972,486 | |
| | 365,406 | | | Amazon.com, Inc.(1) | | | 154,120,943 | |
| | 123,196 | | | JAND Inc. Class A(1)(2)(3) | | | 1,273,449 | |
| | 532,146 | | | Lowe’s Cos., Inc. | | | 36,643,573 | |
| | 121,024 | | | Netflix, Inc.(1) | | | 67,349,856 | |
| | | | | | | | |
| | | | | | | 317,360,307 | |
| | | | | | | | |
| | | | Semiconductors & Semiconductor Equipment - 1.1% | |
| | 492,238 | | | NXP Semiconductors N.V.(1) | | | 47,313,916 | |
| | | | | | | | |
| | | | Software & Services - 17.2% | |
| | 898,044 | | | Akamai Technologies, Inc.(1) | | | 66,257,686 | |
| | 544,856 | | | Alibaba Group Holding Ltd. ADR(1) | | | 44,291,344 | |
| | 131,500 | | | Apigee Corp.(1) | | | 1,902,805 | |
| | 183,109 | | | Baidu, Inc. ADR(1) | | | 36,673,071 | |
| | 837,484 | | | Cognizant Technology Solutions Corp. Class A(1) | | | 49,026,314 | |
| | 297,216 | | | CoStar Group, Inc.(1) | | | 60,759,867 | |
| | 1,483,844 | | | Facebook, Inc. Class A(1) | | | 116,882,392 | |
| | 64,100 | | | GoDaddy, Inc. Class A(1) | | | 1,606,987 | |
| | 175,499 | | | Google, Inc. Class A(1) | | | 96,308,586 | |
| | 98,622 | | | Google, Inc. Class C(1) | | | 52,993,533 | |
| | 974,377 | | | Mobileye N.V.(1) | | | 43,710,552 | |
| | 1,565,700 | | | Tencent Holdings Ltd. | | | 32,314,279 | |
| | 836,815 | | | Workday, Inc. Class A(1) | | | 76,325,896 | |
| | 513,497 | | | Zillow Group, Inc. Class A(1) | | | 50,137,847 | |
| | | | | | | | |
| | | | | | | 729,191,159 | |
| | | | | | | | |
| | | | Technology Hardware & Equipment - 9.1% | |
| | 1,970,170 | | | Apple, Inc. | | | 246,566,776 | |
| | 629,909 | | | Arista Networks, Inc.(1) | | | 40,320,475 | |
| | 1,427,817 | | | CDW Corp. of Delaware | | | 54,713,947 | |
| | 669,176 | | | TE Connectivity Ltd. | | | 44,533,663 | |
| | | | | | | | |
| | | | | | | 386,134,861 | |
| | | | | | | | |
| | | | Transportation - 2.7% | |
| | 393,249 | | | Genesee & Wyoming, Inc. Class A(1) | | | 36,552,495 | |
| | 365,443 | | | Kansas City Southern | | | 37,454,253 | |
The accompanying notes are an integral part of these financial statements.
|
| The Hartford Growth Opportunities Fund |
Schedule of Investments – (continued)
April 30, 2015 (Unaudited)
| | | | | | | | |
Shares or Principal Amount | | Market Value* | |
| COMMON STOCKS - 90.6% - (continued) | |
| | | | Transportation - 2.7% - (continued) | |
| | 421,727 | | | United Parcel Service, Inc. Class B | | $ | 42,396,215 | |
| | | | | | | | |
| | | | | | | 116,402,963 | |
| | | | | | | | |
| | |
| | | | Total Common Stocks
(cost $3,317,671,883) | | $ | 3,851,908,043 | |
| | | | | | | | |
|
| PREFERRED STOCKS - 6.6% | |
| | | | Consumer Durables & Apparel - 0.3% | |
| | 923,832 | | | One Kings Lane, Inc.(1)(2)(3) | | $ | 13,099,938 | |
| | | | | | | | |
| | | | Consumer Services - 0.1% | |
| | 2,428,921 | | | Draftkings, Inc.(1)(2)(3) | | | 3,937,655 | |
| | | | | | | | |
| | | | Real Estate - 0.4% | |
| | 2,437,006 | | | Redfin Corp. Series G(1)(2)(3) | | | 7,232,863 | |
| | 404,267 | | | WeWork Companies, Inc. Class D-1(1)(2)(3) | | | 6,058,363 | |
| | 317,638 | | | WeWork Companies, Inc. Class D-2(1)(2)(3) | | | 4,760,137 | |
| | | | | | | | |
| | | | | | | 18,051,363 | |
| | | | | | | | |
| | | | Retailing - 1.2% | |
| | 443,446 | | | Forward Ventures LLC(1)(2)(3) | | | 17,888,612 | |
| | 116,585 | | | Honest Co.(1)(2)(3) | | | 2,993,903 | |
| | 275,096 | | | JAND Inc. Series D(1)(2)(3) | | | 2,843,604 | |
| | 418,006 | | | Tory Burch LLC(1)(2)(3) | | | 28,018,931 | |
| | | | | | | | |
| | | | | | | 51,745,050 | |
| | | | | | | | |
| | | | Software & Services - 4.1% | |
| | 454,126 | | | Apigee Corp. PIPE(1)(2)(3) | | | 5,935,987 | |
| | 1,526,069 | | | Birst, Inc. Series F(1)(2)(3) | | | 8,022,240 | |
| | 387,642 | | | Cloudera, Inc.(1)(2)(3) | | | 11,512,967 | |
| | 5,668,755 | | | Essence Holding Group(1)(2)(3) | | | 10,090,384 | |
| | 743,470 | | | Lookout, Inc. Series F(1)(2)(3) | | | 7,642,872 | |
| | 1,078,374 | | | MarkLogic Corp. Series F(1)(2)(3) | | | 11,272,006 | |
| | 158,587 | | | New Relic, Inc. PIPE Series A(1)(2)(3) | | | 5,035,129 | |
| | 610,175 | | | Nutanix, Inc.(1)(2)(3) | | | 10,855,013 | |
| | 282,178 | | | Pinterest, Inc. Series G(1)(2)(3) | | | 9,116,018 | |
| | 2,311,920 | | | Uber Technologies, Inc.(1)(2)(3) | | | 69,324,817 | |
| | 566,228 | | | Veracode, Inc.(1)(2)(3) | | | 16,126,173 | |
| | 3,194,823 | | | Zuora, Inc. Series F(1)(2)(3) | | | 10,924,282 | |
| | | | | | | | |
| | | | | | | 175,857,888 | |
| | | | | | | | |
| | | | Technology Hardware & Equipment - 0.3% | |
| | 654,892 | | | Pure Storage, Inc.(1)(2)(3) | | | 10,805,718 | |
| | | | | | | | |
| | | | Telecommunication Services - 0.2% | |
| | 19,187 | | | DocuSign, Inc. Series B(1)(2)(3) | | | 366,339 | |
| | 5,747 | | | DocuSign, Inc. Series B-1(1)(2)(3) | | | 109,728 | |
| | 13,788 | | | DocuSign, Inc. Series D(1)(2)(3) | | | 263,256 | |
| | 356,583 | | | DocuSign, Inc. Series E(1)(2)(3) | | | 6,808,275 | |
| | 74,347 | | | DocuSign, Inc. Series F(1)(2)(3) | | | 1,419,515 | |
| | | | | | | | |
| | | | | | | 8,967,113 | |
| | | | | | | | |
| | |
| | | | Total Preferred Stocks
(cost $243,957,797) | | $ | 282,464,725 | |
| | | | | | | | |
|
| CONVERTIBLE PREFERRED STOCKS - 0.2% | |
| | | | Retailing - 0.2% | |
| | 272,032 | | | Honest Co. Series C(1)(2)(3) | | $ | 6,985,782 | |
| | | | | | | | |
| | |
| | | | Total Convertible Preferred Stocks
(cost $7,360,451) | | $ | 6,985,782 | |
| | | | | | | | |
| | | | | | | | |
Shares or Principal Amount | | Market Value* | |
| WARRANTS - 0.1% | |
| | | | Diversified Financials - 0.1% | | | |
| | 1,484,000 | | | Nomad Holdings Ltd.(1)(2)(3) | | $ | 3,710,000 | |
| | | | | | | | |
| | |
| | | | Total Warrants
(cost $14,840) | | $ | 3,710,000 | |
| | | | | | | | |
| | |
| | | | Total Long-Term Investments
(cost $3,569,004,971) | | $ | 4,145,068,550 | |
| | | | | | | | |
|
| SHORT-TERM INVESTMENTS - 2.7% | |
| | | | Other Investment Pools & Funds - 2.7% | |
| | 115,804,583 | | | Federated Prime Obligations Fund | | $ | 115,804,583 | |
| | | | | | | | |
| | |
| | | | Total Short-Term Investments
(cost $115,804,583) | | $ | 115,804,583 | |
| | | | | | | | |
| | | | | | | | | | |
| | | |
| | Total Investments
(cost $3,684,809,554)^ | | | 100.2 | % | | $ | 4,260,873,133 | |
| | Other Assets and Liabilities | | | (0.2 | )% | | | (9,857,847 | ) |
| | | | | | | | | | |
| | Total Net Assets | | | 100.0 | % | | $ | 4,251,015,286 | |
| | | | | | | | | | |
The accompanying notes are an integral part of these financial statements.
|
| The Hartford Growth Opportunities Fund |
Schedule of Investments – (continued)
April 30, 2015 (Unaudited)
| Note: | Percentage of investments as shown is the ratio of the total market value to total net assets. |
| | Prices of foreign equities that are principally traded on certain foreign markets may be adjusted daily pursuant to a fair value pricing service approved by the Board of Directors in order to reflect an adjustment for factors occurring after the close of certain foreign markets but before the close of the New York Stock Exchange. |
| | Equity industry classifications used in this report are the Global Industry Classification Standard, which was developed by and is the exclusive property and service mark of MSCI, Inc. and Standard & Poor’s. |
| | For Fund compliance purposes, the Fund may not use the same classification system shown in this report as these classifications are used for reporting ease. |
| ^ | At April 30, 2015, the cost of securities for federal income tax purposes was $3,685,798,886 and the aggregate gross unrealized appreciation and depreciation based on that cost were: |
| | | | |
Unrealized Appreciation | | $ | 642,572,166 | |
Unrealized Depreciation | | | (67,497,919 | ) |
| | | | |
Net Unrealized Appreciation | | $ | 575,074,247 | |
| | | | |
| (1) | Non-income producing. |
| (2) | These securities are valued in good faith at fair value as determined under policies and procedures established by and under the supervision of the Board of Directors. At April 30, 2015, the aggregate fair value of these securities were $343,545,868, which represents 8.0% of total net assets. This amount excludes securities that are principally traded in certain foreign markets and whose prices are adjusted pursuant to a third party pricing service methodology approved by the Board of Directors. |
| (3) | The following securities are considered illiquid. Illiquid securities are often purchased in private placement transactions, are often not registered under the Securities Act of 1933, as amended, and may have contractual restrictions on resale. A security may also be considered illiquid if the security lacks a readily available market or if its valuation has not changed for a certain period of time. |
| | | | | | | | | | |
Period
Acquired | | Shares/Par | | | Security | | Cost | |
04/2014 | | | 454,126 | | | Apigee Corp. PIPE Preferred | | $ | 9,689,753 | |
03/2015 | | | 1,526,069 | | | Birst, Inc. Series F Preferred | | | 8,913,617 | |
02/2014 | | | 387,642 | | | Cloudera, Inc. Preferred | | | 5,644,068 | |
02/2014 | | | 19,187 | | | DocuSign, Inc. Series B Preferred | | | 251,971 | |
02/2014 | | | 5,747 | | | DocuSign, Inc. Series B-1 Preferred | | | 75,472 | |
02/2014 | | | 13,788 | | | DocuSign, Inc. Series D Preferred | | | 181,069 | |
02/2014 | | | 356,583 | | | DocuSign, Inc. Series E Preferred | | | 4,682,791 | |
04/2015 | | | 74,347 | | | DocuSign, Inc. Series F Preferred | | | 1,419,515 | |
02/2014 | | | 2,428,921 | | | Draftkings, Inc. Preferred | | | 4,375,172 | |
05/2014 | | | 5,668,755 | | | Essence Holding Group Preferred | | | 8,964,002 | |
11/2014 | | | 443,446 | | | Forward Ventures LLC Preferred | | | 13,805,011 | |
08/2014 | | | 116,585 | | | Honest Co. Preferred | | | 3,154,475 | |
08/2014 | | | 272,032 | | | Honest Co. Series C Convertible Preferred | | | 7,360,451 | |
04/2015 | | | 123,196 | | | JAND Inc. | | | 1,414,943 | |
04/2015 | | | 275,096 | | | JAND Inc. Series D Preferred | | | 3,159,560 | |
08/2013 | | | 4,106,956 | | | Lithium Technology Corp. | | | 20,017,304 | |
07/2014 | | | 743,470 | | | Lookout, Inc. Series F Preferred | | | 8,492,732 | |
04/2015 | | | 1,078,374 | | | MarkLogic Corp. Series F Preferred | | | 12,524,451 | |
04/2014 | | | 158,587 | | | New Relic, Inc. PIPE Series A Preferred | | | 4,501,696 | |
04/2014 | | | 1,478,828 | | | Nomad Holdings Ltd. | | | 14,773,492 | |
04/2014 | | | 1,484,000 | | | Nomad Holdings Ltd. Warrants | | | 14,840 | |
08/2014 | | | 610,175 | | | Nutanix, Inc. Preferred | | | 8,174,209 | |
01/2014 | | | 923,832 | | | One Kings Lane, Inc. Preferred | | | 14,242,718 | |
03/2015 | | | 282,178 | | | Pinterest, Inc. Series G Preferred | | | 10,128,909 | |
04/2014 | | | 654,892 | | | Pure Storage, Inc. Preferred | | | 10,298,766 | |
12/2014 | | | 2,437,006 | | | Redfin Corp. Series G Preferred | | | 8,036,515 | |
11/2013 | | | 418,006 | | | Tory Burch LLC Preferred | | | 32,761,838 | |
06/2014 | | | 2,311,920 | | | Uber Technologies, Inc. Preferred | | | 35,864,931 | |
08/2014 | | | 566,228 | | | Veracode, Inc. Preferred | | | 10,455,910 | |
12/2014 | | | 81,341 | | | WeWork Companies, Inc. | | | 1,354,422 | |
12/2014 | | | 404,267 | | | WeWork Companies, Inc. Class D-1 Preferred | | | 6,731,514 | |
12/2014 | | | 317,638 | | | WeWork Companies, Inc. Class D-2 Preferred | | | 5,289,041 | |
01/2015 | | | 3,194,823 | | | Zuora, Inc. Series F Preferred | | | 12,138,091 | |
| | | | | | | | | | |
| | | | | | | | $ | 288,893,249 | |
| | | | | | | | | | |
At April 30, 2015, the aggregate value of these securities were $343,545,868, which represents 8.0% of total net assets.
The accompanying notes are an integral part of these financial statements.
|
| The Hartford Growth Opportunities Fund |
Schedule of Investments – (continued)
April 30, 2015 (Unaudited)
| | | | | | | | | | | | | | | | | | | | |
| Foreign Currency Contracts Outstanding at April 30, 2015 | |
Currency | | Buy/Sell | | Delivery
Date | | | Counterparty | | Contract
Amount | | | Market Value* | | | Unrealized
Appreciation/
(Depreciation) | |
JPY | | Sell | | | 05/01/15 | | | DEUT | | $ | 986,520 | | | $ | 984,688 | | | $ | 1,832 | |
JPY | | Sell | | | 05/07/15 | | | HSBC | | | 1,530,342 | | | | 1,526,075 | | | | 4,267 | |
| | | | | | | | | | | | | | | | | | | | |
Total | | | | | | | | | | | | | | | | | | $ | 6,099 | |
| | | | | | | | | | | | | | | | | | | | |
| * | See Significant Accounting Policies of accompanying Notes to Financial Statements regarding valuation of securities. |
| | |
| GLOSSARY: (abbreviations used in preceding Schedule of Investments) |
|
| Counterparty Abbreviations: |
DEUT | | Deutsche Bank Securities, Inc. |
HSBC | | HSBC Bank USA |
|
| Currency Abbreviations: |
JPY | | Japanese Yen |
|
| Other Abbreviations: |
ADR | | American Depositary Receipt |
PIPE | | Private Investment in Public Equity |
REIT | | Real Estate Investment Trust |
The accompanying notes are an integral part of these financial statements.
|
| The Hartford Growth Opportunities Fund |
Schedule of Investments – (continued)
April 30, 2015 (Unaudited)
Fair Valuation Summary
The following is a summary of the fair valuations according to the inputs used as of April 30, 2015 in valuing the Fund’s investments.
| | | | | | | | | | | | | | | | |
| | | Total | | | Level 1(1) | | | Level 2(1) | | | Level 3 | |
Assets | | | | | | | | | | | | | | | | |
Common Stocks | | | | | | | | | | | | | | | | |
Automobiles & Components | | $ | 36,023,554 | | | $ | 36,023,554 | | | $ | — | | | $ | — | |
Capital Goods | | | 375,245,562 | | | | 353,971,530 | | | | — | | | | 21,274,032 | |
Commercial & Professional Services | | | 40,198,957 | | | | 40,198,957 | | | | — | | | | — | |
Consumer Durables & Apparel | | | 147,291,417 | | | | 108,196,110 | | | | 39,095,307 | | | | — | |
Consumer Services | | | 227,606,413 | | | | 227,606,413 | | | | — | | | | — | |
Diversified Financials | | | 147,894,034 | | | | 93,080,292 | | | | 28,194,838 | | | | 26,618,904 | |
Energy | | | 1,105,776 | | | | 1,105,776 | | | | — | | | | — | |
Food & Staples Retailing | | | 42,745,104 | | | | 42,745,104 | | | | — | | | | — | |
Food, Beverage & Tobacco | | | 43,317,848 | | | | 43,317,848 | | | | — | | | | — | |
Health Care Equipment & Services | | | 275,116,180 | | | | 275,116,180 | | | | — | | | | — | |
Insurance | | | 52,726,505 | | | | 52,726,505 | | | | — | | | | — | |
Materials | | | 79,417,391 | | | | 79,417,391 | | | | — | | | | — | |
Media | | | 53,062,117 | | | | 53,062,117 | | | | — | | | | — | |
Pharmaceuticals, Biotechnology & Life Sciences | | | 624,719,198 | | | | 522,199,439 | | | | 102,519,759 | | | | — | |
Real Estate | | | 109,034,781 | | | | 107,815,805 | | | | — | | | | 1,218,976 | |
Retailing | | | 317,360,307 | | | | 316,086,858 | | | | — | | | | 1,273,449 | |
Semiconductors & Semiconductor Equipment | | | 47,313,916 | | | | 47,313,916 | | | | — | | | | — | |
Software & Services | | | 729,191,159 | | | | 696,876,880 | | | | 32,314,279 | | | | — | |
Technology Hardware & Equipment | | | 386,134,861 | | | | 386,134,861 | | | | — | | | | — | |
Transportation | | | 116,402,963 | | | | 116,402,963 | | | | — | | | | — | |
Preferred Stocks | | | 282,464,725 | | | | — | | | | — | | | | 282,464,725 | |
Convertible Preferred Stocks | | | 6,985,782 | | | | — | | | | — | | | | 6,985,782 | |
Warrants | | | 3,710,000 | | | | — | | | | — | | | | 3,710,000 | |
Short-Term Investments | | | 115,804,583 | | | | 115,804,583 | | | | — | | | | — | |
| | | | | | | | | | | | | | | | |
Total | | $ | 4,260,873,133 | | | $ | 3,715,203,082 | | | $ | 202,124,183 | | | $ | 343,545,868 | |
| | | | | | | | | | | | | | | | |
Foreign Currency Contracts(2) | | $ | 6,099 | | | $ | — | | | $ | 6,099 | | | $ | — | |
| | | | | | | | | | | | | | | | |
Total | | $ | 6,099 | | | $ | — | | | $ | 6,099 | | | $ | — | |
| | | | | | | | | | | | | | | | |
| (1) | For the six-month period ended April 30, 2015, there were no transfers between Level 1 and Level 2. |
| (2) | Derivative instruments (excluding purchased and written options, if applicable) are valued at the unrealized appreciation/depreciation on the investments. |
The following is a rollforward of the Fund’s investments that were valued using unobservable inputs (Level 3) for the six-month period ended April 30, 2015:
| | | | | | | | | | | | | | | | | | | | |
| | | Common Stocks | | | Convertible
Preferred Stock | | | Preferred
Stock | | | Warrants | | | Total | |
Beginning balance | | $ | 49,120,034 | | | $ | 6,624,406 | | | $ | 162,484,112 | | | $ | — | | | $ | 218,228,552 | |
Purchases | | | 7,439,903 | | | | — | | | | 86,521,396 | | | | — | | | | 93,961,299 | |
Sales | | | — | | | | — | | | | (24,404,568 | ) | | | — | | | | (24,404,568 | ) |
Accrued discounts/(premiums) | | | — | | | | — | | | | — | | | | — | | | | — | |
Total realized gain/(loss) | | | — | | | | — | | | | 9,911,883 | | | | — | | | | 9,911,883 | |
Net change in unrealized appreciation/depreciation | | | 10,273,314 | | | | 361,376 | | | | 47,951,902 | | | | 3,227,700 | | | | 61,814,292 | |
Transfers into Level 3(1) | | | 15,165,372 | | | | — | | | | — | | | | 482,300 | | | | 15,647,672 | |
Transfers out of Level 3(1) | | | (31,613,262 | ) | | | — | | | | — | | | | — | | | | (31,613,262 | ) |
| | | | | | | | | | | | | | | | | | | | |
Ending balance | | $ | 50,385,361 | | | $ | 6,985,782 | | | $ | 282,464,725 | | | $ | 3,710,000 | | | $ | 343,545,868 | |
The change in net unrealized appreciation/depreciation relating to the Level 3 investment held at April 30, 2015 was $62,519,446.
| (1) | Investments are transferred into and out of Level 3 for a variety of reasons including, but not limited to: |
| | a) | Investments where trading has been halted (transfer into Level 3) or investments where trading has resumed (transfer out of Level 3). |
| | b) | Broker quoted investments (transfer into Level 3) or quoted prices in active markets (transfer out of Level 3). |
| | c) | Investments that have certain restrictions on trading (transfer into level 3) or investments where trading restrictions have expired (transfer out of Level 3). |
| Note: | For purposes of reporting transfers between different hierarchy levels, both transfers in and out of each level, as applicable, are shown as if they occurred at the beginning of the period. |
The accompanying notes are an integral part of these financial statements.
|
| The Hartford Healthcare Fund |
Diversification by Sector
as of April 30, 2015 (Unaudited)
| | | | |
| Sector | | Percentage of
Net Assets | |
Equity Securities | | | | |
Consumer Staples | | | 3.2 | % |
Health Care | | | 91.4 | |
Information Technology | | | 0.2 | |
| | | | |
Total | | | 94.8 | % |
| | | | |
Short-Term Investments | | | 6.4 | % |
Other Assets & Liabilities | | | (1.2 | ) |
| | | | |
Total | | | 100.0 | % |
| | | | |
A sector may be comprised of several industries. For Fund compliance purposes, the Fund may not use the same classification system and these sector classifications are used for reporting ease.
The accompanying notes are an integral part of these financial statements.
|
| The Hartford Healthcare Fund |
Schedule of Investments
April 30, 2015 (Unaudited)
| | | | | | | | |
Shares or Principal Amount | | Market Value* | |
| COMMON STOCKS - 94.8% | |
| | | | Biotechnology - 25.3% | |
| | 624,320 | | | Achillion Pharmaceuticals, Inc.(1) | | $ | 5,462,800 | |
| | 111,030 | | | Acorda Therapeutics, Inc.(1) | | | 3,338,672 | |
| | 489,901 | | | Alkermes plc(1) | | | 27,125,818 | |
| | 162,160 | | | Alnylam Pharmaceuticals, Inc.(1) | | | 16,519,239 | |
| | 250,691 | | | Anacor Pharmaceuticals, Inc.(1) | | | 13,208,909 | |
| | 1,939,700 | | | Arena Pharmaceuticals, Inc.(1) | | | 8,457,092 | |
| | 728,296 | | | BioCryst Pharmaceuticals, Inc.(1) | | | 6,765,870 | |
| | 26,753 | | | Biogen, Inc.(1) | | | 10,003,749 | |
| | 11,900 | | | Blueprint Medicines Corp.(1) | | | 224,553 | |
| | 13,820 | | | Cellectis S.A. ADR(1) | | | 454,678 | |
| | 227,680 | | | Cepheid(1) | | | 12,772,848 | |
| | 468,843 | | | Dicerna Pharmaceuticals, Inc.(1) | | | 9,409,679 | |
| | 239,620 | | | Five Prime Therapeutics, Inc.(1) | | | 4,806,777 | |
| | 14,743 | | | Foundation Medicine, Inc.(1) | | | 670,954 | |
| | 369,384 | | | Galapagos N.V.(1) | | | 15,582,638 | |
| | 638,090 | | | Gilead Sciences, Inc.(1) | | | 64,134,426 | |
| | 386,096 | | | GlycoMimetics, Inc.(1) | | | 3,200,736 | |
| | 225,048 | | | Incyte Corp.(1) | | | 21,865,664 | |
| | 149,005 | | | Innate Pharma S.A.(1) | | | 2,608,461 | |
| | 14,120 | | | Invitae Corp.(1) | | | 154,614 | |
| | 347,610 | | | Ironwood Pharmaceuticals, Inc.(1) | | | 4,748,353 | |
| | 194,799 | | | Otonomy, Inc.(1) | | | 5,111,526 | |
| | 188,080 | | | Portola Pharmaceuticals, Inc.(1) | | | 6,712,575 | |
| | 86,030 | | | PTC Therapeutics, Inc.(1) | | | 5,054,262 | |
| | 88,502 | | | Regeneron Pharmaceuticals, Inc.(1) | | | 40,486,125 | |
| | 417,460 | | | Regulus Therapeutics, Inc.(1) | | | 5,239,123 | |
| | 754,190 | | | Rigel Pharmaceuticals, Inc.(1) | | | 3,212,849 | |
| | 71,284 | | | Seattle Genetics, Inc.(1) | | | 2,447,893 | |
| | 27,190 | | | Synageva BioPharma Corp.(1) | | | 2,500,392 | |
| | 175,290 | | | T2 Biosystems, Inc.(1) | | | 2,711,736 | |
| | 314,433 | | | TESARO, Inc.(1) | | | 17,127,166 | |
| | 397,972 | | | Trevana, Inc.(1) | | | 2,455,487 | |
| | 140,793 | | | Vertex Pharmaceuticals, Inc.(1) | | | 17,356,961 | |
| | | | | | | | |
| | | | | | | 341,932,625 | |
| | | | | | | | |
| | | | Drug Retail - 3.1% | |
| | 247,690 | | | CVS Health Corp. | | | 24,593,140 | |
| | 39,630 | | | Diplomat Pharmacy, Inc.(1) | | | 1,419,547 | |
| | 196,750 | | | Walgreens Boots Alliance, Inc. | | | 16,316,477 | |
| | | | | | | | |
| | | | | | | 42,329,164 | |
| | | | | | | | |
| | | | Health Care Services - 1.1% | |
| | 399,746 | | | Envision Healthcare Holdings, Inc.(1) | | | 15,174,358 | |
| | | | | | | | |
| | | | Health Care Distributors - 5.1% | |
| | 280,910 | | | Cardinal Health, Inc. | | | 23,691,949 | |
| | 202,570 | | | McKesson Corp. | | | 45,254,138 | |
| | | | | | | | |
| | | | | | | 68,946,087 | |
| | | | | | | | |
| | | | Health Care Equipment - 18.1% | |
| | 438,130 | | | Abbott Laboratories | | | 20,337,995 | |
| | 288,550 | | | AtriCure, Inc.(1) | | | 6,350,985 | |
| | 82,890 | | | Becton Dickinson and Co. | | | 11,676,714 | |
| | 1,640,590 | | | Boston Scientific Corp.(1) | | | 29,235,314 | |
| | 278,585 | | | Globus Medical, Inc. Class A(1) | | | 6,655,396 | |
| | 86,525 | | | HeartWare International, Inc.(1) | | | 6,550,808 | |
| | 580,580 | | | K2M Group Holdings, Inc.(1) | | | 12,197,986 | |
| | 893,709 | | | Medtronic plc | | | 66,536,635 | |
| | 381,972 | | | St. Jude Medical, Inc. | | | 26,757,138 | |
| | 228,700 | | | Stryker Corp. | | | 21,095,288 | |
| | 80,932 | | | Teleflex, Inc. | | | 9,951,399 | |
| | 203,873 | | | Tornier N.V.(1) | | | 5,274,194 | |
| | | | | | | | |
Shares or Principal Amount | | Market Value* | |
| COMMON STOCKS - 94.8% - (continued) | |
| | | | Health Care Equipment - 18.1% - (continued) | |
| | 609,237 | | | TriVascular Techonologies, Inc.(1) | | $ | 4,447,430 | |
| | 158,533 | | | Zimmer Holdings, Inc. | | | 17,413,265 | |
| | | | | | | | |
| | | | | | | 244,480,547 | |
| | | | | | | | |
| | | | Health Care Facilities - 5.6% | |
| | 112,730 | | | Acadia Healthcare Co., Inc.(1) | | | 7,722,005 | |
| | 470,061 | | | Al Noor Hospitals Group plc | | | 6,479,460 | |
| | 424,220 | | | HCA Holdings, Inc.(1) | | | 31,396,522 | |
| | 587,058 | | | NMC Health plc | | | 6,866,639 | |
| | 2,751,930 | | | Phoenix Healthcare Group Co., Ltd. | | | 5,678,682 | |
| | 860,320 | | | Spire Healthcare Group plc(1) | | | 4,213,405 | |
| | 107,620 | | | Universal Health Services, Inc. Class B | | | 12,586,159 | |
| | | | | | | | |
| | | | | | | 74,942,872 | |
| | | | | | | | |
| | | | Health Care Supplies - 0.7% | |
| | 117,206 | | | Dentsply International, Inc. | | | 5,977,506 | |
| | 199,610 | | | Endologix, Inc.(1) | | | 3,105,932 | |
| | | | | | | | |
| | | | | | | 9,083,438 | |
| | | | | | | | |
| | | | Health Care Technology - 1.7% | |
| | 347,994 | | | Allscripts Healthcare Solutions, Inc.(1) | | | 4,628,320 | |
| | 74,090 | | | athenahealth, Inc.(1) | | | 9,087,879 | |
| | 203,750 | | | Castlight Health, Inc. Class B(1) | | | 1,534,238 | |
| | 271,240 | | | IMS Health Holdings, Inc.(1) | | | 7,483,512 | |
| | | | | | | | |
| | | | | | | 22,733,949 | |
| | | | | | | | |
| | | | Internet Software & Services - 0.2% | |
| | 255,953 | | | Everyday Health, Inc.(1) | | | 3,137,984 | |
| | | | | | | | |
| | | | Life Sciences Tools & Services - 3.4% | |
| | 166,770 | | | Agilent Technologies, Inc. | | | 6,899,275 | |
| | 40,879 | | | MorphoSys AG(1) | | | 2,941,090 | |
| | 229,470 | | | PRA Health Sciences, Inc.(1) | | | 6,535,306 | |
| | 91,860 | | | Quintiles Transnational Holdings, Inc(1) | | | 6,051,737 | |
| | 126,680 | | | Thermo Fisher Scientific, Inc. | | | 15,921,142 | |
| | 188,850 | | | WuXi PharmaTech Cayman, Inc. ADR(1) | | | 8,152,654 | |
| | | | | | | | |
| | | | | | | 46,501,204 | |
| | | | | | | | |
| | | | Managed Health Care - 6.7% | |
| | 382,360 | | | Aetna, Inc. | | | 40,862,813 | |
| | 239,520 | | | Cigna Corp. | | | 29,853,773 | |
| | 228,800 | | | Qualicorp S.A.(1) | | | 1,883,284 | |
| | 156,620 | | | UnitedHealth Group, Inc. | | | 17,447,468 | |
| | | | | | | | |
| | | | | | | 90,047,338 | |
| | | | | | | | |
| | | | Pharmaceuticals - 23.8% | |
| | 191,500 | | | Actavis plc(1) | | | 54,167,690 | |
| | 398,657 | | | Aerie Pharmaceuticals, Inc.(1) | | | 3,843,053 | |
| | 121,645 | | | Almirall S.A.(1) | | | 2,293,574 | |
| | 292,510 | | | AstraZeneca plc ADR | | | 20,031,085 | |
| | 1,249,050 | | | Bristol-Myers Squibb Co. | | | 79,601,957 | |
| | 332,500 | | | Daiichi Sankyo Co., Ltd. | | | 5,775,088 | |
| | 163,800 | | | Eisai Co., Ltd. | | | 10,918,481 | |
| | 309,250 | | | Eli Lilly & Co. | | | 22,225,798 | |
| | 74,970 | | | Johnson & Johnson | | | 7,437,024 | |
| | 305,017 | | | Medicines Co.(1) | | | 7,811,485 | |
| | 285,140 | | | MediWound Ltd.(1) | | | 1,682,326 | |
| | 340,040 | | | Merck & Co., Inc. | | | 20,252,782 | |
| | 265,720 | | | Mylan N.V.(1) | | | 19,200,927 | |
| | 167,722 | | | Ocular Therapeutix, Inc.(1) | | | 3,681,498 | |
| | 47,500 | | | Ono Pharmaceutical Co., Ltd. | | | 5,148,008 | |
| | 630,000 | | | Shionogi & Co., Ltd. | | | 20,767,743 | |
| | 315,731 | | | Tetraphase Pharmaceuticals, Inc.(1) | | | 11,138,990 | |
The accompanying notes are an integral part of these financial statements.
|
| The Hartford Healthcare Fund |
Schedule of Investments – (continued)
April 30, 2015 (Unaudited)
| | | | | | | | |
Shares or Principal Amount | | Market Value* | |
| COMMON STOCKS - 94.8% - (continued) | |
| | | | Pharmaceuticals - 23.8% - (continued) | |
| | 201,186 | | | Teva Pharmaceutical Industries Ltd. ADR | | $ | 12,155,658 | |
| | 143,314 | | | UCB S.A. | | | 10,323,315 | |
| | 415,531 | | | XenoPort, Inc.(1) | | | 2,464,099 | |
| | | | | | | | |
| | | | | | | 320,920,581 | |
| | | | | | | | |
| | |
| | | | Total Common Stocks
(cost $904,494,087) | | $ | 1,280,230,147 | |
| | | | | | | | |
| | |
| | | | Total Long-Term Investments
(cost $904,494,087) | | $ | 1,280,230,147 | |
| | | | | | | | |
|
| SHORT-TERM INVESTMENTS - 6.4% | |
| | | | Other Investment Pools & Funds - 5.1% | | | |
| | 68,579,810 | | | Federated Prime Obligations Fund | | $ | 68,579,810 | |
| | | | | | | | |
| | |
| | | | U.S. Government Agencies - 1.3% | | | |
| | | | FHLB | | | | |
| | 18,000,000 | | | 0.18%, 05/22/2015 | | | 17,999,676 | |
| | | | | | | | |
| | |
| | | | Total Short-Term Investments
(cost $86,579,023) | | $ | 86,579,486 | |
| | | | | | | | |
| | | | | | | | | | |
| | | |
| | Total Investments
(cost $991,073,110)^ | | | 101.2 | % | | $ | 1,366,809,633 | |
| | Other Assets and Liabilities | | | (1.2 | )% | | | (16,151,740 | ) |
| | | | | | | | | | |
| | Total Net Assets | | | 100.0 | % | | $ | 1,350,657,893 | |
| | | | | | | | | | |
The accompanying notes are an integral part of these financial statements.
|
| The Hartford Healthcare Fund |
Schedule of Investments – (continued)
April 30, 2015 (Unaudited)
| Note: | Percentage of investments as shown is the ratio of the total market value to total net assets. |
| | Prices of foreign equities that are principally traded on certain foreign markets may be adjusted daily pursuant to a fair value pricing service approved by the Board of Directors in order to reflect an adjustment for factors occurring after the close of certain foreign markets but before the close of the New York Stock Exchange. |
| | Equity industry classifications used in this report are the Global Industry Classification Standard, which was developed by and is the exclusive property and service mark of MSCI, Inc. and Standard & Poor’s. |
| | For Fund compliance purposes, the Fund may not use the same classification system shown in this report as these classifications are used for reporting ease. |
| ^ | At April 30, 2015, the cost of securities for federal income tax purposes was $995,468,205 and the aggregate gross unrealized appreciation and depreciation based on that cost were: |
| | | | |
Unrealized Appreciation | | $ | 390,083,452 | |
Unrealized Depreciation | | | (18,742,024 | ) |
| | | | |
Net Unrealized Appreciation | | $ | 371,341,428 | |
| | | | |
| (1) | Non-income producing. |
| | | | | | | | | | | | | | | | | | | | | | |
| Foreign Currency Contracts Outstanding at April 30, 2015 | |
Currency | | Buy/Sell | | | Delivery
Date | | | Counterparty | | Contract
Amount | | | Market Value* | | | Unrealized
Appreciation/
(Depreciation) | |
BRL | | | Buy | | | | 05/05/15 | | | MSC | | $ | 29,690 | | | $ | 29,186 | | | $ | (504 | ) |
EUR | | | Buy | | | | 05/05/15 | | | WEST | | | 493,452 | | | | 494,968 | | | | 1,516 | |
EUR | | | Buy | | | | 05/06/15 | | | WEST | | | 35,188 | | | | 35,296 | | | | 108 | |
GBP | | | Buy | | | | 05/05/15 | | | TDB | | | 153,119 | | | | 153,359 | | | | 240 | |
HKD | | | Buy | | | | 05/05/15 | | | UBS | | | 89,417 | | | | 89,424 | | | | 7 | |
JPY | | | Buy | | | | 05/08/15 | | | DEUT | | | 672,501 | | | | 669,849 | | | | (2,652 | ) |
| | | | | | | | | | | | | | | | | | | | | | |
Total | | | | | | | | | | | | | | | | | | | | $ | (1,285 | ) |
| | | | | | | | | | | | | | | | | | | | | | |
| * | See Significant Accounting Policies of accompanying Notes to Financial Statements regarding valuation of securities. |
| | |
| GLOSSARY: (abbreviations used in preceding Schedule of Investments) |
|
| Counterparty Abbreviations: |
DEUT | | Deutsche Bank Securities, Inc. |
MSC | | Morgan Stanley |
TDB | | Toronto-Dominion Bank |
UBS | | UBS AG |
WEST | | Westpac International |
|
| Currency Abbreviations: |
BRL | | Brazilian Real |
EUR | | Euro |
GBP | | British Pound |
HKD | | Hong Kong Dollar |
JPY | | Japanese Yen |
|
| Other Abbreviations: |
ADR | | American Depositary Receipt |
FHLB | | Federal Home Loan Bank |
The accompanying notes are an integral part of these financial statements.
|
| The Hartford Healthcare Fund |
Schedule of Investments – (continued)
April 30, 2015 (Unaudited)
Fair Valuation Summary
The following is a summary of the fair valuations according to the inputs used as of April 30, 2015 in valuing the Fund’s investments.
| | | | | | | | | | | | | | | | |
| | | Total | | | Level 1(1) | | | Level 2(1) | | | Level 3 | |
Assets | | | | | | | | | | | | | | | | |
Common Stocks | | | | | | | | | | | | | | | | |
Biotechnology | | $ | 341,932,625 | | | $ | 339,324,164 | | | $ | 2,608,461 | | | $ | — | |
Drug Retail | | | 42,329,164 | | | | 42,329,164 | | | | — | | | | — | |
Health Care Services | | | 15,174,358 | | | | 15,174,358 | | | | — | | | | — | |
Health Care Distributors | | | 68,946,087 | | | | 68,946,087 | | | | — | | | | — | |
Health Care Equipment | | | 244,480,547 | | | | 244,480,547 | | | | — | | | | — | |
Health Care Facilities | | | 74,942,872 | | | | 65,050,785 | | | | 9,892,087 | | | | — | |
Health Care Supplies | | | 9,083,438 | | | | 9,083,438 | | | | — | | | | — | |
Health Care Technology | | | 22,733,949 | | | | 22,733,949 | | | | — | | | | — | |
Internet Software & Services | | | 3,137,984 | | | | 3,137,984 | | | | — | | | | — | |
Life Sciences Tools & Services | | | 46,501,204 | | | | 43,560,114 | | | | 2,941,090 | | | | — | |
Managed Health Care | | | 90,047,338 | | | | 90,047,338 | | | | — | | | | — | |
Pharmaceuticals | | | 320,920,581 | | | | 265,694,372 | | | | 55,226,209 | | | | — | |
Short-Term Investments | | | 86,579,486 | | | | 68,579,810 | | | | 17,999,676 | | | | — | |
| | | | | | | | | | | | | | | | |
Total | | $ | 1,366,809,633 | | | $ | 1,278,142,110 | | | $ | 88,667,523 | | | $ | — | |
| | | | | | | | | | | | | | | | |
Foreign Currency Contracts(2) | | $ | 1,871 | | | $ | — | | | $ | 1,871 | | | $ | — | |
| | | | | | | | | | | | | | | | |
Total | | $ | 1,871 | | | $ | — | | | $ | 1,871 | | | $ | — | |
| | | | | | | | | | | | | | | | |
Liabilities | | | | | | | | | | | | | | | | |
Foreign Currency Contracts(2) | | $ | (3,156 | ) | | $ | — | | | $ | (3,156 | ) | | $ | — | |
| | | | | | | | | | | | | | | | |
Total | | $ | (3,156 | ) | | $ | — | | | $ | (3,156 | ) | | $ | — | |
| | | | | | | | | | | | | | | | |
| (1) | For the six-month period ended April 30, 2015, investments valued at $3,436,396 were transferred from Level 1 to Level 2, and there were no transfers from Level 2 to Level 1. Investments are transferred between Level 1 and Level 2 for a variety of reasons including, but not limited to: |
| | a) | Foreign equities for which a fair value price is more representative of exit value than the local market close (transfer into Level 2). Foreign equities for which the local market close is more representative of exit value (transfer into Level 1). |
| | b) | U.S. Treasury securities that no longer represent the most recent issue (transfer into Level 2). |
| | c) | Equity investments with no observable trading but a bid or mean price is used (transfer into Level 2). Equity investments using observable quoted prices in an active market (transfer into Level 1). |
| (2) | Derivative instruments (excluding purchased and written options, if applicable) are valued at the unrealized appreciation/depreciation on the investments. |
| Note: | For purposes of reporting transfers between different hierarchy levels, both transfers in and out of each level, as applicable, are shown as if they occurred at the beginning of the period. |
The accompanying notes are an integral part of these financial statements.
Diversification by Sector
as of April 30, 2015 (Unaudited)
| | | | |
| Sector | | Percentage of
Net Assets | |
Equity Securities | | | | |
Consumer Discretionary | | | 9.5 | % |
Consumer Staples | | | 2.4 | |
Energy | | | 7.1 | |
Financials | | | 13.8 | |
Health Care | | | 18.6 | |
Industrials | | | 21.5 | |
Information Technology | | | 21.9 | |
Materials | | | 3.0 | |
Utilities | | | 1.9 | |
| | | | |
Total | | | 99.7 | % |
| | | | |
Short-Term Investments | | | 0.4 | % |
Other Assets & Liabilities | | | (0.1 | ) |
| | | | |
Total | | | 100.0 | % |
| | | | |
A sector may be comprised of several industries. For Fund compliance purposes, the Fund may not use the same classification system and these sector classifications are used for reporting ease.
The accompanying notes are an integral part of these financial statements.
Schedule of Investments
April 30, 2015 (Unaudited)
| | | | | | | | |
Shares or Principal Amount | | Market Value* | |
| COMMON STOCKS - 99.7% | |
| | | | Automobiles & Components - 1.3% | |
| | 1,103,083 | | | Harley-Davidson, Inc. | | $ | 62,004,295 | |
| | | | | | | | |
| | | | Banks - 3.6% | |
| | 223,197 | | | Cullen/Frost Bankers, Inc. | | | 16,279,989 | |
| | 469,902 | | | East West Bancorp, Inc. | | | 19,073,322 | |
| | 833,638 | | | First Republic Bank | | | 48,592,759 | |
| | 731,443 | | | M&T Bank Corp. | | | 87,531,784 | |
| | | | | | | | |
| | | | | | | 171,477,854 | |
| | | | | | | | |
| | | | Capital Goods - 8.0% | |
| | 1,799,017 | | | Allison Transmission Holdings, Inc. | | | 55,193,842 | |
| | 505,333 | | | Colfax Corp.(1) | | | 25,059,463 | |
| | 628,929 | | | IDEX Corp. | | | 47,175,964 | |
| | 856,258 | | | Jacobs Engineering Group, Inc.(1) | | | 36,699,218 | |
| | 812,284 | | | Lennox International, Inc. | | | 86,069,613 | |
| | 663,484 | | | MSC Industrial Direct Co., Inc. Class A | | | 47,147,173 | |
| | 701,479 | | | PACCAR, Inc. | | | 45,841,653 | |
| | 369,729 | | | Pall Corp. | | | 35,982,026 | |
| | | | | | | | |
| | | | | | | 379,168,952 | |
| | | | | | | | |
| | | | Commercial & Professional Services - 9.8% | |
| | 760,327 | | | Clean Harbors, Inc.(1) | | | 42,008,067 | |
| | 1,347,755 | | | Equifax, Inc. | | | 130,637,892 | |
| | 1,040,098 | | | ManpowerGroup, Inc. | | | 88,751,562 | |
| | 2,008,691 | | | Robert Half International, Inc. | | | 111,381,916 | |
| | 708,202 | | | TriNet Group, Inc.(1) | | | 24,801,234 | |
| | 1,477,833 | | | Waste Connections, Inc. | | | 70,064,063 | |
| | | | | | | | |
| | | | | | | 467,644,734 | |
| | | | | | | | |
| | | | Consumer Durables & Apparel - 2.5% | |
| | 264,709 | | | Harman International Industries, Inc. | | | 34,512,760 | |
| | 63,170 | | | NVR, Inc.(1) | | | 83,794,373 | |
| | | | | | | | |
| | | | | | | 118,307,133 | |
| | | | | | | | |
| | | | Diversified Financials - 4.4% | |
| | 620,471 | | | Invesco Ltd. | | | 25,699,909 | |
| | 370,468 | | | Moody’s Corp. | | | 39,832,719 | |
| | 685,396 | | | MSCI, Inc. | | | 41,939,381 | |
| | 707,383 | | | Northern Trust Corp. | | | 51,745,067 | |
| | 1,060,844 | | | SEI Investments Co. | | | 48,438,137 | |
| | | | | | | | |
| | | | | | | 207,655,213 | |
| | | | | | | | |
| | | | Energy - 7.1% | |
| | 277,697 | | | Cimarex Energy Co. | | | 34,545,507 | |
| | 2,878,258 | | | Cobalt International Energy, Inc.(1) | | | 30,797,361 | |
| | 340,414 | | | Diamondback Energy, Inc.(1) | | | 28,107,984 | |
| | 584,271 | | | Energen Corp. | | | 41,582,567 | |
| | 579,699 | | | Gulfport Energy Corp.(1) | | | 28,370,469 | |
| | 1,281,333 | | | Laredo Petroleum, Inc.(1) | | | 20,245,061 | |
| | 1,661,939 | | | Memorial Resource Development Corp.(1) | | | 33,554,548 | |
| | 1,817,554 | | | Patterson-UTI Energy, Inc. | | | 40,622,332 | |
| | 155,287 | | | Pioneer Natural Resources Co. | | | 26,830,488 | |
| | 1,345,848 | | | QEP Resources, Inc. | | | 30,281,580 | |
| | 424,471 | | | World Fuel Services Corp. | | | 23,558,141 | |
| | | | | | | | |
| | | | | | | 338,496,038 | |
| | | | | | | | |
| | | | Food & Staples Retailing - 0.6% | |
| | 378,146 | | | PriceSmart, Inc. | | | 30,425,627 | |
| | | | | | | | |
| | | | Food, Beverage & Tobacco - 1.8% | |
| | 611,244 | | | Monster Beverage Corp.(1) | | | 83,807,665 | |
| | | | | | | | |
| | | | Health Care Equipment & Services - 9.3% | |
| | 1,530,277 | | | Envision Healthcare Holdings, Inc.(1) | | | 58,089,315 | |
| | 1,509,281 | | | IMS Health Holdings, Inc.(1) | | | 41,641,063 | |
| | | | | | | | |
Shares or Principal Amount | | Market Value* | |
| COMMON STOCKS - 99.7% - (continued) | |
| | | | Health Care Equipment & Services - 9.3% - (continued) | |
| | 559,205 | | | MEDNAX, Inc.(1) | | $ | 39,580,530 | |
| | 652,028 | | | Omnicare, Inc. | | | 57,365,423 | |
| | 935,543 | | | Patterson Cos., Inc. | | | 43,928,422 | |
| | 563,705 | | | Sirona Dental Systems, Inc.(1) | | | 52,283,639 | |
| | 711,801 | | | Team Health Holdings, Inc.(1) | | | 42,401,986 | |
| | 647,633 | | | Universal Health Services, Inc. Class B | | | 75,740,679 | |
| | 358,665 | | | Varian Medical Systems, Inc.(1) | | | 31,867,385 | |
| | | | | | | | |
| | | | | | | 442,898,442 | |
| | | | | | | | |
| | | | Insurance - 5.8% | |
| | 118,394 | | | Alleghany Corp.(1) | | | 56,061,927 | |
| | 94,315 | | | Fairfax Financial Holdings Ltd. | | | 51,515,612 | |
| | 133,983 | | | Markel Corp.(1) | | | 99,233,169 | |
| | 51,765 | | | White Mountains Insurance Group Ltd. | | | 34,991,587 | |
| | 671,079 | | | WR Berkley Corp. | | | 32,876,160 | |
| | | | | | | | |
| | | | | | | 274,678,455 | |
| | | | | | | | |
| | | | Materials - 3.0% | |
| | 486,275 | | | Ball Corp. | | | 35,697,448 | |
| | 557,889 | | | Packaging Corp. of America | | | 38,600,340 | |
| | 117,381 | | | Sherwin-Williams Co. | | | 32,631,918 | |
| | 634,156 | | | Silgan Holdings, Inc. | | | 34,161,983 | |
| | | | | | | | |
| | | | | | | 141,091,689 | |
| | | | | | | | |
| | | | Pharmaceuticals, Biotechnology & Life Sciences - 9.3% | |
| | 247,141 | | | Agios Pharmaceuticals, Inc.(1) | | | 22,821,000 | |
| | 1,513,508 | | | Alkermes plc(1) | | | 83,802,938 | |
| | 405,771 | | | Alnylam Pharmaceuticals, Inc.(1) | | | 41,335,892 | |
| | 579,444 | | | Incyte Corp.(1) | | | 56,298,779 | |
| | 1,883,028 | | | Ironwood Pharmaceuticals, Inc.(1) | | | 25,722,162 | |
| | 265,082 | | | Jazz Pharmaceuticals plc(1) | | | 47,370,153 | |
| | 434,345 | | | Medivation, Inc.(1) | | | 52,442,815 | |
| | 139,171 | | | Mettler-Toledo International, Inc.(1) | | | 44,118,599 | |
| | 106,715 | | | Puma Biotechnology, Inc.(1) | | | 19,270,595 | |
| | 383,411 | | | Waters Corp.(1) | | | 47,999,223 | |
| | | | | | | | |
| | | | | | | 441,182,156 | |
| | | | | | | | |
| | | | Retailing - 5.7% | |
| | 799,798 | | | Advance Auto Parts, Inc. | | | 114,371,114 | |
| | 1,283,650 | | | CarMax, Inc.(1) | | | 87,429,402 | |
| | 236,552 | | | Tiffany & Co. | | | 20,693,569 | |
| | 583,490 | | | TripAdvisor, Inc.(1) | | | 46,965,110 | |
| | | | | | | | |
| | | | | | | 269,459,195 | |
| | | | | | | | |
| | | | Semiconductors & Semiconductor Equipment - 1.1% | |
| | 456,528 | | | First Solar, Inc.(1) | | | 27,241,026 | |
| | 839,727 | | | SunPower Corp.(1) | | | 27,030,812 | |
| | | | | | | | |
| | | | | | | 54,271,838 | |
| | | | | | | | |
| | | | Software & Services - 14.0% | |
| | 1,270,349 | | | Akamai Technologies, Inc.(1) | | | 93,726,349 | |
| | 452,438 | | | Factset Research Systems, Inc. | | | 71,209,217 | |
| | 5,671,182 | | | Genpact Ltd.(1) | | | 123,972,039 | |
| | 1,845,830 | | | HomeAway, Inc.(1) | | | 51,590,948 | |
| | 1,477,333 | | | Pandora Media, Inc.(1) | | | 26,355,621 | |
| | 772,093 | | | Solera Holdings, Inc. | | | 37,461,952 | |
| | 2,927,734 | | | Vantiv, Inc. Class A(1) | | | 114,474,399 | |
| | 720,672 | | | VeriSign, Inc.(1) | | | 45,769,879 | |
| | 535,034 | | | WEX, Inc.(1) | | | 60,303,682 | |
| | 901,788 | | | Yelp, Inc.(1) | | | 35,521,429 | |
| | 70,395 | | | Zillow Group, Inc. Class A(1) | | | 6,873,368 | |
| | | | | | | | |
| | | | | | | 667,258,883 | |
| | | | | | | | |
The accompanying notes are an integral part of these financial statements.
Schedule of Investments – (continued)
April 30, 2015 (Unaudited)
| | | | | | | | |
Shares or Principal Amount | | Market Value* | |
| COMMON STOCKS - 99.7% - (continued) | |
| | | | Technology Hardware & Equipment - 6.8% | |
| | 877,527 | | | Amphenol Corp. Class A | | $ | 48,588,670 | |
| | 1,081,523 | | | CDW Corp. of Delaware | | | 41,443,961 | |
| | 395,934 | | | F5 Networks, Inc.(1) | | | 48,311,867 | |
| | 264,584 | | | FEI Co. | | | 19,965,509 | |
| | 2,291,224 | | | National Instruments Corp. | | | 65,529,006 | |
| | 1,580,436 | | | Nimble Storage, Inc.(1) | | | 38,657,464 | |
| | 2,290,539 | | | Trimble Navigation Ltd.(1) | | | 58,248,407 | |
| | | | | | | | |
| | | | | | | 320,744,884 | |
| | | | | | | | |
| | | | Transportation - 3.7% | | | |
| | 81,494 | | | AMERCO | | | 26,244,328 | |
| | 672,334 | | | Genesee & Wyoming, Inc. Class A(1) | | | 62,493,445 | |
| | 636,387 | | | J.B. Hunt Transport Services, Inc. | | | 55,492,946 | |
| | 1,627,084 | | | JetBlue Airways Corp.(1) | | | 33,404,035 | |
| | | | | | | | |
| | | | | | | 177,634,754 | |
| | | | | | | | |
| | | | Utilities - 1.9% | | | |
| | 331,069 | | | Eversource Energy | | | 16,142,924 | |
| | 1,594,515 | | | UGI Corp. | | | 55,505,067 | |
| | 411,015 | | | Wisconsin Energy Corp. | | | 20,189,057 | |
| | | | | | | | |
| | | | | | | 91,837,048 | |
| | | | | | | | |
| | |
| | | | Total Common Stocks
(cost $3,570,914,045) | | $ | 4,740,044,855 | |
| | | | | | | | |
| | |
| | | | Total Long-Term Investments
(cost $3,570,914,045) | | $ | 4,740,044,855 | |
| | | | | | | | |
|
| SHORT-TERM INVESTMENTS - 0.4% | |
| | | | Other Investment Pools & Funds - 0.4% | |
| | 16,849,100 | | | BlackRock Liquidity Funds TempFund Portfolio | | $ | 16,849,100 | |
| | | | | | | | |
| | |
| | | | Total Short-Term Investments
(cost $16,849,100) | | $ | 16,849,100 | |
| | | | | | | | |
| | | | | | | | | | |
| | | |
| | Total Investments
(cost $3,587,763,145)^ | | | 100.1 | % | | $ | 4,756,893,955 | |
| | Other Assets and Liabilities | | | (0.1 | )% | | | (4,851,431 | ) |
| | | | | | | | | | |
| | Total Net Assets | | | 100.0 | % | | $ | 4,752,042,524 | |
| | | | | | | | | | |
The accompanying notes are an integral part of these financial statements.
Schedule of Investments – (continued)
April 30, 2015 (Unaudited)
| Note: | Percentage of investments as shown is the ratio of the total market value to total net assets. |
| | Prices of foreign equities that are principally traded on certain foreign markets may be adjusted daily pursuant to a fair value pricing service approved by the Board of Directors in order to reflect an adjustment for factors occurring after the close of certain foreign markets but before the close of the New York Stock Exchange. |
| | Equity industry classifications used in this report are the Global Industry Classification Standard, which was developed by and is the exclusive property and service mark of MSCI, Inc. and Standard & Poor’s. |
| | For Fund compliance purposes, the Fund may not use the same classification system shown in this report as these classifications are used for reporting ease. |
| ^ | At April 30, 2015, the cost of securities for federal income tax purposes was $3,594,472,967 and the aggregate gross unrealized appreciation and depreciation based on that cost were: |
| | | | |
Unrealized Appreciation | | $ | 1,256,977,910 | |
Unrealized Depreciation | | | (94,556,922 | ) |
| | | | |
Net Unrealized Appreciation | | $ | 1,162,420,988 | |
| | | | |
| (1) | Non-income producing. |
| * | See Significant Accounting Policies of accompanying Notes to Financial Statements regarding valuation of securities. |
The accompanying notes are an integral part of these financial statements.
Schedule of Investments – (continued)
April 30, 2015 (Unaudited)
Fair Valuation Summary
The following is a summary of the fair valuations according to the inputs used as of April 30, 2015 in valuing the Fund’s investments.
| | | | | | | | | | | | | | | | |
| | | Total | | | Level 1(1) | | | Level 2(1) | | | Level 3 | |
Assets | | | | | | | | | | | | | | | | |
Common Stocks | | | | | | | | | | | | | | | | |
Automobiles & Components | | $ | 62,004,295 | | | $ | 62,004,295 | | | $ | — | | | $ | — | |
Banks | | | 171,477,854 | | | | 171,477,854 | | | | — | | | | — | |
Capital Goods | | | 379,168,952 | | | | 379,168,952 | | | | — | | | | — | |
Commercial & Professional Services | | | 467,644,734 | | | | 467,644,734 | | | | — | | | | — | |
Consumer Durables & Apparel | | | 118,307,133 | | | | 118,307,133 | | | | — | | | | — | |
Diversified Financials | | | 207,655,213 | | | | 207,655,213 | | | | — | | | | — | |
Energy | | | 338,496,038 | | | | 338,496,038 | | | | — | | | | — | |
Food & Staples Retailing | | | 30,425,627 | | | | 30,425,627 | | | | — | | | | — | |
Food, Beverage & Tobacco | | | 83,807,665 | | | | 83,807,665 | | | | — | | | | — | |
Health Care Equipment & Services | | | 442,898,442 | | | | 442,898,442 | | | | — | | | | — | |
Insurance | | | 274,678,455 | | | | 274,678,455 | | | | — | | | | — | |
Materials | | | 141,091,689 | | | | 141,091,689 | | | | — | | | | — | |
Pharmaceuticals, Biotechnology & Life Sciences | | | 441,182,156 | | | | 441,182,156 | | | | — | | | | — | |
Retailing | | | 269,459,195 | | | | 269,459,195 | | | | — | | | | — | |
Semiconductors & Semiconductor Equipment | | | 54,271,838 | | | | 54,271,838 | | | | — | | | | — | |
Software & Services | | | 667,258,883 | | | | 667,258,883 | | | | — | | | | — | |
Technology Hardware & Equipment | | | 320,744,884 | | | | 320,744,884 | | | | — | | | | — | |
Transportation | | | 177,634,754 | | | | 177,634,754 | | | | — | | | | — | |
Utilities | | | 91,837,048 | | | | 91,837,048 | | | | — | | | | — | |
Short-Term Investments | | | 16,849,100 | | | | 16,849,100 | | | | — | | | | — | |
| | | | | | | | | | | | | | | | |
Total | | $ | 4,756,893,955 | | | $ | 4,756,893,955 | | | $ | — | | | $ | — | |
| | | | | | | | | | | | | | | | |
| (1) | For the six-month period ended April 30, 2015, there were no transfers between Level 1 and Level 2. |
| Note: | For purposes of reporting transfers between different hierarchy levels, both transfers in and out of each level, as applicable, are shown as if they occurred at the beginning of the period. |
The accompanying notes are an integral part of these financial statements.
|
| The Hartford MidCap Value Fund |
Diversification by Sector
as of April 30, 2015 (Unaudited)
| | | | |
| Sector | | Percentage of
Net Assets | |
Equity Securities | | | | |
Consumer Discretionary | | | 14.3 | % |
Consumer Staples | | | 2.3 | |
Energy | | | 5.7 | |
Financials | | | 26.8 | |
Health Care | | | 7.8 | |
Industrials | | | 15.5 | |
Information Technology | | | 11.9 | |
Materials | | | 8.9 | |
Utilities | | | 5.3 | |
| | | | |
Total | | | 98.5 | % |
| | | | |
Short-Term Investments | | | 1.7 | % |
Other Assets & Liabilities | | | (0.2 | ) |
| | | | |
Total | | | 100.0 | % |
| | | | |
A sector may be comprised of several industries. For Fund compliance purposes, the Fund may not use the same classification system and these sector classifications are used for reporting ease.
The accompanying notes are an integral part of these financial statements.
|
| The Hartford MidCap Value Fund |
Schedule of Investments
April 30, 2015 (Unaudited)
| | | | | | | | |
Shares or Principal Amount | | Market Value* | |
| COMMON STOCKS - 98.5% | |
| | | | Automobiles & Components - 1.1% | |
| | 199,600 | | | Goodyear Tire & Rubber Co. | | $ | 5,661,654 | |
| | | | | | | | |
| | | | Banks - 8.1% | |
| | 215,728 | | | BankUnited, Inc. | | | 7,088,822 | |
| | 114,100 | | | CIT Group, Inc. | | | 5,137,923 | |
| | 176,600 | | | Comerica, Inc. | | | 8,372,606 | |
| | 121,600 | | | EverBank Financial Corp. | | | 2,258,112 | |
| | 103,900 | | | IBERIABANK Corp. | | | 6,474,009 | |
| | 51,000 | | | South State Corp. | | | 3,453,720 | |
| | 316,000 | | | Zions Bancorporation | | | 8,953,860 | |
| | | | | | | | |
| | | | | | | 41,739,052 | |
| | | | | | | | |
| | | | Capital Goods - 15.5% | |
| | 255,725 | | | Barnes Group, Inc. | | | 10,254,573 | |
| | 75,200 | | | Curtiss-Wright Corp. | | | 5,494,112 | |
| | 68,625 | | | Esterline Technologies Corp.(1) | | | 7,637,276 | |
| | 154,400 | | | Generac Holdings, Inc.(1) | | | 6,436,936 | |
| | 78,300 | | | Hubbell, Inc. Class B | | | 8,521,389 | |
| | 123,600 | | | Moog, Inc. Class A(1) | | | 8,637,168 | |
| | 106,721 | | | Orbital ATK, Inc. | | | 7,807,708 | |
| | 224,315 | | | Rexel S.A. | | | 4,227,583 | |
| | 419,300 | | | Sanwa Holdings Corp. | | | 3,164,614 | |
| | 130,400 | | | Sensata Technologies Holding N.V.(1) | | | 7,199,384 | |
| | 13,800 | | | Teledyne Technologies, Inc.(1) | | | 1,448,586 | |
| | 118,200 | | | WESCO International, Inc.(1) | | | 8,526,948 | |
| | | | | | | | |
| | | | | | | 79,356,277 | |
| | | | | | | | |
| | | | Consumer Durables & Apparel - 7.9% | |
| | 175,700 | | | D.R. Horton, Inc. | | | 4,462,780 | |
| | 185,500 | | | Lennar Corp. Class A | | | 8,495,900 | |
| | 294,606 | | | Newell Rubbermaid, Inc. | | | 11,233,327 | |
| | 385,600 | | | Performance Sports Group Ltd.(1) | | | 7,827,680 | |
| | 585,000 | | | Samsonite International S.A. | | | 2,133,593 | |
| | 176,900 | | | Toll Brothers, Inc.(1) | | | 6,287,026 | |
| | | | | | | | |
| | | | | | | 40,440,306 | |
| | | | | | | | |
| | | | Consumer Services - 1.5% | |
| | 161,100 | | | Norwegian Cruise Line Holdings Ltd.(1) | | | 7,814,961 | |
| | | | | | | | |
| | | | Diversified Financials - 1.7% | |
| | 71,900 | | | LPL Financial Holdings, Inc. | | | 2,909,793 | |
| | 90,900 | | | MSCI, Inc. | | | 5,562,171 | |
| | 182,200 | | | Solar Cayman Ltd.(1)(2)(3)(4) | | | 12,754 | |
| | | | | | | | |
| | | | | | | 8,484,718 | |
| | | | | | | | |
| | | | Energy - 5.7% | |
| | 449,646 | | | Cobalt International Energy, Inc.(1) | | | 4,811,212 | |
| | 118,100 | | | Diamondback Energy, Inc.(1) | | | 9,751,517 | |
| | 86,800 | | | HollyFrontier Corp. | | | 3,366,104 | |
| | 218,843 | | | Laredo Petroleum, Inc.(1) | | | 3,457,720 | |
| | 57,600 | | | Newfield Exploration Co.(1) | | | 2,260,224 | |
| | 193,600 | | | QEP Resources, Inc. | | | 4,356,000 | |
| | 334,500 | | | Trican Well Service Ltd. | | | 1,413,966 | |
| | | | | | | | |
| | | | | | | 29,416,743 | |
| | | | | | | | |
| | | | Food, Beverage & Tobacco - 2.3% | |
| | 96,682 | | | Ebro Foods S.A. | | | 1,875,452 | |
| | 81,300 | | | Ingredion, Inc. | | | 6,455,220 | |
| | 788,236 | | | Treasury Wine Estates Ltd. | | | 3,457,017 | |
| | | | | | | | |
| | | | | | | 11,787,689 | |
| | | | | | | | |
| | | | Health Care Equipment & Services - 2.7% | |
| | 264,078 | | | Brookdale Senior Living, Inc.(1) | | | 9,567,546 | |
| | 53,200 | | | WellCare Health Plans, Inc.(1) | | | 4,119,276 | |
| | | | | | | | |
| | | | | | | 13,686,822 | |
| | | | | | | | |
| | | | | | | | |
Shares or Principal Amount | | Market Value* | |
| COMMON STOCKS - 98.5% - (continued) | |
| | | | Insurance - 8.2% | |
| | 111,800 | | | Argo Group International Holdings Ltd. | | $ | 5,477,082 | |
| | 116,100 | | | Hanover Insurance Group, Inc. | | | 7,960,977 | |
| | 111,442 | | | Reinsurance Group of America, Inc. | | | 10,210,316 | |
| | 1,600 | | | StanCorp Financial Group, Inc. | | | 115,328 | |
| | 298,577 | | | Unum Group | | | 10,199,390 | |
| | 213,300 | | | XL Group plc | | | 7,909,164 | |
| | | | | | | | |
| | | | | | | 41,872,257 | |
| | | | | | | | |
| | | | Materials - 8.9% | |
| | 144,500 | | | Cabot Corp. | | | 6,175,930 | |
| | 117,400 | | | Celanese Corp. Series A | | | 7,790,664 | |
| | 242,600 | | | Huntsman Corp. | | | 5,591,930 | |
| | 470,800 | | | Louisiana-Pacific Corp.(1) | | | 7,174,992 | |
| | 227,984 | | | Methanex Corp. | | | 13,726,917 | |
| | 43,000 | | | Packaging Corp. of America | | | 2,975,170 | |
| | 36,800 | | | Reliance Steel & Aluminum Co. | | | 2,381,696 | |
| | | | | | | | |
| | | | | | | 45,817,299 | |
| | | | | | | | |
| | | | Media - 2.4% | |
| | 35,800 | | | AMC Entertainment Holdings, Inc. Class A | | | 1,076,148 | |
| | 297,700 | | | Interpublic Group of Cos., Inc. | | | 6,204,068 | |
| | 175,700 | | | Quebecor, Inc. Class B | | | 4,831,932 | |
| | | | | | | | |
| | | | | | | 12,112,148 | |
| | | | | | | | |
| | | | Pharmaceuticals, Biotechnology & Life Sciences - 5.1% | |
| | 565,539 | | | Almirall S.A.(1) | | | 10,663,041 | |
| | 83,400 | | | Ono Pharmaceutical Co., Ltd. | | | 9,038,819 | |
| | 31,590 | | | UCB S.A. | | | 2,275,518 | |
| | 90,700 | | | WuXi PharmaTech Cayman, Inc. ADR(1) | | | 3,915,519 | |
| | | | | | | | |
| | | | | | | 25,892,897 | |
| | | | | | | | |
| | | | Real Estate - 8.8% | |
| | 160,100 | | | American Assets Trust, Inc. REIT | | | 6,371,980 | |
| | 236,800 | | | Blackstone Mortgage Trust, Inc. Class A REIT | | | 7,276,864 | |
| | 171,800 | | | Equity LifeStyle Properties, Inc. REIT | | | 9,074,476 | |
| | 130,500 | | | Extra Space Storage, Inc. REIT | | | 8,603,865 | |
| | 281,200 | | | Forest City Enterprises, Inc. Class A(1) | | | 6,681,312 | |
| | 14,400 | | | Plum Creek Timber Co., Inc. REIT | | | 607,680 | |
| | 54,900 | | | SL Green Realty Corp. REIT | | | 6,717,564 | |
| | | | | | | | |
| | | | | | | 45,333,741 | |
| | | | | | | | |
| | | | Retailing - 1.4% | |
| | 193,500 | | | DSW, Inc. Class A | | | 7,018,245 | |
| | | | | | | | |
| | | | Semiconductors & Semiconductor Equipment - 4.2% | |
| | 295,600 | | | Microsemi Corp.(1) | | | 9,861,216 | |
| | 110,175 | | | Qorvo, Inc.(1) | | | 7,261,635 | |
| | 49,017 | | | Synaptics, Inc.(1) | | | 4,152,720 | |
| | | | | | | | |
| | | | | | | 21,275,571 | |
| | | | | | | | |
| | | | Software & Services - 4.0% | |
| | 194,400 | | | Booz Allen Hamilton Holding Corp. | | | 5,346,000 | |
| | 60,000 | | | Check Point Software Technologies Ltd. ADR(1) | | | 5,008,800 | |
| | 162,352 | | | Verint Systems, Inc.(1) | | | 9,973,283 | |
| | | | | | | | |
| | | | | | | 20,328,083 | |
| | | | | | | | |
| | | | Technology Hardware & Equipment - 3.7% | |
| | 258,000 | | | ARRIS Group, Inc.(1) | | | 8,688,150 | |
| | 176,371 | | | Arrow Electronics, Inc.(1) | | | 10,531,112 | |
| | | | | | | | |
| | | | | | | 19,219,262 | |
| | | | | | | | |
| | | | Utilities - 5.3% | |
| | 47,700 | | | Alliant Energy Corp. | | | 2,884,419 | |
| | 168,500 | | | Great Plains Energy, Inc. | | | 4,411,330 | |
The accompanying notes are an integral part of these financial statements.
|
| The Hartford MidCap Value Fund |
Schedule of Investments – (continued)
April 30, 2015 (Unaudited)
| | | | | | | | |
Shares or Principal Amount | | Market Value* | |
| COMMON STOCKS - 98.5% - (continued) | |
| | | | Utilities - 5.3% - (continued) | |
| | 193,000 | | | Portland General Electric Co. | | $ | 6,785,880 | |
| | 230,102 | | | UGI Corp. | | | 8,009,851 | |
| | 131,200 | | | Westar Energy, Inc. | | | 4,939,680 | |
| | | | | | | | |
| | | | | | | 27,031,160 | |
| | | | | | | | |
| | |
| | | | Total Common Stocks
(cost $407,155,886) | | $ | 504,288,885 | |
| | | | | | | | |
| | |
| | | | Total Long-Term Investments
(cost $407,155,886) | | $ | 504,288,885 | |
| | | | | | | | |
|
| SHORT-TERM INVESTMENTS - 1.7% | |
| | | | Other Investment Pools & Funds - 1.7% | |
| | 8,595,037 | | | Federated Prime Obligations Fund | | $ | 8,595,037 | |
| | | | | | | | |
| | |
| | | | Total Short-Term Investments
(cost $8,595,037) | | $ | 8,595,037 | |
| | | | | | | | |
| | | | | | | | | | |
| | | |
| | Total Investments
(cost $415,750,923)^ | | | 100.2 | % | | $ | 512,883,922 | |
| | Other Assets and Liabilities | | | (0.2 | )% | | | (867,809 | ) |
| | | | | | | | | | |
| | Total Net Assets | | | 100.0 | % | | $ | 512,016,113 | |
| | | | | | | | | | |
The accompanying notes are an integral part of these financial statements.
|
| The Hartford MidCap Value Fund |
Schedule of Investments – (continued)
April 30, 2015 (Unaudited)
| Note: | Percentage of investments as shown is the ratio of the total market value to total net assets. |
| | Prices of foreign equities that are principally traded on certain foreign markets may be adjusted daily pursuant to a fair value pricing service approved by the Board of Directors in order to reflect an adjustment for factors occurring after the close of certain foreign markets but before the close of the New York Stock Exchange. |
| | Equity industry classifications used in this report are the Global Industry Classification Standard, which was developed by and is the exclusive property and service mark of MSCI, Inc. and Standard & Poor’s. |
| | For Fund compliance purposes, the Fund may not use the same classification system shown in this report as these classifications are used for reporting ease. |
| ^ | At April 30, 2015, the cost of securities for federal income tax purposes was $417,569,637 and the aggregate gross unrealized appreciation and depreciation based on that cost were: |
| | | | |
Unrealized Appreciation | | $ | 105,266,579 | |
Unrealized Depreciation | | | (9,952,294 | ) |
| | | | |
Net Unrealized Appreciation | | $ | 95,314,285 | |
| | | | |
| (1) | Non-income producing. |
| (2) | This security is valued in good faith at fair value as determined under policies and procedures established by and under the supervision of the Board of Directors. At April 30, 2015, the aggregate fair value of this security was $12,754, which represents 0.0% of total net assets. This amount excludes securities that are principally traded in certain foreign markets and whose prices are adjusted pursuant to a third party pricing service methodology approved by the Board of Directors. |
| (3) | Securities issued within terms of a private placement memorandum, exempt from registration under Rule 144A under the Securities Act of 1933, as amended, and may be sold only to qualified institutional buyers. Unless otherwise indicated, this holding is determined to be liquid. At April 30, 2015, the aggregate value of this security was $12,754, which represents 0.0% of total net assets. |
| (4) | The following security is considered illiquid. Illiquid securities are often purchased in private placement transactions, are often not registered under the Securities Act of 1933, as amended, and may have contractual restrictions on resale. A security may also be considered illiquid if the security lacks a readily available market or if its valuation has not changed for a certain period of time. |
| | | | | | | | | | |
Period
Acquired | | Shares/Par | | | Security | | Cost | |
| 03/2007 | | | 182,200 | | | Solar Cayman Ltd. | | $ | 53,400 | |
At April 30, 2015, the aggregate value of this security was $12,754, which represents 0.0% of total net assets.
| | | | | | | | | | | | | | | | | | | | |
| Foreign Currency Contracts Outstanding at April 30, 2015 | |
Currency | | Buy/Sell | | Delivery
Date | | | Counterparty | | Contract
Amount | | | Market
Value* | | | Unrealized
Appreciation/
(Depreciation) | |
AUD | | Buy | | | 05/05/15 | | | DEUT | | $ | 6,591 | | | $ | 6,590 | | | $ | (1 | ) |
CAD | | Buy | | | 05/04/15 | | | CBA | | | 11,225 | | | | 11,177 | | | | (48 | ) |
EUR | | Buy | | | 05/05/15 | | | WEST | | | 8,328 | | | | 8,354 | | | | 26 | |
EUR | | Buy | | | 05/06/15 | | | WEST | | | 3,747 | | | | 3,758 | | | | 11 | |
HKD | | Buy | | | 05/05/15 | | | UBS | | | 4,419 | | | | 4,419 | | | | — | |
JPY | | Buy | | | 05/08/15 | | | DEUT | | | 6,036 | | | | 6,012 | | | | (24 | ) |
| | | | | | | | | | | | | | | | | | | | |
Total | | | | | | | | | | | | | | | | | | $ | (36 | ) |
| | | | | | | | | | | | | | | | | | | | |
| * | See Significant Accounting Policies of accompanying Notes to Financial Statements regarding valuation of securities. |
| | |
| GLOSSARY: (abbreviations used in preceding Schedule of Investments) |
|
| Counterparty Abbreviations: |
CBA | | Commonwealth Bank of Australia |
DEUT | | Deutsche Bank Securities, Inc. |
UBS | | UBS AG |
WEST | | Westpac International |
|
| Currency Abbreviations: |
AUD | | Australian Dollar |
CAD | | Canadian Dollar |
EUR | | Euro |
HKD | | Hong Kong Dollar |
JPY | | Japanese Yen |
|
| Other Abbreviations: |
ADR | | American Depositary Receipt |
REIT | | Real Estate Investment Trust |
The accompanying notes are an integral part of these financial statements.
|
| The Hartford MidCap Value Fund |
Schedule of Investments – (continued)
April 30, 2015 (Unaudited)
Fair Valuation Summary
The following is a summary of the fair valuations according to the inputs used as of April 30, 2015 in valuing the Fund’s investments.
| | | | | | | | | | | | | | | | |
| | | Total | | | Level 1(1) | | | Level 2(1) | | | Level 3 | |
Assets | | | | | | | | | | | | | | | | |
Common Stocks | | | | | | | | | | | | | | | | |
Automobiles & Components | | $ | 5,661,654 | | | $ | 5,661,654 | | | $ | — | | | $ | — | |
Banks | | | 41,739,052 | | | | 41,739,052 | | | | — | | | | — | |
Capital Goods | | | 79,356,277 | | | | 71,964,080 | | | | 7,392,197 | | | | — | |
Consumer Durables & Apparel | | | 40,440,306 | | | | 38,306,713 | | | | 2,133,593 | | | | — | |
Consumer Services | | | 7,814,961 | | | | 7,814,961 | | | | — | | | | — | |
Diversified Financials | | | 8,484,718 | | | | 8,471,964 | | | | — | | | | 12,754 | |
Energy | | | 29,416,743 | | | | 29,416,743 | | | | — | | | | — | |
Food, Beverage & Tobacco | | | 11,787,689 | | | | 6,455,220 | | | | 5,332,469 | | | | — | |
Health Care Equipment & Services | | | 13,686,822 | | | | 13,686,822 | | | | — | | | | — | |
Insurance | | | 41,872,257 | | | | 41,872,257 | | | | — | | | | — | |
Materials | | | 45,817,299 | | | | 45,817,299 | | | | — | | | | — | |
Media | | | 12,112,148 | | | | 12,112,148 | | | | — | | | | — | |
Pharmaceuticals, Biotechnology & Life Sciences | | | 25,892,897 | | | | 3,915,519 | | | | 21,977,378 | | | | — | |
Real Estate | | | 45,333,741 | | | | 45,333,741 | | | | — | | | | — | |
Retailing | | | 7,018,245 | | | | 7,018,245 | | | | — | | | | — | |
Semiconductors & Semiconductor Equipment | | | 21,275,571 | | | | 21,275,571 | | | | — | | | | — | |
Software & Services | | | 20,328,083 | | | | 20,328,083 | | | | — | | | | — | |
Technology Hardware & Equipment | | | 19,219,262 | | | | 19,219,262 | | | | — | | | | — | |
Utilities | | | 27,031,160 | | | | 27,031,160 | | | | — | | | | — | |
Short-Term Investments | | | 8,595,037 | | | | 8,595,037 | | | | — | | | | — | |
| | | | | | | | | | | | | | | | |
Total | | $ | 512,883,922 | | | $ | 476,035,531 | | | $ | 36,835,637 | | | $ | 12,754 | |
| | | | | | | | | | | | | | | | |
Foreign Currency Contracts(2) | | $ | 37 | | | $ | — | | | $ | 37 | | | $ | — | |
| | | | | | | | | | | | | | | | |
Total | | $ | 37 | | | $ | — | | | $ | 37 | | | $ | — | |
| | | | | | | | | | | | | | | | |
Liabilities | | | | | | | | | | | | | | | | |
Foreign Currency Contracts(2) | | $ | (73 | ) | | $ | — | | | $ | (73 | ) | | $ | — | |
| | | | | | | | | | | | | | | | |
Total | | $ | (73 | ) | | $ | — | | | $ | (73 | ) | | $ | — | |
| | | | | | | | | | | | | | | | |
| (1) | For the six-month period ended April 30, 2015, there were no transfers between Level 1 and Level 2. |
| (2) | Derivative instruments (excluding purchased and written options, if applicable) are valued at the unrealized appreciation/depreciation on the investments. |
The following is a rollforward of the Fund’s investments that were valued using unobservable inputs (Level 3) for the six-month period ended April 30, 2015:
| | | | | | | | |
| | | Common Stocks | | | Total | |
Beginning balance | | $ | 12,754 | | | $ | 12,754 | |
Purchases | | | — | | | | — | |
Sales | | | — | | | | — | |
Accrued discounts/(premiums) | | | — | | | | — | |
Total realized gain/(loss) | | | — | | | | — | |
Net change in unrealized appreciation/(depreciation) | | | — | | | | — | |
Transfers into Level 3(1) | | | — | | | | — | |
Transfers out of Level 3(1) | | | — | | | | — | |
| | | | | | | | |
Ending balance | | $ | 12,754 | | | $ | 12,754 | |
The change in net unrealized appreciation/(depreciation) relating to the Level 3 investment held at April 30, 2015 was $0.
| (1) | Investments are transferred into and out of Level 3 for a variety of reasons including, but not limited to: |
| | a) | Investments where trading has been halted (transfer into Level 3) or investments where trading has resumed (transfer out of Level 3). |
| | b) | Broker quoted investments (transfer into Level 3) or quoted prices in active markets (transfer out of Level 3). |
| | c) | Investments that have certain restrictions on trading (transfer into level 3) or investments where trading restrictions have expired (transfer out of Level 3). |
| Note: | For purposes of reporting transfers between different hierarchy levels, both transfers in and out of each level, as applicable, are shown as if they occurred at the beginning of the period. |
The accompanying notes are an integral part of these financial statements.
|
| The Hartford Small Company Fund |
Diversification by Sector
as of April 30, 2015 (Unaudited)
| | | | |
| Sector | | Percentage of
Net Assets | |
Equity Securities | | | | |
Consumer Discretionary | | | 13.8 | % |
Consumer Staples | | | 1.2 | |
Energy | | | 2.8 | |
Financials | | | 10.4 | |
Health Care | | | 19.5 | |
Industrials | | | 19.4 | |
Information Technology | | | 27.7 | |
Materials | | | 4.5 | |
Utilities | | | 0.1 | |
| | | | |
Total | | | 99.4 | % |
| | | | |
Short-Term Investments | | | 0.6 | % |
Other Assets & Liabilities | | | 0.0 | |
| | | | |
Total | | | 100.0 | % |
| | | | |
A sector may be comprised of several industries. For Fund compliance purposes, the Fund may not use the same classification system and these sector classifications are used for reporting ease.
The accompanying notes are an integral part of these financial statements.
|
| The Hartford Small Company Fund |
Schedule of Investments
April 30, 2015 (Unaudited)
| | | | | | | | |
Shares or Principal Amount | | Market Value* | |
| COMMON STOCKS - 95.1% | |
| | | | Automobiles & Components - 0.7% | | | |
| | 23,954 | | | Dana Holding Corp. | | $ | 516,688 | |
| | 79,935 | | | Gentherm, Inc.(1) | | | 4,214,972 | |
| | 5,296 | | | Standard Motor Products, Inc. | | | 200,189 | |
| | 15,676 | | | Tenneco Automotive, Inc.(1) | | | 916,262 | |
| | 559 | | | Tesla Motors, Inc.(1) | | | 126,362 | |
| | 12,500 | | | Winnebago Industries, Inc. | | | 258,875 | |
| | | | | | | | |
| | | | | | | 6,233,348 | |
| | | | | | | | |
| | | | Banks - 1.5% | | | |
| | 5,268 | | | Bank of Marin Bancorp | | | 265,613 | |
| | 21,837 | | | Blue Hills Bancorp, Inc.(1) | | | 293,053 | |
| | 22,780 | | | Clifton Bancorp, Inc. | | | 310,947 | |
| | 48,243 | | | EverBank Financial Corp. | | | 895,872 | |
| | 25,550 | | | First Merchants Corp. | | | 576,663 | |
| | 23,435 | | | Flushing Financial Corp. | | | 449,015 | |
| | 12,900 | | | Great Western Bancorp, Inc. | | | 282,123 | |
| | 17,283 | | | Heritage Financial Corp. of Washington | | | 292,083 | |
| | 46,545 | | | MGIC Investment Corp.(1) | | | 484,999 | |
| | 205,845 | | | PacWest Bancorp | | | 9,283,609 | |
| | 9,470 | | | Sandy Spring Bancorp, Inc. | | | 246,788 | |
| | 13,132 | | | TriCo Bancshares | | | 306,238 | |
| | 15,355 | | | Wintrust Financial Corp. | | | 748,403 | |
| | 3,082 | | | WSFS Financial Corp. | | | 219,346 | |
| | | | | | | | |
| | | | | | | 14,654,752 | |
| | | | | | | | |
| | | | Capital Goods - 12.5% | | | |
| | 9,463 | | | A.O. Smith Corp. | | | 604,686 | |
| | 20,319 | | | AAON, Inc. | | | 487,046 | |
| | 66,040 | | | Acuity Brands, Inc. | | | 11,025,378 | |
| | 275,879 | | | Advanced Drainage Systems, Inc. | | | 7,724,612 | |
| | 252,541 | | | AECOM(1) | | | 7,970,194 | |
| | 3,990 | | | Alamo Group, Inc. | | | 246,502 | |
| | 243,388 | | | Altra Industrial Motion Corp. | | | 6,418,142 | |
| | 113,005 | | | Applied Industrial Technologies, Inc. | | | 4,720,219 | |
| | 100,837 | | | Astronics Corp.(1) | | | 6,787,339 | |
| | 1,824 | | | Astronics Corp. Class B(1) | | | 125,582 | |
| | 11,229 | | | AZZ, Inc. | | | 520,913 | |
| | 11,431 | | | CAI International, Inc.(1) | | | 272,286 | |
| | 1,998 | | | Carlisle Cos., Inc. | | | 192,807 | |
| | 4,033 | | | Crane Co. | | | 246,457 | |
| | 323,635 | | | DigitalGlobe, Inc.(1) | | | 10,411,338 | |
| | 6,885 | | | EMCOR Group, Inc. | | | 307,278 | |
| | 4,155 | | | Esterline Technologies Corp.(1) | | | 462,410 | |
| | 266,219 | | | Generac Holdings, Inc.(1) | | | 11,098,670 | |
| | 10,938 | | | H & E Equipment Services, Inc. | | | 270,387 | |
| | 342,021 | | | HD Supply Holdings, Inc.(1) | | | 11,286,693 | |
| | 14,430 | | | Heico Corp. Class A | | | 661,904 | |
| | 15,033 | | | Insteel Industries, Inc. | | | 304,569 | |
| | 7,578 | | | Lennox International, Inc. | | | 802,965 | |
| | 18,606 | | | Luxfer Holdings plc ADR | | | 239,087 | |
| | 7,775 | | | Lydall, Inc.(1) | | | 208,681 | |
| | 206,396 | | | Masonite International Corp.(1) | | | 13,663,415 | |
| | 8,620 | | | Moog, Inc. Class A(1) | | | 602,366 | |
| | 14,126 | | | NN, Inc. | | | 355,410 | |
| | 217,096 | | | Owens Corning | | | 8,392,931 | |
| | 51,815 | | | Teledyne Technologies, Inc.(1) | | | 5,439,021 | |
| | 8,609 | | | Textainer Group Holdings Ltd. | | | 260,853 | |
| | 31,229 | | | Titan International, Inc. | | | 324,469 | |
| | 9,470 | | | Toro Co. | | | 634,869 | |
| | 119,917 | | | Watts Water Technologies, Inc. Class A | | | 6,541,472 | |
| | | | | | | | |
| | | | | | | 119,610,951 | |
| | | | | | | | |
| | | | | | | | |
Shares or Principal Amount | | Market Value* | |
| COMMON STOCKS - 95.1% - (continued) | |
| | | | Commercial & Professional Services - 2.1% | | | |
| | 21,500 | | | CECO Environmental Corp. | | $ | 253,485 | |
| | 10,168 | | | Deluxe Corp. | | | 658,378 | |
| | 8,970 | | | Exponent, Inc. | | | 794,832 | |
| | 10,252 | | | Gategroup Holding AG | | | 359,334 | |
| | 16,250 | | | GP Strategies Corp.(1) | | | 529,588 | |
| | 18,586 | | | Heritage Crystal Clean, Inc.(1) | | | 217,828 | |
| | 15,910 | | | On Assignment, Inc.(1) | | | 535,371 | |
| | 311,215 | | | TriNet Group, Inc.(1) | | | 10,898,749 | |
| | 120,336 | | | WageWorks, Inc.(1) | | | 6,064,934 | |
| | | | | | | | |
| | | | | | | 20,312,499 | |
| | | | | | | | |
| | | | Consumer Durables & Apparel - 4.8% | | | |
| | 13,020 | | | Arctic Cat, Inc. | | | 462,080 | |
| | 26,627 | | | Crocs, Inc.(1) | | | 351,476 | |
| | 151,700 | | | GoPro, Inc. Class A(1) | | | 7,597,136 | |
| | 9,495 | | | iRobot Corp.(1) | | | 307,828 | |
| | 318,927 | | | Kate Spade & Co.(1) | | | 10,428,913 | |
| | 11,191 | | | M/I Schottenstein Homes, Inc.(1) | | | 252,469 | |
| | 23,509 | | | New Home Co., Inc.(1) | | | 348,874 | |
| | 8,096 | | | Oxford Industries, Inc. | | | 643,227 | |
| | 1,628,070 | | | Samsonite International S.A. | | | 5,937,845 | |
| | 92,255 | | | Skechers USA, Inc. Class A(1) | | | 8,295,570 | |
| | 191,246 | | | Steven Madden Ltd.(1) | | | 7,462,419 | |
| | 17,095 | | | Taylor Morrison Home Corp. Class A(1) | | | 316,599 | |
| | 178,050 | | | Vince Holding Corp.(1) | | | 3,281,461 | |
| | 4,500 | | | William Lyon Homes Class A(1) | | | 97,425 | |
| | | | | | | | |
| | | | | | | 45,783,322 | |
| | | | | | | | |
| | | | Consumer Services - 3.8% | | | |
| | 37,033 | | | Bloomin’ Brands, Inc. | | | 839,168 | |
| | 8,515 | | | Brinker International, Inc. | | | 471,476 | |
| | 26,729 | | | Buffalo Wild Wings, Inc.(1) | | | 4,257,930 | |
| | 42,896 | | | Del Frisco’s Restaurant Group, Inc.(1) | | | 865,212 | |
| | 530,360 | | | Diamond Resorts International, Inc.(1) | | | 16,976,824 | |
| | 37,899 | | | Jack in the Box, Inc. | | | 3,288,496 | |
| | 20,560 | | | La Quinta Holdings, Inc.(1) | | | 495,085 | |
| | 9,720 | | | Marriott Vacations Worldwide Corp. | | | 799,081 | |
| | 44,273 | | | Panera Bread Co. Class A(1) | | | 8,078,937 | |
| | 3,016 | | | Red Robin Gourmet Burgers, Inc.(1) | | | 226,471 | |
| | 16,500 | | | Ruth’s Hospitality Group, Inc. | | | 240,075 | |
| | | | | | | | |
| | | | | | | 36,538,755 | |
| | | | | | | | |
| | | | Diversified Financials - 2.8% | | | |
| | 9,500 | | | Alaris Royalty Corp. | | | 273,622 | |
| | 10,495 | | | Evercore Partners, Inc. Class A | | | 506,279 | |
| | 82,355 | | | Financial Engines, Inc. | | | 3,472,911 | |
| | 244,441 | | | HFF, Inc. Class A | | | 9,579,643 | |
| | 64,198 | | | MarketAxess Holdings, Inc. | | | 5,511,398 | |
| | 83,466 | | | Platform Specialty Products Corp.(1) | | | 2,248,574 | |
| | 19,973 | | | Regional Management Corp.(1) | | | 322,564 | |
| | 249,081 | | | Wisdomtree Investments, Inc. | | | 4,742,502 | |
| | | | | | | | |
| | | | | | | 26,657,493 | |
| | | | | | | | |
| | | | Energy - 2.8% | | | |
| | 51,838 | | | Abraxas Petroleum Corp.(1) | | | 196,984 | |
| | 15,500 | | | Bill Barrett Corp.(1) | | | 179,800 | |
| | 134,741 | | | Diamondback Energy, Inc.(1) | | | 11,125,564 | |
| | 12,567 | | | Forum Energy Technologies, Inc.(1) | | | 292,309 | |
| | 6,700 | | | Hornbeck Offshore Services, Inc.(1) | | | 153,095 | |
| | 7,095 | | | Jones Energy, Inc. Class A(1) | | | 72,795 | |
| | 101,680 | | | Karoon Gas Australia Ltd.(1) | | | 219,102 | |
| | 436,400 | | | Malakoff Corp. Bhd(1) | | | 220,559 | |
The accompanying notes are an integral part of these financial statements.
|
| The Hartford Small Company Fund |
Schedule of Investments – (continued)
April 30, 2015 (Unaudited)
| | | | | | | | |
Shares or Principal Amount | | Market Value* | |
| COMMON STOCKS - 95.1% - (continued) | |
| | | | Energy - 2.8% - (continued) | | | |
| | 6,530 | | | PBF Energy, Inc. Class A | | $ | 185,321 | |
| | 15,905 | | | Rosetta Resources, Inc.(1) | | | 363,111 | |
| | 447,765 | | | RSP Permian, Inc.(1) | | | 12,994,140 | |
| | 65,190 | | | Superior Drilling Products I(1) | | | 237,357 | |
| | 13,322 | | | Synergy Resources Corp.(1) | | | 159,598 | |
| | | | | | | | |
| | | | | | | 26,399,735 | |
| | | | | | | | |
| | | | Food & Staples Retailing - 0.3% | | | |
| | 12,950 | | | Casey’s General Stores, Inc. | | | 1,064,231 | |
| | 21,615 | | | Natural Grocers by Vitamin Cottage, Inc.(1) | | | 568,907 | |
| | 8,715 | | | PriceSmart, Inc. | | | 701,209 | |
| | | | | | | | |
| | | | | | | 2,334,347 | |
| | | | | | | | |
| | | | Food, Beverage & Tobacco - 0.9% | | | |
| | 17,056 | | | Darling Ingredients, Inc.(1) | | | 232,985 | |
| | 126,395 | | | Freshpet, Inc.(1) | | | 2,740,244 | |
| | 8,750 | | | Post Holdings, Inc.(1) | | | 410,725 | |
| | 446,931 | | | SunOpta, Inc.(1) | | | 4,621,266 | |
| | 11,390 | | | TreeHouse Foods, Inc.(1) | | | 925,551 | |
| | | | | | | | |
| | | | | | | 8,930,771 | |
| | | | | | | | |
| | | | Health Care Equipment &
Services - 9.9% | |
| | 199,766 | | | Acadia Healthcare Co., Inc.(1) | | | 13,683,971 | |
| | 13,863 | | | Aceto Corp. | | | 268,665 | |
| | 7,677 | | | Anika Therapeutics, Inc.(1) | | | 261,939 | |
| | 1,460 | | | Atrion Corp. | | | 474,281 | |
| | 95,701 | | | Cardiovascular Systems, Inc.(1) | | | 2,995,441 | |
| | 7,316 | | | Cyberonics, Inc.(1) | | | 445,618 | |
| | 13,180 | | | Cynosure, Inc. Class A(1) | | | 440,476 | |
| | 212,705 | | | DexCom, Inc.(1) | | | 14,372,477 | |
| | 349,924 | | | Endologix, Inc.(1) | | | 5,444,817 | |
| | 8,026 | | | Ensign Group, Inc. | | | 337,975 | |
| | 260,181 | | | Envision Healthcare Holdings, Inc.(1) | | | 9,876,471 | |
| | 44,536 | | | Globus Medical, Inc. Class A(1) | | | 1,063,965 | |
| | 22,896 | | | HealthSouth Corp. | | | 1,035,357 | |
| | 127,187 | | | HeartWare International, Inc.(1) | | | 9,629,328 | |
| | 7,285 | | | ICU Medical, Inc.(1) | | | 614,635 | |
| | 401,103 | | | Insulet Corp.(1) | | | 11,972,924 | |
| | 183,072 | | | LDR Holding Corp.(1) | | | 6,196,987 | |
| | 3,141 | | | MEDNAX, Inc.(1) | | | 222,320 | |
| | 4,633 | | | Natus Medical, Inc.(1) | | | 174,710 | |
| | 18,745 | | | Omnicell, Inc.(1) | | | 666,010 | |
| | 14,405 | | | Team Health Holdings, Inc.(1) | | | 858,106 | |
| | 14,982 | | | U.S. Physical Therapy, Inc. | | | 706,551 | |
| | 22,382 | | | Vascular Solutions, Inc.(1) | | | 717,567 | |
| | 460,305 | | | Veeva Systems, Inc. Class A(1) | | | 12,221,098 | |
| | 7,716 | | | WellCare Health Plans, Inc.(1) | | | 597,450 | |
| | | | | | | | |
| | | | | | | 95,279,139 | |
| | | | | | | | |
| | | | Insurance - 0.9% | | | |
| | 15,660 | | | AMERISAFE, Inc. | | | 707,676 | |
| | 267,794 | | | Assured Guaranty Ltd. | | | 6,959,966 | |
| | 25,984 | | | James River Group Holdings Ltd. | | | 614,262 | |
| | 2,558 | | | Phoenix Cos., Inc.(1) | | | 87,253 | |
| | | | | | | | |
| | | | | | | 8,369,157 | |
| | | | | | | | |
| | | | Materials - 4.5% | | | |
| | 15,101 | | | Advanced Emissions Solutions, Inc.(1) | | | 217,605 | |
| | 16,518 | | | Boise Cascade Co.(1) | | | 573,175 | |
| | 9,035 | | | Cabot Corp. | | | 386,156 | |
| | 1,069,645 | | | Graphic Packaging Holding Co. | | | 15,081,994 | |
| | 1,859 | | | Haynes International, Inc. | | | 82,670 | |
| | | | | | | | |
Shares or Principal Amount | | Market Value* | |
| COMMON STOCKS - 95.1% - (continued) | |
| | | | Materials - 4.5% - (continued) | | | |
| | 875,603 | | | Headwaters, Inc.(1) | | $ | 15,393,101 | |
| | 240,469 | | | KapStone Paper & Packaging Corp. | | | 6,721,108 | |
| | 18,552 | | | Myers Industries, Inc. | | | 299,986 | |
| | 17,418 | | | New Gold, Inc.(1) | | | 58,873 | |
| | 51,240 | | | OMNOVA Solutions, Inc.(1) | | | 409,408 | |
| | 13,551 | | | Orion Engineered Carbons S.A. | | | 265,328 | |
| | 95,104 | | | Platform Specialty Products Corp.(1) | | | 2,562,102 | |
| | 20,685 | | | PolyOne Corp. | | | 807,749 | |
| | 11,102 | | | Silgan Holdings, Inc. | | | 598,065 | |
| | | | | | | | |
| | | | | | | 43,457,320 | |
| | | | | | | | |
| | | | Media - 2.1% | | | |
| | 393,540 | | | IMAX Corp.(1) | | | 14,702,654 | |
| | 221,817 | | | Markit, Ltd.(1) | | | 5,689,606 | |
| | | | | | | | |
| | | | | | | 20,392,260 | |
| | | | | | | | |
| | | | Pharmaceuticals, Biotechnology & Life Sciences - 9.6% | |
| | 304,323 | | | Achillion Pharmaceuticals, Inc.(1) | | | 2,662,826 | |
| | 18,445 | | | Acorda Therapeutics, Inc.(1) | | | 554,641 | |
| | 147,025 | | | Aerie Pharmaceuticals, Inc.(1) | | | 1,417,321 | |
| | 55,538 | | | Agios Pharmaceuticals, Inc.(1) | | | 5,128,379 | |
| | 16,577 | | | Albany Molecular Research, Inc.(1) | | | 299,381 | |
| | 10,450 | | | Alkermes plc(1) | | | 578,617 | |
| | 36,208 | | | Alnylam Pharmaceuticals, Inc.(1) | | | 3,688,509 | |
| | 141,884 | | | Anacor Pharmaceuticals, Inc.(1) | | | 7,475,868 | |
| | 57,524 | | | Arena Pharmaceuticals, Inc.(1) | | | 250,805 | |
| | 5,320 | | | Avalanche Biotechnologies, Inc.(1) | | | 169,495 | |
| | 186 | | | Bellicum Pharmaceuticals, Inc.(1) | | | 4,460 | |
| | 379,062 | | | BioCryst Pharmaceuticals, Inc.(1) | | | 3,521,486 | |
| | 7,500 | | | Blueprint Medicines Corp.(1) | | | 141,525 | |
| | 22,836 | | | Cara Therapeutics, Inc.(1) | | | 245,487 | |
| | 78,083 | | | Cepheid(1) | | | 4,380,456 | |
| | 10,543 | | | Dicerna Pharmaceuticals, Inc.(1) | | | 211,598 | |
| | 14,200 | | | Five Prime Therapeutics, Inc.(1) | | | 284,852 | |
| | 13,200 | | | GlycoMimetics, Inc.(1) | | | 109,428 | |
| | 126,779 | | | Intersect ENT, Inc.(1) | | | 3,181,519 | |
| | 277,321 | | | Ironwood Pharmaceuticals, Inc.(1) | | | 3,788,205 | |
| | 56,509 | | | Isis Pharmaceuticals, Inc.(1) | | | 3,205,190 | |
| | 19,740 | | | KemPharm, Inc.(1) | | | 217,140 | |
| | 8,930 | | | KYTHERA Biopharmaceuticals, Inc.(1) | | | 390,152 | |
| | 19,455 | | | Medicines Co.(1) | | | 498,243 | |
| | 500,634 | | | Novavax, Inc.(1) | | | 3,869,901 | |
| | 135,963 | | | Otonomy, Inc.(1) | | | 3,567,669 | |
| | 12,562 | | | PAREXEL International Corp.(1) | | | 798,629 | |
| | 5,185 | | | Philbro Animal Health Corp. Class A | | | 164,676 | |
| | 229,871 | | | Portola Pharmaceuticals, Inc.(1) | | | 8,204,096 | |
| | 9,605 | | | Prestige Brands Holdings, Inc.(1) | | | 376,996 | |
| | 126,299 | | | PTC Therapeutics, Inc.(1) | | | 7,420,066 | |
| | 13,579 | | | Puma Biotechnology, Inc.(1) | | | 2,452,096 | |
| | 190,468 | | | Regulus Therapeutics, Inc.(1) | | | 2,390,373 | |
| | 113,776 | | | Relypsa, Inc.(1) | | | 3,291,540 | |
| | 44,002 | | | Synageva BioPharma Corp.(1) | | | 4,046,424 | |
| | 144,850 | | | TESARO, Inc.(1) | | | 7,889,979 | |
| | 104,039 | | | Tetraphase Pharmaceuticals, Inc.(1) | | | 3,670,496 | |
| | 41,926 | | | Trevana, Inc.(1) | | | 258,683 | |
| | 7,060 | | | Ultragenyx Pharmaceutical, Inc.(1) | | | 398,396 | |
| | 62,455 | | | XenoPort, Inc.(1) | | | 370,358 | |
| | 18,458 | | | Zafgen, Inc.(1) | | | 574,413 | |
| | | | | | | | |
| | | | | | | 92,150,374 | |
| | | | | | | | |
The accompanying notes are an integral part of these financial statements.
|
| The Hartford Small Company Fund |
Schedule of Investments – (continued)
April 30, 2015 (Unaudited)
| | | | | | | | |
Shares or Principal Amount | | Market Value* | |
| COMMON STOCKS - 95.1% - (continued) | |
| | | | Real Estate - 3.7% | | | |
| | 36,741 | | | Arbor Realty Trust, Inc. REIT | | $ | 252,043 | |
| | 23,248 | | | Armada Hoffler Properties, Inc. REIT | | | 238,757 | |
| | 22,055 | | | CareTrust, Inc. REIT | | | 275,467 | |
| | 12,816 | | | Coresite Realty Corp. REIT | | | 616,193 | |
| | 15,739 | | | Easterly Government Properties, Inc. REIT(1) | | | 247,889 | |
| | 192,800 | | | Hannon Armstrong Sustainable Infrastructure Capital, Inc. REIT | | | 3,663,200 | |
| | 386,597 | | | Kennedy-Wilson Holdings, Inc. | | | 9,579,873 | |
| | 4,207 | | | Marcus & Millichap, Inc.(1) | | | 148,844 | |
| | 20,611 | | | Medical Properties Trust, Inc. REIT | | | 288,142 | |
| | 595,962 | | | Paramount Group, Inc. REIT | | | 10,918,024 | |
| | 189,616 | | | Pebblebrook Hotel Trust REIT | | | 8,142,111 | |
| | 13,664 | | | STAG Industrial, Inc. REIT | | | 296,919 | |
| | 20,213 | | | Summit Hotel Properties, Inc. REIT | | | 266,205 | |
| | 40,191 | | | Sunstone Hotel Investors, Inc. REIT | | | 626,176 | |
| | | | | | | | |
| | | | | | | 35,559,843 | |
| | | | | | | | |
| | | | Retailing - 2.2% | | | |
| | 3,136,600 | | | Allstar Co.(1)(2)(3) | | | 3,230,698 | |
| | 13,361 | | | Core-Mark Holding Co., Inc. | | | 704,258 | |
| | 180,886 | | | CST Brands, Inc. | | | 7,544,755 | |
| | 18,744 | | | DSW, Inc. Class A | | | 679,845 | |
| | 20,885 | | | Five Below, Inc.(1) | | | 704,242 | |
| | 13,605 | | | HSN, Inc. | | | 849,224 | |
| | 12,400 | | | Party City Holdco, Inc.(1) | | | 257,796 | |
| | 46,848 | | | Pier 1 Imports, Inc. | | | 592,627 | |
| | 11,597 | | | Shoe Carnival, Inc. | | | 302,798 | |
| | 325,618 | | | Tuesday Morning Corp.(1) | | | 5,151,277 | |
| | 31,120 | | | Wayfair, Inc. Class A(1) | | | 999,575 | |
| | 13,740 | | | zulily, Inc. Class A(1) | | | 171,269 | |
| | | | | | | | |
| | | | | | | 21,188,364 | |
| | | | | | | | |
| | | | Semiconductors & Semiconductor Equipment - 5.3% | |
| | 69,687 | | | Ambarella, Inc.(1) | | | 5,097,604 | |
| | 34,216 | | | Exar Corp.(1) | | | 337,712 | |
| | 19,365 | | | Inphi Corp.(1) | | | 415,379 | |
| | 198,924 | | | Mellanox Technologies Ltd.(1) | | | 9,247,977 | |
| | 134,064 | | | Power Integrations, Inc. | | | 6,634,827 | |
| | 11,524 | | | Qorvo, Inc.(1) | | | 759,547 | |
| | 20,865 | | | Rambus, Inc.(1) | | | 288,772 | |
| | 197,604 | | | SunEdison Semiconductor Ltd.(1) | | | 4,412,497 | |
| | 398,297 | | | SunEdison, Inc.(1) | | | 10,084,880 | |
| | 237,868 | | | SunPower Corp.(1) | | | 7,656,971 | |
| | 69,076 | | | Synaptics, Inc.(1) | | | 5,852,119 | |
| | | | | | | | |
| | | | | | | 50,788,285 | |
| | | | | | | | |
| | | | Software & Services - 18.0% | |
| | 161,101 | | | Apigee Corp.(1) | | | 2,331,131 | |
| | 14,440 | | | Aspen Technology, Inc.(1) | | | 640,992 | |
| | 4,870 | | | CACI International, Inc. Class A(1) | | | 429,729 | |
| | 11,165 | | | Cass Information Systems, Inc. | | | 583,595 | |
| | 14,300 | | | comScore, Inc.(1) | | | 748,748 | |
| | 235,964 | | | Constant Contact, Inc.(1) | | | 8,223,345 | |
| | 77,519 | | | CoStar Group, Inc.(1) | | | 15,847,209 | |
| | 9,503 | | | CSG Systems International, Inc. | | | 276,727 | |
| | 61,884 | | | Demandware, Inc.(1) | | | 3,812,054 | |
| | 3,331 | | | Digimarc Corp. | | | 77,945 | |
| | 13,947 | | | Ellie Mae, Inc.(1) | | | 767,085 | |
| | 112,723 | | | Envestnet, Inc.(1) | | | 5,778,181 | |
| | 16,444 | | | ePlus, Inc.(1) | | | 1,364,194 | |
| | 29,972 | | | Everyday Health, Inc.(1) | | | 367,457 | |
| | 30,463 | | | Exlservice Holdings, Inc.(1) | | | 1,048,841 | |
| | | | | | | | |
Shares or Principal Amount | | Market Value* | |
| COMMON STOCKS - 95.1% - (continued) | |
| | | | Software & Services - 18.0% - (continued) | |
| | 12,020 | | | Fair Isaac Corp. | | $ | 1,063,289 | |
| | 55,835 | | | Five9, Inc.(1) | | | 303,184 | |
| | 242,553 | | | Fleetmatics Group Ltd.(1) | | | 11,055,566 | |
| | 51,207 | | | Global Cash Access, Inc.(1) | | | 378,932 | |
| | 13,400 | | | GoDaddy, Inc. Class A(1) | | | 335,938 | |
| | 122,496 | | | Heartland Payment Systems, Inc. | | | 6,235,046 | |
| | 217,375 | | | HubSpot, Inc.(1) | | | 8,414,586 | |
| | 15,220 | | | j2 Global, Inc. | | | 1,055,811 | |
| | 13,838 | | | Manhattan Associates, Inc.(1) | | | 727,325 | |
| | 55,628 | | | Marchex, Inc. Class B | | | 236,419 | |
| | 216,461 | | | Marketo, Inc.(1) | | | 6,158,315 | |
| | 121,578 | | | MAXIMUS, Inc. | | | 7,782,208 | |
| | 36,590 | | | Model N, Inc.(1) | | | 429,933 | |
| | 13,795 | | | NetScout Systems, Inc.(1) | | | 566,975 | |
| | 12,460 | | | Nuance Communications, Inc.(1) | | | 191,012 | |
| | 15,960 | | | Perficient, Inc.(1) | | | 329,255 | |
| | 23,380 | | | PTC, Inc.(1) | | | 896,389 | |
| | 13,580 | | | Q2 Holdings, Inc.(1) | | | 276,353 | |
| | 11,675 | | | Qualys, Inc.(1) | | | 578,146 | |
| | 29,452 | | | Sapiens International Corp. N.V.(1) | | | 257,116 | |
| | 157,089 | | | Shutterstock, Inc.(1) | | | 10,601,937 | |
| | 26,662 | | | Silver Spring Networks, Inc.(1) | | | 259,155 | |
| | 10,072 | | | Solera Holdings, Inc. | | | 488,693 | |
| | 26,676 | | | Tangoe, Inc.(1) | | | 364,928 | |
| | 667,714 | | | Telogis, Inc.(1)(2)(3) | | | 514,140 | |
| | 7,210 | | | Textura Corp.(1) | | | 188,686 | |
| | 152,194 | | | TrueCar, Inc.(1) | | | 2,346,832 | |
| | 113,976 | | | Tyler Technologies Corp.(1) | | | 13,899,373 | |
| | 192,638 | | | Verint Systems, Inc.(1) | | | 11,833,752 | |
| | 270,664 | | | Virtusa Corp.(1) | | | 10,772,427 | |
| | 12,630 | | | WebMD Health Corp.(1) | | | 557,615 | |
| | 77,446 | | | WEX, Inc.(1) | | | 8,728,939 | |
| | 493,798 | | | WNS Holdings Ltd. ADR(1) | | | 11,915,346 | |
| | 30,500 | | | Zendesk, Inc.(1) | | | 703,330 | |
| | 100,371 | | | Zillow Group, Inc. Class A(1) | | | 9,800,224 | |
| | 68,474 | | | Zix Corp.(1) | | | 291,699 | |
| | | | | | | | |
| | | | | | | 172,836,107 | |
| | | | | | | | |
| | | | Technology Hardware & Equipment - 2.1% | |
| | 117,068 | | | Arista Networks, Inc.(1) | | | 7,493,523 | |
| | 16,176 | | | CalAmp Corp.(1) | | | 318,829 | |
| | 15,755 | | | CDW Corp. of Delaware | | | 603,732 | |
| | 19,320 | | | Ciena Corp.(1) | | | 411,516 | |
| | 127,141 | | | Cognex Corp.(1) | | | 5,707,359 | |
| | 10,000 | | | Control4 Corp.(1) | | | 117,200 | |
| | 4,305 | | | FEI Co. | | | 324,855 | |
| | 42,357 | | | Mitel Networks Corp.(1) | | | 393,496 | |
| | 10,800 | | | Newport Corp.(1) | | | 205,956 | |
| | 150,833 | | | Nimble Storage, Inc.(1) | | | 3,689,375 | |
| | 115,230 | | | ParkerVision, Inc.(1) | | | 78,356 | |
| | 13,515 | | | Radware Ltd.(1) | | | 319,900 | |
| | 21,892 | | | Sonus Networks, Inc.(1) | | | 173,385 | |
| | 84,493 | | | Speed Commerce, Inc.(1) | | | 25,492 | |
| | 10,445 | | | Ubiquiti Networks, Inc. | | | 298,414 | |
| | | | | | | | |
| | | | | | | 20,161,388 | |
| | | | | | | | |
| | | | Transportation - 4.5% | |
| | 29,277 | | | Celadon Group, Inc. | | | 756,518 | |
| | 196,969 | | | Landstar System, Inc. | | | 12,273,138 | |
| | 14,452 | | | Marten Transport Ltd. | | | 321,702 | |
| | 110,233 | | | Old Dominion Freight Line, Inc.(1) | | | 7,840,873 | |
The accompanying notes are an integral part of these financial statements.
|
| The Hartford Small Company Fund |
Schedule of Investments – (continued)
April 30, 2015 (Unaudited)
| | | | | | | | |
Shares or Principal Amount | | Market Value* | |
| COMMON STOCKS - 95.1% - (continued) | |
| | | | Transportation - 4.5% - (continued) | |
| | 6,133 | | | Park-Ohio Holdings Corp. | | $ | 284,142 | |
| | 87,293 | | | Spirit Airlines, Inc.(1) | | | 5,976,952 | |
| | 435,574 | | | Swift Transportation Co.(1) | | | 10,540,891 | |
| | 101,459 | | | XPO Logistics, Inc.(1) | | | 4,920,761 | |
| | | | | | | | |
| | | | | | | 42,914,977 | |
| | | | | | | | |
| | | | Utilities - 0.1% | |
| | 4,899 | | | ALLETE, Inc. | | | 246,419 | |
| | 9,360 | | | Pattern Energy Group, Inc. | | | 271,253 | |
| | 18,700 | | | Spark Energy, Inc. Class A | | | 233,750 | |
| | | | | | | | |
| | | | | | | 751,422 | |
| | | | | | | | |
| | |
| | | | Total Common Stocks
(cost $817,364,266) | | $ | 911,304,609 | |
| | | | | | | | |
|
| EXCHANGE TRADED FUNDS - 0.5% | |
| | | | Other Investment Pools & Funds - 0.5% | |
| | 8,708 | | | iShares Russell 2000 ETF | | $ | 1,055,061 | |
| | 24,090 | | | iShares Russell 2000 Growth ETF | | | 3,542,435 | |
| | | | | | | | |
| | |
| | | | Total Exchange Traded Funds
(cost $4,748,339) | | $ | 4,597,496 | |
| | | | | | | | |
|
| PREFERRED STOCKS - 2.8% | |
| | | | Pharmaceuticals, Biotechnology & Life Sciences - 0.0% | |
| | 92,973 | | | Sancilio & Co., Inc.(1)(2)(3) | | $ | 316,043 | |
| | | | | | | | |
| | | | Retailing - 0.5% | |
| | 65,552 | | | Tory Burch LLC(1)(2)(3) | | | 4,393,949 | |
| | | | | | | | |
| | | | Software & Services - 1.9% | |
| | 118,679 | | | Apigee Corp. PIPE(1)(2)(3) | | | 1,551,281 | |
| | 106,123 | | | Cloudera, Inc.(1)(2)(3) | | | 3,151,853 | |
| | 263,189 | | | MarkLogic Corp. Series F(1)(2)(3) | | | 2,751,056 | |
| | 129,162 | | | Nutanix, Inc.(1)(2)(3) | | | 2,297,792 | |
| | 909,316 | | | Telogis, Inc.(1)(2)(3) | | | 3,910,059 | |
| | 98,033 | | | Veracode, Inc.(1)(2)(3) | | | 2,791,980 | |
| | 658,164 | | | Zuora, Inc. Series F(1)(2)(3) | | | 2,250,506 | |
| | | | | | | | |
| | | | | | | 18,704,527 | |
| | | | | | | | |
| | | | Technology Hardware & Equipment - 0.2% | | | |
| | 122,994 | | | Pure Storage, Inc.(1)(2)(3) | | | 2,029,401 | |
| | | | | | | | |
| | | | Telecommunication Services - 0.2% | | | |
| | 4,044 | | | DocuSign, Inc. Series B(1)(2)(3) | | | 77,213 | |
| | 1,211 | | | DocuSign, Inc. Series B-1(1)(2)(3) | | | 23,122 | |
| | 2,906 | | | DocuSign, Inc. Series D(1)(2)(3) | | | 55,485 | |
| | 75,160 | | | DocuSign, Inc. Series E(1)(2)(3) | | | 1,435,037 | |
| | 14,065 | | | DocuSign, Inc. Series F(1)(2)(3) | | | 268,544 | |
| | | | | | | | |
| | | | | | | 1,859,401 | |
| | | | | | | | |
| | |
| | | | Total Preferred Stocks
(cost $23,962,748) | | $ | 27,303,321 | |
| | | | | | | | |
|
| CONVERTIBLE PREFERRED STOCKS - 0.0% | |
| | | | Capital Goods - 0.0% | | | |
| | 2,268 | | | William Lyon Homes, Inc., 6.50% | | $ | 255,830 | |
| | | | | | | | |
| | |
| | | | Total Convertible Preferred Stocks
(cost $226,800) | | $ | 255,830 | |
| | | | | | | | |
| | | | | | | | |
Shares or Principal Amount | | Market Value* | |
| WARRANTS - 1.0% | |
| | | | Diversified Financials - 1.0% | | | |
| | 369,104 | | | Platform Specialty Products Corp.(1) | | $ | 9,943,662 | |
| | | | | | | | |
| | | | Total Warrants
(cost $7,012,976) | | $ | 9,943,662 | |
| | | | | | | | |
| | | | Total Long-Term Investments
(cost $853,315,129) | | $ | 953,404,918 | |
| | | | | | | | |
|
| SHORT-TERM INVESTMENTS - 0.6% | |
| | | | Other Investment Pools & Funds - 0.6% | | | |
| | 5,634,666 | | | Federated Prime Obligations Fund | | $ | 5,634,666 | |
| | | | | | | | |
| | |
| | | | Total Short-Term Investments
(cost $5,634,666) | | $ | 5,634,666 | |
| | | | | | | | |
| | | | | | | | | | |
| | | |
| | Total Investments
(cost $858,949,795)^ | | | 100.0 | % | | $ | 959,039,584 | |
| | Other Assets and Liabilities | | | 0.0 | % | | | (279,002 | ) |
| | | | | | | | | | |
| | Total Net Assets | | | 100.0 | % | | $ | 958,760,582 | |
| | | | | | | | | | |
The accompanying notes are an integral part of these financial statements.
|
| The Hartford Small Company Fund |
Schedule of Investments – (continued)
April 30, 2015 (Unaudited)
| Note: | Percentage of investments as shown is the ratio of the total market value to total net assets. |
| | Prices of foreign equities that are principally traded on certain foreign markets may be adjusted daily pursuant to a fair value pricing service approved by the Board of Directors in order to reflect an adjustment for factors occurring after the close of certain foreign markets but before the close of the New York Stock Exchange. |
| | The Fund may refer to any one or more of the industry classifications used by one or more widely recognized market indices, ratings group indices and/or as defined by Fund management. Industry classifications may not be identical across all security types. |
| | Other than the industry classifications “Other Investment Pools and Funds” and “Exchange Traded Funds,” equity industry classifications used in this report are the Global Industry Classification Standard, which was developed by and is the exclusive property and service mark of MSCI, Inc. and Standard & Poor’s. |
| | For Fund compliance purposes, the Fund may not use the same classification system shown in this report as these classifications are used for reporting ease. |
| ^ | At April 30, 2015, the cost of securities for federal income tax purposes was $861,605,017 and the aggregate gross unrealized appreciation and depreciation based on that cost were: |
| | | | |
Unrealized Appreciation | | $ | 133,220,825 | |
Unrealized Depreciation | | | (35,786,258 | ) |
| | | | |
Net Unrealized Appreciation | | $ | 97,434,567 | |
| | | | |
| (1) | Non-income producing. |
| (2) | These securities are valued in good faith at fair value as determined under policies and procedures established by and under the supervision of the Board of Directors. At April 30, 2015, the aggregate fair value of these securities were $31,048,159, which represents 3.2% of total net assets. This amount excludes securities that are principally traded in certain foreign markets and whose prices are adjusted pursuant to a third party pricing service methodology approved by the Board of Directors. |
| (3) | The following securities are considered illiquid. Illiquid securities are often purchased in private placement transactions, are often not registered under the Securities Act of 1933, as amended, and may have contractual restrictions on resale. A security may also be considered illiquid if the security lacks a readily available market or if its valuation has not changed for a certain period of time. |
| | | | | | | | | | |
Period
Acquired | | Shares/Par | | | Security | | Cost | |
08/2011 | | | 3,136,600 | | | Allstar Co. | | $ | 1,364,479 | |
04/2014 | | | 118,679 | | | Apigee Corp. PIPE Preferred | | | 2,532,302 | |
02/2014 | | | 106,123 | | | Cloudera, Inc. Preferred | | | 1,545,151 | |
02/2014 | | | 4,044 | | | DocuSign, Inc. Series B Preferred | | | 53,108 | |
02/2014 | | | 1,211 | | | DocuSign, Inc. Series B-1 Preferred | | | 15,903 | |
02/2014 | | | 2,906 | | | DocuSign, Inc. Series D Preferred | | | 38,163 | |
02/2014 | | | 75,160 | | | DocuSign, Inc. Series E Preferred | | | 987,031 | |
04/2015 | | | 14,065 | | | DocuSign, Inc. Series F Preferred | | | 268,544 | |
04/2015 | | | 263,189 | | | MarkLogic Corp. Series F Preferred | | | 3,056,730 | |
08/2014 | | | 129,162 | | | Nutanix, Inc. Preferred | | | 1,730,319 | |
04/2014 | | | 122,994 | | | Pure Storage, Inc. Preferred | | | 1,934,191 | |
05/2014 | | | 92,973 | | | Sancilio & Co., Inc. Preferred | | | 351,155 | |
09/2013 | | | 667,714 | | | Telogis, Inc. | | | 1,322,808 | |
09/2013 | | | 909,316 | | | Telogis, Inc. Preferred | | | 2,001,586 | |
11/2013 | | | 65,552 | | | Tory Burch LLC Preferred | | | 5,137,735 | |
08/2014 | | | 98,033 | | | Veracode, Inc. Preferred | | | 1,810,268 | |
01/2015 | | | 658,164 | | | Zuora, Inc. Series F Preferred | | | 2,500,562 | |
| | | | | | | | | | |
| | | | | | | | $ | 26,650,035 | |
| | | | | | | | | | |
At April 30, 2015, the aggregate value of these securities were $31,048,159, which represents 3.2% of total net assets.
| * | See Significant Accounting Policies of accompanying Notes to Financial Statements regarding valuation of securities. |
| | |
| GLOSSARY: (abbreviations used in preceding Schedule of Investments) |
|
| Other Abbreviations: |
ADR | | American Depositary Receipt |
ETF | | Exchange Traded Fund |
PIPE | | Private Investment in Public Equity |
REIT | | Real Estate Investment Trust |
The accompanying notes are an integral part of these financial statements.
|
| The Hartford Small Company Fund |
Schedule of Investments – (continued)
April 30, 2015 (Unaudited)
Fair Valuation Summary
The following is a summary of the fair valuations according to the inputs used as of April 30, 2015 in valuing the Fund’s investments.
| | | | | | | | | | | | | | | | |
| | | Total | | | Level 1(1) | | | Level 2(1) | | | Level 3 | |
Assets | | | | | | | | | | | | | | | | |
Common Stocks | | | | | | | | | | | | | | | | |
Automobiles & Components | | $ | 6,233,348 | | | $ | 6,233,348 | | | $ | — | | | $ | — | |
Banksw | | | 14,654,752 | | | | 14,654,752 | | | | — | | | | — | |
Capital Goods | | | 119,610,951 | | | | 119,610,951 | | | | — | | | | — | |
Commercial & Professional Services | | | 20,312,499 | | | | 20,312,499 | | | | — | | | | — | |
Consumer Durables & Apparel | | | 45,783,322 | | | | 39,845,477 | | | | 5,937,845 | | | | — | |
Consumer Services | | | 36,538,755 | | | | 36,538,755 | | | | — | | | | — | |
Diversified Financials | | | 26,657,493 | | | | 24,408,919 | | | | 2,248,574 | | | | — | |
Energy | | | 26,399,735 | | | | 26,180,633 | | | | 219,102 | | | | — | |
Food & Staples Retailing | | | 2,334,347 | | | | 2,334,347 | | | | — | | | | — | |
Food, Beverage & Tobacco | | | 8,930,771 | | | | 8,930,771 | | | | — | | | | — | |
Health Care Equipment & Services | | | 95,279,139 | | | | 95,279,139 | | | | — | | | | — | |
Insurance | | | 8,369,157 | | | | 8,369,157 | | | | — | | | | — | |
Materials | | | 43,457,320 | | | | 43,457,320 | | | | — | | | | — | |
Media | | | 20,392,260 | | | | 20,392,260 | | | | — | | | | — | |
Pharmaceuticals, Biotechnology & Life Sciences | | | 92,150,374 | | | | 92,150,374 | | | | — | | | | — | |
Real Estate | | | 35,559,843 | | | | 35,559,843 | | | | — | | | | — | |
Retailing | | | 21,188,364 | | | | 17,957,666 | | | | — | | | | 3,230,698 | |
Semiconductors & Semiconductor Equipment | | | 50,788,285 | | | | 50,788,285 | | | | — | | | | — | |
Software & Services | | | 172,836,107 | | | | 172,321,967 | | | | — | | | | 514,140 | |
Technology Hardware & Equipment | | | 20,161,388 | | | | 20,161,388 | | | | — | | | | — | |
Transportation | | | 42,914,977 | | | | 42,914,977 | | | | — | | | | — | |
Utilities | | | 751,422 | | | | 751,422 | | | | — | | | | — | |
Exchange Traded Funds | | | 4,597,496 | | | | 4,597,496 | | | | — | | | | — | |
Preferred Stocks | | | 27,303,321 | | | | — | | | | — | | | | 27,303,321 | |
Convertible Preferred Stocks | | | 255,830 | | | | 255,830 | | | | — | | | | — | |
Warrants | | | 9,943,662 | | | | — | | | | 9,943,662 | | | | — | |
Short-Term Investments | | | 5,634,666 | | | | 5,634,666 | | | | — | | | | — | |
| | | | | | | | | | | | | | | | |
Total | | $ | 959,039,584 | | | $ | 909,642,242 | | | $ | 18,349,183 | | | $ | 31,048,159 | |
| | | | | | | | | | | | | | | | |
| (1) | For the six-month period ended April 30, 2015, investments valued at $9,596,704 were transferred from Level 1 to Level 2, and investments valued at $194,959 were transferred from Level 2 to Level 1. Investments are transferred between Level 1 and Level 2 for a variety of reasons including, but not limited to: |
| | a) | Foreign equities for which a fair value price is more representative of exit value than the local market close (transfer into Level 2). Foreign equities for which the local market close is more representative of exit value (transfer into Level 1). |
| | b) | U.S. Treasury securities that no longer represent the most recent issue (transfer into Level 2). |
| | c) | Equity investments with no observable trading but a bid or mean price is used (transfer into Level 2). Equity investments using observable quoted prices in an active market (transfer into Level 1). |
The following is a rollforward of the Fund’s investments that were valued using unobservable inputs (Level 3) for the six-month period ended April 30, 2015:
| | | | | | | | | | | | |
| | | Common Stocks | | | Preferred Stock | | | Total | |
Beginning balance | | $ | 28,547,778 | | | | 20,281,239 | | | $ | 48,829,017 | |
Purchases | | | — | | | | 5,825,836 | | | | 5,825,836 | |
Sales | | | — | | | | — | | | | — | |
Accrued discounts/(premiums) | | | — | | | | — | | | | — | |
Total realized gain/(loss) | | | — | | | | — | | | | — | |
Net change in unrealized appreciation/depreciation | | | 541,643 | | | | 1,196,246 | | | | 1,737,889 | |
Transfers into Level 3(1) | | | — | | | | — | | | | — | |
Transfers out of Level 3(1) | | | (25,344,583 | ) | | | — | | | | (25,344,583 | ) |
| | | | | | | | | | | | |
Ending balance | | $ | 3,744,838 | | | $ | 27,303,321 | | | $ | 31,048,159 | |
The change in net unrealized appreciation/depreciation relating to the Level 3 investment held at April 30, 2015 was $1,737,889.
The accompanying notes are an integral part of these financial statements.
|
| The Hartford Small Company Fund |
Schedule of Investments – (continued)
April 30, 2015 (Unaudited)
| (1) | Investments are transferred into and out of Level 3 for a variety of reasons including, but not limited to: |
| | a) | Investments where trading has been halted (transfer into Level 3) or investments where trading has resumed (transfer out of Level 3). |
| | b) | Broker quoted investments (transfer into Level 3) or quoted prices in active markets (transfer out of Level 3). |
| | c) | Investments that have certain restrictions on trading (transfer into level 3) or investments where trading restrictions have expired (transfer out of Level 3). |
| Note: | For purposes of reporting transfers between different hierarchy levels, both transfers in and out of each level, as applicable, are shown as if they occurred at the beginning of the period. |
The accompanying notes are an integral part of these financial statements.
|
| The Hartford Small/Mid Cap Equity Fund |
Diversification by Sector
as of April 30, 2015 (Unaudited)
| | | | |
| Sector | | Percentage of
Net Assets | |
Equity Securities | | | | |
Consumer Discretionary | | | 16.3 | % |
Consumer Staples | | | 1.6 | |
Energy | | | 4.6 | |
Financials | | | 22.7 | |
Health Care | | | 12.0 | |
Industrials | | | 14.9 | |
Information Technology | | | 16.6 | |
Materials | | | 5.4 | |
Telecommunication Services | | | 0.4 | |
Utilities | | | 4.1 | |
| | | | |
Total | | | 98.6 | % |
| | | | |
Short-Term Investments | | | 2.2 | % |
Other Assets & Liabilities | | | (0.8 | ) |
| | | | |
Total | | | 100.0 | % |
| | | | |
A sector may be comprised of several industries. For Fund compliance purposes, the Fund may not use the same classification system and these sector classifications are used for reporting ease.
The accompanying notes are an integral part of these financial statements.
|
| The Hartford Small/Mid Cap Equity Fund |
Schedule of Investments
April 30, 2015 (Unaudited)
| | | | | | | | |
Shares or Principal Amount | | Market Value* | |
| COMMON STOCKS - 98.6% | |
| | | | Automobiles & Components - 1.2% | |
| | 6,360 | | | American Axle & Manufacturing Holdings, Inc.(1) | | $ | 158,555 | |
| | 4,979 | | | Cooper Tire & Rubber Co. | | | 211,558 | |
| | 3,440 | | | Lear Corp. | | | 381,943 | |
| | 1,700 | | | Strattec Security Corp. | | | 127,619 | |
| | | | | | | | |
| | | | | | | 879,675 | |
| | | | | | | | |
| | | | Banks - 3.1% | |
| | 4,500 | | | Banco Latinoamericano de Comercio Exterior S.A. ADR | | | 142,965 | |
| | 28,310 | | | Fifth Third Bancorp | | | 566,200 | |
| | 45,700 | | | Huntington Bancshares, Inc. | | | 496,302 | |
| | 9,971 | | | MainSource Financial Group, Inc. | | | 191,942 | |
| | 9,200 | | | OFG Bancorp | | | 129,628 | |
| | 16,536 | | | Popular, Inc.(1) | | | 536,262 | |
| | 13,400 | | | Walker & Dunlop, Inc.(1) | | | 256,476 | |
| | | | | | | | |
| | | | | | | 2,319,775 | |
| | | | | | | | |
| | | | Capital Goods - 8.3% | |
| | 4,897 | | | AAON, Inc. | | | 117,381 | |
| | 6,169 | | | AGCO Corp. | | | 317,765 | |
| | 5,100 | | | American Woodmark Corp.(1) | | | 258,570 | |
| | 5,400 | | | Argan, Inc. | | | 174,474 | |
| | 2,023 | | | Astronics Corp.(1) | | | 136,168 | |
| | 6,600 | | | Douglas Dynamics, Inc. | | | 143,550 | |
| | 13,349 | | | Enphase Energy, Inc.(1) | | | 167,797 | |
| | 2,300 | | | Huntington Ingalls Industries, Inc. | | | 302,657 | |
| | 2,800 | | | Hyster-Yale Materials Handling, Inc. | | | 205,352 | |
| | 19,800 | | | Meritor, Inc.(1) | | | 259,776 | |
| | 2,200 | | | Moog, Inc. Class A(1) | | | 153,736 | |
| | 1,157 | | | Proto Labs, Inc.(1) | | | 80,990 | |
| | 6,133 | | | Regal-Beloit Corp. | | | 479,601 | |
| | 4,813 | | | Snap-on, Inc. | | | 719,784 | |
| | 6,270 | | | Spirit Aerosystems Holdings, Inc. Class A(1) | | | 319,080 | |
| | 10,884 | | | Taser International, Inc.(1) | | | 328,588 | |
| | 1,400 | | | Teledyne Technologies, Inc.(1) | | | 146,958 | |
| | 4,200 | | | Timken Co. | | | 165,018 | |
| | 8,400 | | | Trex Co., Inc.(1) | | | 394,128 | |
| | 2,500 | | | Triumph Group, Inc. | | | 148,100 | |
| | 2,502 | | | United Rentals, Inc.(1) | | | 241,643 | |
| | 6,790 | | | Wabco Holdings, Inc.(1) | | | 845,016 | |
| | 4,859 | | | Woodward, Inc. | | | 228,616 | |
| | | | | | | | |
| | | | | | | 6,334,748 | |
| | | | | | | | |
| | | | Commercial & Professional Services - 3.8% | |
| | 8,100 | | | Brink’s Co. | | | 214,407 | |
| | 5,200 | | | Deluxe Corp. | | | 336,700 | |
| | 3,500 | | | Dun & Bradstreet Corp. | | | 446,845 | |
| | 3,300 | | | Insperity, Inc. | | | 158,928 | |
| | 4,800 | | | Korn/Ferry International | | | 151,344 | |
| | 2,234 | | | Multi-Color Corp. | | | 140,251 | |
| | 13,100 | | | Pitney Bowes, Inc. | | | 293,047 | |
| | 7,200 | | | Quad/Graphics, Inc. | | | 155,088 | |
| | 17,800 | | | R.R. Donnelley & Sons Co. | | | 331,436 | |
| | 2,500 | | | Robert Half International, Inc. | | | 138,625 | |
| | 8,700 | | | RPX Corp.(1) | | | 135,372 | |
| | 4,169 | | | TriNet Group, Inc.(1) | | | 145,998 | |
| | 2,400 | | | UniFirst Corp. | | | 271,752 | |
| | | | | | | | |
| | | | | | | 2,919,793 | |
| | | | | | | | |
| | | | Consumer Durables & Apparel - 2.9% | |
| | 6,034 | | | CSS Industries, Inc. | | | 171,004 | |
| | 780 | | | Harman International Industries, Inc. | | | 101,696 | |
| | | | | | | | |
Shares or Principal Amount | | Market Value* | |
| COMMON STOCKS - 98.6% - (continued) | |
| | | | Consumer Durables & Apparel - 2.9% - (continued) | |
| | 5,573 | | | Helen of Troy Ltd.(1) | | $ | 488,251 | |
| | 13,100 | | | Nautilus, Inc.(1) | | | 220,211 | |
| | 4,021 | | | Polaris Industries, Inc. | | | 550,716 | |
| | 69,800 | | | Quiksilver, Inc.(1) | | | 115,868 | |
| | 4,300 | | | Skechers USA, Inc. Class A(1) | | | 386,656 | |
| | 2,600 | | | Universal Electronics, Inc.(1) | | | 140,244 | |
| | | | | | | | |
| | | | | | | 2,174,646 | |
| | | | | | | | |
| | | | Consumer Services - 4.3% | |
| | 4,700 | | | American Public Education, Inc.(1) | | | 131,083 | |
| | 11,300 | | | Bridgepoint Education, Inc.(1) | | | 99,101 | |
| | 9,820 | | | Brinker International, Inc. | | | 543,734 | |
| | 1,150 | | | Buffalo Wild Wings, Inc.(1) | | | 183,195 | |
| | 2,498 | | | Capella Education Co. | | | 134,967 | |
| | 3,359 | | | Choice Hotels International, Inc. | | | 201,103 | |
| | 2,700 | | | DeVry Education Group, Inc. | | | 81,648 | |
| | 6,773 | | | Domino’s Pizza, Inc. | | | 730,468 | |
| | 13,700 | | | International Speedway Corp. Class A | | | 498,132 | |
| | 11,200 | | | LifeLock, Inc.(1) | | | 163,632 | |
| | 2,500 | | | Marriott Vacations Worldwide Corp. | | | 205,525 | |
| | 2,400 | | | Strayer Education, Inc.(1) | | | 121,728 | |
| | 20,460 | | | Weight Watchers International, Inc.(1) | | | 174,933 | |
| | | | | | | | |
| | | | | | | 3,269,249 | |
| | | | | | | | |
| | | | Diversified Financials - 3.2% | |
| | 56,961 | | | Apollo Investment Corp. | | | 455,688 | |
| | 16,600 | | | BGC Partners, Inc. Class A | | | 166,581 | |
| | 12,077 | | | Ezcorp, Inc. Class A(1) | | | 111,108 | |
| | 4,892 | | | Investment Technology Group, Inc.(1) | | | 139,373 | |
| | 16,144 | | | Janus Capital Group, Inc. | | | 288,978 | |
| | 6,310 | | | Nelnet, Inc. Class A | | | 282,499 | |
| | 10,515 | | | Solar Capital Ltd. | | | 207,776 | |
| | 5,860 | | | Springleaf Holdings, Inc.(1) | | | 293,000 | |
| | 13,500 | | | Wisdomtree Investments, Inc. | | | 257,040 | |
| | 2,900 | | | World Acceptance Corp.(1) | | | 245,398 | |
| | | | | | | | |
| | | | | | | 2,447,441 | |
| | | | | | | | |
| | | | Energy - 4.6% | |
| | 11,400 | | | Alon USA Energy, Inc. | | | 183,426 | |
| | 12,500 | | | Bill Barrett Corp.(1) | | | 145,000 | |
| | 4,081 | | | CVR Energy, Inc. | | | 163,403 | |
| | 4,100 | | | Delek US Holdings, Inc. | | | 151,372 | |
| | 66,944 | | | Frontline Ltd.(1) | | | 171,377 | |
| | 10,397 | | | Gulfmark Offshore, Inc. Class A | | | 156,059 | |
| | 24,120 | | | Kosmos Energy Ltd.(1) | | | 235,893 | |
| | 4,200 | | | Matrix Service Co.(1) | | | 92,274 | |
| | 5,600 | | | Oceaneering International, Inc. | | | 308,616 | |
| | 7,413 | | | Oil States International, Inc.(1) | | | 352,785 | |
| | 9,879 | | | Pacific Ethanol, Inc.(1) | | | 118,153 | |
| | 1,400 | | | REX American Resources Corp.(1) | | | 88,508 | |
| | 6,710 | | | Superior Energy Services, Inc. | | | 171,105 | |
| | 1,206 | | | Targa Resources Corp. | | | 126,594 | |
| | 4,400 | | | US Silica Holdings, Inc. | | | 164,340 | |
| | 11,324 | | | Valero Energy Corp. | | | 644,335 | |
| | 5,714 | | | Western Refining, Inc. | | | 251,702 | |
| | | | | | | | |
| | | | | | | 3,524,942 | |
| | | | | | | | |
| | | | Food & Staples Retailing - 0.4% | |
| | 5,030 | | | Fresh Market, Inc.(1) | | | 176,754 | |
| | 17,500 | | | Rite Aid Corp.(1) | | | 134,925 | |
| | | | | | | | |
| | | | | | | 311,679 | |
| | | | | | | | |
The accompanying notes are an integral part of these financial statements.
|
| The Hartford Small/Mid Cap Equity Fund |
Schedule of Investments – (continued)
April 30, 2015 (Unaudited)
| | | | | | | | |
Shares or Principal Amount | | Market Value* | |
| COMMON STOCKS - 98.6% - (continued) | |
| | | | Food, Beverage & Tobacco - 0.9% | |
| | 2,998 | | | Ingredion, Inc. | | $ | 238,041 | |
| | 17,500 | | | Pilgrim’s Pride Corp. | | | 432,250 | |
| | | | | | | | |
| | | | | | | 670,291 | |
| | | | | | | | |
| | | | Health Care Equipment & Services - 3.8% | |
| | 4,332 | | | ABIOMED, Inc.(1) | | | 273,869 | |
| | 2,158 | | | Aetna, Inc. | | | 230,625 | |
| | 7,400 | | | Centene Corp.(1) | | | 458,726 | |
| | 4,200 | | | Ensign Group, Inc. | | | 176,862 | |
| | 5,300 | | | Health Net, Inc.(1) | | | 279,045 | |
| | 7,100 | | | HealthEquity, Inc.(1) | | | 186,091 | |
| | 6,150 | | | Magellan Health, Inc.(1) | | | 389,295 | |
| | 4,400 | | | Orthofix International N.V.(1) | | | 142,164 | |
| | 25,008 | | | Quality Systems, Inc. | | | 390,000 | |
| | 6,351 | | | Triple-S Management Corp., Class B(1) | | | 118,891 | |
| | 5,400 | | | VCA, Inc.(1) | | | 275,238 | |
| | | | | | | | |
| | | | | | | 2,920,806 | |
| | | | | | | | |
| | | | Household & Personal Products - 0.3% | |
| | 2,000 | | | Usana Health Sciences, Inc.(1) | | | 227,480 | |
| | | | | | | | |
| | | | Insurance - 5.3% | |
| | 6,055 | | | Ambac Financial Group, Inc.(1) | | | 139,325 | |
| | 3,400 | | | AmTrust Financial Services, Inc. | | | 202,198 | |
| | 1,430 | | | Argo Group International Holdings Ltd. | | | 70,056 | |
| | 6,900 | | | Assurant, Inc. | | | 424,074 | |
| | 2,964 | | | Axis Capital Holdings Ltd. | | | 154,306 | |
| | 5,600 | | | Endurance Specialty Holdings Ltd. | | | 338,128 | |
| | 1,000 | | | Enstar Group Ltd.(1) | | | 142,040 | |
| | 2,940 | | | Everest Re Group Ltd. | | | 525,995 | |
| | 10,900 | | | Greenlight Capital Re Ltd. Class A(1) | | | 331,251 | |
| | 3,277 | | | HCI Group, Inc. | | | 142,812 | |
| | 18,200 | | | MBIA, Inc.(1) | | | 159,250 | |
| | 2,300 | | | Phoenix Cos., Inc.(1) | | | 78,453 | |
| | 2,900 | | | Reinsurance Group of America, Inc. | | | 265,698 | |
| | 19,200 | | | Symetra Financial Corp. | | | 456,000 | |
| | 10,779 | | | Third Point Reinsurance Ltd.(1) | | | 145,301 | |
| | 9,200 | | | United Insurance Holdings Corp. | | | 152,996 | |
| | 5,962 | | | Universal Insurance Holdings, Inc. | | | 143,207 | |
| | 3,700 | | | Validus Holdings Ltd. | | | 154,771 | |
| | | | | | | | |
| | | | | | | 4,025,861 | |
| | | | | | | | |
| | | | Materials - 5.4% | �� |
| | 6,000 | | | Boise Cascade Co.(1) | | | 208,200 | |
| | 9,187 | | | Century Aluminum Co.(1) | | | 118,420 | |
| | 4,940 | | | Clearwater Paper Corp.(1) | | | 316,012 | |
| | 4,535 | | | Commercial Metals Co. | | | 75,281 | |
| | 7,800 | | | Domtar Corp. | | | 337,116 | |
| | 25,700 | | | Gold Resource Corp. | | | 86,609 | |
| | 43,680 | | | Graphic Packaging Holding Co. | | | 615,888 | |
| | 7,530 | | | Innospec, Inc. | | | 329,061 | |
| | 10,723 | | | Kronos Worldwide, Inc. | | | 144,224 | |
| | 5,700 | | | PolyOne Corp. | | | 222,585 | |
| | 3,066 | | | Reliance Steel & Aluminum Co. | | | 198,432 | |
| | 17,500 | | | Resolute Forest Products, Inc.(1) | | | 269,850 | |
| | 4,000 | | | Rock-Tenn Co. Class A | | | 251,920 | |
| | 8,300 | | | Sonoco Products Co. | | | 370,927 | |
| | 2,800 | | | Stepan Co. | | | 142,604 | |
| | 15,800 | | | Stillwater Mining Co.(1) | | | 212,194 | |
| | 9,852 | | | United States Steel Corp. | | | 236,645 | |
| | | | | | | | |
| | | | | | | 4,135,968 | |
| | | | | | | | |
| | | | | | | | |
Shares or Principal Amount | | Market Value* | |
| COMMON STOCKS - 98.6% - (continued) | |
| | | | Media - 0.3% | |
| | 5,352 | | | Starz Class A(1) | | $ | 210,494 | |
| | | | | | | | |
| | | | Pharmaceuticals, Biotechnology & Life Sciences - 8.2% | |
| | 19,000 | | | Affymetrix, Inc.(1) | | | 230,470 | |
| | 9,300 | | | Anacor Pharmaceuticals, Inc.(1) | | | 490,017 | |
| | 3,100 | | | Bio-Rad Laboratories, Inc. Class A(1) | | | 416,795 | |
| | 3,803 | | | BioSpecifics Technologies Corp.(1) | | | 145,693 | |
| | 7,000 | | | Cambrex Corp.(1) | | | 269,430 | |
| | 1,621 | | | Charles River Laboratories International, Inc.(1) | | | 112,108 | |
| | 7,094 | | | Five Prime Therapeutics, Inc.(1) | | | 142,306 | |
| | 38,690 | | | Geron Corp.(1) | | | 140,058 | |
| | 4,209 | | | Impax Laboratories, Inc.(1) | | | 190,499 | |
| | 11,200 | | | Infinity Pharmaceuticals, Inc.(1) | | | 141,904 | |
| | 2,714 | | | Insys Therapeutics, Inc.(1) | | | 142,675 | |
| | 5,200 | | | Isis Pharmaceuticals, Inc.(1) | | | 294,944 | |
| | 3,800 | | | Lannett Co., Inc.(1) | | | 218,500 | |
| | 9,240 | | | Luminex Corp.(1) | | | 143,405 | |
| | 2,050 | | | Medivation, Inc.(1) | | | 247,517 | |
| | 20,700 | | | Merrimack Pharmaceuticals, Inc.(1) | | | 229,770 | |
| | 2,709 | | | NewLink Genetics Corp.(1) | | | 120,821 | |
| | 3,162 | | | Omeros Corp.(1) | | | 63,620 | |
| | 3,998 | | | Ophthotech Corp.(1) | | | 181,030 | |
| | 3,442 | | | OvaScience, Inc.(1) | | | 85,172 | |
| | 4,900 | | | PAREXEL International Corp.(1) | | | 311,518 | |
| | 60,951 | | | PDL Biopharma, Inc. | | | 406,543 | |
| | 700 | | | Puma Biotechnology, Inc.(1) | | | 126,406 | |
| | 6,155 | | | Quintiles Transnational Holdings, Inc(1) | | | 405,491 | |
| | 13,100 | | | Sciclone Pharmaceuticals, Inc.(1) | | | 107,027 | |
| | 9,800 | | | Sucampo Pharmaceuticals, Inc. Class A(1) | | | 174,048 | |
| | 4,200 | | | United Therapeutics Corp.(1) | | | 670,698 | |
| | | | | | | | |
| | | | | | | 6,208,465 | |
| | | | | | | | |
| | | | Real Estate - 11.1% | |
| | 7,900 | | | AG Mortgage Investment Trust, Inc. REIT | | | 151,838 | |
| | 16,510 | | | American Capital Mortgage Investment Corp. REIT | | | 289,585 | |
| | 8,832 | | | Apollo Commercial Real Estate Finance, Inc. REIT | | | 150,939 | |
| | 24,000 | | | Brandywine Realty Trust REIT | | | 349,920 | |
| | 6,800 | | | Brixmor Property Group, Inc. REIT | | | 159,460 | |
| | 41,350 | | | Capstead Mortgage Corp. REIT | | | 481,728 | |
| | 7,300 | | | CBL & Associates Properties, Inc. REIT | | | 131,473 | |
| | 32,800 | | | Chambers Street Properties REIT | | | 246,000 | |
| | 5,600 | | | CyrusOne, Inc. REIT | | | 181,888 | |
| | 11,500 | | | Franklin Street Properties Corp. REIT | | | 135,815 | |
| | 11,400 | | | Government Properties Income Trust REIT | | | 237,576 | |
| | 14,290 | | | Hatteras Financial Corp. REIT | | | 258,077 | |
| | 9,900 | | | Hospitality Properties Trust REIT | | | 297,792 | |
| | 4,010 | | | Jones Lang LaSalle, Inc. | | | 665,901 | |
| | 29,660 | | | Mack-Cali Realty Corp. REIT | | | 532,397 | |
| | 4,700 | | | Marcus & Millichap, Inc.(1) | | | 166,286 | |
| | 17,800 | | | MFA Financial, Inc. REIT | | | 138,306 | |
| | 14,613 | | | New Residential Investment Corp. REIT | | | 249,006 | |
| | 20,640 | | | New York Mortgage Trust, Inc. REIT | | | 161,198 | |
| | 11,100 | | | Pennsylvania REIT | | | 250,971 | |
| | 6,820 | | | PennyMac Mortgage Investment Trust REIT | | | 142,879 | |
| | 46,900 | | | Piedmont Office Realty Trust, Inc. Class A, REIT | | | 819,812 | |
| | 9,200 | | | Ramco-Gershenson Properties Trust REIT | | | 160,816 | |
| | 9,800 | | | Redwood Trust, Inc. REIT | | | 168,462 | |
| | 50,400 | | | Resource Capital Corp. REIT | | | 222,264 | |
| | 51,200 | | | Retail Properties of America, Inc. Class A, REIT | | | 773,632 | |
| | 20,441 | | | Select Income REIT | | | 474,027 | |
| | 26,200 | | | Two Harbors Investment Corp. REIT | | | 275,100 | |
The accompanying notes are an integral part of these financial statements.
|
| The Hartford Small/Mid Cap Equity Fund |
Schedule of Investments – (continued)
April 30, 2015 (Unaudited)
| | | | | | | | |
Shares or Principal Amount | | Market Value* | |
| COMMON STOCKS - 98.6% - (continued) | |
| | | | Real Estate - 11.1% - (continued) | |
| | 9,500 | | | Western Asset Mortgage Capital Corp. REIT | | $ | 138,795 | |
| | | | | | | | |
| | | | | | | 8,411,943 | |
| | | | | | | | |
| | | | Retailing - 7.6% | |
| | 8,854 | | | American Eagle Outfitters, Inc. | | | 140,867 | |
| | 3,950 | | | ANN, Inc.(1) | | | 149,547 | |
| | 7,000 | | | Big Lots, Inc. | | | 318,990 | |
| | 5,900 | | | Buckle, Inc. | | | 264,320 | |
| | 5,191 | | | Burlington Stores, Inc.(1) | | | 267,700 | |
| | 5,100 | | | Cato Corp. Class A | | | 200,634 | |
| | 7,800 | | | Chico’s FAS, Inc. | | | 131,508 | |
| | 3,200 | | | Dick’s Sporting Goods, Inc. | | | 173,632 | |
| | 4,400 | | | Dillard’s, Inc. Class A | | | 578,996 | |
| | 4,080 | | | DSW, Inc. Class A | | | 147,982 | |
| | 6,400 | | | Foot Locker, Inc. | | | 380,480 | |
| | 15,200 | | | Francescas Holding Corp.(1) | | | 257,336 | |
| | 4,106 | | | GNC Holdings, Inc. Class A | | | 176,763 | |
| | 19,300 | | | Nutrisystem, Inc. | | | 367,665 | |
| | 2,800 | | | Outerwall, Inc. | | | 186,004 | |
| | 14,300 | | | Overstock.com, Inc.(1) | | | 307,021 | |
| | 7,900 | | | Select Comfort Corp.(1) | | | 243,478 | |
| | 6,900 | | | Tilly’s, Inc. Class A(1) | | | 92,046 | |
| | 2,900 | | | Ulta Salon Cosmetics & Fragrance, Inc.(1) | | | 438,161 | |
| | 7,100 | | | Urban Outfitters, Inc.(1) | | | 284,284 | |
| | 4,851 | | | Williams-Sonoma, Inc. | | | 356,694 | |
| | 11,200 | | | zulily, Inc. Class A(1) | | | 139,608 | |
| | 5,239 | | | Zumiez, Inc.(1) | | | 166,129 | |
| | | | | | | | |
| | | | | | | 5,769,845 | |
| | | | | | | | |
| | | | Semiconductors & Semiconductor Equipment - 2.5% | |
| | 6,000 | | | Advanced Energy Industries, Inc.(1) | | | 146,760 | |
| | 3,300 | | | Ambarella, Inc.(1) | | | 241,395 | |
| | 26,900 | | | Amkor Technology, Inc.(1) | | | 189,107 | |
| | 11,657 | | | Cypress Semiconductor Corp.(1) | | | 155,271 | |
| | 10,200 | | | Integrated Device Technology, Inc.(1) | | | 185,538 | |
| | 10,792 | | | Kulicke & Soffa Industries, Inc.(1) | | | 163,067 | |
| | 7,500 | | | Skyworks Solutions, Inc. | | | 691,875 | |
| | 3,700 | | | Tessera Technologies, Inc. | | | 133,607 | |
| | | | | | | | |
| | | | | | | 1,906,620 | |
| | | | | | | | |
| | | | Software & Services - 10.1% | |
| | 12,510 | | | Aspen Technology, Inc.(1) | | | 555,319 | |
| | 16,800 | | | AVG Technologies N.V.(1) | | | 401,856 | |
| | 3,714 | | | Barracuda Networks, Inc.(1) | | | 150,528 | |
| | 4,300 | | | Blackhawk Network Holdings, Inc.(1) | | | 158,111 | |
| | 2,630 | | | Cimpress N.V.(1) | | | 220,762 | |
| | 2,300 | | | Constant Contact, Inc.(1) | | | 80,155 | |
| | 14,500 | | | Convergys Corp. | | | 328,860 | |
| | 2,766 | | | CSG Systems International, Inc. | | | 80,546 | |
| | 2,400 | | | DST Systems, Inc. | | | 276,192 | |
| | 4,400 | | | EPAM Systems, Inc.(1) | | | 284,724 | |
| | 2,153 | | | ePlus, Inc.(1) | | | 178,613 | |
| | 6,000 | | | Fleetmatics Group Ltd.(1) | | | 273,480 | |
| | 6,415 | | | Global Sources Ltd.(1) | | | 35,539 | |
| | 8,900 | | | Guidewire Software, Inc.(1) | | | 444,555 | |
| | 9,800 | | | Liquidity Services, Inc.(1) | | | 91,728 | |
| | 5,500 | | | Logmein, Inc.(1) | | | 352,990 | |
| | 4,572 | | | Manhattan Associates, Inc.(1) | | | 240,304 | |
| | 4,900 | | | MAXIMUS, Inc. | | | 313,649 | |
| | 22,908 | | | Mentor Graphics Corp. | | | 548,189 | |
| | 1,882 | | | NetScout Systems, Inc.(1) | | | 77,350 | |
| | 5,254 | | | Paycom Software, Inc.(1) | | | 166,079 | |
| | | | | | | | |
Shares or Principal Amount | | Market Value* | |
| COMMON STOCKS - 98.6% - (continued) | |
| | | | Software & Services - 10.1% - (continued) | |
| | 3,498 | | | Pegasystems, Inc. | | $ | 75,347 | |
| | 5,970 | | | Rackspace Hosting, Inc.(1) | | | 321,783 | |
| | 3,000 | | | Science Applications International Corp. | | | 150,300 | |
| | 8,158 | | | SolarWinds, Inc.(1) | | | 397,947 | |
| | 4,500 | | | SS&C Technologies Holdings, Inc. | | | 270,765 | |
| | 19,800 | | | Synopsys, Inc.(1) | | | 928,224 | |
| | 12,400 | | | VASCO Data Security International, Inc.(1) | | | 315,208 | |
| | | | | | | | |
| | | | | | | 7,719,103 | |
| | | | | | | | |
| | | | Technology Hardware & Equipment - 4.0% | |
| | 8,054 | | | ADTRAN, Inc. | | | 133,777 | |
| | 8,432 | | | Alliance Fiber Optic Products, Inc. | | | 154,811 | |
| | 4,000 | | | Arrow Electronics, Inc.(1) | | | 238,840 | |
| | 6,900 | | | Avnet, Inc. | | | 294,147 | |
| | 3,100 | | | Benchmark Electronics, Inc.(1) | | | 72,943 | |
| | 47,497 | | | Brocade Communications Systems, Inc. | | | 536,716 | |
| | 3,318 | | | InterDigital, Inc. | | | 181,561 | |
| | 7,300 | | | Jabil Circuit, Inc. | | | 164,396 | |
| | 9,504 | | | Lexmark International, Inc. Class A | | | 421,883 | |
| | 4,000 | | | Methode Electronics, Inc. | | | 169,840 | |
| | 2,637 | | | Palo Alto Networks, Inc.(1) | | | 389,538 | |
| | 11,100 | | | Polycom, Inc.(1) | | | 144,855 | |
| | 7,725 | | | Sanmina Corp.(1) | | | 157,049 | |
| | | | | | | | |
| | | | | | | 3,060,356 | |
| | | | | | | | |
| | | | Telecommunication Services - 0.4% | |
| | 6,900 | | | IDT Corp. Class B | | | 117,507 | |
| | 10,800 | | | Inteliquent, Inc. | | | 205,308 | |
| | | | | | | | |
| | | | | | | 322,815 | |
| | | | | | | | |
| | | | Transportation - 2.8% | | | |
| | 15,642 | | | Alaska Air Group, Inc. | | | 1,002,027 | |
| | 3,500 | | | ArcBest Corp. | | | 124,950 | |
| | 7,800 | | | Avis Budget Group, Inc.(1) | | | 422,292 | |
| | 2,200 | | | Spirit Airlines, Inc.(1) | | | 150,634 | |
| | 11,700 | | | Swift Transportation Co.(1) | | | 283,140 | |
| | 5,900 | | | Werner Enterprises, Inc. | | | 158,533 | |
| | | | | | | | |
| | | | | | | 2,141,576 | |
| | | | | | | | |
| | | | Utilities - 4.1% | | | |
| | 41,100 | | | Atlantic Power Corp. | | | 133,575 | |
| | 2,100 | | | El Paso Electric Co. | | | 78,141 | |
| | 19,500 | | | Great Plains Energy, Inc. | | | 510,510 | |
| | 13,640 | | | New Jersey Resources Corp. | | | 416,156 | |
| | 6,374 | | | ONE Gas, Inc. | | | 267,517 | |
| | 9,800 | | | Pinnacle West Capital Corp. | | | 599,760 | |
| | 8,230 | | | UGI Corp. | | | 286,486 | |
| | 22,760 | | | Westar Energy, Inc. | | | 856,914 | |
| | | | | | | | |
| | | | | | | 3,149,059 | |
| | | | | | | | |
| | |
| | | | Total Common Stocks
(cost $65,226,215) | | $ | 75,062,630 | |
| | | | | | | | |
| | |
| | | | Total Long-Term Investments
(cost $65,226,215) | | $ | 75,062,630 | |
| | | | | | | | |
The accompanying notes are an integral part of these financial statements.
|
| The Hartford Small/Mid Cap Equity Fund |
Schedule of Investments – (continued)
April 30, 2015 (Unaudited)
| | | | | | | | |
Shares or Principal Amount | | Market Value* | |
| SHORT-TERM INVESTMENTS - 2.2% | |
| | | | Other Investment Pools & Funds - 2.2% | | | |
| | 1,657,286 | | | BlackRock Liquidity Funds TempFund Portfolio | | $ | 1,657,286 | |
| | | | | | | | |
| | |
| | | | Total Short-Term Investments
(cost $1,657,286) | | $ | 1,657,286 | |
| | | | | | | | |
| | | | | | | | | | |
| | | |
| | Total Investments
(cost $66,883,501)^ | | | 100.8 | % | | $ | 76,719,916 | |
| | Other Assets and Liabilities | | | (0.8 | )% | | | (642,125 | ) |
| | | | | | | | | | |
| | Total Net Assets | | | 100.0 | % | | $ | 76,077,791 | |
| | | | | | | | | | |
The accompanying notes are an integral part of these financial statements.
|
| The Hartford Small/Mid Cap Equity Fund |
Schedule of Investments – (continued)
April 30, 2015 (Unaudited)
| Note: | Percentage of investments as shown is the ratio of the total market value to total net assets. |
| | Equity industry classifications used in this report are the Global Industry Classification Standard, which was developed by and is the exclusive property and service mark of MSCI, Inc. and Standard & Poor’s. |
| | For Fund compliance purposes, the Fund may not use the same classification system shown in this report as these classifications are used for reporting ease. |
| ^ | At April 30, 2015, the cost of securities for federal income tax purposes was $66,917,204 and the aggregate gross unrealized appreciation and depreciation based on that cost were: |
| | | | |
Unrealized Appreciation | | $ | 12,482,699 | |
Unrealized Depreciation | | | (2,679,987 | ) |
| | | | |
Net Unrealized Appreciation | | $ | 9,802,712 | |
| | | | |
| (1) | Non-income producing. |
| * | See Significant Accounting Policies of accompanying Notes to Financial Statements regarding valuation of securities. |
| | |
| GLOSSARY: (abbreviations used in preceding Schedule of Investments) |
|
| Other Abbreviations: |
ADR | | American Depositary Receipt |
REIT | | Real Estate Investment Trust |
The accompanying notes are an integral part of these financial statements.
|
| The Hartford Small/Mid Cap Equity Fund |
Schedule of Investments – (continued)
April 30, 2015 (Unaudited)
Fair Valuation Summary
The following is a summary of the fair valuations according to the inputs used as of April 30, 2015 in valuing the Fund’s investments.
| | | | | | | | | | | | | | | | |
| | | Total | | | Level 1(1) | | | Level 2(1) | | | Level 3 | |
Assets | | | | | | | | | | | | | | | | |
Common Stocks | | | | | | | | | | | | | | | | |
Automobiles & Components | | $ | 879,675 | | | $ | 879,675 | | | $ | — | | | $ | — | |
Banks | | | 2,319,775 | | | | 2,319,775 | | | | — | | | | — | |
Capital Goods | | | 6,334,748 | | | | 6,334,748 | | | | — | | | | — | |
Commercial & Professional Services | | | 2,919,793 | | | | 2,919,793 | | | | — | | | | — | |
Consumer Durables & Apparel | | | 2,174,646 | | | | 2,174,646 | | | | — | | | | — | |
Consumer Services | | | 3,269,249 | | | | 3,269,249 | | | | — | | | | — | |
Diversified Financials | | | 2,447,441 | | | | 2,447,441 | | | | — | | | | — | |
Energy | | | 3,524,942 | | | | 3,524,942 | | | | — | | | | — | |
Food & Staples Retailing | | | 311,679 | | | | 311,679 | | | | — | | | | — | |
Food, Beverage & Tobacco | | | 670,291 | | | | 670,291 | | | | — | | | | — | |
Health Care Equipment & Services | | | 2,920,806 | | | | 2,920,806 | | | | — | | | | — | |
Household & Personal Products | | | 227,480 | | | | 227,480 | | | | — | | | | — | |
Insurance | | | 4,025,861 | | | | 4,025,861 | | | | — | | | | — | |
Materials | | | 4,135,968 | | | | 4,135,968 | | | | — | | | | — | |
Media | | | 210,494 | | | | 210,494 | | | | — | | | | — | |
Pharmaceuticals, Biotechnology & Life Sciences | | | 6,208,465 | | | | 6,208,465 | | | | — | | | | — | |
Real Estate | | | 8,411,943 | | | | 8,411,943 | | | | — | | | | — | |
Retailing | | | 5,769,845 | | | | 5,769,845 | | | | — | | | | — | |
Semiconductors & Semiconductor Equipment | | | 1,906,620 | | | | 1,906,620 | | | | — | | | | — | |
Software & Services | | | 7,719,103 | | | | 7,719,103 | | | | — | | | | — | |
Technology Hardware & Equipment | | | 3,060,356 | | | | 3,060,356 | | | | — | | | | — | |
Telecommunication Services | | | 322,815 | | | | 322,815 | | | | — | | | | — | |
Transportation | | | 2,141,576 | | | | 2,141,576 | | | | — | | | | — | |
Utilities | | | 3,149,059 | | | | 3,149,059 | | | | — | | | | — | |
Short-Term Investments | | | 1,657,286 | | | | 1,657,286 | | | | — | | | | — | |
| | | | | | | | | | | | | | | | |
Total | | $ | 76,719,916 | | | $ | 76,719,916 | | | $ | — | | | $ | — | |
| | | | | | | | | | | | | | | | |
| (1) | For the six-month period ended April 30, 2015, there were no transfers between Level 1 and Level 2. |
| Note: | For purposes of reporting transfers between different hierarchy levels, both transfers in and out of each level, as applicable, are shown as if they occurred at the beginning of the period. |
The accompanying notes are an integral part of these financial statements.
|
| The Hartford SmallCap Growth Fund |
Diversification by Sector
as of April 30, 2015 (Unaudited)
| | | | |
| Sector | | Percentage of
Net Assets | |
Equity Securities | | | | |
Consumer Discretionary | | | 15.4 | % |
Consumer Staples | | | 3.9 | |
Energy | | | 2.9 | |
Financials | | | 8.9 | |
Health Care | | | 22.8 | |
Industrials | | | 13.8 | |
Information Technology | | | 26.1 | |
Materials | | | 5.3 | |
Telecommunication Services | | | 0.2 | |
| | | | |
Total | | | 99.3 | % |
| | | | |
Short-Term Investments | | | 1.0 | % |
Other Assets & Liabilities | | | (0.3 | ) |
| | | | |
Total | | | 100.0 | % |
| | | | |
A sector may be comprised of several industries. For Fund compliance purposes, the Fund may not use the same classification system and these sector classifications are used for reporting ease.
The accompanying notes are an integral part of these financial statements.
|
| The Hartford SmallCap Growth Fund |
Schedule of Investments
April 30, 2015 (Unaudited)
| | | | | | | | |
Shares or Principal Amount | | Market Value* | |
| COMMON STOCKS - 98.2% | |
| | | | Automobiles & Components - 1.6% | |
| | 45,400 | | | American Axle & Manufacturing Holdings,
Inc.(1) | | $ | 1,131,822 | |
| | 21,500 | | | Cooper Tire & Rubber Co. | | | 913,535 | |
| | 230,635 | | | Dana Holding Corp. | | | 4,974,797 | |
| | 150,895 | | | Tenneco Automotive, Inc.(1) | | | 8,819,813 | |
| | | | | | | | |
| | | | | | | 15,839,967 | |
| | | | | | | | |
| | | | Banks - 2.8% | |
| | 311,935 | | | EverBank Financial Corp. | | | 5,792,633 | |
| | 253,405 | | | First Merchants Corp. | | | 5,719,351 | |
| | 128,770 | | | Flushing Financial Corp. | | | 2,467,233 | |
| | 126,120 | | | Great Western Bancorp, Inc. | | | 2,758,244 | |
| | 435,020 | | | MGIC Investment Corp.(1) | | | 4,532,908 | |
| | 94,010 | | | Sandy Spring Bancorp, Inc. | | | 2,449,901 | |
| | 105,265 | | | Wintrust Financial Corp. | | | 5,130,616 | |
| | | | | | | | |
| | | | | | | 28,850,886 | |
| | | | | | | | |
| | | | Capital Goods - 8.5% | |
| | 91,000 | | | A.O. Smith Corp. | | | 5,814,900 | |
| | 219,155 | | | AAON, Inc. | | | 5,253,145 | |
| | 22,200 | | | Aegion Corp.(1) | | | 408,924 | |
| | 175,546 | | | Altra Industrial Motion Corp. | | | 4,629,148 | |
| | 14,742 | | | American Railcar Industries, Inc. | | | 781,916 | |
| | 7,750 | | | American Woodmark Corp.(1) | | | 392,925 | |
| | 9,300 | | | Argan, Inc. | | | 300,483 | |
| | 99,488 | | | Astronics Corp.(1) | | | 6,696,537 | |
| | 131,302 | | | AZZ, Inc. | | | 6,091,100 | |
| | 45,445 | | | Blount International, Inc.(1) | | | 602,601 | |
| | 22,100 | | | Douglas Dynamics, Inc. | | | 480,675 | |
| | 8,941 | | | Dycom Industries, Inc.(1) | | | 411,107 | |
| | 94,555 | | | Enphase Energy, Inc.(1) | | | 1,188,556 | |
| | 41,405 | | | Esterline Technologies Corp.(1) | | | 4,607,963 | |
| | 192,387 | | | Generac Holdings, Inc.(1) | | | 8,020,614 | |
| | 16,600 | | | Global Brass & Copper Holdings, Inc. | | | 252,984 | |
| | 130,410 | | | Heico Corp. Class A | | | 5,981,907 | |
| | 23,200 | | | Hillenbrand, Inc. | | | 681,848 | |
| | 24,600 | | | Hyster-Yale Materials Handling, Inc. | | | 1,804,164 | |
| | 70,270 | | | Lennox International, Inc. | | | 7,445,809 | |
| | 104,366 | | | Meritor, Inc.(1) | | | 1,369,282 | |
| | 83,380 | | | Moog, Inc. Class A(1) | | | 5,826,594 | |
| | 7,600 | | | Proto Labs, Inc.(1) | | | 532,000 | |
| | 54,595 | | | Taser International, Inc.(1) | | | 1,648,223 | |
| | 65,620 | | | Teledyne Technologies, Inc.(1) | | | 6,888,131 | |
| | 92,614 | | | Toro Co. | | | 6,208,843 | |
| | 25,600 | | | Trex Co., Inc.(1) | | | 1,201,152 | |
| | 10,085 | | | Woodward, Inc. | | | 474,499 | |
| | | | | | | | |
| | | | | | | 85,996,030 | |
| | | | | | | | |
| | | | Commercial & Professional Services - 3.3% | |
| | 38,509 | | | Brink’s Co. | | | 1,019,333 | |
| | 8,007 | | | Corporate Executive Board Co. | | | 671,227 | |
| | 109,536 | | | Deluxe Corp. | | | 7,092,456 | |
| | 86,325 | | | Exponent, Inc. | | | 7,649,258 | |
| | 150,595 | | | GP Strategies Corp.(1) | | | 4,907,891 | |
| | 8,207 | | | Insperity, Inc. | | | 395,249 | |
| | 34,400 | | | Korn/Ferry International | | | 1,084,632 | |
| | 7,954 | | | Multi-Color Corp. | | | 499,352 | |
| | 145,585 | | | On Assignment, Inc.(1) | | | 4,898,935 | |
| | 20,783 | | | Performant Financial Corp.(1) | | | 61,726 | |
| | 59,623 | | | RPX Corp.(1) | �� | | 927,734 | |
| | 7,237 | | | UniFirst Corp. | | | 819,446 | |
| | 68,515 | | | WageWorks, Inc.(1) | | | 3,453,156 | |
| | | | | | | | |
| | | | | | | 33,480,395 | |
| | | | | | | | |
| | | | | | | | |
Shares or Principal Amount | | Market Value* | |
| COMMON STOCKS - 98.2% - (continued) | |
| | | | Consumer Durables & Apparel - 4.2% | |
| | 125,480 | | | Arctic Cat, Inc. | | $ | 4,453,285 | |
| | 19,000 | | | Ethan Allen Interiors, Inc. | | | 460,180 | |
| | 22,679 | | | Helen of Troy Ltd.(1) | | | 1,986,907 | |
| | 240,823 | | | Kate Spade & Co.(1) | | | 7,874,912 | |
| | 52,211 | | | Nautilus, Inc.(1) | | | 877,667 | |
| | 74,058 | | | Oxford Industries, Inc. | | | 5,883,908 | |
| | 7,380 | | | Polaris Industries, Inc. | | | 1,010,765 | |
| | 223,700 | | | Quiksilver, Inc.(1) | | | 371,342 | |
| | 15,500 | | | Skechers USA, Inc. Class A(1) | | | 1,393,760 | |
| | 216,061 | | | Steven Madden Ltd.(1) | | | 8,430,700 | |
| | 170,455 | | | Taylor Morrison Home Corp. Class A(1) | | | 3,156,827 | |
| | 13,100 | | | Universal Electronics, Inc.(1) | | | 706,614 | |
| | 17,034 | | | Vera Bradley, Inc.(1) | | | 242,564 | |
| | 312,706 | | | Vince Holding Corp.(1) | | | 5,763,172 | |
| | | | | | | | |
| | | | | | | 42,612,603 | |
| | | | | | | | |
| | | | Consumer Services - 4.3% | |
| | 23,700 | | | American Public Education, Inc.(1) | | | 660,993 | |
| | 346,044 | | | Bloomin’ Brands, Inc. | | | 7,841,357 | |
| | 82,281 | | | Brinker International, Inc. | | | 4,555,899 | |
| | 39,464 | | | Buffalo Wild Wings, Inc.(1) | | | 6,286,615 | |
| | 14,591 | | | Capella Education Co. | | | 788,352 | |
| | 242,860 | | | Del Frisco’s Restaurant Group, Inc.(1) | | | 4,898,486 | |
| | 17,600 | | | Domino’s Pizza, Inc. | | | 1,898,160 | |
| | 7,035 | | | Fiesta Restaurant Group, Inc.(1) | | | 355,619 | |
| | 9,500 | | | Grand Canyon Education, Inc.(1) | | | 430,160 | |
| | 29,176 | | | Jamba, Inc.(1) | | | 459,814 | |
| | 190,500 | | | La Quinta Holdings, Inc.(1) | | | 4,587,240 | |
| | 64,900 | | | LifeLock, Inc.(1) | | | 948,189 | |
| | 93,545 | | | Marriott Vacations Worldwide Corp. | | | 7,690,335 | |
| | 15,400 | | | Strayer Education, Inc.(1) | | | 781,088 | |
| | 30,600 | | | Texas Roadhouse, Inc. | | | 1,028,160 | |
| | 38,700 | | | Weight Watchers International, Inc.(1) | | | 330,885 | |
| | | | | | | | |
| | | | | | | 43,541,352 | |
| | | | | | | | |
| | | | Diversified Financials - 1.9% | |
| | 96,637 | | | BGC Partners, Inc. Class A | | | 969,752 | |
| | 6,200 | | | Credit Acceptance Corp.(1) | | | 1,464,440 | |
| | 100,965 | | | Evercore Partners, Inc. Class A | | | 4,870,552 | |
| | 151,715 | | | HFF, Inc. Class A | | | 5,945,711 | |
| | 38,381 | | | MarketAxess Holdings, Inc. | | | 3,295,009 | |
| | 93,300 | | | Wisdomtree Investments, Inc. | | | 1,776,432 | |
| | 15,600 | | | World Acceptance Corp.(1) | | | 1,320,072 | |
| | | | | | | | |
| | | | | | | 19,641,968 | |
| | | | | | | | |
| | | | Energy - 2.9% | |
| | 57,780 | | | Alon USA Energy, Inc. | | | 929,680 | |
| | 18,500 | | | CVR Energy, Inc. | | | 740,740 | |
| | 31,100 | | | Delek US Holdings, Inc. | | | 1,148,212 | |
| | 55,810 | | | Diamondback Energy, Inc.(1) | | | 4,608,232 | |
| | 115,310 | | | Forum Energy Technologies, Inc.(1) | | | 2,682,111 | |
| | 11,844 | | | Geospace Technologies Corp.(1) | | | 255,830 | |
| | 6,500 | | | Green Plains, Inc. | | | 202,410 | |
| | 62,000 | | | Hornbeck Offshore Services, Inc.(1) | | | 1,416,700 | |
| | 101,800 | | | ION Geophysical Corp.(1) | | | 232,104 | |
| | 43,797 | | | Jones Energy, Inc. Class A(1) | | | 449,357 | |
| | 11,805 | | | Matrix Service Co.(1) | | | 259,356 | |
| | 64,680 | | | Pacific Ethanol, Inc.(1) | | | 773,573 | |
| | 73,400 | | | PBF Energy, Inc. Class A | | | 2,083,092 | |
| | 15,429 | | | REX American Resources Corp.(1) | | | 975,421 | |
| | 158,631 | | | Rosetta Resources, Inc.(1) | | | 3,621,546 | |
| | 235,030 | | | RSP Permian, Inc.(1) | | | 6,820,571 | |
The accompanying notes are an integral part of these financial statements.
|
| The Hartford SmallCap Growth Fund |
Schedule of Investments – (continued)
April 30, 2015 (Unaudited)
| | | | | | | | |
Shares or Principal Amount | | Market Value* | |
| COMMON STOCKS - 98.2% - (continued) | |
| | | | Energy - 2.9% - (continued) | |
| | 17,115 | | | US Silica Holdings, Inc. | | $ | 639,245 | |
| | 135,999 | | | Vaalco Energy, Inc.(1) | | | 335,918 | |
| | 30,007 | | | Western Refining, Inc. | | | 1,321,808 | |
| | | | | | | | |
| | | | | | | 29,495,906 | |
| | | | | | | | |
| | | | Food & Staples Retailing - 2.3% | |
| | 126,640 | | | Casey’s General Stores, Inc. | | | 10,407,275 | |
| | 20,487 | | | Fresh Market, Inc.(1) | | | 719,913 | |
| | 201,020 | | | Natural Grocers by Vitamin Cottage, Inc.(1) | | | 5,290,846 | |
| | 82,740 | | | PriceSmart, Inc. | | | 6,657,261 | |
| | | | | | | | |
| | | | | | | 23,075,295 | |
| | | | | | | | |
| | | | Food, Beverage & Tobacco - 1.5% | | | |
| | 19,626 | | | Cal-Maine Foods, Inc. | | | 877,479 | |
| | 34,800 | | | Pilgrim’s Pride Corp. | | | 859,560 | |
| | 85,500 | | | Post Holdings, Inc.(1) | | | 4,013,370 | |
| | 15,200 | | | Sanderson Farms, Inc. | | | 1,141,824 | |
| | 106,155 | | | TreeHouse Foods, Inc.(1) | | | 8,626,155 | |
| | | | | | | | |
| | | | | | | 15,518,388 | |
| | | | | | | | |
| | | | Health Care Equipment & Services - 10.5% | |
| | 15,492 | | | ABIOMED, Inc.(1) | | | 979,404 | |
| | 93,761 | | | Acadia Healthcare Co., Inc.(1) | | | 6,422,628 | |
| | 5,620 | | | Align Technology, Inc.(1) | | | 330,681 | |
| | 17,632 | | | Anika Therapeutics, Inc.(1) | | | 601,604 | |
| | 14,535 | | | Atrion Corp. | | | 4,721,695 | |
| | 36,546 | | | Centene Corp.(1) | | | 2,265,487 | |
| | 15,400 | | | Computer Programs & Systems, Inc. | | | 805,882 | |
| | 91,183 | | | Cyberonics, Inc.(1) | | | 5,553,957 | |
| | 120,710 | | | Cynosure, Inc. Class A(1) | | | 4,034,128 | |
| | 167,635 | | | DexCom, Inc.(1) | | | 11,327,097 | |
| | 8,500 | | | Ensign Group, Inc. | | | 357,935 | |
| | 340,352 | | | Globus Medical, Inc. Class A(1) | | | 8,131,009 | |
| | 223,820 | | | HealthSouth Corp. | | | 10,121,140 | |
| | 37,425 | | | HeartWare International, Inc.(1) | | | 2,833,447 | |
| | 79,100 | | | ICU Medical, Inc.(1) | | | 6,673,667 | |
| | 28,500 | | | Magellan Health, Inc.(1) | | | 1,804,050 | |
| | 32,700 | | | Meridian Bioscience, Inc. | | | 579,444 | |
| | 23,107 | | | Molina Healthcare, Inc.(1) | | | 1,368,628 | |
| | 6,000 | | | Natus Medical, Inc.(1) | | | 226,260 | |
| | 174,525 | | | Omnicell, Inc.(1) | | | 6,200,873 | |
| | 29,900 | | | Orthofix International N.V.(1) | | | 966,069 | |
| | 82,700 | | | Quality Systems, Inc. | | | 1,289,706 | |
| | 30,049 | | | RadNet, Inc.(1) | | | 251,811 | |
| | 134,255 | | | Team Health Holdings, Inc.(1) | | | 7,997,570 | |
| | 37,500 | | | Triple-S Management Corp., Class B(1) | | | 702,000 | |
| | 146,435 | | | U.S. Physical Therapy, Inc. | | | 6,905,875 | |
| | 215,405 | | | Vascular Solutions, Inc.(1) | | | 6,905,884 | |
| | 75,470 | | | WellCare Health Plans, Inc.(1) | | | 5,843,642 | |
| | | | | | | | |
| | | | | | | 106,201,573 | |
| | | | | | | | |
| | | | Household & Personal Products - 0.1% | | | |
| | 7,900 | | | Medifast, Inc.(1) | | | 237,000 | |
| | 6,400 | | | Usana Health Sciences, Inc.(1) | | | 727,936 | |
| | | | | | | | |
| | | | | | | 964,936 | |
| | | | | | | | |
| | | | Insurance - 1.5% | | | |
| | 153,065 | | | AMERISAFE, Inc. | | | 6,917,007 | |
| | 12,980 | | | AmTrust Financial Services, Inc. | | | 771,921 | |
| | 26,600 | | | Greenlight Capital Re Ltd. Class A(1) | | | 808,374 | |
| | 9,356 | | | HCI Group, Inc. | | | 407,735 | |
| | 151,480 | | | James River Group Holdings Ltd. | | | 3,580,987 | |
| | | | | | | | |
Shares or Principal Amount | | Market Value* | |
| COMMON STOCKS - 98.2% - (continued) | |
| | | | Insurance - 1.5% - (continued) | | | |
| | 70,374 | | | Maiden Holdings Ltd. | | $ | 1,022,534 | |
| | 20,300 | | | United Insurance Holdings Corp. | | | 337,589 | |
| | 36,400 | | | Universal Insurance Holdings, Inc. | | | 874,328 | |
| | | | | | | | |
| | | | | | | 14,720,475 | |
| | | | | | | | |
| | | | Materials - 5.3% | | | |
| | 184,212 | | | Boise Cascade Co.(1) | | | 6,392,156 | |
| | 82,680 | | | Cabot Corp. | | | 3,533,743 | |
| | 16,600 | | | Clearwater Paper Corp.(1) | | | 1,061,902 | |
| | 77,000 | | | Gold Resource Corp. | | | 259,490 | |
| | 832,900 | | | Graphic Packaging Holding Co. | | | 11,743,890 | |
| | 485,123 | | | Headwaters, Inc.(1) | | | 8,528,462 | |
| | 16,800 | | | Innospec, Inc. | | | 734,160 | |
| | 13,069 | | | KapStone Paper & Packaging Corp. | | | 365,279 | |
| | 508,200 | | | OMNOVA Solutions, Inc.(1) | | | 4,060,518 | |
| | 246,106 | | | PolyOne Corp. | | | 9,610,439 | |
| | 106,837 | | | Silgan Holdings, Inc. | | | 5,755,309 | |
| | 5,800 | | | Stepan Co. | | | 295,394 | |
| | 105,899 | | | Stillwater Mining Co.(1) | | | 1,422,224 | |
| | | | | | | | |
| | | | | | | 53,762,966 | |
| | | | | | | | |
| | | | Media - 0.0% | | | |
| | 29,177 | | | McClatchy Co. Class A(1) | | | 40,556 | |
| | 31,396 | | | World Wrestling Entertainment, Inc. Class A | | | 421,334 | |
| | | | | | | | |
| | | | | | | 461,890 | |
| | | | | | | | |
| | | | Pharmaceuticals, Biotechnology & Life Sciences - 12.3% | |
| | 395,957 | | | Achillion Pharmaceuticals, Inc.(1) | | | 3,464,624 | |
| | 177,500 | | | Acorda Therapeutics, Inc.(1) | | | 5,337,425 | |
| | 129,310 | | | Aerie Pharmaceuticals, Inc.(1) | | | 1,246,548 | |
| | 92,121 | | | Affymetrix, Inc.(1) | | | 1,117,428 | |
| | 47,086 | | | Agios Pharmaceuticals, Inc.(1) | | | 4,347,921 | |
| | 115,750 | | | Alkermes plc(1) | | | 6,409,077 | |
| | 52,459 | | | Alnylam Pharmaceuticals, Inc.(1) | | | 5,343,998 | |
| | 145,552 | | | Anacor Pharmaceuticals, Inc.(1) | | | 7,669,135 | |
| | 4,775 | | | ANI Pharmaceuticals, Inc.(1) | | | 291,180 | |
| | 58,234 | | | Array BioPharma, Inc.(1) | | | 363,963 | |
| | 49,900 | | | Avalanche Biotechnologies, Inc.(1) | | | 1,589,814 | |
| | 283,302 | | | BioCryst Pharmaceuticals, Inc.(1) | | | 2,631,876 | |
| | 3,553 | | | Bluebird Bio, Inc.(1) | | | 473,224 | |
| | 16,900 | | | Cambrex Corp.(1) | | | 650,481 | |
| | 17,399 | | | Cempra, Inc.(1) | | | 547,895 | |
| | 64,277 | | | Dyax Corp.(1) | | | 1,536,863 | |
| | 29,500 | | | Emergent Biosolutions, Inc.(1) | | | 875,855 | |
| | 14,100 | | | Enanta Pharmaceuticals, Inc.(1) | | | 482,784 | |
| | 155,070 | | | Five Prime Therapeutics, Inc.(1) | | | 3,110,704 | |
| | 123,760 | | | GlycoMimetics, Inc.(1) | | | 1,025,970 | |
| | 36,233 | | | Impax Laboratories, Inc.(1) | | | 1,639,906 | |
| | 95,700 | | | Infinity Pharmaceuticals, Inc.(1) | | | 1,212,519 | |
| | 21,112 | | | Insys Therapeutics, Inc.(1) | | | 1,109,858 | |
| | 147,290 | | | Ironwood Pharmaceuticals, Inc.(1) | | | 2,011,981 | |
| | 41,000 | | | Isis Pharmaceuticals, Inc.(1) | | | 2,325,520 | |
| | 81,790 | | | KYTHERA Biopharmaceuticals, Inc.(1) | | | 3,573,405 | |
| | 20,300 | | | Lannett Co., Inc.(1) | | | 1,167,250 | |
| | 8,795 | | | Ligand Pharmaceuticals, Inc.(1) | | | 682,844 | |
| | 13,681 | | | MacroGenics, Inc.(1) | | | 391,413 | |
| | 184,760 | | | Medicines Co.(1) | | | 4,731,704 | |
| | 139,546 | | | Merrimack Pharmaceuticals, Inc.(1) | | | 1,548,961 | |
| | 62,700 | | | MiMedx Group, Inc.(1) | | | 589,380 | |
| | 28,447 | | | Omeros Corp.(1) | | | 572,354 | |
| | 33,206 | | | Ophthotech Corp.(1) | | | 1,503,568 | |
| | 87,975 | | | Orexigen Therapeutics, Inc.(1) | | | 577,996 | |
The accompanying notes are an integral part of these financial statements.
|
| The Hartford SmallCap Growth Fund |
Schedule of Investments – (continued)
April 30, 2015 (Unaudited)
| | | | | | | | |
Shares or Principal Amount | | Market Value* | |
| COMMON STOCKS - 98.2% - (continued) | |
| | | | Pharmaceuticals, Biotechnology & Life Sciences - 12.3% -
(continued) | |
| | 88,650 | | | Otonomy, Inc.(1) | | $ | 2,326,176 | |
| | 155,785 | | | PAREXEL International Corp.(1) | | | 9,904,031 | |
| | 279,735 | | | PDL Biopharma, Inc. | | | 1,865,832 | |
| | 144,060 | | | Portola Pharmaceuticals, Inc.(1) | | | 5,141,501 | |
| | 90,325 | | | Prestige Brands Holdings, Inc.(1) | | | 3,545,256 | |
| | 90,930 | | | PTC Therapeutics, Inc.(1) | | | 5,342,137 | |
| | 38,906 | | | Puma Biotechnology, Inc.(1) | | | 7,025,645 | |
| | 125,708 | | | Sciclone Pharmaceuticals, Inc.(1) | | | 1,027,034 | |
| | 63,100 | | | Sucampo Pharmaceuticals, Inc. Class A(1) | | | 1,120,656 | |
| | 107,565 | | | TESARO, Inc.(1) | | | 5,859,066 | |
| | 67,970 | | | Ultragenyx Pharmaceutical, Inc.(1) | | | 3,835,547 | |
| | 304,950 | | | XenoPort, Inc.(1) | | | 1,808,354 | |
| | 111,860 | | | Zafgen, Inc.(1) | | | 3,481,083 | |
| | | | | | | | |
| | | | | | | 124,437,742 | |
| | | | | | | | |
| | | | Real Estate - 1.6% | | | |
| | 89,145 | | | Apollo Residential Mortgage, Inc. REIT | | | 1,413,840 | |
| | 123,335 | | | Coresite Realty Corp. REIT | | | 5,929,947 | |
| | 18,600 | | | Inland Real Estate Corp. REIT | | | 191,394 | |
| | 9,300 | | | Marcus & Millichap, Inc.(1) | | | 329,034 | |
| | 24,480 | | | Omega Healthcare Investors, Inc. REIT | | | 883,483 | |
| | 28,024 | | | Potlatch Corp. REIT | | | 1,034,366 | |
| | 392,846 | | | Sunstone Hotel Investors, Inc. REIT | | | 6,120,540 | |
| | | | | | | | |
| | | | | | | 15,902,604 | |
| | | | | | | | |
| | | | Retailing - 5.3% | | | |
| | 32,209 | | | ANN, Inc.(1) | | | 1,219,433 | |
| | 35,800 | | | Buckle, Inc. | | | 1,603,840 | |
| | 37,457 | | | Build-A-Bear Workshop, Inc.(1) | | | 690,332 | |
| | 23,600 | | | Burlington Stores, Inc.(1) | | | 1,217,052 | |
| | 20,273 | | | Cato Corp. Class A | | | 797,540 | |
| | 125,094 | | | Core-Mark Holding Co., Inc. | | | 6,593,705 | |
| | 180,477 | | | DSW, Inc. Class A | | | 6,545,901 | |
| | 20,000 | | | Finish Line, Inc. Class A | | | 490,600 | |
| | 190,645 | | | Five Below, Inc.(1) | | | 6,428,549 | |
| | 85,300 | | | Francescas Holding Corp.(1) | | | 1,444,129 | |
| | 3,900 | | | Hibbett Sports, Inc.(1) | | | 182,520 | |
| | 130,930 | | | HSN, Inc. | | | 8,172,651 | |
| | 10,400 | | | Kirkland’s, Inc.(1) | | | 246,896 | |
| | 84,600 | | | Nutrisystem, Inc. | | | 1,611,630 | |
| | 21,300 | | | Outerwall, Inc. | | | 1,414,959 | |
| | 34,300 | | | Overstock.com, Inc.(1) | | | 736,421 | |
| | 10,900 | | | Party City Holdco, Inc.(1) | | | 226,611 | |
| | 450,964 | | | Pier 1 Imports, Inc. | | | 5,704,695 | |
| | 41,100 | | | Select Comfort Corp.(1) | | | 1,266,702 | |
| | 141,795 | | | Wayfair, Inc. Class A(1) | | | 4,554,455 | |
| | 142,475 | | | zulily, Inc. Class A(1) | | | 1,775,951 | |
| | 10,043 | | | Zumiez, Inc.(1) | | | 318,463 | |
| | | | | | | | |
| | | | | | | 53,243,035 | |
| | | | | | | | |
| | | | Semiconductors & Semiconductor Equipment - 3.3% | |
| | 15,800 | | | Advanced Energy Industries, Inc.(1) | | | 386,468 | |
| | 29,503 | | | Ambarella, Inc.(1) | | | 2,158,144 | |
| | 144,453 | | | Amkor Technology, Inc.(1) | | | 1,015,505 | |
| | 148,893 | | | Cypress Semiconductor Corp.(1) | | | 1,983,255 | |
| | 105,480 | | | Integrated Device Technology, Inc.(1) | | | 1,918,681 | |
| | 105,647 | | | Kulicke & Soffa Industries, Inc.(1) | | | 1,596,326 | |
| | 110,872 | | | Qorvo, Inc.(1) | | | 7,307,574 | |
| | 131,156 | | | SunEdison Semiconductor Ltd.(1) | | | 2,928,713 | |
| | 286,633 | | | SunEdison, Inc.(1) | | | 7,257,548 | |
| | 184,964 | | | SunPower Corp.(1) | | | 5,953,991 | |
| | | | | | | | |
Shares or Principal Amount | | Market Value* | |
| COMMON STOCKS - 98.2% - (continued) | |
| | | | Semiconductors & Semiconductor Equipment - 3.3% -
(continued) | |
| | 32,172 | | | Tessera Technologies, Inc. | | $ | 1,161,731 | |
| | | | | | | | |
| | | | | | | 33,667,936 | |
| | | | | | | | |
| | | | Software & Services - 20.4% | | | |
| | 199,142 | | | Aspen Technology, Inc.(1) | | | 8,839,913 | |
| | 74,339 | | | AVG Technologies N.V.(1) | | | 1,778,189 | |
| | 13,700 | | | Barracuda Networks, Inc.(1) | | | 555,261 | |
| | 23,598 | | | Blackhawk Network Holdings, Inc.(1) | | | 867,698 | |
| | 46,600 | | | CACI International, Inc. Class A(1) | | | 4,111,984 | |
| | 109,145 | | | Cass Information Systems, Inc. | | | 5,705,009 | |
| | 24,500 | | | Cimpress N.V.(1) | | | 2,056,530 | |
| | 132,900 | | | comScore, Inc.(1) | | | 6,958,644 | |
| | 13,840 | | | Constant Contact, Inc.(1) | | | 482,324 | |
| | 60,010 | | | CSG Systems International, Inc. | | | 1,747,491 | |
| | 50,040 | | | Demandware, Inc.(1) | | | 3,082,464 | |
| | 32,400 | | | DHI Group, Inc.(1) | | | 246,240 | |
| | 151,705 | | | Ellie Mae, Inc.(1) | | | 8,343,775 | |
| | 6,905 | | | Envestnet, Inc.(1) | | | 353,950 | |
| | 22,449 | | | EPAM Systems, Inc.(1) | | | 1,452,675 | |
| | 78,090 | | | ePlus, Inc.(1) | | | 6,478,346 | |
| | 5,900 | | | Euronet Worldwide, Inc.(1) | | | 345,032 | |
| | 294,823 | | | Everyday Health, Inc.(1) | | | 3,614,530 | |
| | 195,289 | | | Exlservice Holdings, Inc.(1) | | | 6,723,800 | |
| | 117,530 | | | Fair Isaac Corp. | | | 10,396,704 | |
| | 512,321 | | | Five9, Inc.(1) | | | 2,781,903 | |
| | 265,121 | | | Fleetmatics Group Ltd.(1) | | | 12,084,215 | |
| | 45,072 | | | Guidewire Software, Inc.(1) | | | 2,251,346 | |
| | 169,320 | | | Heartland Payment Systems, Inc. | | | 8,618,388 | |
| | 104,485 | | | HubSpot, Inc.(1) | | | 4,044,614 | |
| | 36,613 | | | Infoblox, Inc.(1) | | | 862,602 | |
| | 109,345 | | | j2 Global, Inc. | | | 7,585,263 | |
| | 26,800 | | | Logmein, Inc.(1) | | | 1,720,024 | |
| | 176,045 | | | Manhattan Associates, Inc.(1) | | | 9,252,925 | |
| | 122,550 | | | Marketo, Inc.(1) | | | 3,486,548 | |
| | 31,200 | | | MAXIMUS, Inc. | | | 1,997,112 | |
| | 362,902 | | | Model N, Inc.(1) | | | 4,264,099 | |
| | 155,921 | | | NetScout Systems, Inc.(1) | | | 6,408,353 | |
| | 42,525 | | | Pegasystems, Inc. | | | 915,989 | |
| | 224,985 | | | PTC, Inc.(1) | | | 8,625,925 | |
| | 132,790 | | | Q2 Holdings, Inc.(1) | | | 2,702,277 | |
| | 144,976 | | | Qualys, Inc.(1) | | | 7,179,212 | |
| | 20,700 | | | Science Applications International Corp. | | | 1,037,070 | |
| | 4,764 | | | Shutterstock, Inc.(1) | | | 321,522 | |
| | 32,000 | | | SolarWinds, Inc.(1) | | | 1,560,960 | |
| | 98,938 | | | Solera Holdings, Inc. | | | 4,800,472 | |
| | 47,116 | | | SS&C Technologies Holdings, Inc. | | | 2,834,970 | |
| | 11,500 | | | Stamps.com, Inc.(1) | | | 711,735 | |
| | 54,455 | | | Sykes Enterprises, Inc.(1) | | | 1,363,009 | |
| | 7,800 | | | Syntel, Inc.(1) | | | 351,156 | |
| | 110,035 | | | Tyler Technologies Corp.(1) | | | 13,418,768 | |
| | 65,100 | | | VASCO Data Security International, Inc.(1) | | | 1,654,842 | |
| | 106,880 | | | Verint Systems, Inc.(1) | | | 6,565,638 | |
| | 130,699 | | | WebMD Health Corp.(1) | | | 5,770,361 | |
| | 60,990 | | | WEX, Inc.(1) | | | 6,874,183 | |
| | 22,500 | | | Wix.com Ltd.(1) | | | 438,075 | |
| | | | | | | | |
| | | | | | | 206,624,115 | |
| | | | | | | | |
| | | | Technology Hardware & Equipment - 2.4% | | | |
| | 52,563 | | | ADTRAN, Inc. | | | 873,071 | |
| | 22,500 | | | Alliance Fiber Optic Products, Inc. | | | 413,100 | |
The accompanying notes are an integral part of these financial statements.
|
| The Hartford SmallCap Growth Fund |
Schedule of Investments – (continued)
April 30, 2015 (Unaudited)
| | | | | | | | |
Shares or Principal Amount | | Market Value* | |
| COMMON STOCKS - 98.2% - (continued) | |
| | | | Technology Hardware & Equipment - 2.4% - (continued) | |
| | 151,620 | | | CDW Corp. of Delaware | | $ | 5,810,078 | |
| | 181,210 | | | Ciena Corp.(1) | | | 3,859,773 | |
| | 26,400 | | | DTS, Inc.(1) | | | 946,440 | |
| | 42,960 | | | FEI Co. | | | 3,241,762 | |
| | 22,700 | | | Infinera Corp.(1) | | | 426,760 | |
| | 27,600 | | | InterDigital, Inc. | | | 1,510,272 | |
| | 29,880 | | | Methode Electronics, Inc. | | | 1,268,705 | |
| | 29,300 | | | Polycom, Inc.(1) | | | 382,365 | |
| | 207,700 | | | Quantum Corp.(1) | | | 417,477 | |
| | 294,185 | | | Sonus Networks, Inc.(1) | | | 2,329,945 | |
| | 100,975 | | | Ubiquiti Networks, Inc. | | | 2,884,856 | |
| | | | | | | | |
| | | | | | | 24,364,604 | |
| | | | | | | | |
| | | | Telecommunication Services - 0.2% | | | |
| | 117,400 | | | Cincinnati Bell, Inc.(1) | | | 402,682 | |
| | 21,900 | | | IDT Corp. Class B | | | 372,957 | |
| | 57,100 | | | Inteliquent, Inc. | | | 1,085,471 | |
| | | | | | | | |
| | | | | | | 1,861,110 | |
| | | | | | | | |
| | | | Transportation - 2.0% | | | |
| | 8,000 | | | Alaska Air Group, Inc. | | | 512,480 | |
| | 4,700 | | | Allegiant Travel Co. | | | 722,672 | |
| | 20,215 | | | ArcBest Corp. | | | 721,676 | |
| | 182,723 | | | Celadon Group, Inc. | | | 4,721,562 | |
| | 43,000 | | | Hawaiian Holdings, Inc.(1) | | | 992,440 | |
| | 26,900 | | | JetBlue Airways Corp.(1) | | | 552,257 | |
| | 144,140 | | | Marten Transport Ltd. | | | 3,208,556 | |
| | 10,200 | | | Matson, Inc. | | | 413,100 | |
| | 19,100 | | | Spirit Airlines, Inc.(1) | | | 1,307,777 | |
| | 314,978 | | | Swift Transportation Co.(1) | | | 7,622,468 | |
| | | | | | | | |
| | | | | | | 20,774,988 | |
| | | | | | | | |
| | |
| | | | Total Common Stocks
(cost $867,884,182) | | $ | 995,040,764 | |
| | | | | | | | |
|
| EXCHANGE TRADED FUNDS - 1.1% | |
| | | | Other Investment Pools & Funds - 1.1% | | | |
| | 78,650 | | | iShares Russell 2000 Growth ETF | | $ | 11,565,482 | |
| | | | | | | | |
| | |
| | | | Total Exchange Traded Funds
(cost $11,965,658) | | $ | 11,565,482 | |
| | | | | | | | |
|
| WARRANTS - 0.0% | |
| | | | Diversified Financials - 0.0% | | | |
| | 1,613 | | | Imperial Holdings, Inc.(1)(2) | | $ | — | |
| | | | | | | | |
| | |
| | | | Total Warrants
(cost $—) | | $ | — | |
| | | | | | | | |
| | |
| | | | Total Long-Term Investments
(cost $879,849,840) | | $ | 1,006,606,246 | |
| | | | | | | | |
| | | | | | | | |
Shares or Principal Amount | | Market Value* | |
| SHORT-TERM INVESTMENTS - 1.0% | |
| | | | Other Investment Pools & Funds - 1.0% | | | |
| | 3,362,719 | | | BlackRock Liquidity Funds TempFund Portfolio | | $ | 3,362,719 | |
| | 6,533,791 | | | Federated Prime Obligations Fund | | | 6,533,791 | |
| | | | | | | | |
| | |
| | | | Total Short-Term Investments
(cost $9,896,510) | | $ | 9,896,510 | |
| | | | | | | | |
| | | | | | | | | | |
| | | |
| | Total Investments
(cost $889,746,350)^ | | | 100.3 | % | | $ | 1,016,502,756 | |
| | Other Assets and Liabilities | | | (0.3 | )% | | | (2,613,924 | ) |
| | | | | | | | | | |
| | Total Net Assets | | | 100.0 | % | | $ | 1,013,888,832 | |
| | | | | | | | | | |
The accompanying notes are an integral part of these financial statements.
|
| The Hartford SmallCap Growth Fund |
Schedule of Investments – (continued)
April 30, 2015 (Unaudited)
| Note: | Percentage of investments as shown is the ratio of the total market value to total net assets. |
| | Other than the industry classifications “Other Investment Pools and Funds” and “Exchange Traded Funds,” equity industry classifications used in this report are the Global Industry Classification Standard, which was developed by and is the exclusive property and service mark of MSCI, Inc. and Standard & Poor’s. |
| | For Fund compliance purposes, the Fund may not use the same classification system shown in this report as these classifications are used for reporting ease. |
| ^ | At April 30, 2015, the cost of securities for federal income tax purposes was $892,393,573 and the aggregate gross unrealized appreciation and depreciation based on that cost were: |
| | | | |
Unrealized Appreciation | | $ | 158,797,371 | |
Unrealized Depreciation | | | (34,688,188 | ) |
| | | | |
Net Unrealized Appreciation | | $ | 124,109,183 | |
| | | | |
| (1) | Non-income producing. |
| (2) | The following security is considered illiquid. Illiquid securities are often purchased in private placement transactions, are often not registered under the Securities Act of 1933, as amended, and may have contractual restrictions on resale. A security may also be considered illiquid if the security lacks a readily available market or if its valuation has not changed for a certain period of time. |
| | | | | | | | | | |
Period
Acquired | | Shares/Par | | | Security | | Cost | |
12/2015 | | | 1,613 | | | Imperial Holdings, Inc. Warrants | | $ | — | |
At April 30, 2015, the aggregate value of these securities were $0, which represents 0.0% of total net assets.
| * | See Significant Accounting Policies of accompanying Notes to Financial Statements regarding valuation of securities. |
| | |
| GLOSSARY: (abbreviations used in preceding Schedule of Investments) |
|
| Other Abbreviations: |
ETF | | Exchange Traded Fund |
REIT | | Real Estate Investment Trust |
The accompanying notes are an integral part of these financial statements.
|
| The Hartford SmallCap Growth Fund |
Schedule of Investments – (continued)
April 30, 2015 (Unaudited)
Fair Valuation Summary
The following is a summary of the fair valuations according to the inputs used as of April 30, 2015 in valuing the Fund’s investments.
| | | | | | | | | | | | | | | | |
| | | Total | | | Level 1(1) | | | Level 2(1) | | | Level 3 | |
Assets | | | | | | | | | | | | | | | | |
Common Stocks | | | | | | | | | | | | | | | | |
Automobiles & Components | | $ | 15,839,967 | | | $ | 15,839,967 | | | $ | — | | | $ | — | |
Banks | | | 28,850,886 | | | | 28,850,886 | | | | — | | | | — | |
Capital Goods | | | 85,996,030 | | | | 85,996,030 | | | | — | | | | — | |
Commercial & Professional Services | | | 33,480,395 | | | | 33,480,395 | | | | — | | | | — | |
Consumer Durables & Apparel | | | 42,612,603 | | | | 42,612,603 | | | | — | | | | — | |
Consumer Services | | | 43,541,352 | | | | 43,541,352 | | | | — | | | | — | |
Diversified Financials | | | 19,641,968 | | | | 19,641,968 | | | | — | | | | — | |
Energy | | | 29,495,906 | | | | 29,495,906 | | | | — | | | | — | |
Food & Staples Retailing | | | 23,075,295 | | | | 23,075,295 | | | | — | | | | — | |
Food, Beverage & Tobacco | | | 15,518,388 | | | | 15,518,388 | | | | — | | | | — | |
Health Care Equipment & Services | | | 106,201,573 | | | | 106,201,573 | | | | — | | | | — | |
Household & Personal Products | | | 964,936 | | | | 964,936 | | | | — | | | | — | |
Insurance | | | 14,720,475 | | | | 14,720,475 | | | | — | | | | — | |
Materials | | | 53,762,966 | | | | 53,762,966 | | | | — | | | | — | |
Media | | | 461,890 | | | | 461,890 | | | | — | | | | — | |
Pharmaceuticals, Biotechnology & Life Sciences | | | 124,437,742 | | | | 124,437,742 | | | | — | | | | — | |
Real Estate | | | 15,902,604 | | | | 15,902,604 | | | | — | | | | — | |
Retailing | | | 53,243,035 | | | | 53,243,035 | | | | — | | | | — | |
Semiconductors & Semiconductor Equipment | | | 33,667,936 | | | | 33,667,936 | | | | — | | | | — | |
Software & Services | | | 206,624,115 | | | | 206,624,115 | | | | — | | | | — | |
Technology Hardware & Equipment | | | 24,364,604 | | | | 24,364,604 | | | | — | | | | — | |
Telecommunication Services | | | 1,861,110 | | | | 1,861,110 | | | | — | | | | — | |
Transportation | | | 20,774,988 | | | | 20,774,988 | | | | — | | | | — | |
Exchange Traded Funds | | | 11,565,482 | | | | 11,565,482 | | | | — | | | | — | |
Warrants | | | — | | | | — | | | | — | | | | — | |
Short-Term Investments | | | 9,896,510 | | | | 9,896,510 | | | | — | | | | — | |
| | | | | | | | | | | | | | | | |
Total | | $ | 1,016,502,756 | | | $ | 1,016,502,756 | | | $ | — | | | $ | — | |
| | | | | | | | | | | | | | | | |
| (1) | For the six-month period ended April 30, 2015, there were no transfers between Level 1 and Level 2. |
| Note: | For purposes of reporting transfers between different hierarchy levels, both transfers in and out of each level, as applicable, are shown as if they occurred at the beginning of the period. |
The accompanying notes are an integral part of these financial statements.
|
| The Hartford Value Opportunities Fund |
Diversification by Sector
as of April 30, 2015 (Unaudited)
| | | | |
| Sector | | Percentage of
Net Assets | |
Equity Securities | | | | |
Consumer Discretionary | | | 7.5 | % |
Consumer Staples | | | 2.2 | |
Energy | | | 13.9 | |
Financials | | | 31.6 | |
Health Care | | | 10.1 | |
Industrials | | | 10.6 | |
Information Technology | | | 10.0 | |
Materials | | | 8.0 | |
Telecommunication Services | | | 1.5 | |
Utilities | | | 4.3 | |
| | | | |
Total | | | 99.7 | % |
| | | | |
Short-Term Investments | | | 0.2 | % |
Other Assets & Liabilities | | | 0.1 | |
| | | | |
Total | | | 100.0 | % |
| | | | |
A sector may be comprised of several industries. For Fund compliance purposes, the Fund may not use the same classification system and these sector classifications are used for reporting ease.
The accompanying notes are an integral part of these financial statements.
|
| The Hartford Value Opportunities Fund |
Schedule of Investments
April 30, 2015 (Unaudited)
| | | | | | | | |
Shares or Principal Amount | | Market Value* | |
| COMMON STOCKS - 99.7% | |
| | | | Banks - 9.3% | | | |
| | 174,708 | | | Citigroup, Inc. | | $ | 9,315,431 | |
| | 170,279 | | | JP Morgan Chase & Co. | | | 10,771,849 | |
| | 80,906 | | | PNC Financial Services Group, Inc. | | | 7,421,507 | |
| | 30,500 | | | South State Corp. | | | 2,065,460 | |
| | | | | | | | |
| | | | | | | 29,574,247 | |
| | | | | | | | |
| | | | Capital Goods - 8.2% | | | |
| | 59,400 | | | Eaton Corp. plc | | | 4,082,562 | |
| | 61,600 | | | Generac Holdings, Inc.(1) | | | 2,568,104 | |
| | 305,679 | | | General Electric Co. | | | 8,277,787 | |
| | 13,400 | | | Orbital ATK, Inc. | | | 980,344 | |
| | 17,500 | | | Raytheon Co. | | | 1,820,000 | |
| | 115,461 | | | Rexel S.A. | | | 2,176,051 | |
| | 16,303 | | | Sulzer AG | | | 1,819,221 | |
| | 58,320 | | | WESCO International, Inc.(1) | | | 4,207,205 | |
| | | | | | | | |
| | | | | | | 25,931,274 | |
| | | | | | | | |
| | | | Commercial & Professional Services - 1.2% | | | |
| | 174,362 | | | Knoll, Inc. | | | 3,970,223 | |
| | | | | | | | |
| | | | Consumer Durables & Apparel - 2.1% | | | |
| | 62,400 | | | D.R. Horton, Inc. | | | 1,584,960 | |
| | 107,445 | | | Electrolux AB Series B | | | 3,217,185 | |
| | 135,380 | | | Vera Bradley, Inc.(1) | | | 1,927,811 | |
| | | | | | | | |
| | | | | | | 6,729,956 | |
| | | | | | | | |
| | | | Consumer Services - 2.5% | | | |
| | 74,800 | | | Las Vegas Sands Corp. | | | 3,955,424 | |
| | 73,500 | | | Melco Crown Entertainment Ltd. ADR | | | 1,500,870 | |
| | 21,400 | | | Norwegian Cruise Line Holdings Ltd.(1) | | | 1,038,114 | |
| | 360,000 | | | Sands China Ltd. | | | 1,467,500 | |
| | | | | | | | |
| | | | | | | 7,961,908 | |
| | | | | | | | |
| | | | Diversified Financials - 4.0% | | | |
| | 72,317 | | | Julius Baer Group Ltd.(1) | | | 3,785,125 | |
| | 59,710 | | | Northern Trust Corp. | | | 4,367,786 | |
| | 78,800 | | | Raymond James Financial, Inc. | | | 4,454,564 | |
| | 73,500 | | | Solar Cayman Ltd.(1)(2)(3)(4) | | | 5,145 | |
| | | | | | | | |
| | | | | | | 12,612,620 | |
| | | | | | | | |
| | | | Energy - 13.9% | | | |
| | 36,400 | | | Baker Hughes, Inc. | | | 2,491,944 | |
| | 56,175 | | | Cabot Oil & Gas Corp. | | | 1,899,838 | |
| | 111,800 | | | Cameco Corp. | | | 1,966,346 | |
| | 137,695 | | | Canadian Natural Resources Ltd. | | | 4,578,359 | |
| | 237,570 | | | Cobalt International Energy, Inc.(1) | | | 2,541,999 | |
| | 19,100 | | | Diamondback Energy, Inc.(1) | | | 1,577,087 | |
| | 99,115 | | | Halliburton Co. | | | 4,851,679 | |
| | 22,500 | | | Helmerich & Payne, Inc. | | | 1,754,325 | |
| | 75,505 | | | HollyFrontier Corp. | | | 2,928,084 | |
| | 182,500 | | | Laredo Petroleum, Inc.(1) | | | 2,883,500 | |
| | 57,990 | | | National Oilwell Varco, Inc. | | | 3,155,236 | |
| | 18,220 | | | Pioneer Natural Resources Co. | | | 3,148,052 | |
| | 78,485 | | | QEP Resources, Inc. | | | 1,765,912 | |
| | 269,530 | | | Southwestern Energy Co.(1) | | | 7,554,926 | |
| | 265,600 | | | Trican Well Service Ltd. | | | 1,122,719 | |
| | | | | | | | |
| | | | | | | 44,220,006 | |
| | | | | | | | |
| | | | Food, Beverage & Tobacco - 2.2% | | | |
| | 82,489 | | | Imperial Tobacco Group plc | | | 4,027,979 | |
| | 18,835 | | | Ingredion, Inc. | | | 1,495,499 | |
| | 310,148 | | | Treasury Wine Estates Ltd. | | | 1,360,236 | |
| | | | | | | | |
| | | | | | | 6,883,714 | |
| | | | | | | | |
| | | | | | | | |
Shares or Principal Amount | | Market Value* | |
| COMMON STOCKS - 99.7% - (continued) | |
| | | | Health Care Equipment & Services - 0.5% | | | |
| | 16,055 | | | Aetna, Inc. | | $ | 1,715,798 | |
| | | | | | | | |
| | | | Insurance - 12.1% | | | |
| | 127,208 | | | American International Group, Inc. | | | 7,160,539 | |
| | 74,900 | | | Arthur J Gallagher & Co. | | | 3,582,467 | |
| | 242,832 | | | MetLife, Inc. | | | 12,454,853 | |
| | 152,742 | | | Principal Financial Group, Inc. | | | 7,808,171 | |
| | 74,200 | | | Torchmark Corp. | | | 4,163,362 | |
| | 93,200 | | | Unum Group | | | 3,183,712 | |
| | | | | | | | |
| | | | | | | 38,353,104 | |
| | | | | | | | |
| | | | Materials - 8.0% | | | |
| | 52,320 | | | Cabot Corp. | | | 2,236,157 | |
| | 92,020 | | | Celanese Corp. Series A | | | 6,106,447 | |
| | 140,500 | | | Constellium N.V. Class A(1) | | | 2,580,985 | |
| | 106,500 | | | Huntsman Corp. | | | 2,454,825 | |
| | 100,200 | | | Norbord, Inc. | | | 2,021,440 | |
| | 112,605 | | | Reliance Steel & Aluminum Co. | | | 7,287,796 | |
| | 64,265 | | | Rio Tinto plc ADR | | | 2,878,429 | |
| | | | | | | | |
| | | | | | | 25,566,079 | |
| | | | | | | | |
| | | | Media - 2.0% | | | |
| | 124,300 | | | Quebecor, Inc. Class B | | | 3,418,379 | |
| | 179,779 | | | Sky plc | | | 2,964,184 | |
| | | | | | | | |
| | | | | | | 6,382,563 | |
| | | | | | | | |
| | | | Pharmaceuticals, Biotechnology & Life Sciences - 9.6% | |
| | 33,900 | | | AstraZeneca plc ADR | | | 2,321,472 | |
| | 4,400 | | | Biogen, Inc.(1) | | | 1,645,292 | |
| | 109,297 | | | Bristol-Myers Squibb Co. | | | 6,965,498 | |
| | 209,229 | | | Merck & Co., Inc. | | | 12,461,679 | |
| | 76,000 | | | Mylan N.V.(1) | | | 5,491,760 | |
| | 28,197 | | | TESARO, Inc.(1) | | | 1,535,891 | |
| | | | | | | | |
| | | | | | | 30,421,592 | |
| | | | | | | | |
| | | | Real Estate - 6.2% | | | |
| | 43,600 | | | American Tower Corp. REIT | | | 4,121,508 | |
| | 23,195 | | | AvalonBay Communities, Inc. REIT | | | 3,811,866 | |
| | 136,300 | | | Columbia Property Trust, Inc. REIT | | | 3,575,149 | |
| | 61,227 | | | Equity LifeStyle Properties, Inc. REIT | | | 3,234,010 | |
| | 9,300 | | | SL Green Realty Corp. REIT | | | 1,137,948 | |
| | 155,595 | | | Two Harbors Investment Corp. REIT | | | 1,633,748 | |
| | 66,040 | | | Weyerhaeuser Co. REIT | | | 2,080,920 | |
| | | | | | | | |
| | | | | | | 19,595,149 | |
| | | | | | | | |
| | | | Retailing - 1.1% | | | |
| | 571,800 | | | Allstar Co.(1)(3)(4) | | | 588,954 | |
| | 65,750 | | | GNC Holdings, Inc. Class A | | | 2,830,537 | |
| | | | | | | | |
| | | | | | | 3,419,491 | |
| | | | | | | | |
| | | | Semiconductors & Semiconductor Equipment - 1.2% | |
| | 114,390 | | | Maxim Integrated Products, Inc. | | | 3,755,424 | |
| | | | | | | | |
| | | | Software & Services - 2.7% | |
| | 128,575 | | | Activision Blizzard, Inc. | | | 2,933,439 | |
| | 10,200 | | | Google, Inc. Class A(1) | | | 5,597,454 | |
| | | | | | | | |
| | | | | | | 8,530,893 | |
| | | | | | | | |
| | | | Technology Hardware & Equipment - 6.1% | | | |
| | 175,500 | | | ARRIS Group, Inc.(1) | | | 5,909,963 | |
| | 340,924 | | | Cisco Systems, Inc. | | | 9,828,839 | |
| | 2,768 | | | Samsung Electronics Co., Ltd. | | | 3,631,211 | |
| | | | | | | | |
| | | | | | | 19,370,013 | |
| | | | | | | | |
The accompanying notes are an integral part of these financial statements.
|
| The Hartford Value Opportunities Fund |
Schedule of Investments – (continued)
April 30, 2015 (Unaudited)
| | | | | | | | |
Shares or Principal Amount | | Market Value* | |
| COMMON STOCKS - 99.7% - (continued) | |
| | | | Telecommunication Services - 1.5% | | | |
| | 95,900 | | | Verizon Communications, Inc. | | $ | 4,837,196 | |
| | | | | | | | |
| | | | Transportation - 1.0% | | | |
| | 32,405 | | | United Parcel Service, Inc. Class B | | | 3,257,675 | |
| | | | | | | | |
| | | | Utilities - 4.3% | | | |
| | 176,600 | | | Exelon Corp. | | | 6,007,932 | |
| | 62,485 | | | PG&E Corp. | | | 3,306,706 | |
| | 292,529 | | | Snam S.p.A. | | | 1,523,825 | |
| | 85,925 | | | Xcel Energy, Inc. | | | 2,913,717 | |
| | | | | | | | |
| | | | | | | 13,752,180 | |
| | | | | | | | |
| | |
| | | | Total Common Stocks
(cost $299,207,426) | | $ | 316,841,105 | |
| | | | | | | | |
| | |
| | | | Total Long-Term Investments
(cost $299,207,426) | | $ | 316,841,105 | |
| | | | | | | | |
|
| SHORT-TERM INVESTMENTS - 0.2% | |
| | | | Other Investment Pools & Funds - 0.2% | |
| | 583,263 | | | Federated Prime Obligations Fund | | $ | 583,263 | |
| | | | | | | | |
| | |
| | | | Total Short-Term Investments
(cost $583,263) | | $ | 583,263 | |
| | | | | | | | |
| | | | | | | | | | |
| | | |
| | Total Investments
(cost $299,790,689)^ | | | 99.9 | % | | $ | 317,424,368 | |
| | Other Assets and Liabilities | | | 0.1 | % | | | 384,470 | |
| | | | | | | | | | |
| | Total Net Assets | | | 100.0 | % | | $ | 317,808,838 | |
| | | | | | | | | | |
The accompanying notes are an integral part of these financial statements.
|
| The Hartford Value Opportunities Fund |
Schedule of Investments – (continued)
April 30, 2015 (Unaudited)
| Note: | Percentage of investments as shown is the ratio of the total market value to total net assets. |
| | Prices of foreign equities that are principally traded on certain foreign markets may be adjusted daily pursuant to a fair value pricing service approved by the Board of Directors in order to reflect an adjustment for factors occurring after the close of certain foreign markets but before the close of the New York Stock Exchange. |
| | Equity industry classifications used in this report are the Global Industry Classification Standard, which was developed by and is the exclusive property and service mark of MSCI, Inc. and Standard & Poor’s. |
| | For Fund compliance purposes, the Fund may not use the same classification system shown in this report as these classifications are used for reporting ease. |
| ^ | At April 30, 2015, the cost of securities for federal income tax purposes was $300,799,389 and the aggregate gross unrealized appreciation and depreciation based on that cost were: |
| | | | |
Unrealized Appreciation | | $ | 31,040,186 | |
Unrealized Depreciation | | | (14,415,207 | ) |
| | | | |
Net Unrealized Appreciation | | $ | 16,624,979 | |
| | | | |
| (1) | Non-income producing. |
| (2) | Securities issued within terms of a private placement memorandum, exempt from registration under Rule 144A under the Securities Act of 1933, as amended, and may be sold only to qualified institutional buyers. Unless otherwise indicated, this holding is determined to be liquid. At April 30, 2015, the aggregate value of this security was $5,145, which represents 0.0% of total net assets. |
| (3) | The following securities are considered illiquid. Illiquid securities are often purchased in private placement transactions, are often not registered under the Securities Act of 1933, as amended, and may have contractual restrictions on resale. A security may also be considered illiquid if the security lacks a readily available market or if its valuation has not changed for a certain period of time. |
| | | | | | | | | | |
Period
Acquired | | Shares/Par | | | Security | | Cost | |
08/2011 | | | 571,800 | | | Allstar Co. | | $ | 248,744 | |
03/2007 | | | 73,500 | | | Solar Cayman Ltd. | | | 21,542 | |
| | | | | | | | | | |
| | | | | | | | $ | 270,286 | |
| | | | | | | | | | |
At April 30, 2015, the aggregate value of these securities were $594,099, which represents 0.2% of total net assets.
| (4) | These securities are valued in good faith at fair value as determined under policies and procedures established by and under the supervision of the Board of Directors. At April 30, 2015, the aggregate fair value of these securities were $594,099, which represents 0.2% of total net assets. This amount excludes securities that are principally traded in certain foreign markets and whose prices are adjusted pursuant to a third party pricing service methodology approved by the Board of Directors. |
| | | | | | | | | | | | | | | | | | | | |
| Foreign Currency Contracts Outstanding at April 30, 2015 | |
Currency | | Buy/Sell | | Delivery
Date | | | Counterparty | | Contract
Amount | | | Market
Value* | | | Unrealized
Appreciation/
(Depreciation) | |
CHF | | Sell | | | 05/04/15 | | | MSC | | $ | 162,574 | | | $ | 163,506 | | | $ | (932 | ) |
EUR | | Buy | | | 06/17/15 | | | RBS | | | 2,684,114 | | | | 2,749,352 | | | | 65,238 | |
EUR | | Sell | | | 06/17/15 | | | NAB | | | 5,133,661 | | | | 5,425,673 | | | | (292,012 | ) |
EUR | | Sell | | | 06/17/15 | | | RBS | | | 5,118,402 | | | | 5,425,674 | | | | (307,272 | ) |
GBP | | Sell | | | 06/17/15 | | | BNP | | | 843,707 | | | | 865,446 | | | | (21,739 | ) |
GBP | | Sell | | | 06/17/15 | | | BCLY | | | 1,568,199 | | | | 1,597,392 | | | | (29,193 | ) |
GBP | | Sell | | | 06/17/15 | | | RBS | | | 1,566,310 | | | | 1,595,858 | | | | (29,548 | ) |
JPY | | Buy | | | 06/17/15 | | | GSC | | | 2,198,061 | | | | 2,233,611 | | | | 35,550 | |
JPY | | Sell | | | 06/17/15 | | | DEUT | | | 1,100,846 | | | | 1,116,805 | | | | (15,959 | ) |
JPY | | Sell | | | 06/17/15 | | | JPM | | | 1,100,737 | | | | 1,116,805 | | | | (16,068 | ) |
| | | | | | | | | | | | | | | | | | | | |
Total | | | | | | | | | | | | | | | | | | $ | (611,935 | ) |
| | | | | | | | | | | | | | | | | | | | |
| * | See Significant Accounting Policies of accompanying Notes to Financial Statements regarding valuation of securities. |
The accompanying notes are an integral part of these financial statements.
|
| The Hartford Value Opportunities Fund |
Schedule of Investments – (continued)
April 30, 2015 (Unaudited)
| | |
| GLOSSARY: (abbreviations used in preceding Schedule of Investments) |
|
| Counterparty Abbreviations: |
BCLY | | Barclays |
BNP | | BNP Paribas Securities Services |
DEUT | | Deutsche Bank Securities, Inc. |
GSC | | Goldman Sachs & Co. |
JPM | | JP Morgan Chase & Co. |
MSC | | Morgan Stanley |
NAB | | National Australia Bank Limited |
RBS | | RBS Greenwich Capital |
|
| Currency Abbreviations: |
CHF | | Swiss Franc |
EUR | | Euro |
GBP | | British Pound |
JPY | | Japanese Yen |
|
| Other Abbreviations: |
ADR | | American Depositary Receipt |
REIT | | Real Estate Investment Trust |
The accompanying notes are an integral part of these financial statements.
|
| The Hartford Value Opportunities Fund |
Schedule of Investments – (continued)
April 30, 2015 (Unaudited)
Fair Valuation Summary
The following is a summary of the fair valuations according to the inputs used as of April 30, 2015 in valuing the Fund’s investments.
| | | | | | | | | | | | | | | | |
| | | Total | | | Level 1(1) | | | Level 2(1) | | | Level 3 | |
Assets | | | | | | | | | | | | | | | | |
Common Stocks | | | | | | | | | | | | | | | | |
Banks | | $ | 29,574,247 | | | $ | 29,574,247 | | | $ | — | | | $ | — | |
Capital Goods | | | 25,931,274 | | | | 21,936,002 | | | | 3,995,272 | | | | — | |
Commercial & Professional Services | | | 3,970,223 | | | | 3,970,223 | | | | — | | | | — | |
Consumer Durables & Apparel | | | 6,729,956 | | | | 3,512,771 | | | | 3,217,185 | | | | — | |
Consumer Services | | | 7,961,908 | | | | 6,494,408 | | | | 1,467,500 | | | | — | |
Diversified Financials | | | 12,612,620 | | | | 8,822,350 | | | | 3,785,125 | | | | 5,145 | |
Energy | | | 44,220,006 | | | | 44,220,006 | | | | — | | | | — | |
Food, Beverage & Tobacco | | | 6,883,714 | | | | 1,495,499 | | | | 5,388,215 | | | | — | |
Health Care Equipment & Services | | | 1,715,798 | | | | 1,715,798 | | | | — | | | | — | |
Insurance | | | 38,353,104 | | | | 38,353,104 | | | | — | | | | — | |
Materials | | | 25,566,079 | | | | 25,566,079 | | | | — | | | | — | |
Media | | | 6,382,563 | | | | 3,418,379 | | | | 2,964,184 | | | | — | |
Pharmaceuticals, Biotechnology & Life Sciences | | | 30,421,592 | | | | 30,421,592 | | | | — | | | | — | |
Real Estate | | | 19,595,149 | | | | 19,595,149 | | | | — | | | | — | |
Retailing | | | 3,419,491 | | | | 2,830,537 | | | | — | | | | 588,954 | |
Semiconductors & Semiconductor Equipment | | | 3,755,424 | | | | 3,755,424 | | | | — | | | | — | |
Software & Services | | | 8,530,893 | | | | 8,530,893 | | | | — | | | | — | |
Technology Hardware & Equipment | | | 19,370,013 | | | | 15,738,802 | | | | 3,631,211 | | | | — | |
Telecommunication Services | | | 4,837,196 | | | | 4,837,196 | | | | — | | | | — | |
Transportation | | | 3,257,675 | | | | 3,257,675 | | | | — | | | | — | |
Utilities | | | 13,752,180 | | | | 12,228,355 | | | | 1,523,825 | | | | — | |
Short-Term Investments | | | 583,263 | | | | 583,263 | | | | — | | | | — | |
| | | | | | | | | | | | | | | | |
Total | | $ | 317,424,368 | | | $ | 290,857,752 | | | $ | 25,972,517 | | | $ | 594,099 | |
| | | | | | | | | | | | | | | | |
Foreign Currency Contracts(2) | | $ | 100,788 | | | $ | — | | | $ | 100,788 | | | $ | — | |
| | | | | | | | | | | | | | | | |
Total | | $ | 100,788 | | | $ | — | | | $ | 100,788 | | | $ | — | |
| | | | | | | | | | | | | | | | |
Liabilities | | | | | | | | | | | | | | | | |
Foreign Currency Contracts(2) | | $ | (712,723 | ) | | $ | — | | | $ | (712,723 | ) | | $ | — | |
| | | | | | | | | | | | | | | | |
Total | | $ | (712,723 | ) | | $ | — | | | $ | (712,723 | ) | | $ | — | |
| | | | | | | | | | | | | | | | |
| (1) | For the six-month period ended April 30, 2015, there were no transfers between Level 1 and Level 2. |
| (2) | Derivative instruments (excluding purchased and written options, if applicable) are valued at the unrealized appreciation/depreciation on the investments. |
The following is a rollforward of the Fund’s investments that were valued using unobservable inputs (Level 3) for the six-month period ended April 30, 2015:
| | | | | | | | |
| | | Common Stocks | | | Total | |
Beginning balance | | $ | 490,489 | | | $ | 490,489 | |
Purchases | | | — | | | | — | |
Sales | | | — | | | | — | |
Accrued discounts/(premiums) | | | — | | | | — | |
Total realized gain/(loss) | | | — | | | | — | |
Net change in unrealized appreciation/depreciation | | | 103,610 | | | | 103,610 | |
Transfers into Level 3(1) | | | — | | | | — | |
Transfers out of Level 3(1) | | | — | | | | — | |
| | | | | | | | |
Ending balance | | $ | 594,099 | | | $ | 594,099 | |
The change in net unrealized appreciation/depreciation relating to the Level 3 investment held at April 30, 2015 was $103,610.
| (1) | Investments are transferred into and out of Level 3 for a variety of reasons including, but not limited to: |
| | a) | Investments where trading has been halted (transfer into Level 3) or investments where trading has resumed (transfer out of Level 3). |
| | b) | Broker quoted investments (transfer into Level 3) or quoted prices in active markets (transfer out of Level 3). |
| | c) | Investments that have certain restrictions on trading (transfer into level 3) or investments where trading restrictions have expired (transfer out of Level 3). |
| Note: | For purposes of reporting transfers between different hierarchy levels, both transfers in and out of each level, as applicable, are shown as if they occurred at the beginning of the period. |
The accompanying notes are an integral part of these financial statements.
|
| Hartford Funds – Domestic Equity Funds |
Statements of Assets and Liabilities
April 30, 2015 (Unaudited)
| | | | | | | | | | | | |
| | | The Hartford
Capital
Appreciation
Fund | | | Hartford
Core Equity
Fund | | | The Hartford
Dividend and
Growth Fund | |
Assets: | | | | | | | | | | | | |
Investments in securities, at market value | | $ | 11,457,060,640 | | | $ | 240,226,198 | | | $ | 8,159,696,065 | |
Cash | | | 137,765 | | | | 1,876 | | | | — | |
Cash collateral | | | — | | | | 317,400 | | | | — | |
Foreign currency on deposit with custodian | | | 610,305 | | | | — | | | | — | |
Unrealized appreciation on foreign currency contracts | | | 308,208 | | | | — | | | | — | |
Receivables: | | | | | | | | | | | | |
Investment securities sold | | | 129,423,091 | | | | 483,421 | | | | 33,546,195 | |
Fund shares sold | | | 6,242,246 | | | | 2,367,765 | | | | 6,067,758 | |
Dividends and interest | | | 18,376,513 | | | | 175,211 | | | | 11,267,776 | |
Other assets | | | 98,882 | | | | 122,000 | | | | 89,830 | |
| | | | | | | | | | | | |
Total assets | | | 11,612,257,650 | | | | 243,693,871 | | | | 8,210,667,624 | |
| | | | | | | | | | | | |
Liabilities: | | | | | | | | | | | | |
Unrealized depreciation on foreign currency contracts | | | 12,078,803 | | | | — | | | | — | |
Bank overdraft | | | — | | | | — | | | | — | |
Payables: | | | | | | | | | | | | |
Investment securities purchased | | | 150,136,464 | | | | 794,610 | | | | 36,367,997 | |
Fund shares redeemed | | | 12,708,622 | | | | 346,378 | | | | 10,026,051 | |
Investment management fees | | | 6,238,523 | | | | 83,003 | | | | 4,062,935 | |
Variation margin on financial derivative instruments | | | — | | | | 69,364 | | | | — | |
Distribution fees | | | 3,073,954 | | | | 62,845 | | | | 1,309,729 | |
Distributions payable | | | 15 | | | | — | | | | — | |
Accrued expenses | | | 1,764,253 | | | | 29,981 | | | | 1,099,877 | |
| | | | | | | | | | | | |
Total liabilities | | | 186,000,634 | | | | 1,386,181 | | | | 52,866,589 | |
| | | | | | | | | | | | |
Net assets | | $ | 11,426,257,016 | | | $ | 242,307,690 | | | $ | 8,157,801,035 | |
| | | | | | | | | | | | |
Summary of Net Assets: | | | | | | | | | | | | |
Capital stock and paid-in-capital | | $ | 9,962,977,224 | | | $ | 199,471,874 | | | $ | 5,583,967,829 | |
Undistributed (distributions in excess of) net investment income | | | 12,540,315 | | | | 369,139 | | | | 12,468,525 | |
Accumulated net realized gain (loss) | | | 474,916,999 | | | | 3,877,428 | | | | 338,659,016 | |
Unrealized appreciation (depreciation) of investments and the translation of assets and liabilities denominated in foreign currency | | | 975,822,478 | | | | 38,589,249 | | | | 2,222,705,665 | |
| | | | | | | | | | | | |
Net assets | | $ | 11,426,257,016 | | | $ | 242,307,690 | | | $ | 8,157,801,035 | |
| | | | | | | | | | | | |
Shares authorized | | | 1,615,000,000 | | | | 450,000,000 | | | | 1,000,000,000 | |
| | | | | | | | | | | | |
Par value | | $ | 0.001 | | | $ | 0.001 | | | $ | 0.001 | |
| | | | | | | | | | | | |
Class A: Net asset value per share | | $ | 38.69 | | | $ | 23.29 | | | $ | 25.53 | |
| | | | | | | | | | | | |
Maximum offering price per share | | $ | 40.94 | | | $ | 24.65 | | | $ | 27.02 | |
| | | | | | | | | | | | |
Shares outstanding | | | 148,827,576 | | | | 7,278,999 | | | | 151,145,454 | |
| | | | | | | | | | | | |
Net Assets | | $ | 5,758,185,207 | | | $ | 169,527,754 | | | $ | 3,859,234,310 | |
| | | | | | | | | | | | |
Class B: Net asset value per share | | $ | 31.57 | | | $ | 21.71 | | | $ | 25.06 | |
| | | | | | | | | | | | |
Shares outstanding | | | 6,553,006 | | | | 76,746 | | | | 2,331,687 | |
| | | | | | | | | | | | |
Net Assets | | $ | 206,888,958 | | | $ | 1,665,938 | | | $ | 58,443,035 | |
| | | | | | | | | | | | |
Class C: Net asset value per share | | $ | 32.04 | | | $ | 21.65 | | | $ | 24.87 | |
| | | | | | | | | | | | |
Shares outstanding | | | 60,329,556 | | | | 1,556,180 | | | | 19,447,985 | |
| | | | | | | | | | | | |
Net Assets | | $ | 1,932,773,318 | | | $ | 33,694,070 | | | $ | 483,693,972 | |
| | | | | | | | | | | | |
Class I: Net asset value per share | | $ | 38.78 | | | $ | 23.30 | | | $ | 25.43 | |
| | | | | | | | | | | | |
Shares outstanding | | | 47,557,811 | | | | 41,366 | | | | 75,047,085 | |
| | | | | | | | | | | | |
Net Assets | | $ | 1,844,472,287 | | | $ | 963,726 | | | $ | 1,908,492,174 | |
| | | | | | | | | | | | |
Class R3: Net asset value per share | | $ | 41.70 | | | $ | 23.70 | | | $ | 25.78 | |
| | | | | | | | | | | | |
Shares outstanding | | | 3,195,048 | | | | 27,087 | | | | 3,597,625 | |
| | | | | | | | | | | | |
Net Assets | | $ | 133,248,183 | | | $ | 642,055 | | | $ | 92,763,155 | |
| | | | | | | | | | | | |
The accompanying notes are an integral part of these financial statements.
|
| Hartford Funds – Domestic Equity Funds |
Statements of Assets and Liabilities – (continued)
April 30, 2015 (Unaudited)
| | | | | | | | | | | | | | | | | | | | | | | | | | |
The Hartford
Equity Income
Fund | | | The Hartford
Growth
Opportunities
Fund | | | The Hartford
Healthcare Fund | | | The Hartford
MidCap Fund | | | The Hartford
MidCap Value
Fund | | | The Hartford
Small Company
Fund | | | The Hartford
Small/Mid Cap
Equity Fund | |
| | | | | | | | | | | | | | | | | | | | | | | | | | |
| $ | 3,841,769,958 | | | $ | 4,260,873,133 | | | $ | 1,366,809,633 | | | $ | 4,756,893,955 | | | $ | 512,883,922 | | | $ | 959,039,584 | | | $ | 76,719,916 | |
| | — | | | | 13,493 | | | | — | | | | — | | | | — | | | | — | | | | — | |
| | — | | | | — | | | | — | | | | — | | | | — | | | | — | | | | — | |
| | — | | | | 24 | | | | 5 | | | | — | | | | — | | | | — | | | | — | |
| | — | | | | 6,099 | | | | 1,871 | | | | — | | | | 37 | | | | — | | | | — | |
| | | | | | | | | | | | | | | | | | | | | | | | | | |
| | — | | | | 11,797,839 | | | | 5,836,195 | | | | 1,842,145 | | | | 505,358 | | | | 21,241,340 | | | | — | |
| | 9,230,012 | | | | 22,677,740 | | | | 7,195,703 | | | | 9,836,692 | | | | 633,631 | | | | 1,396,430 | | | | 229,468 | |
| | 7,036,321 | | | | 1,951,225 | | | | 1,124,962 | | | | 531,111 | | | | 224,448 | | | | 24,459 | | | | 33,550 | |
| | 105,291 | | | | 162,692 | | | | 108,616 | | | | 112,438 | | | | 76,796 | | | | 78,579 | | | | 64,583 | |
| | | | | | | | | | | | | | | | | | | | | | | | | | |
| | 3,858,141,582 | | | | 4,297,482,245 | | | | 1,381,076,985 | | | | 4,769,216,341 | | | | 514,324,192 | | | | 981,780,392 | | | | 77,047,517 | |
| | | | | | | | | | | | | | | | | | | | | | | | | | |
| | | | | | | | | | | | | | | | | | | | | | | | | | |
| | — | | | | — | | | | 3,156 | | | | — | | | | 73 | | | | — | | | | — | |
| | 424 | | | | — | | | | — | | | | — | | | | — | | | | 224,597 | | | | — | |
| | | | | | | | | | | | | | | | | | | | | | | | | | |
| | 12,114,106 | | | | 37,841,252 | | | | 27,656,938 | | | | 3,123,912 | | | | 1,360,651 | | | | 21,122,781 | | | | 812,457 | |
| | 8,034,593 | | | | 4,952,192 | | | | 1,263,443 | | | | 9,630,112 | | | | 453,011 | | | | 715,462 | | | | 61,875 | |
| | 1,961,733 | | | | 2,447,771 | | | | 962,455 | | | | 2,865,942 | | | | 317,913 | | | | 640,772 | | | | 47,679 | |
| | — | | | | — | | | | — | | | | — | | | | — | | | | — | | | | — | |
| | 854,360 | | | | 626,843 | | | | 407,970 | | | | 1,000,652 | | | | 93,562 | | | | 148,370 | | | | 26,212 | |
| | — | | | | — | | | | — | | | | — | | | | — | | | | — | | | | — | |
| | 527,545 | | | | 598,901 | | | | 125,130 | | | | 553,199 | | | | 82,869 | | | | 167,828 | | | | 21,503 | |
| | | | | | | | | | | | | | | | | | | | | | | | | | |
| | 23,492,761 | | | | 46,466,959 | | | | 30,419,092 | | | | 17,173,817 | | | | 2,308,079 | | | | 23,019,810 | | | | 969,726 | |
| | | | | | | | | | | | | | | | | | | | | | | | | | |
| $ | 3,834,648,821 | | | $ | 4,251,015,286 | | | $ | 1,350,657,893 | | | $ | 4,752,042,524 | | | $ | 512,016,113 | | | $ | 958,760,582 | | | $ | 76,077,791 | |
| | | | | | | | | | | | | | | | | | | | | | | | | | |
| | | | | | | | | | | | | | | | | | | | | | | | | | |
| $ | 2,931,410,900 | | | $ | 3,428,187,033 | | | $ | 909,879,262 | | | $ | 3,380,099,967 | | | $ | 398,532,449 | | | $ | 791,697,515 | | | $ | 70,218,712 | |
| | 5,772,225 | | | | (5,847,528 | ) | | | (8,152,403 | ) | | | (5,041,381 | ) | | | (706,364 | ) | | | (2,696,391 | ) | | | 298,912 | |
| | 134,542,413 | | | | 252,620,015 | | | | 73,198,703 | | | | 207,853,128 | | | | 17,060,104 | | | | 69,669,672 | | | | (4,276,248 | ) |
|
762,923,283 |
| | | 576,055,766 | | | | 375,732,331 | | | | 1,169,130,810 | | | | 97,129,924 | | | | 100,089,786 | | | | 9,836,415 | |
| | | | | | | | | | | | | | | | | | | | | | | | | | |
| $ | 3,834,648,821 | | | $ | 4,251,015,286 | | | $ | 1,350,657,893 | | | $ | 4,752,042,524 | | | $ | 512,016,113 | | | $ | 958,760,582 | | | $ | 76,077,791 | |
| | | | | | | | | | | | | | | | | | | | | | | | | | |
| | 600,000,000 | | | | 23,750,000,000 | | | | 500,000,000 | | | | 760,000,000 | | | | 500,000,000 | | | | 500,000,000 | | | | 950,000,000 | |
| | | | | | | | | | | | | | | | | | | | | | | | | | |
| $ | 0.001 | | | $ | 0.001 | | | $ | 0.001 | | | $ | 0.001 | | | $ | 0.001 | | | $ | 0.001 | | | $ | 0.001 | |
| | | | | | | | | | | | | | | | | | | | | | | | | | |
| $ | 19.00 | | | $ | 39.96 | | | $ | 38.24 | | | $ | 26.25 | | | $ | 15.69 | | | $ | 21.37 | | | $ | 13.05 | |
| | | | | | | | | | | | | | | | | | | | | | | | | | |
| $ | 20.11 | | | $ | 42.29 | | | $ | 40.47 | | | $ | 27.78 | | | $ | 16.60 | | | $ | 22.61 | | | $ | 13.81 | |
| | | | | | | | | | | | | | | | | | | | | | | | | | |
| | 101,409,021 | | | | 41,625,899 | | | | 20,493,623 | | | | 77,402,699 | | | | 15,153,929 | | | | 17,446,290 | | | | 4,345,616 | |
| | | | | | | | | | | | | | | | | | | | | | | | | | |
| $ | 1,927,191,358 | | | $ | 1,663,573,791 | | | $ | 783,667,790 | | | $ | 2,032,107,581 | | | $ | 237,708,694 | | | $ | 372,855,956 | | | $ | 56,716,432 | |
| | | | | | | | | | | | | | | | | | | | | | | | | | |
| $ | 19.01 | | | $ | 28.70 | | | $ | 33.16 | | | $ | 20.06 | | | $ | 13.71 | | | $ | 16.72 | | | $ | 12.29 | |
| | | | | | | | | | | | | | | | | | | | | | | | | | |
| | 921,979 | | | | 702,236 | | | | 265,439 | | | | 1,392,535 | | | | 136,716 | | | | 236,408 | | | | 197,346 | |
| | | | | | | | | | | | | | | | | | | | | | | | | | |
| $ | 17,531,104 | | | $ | 20,152,326 | | | $ | 8,801,368 | | | $ | 27,931,580 | | | $ | 1,874,305 | | | $ | 3,951,845 | | | $ | 2,424,515 | |
| | | | | | | | | | | | | | | | | | | | | | | | | | |
| $ | 18.92 | | | $ | 28.96 | | | $ | 33.45 | | | $ | 20.64 | | | $ | 13.65 | | | $ | 16.68 | | | $ | 12.12 | |
| | | | | | | | | | | | | | | | | | | | | | | | | | |
| | 25,514,983 | | | | 10,178,502 | | | | 7,346,711 | | | | 28,782,160 | | | | 3,160,657 | | | | 2,368,259 | | | | 1,155,852 | |
| | | | | | | | | | | | | | | | | | | | | | | | | | |
| $ | 482,759,482 | | | $ | 294,725,944 | | | $ | 245,745,351 | | | $ | 594,013,426 | | | $ | 43,133,766 | | | $ | 39,511,250 | | | $ | 14,012,587 | |
| | | | | | | | | | | | | | | | | | | | | | | | | | |
| $ | 18.93 | | | $ | 41.20 | | | $ | 39.45 | | | $ | 26.70 | | | $ | 15.78 | | | $ | 22.10 | | | $ | 13.06 | |
| | | | | | | | | | | | | | | | | | | | | | | | | | |
| | 48,342,681 | | | | 47,807,695 | | | | 5,119,963 | | | | 24,595,897 | | | | 2,207,769 | | | | 3,231,077 | | | | 7,463 | |
| | | | | | | | | | | | | | | | | | | | | | | | | | |
| $ | 914,952,575 | | | $ | 1,969,532,572 | | | $ | 201,967,497 | | | $ | 656,813,093 | | | $ | 34,830,922 | | | $ | 71,400,056 | | | $ | 97,441 | |
| | | | | | | | | | | | | | | | | | | | | | | | | | |
| $ | 19.02 | | | $ | 40.45 | | | $ | 39.28 | | | $ | 29.01 | | | $ | 16.44 | | | $ | 22.96 | | | $ | 13.40 | |
| | | | | | | | | | | | | | | | | | | | | | | | | | |
| | 3,326,977 | | | | 899,334 | | | | 1,405,113 | | | | 2,443,300 | | | | 556,640 | | | | 1,769,212 | | | | 54,846 | |
| | | | | | | | | | | | | | | | | | | | | | | | | | |
| $ | 63,284,862 | | | $ | 36,378,442 | | | $ | 55,187,812 | | | $ | 70,881,435 | | | $ | 9,153,412 | | | $ | 40,616,290 | | | $ | 734,749 | |
| | | | | | | | | | | | | | | | | | | | | | | | | | |
The accompanying notes are an integral part of these financial statements.
|
| Hartford Funds – Domestic Equity Funds |
Statements of Assets and Liabilities – (continued)
April 30, 2015 (Unaudited)
| | | | | | | | | | | | |
| | | The Hartford
Capital
Appreciation
Fund | | | Hartford
Core Equity
Fund | | | The Hartford
Dividend and
Growth Fund | |
Class R4: Net asset value per share | | $ | 42.66 | | | $ | 23.95 | | | $ | 25.92 | |
| | | | | | | | | | | | |
Shares outstanding | | | 4,342,650 | | | | 131,978 | | | | 6,087,298 | |
| | | | | | | | | | | | |
Net Assets | | $ | 185,254,064 | | | $ | 3,160,665 | | | $ | 157,781,824 | |
| | | | | | | | | | | | |
Class R5: Net asset value per share | | $ | 43.38 | | | $ | 23.45 | | | $ | 25.99 | |
| | | | | | | | | | | | |
Shares outstanding | | | 1,269,378 | | | | 969,243 | | | | 9,343,411 | |
| | | | | | | | | | | | |
Net Assets | | $ | 55,059,464 | | | $ | 22,733,161 | | | $ | 242,869,003 | |
| | | | | | | | | | | | |
Class R6: Net asset value per share | | $ | 43.57 | | | $ | 23.52 | | | $ | 26.01 | |
| | | | | | | | | | | | |
Shares outstanding | | | 242 | | | | 425 | | | | 396 | |
| | | | | | | | | | | | |
Net Assets | | $ | 10,546 | | | $ | 9,998 | | | $ | 10,294 | |
| | | | | | | | | | | | |
Class Y: Net asset value per share | | $ | 43.56 | | | $ | 23.53 | | | $ | 26.01 | |
| | | | | | | | | | | | |
Shares outstanding | | | 30,078,646 | | | | 421,244 | | | | 52,085,942 | |
| | | | | | | | | | | | |
Net Assets | | $ | 1,310,364,989 | | | $ | 9,910,323 | | | $ | 1,354,513,268 | |
| | | | | | | | | | | | |
Cost of investments | | $ | 10,469,087,956 | | | $ | 201,608,869 | | | $ | 5,936,990,400 | |
Cost of foreign currency on deposit with custodian | | $ | 595,610 | | | $ | — | | | $ | — | |
The accompanying notes are an integral part of these financial statements.
|
| Hartford Funds – Domestic Equity Funds |
Statements of Assets and Liabilities – (continued)
April 30, 2015 (Unaudited)
| | | | | | | | | | | | | | | | | | | | | | | | | | |
The Hartford
Equity Income
Fund | | | The Hartford
Growth
Opportunities
Fund | | | The Hartford
Healthcare Fund | | | The Hartford
MidCap Fund | | | The Hartford
MidCap Value
Fund | | | The Hartford
Small Company
Fund | | | The Hartford
Small/Mid Cap
Equity Fund | |
| $ | 19.05 | | | $ | 41.77 | | | $ | 40.52 | | | $ | 29.69 | | | $ | 16.60 | | | $ | 23.85 | | | $ | 13.43 | |
| | | | | | | | | | | | | | | | | | | | | | | | | | |
| | 4,132,911 | | | | 1,421,770 | | | | 1,048,878 | | | | 4,462,395 | | | | 739,334 | | | | 2,895,171 | | | | 39,731 | |
| | | | | | | | | | | | | | | | | | | | | | | | | | |
| $ | 78,711,715 | | | $ | 59,382,857 | | | $ | 42,499,013 | | | $ | 132,480,494 | | | $ | 12,272,682 | | | $ | 69,036,199 | | | $ | 533,590 | |
| | | | | | | | | | | | | | | | | | | | | | | | | | |
| $ | 19.12 | | | $ | 42.90 | | | $ | 41.66 | | | $ | 30.10 | | | $ | 16.74 | | | $ | 24.65 | | | $ | 13.48 | |
| | | | | | | | | | | | | | | | | | | | | | | | | | |
| | 5,036,331 | | | | 2,640,334 | | | | 114,850 | | | | 4,809,165 | | | | 454,910 | | | | 448,535 | | | | 17,048 | |
| | | | | | | | | | | | | | | | | | | | | | | | | | |
| $ | 96,291,510 | | | $ | 113,282,783 | | | $ | 4,784,436 | | | $ | 144,778,239 | | | $ | 7,614,760 | | | $ | 11,055,573 | | | $ | 229,801 | |
| | | | | | | | | | | | | | | | | | | | | | | | | | |
| $ | 19.15 | | | $ | 43.32 | | | $ | — | | | $ | 30.27 | | | $ | — | | | $ | 25.00 | | | $ | — | |
| | | | | | | | | | | | | | | | | | | | | | | | | | |
| | 1,169 | | | | 254 | | | | — | | | | 29,553 | | | | — | | | | 416 | | | | — | |
| | | | | | | | | | | | | | | | | | | | | | | | | | |
| $ | 22,392 | | | $ | 11,004 | | | $ | — | | | $ | 894,612 | | | $ | — | | | $ | 10,402 | | | $ | — | |
| | | | | | | | | | | | | | | | | | | | | | | | | | |
| $ | 19.15 | | | $ | 43.31 | | | $ | 41.95 | | | $ | 30.26 | | | $ | 16.77 | | | $ | 24.99 | | | $ | 13.47 | |
| | | | | | | | | | | | | | | | | | | | | | | | | | |
| | 13,256,341 | | | | 2,169,959 | | | | 190,798 | | | | 36,089,979 | | | | 9,865,323 | | | | 14,018,515 | | | | 98,664 | |
| | | | | | | | | | | | | | | | | | | | | | | | | | |
| $ | 253,903,823 | | | $ | 93,975,567 | | | $ | 8,004,626 | | | $ | 1,092,142,064 | | | $ | 165,427,572 | | | $ | 350,323,011 | | | $ | 1,328,676 | |
| | | | | | | | | | | | | | | | | | | | | | | | | | |
| $ | 3,078,844,450 | | | $ | 3,684,809,554 | | | $ | 991,073,110 | | | $ | 3,587,763,145 | | | $ | 415,750,923 | | | $ | 858,949,795 | | | $ | 66,883,501 | |
| $ | — | | | $ | 23 | | | $ | 5 | | | $ | — | | | $ | — | | | $ | — | | | $ | — | |
The accompanying notes are an integral part of these financial statements.
|
| Hartford Funds – Domestic Equity Funds |
Statements of Assets and Liabilities – (continued)
April 30, 2015 (Unaudited)
| | | | | | | | |
| | | The Hartford
SmallCap
Growth Fund | | | The Hartford
Value
Opportunities
Fund | |
Assets: | | | | | | | | |
Investments in securities, at market value | | $ | 1,016,502,756 | | | $ | 317,424,368 | |
Cash | | | 18,543 | | | | 38,974 | |
Unrealized appreciation on foreign currency contracts | | | — | | | | 100,788 | |
Receivables: | | | | | | | | |
Investment securities sold | | | 4,522,500 | | | | 1,335,029 | |
Fund shares sold | | | 3,188,056 | | | | 127,915 | |
Dividends and interest | | | 138,687 | | | | 378,133 | |
Other assets | | | 106,188 | | | | 65,373 | |
| | | | | | | | |
Total assets | | | 1,024,476,730 | | | | 319,470,580 | |
| | | | | | | | |
Liabilities: | | | | | | | | |
Unrealized depreciation on foreign currency contracts | | | — | | | | 712,723 | |
Payables: | | | | | | | | |
Investment securities purchased | | | 9,000,529 | | | | 105,754 | |
Fund shares redeemed | | | 749,822 | | | | 511,728 | |
Investment management fees | | | 614,578 | | | | 182,570 | |
Distribution fees | | | 127,365 | | | | 78,543 | |
Accrued expenses | | | 95,604 | | | | 70,424 | |
| | | | | | | | |
Total liabilities | | | 10,587,898 | | | | 1,661,742 | |
| | | | | | | | |
Net assets | | $ | 1,013,888,832 | | | $ | 317,808,838 | |
| | | | | | | | |
Summary of Net Assets: | | | | | | | | |
Capital stock and paid-in-capital | | $ | 845,710,632 | | | $ | 291,876,823 | |
Undistributed (distributions in excess of) net investment income | | | 176,849 | | | | 1,694,939 | |
Accumulated net realized gain (loss) | | | 41,244,945 | | | | 7,215,830 | |
Unrealized appreciation (depreciation) of investments and the translation of assets and liabilities denominated in foreign currency | | | 126,756,406 | | | | 17,021,246 | |
| | | | | | | | |
Net assets | | $ | 1,013,888,832 | | | $ | 317,808,838 | |
| | | | | | | | |
Shares authorized | | | 27,000,000,000 | | | | 27,000,000,000 | |
| | | | | | | | |
Par value | | $ | 0.001 | | | $ | 0.001 | |
| | | | | | | | |
Class A: Net asset value per share | | $ | 50.37 | | | $ | 19.87 | |
| | | | | | | | |
Maximum offering price per share | | $ | 53.30 | | | $ | 21.03 | |
| | | | | | | | |
Shares outstanding | | | 5,244,491 | | | | 11,525,302 | |
| | | | | | | | |
Net Assets | | $ | 264,166,023 | | | $ | 229,000,133 | |
| | | | | | | | |
Class B: Net asset value per share | | $ | 40.97 | | | $ | 17.59 | |
| | | | | | | | |
Shares outstanding | | | 52,715 | | | | 162,998 | |
| | | | | | | | |
Net Assets | | $ | 2,159,969 | | | $ | 2,867,006 | |
| | | | | | | | |
Class C: Net asset value per share | | $ | 40.63 | | | $ | 17.47 | |
| | | | | | | | |
Shares outstanding | | | 1,294,035 | | | | 1,710,991 | |
| | | | | | | | |
Net Assets | | $ | 52,577,087 | | | $ | 29,890,424 | |
| | | | | | | | |
Class I: Net asset value per share | | $ | 51.45 | | | $ | 19.63 | |
| | | | | | | | |
Shares outstanding | | | 3,765,105 | | | | 1,736,023 | |
| | | | | | | | |
Net Assets | | $ | 193,715,940 | | | $ | 34,075,634 | |
| | | | | | | | |
Class R3: Net asset value per share | | $ | 50.42 | | | $ | 20.08 | |
| | | | | | | | |
Shares outstanding | | | 312,603 | | | | 199,942 | |
| | | | | | | | |
Net Assets | | $ | 15,761,105 | | | $ | 4,014,951 | |
| | | | | | | | |
Class R4: Net asset value per share | | $ | 51.72 | | | $ | 20.27 | |
| | | | | | | | |
Shares outstanding | | | 1,394,292 | | | | 659,429 | |
| | | | | | | | |
Net Assets | | $ | 72,109,788 | | | $ | 13,366,149 | |
| | | | | | | | |
The accompanying notes are an integral part of these financial statements.
|
| Hartford Funds – Domestic Equity Funds |
Statements of Assets and Liabilities – (continued)
April 30, 2015 (Unaudited)
| | | | | | | | |
| | | The Hartford
SmallCap
Growth Fund | | | The Hartford
Value
Opportunities
Fund | |
Class R5: Net asset value per share | | $ | 53.17 | | | $ | 20.40 | |
| | | | | | | | |
Shares outstanding | | | 1,938,195 | | | | 133,317 | |
| | | | | | | | |
Net Assets | | $ | 103,045,694 | | | $ | 2,719,659 | |
| | | | | | | | |
Class R6: Net asset value per share | | $ | 53.59 | | | $ | — | |
| | | | | | | | |
Shares outstanding | | | 201 | | | | — | |
| | | | | | | | |
Net Assets | | $ | 10,786 | | | $ | — | |
| | | | | | | | |
Class Y: Net asset value per share | | $ | 53.59 | | | $ | 20.45 | |
| | | | | | | | |
Shares outstanding | | | 5,791,455 | | | | 91,689 | |
| | | | | | | | |
Net Assets | | $ | 310,342,440 | | | $ | 1,874,882 | |
| | | | | | | | |
Cost of investments | | $ | 889,746,350 | | | $ | 299,790,689 | |
The accompanying notes are an integral part of these financial statements.
|
| Hartford Funds – Domestic Equity Funds |
Statements of Operations
For the Six-Month Period Ended April 30, 2015 (Unaudited)
| | | | | | | | | | | | |
| | | The Hartford
Capital
Appreciation
Fund | | | Hartford
Core Equity
Fund | | | The Hartford
Dividend and
Growth Fund | |
Investment Income: | | | | | | | | | | | | |
Dividends | | $ | 87,691,049 | | | $ | 1,448,451 | | | $ | 98,444,868 | |
Interest | | | 65,886 | | | | 1,893 | | | | 94,885 | |
Less: Foreign tax withheld | | | (1,896,786 | ) | | | (1,922 | ) | | | (763,107 | ) |
| | | | | | | | | | | | |
Total investment income, net | | | 85,860,149 | | | | 1,448,422 | | | | 97,776,646 | |
| | | | | | | | | | | | |
Expenses: | | | | | | | | | | | | |
Investment management fees | | | 37,492,519 | | | | 578,328 | | | | 24,355,146 | |
Administrative services fees | | | | | | | | | | | | |
Class R3 | | | 132,858 | | | | 598 | | | | 91,480 | |
Class R4 | | | 138,320 | | | | 1,343 | | | | 116,351 | |
Class R5 | | | 27,871 | | | | 1,094 | | | | 116,289 | |
Transfer agent fees | | | | | | | | | | | | |
Class A | | | 3,715,071 | | | | 117,195 | | | | 2,249,160 | |
Class B | | | 313,930 | | | | 4,864 | | | | 106,266 | |
Class C | | | 1,070,453 | | | | 13,635 | | | | 251,905 | |
Class I | | | 1,057,318 | | | | 2 | | | | 1,543,191 | |
Class R3 | | | 5,906 | | | | 156 | | | | 3,111 | |
Class R4 | | | 1,695 | | | | 72 | | | | 1,071 | |
Class R5 | | | 390 | | | | 64 | | | | 543 | |
Class R6 | | | — | | | | — | | | | — | |
Class Y | | | 9,951 | | | | 21 | | | | 10,625 | |
Distribution fees | | | | | | | | | | | | |
Class A | | | 7,095,462 | | | | 182,313 | | | | 4,742,385 | |
Class B | | | 1,182,184 | | | | 9,044 | | | | 335,168 | |
Class C | | | 9,641,013 | | | | 130,524 | | | | 2,367,507 | |
Class R3 | | | 332,142 | | | | 1,494 | | | | 228,699 | |
Class R4 | | | 230,533 | | | | 2,239 | | | | 193,917 | |
Custodian fees | | | 79,541 | | | | 1,586 | | | | 10,414 | |
Registration and filing fees | | | 175,865 | | | | 60,117 | | | | 173,332 | |
Accounting services fees | | | 867,828 | | | | 14,661 | | | | 531,114 | |
Board of Directors’ fees | | | 153,474 | | | | 2,132 | | | | 102,650 | |
Audit fees | | | 48,264 | | | | 5,950 | | | | 33,374 | |
Other expenses | | | 844,027 | | | | 19,302 | | | | 536,735 | |
| | | | | | | | | | | | |
Total expenses (before waivers and fees paid indirectly) | | | 64,616,615 | | | | 1,146,734 | | | | 38,100,433 | |
Expense waivers | | | — | | | | (13,750 | ) | | | — | |
Management fee waivers | | | (205 | ) | | | (50,364 | ) | | | — | |
Transfer agent fee waivers | | | — | | | | (2,149 | ) | | | (5,578 | ) |
Commission recapture | | | (121,838 | ) | | | (1,188 | ) | | | (25,937 | ) |
Custodian fee offset | | | (163 | ) | | | — | | | | — | |
| | | | | | | | | | | | |
Total waivers and fees paid indirectly | | | (122,206 | ) | | | (67,451 | ) | | | (31,515 | ) |
| | | | | | | | | | | | |
Total expenses, net | | | 64,494,409 | | | | 1,079,283 | | | | 38,068,918 | |
| | | | | | | | | | | | |
Net Investment Income (Loss) | | | 21,365,740 | | | | 369,139 | | | | 59,707,728 | |
| | | | | | | | | | | | |
Net Realized Gain (Loss) on Investments, Other Financial Instruments and Foreign Currency Transactions: | | | | | | | | | | | | |
Net realized gain (loss) on investments | | | 446,247,698 | | | | 4,157,694 | | | | 389,740,467 | |
Net realized gain (loss) on futures contracts | | | — | | | | 42,716 | | | | — | |
Net realized gain (loss) on foreign currency contracts | | | 73,701,092 | | | | — | | | | (989 | ) |
Net realized gain (loss) on other foreign currency transactions | | | (1,704,367 | ) | | | — | | | | (16,159 | ) |
| | | | | | | | | | | | |
Net Realized Gain (Loss) on Investments, Other Financial Instruments and Foreign Currency Transactions | | | 518,244,423 | | | | 4,200,410 | | | | 389,723,319 | |
| | | | | | | | | | | | |
Net Changes in Unrealized Appreciation (Depreciation) of Investments, Other Financial Instruments and Foreign Currency Transactions: | | | | | | | | | | | | |
Net unrealized appreciation (depreciation) of investments | | | 123,670,056 | | | | 7,206,298 | | | | (137,207,423 | ) |
Net unrealized appreciation (depreciation) of future contracts | | | — | | | | (239,681 | ) | | | — | |
Net unrealized appreciation (depreciation) of foreign currency contracts | | | (38,069,909 | ) | | | — | | | | — | |
Net unrealized appreciation (depreciation) of translation of other assets and liabilities in foreign currencies | | | (236,181 | ) | | | — | | | | — | |
| | | | | | | | | | | | |
Net Changes in Unrealized Appreciation (Depreciation) of Investments, Other Financial Instruments and Foreign Currency Transactions | | | 85,363,966 | | | | 6,966,617 | | | | (137,207,423 | ) |
| | | | | | | | | | | | |
Net Gain (Loss) on Investments, Other Financial Instruments and Foreign Currency Transactions | | | 603,608,389 | | | | 11,167,027 | | | | 252,515,896 | |
| | | | | | | | | | | | |
Net Increase (Decrease) in Net Assets Resulting from Operations | | $ | 624,974,129 | | | $ | 11,536,166 | | | $ | 312,223,624 | |
| | | | | | | | | | | | |
The accompanying notes are an integral part of these financial statements.
|
| Hartford Funds – Domestic Equity Funds |
Statements of Operations – (continued)
For the Six-Month Period Ended April 30, 2015 (Unaudited)
| | | | | | | | | | | | | | | | | | | | | | | | | | |
The Hartford
Equity Income
Fund | | | The Hartford
Growth
Opportunities
Fund | | | The Hartford
Healthcare Fund | | | The Hartford
MidCap Fund | | | The Hartford
MidCap Value
Fund | | | The Hartford
Small Company
Fund | | | The Hartford
Small/Mid Cap
Equity Fund | |
| | | | | | | | | | | | | | | | | | | | | | | | | | |
| $ | 56,303,403 | | | $ | 15,311,152 | | | $ | 4,570,165 | | | $ | 20,185,630 | | | $ | 3,209,925 | | | $ | 2,795,322 | | | $ | 864,157 | |
| | 6,028 | | | | 15,998 | | | | 16,430 | | | | 6,926 | | | | 1,560 | | | | 4,869 | | | | 315 | |
| | (1,075,192 | ) | | | (401,530 | ) | | | (35,954 | ) | | | (143,722 | ) | | | (47,833 | ) | | | (4,632 | ) | | | (640 | ) |
| | | | | | | | | | | | | | | | | | | | | | | | | | |
| | 55,234,239 | | | | 14,925,620 | | | | 4,550,641 | | | | 20,048,834 | | | | 3,163,652 | | | | 2,795,559 | | | | 863,832 | |
| | | | | | | | | | | | | | | | | | | | | | | | | | |
| | | | | | | | | | | | | | | | | | | | | | | | | | |
| | 11,784,991 | | | | 13,847,407 | | | | 5,072,082 | | | | 16,412,822 | | | | 1,859,867 | | | | 3,689,148 | | | | 275,665 | |
| | | | | | | | | | | | | | | | | | | | | | | | | | |
| | 60,046 | | | | 32,294 | | | | 48,074 | | | | 62,747 | | | | 9,626 | | | | 46,632 | | | | 681 | |
| | 57,716 | | | | 41,474 | | | | 27,195 | | | | 86,736 | | | | 7,765 | | | | 50,764 | | | | 398 | |
| | 46,925 | | | | 54,003 | | | | 1,714 | | | | 64,231 | | | | 2,914 | | | | 4,684 | | | | 106 | |
| | | | | | | | | | | | | | | | | | | | | | | | | | |
| | 1,109,095 | | | | 963,681 | | | | 392,550 | | | | 1,267,285 | | | | 208,790 | | | | 459,736 | | | | 50,756 | |
| | 24,527 | | | | 31,480 | | | | 13,131 | | | | 39,435 | | | | 4,676 | | | | 9,497 | | | | 4,860 | |
| | 204,265 | | | | 144,072 | | | | 104,189 | | | | 301,388 | | | | 32,862 | | | | 35,439 | | | | 12,741 | |
| | 525,778 | | | | 1,430,248 | | | | 85,897 | | | | 454,718 | | | | 23,758 | | | | 89,439 | | | | 2 | |
| | 1,568 | | | | 1,541 | | | | 879 | | | | 2,607 | | | | 624 | | | | 1,303 | | | | 140 | |
| | 912 | | | | 497 | | | | 307 | | | | 1,653 | | | | 216 | | | | 567 | | | | 40 | |
| | 771 | | | | 403 | | | | 174 | | | | 739 | | | | 177 | | | | 891 | | | | 7 | |
| | 1 | | | | — | | | | — | | | | 1 | | | | — | | | | — | | | | — | |
| | 1,858 | | | | 543 | | | | 49 | | | | 8,455 | | | | 1,277 | | | | 2,615 | | | | 5 | |
| | | | | | | | | | | | | | | | | | | | | | | | | | |
| | 2,396,821 | | | | 1,949,306 | | | | 864,896 | | | | 2,428,340 | | | | 284,656 | | | | 452,175 | | | | 68,510 | |
| | 24,501 | | | | 106,919 | | | | 52,967 | | | | 142,864 | | | | 10,083 | | | | 21,886 | | | | 14,177 | |
| | 2,362,885 | | | | 1,326,855 | | | | 1,048,966 | | | | 2,815,758 | | | | 209,464 | | | | 193,789 | | | | 68,604 | |
| | 150,113 | | | | 80,734 | | | | 120,185 | | | | 156,867 | | | | 24,066 | | | | 116,580 | | | | 1,702 | |
| | 96,193 | | | | 69,123 | | | | 45,325 | | | | 144,560 | | | | 12,942 | | | | 84,607 | | | | 664 | |
| | 11,951 | | | | 12,059 | | | | 4,810 | | | | 10,116 | | | | 3,422 | | | | 2,381 | | | | 446 | |
| | 145,722 | | | | 94,189 | | | | 77,914 | | | | 120,423 | | | | 54,120 | | | | 66,154 | | | | 40,216 | |
| | 228,363 | | | | 235,274 | | | | 82,258 | | | | 272,879 | | | | 34,771 | | | | 65,398 | | | | 5,146 | |
| | 44,630 | | | | 38,680 | | | | 11,175 | | | | 51,573 | | | | 6,446 | | | | 12,398 | | | | 1,488 | |
| | 21,088 | | | | 19,194 | | | | 9,249 | | | | 22,092 | | | | 10,910 | | | | 8,448 | | | | 5,702 | |
| | 256,243 | | | | 332,838 | | | | 66,090 | | | | 286,761 | | | | 36,494 | | | | 90,161 | | | | 10,633 | |
| | | | | | | | | | | | | | | | | | | | | | | | | | |
| | 19,556,963 | | | | 20,812,814 | | | | 8,130,076 | | | | 25,155,050 | | | | 2,839,926 | | | | 5,504,692 | | | | 562,689 | |
| | — | | | | — | | | | — | | | | — | | | | — | | | | — | | | | — | |
| | — | | | | (435 | ) | | | — | | | | — | | | | (42 | ) | | | (529 | ) | | | (23,213 | ) |
| | (1 | ) | | | — | | | | — | | | | (1 | ) | | | (1,646 | ) | | | (2,915 | ) | | | (600 | ) |
| | (7,380 | ) | | | (39,185 | ) | | | (2,939 | ) | | | (64,833 | ) | | | (1,834 | ) | | | (15,287 | ) | | | — | |
| | — | | | | (46 | ) | | | — | | | | (1 | ) | | | — | | | | — | | | | — | |
| | | | | | | | | | | | | | | | | | | | | | | | | | |
| | (7,381 | ) | | | (39,666 | ) | | | (2,939 | ) | | | (64,835 | ) | | | (3,522 | ) | | | (18,731 | ) | | | (23,813 | ) |
| | | | | | | | | | | | | | | | | | | | | | | | | | |
| | 19,549,582 | | | | 20,773,148 | | | | 8,127,137 | | | | 25,090,215 | | | | 2,836,404 | | | | 5,485,961 | | | | 538,876 | |
| | | | | | | | | | | | | | | | | | | | | | | | | | |
| | 35,684,657 | | | | (5,847,528 | ) | | | (3,576,496 | ) | | | (5,041,381 | ) | | | 327,248 | | | | (2,690,402 | ) | | | 324,956 | |
| | | | | | | | | | | | | | | | | | | | | | | | | | |
| | | | | | | | | | | | | | | | | | | | | | | | | | |
| | 142,757,161 | | | | 253,710,222 | | | | 76,217,756 | | | | 214,554,611 | | | | 20,122,627 | | | | 72,515,233 | | | | 1,315,456 | |
| | — | | | | — | | | | — | | | | — | | | | — | | | | — | | | | — | |
| | 56,581 | | | | 191,933 | | | | 1,318,903 | | | | 25,998 | | | | 28,617 | | | | (2,312 | ) | | | (8 | ) |
| | (122,644 | ) | | | (286,827 | ) | | | 70,878 | | | | (25,359 | ) | | | (42,444 | ) | | | 3,021 | | | | (57 | ) |
| | | | | | | | | | | | | | | | | | | | | | | | | | |
| | 142,691,098 | | | | 253,615,328 | | | | 77,607,537 | | | | 214,555,250 | | | | 20,108,800 | | | | 72,515,942 | | | | 1,315,391 | |
| | | | | | | | | | | | | | | | | | | | | | | | | | |
| | | | | | | | | | | | | | | | | | | | | | | | | | |
| | (45,356,461 | ) | | | 153,626,835 | | | | 47,633,591 | | | | 72,919,498 | | | | 9,851,033 | | | | (37,591,241 | ) | | | 1,405,388 | |
| | — | | | | — | | | | — | | | | — | | | | — | | | | — | | | | — | |
| | — | | | | 6,099 | | | | (698,754 | ) | | | — | | | | (3,142 | ) | | | — | | | | — | |
| | 47,411 | | | | 12,146 | | | | 38,208 | | | | — | | | | 3,254 | | | | 3 | | | | — | |
| | | | | | | | | | | | | | | | | | | | | | | | | | |
| (45,309,050 | ) | | | 153,645,080 | | | | 46,973,045 | | | | 72,919,498 | | | | 9,851,145 | | | | (37,591,238 | ) | | | 1,405,388 | |
| | | | | | | | | | | | | | | | | | | | | | | | | | |
| | 97,382,048 | | | | 407,260,408 | | | | 124,580,582 | | | | 287,474,748 | | | | 29,959,945 | | | | 34,924,704 | | | | 2,720,779 | |
| | | | | | | | | | | | | | | | | | | | | | | | | | |
| $ | 133,066,705 | | | $ | 401,412,880 | | | $ | 121,004,086 | | | $ | 282,433,367 | | | $ | 30,287,193 | | | $ | 32,234,302 | | | $ | 3,045,735 | |
| | | | | | | | | | | | | | | | | | | | | | | | | | |
The accompanying notes are an integral part of these financial statements.
|
| Hartford Funds – Domestic Equity Funds |
Statements of Operations – (continued)
For the Six-Month Period Ended April 30, 2015 (Unaudited)
| | | | | | | | |
| | | The Hartford
SmallCap
Growth Fund | | | The Hartford
Value
Opportunities
Fund | |
Investment Income: | | | | | | | | |
Dividends | | $ | 4,864,667 | | | $ | 3,766,842 | |
Interest | | | 4,992 | | | | 280 | |
Less: Foreign tax withheld | | | (12,057 | ) | | | (74,842 | ) |
| | | | | | | | |
Total investment income, net | | | 4,857,602 | | | | 3,692,280 | |
| | | | | | | | |
Expenses: | | | | | | | | |
Investment management fees | | | 3,263,132 | | | | 1,122,693 | |
Administrative services fees | | | | | | | | |
Class R3 | | | 12,834 | | | | 4,160 | |
Class R4 | | | 45,735 | | | | 9,791 | |
Class R5 | | | 39,250 | | | | 1,338 | |
Transfer agent fees | | | | | | | | |
Class A | | | 259,177 | | | | 190,294 | |
Class B | | | 5,548 | | | | 8,077 | |
Class C | | | 34,609 | | | | 21,045 | |
Class I | | | 122,008 | | | | 24,303 | |
Class R3 | | | 1,321 | | | | 628 | |
Class R4 | | | 1,019 | | | | 314 | |
Class R5 | | | 639 | | | | 115 | |
Class R6 | | | — | | | | — | |
Class Y | | | 1,875 | | | | 14 | |
Distribution fees | | | | | | | | |
Class A | | | 331,193 | | | | 284,508 | |
Class B | | | 12,655 | | | | 16,767 | |
Class C | | | 246,837 | | | | 151,316 | |
Class R3 | | | 32,085 | | | | 10,400 | |
Class R4 | | | 76,225 | | | | 16,318 | |
Custodian fees | | | 1,473 | | | | 2,132 | |
Registration and filing fees | | | 64,197 | | | | 83,729 | |
Accounting services fees | | | 73,004 | | | | 22,455 | |
Board of Directors’ fees | | | 8,211 | | | | 3,447 | |
Audit fees | | | 8,305 | | | | 6,291 | |
Other expenses | | | 46,013 | | | | 28,658 | |
| | | | | | | | |
Total expenses (before waivers and fees paid indirectly) | | | 4,687,345 | | | | 2,008,793 | |
Management fee waivers | | | — | | | | (6,198 | ) |
Transfer agent fee waivers | | | (1,747 | ) | | | (3,040 | ) |
Commission Recapture | | | (4,845 | ) | | | (2,163 | ) |
| | | | | | | | |
Total waivers and fees paid indirectly | | | (6,592 | ) | | | (11,401 | ) |
| | | | | | | | |
Total expenses, net | | | 4,680,753 | | | | 1,997,392 | |
| | | | | | | | |
Net Investment Income (Loss) | | | 176,849 | | | | 1,694,888 | |
| | | | | | | | |
Net Realized Gain (Loss) on Investments and Foreign Currency Transactions: | | | | | | | | |
Net realized gain (loss) on investments | | | 43,891,846 | | | | 11,803,577 | |
Net realized gain (loss) on foreign currency contracts | | | — | | | | 2,749,860 | |
Net realized gain (loss) on other foreign currency transactions | | | — | | | | 9,743 | |
| | | | | | | | |
Net Realized Gain (Loss) on Investments and Foreign Currency Transactions | | | 43,891,846 | | | | 14,563,180 | |
| | | | | | | | |
Net Changes in Unrealized Appreciation (Depreciation) of Investments and Foreign Currency Transactions: | | | | | | | | |
Net unrealized appreciation (depreciation) of investments | | | 26,064,502 | | | | 676,417 | |
Net unrealized appreciation (depreciation) of foreign currency contracts | | | — | | | | (804,586 | ) |
Net unrealized appreciation (depreciation) of translation of other assets and liabilities in foreign currencies | | | 1,000 | | | | 6,292 | |
| | | | | | | | |
Net Changes in Unrealized Appreciation (Depreciation) of Investments and Foreign Currency Transactions | | | 26,065,502 | | | | (121,877 | ) |
| | | | | | | | |
Net Gain (Loss) on Investments, Other Financial Instruments and Foreign Currency Transactions | | | 69,957,348 | | | | 14,441,303 | |
| | | | | | | | |
Net Increase (Decrease) in Net Assets Resulting from Operations | | $ | 70,134,197 | | | $ | 16,136,191 | |
| | | | | | | | |
The accompanying notes are an integral part of these financial statements.
[This page is intentionally left blank]
|
| Hartford Funds – Domestic Equity Funds |
Statements of Changes in Net Assets
| | | | | | | | |
| | | The Hartford Capital
Appreciation Fund | |
| | | For the
Six-Month Period
Ended
April 30, 2015
(Unaudited) | | | For the
Year Ended
October 31,
2014 | |
Operations: | | | | | | | | |
Net investment income (loss) | | $ | 21,365,740 | | | $ | 50,868,498 | |
Net realized gain (loss) on investments and foreign currency transactions | | | 518,244,423 | | | | 2,980,354,356 | |
Net changes in unrealized appreciation (depreciation) of investments, other financial instruments and foreign currency transactions | | | 85,363,966 | | | | (1,614,403,702 | ) |
| | | | | | | | |
Net Increase (Decrease) in Net Assets Resulting from Operations | | | 624,974,129 | | | | 1,416,819,152 | |
| | | | | | | | |
Distributions to Shareholders: | | | | | | | | |
From net investment income | | | | | | | | |
Class A | | | (19,537,281 | ) | | | (16,001,170 | ) |
Class B | | | — | | | | — | |
Class C | | | — | | | | — | |
Class I | | | (12,661,018 | ) | | | (10,300,170 | ) |
Class R3 | | | — | | | | — | |
Class R4 | | | (519,713 | ) | | | (464,998 | ) |
Class R5 | | | (315,576 | ) | | | (213,294 | ) |
Class R6 | | | (67 | ) | | | — | |
Class Y | | | (8,488,733 | ) | | | (8,225,936 | ) |
| | | | | | | | |
Total from net investment income | | | (41,522,388 | ) | | | (35,205,568 | ) |
| | | | | | | | |
From net realized gain on investments | | | | | | | | |
Class A | | | (1,455,382,995 | ) | | | (234,951,270 | ) |
Class B | | | (75,893,189 | ) | | | (17,286,916 | ) |
Class C | | | (574,029,617 | ) | | | (89,366,852 | ) |
Class I | | | (529,434,316 | ) | | | (80,991,091 | ) |
Class R3 | | | (32,300,323 | ) | | | (5,105,467 | ) |
Class R4 | | | (44,038,113 | ) | | | (6,898,026 | ) |
Class R5 | | | (12,968,848 | ) | | | (5,136,346 | ) |
Class R6 | | | (2,313 | ) | | | — | |
Class Y | | | (295,123,770 | ) | | | (49,495,789 | ) |
| | | | | | | | |
Total from net realized gain on investments | | | (3,019,173,484 | ) | | | (489,231,757 | ) |
| | | | | | | | |
Total distributions | | | (3,060,695,872 | ) | | | (524,437,325 | ) |
| | | | | | | | |
Capital Share Transactions: | | | | | | | | |
Sold | | | 559,981,656 | | | | 1,335,640,072 | |
Issued in merger | | | — | | | | — | |
Issued on reinvestment of distributions | | | 2,695,759,860 | | | | 455,606,808 | |
Redeemed | | | (1,311,997,243 | ) | | | (2,712,553,219 | ) |
| | | | | | | | |
Net increase (decrease) from capital share transactions | | | 1,943,744,273 | | | | (921,306,339 | ) |
| | | | | | | | |
Net Increase (Decrease) in Net Assets | | | (491,977,470 | ) | | | (28,924,512 | ) |
| | | | | | | | |
Net Assets: | | | | | | | | |
Beginning of period | | | 11,918,234,486 | | | | 11,947,158,998 | |
| | | | | | | | |
End of period | | $ | 11,426,257,016 | | | $ | 11,918,234,486 | |
| | | | | | | | |
Undistributed (distributions in excess of) net investment income | | $ | 12,540,315 | | | $ | 32,696,963 | |
| | | | | | | | |
The accompanying notes are an integral part of these financial statements.
|
| Hartford Funds – Domestic Equity Funds |
Statements of Changes in Net Assets – (continued)
| | | | | | | | | | | | | | | | | | | | | | | | | | | | | | |
Hartford Core
Equity Fund | | | The Hartford Dividend and
Growth Fund | | | The Hartford Equity
Income Fund | | | The Hartford Growth
Opportunities Fund | |
For the
Six-Month
Period
Ended
April 30,
2015
(Unaudited) | | | For the
Year Ended
October 31,
2014 | | | For the
Six-Month
Period
Ended
April 30,
2015
(Unaudited) | | | For the
Year Ended
October 31,
2014 | | | For the
Six-Month
Period
Ended
April 30,
2015
(Unaudited) | | | For the
Year Ended
October 31,
2014 | | | For the
Six-Month
Period
Ended
April 30,
2015
(Unaudited) | | | For the
Year Ended
October 31,
2014 | |
| | | | | | | | | | | | | | | | | | | | | | | | | | | | | | |
| $ | 369,139 | | | $ | 90,399 | | | $ | 59,707,728 | | | $ | 116,110,624 | | | $ | 35,684,657 | | | $ | 64,988,401 | | | $ | (5,847,528 | ) | | $ | (8,384,153 | ) |
| | 4,200,410 | | | | 25,809,219 | | | | 389,723,319 | | | | 694,232,925 | | | | 142,691,098 | | | | 104,327,898 | | | | 253,615,328 | | | | 672,216,540 | |
| | 6,966,617 | | | | (3,975,293 | ) | | | (137,207,423 | ) | | | 365,333,597 | | | | (45,309,050 | ) | | | 236,186,569 | | | | 153,645,080 | | | | (128,045,320 | ) |
| | | | | | | | | | | | | | | | | | | | | | | | | | | | | | |
| | 11,536,166 | | | | 21,924,325 | | | | 312,223,624 | | | | 1,175,677,146 | | | | 133,066,705 | | | | 405,502,868 | | | | 401,412,880 | | | | 535,787,067 | |
| | | | | | | | | | | | | | | | | | | | | | | | | | | | | | |
| | | | | | | | | | | | | | | | | | | | | | | | | | | | | | |
| | | | | | | | | | | | | | | | | | | | | | | | | | | | | | |
| | — | | | | (322,556 | ) | | | (26,273,245 | ) | | | (51,845,040 | ) | | | (16,903,154 | ) | | | (34,679,873 | ) | | | — | | | | — | |
| | — | | | | — | | | | (134,973 | ) | | | (411,664 | ) | | | (154,981 | ) | | | (403,742 | ) | | | — | | | | — | |
| | — | | | | — | | | | (1,666,623 | ) | | | (3,223,682 | ) | | | (2,552,931 | ) | | | (4,614,778 | ) | | | — | | | | — | |
| | — | | | | — | | | | (14,980,354 | ) | | | (28,595,496 | ) | | | (9,371,478 | ) | | | (16,809,435 | ) | | | — | | | | — | |
| | — | | | | (653 | ) | | | (468,840 | ) | | | (961,226 | ) | | | (433,421 | ) | | | (800,283 | ) | | | — | | | | — | |
| | — | | | | — | | | | (1,024,978 | ) | | | (2,078,620 | ) | | | (674,876 | ) | | | (1,339,427 | ) | | | — | | | | — | |
| | (10,900 | ) | | | (1,455 | ) | | | (1,886,914 | ) | | | (3,612,657 | ) | | | (946,044 | ) | | | (1,654,891 | ) | | | — | | | | — | |
| | — | | | | — | | | | (86 | ) | | | — | | | | (112 | ) | | | — | | | | — | | | | — | |
| | (79,362 | ) | | | (15,450 | ) | | | (11,403,306 | ) | | | (25,884,014 | ) | | | (2,565,305 | ) | | | (4,604,485 | ) | | | — | | | | — | |
| | | | | | | | | | | | | | | | | | | | | | | | | | | | | | |
| | (90,262 | ) | | | (340,114 | ) | | | (57,839,319 | ) | | | (116,612,399 | ) | | | (33,602,302 | ) | | | (64,906,914 | ) | | | — | | | | — | |
| | | | | | | | | | | | | | | | | | | | | | | | | | | | | | |
| | | | | | | | | | | | | | | | | | | | | | | | | | | | | | |
| | (1,708,044 | ) | | | — | | | | (319,566,759 | ) | | | (224,788,404 | ) | | | (52,367,058 | ) | | | (55,602,450 | ) | | | (263,434,988 | ) | | | (38,220,366 | ) |
| | (25,536 | ) | | | — | | | | (6,141,424 | ) | | | (6,351,007 | ) | | | (571,688 | ) | | | (824,023 | ) | | | (4,960,981 | ) | | | (1,169,528 | ) |
| | (305,170 | ) | | | — | | | | (40,699,299 | ) | | | (27,381,233 | ) | | | (12,820,307 | ) | | | (10,991,047 | ) | | | (57,331,100 | ) | | | (8,748,014 | ) |
| | — | | | | — | | | | (159,438,841 | ) | | | (103,448,364 | ) | | | (25,565,543 | ) | | | (20,986,994 | ) | | | (295,776,038 | ) | | | (49,465,635 | ) |
| | (6,893 | ) | | | — | | | | (7,630,510 | ) | | | (5,497,739 | ) | | | (1,610,943 | ) | | | (1,526,759 | ) | | | (5,335,475 | ) | | | (960,410 | ) |
| | (20,981 | ) | | | — | | | | (12,877,938 | ) | | | (9,020,385 | ) | | | (2,086,941 | ) | | | (2,091,645 | ) | | | (9,014,113 | ) | | | (1,636,154 | ) |
| | (4,732 | ) | | | — | | | | (18,791,192 | ) | | | (12,871,286 | ) | | | (2,537,076 | ) | | | (2,344,450 | ) | | | (17,052,786 | ) | | | (761,916 | ) |
| | — | | | | — | | | | (825 | ) | | | — | | | | (270 | ) | | | — | | | | (1,642 | ) | | | — | |
| | (33,979 | ) | | | — | | | | (110,478,069 | ) | | | (101,247,140 | ) | | | (6,421,509 | ) | | | (5,213,540 | ) | | | (11,356,544 | ) | | | (2,123,074 | ) |
| | | | | | | | | | | | | | | | | | | | | | | | | | | | | | |
| | (2,105,335 | ) | | | — | | | | (675,624,857 | ) | | | (490,605,558 | ) | | | (103,981,335 | ) | | | (99,580,908 | ) | | | (664,263,667 | ) | | | (103,085,097 | ) |
| | | | | | | | | | | | | | | | | | | | | | | | | | | | | | |
| | (2,195,597 | ) | | | (340,114 | ) | | | (733,464,176 | ) | | | (607,217,957 | ) | | | (137,583,637 | ) | | | (164,487,822 | ) | | | (664,263,667 | ) | | | (103,085,097 | ) |
| | | | | | | | | | | | | | | | | | | | | | | | | | | | | | |
| | | | | | | | | | | | | | | | | | | | | | | | | | | | | | |
| | 98,477,908 | | | | 25,912,117 | | | | 487,373,162 | | | | 964,760,686 | | | | 403,865,370 | | | | 1,156,827,678 | | | | 642,234,483 | | | | 668,932,406 | |
| | — | | | | — | | | | — | | | | — | | | | — | | | | — | | | | — | | | | 673,257,083 | |
| | 2,146,390 | | | | 336,012 | | | | 711,298,962 | | | | 587,189,060 | | | | 130,636,856 | | | | 155,386,346 | | | | 586,610,242 | | | | 86,376,670 | |
| | (19,891,012 | ) | | | (20,231,264 | ) | | | (643,942,718 | ) | | | (1,664,066,120 | ) | | | (493,882,189 | ) | | | (866,664,228 | ) | | | (472,747,335 | ) | | | (722,897,879 | ) |
| | | | | | | | | | | | | | | | | | | | | | | | | | | | | | |
| | 80,733,286 | | | | 6,016,865 | | | | 554,729,406 | | | | (112,116,374 | ) | | | 40,620,037 | | | | 445,549,796 | | | | 756,097,390 | | | | 705,668,280 | |
| | | | | | | | | | | | | | | | | | | | | | | | | | | | | | |
| | 90,073,855 | | | | 27,601,076 | | | | 133,488,854 | | | | 456,342,815 | | | | 36,103,105 | | | | 686,564,842 | | | | 493,246,603 | | | | 1,138,370,250 | |
| | | | | | | | | | | | | | | | | | | | | | | | | | | | | | |
| | | | | | | | | | | | | | | | | | | | | | | | | | | | | | |
| | 152,233,835 | | | | 124,632,759 | | | | 8,024,312,181 | | | | 7,567,969,366 | | | | 3,798,545,716 | | | | 3,111,980,874 | | | | 3,757,768,683 | | | | 2,619,398,433 | |
| | | | | | | | | | | | | | | | | | | | | | | | | | | | | | |
| $ | 242,307,690 | | | $ | 152,233,835 | | | $ | 8,157,801,035 | | | $ | 8,024,312,181 | | | $ | 3,834,648,821 | | | $ | 3,798,545,716 | | | $ | 4,251,015,286 | | | $ | 3,757,768,683 | |
| | | | | | | | | | | | | | | | | | | | | | | | | | | | | | |
| $ | 369,139 | | | $ | 90,262 | | | $ | 12,468,525 | | | $ | 10,600,116 | | | $ | 5,772,225 | | | $ | 3,689,870 | | | $ | (5,847,528 | ) | | $ | — | |
| | | | | | | | | | | | | | | | | | | | | | | | | | | | | | |
The accompanying notes are an integral part of these financial statements.
|
| Hartford Funds – Domestic Equity Funds |
Statements of Changes in Net Assets – (continued)
| | | | | | | | |
| | | The Hartford Healthcare
Fund | |
| | | For the
Six-Month Period
Ended
April 30, 2015
(Unaudited) | | | For the
Year Ended
October 31,
2014 | |
Operations: | | | | | | | | |
Net investment income (loss) | | $ | (3,576,496 | ) | | $ | (4,292,877 | ) |
Net realized gain (loss) on investments and foreign currency transactions | | | 77,607,537 | | | | 84,118,699 | |
Net changes in unrealized appreciation (depreciation) of investments, other financial instruments and foreign currency transactions | | | 46,973,045 | | | | 136,776,461 | |
| | | | | | | | |
Net Increase (Decrease) in Net Assets Resulting from Operations | | | 121,004,086 | | | | 216,602,283 | |
| | | | | | | | |
Distributions to Shareholders: | | | | | | | | |
From net investment income | | | | | | | | |
Class A | | | — | | | | — | |
Class B | | | — | | | | — | |
Class C | | | — | | | | — | |
Class I | | | — | | | | — | |
Class R3 | | | — | | | | — | |
Class R4 | | | — | | | | — | |
Class R5 | | | — | | | | — | |
Class Y | | | — | | | | — | |
| | | | | | | | |
Total from net investment income | | | — | | | | — | |
| | | | | | | | |
From net realized gain on investments | | | | | | | | |
Class A | | | (41,859,286 | ) | | | — | |
Class B | | | (851,671 | ) | | | — | |
Class C | | | (14,037,691 | ) | | | — | |
Class I | | | (9,319,309 | ) | | | — | |
Class R3 | | | (2,814,540 | ) | | | — | |
Class R4 | | | (2,016,864 | ) | | | — | |
Class R5 | | | (166,891 | ) | | | — | |
Class R6 | | | — | | | | — | |
Class Y | | | (387,225 | ) | | | — | |
| | | | | | | | |
Total from net realized gain on investments | | | (71,453,477 | ) | | | — | |
| | | | | | | | |
Total distributions | | | (71,453,477 | ) | | | — | |
| | | | | | | | |
Capital Share Transactions: | | | | | | | | |
Sold | | | 330,518,084 | | | | 274,644,488 | |
Issued on reinvestment of distributions | | | 67,149,489 | | | | — | |
Redeemed | | | (99,320,481 | ) | | | (162,205,793 | ) |
| | | | | | | | |
Net increase from capital share transactions | | | 298,347,092 | | | | 112,438,695 | |
| | | | | | | | |
Net Increase (Decrease) in Net Assets | | | 347,897,701 | | | | 329,040,978 | |
| | | | | | | | |
Net Assets: | | | | | | | | |
Beginning of period | | | 1,002,760,192 | | | | 673,719,214 | |
| | | | | | | | |
End of period | | $ | 1,350,657,893 | | | $ | 1,002,760,192 | |
| | | | | | | | |
Undistributed (distributions in excess of) net investment income | | $ | (8,152,403 | ) | | $ | (4,575,907 | ) |
| | | | | | | | |
The accompanying notes are an integral part of these financial statements.
|
| Hartford Funds – Domestic Equity Funds |
Statements of Changes in Net Assets – (continued)
| | | | | | | | | | | | | | | | | | | | | | | | | | | | | | |
The Hartford MidCap
Fund | | | The Hartford MidCap
Value Fund | | | The Hartford Small
Company Fund | | | The Hartford Small/Mid Cap
Equity Fund | |
For the
Six-Month
Period
Ended
April 30, 2015
(Unaudited) | | | For the
Year Ended
October 31,
2014 | | | For the
Six-Month
Period
Ended
April 30, 2015
(Unaudited) | | | For the
Year Ended
October 31,
2014 | | | For the
Six-Month
Period
Ended
April 30, 2015
(Unaudited) | | | For the
Year Ended
October 31,
2014 | | | For the
Six-Month
Period
Ended
April 30, 2015
(Unaudited) | | | For the
Year Ended
October 31,
2014 | |
| | | | | | | | | | | | | | | | | | | | | | | | | | | | | | |
| $ | (5,041,381 | ) | | $ | (15,529,400 | ) | | $ | 327,248 | | | $ | 1,346,375 | | | $ | (2,690,402 | ) | | $ | (7,705,686 | ) | | $ | 324,956 | | | $ | 412,547 | |
| | 214,555,250 | | | | 446,237,024 | | | | 20,108,800 | | | | 52,760,953 | | | | 72,515,942 | | | | 152,516,529 | | | | 1,315,391 | | | | 8,712,224 | |
| | 72,919,498 | | | | 143,809,565 | | | | 9,851,145 | | | | (1,011,084 | ) | | | (37,591,238 | ) | | | (30,164,247 | ) | | | 1,405,388 | | | | (2,924,367 | ) |
| | | | | | | | | | | | | | | | | | | | | | | | | | | | | | |
| | 282,433,367 | | | | 574,517,189 | | | | 30,287,193 | | | | 53,096,244 | | | | 32,234,302 | | | | 114,646,596 | | | | 3,045,735 | | | | 6,200,404 | |
| | | | | | | | | | | | | | | | | | | | | | | | | | | | | | |
| | | | | | | | | | | | | | | | | | | | | | | | | | | | | | |
| | | | | | | | | | | | | | | | | | | | | | | | | | | | | | |
| | — | | | | — | | | | (341,861 | ) | | | — | | | | — | | | | — | | | | (357,551 | ) | | | (566,365 | ) |
| | — | | | | — | | | | — | | | | — | | | | — | | | | — | | | | — | | | | (12,196 | ) |
| | — | | | | — | | | | — | | | | — | | | | — | | | | — | | | | — | | | | (67,266 | ) |
| | — | | | | — | | | | (187,954 | ) | | | — | | | | — | | | | — | | | | — | | | | — | |
| | — | | | | — | | | | — | | | | — | | | | — | | | | — | | | | (3,127 | ) | | | (6,845 | ) |
| | — | | | | — | | | | (23,807 | ) | | | — | | | | — | | | | — | | | | (4,294 | ) | | | (1,878 | ) |
| | — | | | | — | | | | (27,078 | ) | | | — | | | | — | | | | — | | | | (2,126 | ) | | | (2,398 | ) |
| | — | | | | — | | | | (899,001 | ) | | | — | | | | — | | | | — | | | | (8,040 | ) | | | (3,280 | ) |
| | | | | | | | | | | | | | | | | | | | | | | | | | | | | | |
| | — | | | | — | | | | (1,479,701 | ) | | | — | | | | — | | | | — | | | | (375,138 | ) | | | (660,228 | ) |
| | | | | | | | | | | | | | | | | | | | | | | | | | | | | | |
| | | | | | | | | | | | | | | | | | | | | | | | | | | | | | |
| | (184,194,904 | ) | | | (143,567,186 | ) | | | (25,023,718 | ) | | | (19,547,732 | ) | | | (58,246,001 | ) | | | (36,374,051 | ) | | | (4,979,568 | ) | | | (6,822,827 | ) |
| | (3,556,326 | ) | | | (3,118,365 | ) | | | (263,547 | ) | | | (286,591 | ) | | | (924,635 | ) | | | (767,167 | ) | | | (295,991 | ) | | | (585,834 | ) |
| | (65,661,987 | ) | | | (44,515,881 | ) | | | (5,248,502 | ) | | | (3,955,390 | ) | | | (7,686,853 | ) | | | (5,032,180 | ) | | | (1,353,083 | ) | | | (1,749,811 | ) |
| | (54,161,721 | ) | | | (21,758,465 | ) | | | (4,062,792 | ) | | | (1,835,803 | ) | | | (9,826,479 | ) | | | (4,446,788 | ) | | | — | | | | — | |
| | (5,156,865 | ) | | | (3,447,459 | ) | | | (1,112,176 | ) | | | (483,560 | ) | | | (9,236,016 | ) | | | (6,038,821 | ) | | | (57,213 | ) | | | (76,759 | ) |
| | (8,609,977 | ) | | | (5,329,645 | ) | | | (997,104 | ) | | | (470,894 | ) | | | (9,918,854 | ) | | | (6,816,923 | ) | | | (47,142 | ) | | | (22,229 | ) |
| | (9,910,109 | ) | | | (6,407,783 | ) | | | (545,519 | ) | | | (124,254 | ) | | | (1,227,471 | ) | | | (866,941 | ) | | | (18,490 | ) | | | (21,741 | ) |
| | (858 | ) | | | — | | | | — | | | | — | | | | (1,449 | ) | | | — | | | | — | | | | — | |
| | (93,055,770 | ) | | | (61,071,195 | ) | | | (17,186,601 | ) | | | (13,320,892 | ) | | | (48,355,024 | ) | | | (32,103,165 | ) | | | (66,839 | ) | | | (28,808 | ) |
| | | | | | | | | | | | | | | | | | | | | | | | | | | | | | |
| | (424,308,517 | ) | | | (289,215,979 | ) | | | (54,439,959 | ) | | | (40,025,116 | ) | | | (145,422,782 | ) | | | (92,446,036 | ) | | | (6,818,326 | ) | | | (9,308,009 | ) |
| | | | | | | | | | | | | | | | | | | | | | | | | | | | | | |
| | (424,308,517 | ) | | | (289,215,979 | ) | | | (55,919,660 | ) | | | (40,025,116 | ) | | | (145,422,782 | ) | | | (92,446,036 | ) | | | (7,193,464 | ) | | | (9,968,237 | ) |
| | | | | | | | | | | | | | | | | | | | | | | | | | | | | | |
| | | | | | | | | | | | | | | | | | | | | | | | | | | | | | |
| | 632,304,968 | | | | 895,531,427 | | | | 52,168,818 | | | | 134,173,170 | | | | 122,624,914 | | | | 211,673,572 | | | | 7,526,156 | | | | 11,133,101 | |
| | 408,459,675 | | | | 278,270,487 | | | | 53,690,386 | | | | 38,395,611 | | | | 144,047,378 | | | | 91,028,425 | | | | 6,960,461 | | | | 9,642,148 | |
| | (501,935,974 | ) | | | (825,802,905 | ) | | | (61,281,253 | ) | | | (121,433,682 | ) | | | (125,280,173 | ) | | | (251,657,714 | ) | | | (7,259,245 | ) | | | (13,217,198 | ) |
| | | | | | | | | | | | | | | | | | | | | | | | | | | | | | |
| | 538,828,669 | | | | 347,999,009 | | | | 44,577,951 | | | | 51,135,099 | | | | 141,392,119 | | | | 51,044,283 | | | | 7,227,372 | | | | 7,558,051 | |
| | | | | | | | | | | | | | | | | | | | | | | | | | | | | | |
| | 396,953,519 | | | | 633,300,219 | | | | 18,945,484 | | | | 64,206,227 | | | | 28,203,639 | | | | 73,244,843 | | | | 3,079,643 | | | | 3,790,218 | |
| | | | | | | | | | | | | | | | | | | | | | | | | | | | | | |
| | | | | | | | | | | | | | | | | | | | | | | | | | | | | | |
| | 4,355,089,005 | | | | 3,721,788,786 | | | | 493,070,629 | | | | 428,864,402 | | | | 930,556,943 | | | | 857,312,100 | | | | 72,998,148 | | | | 69,207,930 | |
| | | | | | | | | | | | | | | | | | | | | | | | | | | | | | |
| $ | 4,752,042,524 | | | $ | 4,355,089,005 | | | $ | 512,016,113 | | | $ | 493,070,629 | | | $ | 958,760,582 | | | $ | 930,556,943 | | | $ | 76,077,791 | | | $ | 72,998,148 | |
| | | | | | | | | | | | | | | | | | | | | | | | | | | | | | |
| $ | (5,041,381 | ) | | $ | — | | | $ | (706,364 | ) | | $ | 446,089 | | | $ | (2,696,391 | ) | | $ | (5,988 | ) | | $ | 298,912 | | | $ | 349,094 | |
| | | | | | | | | | | | | | | | | | | | | | | | | | | | | | |
The accompanying notes are an integral part of these financial statements.
|
| Hartford Funds – Domestic Equity Funds |
Statements of Changes in Net Assets – (continued)
| | | | | | | | | | | | | | | | |
| | | The Hartford SmallCap
Growth Fund | | | The Hartford Value
Opportunities Fund | |
| | | For the
Six-Month Period
Ended
April 30, 2015
(Unaudited) | | | For the
Year Ended
October 31,
2014 | | | For the
Six-Month Period
Ended
April 30, 2015
(Unaudited) | | | For the
Year Ended
October 31,
2014 | |
Operations: | | | | | | | | | | | | | | | | |
Net investment income (loss) | | $ | 176,849 | | | $ | (2,525,339 | ) | | $ | 1,694,888 | | | $ | 2,312,930 | |
Net realized gain (loss) on investments and foreign currency transactions | | | 43,891,846 | | | | 34,489,381 | | | | 14,563,180 | | | | 52,309,127 | |
Net changes in unrealized appreciation (depreciation) of investments, other financial instruments and foreign currency transactions | | | 26,065,502 | | | | 16,020,575 | | | | (121,877 | ) | | | (31,261,613 | ) |
| | | | | | | | | | | | | | | | |
Net Increase (Decrease) in Net Assets Resulting from Operations | | | 70,134,197 | | | | 47,984,617 | | | | 16,136,191 | | | | 23,360,444 | |
| | | | | | | | | | | | | | | | |
Distributions to Shareholders: | | | | | | | | | | | | | | | | |
From net investment income | | | | | | | | | | | | | | | | |
Class A | | | — | | | | — | | | | (1,586,036 | ) | | | (539,189 | ) |
Class C | | | — | | | | — | | | | (73,183 | ) | | | — | |
Class I | | | — | | | | — | | | | (411,176 | ) | | | (62,002 | ) |
Class R3 | | | — | | | | — | | | | (17,676 | ) | | | (5,573 | ) |
Class R4 | | | — | | | | — | | | | (93,078 | ) | | | (37,182 | ) |
Class R5 | | | — | | | | — | | | | (22,409 | ) | | | (12,015 | ) |
Class Y | | | — | | | | — | | | | (18,003 | ) | | | (9,555 | ) |
| | | | | | | | | | | | | | | | |
Total from net investment income | | | — | | | | — | | | | (2,221,561 | ) | | | (665,516 | ) |
| | | | | | | | | | | | | | | | |
From net realized gain on investments | | | | | | | | | | | | | | | | |
Class A | | | (10,378,573 | ) | | | (16,173,027 | ) | | | (16,110,192 | ) | | | — | |
Class B | | | (136,204 | ) | | | (370,441 | ) | | | (287,477 | ) | | | — | |
Class C | | | (2,398,611 | ) | | | (2,972,321 | ) | | | (2,411,601 | ) | | | — | |
Class I | | | (5,567,530 | ) | | | (5,150,957 | ) | | | (2,996,924 | ) | | | — | |
Class R3 | | | (438,934 | ) | | | (614,561 | ) | | | (296,248 | ) | | | — | |
Class R4 | | | (2,115,375 | ) | | | (1,380,290 | ) | | | (882,937 | ) | | | — | |
Class R5 | | | (2,053,035 | ) | | | (539,105 | ) | | | (178,838 | ) | | | — | |
Class R6 | | | (409 | ) | | | — | | | | — | | | | — | |
Class Y | | | (9,827,589 | ) | | | (8,596,000 | ) | | | (125,553 | ) | | | — | |
| | | | | | | | | | | | | | | | |
Total from net realized gain on investments | | | (32,916,260 | ) | | | (35,796,702 | ) | | | (23,289,770 | ) | | | — | |
| | | | | | | | | | | | | | | | |
Total distributions | | | (32,916,260 | ) | | | (35,796,702 | ) | | | (25,511,331 | ) | | | (665,516 | ) |
| | | | | | | | | | | | | | | | |
Capital Share Transactions: | | | | | | | | | | | | | | | | |
Sold | | | 387,650,602 | | | | 374,600,255 | | | | 16,524,328 | | | | 113,944,029 | |
Issued in merger | | | — | | | | — | | | | — | | | | 171,919,133 | |
Issued on reinvestment of distributions | | | 30,936,318 | | | | 34,386,103 | | | | 24,146,676 | | | | 654,118 | |
Redeemed | | | (151,953,598 | ) | | | (197,615,600 | ) | | | (53,719,506 | ) | | | (121,783,239 | ) |
| | | | | | | | | | | | | | | | |
Net increase (decrease) from capital share transactions | | | 266,633,322 | | | | 211,370,758 | | | | (13,048,502 | ) | | | 164,734,041 | |
| | | | | | | | | | | | | | | | |
Net Increase (Decrease) in Net Assets | | | 303,851,259 | | | | 223,558,673 | | | | (22,423,642 | ) | | | 187,428,969 | |
| | | | | | | | | | | | | | | | |
Net Assets: | | | | | | | | | | | | | | | | |
Beginning of period | | | 710,037,573 | | | | 486,478,900 | | | | 340,232,480 | | | | 152,803,511 | |
| | | | | | | | | | | | | | | | |
End of period | | $ | 1,013,888,832 | | | $ | 710,037,573 | | | $ | 317,808,838 | | | $ | 340,232,480 | |
| | | | | | | | | | | | | | | | |
Undistributed (distributions in excess of) net investment income | | $ | 176,849 | | | $ | — | | | $ | 1,694,939 | | | $ | 2,221,612 | |
| | | | | | | | | | | | | | | | |
The accompanying notes are an integral part of these financial statements.
|
| Hartford Funds – Domestic Equity Funds |
Notes to Financial Statements
April 30, 2015
The Hartford Mutual Funds, Inc. and The Hartford Mutual Funds II, Inc. (the “Companies” and each a “Company”) are each an open-end management investment company comprised of forty-two and four series, respectively, as of April 30, 2015. The financial statements for certain other series of the Companies are presented in separate reports. The following series (individually, a “Fund” and collectively, the “Funds”) are included in this report.
The Hartford Mutual Funds, Inc.:
The Hartford Capital Appreciation Fund (the “Capital Appreciation Fund”)
Hartford Core Equity Fund (formerly The Hartford Disciplined Equity Fund) (the “Core Equity Fund”)
The Hartford Dividend and Growth Fund (the “Dividend and Growth Fund”)
The Hartford Equity Income Fund (the “Equity Income Fund”)
The Hartford Healthcare Fund (the “Healthcare Fund”)
The Hartford MidCap Fund (the “MidCap Fund”)
The Hartford MidCap Value Fund (the “MidCap Value Fund”)
The Hartford Small Company Fund (the “Small Company Fund”)
The Hartford Small/Mid Cap Equity Fund (the “Small/Mid Cap Equity Fund”)
The Hartford Mutual Funds II, Inc.:
The Hartford Growth Opportunities Fund (the “Growth Opportunities Fund”)
The Hartford SmallCap Growth Fund (the “SmallCap Growth Fund”)
The Hartford Value Opportunities Fund (the “Value Opportunities Fund”)
Each Company is organized under the laws of the State of Maryland and is registered with the Securities and Exchange Commission (“SEC”) under the Investment Company Act of 1940, as amended (“1940 Act”). Each Fund is a diversified open-end management investment company. Each Fund applies specialized accounting and reporting under Accounting Standards and Codification Topic 946, Financial Services – Investment Companies.
Each Fund offers Class A, Class B, Class C, Class I, Class R3, Class R4, Class R5 and Class Y shares. Effective November 7, 2014, Capital Appreciation Fund, Dividend and Growth Fund, Equity Income Fund, Growth Opportunities Fund, MidCap Fund, Small Company Fund and SmallCap Growth Fund began offering Class R6 shares. Effective March 31, 2015, Core Equity Fund began offering Class I and Class R6 shares and Small/Mid Cap Equity Fund began offering Class I shares. Class A shares are sold with a front-end sales charge of up to 5.50%. Class B shares were sold with a contingent deferred sales charge which is assessed on the lesser of the per share net asset value (“NAV”) of the shares at the time of redemption or the original purchase price, and declines from up to 5.00% to zero depending on the period of time the shares are held (see note below regarding the closing of Class B shares). Class C shares are sold with a contingent deferred sales charge of up to 1.00% on shares redeemed within twelve months of purchase. Class I shares are sold without sales charges to certain eligible investors primarily through advisory fee-based wrap programs. Class R3, R4, R5 and R6 shares, which are offered to employer-sponsored retirement plans, and Class Y shares, which are sold to certain eligible institutional investors, are sold without a sales charge. All classes of shares have identical voting, redemption, dividend, liquidation and other rights and the same terms and conditions, with the exceptions that each class may have different expenses, which may affect performance, and that Class B shares automatically convert to Class A shares after 8 years.
No new or additional investments are allowed in Class B shares of each Fund (including investments through any systematic investment plan). Existing shareholders of Class B shares may continue to hold their Class B shares, exchange their Class B shares for Class B shares of another Hartford Fund (as permitted by existing exchange privileges), or redeem their Class B shares as described in each Fund’s prospectus. Reinstatement privileges with respect to Class B shares are set forth in each Fund’s prospectus. For investors electing to reinvest capital gains and dividends, any such capital gains or dividends on Class B shares will continue to be reinvested in Class B shares of each Fund. All Class B share attributes, including the 12b-1 fee, contingent deferred sales charge schedule, and conversion to Class A shares, remain unchanged.
| 2. | Significant Accounting Policies: |
The following is a summary of significant accounting policies of each Fund in the preparation of its financial statements, which are in accordance with United States Generally Accepted Accounting Principles (“U.S. GAAP”). The preparation of financial statements in
|
| Hartford Funds – Domestic Equity Funds |
Notes to Financial Statements – (continued)
April 30, 2015
accordance with U.S. GAAP may require management to make estimates and assumptions that affect the reported amounts of assets and liabilities and disclosure of contingent assets and liabilities at the date of the financial statements and the reported amounts of increases and decreases in net assets from operations during the reporting period. Actual results could differ from those estimates.
| | a) | Determination of Net Asset Value – The NAV of each class of each Fund’s shares is determined as of the close of regular trading (normally 4:00 p.m. Eastern Time) (the “NYSE Close”) on each day that the New York Stock Exchange (the “Exchange”) is open (“Valuation Date”). Information that becomes known to the Funds after the NAV has been calculated on a particular day will not generally be used to retroactively adjust the NAV determined earlier that day. |
| | b) | Investment Valuation and Fair Value Measurements – For purposes of calculating the NAV, portfolio investments and other assets held by each Fund’s portfolio for which market quotes are readily available are valued at market value. Market value is generally determined on the basis of last reported sales prices or official close price. If no sales are reported, market value is based on quotes obtained from a quotation reporting system, established market makers, or independent pricing services. If market prices are not readily available or are deemed unreliable, each Fund will use the fair value of the investment as determined in good faith under policies and procedures established by and under the supervision of each Company’s Board of Directors. Market quotes are considered not readily available where there is an absence of current or reliable market-based data (e.g., trade information or indicative market quotes), including where events occur after the close of the relevant market, but prior to the NYSE Close, that materially affect the values of each Fund’s portfolio investments or assets. In addition, market quotes are considered not readily available when, due to extraordinary circumstances, the exchanges or markets on which the investments trade do not open for trading for the entire day and no other market prices are available. In addition, prices of foreign equities that are principally traded on certain foreign markets may be adjusted daily pursuant to a fair value pricing service approved by the Company’s Board of Directors in order to reflect an adjustment for the factors occurring after the close of certain foreign markets but before the NYSE Close. Investments that are primarily traded on foreign markets may trade on days that are not business days of the Funds. The value of the foreign investments in which a Fund invests may change on days when a shareholder will not be able to purchase or redeem shares of the Fund. Fair value pricing is subjective in nature and the use of fair value pricing by the Funds may cause the NAV of its shares to differ significantly from the NAV that would have been calculated using market prices at the close of the exchange on which a portfolio investment is primarily traded. There can be no assurance that each Fund could obtain the fair market value assigned to an investment if the Fund were to sell the investment at approximately the time at which each Fund determines its NAV. |
Fixed income investments (other than short-term obligations), non-exchange traded derivatives and centrally cleared swaps held by a Fund are normally valued on the basis of quotes obtained from independent pricing services or brokers and dealers in accordance with procedures established by each Company’s Board of Directors. Prices obtained from independent pricing services use information provided by market makers or estimates of market values through accepted market modeling, trading and pricing conventions. Inputs to the models may include, but are not limited to, prepayment speeds, pricing spread, yield, trade information, dealer quotes, market color, cash flow models and the investment’s terms and conditions. Generally, the Funds may use fair valuation in regard to fixed income investments when the Funds hold defaulted or distressed investments or investments in a company in which a reorganization is pending. Short-term investments maturing in 60 days or less are generally valued at amortized cost, if their original term to maturity was 60 days or less, or by amortizing their value on the 61st day prior to maturity, if the original term to maturity exceeded 60 days, which approximates fair value.
Exchange traded options, futures and options on futures are valued at the settlement price or last trade price determined by the relevant exchange as of the NYSE Close. If the last trade price for exchange traded options does not fall between the bid and ask prices, the value will be the mean of the bid and ask prices as of the NYSE Close. If a last trade price is not available, the value will be the mean of the bid and ask prices as of the NYSE Close. If a mean of the bid and ask prices cannot be calculated for the day, the value will be the bid price as of the NYSE Close. In the case of over-the-counter (“OTC”) options and such instruments that do not trade on an exchange, values may be supplied by a pricing service using a formula or other objective method that may take into consideration the style, direction, expiration, strike price, notional value and volatility or other special adjustments.
Investments valued in currencies other than U.S. dollars are converted to U.S. dollars using exchange rates obtained from independent pricing services for calculation of the NAV. As a result, the NAV of certain Funds’ shares may be affected by changes in the value of currencies in relation to the U.S. dollar. The value of investments traded in markets outside the United States or denominated in currencies other than the U.S. dollar may be affected significantly on a day that the NYSE is closed and the market value may change on days when an investor is not able to purchase, redeem or exchange shares of the Funds.
|
| Hartford Funds – Domestic Equity Funds |
Notes to Financial Statements – (continued)
April 30, 2015
Foreign currency contracts represent agreements to exchange currencies on specific future dates at predetermined rates. Foreign currency contracts are valued using foreign currency exchange rates and forward rates as provided by an independent pricing service on the Valuation Date.
Investments in open-end mutual funds are valued at the respective NAV of each open-end mutual fund on the Valuation Date.
Financial instruments for which prices are not available from an independent pricing service may be valued using market quotations obtained from one or more dealers that make markets in the respective financial instrument in accordance with procedures established by the Company’s Board of Directors.
U.S. GAAP defines fair value as the price that the Funds would receive to sell an asset or pay to transfer a liability in an orderly transaction between market participants. The U.S. GAAP fair value measurement standards require disclosure of a fair value hierarchy for each major category of assets and liabilities. Various inputs are used in determining the fair value of each Fund’s investments. These inputs are summarized into three broad hierarchy levels. This hierarchy is based on whether the valuation inputs are observable or unobservable. These levels are:
| | • | | Level 1 – Quoted prices in active markets for identical investments. Level 1 may include exchange traded instruments, such as domestic equities, some foreign equities, options, futures, mutual funds, exchange traded funds, rights and warrants. |
| | • | | Level 2 – Observable inputs other than Level 1 prices, such as quoted prices for similar investments; quoted prices in markets that are not active; or other inputs that are observable or can be corroborated by observable market data. Level 2 may include debt investments that are traded less frequently than exchange traded instruments and which are valued using independent pricing services; foreign equities, which are principally traded on certain foreign markets and are adjusted daily pursuant to a fair value pricing service in order to reflect an adjustment for the factors occurring after the close of certain foreign markets but before the NYSE Close; senior floating rate interests, which are valued using an aggregate of dealer bids; short-term investments, which are valued at amortized cost; and swaps, which are valued based upon the terms of each swap contract. |
| | • | | Level 3 – Significant unobservable inputs that are supported by limited or no market activity. Level 3 may include financial instruments whose values are determined using indicative market quotes or require significant management judgment or estimation. These unobservable valuation inputs may include estimates for current yields, maturity/duration, prepayment speed, and indicative market quotes for comparable investments along with other assumptions relating to credit quality, collateral value, complexity of the investment structure, general market conditions and liquidity. This category may include investments where trading has been halted or there are certain restrictions on trading. While these investments are priced using unobservable inputs, the valuation of these investments reflects the best available data and management believes the prices are a reasonable representation of exit price. |
The Board of Directors of the Company generally reviews and approves the “Procedures for Valuation of Portfolio Securities” at least once a year. These procedures define how investments are to be valued, including the formation and activities of a Valuation Committee. The Valuation Committee is responsible for determining in good faith the fair value of investments when the value cannot be obtained from primary pricing services or alternative sources or if the valuation of an investment as provided by the primary pricing service or alternative source is believed not to reflect the investment’s fair value as of the Valuation Date. Voting members of the Valuation Committee include the Company’s Treasurer or designee and a Vice President of the investment manager or designee. An Assistant Vice President of the Company with legal expertise or designee is also included on the Valuation Committee as a non-voting advisory member. In addition, the Company’s Chief Compliance Officer shall designate a member of the compliance group to attend Valuation Committee meetings as a non-voting resource, to monitor for and provide guidance with respect to compliance with these procedures. Two members of the Valuation Committee or their designees, representing different departments, shall constitute a quorum for purposes of permitting the Valuation Committee to take action. The Valuation Committee will consider all relevant factors in determining an investment’s fair value, and may seek the advice of each Fund’s subadviser, as applicable, knowledgeable brokers, and legal counsel in making such determination. The Valuation Committee reports to the Audit Committee of the Company’s Board of Directors. The Audit Committee receives quarterly written reports which include details of all fair-valued investments, including the reason for the fair valuation, and an indication, when possible, of the accuracy of the valuation by disclosing the next available reliable public price quotation or the disposition price of such investments (the “lookback” test). The Board of Directors of each Company then must consider for ratification all of the fair value determinations made during the previous quarter.
|
| Hartford Funds – Domestic Equity Funds |
Notes to Financial Statements – (continued)
April 30, 2015
Valuation levels are not necessarily indicative of the risk associated with investing in such investments. Individual investments within any of the above mentioned asset classes may be assigned a different hierarchical level than those presented above, as individual circumstances dictate.
For additional information, refer to the Fair Valuation Summary and the Level 3 roll-forward reconciliation, if applicable, which follows each Fund’s Schedule of Investments.
| | c) | Investment Transactions and Investment Income – Investment transactions are recorded as of the trade date (the date the order to buy or sell is executed) for financial reporting purposes. Investments purchased or sold on a when-issued or delayed-delivery basis may be settled a month or more after the trade date. Realized gains and losses are determined on the basis of identified cost. |
Dividend income from domestic securities is accrued on the ex-dividend date. In general, dividend income from foreign securities is recorded on the ex-date; however, dividend notifications in certain foreign jurisdictions may not be available in a timely manner and as a result, certain Funds will record the dividend as soon as the relevant details (i.e., rate per share, payment date, shareholders of record, etc.) are publicly available. Interest income, including amortization of premium, accretion of discounts and additional principal received in-kind in lieu of cash, is accrued on a daily basis.
| | d) | Foreign Currency Transactions – Assets and liabilities denominated in currencies other than U.S. dollars are translated into U.S. dollars at the exchange rates in effect on the valuation date. Purchases and sales of investments, income and expenses are translated into U.S. dollars at the exchange rates on the dates of such transactions. |
The Funds do not isolate that portion of portfolio investment valuation resulting from fluctuations in the foreign currency exchange rates from the fluctuations arising from changes in the market prices of investments held. Exchange rate fluctuations are included with the net realized and unrealized gain or loss on investments in the accompanying financial statements.
Net realized foreign exchange gains or losses arise from sales of foreign currencies and the difference between asset and liability amounts initially stated in foreign currencies and the U.S. dollar value of the amounts actually received or paid. Net unrealized foreign exchange gains or losses arise from changes in the value of other assets and liabilities at the end of the reporting period, resulting from changes in the exchange rates.
| | e) | Joint Trading Account – Each Fund may invest cash balances into a joint trading account that may be invested in one or more repurchase agreements. |
| | f) | Fund Share Valuation and Dividend Distributions to Shareholders – Orders for each Fund’s shares are executed in accordance with the investment instructions of the shareholders. The NAV of each Fund’s shares is determined as of the close of business on each business day of the Exchange (see Note 2(a)). The NAV is determined separately for each class of shares of a Fund by dividing the Fund’s net assets attributable to that class by the number of shares of the class outstanding. Each class of shares offered by a Fund has equal rights as to assets and voting privileges (except that shareholders of a class have exclusive voting rights regarding any matter relating solely to that class of shares). Income and non-class specific expenses are allocated daily to each class on the basis of the relative net assets of the class. Realized and unrealized gains and losses are allocated daily based on the relative net assets of each class of shares of each Fund. |
Orders for the purchase of a Funds’ shares received prior to the close of the Exchange on any day the Exchange is open for business are priced at the NAV determined as of the close of the Exchange. Orders received after the close of the Exchange, or on a day on which the Exchange and/or the Funds are not open for business, are priced at the next determined NAV.
Dividends are declared pursuant to a policy adopted by each Company’s Board of Directors. Dividends and/or distributions to shareholders are recorded on ex-date. The policy of each Fund, except Dividend and Growth Fund and Equity Income Fund, is to pay dividends from net investment income and realized gains, if any, at least once a year. The policy of Dividend and Growth Fund and Equity Income Fund is to pay dividends from net investment income, if any, quarterly and realized gains, if any, at least once a year.
Income dividends and capital gains distributions are determined in accordance with federal income tax regulations, which may differ from U.S. GAAP with respect to character and timing (see Federal Income Taxes: Distributions and Components of Distributable Earnings and Reclassification of Capital Accounts note).
|
| Hartford Funds – Domestic Equity Funds |
Notes to Financial Statements – (continued)
April 30, 2015
| 3. | Securities and Other Investments: |
| | a) | Repurchase Agreements – A repurchase agreement is an agreement by which a counterparty agrees to sell an investment and agrees to repurchase the investment sold from the buyer at a mutually agreed upon time and price. During the period of the repurchase agreement, the counterparty will deposit cash and or securities in a third party custodial account to serve as collateral. At the time a Fund enters into a repurchase agreement, the value of the underlying collateral, including accrued interest, will be equal to or exceed the value of the repurchase agreement. Repurchase agreements expose a Fund to counterparty risk – that is, the risk that the counterparty will not fulfill its obligations. To minimize counterparty risk, the investments that serve to collateralize the repurchase agreement are held by a Fund’s custodian in book entry or physical form in the custodial account of the Funds or in a third party custodial account. Repurchase agreements are valued at cost plus accrued interest, which approximates fair value. Repurchase agreements have master netting arrangements which allow the Funds to offset amounts owed to a counterparty with amounts owed by the counterparty, including any collateral. Upon an event of default under a master repurchase agreement, the nondefaulting party may close out all transactions traded under such agreement and net amounts owed under each transaction to one net amount payable by one party to the other. Absent an event of default, the master repurchase agreement does not result in an offset of reported amounts of assets and liabilities in the Statements of Assets and Liabilities across transactions between a Fund and the applicable counterparty. See each Fund’s Schedule of Investments, if applicable, for outstanding repurchase agreements and related collateral as of April 30, 2015. |
| | b) | Illiquid and Restricted Investments – Each Fund is permitted to invest up to 15% of its net assets in illiquid investments. Illiquid investments are those that may not be sold or disposed of in the ordinary course of business within seven days, at approximately the price used to determine a Fund’s NAV. A Fund may not be able to sell illiquid investments when its sub-adviser considers it desirable to do so or may have to sell such investments at a price that is lower than the price that could be obtained if the investments were more liquid. A sale of illiquid investments may require more time and may result in higher dealer discounts and other selling expenses than does the sale of those that are liquid. Illiquid investments also may be more difficult to value due to the unavailability of reliable market quotations for such investments, and an investment in them may have an adverse impact on a Fund’s NAV. Certain Funds may also purchase certain restricted investments that can only be resold to certain qualified investors and may be determined to be liquid pursuant to policies and guidelines established by each Company’s Board of Directors. See each Fund’s Schedule of Investments, if applicable, for illiquid or restricted investments as of April 30, 2015. |
| | c) | Investments Purchased on a When-Issued or Delayed-Delivery Basis – Delivery and payment for investments that have been purchased by a Fund on a forward commitment, or when-issued or delayed-delivery basis, take place beyond the customary settlement period. A Fund may dispose of or renegotiate a delayed-delivery transaction after it is entered into, and may sell delayed-delivery investments before they are delivered, which may result in a realized gain or loss. During this period, such investments are subject to market fluctuations, and a Fund identifies investments segregated in its records with a value at least equal to the amount of the commitment. See each Fund’s Schedule of Investments, if applicable, for when-issued or delayed-delivery investments as of April 30, 2015. |
| 4. | Financial Derivative Instruments: |
The following disclosures contain information on how and why the Funds use derivative instruments, the credit-risk-related contingent features in certain derivative instruments, and how derivative instruments affect a Fund’s financial position and results of operations. The location and fair value amounts of these instruments on the Statements of Assets and Liabilities and the realized gains and losses and changes in unrealized gains and losses on the Statements of Operations, each categorized by type of derivative contract, are included in the following Additional Derivative Instrument Information footnote. The derivative instruments outstanding as of period-end are disclosed in the notes to the Schedules of Investments, if applicable. The amounts of realized gains and losses and changes in unrealized gains and losses on derivative instruments during the period are disclosed in the Statements of Operations.
| | a) | Foreign Currency Contracts – Each Fund may enter into foreign currency contracts that obligate the Funds to purchase or sell currencies at specified future dates. Foreign currency contracts are used to hedge the currency exposure associated with some or all of a Fund’s investments and/or as part of an investment strategy. Foreign currency contracts are marked to market daily and the change in value is recorded by a Fund as an unrealized gain or loss. A Fund will record a realized gain or loss when the foreign currency contract is settled. |
|
| Hartford Funds – Domestic Equity Funds |
Notes to Financial Statements – (continued)
April 30, 2015
Foreign currency contracts involve elements of market risk in excess of the amounts reflected in the Statements of Assets and Liabilities. In addition, risks may arise upon entering into these contracts from the potential inability of the counterparties to meet the terms of the contracts and from unanticipated movements in the value of the foreign currencies relative to the U.S. dollar. See each Fund’s Schedule of Investments, if applicable, for outstanding foreign currency contracts as of April 30, 2015.
| | b) | Futures Contracts – Each Fund may enter into futures contracts. A futures contract is an agreement between two parties to buy or sell an asset at a set price on a future date. A Fund uses futures contracts to manage or obtain exposure to the investment markets, commodities, or movements in interest rates and currency values. The primary risks associated with the use of futures contracts are the imperfect correlation between the change in market value of the investments held by a Fund and the prices of futures contracts and the possibility of an illiquid market. Upon entering into a futures contract, a Fund is required to deposit with a futures commission merchant (“FCM”) an amount of cash or U.S. Government or Agency Obligations in accordance with the initial margin requirements of the broker or exchange. Futures contracts are marked to market daily at the most recent settlement price reported by an exchange on which, over time, they are traded most extensively, and an appropriate payable or receivable for the change in value (“variation margin”) is recorded by the Funds. Gains or losses are recognized but not considered realized until the contracts expire or are closed. Futures contracts involve, to varying degrees, risk of loss in excess of the variation margin disclosed on the Statements of Assets and Liabilities; however, the Funds seek to reduce this risk through the use of an FCM. See each Fund’s Schedule of Investments, if applicable, for outstanding futures contracts as of April 30, 2015. |
| | c) | Options Contracts – An option contract is a contract sold by one party to another party that offers the buyer the right, but not the obligation, to buy (call) or sell (put) an investment or other financial asset at an agreed-upon price during a specific period of time or on a specific date. Option contracts are either privately negotiated in the over-the-counter market (“OTC options”) or executed in a registered exchange (“exchange traded options”). A Fund may write (sell) covered call and put options on futures, swaps (“swaptions”), securities, commodities or currencies. “Covered” means that so long as a Fund is obligated as the writer of an option, it will own either the underlying investments or currency or an option to purchase the same underlying investments or currency having an expiration date of the covered option and an exercise price equal to or less than the exercise price of the covered option, or will pledge cash or other liquid investments having a value equal to or greater than the fluctuating market value of the option investment or currency. Writing put options increases a Fund’s exposure to the underlying instrument. Writing call options decreases a Fund’s exposure to the underlying instrument. Premiums received from writing options that expire are treated as realized gains. Premiums received from writing options that are exercised or closed are added to the proceeds or offset amounts paid on the underlying futures, swap, investment or currency transaction to determine the realized gain or loss. A Fund as a writer of an option has no control over whether the underlying instrument may be sold (call) or purchased (put) and as a result bears the market risk of an unfavorable change in the price of the instrument underlying the written option. There is the risk a Fund may not be able to enter into a closing transaction because of an illiquid market. A Fund may also purchase put and call options. Purchasing call options increases a Fund’s exposure to the underlying instrument. Purchasing put options decreases a Fund’s exposure to the underlying instrument. Each Fund pays a premium, which is included on the Fund’s Statements of Assets and Liabilities as an investment and is subsequently marked to market to reflect the current value of the option. Premiums paid for purchasing options that expire are treated as realized losses. Certain options may be purchased with premiums to be determined on a future date. The premiums for these options are based upon implied volatility parameters at specified terms. The risk associated with purchasing put and call options is generally limited to the premium paid. Premiums paid for purchasing options that are exercised or closed are added to the amounts paid or offset against the proceeds on the underlying investment transaction to determine the realized gain or loss. Entering into over-the-counter options also exposes a Fund to counterparty risk. Counterparty risk is the possibility that the counterparty to the agreements may default on its obligation to perform or disagree as to the meaning of the contractual terms in the agreements. |
See each Fund’s Schedule of Investments, if applicable, for outstanding purchased option contracts as of April 30, 2015. The Funds had no outstanding written option contracts as of April 30, 2015. There were no transactions involving written option contracts during the six-month period ended April 30, 2015.
|
| Hartford Funds – Domestic Equity Funds |
Notes to Financial Statements – (continued)
April 30, 2015
| | d) | Additional Derivative Instrument Information: |
Capital Appreciation Fund
Fair Value of Derivative Instruments on the Statement of Assets and Liabilities as of April 30, 2015:
| | | | | | | | | | | | | | | | | | | | | | | | | | | | |
| | | Risk Exposure Category | |
| | | Interest Rate
Contracts | | | Foreign
Exchange
Contracts | | | Credit
Contracts | | | Equity
Contracts | | | Commodity
Contracts | | | Other
Contracts | | | Total | |
Assets: | | | | | | | | | | | | | | | | | | | | | | | | | | | | |
Unrealized appreciation on foreign currency contracts | | $ | — | | | $ | 308,208 | | | $ | — | | | $ | — | | | $ | — | | | $ | — | | | $ | 308,208 | |
| | | | | | | | | | | | | | | | | | | | | | | | | | | | |
Total | | $ | — | | | $ | 308,208 | | | $ | — | | | $ | — | | | $ | — | | | $ | — | | | $ | 308,208 | |
| | | | | | | | | | | | | | | | | | | | | | | | | | | | |
| | | | | | | |
Liabilities: | | | | | | | | | | | | | | | | | | | | | | | | | | | | |
Unrealized depreciation on foreign currency contracts | | $ | — | | | $ | 12,078,803 | | | $ | — | | | $ | — | | | $ | — | | | $ | — | | | $ | 12,078,803 | |
| | | | | | | | | | | | | | | | | | | | | | | | | | | | |
Total | | $ | — | | | $ | 12,078,803 | | | $ | — | | | $ | — | | | $ | — | | | $ | — | | | $ | 12,078,803 | |
| | | | | | | | | | | | | | | | | | | | | | | | | | | | |
The volume of derivatives that is presented in the Schedules of Investments is consistent with the Fund’s derivatives activity during the six-month period ended April 30, 2015.
The Effect of Derivative Instruments on the Statement of Operations for the six-month period ended April 30, 2015
| | | | | | | | | | | | | | | | | | | | | | | | | | | | |
| | | Risk Exposure Category | |
| | | Interest Rate
Contracts | | | Foreign
Exchange
Contracts | | | Credit
Contracts | | | Equity
Contracts | | | Commodity
Contracts | | | Other
Contracts | | | Total | |
Realized Gain on Derivatives Recognized as a Result of Operations: | | | | | | | | | | | | | |
Net realized gain (loss) on foreign currency contracts | | $ | — | | | $ | 73,701,092 | | | $ | — | | | $ | — | | | $ | — | | | $ | — | | | $ | 73,701,092 | |
| | | | | | | | | | | | | | | | | | | | | | | | | | | | |
Total | | $ | — | | | $ | 73,701,092 | | | $ | — | | | $ | — | | | $ | — | | | $ | — | | | $ | 73,701,092 | |
| | | | | | | | | | | | | | | | | | | | | | | | | | | | |
| |
Net Change in Unrealized Appreciation (Depreciation) on Derivatives Recognized as a Result of Operations: | | | | | |
Net change in unrealized appreciation (depreciation) of foreign currency | | $ | — | | | $ | (38,069,909 | ) | | $ | — | | | $ | — | | | $ | — | | | $ | — | | | $ | (38,069,909 | ) |
| | | | | | | | | | | | | | | | | | | | | | | | | | | | |
Total | | $ | — | | | $ | (38,069,909 | ) | | $ | — | | | $ | — | | | $ | — | | | $ | — | | | $ | (38,069,909 | ) |
| | | | | | | | | | | | | | | | | | | | | | | | | | | | |
Core Equity Fund
Fair Value of Derivative Instruments on the Statement of Assets and Liabilities as of April 30, 2015:
| | | | | | | | | | | | | | | | | | | | | | | | | | | | |
| | | Risk Exposure Category | |
| | | Interest Rate
Contracts | | | Foreign
Exchange
Contracts | | | Credit
Contracts | | | Equity
Contracts | | | Commodity
Contracts | | | Other
Contracts | | | Total | |
Liabilities: | | | | | | | | | | | | | | | | | | | | | | | | | | | | |
Unrealized depreciation on futures contracts(1) | | $ | — | | | $ | — | | | $ | — | | | $ | 28,080 | | | $ | — | | | $ | — | | | $ | 28,080 | |
| | | | | | | | | | | | | | | | | | | | | | | | | | | | |
Total | | $ | — | | | $ | — | | | $ | — | | | $ | 28,080 | | | $ | — | | | $ | — | | | $ | 28,080 | |
| | | | | | | | | | | | | | | | | | | | | | | | | | | | |
| | (1) | Cumulative appreciation (depreciation) on futures contracts is disclosed within the Schedule of Investments under the open “Futures Contracts” section. Only current day’s variation margin, if any, are reported within the Statements of Assets and Liabilities. |
The volume of derivatives that is presented in the Schedules of Investments is consistent with the Fund’s derivatives activity during the six-month period ended April 30, 2015.
|
| Hartford Funds – Domestic Equity Funds |
Notes to Financial Statements – (continued)
April 30, 2015
The Effect of Derivative Instruments on the Statement of Operations for the six-month period ended April 30, 2015
| | | | | | | | | | | | | | | | | | | | | | | | | | | | |
| | | Risk Exposure Category | |
| | | Interest Rate
Contracts | | | Foreign
Exchange
Contracts | | | Credit
Contracts | | | Equity
Contracts | | | Commodity
Contracts | | | Other
Contracts | | | Total | |
Realized Gain on Derivatives Recognized as a Result of Operations: | | | | | | | | | | | | | |
Net realized gain (loss) on futures | | $ | — | | | $ | — | | | $ | — | | | $ | 42,716 | | | $ | — | | | $ | — | | | $ | 42,716 | |
| | | | | | | | | | | | | | | | | | | | | | | | | | | | |
Total | | $ | — | | | $ | — | | | $ | — | | | $ | 42,716 | | | $ | — | | | $ | — | | | $ | 42,716 | |
| | | | | | | | | | | | | | | | | | | | | | | | | | | | |
| | | |
Net Change in Unrealized Appreciation (Depreciation) on Derivatives Recognized as a Result of Operations: | | | | | | | | | | | | | |
Net change in unrealized appreciation (depreciation) of futures | | $ | — | | | $ | — | | | $ | — | | | $ | (239,681 | ) | | $ | — | | | $ | — | | | $ | (239,681 | ) |
| | | | | | | | | | | | | | | | | | | | | | | | | | | | |
Total | | $ | — | | | $ | — | | | $ | — | | | $ | (239,681 | ) | | $ | — | | | $ | — | | | $ | (239,681 | ) |
| | | | | | | | | | | | | | | | | | | | | | | | | | | | |
Dividend and Growth Fund
The Effect of Derivative Instruments on the Statement of Operations for the six-month period ended April 30, 2015
| | | | | | | | | | | | | | | | | | | | | | | | | | | | |
| | | Risk Exposure Category | |
| | | Interest Rate
Contracts | | | Foreign
Exchange
Contracts | | | Credit
Contracts | | | Equity
Contracts | | | Commodity
Contracts | | | Other
Contracts | | | Total | |
Realized Gain on Derivatives Recognized as a Result of Operations: | | | | | | | | | | | | | |
Net realized gain (loss) on foreign currency contracts | | $ | — | | | $ | (989 | ) | | $ | — | | | $ | — | | | $ | — | | | $ | — | | | $ | (989 | ) |
| | | | | | | | | | | | | | | | | | | | | | | | | | | | |
Total | | $ | — | | | $ | (989 | ) | | $ | — | | | $ | — | | | $ | — | | | $ | — | | | $ | (989 | ) |
| | | | | | | | | | | | | | | | | | | | | | | | | | | | |
Equity Income Fund
The Effect of Derivative Instruments on the Statement of Operations for the six-month period ended April 30, 2015
| | | | | | | | | | | | | | | | | | | | | | | | | | | | |
| | | Risk Exposure Category | |
| | | Interest Rate
Contracts | | | Foreign
Exchange
Contracts | | | Credit
Contracts | | | Equity
Contracts | | | Commodity
Contracts | | | Other
Contracts | | | Total | |
Realized Gain on Derivatives Recognized as a Result of Operations: | | | | | | | | | | | | | |
Net realized gain (loss) on foreign currency contracts | | $ | — | | | $ | 56,581 | | | $ | — | | | $ | — | | | $ | — | | | $ | — | | | $ | 56,581 | |
| | | | | | | | | | | | | | | | | | | | | | | | | | | | |
Total | | $ | — | | | $ | 56,581 | | | $ | — | | | $ | — | | | $ | — | | | $ | — | | | $ | 56,581 | |
| | | | | | | | | | | | | | | | | | | | | | | | | | | | |
Growth Opportunities Fund
Fair Value of Derivative Instruments on the Statement of Assets and Liabilities as of April 30, 2015:
| | | | | | | | | | | | | | | | | | | | | | | | | | | | |
| | | Risk Exposure Category | |
| | | Interest Rate
Contracts | | | Foreign
Exchange
Contracts | | | Credit
Contracts | | | Equity
Contracts | | | Commodity
Contracts | | | Other
Contracts | | | Total | |
Assets: | | | | | | | | | | | | | | | | | | | | | | | | | | | | |
Unrealized appreciation on foreign currency contracts | | $ | — | | | $ | 6,099 | | | $ | — | | | $ | — | | | $ | — | | | $ | — | | | $ | 6,099 | |
| | | | | | | | | | | | | | | | | | | | | | | | | | | | |
Total | | $ | — | | | $ | 6,099 | | | $ | — | | | $ | — | | | $ | — | | | $ | — | | | $ | 6,099 | |
| | | | | | | | | | | | | | | | | | | | | | | | | | | | |
The volume of derivatives that is presented in the Schedules of Investments is consistent with the Fund’s derivatives activity during the six-month period ended April 30, 2015.
|
| Hartford Funds – Domestic Equity Funds |
Notes to Financial Statements – (continued)
April 30, 2015
The Effect of Derivative Instruments on the Statement of Operations for the six-month period ended April 30, 2015
| | | | | | | | | | | | | | | | | | | | | | | | | | | | |
| | | Risk Exposure Category | |
| | | Interest Rate
Contracts | | | Foreign
Exchange
Contracts | | | Credit
Contracts | | | Equity
Contracts | | | Commodity
Contracts | | | Other
Contracts | | | Total | |
Realized Gain on Derivatives Recognized as a Result of Operations: | |
Net realized gain (loss) on foreign currency contracts | | $ | — | | | $ | 191,933 | | | $ | — | | | $ | — | | | $ | — | | | $ | — | | | $ | 191,933 | |
| | | | | | | | | | | | | | | | | | | | | | | | | | | | |
Total | | $ | — | | | $ | 191,933 | | | $ | — | | | $ | — | | | $ | — | | | $ | — | | | $ | 191,933 | |
| | | | | | | | | | | | | | | | | | | | | | | | | | | | |
|
Net Change in Unrealized Appreciation (Depreciation) on Derivatives Recognized as a Result of Operations: | |
Net change in unrealized appreciation (depreciation) of foreign currency | | $ | — | | | $ | 6,099 | | | $ | — | | | $ | — | | | $ | — | | | $ | — | | | $ | 6,099 | |
| | | | | | | | | | | | | | | | | | | | | | | | | | | | |
Total | | $ | — | | | $ | 6,099 | | | $ | — | | | $ | — | | | $ | — | | | $ | — | | | $ | 6,099 | |
| | | | | | | | | | | | | | | | | | | | | | | | | | | | |
Healthcare Fund
Fair Value of Derivative Instruments on the Statement of Assets and Liabilities as of April 30, 2015:
| | | | | | | | | | | | | | | | | | | | | | | | | | | | |
| | | Risk Exposure Category | |
| | | Interest Rate
Contracts | | | Foreign
Exchange
Contracts | | | Credit
Contracts | | | Equity
Contracts | | | Commodity
Contracts | | | Other
Contracts | | | Total | |
Assets: | |
Unrealized appreciation on foreign currency contracts | | $ | — | | | $ | 1,871 | | | $ | — | | | $ | — | | | $ | — | | | $ | — | | | $ | 1,871 | |
| | | | | | | | | | | | | | | | | | | | | | | | | | | | |
Total | | $ | — | | | $ | 1,871 | | | $ | — | | | $ | — | | | $ | — | | | $ | — | | | $ | 1,871 | |
| | | | | | | | | | | | | | | | | | | | | | | | | | | | |
|
Liabilities: | |
Unrealized depreciation on foreign currency contracts | | $ | — | | | $ | 3,156 | | | $ | — | | | $ | — | | | $ | — | | | $ | — | | | $ | 3,156 | |
| | | | | | | | | | | | | | | | | | | | | | | | | | | | |
Total | | $ | — | | | $ | 3,156 | | | $ | — | | | $ | — | | | $ | — | | | $ | — | | | $ | 3,156 | |
| | | | | | | | | | | | | | | | | | | | | | | | | | | | |
The volume of derivatives that is presented in the Schedules of Investments is consistent with the Fund’s derivatives activity during the six-month period ended April 30, 2015.
The Effect of Derivative Instruments on the Statement of Operations for the six-month period ended April 30, 2015
| | | | | | | | | | | | | | | | | | | | | | | | | | | | |
| | | Risk Exposure Category | |
| | | Interest Rate
Contracts | | | Foreign
Exchange
Contracts | | | Credit
Contracts | | | Equity
Contracts | | | Commodity
Contracts | | | Other
Contracts | | | Total | |
Realized Gain on Derivatives Recognized as a Result of Operations: | |
Net realized gain (loss) on foreign currency contracts | | $ | — | | | $ | 1,318,903 | | | $ | — | | | $ | — | | | $ | — | | | $ | — | | | $ | 1,318,903 | |
| | | | | | | | | | | | | | | | | | | | | | | | | | | | |
Total | | $ | — | | | $ | 1,318,903 | | | $ | — | | | $ | — | | | $ | — | | | $ | — | | | $ | 1,318,903 | |
| | | | | | | | | | | | | | | | | | | | | | | | | | | | |
|
Net Change in Unrealized Appreciation (Depreciation) on Derivatives Recognized as a Result of Operations: | |
Net change in unrealized appreciation (depreciation) of foreign currency | | $ | — | | | $ | (698,754 | ) | | $ | — | | | $ | — | | | $ | — | | | $ | — | | | $ | (698,754 | ) |
| | | | | | | | | | | | | | | | | | | | | | | | | | | | |
Total | | $ | — | | | $ | (698,754 | ) | | $ | — | | | $ | — | | | $ | — | | | $ | — | | | $ | (698,754 | ) |
| | | | | | | | | | | | | | | | | | | | | | | | | | | | |
MidCap Fund
The Effect of Derivative Instruments on the Statement of Operations for the six-month period ended April 30, 2015
| | | | | | | | | | | | | | | | | | | | | | | | | | | | |
| | | Risk Exposure Category | |
| | | Interest Rate
Contracts | | | Foreign
Exchange
Contracts | | | Credit
Contracts | | | Equity
Contracts | | | Commodity
Contracts | | | Other
Contracts | | | Total | |
Realized Gain on Derivatives Recognized as a Result of Operations: | |
Net realized gain (loss) on foreign currency contracts | | $ | — | | | $ | 25,998 | | | $ | — | | | $ | — | | | $ | — | | | $ | — | | | $ | 25,998 | |
| | | | | | | | | | | | | | | | | | | | | | | | | | | | |
Total | | $ | — | | | $ | 25,998 | | | $ | — | | | $ | — | | | $ | — | | | $ | — | | | $ | 25,998 | |
| | | | | | | | | | | | | | | | | | | | | | | | | | | | |
|
| Hartford Funds – Domestic Equity Funds |
Notes to Financial Statements – (continued)
April 30, 2015
MidCap Value Fund
Fair Value of Derivative Instruments on the Statement of Assets and Liabilities as of April 30, 2015:
| | | | | | | | | | | | | | | | | | | | | | | | | | | | |
| | | Risk Exposure Category | |
| | | Interest Rate
Contracts | | | Foreign
Exchange
Contracts | | | Credit
Contracts | | | Equity
Contracts | | | Commodity
Contracts | | | Other
Contracts | | | Total | |
Assets: | |
Unrealized appreciation on foreign currency contracts | | $ | — | | | $ | 37 | | | $ | — | | | $ | — | | | $ | — | | | $ | — | | | $ | 37 | |
| | | | | | | | | | | | | | | | | | | | | | | | | | | | |
Total | | $ | — | | | $ | 37 | | | $ | — | | | $ | — | | | $ | — | | | $ | — | | | $ | 37 | |
| | | | | | | | | | | | | | | | | | | | | | | | | | | | |
|
Liabilities: | |
Unrealized depreciation on foreign currency contracts | | $ | — | | | $ | 73 | | | $ | — | | | $ | — | | | $ | — | | | $ | — | | | $ | 73 | |
| | | | | | | | | | | | | | | | | | | | | | | | | | | | |
Total | | $ | — | | | $ | 73 | | | $ | — | | | $ | — | | | $ | — | | | $ | — | | | $ | 73 | |
| | | | | | | | | | | | | | | | | | | | | | | | | | | | |
The volume of derivatives that is presented in the Schedules of Investments is consistent with the Fund’s derivatives activity during the six-month period ended April 30, 2015.
The Effect of Derivative Instruments on the Statement of Operations for the six-month period ended April 30, 2015
| | | | | | | | | | | | | | | | | | | | | | | | | | | | |
| | | Risk Exposure Category | |
| | | Interest Rate
Contracts | | | Foreign
Exchange
Contracts | | | Credit
Contracts | | | Equity
Contracts | | | Commodity
Contracts | | | Other
Contracts | | | Total | |
Realized Gain on Derivatives Recognized as a Result of Operations: | |
Net realized gain (loss) on foreign currency contracts | | $ | — | | | $ | 28,617 | | | $ | — | | | $ | — | | | $ | — | | | $ | — | | | $ | 28,617 | |
| | | | | | | | | | | | | | | | | | | | | | | | | | | | |
Total | | $ | — | | | $ | 28,617 | | | $ | — | | | $ | — | | | $ | — | | | $ | — | | | $ | 28,617 | |
| | | | | | | | | | | | | | | | | | | | | | | | | | | | |
|
Net Change in Unrealized Appreciation (Depreciation) on Derivatives Recognized as a Result of Operations: | |
Net change in unrealized appreciation (depreciation) of foreign currency | | $ | — | | | $ | (3,142 | ) | | $ | — | | | $ | — | | | $ | — | | | $ | — | | | $ | (3,142 | ) |
| | | | | | | | | | | | | | | | | | | | | | | | | | | | |
Total | | $ | — | | | $ | (3,142 | ) | | $ | — | | | $ | — | | | $ | — | | | $ | — | | | $ | (3,142 | ) |
| | | | | | | | | | | | | | | | | | | | | | | | | | | | |
Small Company Fund
The Effect of Derivative Instruments on the Statement of Operations for the six-month period ended April 30, 2015
| | | | | | | | | | | | | | | | | | | | | | | | | | | | |
| | | Risk Exposure Category | |
| | | Interest Rate
Contracts | | | Foreign
Exchange
Contracts | | | Credit
Contracts | | | Equity
Contracts | | | Commodity
Contracts | | | Other
Contracts | | | Total | |
Realized Gain on Derivatives Recognized as a Result of Operations: | |
Net realized gain (loss) on foreign currency contracts | | $ | — | | | $ | (2,312 | ) | | $ | — | | | $ | — | | | $ | — | | | $ | — | | | $ | (2,312 | ) |
| | | | | | | | | | | | | | | | | | | | | | | | | | | | |
Total | | $ | — | | | $ | (2,312 | ) | | $ | — | | | $ | — | | | $ | — | | | $ | — | | | $ | (2,312 | ) |
| | | | | | | | | | | | | | | | | | | | | | | | | | | | |
Small/Mid Cap Equity Fund
The Effect of Derivative Instruments on the Statement of Operations for the six-month period ended April 30, 2015
| | | | | | | | | | | | | | | | | | | | | | | | | | | | |
| | | Risk Exposure Category | |
| | | Interest Rate
Contracts | | | Foreign
Exchange
Contracts | | | Credit
Contracts | | | Equity
Contracts | | | Commodity
Contracts | | | Other
Contracts | | | Total | |
Realized Gain on Derivatives Recognized as a Result of Operations: | |
Net realized gain (loss) on foreign currency contracts | | $ | — | | | $ | (8 | ) | | $ | — | | | $ | — | | | $ | — | | | $ | — | | | $ | (8 | ) |
| | | | | | | | | | | | | | | | | | | | | | | | | | | | |
Total | | $ | — | | | $ | (8 | ) | | $ | — | | | $ | — | | | $ | — | | | $ | — | | | $ | (8 | ) |
| | | | | | | | | | | | | | | | | | | | | | | | | | | | |
|
| Hartford Funds – Domestic Equity Funds |
Notes to Financial Statements – (continued)
April 30, 2015
Value Opportunities Fund
Fair Value of Derivative Instruments on the Statement of Assets and Liabilities as of April 30, 2015:
| | | | | | | | | | | | | | | | | | | | | | | | | | | | |
| | | Risk Exposure Category | |
| | | Interest Rate
Contracts | | | Foreign
Exchange
Contracts | | | Credit
Contracts | | | Equity
Contracts | | | Commodity
Contracts | | | Other
Contracts | | | Total | |
Assets: | |
Unrealized appreciation on foreign currency contracts | | $ | — | | | $ | 100,788 | | | $ | — | | | $ | — | | | $ | — | | | $ | — | | | $ | 100,788 | |
| | | | | | | | | | | | | | | | | | | | | | | | | | | | |
Total | | $ | — | | | $ | 100,788 | | | $ | — | | | $ | — | | | $ | — | | | $ | — | | | $ | 100,788 | |
| | | | | | | | | | | | | | | | | | | | | | | | | | | | |
|
Liabilities: | |
Unrealized depreciation on foreign currency contracts | | $ | — | | | $ | 712,723 | | | $ | — | | | $ | — | | | $ | — | | | $ | — | | | $ | 712,723 | |
| | | | | | | | | | | | | | | | | | | | | | | | | | | | |
Total | | $ | — | | | $ | 712,723 | | | $ | — | | | $ | — | | | $ | — | | | $ | — | | | $ | 712,723 | |
| | | | | | | | | | | | | | | | | | | | | | | | | | | | |
The volume of derivatives that is presented in the Schedules of Investments is consistent with the Fund’s derivatives activity during the six-month period ended April 30, 2015.
The Effect of Derivative Instruments on the Statement of Operations for the six-month period ended April 30, 2015
| | | | | | | | | | | | | | | | | | | | | | | | | | | | |
| | | Risk Exposure Category | |
| | | Interest Rate
Contracts | | | Foreign
Exchange
Contracts | | | Credit
Contracts | | | Equity
Contracts | | | Commodity
Contracts | | | Other
Contracts | | | Total | |
Realized Gain on Derivatives Recognized as a Result of Operations: | |
Net realized gain (loss) on foreign currency contracts | | $ | — | | | $ | 2,749,860 | | | $ | — | | | $ | — | | | $ | — | | | $ | — | | | $ | 2,749,860 | |
| | | | | | | | | | | | | | | | | | | | | | | | | | | | |
Total | | $ | — | | | $ | 2,749,860 | | | $ | — | | | $ | — | | | $ | — | | | $ | — | | | $ | 2,749,860 | |
| | | | | | | | | | | | | | | | | | | | | | | | | | | | |
|
Net Change in Unrealized Appreciation (Depreciation) on Derivatives Recognized as a Result of Operations: | |
Net change in unrealized appreciation (depreciation) of foreign currency | | $ | — | | | $ | (804,586 | ) | | $ | — | | | $ | — | | | $ | — | | | $ | — | | | $ | (804,586 | ) |
| | | | | | | | | | | | | | | | | | | | | | | | | | | | |
Total | | $ | — | | | $ | (804,586 | ) | | $ | — | | | $ | — | | | $ | — | | | $ | — | | | $ | (804,586 | ) |
| | | | | | | | | | | | | | | | | | | | | | | | | | | | |
| | e) | Balance Sheet Offsetting Information – Set forth below are tables which disclose both gross information and net information about instruments and transactions eligible for offset in the financial statements, and instruments and transactions that are subject to a master netting arrangement, as well as amounts related to margin, reflected as financial collateral (including cash collateral), held at clearing brokers, counterparties and the Funds’ custodian. The master netting arrangements (“MNA”) allow the clearing brokers to net any collateral held in or on behalf of the Funds, or liabilities or payment obligations of the clearing brokers to the Funds, against any liabilities or payment obligations of the Funds to the clearing brokers. The Funds are required to deposit financial collateral (including cash collateral) at the Funds’ custodian on behalf of clearing brokers and counterparties to continually meet the original and maintenance requirements established by the clearing brokers and counterparties. Such requirements are specific to the respective clearing broker or counterparty. Certain master netting arrangements may not be enforceable in a bankruptcy. |
The following tables present the Funds’ derivative assets and liabilities, presented on a gross basis as no amounts are netted within the Statements of Assets and Liabilities, by counterparty net of amounts available for offset under a master netting agreement or similar agreement (“MNA”) and net of the related collateral received/pledged by the Funds as of April 30, 2015:
| | | | | | | | |
| Capital Appreciation Fund | |
Derivative Financial Instruments: | | Assets ($) | | | Liabilities ($) | |
Foreign currency contracts | | | 308,208 | | | | (12,078,803 | ) |
| | | | | | | | |
Total gross amount of derivative assets and liabilities in the Statement of Assets and Liabilities | | | 308,208 | | | | (12,078,803 | ) |
| | | | | | | | |
Derivatives not subject to a MNA | | | — | | | | — | |
| | | | | | | | |
Total gross amount of assets and liabilities subject to MNA or similar agreements | | | 308,208 | | | | (12,078,803 | ) |
| | | | | | | | |
|
| Hartford Funds – Domestic Equity Funds |
Notes to Financial Statements – (continued)
April 30, 2015
| | | | | | | | | | | | | | | | | | | | |
Capital Appreciation Fund | |
Counterparty | | Gross Amount of
Assets ($) | | | Financial
Instruments
and Derivatives
Available for
Offset ($) | | | Non-cash
Collateral
Received ($)* | | | Cash
Collateral
Received ($)* | | | Net Amount of
Assets ($) | |
Deutsche Bank Securities, Inc. | | | 55,516 | | | | (55,516 | ) | | | — | | | | — | | | | — | |
Goldman Sachs & Co. | | | 91,041 | | | | (23,138 | ) | | | — | | | | — | | | | 67,903 | |
HSBC Bank USA | | | 5,903 | | | | (2,697 | ) | | | — | | | | — | | | | 3,206 | |
RBS Greenwich Capital | | | 152,898 | | | | (152,898 | ) | | | — | | | | — | | | | — | |
Toronto-Dominion Bank | | | 206 | | | | — | | | | — | | | | — | | | | 206 | |
Westpac International | | | 2,644 | | | | (2,644 | ) | | | — | | | | — | | | | — | |
| | | | | | | | | | | | | | | | | | | | |
Total | | | 308,208 | | | | (236,893 | ) | | | — | | | | — | | | | 71,315 | |
| | | | | | | | | | | | | | | | | | | | |
| | | | | |
Counterparty | | Gross Amount of
Liabilities ($) | | | Financial
Instruments
and Derivatives
Available for
Offset ($) | | | Non-cash
Collateral
Pledged ($)* | | | Cash
Collateral
Pledged ($)* | | | Net Amount of
Liabilities ($) | |
Barclays | | | (74,735 | ) | | | — | | | | — | | | | — | | | | (74,735 | ) |
BNP Paribas Securities Services | | | (60,206 | ) | | | — | | | | — | | | | — | | | | (60,206 | ) |
Deutsche Bank Securities, Inc. | | | (1,430,237 | ) | | | 55,516 | | | | — | | | | — | | | | (1,374,721 | ) |
Goldman Sachs & Co. | | | (23,138 | ) | | | 23,138 | | | | — | | | | — | | | | — | |
HSBC Bank USA | | | (2,697 | ) | | | 2,697 | | | | — | | | | — | | | | — | |
JP Morgan Chase & Co. | | | (1,432,340 | ) | | | — | | | | — | | | | — | | | | (1,432,340 | ) |
National Australia Bank Limited | | | (4,372,743 | ) | | | — | | | | — | | | | — | | | | (4,372,743 | ) |
RBS Greenwich Capital | | | (4,676,873 | ) | | | 152,898 | | | | — | | | | — | | | | (4,523,975 | ) |
Westpac International | | | (5,834 | ) | | | 2,644 | | | | — | | | | — | | | | (3,190 | ) |
| | | | | | | | | | | | | | | | | | | | |
Total | | | (12,078,803 | ) | | | 236,893 | | | | — | | | | — | | | | (11,841,910 | ) |
| | | | | | | | | | | | | | | | | | | | |
| | * | In some instances, the actual collateral received and/or pledged may be more than the amount shown. |
| | | | | | | | |
Core Equity Fund | |
Derivative Financial Instruments: | | Assets ($) | | | Liabilities ($) | |
Futures contracts | | | — | | | | (28,080 | ) |
| | | | | | | | |
Total gross amount of derivative assets and liabilities in the Statement of Assets and Liabilities | | | — | | | | (28,080 | ) |
| | | | | | | | |
Derivatives not subject to a MNA | | | — | | | | 28,080 | |
| | | | | | | | |
| | | | | | | | |
Healthcare Fund | |
Derivative Financial Instruments: | | Assets ($) | | | Liabilities ($) | |
Foreign currency contracts | | | 1,871 | | | | (3,156 | ) |
| | | | | | | | |
Total gross amount of derivative assets and liabilities in the Statement of Assets and Liabilities | | | 1,871 | | | | (3,156 | ) |
| | | | | | | | |
Derivatives not subject to a MNA | | | — | | | | — | |
| | | | | | | | |
Total gross amount of assets and liabilities subject to MNA or similar agreements | | | 1,871 | | | | (3,156 | ) |
| | | | | | | | |
| | | | | | | | | | | | | | | | | | | | |
Healthcare Fund | |
Counterparty | | Gross Amount of
Assets ($) | | | Financial
Instruments
and Derivatives
Available for
Offset ($) | | | Non-cash
Collateral
Received ($)* | | | Cash
Collateral
Received ($)* | | | Net Amount of
Assets ($) | |
Toronto-Dominion Bank | | | 240 | | | | — | | | | — | | | | — | | | | 240 | |
UBS AG | | | 7 | | | | — | | | | — | | | | — | | | | 7 | |
Westpac International | | | 1,624 | | | | — | | | | — | | | | — | | | | 1,624 | |
| | | | | | | | | | | | | | | | | | | | |
Total | | | 1,871 | | | | — | | | | — | | | | — | | | | 1,871 | |
| | | | | | | | | | | | | | | | | | | | |
|
| Hartford Funds – Domestic Equity Funds |
Notes to Financial Statements – (continued)
April 30, 2015
| | | | | | | | | | | | | | | | | | | | |
Counterparty | | Gross Amount of
Liabilities ($) | | | Financial
Instruments
and Derivatives
Available for
Offset ($) | | | Non-cash
Collateral
Pledged ($)* | | | Cash
Collateral
Pledged ($)* | | | Net Amount of
Liabilities ($) | |
Deutsche Bank Securities, Inc. | | | (2,652 | ) | | | — | | | | — | | | | — | | | | (2,652 | ) |
Morgan Stanley | | | (504 | ) | | | — | | | | — | | | | — | | | | (504 | ) |
| | | | | | | | | | | | | | | | | | | | |
Total | | | (3,156 | ) | | | — | | | | — | | | | — | | | | (3,156 | ) |
| | | | | | | | | | | | | | | | | | | | |
| | * | In some instances, the actual collateral received and/or pledged may be more than the amount shown. |
| | | | | | | | |
| MidCap Fund | |
Derivative Financial Instruments: | | Assets ($) | | | Liabilities ($) | |
Derivatives not subject to a master netting agreement or similar agreements (“MNA”) | | | — | | | | — | |
| | | | | | | | |
|
| MidCap Value Fund | |
Derivative Financial Instruments: | | Assets ($) | | | Liabilities ($) | |
Foreign currency contracts | | | 37 | | | | (73 | ) |
| | | | | | | | |
Total gross amount of derivative assets and liabilities in the Statement of Assets and Liabilities | | | 37 | | | | (73 | ) |
| | | | | | | | |
Derivatives not subject to a MNA | | | — | | | | — | |
| | | | | | | | |
Total gross amount of assets and liabilities subject to MNA or similar agreements | | | 37 | | | | (73 | ) |
| | | | | | | | |
| | | | | | | | | | | | | | | | | | | | |
| MidCap Value Fund | |
Counterparty | | Gross Amount of
Assets ($) | | | Financial
Instruments
and Derivatives
Available for
Offset ($) | | | Non-cash
Collateral
Received ($)* | | | Cash
Collateral
Received ($)* | | | Net Amount of
Assets ($) | |
Westpac International | | | 37 | | | | — | | | | — | | | | — | | | | 37 | |
| | | | | | | | | | | | | | | | | | | | |
| | | | | |
Counterparty | | Gross Amount of
Liabilities ($) | | | Financial
Instruments
and Derivatives
Available for
Offset ($) | | | Non-cash
Collateral
Pledged($)* | | | Cash
Collateral
Pledged ($)* | | | Net Amount of
Liabilities ($) | |
Commonwealth Bank of Australia | | | (48 | ) | | | — | | | | — | | | | — | | | | (48 | ) |
Deutsche Bank Securities, Inc. | | | (25 | ) | | | — | | | | — | | | | — | | | | (25 | ) |
| | | | | | | | | | | | | | | | | | | | |
Total | | | (73 | ) | | | — | | | | — | | | | — | | | | (73 | ) |
| | | | | | | | | | | | | | | | | | | | |
| | * | In some instances, the actual collateral received and/or pledged may be more than the amount shown. |
| | | | | | | | |
| Growth Opportunities Fund | |
Derivative Financial Instruments: | | Assets ($) | | | Liabilities ($) | |
Foreign currency contracts | | | 6,099 | | | | — | |
| | | | | | | | |
Total gross amount of derivative assets and liabilities in the Statement of Assets and Liabilities | | | 6,099 | | | | — | |
| | | | | | | | |
Derivatives not subject to a MNA | | | — | | | | — | |
| | | | | | | | |
Total gross amount of assets and liabilities subject to MNA or similar agreements | | | 6,099 | | | | — | |
| | | | | | | | |
| | | | | | | | | | | | | | | | | | | | |
| Growth Opportunities Fund | |
Counterparty | | Gross Amount of
Assets ($) | | | Financial
Instruments
and Derivatives
Available for
Offset ($) | | | Non-cash
Collateral
Received ($)* | | | Cash
Collateral
Received ($)* | | | Net Amount of
Assets ($) | |
Deutsche Bank Securities, Inc. | | | 1,832 | | | | — | | | | — | | | | — | | | | 1,832 | |
HSBC Bank USA | | | 4,267 | | | | — | | | | — | | | | — | | | | 4,267 | |
| | | | | | | | | | | | | | | | | | | | |
Total | | | 6,099 | | | | — | | | | — | | | | — | | | | 6,099 | |
| | | | | | | | | | | | | | | | | | | | |
| | * | In some instances, the actual collateral received and/or pledged may be more than the amount shown. |
|
| Hartford Funds – Domestic Equity Funds |
Notes to Financial Statements – (continued)
April 30, 2015
| | | | | | | | |
| Value Opportunities Fund | |
Derivative Financial Instruments: | | Assets ($) | | | Liabilities ($) | |
Foreign currency contracts | | | 100,788 | | | | (712,723 | ) |
| | | | | | | | |
Total gross amount of derivative assets and liabilities in the Statement of Assets and Liabilities | | | 100,788 | | | | (712,723 | ) |
| | | | | | | | |
Derivatives not subject to a MNA | | | — | | | | — | |
| | | | | | | | |
Total gross amount of assets and liabilities subject to MNA or similar agreements | | | 100,788 | | | | (712,723 | ) |
| | | | | | | | |
| | | | | | | | | | | | | | | | | | | | |
| Value Opportunities Fund | |
Counterparty | | Gross Amount of
Assets ($) | | | Financial
Instruments
and Derivatives
Available for
Offset ($) | | | Non-cash
Collateral
Received ($)* | | | Cash
Collateral
Received ($)* | | | Net Amount of
Assets ($) | |
Goldman Sachs & Co. | | | 35,550 | | | | — | | | | — | | | | — | | | | 35,550 | |
RBS Greenwich Capital | | | 65,238 | | | | (65,238 | ) | | | — | | | | — | | | | — | |
| | | | | | | | | | | | | | | | | | | | |
Total | | | 100,788 | | | | (65,238 | ) | | | — | | | | — | | | | 35,550 | |
| | | | | | | | | | | | | | | | | | | | |
| | | | | | | | | | | | | | | | | | | | |
Counterparty | | Gross Amount of
Liabilities ($) | | | Financial
Instruments
and Derivatives
Available for
Offset ($) | | | Non-cash
Collateral
Pledged ($)* | | | Cash
Collateral
Pledged ($)* | | | Net Amount of
Liabilities ($) | |
Barclays | | | (29,193 | ) | | | — | | | | — | | | | — | | | | (29,193 | ) |
BNP Paribas Securities Services | | | (21,739 | ) | | | — | | | | — | | | | — | | | | (21,739 | ) |
Deutsche Bank Securities, Inc. | | | (15,959 | ) | | | — | | | | — | | | | — | | | | (15,959 | ) |
JP Morgan Chase & Co. | | | (16,068 | ) | | | — | | | | — | | | | — | | | | (16,068 | ) |
Morgan Stanley | | | (932 | ) | | | — | | | | — | | | | — | | | | (932 | ) |
National Australia Bank Limited | | | (292,012 | ) | | | — | | | | — | | | | — | | | | (292,012 | ) |
RBS Greenwich Capital | | | (336,820 | ) | | | 65,238 | | | | — | | | | — | | | | (271,582 | ) |
| | | | | | | | | | | | | | | | | | | | |
Total | | | (712,723 | ) | | | 65,238 | | | | — | | | | — | | | | (647,485 | ) |
| | | | | | | | | | | | | | | | | | | | |
| | * | In some instances, the actual collateral received and/or pledged may be more than the amount shown. |
Certain derivatives held by Capital Appreciation Fund, as of April 30, 2015, are not subject to a master netting arrangement and are excluded from the table above.
Certain Funds may be exposed to counterparty risk, or the risk that an institution or other entity with which the Funds have unsettled or open transactions will default.
Credit risk depends largely on the perceived financial health of bond issuers. In general, the credit rating is inversely related to the credit risk of the issuer. Higher rated bonds generally are deemed to have less credit risk, while lower or unrated bonds are deemed to have higher risk of default. The share price, yield and total return of a fund that holds securities with higher credit risk may be more volatile than those of a fund that holds bonds with lower credit risk. Similar to credit risk, a Fund may be exposed to counterparty risk, or the risk that an institution or other entity with which a Fund has unsettled or open transactions will default.
Each Fund’s investments expose the Fund to various risks which may include, but are not limited to, interest rate, prepayment, extension, foreign currency and equity risks. Interest rate risk is the risk that fixed income securities will decline in value because of changes in interest rates. As nominal interest rates rise, the values of certain fixed income securities held by the Funds are likely to decrease. A nominal interest rate can be described as the sum of a real interest rate and an expected inflation rate. Fixed income securities with longer durations tend to be more sensitive to changes in interest rates, usually making them more volatile than securities with shorter durations. Duration is useful primarily as a measure of the sensitivity of a fixed income security’s market price to interest rate (i.e., yield) movements. Rising interest rates may cause prepayments to occur at a slower than expected rate, thereby effectively lengthening the maturity of the security and making the security more sensitive to interest rate changes. Prepayment and extension risk are major risks of mortgage backed securities and certain asset backed securities. For certain asset backed securities, the actual maturity may be less than the stated maturity shown in the Schedule of Investments, if applicable. As a result, the timing of income recognition relating to these securities may vary based upon the actual maturity.
|
| Hartford Funds – Domestic Equity Funds |
Notes to Financial Statements – (continued)
April 30, 2015
If a Fund invests directly in foreign currencies or in securities that trade in, and receive revenues in, foreign currencies, or in derivatives that provide exposure to foreign currencies, it will be subject to the risk that those currencies will decline in value relative to the base currency (U.S. dollars) of the Fund, or, in the case of hedging positions, that the Fund’s base currency will decline in value relative to the currency being hedged. Currency rates in foreign countries may fluctuate significantly over short periods of time for a number of reasons, including changes in interest rates, intervention (or the failure to intervene) by U.S. or foreign governments, central banks or supranational entities, such as the International Monetary Fund, or by the imposition of currency controls or other political developments in the United States or abroad. As a result, the Fund’s investments in foreign currency denominated securities may reduce the returns, if applicable, of the Fund. The market values of equity securities, such as common stocks and preferred stocks, or equity related investments, such as futures and options, may decline due to general market conditions which are not specifically related to a particular company, such as real or perceived adverse economic conditions, changes in the general outlook for corporate earnings, changes in interest or currency rates or adverse investor sentiment generally. The market value of equity securities may also decline due to factors which affect a particular industry or industries, such as labor shortages or increased production costs and competitive conditions within an industry. Equity securities and equity related investments generally have greater market price volatility than fixed income securities.
| | a) | Each Fund intends to continue to qualify as a Regulated Investment Company (“RIC”) under Subchapter M of the Internal Revenue Code (“IRC”) by distributing substantially all of its taxable net investment income and net realized capital gains to its shareholders. Each Fund has distributed substantially all of its income and capital gains in prior years, if applicable, and intends to distribute substantially all of its income and capital gains during the calendar year ending December 31, 2015. Accordingly, no provision for federal income or excise taxes has been made in the accompanying financial statements. Distributions from short-term capital gains are treated as ordinary income distributions for federal income tax purposes. |
| | b) | Net Investment Income (Loss), Net Realized Gains (Losses) and Distributions – Net investment income (loss) and net realized gains (losses) may differ for financial statement and tax purposes primarily because of losses deferred due to wash sale adjustments, foreign currency gains and losses, adjustments related to Passive Foreign Investment Companies (“PFICs”), Real Estate Investment Trusts (“REITs”), RICs, certain derivatives and partnerships. The character of distributions made during the year from net investment income or net realized gains may differ from their ultimate characterization for federal income tax purposes. Also, due to the timing of dividend distributions, the fiscal year in which amounts are distributed may differ from the year that the income or realized gains (losses) were recorded by the Funds. |
| | c) | Distributions and Components of Distributable Earnings – The tax character of distributions paid by each Fund for the years ended October 31, 2014 and October 31, 2013 are as follows (as adjusted for dividends payable, if applicable): |
| | | | | | | | | | | | | | | | |
Fund | | Ordinary
Income
for the
Year Ended
October 31, 2014 | | | Long-Term
Capital Gains
for the
Year Ended
October 31, 2014(1) | | | Ordinary
Income
for the
Year Ended
October 31, 2013 | | | Long-Term
Capital Gains
for the
Year Ended
October 31, 2013(1) | |
Capital Appreciation Fund | | $ | 35,205,562 | | | $ | 489,231,763 | | | $ | 82,638,906 | | | $ | — | |
Core Equity Fund | | $ | 340,114 | | | $ | — | | | $ | 919,901 | | | $ | — | |
Dividend and Growth Fund | | $ | 151,445,736 | | | $ | 455,772,221 | | | $ | 115,132,105 | | | $ | 109,603,028 | |
Equity Income Fund | | $ | 70,154,139 | | | $ | 94,333,683 | | | $ | 44,364,421 | | | $ | 26,528,316 | |
Growth Opportunities Fund | | $ | — | | | $ | 103,085,097 | | | $ | — | | | $ | — | |
Healthcare Fund | | $ | — | | | $ | — | | | $ | — | | | $ | — | |
MidCap Fund | | $ | 35,485,555 | | | $ | 253,730,424 | | | $ | 4,331,069 | | | $ | 185,811,232 | |
MidCap Value Fund | | $ | — | | | $ | 40,025,116 | | | $ | 3,467,610 | | | $ | 465,392 | |
Small Company Fund | | $ | 33,923,886 | | | $ | 58,522,150 | | | $ | — | | | $ | 44,886,137 | |
Small/Mid Cap Equity Fund | | $ | 4,287,299 | | | $ | 5,680,937 | | | $ | 854,994 | | | $ | — | |
SmallCap Growth Fund | | $ | 11,810,397 | | | $ | 23,986,308 | | | $ | — | | | $ | — | |
Value Opportunities Fund | | $ | 665,516 | | | $ | — | | | $ | 1,625,003 | | | $ | — | |
| | (1) | The Funds designate these distributions as long-term capital gain dividends pursuant to IRC Sec 852(b)(3)(c). |
|
| Hartford Funds – Domestic Equity Funds |
Notes to Financial Statements – (continued)
April 30, 2015
As of October 31, 2014, the components of distributable earnings (deficit) for each Fund on a tax basis are as follows:
| | | | | | | | | | | | | | | | | | | | |
| | | Undistributed
Ordinary
Income | | | Undistributed
Long-Term
Capital Gain | | | Accumulated
Capital and
Other
Losses | | | Unrealized
Appreciation
(Depreciation)
on
Investments(2) | | | Total
Accumulated
Earnings
(Deficit) | |
Capital Appreciation Fund | | $ | 815,315,618 | | | | 2,237,414,555 | | | $ | — | | | | 846,271,362 | | | | 3,899,001,535 | |
Core Equity Fund | | $ | 90,262 | | | | 2,104,992 | | | $ | — | | | | 31,299,993 | | | | 33,495,247 | |
Dividend and Growth Fund | | $ | 56,737,509 | | | | 629,491,691 | | | $ | (32,946,759 | )(1) | | | 2,341,791,317 | | | | 2,995,073,758 | |
Equity Income Fund | | $ | 15,727,003 | | | | 91,942,841 | | | $ | — | | | | 800,085,009 | | | | 907,754,853 | |
Growth Opportunities Fund | | $ | 160,898,945 | | | | 503,358,741 | | | $ | — | | | | 421,421,354 | | | | 1,085,679,040 | |
Healthcare Fund | | $ | — | | | | 71,459,607 | | | $ | (3,935,656 | )(1) | | | 323,704,071 | | | | 391,228,022 | |
MidCap Fund | | $ | 51,668,231 | | | | 372,647,986 | | | $ | — | | | | 1,089,501,490 | | | | 1,513,817,707 | |
MidCap Value Fund | | $ | 5,050,090 | | | | 50,443,794 | | | $ | (1,837,818 | )(1) | | | 85,460,065 | | | | 139,116,131 | |
Small Company Fund | | $ | 31,734,983 | | | | 113,490,762 | | | $ | — | | | | 135,025,802 | | | | 280,251,547 | |
Small/Mid Cap Equity Fund | | $ | 765,225 | | | | 6,427,770 | | | $ | (5,583,511 | )(1) | | | 8,397,324 | | | | 10,006,808 | |
SmallCap Growth Fund | | $ | 1,325,751 | | | | 31,590,831 | | | $ | — | | | | 98,043,681 | | | | 130,960,263 | |
Value Opportunities Fund | | $ | 2,221,612 | | | | 23,291,387 | | | $ | (6,147,616 | )(1) | | | 15,941,772 | | | | 35,307,155 | |
| | (1) | The Fund has capital loss carryforwards that are identified in the Capital Loss Carryforward note that follows. |
| | (2) | Differences between book-basis and tax-basis unrealized appreciation (depreciation) may be attributable to the losses deferred due to wash sale adjustments, foreign currency gains and losses, adjustments related to PFICs, REITs, RICs, certain derivatives and partnerships. |
| | d) | Reclassification of Capital Accounts – The Funds may record reclassifications in their capital accounts. These reclassifications have no impact on the total net assets of the Funds. The reclassifications are a result of permanent differences between U.S. GAAP and tax accounting for such items as foreign currency, PFICs, expiration or utilization of capital loss carryforwards or net operating losses. Adjustments are made to reflect the impact these items have on current and future distributions to shareholders. Therefore, the source of the Funds’ distributions may be shown in the accompanying Statements of Changes in Net Assets as from undistributed net investment income, from accumulated net realized gains on investments or from capital depending on the type of book and tax differences that exist. For the year ended October 31, 2014, the Funds recorded reclassifications to increase (decrease) the accounts listed below: |
| | | | | | | | | | | | |
| | | Capital Stock and
Paid-in-Capital | | | Undistributed Net
Investment Income
(Loss) | | | Accumulated Net
Realized Gain
(Loss) | |
Capital Appreciation Fund | | | — | | | | (6,232,616 | ) | | | 6,232,616 | |
Core Equity Fund | | | — | | | | 2,611 | | | | (2,611 | ) |
Dividend and Growth Fund | | | — | | | | (180,938 | ) | | | 180,938 | |
Equity Income Fund | | | — | | | | (98,934 | ) | | | 98,934 | |
Growth Opportunities Fund | | | (396 | ) | | | 13,740,959 | | | | (13,740,563 | ) |
Healthcare Fund | | | (2,117,503 | ) | | | 1,957,614 | | | | 159,889 | |
MidCap Fund | | | 82,950 | | | | 19,613,657 | | | | (19,696,607 | ) |
MidCap Value Fund | | | — | | | | (201,923 | ) | | | 201,923 | |
Small Company Fund | | | — | | | | 7,812,001 | | | | (7,812,001 | ) |
Small/Mid Cap Equity Fund | | | — | | | | 25,061 | | | | (25,061 | ) |
SmallCap Growth Fund | | | — | | | | 2,586,828 | | | | (2,586,828 | ) |
Value Opportunities Fund | | | — | | | | (91,119 | ) | | | 91,119 | |
| | e) | Capital Loss Carryforward – On December 22, 2010, the Regulated Investment Company Modernization Act of 2010 (the “Act”) was enacted, which made changes to the capital loss carryforward rules. The changes are effective for taxable years beginning after the date of enactment. Under the Act, funds are permitted to carry forward capital losses for an unlimited period. However, any losses incurred during those future taxable years will be required to be utilized prior to the losses incurred in pre-enactment taxable years, which carry an expiration date. As a result of this ordering rule, pre-enactment capital loss carryforwards may be more likely to expire |
|
| Hartford Funds – Domestic Equity Funds |
Notes to Financial Statements – (continued)
April 30, 2015
| | unused. Additionally, post-enactment capital loss carryforwards retain their character as either short-term or long-term capital losses rather than being considered all short-term as permitted under prior regulation. |
At October 31, 2014 (tax year end), the capital loss carryforwards for U.S. federal income tax purposes were as follows:
| | | | | | | | | | | | |
| | | Year of Expiration | |
Fund | | 2015 | | | 2016 | | | 2017 | |
Capital Appreciation Fund | | $ | — | | | $ | — | | | $ | — | |
Core Equity Fund | | $ | — | | | $ | — | | | $ | — | |
Dividend and Growth Fund | | $ | 13,936,043 | | | $ | 19,010,716 | | | $ | — | |
Equity Income Fund | | $ | — | | | $ | — | | | $ | — | |
Growth Opportunities Fund | | $ | — | | | $ | — | | | $ | — | |
Healthcare Fund | | $ | — | | | $ | — | | | $ | — | |
MidCap Fund | | $ | — | | | $ | — | | | $ | — | |
MidCap Value Fund | | $ | 918,909 | | | $ | 918,909 | | | $ | — | |
Small Company Fund | | $ | — | | | $ | — | | | $ | — | |
Small/Mid Cap Equity Fund | | $ | — | | | $ | — | | | $ | 5,583,511 | |
SmallCap Growth Fund | | $ | — | | | $ | — | | | $ | — | |
Value Opportunities Fund | | $ | — | | | $ | — | | | $ | 6,147,616 | |
As a result of mergers involving the Dividend and Growth Fund, MidCap Value Fund, Small/Mid Cap Equity Fund and Value Opportunities Fund, certain provisions in the IRC may limit the future utilization of capital losses. During the year ended October 31, 2014, the Core Equity Fund, Dividend and Growth Fund, Healthcare Fund, MidCap Value Fund, Small/Mid Cap Equity Fund and Value Opportunities Fund utilized $23,914,523, $19,010,716, $12,171,885, $918,908, $1,861,170, $28,343,797 of prior year capital loss carryforwards.
| | f) | Accounting for Uncertainty in Income Taxes – Under provisions set forth by U.S. GAAP, the Adviser reviews each Fund’s tax positions for all open tax years. As of October 31, 2014, the Adviser had reviewed the open tax years and concluded that there was no reason to record a liability for net unrecognized tax benefits relating to uncertain income tax positions. Each Fund files U.S. tax returns. Although the statute of limitations for examining a Fund’s U.S. tax returns remains open for 3 years, no examination is currently in progress. No Fund is aware of any tax positions for which it is reasonably possible that the total amounts of unrecognized tax benefits will significantly change in the next twelve months. |
| | a) | Investment Management Agreement – Hartford Funds Management Company, LLC (“HFMC”) serves as each Fund’s investment manager pursuant to an Investment Management Agreement with each Company. HFMC is an indirect subsidiary of The Hartford Financial Services Group, Inc. (“The Hartford”). The investment manager has overall investment supervisory responsibility for the Fund. In addition, the investment manager provides administrative personnel, services, equipment, facilities and office space for proper operation of each Fund. HFMC has contracted with Wellington Management Company LLP (“Wellington Management”) under a sub-advisory agreement for the provision of day-to-day investment management services to each Fund in accordance with each Fund’s investment objective and policies. Each Fund pays a fee to the investment manager, a portion of which may be used to compensate Wellington Management. |
The schedule below reflects the rates of compensation paid to the investment manager for investment management services rendered as of April 30, 2015; the rates are accrued daily and paid monthly based on each Fund’s average daily net assets, at the following annual rates:
| | |
| | | Management Fee Rates |
Capital Appreciation Fund | | 0.8000% on first $500 million and; |
| | 0.7000% on next $500 million and; |
| | 0.6500% on next $4 billion and; |
| | 0.6475% on next $5 billion and; |
| | 0.6450% over $10 billion |
|
| Hartford Funds – Domestic Equity Funds |
Notes to Financial Statements – (continued)
April 30, 2015
| | |
| | | Management Fee Rates |
Core Equity Fund | | 0.4500% on first $500 million and; |
| | 0.3500% on next $500 million and; |
| | 0.3300% on next $1.5 billion and; |
| | 0.3250% on next $2.5 billion and; |
| | 0.3225% over $5 billion |
| |
Dividend and Growth Fund | | 0.7500% on first $500 million and; |
| | 0.6500% on next $500 million and; |
| | 0.6000% on next $1.5 billion and; |
| | 0.5950% on next $2.5 billion and; |
| | 0.5900% on next $5 billion and; |
| | 0.5850% over $10 billion |
| |
Equity Income Fund | | 0.7500% on first $250 million and; |
| | 0.7000% on next $250 million and; |
| | 0.6500% on next $500 million and; |
| | 0.6000% on next $1.5 billion and; |
| | 0.5900% on next $2.5 billion and; |
| | 0.5875% over $5 billion |
| |
Growth Opportunities Fund | | 0.8000% on first $250 million and; |
| | 0.7000% on next $4.75 billion and; |
| | 0.6975% on next $5 billion and; |
| | 0.6950% over $10 billion |
| |
Healthcare Fund | | 0.9000% on first $500 million and; |
| | 0.8500% on next $500 million and; |
| | 0.8000% on next $4 billion and; |
| | 0.7975% on next $5 billion and; |
| | 0.7950% over $10 billion |
| |
Midcap Fund | | 0.8500% on first $500 million and; |
| | 0.7500% on next $500 million and; |
| | 0.7000% on next $4 billion and; |
| | 0.6975% on next $5 billion and; |
| | 0.6950% over $10 billion |
| |
MidCap Value Fund | | 0.7500% on first $500 million and; |
| | 0.6500% on next $500 million and; |
| | 0.6000% on next $1.5 billion and; |
| | 0.5950% on next $2.5 billion and; |
| | 0.5900% on next $5 billion and; |
| | 0.5850% over $10 billion |
| |
Small Company Fund | | 0.8500% on first $250 million and; |
| | 0.8000% on next $250 million and; |
| | 0.7500% on next $500 million and; |
| | 0.7000% on next $500 million and; |
| | 0.6500% on next $3.5 billion and; |
| | 0.6300% on next $5 billion and; |
| | 0.6200% over $10 billion |
| |
Small/Mid Cap Equity Fund | | 0.7500% on first $500 million and; |
| | 0.7000% on next $500 million and; |
| | 0.6500% on next $2 billion and; |
| | 0.6400% on next $2 billion and; |
| | 0.6300% on next $5 billion and; |
| | 0.6200% over $10 billion |
|
| Hartford Funds – Domestic Equity Funds |
Notes to Financial Statements – (continued)
April 30, 2015
| | |
| | | Management Fee Rates |
SmallCap Growth Fund | | 0.9000% on first $100 million and; |
| | 0.8000% on next $150 million and; |
| | 0.7000% on next $250 million and; |
| | 0.6500% on next $4.5 billion and; |
| | 0.6300% on next $5 billion and; |
| | 0.6200% over $10 billion |
| |
Value Opportunities Fund | | 0.7000% on first $500 million and; |
| | 0.6000% on next $500 million and; |
| | 0.5900% on next $1.5 billion and; |
| | 0.5850% on next $2.5 billion and; |
| | 0.5800% on next $5 billion and; |
| | 0.5750% on over $10 billion |
Prior to March 1, 2015, the Core Equity Fund paid the following rates to the investment manager for investment management services rendered:
| | |
| | | Management Fee Rates |
Core Equity Fund | | 0.7500% on first $500 million and; |
| | 0.6750% on next $500 million and; |
| | 0.6250% on next $4 billion and; |
| | 0.6225% on next $5 billion and; |
| | 0.6200% over $10 billion |
| | b) | Accounting Services Agreement – Pursuant to the Fund Accounting Agreement between HFMC and each Company, on behalf of each Fund, HFMC provides accounting services to each Fund and receives monthly compensation based on each Fund’s average daily net assets at the rates set forth below. Each Fund’s accounting services fees are accrued daily and paid monthly. |
| | |
| | | Accounting Services Fee Rates |
Capital Appreciation Fund | | 0.018% on first $5 billion and; |
| | 0.014% on next $5 billion and; |
| | 0.010% over $10 billion |
| |
Core Equity Fund | | 0.016% on first $5 billion and; |
| | 0.013% on next $5 billion and; |
| | 0.010% over $10 billion |
| |
Dividend and Growth Fund | | 0.014% on first $5 billion and; |
| | 0.012% on next $5 billion and; |
| | 0.010% over $10 billion |
| |
Equity Income Fund | | 0.012% on first $5 billion and; |
| | 0.010% over $5 billion |
| |
Growth Opportunities Fund | | 0.012% on first $5 billion and; |
| | 0.010% over $5 billion |
| |
Healthcare Fund | | 0.014% on first $5 billion and; |
| | 0.012% on next $5 billion and; |
| | 0.010% over $10 billion |
| |
Midcap Fund | | 0.012% on first $5 billion and; |
| | 0.010% over $5 billion |
| |
MidCap Value Fund | | 0.014% on first $5 billion and; |
| | 0.012% on next $5 billion and; |
| | 0.010% over $10 billion |
|
| Hartford Funds – Domestic Equity Funds |
Notes to Financial Statements – (continued)
April 30, 2015
| | |
| | | Accounting Services Fee Rates |
Small Company Fund | | 0.014% on first $5 billion and; |
| | 0.012% on next $5 billion and; |
| | 0.010% over $10 billion |
| |
Small/Mid Cap Equity Fund | | 0.014% on first $5 billion and; |
| | 0.012% on next $5 billion and; |
| | 0.010% over $10 billion |
| |
SmallCap Growth Fund | | 0.016% on first $5 billion and; |
| | 0.013% on next $5 billion and; |
| | 0.010% over $10 billion |
| |
Value Opportunities Fund | | 0.014% on first $5 billion and; |
| | 0.012% on next $5 billion and; |
| | 0.010% over $10 billion |
Effective February 28, 2015, HFMC has delegated certain accounting and administrative services functions to State Street Bank and Trust Company (“State Street”). The costs and expenses of such delegation will be borne by HFMC, not by the Funds, and HFMC will compensate State Street for its services out of its own resources.
| | c) | Operating Expenses – Allocable expenses incurred by each Company are allocated to each Fund and allocated to classes within each Fund in proportion to the average daily net assets of each Fund and each class, except where allocation of certain expenses is more fairly made directly to each Fund or to specific classes within a Fund. As of April 30, 2015, HFMC contractually limited the total operating expenses of each Fund, exclusive of taxes, interest expense, brokerage commissions, acquired fund fees and expenses and extraordinary expenses, through February 29, 2016 as follows: |
| | | | | | | | | | | | | | | | | | | | | | | | | | | | | | | | | | | | |
| | | Expense Limit as a Percentage of Average Daily Net Assets | |
Fund | | Class A | | | Class B | | | Class C | | | Class I | | | Class R3 | | | Class R4 | | | Class R5 | | | Class R6 | | | Class Y | |
Capital Appreciation Fund | | | 1.29 | % | | | NA | | | | NA | | | | 1.04 | % | | | 1.40 | % | | | 1.10 | % | | | 0.80 | % | | | 0.75 | % | | | NA | |
Core Equity Fund | | | 0.79 | % | | | 1.54 | % | | | 1.54 | % | | | 0.54 | % | | | 1.09 | % | | | 0.79 | % | | | 0.49 | % | | | 0.45 | % | | | 0.49 | % |
Dividend and Growth Fund | | | 1.25 | % | | | NA | | | | NA | | | | 1.00 | % | | | 1.35 | % | | | 1.05 | % | | | 0.75 | % | | | 0.70 | % | | | NA | |
Equity Income Fund | | | 1.25 | % | | | 2.00 | %* | | | 2.00 | % | | | 1.00 | % | | | 1.50 | % | | | 1.20 | % | | | 0.90 | % | | | 0.85 | % | | | 0.85 | % |
Growth Opportunities Fund | | | 1.36 | % | | | 2.11 | % | | | 2.11 | % | | | 1.11 | % | | | 1.45 | % | | | 1.15 | % | | | 0.85 | % | | | 0.85 | % | | | 0.85 | % |
Healthcare Fund | | | 1.60 | % | | | 2.35 | % | | | 2.35 | % | | | 1.35 | % | | | 1.65 | % | | | 1.35 | % | | | 1.05 | % | | | NA | | | | 1.00 | % |
MidCap Fund | | | 1.37 | % | | | NA | | | | NA | | | | 1.12 | % | | | 1.50 | % | | | 1.20 | % | | | 0.90 | % | | | 0.85 | % | | | NA | |
MidCap Value Fund | | | 1.35 | % | | | 2.10 | % | | | 2.10 | % | | | 1.10 | % | | | 1.55 | % | | | 1.25 | % | | | 0.95 | % | | | NA | | | | 0.90 | % |
Small Company Fund | | | 1.40 | % | | | 2.15 | % | | | 2.15 | % | | | 1.15 | % | | | 1.55 | % | | | 1.25 | % | | | 0.95 | % | | | 0.90 | % | | | 0.90 | % |
Small/Mid Cap Equity Fund | | | 1.30 | % | | | 2.05 | % | | | 2.05 | % | | | 1.05 | % | | | 1.50 | % | | | 1.20 | % | | | 0.90 | % | | | NA | | | | 0.85 | % |
SmallCap Growth Fund | | | 1.40 | % | | | 2.15 | % | | | 2.15 | % | | | 1.15 | % | | | 1.60 | % | | | 1.30 | % | | | 1.00 | % | | | 0.95 | % | | | 0.95 | % |
Value Opportunities Fund | | | 1.35 | % | | | 2.10 | % | | | 2.10 | % | | | 1.10 | % | | | 1.55 | % | | | 1.25 | % | | | 0.95 | % | | | NA | | | | 0.90 | % |
| | * | The reduction in amounts charged in connection with the Equity Income Fund’s Class B Distribution and Service Plan (12b-1) fees that took effect July 1, 2013, in order to comply with applicable FINRA rules, caused the limit on net operating expenses attributable to the Equity Income Fund’s Class B shares to be, effectively, 1.25%. |
From November 1, 2014 through February 28, 2015, the investment manager contractually limited the total operating expenses of the following funds, exclusive of taxes, interest expense, brokerage commissions, acquired fund fees and expenses and extraordinary expenses as follows:
| | | | | | | | | | | | | | | | | | | | | | | | | | | | | | | | | | | | |
| | | Expense Limit as a Percentage of Average Daily Net Assets | |
Fund | | Class A | | | Class B | | | Class C | | | Class I | | | Class R3 | | | Class R4 | | | Class R5 | | | Class R6 | | | Class Y | |
Core Equity Fund | | | 1.35 | % | | | 2.10 | % | | | 2.10 | % | | | NA | | | | 1.50 | % | | | 1.20 | % | | | 0.90 | % | | | NA | | | | 0.85 | % |
Growth Opportunities Fund | | | 1.19 | % | | | 2.05 | % | | | 2.05 | % | | | 0.92 | % | | | 1.45 | % | | | 1.15 | % | | | 0.85 | % | | | NA | | | | 0.85 | % |
Value Opportunities Fund | | | 1.22 | % | | | 1.92 | % | | | 1.92 | % | | | 1.00 | % | | | 1.45 | % | | | 1.15 | % | | | 0.85 | % | | | NA | | | | 0.80 | % |
|
| Hartford Funds – Domestic Equity Funds |
Notes to Financial Statements – (continued)
April 30, 2015
| | d) | Fees Paid Indirectly – Certain Funds have entered into agreements with State Street Global Markets, LLC and Russell Implementation Services, Inc. to partially recapture non-discounted trade commissions. Such rebates are used to pay a portion of the Funds’ expenses. In addition, the Funds’ custodian bank has agreed to reduce its fees when a Fund maintains cash on deposit in a non-interest-bearing custody account. For the period ended April 30, 2015, these amounts, if any, are included in the Statements of Operations. |
The ratio of expenses to average net assets in the accompanying financial highlights excludes the reduction in expenses related to fees paid indirectly. The annualized expense ratio after waivers reflecting the reduction for fees paid indirectly for the period is as follows:
| | | | | | | | | | | | | | | | | | | | | | | | | | | | | | | | | | | | |
| | | Class A | | | Class B | | | Class C | | | Class I | | | Class R3 | | | Class R4 | | | Class R5 | | | Class R6 | | | Class Y | |
Capital Appreciation Fund | | | 1.07 | % | | | 1.95 | % | | | 1.80 | % | | | 0.80 | % | | | 1.40 | % | | | 1.09 | % | | | 0.79 | % | | | 0.71 | % | | | 0.69 | % |
Core Equity Fund | | | 1.09 | % | | | 1.91 | % | | | 1.79 | % | | | 0.54 | % | | | 1.35 | % | | | 1.01 | % | | | 0.54 | % | | | 0.45 | % | | | 0.64 | % |
Dividend and Growth Fund | | | 1.01 | % | | | 1.94 | % | | | 1.75 | % | | | 0.80 | % | | | 1.35 | % | | | 1.04 | % | | | 0.74 | % | | | 0.64 | % | | | 0.64 | % |
Equity Income Fund | | | 1.02 | % | | | 1.15 | % | | | 1.74 | % | | | 0.77 | % | | | 1.36 | % | | | 1.06 | % | | | 0.76 | % | | | 0.68 | % | | | 0.66 | % |
Growth Opportunities Fund | | | 1.11 | % | | | 2.03 | % | | | 1.85 | % | | | 0.90 | % | | | 1.45 | % | | | 1.14 | % | | | 0.84 | % | | | 0.75 | % | | | 0.74 | % |
Healthcare Fund | | | 1.27 | % | | | 2.15 | % | | | 2.00 | % | | | 1.01 | % | | | 1.61 | % | | | 1.31 | % | | | 1.02 | % | | | — | | | | 0.91 | % |
MidCap Fund | | | 1.13 | % | | | 2.03 | % | | | 1.86 | % | | | 0.90 | % | | | 1.46 | % | | | 1.16 | % | | | 0.85 | % | | | 0.76 | % | | | 0.75 | % |
MidCap Value Fund | | | 1.24 | % | | | 2.10 | % | | | 1.96 | % | | | 0.94 | % | | | 1.52 | % | | | 1.21 | % | | | 0.92 | % | | | — | | | | 0.81 | % |
Small Company Fund | | | 1.34 | % | | | 2.13 | % | | | 2.02 | % | | | 1.12 | % | | | 1.53 | % | | | 1.24 | % | | | 0.95 | % | | | 0.84 | % | | | 0.84 | % |
Small/Mid Cap Equity Fund | | | 1.30 | % | | | 2.05 | % | | | 2.05 | % | | | 0.93 | % | | | 1.50 | % | | | 1.20 | % | | | 0.90 | % | | | — | | | | 0.85 | % |
SmallCap Growth Fund | | | 1.20 | % | | | 2.06 | % | | | 1.90 | % | | | 0.90 | % | | | 1.48 | % | | | 1.16 | % | | | 0.86 | % | | | 0.76 | % | | | 0.76 | % |
Value Opportunities Fund | | | 1.21 | % | | | 1.97 | % | | | 1.92 | % | | | 0.92 | % | | | 1.47 | % | | | 1.16 | % | | | 0.87 | % | | | — | | | | 0.79 | % |
| | e) | Distribution and Service Plan for Class A, B, C, R3 and R4 Shares – Hartford Funds Distributors, LLC (“HFD”), an indirect wholly owned subsidiary of The Hartford, is the principal underwriter and distributor of each Fund. HFD is engaged in distribution activities, which include marketing and distribution of shares through broker/dealers, financing distribution costs and maintaining financial books and records. For the six-month period ended April 30, 2015, HFD received front-end sales charges and contingent deferred sales charges for each Fund as follows: |
| | | | | | | | |
Fund | | Front-end
Sales Charges | | | Contingent Deferred
Sales Charges | |
Capital Appreciation Fund | | $ | 3,110,093 | | | $ | 44,705 | |
Core Equity Fund | | | 352,940 | | | | 941 | |
Dividend and Growth Fund | | | 3,685,623 | | | | 30,363 | |
Equity Income Fund | | | 2,588,820 | | | | 52,645 | |
Growth Opportunities Fund | | | 1,819,922 | | | | 12,609 | |
Healthcare Fund | | | 3,622,147 | | | | 12,387 | |
MidCap Fund | | | 2,406,752 | | | | 20,594 | |
MidCap Value Fund | | | 339,493 | | | | 1,794 | |
Small Company Fund | | | 430,930 | | | | 801 | |
Small/Mid Cap Equity Fund | | | 41,812 | | | | 736 | |
SmallCap Growth Fund | | | 190,516 | | | | 7,348 | |
Value Opportunities Fund | | | 182,404 | | | | 50,057 | |
Each Fund has adopted a Distribution and Service Plan in accordance with Rule 12b-1 of the 1940 Act to compensate the distributor (HFD) for activities intended to result in the sale and distribution of Class A, B, C, R3 and R4 shares and for providing services for shareholders. The Rule 12b-1 plan applicable to Class A shares of each Fund provides for payment of a Rule 12b-1 fee of 0.25% of average daily net assets. Some or all of the fee may be used for shareholder servicing expenses with the remainder used for distribution expenses. Under the Class B Plan, each Fund pays the distributor 1.00% of the average daily net assets of Class B shares that are outstanding for 8 years or less, 0.25% of which is a fee for services provided to existing shareholders with the remainder used for distribution expenses. Some or the entire Rule 12b-1 fee for Class B shares may be remitted to broker/dealers for
|
| Hartford Funds – Domestic Equity Funds |
Notes to Financial Statements – (continued)
April 30, 2015
distribution and/or shareholder account services. After eight years, Class B shares convert to Class A shares. Upon conversion to Class A shares, the Class A plan described above will apply to those shares. Under the Class C Plan, each Fund pays the distributor 1.00% of the average daily net assets of Class C shares outstanding, 0.25% of which is intended as a fee for services provided to existing shareholders with the remainder used for distribution expenses. For Class C shares, some or the entire fee may be remitted to broker/dealers for distribution and/or shareholder account services. Class R3 shares have a distribution fee of 0.50% of average daily net assets and Class R4 shares have a distribution fee of 0.25% of average daily net assets. For Class R3 and R4 shares, some or the entire fee may be remitted to broker/dealers for distribution and/or shareholder account services. Each Fund’s 12b-1 fees are accrued daily and paid monthly or at such other intervals as each Company’s Board of Directors may determine.
| | f) | Other Related Party Transactions – Certain officers of each Fund are directors and/or officers of HFMC and/or The Hartford or its subsidiaries. For the six-month period April 30, 2015, a portion of each Fund’s Chief Compliance Officer’s compensation was paid by all of the investment companies in the Hartford fund complex. Hartford Administrative Services Company (“HASCO”), an indirect subsidiary of The Hartford, provides transfer agent services to each Fund. HASCO has contractually agreed to reimburse any portion of the transfer agency fees over 0.30% of average daily net assets per fiscal year for each class. Effective December 1, 2014, pursuant to a sub-transfer agency agreement between HASCO and Boston Financial Data Services, Inc. (“BFDS”), HASCO delegated certain transfer agent, dividend disbursing agent and shareholder servicing agent functions to BFDS. HASCO is compensated based on average daily net assets, plus out of pocket expenses for providing such services, a portion of which may be used to compensate BFDS. The amount paid to HASCO and any related contractual reimbursement amounts, if applicable, can be found in the Statements of Operations. These fees are accrued daily and paid monthly. |
Administrative services fees are paid to HASCO for third-party recordkeeping services that are payable as a percentage of net assets in the amount of up to 0.20%, 0.15% and 0.10% for Classes R3, R4 and R5 shares, respectively. The total administrative services fees are shown on the Statements of Operations. These fees are accrued daily and paid monthly.
As of April 30, 2015, affiliates of The Hartford had ownership of shares in each Fund as follows:
Percentage of Class:
| | | | | | | | | | | | | | | | | | | | | | | | | | | | | | | | | | | | |
| | | Class A | | | Class B | | | Class C | | | Class I | | | Class R3 | | | Class R4 | | | Class R5 | | | Class R6 | | | Class Y | |
Capital Appreciation Fund | | | — | | | | — | | | | — | | | | — | | | | — | | | | — | | | | — | | | | 100 | % | | | — | |
Core Equity Fund | | | — | | | | — | | | | — | | | | 12 | % | | | — | | | | 7 | % | | | 1 | % | | | 100 | % | | | — | |
Dividend and Growth Fund | | | — | | | | — | | | | — | | | | — | | | | — | | | | — | | | | — | | | | 100 | % | | | — | |
Equity Income Fund | | | — | | | | — | | | | — | | | | — | | | | — | | | | — | | | | — | | | | — | | | | — | |
Growth Opportunities Fund | | | — | | | | — | | | | — | | | | — | | | | — | | | | — | | | | — | | | | — | | | | — | |
Healthcare Fund | | | — | | | | — | | | | — | | | | — | | | | — | | | | — | | | | — | | | | — | | | | — | |
MidCap Fund | | | — | | | | — | | | | — | | | | — | | | | — | | | | — | | | | — | | | | 1 | % | | | — | |
MidCap Value Fund | | | — | | | | — | | | | — | | | | — | | | | — | | | | — | | | | — | | | | — | | | | — | |
Small Company Fund | | | — | | | | — | | | | — | | | | — | | | | — | | | | — | | | | — | | | | 100 | % | | | — | |
Small/Mid Cap Equity Fund | | | — | | | | — | | | | — | | | | 100 | % | | | — | | | | 36 | % | | | 84 | % | | | — | | | | 19 | % |
SmallCap Growth Fund | | | — | | | | — | | | | — | | | | — | | | | — | | | | — | | | | — | | | | 100 | % | | | — | |
Value Opportunities Fund | | | — | | | | — | | | | — | | | | — | | | | — | | | | — | | | | 6 | % | | | — | | | | 12 | % |
|
| Hartford Funds – Domestic Equity Funds |
Notes to Financial Statements – (continued)
April 30, 2015
Percentage of Fund:
| | | | | | | | | | | | | | | | | | | | | | | | | | | | | | | | | | | | |
| | | Class A | | | Class B | | | Class C | | | Class I | | | Class R3 | | | Class R4 | | | Class R5 | | | Class R6 | | | Class Y | |
Capital Appreciation Fund | | | — | | | | — | | | | — | | | | — | | | | — | | | | — | | | | — | | | | — | %* | | | — | |
Core Equity Fund | | | — | | | | — | | | | — | | | | — | %* | | | — | | | | — | %* | | | — | %* | | | — | %* | | | — | |
Dividend and Growth Fund | | | — | | | | — | | | | — | | | | — | | | | — | | | | — | | | | — | | | | — | %* | | | — | |
Equity Income Fund | | | — | | | | — | | | | — | | | | — | | | | — | | | | — | | | | — | | | | — | | | | — | |
Growth Opportunities Fund | | | — | | | | — | | | | — | | | | — | | | | — | | | | — | | | | — | | | | — | | | | — | |
Healthcare Fund | | | — | | | | — | | | | — | | | | — | | | | — | | | | — | | | | — | | | | — | | | | — | |
MidCap Fund | | | — | | | | — | | | | — | | | | — | | | | — | | | | — | | | | — | | | | — | %* | | | — | |
MidCap Value Fund | | | — | | | | — | | | | — | | | | — | | | | — | | | | — | | | | — | | | | — | | | | — | |
Small Company Fund | | | — | | | | — | | | | — | | | | — | | | | — | | | | — | | | | — | | | | — | %* | | | — | |
Small/Mid Cap Equity Fund | | | — | | | | — | | | | — | | | | — | %* | | | — | | | | — | %* | | | — | %* | | | — | | | | — | %* |
SmallCap Growth Fund | | | — | | | | — | | | | — | | | | — | | | | — | | | | — | | | | — | | | | — | %* | | | — | |
Value Opportunities Fund | | | — | | | | — | | | | — | | | | — | | | | — | | | | — | | | | — | %* | | | — | | | | — | %* |
| | * | Percentage rounds to zero. |
As of April 30, 2015, the following Fund’s shares were owned in aggregate by affiliated fund of funds. Therefore, the following Funds may experience relatively large purchases or redemptions of its shares from these affiliated fund of funds. Affiliated fund of funds owned shares in the following Funds as follows:
| | | | |
Capital Appreciation Fund | | | 6 | % |
Dividend and Growth Fund | | | 9 | % |
MidCap Fund | | | 1 | % |
MidCap Value Fund | | | 16 | % |
Small Company Fund | | | 8 | % |
| 9. | Investment Transactions: |
For the six-month period ended April 30, 2015, the cost of purchases and proceeds from sales of investment securities (excluding short-term investments) were as follows:
| | | | | | | | |
| | | Cost of Purchases
Excluding U.S.
Government
Obligations | | | Sales Proceeds
Excluding U.S.
Government
Obligations | |
Capital Appreciation Fund | | $ | 4,692,395,522 | | | $ | 5,596,215,655 | |
Core Equity Fund | | $ | 99,208,717 | | | $ | 24,864,395 | |
Dividend and Growth Fund | | $ | 1,014,564,162 | | | $ | 1,153,479,893 | |
Equity Income Fund | | $ | 438,834,459 | | | $ | 495,053,152 | |
Growth Opportunities Fund | | $ | 2,156,779,901 | | | $ | 2,039,938,403 | |
Healthcare Fund | | $ | 392,520,587 | | | $ | 206,247,283 | |
MidCap Fund | | $ | 944,725,612 | | | $ | 753,396,356 | |
MidCap Value Fund | | $ | 77,690,522 | | | $ | 88,488,346 | |
Small Company Fund | | $ | 476,734,014 | | | $ | 471,933,266 | |
Small/Mid Cap Equity Fund | | $ | 31,905,495 | | | $ | 31,557,114 | |
SmallCap Growth Fund | | $ | 618,557,446 | | | $ | 373,332,449 | |
Value Opportunities Fund | | $ | 93,006,244 | | | $ | 125,226,142 | |
|
| Hartford Funds – Domestic Equity Funds |
Notes to Financial Statements – (continued)
April 30, 2015
| | | | | | | | |
| | | Cost of Purchases
Including U.S.
Government
Obligations | | | Sales Proceeds
Including U.S.
Government
Obligations | |
Capital Appreciation Fund | | $ | — | | | $ | — | |
Core Equity Fund | | $ | — | | | $ | — | |
Dividend and Growth Fund | | $ | — | | | $ | — | |
Equity Income Fund | | $ | — | | | $ | — | |
Growth Opportunities Fund | | $ | — | | | $ | — | |
Healthcare Fund | | $ | — | | | $ | — | |
MidCap Fund | | $ | — | | | $ | — | |
MidCap Value Fund | | $ | — | | | $ | — | |
Small Company Fund | | $ | — | | | $ | — | |
Small/Mid Cap Equity Fund | | $ | — | | | $ | — | |
SmallCap Growth Fund | | $ | — | | | $ | — | |
Value Opportunities Fund | | $ | — | | | $ | — | |
| | | | | | | | |
| | | Total Cost of
Purchases | | | Total Sales
Proceeds | |
Capital Appreciation Fund | | $ | 4,692,395,522 | | | $ | 5,596,215,655 | |
Core Equity Fund | | $ | 99,208,717 | | | $ | 24,864,395 | |
Dividend and Growth Fund | | $ | 1,014,564,162 | | | $ | 1,153,479,893 | |
Equity Income Fund | | $ | 438,834,459 | | | $ | 495,053,152 | |
Growth Opportunities Fund | | $ | 2,156,779,901 | | | $ | 2,039,938,403 | |
Healthcare Fund | | $ | 392,520,587 | | | $ | 206,247,283 | |
MidCap Fund | | $ | 944,725,612 | | | $ | 753,396,356 | |
MidCap Value Fund | | $ | 77,690,522 | | | $ | 88,488,346 | |
Small Company Fund | | $ | 476,734,014 | | | $ | 471,933,266 | |
Small/Mid Cap Equity Fund | | $ | 31,905,495 | | | $ | 31,557,114 | |
SmallCap Growth Fund | | $ | 618,557,446 | | | $ | 373,332,449 | |
Value Opportunities Fund | | $ | 93,006,244 | | | $ | 125,226,142 | |
For the six-month period ended April 30, 2015, the The Hartford MidCap Fund engaged in security transactions with other affiliated portfolios. These amounted to $750,98,511 in sales of investments, which are included above.
| 10. | Capital Share Transactions: |
The following information is for the six-month period ended April 30, 2015, and the year ended October 31, 2014:
Capital Appreciation Fund
| | | | | | | | | | | | | | | | |
| | | For the Six-Month Period
Ended April 30, 2015 | | | For the Year Ended
October 31, 2014 | |
| | | Shares | | | Amount | | | Shares | | | Amount | |
Class A | | | | | | | | | | | | | | | | |
Shares Sold | | | 5,094,183 | | | $ | 199,829,333 | | | | 8,625,883 | | | $ | 407,298,740 | |
Shares Issued for Reinvested Dividends | | | 39,450,052 | | | | 1,435,297,948 | | | | 5,419,060 | | | | 244,199,527 | |
Shares Redeemed | | | (13,109,554 | ) | | | (516,286,738 | ) | | | (23,671,036 | ) | | | (1,128,909,609 | ) |
Shares converted (from) Class B into Class A | | | 282,431 | | | | 11,097,278 | | | | 476,968 | | | | 22,595,607 | |
| | | | | | | | | | | | | | | | |
Net Increase (Decrease) | | | 31,717,112 | | | | 1,129,937,821 | | | | (9,149,125 | ) | | | (454,815,735 | ) |
| | | | | | | | | | | | | | | | |
|
| Hartford Funds – Domestic Equity Funds |
Notes to Financial Statements – (continued)
April 30, 2015
| | | | | | | | | | | | | | | | |
| | | For the Six-Month Period
Ended April 30, 2015 | | | For the Year Ended
October 31, 2014 | |
| | | Shares | | | Amount | | | Shares | | | Amount | |
Class B | | | | | | | | | | | | | | | | |
Shares Sold | | | 119,641 | | | $ | 3,610,581 | | | | 67,480 | | | $ | 2,714,689 | |
Shares Issued for Reinvested Dividends | | | 2,401,841 | | | | 71,262,614 | | | | 411,879 | | | | 16,080,318 | |
Shares Redeemed | | | (1,950,603 | ) | | | (63,341,576 | ) | | | (3,167,837 | ) | | | (127,305,402 | ) |
Shares converted (from) Class B into Class A | | | (343,719 | ) | | | (11,097,278 | ) | | | (476,968 | ) | | | (22,595,607 | ) |
| | | | | | | | | | | | | | | | |
Net Increase (Decrease) | | | 227,160 | | | | 434,341 | | | | (3,165,446 | ) | | | (131,106,002 | ) |
| | | | | | | | | | | | | | | | |
Class C | | | | | | | | | | | | | | | | |
Shares Sold | | | 3,377,773 | | | $ | 106,298,202 | | | | 2,904,865 | | | $ | 119,458,040 | |
Shares Issued for Reinvested Dividends | | | 16,774,258 | | | | 504,737,911 | | | | 1,984,107 | | | | 78,117,581 | |
Shares Redeemed | | | (6,013,783 | ) | | | (196,339,893 | ) | | | (6,659,166 | ) | | | (276,322,772 | ) |
| | | | | | | | | | | | | | | | |
Net Increase (Decrease) | | | 14,138,248 | | | | 414,696,220 | | | | (1,770,194 | ) | | | (78,747,151 | ) |
| | | | | | | | | | | | | | | | |
Class I | | | | | | | | | | | | | | | | |
Shares Sold | | | 4,705,104 | | | $ | 180,259,612 | | | | 10,755,217 | | | $ | 517,315,617 | |
Shares Issued for Reinvested Dividends | | | 8,069,183 | | | | 295,017,658 | | | | 942,914 | | | | 42,645,036 | |
Shares Redeemed | | | (9,463,954 | ) | | | (387,787,065 | ) | | | (11,342,911 | ) | | | (538,919,836 | ) |
| | | | | | | | | | | | | | | | |
Net Increase (Decrease) | | | 3,310,333 | | | | 87,490,205 | | | | 355,220 | | | | 21,040,817 | |
| | | | | | | | | | | | | | | | |
Class R3 | | | | | | | | | | | | | | | | |
Shares Sold | | | 190,595 | | | $ | 8,174,852 | | | | 330,192 | | | $ | 16,496,943 | |
Shares Issued for Reinvested Dividends | | | 817,356 | | | | 31,974,965 | | | | 105,440 | | | | 5,009,680 | |
Shares Redeemed | | | (427,536 | ) | | | (18,287,736 | ) | | | (590,090 | ) | | | (29,498,175 | ) |
| | | | | | | | | | | | | | | | |
Net Increase (Decrease) | | | 580,415 | | | | 21,862,081 | | | | (154,458 | ) | | | (7,991,552 | ) |
| | | | | | | | | | | | | | | | |
Class R4 | | | | | | | | | | | | | | | | |
Shares Sold | | | 392,673 | | | $ | 16,942,854 | | | | 845,553 | | | $ | 43,086,686 | |
Shares Issued for Reinvested Dividends | | | 1,055,199 | | | | 42,295,276 | | | | 144,022 | | | | 6,980,690 | |
Shares Redeemed | | | (702,456 | ) | | | (31,013,161 | ) | | | (1,141,910 | ) | | | (57,952,155 | ) |
| | | | | | | | | | | | | | | | |
Net Increase (Decrease) | | | 745,416 | | | | 28,224,969 | | | | (152,335 | ) | | | (7,884,779 | ) |
| | | | | | | | | | | | | | | | |
Class R5 | | | | | | | | | | | | | | | | |
Shares Sold | | | 62,874 | | | $ | 2,740,245 | | | | 126,977 | | | $ | 6,505,471 | |
Shares Issued for Reinvested Dividends | | | 325,251 | | | | 13,284,424 | | | | 107,339 | | | | 5,261,279 | |
Shares Redeemed | | | (218,306 | ) | | | (10,163,836 | ) | | | (2,001,544 | ) | | | (98,821,720 | ) |
| | | | | | | | | | | | | | | | |
Net Increase (Decrease) | | | 169,819 | | | | 5,860,833 | | | | (1,767,228 | ) | | | (87,054,970 | ) |
| | | | | | | | | | | | | | | | |
Class R6(1) | | | | | | | | | | | | | | | | |
Shares Sold | | | 184 | | | $ | 10,000 | | | | — | | | $ | — | |
Shares Issued for Reinvested Dividends | | | 58 | | | | 2,380 | | | | — | | | | — | |
| | | | | | | | | | | | | | | | |
Net Increase (Decrease) | | | 242 | | | | 12,380 | | | | — | | | | — | |
| | | | | | | | | | | | | | | | |
Class Y | | | | | | | | | | | | | | | | |
Shares Sold | | | 934,202 | | | $ | 42,115,977 | | | | 4,352,059 | | | $ | 222,763,886 | |
Shares Issued for Reinvested Dividends | | | 7,354,682 | | | | 301,886,684 | | | | 1,159,968 | | | | 57,312,697 | |
Shares Redeemed | | | (1,945,871 | ) | | | (88,777,238 | ) | | | (8,712,112 | ) | | | (454,823,550 | ) |
| | | | | | | | | | | | | | | | |
Net Increase (Decrease) | | | 6,343,013 | | | | 255,225,423 | | | | (3,200,085 | ) | | | (174,746,967 | ) |
| | | | | | | | | | | | | | | | |
Total Net Increase (Decrease) | | | 57,231,758 | | | $ | 1,943,744,273 | | | | (19,003,651 | ) | | $ | (921,306,339 | ) |
| | | | | | | | | | | | | | | | |
| | (1) | Commenced operations on November 7, 2014. |
|
| Hartford Funds – Domestic Equity Funds |
Notes to Financial Statements – (continued)
April 30, 2015
Core Equity Fund
| | | | | | | | | | | | | | | | |
| | | For the Six-Month Period
Ended April 30, 2015 | | | For the Year Ended
October 31, 2014 | |
| | | Shares | | | Amount | | | Shares | | | Amount | |
Class A | | | | | | | | | | | | | | | | |
Shares Sold | | | 2,160,770 | | | $ | 49,589,700 | | | | 982,895 | | | $ | 20,161,845 | |
Shares Issued for Reinvested Dividends | | | 76,842 | | | | 1,686,680 | | | | 16,164 | | | | 318,454 | |
Shares Redeemed | | | (713,727 | ) | | | (16,403,792 | ) | | | (775,246 | ) | | | (15,793,999 | ) |
Shares converted (from) Class B into Class A | | | 12,812 | | | | 294,202 | | | | 24,457 | | | | 497,507 | |
| | | | | | | | | | | | | | | | |
Net Increase (Decrease) | | | 1,536,697 | | | | 35,166,790 | | | | 248,270 | | | | 5,183,807 | |
| | | | | | | | | | | | | | | | |
Class B | | | | | | | | | | | | | | | | |
Shares Sold | | | 6,850 | | | $ | 145,618 | | | | 7,453 | | | $ | 141,185 | |
Shares Issued for Reinvested Dividends | | | 1,228 | | | | 25,192 | | | | — | | | | — | |
Shares Redeemed | | | (9,745 | ) | | | (208,293 | ) | | | (31,246 | ) | | | (568,169 | ) |
Shares converted (from) Class B into Class A | | | (13,722 | ) | | | (294,202 | ) | | | (24,457 | ) | | | (497,507 | ) |
| | | | | | | | | | | | | | | | |
Net Increase (Decrease) | | | (15,389 | ) | | | (331,685 | ) | | | (48,250 | ) | | | (924,491 | ) |
| | | | | | | | | | | | | | | | |
Class C | | | | | | | | | | | | | | | | |
Shares Sold | | | 671,564 | | | $ | 14,321,846 | | | | 210,063 | | | $ | 4,009,321 | |
Shares Issued for Reinvested Dividends | | | 13,706 | | | | 280,427 | | | | — | | | | — | |
Shares Redeemed | | | (92,964 | ) | | | (1,983,437 | ) | | | (117,258 | ) | | | (2,232,449 | ) |
| | | | | | | | | | | | | | | | |
Net Increase (Decrease) | | | 592,306 | | | | 12,618,836 | | | | 92,805 | | | | 1,776,872 | |
| | | | | | | | | | | | | | | | |
Class I(1) | | | | | | | | | | | | | | | | |
Shares Sold | | | 41,366 | | | $ | 971,569 | | | | — | | | $ | — | |
| | | | | | | | | | | | | | | | |
Net Increase (Decrease) | | | 41,366 | | | | 971,569 | | | | — | | | | — | |
| | | | | | | | | | | | | | | | |
Class R3 | | | | | | | | | | | | | | | | |
Shares Sold | | | 10,033 | | | $ | 228,979 | | | | 18,552 | | | $ | 386,145 | |
Shares Issued for Reinvested Dividends | | | 185 | | | | 4,137 | | | | 32 | | | | 653 | |
Shares Redeemed | | | (4,584 | ) | | | (105,709 | ) | | | (14,370 | ) | | | (292,115 | ) |
| | | | | | | | | | | | | | | | |
Net Increase (Decrease) | | | 5,634 | | | | 127,407 | | | | 4,214 | | | | 94,683 | |
| | | | | | | | | | | | | | | | |
Class R4 | | | | | | | | | | | | | | | | |
Shares Sold | | | 104,993 | | | $ | 2,492,832 | | | | 28,984 | | | $ | 609,067 | |
Shares Issued for Reinvested Dividends | | | 930 | | | | 20,981 | | | | — | | | | — | |
Shares Redeemed | | | (13,282 | ) | | | (315,333 | ) | | | (53,546 | ) | | | (1,031,391 | ) |
| | | | | | | | | | | | | | | | |
Net Increase (Decrease) | | | 92,641 | | | | 2,198,480 | | | | (24,562 | ) | | | (422,324 | ) |
| | | | | | | | | | | | | | | | |
Class R5 | | | | | | | | | | | | | | | | |
Shares Sold | | | 967,121 | | | $ | 22,962,403 | | | | 5,933 | | | $ | 124,589 | |
Shares Issued for Reinvested Dividends | | | 684 | | | | 15,632 | | | | 72 | | | | 1,455 | |
Shares Redeemed | | | (15,022 | ) | | | (356,266 | ) | | | (59 | ) | | | (1,274 | ) |
| | | | | | | | | | | | | | | | |
Net Increase (Decrease) | | | 952,783 | | | | 22,621,769 | | | | 5,946 | | | | 124,770 | |
| | | | | | | | | | | | | | | | |
Class R6(1) | | | | | | | | | | | | | | | | |
Shares Sold | | | 425 | | | $ | 10,000 | | | | — | | | $ | — | |
| | | | | | | | | | | | | | | | |
Net Increase (Decrease) | | | 425 | | | | 10,000 | | | | — | | | | — | |
| | | | | | | | | | | | | | | | |
|
| Hartford Funds – Domestic Equity Funds |
Notes to Financial Statements – (continued)
April 30, 2015
| | | | | | | | | | | | | | | | |
| | | For the Six-Month Period
Ended April 30, 2015 | | | For the Year Ended
October 31, 2014 | |
| | | Shares | | | Amount | | | Shares | | | Amount | |
Class Y | | | | | | | | | | | | | | | | |
Shares Sold | | | 329,166 | | | $ | 7,754,961 | | | | 22,795 | | | $ | 479,965 | |
Shares Issued for Reinvested Dividends | | | 4,947 | | | | 113,341 | | | | 760 | | | | 15,450 | |
Shares Redeemed | | | (21,947 | ) | | | (518,182 | ) | | | (15,458 | ) | | | (311,867 | ) |
| | | | | | | | | | | | | | | | |
Net Increase | | | 312,166 | | | | 7,350,120 | | | | 8,097 | | | | 183,548 | |
| | | | | | | | | | | | | | | | |
Total Net Increase (Decrease) | | | 3,518,629 | | | $ | 80,733,286 | | | | 286,520 | | | $ | 6,016,865 | |
| | | | | | | | | | | | | | | | |
| | (1) | Commenced operations on March 31, 2015. |
Dividend and Growth Fund
| | | | | | | | | | | | | | | | |
| | | For the Six-Month Period
Ended April 30, 2015 | | | For the Year Ended
October 31, 2014 | |
| | | Shares | | | Amount | | | Shares | | | Amount | |
Class A | | | | | | | | | | | | | | | | |
Shares Sold | | | 6,480,221 | | | $ | 166,019,891 | | | | 11,659,648 | | | $ | 299,298,199 | |
Shares Issued for Reinvested Dividends | | | 13,839,260 | | | | 341,642,546 | | | | 11,232,653 | | | | 273,099,349 | |
Shares Redeemed | | | (9,144,028 | ) | | | (234,474,945 | ) | | | (20,080,459 | ) | | | (516,963,184 | ) |
Shares converted (from) Class B into Class A | | | 196,191 | | | | 5,027,352 | | | | 348,407 | | | | 8,953,647 | |
| | | | | | | | | | | | | | | | |
Net Increase (Decrease) | | | 11,371,644 | | | | 278,214,844 | | | | 3,160,249 | | | | 64,388,011 | |
| | | | | | | | | | | | | | | | |
Class B | | | | | | | | | | | | | | | | |
Shares Sold | | | 29,974 | | | $ | 745,348 | | | | 52,264 | | | $ | 1,307,336 | |
Shares Issued for Reinvested Dividends | | | 252,949 | | | | 6,110,640 | | | | 277,714 | | | | 6,571,439 | |
Shares Redeemed | | | (538,796 | ) | | | (13,594,503 | ) | | | (1,140,277 | ) | | | (28,670,060 | ) |
Shares converted (from) Class B into Class A | | | (199,946 | ) | | | (5,027,352 | ) | | | (348,407 | ) | | | (8,953,647 | ) |
| | | | | | | | | | | | | | | | |
Net Increase (Decrease) | | | (455,819 | ) | | | (11,765,867 | ) | | | (1,158,706 | ) | | | (29,744,932 | ) |
| | | | | | | | | | | | | | | | |
Class C | | | | | | | | | | | | | | | | |
Shares Sold | | | 1,302,353 | | | $ | 32,454,099 | | | | 2,088,970 | | | $ | 52,440,698 | |
Shares Issued for Reinvested Dividends | | | 1,684,735 | | | | 40,434,158 | | | | 1,228,157 | | | | 29,000,306 | |
Shares Redeemed | | | (1,252,375 | ) | | | (31,210,739 | ) | | | (2,228,882 | ) | | | (56,060,830 | ) |
| | | | | | | | | | | | | | | | |
Net Increase (Decrease) | | | 1,734,713 | | | | 41,677,518 | | | | 1,088,245 | | | | 25,380,174 | |
| | | | | | | | | | | | | | | | |
Class I | | | | | | | | | | | | | | | | |
Shares Sold | | | 5,538,389 | | | $ | 141,575,203 | | | | 14,965,376 | | | $ | 385,018,785 | |
Shares Issued for Reinvested Dividends | | | 6,955,432 | | | | 171,059,651 | | | | 5,322,790 | | | | 129,253,156 | |
Shares Redeemed | | | (7,331,895 | ) | | | (187,466,835 | ) | | | (13,146,355 | ) | | | (336,832,150 | ) |
| | | | | | | | | | | | | | | | |
Net Increase (Decrease) | | | 5,161,926 | | | | 125,168,019 | | | | 7,141,811 | | | | 177,439,791 | |
| | | | | | | | | | | | | | | | |
Class R3 | | | | | | | | | | | | | | | | |
Shares Sold | | | 382,660 | | | $ | 9,899,000 | | | | 562,610 | | | $ | 14,514,768 | |
Shares Issued for Reinvested Dividends | | | 310,488 | | | | 7,732,641 | | | | 247,647 | | | | 6,057,950 | |
Shares Redeemed | | | (460,632 | ) | | | (11,967,522 | ) | | | (873,525 | ) | | | (22,741,441 | ) |
| | | | | | | | | | | | | | | | |
Net Increase (Decrease) | | | 232,516 | | | | 5,664,119 | | | | (63,268 | ) | | | (2,168,723 | ) |
| | | | | | | | | | | | | | | | |
Class R4 | | | | | | | | | | | | | | | | |
Shares Sold | | | 860,570 | | | $ | 22,177,659 | | | | 1,403,665 | | | $ | 36,330,043 | |
Shares Issued for Reinvested Dividends | | | 386,759 | | | | 9,687,486 | | | | 305,081 | | | | 7,517,565 | |
Shares Redeemed | | | (960,160 | ) | | | (25,257,887 | ) | | | (1,369,876 | ) | | | (35,617,573 | ) |
| | | | | | | | | | | | | | | | |
Net Increase (Decrease) | | | 287,169 | | | | 6,607,258 | | | | 338,870 | | | | 8,230,035 | |
| | | | | | | | | | | | | | | | |
|
| Hartford Funds – Domestic Equity Funds |
Notes to Financial Statements – (continued)
April 30, 2015
| | | | | | | | | | | | | | | | |
| | | For the Six-Month Period
Ended April 30, 2015 | | | For the Year Ended
October 31, 2014 | |
| | | Shares | | | Amount | | | Shares | | | Amount | |
Class R5 | | | | | | | | | | | | | | | | |
Shares Sold | | | 1,735,296 | | | $ | 44,606,892 | | | | 2,250,986 | | | $ | 57,855,856 | |
Shares Issued for Reinvested Dividends | | | 550,127 | | | | 13,829,912 | | | | 423,595 | | | | 10,492,495 | |
Shares Redeemed | | | (1,172,803 | ) | | | (30,570,090 | ) | | | (2,215,279 | ) | | | (58,005,512 | ) |
| | | | | | | | | | | | | | | | |
Net Increase (Decrease) | | | 1,112,620 | | | | 27,866,714 | | | | 459,302 | | | | 10,342,839 | |
| | | | | | | | | | | | | | | | |
Class R6(1) | | | | | | | | | | | | | | | | |
Shares Sold | | | 360 | | | $ | 10,000 | | | | — | | | $ | — | |
Shares Issued for Reinvested Dividends | | | 36 | | | | 911 | | | | — | | | | — | |
| | | | | | | | | | | | | | | | |
Net Increase (Decrease) | | | 396 | | | | 10,911 | | | | — | | | | — | |
| | | | | | | | | | | | | | | | |
Class Y | | | | | | | | | | | | | | | | |
Shares Sold | | | 2,711,523 | | | $ | 69,885,070 | | | | 4,534,013 | | | $ | 117,995,001 | |
Shares Issued for Reinvested Dividends | | | 4,801,853 | | | | 120,801,017 | | | | 5,064,102 | | | | 125,196,800 | |
Shares Redeemed | | | (4,186,210 | ) | | | (109,400,197 | ) | | | (23,032,840 | ) | | | (609,175,370 | ) |
| | | | | | | | | | | | | | | | |
Net Increase (Decrease) | | | 3,327,166 | | | | 81,285,890 | | | | (13,434,725 | ) | | | (365,983,569 | ) |
| | | | | | | | | | | | | | | | |
Total Net Increase (Decrease) | | | 22,772,331 | | | $ | 554,729,406 | | | | (2,468,222 | ) | | $ | (112,116,374 | ) |
| | | | | | | | | | | | | | | | |
| | (1) | Commenced operations on November 7, 2014. |
Equity Income Fund
| | | | | | | | | | | | | | | | |
| | | For the Six-Month Period
Ended April 30, 2015 | | | For the Year Ended
October 31, 2014 | |
| | | Shares | | | Amount | | | Shares | | | Amount | |
Class A | | | | | | | | | | | | | | | | |
Shares Sold | | | 6,721,394 | | | $ | 127,133,805 | | | | 23,238,515 | | | $ | 423,849,390 | |
Shares Issued for Reinvested Dividends | | | 3,676,561 | | | | 68,134,549 | | | | 4,983,809 | | | | 88,779,589 | |
Shares Redeemed | | | (11,506,962 | ) | | | (218,184,483 | ) | | | (23,748,917 | ) | | | (438,157,374 | ) |
Shares converted (from) Class B into Class A | | | 23,685 | | | | 450,597 | | | | 53,280 | | | | 977,733 | |
| | | | | | | | | | | | | | | | |
Net Increase (Decrease) | | | (1,085,322 | ) | | | (22,465,532 | ) | | | 4,526,687 | | | | 75,449,338 | |
| | | | | | | | | | | | | | | | |
Class B | | | | | | | | | | | | | | | | |
Shares Sold | | | 16,089 | | | $ | 302,170 | | | | 58,251 | | | $ | 1,063,946 | |
Shares Issued for Reinvested Dividends | | | 37,153 | | | | 688,019 | | | | 65,589 | | | | 1,163,587 | |
Shares Redeemed | | | (242,489 | ) | | | (4,595,324 | ) | | | (457,814 | ) | | | (8,395,917 | ) |
Shares converted (from) Class B into Class A | | | (23,674 | ) | | | (450,597 | ) | | | (53,277 | ) | | | (977,733 | ) |
| | | | | | | | | | | | | | | | |
Net Increase (Decrease) | | | (212,921 | ) | | | (4,055,732 | ) | | | (387,251 | ) | | | (7,146,117 | ) |
| | | | | | | | | | | | | | | | |
Class C | | | | | | | | | | | | | | | | |
Shares Sold | | | 2,695,295 | | | $ | 50,725,811 | | | | 7,414,073 | | | $ | 134,841,474 | |
Shares Issued for Reinvested Dividends | | | 745,637 | | | | 13,716,130 | | | | 786,133 | | | | 13,876,238 | |
Shares Redeemed | | | (2,112,499 | ) | | | (39,752,064 | ) | | | (2,939,088 | ) | | | (53,666,780 | ) |
| | | | | | | | | | | | | | | | |
Net Increase (Decrease) | | | 1,328,433 | | | | 24,689,877 | | | | 5,261,118 | | | | 95,050,932 | |
| | | | | | | | | | | | | | | | |
Class I | | | | | | | | | | | | | | | | |
Shares Sold | | | 7,949,201 | | | $ | 149,896,699 | | | | 23,321,858 | | | $ | 426,332,366 | |
Shares Issued for Reinvested Dividends | | | 1,732,519 | | | | 32,006,232 | | | | 1,901,806 | | | | 33,880,207 | |
Shares Redeemed | | | (8,949,168 | ) | | | (168,465,907 | ) | | | (14,128,755 | ) | | | (258,879,321 | ) |
| | | | | | | | | | | | | | | | |
Net Increase (Decrease) | | | 732,552 | | | | 13,437,024 | | | | 11,094,909 | | | | 201,333,252 | |
| | | | | | | | | | | | | | | | |
|
| Hartford Funds – Domestic Equity Funds |
Notes to Financial Statements – (continued)
April 30, 2015
| | | | | | | | | | | | | | | | |
| | | For the Six-Month Period
Ended April 30, 2015 | | | For the Year Ended
October 31, 2014 | |
| | | Shares | | | Amount | | | Shares | | | Amount | |
Class R3 | | | | | | | | | | | | | | | | |
Shares Sold | | | 518,999 | | | $ | 9,796,429 | | | | 1,013,431 | | | $ | 18,524,621 | |
Shares Issued for Reinvested Dividends | | | 102,910 | | | | 1,906,639 | | | | 121,119 | | | | 2,155,113 | |
Shares Redeemed | | | (356,046 | ) | | | (6,733,328 | ) | | | (758,718 | ) | | | (13,899,908 | ) |
| | | | | | | | | | | | | | | | |
Net Increase (Decrease) | | | 265,863 | | | | 4,969,740 | | | | 375,832 | | | | 6,779,826 | |
| | | | | | | | | | | | | | | | |
Class R4 | | | | | | | | | | | | | | | | |
Shares Sold | | | 630,821 | | | $ | 12,001,737 | | | | 1,317,623 | | | $ | 23,994,485 | |
Shares Issued for Reinvested Dividends | | | 125,278 | | | | 2,326,709 | | | | 164,095 | | | | 2,930,535 | |
Shares Redeemed | | | (644,941 | ) | | | (12,293,466 | ) | | | (1,114,276 | ) | | | (20,669,404 | ) |
| | | | | | | | | | | | | | | | |
Net Increase (Decrease) | | | 111,158 | | | | 2,034,980 | | | | 367,442 | | | | 6,255,616 | |
| | | | | | | | | | | | | | | | |
Class R5 | | | | | | | | | | | | | | | | |
Shares Sold | | | 966,974 | | | $ | 18,467,109 | | | | 2,276,360 | | | $ | 42,019,455 | |
Shares Issued for Reinvested Dividends | | | 168,304 | | | | 3,140,160 | | | | 195,011 | | | | 3,501,393 | |
Shares Redeemed | | | (893,107 | ) | | | (17,035,274 | ) | | | (1,708,762 | ) | | | (31,262,501 | ) |
| | | | | | | | | | | | | | | | |
Net Increase (Decrease) | | | 242,171 | | | | 4,571,995 | | | | 762,609 | | | | 14,258,347 | |
| | | | | | | | | | | | | | | | |
Class R6 | | | | | | | | | | | | | | | | |
Shares Sold | | | 1,169 | | | $ | 22,330 | | | | — | | | $ | — | |
Shares Issued for Reinvested Dividends | | | 21 | | | | 381 | | | | — | | | | — | |
Shares Redeemed | | | (21 | ) | | | (397 | ) | | | — | | | | — | |
| | | | | | | | | | | | | | | | |
Net Increase (Decrease) | | | 1,169 | | | | 22,314 | | | | — | | | | — | |
| | | | | | | | | | | | | | | | |
Class Y | | | | | | | | | | | | | | | | |
Shares Sold | | | 1,864,984 | | | $ | 35,519,280 | | | | 4,719,873 | | | $ | 86,201,941 | |
Shares Issued for Reinvested Dividends | | | 466,452 | | | | 8,718,037 | | | | 504,532 | | | | 9,099,684 | |
Shares Redeemed | | | (1,401,770 | ) | | | (26,821,946 | ) | | | (2,248,974 | ) | | | (41,733,023 | ) |
| | | | | | | | | | | | | | | | |
Net Increase | | | 929,666 | | | | 17,415,371 | | | | 2,975,431 | | | | 53,568,602 | |
| | | | | | | | | | | | | | | | |
Total Net Increase (Decrease) | | | 2,312,769 | | | $ | 40,620,037 | | | | 24,976,777 | | | $ | 445,549,796 | |
| | | | | | | | | | | | | | | | |
Growth Opportunities Fund
| | | | | | | | | | | | | | | | |
| | | For the Six-Month Period
Ended April 30, 2015 | | | For the Year Ended
October 31, 2014 | |
| | | Shares | | | Amount | | | Shares | | | Amount | |
Class A | | | | | | | | | | | | | | | | |
Shares Sold | | | 3,341,668 | | | $ | 131,160,346 | | | | 2,906,970 | | | $ | 117,825,129 | |
Issued in Merger | | | — | | | | — | | | | 9,619,769 | | | | 380,973,648 | |
Shares Issued for Reinvested Dividends | | | 7,036,742 | | | | 255,996,603 | | | | 980,734 | | | | 37,199,254 | |
Shares Redeemed | | | (2,997,445 | ) | | | (118,069,275 | ) | | | (4,766,831 | ) | | | (194,247,986 | ) |
Shares converted (from) Class B into Class A | | | 30,994 | | | | 1,227,286 | | | | 68,080 | | | | 2,766,967 | |
| | | | | | | | | | | | | | | | |
Net Increase (Decrease) | | | 7,411,959 | | | | 270,314,960 | | | | 8,808,722 | | | | 344,517,012 | |
| | | | | | | | | | | | | | | | |
Class B | | | | | | | | | | | | | | | | |
Shares Sold | | | 32,793 | | | $ | 897,455 | | | | 16,334 | | | $ | 2,017,943 | |
Issued in Merger | | | — | | | | — | | | | 145,287 | | | | 4,455,206 | |
Shares Issued for Reinvested Dividends | | | 167,713 | | | | 4,395,762 | | | | 35,380 | | | | 1,041,600 | |
Shares Redeemed | | | (116,462 | ) | | | (3,359,408 | ) | | | (267,607 | ) | | | (7,801,880 | ) |
Shares converted (from) Class B into Class A | | | (42,747 | ) | | | (1,227,286 | ) | | | (68,080 | ) | | | (2,766,967 | ) |
| | | | | | | | | | | | | | | | |
Net Increase (Decrease) | | | 41,297 | | | | 706,523 | | | | (138,686 | ) | | | (3,054,098 | ) |
| | | | | | | | | | | | | | | | |
|
| Hartford Funds – Domestic Equity Funds |
Notes to Financial Statements – (continued)
April 30, 2015
| | | | | | | | | | | | | | | | |
| | | For the Six-Month Period
Ended April 30, 2015 | | | For the Year Ended
October 31, 2014 | |
| | | Shares | | | Amount | | | Shares | | | Amount | |
Class C | | | | | | | | | | | | | | | | |
Shares Sold | | | 1,850,193 | | | $ | 52,463,187 | | | | 1,147,608 | | | $ | 39,602,224 | |
Issued in Merger | | | — | | | | — | | | | 1,244,047 | | | | 38,336,418 | |
Shares Issued for Reinvested Dividends | | | 1,801,666 | | | | 47,618,034 | | | | 241,727 | | | | 7,150,297 | |
Shares Redeemed | | | (893,834 | ) | | | (25,753,581 | ) | | | (993,424 | ) | | | (31,429,150 | ) |
| | | | | | | | | | | | | | | | |
Net Increase (Decrease) | | | 2,758,025 | | | | 74,327,640 | | | | 1,639,958 | | | | 53,659,789 | |
| | | | | | | | | | | | | | | | |
Class I | | | | | | | | | | | | | | | | |
Shares Sold | | | 10,181,962 | | | $ | 409,576,089 | | | | 9,661,043 | | | $ | 398,434,498 | |
Issued in Merger | | | — | | | | — | | | | 5,900,903 | | | | 239,063,272 | |
Shares Issued for Reinvested Dividends | | | 6,332,967 | | | | 237,296,256 | | | | 922,669 | | | | 35,771,876 | |
Shares Redeemed | | | (7,382,965 | ) | | | (300,807,913 | ) | | | (10,441,007 | ) | | | (434,021,508 | ) |
| | | | | | | | | | | | | | | | |
Net Increase (Decrease) | | | 9,131,964 | | | | 346,064,432 | | | | 6,043,608 | | | | 239,248,138 | |
| | | | | | | | | | | | | | | | |
Class R3 | | | | | | | | | | | | | | | | |
Shares Sold | | | 189,733 | | | $ | 7,589,914 | | | | 192,558 | | | $ | 7,907,601 | |
Issued in Merger | | | — | | | | — | | | | 28,006 | | | | 1,123,623 | |
Shares Issued for Reinvested Dividends | | | 133,408 | | | | 4,918,740 | | | | 23,145 | | | | 890,165 | |
Shares Redeemed | | | (100,682 | ) | | | (3,955,956 | ) | | | (202,397 | ) | | | (8,362,311 | ) |
| | | | | | | | | | | | | | | | |
Net Increase (Decrease) | | | 222,459 | | | | 8,552,698 | | | | 41,312 | | | | 1,559,078 | |
| | | | | | | | | | | | | | | | |
Class R4 | | | | | | | | | | | | | | | | |
Shares Sold | | | 189,121 | | | $ | 7,800,330 | | | | 249,812 | | | $ | 10,659,171 | |
Issued in Merger | | | — | | | | — | | | | 87,171 | | | | 3,580,566 | |
Shares Issued for Reinvested Dividends | | | 215,215 | | | | 8,182,472 | | | | 37,995 | | | | 1,494,710 | |
Shares Redeemed | | | (139,283 | ) | | | (5,739,641 | ) | | | (325,362 | ) | | | (13,752,273 | ) |
| | | | | | | | | | | | | | | | |
Net Increase (Decrease) | | | 265,053 | | | | 10,243,161 | | | | 49,616 | | | | 1,982,174 | |
| | | | | | | | | | | | | | | | |
Class R5 | | | | | | | | | | | | | | | | |
Shares Sold | | | 230,192 | | | $ | 9,679,149 | | | | 2,186,606 | | | $ | 88,505,755 | |
Issued in Merger | | | — | | | | — | | | | 1,474 | | | | 61,745 | |
Shares Issued for Reinvested Dividends | | | 437,027 | | | | 17,052,786 | | | | 19,015 | | | | 761,916 | |
Shares Redeemed | | | (245,383 | ) | | | (10,530,910 | ) | | | (485,186 | ) | | | (20,905,043 | ) |
| | | | | | | | | | | | | | | | |
Net Increase (Decrease) | | | 421,836 | | | | 16,201,025 | | | | 1,721,909 | | | | 68,424,373 | |
| | | | | | | | | | | | | | | | |
Class R6(1) | | | | | | | | | | | | | | | | |
Shares Sold | | | 212 | | | $ | 10,000 | | | | — | | | $ | — | |
Shares Issued for Reinvested Dividends | | | 42 | | | | 1,642 | | | | — | | | | — | |
| | | | | | | | | | | | | | | | |
Net Increase (Decrease) | | | 254 | | | | 11,642 | | | | — | | | | — | |
| | | | | | | | | | | | | | | | |
Class Y | | | | | | | | | | | | | | | | |
Shares Sold | | | 536,655 | | | $ | 23,058,013 | | | | 154,439 | | | $ | 3,980,085 | |
Issued in Merger | | | — | | | | — | | | | 134,279 | | | | 5,662,605 | |
Shares Issued for Reinvested Dividends | | | 283,158 | | | | 11,147,947 | | | | 51,249 | | | | 2,066,852 | |
Shares Redeemed | | | (105,947 | ) | | | (4,530,651 | ) | | | (290,656 | ) | | | (12,377,728 | ) |
| | | | | | | | | | | | | | | | |
Net Increase | | | 713,866 | | | | 29,675,309 | | | | 49,311 | | | | (668,186 | ) |
| | | | | | | | | | | | | | | | |
Total Net Increase (Decrease) | | | 20,966,713 | | | $ | 756,097,390 | | | | 18,215,750 | | | $ | 705,668,280 | |
| | | | | | | | | | | | | | | | |
| | (1) | Commenced operations on November 7, 2014. |
|
| Hartford Funds – Domestic Equity Funds |
Notes to Financial Statements – (continued)
April 30, 2015
Healthcare Fund
| | | | | | | | | | | | | | | | |
| | | For the Six-Month Period
Ended April 30, 2015 | | | For the Year Ended
October 31, 2014 | |
| | | Shares | | | Amount | | | Shares | | | Amount | |
Class A | | | | | | | | | | | | | | | | |
Shares Sold | | | 4,341,440 | | | $ | 164,810,744 | | | | 4,246,090 | | | $ | 138,256,714 | |
Shares Issued for Reinvested Dividends | | | 1,147,667 | | | | 40,592,988 | | | | — | | | | — | |
Shares Redeemed | | | (1,387,279 | ) | | | (52,148,370 | ) | | | (2,729,598 | ) | | | (87,391,866 | ) |
Shares converted (from) Class B into Class A | | | 24,138 | | | | 931,638 | | | | 43,286 | | | | 1,398,567 | |
| | | | | | | | | | | | | | | | |
Net Increase (Decrease) | | | 4,125,966 | | | | 154,187,000 | | | | 1,559,778 | | | | 52,263,415 | |
| | | | | | | | | | | | | | | | |
Class B | | | | | | | | | | | | | | | | |
Shares Sold | | | 20,253 | | | $ | 662,143 | | | | 14,050 | | | $ | 397,992 | |
Shares Issued for Reinvested Dividends | | | 23,436 | | | | 721,123 | | | | — | | | | — | |
Shares Redeemed | | | (101,704 | ) | | | (3,366,503 | ) | | | (210,249 | ) | | | (5,915,820 | ) |
Shares converted (from) Class B into Class A | | | (27,758 | ) | | | (931,638 | ) | | | (43,286 | ) | | | (1,398,567 | ) |
| | | | | | | | | | | | | | | | |
Net Increase (Decrease) | | | (85,773 | ) | | | (2,914,875 | ) | | | (239,485 | ) | | | (6,916,395 | ) |
| | | | | | | | | | | | | | | | |
Class C | | | | | | | | | | | | | | | | |
Shares Sold | | | 1,869,241 | | | $ | 62,311,885 | | | | 1,431,513 | | | $ | 41,553,037 | |
Shares Issued for Reinvested Dividends | | | 398,445 | | | | 12,359,998 | | | | — | | | | — | |
Shares Redeemed | | | (367,006 | ) | | | (12,201,395 | ) | | | (645,576 | ) | | | (18,640,173 | ) |
| | | | | | | | | | | | | | | | |
Net Increase (Decrease) | | | 1,900,680 | | | | 62,470,488 | | | | 785,937 | | | | 22,912,864 | |
| | | | | | | | | | | | | | | | |
Class I | | | | | | | | | | | | | | | | |
Shares Sold | | | 1,717,010 | | | $ | 67,007,577 | | | | 1,778,835 | | | $ | 59,336,290 | |
Shares Issued for Reinvested Dividends | | | 224,482 | | | | 8,182,379 | | | | — | | | | — | |
Shares Redeemed | | | (474,348 | ) | | | (18,356,021 | ) | | | (873,492 | ) | | | (29,299,650 | ) |
| | | | | | | | | | | | | | | | |
Net Increase (Decrease) | | | 1,467,144 | | | | 56,833,935 | | | | 905,343 | | | | 30,036,640 | |
| | | | | | | | | | | | | | | | |
Class R3 | | | | | | | | | | | | | | | | |
Shares Sold | | | 456,745 | | | $ | 17,700,601 | | | | 533,680 | | | $ | 17,903,759 | |
Shares Issued for Reinvested Dividends | | | 76,789 | | | | 2,793,593 | | | | — | | | | — | |
Shares Redeemed | | | (205,528 | ) | | | (7,835,595 | ) | | | (318,871 | ) | | | (10,684,655 | ) |
| | | | | | | | | | | | | | | | |
Net Increase (Decrease) | | | 328,006 | | | | 12,658,599 | | | | 214,809 | | | | 7,219,104 | |
| | | | | | | | | | | | | | | | |
Class R4 | | | | | | | | | | | | | | | | |
Shares Sold | | | 322,628 | | | $ | 12,907,618 | | | | 350,389 | | | $ | 11,950,638 | |
Shares Issued for Reinvested Dividends | | | 51,929 | | | | 1,946,281 | | | | — | | | | — | |
Shares Redeemed | | | (89,897 | ) | | | (3,593,373 | ) | | | (187,783 | ) | | | (6,312,601 | ) |
| | | | | | | | | | | | | | | | |
Net Increase (Decrease) | | | 284,660 | | | | 11,260,526 | | | | 162,606 | | | | 5,638,037 | |
| | | | | | | | | | | | | | | | |
Class R5 | | | | | | | | | | | | | | | | |
Shares Sold | | | 80,384 | | | $ | 3,312,747 | | | | 55,603 | | | $ | 1,951,139 | |
Shares Issued for Reinvested Dividends | | | 4,336 | | | | 166,891 | | | | — | | | | — | |
Shares Redeemed | | | (28,525 | ) | | | (1,170,626 | ) | | | (38,798 | ) | | | (1,337,288 | ) |
| | | | | | | | | | | | | | | | |
Net Increase (Decrease) | | | 56,195 | | | | 2,309,012 | | | | 16,805 | | | | 613,851 | |
| | | | | | | | | | | | | | | | |
Class Y | | | | | | | | | | | | | | | | |
Shares Sold | | | 44,205 | | | $ | 1,804,769 | | | | 93,800 | | | $ | 3,294,919 | |
Shares Issued for Reinvested Dividends | | | 9,967 | | | | 386,236 | | | | — | | | | — | |
Shares Redeemed | | | (15,960 | ) | | | (648,598 | ) | | | (74,555 | ) | | | (2,623,740 | ) |
| | | | | | | | | | | | | | | | |
Net Increase | | | 38,212 | | | | 1,542,407 | | | | 19,245 | | | | 671,179 | |
| | | | | | | | | | | | | | | | |
Total Net Increase (Decrease) | | | 8,115,090 | | | $ | 298,347,092 | | | | 3,425,038 | | | $ | 112,438,695 | |
| | | | | | | | | | | | | | | | |
|
| Hartford Funds – Domestic Equity Funds |
Notes to Financial Statements – (continued)
April 30, 2015
MidCap Fund
| | | | | | | | | | | | | | | | |
| | | For the Six-Month Period
Ended April 30, 2015 | | | For the Year Ended
October 31, 2014 | |
| | | Shares | | | Amount | | | Shares | | | Amount | |
Class A | | | | | | | | | | | | | | | | |
Shares Sold | | | 5,430,259 | | | $ | 141,993,024 | | | | 7,669,202 | | | $ | 201,602,782 | |
Shares Issued for Reinvested Dividends | | | 7,470,845 | | | | 181,840,371 | | | | 5,885,537 | | | | 141,547,169 | |
Shares Redeemed | | | (4,593,701 | ) | | | (119,372,981 | ) | | | (16,536,000 | ) | | | (435,627,486 | ) |
Shares converted (from) Class B into Class A | | | 38,605 | | | | 1,008,552 | | | | 81,927 | | | | 2,154,024 | |
| | | | | | | | | | | | | | | | |
Net Increase (Decrease) | | | 8,346,008 | | | | 205,468,966 | | | | (2,899,334 | ) | | | (90,323,511 | ) |
| | | | | | | | | | | | | | | | |
Class B | | | | | | | | | | | | | | | | |
Shares Sold | | | 17,754 | | | $ | 352,348 | | | | 49,069 | | | $ | 1,025,291 | |
Shares Issued for Reinvested Dividends | | | 187,726 | | | | 3,502,970 | | | | 159,556 | | | | 3,057,100 | |
Shares Redeemed | | | (122,999 | ) | | | (2,471,273 | ) | | | (358,234 | ) | | | (7,023,548 | ) |
Shares converted (from) Class B into Class A | | | (50,204 | ) | | | (1,008,552 | ) | | | (81,927 | ) | | | (2,154,024 | ) |
| | | | | | | | | | | | | | | | |
Net Increase (Decrease) | | | 32,277 | | | | 375,493 | | | | (231,536 | ) | | | (5,095,181 | ) |
| | | | | | | | | | | | | | | | |
Class C | | | | | | | | | | | | | | | | |
Shares Sold | | | 2,838,653 | | | $ | 58,568,910 | | | | 3,285,184 | | | $ | 70,121,656 | |
Shares Issued for Reinvested Dividends | | | 3,259,674 | | | | 62,553,351 | | | | 2,159,468 | | | | 42,325,578 | |
Shares Redeemed | | | (1,853,311 | ) | | | (38,210,027 | ) | | | (3,187,180 | ) | | | (67,841,246 | ) |
| | | | | | | | | | | | | | | | |
Net Increase (Decrease) | | | 4,245,016 | | | | 82,912,234 | | | | 2,257,472 | | | | 44,605,988 | |
| | | | | | | | | | | | | | | | |
Class I | | | | | | | | | | | | | | | | |
Shares Sold | | | 4,910,104 | | | $ | 129,592,967 | | | | 11,260,304 | | | $ | 303,600,378 | |
Shares Issued for Reinvested Dividends | | | 2,049,424 | | | | 50,702,742 | | | | 820,991 | | | | 19,982,925 | |
Shares Redeemed | | | (2,189,821 | ) | | | (57,807,414 | ) | | | (2,967,374 | ) | | | (78,600,420 | ) |
| | | | | | | | | | | | | | | | |
Net Increase (Decrease) | | | 4,769,707 | | | | 122,488,295 | | | | 9,113,921 | | | | 244,982,883 | |
| | | | | | | | | | | | | | | | |
Class R3 | | | | | | | | | | | | | | | | |
Shares Sold | | | 560,892 | | | $ | 16,107,988 | | | | 511,275 | | | $ | 14,734,623 | |
Shares Issued for Reinvested Dividends | | | 186,911 | | | | 5,033,512 | | | | 128,964 | | | | 3,409,817 | |
Shares Redeemed | | | (183,318 | ) | | | (5,259,938 | ) | | | (467,889 | ) | | | (13,425,866 | ) |
| | | | | | | | | | | | | | | | |
Net Increase (Decrease) | | | 564,485 | | | | 15,881,562 | | | | 172,350 | | | | 4,718,574 | |
| | | | | | | | | | | | | | | | |
Class R4 | | | | | | | | | | | | | | | | |
Shares Sold | | | 1,724,751 | | | $ | 50,035,431 | | | | 1,098,044 | | | $ | 32,080,748 | |
Shares Issued for Reinvested Dividends | | | 291,617 | | | | 8,028,220 | | | | 196,029 | | | | 5,271,207 | |
Shares Redeemed | | | (631,986 | ) | | | (18,722,995 | ) | | | (942,212 | ) | | | (27,487,836 | ) |
| | | | | | | | | | | | | | | | |
Net Increase (Decrease) | | | 1,384,382 | | | | 39,340,656 | | | | 351,861 | | | | 9,864,119 | |
| | | | | | | | | | | | | | | | |
Class R5 | | | | | | | | | | | | | | | | |
Shares Sold | | | 1,348,606 | | | $ | 39,742,410 | | | | 838,230 | | | $ | 24,802,356 | |
Shares Issued for Reinvested Dividends | | | 351,572 | | | | 9,801,832 | | | | 236,276 | | | | 6,407,782 | |
Shares Redeemed | | | (455,235 | ) | | | (13,622,568 | ) | | | (688,020 | ) | | | (20,093,064 | ) |
| | | | | | | | | | | | | | | | |
Net Increase (Decrease) | | | 1,244,943 | | | | 35,921,674 | | | | 386,486 | | | | 11,117,074 | |
| | | | | | | | | | | | | | | | |
Class R6(1) | | | | | | | | | | | | | | | | |
Shares Sold | | | 30,174 | | | $ | 902,347 | | | | — | | | $ | — | |
Shares Issued for Reinvested Dividends | | | 31 | | | | 858 | | | | — | | | | — | |
Shares Redeemed | | | (652 | ) | | | (20,060 | ) | | | — | | | | — | |
| | | | | | | | | | | | | | | | |
Net Increase (Decrease) | | | 29,553 | | | | 883,145 | | | | — | | | | — | |
| | | | | | | | | | | | | | | | |
|
| Hartford Funds – Domestic Equity Funds |
Notes to Financial Statements – (continued)
April 30, 2015
| | | | | | | | | | | | | | | | |
| | | For the Six-Month Period
Ended April 30, 2015 | | | For the Year Ended
October 31, 2014 | |
| | | Shares | | | Amount | | | Shares | | | Amount | |
Class Y | | | | | | | | | | | | | | | | |
Shares Sold | | | 6,561,632 | | | $ | 195,009,543 | | | | 8,285,332 | | | $ | 247,563,593 | |
Shares Issued for Reinvested Dividends | | | 3,104,776 | | | | 86,995,819 | | | | 2,067,950 | | | | 56,268,909 | |
Shares Redeemed | | | (8,265,104 | ) | | | (246,448,718 | ) | | | (5,979,371 | ) | | | (175,703,439 | ) |
| | | | | | | | | | | | | | | | |
Net Increase | | | 1,401,304 | | | | 35,556,644 | | | | 4,373,911 | | | | 128,129,063 | |
| | | | | | | | | | | | | | | | |
Total Net Increase (Decrease) | | | 22,017,675 | | | $ | 538,828,669 | | | | 13,525,131 | | | $ | 347,999,009 | |
| | | | | | | | | | | | | | | | |
| | (1) | Commenced operations on November 7, 2014. |
MidCap Value Fund
| | | | | | | | | | | | | | | | |
| | | For the Six-Month Period
Ended April 30, 2015 | | | For the Year Ended
October 31, 2014 | |
| | | Shares | | | Amount | | | Shares | | | Amount | |
Class A | | | | | | | | | | | | | | | | |
Shares Sold | | | 1,204,742 | | | $ | 18,827,021 | | | | 2,200,511 | | | $ | 35,906,259 | |
Shares Issued for Reinvested Dividends | | | 1,747,300 | | | | 25,055,811 | | | | 1,280,591 | | | | 19,132,034 | |
Shares Redeemed | | | (1,132,272 | ) | | | (17,594,986 | ) | | | (2,809,819 | ) | | | (46,076,422 | ) |
Shares converted (from) Class B into Class A | | | 14,147 | | | | 220,800 | | | | 25,938 | | | | 422,340 | |
| | | | | | | | | | | | | | | | |
Net Increase (Decrease) | | | 1,833,917 | | | | 26,508,646 | | | | 697,221 | | | | 9,384,211 | |
| | | | | | | | | | | | | | | | |
Class B | | | | | | | | | | | | | | | | |
Shares Sold | | | 4,945 | | | $ | 67,105 | | | | 5,453 | | | $ | 80,432 | |
Shares Issued for Reinvested Dividends | | | 20,894 | | | | 262,016 | | | | 20,950 | | | | 280,934 | |
Shares Redeemed | | | (17,645 | ) | | | (240,003 | ) | | | (44,641 | ) | | | (602,391 | ) |
Shares converted (from) Class B into Class A | | | (16,122 | ) | | | (220,800 | ) | | | (25,938 | ) | | | (422,340 | ) |
| | | | | | | | | | | | | | | | |
Net Increase (Decrease) | | | (7,928 | ) | | | (131,682 | ) | | | (44,176 | ) | | | (663,365 | ) |
| | | | | | | | | | | | | | | | |
Class C | | | | | | | | | | | | | | | | |
Shares Sold | | | 290,635 | | | $ | 3,923,648 | | | | 420,359 | | | $ | 6,066,244 | |
Shares Issued for Reinvested Dividends | | | 371,518 | | | | 4,636,545 | | | | 257,808 | | | | 3,436,582 | |
Shares Redeemed | | | (290,717 | ) | | | (3,935,574 | ) | | | (452,135 | ) | | | (6,603,527 | ) |
| | | | | | | | | | | | | | | | |
Net Increase (Decrease) | | | 371,436 | | | | 4,624,619 | | | | 226,032 | | | | 2,899,299 | |
| | | | | | | | | | | | | | | | |
Class I | | | | | | | | | | | | | | | | |
Shares Sold | | | 539,691 | | | $ | 8,295,992 | | | | 1,555,731 | | | $ | 25,797,606 | |
Shares Issued for Reinvested Dividends | | | 232,153 | | | | 3,359,439 | | | | 81,259 | | | | 1,218,068 | |
Shares Redeemed | | | (784,834 | ) | | | (12,140,200 | ) | | | (555,709 | ) | | | (9,147,262 | ) |
| | | | | | | | | | | | | | | | |
Net Increase (Decrease) | | | (12,990 | ) | | | (484,769 | ) | | | 1,081,281 | | | | 17,868,412 | |
| | | | | | | | | | | | | | | | |
Class R3 | | | | | | | | | | | | | | | | |
Shares Sold | | | 134,616 | | | $ | 2,214,199 | | | | 353,372 | | | $ | 5,996,958 | |
Shares Issued for Reinvested Dividends | | | 70,619 | | | | 1,059,988 | | | | 27,857 | | | | 434,856 | |
Shares Redeemed | | | (232,450 | ) | | | (3,734,514 | ) | | | (94,647 | ) | | | (1,592,846 | ) |
| | | | | | | | | | | | | | | | |
Net Increase (Decrease) | | | (27,215 | ) | | | (460,327 | ) | | | 286,582 | | | | 4,838,968 | |
| | | | | | | | | | | | | | | | |
Class R4 | | | | | | | | | | | | | | | | |
Shares Sold | | | 217,612 | | | $ | 3,541,153 | | | | 301,832 | | | $ | 5,225,012 | |
Shares Issued for Reinvested Dividends | | | 60,130 | | | | 913,209 | | | | 28,516 | | | | 447,991 | |
Shares Redeemed | | | (76,546 | ) | | | (1,265,491 | ) | | | (77,051 | ) | | | (1,326,268 | ) |
| | | | | | | | | | | | | | | | |
Net Increase (Decrease) | | | 201,196 | | | | 3,188,871 | | | | 253,297 | | | | 4,346,735 | |
| | | | | | | | | | | | | | | | |
|
| Hartford Funds – Domestic Equity Funds |
Notes to Financial Statements – (continued)
April 30, 2015
| | | | | | | | | | | | | | | | |
| | | For the Six-Month Period
Ended April 30, 2015 | | | For the Year Ended
October 31, 2014 | |
| | | Shares | | | Amount | | | Shares | | | Amount | |
Class R5 | | | | | | | | | | | | | | | | |
Shares Sold | | | 331,087 | | | $ | 5,600,181 | | | | 116,642 | | | $ | 2,004,805 | |
Shares Issued for Reinvested Dividends | | | 20,697 | | | | 317,777 | | | | 7,864 | | | | 124,254 | |
Shares Redeemed | | | (57,493 | ) | | | (950,038 | ) | | | (39,591 | ) | | | (673,078 | ) |
| | | | | | | | | | | | | | | | |
Net Increase (Decrease) | | | 294,291 | | | | 4,967,920 | | | | 84,915 | | | | 1,455,981 | |
| | | | | | | | | | | | | | | | |
Class Y | | | | | | | | | | | | | | | | |
Shares Sold | | | 595,644 | | | $ | 9,699,519 | | | | 3,017,935 | | | $ | 53,095,854 | |
Shares Issued for Reinvested Dividends | | | 1,175,452 | | | | 18,085,601 | | | | 842,561 | | | | 13,320,892 | |
Shares Redeemed | | | (1,281,792 | ) | | | (21,420,447 | ) | | | (3,170,911 | ) | | | (55,411,888 | ) |
| | | | | | | | | | | | | | | | |
Net Increase | | | 489,304 | | | | 6,364,673 | | | | 689,585 | | | | 11,004,858 | |
| | | | | | | | | | | | | | | | |
Total Net Increase (Decrease) | | | 3,142,011 | | | $ | 44,577,951 | | | | 3,274,737 | | | $ | 51,135,099 | |
| | | | | | | | | | | | | | | | |
Small Company Fund
| | | | | | | | | | | | | | | | |
| | | For the Six-Month Period
Ended April 30, 2015 | | | For the Year Ended
October 31, 2014 | |
| | | Shares | | | Amount | | | Shares | | | Amount | |
Class A | | | | | | | | | | | | | | | | |
Shares Sold | | | 2,415,068 | | | $ | 52,510,179 | | | | 2,541,227 | | | $ | 60,828,563 | |
Shares Issued for Reinvested Dividends | | | 2,859,231 | | | | 57,642,102 | | | | 1,601,959 | | | | 35,947,971 | |
Shares Redeemed | | | (2,139,591 | ) | | | (46,454,325 | ) | | | (2,911,289 | ) | | | (69,115,332 | ) |
Shares converted (from) Class B into Class A | | | 14,558 | | | | 314,336 | | | | 21,279 | | | | 510,055 | |
| | | | | | | | | | | | | | | | |
Net Increase (Decrease) | | | 3,149,266 | | | | 64,012,292 | | | | 1,253,176 | | | | 28,171,257 | |
| | | | | | | | | | | | | | | | |
Class B | | | | | | | | | | | | | | | | |
Shares Sold | | | 4,777 | | | $ | 79,043 | | | | 11,055 | | | $ | 215,565 | |
Shares Issued for Reinvested Dividends | | | 55,903 | | | | 884,387 | | | | 38,825 | | | | 720,600 | |
Shares Redeemed | | | (37,573 | ) | | | (648,837 | ) | | | (87,870 | ) | | | (1,659,952 | ) |
Shares converted (from) Class B into Class A | | | (18,534 | ) | | | (314,336 | ) | | | (21,279 | ) | | | (510,055 | ) |
| | | | | | | | | | | | | | | | |
Net Increase (Decrease) | | | 4,573 | | | | 257 | | | | (59,269 | ) | | | (1,233,842 | ) |
| | | | | | | | | | | | | | | | |
Class C | | | | | | | | | | | | | | | | |
Shares Sold | | | 182,449 | | | $ | 3,136,296 | | | | 171,050 | | | $ | 3,365,868 | |
Shares Issued for Reinvested Dividends | | | 462,372 | | | | 7,296,225 | | | | 256,524 | | | | 4,748,255 | |
Shares Redeemed | | | (160,147 | ) | | | (2,756,317 | ) | | | (394,247 | ) | | | (7,788,859 | ) |
| | | | | | | | | | | | | | | | |
Net Increase (Decrease) | | | 484,674 | | | | 7,676,204 | | | | 33,327 | | | | 325,264 | |
| | | | | | | | | | | | | | | | |
Class I | | | | | | | | | | | | | | | | |
Shares Sold | | | 818,885 | | | $ | 18,413,538 | | | | 1,148,787 | | | $ | 28,254,416 | |
Shares Issued for Reinvested Dividends | | | 459,818 | | | | 9,578,007 | | | | 185,871 | | | | 4,275,036 | |
Shares Redeemed | | | (416,320 | ) | | | (9,243,131 | ) | | | (508,644 | ) | | | (12,311,239 | ) |
| | | | | | | | | | | | | | | | |
Net Increase (Decrease) | | | 862,383 | | | | 18,748,414 | | | | 826,014 | | | | 20,218,213 | |
| | | | | | | | | | | | | | | | |
Class R3 | | | | | | | | | | | | | | | | |
Shares Sold | | | 181,270 | | | $ | 4,336,645 | | | | 471,390 | | | $ | 11,862,900 | |
Shares Issued for Reinvested Dividends | | | 425,197 | | | | 9,218,261 | | | | 251,977 | | | | 6,019,720 | |
Shares Redeemed | | | (1,115,388 | ) | | | (25,389,788 | ) | | | (662,425 | ) | | | (16,758,413 | ) |
| | | | | | | | | | | | | | | | |
Net Increase (Decrease) | | | (508,921 | ) | | | (11,834,882 | ) | | | 60,942 | | | | 1,124,207 | |
| | | | | | | | | | | | | | | | |
|
| Hartford Funds – Domestic Equity Funds |
Notes to Financial Statements – (continued)
April 30, 2015
| | | | | | | | | | | | | | | | |
| | | For the Six-Month Period
Ended April 30, 2015 | | | For the Year Ended
October 31, 2014 | |
| | | Shares | | | Amount | | | Shares | | | Amount | |
Class R4 | | | | | | | | | | | | | | | | |
Shares Sold | | | 341,944 | | | $ | 8,282,694 | | | | 512,639 | | | $ | 13,324,559 | |
Shares Issued for Reinvested Dividends | | | 437,726 | | | | 9,844,453 | | | | 276,453 | | | | 6,789,685 | |
Shares Redeemed | | | (322,714 | ) | | | (7,903,685 | ) | | | (882,136 | ) | | | (22,955,392 | ) |
| | | | | | | | | | | | | | | | |
Net Increase (Decrease) | | | 456,956 | | | | 10,223,462 | | | | (93,044 | ) | | | (2,841,148 | ) |
| | | | | | | | | | | | | | | | |
Class R5 | | | | | | | | | | | | | | | | |
Shares Sold | | | 180,374 | | | $ | 4,544,018 | | | | 62,309 | | | $ | 1,670,794 | |
Shares Issued for Reinvested Dividends | | | 52,863 | | | | 1,227,471 | | | | 34,457 | | | | 866,941 | |
Shares Redeemed | | | (56,086 | ) | | | (1,395,951 | ) | | | (130,979 | ) | | | (3,470,808 | ) |
| | | | | | | | | | | | | | | | |
Net Increase (Decrease) | | | 177,151 | | | | 4,375,538 | | | | (34,213 | ) | | | (933,073 | ) |
| | | | | | | | | | | | | | | | |
Class R6(1) | | | | | | | | | | | | | | | | |
Shares Sold | | | 354 | | | $ | 10,000 | | | | — | | | $ | — | |
Shares Issued for Reinvested Dividends | | | 62 | | | | 1,449 | | | | — | | | | — | |
| | | | | | | | | | | | | | | | |
Net Increase (Decrease) | | | 416 | | | | 11,449 | | | | — | | | | — | |
| | | | | | | | | | | | | | | | |
Class Y | | | | | | | | | | | | | | | | |
Shares Sold | | | 1,225,026 | | | $ | 31,312,501 | | | | 3,389,614 | | | $ | 92,150,907 | |
Shares Issued for Reinvested Dividends | | | 2,055,037 | | | | 48,355,023 | | | | 1,244,995 | | | | 31,660,217 | |
Shares Redeemed | | | (1,216,476 | ) | | | (31,488,139 | ) | | | (4,324,824 | ) | | | (117,597,719 | ) |
| | | | | | | | | | | | | | | | |
Net Increase | | | 2,063,587 | | | | 48,179,385 | | | | 309,785 | | | | 6,213,405 | |
| | | | | | | | | | | | | | | | |
Total Net Increase (Decrease) | | | 6,690,085 | | | $ | 141,392,119 | | | | 2,296,718 | | | $ | 51,044,283 | |
| | | | | | | | | | | | | | | | |
| | (1) | Commenced operations on November 7, 2014. |
Small/Mid Cap Equity Fund
| | | | | | | | | | | | | | | | |
| | | For the Six-Month Period
Ended April 30, 2015 | | | For the Year Ended
October 31, 2014 | |
| | | Shares | | | Amount | | | Shares | | | Amount | |
Class A | | | | | | | | | | | | | | | | |
Shares Sold | | | 382,447 | | | $ | 5,034,345 | | | | 589,635 | | | $ | 8,024,210 | |
Shares Issued for Reinvested Dividends | | | 420,436 | | | | 5,202,022 | | | | 549,748 | | | | 7,186,719 | |
Shares Redeemed | | | (423,000 | ) | | | (5,549,306 | ) | | | (719,229 | ) | | | (9,768,583 | ) |
Shares converted (from) Class B into Class A | | | 25,544 | | | | 338,015 | | | | 40,877 | | | | 561,616 | |
| | | | | | | | | | | | | | | | |
Net Increase (Decrease) | | | 405,427 | | | | 5,025,076 | | | | 461,031 | | | | 6,003,962 | |
| | | | | | | | | | | | | | | | |
Class B | | | | | | | | | | | | | | | | |
Shares Sold | | | 1,013 | | | $ | 12,096 | | | | 4,027 | | | $ | 52,801 | |
Shares Issued for Reinvested Dividends | | | 24,551 | | | | 284,304 | | | | 46,566 | | | | 573,681 | |
Shares Redeemed | | | (38,900 | ) | | | (480,161 | ) | | | (80,402 | ) | | | (1,013,846 | ) |
Shares converted (from) Class B into Class A | | | (27,114 | ) | | | (338,015 | ) | | | (40,877 | ) | | | (561,616 | ) |
| | | | | | | | | | | | | | | | |
Net Increase (Decrease) | | | (40,450 | ) | | | (521,776 | ) | | | (70,686 | ) | | | (948,980 | ) |
| | | | | | | | | | | | | | | | |
Class C | | | | | | | | | | | | | | | | |
Shares Sold | | | 81,506 | | | $ | 1,004,288 | | | | 193,068 | | | $ | 2,481,316 | |
Shares Issued for Reinvested Dividends | | | 112,859 | | | | 1,288,848 | | | | 140,831 | | | | 1,719,096 | |
Shares Redeemed | | | (88,022 | ) | | | (1,068,684 | ) | | | (167,676 | ) | | | (2,148,060 | ) |
| | | | | | | | | | | | | | | | |
Net Increase (Decrease) | | | 106,343 | | | | 1,224,452 | | | | 166,223 | | | | 2,052,352 | |
| | | | | | | | | | | | | | | | |
|
| Hartford Funds – Domestic Equity Funds |
Notes to Financial Statements – (continued)
April 30, 2015
| | | | | | | | | | | | | | | | |
| | | For the Six-Month Period
Ended April 30, 2015 | | | For the Year Ended
October 31, 2014 | |
| | | Shares | | | Amount | | | Shares | | | Amount | |
Class I(1) | | | | | | | | | | | | | | | | |
Shares Sold | | | 7,463 | | | $ | 100,000 | | | | — | | | $ | — | |
| | | | | | | | | | | | | | | | |
Net Increase (Decrease) | | | 7,463 | | | | 100,000 | | | | — | | | | — | |
| | | | | | | | | | | | | | | | |
Class R3 | | | | | | | | | | | | | | | | |
Shares Sold | | | 12,154 | | | $ | 163,549 | | | | 16,147 | | | $ | 226,328 | |
Shares Issued for Reinvested Dividends | | | 4,189 | | | | 53,140 | | | | 6,140 | | | | 82,317 | |
Shares Redeemed | | | (2,784 | ) | | | (37,458 | ) | | | (20,605 | ) | | | (276,545 | ) |
| | | | | | | | | | | | | | | | |
Net Increase (Decrease) | | | 13,559 | | | | 179,231 | | | | 1,682 | | | | 32,100 | |
| | | | | | | | | | | | | | | | |
Class R4 | | | | | | | | | | | | | | | | |
Shares Sold | | | 3,510 | | | $ | 47,144 | | | | 23,726 | | | $ | 329,293 | |
Shares Issued for Reinvested Dividends | | | 2,874 | | | | 36,652 | | | | 1,797 | | | | 24,107 | |
Shares Redeemed | | | (2,834 | ) | | | (38,790 | ) | | | (725 | ) | | | (10,164 | ) |
| | | | | | | | | | | | | | | | |
Net Increase (Decrease) | | | 3,550 | | | | 45,006 | | | | 24,798 | | | | 343,236 | |
| | | | | | | | | | | | | | | | |
Class R5 | | | | | | | | | | | | | | | | |
Shares Sold | | | 1,203 | | | $ | 16,717 | | | | 1,290 | | | $ | 17,772 | |
Shares Issued for Reinvested Dividends | | | 1,608 | | | | 20,616 | | | | 1,791 | | | | 24,140 | |
| | | | | | | | | | | | | | | | |
Net Increase (Decrease) | | | 2,811 | | | | 37,333 | | | | 3,081 | | | | 41,912 | |
| | | | | | | | | | | | | | | | |
Class Y | | | | | | | | | | | | | | | | |
Shares Sold | | | 81,831 | | | $ | 1,148,017 | | | | 101 | | | $ | 1,381 | |
Shares Issued for Reinvested Dividends | | | 5,845 | | | | 74,879 | | | | 2,382 | | | | 32,088 | |
Shares Redeemed | | | (6,277 | ) | | | (84,846 | ) | | | — | | | | — | |
| | | | | | | | | | | | | | | | |
Net Increase | | | 81,399 | | | | 1,138,050 | | | | 2,483 | | | | 33,469 | |
| | | | | | | | | | | | | | | | |
Total Net Increase (Decrease) | | | 580,102 | | | $ | 7,227,372 | | | | 588,612 | | | $ | 7,558,051 | |
| | | | | | | | | | | | | | | | |
| | (1) | Commenced operations on March 31, 2015. |
SmallCap Growth Fund
| | | | | | | | | | | | | | | | |
| | | For the Six-Month Period
Ended April 30, 2015 | | | For the Year Ended
October 31, 2014 | |
| | | Shares | | | Amount | | | Shares | | | Amount | |
Class A | | | | | | | | | | | | | | | | |
Shares Sold | | | 875,995 | | | $ | 43,055,709 | | | | 932,647 | | | $ | 44,158,010 | |
Shares Issued for Reinvested Dividends | | | 219,479 | | | | 10,280,405 | | | | 351,327 | | | | 16,009,966 | |
Shares Redeemed | | | (785,478 | ) | | | (40,170,073 | ) | | | (1,104,634 | ) | | | (52,507,554 | ) |
Shares converted (from) Class B into Class A | | | 5,780 | | | | 291,094 | | | | 20,515 | | | | 976,851 | |
| | | | | | | | | | | | | | | | |
Net Increase (Decrease) | | | 315,776 | | | | 13,457,135 | | | | 199,855 | | | | 8,637,273 | |
| | | | | | | | | | | | | | | | |
Class B | | | | | | | | | | | | | | | | |
Shares Sold | | | 241 | | | $ | 9,307 | | | | 4,950 | | | $ | 199,323 | |
Shares Issued for Reinvested Dividends | | | 3,349 | | | | 128,001 | | | | 9,307 | | | | 352,381 | |
Shares Redeemed | | | (10,975 | ) | | | (453,849 | ) | | | (39,089 | ) | | | (1,377,937 | ) |
Shares converted (from) Class B into Class A | | | (7,084 | ) | | | (291,094 | ) | | | (20,515 | ) | | | (976,851 | ) |
| | | | | | | | | | | | | | | | |
Net Increase (Decrease) | | | (14,469 | ) | | | (607,635 | ) | | | (45,347 | ) | | | (1,803,084 | ) |
| | | | | | | | | | | | | | | | |
|
| Hartford Funds – Domestic Equity Funds |
Notes to Financial Statements – (continued)
April 30, 2015
| | | | | | | | | | | | | | | | |
| | | For the Six-Month Period
Ended April 30, 2015 | | | For the Year Ended
October 31, 2014 | |
| | | Shares | | | Amount | | | Shares | | | Amount | |
Class C | | | | | | | | | | | | | | | | |
Shares Sold | | | 224,939 | | | $ | 9,034,228 | | | | 382,352 | | | $ | 14,891,568 | |
Shares Issued for Reinvested Dividends | | | 60,618 | | | | 2,296,226 | | | | 75,636 | | | | 2,835,586 | |
Shares Redeemed | | | (102,645 | ) | | | (4,128,537 | ) | | | (176,563 | ) | | | (6,825,650 | ) |
| | | | | | | | | | | | | | | | |
Net Increase (Decrease) | | | 182,912 | | | | 7,201,917 | | | | 281,425 | | | | 10,901,504 | |
| | | | | | | | | | | | | | | | |
Class I | | | | | | | | | | | | | | | | |
Shares Sold | | | 2,341,163 | | | $ | 118,169,784 | | | | 1,745,122 | | | $ | 84,480,622 | |
Shares Issued for Reinvested Dividends | | | 98,145 | | | | 4,689,390 | | | | 101,805 | | | | 4,714,582 | |
Shares Redeemed | | | (983,767 | ) | | | (51,304,924 | ) | | | (1,008,656 | ) | | | (48,341,679 | ) |
| | | | | | | | | | | | | | | | |
Net Increase (Decrease) | | | 1,455,541 | | | | 71,554,250 | | | | 838,271 | | | | 40,853,525 | |
| | | | | | | | | | | | | | | | |
Class R3 | | | | | | | | | | | | | | | | |
Shares Sold | | | 167,720 | | | $ | 8,278,418 | | | | 172,834 | | | $ | 8,220,121 | |
Shares Issued for Reinvested Dividends | | | 6,988 | | | | 327,938 | | | | 12,268 | | | | 561,517 | |
Shares Redeemed | | | (41,520 | ) | | | (2,065,164 | ) | | | (177,582 | ) | | | (8,135,678 | ) |
| | | | | | | | | | | | | | | | |
Net Increase (Decrease) | | | 133,188 | | | | 6,541,192 | | | | 7,520 | | | | 645,960 | |
| | | | | | | | | | | | | | | | |
Class R4 | | | | | | | | | | | | | | | | |
Shares Sold | | | 648,446 | | | $ | 33,012,594 | | | | 734,819 | | | $ | 35,982,533 | |
Shares Issued for Reinvested Dividends | | | 35,955 | | | | 1,728,699 | | | | 23,939 | | | | 1,117,967 | |
Shares Redeemed | | | (233,287 | ) | | | (11,956,471 | ) | | | (170,537 | ) | | | (8,206,082 | ) |
| | | | | | | | | | | | | | | | |
Net Increase (Decrease) | | | 451,114 | | | | 22,784,822 | | | | 588,221 | | | | 28,894,418 | |
| | | | | | | | | | | | | | | | |
Class R5 | | | | | | | | | | | | | | | | |
Shares Sold | | | 1,244,415 | | | $ | 64,498,005 | | | | 814,540 | | | $ | 40,296,385 | |
Shares Issued for Reinvested Dividends | | | 37,778 | | | | 1,865,099 | | | | 10,732 | | | | 512,463 | |
Shares Redeemed | | | (123,567 | ) | | | (6,529,958 | ) | | | (117,183 | ) | | | (5,806,300 | ) |
| | | | | | | | | | | | | | | | |
Net Increase (Decrease) | | | 1,158,626 | | | | 59,833,146 | | | | 708,089 | | | | 35,002,548 | |
| | | | | | | | | | | | | | | | |
Class R6(1) | | | | | | | | | | | | | | | | |
Shares Sold | | | 193 | | | $ | 10,000 | | | | — | | | $ | — | |
Shares Issued for Reinvested Dividends | | | 8 | | | | 409 | | | | — | | | | — | |
| | | | | | | | | | | | | | | | |
Net Increase (Decrease) | | | 201 | | | | 10,409 | | | | — | | | | — | |
| | | | | | | | | | | | | | | | |
Class Y | | | | | | | | | | | | | | | | |
Shares Sold | | | 2,122,466 | | | $ | 111,582,557 | | | | 2,927,951 | | | $ | 146,371,693 | |
Shares Issued for Reinvested Dividends | | | 193,409 | | | | 9,620,151 | | | | 172,355 | | | | 8,281,641 | |
Shares Redeemed | | | (668,330 | ) | | | (35,344,622 | ) | | | (1,359,190 | ) | | | (66,414,720 | ) |
| | | | | | | | | | | | | | | | |
Net Increase | | | 1,647,545 | | | | 85,858,086 | | | | 1,741,116 | | | | 88,238,614 | |
| | | | | | | | | | | | | | | | |
Total Net Increase (Decrease) | | | 5,330,434 | | | $ | 266,633,322 | | | | 4,319,150 | | | $ | 211,370,758 | |
| | | | | | | | | | | | | | | | |
| | (1) | Commenced operations on November 7, 2014. |
|
| Hartford Funds – Domestic Equity Funds |
Notes to Financial Statements – (continued)
April 30, 2015
Value Opportunities Fund
| | | | | | | | | | | | | | | | |
| | | For the Six-Month Period
Ended April 30, 2015 | | | For the Year Ended
October 31, 2014 | |
| | | Shares | | | Amount | | | Shares | | | Amount | |
Class A | | | | | | | | | | | | | | | | |
Shares Sold | | | 483,932 | | | $ | 9,382,813 | | | | 1,855,718 | | | $ | 36,368,099 | |
Issued in Merger | | | — | | | | — | | | | 5,068,560 | | | | 101,052,895 | |
Shares Issued for Reinvested Dividends | | | 945,072 | | | | 17,480,234 | | | | 28,344 | | | | 535,986 | |
Shares Redeemed | | | (1,548,203 | ) | | | (29,898,474 | ) | | | (1,825,565 | ) | | | (36,590,641 | ) |
Shares converted (from) Class B into Class A | | | 26,567 | | | | 518,830 | | | | 35,931 | | | | 712,192 | |
| | | | | | | | | | | | | | | | |
Net Increase (Decrease) | | | (92,632 | ) | | | (2,516,597 | ) | | | 5,162,988 | | | | 102,078,531 | |
| | | | | | | | | | | | | | | | |
Class B | | | | | | | | | | | | | | | | |
Shares Sold | | | 1,833 | | | $ | 30,533 | | | | 6,907 | | | $ | 55,902 | |
Issued in Merger | | | — | | | | — | | | | 99,401 | | | | 1,772,987 | |
Shares Issued for Reinvested Dividends | | | 16,686 | | | | 271,313 | | | | — | | | | — | |
Shares Redeemed | | | (41,180 | ) | | | (702,065 | ) | | | (88,477 | ) | | | (1,498,211 | ) |
Shares converted (from) Class B into Class A | | | (29,977 | ) | | | (518,830 | ) | | | (35,931 | ) | | | (712,192 | ) |
| | | | | | | | | | | | | | | | |
Net Increase (Decrease) | | | (52,638 | ) | | | (919,049 | ) | | | (18,100 | ) | | | (381,514 | ) |
| | | | | | | | | | | | | | | | |
Class C | | | | | | | | | | | | | | | | |
Shares Sold | | | 104,510 | | | $ | 1,758,645 | | | | 216,378 | | | $ | 3,944,942 | |
Issued in Merger | | | — | | | | — | | | | 1,136,845 | | | | 20,188,547 | |
Shares Issued for Reinvested Dividends | | | 126,635 | | | | 2,052,542 | | | | — | | | | — | |
Shares Redeemed | | | (269,778 | ) | | | (4,616,005 | ) | | | (282,459 | ) | | | (5,021,009 | ) |
| | | | | | | | | | | | | | | | |
Net Increase (Decrease) | | | (38,633 | ) | | | (804,818 | ) | | | 1,070,764 | | | | 19,112,480 | |
| | | | | | | | | | | | | | | | |
Class I | | | | | | | | | | | | | | | | |
Shares Sold | | | 167,783 | | | $ | 3,177,201 | | | | 2,028,716 | | | $ | 40,625,577 | |
Issued in Merger | | | — | | | | — | | | | 496,445 | | | | 9,781,014 | |
Shares Issued for Reinvested Dividends | | | 162,322 | | | | 2,974,924 | | | | 2,990 | | | | 55,830 | |
Shares Redeemed | | | (781,936 | ) | | | (14,725,142 | ) | | | (776,654 | ) | | | (15,265,915 | ) |
| | | | | | | | | | | | | | | | |
Net Increase (Decrease) | | | (451,831 | ) | | | (8,573,017 | ) | | | 1,751,497 | | | | 35,196,506 | |
| | | | | | | | | | | | | | | | |
Class R3 | | | | | | | | | | | | | | | | |
Shares Sold | | | 22,815 | | | $ | 445,723 | | | | 98,970 | | | $ | 1,986,629 | |
Issued in Merger | | | — | | | | — | | | | 161,178 | | | | 3,246,366 | |
Shares Issued for Reinvested Dividends | | | 16,813 | | | | 313,532 | | | | 227 | | | | 4,335 | |
Shares Redeemed | | | (59,266 | ) | | | (1,160,004 | ) | | | (120,782 | ) | | | (2,486,351 | ) |
| | | | | | | | | | | | | | | | |
Net Increase (Decrease) | | | (19,638 | ) | | | (400,749 | ) | | | 139,593 | | | | 2,750,979 | |
| | | | | | | | | | | | | | | | |
Class R4 | | | | | | | | | | | | | | | | |
Shares Sold | | | 70,795 | | | $ | 1,382,010 | | | | 270,983 | | | $ | 5,477,900 | |
Issued in Merger | | | — | | | | — | | | | 489,772 | | | | 9,940,224 | |
Shares Issued for Reinvested Dividends | | | 37,586 | | | | 709,328 | | | | 1,892 | | | | 36,397 | |
Shares Redeemed | | | (103,342 | ) | | | (2,051,946 | ) | | | (498,254 | ) | | | (10,220,618 | ) |
| | | | | | | | | | | | | | | | |
Net Increase (Decrease) | | | 5,039 | | | | 39,392 | | | | 264,393 | | | | 5,233,903 | |
| | | | | | | | | | | | | | | | |
Class R5 | | | | | | | | | | | | | | | | |
Shares Sold | | | 11,851 | | | $ | 234,941 | | | | 94,216 | | | $ | 2,417,503 | |
Issued in Merger | | | — | | | | — | | | | 1,251,688 | | | | 25,515,291 | |
Shares Issued for Reinvested Dividends | | | 10,587 | | | | 201,247 | | | | 622 | | | | 12,015 | |
Shares Redeemed | | | (19,694 | ) | | | (395,741 | ) | | | (1,317,750 | ) | | | (27,523,222 | ) |
| | | | | | | | | | | | | | | | |
Net Increase (Decrease) | | | 2,744 | | | | 40,447 | | | | 28,776 | | | | 421,587 | |
| | | | | | | | | | | | | | | | |
|
| Hartford Funds – Domestic Equity Funds |
Notes to Financial Statements – (continued)
April 30, 2015
| | | | | | | | | | | | | | | | |
| | | For the Six-Month Period
Ended April 30, 2015 | | | For the Year Ended
October 31, 2014 | |
| | | Shares | | | Amount | | | Shares | | | Amount | |
Class Y | | | | | | | | | | | | | | | | |
Shares Sold | | | 5,460 | | | $ | 112,462 | | | | 14,941 | | | $ | 23,067,477 | |
Issued in Merger | | | — | | | | — | | | | 20,622 | | | | 421,809 | |
Shares Issued for Reinvested Dividends | | | 7,522 | | | | 143,556 | | | | 493 | | | | 9,555 | |
Shares Redeemed | | | (8,863 | ) | | | (170,129 | ) | | | (9,545 | ) | | | (23,177,272 | ) |
| | | | | | | | | | | | | | | | |
Net Increase | | | 4,119 | | | | 85,889 | | | | 26,511 | | | | 321,569 | |
| | | | | | | | | | | | | | | | |
Total Net Increase (Decrease) | | | (643,470 | ) | | $ | (13,048,502 | ) | | | 8,426,422 | | | $ | 164,734,041 | |
| | | | | | | | | | | | | | | | |
Each Fund, together with certain other Hartford Funds, participates in a $350 million committed revolving line of credit facility. The facility is to be used for temporary or emergency purposes. Under the arrangement, the funds are required to own securities having a market value in excess of 300% of the total bank borrowings. The interest rate on borrowings varies depending on the nature of the loan. The facility also requires a fee to be paid based on the amount of the commitment. This commitment fee is allocated to all the funds participating in the line of credit based on the average net assets of the funds. During the six-month period ended April 30, 2015, none of the Funds had borrowings under this facility.
| 12. | Pending Legal Proceedings: |
On February 25, 2011, Jennifer L. Kasilag, Louis Mellinger, Judith M. Menendez, Jacqueline M. Robinson, and Linda A. Russell filed a derivative lawsuit against Hartford Investment Financial Services, LLC (“HIFSCO”) (now known as HFD) on behalf of six Hartford retail mutual funds in the United States District Court for the District of New Jersey, alleging that HIFSCO received excessive advisory and distribution fees in violation of its statutory fiduciary duty under Section 36(b) of the 1940 Act when serving as investment manager and principal underwriter, respectively, to the Hartford retail mutual funds. Although this action was purportedly filed on behalf of certain of the Hartford Funds, none of the Hartford Funds is itself a defendant to the suit. HIFSCO moved to dismiss and, in September 2011, the motion was granted in part and denied in part, with leave to amend the complaint. In November 2011, plaintiffs filed an amended complaint on behalf of certain Hartford retail mutual funds, The Hartford Global Health Fund (now known as The Hartford Healthcare Fund), The Hartford Conservative Allocation Fund, The Hartford Growth Opportunities Fund, The Hartford Inflation Plus Fund, The Hartford Advisers Fund (now known as The Hartford Balanced Fund), and The Hartford Capital Appreciation Fund. Plaintiffs seek to rescind the investment management agreements and distribution plans between HIFSCO and these funds and to recover the total fees charged thereunder or, in the alternative, to recover any improper compensation HIFSCO received, in addition to lost earnings. HIFSCO filed a partial motion to dismiss the amended complaint and, in December 2012, the court dismissed without prejudice the claims regarding distribution fees and denied the motion with respect to the advisory fees claims. In March 2014, the plaintiffs filed a new complaint that added as new plaintiffs The Hartford Floating Rate Fund and The Hartford Small Company Fund and named as a defendant HFMC, which assumed the role as investment manager to the funds as of January 2013. In March 2015, the plaintiffs filed a new complaint that removed The Hartford Small Company Fund as a plaintiff. Discovery is ongoing. HFMC and HIFSCO dispute the allegations and have filed a motion for summary judgment.
No accrual for litigation relating to this matter has been recorded in the financial statements of the Funds because the Funds are not party to the suit.
Under the Company’s organizational documents, each Company shall indemnify its officers and directors to the full extent required or permitted under Maryland General Corporation Law and the federal securities laws. In addition, each Company, on behalf of each Fund, may enter into contracts that contain a variety of indemnifications. Each Company’s maximum exposure under these arrangements is unknown. However, as of the date of these financial statements, each Company has not had prior claims or losses pursuant to these contracts and expects the risk of loss to be remote.
|
| Hartford Funds – Domestic Equity Funds |
Notes to Financial Statements – (continued)
April 30, 2015
| 14. | Recent Accounting Pronouncement: |
In June 2014, the Financial Accounting Standards Board (FASB) issued Accounting Standards Update (ASU) No. 2014-11, Transfers and Servicing (Topic 860): Repurchase-to-Maturity Transactions, Repurchase Financings, and Disclosures, modifying Accounting Standards Codification Topic 860. The amended guidance changes the accounting for repurchase-to-maturity transactions and repurchase financing arrangements. The guidance also requires new disclosures for certain transfers accounted for as sales and collateral supporting transactions that are accounted for as secured borrowings. ASU 2014-11 is effective for annual and interim periods beginning after December 15, 2014, except for the disclosures related to secured borrowings, which are effective for annual periods beginning after December 15, 2014, and for interim periods beginning after March 15, 2015. The adoption of ASU 2014-11 is not expected to have a material impact on the Fund’s results of operations or financial position, but may impact the Fund’s disclosures.
|
| Hartford Funds – Domestic Equity Funds |
Financial Highlights
| | | | | | | | | | | | | | | | | | | | | | | | | | | | | | | | | | | | | | | | | | | | | | | | | | | | | | | | | | | | |
| | | — Selected Per-Share Data(1) — | | | — Ratios and Supplemental Data — | |
Class | | Net Asset
Value at,
Beginning
of Period | | | Net
Investment
Income
(Loss) | | | Net
Realized
and
Unrealized
Gain (Loss)
on
Investments | | | Total from
Investment
Operations | | | Dividends
from Net
Investment
Income | | | Distributions
from
Realized
Capital
Gains | | | Distributions
Capital | | | Total
Dividends
and
Distributions | | | Net
Asset
Value
End of
Period | | | Total
Return(2) | | | Net
Assets at
End of
Period
(000s) | | | Ratio of
Expenses
to
Average
Net
Assets
Before
Adjust-
ments(3) | | | Ratio of
Expenses
to
Average
Net
Assets
After
Adjust-
ments(3) | | | Ratio of
Net
Investment
Income
(Loss) to
Average
Net Assets | | | Portfolio
Turnover | |
| The Hartford Capital Appreciation Fund | | | | | | | | | | | | | | | | | | | | | | | | | | | | | | | | | | | | | | | | | |
For the Six-Month Period Ended April 30, 2015 (Unaudited) | | | | | | | | | | | | | | | | | | | | | | | | | | | | | | | | | | | | | | | | | |
A | | $ | 49.44 | | | $ | 0.09 | | | $ | 1.85 | | | $ | 1.94 | | | $ | (0.13 | ) | | $ | (12.56 | ) | | $ | — | | | $ | (12.69 | ) | | $ | 38.69 | | | | 5.65 | %(4) | | $ | 5,758,185 | | | | 1.07 | %(5) | | | 1.07 | %(5) | | | 0.43 | %(5) | | | 41 | % |
B | | | 42.72 | | | | (0.08 | ) | | | 1.49 | | | | 1.41 | | | | — | | | | (12.56 | ) | | | — | | | | (12.56 | ) | | | 31.57 | | | | 5.19 | (4) | | | 206,889 | | | | 1.95 | (5) | | | 1.95 | (5) | | | (0.46 | )(5) | | | 41 | |
C | | | 43.13 | | | | (0.05 | ) | | | 1.52 | | | | 1.47 | | | | — | | | | (12.56 | ) | | | — | | | | (12.56 | ) | | | 32.04 | | | | 5.31 | (4) | | | 1,932,773 | | | | 1.80 | (5) | | | 1.80 | (5) | | | (0.30 | )(5) | | | 41 | |
I | | | 49.60 | | | | 0.14 | | | | 1.85 | | | | 1.99 | | | | (0.25 | ) | | | (12.56 | ) | | | — | | | | (12.81 | ) | | | 38.78 | | | | 5.78 | (4) | | | 1,844,472 | | | | 0.80 | (5) | | | 0.80 | (5) | | | 0.70 | (5) | | | 41 | |
R3 | | | 52.24 | | | | 0.02 | | | | 2.00 | | | | 2.02 | | | | — | | | | (12.56 | ) | | | — | | | | (12.56 | ) | | | 41.70 | | | | 5.46 | (4) | | | 133,248 | | | | 1.40 | (5) | | | 1.40 | (5) | | | 0.10 | (5) | | | 41 | |
R4 | | | 53.19 | | | | 0.09 | | | | 2.05 | | | | 2.14 | | | | (0.11 | ) | | | (12.56 | ) | | | — | | | | (12.67 | ) | | | 42.66 | | | | 5.64 | (4) | | | 185,254 | | | | 1.09 | (5) | | | 1.09 | (5) | | | 0.41 | (5) | | | 41 | |
R5 | | | 53.92 | | | | 0.16 | | | | 2.09 | | | | 2.25 | | | | (0.23 | ) | | | (12.56 | ) | | | — | | | | (12.79 | ) | | | 43.38 | | | | 5.80 | (4) | | | 55,059 | | | | 0.79 | (5) | | | 0.79 | (5) | | | 0.71 | (5) | | | 41 | |
R6(6) | | | 54.32 | | | | 0.17 | | | | 1.92 | | | | 2.09 | | | | (0.28 | ) | | | (12.56 | ) | | | — | | | | (12.84 | ) | | | 43.57 | | | | 5.47 | (4) | | | 11 | | | | 0.71 | (5) | | | 0.71 | (5) | | | 0.79 | (5) | | | 41 | |
Y | | | — | | | | 0.18 | | | | 2.10 | | | | 2.28 | | | | (0.28 | ) | | | (12.56 | ) | | | — | | | | (12.84 | ) | | | (10.56 | ) | | | 5.84 | (4) | | | 1,310,365 | | | | 0.69 | (5) | | | 0.69 | (5) | | | 0.81 | (5) | | | 41 | |
| | | | | | | | | | | |
For the Year Ended October 31, 2014 | | | | | | | | | | | | | | | | | | | | | | | | | | | | | | | | | | | | | | | | | | | | | |
A | | $ | 45.91 | | | $ | 0.22 | | | $ | 5.31 | | | $ | 5.53 | | | $ | (0.12 | ) | | $ | (1.88 | ) | | $ | — | | | $ | (2.00 | ) | | $ | 49.44 | | | | 12.49 | % | | $ | 5,789,682 | | | | 1.10 | % | | | 1.10 | % | | | 0.46 | % | | | 111 | % |
B | | | 40.14 | | | | (0.16 | ) | | | 4.62 | | | | 4.46 | | | | — | | | | (1.88 | ) | | | — | | | | (1.88 | ) | | | 42.72 | | | | 11.55 | | | | 270,227 | | | | 1.95 | | | | 1.95 | | | | (0.39 | ) | | | 111 | |
C | | | 40.46 | | | | (0.11 | ) | | | 4.66 | | | | 4.55 | | | | — | | | | (1.88 | ) | | | — | | | | (1.88 | ) | | | 43.13 | | | | 11.69 | | | | 1,992,142 | | | | 1.81 | | | | 1.81 | | | | (0.26 | ) | | | 111 | |
I | | | 46.01 | | | | 0.37 | | | | 5.34 | | | | 5.71 | | | | (0.24 | ) | | | (1.88 | ) | | | — | | | | (2.12 | ) | | | 49.60 | | | | 12.87 | | | | 2,194,464 | | | | 0.76 | | | | 0.76 | | | | 0.79 | | | | 111 | |
R3 | | | 48.42 | | | | 0.08 | | | | 5.62 | | | | 5.70 | | | | — | | | | (1.88 | ) | | | — | | | | (1.88 | ) | | | 52.24 | | | | 12.16 | | | | 136,576 | | | | 1.40 | | | | 1.40 | | | | 0.16 | | | | 111 | |
R4 | | | 49.24 | | | | 0.23 | | | | 5.72 | | | | 5.95 | | | | (0.12 | ) | | | (1.88 | ) | | | — | | | | (2.00 | ) | | | 53.19 | | | | 12.50 | | | | 191,319 | | | | 1.10 | | | | 1.10 | | | | 0.46 | | | | 111 | |
R5 | | | 49.80 | | | | 0.37 | | | | 5.81 | | | | 6.18 | | | | (0.18 | ) | | | (1.88 | ) | | | — | | | | (2.06 | ) | | | 53.92 | | | | 12.82 | | | | 59,285 | | | | 0.80 | | | | 0.80 | | | | 0.72 | | | | 111 | |
Y | | | 50.05 | | | | 0.46 | | | | 5.79 | | | | 6.25 | | | | (0.30 | ) | | | (1.88 | ) | | | — | | | | (2.18 | ) | | | — | | | | 12.94 | | | | 1,284,539 | | | | 0.70 | | | | 0.70 | | | | 0.88 | | | | 111 | |
|
For the Year Ended October 31, 2013 | |
A | | $ | 32.65 | | | $ | 0.18 | | | $ | 13.31 | | | $ | 13.49 | | | $ | (0.23 | ) | | $ | — | | | $ | — | | | $ | (0.23 | ) | | $ | 45.91 | | | | 41.56 | % | | $ | 5,796,609 | | | | 1.14 | % | | | 1.14 | % | | | 0.46 | % | | | 91 | % |
B | | | 28.60 | | | | (0.13 | ) | | | 11.67 | | | | 11.54 | | | | — | | | | — | | | | — | | | | — | | | | 40.14 | | | | 40.35 | | | | 381,022 | | | | 1.99 | | | | 1.99 | | | | (0.37 | ) | | | 91 | |
C | | | 28.80 | | | | (0.09 | ) | | | 11.76 | | | | 11.67 | | | | (0.01 | ) | | | — | | | | — | | | | (0.01 | ) | | | 40.46 | | | | 40.55 | | | | 1,940,617 | | | | 1.85 | | | | 1.85 | | | | (0.25 | ) | | | 91 | |
I | | | 32.72 | | | | 0.31 | | | | 13.33 | | | | 13.64 | | | | (0.35 | ) | | | — | | | | — | | | | (0.35 | ) | | | 46.01 | | | | 45.02 | | | | 2,019,281 | | | | 0.84 | | | | 0.84 | | | | 0.82 | | | | 91 | |
R3 | | | 34.41 | | | | 0.08 | | | | 14.06 | | | | 14.14 | | | | (0.13 | ) | | | — | | | | — | | | | (0.13 | ) | | | 48.42 | | | | 41.20 | | | | 134,084 | | | | 1.41 | | | | 1.40 | | | | 0.21 | | | | 91 | |
R4 | | | 34.98 | | | | 0.21 | | | | 14.28 | | | | 14.49 | | | | (0.23 | ) | | | — | | | | — | | | | (0.23 | ) | | | 49.24 | | | | 41.63 | | | | 184,618 | | | | 1.10 | | | | 1.10 | | | | 0.51 | | | | 91 | |
R5 | | | 35.40 | | | | 0.35 | | | | 14.41 | | | | 14.76 | | | | (0.36 | ) | | | — | | | | — | | | | (0.36 | ) | | | 49.80 | | | | 42.04 | | | | 142,768 | | | | 0.80 | | | | 0.80 | | | | 0.84 | | | | 91 | |
Y | | | 35.58 | | | | 0.39 | | | | 14.48 | | | | 14.87 | | | | (0.40 | ) | | | — | | | | — | | | | (0.40 | ) | | | 50.05 | | | | 42.17 | | | | 1,348,160 | | | | 0.70 | | | | 0.70 | | | | 0.91 | | | | 91 | |
| | | | | | | | | | | |
For the Year Ended October 31, 2012(7) | | | | | | | | | | | | | | | | | | | | | | | | | | | | | | | | | | | | | | | | | | | | | |
A | | $ | 30.55 | | | $ | 0.25 | | | $ | 2.38 | | | $ | 2.63 | | | $ | (0.53 | ) | | $ | — | | | $ | — | | | $ | (0.53 | ) | | $ | 32.65 | | | | 8.84 | % | | $ | 4,859,760 | | | | 1.16 | % | | | 1.16 | % | | | 0.63 | % | | | 74 | % |
B | | | 26.76 | | | | (0.31 | ) | | | 2.40 | | | | 2.09 | | | | (0.25 | ) | | | — | | | | — | | | | (0.25 | ) | | | 28.60 | | | | 7.93 | | | | 391,388 | | | | 2.01 | | | | 2.00 | | | | (0.23 | ) | | | 74 | |
C | | | 26.94 | | | | (0.16 | ) | | | 2.31 | | | | 2.15 | | | | (0.29 | ) | | | — | | | | — | | | | (0.29 | ) | | | 28.80 | | | | 8.11 | | | | 1,642,578 | | | | 1.87 | | | | 1.87 | | | | (0.09 | ) | | | 74 | |
I | | | 30.61 | | | | 0.36 | | | | 2.37 | | | | 2.73 | | | | (0.62 | ) | | | — | | | | — | | | | (0.62 | ) | | | 32.72 | | | | 9.19 | | | | 3,024,465 | | | | 0.86 | | | | 0.86 | | | | 0.93 | | | | 74 | |
R3 | | | 32.17 | | | | 0.10 | | | | 2.61 | | | | 2.71 | | | | (0.47 | ) | | | — | | | | — | | | | (0.47 | ) | | | 34.41 | | | | 8.59 | | | | 122,235 | | | | 1.41 | | | | 1.40 | | | | 0.39 | | | | 74 | |
R4 | | | 32.68 | | | | 0.28 | | | | 2.57 | | | | 2.85 | | | | (0.55 | ) | | | — | | | | — | | | | (0.55 | ) | | | 34.98 | | | | 8.92 | | | | 168,689 | | | | 1.11 | | | | 1.10 | | | | 0.68 | | | | 74 | |
R5 | | | 33.09 | | | | 0.40 | | | | 2.58 | | | | 2.98 | | | | (0.67 | ) | | | — | | | | — | | | | (0.67 | ) | | | 35.40 | | | | 9.25 | | | | 185,705 | | | | 0.80 | | | | 0.80 | | | | 1.00 | | | | 74 | |
Y | | | 33.26 | | | | 0.55 | | | | 2.47 | | | | 3.02 | | | | (0.70 | ) | | | — | | | | — | | | | (0.70 | ) | | | 35.58 | | | | 9.36 | | | | 1,304,963 | | | | 0.70 | | | | 0.70 | | | | 1.09 | | | | 74 | |
|
For the Year Ended October 31, 2011 | |
A | | $ | 32.40 | | | $ | 0.19 | | | $ | (2.04 | ) | | $ | (1.85 | ) | | $ | — | | | $ | — | | | $ | — | | | $ | — | | | $ | 30.55 | | | | (5.71 | )% | | $ | 5,859,434 | | | | 1.12 | % | | | 1.12 | % | | | 0.55 | % | | | 75 | % |
B | | | 28.62 | | | | (0.08 | ) | | | (1.78 | ) | | | (1.86 | ) | | | — | | | | — | | | | — | | | | — | | | | 26.76 | | | | (6.50 | ) | | | 559,856 | | | | 1.95 | | | | 1.95 | | | | (0.28 | ) | | | 75 | |
C | | | 28.79 | | | | (0.05 | ) | | | (1.80 | ) | | | (1.85 | ) | | | — | | | | — | | | | — | | | | — | | | | 26.94 | | | | (6.43 | ) | | | 2,096,461 | | | | 1.84 | | | | 1.84 | | | | (0.16 | ) | | | 75 | |
I | | | 32.39 | | | | 0.27 | | | | (2.05 | ) | | | (1.78 | ) | | | — | | | | — | | | | — | | | | — | | | | 30.61 | | | | (5.50 | ) | | | 3,254,198 | | | | 0.87 | | | | 0.87 | | | | 0.81 | | | | 75 | |
R3 | | | 34.22 | | | | 0.10 | | | | (2.15 | ) | | | (2.05 | ) | | | — | | | | — | | | | — | | | | — | | | | 32.17 | | | | (5.99 | ) | | | 137,767 | | | | 1.41 | | | | 1.41 | | | | 0.30 | | | | 75 | |
R4 | | | 34.66 | | | | 0.21 | | | | (2.19 | ) | | | (1.98 | ) | | | — | | | | — | | | | — | | | | — | | | | 32.68 | | | | (5.71 | ) | | | 224,653 | | | | 1.10 | | | | 1.10 | | | | 0.59 | | | | 75 | |
R5 | | | 34.99 | | | | 0.32 | | | | (2.22 | ) | | | (1.90 | ) | | | — | | | | — | | | | — | | | | — | | | | 33.09 | | | | (5.43 | ) | | | 204,417 | | | | 0.80 | | | | 0.80 | | | | 0.89 | | | | 75 | |
Y | | | 35.13 | | | | 0.36 | | | | (2.23 | ) | | | (1.87 | ) | | | — | | | | — | | | | — | | | | — | | | | 33.26 | | | | (5.32 | ) | | | 1,460,367 | | | | 0.70 | | | | 0.70 | | | | 0.98 | | | | 75 | |
| | | | | | | | | | | |
For the Year Ended October 31, 2010 | | | | | | | | | | | | | | | | | | | | | | | | | | | | | | | | | | | | | | | | | | | | | |
A | | $ | 28.02 | | | $ | 0.14 | | | $ | 4.24 | | | $ | 4.38 | | | $ | — | | | $ | — | | | $ | — | | | $ | — | | | $ | 32.40 | | | | 15.63 | % | | $ | 8,535,338 | | | | 1.15 | % | | | 1.15 | % | | | 0.45 | % | | | 70 | % |
B | | | 24.95 | | | | (0.10 | ) | | | 3.77 | | | | 3.67 | | | | — | | | | — | | | | — | | | | — | | | | 28.62 | | | | 14.71 | | | | 828,754 | | | | 1.95 | | | | 1.95 | | | | (0.36 | ) | | | 70 | |
C | | | 25.07 | | | | (0.07 | ) | | | 3.79 | | | | 3.72 | | | | — | | | | — | | | | — | | | | — | | | | 28.79 | | | | 14.84 | | | | 3,001,079 | | | | 1.85 | | | | 1.85 | | | | (0.25 | ) | | | 70 | |
I | | | 27.94 | | | | 0.21 | | | | 4.24 | | | | 4.45 | | | | — | | | | — | | | | — | | | | — | | | | 32.39 | | | | 15.93 | | | | 4,781,187 | | | | 0.88 | | | | 0.88 | | | | 0.70 | | | | 70 | |
R3 | | | 29.67 | | | | 0.05 | | | | 4.50 | | | | 4.55 | | | | — | | | | — | | | | — | | | | — | | | | 34.22 | | | | 15.34 | | | | 126,972 | | | | 1.42 | | | | 1.41 | | | | 0.17 | | | | 70 | |
R4 | | | 29.96 | | | | 0.16 | | | | 4.54 | | | | 4.70 | | | | — | | | | — | | | | — | | | | — | | | | 34.66 | | | | 15.69 | | | | 270,804 | | | | 1.10 | | | | 1.10 | | | | 0.49 | | | | 70 | |
R5 | | | 30.15 | | | | 0.26 | | | | 4.58 | | | | 4.84 | | | | — | | | | — | | | | — | | | | — | | | | 34.99 | | | | 16.05 | | | | 215,999 | | | | 0.80 | | | | 0.80 | | | | 0.79 | | | | 70 | |
Y | | | 30.24 | | | | 0.29 | | | | 4.60 | | | | 4.89 | | | | — | | | | — | | | | — | | | | — | | | | 35.13 | | | | 16.17 | | | | 2,196,541 | | | | 0.70 | | | | 0.70 | | | | 0.89 | | | | 70 | |
The accompanying notes are an integral part of these financial statements.
|
| Hartford Funds – Domestic Equity Funds |
Financial Highlights – (continued)
| | | | | | | | | | | | | | | | | | | | | | | | | | | | | | | | | | | | | | | | | | | | | | | | | | | | | | | | | | | | |
| | | — Selected Per-Share Data(1) — | | | — Ratios and Supplemental Data — | |
Class | | Net Asset
Value at,
Beginning
of Period | | | Net
Investment
Income
(Loss) | | | Net
Realized
and
Unrealized
Gain (Loss)
on
Investments | | | Total from
Investment
Operations | | | Dividends
from Net
Investment
Income | | | Distributions
from
Realized
Capital
Gains | | | Distributions
Capital | | | Total
Dividends
and
Distributions | | | Net
Asset
Value
End of
Period | | | Total
Return(2) | | | Net
Assets at
End of
Period
(000s) | | | Ratio of
Expenses
to
Average
Net
Assets
Before
Adjust-
ments(3) | | | Ratio of
Expenses
to
Average
Net
Assets
After
Adjust-
ments(3) | | | Ratio of
Net
Investment
Income
(Loss) to
Average
Net Assets | | | Portfolio
Turnover | |
| Hartford Core Equity Fund | | | | | | | | | | | | | | | | | | | | | | | | | | | | | | | | | | | | | | | | | |
For the Six-Month Period Ended April 30, 2015 (Unaudited) | | | | | | | | | | | | | | | | | | | | | | | | | | | | | | | | | | | | | | | | | |
A | | $ | 22.00 | | | $ | 0.06 | | | $ | 1.52 | | | $ | 1.58 | | | $ | — | | | $ | (0.29 | ) | | $ | — | | | $ | (0.29 | ) | | $ | 23.29 | | | | 7.25 | %(4) | | $ | 169,528 | | | | 1.16 | %(5) | | | 1.09 | %(5) | | | 0.50 | %(5) | | | 14 | % |
B | | | 20.60 | | | | (0.03 | ) | | | 1.43 | | | | 1.40 | | | | — | | | | (0.29 | ) | | | — | | | | (0.29 | ) | | | 21.71 | | | | 6.87 | (4) | | | 1,666 | | | | 2.30 | (5) | | | 1.91 | (5) | | | (0.30 | )(5) | | | 14 | |
C | | | 20.54 | | | | (0.02 | ) | | | 1.42 | | | | 1.40 | | | | — | | | | (0.29 | ) | | | — | | | | (0.29 | ) | | | 21.65 | | | | 6.89 | (4) | | | 33,694 | | | | 1.85 | (5) | | | 1.80 | (5) | | | (0.21 | )(5) | | | 14 | |
I(8) | | | 23.30 | | | | 0.01 | | | | (0.01 | ) | | | — | | | | — | | | | — | | | | — | | | | — | | | | 23.30 | | | | (0.85 | )(4) | | | 964 | | | | 0.57 | (5) | | | 0.54 | (5) | | | 0.62 | (5) | | | 14 | |
R3 | | | 22.41 | | | | 0.03 | | | | 1.55 | | | | 1.58 | | | | — | | | | (0.29 | ) | | | — | | | | (0.29 | ) | | | 23.70 | | | | 7.12 | (4) | | | 642 | | | | 1.51 | (5) | | | 1.35 | (5) | | | 0.26 | (5) | | | 14 | |
R4 | | | 22.60 | | | | 0.06 | | | | 1.58 | | | | 1.64 | | | | — | | | | (0.29 | ) | | | — | | | | (0.29 | ) | | | 23.95 | | | | 7.32 | (4) | | | 3,161 | | | | 1.13 | (5) | | | 1.01 | (5) | | | 0.51 | (5) | | | 14 | |
R5 | | | 22.72 | | | | 0.05 | | | | 1.61 | | | | 1.66 | | | | (0.64 | ) | | | (0.29 | ) | | | — | | | | (0.93 | ) | | | 23.45 | | | | 7.43 | (4) | | | 22,733 | | | | 0.71 | (5) | | | 0.54 | (5) | | | 0.42 | (5) | | | 14 | |
R6(8) | | | 23.53 | | | | 0.02 | | | | (0.03 | ) | | | (0.01 | ) | | | — | | | | — | | | | — | | | | — | | | | 23.52 | | | | (0.88 | )(4) | | | 10 | | | | 0.57 | (5) | | | 0.45 | (5) | | | 0.74 | (5) | | | 14 | |
Y | | | 22.79 | | | | 0.10 | | | | 1.58 | | | | 1.68 | | | | (0.65 | ) | | | (0.29 | ) | | | — | | | | (0.94 | ) | | | 23.53 | | | | 7.50 | (4) | | | 9,910 | | | | 0.69 | (5) | | | 0.64 | (5) | | | 0.88 | (5) | | | 14 | |
| | | | | | | | | | | |
For the Year Ended October 31, 2014 | | | | | | | | | | | | | | | | | | | | | | | | | | | | | | | | | | | | | | | | | | | | | |
A | | $ | 18.77 | | | $ | 0.03 | | | $ | 3.26 | | | $ | 3.29 | | | $ | (0.06 | ) | | $ | — | | | $ | — | | | $ | (0.06 | ) | | $ | 22.00 | | | | 17.56 | % | | $ | 126,308 | | | | 1.37 | % | | | 1.31 | % | | | 0.16 | % | | | 60 | % |
B | | | 17.66 | | | | (0.12 | ) | | | 3.06 | | | | 2.94 | | | | — | | | | — | | | | — | | | | — | | | | 20.60 | | | | 16.65 | | | | 1,898 | | | | 2.49 | | | | 2.10 | | | | (0.62 | ) | | | 60 | |
C | | | 17.59 | | | | (0.10 | ) | | | 3.05 | | | | 2.95 | | | | — | | | | — | | | | — | | | | — | | | | 20.54 | | | | 16.77 | | | | 19,798 | | | | 2.06 | | | | 2.00 | | | | (0.53 | ) | | | 60 | |
R3 | | | 19.14 | | | | (0.01 | ) | | | 3.32 | | | | 3.31 | | | | (0.04 | ) | | | — | | | | — | | | | (0.04 | ) | | | 22.41 | | | | 17.30 | | | | 481 | | | | 1.70 | | | | 1.50 | | | | (0.05 | ) | | | 60 | |
R4 | | | 19.20 | | | | 0.05 | | | | 3.35 | | | | 3.40 | | | | — | | | | — | | | | — | | | | — | | | | 22.60 | | | | 17.71 | | | | 889 | | | | 1.34 | | | | 1.20 | | | | 0.21 | | | | 60 | |
R5 | | | 19.38 | | | | 0.12 | | | | 3.36 | | | | 3.48 | | | | (0.14 | ) | | | — | | | | — | | | | (0.14 | ) | | | 22.72 | | | | 18.03 | | | | 374 | | | | 1.04 | | | | 0.90 | | | | 0.56 | | | | 60 | |
Y | | | 19.44 | | | | 0.13 | | | | 3.37 | | | | 3.50 | | | | (0.15 | ) | | | — | | | | — | | | | (0.15 | ) | | | 22.79 | | | | 18.07 | | | | 2,486 | | | | 0.91 | | | | 0.85 | | | | 0.62 | | | | 60 | |
| | | | | | | | | | | |
For the Year Ended October 31, 2013 | | | | | | | | | | | | | | | | | | | | | | | | | | | | | | | | | | | | | | | | | | | | | |
A | | $ | 14.57 | | | $ | 0.11 | | | $ | 4.24 | | | $ | 4.35 | | | $ | (0.15 | ) | | $ | — | | | $ | — | | | $ | (0.15 | ) | | $ | 18.77 | | | | 30.12 | % | | $ | 103,104 | | | | 1.40 | % | | | 1.35 | % | | | 0.68 | % | | | 28 | % |
B | | | 13.70 | | | | (0.01 | ) | | | 3.99 | | | | 3.98 | | | | (0.02 | ) | | | — | | | | — | | | | (0.02 | ) | | | 17.66 | | | | 29.10 | | | | 2,480 | | | | 2.50 | | | | 2.10 | | | | (0.04 | ) | | | 28 | |
C | | | 13.66 | | | | — | | | | 3.98 | | | | 3.98 | | | | (0.05 | ) | | | — | | | | — | | | | (0.05 | ) | | | 17.59 | | | | 29.19 | | | | 15,324 | | | | 2.07 | | | | 2.04 | | | | (0.01 | ) | | | 28 | |
R3 | | | 14.86 | | | | 0.09 | | | | 4.32 | | | | 4.41 | | | | (0.13 | ) | | | — | | | | — | | | | (0.13 | ) | | | 19.14 | | | | 29.88 | | | | 330 | | | | 1.69 | | | | 1.50 | | | | 0.51 | | | | 28 | |
R4 | | | 14.91 | | | | 0.12 | | | | 4.34 | | | | 4.46 | | | | (0.17 | ) | | | — | | | | — | | | | (0.17 | ) | | | 19.20 | | | | 30.24 | | | | 1,227 | | | | 1.29 | | | | 1.20 | | | | 0.69 | | | | 28 | |
R5 | | | 15.04 | | | | 0.19 | | | | 4.37 | | | | 4.56 | | | | (0.22 | ) | | | — | | | | — | | | | (0.22 | ) | | | 19.38 | | | | 30.68 | | | | 204 | | | | 1.00 | | | | 0.90 | | | | 1.12 | | | | 28 | |
Y | | | 15.05 | | | | 0.20 | | | | 4.38 | | | | 4.58 | | | | (0.19 | ) | | | — | | | | — | | | | (0.19 | ) | | | 19.44 | | | | 30.73 | | | | 1,963 | | | | 0.88 | | | | 0.85 | | | | 1.19 | | | | 28 | |
| | | | | | | | | | | |
For the Year Ended October 31, 2012 | | | | | | | | | | | | | | | | | | | | | | | | | | | | | | | | | | | | | | | | | | | | | |
A | | $ | 12.77 | | | $ | 0.09 | | | $ | 1.74 | | | $ | 1.83 | | | $ | (0.03 | ) | | $ | — | | | $ | — | | | $ | (0.03 | ) | | $ | 14.57 | | | | 14.39 | % | | $ | 83,534 | | | | 1.44 | % | | | 1.35 | % | | | 0.69 | % | | | 46 | % |
B | | | 12.07 | | | | (0.01 | ) | | | 1.64 | | | | 1.63 | | | | — | | | | — | | | | — | | | | — | | | | 13.70 | | | | 13.50 | | | | 2,761 | | | | 2.50 | | | | 2.10 | | | | (0.08 | ) | | | 46 | |
C | | | 12.03 | | | | (0.01 | ) | | | 1.64 | | | | 1.63 | | | | — | | | | — | | | | — | | | | — | | | | 13.66 | | | | 13.55 | | | | 11,913 | | | | 2.09 | | | | 2.09 | | | | (0.06 | ) | | | 46 | |
R3 | | | 13.05 | | | | 0.08 | | | | 1.77 | | | | 1.85 | | | | (0.04 | ) | | | — | | | | — | | | | (0.04 | ) | | | 14.86 | | | | 14.22 | | | | 209 | | | | 1.70 | | | | 1.50 | | | | 0.53 | | | | 46 | |
R4 | | | 13.07 | | | | 0.12 | | | | 1.78 | | | | 1.90 | | | | (0.06 | ) | | | — | | | | — | | | | (0.06 | ) | | | 14.91 | | | | 14.57 | | | | 167 | | | | 1.31 | | | | 1.20 | | | | 0.85 | | | | 46 | |
R5 | | | 13.18 | | | | 0.16 | | | | 1.79 | | | | 1.95 | | | | (0.09 | ) | | | — | | | | — | | | | (0.09 | ) | | | 15.04 | | | | 14.93 | | | | 144 | | | | 1.01 | | | | 0.90 | | | | 1.14 | | | | 46 | |
Y | | | 13.20 | | | | 0.15 | | | | 1.80 | | | | 1.95 | | | | (0.10 | ) | | | — | | | | — | | | | (0.10 | ) | | | 15.05 | | | | 14.90 | | | | 1,594 | | | | 0.85 | | | | 0.85 | | | | 1.04 | | | | 46 | |
| | | | | | | | | | | |
For the Year Ended October 31, 2011 | | | | | | | | | | | | | | | | | | | | | | | | | | | | | | | | | | | | | | | | | | | | | |
A | | $ | 11.90 | | | $ | 0.07 | | | $ | 0.82 | | | $ | 0.89 | | | $ | (0.02 | ) | | $ | — | | | $ | — | | | $ | (0.02 | ) | | $ | 12.77 | | | | 7.50 | % | | $ | 80,470 | | | | 1.44 | % | | | 1.35 | % | | | 0.51 | % | | | 56 | % |
B | | | 11.32 | | | | (0.03 | ) | | | 0.79 | | | | 0.76 | | | | (0.01 | ) | | | — | | | | — | | | | (0.01 | ) | | | 12.07 | | | | 6.69 | | | | 4,020 | | | | 2.42 | | | | 2.10 | | | | (0.21 | ) | | | 56 | |
C | | | 11.28 | | | | (0.03 | ) | | | 0.79 | | | | 0.76 | | | | (0.01 | ) | | | — | | | | — | | | | (0.01 | ) | | | 12.03 | | | | 6.72 | | | | 11,221 | | | | 2.10 | | | | 2.09 | | | | (0.23 | ) | | | 56 | |
R3 | | | 12.18 | | | | 0.04 | | | | 0.85 | | | | 0.89 | | | | (0.02 | ) | | | — | | | | — | | | | (0.02 | ) | | | 13.05 | | | | 7.30 | | | | 165 | | | | 1.65 | | | | 1.50 | | | | 0.34 | | | | 56 | |
R4 | | | 12.16 | | | | 0.08 | | | | 0.86 | | | | 0.94 | | | | (0.03 | ) | | | — | | | | — | | | | (0.03 | ) | | | 13.07 | | | | 7.70 | | | | 134 | | | | 1.28 | | | | 1.20 | | | | 0.64 | | | | 56 | |
R5 | | | 12.24 | | | | 0.13 | | | | 0.84 | | | | 0.97 | | | | (0.03 | ) | | | — | | | | — | | | | (0.03 | ) | | | 13.18 | | | | 7.94 | | | | 117 | | | | 0.96 | | | | 0.90 | | | | 0.96 | | | | 56 | |
Y | | | 12.25 | | | | 0.13 | | | | 0.85 | | | | 0.98 | | | | (0.03 | ) | | | — | | | | — | | | | (0.03 | ) | | | 13.20 | | | | 8.03 | | | | 72,307 | | | | 0.86 | | | | 0.85 | | | | 0.98 | | | | 56 | |
| | | | | | | | | | | |
For the Year Ended October 31, 2010 | | | | | | | | | | | | | | | | | | | | | | | | | | | | | | | | | | | | | | | | | | | | | |
A | | $ | 10.44 | | | $ | 0.08 | | | $ | 1.58 | | | $ | 1.66 | | | $ | (0.20 | ) | | $ | — | | | $ | — | | | $ | (0.20 | ) | | $ | 11.90 | | | | 16.00 | % | | $ | 81,949 | | | | 1.47 | % | | | 1.35 | % | | | 0.71 | % | | | 41 | % |
B | | | 9.89 | | | | — | | | | 1.50 | | | | 1.50 | | | | (0.07 | ) | | | — | | | | — | | | | (0.07 | ) | | | 11.32 | | | | 15.18 | | | | 5,770 | | | | 2.46 | | | | 2.10 | | | | (0.04 | ) | | | 41 | |
C | | | 9.84 | | | | — | | | | 1.49 | | | | 1.49 | | | | (0.05 | ) | | | — | | | | — | | | | (0.05 | ) | | | 11.28 | | | | 15.18 | | | | 11,519 | | | | 2.12 | | | | 2.10 | | | | (0.04 | ) | | | 41 | |
R3 | | | 10.71 | | | | 0.05 | | | | 1.63 | | | | 1.68 | | | | (0.21 | ) | | | — | | | | — | | | | (0.21 | ) | | | 12.18 | | | | 15.77 | | | | 113 | | | | 1.66 | | | | 1.55 | | | | 0.47 | | | | 41 | |
R4 | | | 10.68 | | | | 0.09 | | | | 1.61 | | | | 1.70 | | | | (0.22 | ) | | | — | | | | — | | | | (0.22 | ) | | | 12.16 | | | | 16.01 | | | | 105 | | | | 1.25 | | | | 1.23 | | | | 0.82 | | | | 41 | |
R5 | | | 10.75 | | | | 0.12 | | | | 1.65 | | | | 1.77 | | | | (0.28 | ) | | | — | | | | — | | | | (0.28 | ) | | | 12.24 | | | | 16.55 | | | | 105 | | | | 0.95 | | | | 0.92 | | | | 1.09 | | | | 41 | |
Y | | | 10.76 | | | | 0.14 | | | | 1.64 | | | | 1.78 | | | | (0.29 | ) | | | — | | | | — | | | | (0.29 | ) | | | 12.25 | | | | 16.63 | | | | 45,376 | | | | 0.85 | | | | 0.85 | | | | 1.21 | | | | 41 | |
The accompanying notes are an integral part of these financial statements.
|
| Hartford Funds – Domestic Equity Funds |
Financial Highlights – (continued)
| | | | | | | | | | | | | | | | | | | | | | | | | | | | | | | | | | | | | | | | | | | | | | | | | | | | | | | | | | | | |
| | | — Selected Per-Share Data(1) — | | | — Ratios and Supplemental Data — | |
Class | | Net Asset
Value at,
Beginning
of Period | | | Net
Investment
Income
(Loss) | | | Net
Realized
and
Unrealized
Gain (Loss)
on
Investments | | | Total from
Investment
Operations | | | Dividends
from Net
Investment
Income | | | Distributions
from
Realized
Capital
Gains | | | Distributions
Capital | | | Total
Dividends
and
Distributions | | | Net
Asset
Value
End of
Period | | | Total
Return(2) | | | Net
Assets at
End of
Period
(000s) | | | Ratio of
Expenses
to
Average
Net
Assets
Before
Adjust-
ments(3) | | | Ratio of
Expenses
to
Average
Net
Assets
After
Adjust-
ments(3) | | | Ratio of
Net
Investment
Income
(Loss) to
Average
Net Assets | | | Portfolio
Turnover | |
| The Hartford Dividend and Growth Fund | | | | | | | | | | | | | | | | | | | | | | | | | | | | | | | | | | | | | |
For the Six-Month Period Ended April 30, 2015 (Unaudited) | | | | | | | | | | | | | | | | | | | | | | | | | | | | | | | | | | | | | | | | | |
A | | $ | 27.05 | | | $ | 0.18 | | | $ | 0.77 | | | $ | 0.95 | | | $ | (0.17 | ) | | $ | (2.30 | ) | | $ | — | | | $ | (2.47 | ) | | $ | 25.53 | | | | 3.88 | %(4) | | $ | 3,859,234 | | | | 1.01 | %(5) | | | 1.01 | %(5) | | | 1.43 | %(5) | | | 13 | % |
B | | | 26.59 | | | | 0.06 | | | | 0.76 | | | | 0.82 | | | | (0.05 | ) | | | (2.30 | ) | | | — | | | | (2.35 | ) | | | 25.06 | | | | 3.41 | (4) | | | 58,443 | | | | 1.96 | (5) | | | 1.94 | (5) | | | 0.52 | (5) | | | 13 | |
C | | | 26.42 | | | | 0.09 | | | | 0.75 | | | | 0.84 | | | | (0.09 | ) | | | (2.30 | ) | | | — | | | | (2.39 | ) | | | 24.87 | | | | 3.50 | (4) | | | 483,694 | | | | 1.75 | (5) | | | 1.75 | (5) | | | 0.69 | (5) | | | 13 | |
I | | | 26.95 | | | | 0.21 | | | | 0.77 | | | | 0.98 | | | | (0.20 | ) | | | (2.30 | ) | | | — | | | | (2.50 | ) | | | 25.43 | | | | 4.00 | (4) | | | 1,908,492 | | | | 0.81 | (5) | | | 0.81 | (5) | | | 1.63 | (5) | | | 13 | |
R3 | | | 27.29 | | | | 0.14 | | | | 0.78 | | | | 0.92 | | | | (0.13 | ) | | | (2.30 | ) | | | — | | | | (2.43 | ) | | | 25.78 | | | | 3.71 | (4) | | | 92,763 | | | | 1.35 | (5) | | | 1.35 | (5) | | | 1.09 | (5) | | | 13 | |
R4 | | | 27.42 | | | | 0.18 | | | | 0.79 | | | | 0.97 | | | | (0.17 | ) | | | (2.30 | ) | | | — | | | | (2.47 | ) | | | 25.92 | | | | 3.89 | (4) | | | 157,782 | | | | 1.04 | (5) | | | 1.04 | (5) | | | 1.40 | (5) | | | 13 | |
R5 | | | 27.49 | | | | 0.22 | | | | 0.79 | | | | 1.01 | | | | (0.21 | ) | | | (2.30 | ) | | | — | | | | (2.51 | ) | | | 25.99 | | | | 4.03 | (4) | | | 242,869 | | | | 0.74 | (5) | | | 0.74 | (5) | | | 1.69 | (5) | | | 13 | |
R6(6) | | | 27.81 | | | | 0.21 | | | | 0.51 | | | | 0.72 | | | | (0.22 | ) | | | (2.30 | ) | | | — | | | | (2.52 | ) | | | 26.01 | | | | 2.95 | (4) | | | 10 | | | | 0.64 | (5) | | | 0.64 | (5) | | | 1.71 | (5) | | | 13 | |
Y | | | 27.50 | | | | 0.23 | | | | 0.80 | | | | 1.03 | | | | (0.22 | ) | | | (2.30 | ) | | | — | | | | (2.52 | ) | | | 26.01 | | | | 4.07 | (4) | | | 1,354,513 | | | | 0.64 | (5) | | | 0.64 | (5) | | | 1.79 | (5) | | | 13 | |
| | | | | | | | | | | |
For the Year Ended October 31, 2014 | | | | | | | | | | | | | | | | | | | | | | | | | | | | | | | | | | | | | | | | | | | | | |
A | | $ | 25.28 | | | $ | 0.36 | | | $ | 3.43 | | | $ | 3.79 | | | $ | (0.36 | ) | | $ | (1.66 | ) | | $ | — | | | $ | (2.02 | ) | | $ | 27.05 | | | | 16.01 | % | | $ | 3,780,786 | | | | 1.02 | % | | | 1.02 | % | | | 1.40 | % | | | 23 | % |
B | | | 24.88 | | | | 0.13 | | | | 3.35 | | | | 3.48 | | | | (0.11 | ) | | | (1.66 | ) | | | — | | | | (1.77 | ) | | | 26.59 | | | | 14.91 | | | | 74,126 | | | | 1.96 | | | | 1.94 | | | | 0.50 | | | | 23 | |
C | | | 24.75 | | | | 0.16 | | | | 3.35 | | | | 3.51 | | | | (0.18 | ) | | | (1.66 | ) | | | — | | | | (1.84 | ) | | | 26.42 | | | | 15.12 | | | | 467,932 | | | | 1.77 | | | | 1.77 | | | | 0.65 | | | | 23 | |
I | | | 25.20 | | | | 0.41 | | | | 3.42 | | | | 3.83 | | | | (0.42 | ) | | | (1.66 | ) | | | — | | | | (2.08 | ) | | | 26.95 | | | | 16.22 | | | | 1,883,434 | | | | 0.81 | | | | 0.81 | | | | 1.60 | | | | 23 | |
R3 | | | 25.49 | | | | 0.28 | | | | 3.45 | | | | 3.73 | | | | (0.27 | ) | | | (1.66 | ) | | | — | | | | (1.93 | ) | | | 27.29 | | | | 15.61 | | | | 91,839 | | | | 1.35 | | | | 1.35 | | | | 1.07 | | | | 23 | |
R4 | | | 25.60 | | | | 0.36 | | | | 3.47 | | | | 3.83 | | | | (0.35 | ) | | | (1.66 | ) | | | — | | | | (2.01 | ) | | | 27.42 | | | | 15.98 | | | | 159,018 | | | | 1.04 | | | | 1.04 | | | | 1.37 | | | | 23 | |
R5 | | | 25.66 | | | | 0.44 | | | | 3.48 | | | | 3.92 | | | | (0.43 | ) | | | (1.66 | ) | | | — | | | | (2.09 | ) | | | 27.49 | | | | 16.32 | | | | 226,236 | | | | 0.74 | | | | 0.74 | | | | 1.68 | | | | 23 | |
R6 | | | — | | | | — | | | | — | | | | — | | | | — | | | | — | | | | — | | | | — | | | | 27.81 | | | | — | | | | | | | | — | | | | — | | | | — | | | | — | |
Y | | | 25.67 | | | | 0.47 | | | | 3.48 | | | | 3.95 | | | | (0.46 | ) | | | (1.66 | ) | | | — | | | | (2.12 | ) | | | 27.50 | | | | 16.42 | | | | 1,340,941 | | | | 0.64 | | | | 0.64 | | | | 1.81 | | | | 23 | |
| | | | | | | | | | | |
For the Year Ended October 31, 2013 | | | | | | | | | | | | | | | | | | | | | | | | | | | | | | | | | | | | | | | | | | | | | |
A | | $ | 20.87 | | | $ | 0.36 | | | $ | 4.75 | | | $ | 5.11 | | | $ | (0.35 | ) | | $ | (0.35 | ) | | $ | — | | | $ | (0.70 | ) | | $ | 25.28 | | | | 25.17 | % | | $ | 3,454,165 | | | | 1.05 | % | | | 1.05 | % | | | 1.57 | % | | | 30 | % |
B | | | 20.54 | | | | 0.16 | | | | 4.68 | | | | 4.84 | | | | (0.15 | ) | | | (0.35 | ) | | | — | | | | (0.50 | ) | | | 24.88 | | | | 24.08 | | | | 98,179 | | | | 2.00 | | | | 1.95 | | | | 0.71 | | | | 30 | |
C | | | 20.45 | | | | 0.19 | | | | 4.65 | | | | 4.84 | | | | (0.19 | ) | | | (0.35 | ) | | | — | | | | (0.54 | ) | | | 24.75 | | | | 24.26 | | | | 411,405 | | | | 1.79 | | | | 1.79 | | | | 0.83 | | | | 30 | |
I | | | 20.80 | | | | 0.41 | | | | 4.74 | | | | 5.15 | | | | (0.40 | ) | | | (0.35 | ) | | | — | | | | (0.75 | ) | | | 25.20 | | | | 25.48 | | | | 1,581,081 | | | | 0.83 | | | | 0.83 | | | | 1.79 | | | | 30 | |
R3 | | | 21.04 | | | | 0.29 | | | | 4.80 | | | | 5.09 | | | | (0.29 | ) | | | (0.35 | ) | | | — | | | | (0.64 | ) | | | 25.49 | | | | 24.79 | | | | 87,399 | | | | 1.35 | | | | 1.35 | | | | 1.27 | | | | 30 | |
R4 | | | 21.12 | | | | 0.37 | | | | 4.82 | | | | 5.19 | | | | (0.36 | ) | | | (0.35 | ) | | | — | | | | (0.71 | ) | | | 25.60 | | | | 25.21 | | | | 139,811 | | | | 1.05 | | | | 1.05 | | | | 1.58 | | | | 30 | |
R5 | | | 21.17 | | | | 0.43 | | | | 4.83 | | | | 5.26 | | | | (0.42 | ) | | | (0.35 | ) | | | — | | | | (0.77 | ) | | | 25.66 | | | | 25.57 | | | | 199,409 | | | | 0.75 | | | | 0.75 | | | | 1.85 | | | | 30 | |
Y | | | 21.18 | | | | 0.46 | | | | 4.83 | | | | 5.29 | | | | (0.45 | ) | | | (0.35 | ) | | | — | | | | (0.80 | ) | | | 25.67 | | | | 25.68 | | | | 1,596,519 | | | | 0.65 | | | | 0.65 | | | | 1.99 | | | | 30 | |
| | | | | | | | | | | |
For the Year Ended October 31, 2012(7) | | | | | | | | | | | | | | | | | | | | | | | | | | | | | | | | | | | | | | | | | | | | | |
A | | $ | 18.61 | | | $ | 0.34 | | | $ | 2.26 | | | $ | 2.60 | | | $ | (0.34 | ) | | $ | — | | | $ | — | | | $ | (0.34 | ) | | $ | 20.87 | | | | 14.07 | % | | $ | 2,942,844 | | | | 1.08 | % | | | 1.08 | % | | | 1.69 | % | | | 28 | % |
B | | | 18.32 | | | | 0.17 | | | | 2.21 | | | | 2.38 | | | | (0.16 | ) | | | — | | | | — | | | | (0.16 | ) | | | 20.54 | | | | 13.03 | | | | 108,710 | | | | 2.02 | | | | 1.95 | | | | 0.84 | | | | 28 | |
C | | | 18.25 | | | | 0.18 | | | | 2.22 | | | | 2.40 | | | | (0.20 | ) | | | — | | | | — | | | | (0.20 | ) | | | 20.45 | | | | 13.20 | | | | 340,069 | | | | 1.82 | | | | 1.82 | | | | 0.94 | | | | 28 | |
I | | | 18.56 | | | | 0.40 | | | | 2.23 | | | | 2.63 | | | | (0.39 | ) | | | — | | | | — | | | | (0.39 | ) | | | 20.80 | | | | 14.30 | | | | 1,341,707 | | | | 0.81 | | | | 0.81 | | | | 1.96 | | | | 28 | |
R3 | | | 18.76 | | | | 0.28 | | | | 2.29 | | | | 2.57 | | | | (0.29 | ) | | | — | | | | — | | | | (0.29 | ) | | | 21.04 | | | | 13.77 | | | | 72,926 | | | | 1.36 | | | | 1.35 | | | | 1.40 | | | | 28 | |
R4 | | | 18.84 | | | | 0.34 | | | | 2.29 | | | | 2.63 | | | | (0.35 | ) | | | — | | | | — | | | | (0.35 | ) | | | 21.12 | | | | 14.04 | | | | 122,160 | | | | 1.05 | | | | 1.05 | | | | 1.68 | | | | 28 | |
R5 | | | 18.88 | | | | 0.39 | | | | 2.30 | | | | 2.69 | | | | (0.40 | ) | | | — | | | | — | | | | (0.40 | ) | | | 21.17 | | | | 14.39 | | | | 142,940 | | | | 0.75 | | | | 0.75 | | | | 1.99 | | | | 28 | |
Y | | | 18.88 | | | | 0.41 | | | | 2.31 | | | | 2.72 | | | | (0.42 | ) | | | — | | | | — | | | | (0.42 | ) | | | 21.18 | | | | 14.55 | | | | 1,556,898 | | | | 0.65 | | | | 0.65 | | | | 2.08 | | | | 28 | |
| | | | | | | | | | | |
For the Year Ended October 31, 2011 | | | | | | | | | | | | | | | | | | | | | | | | | | | | | | | | | | | | | | | | | | | | | |
A | | $ | 17.93 | | | $ | 0.27 | | | $ | 0.67 | | | $ | 0.94 | | | $ | (0.26 | ) | | $ | — | | | $ | — | | | $ | (0.26 | ) | | $ | 18.61 | | | | 5.22 | % | | $ | 2,791,444 | | | | 1.08 | % | | | 1.08 | % | | | 1.42 | % | | | 30 | % |
B | | | 17.64 | | | | 0.10 | | | | 0.66 | | | | 0.76 | | | | (0.08 | ) | | | — | | | | — | | | | (0.08 | ) | | | 18.32 | | | | 4.32 | | | | 137,071 | | | | 2.01 | | | | 1.96 | | | | 0.55 | | | | 30 | |
C | | | 17.58 | | | | 0.13 | | | | 0.66 | | | | 0.79 | | | | (0.12 | ) | | | — | | | | — | | | | (0.12 | ) | | | 18.25 | | | | 4.49 | | | | 309,846 | | | | 1.83 | | | | 1.83 | | | | 0.68 | | | | 30 | |
I | | | 17.87 | | | | 0.32 | | | | 0.68 | | | | 1.00 | | | | (0.31 | ) | | | — | | | | — | | | | (0.31 | ) | | | 18.56 | | | | 5.60 | | | | 1,428,333 | | | | 0.80 | | | | 0.80 | | | | 1.69 | | | | 30 | |
R3 | | | 18.08 | | | | 0.22 | | | | 0.67 | | | | 0.89 | | | | (0.21 | ) | | | — | | | | — | | | | (0.21 | ) | | | 18.76 | | | | 4.94 | | | | 57,684 | | | | 1.37 | | | | 1.35 | | | | 1.14 | | | | 30 | |
R4 | | | 18.14 | | | | 0.28 | | | | 0.69 | | | | 0.97 | | | | (0.27 | ) | | | — | | | | — | | | | (0.27 | ) | | | 18.84 | | | | 5.32 | | | | 79,535 | | | | 1.06 | | | | 1.05 | | | | 1.43 | | | | 30 | |
R5 | | | 18.18 | | | | 0.34 | | | | 0.68 | | | | 1.02 | | | | (0.32 | ) | | | — | | | | — | | | | (0.32 | ) | | | 18.88 | | | | 5.62 | | | | 101,281 | | | | 0.76 | | | | 0.75 | | | | 1.75 | | | | 30 | |
Y | | | 18.18 | | | | 0.36 | | | | 0.68 | | | | 1.04 | | | | (0.34 | ) | | | — | | | | — | | | | (0.34 | ) | | | 18.88 | | | | 5.71 | | | | 1,111,199 | | | | 0.66 | | | | 0.66 | | | | 1.84 | | | | 30 | |
| | | | | | | | | | | |
For the Year Ended October 31, 2010(7) | | | | | | | | | | | | | | | | | | | | | | | | | | | | | | | | | | | | | | | | | | | | | |
A | | $ | 16.03 | | | $ | 0.25 | | | $ | 1.90 | | | $ | 2.15 | | | $ | (0.25 | ) | | $ | — | | | $ | — | | | $ | (0.25 | ) | | $ | 17.93 | | | | 13.46 | % | | $ | 2,850,636 | | | | 1.11 | % | | | 1.11 | % | | | 1.46 | % | | | 33 | % |
B | | | 15.76 | | | | 0.11 | | | | 1.86 | | | | 1.97 | | | | (0.09 | ) | | | — | | | | — | | | | (0.09 | ) | | | 17.64 | | | | 12.54 | | | | 182,506 | | | | 2.02 | | | | 1.97 | | | | 0.63 | | | | 33 | |
C | | | 15.72 | | | | 0.12 | | | | 1.86 | | | | 1.98 | | | | (0.12 | ) | | | — | | | | — | | | | (0.12 | ) | | | 17.58 | | | | 12.65 | | | | 314,729 | | | | 1.85 | | | | 1.85 | | | | 0.71 | | | | 33 | |
I | | | 15.98 | | | | 0.29 | | | | 1.90 | | | | 2.19 | | | | (0.30 | ) | | | — | | | | — | | | | (0.30 | ) | | | 17.87 | | | | 13.78 | | | | 1,129,059 | | | | 0.82 | | | | 0.82 | | | | 1.71 | | | | 33 | |
R3 | | | 16.18 | | | | 0.19 | | | | 1.93 | | | | 2.12 | | | | (0.22 | ) | | | — | | | | — | | | | (0.22 | ) | | | 18.08 | | | | 13.15 | | | | 33,933 | | | | 1.39 | | | | 1.38 | | | | 1.06 | | | | 33 | |
R4 | | | 16.22 | | | | 0.25 | | | | 1.93 | | | | 2.18 | | | | (0.26 | ) | | | — | | | | — | | | | (0.26 | ) | | | 18.14 | | | | 13.51 | | | | 57,684 | | | | 1.07 | | | | 1.06 | | | | 1.46 | | | | 33 | |
R5 | | | 16.24 | | | | 0.29 | | | | 1.96 | | | | 2.25 | | | | (0.31 | ) | | | — | | | | — | | | | (0.31 | ) | | | 18.18 | | | | 13.93 | | | | 65,379 | | | | 0.78 | | | | 0.78 | | | | 0.81 | | | | 33 | |
Y | | | 16.25 | | | | 0.32 | | | | 1.93 | | | | 2.25 | | | | (0.32 | ) | | | — | | | | — | | | | (0.32 | ) | | | 18.18 | | | | 13.96 | | | | 1,018,263 | | | | 0.67 | | | | 0.67 | | | | 1.88 | | | | 33 | |
The accompanying notes are an integral part of these financial statements.
|
| Hartford Funds – Domestic Equity Funds |
Financial Highlights – (continued)
| | | | | | | | | | | | | | | | | | | | | | | | | | | | | | | | | | | | | | | | | | | | | | | | | | | | | | | | | | | | |
| | | — Selected Per-Share Data(1) — | | | — Ratios and Supplemental Data — | |
Class | | Net Asset
Value at,
Beginning
of Period | | | Net
Investment
Income
(Loss) | | | Net
Realized
and
Unrealized
Gain (Loss)
on
Investments | | | Total from
Investment
Operations | | | Dividends
from Net
Investment
Income | | | Distributions
from
Realized
Capital
Gains | | | Distributions
Capital | | | Total
Dividends
and
Distributions | | | Net
Asset
Value
End of
Period | | | Total
Return(2) | | | Net
Assets at
End of
Period
(000s) | | | Ratio of
Expenses
to
Average
Net
Assets
Before
Adjust-
ments(3) | | | Ratio of
Expenses
to
Average
Net
Assets
After
Adjust-
ments(3) | | | Ratio of
Net
Investment
Income
(Loss) to
Average
Net Assets | | | Portfolio
Turnover | |
| The Hartford Equity Income Fund | | | | | | | | | | | | | | | | | | | | | | | | | | | | | | | | | | | | | | | | | |
For the Six-Month Period Ended April 30, 2015 (Unaudited) | | | | | | | | | | | | | | | | | | | | | | | | | | | | | | | | | | | | | | | | | |
A | | $ | 19.04 | | | $ | 0.18 | | | $ | 0.46 | | | $ | 0.64 | | | $ | (0.16 | ) | | $ | (0.52 | ) | | $ | — | | | $ | (0.68 | ) | | $ | 19.00 | | | | 3.53 | %(4) | | $ | 1,927,191 | | | | 1.02 | %(5) | | | 1.02 | %(5) | | | 1.88 | %(5) | | | 12 | % |
B | | | 19.05 | | | | 0.17 | | | | 0.46 | | | | 0.63 | | | | (0.15 | ) | | | (0.52 | ) | | | — | | | | (0.67 | ) | | | 19.01 | | | | 3.45 | (4) | | | 17,531 | | | | 1.16 | (5) | | | 1.16 | (5) | | | 1.77 | (5) | | | 12 | |
C | | | 18.96 | | | | 0.11 | | | | 0.47 | | | | 0.58 | | | | (0.10 | ) | | | (0.52 | ) | | | — | | | | (0.62 | ) | | | 18.92 | | | | 3.19 | (4) | | | 482,759 | | | | 1.74 | (5) | | | 1.74 | (5) | | | 1.15 | (5) | | | 12 | |
I | | | 18.97 | | | | 0.20 | | | | 0.47 | | | | 0.67 | | | | (0.19 | ) | | | (0.52 | ) | | | — | | | | (0.71 | ) | | | 18.93 | | | | 3.67 | (4) | | | 914,953 | | | | 0.77 | (5) | | | 0.77 | (5) | | | 2.13 | (5) | | | 12 | |
R3 | | | 19.06 | | | | 0.14 | | | | 0.47 | | | | 0.61 | | | | (0.13 | ) | | | (0.52 | ) | | | — | | | | (0.65 | ) | | | 19.02 | | | | 3.36 | (4) | | | 63,285 | | | | 1.36 | (5) | | | 1.36 | (5) | | | 1.54 | (5) | | | 12 | |
R4 | | | 19.08 | | | | 0.17 | | | | 0.48 | | | | 0.65 | | | | (0.16 | ) | | | (0.52 | ) | | | — | | | | (0.68 | ) | | | 19.05 | | | | 3.56 | (4) | | | 78,712 | | | | 1.06 | (5) | | | 1.06 | (5) | | | 1.84 | (5) | | | 12 | |
R5 | | | 19.15 | | | | 0.20 | | | | 0.48 | | | | 0.68 | | | | (0.19 | ) | | | (0.52 | ) | | | — | | | | (0.71 | ) | | | 19.12 | | | | 3.70 | (4) | | | 96,292 | | | | 0.76 | (5) | | | 0.76 | (5) | | | 2.14 | (5) | | | 12 | |
R6(6) | | | 19.39 | | | | 0.18 | | | | 0.30 | | | | 0.48 | | | | (0.20 | ) | | | (0.52 | ) | | | — | | | | (0.72 | ) | | | 19.15 | | | | 2.62 | (4) | | | 22 | | | | 0.68 | (5) | | | 0.68 | (5) | | | 2.02 | (5) | | | 12 | |
Y | | | 19.19 | | | | 0.21 | | | | 0.47 | | | | 0.68 | | | | (0.20 | ) | | | (0.52 | ) | | | — | | | | (0.72 | ) | | | 19.15 | | | | 3.68 | (4) | | | 253,904 | | | | 0.66 | (5) | | | 0.66 | (5) | | | 2.24 | (5) | | | 12 | |
|
For the Year Ended October 31, 2014 | |
A | | $ | 17.83 | | | $ | 0.34 | | | $ | 1.76 | | | $ | 2.10 | | | $ | (0.33 | ) | | $ | (0.56 | ) | | $ | — | | | $ | (0.89 | ) | | $ | 19.04 | | | | 12.19 | % | | $ | 1,951,760 | | | | 1.03 | % | | | 1.03 | % | | | 1.83 | % | | | 13 | % |
B | | | 17.82 | | | | 0.32 | | | | 1.77 | | | | 2.09 | | | | (0.30 | ) | | | (0.56 | ) | | | — | | | | (0.86 | ) | | | 19.05 | | | | 12.15 | | | | 21,619 | | | | 1.16 | | | | 1.16 | | | | 1.72 | | | | 13 | |
C | | | 17.77 | | | | 0.20 | | | | 1.75 | | | | 1.95 | | | | (0.20 | ) | | | (0.56 | ) | | | — | | | | (0.76 | ) | | | 18.96 | | | | 11.36 | | | | 458,695 | | | | 1.76 | | | | 1.76 | | | | 1.08 | | | | 13 | |
I | | | 17.76 | | | | 0.38 | | | | 1.77 | | | | 2.15 | | | | (0.38 | ) | | | (0.56 | ) | | | — | | | | (0.94 | ) | | | 18.97 | | | | 12.54 | | | | 903,048 | | | | 0.76 | | | | 0.76 | | | | 2.07 | | | | 13 | |
R3 | | | 17.85 | | | | 0.27 | | | | 1.77 | | | | 2.04 | | | | (0.27 | ) | | | (0.56 | ) | | | — | | | | (0.83 | ) | | | 19.06 | | | | 11.81 | | | | 58,349 | | | | 1.37 | | | | 1.37 | | | | 1.47 | | | | 13 | |
R4 | | | 17.87 | | | | 0.33 | | | | 1.76 | | | | 2.09 | | | | (0.32 | ) | | | (0.56 | ) | | | — | | | | (0.88 | ) | | | 19.08 | | | | 12.13 | | | | 76,746 | | | | 1.06 | | | | 1.06 | | | | 1.78 | | | | 13 | |
R5 | | | 17.93 | | | | 0.38 | | | | 1.78 | | | | 2.16 | | | | (0.38 | ) | | | (0.56 | ) | | | — | | | | (0.94 | ) | | | 19.15 | | | | 12.47 | | | | 91,827 | | | | 0.76 | | | | 0.76 | | | | 2.08 | | | | 13 | |
R6 | | | — | | | | — | | | | — | | | | — | | | | — | | | | — | | | | — | | | | — | | | | 19.39 | | | | — | | | | | | | | — | | | | — | | | | — | | | | — | |
Y | | | 17.96 | | | | 0.40 | | | | 1.79 | | | | 2.19 | | | | (0.40 | ) | | | (0.56 | ) | | | — | | | | (0.96 | ) | | | 19.19 | | | | 12.61 | | | | 236,502 | | | | 0.66 | | | | 0.66 | | | | 2.17 | | | | 13 | |
|
For the Year Ended October 31, 2013 | |
A | | $ | 14.81 | | | $ | 0.32 | | | $ | 3.23 | | | $ | 3.55 | | | $ | (0.31 | ) | | $ | (0.22 | ) | | $ | — | | | $ | (0.53 | ) | | $ | 17.83 | | | | 24.56 | % | | $ | 1,746,629 | | | | 1.06 | % | | | 1.06 | % | | | 1.98 | % | | | 17 | % |
B | | | 14.78 | | | | 0.23 | | | | 3.22 | | | | 3.45 | | | | (0.19 | ) | | | (0.22 | ) | | | — | | | | (0.41 | ) | | | 17.82 | | | | 23.87 | | | | 27,131 | | | | 1.65 | | | | 1.65 | | | | 1.44 | | | | 17 | |
C | | | 14.77 | | | | 0.20 | | | | 3.22 | | | | 3.42 | | | | (0.20 | ) | | | (0.22 | ) | | | — | | | | (0.42 | ) | | | 17.77 | | | | 23.67 | | | | 336,264 | | | | 1.79 | | | | 1.79 | | | | 1.20 | | | | 17 | |
I | | | 14.75 | | | | 0.36 | | | | 3.22 | | | | 3.58 | | | | (0.35 | ) | | | (0.22 | ) | | | — | | | | (0.57 | ) | | | 17.76 | | | | 24.93 | | | | 648,568 | | | | 0.78 | | | | 0.78 | | | | 2.18 | | | | 17 | |
R3 | | | 14.83 | | | | 0.27 | | | | 3.23 | | | | 3.50 | | | | (0.26 | ) | | | (0.22 | ) | | | — | | | | (0.48 | ) | | | 17.85 | | | | 24.17 | | | | 47,928 | | | | 1.38 | | | | 1.38 | | | | 1.62 | | | | 17 | |
R4 | | | 14.84 | | | | 0.31 | | | | 3.25 | | | | 3.56 | | | | (0.31 | ) | | | (0.22 | ) | | | — | | | | (0.53 | ) | | | 17.87 | | | | 24.58 | | | | 65,286 | | | | 1.08 | | | | 1.08 | | | | 1.89 | | | | 17 | |
R5 | | | 14.88 | | | | 0.35 | | | | 3.27 | | | | 3.62 | | | | (0.35 | ) | | | (0.22 | ) | | | — | | | | (0.57 | ) | | | 17.93 | | | | 24.99 | | | | 72,270 | | | | 0.77 | | | | 0.77 | | | | 2.06 | | | | 17 | |
Y | | | 14.90 | | | | 0.39 | | | | 3.26 | | | | 3.65 | | | | (0.37 | ) | | | (0.22 | ) | | | — | | | | (0.59 | ) | | | 17.96 | | | | 25.13 | | | | 167,906 | | | | 0.67 | | | | 0.67 | | | | 2.35 | | | | 17 | |
| | | | | | | | | | | |
For the Year Ended October 31, 2012 | | | | | | | | | | | | | | | | | | | | | | | | | | | | | | | | | | | | | | | | | | | | | |
A | | $ | 12.93 | | | $ | 0.29 | | | $ | 1.89 | | | $ | 2.18 | | | $ | (0.30 | ) | | $ | — | | | $ | — | | | $ | (0.30 | ) | | $ | 14.81 | | | | 17.00 | % | | $ | 1,195,106 | | | | 1.11 | % | | | 1.11 | % | | | 2.12 | % | | | 27 | % |
B | | | 12.91 | | | | 0.18 | | | | 1.86 | | | | 2.04 | | | | (0.14 | ) | | | — | | | | — | | | | (0.14 | ) | | | 14.78 | | | | 15.90 | | | | 27,731 | | | | 2.00 | | | | 2.00 | | | | 1.27 | | | | 27 | |
C | | | 12.91 | | | | 0.19 | | | | 1.88 | | | | 2.07 | | | | (0.21 | ) | | | — | | | | — | | | | (0.21 | ) | | | 14.77 | | | | 16.13 | | | | 160,153 | | | | 1.84 | | | | 1.84 | | | | 1.35 | | | | 27 | |
I | | | 12.89 | | | | 0.31 | | | | 1.89 | | | | 2.20 | | | | (0.34 | ) | | | — | | | | — | | | | (0.34 | ) | | | 14.75 | | | | 17.25 | | | | 244,794 | | | | 0.81 | | | | 0.81 | | | | 2.31 | | | | 27 | |
R3 | | | 12.96 | | | | 0.24 | | | | 1.90 | | | | 2.14 | | | | (0.27 | ) | | | — | | | | — | | | | (0.27 | ) | | | 14.83 | | | | 16.63 | | | | 23,077 | | | | 1.42 | | | | 1.42 | | | | 1.72 | | | | 27 | |
R4 | | | 12.97 | | | | 0.28 | | | | 1.89 | | | | 2.17 | | | | (0.30 | ) | | | — | | | | — | | | | (0.30 | ) | | | 14.84 | | | | 16.90 | | | | 24,672 | | | | 1.11 | | | | 1.11 | | | | 2.01 | | | | 27 | |
R5 | | | 12.99 | | | | 0.32 | | | | 1.91 | | | | 2.23 | | | | (0.34 | ) | | | — | | | | — | | | | (0.34 | ) | | | 14.88 | | | | 17.33 | | | | 8,931 | | | | 0.82 | | | | 0.82 | | | | 2.48 | | | | 27 | |
Y | | | 13.01 | | | | 0.55 | | | | 1.69 | | | | 2.24 | | | | (0.35 | ) | | | — | | | | — | | | | (0.35 | ) | | | 14.90 | | | | 17.41 | | | | 74,613 | | | | 0.72 | | | | 0.72 | | | | 2.68 | | | | 27 | |
|
For the Year Ended October 31, 2011 | |
A | | $ | 11.99 | | | $ | 0.25 | | | $ | 0.93 | | | $ | 1.18 | | | $ | (0.24 | ) | | $ | — | | | $ | — | | | $ | (0.24 | ) | | $ | 12.93 | | | | 9.87 | % | | $ | 826,555 | | | | 1.17 | % | | | 1.17 | % | | | 1.93 | % | | | 18 | % |
B | | | 11.97 | | | | 0.14 | | | | 0.93 | | | | 1.07 | | | | (0.13 | ) | | | — | | | | — | | | | (0.13 | ) | | | 12.91 | | | | 8.94 | | | | 29,071 | | | | 2.05 | | | | 2.00 | | | | 1.11 | | | | 18 | |
C | | | 11.97 | | | | 0.15 | | | | 0.94 | | | | 1.09 | | | | (0.12 | ) | | | — | | | | — | | | | (0.12 | ) | | | 12.91 | | | | 9.13 | | | | 78,710 | | | | 1.89 | | | | 1.89 | | | | 1.20 | | | | 18 | |
I | | | 11.95 | | | | 0.28 | | | | 0.94 | | | | 1.22 | | | | (0.28 | ) | | | — | | | | — | | | | (0.28 | ) | | | 12.89 | | | | 10.24 | | | | 52,965 | | | | 0.88 | | | | 0.88 | | | | 2.21 | | | | 18 | |
R3 | | | 12.03 | | | | 0.20 | | | | 0.94 | | | | 1.14 | | | | (0.21 | ) | | | — | | | | — | | | | (0.21 | ) | | | 12.96 | | | | 9.49 | | | | 6,694 | | | | 1.50 | | | | 1.50 | | | | 1.57 | | | | 18 | |
R4 | | | 12.03 | | | | 0.25 | | | | 0.93 | | | | 1.18 | | | | (0.24 | ) | | | — | | | | — | | | | (0.24 | ) | | | 12.97 | | | | 9.87 | | | | 5,651 | | | | 1.18 | | | | 1.18 | | | | 1.92 | | | | 18 | |
R5 | | | 12.05 | | | | 0.27 | | | | 0.95 | | | | 1.22 | | | | (0.28 | ) | | | — | | | | — | | | | (0.28 | ) | | | 12.99 | | | | 10.16 | | | | 2,597 | | | | 0.88 | | | | 0.88 | | | | 2.11 | | | | 18 | |
Y | | | 12.06 | | | | 0.29 | | | | 0.95 | | | | 1.24 | | | | (0.29 | ) | | | — | | | | — | | | | (0.29 | ) | | | 13.01 | | | | 10.33 | | | | 178,516 | | | | 0.77 | | | | 0.77 | | | | 2.28 | | | | 18 | |
| | | | | | | | | | | |
For the Year Ended October 31, 2010 | | | | | | | | | | | | | | | | | | | | | | | | | | | | | | | | | | | | | | | | | | | | | |
A | | $ | 10.74 | | | $ | 0.21 | | | $ | 1.24 | | | $ | 1.45 | | | $ | (0.20 | ) | | $ | — | | | $ | — | | | $ | (0.20 | ) | | $ | 11.99 | | | | 13.63 | % | | $ | 716,700 | | | | 1.20 | % | | | 1.20 | % | | | 1.86 | % | | | 27 | % |
B | | | 10.72 | | | | 0.13 | | | | 1.23 | | | | 1.36 | | | | (0.11 | ) | | | — | | | | — | | | | (0.11 | ) | | | 11.97 | | | | 12.73 | | | | 31,038 | | | | 2.08 | | | | 2.00 | | | | 1.07 | | | | 27 | |
C | | | 10.73 | | | | 0.13 | | | | 1.23 | | | | 1.36 | | | | (0.12 | ) | | | — | | | | — | | | | (0.12 | ) | | | 11.97 | | | | 12.75 | | | | 57,416 | | | | 1.92 | | | | 1.92 | | | | 1.13 | | | | 27 | |
I | | | 10.72 | | | | 0.23 | | | | 1.23 | | | | 1.46 | | | | (0.23 | ) | | | — | | | | — | | | | (0.23 | ) | | | 11.95 | | | | 13.76 | | | | 16,462 | | | | 0.93 | | | | 0.93 | | | | 2.06 | | | | 27 | |
R3 | | | 10.78 | | | | 0.15 | | | | 1.27 | | | | 1.42 | | | | (0.17 | ) | | | — | | | | — | | | | (0.17 | ) | | | 12.03 | | | | 13.28 | | | | 1,719 | | | | 1.55 | | | | 1.55 | | | | 1.37 | | | | 27 | |
R4 | | | 10.78 | | | | 0.21 | | | | 1.24 | | | | 1.45 | | | | (0.20 | ) | | | — | | | | — | | | | (0.20 | ) | | | 12.03 | | | | 13.59 | | | | 2,926 | | | | 1.20 | | | | 1.20 | | | | 1.80 | | | | 27 | |
R5 | | | 10.79 | | | | 0.21 | | | | 1.29 | | | | 1.50 | | | | (0.24 | ) | | | — | | | | — | | | | (0.24 | ) | | | 12.05 | | | | 14.06 | | | | 694 | | | | 0.87 | | | | 0.87 | | | | 1.70 | | | | 27 | |
Y | | | 10.81 | | | | 0.26 | | | | 1.24 | | | | 1.50 | | | | (0.25 | ) | | | — | | | | — | | | | (0.25 | ) | | | 12.06 | | | | 14.01 | | | | 71,899 | | | | 0.79 | | | | 0.79 | | | | 2.27 | | | | 27 | |
The accompanying notes are an integral part of these financial statements.
|
| Hartford Funds – Domestic Equity Funds |
Financial Highlights – (continued)
| | | | | | | | | | | | | | | | | | | | | | | | | | | | | | | | | | | | | | | | | | | | | | | | | | | | | | | | | | | | |
| | | — Selected Per-Share Data(1) — | | | — Ratios and Supplemental Data — | |
Class | | Net Asset
Value at,
Beginning
of Period | | | Net
Investment
Income
(Loss) | | | Net
Realized
and
Unrealized
Gain (Loss)
on
Investments | | | Total from
Investment
Operations | | | Dividends
from Net
Investment
Income | | | Distributions
from
Realized
Capital
Gains | | | Distributions
Capital | | | Total
Dividends
and
Distributions | | | Net
Asset
Value
End of
Period | | | Total
Return(2) | | | Net
Assets at
End of
Period
(000s) | | | Ratio of
Expenses
to
Average
Net
Assets
Before
Adjust-
ments(3) | | | Ratio of
Expenses
to
Average
Net
Assets
After
Adjust-
ments(3) | | | Ratio of
Net
Investment
Income
(Loss) to
Average
Net Assets | | | Portfolio
Turnover | |
| The Hartford Growth Opportunities Fund | | | | | | | | | | | | | | | | | | | | | | | | | | | | | | | | | | | | | |
For the Six-Month Period Ended April 30, 2015 (Unaudited) | | | | | | | | | | | | | | | | | | | | | | | | | | | | | | | | | | | | | | | | | |
A | | $ | 43.76 | | | $ | (0.07 | ) | | $ | 4.00 | | | $ | 3.93 | | | $ | — | | | $ | (7.73 | ) | | $ | — | | | $ | (7.73 | ) | | $ | 39.96 | | | | 10.76 | %(4) | | $ | 1,663,574 | | | | 1.12 | %(5) | | | 1.12 | %(5) | | | (0.35 | )%(5) | | | 52 | % |
B | | | 33.71 | | | | (0.18 | ) | | | 2.90 | | | | 2.72 | | | | — | | | | (7.73 | ) | | | — | | | | (7.73 | ) | | | 28.70 | | | | 10.26 | (4) | | | 20,152 | | | | 2.03 | (5) | | | 2.03 | (5) | | | (1.27 | )(5) | | | 52 | |
C | | | 33.91 | | | | (0.16 | ) | | | 2.94 | | | | 2.78 | | | | — | | | | (7.73 | ) | | | — | | | | (7.73 | ) | | | 28.96 | | | | 10.39 | (4) | | | 294,726 | | | | 1.85 | (5) | | | 1.85 | (5) | | | (1.09 | )(5) | | | 52 | |
I | | | 44.82 | | | | (0.03 | ) | | | 4.14 | | | | 4.11 | | | | — | | | | (7.73 | ) | | | — | | | | (7.73 | ) | | | 41.20 | | | | 10.90 | (4) | | | 1,969,533 | | | | 0.90 | (5) | | | 0.90 | (5) | | | (0.14 | )(5) | | | 52 | |
R3 | | | 44.25 | | | | (0.14 | ) | | | 4.07 | | | | 3.93 | | | | — | | | | (7.73 | ) | | | — | | | | (7.73 | ) | | | 40.45 | | | | 10.59 | (4) | | | 36,378 | | | | 1.45 | (5) | | | 1.45 | (5) | | | (0.69 | )(5) | | | 52 | |
R4 | | | 45.39 | | | | (0.08 | ) | | | 4.19 | | | | 4.11 | | | | — | | | | (7.73 | ) | | | — | | | | (7.73 | ) | | | 41.77 | | | | 10.74 | (4) | | | 59,383 | | | | 1.14 | (5) | | | 1.14 | (5) | | | (0.38 | )(5) | | | 52 | |
R5 | | | 46.36 | | | | (0.02 | ) | | | 4.29 | | | | 4.27 | | | | — | | | | (7.73 | ) | | | — | | | | (7.73 | ) | | | 42.90 | | | | 10.90 | (4) | | | 113,283 | | | | 0.84 | (5) | | | 0.84 | (5) | | | (0.08 | )(5) | | | 52 | |
R6(6) | | | 47.09 | | | | — | | | | 3.96 | | | | 3.96 | | | | — | | | | (7.73 | ) | | | — | | | | (7.73 | ) | | | 43.32 | | | | 10.05 | (4) | | | 11 | | | | 0.75 | (5) | | | 0.75 | (5) | | | (0.02 | )(5) | | | 52 | |
Y | | | 46.70 | | | | — | | | | 4.34 | | | | 4.34 | | | | — | | | | (7.73 | ) | | | — | | | | (7.73 | ) | | | 43.31 | | | | 10.96 | (4) | | | 93,976 | | | | 0.74 | (5) | | | 0.74 | (5) | | | 0.02 | (5) | | | 52 | |
| | | | | | | | | | | |
For the Year Ended October 31, 2014 | | | | | | | | | | | | | | | | | | | | | | | | | | | | | | | | | | | | | | | | | | | | | |
A | | $ | 38.68 | | | $ | (0.13 | ) | | $ | 6.72 | | | $ | 6.59 | | | $ | — | | | $ | (1.51 | ) | | $ | — | | | $ | (1.51 | ) | | $ | 43.76 | | | | 17.63 | % | | $ | 1,497,082 | | | | 1.15 | % | | | 1.15 | % | | | (0.33 | )% | | | 136 | %(9) |
B | | | 30.38 | | | | (0.37 | ) | | | 5.21 | | | | 4.84 | | | | — | | | | (1.51 | ) | | | — | | | | (1.51 | ) | | | 33.71 | | | | 16.65 | | | | 22,277 | | | | 2.07 | | | | 2.02 | | | | (1.18 | ) | | | 136 | (9) |
C | | | 30.51 | | | | (0.33 | ) | | | 5.24 | | | | 4.91 | | | | — | | | | (1.51 | ) | | | — | | | | (1.51 | ) | | | 33.91 | | | | 16.81 | | | | 251,628 | | | | 1.88 | | | | 1.88 | | | | (1.05 | ) | | | 136 | (9) |
I | | | 39.49 | | | | (0.04 | ) | | | 6.88 | | | | 6.84 | | | | — | | | | (1.51 | ) | | | — | | | | (1.51 | ) | | | 44.82 | | | | 17.92 | | | | 1,733,488 | | | | 0.91 | | | | 0.91 | | | | (0.09 | ) | | | 136 | (9) |
R3 | | | 39.21 | | | | (0.26 | ) | | | 6.81 | | | | 6.55 | | | | — | | | | (1.51 | ) | | | — | | | | (1.51 | ) | | | 44.25 | | | | 17.28 | | | | 29,954 | | | | 1.46 | | | | 1.45 | | | | (0.62 | ) | | | 136 | (9) |
R4 | | | 40.06 | | | | (0.14 | ) | | | 6.98 | | | | 6.84 | | | | — | | | | (1.51 | ) | | | — | | | | (1.51 | ) | | | 45.39 | | | | 17.65 | | | | 52,498 | | | | 1.15 | | | | 1.15 | | | | (0.32 | ) | | | 136 | (9) |
R5 | | | 40.76 | | | | (0.02 | ) | | | 7.13 | | | | 7.11 | | | | — | | | | (1.51 | ) | | | — | | | | (1.51 | ) | | | 46.36 | | | | 18.02 | | | | 102,841 | | | | 0.85 | | | | 0.85 | | | | (0.05 | ) | | | 136 | (9) |
R6 | | | — | | | | — | | | | — | | | | — | | | | — | | | | — | | | | — | | | | — | | | | 47.09 | | | | — | | | | | | | | — | | | | — | | | | — | | | | — | (9) |
Y | | | 41.02 | | | | 0.03 | | | | 7.16 | | | | 7.19 | | | | — | | | | (1.51 | ) | | | — | | | | (1.51 | ) | | | 46.70 | | | | 18.11 | | | | 68,001 | | | | 0.75 | | | | 0.75 | | | | 0.08 | | | | 136 | (9) |
| | | | | | | | | | | |
For the Year Ended October 31, 2013 | | | | | | | | | | | | | | | | | | | | | | | | | | | | | | | | | | | | | | | | | | | | | |
A | | $ | 29.60 | | | $ | (0.10 | ) | | $ | 9.18 | | | $ | 9.08 | | | $ | — | | | $ | — | | | $ | — | | | $ | — | | | $ | 38.68 | | | | 30.68 | % | | $ | 982,699 | | | | 1.19 | % | | | 1.19 | % | | | (0.30 | )% | | | 120 | %(10) |
B | | | 23.43 | | | | (0.28 | ) | | | 7.23 | | | | 6.95 | | | | — | | | | — | | | | — | | | | — | | | | 30.38 | | | | 29.66 | | | | 24,296 | | | | 2.11 | | | | 1.96 | | | | (1.05 | ) | | | 120 | (10) |
C | | | 23.52 | | | | (0.27 | ) | | | 7.26 | | | | 6.99 | | | | — | | | | — | | | | — | | | | — | | | | 30.51 | | | | 29.72 | | | | 176,392 | | | | 1.90 | | | | 1.90 | | | | (1.01 | ) | | | 120 | (10) |
I | | | 30.14 | | | | (0.01 | ) | | | 9.36 | | | | 9.35 | | | | — | | | | — | | | | — | | | | — | | | | 39.49 | | | | 31.02 | | | | 1,288,778 | | | | 0.92 | | | | 0.92 | | | | (0.03 | ) | | | 120 | (10) |
R3 | | | 30.09 | | | | (0.19 | ) | | | 9.31 | | | | 9.12 | | | | — | | | | — | | | | — | | | | — | | | | 39.21 | | | | 30.31 | | | | 24,924 | | | | 1.46 | | | | 1.45 | | | | (0.56 | ) | | | 120 | (10) |
R4 | | | 30.64 | | | | (0.09 | ) | | | 9.51 | | | | 9.42 | | | | — | | | | — | | | | — | | | | — | | | | 40.06 | | | | 30.74 | | | | 44,353 | | | | 1.15 | | | | 1.15 | | | | (0.25 | ) | | | 120 | (10) |
R5 | | | 31.09 | | | | 0.01 | | | | 9.66 | | | | 9.67 | | | | — | | | | — | | | | — | | | | — | | | | 40.76 | | | | 31.10 | | | | 20,243 | | | | 0.85 | | | | 0.85 | | | | 0.04 | | | | 120 | (10) |
Y | | | 31.25 | | | | 0.05 | | | | 9.72 | | | | 9.77 | | | | — | | | | — | | | | — | | | | — | | | | 41.02 | | | | 31.26 | | | | 57,712 | | | | 0.75 | | | | 0.75 | | | | 0.14 | | | | 120 | (10) |
| | | | | | | | | | | |
For the Year Ended October 31, 2012 | | | | | | | | | | | | | | | | | | | | | | | | | | | | | | | | | | | | | | | | | | | | | |
A | | $ | 25.98 | | | $ | (0.15 | ) | | $ | 3.77 | | | $ | 3.62 | | | $ | — | | | $ | — | | | $ | — | | | $ | — | | | $ | 29.60 | | | | 13.93 | % | | $ | 748,795 | | | | 1.23 | % | | | 1.21 | % | | | (0.54 | )% | | | 116 | % |
B | | | 20.72 | | | | (0.28 | ) | | | 2.99 | | | | 2.71 | | | | — | | | | — | | | | — | | | | — | | | | 23.43 | | | | 13.08 | | | | 23,529 | | | | 2.15 | | | | 1.96 | | | | (1.29 | ) | | | 116 | |
C | | | 20.80 | | | | (0.28 | ) | | | 3.00 | | | | 2.72 | | | | — | | | | — | | | | — | | | | — | | | | 23.52 | | | | 13.08 | | | | 123,174 | | | | 1.93 | | | | 1.93 | | | | (1.26 | ) | | | 116 | |
I | | | 26.39 | | | | (0.08 | ) | | | 3.83 | | | | 3.75 | | | | — | | | | — | | | | — | | | | — | | | | 30.14 | | | | 14.21 | | | | 893,563 | | | | 0.95 | | | | 0.95 | | | | (0.28 | ) | | | 116 | |
R3 | | | 26.48 | | | | (0.22 | ) | | | 3.83 | | | | 3.61 | | | | — | | | | — | | | | — | | | | — | | | | 30.09 | | | | 13.63 | | | | 17,259 | | | | 1.48 | | | | 1.45 | | | | (0.78 | ) | | | 116 | |
R4 | | | 26.89 | | | | (0.14 | ) | | | 3.89 | | | | 3.75 | | | | — | | | | — | | | | — | | | | — | | | | 30.64 | | | | 13.95 | | | | 38,458 | | | | 1.16 | | | | 1.15 | | | | (0.47 | ) | | | 116 | |
R5 | | | 27.20 | | | | (0.05 | ) | | | 3.94 | | | | 3.89 | | | | — | | | | — | | | | — | | | | — | | | | 31.09 | | | | 14.30 | | | | 14,935 | | | | 0.86 | | | | 0.85 | | | | (0.17 | ) | | | 116 | |
Y | | | 27.32 | | | | (0.03 | ) | | | 3.96 | | | | 3.93 | | | | — | | | | — | | | | — | | | | — | | | | 31.25 | | | | 14.39 | | | | 46,782 | | | | 0.76 | | | | 0.76 | | | | (0.09 | ) | | | 116 | |
| | | | | | | | | | | |
For the Year Ended October 31, 2011 | | | | | | | | | | | | | | | | | | | | | | | | | | | | | | | | | | | | | | | | | | | | | |
A(11) | | $ | 24.78 | | | $ | 0.02 | | | $ | 1.18 | | | $ | 1.20 | | | $ | — | | | $ | — | | | $ | — | | | $ | — | | | $ | 25.98 | | | | 4.84 | % | | $ | 754,532 | | | | 1.22 | % | | | 1.22 | % | | | 0.06 | % | | | 121 | % |
B | | | 19.93 | | | | (0.29 | ) | | | 1.08 | | | | 0.79 | | | | — | | | | — | | | | — | | | | — | | | | 20.72 | | | | 3.96 | | | | 27,884 | | | | 2.13 | | | | 2.04 | | | | (1.32 | ) | | | 121 | |
C | | | 19.98 | | | | (0.26 | ) | | | 1.08 | | | | 0.82 | | | | — | | | | — | | | | — | | | | — | | | | 20.80 | | | | 4.10 | | | | 128,016 | | | | 1.92 | | | | 1.92 | | | | (1.20 | ) | | | 121 | |
I | | | 25.10 | | | | (0.06 | ) | | | 1.35 | | | | 1.29 | | | | — | | | | — | | | | — | | | | — | | | | 26.39 | | | | 5.14 | | | | 791,091 | | | | 0.92 | | | | 0.92 | | | | (0.22 | ) | | | 121 | |
R3 | | | 25.31 | | | | (0.20 | ) | | | 1.37 | | | | 1.17 | | | | — | | | | — | | | | — | | | | — | | | | 26.48 | | | | 4.62 | | | | 13,444 | | | | 1.48 | | | | 1.45 | | | | (0.74 | ) | | | 121 | |
R4 | | | 25.63 | | | | (0.12 | ) | | | 1.38 | | | | 1.26 | | | | — | | | | — | | | | — | | | | — | | | | 26.89 | | | | 4.92 | | | | 36,249 | | | | 1.16 | | | | 1.15 | | | | (0.43 | ) | | | 121 | |
R5 | | | 25.85 | | | | (0.04 | ) | | | 1.39 | | | | 1.35 | | | | — | | | | — | | | | — | | | | — | | | | 27.20 | | | | 5.22 | | | | 14,132 | | | | 0.86 | | | | 0.85 | | | | (0.15 | ) | | | 121 | |
Y | | | 25.94 | | | | (0.01 | ) | | | 1.39 | | | | 1.38 | | | | — | | | | — | | | | — | | | | — | | | | 27.32 | | | | 5.32 | | | | 98,278 | | | | 0.76 | | | | 0.76 | | | | (0.04 | ) | | | 121 | |
| | | | | | | | | | | |
For the Year Ended October 31, 2010 | | | | | | | | | | | | | | | | | | | | | | | | | | | | | | | | | | | | | | | | | | | | | |
A | | $ | 20.69 | | | $ | (0.13 | ) | | $ | 4.22 | | | $ | 4.09 | | | $ | — | | | $ | — | | | $ | — | | | $ | — | | | $ | 24.78 | | | | 19.77 | % | | $ | 431,465 | | | | 1.35 | % | | | 1.32 | % | | | (0.57 | )% | | | 115 | % |
B | | | 16.77 | | | | (0.25 | ) | | | 3.41 | | | | 3.16 | | | | — | | | | — | | | | — | | | | — | | | | 19.93 | | | | 18.84 | | | | 34,559 | | | | 2.18 | | | | 2.07 | | | | (1.33 | ) | | | 115 | |
C | | | 16.78 | | | | (0.23 | ) | | | 3.43 | | | | 3.20 | | | | — | | | | — | | | | — | | | | — | | | | 19.98 | | | | 19.07 | | | | 156,903 | | | | 1.95 | | | | 1.95 | | | | (1.21 | ) | | | 115 | |
I | | | 20.91 | | | | (0.05 | ) | | | 4.28 | | | | 4.23 | | | | (0.04 | ) | | | — | | | | — | | | | (0.04 | ) | | | 25.10 | | | | 20.23 | | | | 495,439 | | | | 0.93 | | | | 0.93 | | | | (0.22 | ) | | | 115 | |
R3 | | | 21.17 | | | | (0.18 | ) | | | 4.32 | | | | 4.14 | | | | — | | | | — | | | | — | | | | — | | | | 25.31 | | | | 19.56 | | | | 10,772 | | | | 1.49 | | | | 1.49 | | | | (0.77 | ) | | | 115 | |
R4 | | | 21.37 | | | | (0.10 | ) | | | 4.36 | | | | 4.26 | | | | — | | | | — | | | | — | | | | — | | | | 25.63 | | | | 19.93 | | | | 42,770 | | | | 1.17 | | | | 1.17 | | | | (0.44 | ) | | | 115 | |
R5 | | | 21.52 | | | | (0.03 | ) | | | 4.40 | | | | 4.37 | | | | (0.04 | ) | | | — | | | | — | | | | (0.04 | ) | | | 25.85 | | | | 20.34 | | | | 14,203 | | | | 0.87 | | | | 0.87 | | | | (0.14 | ) | | | 115 | |
Y | | | 21.59 | | | | (0.01 | ) | | | 4.42 | | | | 4.41 | | | | (0.06 | ) | | | — | | | | — | | | | (0.06 | ) | | | 25.94 | | | | 20.44 | | | | 136,662 | | | | 0.77 | | | | 0.77 | | | | (0.04 | ) | | | 115 | |
The accompanying notes are an integral part of these financial statements.
|
| Hartford Funds – Domestic Equity Funds |
Financial Highlights – (continued)
| | | | | | | | | | | | | | | | | | | | | | | | | | | | | | | | | | | | | | | | | | | | | | | | | | | | | | | | | | | | |
| | | — Selected Per-Share Data(1) — | | | — Ratios and Supplemental Data — | |
Class | | Net Asset
Value at,
Beginning
of Period | | | Net
Investment
Income
(Loss) | | | Net
Realized
and
Unrealized
Gain (Loss)
on
Investments | | | Total from
Investment
Operations | | | Dividends
from Net
Investment
Income | | | Distributions
from
Realized
Capital
Gains | | | Distributions
Capital | | | Total
Dividends
and
Distributions | | | Net
Asset
Value
End of
Period | | | Total
Return(2) | | | Net
Assets at
End of
Period
(000s) | | | Ratio of
Expenses
to
Average
Net
Assets
Before
Adjust-
ments(3) | | | Ratio of
Expenses
to
Average
Net
Assets
After
Adjust-
ments(3) | | | Ratio of
Net
Investment
Income
(Loss) to
Average
Net Assets | | | Portfolio
Turnover | |
| The Hartford Healthcare Fund | | | | | | | | | | | | | | | | | | | | | | | | | | | | | | | | | | | | | | | | | |
For the Six-Month Period Ended April 30, 2015 (Unaudited) | | | | | | | | | | | | | | | | | | | | | | | | | | | | | | | | | | | | | | | | | |
A | | $ | 36.60 | | | $ | (0.09 | ) | | $ | 4.22 | | | $ | 4.13 | | | $ | — | | | $ | (2.49 | ) | | $ | — | | | $ | (2.49 | ) | | $ | 38.24 | | | | 11.84 | %(4) | | $ | 783,668 | | | | 1.27 | %(5) | | | 1.27 | %(5) | | | (0.50 | )%(5) | | | 18 | % |
B | | | 32.18 | | | | (0.23 | ) | | | 3.70 | | | | 3.47 | | | | — | | | | (2.49 | ) | | | — | | | | (2.49 | ) | | | 33.16 | | | | 11.39 | (4) | | | 8,801 | | | | 2.15 | (5) | | | 2.15 | (5) | | | (1.39 | )(5) | | | 18 | |
C | | | 32.42 | | | | (0.20 | ) | | | 3.72 | | | | 3.52 | | | | — | | | | (2.49 | ) | | | — | | | | (2.49 | ) | | | 33.45 | | | | 11.46 | (4) | | | 245,745 | | | | 2.01 | (5) | | | 2.01 | (5) | | | (1.23 | )(5) | | | 18 | |
I | | | 37.63 | | | | (0.04 | ) | | | 4.35 | | | | 4.31 | | | | — | | | | (2.49 | ) | | | — | | | | (2.49 | ) | | | 39.45 | | | | 12.00 | (4) | | | 201,967 | | | | 1.01 | (5) | | | 1.01 | (5) | | | (0.23 | )(5) | | | 18 | |
R3 | | | 37.58 | | | | (0.16 | ) | | | 4.35 | | | | 4.19 | | | | — | | | | (2.49 | ) | | | — | | | | (2.49 | ) | | | 39.28 | | | | 11.68 | (4) | | | 55,188 | | | | 1.61 | (5) | | | 1.61 | (5) | | | (0.84 | )(5) | | | 18 | |
R4 | | | 38.64 | | | | (0.11 | ) | | | 4.48 | | | | 4.37 | | | | — | | | | (2.49 | ) | | | — | | | | (2.49 | ) | | | 40.52 | | | | 11.84 | (4) | | | 42,499 | | | | 1.31 | (5) | | | 1.31 | (5) | | | (0.54 | )(5) | | | 18 | |
R5 | | | 39.60 | | | | (0.05 | ) | | | 4.60 | | | | 4.55 | | | | — | | | | (2.49 | ) | | | — | | | | (2.49 | ) | | | 41.66 | | | | 12.01 | (4) | | | 4,784 | | | | 1.02 | (5) | | | 1.02 | (5) | | | (0.25 | )(5) | | | 18 | |
Y | | | 39.85 | | | | (0.03 | ) | | | 4.62 | | | | 4.59 | | | | — | | | | (2.49 | ) | | | — | | | | (2.49 | ) | | | 41.95 | | | | 12.04 | (4) | | | 8,005 | | | | 0.91 | (5) | | | 0.91 | (5) | | | (0.13 | )(5) | | | 18 | |
| | | | | | | | | | | |
For the Year Ended October 31, 2014 | | | | | | | | | | | | | | | | | | | | | | | | | | | | | | | | | | | | | | | | | | | | | |
A | | $ | 28.05 | | | $ | (0.13 | ) | | $ | 8.68 | | | $ | 8.55 | | | $ | — | | | $ | — | | | $ | — | | | $ | — | | | $ | 36.60 | | | | 30.48 | % | | $ | 599,010 | | | | 1.33 | % | | | 1.33 | % | | | (0.40 | )% | | | 28 | % |
B | | | 24.88 | | | | (0.36 | ) | | | 7.66 | | | | 7.30 | | | | — | | | | — | | | | — | | | | — | | | | 32.18 | | | | 29.34 | | | | 11,303 | | | | 2.20 | | | | 2.20 | | | | (1.27 | ) | | | 28 | |
C | | | 25.03 | | | | (0.32 | ) | | | 7.71 | | | | 7.39 | | | | — | | | | — | | | | — | | | | — | | | | 32.42 | | | | 29.52 | | | | 176,581 | | | | 2.06 | | | | 2.06 | | | | (1.13 | ) | | | 28 | |
I | | | 28.76 | | | | (0.04 | ) | | | 8.91 | | | | 8.87 | | | | — | | | | — | | | | — | | | | — | | | | 37.63 | | | | 30.84 | | | | 137,450 | | | | 1.05 | | | | 1.05 | | | | (0.12 | ) | | | 28 | |
R3 | | | 28.89 | | | | (0.24 | ) | | | 8.93 | | | | 8.69 | | | | — | | | | — | | | | — | | | | — | | | | 37.58 | | | | 30.08 | | | | 40,482 | | | | 1.64 | | | | 1.64 | | | | (0.71 | ) | | | 28 | |
R4 | | | 29.62 | | | | (0.14 | ) | | | 9.16 | | | | 9.02 | | | | — | | | | — | | | | — | | | | — | | | | 38.64 | | | | 30.45 | | | | 29,530 | | | | 1.34 | | | | 1.34 | | | | (0.41 | ) | | | 28 | |
R5 | | | 30.27 | | | | (0.04 | ) | | | 9.37 | | | | 9.33 | | | | — | | | | — | | | | — | | | | — | | | | 39.60 | | | | 30.82 | | | | 2,323 | | | | 1.05 | | | | 1.05 | | | | (0.12 | ) | | | 28 | |
Y | | | 30.42 | | | | — | | | | 9.43 | | | | 9.43 | | | | — | | | | — | | | | — | | | | — | | | | 39.85 | | | | 31.00 | | | | 6,081 | | | | 0.94 | | | | 0.94 | | | | — | | | | 28 | |
|
For the Year Ended October 31, 2013 | |
A | | $ | 20.11 | | | $ | (0.06 | ) | | $ | 8.00 | | | $ | 7.94 | | | $ | — | | | $ | — | | | $ | — | | | $ | — | | | $ | 28.05 | | | | 39.48 | % | | $ | 415,323 | | | | 1.40 | % | | | 1.40 | % | | | (0.24 | )% | | | 32 | % |
B | | | 17.99 | | | | (0.23 | ) | | | 7.12 | | | | 6.89 | | | | — | | | | — | | | | — | | | | — | | | | 24.88 | | | | 38.30 | | | | 14,697 | | | | 2.29 | | | | 2.26 | | | | (1.08 | ) | | | 32 | |
C | | | 18.07 | | | | (0.21 | ) | | | 7.17 | | | | 6.96 | | | | — | | | | — | | | | — | | | | — | | | | 25.03 | | | | 38.52 | | | | 116,641 | | | | 2.11 | | | | 2.11 | | | | (0.95 | ) | | | 32 | |
I | | | 20.55 | | | | 0.01 | | | | 8.20 | | | | 8.21 | | | | — | | | | — | | | | — | | | | — | | | | 28.76 | | | | 39.95 | | | | 79,005 | | | | 1.08 | | | | 1.08 | | | | 0.06 | | | | 32 | |
R3 | | | 20.77 | | | | (0.13 | ) | | | 8.25 | | | | 8.12 | | | | — | | | | — | | | | — | | | | — | | | | 28.89 | | | | 39.09 | | | | 24,914 | | | | 1.66 | | | | 1.65 | | | | (0.51 | ) | | | 32 | |
R4 | | | 21.22 | | | | (0.05 | ) | | | 8.45 | | | | 8.40 | | | | — | | | | — | | | | — | | | | — | | | | 29.62 | | | | 39.59 | | | | 17,817 | | | | 1.36 | | | | 1.35 | | | | (0.20 | ) | | | 32 | |
R5 | | | 21.62 | | | | 0.05 | | | | 8.60 | | | | 8.65 | | | | — | | | | — | | | | — | | | | — | | | | 30.27 | | | | 40.01 | | | | 1,267 | | | | 1.08 | | | | 1.05 | | | | 0.19 | | | | 32 | |
Y | | | 21.71 | | | | 0.05 | | | | 8.66 | | | | 8.71 | | | | — | | | | — | | | | — | | | | — | | | | 30.42 | | | | 40.12 | | | | 4,056 | | | | 0.96 | | | | 0.96 | | | | 0.20 | | | | 32 | |
| | | | | | | | | | | |
For the Year Ended October 31, 2012(7) | | | | | | | | | | | | | | | | | | | | | | | | | | | | | | | | | | | | | | | | | | | | | |
A | | $ | 16.80 | | | $ | — | | | $ | 3.31 | | | $ | 3.31 | | | $ | — | | | $ | — | | | $ | — | | | $ | — | | | $ | 20.11 | | | | 19.70 | % | | $ | 276,741 | | | | 1.47 | % | | | 1.47 | % | | | — | % | | | 46 | % |
B | | | 15.15 | | | | (0.17 | ) | | | 3.01 | | | | 2.84 | | | | — | | | | — | | | | — | | | | — | | | | 17.99 | | | | 18.75 | | | | 14,015 | | | | 2.38 | | | | 2.28 | | | | (0.84 | ) | | | 46 | |
C | | | 15.20 | | | | (0.12 | ) | | | 2.99 | | | | 2.87 | | | | — | | | | — | | | | — | | | | — | | | | 18.07 | | | | 18.88 | | | | 73,728 | | | | 2.17 | | | | 2.17 | | | | (0.71 | ) | | | 46 | |
I | | | 17.10 | | | | 0.07 | | | | 3.38 | | | | 3.45 | | | | — | | | | — | | | | — | | | | — | | | | 20.55 | | | | 20.18 | | | | 38,199 | | | | 1.11 | | | | 1.11 | | | | 0.35 | | | | 46 | |
R3 | | | 17.38 | | | | (0.02 | ) | | | 3.41 | | | | 3.39 | | | | — | | | | — | | | | — | | | | — | | | | 20.77 | | | | 19.51 | | | | 12,521 | | | | 1.69 | | | | 1.65 | | | | (0.15 | ) | | | 46 | |
R4 | | | 17.70 | | | | 0.02 | | | | 3.50 | | | | 3.52 | | | | — | | | | — | | | | — | | | | — | | | | 21.22 | | | | 19.89 | | | | 12,363 | | | | 1.38 | | | | 1.35 | | | | 0.11 | | | | 46 | |
R5 | | | 17.98 | | | | 0.08 | | | | 3.56 | | | | 3.64 | | | | — | | | | — | | | | — | | | | — | | | | 21.62 | | | | 20.24 | | | | 2,489 | | | | 1.09 | | | | 1.05 | | | | 0.43 | | | | 46 | |
Y | | | 18.05 | | | | 0.10 | | | | 3.56 | | | | 3.66 | | | | — | | | | — | | | | — | | | | — | | | | 21.71 | | | | 20.28 | | | | 3,252 | | | | 0.98 | | | | 0.98 | | | | 0.48 | | | | 46 | |
|
For the Year Ended October 31, 2011 | |
A | | $ | 15.21 | | | $ | (0.04 | ) | | $ | 1.63 | | | $ | 1.59 | | | $ | — | | | $ | — | | | $ | — | | | $ | — | | | $ | 16.80 | | | | 10.45 | % | | $ | 224,294 | | | | 1.49 | % | | | 1.49 | % | | | (0.24 | )% | | | 44 | % |
B | | | 13.83 | | | | (0.16 | ) | | | 1.48 | | | | 1.32 | | | | — | | | | — | | | | — | | | | — | | | | 15.15 | | | | 9.54 | | | | 17,208 | | | | 2.38 | | | | 2.28 | | | | (1.04 | ) | | | 44 | |
C | | | 13.86 | | | | (0.14 | ) | | | 1.48 | | | | 1.34 | | | | — | | | | — | | | | — | | | | — | | | | 15.20 | | | | 9.67 | | | | 65,692 | | | | 2.18 | | | | 2.18 | | | | (0.93 | ) | | | 44 | |
I | | | 15.44 | | | | 0.02 | | | | 1.64 | | | | 1.66 | | | | — | | | | — | | | | — | | | | — | | | | 17.10 | | | | 10.75 | | | | 32,213 | | | | 1.18 | | | | 1.18 | | | | 0.09 | | | | 44 | |
R3 | | | 15.76 | | | | (0.07 | ) | | | 1.69 | | | | 1.62 | | | | — | | | | — | | | | — | | | | — | | | | 17.38 | | | | 10.28 | | | | 5,905 | | | | 1.71 | | | | 1.65 | | | | (0.39 | ) | | | 44 | |
R4 | | | 16.01 | | | | (0.02 | ) | | | 1.71 | | | | 1.69 | | | | — | | | | — | | | | — | | | | — | | | | 17.70 | | | | 10.56 | | | | 9,241 | | | | 1.39 | | | | 1.35 | | | | (0.09 | ) | | | 44 | |
R5 | | | 16.21 | | | | 0.04 | | | | 1.73 | | | | 1.77 | | | | — | | | | — | | | | — | | | | — | | | | 17.98 | | | | 10.92 | | | | 1,403 | | | | 1.09 | | | | 1.05 | | | | 0.21 | | | | 44 | |
Y | | | 16.26 | | | | 0.05 | | | | 1.74 | | | | 1.79 | | | | — | | | | — | | | | — | | | | — | | | | 18.05 | | | | 11.01 | | | | 2,555 | | | | 0.99 | | | | 0.99 | | | | 0.27 | | | | 44 | |
| | | | | | | | | | | |
For the Year Ended October 31, 2010(7) | | | | | | | | | | | | | | | | | | | | | | | | | | | | | | | | | | | | | | | | | | | | | |
A | | $ | 13.07 | | | $ | — | | | $ | 2.14 | | | $ | 2.14 | | | $ | — | | | $ | — | | | $ | — | | | $ | — | | | $ | 15.21 | | | | 16.37 | % | | $ | 236,781 | | | | 1.49 | % | | | 1.49 | % | | | (0.03 | )% | | | 36 | % |
B | | | 11.98 | | | | (0.14 | ) | | | 1.99 | | | | 1.85 | | | | — | | | | — | | | | — | | | | — | | | | 13.83 | | | | 15.44 | | | | 23,023 | | | | 2.39 | | | | 2.28 | | | | (0.84 | ) | | | 36 | |
C | | | 11.99 | | | | (0.11 | ) | | | 1.98 | | | | 1.87 | | | | — | | | | — | | | | — | | | | — | | | | 13.86 | | | | 15.60 | | | | 71,124 | | | | 2.18 | | | | 2.18 | | | | (0.72 | ) | | | 36 | |
I | | | 13.23 | | | | 0.04 | | | | 2.17 | | | | 2.21 | | | | — | | | | — | | | | — | | | | — | | | | 15.44 | | | | 16.70 | | | | 14,176 | | | | 1.22 | | | | 1.22 | | | | 0.24 | | | | 36 | |
R3 | | | 13.57 | | | | (0.02 | ) | | | 2.21 | | | | 2.19 | | | | — | | | | — | | | | — | | | | — | | | | 15.76 | | | | 16.14 | | | | 3,549 | | | | 1.70 | | | | 1.70 | | | | (0.17 | ) | | | 36 | |
R4 | | | 13.74 | | | | 0.02 | | | | 2.25 | | | | 2.27 | | | | — | | | | — | | | | — | | | | — | | | | 16.01 | | | | 16.52 | | | | 7,939 | | | | 1.37 | | | | 1.37 | | | | 0.11 | | | | 36 | |
R5 | | | 13.87 | | | | 0.06 | | | | 2.28 | | | | 2.34 | | | | — | | | | — | | | | — | | | | — | | | | 16.21 | | | | 16.87 | | | | 1,895 | | | | 1.08 | | | | 1.08 | | | | 0.38 | | | | 36 | |
Y | | | 13.90 | | | | 0.08 | | | | 2.28 | | | | 2.36 | | | | — | | | | — | | | | — | | | | — | | | | 16.26 | | | | 16.98 | | | | 2,294 | | | | 0.97 | | | | 0.97 | | | | 0.50 | | | | 36 | |
The accompanying notes are an integral part of these financial statements.
|
| Hartford Funds – Domestic Equity Funds |
Financial Highlights – (continued)
| | | | | | | | | | | | | | | | | | | | | | | | | | | | | | | | | | | | | | | | | | | | | | | | | | | | | | | | | | | | |
| | | — Selected Per-Share Data(1) — | | | — Ratios and Supplemental Data — | |
Class | | Net Asset
Value at,
Beginning
of Period | | | Net
Investment
Income
(Loss) | | | Net
Realized
and
Unrealized
Gain (Loss)
on
Investments | | | Total from
Investment
Operations | | | Dividends
from Net
Investment
Income | | | Distributions
from
Realized
Capital
Gains | | | Distributions
Capital | | | Total
Dividends
and
Distributions | | | Net
Asset
Value
End of
Period | | | Total
Return(2) | | | Net
Assets at
End of
Period
(000s) | | | Ratio of
Expenses
to
Average
Net
Assets
Before
Adjust-
ments(3) | | | Ratio of
Expenses
to
Average
Net
Assets
After
Adjust-
ments(3) | | | Ratio of
Net
Investment
Income
(Loss) to
Average
Net Assets | | | Portfolio
Turnover | |
| The Hartford MidCap Fund | | | | | | | | | | | | | | | | | | | | | | | | | | | | | | | | | | | | | | | | | |
For the Six-Month Period Ended April 30, 2015 (Unaudited) | | | | | | | | | | | | | | | | | | | | | | | | | | | | | | | | | | | | | | | | | |
A | | $ | 27.38 | | | $ | (0.03 | ) | | $ | 1.57 | | | $ | 1.54 | | | $ | — | | | $ | (2.67 | ) | | $ | — | | | $ | (2.67 | ) | | $ | 26.25 | | | | 6.38 | %(4) | | $ | 2,032,108 | | | | 1.13 | %(5) | | | 1.13 | %(5) | | | (0.25 | )%(5) | | | 17 | % |
B | | | 21.65 | | | | (0.11 | ) | | | 1.19 | | | | 1.08 | | | | — | | | | (2.67 | ) | | | — | | | | (2.67 | ) | | | 20.06 | | | | 5.91 | (4) | | | 27,932 | | | | 2.03 | (5) | | | 2.03 | (5) | | | (1.13 | )(5) | | | 17 | |
C | | | 22.18 | | | | (0.10 | ) | | | 1.23 | | | | 1.13 | | | | — | | | | (2.67 | ) | | | — | | | | (2.67 | ) | | | 20.64 | | | | 6.00 | (4) | | | 594,013 | | | | 1.86 | (5) | | | 1.86 | (5) | | | (0.98 | )(5) | | | 17 | |
I | | | 27.78 | | | | — | | | | 1.59 | | | | 1.59 | | | | — | | | | (2.67 | ) | | | — | | | | (2.67 | ) | | | 26.70 | | | | 6.48 | (4) | | | 656,813 | | | | 0.91 | (5) | | | 0.91 | (5) | | | (0.03 | )(5) | | | 17 | |
R3 | | | 30.02 | | | | (0.09 | ) | | | 1.75 | | | | 1.66 | | | | — | | | | (2.67 | ) | | | — | | | | (2.67 | ) | | | 29.01 | | | | 6.21 | (4) | | | 70,881 | | | | 1.46 | (5) | | | 1.46 | (5) | | | (0.59 | )(5) | | | 17 | |
R4 | | | 30.61 | | | | (0.04 | ) | | | 1.79 | | | | 1.75 | | | | — | | | | (2.67 | ) | | | — | | | | (2.67 | ) | | | 29.69 | | | | 6.40 | (4) | | | 132,480 | | | | 1.16 | (5) | | | 1.16 | (5) | | | (0.30 | )(5) | | | 17 | |
R5 | | | 30.96 | | | | — | | | | 1.81 | | | | 1.81 | | | | — | | | | (2.67 | ) | | | — | | | | (2.67 | ) | | | 30.10 | | | | 6.53 | (4) | | | 144,778 | | | | 0.86 | (5) | | | 0.86 | (5) | | | — | (5) | | | 17 | |
R6(6) | | | 31.11 | | | | (0.05 | ) | | | 1.88 | | | | 1.83 | | | | — | | | | (2.67 | ) | | | — | | | | (2.67 | ) | | | 30.27 | | | | 6.56 | (4) | | | 895 | | | | 0.77 | (5) | | | 0.76 | (5) | | | (0.36 | )(5) | | | 17 | |
Y | | | 31.10 | | | | 0.02 | | | | 1.81 | | | | 1.83 | | | | — | | | | (2.67 | ) | | | — | | | | (2.67 | ) | | | 30.26 | | | | 6.57 | (4) | | | 1,092,142 | | | | 0.76 | (5) | | | 0.76 | (5) | | | 0.14 | (5) | | | 17 | |
| | | | | | | | | | | |
For the Year Ended October 31, 2014 | | | | | | | | | | | | | | | | | | | | | | | | | | | | | | | | | | | | | | | | | | | | | |
A | | $ | 25.67 | | | $ | (0.10 | ) | | $ | 3.82 | | | $ | 3.72 | | | $ | — | | | $ | (2.01 | ) | | $ | — | | | $ | (2.01 | ) | | $ | 27.38 | | | | 15.57 | % | | $ | 1,891,075 | | | | 1.15 | % | | | 1.15 | % | | | (0.40 | )% | | | 34 | % |
B | | | 20.88 | | | | (0.27 | ) | | | 3.05 | | | | 2.78 | | | | — | | | | (2.01 | ) | | | — | | | | (2.01 | ) | | | 21.65 | | | | 14.56 | | | | 29,446 | | | | 2.05 | | | | 2.05 | | | | (1.29 | ) | | | 34 | |
C | | | 21.30 | | | | (0.24 | ) | | | 3.13 | | | | 2.89 | | | | — | | | | (2.01 | ) | | | — | | | | (2.01 | ) | | | 22.18 | | | | 14.81 | | | | 544,154 | | | | 1.88 | | | | 1.88 | | | | (1.13 | ) | | | 34 | |
I | | | 25.95 | | | | (0.04 | ) | | | 3.88 | | | | 3.84 | | | | — | | | | (2.01 | ) | | | — | | | | (2.01 | ) | | | 27.78 | | | | 15.89 | | | | 550,720 | | | | 0.90 | | | | 0.90 | | | | (0.17 | ) | | | 34 | |
R3 | | | 28.03 | | | | (0.21 | ) | | | 4.21 | | | | 4.00 | | | | — | | | | (2.01 | ) | | | — | | | | (2.01 | ) | | | 30.02 | | | | 15.24 | | | | 56,403 | | | | 1.47 | | | | 1.47 | | | | (0.72 | ) | | | 34 | |
R4 | | | 28.47 | | | | (0.12 | ) | | | 4.27 | | | | 4.15 | | | | — | | | | (2.01 | ) | | | — | | | | (2.01 | ) | | | 30.61 | | | | 15.55 | | | | 94,232 | | | | 1.16 | | | | 1.16 | | | | (0.41 | ) | | | 34 | |
R5 | | | 28.69 | | | | (0.03 | ) | | | 4.31 | | | | 4.28 | | | | — | | | | (2.01 | ) | | | — | | | | (2.01 | ) | | | 30.96 | | | | 15.91 | | | | 110,364 | | | | 0.86 | | | | 0.86 | | | | (0.11 | ) | | | 34 | |
R6 | | | — | | | | — | | | | — | | | | — | | | | — | | | | — | | | | — | | | | — | | | | 31.11 | | | | — | | | | | | | | — | | | | — | | | | — | | | | — | |
Y | | | 28.77 | | | | (0.01 | ) | | | 4.35 | | | | 4.34 | | | | — | | | | (2.01 | ) | | | — | | | | (2.01 | ) | | | 31.10 | | | | 16.08 | | | | 1,078,695 | | | | 0.76 | | | | 0.76 | | | | (0.02 | ) | | | 34 | |
| | | | | | | | | | | |
For the Year Ended October 31, 2013 | | | | | | | | | | | | | | | | | | | | | | | | | | | | | | | | | | | | | | | | | | | | | |
A | | $ | 20.44 | | | $ | (0.03 | ) | | $ | 6.56 | | | $ | 6.53 | | | $ | — | | | $ | (1.30 | ) | | $ | — | | | $ | (1.30 | ) | | $ | 25.67 | | | | 34.17 | % | | $ | 1,847,041 | | | | 1.20 | % | | | 1.20 | % | | | (0.14 | )% | | | 38 | % |
B | | | 17.00 | | | | (0.18 | ) | | | 5.36 | | | | 5.18 | | | | — | | | | (1.30 | ) | | | — | | | | (1.30 | ) | | | 20.88 | | | | 33.01 | | | | 33,232 | | | | 2.11 | | | | 2.07 | | | | (1.00 | ) | | | 38 | |
C | | | 17.29 | | | | (0.16 | ) | | | 5.47 | | | | 5.31 | | | | — | | | | (1.30 | ) | | | — | | | | (1.30 | ) | | | 21.30 | | | | 33.21 | | | | 474,663 | | | | 1.91 | | | | 1.91 | | | | (0.85 | ) | | | 38 | |
I | | | 20.65 | | | | 0.02 | | | | 6.63 | | | | 6.65 | | | | (0.05 | ) | | | (1.30 | ) | | | — | | | | (1.35 | ) | | | 25.95 | | | | 34.48 | | | | 277,953 | | | | 0.96 | | | | 0.96 | | | | 0.09 | | | | 38 | |
R3 | | | 22.25 | | | | (0.10 | ) | | | 7.18 | | | | 7.08 | | | | — | | | | (1.30 | ) | | | — | | | | (1.30 | ) | | | 28.03 | | | | 33.80 | | | | 47,837 | | | | 1.48 | | | | 1.48 | | | | (0.43 | ) | | | 38 | |
R4 | | | 22.51 | | | | (0.03 | ) | | | 7.29 | | | | 7.26 | | | | — | | | | (1.30 | ) | | | — | | | | (1.30 | ) | | | 28.47 | | | | 34.24 | | | | 77,603 | | | | 1.17 | | | | 1.17 | | | | (0.13 | ) | | | 38 | |
R5 | | | 22.69 | | | | 0.04 | | | | 7.33 | | | | 7.37 | | | | (0.07 | ) | | | (1.30 | ) | | | — | | | | (1.37 | ) | | | 28.69 | | | | 34.60 | | | | 91,163 | | | | 0.87 | | | | 0.87 | | | | 0.17 | | | | 38 | |
Y | | | 22.75 | | | | 0.07 | | | | 7.34 | | | | 7.41 | | | | (0.09 | ) | | | (1.30 | ) | | | — | | | | (1.39 | ) | | | 28.77 | | | | 34.73 | | | | 872,297 | | | | 0.77 | | | | 0.77 | | | | 0.28 | | | | 38 | |
| | | | | | | | | | | |
For the Year Ended October 31, 2012 | | | | | | | | | | | | | | | | | | | | | | | | | | | | | | | | | | | | | | | | | | | | | |
A | | $ | 20.67 | | | $ | 0.05 | | | $ | 2.22 | | | $ | 2.27 | | | $ | — | | | $ | (2.50 | ) | | $ | — | | | $ | (2.50 | ) | | $ | 20.44 | | | | 13.47 | % | | $ | 1,536,203 | | | | 1.23 | % | | | 1.23 | % | | | 0.25 | % | | | 45 | % |
B | | | 17.77 | | | | (0.10 | ) | | | 1.83 | | | | 1.73 | | | | — | | | | (2.50 | ) | | | — | | | | (2.50 | ) | | | 17.00 | | | | 12.50 | | | | 30,803 | | | | 2.16 | | | | 2.08 | | | | (0.62 | ) | | | 45 | |
C | | | 18.01 | | | | (0.08 | ) | | | 1.86 | | | | 1.78 | | | | — | | | | (2.50 | ) | | | — | | | | (2.50 | ) | | | 17.29 | | | | 12.63 | | | | 380,413 | | | | 1.93 | | | | 1.93 | | | | (0.45 | ) | | | 45 | |
I | | | 20.85 | | | | 0.09 | | | | 2.25 | | | | 2.34 | | | | (0.04 | ) | | | (2.50 | ) | | | — | | | | (2.54 | ) | | | 20.65 | | | | 13.78 | | | | 213,875 | | | | 0.99 | | | | 0.99 | | | | 0.48 | | | | 45 | |
R3 | | | 22.32 | | | | — | | | | 2.43 | | | | 2.43 | | | | — | | | | (2.50 | ) | | | — | | | | (2.50 | ) | | | 22.25 | | | | 13.16 | | | | 37,776 | | | | 1.49 | | | | 1.49 | | | | (0.01 | ) | | | 45 | |
R4 | | | 22.49 | | | | 0.06 | | | | 2.46 | | | | 2.52 | | | | — | | | | (2.50 | ) | | | — | | | | (2.50 | ) | | | 22.51 | | | | 13.50 | | | | 57,799 | | | | 1.18 | | | | 1.18 | | | | 0.29 | | | | 45 | |
R5 | | | 22.66 | | | | 0.13 | | | | 2.47 | | | | 2.60 | | | | (0.07 | ) | | | (2.50 | ) | | | — | | | | (2.57 | ) | | | 22.69 | | | | 13.85 | | | | 66,039 | | | | 0.88 | | | | 0.88 | | | | 0.59 | | | | 45 | |
Y | | | 22.71 | | | | 0.15 | | | | 2.48 | | | | 2.63 | | | | (0.09 | ) | | | (2.50 | ) | | | — | | | | (2.59 | ) | | | 22.75 | | | | 13.98 | | | | 642,084 | | | | 0.78 | | | | 0.78 | | | | 0.70 | | | | 45 | |
| | | | | | | | | | | |
For the Year Ended October 31, 2011 | | | | | | | | | | | | | | | | | | | | | | | | | | | | | | | | | | | | | | | | | | | | | |
A | | $ | 20.16 | | | $ | 0.02 | | | $ | 0.49 | | | $ | 0.51 | | | $ | — | | | $ | — | | | $ | — | | | $ | — | | | $ | 20.67 | | | | 2.53 | % | | $ | 1,754,028 | | | | 1.21 | % | | | 1.21 | % | | | 0.09 | % | | | 70 | % |
B | | | 17.48 | | | | (0.14 | ) | | | 0.43 | | | | 0.29 | | | | — | | | | — | | | | — | | | | — | | | | 17.77 | | | | 1.66 | | | | 44,266 | | | | 2.06 | | | | 2.06 | | | | (0.72 | ) | | | 70 | |
C | | | 17.68 | | | | (0.12 | ) | | | 0.45 | | | | 0.33 | | | | — | | | | — | | | | — | | | | — | | | | 18.01 | | | | 1.87 | | | | 422,515 | | | | 1.91 | | | | 1.91 | | | | (0.63 | ) | | | 70 | |
I | | | 20.28 | | | | 0.09 | | | | 0.48 | | | | 0.57 | | | | — | | | | — | | | | — | | | | — | | | | 20.85 | | | | 2.81 | | | | 324,002 | | | | 0.92 | | | | 0.92 | | | | 0.40 | | | | 70 | |
R3 | | | 21.82 | | | | (0.05 | ) | | | 0.55 | | | | 0.50 | | | | — | | | | — | | | | — | | | | — | | | | 22.32 | | | | 2.29 | | | | 40,311 | | | | 1.48 | | | | 1.48 | | | | (0.23 | ) | | | 70 | |
R4 | | | 21.92 | | | | 0.02 | | | | 0.55 | | | | 0.57 | | | | — | | | | — | | | | — | | | | — | | | | 22.49 | | | | 2.60 | | | | 65,550 | | | | 1.18 | | | | 1.18 | | | | 0.07 | | | | 70 | |
R5 | | | 22.02 | | | | 0.09 | | | | 0.55 | | | | 0.64 | | | | — | | | | — | | | | — | | | | — | | | | 22.66 | | | | 2.91 | | | | 73,192 | | | | 0.87 | | | | 0.87 | | | | 0.38 | | | | 70 | |
Y | | | 22.05 | | | | 0.12 | | | | 0.54 | | | | 0.66 | | | | — | | | | — | | | | — | | | | — | | | | 22.71 | | | | 2.99 | | | | 678,566 | | | | 0.77 | | | | 0.77 | | | | 0.50 | | | | 70 | |
| | | | | | | | | | | |
For the Year Ended October 31, 2010 | | | | | | | | | | | | | | | | | | | | | | | | | | | | | | | | | | | | | | | | | | | | | |
A | | $ | 16.20 | | | $ | (0.04 | ) | | $ | 4.00 | | | $ | 3.96 | | | $ | — | | | $ | — | | | $ | — | | | $ | — | | | $ | 20.16 | | | | 24.44 | % | | $ | 2,275,785 | | | | 1.25 | % | | | 1.25 | % | | | (0.24 | )% | | | 56 | % |
B | | | 14.16 | | | | (0.17 | ) | | | 3.49 | | | | 3.32 | | | | — | | | | — | | | | — | | | | — | | | | 17.48 | | | | 23.45 | | | | 108,330 | | | | 2.05 | | | | 2.05 | | | | (1.03 | ) | | | 56 | |
C | | | 14.30 | | | | (0.15 | ) | | | 3.53 | | | | 3.38 | | | | — | | | | — | | | | — | | | | — | | | | 17.68 | | | | 23.64 | | | | 448,592 | | | | 1.93 | | | | 1.93 | | | | (0.92 | ) | | | 56 | |
I | | | 16.25 | | | | — | | | | 4.03 | | | | 4.03 | | | | — | | | | — | | | | — | | | | — | | | | 20.28 | | | | 24.80 | | | | 541,255 | | | | 0.96 | | | | 0.96 | | | | 0.01 | | | | 56 | |
R3 | | | 17.58 | | | | (0.11 | ) | | | 4.35 | | | | 4.24 | | | | — | | | | — | | | | — | | | | — | | | | 21.82 | | | | 24.12 | | | | 22,038 | | | | 1.49 | | | | 1.49 | | | | (0.57 | ) | | | 56 | |
R4 | | | 17.60 | | | | (0.04 | ) | | | 4.36 | | | | 4.32 | | | | — | | | | — | | | | — | | | | — | | | | 21.92 | | | | 24.55 | | | | 41,422 | | | | 1.18 | | | | 1.18 | | | | (0.23 | ) | | | 56 | |
R5 | | | 17.62 | | | | 0.01 | | | | 4.39 | | | | 4.40 | | | | — | | | | — | | | | — | | | | — | | | | 22.02 | | | | 24.97 | | | | 47,915 | | | | 0.88 | | | | 0.88 | | | | 0.05 | | | | 56 | |
Y | | | 17.63 | | | | 0.05 | | | | 4.37 | | | | 4.42 | | | | — | | | | — | | | | — | | | | — | | | | 22.05 | | | | 25.07 | | | | 556,046 | | | | 0.78 | | | | 0.78 | | | | 0.23 | | | | 56 | |
The accompanying notes are an integral part of these financial statements.
|
| Hartford Funds – Domestic Equity Funds |
Financial Highlights – (continued)
| | | | | | | | | | | | | | | | | | | | | | | | | | | | | | | | | | | | | | | | | | | | | | | | | | | | | | | | | | | | |
| | | — Selected Per-Share Data(1) — | | | — Ratios and Supplemental Data — | |
Class | | Net Asset
Value at,
Beginning
of Period | | | Net
Investment
Income
(Loss) | | | Net
Realized
and
Unrealized
Gain (Loss)
on
Investments | | | Total from
Investment
Operations | | | Dividends
from Net
Investment
Income | | | Distributions
from
Realized
Capital
Gains | | | Distributions
Capital | | | Total
Dividends
and
Distributions | | | Net
Asset
Value
End of
Period | | | Total
Return(2) | | | Net
Assets at
End of
Period
(000s) | | | Ratio of
Expenses
to
Average
Net
Assets
Before
Adjust-
ments(3) | | | Ratio of
Expenses
to
Average
Net
Assets
After
Adjust-
ments(3) | | | Ratio of
Net
Investment
Income
(Loss) to
Average
Net Assets | | | Portfolio
Turnover | |
| The Hartford MidCap Value Fund | | | | | | | | | | | | | | | | | | | | | | | | | | | | | | | | | | | | | | | | | |
For the Six-Month Period Ended April 30, 2015 (Unaudited) | | | | | | | | | | | | | | | | | | | | | | | | | | | | | | | | | | | | | | | | | |
A | | $ | 16.73 | | | $ | — | | | $ | 0.85 | | | $ | 0.85 | | | $ | (0.02 | ) | | $ | (1.87 | ) | | $ | — | | | $ | (1.89 | ) | | $ | 15.69 | | | | 6.20 | %(4) | | $ | 237,709 | | | | 1.24 | %(5) | | | 1.24 | %(5) | | | 0.03 | %(5) | | | 16 | % |
B | | | 14.91 | | | | (0.06 | ) | | | 0.73 | | | | 0.67 | | | | — | | | | (1.87 | ) | | | — | | | | (1.87 | ) | | | 13.71 | | | | 5.69 | (4) | | | 1,874 | | | | 2.27 | (5) | | | 2.10 | (5) | | | (0.83 | )(5) | | | 16 | |
C | | | 14.84 | | | | (0.05 | ) | | | 0.73 | | | | 0.68 | | | | — | | | | (1.87 | ) | | | — | | | | (1.87 | ) | | | 13.65 | | | | 5.79 | (4) | | | 43,134 | | | | 1.96 | (5) | | | 1.96 | (5) | | | (0.69 | )(5) | | | 16 | |
I | | | 16.85 | | | | 0.03 | | | | 0.85 | | | | 0.88 | | | | (0.08 | ) | | | (1.87 | ) | | | — | | | | (1.95 | ) | | | 15.78 | | | | 6.34 | (4) | | | 34,831 | | | | 0.94 | (5) | | | 0.94 | (5) | | | 0.33 | (5) | | | 16 | |
R3 | | | 17.45 | | | | (0.02 | ) | | | 0.88 | | | | 0.86 | | | | — | | | | (1.87 | ) | | | — | | | | (1.87 | ) | | | 16.44 | | | | 5.97 | (4) | | | 9,153 | | | | 1.52 | (5) | | | 1.52 | (5) | | | (0.26 | )(5) | | | 16 | |
R4 | | | 17.61 | | | | — | | | | 0.90 | | | | 0.90 | | | | (0.04 | ) | | | (1.87 | ) | | | — | | | | (1.91 | ) | | | 16.60 | | | | 6.16 | (4) | | | 12,273 | | | | 1.21 | (5) | | | 1.21 | (5) | | | 0.06 | (5) | | | 16 | |
R5 | | | 17.75 | | | | 0.03 | | | | 0.91 | | | | 0.94 | | | | (0.08 | ) | | | (1.87 | ) | | | — | | | | (1.95 | ) | | | 16.74 | | | | 6.37 | (4) | | | 7,615 | | | | 0.92 | (5) | | | 0.92 | (5) | | | 0.35 | (5) | | | 16 | |
Y | | | 17.78 | | | | 0.04 | | | | 0.91 | | | | 0.95 | | | | (0.09 | ) | | | (1.87 | ) | | | — | | | | (1.96 | ) | | | 16.77 | | | | 6.41 | (4) | | | 165,428 | | | | 0.81 | (5) | | | 0.81 | (5) | | | 0.46 | (5) | | | 16 | |
| | | | | | | | | | | |
For the Year Ended October 31, 2014 | | | | | | | | | | | | | | | | | | | | | | | | | | | | | | | | | | | | | | | | | | | | | |
A | | $ | 16.44 | | | $ | 0.03 | | | $ | 1.81 | | | $ | 1.84 | | | $ | — | | | $ | (1.55 | ) | | $ | — | | | $ | (1.55 | ) | | $ | 16.73 | | | | 12.32 | % | | $ | 222,876 | | | | 1.27 | % | | | 1.27 | % | | | 0.19 | % | | | 43 | % |
B | | | 14.93 | | | | (0.09 | ) | | | 1.62 | | | | 1.53 | | | | — | | | | (1.55 | ) | | | — | | | | (1.55 | ) | | | 14.91 | | | | 11.41 | | | | 2,156 | | | | 2.28 | | | | 2.10 | | | | (0.63 | ) | | | 43 | |
C | | | 14.85 | | | | (0.08 | ) | | | 1.62 | | | | 1.54 | | | | — | | | | (1.55 | ) | | | — | | | | (1.55 | ) | | | 14.84 | | | | 11.56 | | | | 41,382 | | | | 1.99 | | | | 1.99 | | | | (0.53 | ) | | | 43 | |
I | | | 16.49 | | | | 0.09 | | | | 1.82 | | | | 1.91 | | | | — | | | | (1.55 | ) | | | — | | | | (1.55 | ) | | | 16.85 | | | | 12.75 | | | | 37,414 | | | | 0.92 | | | | 0.92 | | | | 0.53 | | | | 43 | |
R3 | | | 17.12 | | | | (0.01 | ) | | | 1.89 | | | | 1.88 | | | | — | | | | (1.55 | ) | | | — | | | | (1.55 | ) | | | 17.45 | | | | 12.05 | | | | 10,187 | | | | 1.53 | | | | 1.53 | | | | (0.08 | ) | | | 43 | |
R4 | | | 17.21 | | | | 0.04 | | | | 1.91 | | | | 1.95 | | | | — | | | | (1.55 | ) | | | — | | | | (1.55 | ) | | | 17.61 | | | | 12.42 | | | | 9,476 | | | | 1.22 | | | | 1.22 | | | | 0.22 | | | | 43 | |
R5 | | | 17.29 | | | | 0.09 | | | | 1.92 | | | | 2.01 | | | | — | | | | (1.55 | ) | | | — | | | | (1.55 | ) | | | 17.75 | | | | 12.73 | | | | 2,851 | | | | 0.93 | | | | 0.93 | | | | 0.52 | | | | 43 | |
Y | | | 17.31 | | | | 0.11 | | | | 1.91 | | | | 2.02 | | | | — | | | | (1.55 | ) | | | — | | | | (1.55 | ) | | | 17.78 | | | | 12.79 | | | | 166,729 | | | | 0.82 | | | | 0.82 | | | | 0.63 | | | | 43 | |
|
For the Year Ended October 31, 2013 | |
A | | $ | 12.58 | | | $ | 0.02 | | | $ | 3.97 | | | $ | 3.99 | | | $ | (0.13 | ) | | $ | — | | | $ | — | | | $ | (0.13 | ) | | $ | 16.44 | | | | 32.01 | % | | $ | 207,552 | | | | 1.31 | % | | | 1.31 | % | | | 0.11 | % | | | 59 | % |
B | | | 11.40 | | | | (0.09 | ) | | | 3.62 | | | | 3.53 | | | | — | | | | — | | | | — | | | | — | | | | 14.93 | | | | 30.96 | | | | 2,819 | | | | 2.33 | | | | 2.10 | | | | (0.68 | ) | | | 59 | |
C | | | 11.38 | | | | (0.08 | ) | | | 3.60 | | | | 3.52 | | | | (0.05 | ) | | | — | | | | — | | | | (0.05 | ) | | | 14.85 | | | | 31.07 | | | | 38,067 | | | | 2.01 | | | | 2.01 | | | | (0.60 | ) | | | 59 | |
I | | | 12.62 | | | | 0.06 | | | | 3.99 | | | | 4.05 | | | | (0.18 | ) | | | — | | | | — | | | | (0.18 | ) | | | 16.49 | | | | 32.49 | | | | 18,791 | | | | 0.96 | | | | 0.96 | | | | 0.43 | | | | 59 | |
R3 | | | 13.12 | | | | (0.02 | ) | | | 4.15 | | | | 4.13 | | | | (0.13 | ) | | | — | | | | — | | | | (0.13 | ) | | | 17.12 | | | | 31.68 | | | | 5,089 | | | | 1.53 | | | | 1.53 | | | | (0.12 | ) | | | 59 | |
R4 | | | 13.17 | | | | 0.03 | | | | 4.16 | | | | 4.19 | | | | (0.15 | ) | | | — | | | | — | | | | (0.15 | ) | | | 17.21 | | | | 32.11 | | | | 4,903 | | | | 1.22 | | | | 1.22 | | | | 0.18 | | | | 59 | |
R5 | | | 13.23 | | | | 0.06 | | | | 4.19 | | | | 4.25 | | | | (0.19 | ) | | | — | | | | — | | | | (0.19 | ) | | | 17.29 | | | | 32.46 | | | | 1,309 | | | | 0.93 | | | | 0.93 | | | | 0.38 | | | | 59 | |
Y | | | 13.24 | | | | 0.09 | | | | 4.18 | | | | 4.27 | | | | (0.20 | ) | | | — | | | | — | | | | (0.20 | ) | | | 17.31 | | | | 32.64 | | | | 150,335 | | | | 0.82 | | | | 0.82 | | | | 0.60 | | | | 59 | |
| | | | | | | | | | | |
For the Year Ended October 31, 2012 | | | | | | | | | | | | | | | | | | | | | | | | | | | | | | | | | | | | | | | | | | | | | |
A | | $ | 10.75 | | | $ | 0.08 | | | $ | 1.80 | | | $ | 1.88 | | | $ | (0.05 | ) | | $ | — | | | $ | — | | | $ | (0.05 | ) | | $ | 12.58 | | | | 17.55 | % | | $ | 159,104 | | | | 1.38 | % | | | 1.35 | % | | | 0.67 | % | | | 59 | % |
B | | | 9.77 | | | | (0.02 | ) | | | 1.65 | | | | 1.63 | | | | — | | | | — | | | | — | | | | — | | | | 11.40 | | | | 16.88 | | | | 2,813 | | | | 2.38 | | | | 2.10 | | | | (0.21 | ) | | | 59 | |
C | | | 9.74 | | | | — | | | | 1.64 | | | | 1.64 | | | | — | | | | — | | | | — | | | | — | | | | 11.38 | | | | 16.84 | | | | 28,522 | | | | 2.06 | | | | 2.06 | | | | (0.05 | ) | | | 59 | |
I | | | 10.79 | | | | 0.12 | | | | 1.81 | | | | 1.93 | | | | (0.10 | ) | | | — | | | | — | | | | (0.10 | ) | | | 12.62 | | | | 18.02 | | | | 5,296 | | | | 1.00 | | | | 1.00 | | | | 1.06 | | | | 59 | |
R3 | | | 11.23 | | | | 0.06 | | | | 1.88 | | | | 1.94 | | | | (0.05 | ) | | | — | | | | — | | | | (0.05 | ) | | | 13.12 | | | | 17.41 | | | | 3,514 | | | | 1.55 | | | | 1.55 | | | | 0.50 | | | | 59 | |
R4 | | | 11.28 | | | | 0.10 | | | | 1.88 | | | | 1.98 | | | | (0.09 | ) | | | — | | | | — | | | | (0.09 | ) | | | 13.17 | | | | 17.70 | | | | 2,735 | | | | 1.25 | | | | 1.25 | | | | 0.79 | | | | 59 | |
R5 | | | 11.31 | | | | 0.14 | | | | 1.88 | | | | 2.02 | | | | (0.10 | ) | | | — | | | | — | | | | (0.10 | ) | | | 13.23 | | | | 18.07 | | | | 311 | | | | 0.96 | | | | 0.95 | | | | 1.14 | | | | 59 | |
Y | | | 11.31 | | | | 0.15 | | | | 1.89 | | | | 2.04 | | | | (0.11 | ) | | | — | | | | — | | | | (0.11 | ) | | | 13.24 | | | | 18.22 | | | | 136,388 | | | | 0.84 | | | | 0.84 | | | | 1.24 | | | | 59 | |
|
For the Year Ended October 31, 2011 | |
A | | $ | 10.69 | | | $ | 0.01 | | | $ | 0.05 | | | $ | 0.06 | | | $ | — | | | $ | — | | | $ | — | | | $ | — | | | $ | 10.75 | | | | 0.56 | % | | $ | 147,222 | | | | 1.38 | % | | | 1.35 | % | | | 0.05 | % | | | 54 | % |
B | | | 9.79 | | | | (0.07 | ) | | | 0.05 | | | | (0.02 | ) | | | — | | | | — | | | | — | | | | — | | | | 9.77 | | | | (0.20 | ) | | | 8,100 | | | | 2.32 | | | | 2.10 | | | | (0.69 | ) | | | 54 | |
C | | | 9.77 | | | | (0.07 | ) | | | 0.04 | | | | (0.03 | ) | | | — | | | | — | | | | — | | | | — | | | | 9.74 | | | | (0.31 | ) | | | 28,939 | | | | 2.09 | | | | 2.09 | | | | (0.70 | ) | | | 54 | |
I | | | 10.72 | | | | 0.04 | | | | 0.05 | | | | 0.09 | | | | (0.02 | ) | | | — | | | | — | | | | (0.02 | ) | | | 10.79 | | | | 0.81 | | | | 3,459 | | | | 1.04 | | | | 1.04 | | | | 0.34 | | | | 54 | |
R3 | | | 11.20 | | | | (0.03 | ) | | | 0.06 | | | | 0.03 | | | | — | | | | — | | | | — | | | | — | | | | 11.23 | | | | 0.27 | | | | 1,584 | | | | 1.60 | | | | 1.55 | | | | (0.23 | ) | | | 54 | |
R4 | | | 11.21 | | | | (0.01 | ) | | | 0.08 | | | | 0.07 | | | | — | | | | — | | | | — | | | | — | | | | 11.28 | | | | 0.62 | | | | 1,523 | | | | 1.29 | | | | 1.25 | | | | (0.05 | ) | | | 54 | |
R5 | | | 11.22 | | | | 0.05 | | | | 0.06 | | | | 0.11 | | | | (0.02 | ) | | | — | | | | — | | | | (0.02 | ) | | | 11.31 | | | | 0.96 | | | | 136 | | | | 0.99 | | | | 0.95 | | | | 0.43 | | | | 54 | |
Y | | | 11.22 | | | | 0.06 | | | | 0.06 | | | | 0.12 | | | | (0.03 | ) | | | — | | | | — | | | | (0.03 | ) | | | 11.31 | | | | 1.01 | | | | 109,944 | | | | 0.88 | | | | 0.88 | | | | 0.51 | | | | 54 | |
| | | | | | | | | | | |
For the Year Ended October 31, 2010 | | | | | | | | | | | | | | | | | | | | | | | | | | | | | | | | | | | | | | | | | | | | | |
A | | $ | 8.37 | | | $ | — | | | $ | 2.33 | | | $ | 2.33 | | | $ | (0.01 | ) | | $ | — | | | $ | — | | | $ | (0.01 | ) | | $ | 10.69 | | | | 27.83 | % | | $ | 176,359 | | | | 1.44 | % | | | 1.35 | % | | | 0.01 | % | | | 48 | % |
B | | | 7.72 | | | | (0.06 | ) | | | 2.13 | | | | 2.07 | | | | — | | | | — | | | | — | | | | — | | | | 9.79 | | | | 26.81 | | | | 14,305 | | | | 2.32 | | | | 2.10 | | | | (0.70 | ) | | | 48 | |
C | | | 7.70 | | | | (0.07 | ) | | | 2.14 | | | | 2.07 | | | | — | | | | — | | | | — | | | | — | | | | 9.77 | | | | 26.88 | | | | 30,467 | | | | 2.13 | | | | 2.10 | | | | (0.74 | ) | | | 48 | |
I | | | 9.71 | | | | — | | | | 1.01 | | | | 1.01 | | | | — | | | | — | | | | — | | | | — | | | | 10.72 | | | | 10.40 | | | | 254 | | | | 0.95 | | | | 0.95 | | | | 0.06 | | | | 48 | |
R3 | | | 10.17 | | | | (0.02 | ) | | | 1.05 | | | | 1.03 | | | | — | | | | — | | | | — | | | | — | | | | 11.20 | | | | 10.13 | | | | 110 | | | | 1.60 | | | | 1.55 | | | | (0.40 | ) | | | 48 | |
R4 | | | 10.17 | | | | — | | | | 1.04 | | | | 1.04 | | | | — | | | | — | | | | — | | | | — | | | | 11.21 | | | | 10.23 | | | | 110 | | | | 1.30 | | | | 1.25 | | | | (0.10 | ) | | | 48 | |
R5 | | | 10.17 | | | | 0.01 | | | | 1.04 | | | | 1.05 | | | | — | | | | — | | | | — | | | | — | | | | 11.22 | | | | 10.32 | | | | 111 | | | | 1.00 | | | | 0.96 | | | | 0.20 | | | | 48 | |
Y | | | 8.77 | | | | 0.04 | | | | 2.44 | | | | 2.48 | | | | (0.03 | ) | | | — | | | | — | | | | (0.03 | ) | | | 11.22 | | | | 28.39 | | | | 96,621 | | | | 0.90 | | | | 0.90 | | | | 0.39 | | | | 48 | |
The accompanying notes are an integral part of these financial statements.
|
| Hartford Funds – Domestic Equity Funds |
Financial Highlights – (continued)
| | | | | | | | | | | | | | | | | | | | | | | | | | | | | | | | | | | | | | | | | | | | | | | | | | | | | | | | | | | | |
| | | — Selected Per-Share Data(1) — | | | — Ratios and Supplemental Data — | |
Class | | Net Asset
Value at,
Beginning
of Period | | | Net
Investment
Income
(Loss) | | | Net
Realized
and
Unrealized
Gain (Loss)
on
Investments | | | Total from
Investment
Operations | | | Dividends
from Net
Investment
Income | | | Distributions
from
Realized
Capital
Gains | | | Distributions
Capital | | | Total
Dividends
and
Distributions | | | Net
Asset
Value
End of
Period | | | Total
Return(2) | | | Net
Assets at
End of
Period
(000s) | | | Ratio of
Expenses
to
Average
Net
Assets
Before
Adjust-
ments(3) | | | Ratio of
Expenses
to
Average
Net
Assets
After
Adjust-
ments(3) | | | Ratio of
Net
Investment
Income
(Loss) to
Average
Net Assets | | | Portfolio
Turnover | |
| The Hartford Small Company Fund | | | | | | | | | | | | | | | | | | | | | | | | | | | | | | | | | | | | | | | | | |
For the Six-Month Period Ended April 30, 2015 (Unaudited) | | | | | | | | | | | | | | | | | | | | | | | | | | | | | | | | | | | | | | | | | |
A | | $ | 24.83 | | | $ | (0.08 | ) | | $ | 0.71 | | | $ | 0.63 | | | $ | — | | | $ | (4.09 | ) | | $ | — | | | $ | (4.09 | ) | | $ | 21.37 | | | | 3.51 | %(4) | | $ | 372,856 | | | | 1.34 | %(5) | | | 1.34 | %(5) | | | (0.74 | )%(5) | | | 51 | % |
B | | | 20.40 | | | | (0.13 | ) | | | 0.54 | | | | 0.41 | | | | — | | | | (4.09 | ) | | | — | | | | (4.09 | ) | | | 16.72 | | | | 3.13 | (4) | | | 3,952 | | | | 2.27 | (5) | | | 2.14 | (5) | | | (1.53 | )(5) | | | 51 | |
C | | | 20.36 | | | | (0.12 | ) | | | 0.53 | | | | 0.41 | | | | — | | | | (4.09 | ) | | | — | | | | (4.09 | ) | | | 16.68 | | | | 3.14 | (4) | | | 39,511 | | | | 2.02 | (5) | | | 2.02 | (5) | | | (1.42 | )(5) | | | 51 | |
I | | | 25.51 | | | | (0.06 | ) | | | 0.74 | | | | 0.68 | | | | — | | | | (4.09 | ) | | | — | | | | (4.09 | ) | | | 22.10 | | | | 3.63 | (4) | | | 71,400 | | | | 1.12 | (5) | | | 1.12 | (5) | | | (0.52 | )(5) | | | 51 | |
R3 | | | 26.39 | | | | (0.11 | ) | | | 0.77 | | | | 0.66 | | | | — | | | | (4.09 | ) | | | — | | | | (4.09 | ) | | | 22.96 | | | | 3.40 | (4) | | | 40,616 | | | | 1.54 | (5) | | | 1.54 | (5) | | | (0.95 | )(5) | | | 51 | |
R4 | | | 27.21 | | | | (0.08 | ) | | | 0.81 | | | | 0.73 | | | | — | | | | (4.09 | ) | | | — | | | | (4.09 | ) | | | 23.85 | | | | 3.54 | (4) | | | 69,036 | | | | 1.24 | (5) | | | 1.24 | (5) | | | (0.64 | )(5) | | | 51 | |
R5 | | | 27.95 | | | | (0.04 | ) | | | 0.83 | | | | 0.79 | | | | — | | | | (4.09 | ) | | | — | | | | (4.09 | ) | | | 24.65 | | | | 3.72 | (4) | | | 11,056 | | | | 0.96 | (5) | | | 0.95 | (5) | | | (0.34 | )(5) | | | 51 | |
R6(6) | | | 28.20 | | | | (0.03 | ) | | | 0.92 | | | | 0.89 | | | | — | | | | (4.09 | ) | | | — | | | | (4.09 | ) | | | 25.00 | | | | 4.05 | (4) | | | 10 | | | | 0.84 | (5) | | | 0.84 | (5) | | | (0.23 | )(5) | | | 51 | |
Y | | | 28.27 | | | | (0.03 | ) | | | 0.84 | | | | 0.81 | | | | — | | | | (4.09 | ) | | | — | | | | (4.09 | ) | | | 24.99 | | | | 3.75 | (4) | | | 350,323 | | | | 0.84 | (5) | | | 0.84 | (5) | | | (0.24 | )(5) | | | 51 | |
| | | | | | | | | | | |
For the Year Ended October 31, 2014 | | | | | | | | | | | | | | | | | | | | | | | | | | | | | | | | | | | | | | | | | | | | | |
A | | $ | 24.58 | | | $ | (0.24 | ) | | $ | 3.26 | | | $ | 3.02 | | | $ | — | | | $ | (2.77 | ) | | $ | — | | | $ | (2.77 | ) | | $ | 24.83 | | | | 13.49 | % | | $ | 355,056 | | | | 1.34 | % | | | 1.34 | % | | | (1.01 | )% | | | 92 | % |
B | | | 20.82 | | | | (0.36 | ) | | | 2.71 | | | | 2.35 | | | | — | | | | (2.77 | ) | | | — | | | | (2.77 | ) | | | 20.40 | | | | 12.61 | | | | 4,730 | | | | 2.29 | | | | 2.15 | | | | (1.80 | ) | | | 92 | |
C | | | 20.77 | | | | (0.34 | ) | | | 2.70 | | | | 2.36 | | | | — | | | | (2.77 | ) | | | — | | | | (2.77 | ) | | | 20.36 | | | | 12.70 | | | | 38,351 | | | | 2.05 | | | | 2.05 | | | | (1.71 | ) | | | 92 | |
I | | | 25.12 | | | | (0.19 | ) | | | 3.35 | | | | 3.16 | | | | — | | | | (2.77 | ) | | | — | | | | (2.77 | ) | | | 25.51 | | | | 13.78 | | | | 60,425 | | | | 1.10 | | | | 1.10 | | | | (0.77 | ) | | | 92 | |
R3 | | | 26.00 | | | | (0.31 | ) | | | 3.47 | | | | 3.16 | | | | — | | | | (2.77 | ) | | | — | | | | (2.77 | ) | | | 26.39 | | | | 13.27 | | | | 60,124 | | | | 1.55 | | | | 1.55 | | | | (1.21 | ) | | | 92 | |
R4 | | | 26.65 | | | | (0.24 | ) | | | 3.57 | | | | 3.33 | | | | — | | | | (2.77 | ) | | | — | | | | (2.77 | ) | | | 27.21 | | | | 13.62 | | | | 66,353 | | | | 1.25 | | | | 1.25 | | | | (0.91 | ) | | | 92 | |
R5 | | | 27.23 | | | | (0.16 | ) | | | 3.65 | | | | 3.49 | | | | — | | | | (2.77 | ) | | | — | | | | (2.77 | ) | | | 27.95 | | | | 13.95 | | | | 7,585 | | | | 0.97 | | | | 0.95 | | | | (0.61 | ) | | | 92 | |
R6 | | | — | | | | — | | | | — | | | | — | | | | — | | | | — | | | | — | | | | — | | | | 28.20 | | | | — | | | | | | | | — | | | | — | | | | — | | | | — | |
Y | | | 27.48 | | | | (0.14 | ) | | | 3.70 | | | | 3.56 | | | | — | | | | (2.77 | ) | | | — | | | | (2.77 | ) | | | 28.27 | | | | 14.08 | | | | 337,933 | | | | 0.85 | | | | 0.85 | | | | (0.51 | ) | | | 92 | |
| | | | | | | | | | | |
For the Year Ended October 31, 2013 | | | | | | | | | | | | | | | | | | | | | | | | | | | | | | | | | | | | | | | | | | | | | |
A | | $ | 19.52 | | | $ | (0.16 | ) | | $ | 6.56 | | | $ | 6.40 | | | $ | — | | | $ | (1.34 | ) | | $ | — | | | $ | (1.34 | ) | | $ | 24.58 | | | | 35.44 | % | | $ | 320,630 | | | | 1.39 | % | | | 1.39 | % | | | (0.73 | )% | | | 106 | % |
B | | | 16.87 | | | | (0.27 | ) | | | 5.56 | | | | 5.29 | | | | — | | | | (1.34 | ) | | | — | | | | (1.34 | ) | | | 20.82 | | | | 34.34 | | | | 6,062 | | | | 2.35 | | | | 2.15 | | | | (1.47 | ) | | | 106 | |
C | | | 16.82 | | | | (0.26 | ) | | | 5.55 | | | | 5.29 | | | | — | | | | (1.34 | ) | | | — | | | | (1.34 | ) | | | 20.77 | | | | 34.45 | | | | 38,428 | | | | 2.09 | | | | 2.09 | | | | (1.43 | ) | | | 106 | |
I | | | 19.87 | | | | (0.11 | ) | | | 6.70 | | | | 6.59 | | | | — | | | | (1.34 | ) | | | — | | | | (1.34 | ) | | | 25.12 | | | | 35.79 | | | | 38,749 | | | | 1.14 | | | | 1.14 | | | | (0.52 | ) | | | 106 | |
R3 | | | 20.61 | | | | (0.20 | ) | | | 6.93 | | | | 6.73 | | | | — | | | | (1.34 | ) | | | — | | | | (1.34 | ) | | | 26.00 | | | | 35.15 | | | | 57,652 | | | | 1.56 | | | | 1.55 | | | | (0.88 | ) | | | 106 | |
R4 | | | 21.03 | | | | (0.14 | ) | | | 7.10 | | | | 6.96 | | | | — | | | | (1.34 | ) | | | — | | | | (1.34 | ) | | | 26.65 | | | | 35.56 | | | | 67,467 | | | | 1.26 | | | | 1.25 | | | | (0.59 | ) | | | 106 | |
R5 | | | 21.39 | | | | (0.06 | ) | | | 7.24 | | | | 7.18 | | | | — | | | | (1.34 | ) | | | — | | | | (1.34 | ) | | | 27.23 | | | | 36.02 | | | | 8,321 | | | | 0.99 | | | | 0.95 | | | | (0.25 | ) | | | 106 | |
Y | | | 21.56 | | | | (0.05 | ) | | | 7.31 | | | | 7.26 | | | | — | | | | (1.34 | ) | | | — | | | | (1.34 | ) | | | 27.48 | | | | 36.12 | | | | 320,003 | | | | 0.86 | | | | 0.86 | | | | (0.20 | ) | | | 106 | |
| | | | | | | | | | | |
For the Year Ended October 31, 2012 | | | | | | | | | | | | | | | | | | | | | | | | | | | | | | | | | | | | | | | | | | | | | |
A | | $ | 19.23 | | | $ | (0.18 | ) | | $ | 1.46 | | | $ | 1.28 | | | $ | — | | | $ | (0.99 | ) | | $ | — | | | $ | (0.99 | ) | | $ | 19.52 | | | | 7.44 | % | | $ | 268,501 | | | | 1.41 | % | | | 1.40 | % | | | (0.85 | )% | | | 124 | % |
B | | | 16.88 | | | | (0.35 | ) | | | 1.33 | | | | 0.98 | | | | — | | | | (0.99 | ) | | | — | | | | (0.99 | ) | | | 16.87 | | | | 6.65 | | | | 5,972 | | | | 2.37 | | | | 2.15 | | | | (1.60 | ) | | | 124 | |
C | | | 16.83 | | | | (0.29 | ) | | | 1.27 | | | | 0.98 | | | | — | | | | (0.99 | ) | | | — | | | | (0.99 | ) | | | 16.82 | | | | 6.67 | | | | 32,182 | | | | 2.12 | | | | 2.12 | | | | (1.57 | ) | | | 124 | |
I | | | 19.51 | | | | (0.11 | ) | | | 1.46 | | | | 1.35 | | | | — | | | | (0.99 | ) | | | — | | | | (0.99 | ) | | | 19.87 | | | | 7.70 | | | | 24,366 | | | | 1.14 | | | | 1.14 | | | | (0.58 | ) | | | 124 | |
R3 | | | 20.27 | | | | (0.20 | ) | | | 1.53 | | | | 1.33 | | | | — | | | | (0.99 | ) | | | — | | | | (0.99 | ) | | | 20.61 | | | | 7.30 | | | | 48,148 | | | | 1.58 | | | | 1.55 | | | | (0.99 | ) | | | 124 | |
R4 | | | 20.60 | | | | (0.13 | ) | | | 1.55 | | | | 1.42 | | | | — | | | | (0.99 | ) | | | — | | | | (0.99 | ) | | | 21.03 | | | | 7.63 | | | | 56,217 | | | | 1.27 | | | | 1.25 | | | | (0.68 | ) | | | 124 | |
R5 | | | 20.88 | | | | (0.11 | ) | | | 1.61 | | | | 1.50 | | | | — | | | | (0.99 | ) | | | — | | | | (0.99 | ) | | | 21.39 | | | | 7.93 | | | | 8,859 | | | | 1.00 | | | | 0.95 | | | | (0.41 | ) | | | 124 | |
Y | | | 21.02 | | | | (0.06 | ) | | | 1.59 | | | | 1.53 | | | | — | | | | (0.99 | ) | | | — | | | | (0.99 | ) | | | 21.56 | | | | 8.02 | | | | 243,219 | | | | 0.87 | | | | 0.87 | | | | (0.30 | ) | | | 124 | |
| | | | | | | | | | | |
For the Year Ended October 31, 2011 | | | | | | | | | | | | | | | | | | | | | | | | | | | | | | | | | | | | | | | | | | | | | |
A | | $ | 17.48 | | | $ | (0.15 | ) | | $ | 1.90 | | | $ | 1.75 | | | $ | — | | | $ | — | | | $ | — | | | $ | — | | | $ | 19.23 | | | | 10.01 | % | | $ | 296,062 | | | | 1.37 | % | | | 1.37 | % | | | (0.77 | )% | | | 111 | % |
B | | | 15.46 | | | | (0.27 | ) | | | 1.69 | | | | 1.42 | | | | — | | | | — | | | | — | | | | — | | | | 16.88 | | | | 9.18 | | | | 9,192 | | | | 2.30 | | | | 2.15 | | | | (1.55 | ) | | | 111 | |
C | | | 15.41 | | | | (0.26 | ) | | | 1.68 | | | | 1.42 | | | | — | | | | — | | | | — | | | | — | | | | 16.83 | | | | 9.21 | | | | 36,465 | | | | 2.10 | | | | 2.10 | | | | (1.50 | ) | | | 111 | |
I | | | 17.68 | | | | (0.10 | ) | | | 1.93 | | | | 1.83 | | | | — | | | | — | | | | — | | | | — | | | | 19.51 | | | | 10.35 | | | | 19,056 | | | | 1.08 | | | | 1.08 | | | | (0.49 | ) | | | 111 | |
R3 | | | 18.45 | | | | (0.20 | ) | | | 2.02 | | | | 1.82 | | | | — | | | | — | | | | — | | | | — | | | | 20.27 | | | | 9.86 | | | | 46,392 | | | | 1.57 | | | | 1.55 | | | | (0.96 | ) | | | 111 | |
R4 | | | 18.70 | | | | (0.14 | ) | | | 2.04 | | | | 1.90 | | | | — | | | | — | | | | — | | | | — | | | | 20.60 | | | | 10.16 | | | | 51,387 | | | | 1.26 | | | | 1.25 | | | | (0.66 | ) | | | 111 | |
R5 | | | 18.90 | | | | (0.08 | ) | | | 2.06 | | | | 1.98 | | | | — | | | | — | | | | — | | | | — | | | | 20.88 | | | | 10.48 | | | | 9,867 | | | | 0.99 | | | | 0.95 | | | | (0.35 | ) | | | 111 | |
Y | | | 19.01 | | | | (0.06 | ) | | | 2.07 | | | | 2.01 | | | | — | | | | — | | | | — | | | | — | | | | 21.02 | | | | 10.57 | | | | 235,036 | | | | 0.86 | | | | 0.86 | | | | (0.26 | ) | | | 111 | |
| | | | | | | | | | | |
For the Year Ended October 31, 2010 | | | | | | | | | | | | | | | | | | | | | | | | | | | | | | | | | | | | | | | | | | | | | |
A | | $ | 13.90 | | | $ | (0.13 | ) | | $ | 3.71 | | | $ | 3.58 | | | $ | — | | | $ | — | | | $ | — | | | $ | — | | | $ | 17.48 | | | | 25.76 | % | | $ | 289,558 | | | | 1.41 | % | | | 1.40 | % | | | (0.80 | )% | | | 181 | % |
B | | | 12.39 | | | | (0.22 | ) | | | 3.29 | | | | 3.07 | | | | — | | | | — | | | | — | | | | — | | | | 15.46 | | | | 24.78 | | | | 12,384 | | | | 2.36 | | | | 2.15 | | | | (1.54 | ) | | | 181 | |
C | | | 12.34 | | | | (0.22 | ) | | | 3.29 | | | | 3.07 | | | | — | | | | — | | | | — | | | | — | | | | 15.41 | | | | 24.88 | | | | 40,018 | | | | 2.16 | | | | 2.15 | | | | (1.55 | ) | | | 181 | |
I | | | 14.03 | | | | (0.09 | ) | | | 3.74 | | | | 3.65 | | | | — | | | | — | | | | — | | | | — | | | | 17.68 | | | | 26.02 | | | | 13,283 | | | | 1.17 | | | | 1.15 | | | | (0.54 | ) | | | 181 | |
R3 | | | 14.70 | | | | (0.16 | ) | | | 3.91 | | | | 3.75 | | | | — | | | | — | | | | — | | | | — | | | | 18.45 | | | | 25.51 | | | | 35,873 | | | | 1.59 | | | | 1.57 | | | | (1.00 | ) | | | 181 | |
R4 | | | 14.85 | | | | (0.11 | ) | | | 3.96 | | | | 3.85 | | | | — | | | | — | | | | — | | | | — | | | | 18.70 | | | | 25.93 | | | | 45,096 | | | | 1.28 | | | | 1.26 | | | | (0.67 | )�� | | | 181 | |
R5 | | | 14.97 | | | | (0.07 | ) | | | 4.00 | | | | 3.93 | | | | — | | | | — | | | | — | | | | — | | | | 18.90 | | | | 26.25 | | | | 11,706 | | | | 1.02 | | | | 1.02 | | | | (0.41 | ) | | | 181 | |
Y | | | 15.03 | | | | (0.05 | ) | | | 4.03 | | | | 3.98 | | | | — | | | | — | | | | — | | | | — | | | | 19.01 | | | | 26.48 | | | | 273,558 | | | | 0.87 | | | | 0.87 | | | | (0.28 | ) | | | 181 | |
The accompanying notes are an integral part of these financial statements.
|
| Hartford Funds – Domestic Equity Funds |
Financial Highlights – (continued)
| | | | | | | | | | | | | | | | | | | | | | | | | | | | | | | | | | | | | | | | | | | | | | | | | | | | | | | | | | | | |
| | | — Selected Per-Share Data(1) — | | | — Ratios and Supplemental Data — | |
Class | | Net Asset
Value at,
Beginning
of Period | | | Net
Investment
Income
(Loss) | | | Net
Realized
and
Unrealized
Gain (Loss)
on
Investments | | | Total from
Investment
Operations | | | Dividends
from Net
Investment
Income | | | Distributions
from
Realized
Capital
Gains | | | Distributions
Capital | | | Total
Dividends
and
Distributions | | | Net
Asset
Value
End of
Period | | | Total
Return(2) | | | Net
Assets at
End of
Period
(000s) | | | Ratio of
Expenses
to
Average
Net
Assets
Before
Adjust-
ments(3) | | | Ratio of
Expenses
to
Average
Net
Assets
After
Adjust-
ments(3) | | | Ratio of
Net
Investment
Income
(Loss) to
Average
Net Assets | | | Portfolio
Turnover | |
| The Hartford Small/Mid Cap Equity Fund | | | | | | | | | | | | | | | | | | | | | | | | | | | | | | | | | | | | | | | | | |
For the Six-Month Period Ended April 30, 2015 (Unaudited) | | | | | | | | | | | | | | | | | | | | | | | | | | | | | | | | | | | | | | | | | |
A | | $ | 13.89 | | | $ | 0.07 | | | $ | 0.46 | | | $ | 0.53 | | | $ | (0.08 | ) | | $ | (1.29 | ) | | $ | — | | | $ | (1.37 | ) | | $ | 13.05 | | | | 4.44 | %(4) | | $ | 56,716 | | | | 1.36 | %(5) | | | 1.30 | %(5) | | | 1.05 | %(5) | | | 43 | % |
B | | | 13.12 | | | | 0.02 | | | | 0.44 | | | | 0.46 | | | | — | | | | (1.29 | ) | | | — | | | | (1.29 | ) | | | 12.29 | | | | 4.09 | (4) | | | 2,425 | | | | 2.26 | (5) | | | 2.05 | (5) | | | 0.30 | (5) | | | 43 | |
C | | | 12.96 | | | | 0.02 | | | | 0.43 | | | | 0.45 | | | | — | | | | (1.29 | ) | | | — | | | | (1.29 | ) | | | 12.12 | | | | 4.07 | (4) | | | 14,013 | | | | 2.11 | (5) | | | 2.05 | (5) | | | 0.30 | (5) | | | 43 | |
I(8) | | | 13.40 | | | | — | | | | (0.34 | ) | | | (0.34 | ) | | | — | | | | — | | | | — | | | | — | | | | 13.06 | | | | (2.90 | )(4) | | | 97 | | | | 0.93 | (5) | | | 0.93 | (5) | | | (0.02 | )(5) | | | 43 | |
R3 | | | 14.21 | | | | 0.06 | | | | 0.48 | | | | 0.54 | | | | (0.06 | ) | | | (1.29 | ) | | | — | | | | (1.35 | ) | | | 13.40 | | | | 4.39 | (4) | | | 735 | | | | 1.66 | (5) | | | 1.50 | (5) | | | 0.85 | (5) | | | 43 | |
R4 | | | 14.26 | | | | 0.08 | | | | 0.49 | | | | 0.57 | | | | (0.11 | ) | | | (1.29 | ) | | | — | | | | (1.40 | ) | | | 13.43 | | | | 4.55 | (4) | | | 534 | | | | 1.34 | (5) | | | 1.20 | (5) | | | 1.16 | (5) | | | 43 | |
R5 | | | 14.32 | | | | 0.10 | | | | 0.48 | | | | 0.58 | | | | (0.13 | ) | | | (1.29 | ) | | | — | | | | (1.42 | ) | | | 13.48 | | | | 4.68 | (4) | | | 230 | | | | 1.03 | (5) | | | 0.90 | (5) | | | 1.44 | (5) | | | 43 | |
Y | | | 14.31 | | | | 0.10 | | | | 0.49 | | | | 0.59 | | | | (0.14 | ) | | | (1.29 | ) | | | — | | | | (1.43 | ) | | | 13.47 | | | | 4.73 | (4) | | | 1,329 | | | | 0.93 | (5) | | | 0.85 | (5) | | | 1.50 | (5) | | | 43 | |
| | | | | | | | | | | |
For the Year Ended October 31, 2014 | | | | | | | | | | | | | | | | | | | | | | | | | | | | | | | | | | | | | | | | | | | | | |
A | | $ | 14.77 | | | $ | 0.10 | | | $ | 1.11 | | | $ | 1.21 | | | $ | (0.14 | ) | | $ | (1.95 | ) | | $ | — | | | $ | (2.09 | ) | | $ | 13.89 | | | | 9.22 | % | | $ | 54,722 | | | | 1.41 | % | | | 1.30 | % | | | 0.75 | % | | | 116 | % |
B | | | 14.06 | | | | — | | | | 1.05 | | | | 1.05 | | | | (0.04 | ) | | | (1.95 | ) | | | — | | | | (1.99 | ) | | | 13.12 | | | | 8.39 | | | | 3,119 | | | | 2.32 | | | | 2.05 | | | | 0.01 | | | | 116 | |
C | | | 13.94 | | | | — | | | | 1.03 | | | | 1.03 | | | | (0.06 | ) | | | (1.95 | ) | | | — | | | | (2.01 | ) | | | 12.96 | | | | 8.39 | | | | 13,603 | | | | 2.16 | | | | 2.05 | | | | — | | | | 116 | |
I | | | — | | | | — | | | | — | | | | — | | | | — | | | | — | | | | — | | | | — | | | | 13.40 | | | | — | | | | | | | | — | | | | — | | | | — | | | | — | |
R3 | | | 15.10 | | | | 0.07 | | | | 1.14 | | | | 1.21 | | | | (0.15 | ) | | | (1.95 | ) | | | — | | | | (2.10 | ) | | | 14.21 | | | | 8.99 | | | | 587 | | | | 1.70 | | | | 1.50 | | | | 0.53 | | | | 116 | |
R4 | | | 15.10 | | | | 0.11 | | | | 1.14 | | | | 1.25 | | | | (0.14 | ) | | | (1.95 | ) | | | — | | | | (2.09 | ) | | | 14.26 | | | | 9.31 | | | | 516 | | | | 1.37 | | | | 1.20 | | | | 0.81 | | | | 116 | |
R5 | | | 15.16 | | | | 0.16 | | | | 1.14 | | | | 1.30 | | | | (0.19 | ) | | | (1.95 | ) | | | — | | | | (2.14 | ) | | | 14.32 | | | | 9.62 | | | | 204 | | | | 1.05 | | | | 0.90 | | | | 1.14 | | | | 116 | |
Y | | | 15.14 | | | | 0.17 | | | | 1.14 | | | | 1.31 | | | | (0.19 | ) | | | (1.95 | ) | | | — | | | | (2.14 | ) | | | 14.31 | | | | 9.75 | | | | 247 | | | | 0.96 | | | | 0.85 | | | | 1.20 | | | | 116 | |
|
For the Year Ended October 31, 2013 | |
A | | $ | 11.21 | | | $ | 0.19 | | | $ | 3.50 | | | $ | 3.69 | | | $ | (0.13 | ) | | $ | — | | | $ | — | | | $ | (0.13 | ) | | $ | 14.77 | | | | 33.23 | % | | $ | 51,393 | | | | 1.43 | % | | | 1.30 | % | | | 1.48 | % | | | 140 | % |
B | | | 10.68 | | | | 0.09 | | | | 3.34 | | | | 3.43 | | | | (0.05 | ) | | | — | | | | — | | | | (0.05 | ) | | | 14.06 | | | | 32.21 | | | | 4,337 | | | | 2.35 | | | | 2.05 | | | | 0.77 | | | | 140 | |
C | | | 10.60 | | | | 0.09 | | | | 3.30 | | | | 3.39 | | | | (0.05 | ) | | | — | | | | — | | | | (0.05 | ) | | | 13.94 | | | | 32.12 | | | | 12,315 | | | | 2.18 | | | | 2.05 | | | | 0.73 | | | | 140 | |
R3 | | | 11.47 | | | | 0.14 | | | | 3.61 | | | | 3.75 | | | | (0.12 | ) | | | — | | | | — | | | | (0.12 | ) | | | 15.10 | | | | 32.93 | | | | 598 | | | | 1.68 | | | | 1.50 | | | | 1.05 | | | | 140 | |
R4 | | | 11.48 | | | | 0.23 | | | | 3.55 | | | | 3.78 | | | | (0.16 | ) | | | — | | | | — | | | | (0.16 | ) | | | 15.10 | | | | 33.25 | | | | 172 | | | | 1.34 | | | | 1.20 | | | | 1.75 | | | | 140 | |
R5 | | | 11.51 | | | | 0.25 | | | | 3.58 | | | | 3.83 | | | | (0.18 | ) | | | — | | | | — | | | | (0.18 | ) | | | 15.16 | | | | 33.71 | | | | 169 | | | | 1.04 | | | | 0.90 | | | | 1.87 | | | | 140 | |
Y | | | 11.51 | | | | 0.29 | | | | 3.53 | | | | 3.82 | | | | (0.19 | ) | | | — | | | | — | | | | (0.19 | ) | | | 15.14 | | | | 33.59 | | | | 224 | | | | 0.93 | | | | 0.85 | | | | 2.33 | | | | 140 | |
|
For the Year Ended October 31, 2012(7) | |
A | | $ | 10.10 | | | $ | 0.08 | | | $ | 1.03 | | | $ | 1.11 | | | $ | — | | | $ | — | | | $ | — | | | $ | — | | | $ | 11.21 | | | | 10.99 | % | | $ | 41,266 | | | | 1.44 | % | | | 1.30 | % | | | 0.69 | % | | | 121 | % |
B | | | 9.69 | | | | (0.01 | ) | | | 1.00 | | | | 0.99 | | | | — | | | | — | | | | — | | | | — | | | | 10.68 | | | | 10.22 | | | | 4,391 | | | | 2.38 | | | | 2.05 | | | | (0.06 | ) | | | 121 | |
C | | | 9.62 | | | | (0.01 | ) | | | 0.99 | | | | 0.98 | | | | — | | | | — | | | | — | | | | — | | | | 10.60 | | | | 10.19 | | | | 9,624 | | | | 2.21 | | | | 2.05 | | | | (0.06 | ) | | | 121 | |
R3 | | | 10.35 | | | | 0.05 | | | | 1.07 | | | | 1.12 | | | | — | | | | — | | | | — | | | | — | | | | 11.47 | | | | 10.82 | | | | 144 | | | | 1.65 | | | | 1.50 | | | | 0.52 | | | | 121 | |
R4 | | | 10.36 | | | | 0.09 | | | | 1.06 | | | | 1.15 | | | | (0.03 | ) | | | — | | | | — | | | | (0.03 | ) | | | 11.48 | | | | 11.11 | | | | 262 | | | | 1.35 | | | | 1.20 | | | | 0.90 | | | | 121 | |
R5 | | | 10.36 | | | | 0.12 | | | | 1.07 | | | | 1.19 | | | | (0.04 | ) | | | — | | | | — | | | | (0.04 | ) | | | 11.51 | | | | 11.48 | | | | 127 | | | | 1.03 | | | | 0.90 | | | | 1.11 | | | | 121 | |
Y | | | 10.36 | | | | 0.23 | | | | 0.96 | | | | 1.19 | | | | (0.04 | ) | | | — | | | | — | | | | (0.04 | ) | | | 11.51 | | | | 11.49 | | | | 20,243 | | | | 0.90 | | | | 0.85 | | | | 1.01 | | | | 121 | |
|
For the Year Ended October 31, 2011 | |
A | | $ | 9.37 | | | $ | 0.03 | | | $ | 0.73 | | | $ | 0.76 | | | $ | (0.03 | ) | | $ | — | | | $ | — | | | $ | (0.03 | ) | | $ | 10.10 | | | | 8.09 | % | | $ | 44,655 | | | | 1.36 | % | | | 1.30 | % | | | 0.27 | % | | | 202 | % |
B | | | 9.04 | | | | (0.05 | ) | | | 0.70 | | | | 0.65 | | | | — | | | | — | | | | — | | | | — | | | | 9.69 | | | | 7.19 | | | | 4,821 | | | | 2.31 | | | | 2.05 | | | | (0.47 | ) | | | 202 | |
C | | | 8.97 | | | | (0.05 | ) | | | 0.70 | | | | 0.65 | | | | — | | | | — | | | | — | | | | — | | | | 9.62 | | | | 7.25 | | | | 9,702 | | | | 2.13 | | | | 2.05 | | | | (0.48 | ) | | | 202 | |
R3(12) | | | 9.13 | | | | — | | | | 1.22 | | | | 1.22 | | | | — | | | | — | | | | — | | | | — | | | | 10.35 | | | | 13.36 | (4) | | | 113 | | | | 1.61 | (5) | | | 1.50 | (5) | | | (0.40 | )(5) | | | 202 | |
R4(12) | | | 9.13 | | | | — | | | | 1.23 | | | | 1.23 | | | | — | | | | — | | | | — | | | | — | | | | 10.36 | | | | 13.47 | (4) | | | 113 | | | | 1.31 | (5) | | | 1.20 | (5) | | | (0.12 | )(5) | | | 202 | |
R5(12) | | | 9.13 | | | | — | | | | 1.23 | | | | 1.23 | | | | — | | | | — | | | | — | | | | — | | | | 10.36 | | | | 13.47 | (4) | | | 114 | | | | 1.01 | (5) | | | 0.90 | (5) | | | 0.17 | (5) | | | 202 | |
Y | | | 9.60 | | | | 0.07 | | | | 0.76 | | | | 0.83 | | | | (0.07 | ) | | | — | | | | — | | | | (0.07 | ) | | | 10.36 | | | | 8.61 | | | | 88,130 | | | | 0.87 | | | | 0.85 | | | | 0.68 | | | | 202 | |
|
For the Year Ended October 31, 2010 | |
A | | $ | 7.49 | | | $ | 0.02 | | | $ | 1.86 | | | $ | 1.88 | | | $ | — | | | $ | — | | | $ | — | | | $ | — | | | $ | 9.37 | | | | 25.10 | % | | $ | 46,068 | | | | 1.45 | % | | | 1.31 | % | | | 0.19 | % | | | 399 | %(13) |
B | | | 7.27 | | | | (0.05 | ) | | | 1.82 | | | | 1.77 | | | | — | | | | — | | | | — | | | | — | | | | 9.04 | | | | 24.35 | | | | 5,420 | | | | 2.39 | | | | 2.06 | | | | (0.55 | ) | | | 399 | (13) |
C | | | 7.21 | | | | (0.04 | ) | | | 1.80 | | | | 1.76 | | | | — | | | | — | | | | — | | | | — | | | | 8.97 | | | | 24.41 | | | | 10,025 | | | | 2.22 | | | | 2.06 | | | | (0.56 | ) | | | 399 | (13) |
Y | | | 7.64 | | | | 0.05 | | | | 1.91 | | | | 1.96 | | | | — | | | | — | | | | — | | | | — | | | | 9.60 | | | | 25.65 | | | | 42,540 | | | | 0.89 | | | | 0.87 | | | | 0.65 | | | | 399 | (13) |
The accompanying notes are an integral part of these financial statements.
|
| Hartford Funds – Domestic Equity Funds |
Financial Highlights – (continued)
| | | | | | | | | | | | | | | | | | | | | | | | | | | | | | | | | | | | | | | | | | | | | | | | | | | | | | | | | | | | |
| | | — Selected Per-Share Data(1) — | | | — Ratios and Supplemental Data — | |
Class | | Net Asset
Value at,
Beginning
of Period | | | Net
Investment
Income
(Loss) | | | Net
Realized
and
Unrealized
Gain (Loss)
on
Investments | | | Total from
Investment
Operations | | | Dividends
from Net
Investment
Income | | | Distributions
from
Realized
Capital
Gains | | | Distributions
Capital | | | Total
Dividends
and
Distributions | | | Net
Asset
Value
End of
Period | | | Total
Return(2) | | | Net
Assets at
End of
Period
(000s) | | | Ratio of
Expenses
to
Average
Net
Assets
Before
Adjust-
ments(3) | | | Ratio of
Expenses
to
Average
Net
Assets
After
Adjust-
ments(3) | | | Ratio of
Net
Investment
Income
(Loss) to
Average
Net Assets | | | Portfolio
Turnover | |
| The Hartford SmallCap Growth Fund | | | | | | | | | | | | | | | | | | | | | | | | | | | | | | | | | | | | | | | | | |
For the Six-Month Period Ended April 30, 2015 (Unaudited) | | | | | | | | | | | | | | | | | | | | | | | | | | | | | | | | | | | | | | | | | |
A | | $ | 48.63 | | | $ | (0.03 | ) | | $ | 3.89 | | | $ | 3.86 | | | $ | — | | | $ | (2.12 | ) | | $ | — | | | $ | (2.12 | ) | | $ | 50.37 | | | | 8.26 | %(4) | | $ | 264,166 | | | | 1.20 | %(5) | | | 1.20 | %(5) | | | (0.14 | )%(5) | | | 42 | % |
B | | | 40.12 | | | | (0.20 | ) | | | 3.17 | | | | 2.97 | | | | — | | | | (2.12 | ) | | | — | | | | (2.12 | ) | | | 40.97 | | | | 7.77 | (4) | | | 2,160 | | | | 2.20 | (5) | | | 2.06 | (5) | | | (0.99 | )(5) | | | 42 | |
C | | | 39.77 | | | | (0.17 | ) | | | 3.15 | | | | 2.98 | | | | — | | | | (2.12 | ) | | | — | | | | (2.12 | ) | | | 40.63 | | | | 7.87 | (4) | | | 52,577 | | | | 1.90 | (5) | | | 1.90 | (5) | | | (0.84 | )(5) | | | 42 | |
I | | | 49.55 | | | | 0.05 | | | | 3.97 | | | | 4.02 | | | | — | | | | (2.12 | ) | | | — | | | | (2.12 | ) | | | 51.45 | | | | 8.43 | (4) | | | 193,716 | | | | 0.90 | (5) | | | 0.90 | (5) | | | 0.18 | (5) | | | 42 | |
R3 | | | 48.74 | | | | (0.10 | ) | | | 3.90 | | | | 3.80 | | | | — | | | | (2.12 | ) | | | — | | | | (2.12 | ) | | | 50.42 | | | | 8.09 | (4) | | | 15,761 | | | | 1.48 | (5) | | | 1.48 | (5) | | | (0.42 | )(5) | | | 42 | |
R4 | | | 49.86 | | | | (0.03 | ) | | | 4.01 | | | | 3.98 | | | | — | | | | (2.12 | ) | | | — | | | | (2.12 | ) | | | 51.72 | | | | 8.28 | (4) | | | 72,110 | | | | 1.16 | (5) | | | 1.16 | (5) | | | (0.11 | )(5) | | | 42 | |
R5 | | | 51.13 | | | | 0.06 | | | | 4.10 | | | | 4.16 | | | | — | | | | (2.12 | ) | | | — | | | | (2.12 | ) | | | 53.17 | | | | 8.43 | (4) | | | 103,046 | | | | 0.86 | (5) | | | 0.86 | (5) | | | 0.21 | (5) | | | 42 | |
R6(6) | | | 51.80 | | | | 0.08 | | | | 3.83 | | | | 3.91 | | | | — | | | | (2.12 | ) | | | — | | | | (2.12 | ) | | | 53.59 | | | | 7.86 | (4) | | | 11 | | | | 0.76 | (5) | | | 0.76 | (5) | | | 0.33 | (5) | | | 42 | |
Y | | | 51.49 | | | | 0.08 | | | | 4.14 | | | | 4.22 | | | | — | | | | (2.12 | ) | | | — | | | | (2.12 | ) | | | 53.59 | | | | 8.49 | (4) | | | 310,342 | | | | 0.76 | (5) | | | 0.76 | (5) | | | 0.29 | (5) | | | 42 | |
| | | | | | | | | | | |
For the Year Ended October 31, 2014 | | | | | | | | | | | | | | | | | | | | | | | | | | | | | | | | | | | | | | | | | | | | | |
A | | $ | 47.96 | | | $ | (0.26 | ) | | $ | 4.36 | | | $ | 4.10 | | | $ | — | | | $ | (3.43 | ) | | $ | — | | | $ | (3.43 | ) | | $ | 48.63 | | | | 9.02 | % | | $ | 239,697 | | | | 1.28 | % | | | 1.28 | % | | | (0.55 | )% | | | 61 | % |
B | | | 40.45 | | | | (0.54 | ) | | | 3.64 | | | | 3.10 | | | | — | | | | (3.43 | ) | | | — | | | | (3.43 | ) | | | 40.12 | | | | 8.16 | | | | 2,695 | | | | 2.26 | | | | 2.11 | | | | (1.36 | ) | | | 61 | |
C | | | 40.08 | | | | (0.49 | ) | | | 3.61 | | | | 3.12 | | | | — | | | | (3.43 | ) | | | — | | | | (3.43 | ) | | | 39.77 | | | | 8.30 | | | | 44,184 | | | | 1.97 | | | | 1.97 | | | | (1.24 | ) | | | 61 | |
I | | | 48.67 | | | | (0.12 | ) | | | 4.43 | | | | 4.31 | | | | — | | | | (3.43 | ) | | | — | | | | (3.43 | ) | | | 49.55 | | | | 9.34 | | | | 114,450 | | | | 0.97 | | | | 0.97 | | | | (0.25 | ) | | | 61 | |
R3 | | | 48.17 | | | | (0.38 | ) | | | 4.38 | | | | 4.00 | | | | — | | | | (3.43 | ) | | | — | | | | (3.43 | ) | | | 48.74 | | | | 8.76 | | | | 8,744 | | | | 1.53 | | | | 1.53 | | | | (0.81 | ) | | | 61 | |
R4 | | | 49.06 | | | | (0.25 | ) | | | 4.48 | | | | 4.23 | | | | — | | | | (3.43 | ) | | | — | | | | (3.43 | ) | | | 49.86 | | | | 9.09 | | | | 47,028 | | | | 1.22 | | | | 1.22 | | | | (0.52 | ) | | | 61 | |
R5 | | | 50.07 | | | | (0.11 | ) | | | 4.60 | | | | 4.49 | | | | — | | | | (3.43 | ) | | | — | | | | (3.43 | ) | | | 51.13 | | | | 9.45 | | | | 39,856 | | | | 0.91 | | | | 0.91 | | | | (0.22 | ) | | | 61 | |
Y | | | 50.36 | | | | (0.05 | ) | | | 4.61 | | | | 4.56 | | | | — | | | | (3.43 | ) | | | — | | | | (3.43 | ) | | | 51.49 | | | | 9.54 | | | | 213,384 | | | | 0.81 | | | | 0.81 | | | | (0.10 | ) | | | 61 | |
| | | | | | | | | | | |
For the Year Ended October 31, 2013 | | | | | | | | | | | | | | | | | | | | | | | | | | | | | | | | | | | | | | | | | | | | | |
A | | $ | 34.72 | | | $ | (0.15 | ) | | $ | 13.39 | | | $ | 13.24 | | | $ | — | | | $ | — | | | $ | — | | | $ | — | | | $ | 47.96 | | | | 38.13 | % | | $ | 226,795 | | | | 1.40 | % | | | 1.40 | % | | | (0.37 | )% | | | 90 | % |
B | | | 29.50 | | | | (0.36 | ) | | | 11.31 | | | | 10.95 | | | | — | | | | — | | | | — | | | | — | | | | 40.45 | | | | 37.12 | | | | 4,552 | | | | 2.40 | | | | 2.15 | | | | (1.05 | ) | | | 90 | |
C | | | 29.21 | | | | (0.40 | ) | | | 11.27 | | | | 10.87 | | | | — | | | | — | | | | — | | | | — | | | | 40.08 | | | | 37.21 | | | | 33,255 | | | | 2.08 | | | | 2.08 | | | | (1.13 | ) | | | 90 | |
I | | | 35.10 | | | | (0.05 | ) | | | 13.62 | | | | 13.57 | | | | — | | | | — | | | | — | | | | — | | | | 48.67 | | | | 38.66 | | | | 71,601 | | | | 1.04 | | | | 1.04 | | | | (0.13 | ) | | | 90 | |
R3 | | | 34.93 | | | | (0.26 | ) | | | 13.50 | | | | 13.24 | | | | — | | | | — | | | | — | | | | — | | | | 48.17 | | | | 37.90 | | | | 8,280 | | | | 1.59 | | | | 1.59 | | | | (0.62 | ) | | | 90 | |
R4 | | | 35.47 | | | | (0.19 | ) | | | 13.78 | | | | 13.59 | | | | — | | | | — | | | | — | | | | — | | | | 49.06 | | | | 38.31 | | | | 17,412 | | | | 1.27 | | | | 1.27 | | | | (0.44 | ) | | | 90 | |
R5 | | | 36.10 | | | | (0.10 | ) | | | 14.07 | | | | 13.97 | | | | — | | | | — | | | | — | | | | — | | | | 50.07 | | | | 38.70 | | | | 3,579 | | | | 0.97 | | | | 0.97 | | | | (0.22 | ) | | | 90 | |
Y | | | 36.27 | | | | 0.03 | | | | 14.06 | | | | 14.09 | | | | — | | | | — | | | | — | | | | — | | | | 50.36 | | | | 38.85 | | | | 121,003 | | | | 0.87 | | | | 0.87 | | | | 0.07 | | | | 90 | |
| | | | | | | | | | | |
For the Year Ended October 31, 2012 | | | | | | | | | | | | | | | | | | | | | | | | | | | | | | | | | | | | | | | | | | | | | |
A | | $ | 31.27 | | | $ | (0.22 | ) | | $ | 3.67 | | | $ | 3.45 | | | $ | — | | | $ | — | | | $ | — | | | $ | — | | | $ | 34.72 | | | | 11.03 | % | | $ | 154,415 | | | | 1.48 | % | | | 1.40 | % | | | (0.65 | )% | | | 73 | % |
B | | | 26.77 | | | | (0.40 | ) | | | 3.13 | | | | 2.73 | | | | — | | | | — | | | | — | | | | — | | | | 29.50 | | | | 10.20 | | | | 4,747 | | | | 2.44 | | | | 2.15 | | | | (1.41 | ) | | | 73 | |
C | | | 26.51 | | | | (0.40 | ) | | | 3.10 | | | | 2.70 | | | | — | | | | — | | | | — | | | | — | | | | 29.21 | | | | 10.18 | | | | 13,343 | | | | 2.17 | | | | 2.15 | | | | (1.40 | ) | | | 73 | |
I | | | 31.52 | | | | (0.11 | ) | | | 3.69 | | | | 3.58 | | | | — | | | | — | | | | — | | | | — | | | | 35.10 | | | | 11.36 | | | | 20,730 | | | | 1.11 | | | | 1.11 | | | | (0.33 | ) | | | 73 | |
R3 | | | 31.53 | | | | (0.27 | ) | | | 3.67 | | | | 3.40 | | | | — | | | | — | | | | — | | | | — | | | | 34.93 | | | | 11.78 | | | | 3,672 | | | | 1.67 | | | | 1.60 | | | | (0.80 | ) | | | 73 | |
R4 | | | 31.91 | | | | (0.19 | ) | | | 3.75 | | | | 3.56 | | | | — | | | | — | | | | — | | | | — | | | | 35.47 | | | | 11.16 | | | | 4,053 | | | | 1.32 | | | | 1.30 | | | | (0.54 | ) | | | 73 | |
R5 | | | 32.38 | | | | (0.08 | ) | | | 3.80 | | | | 3.72 | | | | — | | | | — | | | | — | | | | — | | | | 36.10 | | | | 11.49 | | | | 345 | | | | 1.05 | | | | 1.00 | | | | (0.24 | ) | | | 73 | |
Y | | | 32.51 | | | | (0.06 | ) | | | 3.82 | | | | 3.76 | | | | — | | | | — | | | | — | | | | — | | | | 36.27 | | | | 11.57 | | | | 41,745 | | | | 0.89 | | | | 0.89 | | | | (0.18 | ) | | | 73 | |
| | | | | | | | | | | |
For the Year Ended October 31, 2011 | | | | | | | | | | | | | | | | | | | | | | | | | | | | | | | | | | | | | | | | | | | | | |
A(11) | | $ | 27.59 | | | $ | (0.29 | ) | | $ | 3.97 | | | $ | 3.68 | | | $ | — | | | $ | — | | | $ | — | | | $ | — | | | $ | 31.27 | | | | 13.34 | % | | $ | 154,303 | | | | 1.48 | % | | | 1.40 | % | | | (0.93 | )% | | | 70 | % |
B | | | 23.80 | | | | (0.40 | ) | | | 3.37 | | | | 2.97 | | | | — | | | | — | | | | — | | | | — | | | | 26.77 | | | | 12.48 | | | | 7,018 | | | | 2.39 | | | | 2.15 | | | | (1.46 | ) | | | 70 | |
C | | | 23.57 | | | | (0.40 | ) | | | 3.34 | | | | 2.94 | | | | — | | | | — | | | | — | | | | — | | | | 26.51 | | | | 12.47 | | | | 12,285 | | | | 2.18 | | | | 2.15 | | | | (1.47 | ) | | | 70 | |
I | | | 27.73 | | | | (0.14 | ) | | | 3.93 | | | | 3.79 | | | | — | | | | — | | | | — | | | | — | | | | 31.52 | | | | 13.67 | | | | 9,312 | | | | 1.10 | | | | 1.10 | | | | (0.43 | ) | | | 70 | |
R3 | | | 27.87 | | | | (0.30 | ) | | | 3.96 | | | | 3.66 | | | | — | | | | — | | | | — | | | | — | | | | 31.53 | | | | 13.13 | | | | 763 | | | | 1.69 | | | | 1.60 | | | | (0.93 | ) | | | 70 | |
R4 | | | 28.13 | | | | (0.20 | ) | | | 3.98 | | | | 3.78 | | | | — | | | | — | | | | — | | | | — | | | | 31.91 | | | | 13.44 | | | | 3,059 | | | | 1.30 | | | | 1.30 | | | | (0.62 | ) | | | 70 | |
R5 | | | 28.46 | | | | (0.11 | ) | | | 4.03 | | | | 3.92 | | | | — | | | | — | | | | — | | | | — | | | | 32.38 | | | | 13.77 | | | | 227 | | | | 1.03 | | | | 1.00 | | | | (0.33 | ) | | | 70 | |
Y | | | 28.54 | | | | (0.07 | ) | | | 4.04 | | | | 3.97 | | | | — | | | | — | | | | — | | | | — | | | | 32.51 | | | | 13.91 | | | | 134,508 | | | | 0.89 | | | | 0.89 | | | | (0.22 | ) | | | 70 | |
| | | | | | | | | | | |
For the Year Ended October 31, 2010 | | | | | | | | | | | | | | | | | | | | | | | | | | | | | | | | | | | | | | | | | | | | | |
A | | $ | 20.45 | | | $ | (0.15 | )(14) | | $ | 7.27 | | | $ | 7.14 | | | $ | — | | | $ | — | | | $ | — | | | $ | — | | | $ | 27.59 | | | | 34.91 | %(15) | | $ | 53,548 | | | | 1.62 | % | | | 1.40 | % | | | (0.64 | )% | | | 137 | % |
B | | | 17.78 | | | | (0.29 | )(14) | | | 6.29 | | | | 6.02 | | | | — | | | | — | | | | — | | | | — | | | | 23.80 | | | | 33.86 | (15) | | | 8,398 | | | | 2.59 | | | | 2.15 | | | | (1.39 | ) | | | 137 | |
C | | | 17.60 | | | | (0.29 | )(14) | | | 6.24 | | | | 5.97 | | | | — | | | | — | | | | — | | | | — | | | | 23.57 | | | | 33.92 | (15) | | | 11,084 | | | | 2.34 | | | | 2.15 | | | | (1.39 | ) | | | 137 | |
I | | | 20.50 | | | | (0.09 | )(14) | | | 7.30 | | | | 7.23 | | | | — | | | | — | | | | — | | | | — | | | | 27.73 | | | | 35.27 | (15) | | | 5,384 | | | | 1.23 | | | | 1.15 | | | | (0.39 | ) | | | 137 | |
R3 | | | 20.71 | | | | (0.22 | )(14) | | | 7.35 | | | | 7.16 | | | | — | | | | — | | | | — | | | | — | | | | 27.87 | | | | 34.57 | (15) | | | 367 | | | | 1.77 | | | | 1.63 | | | | (0.90 | ) | | | 137 | |
R4 | | | 20.84 | | | | (0.14 | )(14) | | | 7.40 | | | | 7.29 | | | | — | | | | — | | | | — | | | | — | | | | 28.13 | | | | 34.98 | (15) | | | 2,831 | | | | 1.38 | | | | 1.33 | | | | (0.58 | ) | | | 137 | |
R5 | | | 21.02 | | | | (0.06 | )(14) | | | 7.47 | | | | 7.44 | | | | — | | | | — | | | | — | | | | — | | | | 28.46 | | | | 35.39 | (15) | | | 132 | | | | 1.09 | | | | 1.05 | | | | (0.26 | ) | | | 137 | |
Y | | | 21.06 | | | | (0.04 | )(14) | | | 7.49 | | | | 7.48 | | | | — | | | | — | | | | — | | | | — | | | | 28.54 | | | | 35.52 | (15) | | | 93,908 | | | | 0.95 | | | | 0.95 | | | | (0.18 | ) | | | 137 | |
The accompanying notes are an integral part of these financial statements.
|
| Hartford Funds – Domestic Equity Funds |
Financial Highlights – (continued)
| | | | | | | | | | | | | | | | | | | | | | | | | | | | | | | | | | | | | | | | | | | | | | | | | | | | | | | | | | | | |
| | | — Selected Per-Share Data(1) — | | | — Ratios and Supplemental Data — | |
Class | | Net Asset
Value at,
Beginning
of Period | | | Net
Investment
Income
(Loss) | | | Net
Realized
and
Unrealized
Gain (Loss)
on
Investments | | | Total from
Investment
Operations | | | Dividends
from Net
Investment
Income | | | Distributions
from
Realized
Capital
Gains | | | Distributions
Capital | | | Total
Dividends
and
Distributions | | | Net
Asset
Value
End of
Period | | | Total
Return(2) | | | Net
Assets at
End of
Period
(000s) | | | Ratio of
Expenses
to
Average
Net
Assets
Before
Adjust-
ments(3) | | | Ratio of
Expenses
to
Average
Net
Assets
After
Adjust-
ments(3) | | | Ratio of
Net
Investment
Income
(Loss) to
Average
Net Assets | | | Portfolio
Turnover | |
| The Hartford Value Opportunities Fund | | | | | | | | | | | | | | | | | | | | | | | | | | | | | | | | | | | | | | | | | |
For the Six-Month Period Ended April 30, 2015 (Unaudited) | | | | | | | | | | | | | | | | | | | | | | | | | | | | | | | | | | | | | | | | | |
A | | $ | 20.45 | | | $ | 0.11 | | | $ | 0.84 | | | $ | 0.95 | | | $ | (0.13 | ) | | $ | (1.40 | ) | | $ | — | | | $ | (1.53 | ) | | $ | 19.87 | | | | 5.26 | %(4) | | $ | 229,000 | | | | 1.21 | %(5) | | | 1.21 | %(5) | | | 1.11 | %(5) | | | 29 | % |
B | | | 18.22 | | | | 0.01 | | | | 0.76 | | | | 0.77 | | | | — | | | | (1.40 | ) | | | — | | | | (1.40 | ) | | | 17.59 | | | | 4.86 | (4) | | | 2,867 | | | | 2.27 | (5) | | | 1.98 | (5) | | | 0.08 | (5) | | | 29 | |
C | | | 18.14 | | | | 0.03 | | | | 0.74 | | | | 0.77 | | | | (0.04 | ) | | | (1.40 | ) | | | — | | | | (1.44 | ) | | | 17.47 | | | | 4.88 | (4) | | | 29,890 | | | | 1.93 | (5) | | | 1.92 | (5) | | | 0.36 | (5) | | | 29 | |
I | | | 20.25 | | | | 0.13 | | | | 0.85 | | | | 0.98 | | | | (0.20 | ) | | | (1.40 | ) | | | — | | | | (1.60 | ) | | | 19.63 | | | | 5.45 | (4) | | | 34,076 | | | | 0.92 | (5) | | | 0.92 | (5) | | | 1.36 | (5) | | | 29 | |
R3 | | | 20.62 | | | | 0.08 | | | | 0.86 | | | | 0.94 | | | | (0.08 | ) | | | (1.40 | ) | | | — | | | | (1.48 | ) | | | 20.08 | | | | 5.14 | (4) | | | 4,015 | | | | 1.52 | (5) | | | 1.47 | (5) | | | 0.77 | (5) | | | 29 | |
R4 | | | 20.82 | | | | 0.11 | | | | 0.88 | | | | 0.99 | | | | (0.14 | ) | | | (1.40 | ) | | | — | | | | (1.54 | ) | | | 20.27 | | | | 5.33 | (4) | | | 13,366 | | | | 1.19 | (5) | | | 1.17 | (5) | | | 1.10 | (5) | | | 29 | |
R5 | | | 20.95 | | | | 0.14 | | | | 0.87 | | | | 1.01 | | | | (0.16 | ) | | | (1.40 | ) | | | — | | | | (1.56 | ) | | | 20.40 | | | | 5.44 | (4) | | | 2,720 | | | | 0.90 | (5) | | | 0.87 | (5) | | | 1.40 | (5) | | | 29 | |
Y | | | 21.03 | | | | 0.15 | | | | 0.87 | | | | 1.02 | | | | (0.20 | ) | | | (1.40 | ) | | | — | | | | (1.60 | ) | | | 20.45 | | | | 5.48 | (4) | | | 1,875 | | | | 0.79 | (5) | | | 0.79 | (5) | | | 1.49 | (5) | | | 29 | |
| | | | | | | | | | | |
For the Year Ended October 31, 2014 | | | | | | | | | | | | | | | | | | | | | | | | | | | | | | | | | | | | | | | | | | | | | |
A | | $ | 18.31 | | | $ | 0.17 | | | $ | 2.05 | | | $ | 2.22 | | | $ | (0.08 | ) | | $ | — | | | $ | — | | | $ | (0.08 | ) | | $ | 20.45 | | | | 12.18 | % | | $ | 237,539 | | | | 1.25 | % | | | 1.25 | % | | | 0.87 | % | | | 74 | %(16) |
B | | | 16.36 | | | | 0.03 | | | | 1.83 | | | | 1.86 | | | | — | | | | — | | | | — | | | | — | | | | 18.22 | | | | 11.37 | | | | 3,928 | | | | 2.27 | | | | 1.97 | | | | 0.19 | | | | 74 | (16) |
C | | | 16.29 | | | | 0.02 | | | | 1.83 | | | | 1.85 | | | | — | | | | — | | | | — | | | | — | | | | 18.14 | | | | 11.36 | | | | 31,729 | | | | 1.95 | | | | 1.95 | | | | 0.12 | | | | 74 | (16) |
I | | | 18.12 | | | | 0.23 | | | | 2.03 | | | | 2.26 | | | | (0.13 | ) | | | — | | | | — | | | | (0.13 | ) | | | 20.25 | | | | 12.56 | | | | 44,306 | | | | 0.87 | | | | 0.87 | | | | 1.17 | | | | 74 | (16) |
R3 | | | 18.50 | | | | 0.13 | | | | 2.05 | | | | 2.18 | | | | (0.06 | ) | | | — | | | | — | | | | (0.06 | ) | | | 20.62 | | | | 11.84 | | | | 4,528 | | | | 1.53 | | | | 1.47 | | | | 0.63 | | | | 74 | (16) |
R4 | | | 18.64 | | | | 0.18 | | | | 2.09 | | | | 2.27 | | | | (0.09 | ) | | | — | | | | — | | | | (0.09 | ) | | | 20.82 | | | | 12.24 | | | | 13,626 | | | | 1.21 | | | | 1.17 | | | | 0.91 | | | | 74 | (16) |
R5 | | | 18.76 | | | | 0.24 | | | | 2.10 | | | | 2.34 | | | | (0.15 | ) | | | — | | | | — | | | | (0.15 | ) | | | 20.95 | | | | 12.52 | | | | 2,735 | | | | 0.88 | | | | 0.85 | | | | 1.15 | | | | 74 | (16) |
Y | | | 18.82 | | | | 0.21 | | | | 2.16 | | | | 2.37 | | | | (0.16 | ) | | | — | | | | — | | | | (0.16 | ) | | | 21.03 | | | | 12.64 | | | | 1,841 | | | | 0.83 | | | | 0.83 | | | | 1.07 | | | | 74 | (16) |
| | | | | | | | | | | |
For the Year Ended October 31, 2013 | | | | | | | | | | | | | | | | | | | | | | | | | | | | | | | | | | | | | | | | | | | | | |
A | | $ | 14.02 | | | $ | 0.11 | | | $ | 4.40 | | | $ | 4.51 | | | $ | (0.22 | ) | | $ | — | | | $ | — | | | $ | (0.22 | ) | | $ | 18.31 | | | | 32.53 | % | | $ | 118,203 | | | | 1.44 | % | | | 1.35 | % | | | 0.67 | % | | | 81 | % |
B | | | 12.54 | | | | — | | | | 3.93 | | | | 3.93 | | | | (0.11 | ) | | | — | | | | — | | | | (0.11 | ) | | | 16.36 | | | | 31.50 | | | | 3,825 | | | | 2.39 | | | | 2.10 | | | | (0.03 | ) | | | 81 | |
C | | | 12.49 | | | | (0.01 | ) | | | 3.93 | | | | 3.92 | | | | (0.12 | ) | | | — | | | | — | | | | (0.12 | ) | | | 16.29 | | | | 31.59 | | | | 11,059 | | | | 2.13 | | | | 2.10 | | | | (0.07 | ) | | | 81 | |
I | | | 13.87 | | | | 0.16 | | | | 4.34 | | | | 4.50 | | | | (0.25 | ) | | | — | | | | — | | | | (0.25 | ) | | | 18.12 | | | | 32.93 | | | | 7,908 | | | | 1.07 | | | | 1.06 | | | | 0.95 | | | | 81 | |
R3 | | | 14.16 | | | | 0.08 | | | | 4.45 | | | | 4.53 | | | | (0.19 | ) | | | — | | | | — | | | | (0.19 | ) | | | 18.50 | | | | 32.31 | | | | 1,480 | | | | 1.68 | | | | 1.55 | | | | 0.49 | | | | 81 | |
R4 | | | 14.27 | | | | 0.13 | | | | 4.47 | | | | 4.60 | | | | (0.23 | ) | | | — | | | | — | | | | (0.23 | ) | | | 18.64 | | | | 32.62 | | | | 7,271 | | | | 1.32 | | | | 1.25 | | | | 0.78 | | | | 81 | |
R5 | | | 14.36 | | | | 0.18 | | | | 4.50 | | | | 4.68 | | | | (0.28 | ) | | | — | | | | — | | | | (0.28 | ) | | | 18.76 | | | | 33.06 | | | | 1,909 | | | | 1.02 | | | | 0.95 | | | | 1.08 | | | | 81 | |
Y | | | 14.41 | | | | 0.19 | | | | 4.50 | | | | 4.69 | | | | (0.28 | ) | | | — | | | | — | | | | (0.28 | ) | | | 18.82 | | | | 33.06 | | | | 1,149 | | | | 0.91 | | | | 0.90 | | | | 1.17 | | | | 81 | |
| | | | | | | | | | | |
For the Year Ended October 31, 2012 | | | | | | | | | | | | | | | | | | | | | | | | | | | | | | | | | | | | | | | | | | | | | |
A | | $ | 12.68 | | | $ | 0.19 | | | $ | 1.27 | | | $ | 1.46 | | | $ | (0.12 | ) | | $ | — | | | $ | — | | | $ | (0.12 | ) | | $ | 14.02 | | | | 11.60 | % | | $ | 86,261 | | | | 1.50 | % | | | 1.35 | % | | | 1.44 | % | | | 56 | % |
B | | | 11.33 | | | | 0.08 | | | | 1.15 | | | | 1.23 | | | | (0.02 | ) | | | — | | | | — | | | | (0.02 | ) | | | 12.54 | | | | 10.85 | | | | 4,388 | | | | 2.44 | | | | 2.10 | | | | 0.65 | | | | 56 | |
C | | | 11.31 | | | | 0.08 | | | | 1.13 | | | | 1.21 | | | | (0.03 | ) | | | — | | | | — | | | | (0.03 | ) | | | 12.49 | | | | 10.74 | | | | 8,880 | | | | 2.17 | | | | 2.10 | | | | 0.67 | | | | 56 | |
I | | | 12.57 | | | | 0.22 | | | | 1.25 | | | | 1.47 | | | | (0.17 | ) | | | — | | | | — | | | | (0.17 | ) | | | 13.87 | | | | 11.87 | | | | 3,995 | | | | 1.11 | | | | 1.09 | | | | 1.70 | | | | 56 | |
R3 | | | 12.81 | | | | 0.18 | | | | 1.27 | | | | 1.45 | | | | (0.10 | ) | | | — | | | | — | | | | (0.10 | ) | | | 14.16 | | | | 11.38 | | | | 1,443 | | | | 1.70 | | | | 1.55 | | | | 1.31 | | | | 56 | |
R4 | | | 12.90 | | | | 0.21 | | | | 1.30 | | | | 1.51 | | | | (0.14 | ) | | | — | | | | — | | | | (0.14 | ) | | | 14.27 | | | | 11.81 | | | | 6,015 | | | | 1.33 | | | | 1.25 | | | | 1.55 | | | | 56 | |
R5 | | | 12.99 | | | | 0.31 | | | | 1.24 | | | | 1.55 | | | | (0.18 | ) | | | — | | | | — | | | | (0.18 | ) | | | 14.36 | | | | 12.08 | | | | 1,296 | | | | 1.05 | | | | 0.95 | | | | 2.25 | | | | 56 | |
Y | | | 13.05 | | | | 0.24 | | | | 1.30 | | | | 1.54 | | | | (0.18 | ) | | | — | | | | — | | | | (0.18 | ) | | | 14.41 | | | | 12.00 | | | | 1,076 | | | | 0.92 | | | | 0.90 | | | | 1.77 | | | | 56 | |
| | | | | | | | | | | |
For the Year Ended October 31, 2011(7) | | | | | | | | | | | | | | | | | | | | | | | | | | | | | | | | | | | | | | | | | | | | | |
A(11) | | $ | 12.15 | | | $ | 0.09 | | | $ | 0.45 | | | $ | 0.54 | | | $ | (0.01 | ) | | $ | — | | | $ | — | | | $ | (0.01 | ) | | $ | 12.68 | | | | 4.41 | % | | $ | 86,456 | | | | 1.46 | % | | | 1.35 | % | | | 0.81 | % | | | 70 | % |
B | | | 10.94 | | | | (0.02 | ) | | | 0.41 | | | | 0.39 | | | | — | | | | — | | | | — | | | | — | | | | 11.33 | | | | 3.56 | | | | 5,838 | | | | 2.39 | | | | 2.10 | | | | (0.10 | ) | | | 70 | |
C | | | 10.91 | | | | (0.01 | ) | | | 0.41 | | | | 0.40 | | | | — | | | | — | | | | — | | | | — | | | | 11.31 | | | | 3.67 | | | | 10,227 | | | | 2.15 | | | | 2.10 | | | | (0.09 | ) | | | 70 | |
I | | | 12.04 | | | | 0.14 | | | | 0.44 | | | | 0.58 | | | | (0.05 | ) | | | — | | | | — | | | | (0.05 | ) | | | 12.57 | | | | 4.80 | | | | 2,535 | | | | 1.03 | | | | 1.01 | | | | 1.06 | | | | 70 | |
R3 | | | 12.30 | | | | 0.07 | | | | 0.44 | | | | 0.51 | | | | — | | | | — | | | | — | | | | — | | | | 12.81 | | | | 4.15 | | | | 934 | | | | 1.68 | | | | 1.55 | | | | 0.45 | | | | 70 | |
R4 | | | 12.37 | | | | 0.10 | | | | 0.45 | | | | 0.55 | | | | (0.02 | ) | | | — | | | | — | | | | (0.02 | ) | | | 12.90 | | | | 4.47 | | | | 5,865 | | | | 1.31 | | | | 1.25 | | | | 0.75 | | | | 70 | |
R5 | | | 12.45 | | | | 0.13 | | | | 0.47 | | | | 0.60 | | | | (0.06 | ) | | | — | | | | — | | | | (0.06 | ) | | | 12.99 | | | | 4.81 | | | | 221 | | | | 1.05 | | | | 0.95 | | | | 1.04 | | | | 70 | |
Y | | | 12.51 | | | | 0.14 | | | | 0.47 | | | | 0.61 | | | | (0.07 | ) | | | — | | | | — | | | | (0.07 | ) | | | 13.05 | | | | 4.82 | | | | 34,210 | | | | 0.91 | | | | 0.90 | | | | 1.08 | | | | 70 | |
| | | | | | | | | | | |
For the Year Ended October 31, 2010 | | | | | | | | | | | | | | | | | | | | | | | | | | | | | | | | | | | | | | | | | | | | | |
A | | $ | 10.19 | | | $ | 0.04 | | | $ | 1.97 | | | $ | 2.01 | | | $ | (0.05 | ) | | $ | — | | | $ | — | | | $ | (0.05 | ) | | $ | 12.15 | | | | 19.78 | % | | $ | 69,397 | | | | 1.46 | % | | | 1.35 | % | | | 0.34 | % | | | 87 | % |
B | | | 9.21 | | | | (0.04 | ) | | | 1.78 | | | | 1.74 | | | | (0.01 | ) | | | — | | | | — | | | | (0.01 | ) | | | 10.94 | | | | 18.89 | | | | 7,069 | | | | 2.42 | | | | 2.10 | | | | (0.40 | ) | | | 87 | |
C | | | 9.18 | | | | (0.04 | ) | | | 1.77 | | | | 1.73 | | | | — | | | | — | | | | — | | | | — | | | | 10.91 | | | | 18.85 | | | | 10,954 | | | | 2.18 | | | | 2.10 | | | | (0.41 | ) | | | 87 | |
I | | | 10.09 | | | | 0.07 | | | | 1.94 | | | | 2.01 | | | | (0.06 | ) | | | — | | | | — | | | | (0.06 | ) | | | 12.04 | | | | 20.00 | | | | 1,494 | | | | 1.05 | | | | 1.05 | | | | 0.64 | | | | 87 | |
R3 | | | 10.30 | | | | 0.01 | | | | 2.00 | | | | 2.01 | | | | (0.01 | ) | | | — | | | | — | | | | (0.01 | ) | | | 12.30 | | | | 19.56 | | | | 1,021 | | | | 1.67 | | | | 1.58 | | | | 0.10 | | | | 87 | |
R4 | | | 10.37 | | | | 0.05 | | | | 2.00 | | | | 2.05 | | | | (0.05 | ) | | | — | | | | — | | | | (0.05 | ) | | | 12.37 | | | | 19.79 | | | | 5,147 | | | | 1.31 | | | | 1.28 | | | | 0.39 | | | | 87 | |
R5 | | | 10.43 | | | | 0.07 | | | | 2.03 | | | | 2.10 | | | | (0.08 | ) | | | — | | | | — | | | | (0.08 | ) | | | 12.45 | | | | 20.17 | | | | 154 | | | | 1.07 | | | | 0.98 | | | | 0.65 | | | | 87 | |
Y | | | 10.47 | | | | 0.08 | | | | 2.04 | | | | 2.12 | | | | (0.08 | ) | | | — | | | | — | | | | (0.08 | ) | | | 12.51 | | | | 20.28 | | | | 29,098 | | | | 0.91 | | | | 0.91 | | | | 0.73 | | | | 87 | |
| (1) | Information presented relates to a share outstanding throughout the indicated period. Net investment income (loss) per share amounts are calculated based on average shares outstanding unless otherwise noted. |
The accompanying notes are an integral part of these financial statements.
|
| Hartford Funds – Domestic Equity Funds |
Financial Highlights – (continued)
| (2) | Assumes initial investment at net asset value at the beginning of each period, reinvestment of all distributions, the complete redemption of the investment at net asset value at the end of each period and no sales charge. Total return would be reduced if sales charges were taken into account. |
| (3) | Adjustments include waivers and reimbursements, if applicable. |
| (6) | Commenced operations on November 7, 2014. |
| (7) | Net investment income (loss) per share amounts have been calculated using the SEC method. |
| (8) | Commenced operations on March 31, 2015. |
| (9) | During the year ended October 31, 2014, the Fund incurred $415.5 million in sales of securities held associated with the transition of assets from The Hartford Growth Fund, which merged into the Fund on April 7, 2014. These sales are excluded from the portfolio turnover rate calculation |
| (10) | During the year ended October 31, 2013, the Fund incurred $2.8 million in sales of securities held associated with the transition of assets from The Hartford Fundamental Growth Fund, which merged into the Fund on February 22, 2013. These sales are excluded from the portfolio turnover rate calculation. |
| (11) | Class L was merged into Class A on August 5, 2011. |
| (12) | Commenced operations on September 30, 2011. |
| (13) | During the year ended October 31, 2010, the Fund incurred $45.6 million in purchases associated with the transition of assets from The Hartford Select MidCap Value Fund, which merged into the Fund on February 19, 2010. These purchases are excluded from the portfolio turnover calculation. |
| (14) | The impact of the Payment from Affiliate per share was $0.02 for Class A, Class B, Class C and Class I and $0.03 for Class R3, Class R4, Class R5 and Class Y. |
| (15) | Total return without the inclusion of the Payments from (to) Affiliate, can be found in Expenses in the accompanying Notes to Financial Statements. |
| (16) | During the year ended October 31, 2014, the Fund incurred $121.7 million in sales of securities held associated with the transition of assets from The Hartford Value Fund, which merged into the Fund on April 7, 2014. These sales are excluded from the portfolio turnover rate calculation. |
The accompanying notes are an integral part of these financial statements.
|
| Hartford Funds – Domestic Equity Funds |
Directors and Officers (Unaudited)
The Board of Directors of The Hartford Mutual Funds, Inc. and The Hartford Mutual Funds II, Inc. (the “Companies”) appoints officers who are responsible for the day-to-day operations of the Fund and who execute policies formulated by The Board of Directors of the Companies (the “Directors”). Each Director serves until his or her death, resignation, or retirement or until the next annual meeting of shareholders is held or until his or her successor is elected and qualifies.
Directors and officers who are employed by or who have a financial interest in The Hartford Financial Services Group, Inc. (“The Hartford”) are considered “interested” persons of the Fund pursuant to the 1940 Act. Each officer and one of the Company’s Directors, as noted in the chart below, are “interested” persons of the Fund. Each Director serves as a director for The Hartford Mutual Funds, Inc., The Hartford Mutual Funds II, Inc., Hartford Series Fund, Inc., and Hartford HLS Series Fund II, Inc., and as a trustee for The Hartford Alternative Strategies Fund, which, as of June 2015, collectively, consist of 68 funds. Correspondence may be sent to Directors and officers c/o Hartford Funds, 5 Radnor Corporate Center, Suite 300, 100 Matsonford Road, Radnor, Pennsylvania 19087.
The table below sets forth, for each Director and officer, his or her name, year of birth, current position with the Company and date first elected or appointed to The Hartford Mutual Funds, Inc. (“MF”) and The Hartford Mutual Funds II, Inc. (“MF2”), principal occupation, and, for Directors, other directorships held. The Fund’s Statement of Additional Information contains further information on the Directors and is available free of charge by calling 1-888-843-7824 or writing to: Hartford Funds, P.O. Box 55022, Boston, MA 02205-5022.
Information on the aggregate remuneration paid to the directors of the Company can be found in the Statement of Operations herein. The Fund pays to The Hartford a portion of the Chief Compliance Officer’s compensation, but does not pay salaries or compensation to any of its other officers or Directors who are employed by The Hartford.
Non-Interested Directors
Hilary E. Ackermann (1956) Director since 2014
Ms. Ackermann served as Chief Risk Officer at Goldman Sachs Bank USA from October 2008 to November 2011 and serves as a Director of Dynegy, Inc., an independent power company, from October 2012 to present.
Lynn S. Birdsong (1946) Director since 2003, Chairman of the Investment Committee since 2014
Mr. Birdsong currently serves as a Director of Aberdeen Global and Aberdeen Global II (investment Funds) (September 2014 to present) and as a Director of the Sovereign High Yield Investment Company (April 2010 to June 2014). Mr. Birdsong served as an Independent Director of Nomura Partners Funds, Inc. (formerly, The Japan Fund) (April 2003 to February 2015). From 2003 to March 2005, Mr. Birdsong was an Independent Director of the Atlantic Whitehall Funds. From 1979 to 2002, Mr. Birdsong was a Managing Director of Zurich Scudder Investments, an investment management firm. During his employment with Scudder, Mr. Birdsong was an Interested Director of The Japan Fund. From January 1981 through December 2013, Mr. Birdsong was a partner in Birdsong Company, an advertising specialty firm.
Robert M. Gavin, Jr. (1940) Director since 2002 (MF) and 1986 (MF2), Chairman of the Board for each since 2004
Dr. Gavin is an educational consultant. Prior to September 1, 2001, he was President of Cranbrook Education Community and prior to July 1996, he was President of Macalester College, St. Paul, Minnesota.
Duane E. Hill (1945) Director since 2001 (MF) and 2002 (MF2), Chairman of the Nominating Committee since 2003
Mr. Hill is a Partner of TSG Ventures L.P., a private equity investment company. Mr. Hill is a former partner of TSG Capital Group, a private equity investment firm that served as sponsor and lead investor in leveraged buyouts of middle market companies.
Sandra S. Jaffee (1941) Director since 2005
Ms. Jaffee is the founder and Chief Executive Officer of a private company, Homeworks Concierge, LLC, which provides residential property management services in Westchester County, New York (January 2012 to present). Ms. Jaffee served as Chairman (2008 to 2009) and Chief Executive Officer of Fortent (formerly Searchspace Group), a leading provider of compliance/regulatory technology to financial institutions from August 2005 to August 2009. From August 2004 to August 2005, Ms. Jaffee served as an Entrepreneur in Residence with Warburg Pincus, a private equity firm. Prior to joining Warburg Pincus, Ms. Jaffee served as Executive Vice President at Citigroup, from September 1995 to July 2004, where she was President and Chief Executive Officer of Citibank’s Global Securities Services (1995 to 2003). Ms. Jaffee served as a member of the Board of Directors of Broadridge Financial Solutions (November 2010 to November 2014). Ms. Jaffee currently serves as a member of the Board of Directors of Global Corp. Africa (a non-profit organization) (January 2015 to present) as well as a Trustee of Muhlenberg College.
|
| Hartford Funds – Domestic Equity Funds |
Directors and Officers (Unaudited) – (continued)
William P. Johnston (1944) Director since 2005, Chairman of the Compliance Committee since 2005
In June 2006, Mr. Johnston was appointed as Senior Advisor to The Carlyle Group, a global private equity and other alternative asset investment firm and currently serves as an Operating Executive. In July 2006, Mr. Johnston was elected to the Board of Directors of MultiPlan, Inc. and served as a Director (July 2006 to August 2010). In August 2007, Mr. Johnston was elected to the Board of Directors of LifeCare Holdings, Inc. and served as a Director (August 2007 to June 2013). In February 2008, Mr. Johnston was elected to the Board of Directors of HCR-ManorCare, Inc. In May 2006, Mr. Johnston was elected to the Supervisory Board of Fresenius Medical Care AG & Co. KGaA, after its acquisition of Renal Care Group, Inc. in March 2006. Mr. Johnston joined Renal Care Group in November 2002 as a member of the Board of Directors and served as Chairman of the Board from March 2003 through March 2006. From 2002 through 2013, Mr. Johnston served as a Board member of the Georgia O’Keefe Museum. From September 1987 to December 2002, Mr. Johnston was with Equitable Securities Corporation (and its successors, SunTrust Equitable Securities and SunTrust Robinson Humphrey) serving in various investment banking and managerial positions, including Managing Director and Head of Investment Banking, Chief Executive Officer and Vice Chairman.
Phillip O. Peterson (1944) Director since 2002 (MF) and 2000 (MF2), Chairman of the Audit Committee since 2002
Mr. Peterson is a mutual fund industry consultant. He was a partner of KPMG LLP (an accounting firm) until July 1999. Mr. Peterson joined William Blair Funds in February 2007 as a member of the Board of Trustees. From February 2012 to February 2014, Mr. Peterson served as a Trustee of Symetra Variable Mutual Funds. From January 2004 to April 2005, Mr. Peterson served as Independent President of the Strong Mutual Funds.
Lemma W. Senbet (1946) Director since 2005
Dr. Senbet is the William E. Mayer Chair Professor of Finance and Founding Director, Center for Financial Policy, at the University of Maryland, Robert H. Smith School of Business. He was chair of the Finance Department of the University of Maryland, Robert H. Smith School of Business from 1998 to 2006. Since June 2013, he has been on leave from the University to serve as Executive Director of African Economic Research Consortium which focuses on economic policy research and training. Previously, he was a chaired professor of finance at the University of Wisconsin-Madison. Also, he was a Director of the Fortis Funds from March 2000 to July 2002. Dr. Senbet served as Director of the American Finance Association and President of the Western Finance Association. In 2006, Dr. Senbet was inducted Fellow of Financial Management Association International for his career-long distinguished scholarship and professional service.
Interested Directors and Officers
James E. Davey (1964) Director since 2012, President and Chief Executive Officer since 2010
Mr. Davey serves as Executive Vice President of Hartford Life Insurance Company (“HLIC”) and The Hartford. Additionally, Mr. Davey serves as Chairman of the Board, Manager and Senior Managing Director of Hartford Funds Distributors, LLC (“HFD”). He also currently serves as Director, Chairman of the Board, President and Senior Managing Director of Hartford Administrative Services Company (“HASCO”). Mr. Davey also serves as Manager, Chairman of the Board and Senior Managing Director for Hartford Funds Management Company, LLC (“HFMC”) and Director, Chairman of the Board and Senior Managing Director for Hartford Funds Management Group, Inc. (“HFMG”). Mr. Davey has served in various positions within The Hartford and its subsidiaries in connection with the operation of the Hartford Funds. Mr. Davey joined The Hartford in 2002.
Other Officers
Andrew S. Decker (1963) AML Compliance Officer since 2015
Mr. Decker currently serves as Chief Compliance Officer and AML Compliance Officer of HASCO and as AML Officer of HFD. Prior to joining The Hartford, Mr. Decker served as Vice President and AML Officer at Janney Montgomery Scott (a broker dealer) from April 2011 to January 2015. Mr. Decker served as AML Compliance and Sanctions Enforcement Officer at SEI Investments from December 2007 to April 2011.
Michael Flook (1965) Vice President, Treasurer and Controller since 2015
Mr. Flook currently serves as the Treasurer of HFMG. Mr. Flook served as Assistant Treasurer for each Company, The Hartford Alternative Strategies Fund and the Retail Funds from February 2015 to March 2015. Mr. Flook joined The Hartford in 2014. Prior to joining The Hartford, Mr. Flook served as Director, Vice President and Assistant Treasurer at UBS Global Asset Management from May 2006 to November 2014.
|
| Hartford Funds – Domestic Equity Funds |
Directors and Officers (Unaudited) – (continued)
Edward P. Macdonald (1967) Vice President, Secretary and Chief Legal Officer since 2005
Mr. Macdonald currently serves as Assistant Secretary, Executive Vice President and Deputy General Counsel of HFD, HASCO, HFMC and HFMG. He also serves as Vice President of HLIC. Mr. Macdonald has served in various positions within The Hartford and its subsidiaries in connection with the operation of the Hartford Funds. Mr. Macdonald joined The Hartford in 2005.
Joseph G. Melcher (1973) Vice President and Chief Compliance Officer since 2013
Mr. Melcher currently serves as Executive Vice President of HFD, HFMG and HASCO. Mr. Melcher also currently serves as Executive Vice President and Chief Compliance Officer of HFMC. Mr. Melcher has served in various positions within The Hartford and its subsidiaries in connection with the operation of the Hartford Funds since joining The Hartford in 2012. Prior to joining The Hartford, Mr. Melcher worked at Touchstone Investments, a member of the Western & Southern Financial Group, where he held the position of Vice President and Chief Compliance Officer from 2010 through 2012 and Assistant Vice President, Compliance from 2005 to 2010.
Vernon J. Meyer (1964) Vice President since 2006
Mr. Meyer currently serves as Senior Vice President of HLIC. He also currently serves as Managing Director and Chief Investment Officer of HFMC and Managing Director of HFMG. Mr. Meyer has served in various positions within The Hartford and its subsidiaries in connection with the operation of the Hartford Funds. Mr. Meyer joined The Hartford in 2004.
Laura S. Quade (1969) Vice President since 2012
Ms. Quade currently serves as Vice President of HASCO, HFD and HFMG. She is the Head of Operations of HASCO and formerly served as Director, Enterprise Operations of HLIC. Ms. Quade has served in various positions within The Hartford and its subsidiaries in connection with the operation of the Hartford Funds. Ms. Quade joined The Hartford in 2001.
HOW TO OBTAIN A COPY OF THE FUND’S PROXY VOTING POLICIES AND VOTING RECORDS (UNAUDITED)
A description of the policies and procedures that each uses to determine how to vote proxies relating to portfolio securities and information about how each Fund voted proxies relating to portfolio securities during the most recent twelve-month period ended June 30 are available (1) without charge, upon request, by calling 888-843-7824 and (2) on the SEC’s website at http://www.sec.gov.
QUARTERLY PORTFOLIO HOLDINGS INFORMATION (UNAUDITED)
Each Fund files a complete schedule of portfolio holdings with the SEC for the first and third quarters of each fiscal year on Form N-Q. Each Funds’ Form N-Q is available (1) without charge, upon request, by calling 888-843-7824 and (2) on the SEC’s website at http://www.sec.gov. The Form N-Q may be reviewed and copied at the SEC’s Public Reference Room in Washington, DC. Information on the operation of the Public Reference Room may be obtained by calling 1-800-SEC-0330.
|
| Hartford Funds – Domestic Equity Funds |
Expense Examples (Unaudited)
Your Fund’s Expenses
As a shareholder of a Fund, you incur two types of costs: (1) transaction costs, including sales charges (loads) on purchase payments, if any, and contingent deferred sales charges (CDSC), if any, and (2) ongoing costs, including investment management fees, distribution and/or service (12b-1) fees, if any, and other fund expenses. This example is intended to help you understand your ongoing costs (in dollars) of investing in a Fund and to compare these costs with the ongoing costs of investing in other mutual funds. The example is based on an investment of $1,000 invested at the beginning of the period and held for the entire period of November 1, 2014 through April 30, 2015.
Actual Expenses
The first set of columns of the table below provides information about actual account values and actual expenses. You may use the information in this row, together with the amount you invested, to estimate the expenses that you paid over the period. Simply divide your account value by $1,000 (for example, an $8,600 account value divided by $1,000 = 8.6), then multiply the result by the number in the line under the heading entitled “Expenses Paid During Period” to estimate the expenses you paid on your account during this period.
Hypothetical Example for Comparison Purposes
The second set of columns of the table below provides information about hypothetical account values and hypothetical expenses based on a Fund’s actual expense ratio and an assumed rate of return of 5% per year before expenses, which is not the Fund’s actual return. The hypothetical account values and expenses may not be used to estimate the actual ending account balance or expenses you paid for the period. You may use this information to compare the ongoing costs of investing in a Fund and other funds. To do so, compare this 5% hypothetical example with the 5% hypothetical examples that appear in the shareholder reports of the other funds.
Please note that the expenses shown in the table are meant to highlight your ongoing costs only and do not reflect any transactional costs, such as sales charges (loads) or fees which may be applied at the variable life insurance, variable annuity, or qualified retirement plan product level. Therefore, the second set of columns of the table is useful in comparing ongoing costs only, and will not help you determine the relative total costs of owning different funds. In addition, if these transactional costs were included, your costs would be higher. Expenses are equal to the Fund’s annualized expense ratios multiplied by average account value over the period, multiplied by 181/365 (to reflect the one-half year period).
The Hartford Capital Appreciation Fund
| | | | | | | | | | | | | | | | | | | | | | | | | | | | | | | | | | | | |
| | | Actual Return | | | Hypothetical (5% return before expenses) | | | | | | | | | | |
| | | Beginning
Account
Value
November 1,
2014 | | | Ending
Account
Value
April 30,
2015 | | | Expenses paid
during the period
November 1, 2014
through April 30,
2015 | | | Beginning
Account
Value
November 1,
2014 | | | Ending
Account
Value
April 30,
2015 | | | Expenses paid
during the period
November 1, 2014
through April 30,
2015 | | | Annualized
expense
ratio | | | Days in
the
current
1/2 year | | | Days in
the full
year | |
Class A | | $ | 1,000.00 | | | $ | 1,056.50 | | | $ | 5.46 | | | $ | 1,000.00 | | | $ | 1,019.49 | | | $ | 5.36 | | | | 1.07 | % | | | 181 | | | | 365 | |
Class B | | $ | 1,000.00 | | | $ | 1,051.90 | | | $ | 9.92 | | | $ | 1,000.00 | | | $ | 1,015.13 | | | $ | 9.74 | | | | 1.95 | % | | | 181 | | | | 365 | |
Class C | | $ | 1,000.00 | | | $ | 1,053.10 | | | $ | 9.16 | | | $ | 1,000.00 | | | $ | 1,015.87 | | | $ | 9.00 | | | | 1.80 | % | | | 181 | | | | 365 | |
Class I | | $ | 1,000.00 | | | $ | 1,057.80 | | | $ | 4.08 | | | $ | 1,000.00 | | | $ | 1,020.83 | | | $ | 4.01 | | | | 0.80 | % | | | 181 | | | | 365 | |
Class R3 | | $ | 1,000.00 | | | $ | 1,054.60 | | | $ | 7.13 | | | $ | 1,000.00 | | | $ | 1,017.85 | | | $ | 7.00 | | | | 1.40 | % | | | 181 | | | | 365 | |
Class R4 | | $ | 1,000.00 | | | $ | 1,056.40 | | | $ | 5.56 | | | $ | 1,000.00 | | | $ | 1,019.39 | | | $ | 5.46 | | | | 1.09 | % | | | 181 | | | | 365 | |
Class R5 | | $ | 1,000.00 | | | $ | 1,058.00 | | | $ | 4.03 | | | $ | 1,000.00 | | | $ | 1,020.88 | | | $ | 3.96 | | | | 0.79 | % | | | 181 | | | | 365 | |
Class R6(1) | | $ | 1,000.00 | | | $ | 1,054.70 | | | $ | 3.44 | | | $ | 1,000.00 | | | $ | 1,020.22 | | | $ | 3.38 | | | | 0.71 | % | | | 172 | | | | 365 | |
Class Y | | $ | 1,000.00 | | | $ | 1,058.40 | | | $ | 3.52 | | | $ | 1,000.00 | | | $ | 1,021.37 | | | $ | 3.46 | | | | 0.69 | % | | | 181 | | | | 365 | |
| (1) | Commenced operations on November 7, 2014. |
|
| Hartford Funds – Domestic Equity Funds |
Expense Examples (Unaudited) – (continued)
Hartford Core Equity Fund
| | | | | | | | | | | | | | | | | | | | | | | | | | | | | | | | | | | | |
| | | Actual Return | | | Hypothetical (5% return before expenses) | | | | | | | | | | |
| | | Beginning
Account
Value
November 1,
2014 | | | Ending
Account
Value
April 30,
2015 | | | Expenses paid
during the period
November 1, 2014
through April 30,
2015 | | | Beginning
Account
Value
November 1,
2014 | | | Ending
Account
Value
April 30,
2015 | | | Expenses paid
during the period
November 1, 2014
through April 30,
2015 | | | Annualized
expense
ratio | | | Days in
the
current
1/2 year | | | Days in
the full
year | |
Class A | | $ | 1,000.00 | | | $ | 1,072.50 | | | $ | 5.60 | | | $ | 1,000.00 | | | $ | 1,019.39 | | | $ | 5.46 | | | | 1.09 | % | | | 181 | | | | 365 | |
Class B | | $ | 1,000.00 | | | $ | 1,068.70 | | | $ | 9.80 | | | $ | 1,000.00 | | | $ | 1,015.32 | | | $ | 9.54 | | | | 1.91 | % | | | 181 | | | | 365 | |
Class C | | $ | 1,000.00 | | | $ | 1,068.90 | | | $ | 9.23 | | | $ | 1,000.00 | | | $ | 1,015.87 | | | $ | 9.00 | | | | 1.80 | % | | | 181 | | | | 365 | |
Class I(1) | | $ | 1,000.00 | | | $ | 991.50 | | | $ | 0.44 | | | $ | 1,000.00 | | | $ | 1,003.67 | | | $ | 0.44 | | | | 0.54 | % | | | 30 | | | | 365 | |
Class R3 | | $ | 1,000.00 | | | $ | 1,071.20 | | | $ | 6.93 | | | $ | 1,000.00 | | | $ | 1,018.10 | | | $ | 6.76 | | | | 1.35 | % | | | 181 | | | | 365 | |
Class R4 | | $ | 1,000.00 | | | $ | 1,073.20 | | | $ | 5.19 | | | $ | 1,000.00 | | | $ | 1,019.79 | | | $ | 5.06 | | | | 1.01 | % | | | 181 | | | | 365 | |
Class R5 | | $ | 1,000.00 | | | $ | 1,074.30 | | | $ | 2.78 | | | $ | 1,000.00 | | | $ | 1,022.12 | | | $ | 2.71 | | | | 0.54 | % | | | 181 | | | | 365 | |
Class R6(1) | | $ | 1,000.00 | | | $ | 991.20 | | | $ | 0.37 | | | $ | 1,000.00 | | | $ | 1,003.74 | | | $ | 0.37 | | | | 0.45 | % | | | 30 | | | | 365 | |
Class Y | | $ | 1,000.00 | | | $ | 1,075.00 | | | $ | 3.29 | | | $ | 1,000.00 | | | $ | 1,021.62 | | | $ | 3.21 | | | | 0.64 | % | | | 181 | | | | 365 | |
| (1) | Commenced operations on March 31, 2015. |
The Hartford Dividend and Growth Fund
| | | | | | | | | | | | | | | | | | | | | | | | | | | | | | | | | | | | |
| | | Actual Return | | | Hypothetical (5% return before expenses) | | | | | | | | | | |
| | | Beginning
Account
Value
November 1,
2014 | | | Ending
Account
Value
April 30,
2015 | | | Expenses paid
during the period
November 1, 2014
through April 30,
2015 | | | Beginning
Account
Value
November 1,
2014 | | | Ending
Account
Value
April 30,
2015 | | | Expenses paid
during the period
November 1, 2014
through April 30,
2015 | | | Annualized
expense
ratio | | | Days in
the
current
1/2 year | | | Days in
the full
year | |
Class A | | $ | 1,000.00 | | | $ | 1,038.80 | | | $ | 5.11 | | | $ | 1,000.00 | | | $ | 1,019.79 | | | $ | 5.06 | | | | 1.01 | % | | | 181 | | | | 365 | |
Class B | | $ | 1,000.00 | | | $ | 1,034.10 | | | $ | 9.78 | | | $ | 1,000.00 | | | $ | 1,015.17 | | | $ | 9.69 | | | | 1.94 | % | | | 181 | | | | 365 | |
Class C | | $ | 1,000.00 | | | $ | 1,035.00 | | | $ | 8.83 | | | $ | 1,000.00 | | | $ | 1,016.12 | | | $ | 8.75 | | | | 1.75 | % | | | 181 | | | | 365 | |
Class I | | $ | 1,000.00 | | | $ | 1,040.00 | | | $ | 4.10 | | | $ | 1,000.00 | | | $ | 1,020.78 | | | $ | 4.06 | | | | 0.81 | % | | | 181 | | | | 365 | |
Class R3 | | $ | 1,000.00 | | | $ | 1,037.10 | | | $ | 6.82 | | | $ | 1,000.00 | | | $ | 1,018.10 | | | $ | 6.76 | | | | 1.35 | % | | | 181 | | | | 365 | |
Class R4 | | $ | 1,000.00 | | | $ | 1,038.90 | | | $ | 5.26 | | | $ | 1,000.00 | | | $ | 1,019.64 | | | $ | 5.21 | | | | 1.04 | % | | | 181 | | | | 365 | |
Class R5 | | $ | 1,000.00 | | | $ | 1,040.30 | | | $ | 3.74 | | | $ | 1,000.00 | | | $ | 1,021.13 | | | $ | 3.71 | | | | 0.74 | % | | | 181 | | | | 365 | |
Class R6(1) | | $ | 1,000.00 | | | $ | 1,029.50 | | | $ | 3.04 | | | $ | 1,000.00 | | | $ | 1,020.43 | | | $ | 3.03 | | | | 0.64 | % | | | 171 | | | | 365 | |
Class Y | | $ | 1,000.00 | | | $ | 1,040.70 | | | $ | 3.24 | | | $ | 1,000.00 | | | $ | 1,021.62 | | | $ | 3.21 | | | | 0.64 | % | | | 181 | | | | 365 | |
| (1) | Commenced operations on November 7, 2014. |
|
| Hartford Funds – Domestic Equity Funds |
Expense Examples (Unaudited) – (continued)
The Hartford Equity Income Fund
| | | | | | | | | | | | | | | | | | | | | | | | | | | | | | | | | | | | |
| | | Actual Return | | | Hypothetical (5% return before expenses) | | | | | | | | | | |
| | | Beginning
Account
Value
November 1,
2014 | | | Ending
Account
Value
April 30,
2015 | | | Expenses paid
during the period
November 1, 2014
through April 30,
2015 | | | Beginning
Account
Value
November 1,
2014 | | | Ending
Account
Value
April 30,
2015 | | | Expenses paid
during the period
November 1, 2014
through April 30,
2015 | | | Annualized
expense
ratio | | | Days in
the
current
1/2 year | | | Days in
the full
year | |
Class A | | $ | 1,000.00 | | | $ | 1,035.30 | | | $ | 5.15 | | | $ | 1,000.00 | | | $ | 1,019.74 | | | $ | 5.11 | | | | 1.02 | % | | | 181 | | | | 365 | |
Class B | | $ | 1,000.00 | | | $ | 1,034.50 | | | $ | 5.85 | | | $ | 1,000.00 | | | $ | 1,019.04 | | | $ | 5.81 | | | | 1.16 | % | | | 181 | | | | 365 | |
Class C | | $ | 1,000.00 | | | $ | 1,031.90 | | | $ | 8.77 | | | $ | 1,000.00 | | | $ | 1,016.17 | | | $ | 8.70 | | | | 1.74 | % | | | 181 | | | | 365 | |
Class I | | $ | 1,000.00 | | | $ | 1,036.70 | | | $ | 3.89 | | | $ | 1,000.00 | | | $ | 1,020.98 | | | $ | 3.86 | | | | 0.77 | % | | | 181 | | | | 365 | |
Class R3 | | $ | 1,000.00 | | | $ | 1,033.60 | | | $ | 6.86 | | | $ | 1,000.00 | | | $ | 1,018.05 | | | $ | 6.81 | | | | 1.36 | % | | | 181 | | | | 365 | |
Class R4 | | $ | 1,000.00 | | | $ | 1,035.60 | | | $ | 5.35 | | | $ | 1,000.00 | | | $ | 1,019.54 | | | $ | 5.31 | | | | 1.06 | % | | | 181 | | | | 365 | |
Class R5 | | $ | 1,000.00 | | | $ | 1,037.00 | | | $ | 3.84 | | | $ | 1,000.00 | | | $ | 1,021.03 | | | $ | 3.81 | | | | 0.76 | % | | | 181 | | | | 365 | |
Class R6(1) | | $ | 1,000.00 | | | $ | 1,026.20 | | | $ | 3.25 | | | $ | 1,000.00 | | | $ | 1,020.36 | | | $ | 3.24 | | | | 0.68 | % | | | 172 | | | | 365 | |
Class Y | | $ | 1,000.00 | | | $ | 1,036.80 | | | $ | 3.33 | | | $ | 1,000.00 | | | $ | 1,021.52 | | | $ | 3.31 | | | | 0.66 | % | | | 181 | | | | 365 | |
| (1) | Commenced operations on November 7, 2014. |
The Hartford Growth Opportunities Fund
| | | | | | | | | | | | | | | | | | | | | | | | | | | | | | | | | | | | |
| | | Actual Return | | | Hypothetical (5% return before expenses) | | | | | | | | | | |
| | | Beginning
Account
Value
November 1,
2014 | | | Ending
Account
Value
April 30,
2015 | | | Expenses paid
during the period
November 1, 2014
through April 30,
2015 | | | Beginning
Account
Value
November 1,
2014 | | | Ending
Account
Value
April 30,
2015 | | | Expenses paid
during the period
November 1, 2014
through April 30,
2015 | | | Annualized
expense
ratio | | | Days in
the
current
1/2 year | | | Days in
the full
year | |
Class A | | $ | 1,000.00 | | | $ | 1,107.60 | | | $ | 5.85 | | | $ | 1,000.00 | | | $ | 1,019.24 | | | $ | 5.61 | | | | 1.12 | % | | | 181 | | | | 365 | |
Class B | | $ | 1,000.00 | | | $ | 1,102.60 | | | $ | 10.58 | | | $ | 1,000.00 | | | $ | 1,014.73 | | | $ | 10.14 | | | | 2.03 | % | | | 181 | | | | 365 | |
Class C | | $ | 1,000.00 | | | $ | 1,103.90 | | | $ | 9.65 | | | $ | 1,000.00 | | | $ | 1,015.62 | | | $ | 9.25 | | | | 1.85 | % | | | 181 | | | | 365 | |
Class I | | $ | 1,000.00 | | | $ | 1,109.00 | | | $ | 4.71 | | | $ | 1,000.00 | | | $ | 1,020.33 | | | $ | 4.51 | | | | 0.90 | % | | | 181 | | | | 365 | |
Class R3 | | $ | 1,000.00 | | | $ | 1,105.90 | | | $ | 7.57 | | | $ | 1,000.00 | | | $ | 1,017.60 | | | $ | 7.25 | | | | 1.45 | % | | | 181 | | | | 365 | |
Class R4 | | $ | 1,000.00 | | | $ | 1,107.40 | | | $ | 5.96 | | | $ | 1,000.00 | | | $ | 1,019.14 | | | $ | 5.71 | | | | 1.14 | % | | | 181 | | | | 365 | |
Class R5 | | $ | 1,000.00 | | | $ | 1,100.90 | | | $ | 4.38 | | | $ | 1,000.00 | | | $ | 1,020.63 | | | $ | 4.21 | | | | 0.84 | % | | | 181 | | | | 365 | |
Class R6(1) | | $ | 1,000.00 | | | $ | 1,100.50 | | | $ | 3.71 | | | $ | 1,000.00 | | | $ | 1,020.03 | | | $ | 3.57 | | | | 0.75 | % | | | 172 | | | | 365 | |
Class Y | | $ | 1,000.00 | | | $ | 1,109.60 | | | $ | 3.87 | | | $ | 1,000.00 | | | $ | 1,021.13 | | | $ | 3.71 | | | | 0.74 | % | | | 181 | | | | 365 | |
| (1) | Commenced operations on November 7, 2014. |
|
| Hartford Funds – Domestic Equity Funds |
Expense Examples (Unaudited) – (continued)
The Hartford Healthcare Fund
| | | | | | | | | | | | | | | | | | | | | | | | | | | | | | | | | | | | |
| | | Actual Return | | | Hypothetical (5% return before expenses) | | | | | | | | | | |
| | | Beginning
Account
Value
November 1,
2014 | | | Ending
Account
Value
April 30,
2015 | | | Expenses paid
during the period
November 1, 2014
through April 30,
2015 | | | Beginning
Account
Value
November 1,
2014 | | | Ending
Account
Value
April 30,
2015 | | | Expenses paid
during the period
November 1, 2014
through April 30,
2015 | | | Annualized
expense
ratio | | | Days in
the
current
1/2 year | | | Days in
the full
year | |
Class A | | $ | 1,000.00 | | | $ | 1,118.40 | | | $ | 6.67 | | | $ | 1,000.00 | | | $ | 1,018.50 | | | $ | 6.36 | | | | 1.27 | % | | | 181 | | | | 365 | |
Class B | | $ | 1,000.00 | | | $ | 1,113.90 | | | $ | 11.27 | | | $ | 1,000.00 | | | $ | 1,014.13 | | | $ | 10.74 | | | | 2.15 | % | | | 181 | | | | 365 | |
Class C | | $ | 1,000.00 | | | $ | 1,114.60 | | | $ | 10.54 | | | $ | 1,000.00 | | | $ | 1,014.83 | | | $ | 10.04 | | | | 2.01 | % | | | 181 | | | | 365 | |
Class I | | $ | 1,000.00 | | | $ | 1,120.00 | | | $ | 5.31 | | | $ | 1,000.00 | | | $ | 1,019.79 | | | $ | 5.06 | | | | 1.01 | % | | | 181 | | | | 365 | |
Class R3 | | $ | 1,000.00 | | | $ | 1,116.80 | | | $ | 8.45 | | | $ | 1,000.00 | | | $ | 1,016.81 | | | $ | 8.05 | | | | 1.61 | % | | | 181 | | | | 365 | |
Class R4 | | $ | 1,000.00 | | | $ | 1,118.40 | | | $ | 6.88 | | | $ | 1,000.00 | | | $ | 1,018.30 | | | $ | 6.56 | | | | 1.31 | % | | | 181 | | | | 365 | |
Class R5 | | $ | 1,000.00 | | | $ | 1,120.10 | | | $ | 5.36 | | | $ | 1,000.00 | | | $ | 1,019.74 | | | $ | 5.11 | | | | 1.02 | % | | | 181 | | | | 365 | |
Class Y | | $ | 1,000.00 | | | $ | 1,120.40 | | | $ | 4.78 | | | $ | 1,000.00 | | | $ | 1,020.28 | | | $ | 4.56 | | | | 0.91 | % | | | 181 | | | | 365 | |
The Hartford MidCap Fund
| | | | | | | | | | | | | | | | | | | | | | | | | | | | | | | | | | | | |
| | | Actual Return | | | Hypothetical (5% return before expenses) | | | | | | | | | | |
| | | Beginning
Account
Value
November 1,
2014 | | | Ending
Account
Value
April 30,
2015 | | | Expenses paid
during the period
November 1, 2014
through April 30,
2015 | | | Beginning
Account
Value
November 1,
2014 | | | Ending
Account
Value
April 30,
2015 | | | Expenses paid
during the period
November 1, 2014
through April 30,
2015 | | | Annualized
expense
ratio | | | Days in
the
current
1/2 year | | | Days in
the full
year | |
Class A | | $ | 1,000.00 | | | $ | 1,063.80 | | | $ | 5.78 | | | $ | 1,000.00 | | | $ | 1,019.19 | | | $ | 5.66 | | | | 1.13 | % | | | 181 | | | | 365 | |
Class B | | $ | 1,000.00 | | | $ | 1,059.10 | | | $ | 10.36 | | | $ | 1,000.00 | | | $ | 1,014.73 | | | $ | 10.14 | | | | 2.03 | % | | | 181 | | | | 365 | |
Class C | | $ | 1,000.00 | | | $ | 1,060.00 | | | $ | 9.50 | | | $ | 1,000.00 | | | $ | 1,015.57 | | | $ | 9.30 | | | | 1.86 | % | | | 181 | | | | 365 | |
Class I | | $ | 1,000.00 | | | $ | 1,064.80 | | | $ | 4.66 | | | $ | 1,000.00 | | | $ | 1,020.28 | | | $ | 4.56 | | | | 0.91 | % | | | 181 | | | | 365 | |
Class R3 | | $ | 1,000.00 | | | $ | 1,062.10 | | | $ | 7.46 | | | $ | 1,000.00 | | | $ | 1,017.56 | | | $ | 7.30 | | | | 1.46 | % | | | 181 | | | | 365 | |
Class R4 | | $ | 1,000.00 | | | $ | 1,064.00 | | | $ | 5.94 | | | $ | 1,000.00 | | | $ | 1,019.04 | | | $ | 5.81 | | | | 1.16 | % | | | 181 | | | | 365 | |
Class R5 | | $ | 1,000.00 | | | $ | 1,065.30 | | | $ | 4.40 | | | $ | 1,000.00 | | | $ | 1,020.53 | | | $ | 4.31 | | | | 0.86 | % | | | 181 | | | | 365 | |
Class R6(1) | | $ | 1,000.00 | | | $ | 1,065.60 | | | $ | 3.70 | | | $ | 1,000.00 | | | $ | 1,019.98 | | | $ | 3.62 | | | | 0.76 | % | | | 172 | | | | 365 | |
Class Y | | $ | 1,000.00 | | | $ | 1,065.70 | | | $ | 3.89 | | | $ | 1,000.00 | | | $ | 1,021.03 | | | $ | 3.81 | | | | 0.76 | % | | | 181 | | | | 365 | |
| (1) | Commenced operations on November 7, 2014. |
|
| Hartford Funds – Domestic Equity Funds |
Expense Examples (Unaudited) – (continued)
The Hartford MidCap Value Fund
| | | | | | | | | | | | | | | | | | | | | | | | | | | | | | | | | | | | |
| | | Actual Return | | | Hypothetical (5% return before expenses) | | | | | | | | | | |
| | | Beginning
Account
Value
November 1,
2014 | | | Ending
Account
Value
April 30,
2015 | | | Expenses paid
during the period
November 1, 2014
through April 30,
2015 | | | Beginning
Account
Value
November 1,
2014 | | | Ending
Account
Value
April 30,
2015 | | | Expenses paid
during the period
November 1, 2014
through April 30,
2015 | | | Annualized
expense
ratio | | | Days in
the
current
1/2 year | | | Days in
the full
year | |
Class A | | $ | 1,000.00 | | | $ | 1,062.00 | | | $ | 6.34 | | | $ | 1,000.00 | | | $ | 1,018.65 | | | $ | 6.21 | | | | 1.24 | % | | | 181 | | | | 365 | |
Class B | | $ | 1,000.00 | | | $ | 1,056.90 | | | $ | 10.71 | | | $ | 1,000.00 | | | $ | 1,014.38 | | | $ | 10.49 | | | | 2.10 | % | | | 181 | | | | 365 | |
Class C | | $ | 1,000.00 | | | $ | 1,057.90 | | | $ | 10.00 | | | $ | 1,000.00 | | | $ | 1,015.08 | | | $ | 9.79 | | | | 1.96 | % | | | 181 | | | | 365 | |
Class I | | $ | 1,000.00 | | | $ | 1,063.40 | | | $ | 4.81 | | | $ | 1,000.00 | | | $ | 1,020.13 | | | $ | 4.71 | | | | 0.94 | % | | | 181 | | | | 365 | |
Class R3 | | $ | 1,000.00 | | | $ | 1,059.70 | | | $ | 7.76 | | | $ | 1,000.00 | | | $ | 1,017.26 | | | $ | 7.60 | | | | 1.52 | % | | | 181 | | | | 365 | |
Class R4 | | $ | 1,000.00 | | | $ | 1,061.60 | | | $ | 6.19 | | | $ | 1,000.00 | | | $ | 1,018.79 | | | $ | 6.06 | | | | 1.21 | % | | | 181 | | | | 365 | |
Class R5 | | $ | 1,000.00 | | | $ | 1,063.70 | | | $ | 4.71 | | | $ | 1,000.00 | | | $ | 1,020.23 | | | $ | 4.61 | | | | 0.92 | % | | | 181 | | | | 365 | |
Class Y | | $ | 1,000.00 | | | $ | 1,064.10 | | | $ | 4.15 | | | $ | 1,000.00 | | | $ | 1,020.78 | | | $ | 4.06 | | | | 0.81 | % | | | 181 | | | | 365 | |
The Hartford Small Company Fund
| | | | | | | | | | | | | | | | | | | | | | | | | | | | | | | | | | | | |
| | | Actual Return | | | Hypothetical (5% return before expenses) | | | | | | | | | | |
| | | Beginning
Account
Value
November 1,
2014 | | | Ending
Account
Value
April 30,
2015 | | | Expenses paid
during the period
November 1, 2014
through April 30,
2015 | | | Beginning
Account
Value
November 1,
2014 | | | Ending
Account
Value
April 30,
2015 | | | Expenses paid
during the period
November 1, 2014
through April 30,
2015 | | | Annualized
expense
ratio | | | Days in
the
current
1/2 year | | | Days in
the full
year | |
Class A | | $ | 1,000.00 | | | $ | 1,035.10 | | | $ | 6.76 | | | $ | 1,000.00 | | | $ | 1,018.15 | | | $ | 6.71 | | | | 1.34 | % | | | 181 | | | | 365 | |
Class B | | $ | 1,000.00 | | | $ | 1,031.30 | | | $ | 10.78 | | | $ | 1,000.00 | | | $ | 1,014.18 | | | $ | 10.69 | | | | 2.14 | % | | | 181 | | | | 365 | |
Class C | | $ | 1,000.00 | | | $ | 1,031.40 | | | $ | 10.17 | | | $ | 1,000.00 | | | $ | 1,014.78 | | | $ | 10.09 | | | | 2.02 | % | | | 181 | | | | 365 | |
Class I | | $ | 1,000.00 | | | $ | 1,036.30 | | | $ | 5.65 | | | $ | 1,000.00 | | | $ | 1,019.24 | | | $ | 5.61 | | | | 1.12 | % | | | 181 | | | | 365 | |
Class R3 | | $ | 1,000.00 | | | $ | 1,034.00 | | | $ | 7.77 | | | $ | 1,000.00 | | | $ | 1,017.16 | | | $ | 7.70 | | | | 1.54 | % | | | 181 | | | | 365 | |
Class R4 | | $ | 1,000.00 | | | $ | 1,035.40 | | | $ | 6.26 | | | $ | 1,000.00 | | | $ | 1,018.65 | | | $ | 6.21 | | | | 1.24 | % | | | 181 | | | | 365 | |
Class R5 | | $ | 1,000.00 | | | $ | 1,037.20 | | | $ | 4.80 | | | $ | 1,000.00 | | | $ | 1,020.08 | | | $ | 4.76 | | | | 0.95 | % | | | 181 | | | | 365 | |
Class R6(1) | | $ | 1,000.00 | | | $ | 1,040.50 | | | $ | 4.04 | | | $ | 1,000.00 | | | $ | 1,019.60 | | | $ | 4.00 | | | | 0.84 | % | | | 172 | | | | 365 | |
Class Y | | $ | 1,000.00 | | | $ | 1,037.50 | | | $ | 4.24 | | | $ | 1,000.00 | | | $ | 1,020.63 | | | $ | 4.21 | | | | 0.84 | % | | | 181 | | | | 365 | |
| (1) | Commenced operations on November 7, 2014. |
|
| Hartford Funds – Domestic Equity Funds |
Expense Examples (Unaudited) – (continued)
The Hartford Small/Mid Cap Equity Fund
| | | | | | | | | | | | | | | | | | | | | | | | | | | | | | | | | | | | |
| | | Actual Return | | | Hypothetical (5% return before expenses) | | | | | | | | | | |
| | | Beginning
Account
Value
November 1,
2014 | | | Ending
Account
Value
April 30,
2015 | | | Expenses paid
during the period
November 1, 2014
through April 30,
2015 | | | Beginning
Account
Value
November 1,
2014 | | | Ending
Account
Value
April 30,
2015 | | | Expenses paid
during the period
November 1, 2014
through April 30,
2015 | | | Annualized
expense
ratio | | | Days in
the
current
1/2 year | | | Days in
the full
year | |
Class A | | $ | 1,000.00 | | | $ | 1,044.40 | | | $ | 6.59 | | | $ | 1,000.00 | | | $ | 1,018.35 | | | $ | 6.51 | | | | 1.30 | % | | | 181 | | | | 365 | |
Class B | | $ | 1,000.00 | | | $ | 1,040.90 | | | $ | 10.37 | | | $ | 1,000.00 | | | $ | 1,014.63 | | | $ | 10.24 | | | | 2.05 | % | | | 181 | | | | 365 | |
Class C | | $ | 1,000.00 | | | $ | 1,040.70 | | | $ | 10.37 | | | $ | 1,000.00 | | | $ | 1,014.63 | | | $ | 10.24 | | | | 2.05 | % | | | 181 | | | | 365 | |
Class I(1) | | $ | 1,000.00 | | | $ | 971.00 | | | $ | 0.75 | | | $ | 1,000.00 | | | $ | 1,003.35 | | | $ | 0.77 | | | | 0.93 | % | | | 30 | | | | 365 | |
Class R3 | | $ | 1,000.00 | | | $ | 1,043.90 | | | $ | 7.60 | | | $ | 1,000.00 | | | $ | 1,017.36 | | | $ | 7.50 | | | | 1.50 | % | | | 181 | | | | 365 | |
Class R4 | | $ | 1,000.00 | | | $ | 1,045.50 | | | $ | 6.09 | | | $ | 1,000.00 | | | $ | 1,018.84 | | | $ | 6.01 | | | | 1.20 | % | | | 181 | | | | 365 | |
Class R5 | | $ | 1,000.00 | | | $ | 1,046.80 | | | $ | 4.57 | | | $ | 1,000.00 | | | $ | 1,020.33 | | | $ | 4.51 | | | | 0.90 | % | | | 181 | | | | 365 | |
Class Y | | $ | 1,000.00 | | | $ | 1,047.30 | | | $ | 4.31 | | | $ | 1,000.00 | | | $ | 1,020.58 | | | $ | 4.26 | | | | 0.85 | % | | | 181 | | | | 365 | |
| (1) | Commenced operations on March 31, 2015. |
The Hartford SmallCap Growth Fund
| | | | | | | | | | | | | | | | | | | | | | | | | | | | | | | | | | | | |
| | | Actual Return | | | Hypothetical (5% return before expenses) | | | | | | | | | | |
| | | Beginning
Account
Value
November 1,
2014 | | | Ending
Account
Value
April 30,
2015 | | | Expenses paid
during the period
November 1, 2014
through April 30,
2015 | | | Beginning
Account
Value
November 1,
2014 | | | Ending
Account
Value
April 30,
2015 | | | Expenses paid
during the period
November 1, 2014
through April 30,
2015 | | | Annualized
expense
ratio | | | Days in
the
current
1/2 year | | | Days in
the full
year | |
Class A | | $ | 1,000.00 | | | $ | 1,082.60 | | | $ | 6.20 | | | $ | 1,000.00 | | | $ | 1,018.84 | | | $ | 6.01 | | | | 1.20 | % | | | 181 | | | | 365 | |
Class B | | $ | 1,000.00 | | | $ | 1,077.70 | | | $ | 10.61 | | | $ | 1,000.00 | | | $ | 1,014.58 | | | $ | 10.29 | | | | 2.06 | % | | | 181 | | | | 365 | |
Class C | | $ | 1,000.00 | | | $ | 1,078.70 | | | $ | 9.79 | | | $ | 1,000.00 | | | $ | 1,015.37 | | | $ | 9.49 | | | | 1.90 | % | | | 181 | | | | 365 | |
Class I | | $ | 1,000.00 | | | $ | 1,084.30 | | | $ | 4.65 | | | $ | 1,000.00 | | | $ | 1,020.33 | | | $ | 4.51 | | | | 0.90 | % | | | 181 | | | | 365 | |
Class R3 | | $ | 1,000.00 | | | $ | 1,080.90 | | | $ | 7.64 | | | $ | 1,000.00 | | | $ | 1,017.46 | | | $ | 7.40 | | | | 1.48 | % | | | 181 | | | | 365 | |
Class R4 | | $ | 1,000.00 | | | $ | 1,082.80 | | | $ | 5.99 | | | $ | 1,000.00 | | | $ | 1,019.04 | | | $ | 5.81 | | | | 1.16 | % | | | 181 | | | | 365 | |
Class R5 | | $ | 1,000.00 | | | $ | 1,084.30 | | | $ | 4.44 | | | $ | 1,000.00 | | | $ | 1,020.53 | | | $ | 4.31 | | | | 0.86 | % | | | 181 | | | | 365 | |
Class R6(1) | | $ | 1,000.00 | | | $ | 1,078.60 | | | $ | 3.72 | | | $ | 1,000.00 | | | $ | 1,019.98 | | | $ | 3.62 | | | | 0.76 | % | | | 172 | | | | 365 | |
Class Y | | $ | 1,000.00 | | | $ | 1,084.90 | | | $ | 3.93 | | | $ | 1,000.00 | | | $ | 1,021.03 | | | $ | 3.81 | | | | 0.76 | % | | | 181 | | | | 365 | |
| (1) | Commenced operations on November 7, 2014. |
|
| Hartford Funds – Domestic Equity Funds |
Expense Examples (Unaudited) – (continued)
The Hartford Value Opportunities Fund
| | | | | | | | | | | | | | | | | | | | | | | | | | | | | | | | | | | | |
| | | Actual Return | | | Hypothetical (5% return before expenses) | | | | | | | | | | |
| | | Beginning
Account
Value
November 1,
2014 | | | Ending
Account
Value
April 30,
2015 | | | Expenses paid
during the period
November 1, 2014
through April 30,
2015 | | | Beginning
Account
Value
November 1,
2014 | | | Ending
Account
Value
April 30,
2015 | | | Expenses paid
during the period
November 1, 2014
through April 30,
2015 | | | Annualized
expense
ratio | | | Days in
the
current
1/2 year | | | Days in
the full
year | |
Class A | | $ | 1,000.00 | | | $ | 1,052.60 | | | $ | 6.16 | | | $ | 1,000.00 | | | $ | 1,018.79 | | | $ | 6.06 | | | | 1.21 | % | | | 181 | | | | 365 | |
Class B | | $ | 1,000.00 | | | $ | 1,048.60 | | | $ | 10.06 | | | $ | 1,000.00 | | | $ | 1,014.98 | | | $ | 9.89 | | | | 1.98 | % | | | 181 | | | | 365 | |
Class C | | $ | 1,000.00 | | | $ | 1,048.80 | | | $ | 9.75 | | | $ | 1,000.00 | | | $ | 1,015.27 | | | $ | 9.59 | | | | 1.92 | % | | | 181 | | | | 365 | |
Class I | | $ | 1,000.00 | | | $ | 1,054.50 | | | $ | 4.69 | | | $ | 1,000.00 | | | $ | 1,020.23 | | | $ | 4.61 | | | | 0.92 | % | | | 181 | | | | 365 | |
Class R3 | | $ | 1,000.00 | | | $ | 1,051.40 | | | $ | 7.48 | | | $ | 1,000.00 | | | $ | 1,017.51 | | | $ | 7.35 | | | | 1.47 | % | | | 181 | | | | 365 | |
Class R4 | | $ | 1,000.00 | | | $ | 1,053.30 | | | $ | 5.96 | | | $ | 1,000.00 | | | $ | 1,018.99 | | | $ | 5.86 | | | | 1.17 | % | | | 181 | | | | 365 | |
Class R5 | | $ | 1,000.00 | | | $ | 1,054.40 | | | $ | 4.43 | | | $ | 1,000.00 | | | $ | 1,020.48 | | | $ | 4.36 | | | | 0.87 | % | | | 181 | | | | 365 | |
Class Y | | $ | 1,000.00 | | | $ | 1,054.80 | | | $ | 4.02 | | | $ | 1,000.00 | | | $ | 1,020.88 | | | $ | 3.96 | | | | 0.79 | % | | | 181 | | | | 365 | |
|
| Hartford Funds – Domestic Equity Funds |
Main Risks (Unaudited)
The main risks of investing in each Fund are described below. Each Fund’s Prospectus contains further information on the risks applicable to that Fund.
Active Trading Risk: (All Funds except Dividend and Growth Fund, Equity Income Fund, Healthcare Fund, MidCap Fund, MidCap Value Fund and Value Opportunities Fund) Actively trading investments may result in higher costs and higher taxable income.
Asset Allocation Strategy Risk: (Capital Appreciation Fund only) The portfolio managers’ asset allocation strategy may not always work as intended, and asset allocation does not guarantee better performance or reduce the risk of investment loss.
Dividend Paying Security Investment Risk: (Dividend and Growth Fund and Equity Income Fund only) Dividends are not guaranteed and are subject to change. Dividend paying securities as a group can fall out of favor with the market, causing a Fund to underperform.
Foreign Investment Risk: Investments in foreign securities may be riskier than investments in U.S. securities. Potential risks include the risks of illiquidity, increased price volatility, less government regulation, less extensive and less frequent accounting and other reporting requirements, unfavorable changes in currency exchange rates, and economic and political disruptions.
Foreign Investment and Emerging Markets Risk: Investments in foreign securities may be riskier than investments in U.S. securities. Potential risks include the risks of illiquidity, increased price volatility, less government regulation, less extensive and less frequent accounting and other reporting requirements, unfavorable changes in currency exchange rates, and economic and political disruptions. These risks are generally greater for investments in emerging markets.
Growth Investing Risk: (Growth Opportunities Fund, Small Company Fund and SmallCap Growth Fund only) Growth investments can be volatile, and may fail to increase earnings or grow as quickly as anticipated. Growth-style investing falls in and out of favor, which may result in periods of underperformance.
Health Sector Risk: (Healthcare Fund only) Risks of focusing investments on the health care sector include regulatory and legal developments, patent considerations, intense competitive pressures, rapid technological changes and potential product obsolescence, and liquidity risk.
Market, Selection and Strategy Risk: A Fund’s share price may fluctuate due to market risk and/or security selections that may underperform the market or relevant benchmarks. If the sub-adviser’s investment strategy does not perform as expected, a Fund could underperform its peers or lose money. There is no guarantee a Fund will achieve its stated objective.
Mid-Cap Stock Risk: (Capital Appreciation Fund, Growth Opportunities Fund, MidCap Fund and MidCap Value Fund only) Mid-cap stocks are generally more volatile and risky and may be less liquid than large-cap stocks because they may have limited operating histories, narrow product lines, and focus on niche markets.
Quantitative Analysis Risk: (Core Equity Fund and Small/Mid Cap Fund only) Certain Funds use quantitative analysis in its securities selection; securities selected by this method may perform differently from the broader stock market.
Small-Cap Stock Risk: (Small Company Fund and SmallCap Growth Fund) Small-cap stocks are generally more volatile and risky and may be less liquid than large-cap stocks because they may have limited operating histories, narrow product lines, and focus on niche markets.
Small/Mid-Cap Stock Risk: (Healthcare Fund, Small/Mid Cap Equity Fund and Value Opportunities Fund only) Small- and mid-cap stocks are generally more volatile and risky and may be less liquid than large-cap stocks because they may have limited operating histories, narrow product lines, and focus on niche markets.
Value Investing Risk: (Equity Income Fund, MidCap Value Fund and Value Opportunities Fund only) Value investments are considered to be undervalued, but they may never attain their potential value. Value-style investing falls in and out of favor, which may result in periods of underperformance.
THIS PRIVACY POLICY IS NOT PART OF THIS REPORT
Privacy Policy and Practices of The Hartford Financial Services Group, Inc. and its Affiliates
(herein called “we, our and us”)
This Privacy Policy applies to our United States Operations
We value your trust. We are committed to the responsible:
a) management;
b) use; and
c) protection;
of Personal Information.
This notice describes how we collect, disclose, and protect Personal Information.
We collect Personal Information to:
a) service your Transactions with us; and
b) support our business functions.
We may obtain Personal Information from:
a) You;
b) your Transactions with us; and
c) third parties such as a consumer-reporting agency.
Based on the type of product or service You apply for or get from us, Personal Information such as:
a) your name;
b) your address;
c) your income;
d) your payment; or
e) your credit history;
may be gathered from sources such as applications, Transactions, and consumer reports.
To serve You and service our business, we may share certain Personal Information. We will share Personal Information, only as allowed by law, with affiliates such as:
a) our insurance companies;
b) our employee agents;
c) our brokerage firms; and
d) our administrators.
As allowed by law, we may share Personal Financial Information with our affiliates to:
a) market our products; or
b) market our services;
to You without providing You with an option to prevent these disclosures.
We may also share Personal Information, only as allowed by law, with unaffiliated third parties including:
a) independent agents;
b) brokerage firms;
c) insurance companies;
d) administrators; and
e) service providers;
who help us serve You and service our business.
When allowed by law, we may share certain Personal Financial Information with other unaffiliated third parties who assist us by performing services or functions such as:
a) taking surveys;
b) marketing our products or services; or
c) offering financial products or services under a joint agreement between us and one or more financial institutions.
We, and third parties we partner with, may track some of the pages You visit through the use of:
a) cookies;
b) pixel tagging; or
c) other technologies;
and currently do not process or comply with any web browser’s “do not track” signal or similar mechanism that indicates a request to disable online tracking of individual users who visit our websites or use our services.
We will not sell or share your Personal Financial Information with anyone for purposes unrelated to our business functions without offering You the opportunity to:
a) “opt-out;” or
b) “opt-in;”
as required by law.
We only disclose Personal Health Information with:
a) your proper written authorization; or
b) as otherwise allowed or required by law.
Our employees have access to Personal Information in the course of doing their jobs, such as:
a) underwriting policies;
b) paying claims;
c) developing new products; or
d) advising customers of our products and services.
We use manual and electronic security procedures to maintain:
a) the confidentiality; and
b) the integrity of;
Personal Information that we have. We use these procedures to guard against unauthorized access.
Some techniques we use to protect Personal Information include:
a) secured files;
b) user authentication;
c) encryption;
d) firewall technology; and
e) the use of detection software.
We are responsible for and must:
a) identify information to be protected;
b) provide an adequate level of protection for that data;
c) grant access to protected data only to those people who must use it in the performance of their job-related duties.
Employees who violate our Privacy Policy will be subject to discipline, which may include ending their employment with us.
At the start of our business relationship, we will give You a copy of our current Privacy Policy.
We will also give You a copy of our current Privacy Policy once a year if You maintain a continuing business relationship with us.
We will continue to follow our Privacy Policy regarding Personal Information even when a business relationship no longer exists between us.
As used in this Privacy Notice:
Application means your request for our product or service.
Personal Financial Information means financial information such as:
a) credit history;
b) income;
c) financial benefits; or
d) policy or claim information.
Personal Health Information means health information such as:
a) your medical records; or
b) information about your illness, disability or injury.
Personal Information means information that identifies You personally and is not otherwise available to the public. It includes:
a) Personal Financial Information; and
b) Personal Health Information .
Transaction means your business dealings with us, such as:
a) your Application;
b) your request for us to pay a claim; and
c) your request for us to take an action on your account.
You means an individual who has given us Personal Information in conjunction with:
a) asking about;
b) applying for; or
c) obtaining;
a financial product or service from us if the product or service is used mainly for personal, family, or household purposes.
This Privacy Policy is being provided on behalf of the following affiliates of The Hartford Financial Services Group, Inc.:
1stAGChoice, Inc.; Access CoverageCorp, Inc.; Access CoverageCorp Technologies, Inc.; American Maturity Life Insurance Company; Archway 60 R, LLC; Business Management Group, Inc.; DMS R, LLC; First State Insurance Company; Fountain Investors I LLC; Fountain Investors II LLC; Fountain Investors III LLC; Fountain Investors IV LLC; FTC
Resolution Company LLC; Hart Re Group L.L.C.; Hartford Accident and Indemnity Company; Hartford Administrative Services Company; Hartford Casualty General Agency, Inc.; Hartford Casualty Insurance Company; Hartford Financial Services, LLC; Hartford Fire General Agency, Inc.; Hartford Fire Insurance Company; Hartford Funds Distributors, LLC; Hartford Funds Management Company, LLC; Hartford Funds Management Group, Inc.; Hartford Holdings, Inc.; Hartford HLS Series Fund II, Inc.; Hartford Insurance Company of Illinois; Hartford Insurance Company of the Midwest; Hartford Insurance Company of the Southeast; Hartford Integrated Technologies, Inc.; Hartford International Life Reassurance Corporation; Hartford Investment Management Company; Hartford Life and Accident Insurance Company; Hartford Life and Annuity Insurance Company; Hartford Life Insurance Company; Hartford Life, Inc.; Hartford Life International Holding Company; Hartford Life Private Placement, LLC; Hartford Lloyd’s Corporation; Hartford Lloyd’s Insurance Company; Hartford of Texas General Agency, Inc.; Hartford Residual Market, L.C.C.; Hartford Securities Distribution Company, Inc.; Hartford Series Fund, Inc.; Hartford Specialty Insurance Services of Texas, LLC; Hartford Strategic Investments, LLC; Hartford Underwriters General Agency, Inc.; Hartford Underwriters Insurance Company; Hartford-Comprehensive Employee Benefit Service Company; HDC R, LLC .; Heritage Holdings, Inc.; HIMCO Distribution Services Company; HIMCO Variable Insurance Trust; HLA LLC; HL Investment Advisors, LLC; Horizon Management Group, LLC; HRA Brokerage Services, Inc.; Lanidex Class B, LLC; New England Insurance Company; New England Reinsurance Corporation; Nutmeg Insurance Agency, Inc.; Nutmeg Insurance Company; Pacific Insurance Company, Limited; Planco, LLC; Property and Casualty Insurance Company of Hartford; Revere R, LLC; RVR R, LLC; Sentinel Insurance Company, Ltd.; Sunstone R, LLC; Symphony R, LLC; The Evergreen Group Incorporated; The Hartford Alternative Strategies Fund; The Hartford Mutual Funds, Inc.; The Hartford Mutual Funds II, Inc.; Trumbull Flood Management, L.L.C.; Trumbull Insurance Company; Twin City Fire Insurance Company.
HPP Revised February 2015

This report is submitted for the general information of the shareholders of the Funds referenced in this report. It is not authorized for distribution to persons who are not shareholders of one or more Funds referenced in this report unless preceded or accompanied by a current prospectus for the relevant Funds. Nothing herein contained is to be considered an offer of sale or a solicitation of an offer to buy shares of any Fund listed in this report. Such offering is only made by prospectus, which includes details as to the offering price and other material information.
The information cannot be used or relied upon for the purpose of avoiding IRS penalties. These materials are not intended to provide tax, accounting or legal advice. As with all matters of a tax or legal nature, you should consult your own tax or legal counsel for advice.
Investors should carefully consider the investment objectives, risks, charges, and expenses of Hartford Funds before investing. This and other information can be found in the prospectus and summary prospectus, which can be obtained by calling 888-843-7824 (or 800-279-1541 for institutional investors). Investors should read them carefully before they invest.
Hartford Funds are underwritten and distributed by Hartford Funds Distributors, LLC.
| | | | |
MFSAR-DE15 6/15 117962 Printed in U.S.A. | | | | hartfordfunds.com |
| | |
| | | |
 | | A MESSAGE FROM THE PRESIDENT Dear Fellow Shareholders: Thank you for investing in Hartford Funds. Market Review The now six-year-old bull market in equities continued through the six months ended April 30, 2015, the period of this report, after notching its sixth-consecutive calendar year of positive returns in 2014. From its financial-crisis low in March 2009, the S&P 500 Index1 has grown more than 200%. Returns have been modest so far in 2015, with the S&P 500 Index gaining just less than 2% through April, yet the Index generally managed to stay in positive territory during the period. |
A stronger U.S. dollar, a result of divergent domestic and foreign central-bank policies, and cheaper oil, due to a supply glut unmatched by demand, were market drivers during the period.
In addition, central banks around the globe continue to play an important role in influencing investor and market movement.
On the domestic front, the U.S. Federal Reserve (Fed) ended its bond-buying quantitative-easing (QE) program in late 2014. Now, investor focus is centered on Fed meetings to determine the timeline for future rate hikes, which is dependent on the rate of economic growth, employment rates, and inflation expectations. Currently, rate increases are expected to take place in late 2015. When the Fed begins to raise rates, the shift is likely to be felt by fixed-income investors in particular, as bonds are generally more sensitive to shifting rates than equities.
Though QE ended in the U.S., it is still in use overseas. The Bank of Japan ramped up their existing QE program to stimulate growth by increasing the amount of purchases in their bond-buying program. The European Central Bank started its own program of bond purchases in early 2015 to lower borrowing costs in hopes of stimulating the sluggish economies in the Eurozone. In particular, Greece remains a source of concern as it tries to negotiate its debt repayment to satisfy its creditors.
As the second half of the year approaches, the continuing role of central banks and macroeconomic events in financial markets serves as an important reminder to maintain a strong relationship with a financial advisor who can help guide you through shifting markets with confidence. Whether you’re seeking growth, income, or a way to mitigate volatility with your investments, your financial advisor can help you find a fit within our family of more than 45 mutual funds that were designed with you, and your investment goals, in mind.
Thank you again for investing with Hartford Funds.

James Davey
President
Hartford Funds
| 1 | The S&P 500 Index is a market capitalization-weighted price index composed of 500 widely held common stocks. |
Hartford Funds – Tax-Exempt Fixed Income Funds
Table of Contents
The views expressed in each Fund’s Manager Discussion under “Why did the Fund perform this way?” and “What is the outlook?” are views of the Fund’s sub-adviser and portfolio management team through the end of the period and are subject to change based on market and other conditions. Each Fund’s Manager Discussion is for informational purposes only and does not represent an offer, recommendation or solicitation to buy, hold or sell any security. The specific securities identified and described, if any, do not represent all of the securities purchased or sold and you should not assume that investments in the securities identified and discussed will be profitable.
The Hartford Municipal Opportunities Fund inception 05/31/2007
| | |
| (sub-advised by Wellington Management Company LLP) | | Investment objective – The Fund seeks to provide current income that is generally exempt from federal income taxes and long-term total return. |
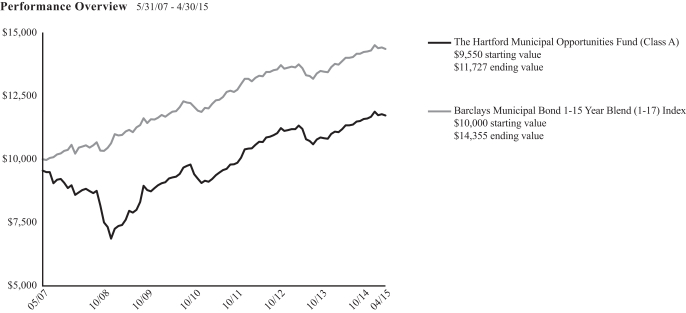
The chart above represents the hypothetical growth of a $10,000 investment in Class A, which includes a sales charge. Growth results in classes other than Class A will vary from what is seen above due to differences in the expenses charged to those share classes.
Average Annual Total Return (as of 4/30/15)
| | | | | | | | | | | | | | | | |
| | | 6 Months1 | | | 1 Year | | | 5 Years | | | Since
Inception2 | |
Municipal Opportunities A3 | | | 1.24% | | | | 4.79% | | | | 4.89% | | | | 2.63% | |
Municipal Opportunities A4 | | | -3.32% | | | | 0.07% | | | | 3.93% | | | | 2.03% | |
Municipal Opportunities B3 | | | 0.74% | | | | 3.89% | | | | 4.10% | | | | 1.83% | 5 |
Municipal Opportunities B4 | | | -4.25% | | | | -1.11% | | | | 3.76% | | | | 1.83% | 5 |
Municipal Opportunities C3 | | | 0.86% | | | | 4.01% | | | | 4.13% | | | | 1.87% | |
Municipal Opportunities C4 | | | -0.14% | | | | 3.01% | | | | 4.13% | | | | 1.87% | |
Municipal Opportunities I3 | | | 1.36% | | | | 5.04% | | | | 5.16% | | | | 2.90% | |
Barclays Municipal Bond 1-15 Year Blend (1-17) Index | | | 0.84% | | | | 3.46% | | | | 4.02% | | | | 4.67% | |
| 5 | Class B shares convert to Class A shares after 8 years. The return shown reflects the conversion to Class A shares, which had different operating expenses, for the period after conversion. |
PERFORMANCE DATA QUOTED REPRESENTS PAST PERFORMANCE AND DOES NOT GUARANTEE FUTURE RESULTS. The investment return and principal value of the investment will fluctuate so that investors’ shares, when redeemed, may be worth more or less than their original cost. Current performance may be lower or higher than the performance data quoted. To obtain performance data current to the most recent month-end, please visit our website www.hartfordfunds.com.
The initial investment in Class A shares reflects the maximum sales charge of 4.50% and returns for Class B shares reflect a contingent deferred sales charge of up to 5.00% and declining to zero, depending on the period of time the shares are held. Returns for Class C shares reflect a contingent deferred sales charge of up to 1.00% on shares redeemed within twelve months of purchase.
Total returns presented above were calculated using the Fund’s net asset value available to shareholders for sale or redemption of Fund shares on April 30, 2015, which may exclude investment transactions as of this date. All share class returns assume the reinvestment of all distributions at net asset value and the deduction of all fund expenses.
Effective 9/30/09, Class B shares of the Fund were closed to new investments.
Performance information includes performance under the Fund’s previous sub-adviser, Hartford Investment Management Company, using a modified investment strategy. As of March 5, 2012, Hartford Investment Management Company no longer served as the sub-adviser to the Fund.
Barclays Municipal Bond 1-15 Year Blend (1-17) Index is a sub-index of the Barclays Municipal Bond Index. It is a rules-based market value-weighted index of bonds with maturities of one year to 17 years engineered for the tax-exempt bond market.
You cannot invest directly in an index.
The chart and table do not reflect the deductions of taxes that a shareholder would pay on Fund distributions or the redemption of Fund shares.
Performance information may reflect historical or current expense waivers/reimbursements from the investment adviser, without which performance would have been lower. For information on current expense waivers/reimbursements, please see the prospectus.
|
| The Hartford Municipal Opportunities Fund |
Manager Discussion
April 30, 2015 (Unaudited)
Operating Expenses*
| | | | | | | | |
| | | Net | | | Gross | |
Municipal Opportunities Class A | | | 0.69% | | | | 0.90% | |
Municipal Opportunities Class B | | | 1.44% | | | | 1.72% | |
Municipal Opportunities Class C | | | 1.44% | | | | 1.66% | |
Municipal Opportunities Class I | | | 0.44% | | | | 0.65% | |
| * | As shown in the Fund’s current prospectus dated March 1, 2015, as supplemented June 1, 2015. Actual expenses may be higher or lower. Please see accompanying Financial Highlights for expense ratios for the six-month period ended April 30, 2015. |
Gross expenses are the Fund’s total annual operating expenses shown in the Fund’s most recent prospectus. Net expenses are the Fund’s total annual operating expenses shown in the Fund’s most recent prospectus and reflect contractual expense reimbursements in instances when these reductions reduce the Fund’s gross expenses. Contractual reimbursements remain in effect until February 29, 2016, and automatically renew for one-year terms unless terminated.
The Fund filed an updated prospectus, dated June 1, 2015, with the U.S. Securities and Exchange Commission that became effective on that date. However, the information in this semiannual report is as of April 30, 2015 and does not reflect any changes made to the total annual fund operating expense table in the June 1, 2015 prospectus. The net expense ratios shown in the June 1, 2015 prospectus are 0.69%, 1.44%, 1.44% and 0.44% for Class A, Class B, Class C and Class I, respectively, and reflect contractual expense reimbursements in place until February 29, 2016. The gross expense ratios shown in the June 1, 2015 prospectus are 0.70%, 1.52%, 1.46% and 0.45% for Class A, Class B, Class C and Class I, respectively.
All investments are subject to risk including the possible loss of principal. For a discussion of the Fund’s risks, please see the Main Risks section of this report. For more detailed information on the risks associated with an investment in the Fund, please see the prospectus.
Timothy D. Haney, CFA
Senior Managing Director and Fixed Income Portfolio Manager
Wellington Management Company LLP
Brad W. Libby
Managing Director and Fixed Income Portfolio Manager/Credit Analyst
Wellington Management Company LLP
How did the Fund perform?
The Class A shares of The Hartford Municipal Opportunities Fund returned 1.24%, before sales charge, for the six-month period ended April 30, 2015, outperforming the Fund’s Index, the Barclays Municipal Bond 1-15 Year Blend (1-17) Index , which returned 0.84% for the same period. The Fund also outperformed the 0.57% average return of the Lipper Intermediate Municipal Debt Funds peer group, a group of funds with investment strategies similar to those of the Fund.
Why did the Fund perform this way?
Over the period, global central banks maintained easy monetary policies with some resorting to radical measures to counter falling inflation and stimulate growth. The European Central Bank (ECB) launched an unprecedented open-ended government bond-buying program, which prompted other central banks to act to stop their currencies from appreciating. China’s central bank cut interest rates for the first time in two years. Meanwhile, the U.S. Federal Reserve (Fed) charted a course for policy normalization (i.e. bringing interest rates to historically normal levels) and the Bank of England debated the risk of deflation and whether the next interest rate move would be up or down.
The U.S. economy proved generally resilient over the period while growth in Europe, Japan, and China weakened. European data in particular disappointed, especially in core countries like Germany; however, there were signs of improvement later in the period. China continued to face conditions that may make future growth difficult from weakening domestic demand and a slumping real estate sector. In Japan, Prime Minister Shinzo Abe postponed a proposed second sales tax increase after the first tax increase in April of 2014 pushed the country into recession during the third quarter of 2014. The U.S. economy’s positive growth trend remained in place at the beginning of the period before the harsh winter weather, West Coast port disruptions, and the effects of a stronger U.S. dollar all acted to slow activity in the first quarter. However, there was continued strength in the labor market with further declines in the unemployment rate. Annual consumer price inflation turned negative for the first time since 2009 mainly because of the steep fall in energy costs.
Global government bond prices gained over the period as subpar growth and deflationary pressures kept central banks in easing mode. European government bond yields hit record lows with many moving to negative yields due to the ECB’s monetary stimulus. In
|
| The Hartford Municipal Opportunities Fund |
Manager Discussion – (continued)
April 30, 2015 (Unaudited)
the U.S., yields largely declined amid expectations that the Fed will take its time in raising interest rates. Longer-term Treasury yields declined the most, resulting in a flattening of the yield curve.
Absolute returns across the major fixed income sectors were positive as the decline in government bond yields offset the credit-spread widening in certain sectors such as high yield and emerging markets. However, credit-sensitive sectors generally underperformed duration-equivalent government bonds.
The yield on 10-year AAA rated general obligation municipal bonds (GOs) moved above those of 10-year Treasuries during the six-month period, as the GO-to-Treasury yield ratio rose from 89% to 103%. Technicals were somewhat weaker during the period, with negative tax-season mutual fund flows and continued strong issuance driven by refundings. However, we do expect demand to rebound by summer. Municipal credit spreads continued to tighten over the period, but remained attractive relative to corporates on an after-tax basis.
The Fund’s allocation to and security selection within high yield revenue bonds was the primary driver of outperformance relative to the Barclays Municipal Bond 1-15 Year Blend (1-17) Index during the period, largely due to selection within the Tobacco and Healthcare sectors. Security selection within Investment Grade Revenue Bonds, specifically within the Lease sector, and within Investment Grade Local General Obligation (GO) Bonds also contributed to outperformance relative to the Barclays Municipal Bond 1-15 Year Blend (1-17) Index. Duration and yield curve positioning contributed to outperformance relative to the Barclays Municipal Bond 1-15 Year Blend (1-17) Index, largely due to our overweights to the 10-year and 20-year portions of the curve, as rates fell significantly over the period.
Derivatives were not used in a significant manner in this Fund during the period and did not have a material impact on performance during the period.
What is the outlook?
We expect U.S. economic momentum to be positive for the remainder of 2015, although the global economic backdrop may pose a risk. We expect a slow increase in rates as the Fed moves policy and ended the quarter with a moderately pro-cyclical risk posture. We believe fundamentals are good for the broad universe of municipal credits, with modest revenue growth and ongoing balance sheet repair at most states and municipalities. High-grade municipals appear cheap relative to Treasuries, particularly from 10 years out. Traffic on toll roads has surprised to the upside, while airports continue to see modest positive traffic growth.
In Healthcare, early results under the Affordable Care Act are very positive, as higher coverage levels for the patient population flow through to hospitals’ bottom lines. We expect revenue bond
fundamentals to remain positive in the near-to medium-term and continue to favor credits in this area, especially special-tax, toll-road, airport, and health care.
The Hartford Municipal Real Return Fund inception 06/02/1986
| | |
| (sub-advised by Wellington Management Company LLP) | | Investment objective – The Fund seeks to provide current income exempt from federal income tax and after-tax inflation-adjusted total returns. |
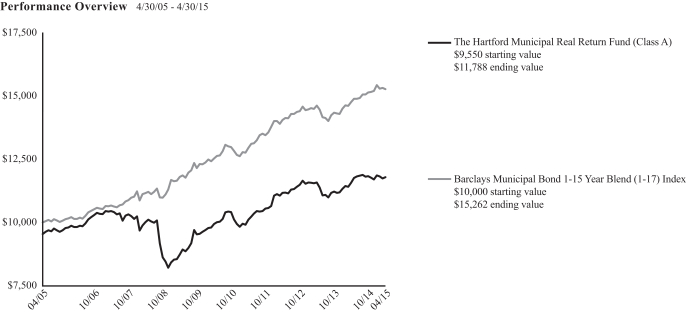
The chart above represents the hypothetical growth of a $10,000 investment in Class A, which includes a sales charge. Growth results in classes other than Class A will vary from what is seen above due to differences in the expenses charged to those share classes.
Average Annual Total Return (as of 4/30/15)
| | | | | | | | | | | | | | | | |
| | | 6 Months1 | | | 1 Year | | | 5 Years | | | 10 Years | |
Municipal Real Return A2 | | | -0.41% | | | | 1.86% | | | | 3.46% | | | | 2.13% | |
Municipal Real Return A3 | | | -4.89% | | | | -2.73% | | | | 2.51% | | | | 1.66% | |
Municipal Real Return B2 | | | -0.67% | | | | 1.12% | | | | 2.72% | | | | 1.52% | 4 |
Municipal Real Return B3 | | | -5.59% | | | | -3.83% | | | | 2.36% | | | | 1.52% | 4 |
Municipal Real Return C2 | | | -0.78% | | | | 1.11% | | | | 2.71% | | | | 1.38% | |
Municipal Real Return C3 | | | -1.76% | | | | 0.12% | | | | 2.71% | | | | 1.38% | |
Municipal Real Return I2 | | | -0.28% | | | | 2.21% | | | | 3.75% | | | | 2.36% | |
Municipal Real Return Y2 | | | -0.28% | | | | 2.23% | | | | 3.77% | | | | 2.37% | |
Barclays Municipal Bond 1-15 Year Blend (1-17) Index | | | 0.84% | | | | 3.46% | | | | 4.02% | | | | 4.32% | |
| 4 | Class B shares convert to Class A shares after 8 years. The return shown reflects the conversion to Class A shares, which had different operating expenses, for the period after conversion. |
PERFORMANCE DATA QUOTED REPRESENTS PAST PERFORMANCE AND DOES NOT GUARANTEE FUTURE RESULTS. The investment return and principal value of the investment will fluctuate so that investors’ shares, when redeemed, may be worth more or less than their original cost. Current performance may be lower or higher than the performance data quoted. To obtain performance data current to the most recent month-end, please visit our website www.hartfordfunds.com.
The initial investment in Class A shares reflects the maximum sales charge of 4.50% and returns for Class B shares reflect a contingent deferred sales charge of up to 5.00% and declining to zero, depending on the period of time the shares are held.
Returns for Class C shares reflect a contingent deferred sales charge of up to 1.00% on shares redeemed within twelve months of purchase.
Total returns presented above were calculated using the Fund’s net asset value available to shareholders for sale or redemption of Fund shares on April 30, 2015, which may exclude investment transactions as of this date. All share class returns assume the reinvestment of all distributions at net asset value and the deduction of all fund expenses.
Effective 9/30/09, Class B shares of the Fund were closed to new investments.
Class I shares commenced operations on 5/31/07. Performance prior to that date is that of the Fund’s Class A shares (excluding sales charges), which had different operating expenses.
Performance information includes performance under the Fund’s previous sub-adviser, Hartford Investment Management Company, using a modified investment strategy. As of March 5, 2012, Hartford Investment Management Company no longer served as the sub-adviser to the Fund.
Barclays Municipal Bond 1-15 Year Blend (1-17) Index is a sub-index of the Barclays Municipal Bond Index. It is a rules-based market value-weighted index of bonds with maturities of one year to 17 years engineered for the tax-exempt bond market.
You cannot invest directly in an index.
The chart and table do not reflect the deductions of taxes that a shareholder would pay on Fund distributions or the redemption of Fund shares.
Performance information may reflect historical or current expense waivers/reimbursements from the investment adviser, without which performance would have been lower. For information on current expense waivers/reimbursements, please see the prospectus.
|
| The Hartford Municipal Real Return Fund |
Manager Discussion
April 30, 2015 (Unaudited)
Operating Expenses*
| | | | | | | | |
| | | Net | | | Gross | |
Municipal Real Return Class A | | | 0.69% | | | | 0.90% | |
Municipal Real Return Class B | | | 1.44% | | | | 1.73% | |
Municipal Real Return Class C | | | 1.44% | | | | 1.64% | |
Municipal Real Return Class I | | | 0.44% | | | | 0.66% | |
Municipal Real Return Class Y | | | 0.44% | | | | 0.60% | |
| * | As shown in the Fund’s current prospectus dated March 1, 2015, as supplemented June 1, 2015. Actual expenses may be higher or lower. Please see accompanying Financial Highlights for expense ratios for the six-month period ended April 30, 2015. |
Gross expenses are the Fund’s total annual operating expenses shown in the Fund’s most recent prospectus. Net expenses are the Fund’s total annual operating expenses shown in the Fund’s most recent prospectus and reflect contractual expense reimbursements in instances when these reductions reduce the Fund’s gross expenses. Contractual reimbursements remain in effect until February 29, 2016, and automatically renew for one-year terms unless terminated.
The Fund filed an updated prospectus, dated June 1, 2015, with the U.S. Securities and Exchange Commission that became effective on that date. However, the information in this semiannual report is as of April 30, 2015 and does not reflect any changes made to the total annual fund operating expense table in the June 1, 2015 prospectus. The net expense ratios shown in the June 1, 2015 prospectus are 0.69%, 1.44%, 1.44%, 0.44% and 0.44% for Class A, Class B, Class C, Class I and Class Y, respectively, and reflect contractual expense reimbursements in place until February 29, 2016. The gross expense ratios shown in the June 1, 2015 prospectus are 0.75%, 1.58%, 1.49%, 0.51% and 0.45% for Class A, Class B, Class C, Class I and Class Y, respectively.
All investments are subject to risk including the possible loss of principal. For a discussion of the Fund’s risks, please see the Main Risks section of this report. For more detailed information on the risks associated with an investment in the Fund, please see the prospectus.
Timothy D. Haney, CFA
Senior Managing Director and Fixed Income Portfolio Manager
Wellington Management Company LLP
Brad W. Libby
Managing Director and Fixed Income Portfolio Manager/Credit Analyst
Wellington Management Company LLP
Lindsay T. Politi*
Managing Director and Fixed Income Portfolio Manager
Wellington Management Company LLP
Joseph F. Marvan, CFA**
Senior Managing Director and Fixed Income Portfolio Manager
Wellington Management Company LLP
How did the Fund perform?
The Class A shares of The Hartford Municipal Real Return Fund returned -0.41%, before sales charge, for the six-month period ended April 30, 2015, underperforming the Fund’s benchmark, the Barclays Municipal Bond 1-15 Year Blend (1-17) Index, which returned 0.84% for the same period. The Fund also underperformed the 0.57% average return of the Lipper Intermediate Municipal Debt Funds peer group, a group of funds with investment strategies similar to those of the Fund.
Why did the Fund perform this way?
Over the period, global central banks maintained easy monetary policies with some resorting to radical measures to counter falling
inflation and stimulate growth. The European Central Bank (ECB) launched an unprecedented open-ended government bond-buying program, which prompted other central banks to act to stop their currencies from appreciating. China’s central bank cut interest rates for the first time in two years. Meanwhile, the U.S. Federal Reserve (Fed) charted a course for policy normalization (i.e. bringing interest rates to historically normal levels) and the Bank of England debated the risk of deflation and whether the next interest rate move would be up or down.
The U.S. economy proved generally resilient over the period while growth in Europe, Japan, and China weakened. European data in
| * | Effective 5/7/2015, Ms. Politi is no longer a portfolio manager of the Fund. |
| ** | Mr. Marvan became a portfolio manager of the Fund effective May 6, 2015. |
|
| The Hartford Municipal Real Return Fund |
Manager Discussion – (continued)
April 30, 2015 (Unaudited)
particular disappointed, especially in core countries like Germany; however, there were signs of improvement later in the period. China continued to face conditions that may make future growth difficult from weakening domestic demand and a slumping real estate sector. In Japan, Prime Minister Shinzo Abe postponed a proposed second sales tax increase after the first tax increase in April pushed the country into recession during the third quarter of 2014. The U.S.
economy’s positive growth trend remained in place at the beginning of the period before the harsh winter weather, West Coast port disruptions, and the effects of a stronger U.S. dollar all acted to slow activity in the first quarter. However, there was continued strength in the labor market with further declines in the unemployment rate. Annual consumer price inflation turned negative for the first time since 2009 mainly because of the steep fall in energy costs.
Global government bond prices gained over the period as subpar growth and deflationary pressures kept central banks in easing mode. European government bond yields hit record lows with many moving to negative yields due to the ECB’s monetary stimulus. In the U.S., yields largely declined amid expectations that the Fed will take its time in raising interest rates. Longer-term Treasury yields declined the most, resulting in a flattening of the yield curve.
Absolute returns across the major fixed income sectors were positive as the decline in government bond yields offset the credit-spread widening in certain sectors such as high yield and emerging markets. However, credit-sensitive sectors generally underperformed duration-equivalent government bonds.
The yield on 10-year AAA rated general obligation municipal bonds (GOs) moved above those of 10-year Treasuries during the six-month period, as the GO-to-Treasury yield ratio rose from 89% to 103%. Technicals were somewhat weaker during the period, with negative tax-season mutual fund flows and continued strong issuance driven by refundings. However, we do expect demand to rebound by summer. Municipal credit spreads continued to tighten over the period, but remained attractive relative to corporates on an after-tax basis.
The Fund’s inflation overlay – which is implemented via CPI swap derivatives – was the main driver of relative underperformance during the period, as longer term inflation expectations decreased during the period. Security selection within investment grade revenue bonds contributed to returns relative to the Barclays Municipal Bond 1-15 Year Blend (1-17) Index, particularly within the lease, education, transportation, and special tax sectors. Security selection within investment grade general obligation (GO) bonds also contributed to relative performance over the period. Our allocation to and security selection within high yield revenue bonds was also additive over the period, in particular within the special tax and health care sectors.
What is the outlook?
We expect U.S. economic momentum to be positive for the remainder of 2015, although the global economic backdrop may pose a risk. We expect a slow increase in rates as the Fed moves policy and ended the quarter with a moderately pro-cyclical risk posture. We believe fundamentals are good for the broad universe of municipal credits, with modest revenue growth and ongoing balance sheet repair at most states and municipalities. High-grade municipals appear cheap relative to Treasuries, particularly from 10 years out. Traffic on toll roads has surprised to the upside, while airports continue to see modest positive traffic growth.
In Healthcare, early results under the Affordable Care Act are very positive, as higher coverage levels for the patient population flow through to hospitals’ bottom lines. We expect revenue bond fundamentals to remain positive in the near-to medium-term and continue to favor credits in this area, especially special-tax, toll-road, airport, and health care.
With regard to inflation, in the short term we expect sustained low energy prices to continue to weigh on realized inflation and inflation expectations. Longer term, we believe there are more upward pressures on core inflation in the U.S. and that longer-term inflation breakeven rates, which can be regarded as a proxy for the market’s inflation expectations, are compelling. We expect the Fed to begin raising rates later this year, as employment and wage growth suggest that the U.S. economy and labor market are strengthening despite weaker than expected first quarter indicators. We believe rising short term interest rates and an improving economic environment would be beneficial for bank loan investments.
We increased the portfolio’s inflation sensitivity during the period via the inflation overlay, with the hedge ratio, or inflation protection, at approximately 87% on a contribution to duration basis at the end of the period.
|
| The Hartford Municipal Opportunities Fund |
Credit Exposure
as of April 30, 2015 (Unaudited)
| | | | |
| Credit Rating* | | Percentage of
Net Assets | |
Aaa / AAA | | | 6.3 | % |
Aa / AA | | | 36.0 | |
A | | | 26.9 | |
Baa / BBB | | | 7.7 | |
Ba / BB | | | 2.0 | |
B | | | 4.6 | |
Not Rated | | | 12.9 | |
Short-Term Instruments | | | 2.1 | |
Other Assets & Liabilities | | | 1.5 | |
| | | | |
Total | | | 100.0 | % |
| | | | |
| * | Credit exposure is the long-term credit ratings for the Fund’s holdings, as of the date noted, as provided by Standard and Poor’s (S&P) or Moody’s Investors Service (Moody’s) and typically range from AAA/Aaa (highest) to C/D (lowest). Presentation of S&P and Moody’s credit ratings in this report have been selected for informational purposes for shareholders, as well as the Fund’s consideration of industry practice. If Moody’s and S&P assign different ratings, the lower rating is used. Fixed income securities that are not rated by either agency are listed as “Not Rated.” Ratings do not apply to the Fund itself or to the Fund’s shares. Ratings may change. |
Diversification by Industry
as of April 30, 2015 (Unaudited)
| | | | |
| Industry | | Percentage of
Net Assets | |
Airport | | | 6.2 | % |
Development | | | 5.8 | |
Education | | | 4.0 | |
Facilities | | | 1.5 | |
General | | | 16.2 | |
General Obligation | | | 9.1 | |
Higher Education | | | 2.5 | |
Medical | | | 16.1 | |
Mello-Roos | | | 0.5 | |
Multifamily Hsg | | | 0.2 | |
Nursing Homes | | | 4.4 | |
Pollution | | | 0.6 | |
Power | | | 3.7 | |
School District | | | 4.0 | |
Single Family Hsg | | | 0.5 | |
Tobacco | | | 4.7 | |
Transportation | | | 9.6 | |
Utilities | | | 0.8 | |
Water | | | 6.0 | |
Short-Term Investments | | | 2.1 | |
Other Assets & Liabilities | | | 1.5 | |
| | | | |
Total | | | 100.0 | % |
| | | | |
For Fund compliance purposes, the Fund may not use the same classification system. These classifications are used for reporting ease.
The accompanying notes are an integral part of these financial statements.
|
| The Hartford Municipal Opportunities Fund |
Schedule of Investments
April 30, 2015 (Unaudited)
| | | | | | | | |
Shares or Principal Amount | | Market Value* | |
| MUNICIPAL BONDS - 96.4% | |
| | | | Alabama - 1.3% | |
| | | | Birmingham, AL, Baptist Medical Center Special Care Fac | | | | |
| $ | 1,855,000 | | | 5.25%, 11/15/2016 | | $ | 1,898,388 | |
| | | | Jefferson County, AL, Sewer Rev | | | | |
| | 2,000,000 | | | 5.00%, 10/01/2017 | | | 2,149,000 | |
| | | | Mobile, AL, Industrial Development Board Pollution | | | | |
| | 1,540,000 | | | 1.65%, 06/01/2034(1) | | | 1,558,542 | |
| | | | | | | | |
| | | | | | | 5,605,930 | |
| | | | | | | | |
| | | | Arizona - 2.3% | |
| | | | Arizona State Health Fac Auth | | | | |
| | 2,000,000 | | | 5.00%, 12/01/2029 | | | 2,285,900 | |
| | 2,000,000 | | | 5.00%, 12/01/2030 | | | 2,273,560 | |
| | | | Estrella Mountain Ranch, AZ, Community Fac Dist GO | | | | |
| | 265,000 | | | 6.20%, 07/15/2032 | | | 277,058 | |
| | | | Pima County, AZ, IDA Education Rev, Legacy Traditional Charter School | | | | |
| | 1,435,000 | | | 8.50%, 07/01/2039 | | | 1,814,586 | |
| | | | Salt River, AZ, Agricultural Improvement | | | | |
| | 3,000,000 | | | 5.00%, 12/01/2027 | | | 3,533,460 | |
| | | | | | | | |
| | | | | | | 10,184,564 | |
| | | | | | | | |
| | | | California - 13.0% | |
| | | | Bay Area, CA, Toll Auth Bridge Rev | | | | |
| | 1,450,000 | | | 1.50%, 04/01/2047(1) | | | 1,466,153 | |
| | | | California County, CA, Tobacco Securitization | | | | |
| | 1,000,000 | | | 5.00%, 06/01/2022 | | | 1,167,470 | |
| | | | California State Communities DA Rev | | | | |
| | 955,000 | | | 0.96%, 04/01/2036(1) | | | 813,288 | |
| | 1,000,000 | | | 5.63%, 10/01/2032 | | | 1,071,440 | |
| | | | California State Department of Water Resources Power Supply Rev | | | | |
| | 3,225,000 | | | 5.00%, 05/01/2022 | | | 3,902,218 | |
| | | | California State GO | | | | |
| | 4,985,000 | | | 6.50%, 04/01/2033 | | | 5,992,169 | |
| | | | California State Health Facilities | | | | |
| | 1,500,000 | | | 6.00%, 07/01/2029 | | | 1,749,810 | |
| | | | California State Public Works Board, Correctional Facilities Improvement | | | | |
| | 1,000,000 | | | 6.00%, 03/01/2035 | | | 1,185,500 | |
| | | | California State Public Works Board, Lease Rev | | | | |
| | 2,000,000 | | | 5.25%, 10/01/2023 | | | 2,402,260 | |
| | | | California State Public Works Board, State University Trustees | | | | |
| | 2,000,000 | | | 6.25%, 04/01/2034 | | | 2,365,720 | |
| | | | Foothill-Eastern Transportation Corridor Agency | | | | |
| | 660,000 | | | 5.00%, 01/15/2053(1) | | | 710,411 | |
| | | | Golden State Tobacco Securitization Corp. | | | | |
| | 5,000,000 | | | 5.75%, 06/01/2047 | | | 4,300,800 | |
| | | | Hemet, CA Unif School Dist FA Special Tax | | | | |
| | 1,440,000 | | | 5.00%, 09/01/2030 | | | 1,632,240 | |
| | 535,000 | | | 5.00%, 09/01/2031 | | | 604,994 | |
| | | | Irvine, CA, Improvement Bond Act | | | | |
| | 1,065,000 | | | 4.00%, 09/02/2016 | | | 1,105,640 | |
| | | | Long Beach, CA, FA Natural Gas | | | | |
| | 425,000 | | | 1.62%, 11/15/2027(1) | | | 387,770 | |
| | | | Oakland, CA, Airport Rev | | | | |
| | 1,000,000 | | | 5.00%, 05/01/2026 | | | 1,124,630 | |
| | | | | | | | |
Shares or Principal Amount | | Market Value* | |
| MUNICIPAL BONDS - 96.4% - (continued) | |
| | | | California - 13.0% - (continued) | |
| | | | Port of Oakland, CA | | | | |
| $ | 985,000 | | | 5.00%, 05/01/2021 | | $ | 1,154,036 | |
| | 500,000 | | | 5.00%, 05/01/2023 | | | 585,290 | |
| | | | Rancho Cucamonga, CA, Redev Agency Tax | | | | |
| | 1,000,000 | | | 5.00%, 09/01/2029 | | | 1,163,320 | |
| | | | San Bernardino, CA, USD GO | | | | |
| | 1,150,000 | | | 5.00%, 08/01/2021 | | | 1,368,466 | |
| | | | San Buenaventura, CA, Community Memorial Health System | | | | |
| | 1,000,000 | | | 7.50%, 12/01/2041 | | | 1,230,360 | |
| | | | San Diego, CA, Redev Agency Tax Allocation | | | | |
| | 3,000,000 | | | 7.00%, 11/01/2039 | | | 3,548,880 | |
| | | | San Joaquin Hills, CA, Transporation Auth | | | | |
| | 875,000 | | | 5.00%, 01/15/2029 | | | 988,986 | |
| | | | San Jose, CA, Redev Agency | | | | |
| | 2,575,000 | | | 5.00%, 08/01/2022 | | | 2,751,954 | |
| | 500,000 | | | 6.50%, 08/01/2023 | | | 557,695 | |
| | | | San Mateo Joint Powers Financing Auth | | | | |
| | 1,250,000 | | | 5.00%, 06/15/2029 | | | 1,456,637 | |
| | 1,250,000 | | | 5.00%, 06/15/2030 | | | 1,449,050 | |
| | | | Santa Cruz County, CA, Redev Agency | | | | |
| | 1,250,000 | | | 5.00%, 09/01/2024 | | | 1,510,700 | |
| | 1,335,000 | | | 6.63%, 09/01/2029 | | | 1,547,519 | |
| | | | Santa Margarita, CA, Water Dist Special Tax | | | | |
| | 500,000 | | | 4.25%, 09/01/2021 | | | 543,840 | |
| | 500,000 | | | 5.00%, 09/01/2022 | | | 573,775 | |
| | 500,000 | | | 5.00%, 09/01/2023 | | | 573,145 | |
| | 1,130,000 | | | 5.00%, 09/01/2028 | | | 1,283,996 | |
| | | | Twin Rivers, CA, Unif School Dist Cops | | | | |
| | 3,000,000 | | | 3.45%, 07/01/2037(1) | | | 3,005,550 | |
| | | | | | | | |
| | | | | | | 57,275,712 | |
| | | | | | | | |
| | | | Colorado - 0.3% | |
| | | | Denver, CO, City and County Special Fac Airport Rev | | | | |
| | 1,000,000 | | | 5.00%, 11/15/2018 | | | 1,123,860 | |
| | | | | | | | |
| | | | Connecticut - 1.4% | |
| | | | City of New Haven, CT, GO | | | | |
| | 2,600,000 | | | 5.00%, 08/01/2024 | | | 3,058,068 | |
| | | | Connecticut Housing FA | | | | |
| | 995,000 | | | 4.00%, 11/15/2044 | | | 1,074,222 | |
| | | | Hartford, CT, GO | | | | |
| | 1,850,000 | | | 5.00%, 04/01/2026 | | | 2,117,047 | |
| | | | | | | | |
| | | | | | | 6,249,337 | |
| | | | | | | | |
| | | | District of Columbia - 0.6% | |
| | | | Metropolitan Washington, DC, Airport Auth System Rev | | | | |
| | 1,000,000 | | | 5.00%, 10/01/2020 | | | 1,159,640 | |
| | 1,450,000 | | | 5.00%, 10/01/2022 | | | 1,709,753 | |
| | | | | | | | |
| | | | | | | 2,869,393 | |
| | | | | | | | |
| | | | Florida - 8.6% | |
| | | | Arlington of Naples | | | | |
| | 500,000 | | | 6.50%, 05/15/2020(2) | | | 500,695 | |
| | 500,000 | | | 7.00%, 05/15/2024(2) | | | 559,830 | |
| | 2,000,000 | | | 5.00%, 07/01/2027 | | | 2,325,040 | |
| | | | Florida Village Community Development Dist No 8 | | | | |
| | 2,195,000 | | | 6.38%, 05/01/2038 | | | 2,449,225 | |
| | | | Greater Orlando, FL, Aviation Auth | | | | |
| | 3,300,000 | | | 5.00%, 10/01/2021 | | | 3,875,025 | |
| | 1,040,000 | | | 5.00%, 10/01/2024 | | | 1,189,022 | |
The accompanying notes are an integral part of these financial statements.
|
| The Hartford Municipal Opportunities Fund |
Schedule of Investments – (continued)
April 30, 2015 (Unaudited)
| | | | | | | | |
Shares or Principal Amount | | Market Value* | |
| MUNICIPAL BONDS - 96.4% - (continued) | |
| | | | Florida - 8.6% - (continued) | |
| | | | Highlands County, FL, Adventist Health (Prerefunded with US Gov’t Securities) | | | | |
| $ | 125,000 | | | 5.25%, 11/15/2036(1) | | $ | 133,926 | |
| | | | Highlands County, FL, Health Fac Auth | | | | |
| | 1,905,000 | | | 5.25%, 11/15/2036(1) | | | 2,014,576 | |
| | | | Jacksonville, FL, Econ Development Commission Obligor: Florida Proton Therapy Institute, Inc. | | | | |
| | 2,000,000 | | | 6.25%, 09/01/2027 | | | 2,154,000 | |
| | | | Jacksonville, FL, Sales Tax Rev | | | | |
| | 2,700,000 | | | 5.00%, 10/01/2021 | | | 3,216,861 | |
| | | | Lake County, FL, School Board | | | | |
| | 2,000,000 | | | 5.00%, 06/01/2026 | | | 2,327,680 | |
| | | | Lakeland, FL, Retirement Community Rev | | | | |
| | 1,750,000 | | | 6.38%, 01/01/2043 | | | 1,863,312 | |
| | | | Magnolia Creek, FL, Community Development Dist Capital Improvement | | | | |
| | 500,000 | | | 0.03%, 05/01/2039(3) | | | 175,000 | |
| | | | Miami-Dade County, FL | | | | |
| | 3,000,000 | | | 5.00%, 07/01/2032 | | | 3,417,480 | |
| | | | Miami-Dade County, FL, Aviation Rev | | | | |
| | 1,000,000 | | | 5.00%, 10/01/2024 | | | 1,152,700 | |
| | 2,500,000 | | | 5.00%, 10/01/2026 | | | 2,840,425 | |
| | | | Miami-Dade County, FL, School Board | | | | |
| | 2,000,000 | | | 5.00%, 08/01/2027(4) | | | 2,224,420 | |
| | | | Orange County, FL, School Board | | | | |
| | 2,130,000 | | | 5.00%, 08/01/2026 | | | 2,517,639 | |
| | | | Palm Beach County, FL, Health System | | | | |
| | 1,000,000 | | | 6.75%, 06/01/2024 | | | 1,125,290 | |
| | | | River Bend Community Development Dist, Capital Improvement Rev | | | | |
| | 1,560,000 | | | 0.00%, 11/01/2015(5) | | | 201,240 | |
| | | | Village, FL, Community Development Dist #11 | | | | |
| | 500,000 | | | 3.25%, 05/01/2019 | | | 501,325 | |
| | | | Volusia County, FL, School Board | | | | |
| | 775,000 | | | 5.00%, 08/01/2025 | | | 919,855 | |
| | | | | | | | |
| | | | | | | 37,684,566 | |
| | | | | | | | |
| | | | Georgia - 1.2% | | | |
| | | | Clayton County, GA, DA | | | | |
| | 1,965,000 | | | 9.00%, 06/01/2035 | | | 1,977,085 | |
| | | | Dekalb Newton and Gwinnett Counties, GA, Joint DA | | | | |
| | 1,500,000 | | | 6.00%, 07/01/2034 | | | 1,703,400 | |
| | | | Marietta, GA, DA Life University, Inc. Proj | | | | |
| | 1,500,000 | | | 7.00%, 06/15/2030 | | | 1,600,905 | |
| | | | | | | | |
| | | | | | | 5,281,390 | |
| | | | | | �� | | |
| | | | Hawaii - 0.3% | | | |
| | | | Hawaii State Dept of Transportation | | | | |
| | 1,000,000 | | | 5.00%, 08/01/2022 | | | 1,166,730 | |
| | | | | | | | |
| | | | Idaho - 0.3% | | | |
| | | | Idaho State Helath Facilities Auth Rev | | | | |
| | 1,000,000 | | | 5.00%, 03/01/2032 | | | 1,112,160 | |
| | | | | | | | |
| | | | Illinois - 9.4% | | | |
| | | | Aurora, IL, Tax Increment Rev | | | | |
| | 830,000 | | | 6.75%, 12/30/2027 | | | 905,912 | |
| | | | Chicago, IL, Board of Education | | | | |
| | 1,625,000 | | | 6.00%, 01/01/2020 | | | 1,790,051 | |
| | | | Chicago, IL, O’Hare International Airport Rev | | | | |
| | 855,000 | | | 5.25%, 01/01/2027 | | | 857,685 | |
| | | | | | | | |
Shares or Principal Amount | | Market Value* | |
| MUNICIPAL BONDS - 96.4% - (continued) | |
| | | | Illinois - 9.4% - (continued) | | | |
| | | | Chicago, IL, Park Dist, GO | | | | |
| $ | 2,750,000 | | | 5.00%, 01/01/2026 | | $ | 3,070,842 | |
| | | | Chicago, IL, Transit Auth. | | | | |
| | 2,770,000 | | | 5.00%, 06/01/2021 | | | 2,925,840 | |
| | | | City of Chicago, IL, GO | | | | |
| | 1,700,000 | | | 4.00%, 01/01/2018 | | | 1,758,429 | |
| | | | Illinois FA Rev, Art Institute of Chicago Ser A | | | | |
| | 1,400,000 | | | 6.00%, 03/01/2038 | | | 1,627,472 | |
| | | | Illinois FA Rev, Silver Cross Hospital and Medicine | | | | |
| | 3,000,000 | | | 5.50%, 08/15/2030 | | | 3,277,470 | |
| | | | Illinois Metropolitan Pier & Exposition Auth | | | | |
| | 4,000,000 | | | 4.32%, 12/15/2024(3) | | | 2,917,640 | |
| | | | Illinois State FA Rev | | | | |
| | 1,650,000 | | | 5.00%, 11/15/2031 | | | 1,857,784 | |
| | 1,500,000 | | | 5.00%, 11/15/2033 | | | 1,664,760 | |
| | 1,250,000 | | | 7.75%, 08/15/2034 | | | 1,544,950 | |
| | | | Illinois State GO | | | | |
| | 1,500,000 | | | 5.00%, 01/01/2022 | | | 1,656,840 | |
| | 1,500,000 | | | 5.00%, 08/01/2025 | | | 1,634,685 | |
| | 1,500,000 | | | 5.25%, 01/01/2021 | | | 1,687,590 | |
| | | | Illinois State Sales Tax Rev | | | | |
| | 1,830,000 | | | 6.50%, 06/15/2022 | | | 2,125,106 | |
| | | | Illinois State Toll Highway Auth | | | | |
| | 2,000,000 | | | 5.00%, 01/01/2030 | | | 2,305,900 | |
| | | | Illinois State Unemployment Insurance Fund | | | | |
| | 1,000,000 | | | 5.00%, 06/15/2019 | | | 1,004,990 | |
| | 1,500,000 | | | 5.00%, 12/15/2019 | | | 1,507,485 | |
| | | | Kane Cook & DuPage Counties GO | | | | |
| | 2,800,000 | | | 5.00%, 01/01/2031 | | | 3,153,500 | |
| | | | Metropolitan Pier & Exposition Auth. | |
| | 1,630,000 | | | 5.00%, 12/15/2020 | | | 1,891,110 | |
| | | | | | | | |
| | | | | | | 41,166,041 | |
| | | | | | | | |
| | | | Indiana - 1.8% | | | |
| | | | Indiana State FA Hospital Rev | |
| | 1,000,000 | | | 5.00%, 12/01/2029 | | | 1,158,100 | |
| | | | Indiana State Financing Auth Rev | |
| | 1,625,000 | | | 5.00%, 03/01/2023 | | | 1,821,154 | |
| | | | Indianapolis, IN Airport Auth Rev | |
| | 1,000,000 | | | 5.00%, 01/01/2029 | | | 1,123,040 | |
| | | | Richmond, IN, Hospital Auth. Rev | |
| | 775,000 | | | 5.00%, 01/01/2035 | | | 852,833 | |
| | | | Vigo County, IN, Hospital Auth | |
| | 2,000,000 | | | 5.75%, 09/01/2042(2) | | | 2,024,040 | |
| | | | Whiting, IN, Environmental Facilities Rev | |
| | 1,000,000 | | | 1.85%, 06/01/2044(1) | | | 1,003,790 | |
| | | | | | | | |
| | | | | | | 7,982,957 | |
| | | | | | | | |
| | | | Kansas - 0.3% | | | |
| | | | Wyandotte County-Kansas City, KS | |
| | 1,000,000 | | | 5.00%, 09/01/2025 | | | 1,181,170 | |
| | | | | | | | |
| | | | Kentucky - 0.9% | | | |
| | | | Kentucky Public Transportation Inf Auth | |
| | 350,000 | | | 5.00%, 07/01/2017 | | | 379,621 | |
| | | | Louisville & Jefferson County, KY | |
| | 1,515,000 | | | 5.00%, 12/01/2023 | | | 1,760,157 | |
| | | | Louisville & Jefferson County, KY, Metropolitan | |
| | 1,710,000 | | | 1.65%, 10/01/2033(1) | | | 1,730,657 | |
| | | | | | | | |
| | | | | | | 3,870,435 | |
| | | | | | | | |
The accompanying notes are an integral part of these financial statements.
|
| The Hartford Municipal Opportunities Fund |
Schedule of Investments – (continued)
April 30, 2015 (Unaudited)
| | | | | | | | |
Shares or Principal Amount | | Market Value* | |
| MUNICIPAL BONDS - 96.4% - (continued) | |
| | | | Louisiana - 1.8% | | | |
| | | | Louisana State, Tobacco Settlement Financing Corp. | | | | |
| $ | 2,500,000 | | | 5.00%, 05/15/2026 | | $ | 2,665,800 | |
| | | | Louisiana State, Local Gov’t Environmental Facs. & Community Dev. Auth | | | | |
| | 1,750,000 | | | 6.00%, 11/15/2035 | | | 1,751,312 | |
| | | | New Orleans, LA, Aviation Board | |
| | 750,000 | | | 5.00%, 01/01/2034 | | | 826,598 | |
| | 2,500,000 | | | 6.00%, 01/01/2023 | | | 2,873,625 | |
| | | | | | | | |
| | | | | | | 8,117,335 | |
| | | | | | | | |
| | | | Maryland - 0.3% | | | |
| | | | Westminster Maryland Rev | |
| | 1,500,000 | | | 4.38%, 07/01/2021 | | | 1,542,735 | |
| | | | | | | | |
| | | | Massachusetts - 1.6% | | | |
| | | | Massachusetts State Development Fin Agency Rev | | | | |
| | 1,200,000 | | | 8.00%, 04/15/2031 | | | 1,413,468 | |
| | | | Massachusetts State Health and Education Fac Auth | | | | |
| | 1,390,000 | | | 8.00%, 10/01/2039 | | | 1,433,104 | |
| | | | Massachusetts State Health and Education Fac Auth Rev | | | | |
| | 965,000 | | | 8.00%, 10/01/2039 | | | 995,455 | |
| | | | Massachusetts State PA | |
| | 455,000 | | | 4.00%, 07/01/2022 | | | 505,437 | |
| | 385,000 | | | 5.00%, 07/01/2021 | | | 450,600 | |
| | 650,000 | | | 5.00%, 07/01/2023 | | | 760,487 | |
| | | | Tufts Medical Center, Inc | | | | |
| | 1,200,000 | | | 5.00%, 01/01/2019 | | | 1,343,832 | |
| | | | | | | | |
| | | | | | | 6,902,383 | |
| | | | | | | | |
| | | | Michigan - 4.0% | | | |
| | | | Kent, MI, Hospital FA | |
| | 4,000,000 | | | 6.00%, 07/01/2035 | | | 4,027,040 | |
| | | | | | | | |
| | | | Michigan FA | |
| | 1,000,000 | | | 5.00%, 07/01/2018 | | | 1,097,390 | |
| | 650,000 | | | 5.00%, 07/01/2029 | | | 715,617 | |
| | 2,700,000 | | | 5.00%, 10/01/2030 | | | 3,082,536 | |
| | | | Michigan St FA | | | | |
| | 2,555,000 | | | 5.00%, 06/01/2033 | | | 2,838,043 | |
| | 1,000,000 | | | 5.00%, 06/01/2034 | | | 1,107,510 | |
| | | | Royal Oak, MI, Hospital FA | | | | |
| | 2,000,000 | | | 8.25%, 09/01/2039 | | | 2,471,860 | |
| | | | Wayne County, MI, Airport Auth Rev | | | | |
| | 1,000,000 | | | 5.00%, 12/01/2015 | | | 1,025,330 | |
| | 1,000,000 | | | 5.00%, 12/01/2030 | | | 1,135,900 | |
| | | | | | | | |
| | | | | | | 17,501,226 | |
| | | | | | | | |
| | | | Mississippi - 0.7% | | | |
| | | | Mississippi State Business Fin Corp. | | | | |
| | 3,000,000 | | | 1.63%, 12/01/2040(1) | | | 3,020,730 | |
| | | | | | | | |
| | | | Missouri - 0.9% | | | |
| | | | Kirkwood, MO, Industrial DA Retirement Community | | | | |
| | 3,500,000 | | | 8.25%, 05/15/2045 | | | 4,015,165 | |
| | | | | | | | |
| | | | Nevada - 1.0% | | | |
| | | | Clark County, NV, School Dist GO | | | | |
| | 1,625,000 | | | 5.00%, 06/15/2020 | | | 1,650,074 | |
| | | | Las Vegas, NV Spl Impt Dist | | | | |
| | 365,000 | | | 5.00%, 06/01/2027 | | | 375,716 | |
| | 700,000 | | | 5.00%, 06/01/2029 | | | 715,344 | |
| | | | | | | | |
Shares or Principal Amount | | Market Value* | |
| MUNICIPAL BONDS - 96.4% - (continued) | |
| | | | Nevada - 1.0% - (continued) | | | |
| | | | Mesquite, NV, Special Improvement Dist 07-01 | | | | |
| $ | 415,000 | | | 6.00%, 08/01/2027 | | $ | 421,628 | |
| | | | Nevada State Natural Resources GO | | | | |
| | 1,110,000 | | | 5.00%, 03/01/2026 | | | 1,319,901 | |
| | | | | | | | |
| | | | | | | 4,482,663 | |
| | | | | | | | |
| | | | New Jersey - 3.6% | | | |
| | | | New Jersey Health Care Facilities FA, Hospital Asset Transformation | | | | |
| | 2,855,000 | | | 5.75%, 10/01/2031 | | | 3,296,440 | |
| | | | New Jersey State Econ DA | | | | |
| | 1,510,000 | | | 4.88%, 09/15/2019 | | | 1,593,246 | |
| | 1,590,000 | | | 5.00%, 03/01/2023 | | | 1,766,840 | |
| | | | New Jersey State Educational FA Rev, University of Medicine & Dentistry | | | | |
| | 2,000,000 | | | 7.50%, 12/01/2032 | | | 2,495,660 | |
| | | | New Jersey State Interstate Turnpike Auth Rev | | | | |
| | 3,000,000 | | | 5.00%, 01/01/2025 | | | 3,480,000 | |
| | | | New Jersey State Transportation Trust Fund Auth | | | | |
| | 5,000,000 | | | 3.17%, 12/15/2032(3) | | | 2,120,700 | |
| | 1,000,000 | | | 5.00%, 09/15/2017 | | | 1,082,580 | |
| | | | | | | | |
| | | | | | | 15,835,466 | |
| | | | | | | | |
| | | | New Mexico - 1.0% | | | |
| | | | Los Alamos County, NM, Tax Improvement Rev | | | | |
| | 3,000,000 | | | 5.88%, 06/01/2027 | | | 3,445,320 | |
| | | | Montecito Estates, NM, Public Improvement Dist | | | | |
| | 905,000 | | | 7.00%, 10/01/2037 | | | 941,725 | |
| | | | | | | | |
| | | | | | | 4,387,045 | |
| | | | | | | | |
| | | | New York - 13.5% | | | |
| | | | City of New York, NY | | | | |
| | 4,000,000 | | | 6.25%, 10/15/2028 | | | 4,695,179 | |
| | | | Liberty, NY, Corp. Development Goldman Sachs Headquarters | | | | |
| | 2,000,000 | | | 5.25%, 10/01/2035 | | | 2,340,220 | |
| | | | New York City Housing Development Corp. | | | | |
| | 940,000 | | | 4.50%, 02/15/2048 | | | 977,750 | |
| | | | New York City, NY, Water and Sewer Financing Auth Rev | | | | |
| | 15,000,000 | | | 5.00%, 06/15/2039 | | | 17,038,500 | |
| | 2,100,000 | | | 5.00%, 11/15/2020 | | | 2,464,140 | |
| | | | New York Mortgage Agency Rev | | | | |
| | 1,195,000 | | | 3.50%, 10/01/2034 | | | 1,254,559 | |
| | | | New York State Dormitory Auth Rev | | | | |
| | 1,670,000 | | | 5.00%, 03/15/2022 | | | 1,972,070 | |
| | 2,000,000 | | | 5.00%, 12/15/2027 | | | 2,359,720 | |
| | 970,000 | | | 5.00%, 03/15/2028 | | | 1,069,309 | |
| | 1,000,000 | | | 5.00%, 03/15/2030 | | | 1,168,990 | |
| | | | New York State Energy Research & Development Auth | | | | |
| | 860,000 | | | 2.38%, 07/01/2026(1) | | | 859,063 | |
| | | | New York State Liberty Development Corp. Rev | | | | |
| | 1,535,000 | | | 5.15%, 11/15/2034(2) | | | 1,663,572 | |
| | | | New York State Thruway Auth | | | | |
| | 1,000,000 | | | 5.00%, 01/01/2019 | | | 1,132,420 | |
| | 1,250,000 | | | 5.00%, 05/01/2019 | | | 1,419,300 | |
| | 1,000,000 | | | 5.00%, 03/15/2021 | | | 1,189,480 | |
| | | | New York State Urban Development Corp. Rev | | | | |
| | 1,000,000 | | | 5.00%, 03/15/2026 | | | 1,182,080 | |
| | | | New York, NY, IDA Terminal One Group Assoc Proj AMT | | | | |
| | 2,000,000 | | | 5.50%, 01/01/2024(1) | | | 2,057,560 | |
| | 1,145,000 | | | 5.00%, 06/15/2019 | | | 1,265,110 | |
The accompanying notes are an integral part of these financial statements.
|
| The Hartford Municipal Opportunities Fund |
Schedule of Investments – (continued)
April 30, 2015 (Unaudited)
| | | | | | | | |
Shares or Principal Amount | | Market Value* | |
| MUNICIPAL BONDS - 96.4% - (continued) | |
| | | | New York - 13.5% - (continued) | | | |
| | | | PA of New York and New Jersey | | | | |
| $ | 2,750,000 | | | 5.00%, 10/15/2025 | | $ | 3,251,490 | |
| | | | Town of Oyster Bay, NY, GO | | | | |
| | 2,340,000 | | | 5.00%, 08/15/2024 | | | 2,768,454 | |
| | | | TSASC, Inc. | | | | |
| | 2,500,000 | | | 5.00%, 06/01/2034 | | | 2,260,250 | |
| | | | Ulster County, NY, Capital Resource Corp. Rev | | | | |
| | 940,000 | | | 3.72%, 09/15/2044(2)(3) | | | 704,022 | |
| | | | Ulster County, NY, IDA Kingston Regional Senior Living | | | | |
| | 2,000,000 | | | 6.00%, 09/15/2042 | | | 1,970,760 | |
| | | | Yonkers, NY, GO | | | | |
| | 885,000 | | | 3.00%, 08/15/2019 | | | 922,205 | |
| | 1,000,000 | | | 5.00%, 03/15/2021 | | | 1,162,110 | |
| | | | | | | | |
| | | | | | | 59,148,313 | |
| | | | | | | | |
| | | | North Carolina - 1.0% | | | |
| | | | North Carolina Eastern Municipal Power | | | | |
| | 1,325,000 | | | 4.00%, 01/01/2020 | | | 1,456,466 | |
| | | | North Carolina Medical Care Commission Retirement FA Rev, First Mortgage Galloway Ridge | | | | |
| | 1,555,000 | | | 5.88%, 01/01/2031 | | | 1,719,348 | |
| | | | North Carolina State Medical Care Commission, Galloway Ridge, Inc. | | | | |
| | 1,000,000 | | | 6.00%, 01/01/2039 | | | 1,097,030 | |
| | | | | | | | |
| | | | | | | 4,272,844 | |
| | | | | | | | |
| | | | Ohio - 3.9% | | | |
| | | | Allen County, OH, Hospital Fac Rev | | | | |
| | 2,000,000 | | | 5.00%, 05/01/2023 | | | 2,331,340 | |
| | | | Buckeye Tobacco Settlement FA | | | | |
| | 4,000,000 | | | 5.88%, 06/01/2047 | | | 3,276,280 | |
| | | | Buckeye, OH, Tobacco Settlement FA | | | | |
| | 6,680,000 | | | 6.00%, 06/01/2042 | | | 5,572,322 | |
| | | | Dayton, OH, City School Dist GO | | | | |
| | 2,000,000 | | | 5.00%, 11/01/2027 | | | 2,416,400 | |
| | | | Lancaster, OH, Gas Rev | | | | |
| | 2,275,000 | | | 0.72%, 02/01/2019(1) | | | 2,267,197 | |
| | | | Ohio State Cultural Sports Fac Building Projects | | | | |
| | 1,235,000 | | | 5.00%, 04/01/2020 | | | 1,431,699 | |
| | | | | | | | |
| | | | | | | 17,295,238 | |
| | | | | | | | |
| | | | Oregon - 0.4% | | | |
| | | | Port of Portland, Oregon Airport Rev | | | | |
| | 1,000,000 | | | 5.00%, 07/01/2031 | | | 1,127,450 | |
| | 750,000 | | | 5.00%, 07/01/2032 | | | 841,815 | |
| | | | | | | | |
| | | | | | | 1,969,265 | |
| | | | | | | | |
| | | | Other U.S. Territories - 0.2% | | | |
| | | | Puerto Rico Highway & Transportation Auth | | | | |
| | 705,000 | | | 4.95%, 07/01/2026 | | | 727,482 | |
| | | | | | | | |
| | | | Pennsylvania - 3.8% | | | |
| | | | Allegheny County, PA, Industrial DA Charter School | | | | |
| | 985,000 | | | 6.75%, 08/15/2035 | | | 1,079,767 | |
| | | | Commonwealth FA | | | | |
| | 2,000,000 | | | 5.00%, 06/01/2026 | | | 2,304,120 | |
| | | | Montgomery County, PA, Higher Education and Health | | | | |
| | 1,165,000 | | | 5.00%, 10/01/2023 | | | 1,321,203 | |
| | | | | | | | |
Shares or Principal Amount | | Market Value* | |
| MUNICIPAL BONDS - 96.4% - (continued) | |
| | | | Pennsylvania - 3.8% - (continued) | | | |
| | | | Pennsylvania State GO | | | | |
| $ | 1,000,000 | | | 7.00%, 07/15/2028 | | $ | 1,079,820 | |
| | | | Pennsylvania State IDA | | | | |
| | 2,250,000 | | | 5.00%, 07/01/2021 | | | 2,634,795 | |
| | | | Pennsylvania State Turnpike Commission Rev | | | | |
| | 575,000 | | | 0.99%, 12/01/2020(1) | | | 581,193 | |
| | 575,000 | | | 1.09%, 12/01/2021(1) | | | 577,018 | |
| | 1,335,000 | | | 6.00%, 06/01/2028 | | | 1,510,392 | |
| | | | Philadelphia, PA, Municipal Auth | | | | |
| | 750,000 | | | 6.38%, 04/01/2029 | | | 871,440 | |
| | 800,000 | | | 6.50%, 04/01/2034 | | | 928,368 | |
| | | | Pittsburgh, PA, School Dist GO | | | | |
| | 1,575,000 | | | 5.00%, 09/01/2021 | | | 1,846,089 | |
| | 750,000 | | | 5.00%, 09/01/2023 | | | 867,540 | |
| | | | Susquehanna, PA, Regional Airport Auth System Rev | | | | |
| | 1,000,000 | | | 5.00%, 01/01/2019 | | | 1,090,080 | |
| | | | | | | | |
| | | | | | | 16,691,825 | |
| | | | | | | | |
| | | | Rhode Island - 1.6% | |
| | | | Cranston, RI, GO | | | | |
| | 1,415,000 | | | 5.00%, 07/01/2019 | | | 1,584,022 | |
| | | | Rhode Island Health & Educational Bldg Corp. | | | | |
| | 1,900,000 | | | 5.00%, 05/15/2027(4) | | | 2,181,998 | |
| | | | Rhode Island State & Providence Plantations | | | | |
| | 1,500,000 | | | 4.00%, 10/01/2018 | | | 1,626,120 | |
| | | | Rhode Island State Health & Educational Bldg Corp. | | | | |
| | 1,655,000 | | | 4.00%, 05/15/2017 | | | 1,735,284 | |
| | | | | | | | |
| | | | | | | 7,127,424 | |
| | | | | | | | |
| | | | South Carolina - 0.1% | |
| | | | Lancaster County, SC, Sun City Assessment | | | | |
| | 1,987,000 | | | 0.00%, 11/01/2017(5) | | | 397,400 | |
| | | | | | | | |
| | | | South Dakota - 0.6% | |
| | | | South Dakota State Education Enhancement | | | | |
| | 1,000,000 | | | 5.00%, 06/01/2026 | | | 1,137,810 | |
| | | | South Dakota State Health & Educational FA | | | | |
| | 1,000,000 | | | 5.00%, 11/01/2029 | | | 1,145,420 | |
| | | | South Dakota State Housing DA | | | | |
| | 185,000 | | | 6.13%, 05/01/2033 | | | 187,165 | |
| | | | | | | | |
| | | | | | | 2,470,395 | |
| | | | | | | | |
| | | | Texas - 7.3% | |
| | | | Arlington, TX, Higher Education Fin | | | | |
| | 1,000,000 | | | 5.00%, 08/15/2027 | | | 1,180,410 | |
| | | | Brazos Harbor, TX, Industrial Development Corp. | | | | |
| | 1,500,000 | | | 5.90%, 05/01/2038(1) | | | 1,638,300 | |
| | | | Dallas, TX, Ind School Dist GO | | | | |
| | 1,350,000 | | | 5.00%, 08/15/2034 | | | 1,368,131 | |
| | | | Dallas-Fort Worth, TX, International Airport Fac Improvement Corp. | | | | |
| | 2,000,000 | | | 6.15%, 01/01/2016 | | | 2,007,460 | |
| | | | Harris County - Houston, TX | | | | |
| | 250,000 | | | 5.00%, 11/15/2032 | | | 277,590 | |
| | 350,000 | | | 5.00%, 11/15/2034 | | | 385,662 | |
| | | | Lower Colorado River, TX, Auth Rev | | | | |
| | 55,000 | | | 7.25%, 05/15/2037 | | | 55,109 | |
| | | | North East TX ISD, GO | | | | |
| | 1,000,000 | | | 5.00%, 08/01/2028 | | | 1,179,360 | |
The accompanying notes are an integral part of these financial statements.
|
| The Hartford Municipal Opportunities Fund |
Schedule of Investments – (continued)
April 30, 2015 (Unaudited)
| | | | | | | | |
Shares or Principal Amount | | Market Value* | |
| MUNICIPAL BONDS - 96.4% - (continued) | |
| | | | Texas - 7.3% - (continued) | |
| | | | North Texas Tollway Auth Rev | | | | |
| $ | 2,995,000 | | | 5.00%, 01/01/2022 | | $ | 3,531,794 | |
| | 2,500,000 | | | 5.00%, 01/01/2030 | | | 2,791,675 | |
| | | | San Antonio, TX, Airport System Rev | | | | |
| | 1,985,000 | | | 5.00%, 07/01/2023 | | | 2,292,754 | |
| | | | San Antonio, TX, Water Rev | | | | |
| | 2,200,000 | | | 5.00%, 05/15/2026 | | | 2,625,634 | |
| | | | Tarrant County, TX, Cultural Education Fac | | | | |
| | 1,000,000 | | | 5.00%, 10/01/2034 | | | 1,085,880 | |
| | | | Texas State Transportation Commission | | | | |
| | 1,500,000 | | | 0.46%, 04/01/2032(1) | | | 1,500,675 | |
| | | | Texas State Transportation Commission Turnpike System | | | | |
| | 1,250,000 | | | 5.00%, 08/15/2032 | | | 1,379,662 | |
| | | | Texas State Transportation Commission, GO | | | | |
| | 2,500,000 | | | 0.49%, 10/01/2041(1) | | | 2,497,500 | |
| | | | Travis County, TX, Health Fac Development | | | | |
| | 2,000,000 | | | 7.13%, 11/01/2040 | | | 2,318,080 | |
| | | | Travis County, TX, Health Fac, Querencia Barton Creek Project | | | | |
| | 600,000 | | | 5.65%, 11/15/2035 | | | 604,140 | |
| | | | Wylie, TX, ISD, GO | | | | |
| | 3,500,000 | | | 1.55%, 08/15/2018(3) | | | 3,368,680 | |
| | | | | | | | |
| | | | | | | 32,088,496 | |
| | | | | | | | |
| | | | Vermont - 0.2% | |
| | | | Vermont State Econ DA Waste | | | | |
| | 900,000 | | | 4.75%, 04/01/2036(1)(2) | | | 901,827 | |
| | | | | | | | |
| | | | Virginia - 0.5% | |
| | | | Washington County, VA, Industrial DA Hospital | | | | |
| | 1,750,000 | | | 7.75%, 07/01/2038 | | | 2,046,923 | |
| | | | | | | | |
| | | | Washington - 3.0% | |
| | | | Grant County, WA, Utility Dist #2 | | | | |
| | 1,825,000 | | | 5.00%, 01/01/2022 | | | 2,152,095 | |
| | 1,905,000 | | | 5.00%, 01/01/2023 | | | 2,241,137 | |
| | | | Washington State Health Care Fac Auth | | | | |
| | 780,000 | | | 5.00%, 07/01/2028(4) | | | 863,070 | |
| | 2,000,000 | | | 5.00%, 03/01/2029 | | | 2,292,200 | |
| | 1,650,000 | | | 5.00%, 10/01/2042(1) | | | 1,944,558 | |
| | | | Washington State Health Care Fac Auth, VA Mason Medical | | | | |
| | 3,600,000 | | | 6.13%, 08/15/2037 | | | 3,901,212 | |
| | | | | | | | |
| | | | | | | 13,394,272 | |
| | | | | | | | |
| | | | West Virginia - 0.3% | |
| | | | West Virginia Economic Development Auth | | | | |
| | 1,240,000 | | | 1.90%, 03/01/2040(1) | | | 1,240,459 | |
| | | | | | | | |
| | | | Wisconsin - 3.4% | |
| | | | Milwaukee County, WI, Airport Rev | | | | |
| | 1,790,000 | | | 5.00%, 12/01/2025 | | | 2,064,640 | |
| | | | Public Finance Auth. | | | | |
| | 1,500,000 | | | 5.00%, 09/01/2025(2) | | | 1,597,005 | |
| | | | Wisconsin Health and Educational Fac, Iowa Health System Obligated Group | | | | |
| | 1,700,000 | | | 5.00%, 12/01/2028 | | | 1,982,013 | |
| | | | Wisconsin State | | | | |
| | 2,685,000 | | | 5.75%, 05/01/2033 | | | 3,104,907 | |
| | 1,295,000 | | | 6.00%, 05/01/2036 | | | 1,509,970 | |
| | | | Wisconsin State Health & Educational Fac Auth Rev | | | | |
| | 2,000,000 | | | 5.00%, 11/15/2027 | | | 2,329,340 | |
| | | | | | | | |
Shares or Principal Amount | | Market Value* | |
| MUNICIPAL BONDS - 96.4% - (continued) | |
| | | | Wisconsin - 3.4% - (continued) | |
| | | | Wisconsin State Health and Educational Fac Auth Rev | | | | |
| $ | 2,465,000 | | | 5.25%, 08/15/2024 | | $ | 2,584,404 | |
| | | | | | | | |
| | | | | | | 15,172,279 | |
| | | | | | | | |
| | |
| | | | Total Municipal Bonds
(cost $407,857,184) | | $ | 423,503,435 | |
| | | | | | | | |
| | |
| | | | Total Long-Term Investments
(cost $407,857,184) | | $ | 423,503,435 | |
| | | | | | | | |
|
| SHORT-TERM INVESTMENTS - 2.1% | |
| | | | Other Investment Pools & Funds - 2.1% | |
| | 9,471,914 | | | JP Morgan Tax Free Money Market Fund | | $ | 9,471,914 | |
| | | | | | | | |
| | |
| | | | Total Short-Term Investments
(cost $9,471,914) | | $ | 9,471,914 | |
| | | | | | | | |
| | | | | | | | | | |
| | | |
| | Total Investments
(cost $417,329,098)^ | | | 98.5 | % | | $ | 432,975,349 | |
| | Other Assets and Liabilities | | | 1.5 | % | | | 6,452,367 | |
| | | | | | | | | | |
| | Total Net Assets | | | 100.0 | % | | $ | 439,427,716 | |
| | | | | | | | | | |
The accompanying notes are an integral part of these financial statements.
|
| The Hartford Municipal Opportunities Fund |
Schedule of Investments – (continued)
April 30, 2015 (Unaudited)
| Note: | Percentage of investments as shown is the ratio of the total market value to total net assets. |
| | The Fund may refer to any one or more of the industry classifications used by one or more widely recognized market indices, ratings group indices and/or as defined by Fund management. Industry classifications may not be identical across all security types. |
| | For Fund compliance purposes, the Fund may not use the same classification system shown in this report as these classifications are used for reporting ease. |
| ^ | At April 30, 2015, the cost of securities for federal income tax purposes was $417,329,098 and the aggregate gross unrealized appreciation and depreciation based on that cost were: |
| | | | |
Unrealized Appreciation | | $ | 20,212,624 | |
Unrealized Depreciation | | | (4,566,373 | ) |
| | | | |
Net Unrealized Appreciation | | $ | 15,646,251 | |
| | | | |
| (1) | Variable rate securities; the rate reported is the coupon rate in effect at April 30, 2015. |
| (2) | Securities issued within terms of a private placement memorandum, exempt from registration under Rule 144A under the Securities Act of 1933, as amended, and may be sold only to qualified institutional buyers. Unless otherwise indicated, these holdings are determined to be liquid. At April 30, 2015, the aggregate value of these securities were $7,950,991, which represents 1.8% of total net assets. |
| (3) | The interest rate disclosed for these holdings are the effective yield on the date of the acquisition. |
| (4) | This security, or a portion of this security, was purchased on a when-issued, delayed-delivery or delayed-draw basis. The cost of these securities were $5,310,954 at April 30, 2015. |
| (5) | Non-income producing. For long-term debt securities, items identified are in default as to payment of interest and/or principal. |
Futures Contracts Outstanding at April 30, 2015
| | | | | | | | | | | | | | | | | | | | |
Description | | Number of
Contracts | | | Expiration
Date | | | Notional
Amount | | | Market
Value* | | | Unrealized
Appreciation/
(Depreciation) | |
Short position contracts: | | | | | | | | | | | | | | | | | | | | |
U.S. Treasury Long Bond Future | | | 81 | | | | 06/19/2015 | | | $ | 13,286,399 | | | $ | 12,927,094 | | | $ | 359,305 | |
| | | | | | | | | | | | | | | | | | | | |
Total futures contracts | | | | | | | | | | | | | | | | | | $ | 359,305 | |
| | | | | | | | | | | | | | | | | | | | |
| * | See Significant Accounting Policies of accompanying Notes to Financial Statements regarding valuation of securities. |
| | |
| GLOSSARY: (abbreviations used in preceding Schedule of Investments) |
|
| Municipal Abbreviations: |
AMT | | Alternative Minimum Tax |
DA | | Development Authority |
FA | | Finance Authority |
GO | | General Obligation |
ISD | | Independent School District |
IDA | | Industrial Development Authority |
PA | | Port Authority |
Rev | | Revenue |
USD | | United School District |
VA | | Veterans Administration |
The accompanying notes are an integral part of these financial statements.
|
| The Hartford Municipal Opportunities Fund |
Schedule of Investments – (continued)
April 30, 2015 (Unaudited)
Fair Valuation Summary
The following is a summary of the fair valuations according to the inputs used as of April 30, 2015 in valuing the Fund’s investments.
| | | | | | | | | | | | | | | | |
| | | Total | | | Level 1(1) | | | Level 2(1) | | | Level 3 | |
Assets | | | | | | | | | | | | | | | | |
Municipal Bonds | | $ | 423,503,435 | | | $ | — | | | $ | 423,503,435 | | | $ | — | |
Short-Term Investments | | | 9,471,914 | | | | 9,471,914 | | | | — | | | | — | |
| | | | | | | | | | | | | | | | |
Total | | $ | 432,975,349 | | | $ | 9,471,914 | | | $ | 423,503,435 | | | $ | — | |
| | | | | | | | | | | | | | | | |
Futures Contracts(2) | | $ | 359,305 | | | $ | 359,305 | | | $ | — | | | $ | — | |
| | | | | | | | | | | | | | | | |
Total | | $ | 359,305 | | | $ | 359,305 | | | $ | — | | | $ | — | |
| | | | | | | | | | | | | | | | |
| (1) | For the six-month period ended April 30, 2015, there were no transfers between Level 1 and Level 2. |
| (2) | Derivative instruments (excluding purchased and written options, if applicable) are valued at the unrealized appreciation/depreciation on the investments. |
| Note: | For purposes of reporting transfers between different hierarchy levels, both transfers in and out of each level, as applicable, are shown as if they occurred at the beginning of the period. |
The accompanying notes are an integral part of these financial statements.
|
| The Hartford Municipal Real Return Fund |
Credit Exposure
as of April 30, 2015 (Unaudited)
| | | | |
| Credit Rating* | | Percentage of
Net Assets | |
Aaa / AAA | | | 1.9 | % |
Aa / AA | | | 36.4 | |
A | | | 32.4 | |
Baa / BBB | | | 12.1 | |
Ba / BB | | | 0.3 | |
B | | | 0.8 | |
Not Rated | | | 12.7 | |
Short-Term Instruments | | | 2.7 | |
Other Assets & Liabilities | | | 0.7 | |
| | | | |
Total | | | 100.0 | % |
| | | | |
| * | Credit exposure is the long-term credit ratings for the Fund’s holdings, as of the date noted, as provided by Standard and Poor’s (S&P) or Moody’s Investors Service (Moody’s) and typically range from AAA/Aaa (highest) to C/D (lowest). Presentation of S&P and Moody’s credit ratings in this report have been selected for informational purposes for shareholders, as well as the Fund’s consideration of industry practice. If Moody’s and S&P assign different ratings, the lower rating is used. Fixed income securities that are not rated by either agency are listed as “Not Rated.” Ratings do not apply to the Fund itself or to the Fund’s shares. Ratings may change. |
Diversification by Industry
as of April 30, 2015 (Unaudited)
| | | | |
| Industry | | Percentage of
Net Assets | |
Airport | | | 10.8 | % |
Bond Bank | | | 1.2 | |
Development | | | 4.4 | |
Education | | | 2.4 | |
Facilities | | | 2.0 | |
General | | | 13.8 | |
General Obligation | | | 7.0 | |
Higher Education | | | 7.1 | |
Medical | | | 14.7 | |
Mello-Roos | | | 0.7 | |
Multifamily Hsg | | | 0.2 | |
Nursing Homes | | | 4.2 | |
Power | | | 2.9 | |
School District | | | 6.4 | |
Single Family Hsg | | | 1.0 | |
Tobacco | | | 1.9 | |
Transportation | | | 9.6 | |
Water | | | 6.3 | |
Short-Term Investments | | | 2.7 | |
Other Assets & Liabilities | | | 0.7 | |
| | | | |
Total | | | 100.0 | % |
| | | | |
For Fund compliance purposes, the Fund may not use the same classification system. These classifications are used for reporting ease.
The accompanying notes are an integral part of these financial statements.
|
| The Hartford Municipal Real Return Fund |
Schedule of Investments
April 30, 2015 (Unaudited)
| | | | | | | | |
Shares or Principal Amount | | Market Value* | |
| MUNICIPAL BONDS - 96.6% | |
| | | | Alabama - 0.9% | |
| | | | County of Jefferson, AL, Sewer Rev | | | | |
| $ | 1,500,000 | | | 5.00%, 10/01/2018 | | $ | 1,641,705 | |
| | | | | | | | |
| | | | Alaska - 0.6% | | | |
| | | | Alaska Municipal Bond Bank Auth Rev | | | | |
| | 375,000 | | | 5.75%, 09/01/2033 | | | 432,813 | |
| | | | Anchorage, AK, GO | | | | |
| | 610,000 | | | 5.25%, 08/01/2028 | | | 687,202 | |
| | | | | | | | |
| | | | | | | 1,120,015 | |
| | | | | | | | |
| | | | Arizona - 1.1% | |
| | | | Arizona State Health Fac Auth Hospital System Rev | | | | |
| | 1,000,000 | | | 5.00%, 02/01/2020 | | | 1,145,690 | |
| | | | Estrella Mountain Ranch, AZ, Community Fac Dist GO | | | | |
| | 265,000 | | | 6.20%, 07/15/2032 | | | 277,058 | |
| | | | Sundance, AZ, Community Fac Dist | | | | |
| | 249,000 | | | 7.13%, 07/01/2027(1) | | | 249,097 | |
| | | | Vistancia, AZ, Community Fac Dist GO | | | | |
| | 185,000 | | | 6.75%, 07/15/2022 | | | 185,529 | |
| | | | | | | | |
| | | | | | | 1,857,374 | |
| | | | | | | | |
| | | | California - 16.0% | |
| | | | California State Communities DA Rev | | | | |
| | 570,000 | | | 0.96%, 04/01/2036(2) | | | 485,418 | |
| | 1,000,000 | | | 5.00%, 10/01/2022 | | | 1,080,810 | |
| | 250,000 | | | 5.50%, 07/01/2037(3) | | | 3 | |
| | | | California State Dept Water Resources Supply Rev | | | | |
| | 500,000 | | | 5.00%, 05/01/2022 | | | 558,590 | |
| | | | California State Health Facilities | | | | |
| | 1,000,000 | | | 6.00%, 07/01/2029 | | | 1,166,540 | |
| | | | California State Public Works Board, State University Trustees | | | | |
| | 170,000 | | | 6.13%, 04/01/2029 | | | 200,423 | |
| | | | Corona-Norco California University | | | | |
| | 1,530,000 | | | 4.00%, 09/01/2019 | | | 1,681,394 | |
| | | | El Dorado, CA, Irrigation Dist | | | | |
| | 300,000 | | | 5.38%, 08/01/2024 | | | 346,626 | |
| | | | Foothill-Eastern Transportation Corridor Agency | | | | |
| | 435,000 | | | 5.00%, 01/15/2053(2) | | | 468,225 | |
| | | | Golden State Tobacco Securitization Agency | | | | |
| | 425,000 | | | 5.00%, 06/01/2017 | | | 459,684 | |
| | | | Hemet, CA Unif School Dist FA Special Tax | | | | |
| | 1,000,000 | | | 5.00%, 09/01/2031 | | | 1,130,830 | |
| | | | Huntington Park, CA, Public FA Rev | | | | |
| | 400,000 | | | 5.25%, 09/01/2019 | | | 409,004 | |
| | | | Irvine, CA, Improvement Bond Act | | | | |
| | 1,000,000 | | | 4.00%, 09/02/2019 | | | 1,099,890 | |
| | | | Los Angeles, CA, Regional Airports Improvement Corp. | | | | |
| | 1,100,000 | | | 5.00%, 01/01/2020 | | | 1,252,273 | |
| | | | Oakland, CA, Airport Rev | | | | |
| | 1,000,000 | | | 5.00%, 05/01/2026 | | | 1,124,630 | |
| | | | San Bernardino City, CA, Unif School Dist GO | | | | |
| | 725,000 | | | 5.00%, 08/01/2020 | | | 849,976 | |
| | | | San Bernardino, CA, Community College Dist GO | | | | |
| | 500,000 | | | 6.38%, 08/01/2026 | | | 587,005 | |
| | | | San Buenaventura, CA, Rev | | | | |
| | 500,000 | | | 5.25%, 12/01/2017 | | | 541,715 | |
| | | | San Diego, CA, Redev Agency, Centre City Sub Pkg | | | | |
| | 60,000 | | | 5.25%, 09/01/2026 | | | 60,059 | |
| | | | | | | | |
Shares or Principal Amount | | Market Value* | |
| MUNICIPAL BONDS - 96.6% - (continued) | |
| | | | California - 16.0% - (continued) | |
| | | | San Francisco City & County, CA, Redev FA | | | | |
| $ | 1,120,000 | | | 6.50%, 08/01/2032 | | $ | 1,322,810 | |
| | | | San Joaquin Hills, CA, Transporation Auth | | | | |
| | 290,000 | | | 5.00%, 01/15/2029 | | | 327,778 | |
| | | | San Jose, CA, Redev Agency | | | | |
| | 1,000,000 | | | 6.50%, 08/01/2019 | | | 1,149,940 | |
| | | | Santa Cruz County, CA, Redev Agency | | | | |
| | 1,360,000 | | | 5.00%, 09/01/2022 | | | 1,633,510 | |
| | 665,000 | | | 6.63%, 09/01/2029 | | | 770,861 | |
| | | | Santa Margarita, CA, Water Dist Special Tax | | | | |
| | 500,000 | | | 5.00%, 09/01/2024 | | | 567,235 | |
| | 500,000 | | | 5.00%, 09/01/2025 | | | 557,540 | |
| | 1,000,000 | | | 5.00%, 09/01/2028 | | | 1,136,280 | |
| | | | Southern California State Public Power Auth | | | | |
| | 500,000 | | | 5.00%, 07/01/2023 | | | 565,635 | |
| | | | Temecula, CA, Redev Agency Tax Allocation Rev | | | | |
| | 230,000 | | | 5.63%, 12/15/2038 | | | 237,240 | |
| | | | Torrance, CA, USD GO | | | | |
| | 1,500,000 | | | 5.50%, 08/01/2025 | | | 1,773,270 | |
| | | | Tuolumne, CA, Wind Proj Auth Rev | | | | |
| | 1,000,000 | | | 5.88%, 01/01/2029 | | | 1,159,300 | |
| | | | Twin Rivers, CA, Unif School Dist Certificates of Participation | | | | |
| | 700,000 | | | 3.20%, 06/01/2035(2) | | | 700,042 | |
| | | | Ventura County, CA, Certificates of Participation | | | | |
| | 1,250,000 | | | 5.63%, 08/15/2027 | | | 1,463,975 | |
| | | | Washington Township, CA, Health Care Dist Rev | | | | |
| | 1,000,000 | | | 6.00%, 07/01/2029 | | | 1,135,600 | |
| | | | | | | | |
| | | | | | | 28,004,111 | |
| | | | | | | | |
| | | | Colorado - 0.4% | |
| | | | University of Colorado Enterprise Rev | | | | |
| | 600,000 | | | 5.75%, 06/01/2028 | | | 708,438 | |
| | | | | | | | |
| | | | Connecticut - 0.6% | |
| | | | City of New Haven, CT, GO | | | | |
| | 1,000,000 | | | 5.00%, 11/01/2017 | | | 1,087,500 | |
| | | | | | | | |
| | | | Delaware - 0.8% | |
| | | | Delaware State Transportation Auth | | | | |
| | 1,180,000 | | | 5.00%, 07/01/2025 | | | 1,346,274 | |
| | | | | | | | |
| | | | District of Columbia - 2.6% | |
| | | | District of Columbia University Rev | | | | |
| | 3,000,000 | | | 5.25%, 04/01/2034(2) | | | 3,339,300 | |
| | | | Metropolitan Washington, DC, Airport Auth System Rev | | | | |
| | 1,035,000 | | | 5.00%, 10/01/2022 | | | 1,220,410 | |
| | | | | | | | |
| | | | | | | 4,559,710 | |
| | | | | | | | |
| | | | Florida - 8.8% | |
| | | | Arlington of Naples | | | | |
| | 500,000 | | | 6.50%, 05/15/2020(1) | | | 500,695 | |
| | 500,000 | | | 7.00%, 05/15/2024(1) | | | 559,830 | |
| | | | Broward County, FL, Airport System Rev | | | | |
| | 145,000 | | | 5.00%, 10/01/2019 | | | 165,889 | |
| | 120,000 | | | 5.00%, 10/01/2020 | | | 139,357 | |
| | 285,000 | | | 5.00%, 10/01/2021 | | | 333,171 | |
| | 1,000,000 | | | 5.00%, 07/01/2027 | | | 1,162,520 | |
| | | | Greater Orlando, FL, Aviation Auth | | | | |
| | 1,500,000 | | | 5.00%, 10/01/2021 | | | 1,761,375 | |
| | 1,000,000 | | | 5.00%, 10/01/2024 | | | 1,143,290 | |
The accompanying notes are an integral part of these financial statements.
|
| The Hartford Municipal Real Return Fund |
Schedule of Investments – (continued)
April 30, 2015 (Unaudited)
| | | | | | | | |
Shares or Principal Amount | | Market Value* | |
| MUNICIPAL BONDS - 96.6% - (continued) | |
| | | | Florida - 8.8% - (continued) | |
| | | | Jacksonville, FL, Econ Development Commission Obligor: Florida Proton Therapy Institute, Inc. | | | | |
| $ | 2,000,000 | | | 6.25%, 09/01/2027 | | $ | 2,154,000 | |
| | | | Miami Beach, FL, Health Fac Auth | | | | |
| | 190,000 | | | 5.00%, 11/15/2020 | | | 220,444 | |
| | | | Miami-Dade County Expressway Auth | | | | |
| | 625,000 | | | 5.00%, 07/01/2024 | | | 746,494 | |
| | | | Miami-Dade County, FL, Aviation Auth | | | | |
| | 530,000 | | | 5.00%, 10/01/2027 | | | 610,194 | |
| | | | Miami-Dade County, FL, Educational Fac Auth | | | | |
| | 2,000,000 | | | 5.75%, 04/01/2028 | | | 2,089,880 | |
| | | | Miami-Dade County, FL, School Board | | | | |
| | 1,000,000 | | | 5.00%, 08/01/2027(4) | | | 1,112,210 | |
| | | | Palm Beach County Health | | | | |
| | 1,000,000 | | | 6.80%, 06/01/2025 | | | 1,133,000 | |
| | | | River Bend Community Development Dist, Capital Improvement Rev | | | | |
| | 780,000 | | | 7.13%, 11/01/2015(3) | | | 100,620 | |
| | | | Village, FL, Community Development Dist #11 | | | | |
| | 250,000 | | | 3.25%, 05/01/2019 | | | 250,662 | |
| | | | Volusia County, FL, School Board | | | | |
| | 1,000,000 | | | 5.00%, 08/01/2025 | | | 1,186,910 | |
| | | | | | | | |
| | | | | | | 15,370,541 | |
| | | | | | | | |
| | | | Georgia - 2.5% | | | |
| | | | Atlanta, GA, Airport Passenger Fac Charge Rev | | | | |
| | 2,000,000 | | | 5.00%, 01/01/2023 | | | 2,297,080 | |
| | | | Atlanta, GA, Water & Wastewater Rev | | | | |
| | 1,500,000 | | | 6.00%, 11/01/2022 | | | 1,810,815 | |
| | | | Georgia Municipal Electric Auth, Power Rev (Prerefunded with US Gov’t Securities) | | | | |
| | 10,000 | | | 6.50%, 01/01/2017 | | | 10,374 | |
| | | | Georgia State Municipal Elec Auth | | | | |
| | 245,000 | | | 6.50%, 01/01/2017 | | | 258,634 | |
| | | | | | | | |
| | | | | | | 4,376,903 | |
| | | | | | | | |
| | | | Hawaii - 0.9% | | | |
| | | | Hawaii State Dept of Transportation | | | | |
| | 1,000,000 | | | 5.00%, 08/01/2022 | | | 1,166,730 | |
| | | | Hawaii State Harbor System Rev | | | | |
| | 500,000 | | | 5.38%, 01/01/2020 | | | 501,680 | |
| | | | | | | | |
| | | | | | | 1,668,410 | |
| | | | | | | | |
| | | | Idaho - 1.0% | | | |
| | | | Idaho State Bond Bank Auth Rev | | | | |
| | 1,470,000 | | | 5.63%, 09/15/2026 | | | 1,685,722 | |
| | | | | | | | |
| | | | Illinois - 11.9% | | | |
| | | | Chicago, IL, Board of Education | | | | |
| | 825,000 | | | 6.00%, 01/01/2020 | | | 908,795 | |
| | | | Chicago, IL, O’Hare International Airport Rev | | | | |
| | 825,000 | | | 5.00%, 01/01/2023 | | | 943,099 | |
| | 1,500,000 | | | 5.00%, 01/01/2026 | | | 1,702,680 | |
| | 850,000 | | | 5.25%, 01/01/2027 | | | 852,669 | |
| | | | Chicago, IL, Park Dist, GO | | | | |
| | 2,370,000 | | | 5.00%, 01/01/2025 | | | 2,669,213 | |
| | | | City of Chicago, IL, GO | | | | |
| | 785,000 | | | 4.00%, 01/01/2018 | | | 811,980 | |
| | | | Huntley, IL, Special Service #9 | | | | |
| | 1,500,000 | | | 5.10%, 03/01/2028 | | | 1,612,455 | |
| | | | Illinois State FA Rev | | | | |
| | 1,000,000 | | | 5.00%, 10/01/2023 | | | 1,181,800 | |
| | | | | | | | |
Shares or Principal Amount | | Market Value* | |
| MUNICIPAL BONDS - 96.6% - (continued) | |
| | | | Illinois - 11.9% - (continued) | | | |
| $ | 1,000,000 | | | 5.00%, 11/15/2031 | | $ | 1,125,930 | |
| | 1,000,000 | | | 5.00%, 11/15/2033 | | | 1,109,840 | |
| | | | Illinois State GO | | | | |
| | 1,000,000 | | | 5.00%, 01/01/2022 | | | 1,104,560 | |
| | 2,000,000 | | | 5.25%, 01/01/2021 | | | 2,250,120 | |
| | | | Illinois State Toll Highway Auth | | | | |
| | 60,000 | | | 5.00%, 01/01/2023 | | | 60,461 | |
| | 1,000,000 | | | 5.00%, 01/01/2027 | | | 1,149,870 | |
| | | | Kane Cook & DuPage Counties GO | | | | |
| | 1,400,000 | | | 5.00%, 01/01/2031 | | | 1,576,750 | |
| | | | Railsplitter, IL, Tobacco Settlement Auth | | | | |
| | 1,000,000 | | | 5.50%, 06/01/2023 | | | 1,181,610 | |
| | | | Springfield, IL, Water Rev | | | | |
| | 500,000 | | | 5.25%, 03/01/2026 | | | 556,165 | |
| | | | | | | | |
| | | | | | | 20,797,997 | |
| | | | | | | | |
| | | | Indiana - 1.4% | | | |
| | | | Indiana State Housing and Community DA | | | | |
| | 1,120,000 | | | 4.55%, 07/01/2027 | | | 1,141,963 | |
| | | | University of Southern Indiana | | | | |
| | 820,000 | | | 5.00%, 10/01/2022 | | | 950,634 | |
| | 250,000 | | | 5.00%, 10/01/2023 | | | 289,478 | |
| | | | | | | | |
| | | | | | | 2,382,075 | |
| | | | | | | | |
| | | | Kentucky - 0.9% | | | |
| | | | Kentucky Public Transportation Inf Auth | | | | |
| | 230,000 | | | 5.00%, 07/01/2017 | | | 249,465 | |
| | | | Louisville & Jefferson County, KY | | | | |
| | 1,085,000 | | | 5.00%, 12/01/2023 | | | 1,260,575 | |
| | | | | | | | |
| | | | | | | 1,510,040 | |
| | | | | | | | |
| | | | Louisiana - 1.8% | | | |
| | | | Louisana State, Tobacco Settlement Financing Corp. | | | | |
| | 1,500,000 | | | 5.00%, 05/15/2026 | | | 1,599,480 | |
| | | | Louisiana Local Gov’t Environmental Facs. & Community DA | | | | |
| | 1,000,000 | | | 6.00%, 11/15/2030 | | | 1,020,310 | |
| | | | New Orleans, LA, Aviation Board | | | | |
| | 500,000 | | | 5.00%, 01/01/2034 | | | 551,065 | |
| | | | | | | | |
| | | | | | | 3,170,855 | |
| | | | | | | | |
| | | | Maryland - 0.6% | | | |
| | | | Westminster Maryland Rev | | | | |
| | 1,000,000 | | | 3.88%, 07/01/2019 | | | 1,027,610 | |
| | | | | | | | |
| | | | Massachusetts - 0.6% | | | |
| | | | Massachusetts State Development Fin Agency Rev | | | | |
| | 925,000 | | | 5.00%, 01/01/2017 | | | 984,329 | |
| | | | | | | | |
| | | | Michigan - 1.1% | | | |
| | | | Detroit, MI, Water Supply System Ref Rev | | | | |
| | 915,000 | | | 6.50%, 07/01/2015 | | | 923,171 | |
| | | | Michigan FA | | | | |
| | 600,000 | | | 5.00%, 07/01/2018 | | | 659,016 | |
| | 350,000 | | | 5.00%, 07/01/2029 | | | 385,332 | |
| | | | | | | | |
| | | | | | | 1,967,519 | |
| | | | | | | | |
| | | | Missouri - 0.3% | | | |
| | | | Stone Canyon, MO, Community Improvement Dist Rev | | | | |
| | 1,000,000 | | | 5.75%, 04/01/2027(3)(5) | | | 480,000 | |
| | | | | | | | |
The accompanying notes are an integral part of these financial statements.
|
| The Hartford Municipal Real Return Fund |
Schedule of Investments – (continued)
April 30, 2015 (Unaudited)
| | | | | | | | |
Shares or Principal Amount | | Market Value* | |
| MUNICIPAL BONDS - 96.6% - (continued) | |
| | | | Nebraska - 0.6% | | | |
| | | | Central Plains, NE, Energy Proj Gas Rev | | | | |
| $ | 1,000,000 | | | 5.00%, 09/01/2015 | | $ | 1,013,970 | |
| | | | | | | | |
| | | | Nevada - 0.2% | | | |
| | | | Las Vegas, NV, Special Improvement Dist | | | | |
| | 400,000 | | | 5.00%, 06/01/2028 | | | 410,252 | |
| | | | | | | | |
| | | | New Jersey - 1.1% | | | |
| | | | New Jersey State Econ DA | | | | |
| | 760,000 | | | 4.88%, 09/15/2019 | | | 801,899 | |
| | | | New Jersey State Econ DA Lease Rev | | | | |
| | 1,000,000 | | | 5.00%, 09/01/2021 | | | 1,107,200 | |
| | | | | | | | |
| | | | | | | 1,909,099 | |
| | | | | | | | |
| | | | New York - 7.9% | | | |
| | | | City of New York, NY | | | | |
| | 1,000,000 | | | 6.25%, 10/15/2028 | | | 1,173,780 | |
| | | | Liberty, NY, Corp. Development Goldman Sachs Headquarters | | | | |
| | 1,000,000 | | | 5.25%, 10/01/2035 | | | 1,170,110 | |
| | | | Metropolitan Transportation Auth, NY, Rev | | | | |
| | 3,000,000 | | | 5.25%, 11/15/2023 | | | 3,523,260 | |
| | | | New York City Housing Development Corp. | | | | |
| | 395,000 | | | 4.50%, 02/15/2048 | | | 410,863 | |
| | | | New York Mortgage Agency Rev | | | | |
| | 530,000 | | | 3.50%, 10/01/2034 | | | 556,415 | |
| | | | New York State Dormitory Auth Rev | | | | |
| | 970,000 | | | 5.00%, 03/15/2028 | | | 1,069,309 | |
| | | | New York State Dormitory Auth Rev Obligor: Teacher’s College | | | | |
| | 2,000,000 | | | 5.38%, 03/01/2029 | | | 2,274,020 | |
| | | | New York State Liberty Development Corp. Rev | | | | |
| | 765,000 | | | 5.15%, 11/15/2034(1) | | | 829,076 | |
| | | | Newburth, NY, GO | | | | |
| | 610,000 | | | 5.00%, 06/15/2017 | | | 649,985 | |
| | 645,000 | | | 5.00%, 06/15/2018 | | | 700,225 | |
| | | | Ulster County, NY, Capital Resource Corp. Rev | | | | |
| | 575,000 | | | 0.00%, 09/15/2044(1) | | | 430,652 | |
| | | | Ulster County, NY, Industrial Development Agency | | | | |
| | 1,000,000 | | | 6.00%, 09/15/2027 | | | 1,003,830 | |
| | | | | | | | |
| | | | | | | 13,791,525 | |
| | | | | | | | |
| | | | North Carolina - 0.5% | | | |
| | | | Mecklenburg County, NC, Certificate of Participation School Improvements | | | | |
| | 795,000 | | | 5.00%, 02/01/2024 | | | 906,371 | |
| | | | | | | | |
| | | | Ohio - 2.2% | | | |
| | | | Cuyahoga, OH, Community College Dist | | | | |
| | 1,200,000 | | | 5.00%, 08/01/2027 | | | 1,368,372 | |
| | | | Dayton, OH, City School Dist GO | | | | |
| | 2,000,000 | | | 5.00%, 11/01/2027 | | | 2,416,400 | |
| | | | | | | | |
| | | | | | | 3,784,772 | |
| | | | | | | | |
| | | | Oklahoma - 1.4% | | | |
| | | | Norman, OK, Regional Hospital Auth Rev | | | | |
| | 2,310,000 | | | 5.25%, 09/01/2019 | | | 2,505,819 | |
| | | | | | | | |
| | | | Other U.S. Territories - 2.5% | | | |
| | | | Guam Government Business Privilege Tax Rev | | | | |
| | 1,500,000 | | | 5.00%, 01/01/2027 | | | 1,682,205 | |
| | | | Guam Government Power Auth Rev | | | | |
| | 1,000,000 | | | 5.00%, 10/01/2021 | | | 1,184,280 | |
| | 1,000,000 | | | 5.00%, 10/01/2023 | | | 1,188,920 | |
| | | | | | | | |
Shares or Principal Amount | | Market Value* | |
| MUNICIPAL BONDS - 96.6% - (continued) | |
| | | | Other U.S. Territories - 2.5% - (continued) | | | |
| | | | Puerto Rico Highway & Transportation Auth | | | | |
| $ | 380,000 | | | 4.95%, 07/01/2026 | | $ | 392,118 | |
| | | | | | | | |
| | | | | | | 4,447,523 | |
| | | | | | | | |
| | | | Pennsylvania - 4.6% | | | |
| | | | Commonwealth FA | | | | |
| | 1,000,000 | | | 5.00%, 06/01/2026 | | | 1,152,060 | |
| | | | Montgomery County, PA, Higher Education and Health | | | | |
| | 1,000,000 | | | 5.00%, 10/01/2023 | | | 1,134,080 | |
| | | | Pennsylvania State Turnpike Commission Rev | | | | |
| | 665,000 | | | 6.00%, 06/01/2028 | | | 752,368 | |
| | | | Philadelphia, PA, GO | | | | |
| | 1,000,000 | | | 5.25%, 08/01/2019 | | | 1,145,450 | |
| | | | Pittsburgh, PA, School Dist GO | | | | |
| | 1,570,000 | | | 5.00%, 09/01/2021 | | | 1,840,228 | |
| | 750,000 | | | 5.00%, 09/01/2023 | | | 867,540 | |
| | | | Susquehanna Area Regional Airport Auth | | | | |
| | 1,000,000 | | | 5.00%, 01/01/2018 | | | 1,072,620 | |
| | | | | | | | |
| | | | | | | 7,964,346 | |
| | | | | | | | |
| | | | Rhode Island - 2.2% | | | |
| | | | Cranston, RI, GO | | | | |
| | 1,410,000 | | | 5.00%, 07/01/2018 | | | 1,549,604 | |
| | | | Rhode Island Health & Educational Bldg Corp. | | | | |
| | 1,215,000 | | | 5.00%, 05/15/2018 | | | 1,323,062 | |
| | 800,000 | | | 5.00%, 05/15/2027(4) | | | 918,736 | |
| | | | | | | | |
| | | | | | | 3,791,402 | |
| | | | | | | | |
| | | | South Carolina - 0.7% | | | |
| | | | South Carolina St Jobs-Econ DA Rev | | | | |
| | 1,000,000 | | | 5.25%, 08/01/2024 | | | 1,183,950 | |
| | | | | | | | |
| | | | South Dakota - 0.3% | | | |
| | | | South Dakota State Health & Educational FA | | | | |
| | 415,000 | | | 5.00%, 11/01/2029 | | | 475,349 | |
| | | | | | | | |
| | | | Tennessee - 0.6% | | | |
| | | | Johnson City, TN, Health & Educational Fac Board Hospital Rev | | | | |
| | 1,000,000 | | | 5.50%, 07/01/2031 | | | 1,050,250 | |
| | | | | | | | |
| | | | Texas - 8.9% | | | |
| | | | Dallas-Fort Worth, TX, International Airport Rev | | | | |
| | 750,000 | | | 5.00%, 11/01/2023 | | | 860,528 | |
| | | | Harris County - Houston, TX | | | | |
| | 250,000 | | | 5.00%, 11/15/2032 | | | 277,590 | |
| | | | Houston, TX, Utility System Rev | | | | |
| | 2,000,000 | | | 6.00%, 11/15/2036 | | | 2,352,200 | |
| | | | Kerrville, TX, Health Fac Development Corp. Hospital Rev | | | | |
| | 935,000 | | | 5.00%, 08/15/2015 | | | 944,191 | |
| | | | Love Field, TX, Airport Modernization Corp. Special Fac Rev | | | | |
| | 1,000,000 | | | 5.00%, 11/01/2015 | | | 1,020,800 | |
| | | | North Texas Tollway Auth Rev | | | | |
| | 1,055,000 | | | 1.95%, 01/01/2038(2) | | | 1,065,803 | |
| | 1,000,000 | | | 5.00%, 01/01/2030 | | | 1,116,670 | |
| | 3,000,000 | | | 6.00%, 01/01/2025 | | | 3,385,095 | |
| | | | Tarrant County, TX, Cultural Education Fac | | | | |
| | 550,000 | | | 5.00%, 10/01/2034 | | | 597,234 | |
| | 1,000,000 | | | 6.25%, 11/15/2029 | | | 1,174,800 | |
The accompanying notes are an integral part of these financial statements.
|
| The Hartford Municipal Real Return Fund |
Schedule of Investments – (continued)
April 30, 2015 (Unaudited)
| | | | | | | | |
Shares or Principal Amount | | Market Value* | |
| MUNICIPAL BONDS - 96.6% - (continued) | |
| | | | Texas - 8.9% - (continued) | | | |
| | | | Texas State Municipal Gas Acquisition & Supply Corp. | | | | |
| $ | 1,000,000 | | | 5.25%, 12/15/2017 | | $ | 1,097,550 | |
| | | | Texas State Transportation Commission Turnpike System | | | | |
| | 550,000 | | | 5.00%, 08/15/2032 | | | 607,052 | |
| | | | Travis County, TX, Health Fac, Querencia Barton Creek Project | | | | |
| | 1,000,000 | | | 5.65%, 11/15/2035 | | | 1,006,900 | |
| | | | | | | | |
| | | | | | | 15,506,413 | |
| | | | | | | | |
| | | | Vermont - 0.3% | | | |
| | | | Vermont State Econ DA Waste | | | | |
| | 600,000 | | | 4.75%, 04/01/2036(1)(2) | | | 601,218 | |
| | | | | | | | |
| | | | Virginia - 0.3% | | | |
| | 500,000 | | | 5.00%, 11/01/2024 | | | 564,452 | |
| | | | | | | | |
| | | | Washington - 2.7% | | | |
| | | | FYI Properties, WA, Lease Rev | | | | |
| | 2,285,000 | | | 5.50%, 06/01/2034 | | | 2,630,058 | |
| | | | Washington State Health Care Fac Auth | | | | |
| | 1,820,000 | | | 5.00%, 03/01/2029 | | | 2,085,902 | |
| | | | | | | | |
| | | | | | | 4,715,960 | |
| | | | | | | | |
| | | | West Virginia - 0.9% | | | |
| | | | West Virginia State Econ DA Solid Waste Disposal Fac | | | | |
| | 1,500,000 | | | 2.25%, 01/01/2041(2) | | | 1,519,395 | |
| | | | | | | | |
| | | | Wisconsin - 3.9% | | | |
| | | | Milwaukee County, WI, Airport Rev | | | | |
| | 1,705,000 | | | 5.00%, 12/01/2024 | | | 1,974,987 | |
| | | | Wisconsin State | | | | |
| | 125,000 | | | 5.75%, 05/01/2033 | | | 144,549 | |
| | 865,000 | | | 6.00%, 05/01/2036 | | | 1,008,590 | |
| | | | Wisconsin State Health & Educational Fac Auth Rev | | | | |
| | 2,265,000 | | | 5.00%, 02/15/2026 | | | 2,560,129 | |
| | 1,000,000 | | | 5.00%, 11/15/2027 | | | 1,164,670 | |
| | | | | | | | |
| | | | | | | 6,852,925 | |
| | | | | | | | |
| | |
| | | | Total Municipal Bonds
(cost $160,673,614) | | $ | 168,742,119 | |
| | | | | | | | |
| | |
| | | | Total Long-Term Investments
(cost $160,673,614) | | $ | 168,742,119 | |
| | | | | | | | |
| |
| SHORT-TERM INVESTMENTS - 2.7% | | | |
| | | | Other Investment Pools & Funds - 2.7% | | | |
| | 4,717,924 | | | JP Morgan Tax Free Money Market Fund | | $ | 4,717,924 | |
| | | | | | | | |
| | |
| | | | Total Short-Term Investments
(cost $4,717,924) | | $ | 4,717,924 | |
| | | | | | | | |
| | | | | | | | | | |
| | | |
| | Total Investments
(cost $165,391,538)^ | | | 99.3 | % | | $ | 173,460,043 | |
| | Other Assets and Liabilities | | | 0.7 | % | | | 1,138,950 | |
| | | | | | | | | | |
| | Total Net Assets | | | 100.0 | % | | $ | 174,598,993 | |
| | | | | | | | | | |
The accompanying notes are an integral part of these financial statements.
|
| The Hartford Municipal Real Return Fund |
Schedule of Investments – (continued)
April 30, 2015 (Unaudited)
| Note: | Percentage of investments as shown is the ratio of the total market value to total net assets. |
| | The Fund may refer to any one or more of the industry classifications used by one or more widely recognized market indices, ratings group indices and/or as defined by Fund management. Industry classifications may not be identical across all security types. |
| | For Fund compliance purposes, the Fund may not use the same classification system shown in this report as these classifications are used for reporting ease. |
| ^ | At April 30, 2015, the cost of securities for federal income tax purposes was $165,391,538 and the aggregate gross unrealized appreciation and depreciation based on that cost were: |
| | | | |
Unrealized Appreciation | | $ | 9,832,788 | |
Unrealized Depreciation | | | (1,764,283 | ) |
| | | | |
Net Unrealized Appreciation | | $ | 8,068,505 | |
| | | | |
| (1) | Securities issued within terms of a private placement memorandum, exempt from registration under Rule 144A under the Securities Act of 1933, as amended, and may be sold only to qualified institutional buyers. Unless otherwise indicated, these holdings are determined to be liquid. At April 30, 2015, the aggregate value of these securities were $3,170,568, which represents 1.8% of total net assets. |
| (2) | Variable rate securities; the rate reported is the coupon rate in effect at April 30, 2015. |
| (3) | Non-income producing. For long-term debt securities, items identified are in default as to payment of interest and/or principal. |
| (4) | This security, or a portion of this security, was purchased on a when-issued, delayed-delivery or delayed-draw basis. The cost of these securities were $2,047,224 at April 30, 2015. |
| (5) | The following security is considered illiquid. Illiquid securities are often purchased in private placement transactions, are often not registered under the Securities Act of 1933, as amended, and may have contractual restrictions on resale. A security may also be considered illiquid if the security lacks a readily available market or if its valuation has not changed for a certain period of time. |
| | | | | | | | | | |
Period
Acquired | | Shares/Par | | | Security | | Cost Basis | |
| 04/2007 | | $ | 1,000,000 | | | Stone Canyon, MO, Community Improvement Dist Rev | | $ | 990,337 | |
| | At April 30, 2015, the aggregate value of these securities were $480,000, which represents 0.3% of total net assets. |
| | | | | | | | | | | | | | | | | | | | | | | | | | | | | | | | |
| OTC Interest Rate Swap Contracts Outstanding at April 30, 2015 | |
Counterparty | | Payments made
by Fund | | Payments received
by Fund | | Notional
Amount | | | Expiration
Date | | | Upfront
Premiums
Paid | | | Upfront
Premiums
Received | | | Market
Value* | | | Unrealized
Appreciation/
(Depreciation) | |
JPM | | 0.05% Fixed | | CPURNSA | | | USD | | | | 8,925,000 | | | | 12/22/15 | | | $ | — | | | $ | — | | | $ | 13,924 | | | $ | 13,924 | |
BNP | | 1.07% Fixed | | CPURNSA | | | USD | | | | 6,275,000 | | | | 02/03/17 | | | | — | | | | — | | | | 23,988 | | | | 23,988 | |
DEUT | | 1.46% Fixed | | CPURNSA | | | USD | | | | 6,785,000 | | | | 03/02/17 | | | | — | | | | — | | | | 1,457 | | | | 1,457 | |
DEUT | | 1.48% Fixed | | CPURNSA | | | USD | | | | 3,155,000 | | | | 03/02/17 | | | | — | | | | — | | | | (431 | ) | | | (431 | ) |
BCLY | | 1.53% Fixed | | CPURNSA | | | USD | | | | 3,335,000 | | | | 03/03/17 | | | | — | | | | — | | | | (3,205 | ) | | | (3,205 | ) |
BOA | | 2.45% Fixed | | CPURNSA | | | USD | | | | 7,800,000 | | | | 03/22/17 | | | | — | | | | — | | | | (450,258 | ) | | | (450,258 | ) |
BNP | | 1.53% Fixed | | CPURNSA | | | USD | | | | 5,425,000 | | | | 01/15/18 | | | | — | | | | — | | | | (80,981 | ) | | | (80,981 | ) |
UBS | | 2.65% Fixed | | CPURNSA | | | USD | | | | 5,250,000 | | | | 03/04/18 | | | | — | | | | — | | | | (396,969 | ) | | | (396,969 | ) |
UBS | | 2.79% Fixed | | CPURNSA | | | USD | | | | 7,800,000 | | | | 04/13/18 | | | | — | | | | — | | | | (690,282 | ) | | | (690,282 | ) |
CBK | | 2.34% Fixed | | CPURNSA | | | USD | | | | 525,000 | | | | 04/15/18 | | | | — | | | | — | | | | (28,209 | ) | | | (28,209 | ) |
BCLY | | 2.12% Fixed | | CPURNSA | | | USD | | | | 7,550,000 | | | | 01/15/19 | | | | — | | | | — | | | | (290,404 | ) | | | (290,404 | ) |
DEUT | | 1.97% Fixed | | CPURNSA | | | USD | | | | 7,450,000 | | | | 11/12/19 | | | | — | | | | — | | | | (173,848 | ) | | | (173,848 | ) |
BCLY | | 1.65% Fixed | | CPURNSA | | | USD | | | | 3,700,000 | | | | 01/15/20 | | | | — | | | | — | | | | (7,510 | ) | | | (7,510 | ) |
BCLY | | 1.86% Fixed | | CPURNSA | | | USD | | | | 3,600,000 | | | | 01/15/20 | | | | — | | | | — | | | | (74,174 | ) | | | (74,174 | ) |
JPM | | 2.75% Fixed | | CPURNSA | | | USD | | | | 7,000,000 | | | | 03/03/21 | | | | — | | | | — | | | | (761,468 | ) | | | (761,468 | ) |
BCLY | | 2.79% Fixed | | CPURNSA | | | USD | | | | 7,000,000 | | | | 03/03/21 | | | | — | | | | — | | | | (761,468 | ) | | | (761,468 | ) |
UBS | | 2.75% Fixed | | CPURNSA | | | USD | | | | 7,000,000 | | | | 03/03/21 | | | | — | | | | — | | | | (761,468 | ) | | | (761,468 | ) |
JPM | | 2.33% Fixed | | CPURNSA | | | USD | | | | 7,000,000 | | | | 09/30/21 | | | | — | | | | — | | | | (485,823 | ) | | | (485,823 | ) |
DEUT | | 2.48% Fixed | | CPURNSA | | | USD | | | | 2,300,000 | | | | 07/15/23 | | | | — | | | | — | | | | (162,919 | ) | | | (162,919 | ) |
MSC | | 2.60% Fixed | | CPURNSA | | | USD | | | | 1,525,000 | | | | 08/09/23 | | | | — | | | | — | | | | (127,269 | ) | | | (127,269 | ) |
DEUT | | 2.02% Fixed | | CPURNSA | | | USD | | | | 1,850,000 | | | | 12/11/24 | | | | — | | | | — | | | | (21,529 | ) | | | (21,529 | ) |
BCLY | | 1.91% Fixed | | CPURNSA | | | USD | | | | 1,850,000 | | | | 01/15/25 | | | | — | | | | — | | | | 5,902 | | | | 5,902 | |
UBS | | 2.95% Fixed | | CPURNSA | | | USD | | | | 5,750,000 | | | | 03/07/26 | | | | — | | | | — | | | | (946,799 | ) | | | (946,799 | ) |
BCLY | | 2.98% Fixed | | CPURNSA | | | USD | | | | 5,750,000 | | | | 03/08/26 | | | | — | | | | — | | | | (987,536 | ) | | | (987,536 | ) |
JPM | | 2.97% Fixed | | CPURNSA | | | USD | | | | 6,800,000 | | | | 04/14/26 | | | | — | | | | — | | | | (1,156,826 | ) | | | (1,156,826 | ) |
CBK | | 2.45% Fixed | | CPURNSA | | | USD | | | | 950,000 | | | | 11/07/34 | | | | — | | | | — | | | | (64,758 | ) | | | (64,758 | ) |
| | | | | | | | | | | | | | | | | | | | | | | | | | | | | | | | |
Total | | | $ | — | | | $ | — | | | $ | (8,388,863 | ) | | $ | (8,388,863 | ) |
| | | | | | | | | | | | | | | | | |
| * | See Significant Accounting Policies of accompanying Notes to Financial Statements regarding valuation of securities. |
The accompanying notes are an integral part of these financial statements.
|
| The Hartford Municipal Real Return Fund |
Schedule of Investments – (continued)
April 30, 2015 (Unaudited)
| | |
| GLOSSARY: (abbreviations used in preceding Schedule of Investments) |
|
| Counterparty Abbreviations: |
BCLY | | Barclays |
BNP | | BNP Paribas Securities Services |
BOA | | Banc of America Securities LLC |
CBK | | Citibank NA |
DEUT | | Deutsche Bank Securities, Inc. |
JPM | | JP Morgan Chase & Co. |
MSC | | Morgan Stanley |
UBS | | UBS AG |
|
| Currency Abbreviations: |
USD | | United States Dollar |
| | |
| Index Abbreviations: |
CPURNSA | | Consumer Price All Urban Non-Seasonally Adjusted |
|
| Other Abbreviations: |
OTC | | Over-the-Counter |
|
| Municipal Abbreviations: |
DA | | Development Authority |
FA | | Finance Authority |
GO | | General Obligation |
PA | | Port Authority |
Rev | | Revenue |
USD | | United School District |
The accompanying notes are an integral part of these financial statements.
|
| The Hartford Municipal Real Return Fund |
Schedule of Investments – (continued)
April 30, 2015 (Unaudited)
Fair Valuation Summary
The following is a summary of the fair valuations according to the inputs used as of April 30, 2015 in valuing the Fund’s investments.
| | | | | | | | | | | | | | | | |
| | | Total | | | Level 1(1) | | | Level 2(1) | | | Level 3 | |
Assets | | | | | | | | | | | | | | | | |
Municipal Bonds | | $ | 168,742,119 | | | $ | — | | | $ | 168,742,119 | | | $ | — | |
Short-Term Investments | | | 4,717,924 | | | | 4,717,924 | | | | — | | | | — | |
| | | | | | | | | | | | | | | | |
Total | | $ | 173,460,043 | | | $ | 4,717,924 | | | $ | 168,742,119 | | | $ | — | |
| | | | | | | | | | | | | | | | |
Swaps - Interest Rate(2) | | $ | 45,271 | | | $ | — | | | $ | 45,271 | | | $ | — | |
| | | | | | | | | | | | | | | | |
Total | | $ | 45,271 | | | $ | — | | | $ | 45,271 | | | $ | — | |
| | | | | | | | | | | | | | | | |
Liabilities | | | | | | | | | | | | | | | | |
| | | | | | | | | | | | | | | | |
Swaps - Interest Rate(2) | | $ | (8,434,134 | ) | | $ | — | | | $ | (8,434,134 | ) | | $ | — | |
| | | | | | | | | | | | | | | | |
Total | | $ | (8,434,134 | ) | | $ | — | | | $ | (8,434,134 | ) | | $ | — | |
| | | | | | | | | | | | | | | | |
| (1) | For the six-month period ended April 30, 2015, there were no transfers between Level 1 and Level 2. |
| (2) | Derivative instruments (excluding purchased and written options, if applicable) are valued at the unrealized appreciation/depreciation on the investments. |
| Note: | For purposes of reporting transfers between different hierarchy levels, both transfers in and out of each level, as applicable, are shown as if they occurred at the beginning of the period. |
The accompanying notes are an integral part of these financial statements.
|
| Hartford Funds – Tax-Exempt Fixed Income Funds |
Statements of Assets and Liabilities
April 30, 2015 (Unaudited)
| | | | | | | | |
| | | The Hartford
Municipal
Opportunities
Fund | | | The Hartford
Municipal Real
Return Fund | |
Assets: | | | | | | | | |
Investments in securities, at market value | | $ | 432,975,349 | | | $ | 173,460,043 | |
Cash | | | 74,426 | | | | 691,411 | |
Cash collateral | | | 275,400 | | | | 8,726,000 | |
Unrealized appreciation on OTC swap contracts | | | — | | | | 45,271 | |
Receivables: | | | | | | | | |
Investment securities sold | | | 10,226,561 | | | | — | |
Fund shares sold | | | 1,129,218 | | | | 158,308 | |
Dividends and interest | | | 5,377,777 | | | | 2,188,986 | |
Variation margin on financial derivative instruments | | | 25,314 | | | | — | |
Other assets | | | 54,094 | | | | 109,100 | |
| | | | | | | | |
Total assets | | | 450,138,139 | | | | 185,379,119 | |
| | | | | | | | |
Liabilities: | | | | | | | | |
Unrealized depreciation on OTC swap contracts | | | — | | | | 8,434,134 | |
Payables: | | | | | | | | |
Investment securities purchased | | | 8,764,434 | | | | 2,047,224 | |
Fund shares redeemed | | | 1,476,851 | | | | 118,076 | |
Investment management fees | | | 125,961 | | | | 50,343 | |
Distribution fees | | | 125,483 | | | | 48,319 | |
Distributions payable | | | 188,209 | | | | 55,701 | |
Accrued expenses | | | 29,485 | | | | 26,329 | |
| | | | | | | | |
Total liabilities | | | 10,710,423 | | | | 10,780,126 | |
| | | | | | | | |
Net assets | | $ | 439,427,716 | | | $ | 174,598,993 | |
| | | | | | | | |
Summary of Net Assets: | | | | | | | | |
Capital stock and paid-in-capital | | $ | 451,220,306 | | | $ | 218,340,456 | |
Undistributed (distributions in excess of) net investment income | | | 166,541 | | | | 30,835 | |
Accumulated net realized gain (loss) | | | (27,964,687 | ) | | | (43,451,940 | ) |
Unrealized appreciation (depreciation) of investments | | | 16,005,556 | | | | (320,358 | ) |
| | | | | | | | |
Net assets | | $ | 439,427,716 | | | $ | 174,598,993 | |
| | | | | | | | |
Shares authorized | | | 650,000,000 | | | | 19,300,000,000 | |
| | | | | | | | |
Par value | | $ | 0.001 | | | $ | 0.0001 | |
| | | | | | | | |
Class A: Net asset value per share | | $ | 8.53 | | | $ | 9.33 | |
| | | | | | | | |
Maximum offering price per share | | $ | 8.93 | | | $ | 9.77 | |
| | | | | | | | |
Shares outstanding | | | 24,572,885 | | | | 11,885,823 | |
| | | | | | | | |
Net Assets | | $ | 209,536,149 | | | $ | 110,951,671 | |
| | | | | | | | |
Class B: Net asset value per share | | $ | 8.52 | | | $ | 9.25 | |
| | | | | | | | |
Shares outstanding | | | 342,802 | | | | 123,879 | |
| | | | | | | | |
Net Assets | | $ | 2,920,825 | | | $ | 1,145,317 | |
| | | | | | | | |
Class C: Net asset value per share | | $ | 8.53 | | | $ | 9.28 | |
| | | | | | | | |
Shares outstanding | | | 11,358,022 | | | | 3,194,234 | |
| | | | | | | | |
Net Assets | | $ | 96,915,264 | | | $ | 29,636,044 | |
| | | | | | | | |
Class I: Net asset value per share | | $ | 8.54 | | | $ | 9.36 | |
| | | | | | | | |
Shares outstanding | | | 15,221,071 | | | | 1,438,496 | |
| | | | | | | | |
Net Assets | | $ | 130,055,478 | | | $ | 13,460,987 | |
| | | | | | | | |
Class Y: Net asset value per share | | $ | — | | | $ | 9.31 | |
| | | | | | | | |
Shares outstanding | | | — | | | | 2,084,909 | |
| | | | | | | | |
Net Assets | | $ | — | | | $ | 19,404,974 | |
| | | | | | | | |
Cost of investments | | $ | 417,329,098 | | | $ | 165,391,538 | |
The accompanying notes are an integral part of these financial statements.
|
| Hartford Funds – Tax-Exempt Fixed Income Funds |
Statements of Operations
For the Six-Month Period Ended April 30, 2015 (Unaudited)
| | | | | | | | |
| | | The Hartford
Municipal
Opportunities
Fund | | | The Hartford
Municipal Real
Return Fund | |
Investment Income: | | | | | | | | |
Dividends | | $ | 229 | | | $ | — | |
Interest | | | 7,357,390 | | | | 3,197,884 | |
| | | | | | | | |
Total investment income, net | | | 7,357,619 | | | | 3,197,884 | |
| | | | | | | | |
Expenses: | | | | | | | | |
Investment management fees | | | 1,138,919 | | | | 446,853 | |
Transfer agent fees | | | | | | | | |
Class A | | | 35,231 | | | | 29,930 | |
Class B | | | 1,590 | | | | 865 | |
Class C | | | 22,379 | | | | 7,458 | |
Class I | | | 28,450 | | | | 5,326 | |
Class Y | | | — | | | | 160 | |
Distribution fees | | | | | | | | |
Class A | | | 251,611 | | | | 140,605 | |
Class B | | | 15,515 | | | | 6,357 | |
Class C | | | 471,856 | | | | 152,210 | |
Custodian fees | | | 969 | | | | 4,662 | |
Registration and filing fees | | | 42,447 | | | | 70,406 | |
Accounting services fees | | | 37,276 | | | | 14,300 | |
Board of Directors’ fees | | | 4,562 | | | | 2,876 | |
Audit fees | | | 6,248 | | | | 5,950 | |
Other expenses | | | 23,153 | | | | 13,295 | |
| | | | | | | | |
Total expenses (before waivers and fees paid indirectly) | | | 2,080,206 | | | | 901,253 | |
Management fee waivers | | | (156,077 | ) | | | (113,834 | ) |
| | | | | | | | |
Total waivers and fees paid indirectly | | | (156,077 | ) | | | (113,834 | ) |
| | | | | | | | |
Total expenses, net | | | 1,924,129 | | | | 787,419 | |
| | | | | | | | |
Net Investment Income (Loss) | | | 5,433,490 | | | | 2,410,465 | |
| | | | | | | | |
Net Realized Gain (Loss) on Investments and Other Financial Instruments: | | | | | | | | |
Net realized gain (loss) on investments | | | 967,545 | | | | 1,804,582 | |
Net realized gain (loss) on swap contracts | | | — | | | | (1,302,536 | ) |
| | | | | | | | |
Net Realized Gain (Loss) on Investments and Other Financial Instruments | | | 967,545 | | | | 502,046 | |
| | | | | | | | |
Net Changes in Unrealized Appreciation (Depreciation) of Investments, Other Financial Instruments and Foreign Currency Transactions: | | | | | | | | |
Net unrealized appreciation (depreciation) of investments | | | (1,875,364 | ) | | | (1,874,474 | ) |
Net unrealized appreciation (depreciation) of future contracts | | | 359,305 | | | | — | |
Net unrealized appreciation (depreciation) of swap contracts | | | — | | | | (1,891,759 | ) |
Net unrealized appreciation (depreciation) of translation of other assets and liabilities in foreign currencies | | | (568 | ) | | | — | |
| | | | | | | | |
Net Changes in Unrealized Appreciation (Depreciation) of Investments, Other Financial Instruments and Foreign Currency Transactions | | | (1,516,627 | ) | | | (3,766,233 | ) |
| | | | | | | | |
Net Gain (Loss) on Investments, Other Financial Instruments and Foreign Currency Transactions | | | (549,082 | ) | | | (3,264,187 | ) |
| | | | | | | | |
Net Increase (Decrease) in Net Assets Resulting from Operations | | $ | 4,884,408 | | | $ | (853,722 | ) |
| | | | | | | | |
The accompanying notes are an integral part of these financial statements.
|
| Hartford Funds – Tax-Exempt Fixed Income Funds |
Statements of Changes in Net Assets
| | | | | | | | | | | | | | | | |
| | | The Hartford Municipal
Opportunities Fund | | | The Hartford Municipal Real
Return Fund | |
| | | For the
Six-Month Period
Ended
April 30, 2015
(Unaudited) | | | For the
Year Ended
October 31,
2014 | | | For the
Six-Month Period
Ended
April 30, 2015
(Unaudited) | | | For the
Year Ended
October 31,
2014 | |
Operations: | | | | | | | | | | | | | | | | |
Net investment income (loss) | | $ | 5,433,490 | | | $ | 9,511,418 | | | $ | 2,410,465 | | | $ | 5,063,745 | |
Net realized gain (loss) on investments and other financial instruments | | | 967,545 | | | | 2,243,064 | | | | 502,046 | | | | (584,902 | ) |
Net changes in unrealized appreciation (depreciation) of investments, other financial instruments and foreign currency transactions | | | (1,516,627 | ) | | | 9,378,453 | | | | (3,766,233 | ) | | | 4,718,111 | |
| | | | | | | | | | | | | | | | |
Net Increase (Decrease) in Net Assets Resulting from Operations | | | 4,884,408 | | | | 21,132,935 | | | | (853,722 | ) | | | 9,196,954 | |
| | | | | | | | | | | | | | | | |
Distributions to Shareholders: | | | | | | | | | | | | | | | | |
From net investment income | | | | | | | | | | | | | | | | |
Class A | | | (2,730,997 | ) | | | (4,986,696 | ) | | | (1,586,029 | ) | | | (3,209,040 | ) |
Class B | | | (30,493 | ) | | | (82,801 | ) | | | (13,283 | ) | | | (40,257 | ) |
Class C | | | (926,528 | ) | | | (1,949,160 | ) | | | (317,356 | ) | | | (727,521 | ) |
Class I | | | (1,711,629 | ) | | | (2,442,376 | ) | | | (227,249 | ) | | | (383,757 | ) |
Class Y | | | — | | | | — | | | | (303,960 | ) | | | (676,771 | ) |
| | | | | | | | | | | | | | | | |
Total distributions | | | (5,399,647 | ) | | | (9,461,033 | ) | | | (2,447,877 | ) | | | (5,037,346 | ) |
| | | | | | | | | | | | | | | | |
Capital Share Transactions: | | | | | | | | | | | | | | | | |
Sold | | | 90,009,309 | | | | 165,908,672 | | | | 20,111,083 | | | | 40,073,031 | |
Issued on reinvestment of distributions | | | 4,423,685 | | | | 7,881,709 | | | | 2,109,611 | | | | 4,461,510 | |
Redeemed | | | (43,755,004 | ) | | | (100,015,364 | ) | | | (31,419,080 | ) | | | (61,122,925 | ) |
| | | | | | | | | | | | | | | | |
Net increase (decrease) from capital share transactions | | | 50,677,990 | | | | 73,775,017 | | | | (9,198,386 | ) | | | (16,588,384 | ) |
| | | | | | | | | | | | | | | | |
Net Increase (Decrease) in Net Assets | | | 50,162,751 | | | | 85,446,919 | | | | (12,499,985 | ) | | | (12,428,776 | ) |
| | | | | | | | | | | | | | | | |
Net Assets: | | | | | | | | | | | | | | | | |
Beginning of period | | | 389,264,965 | | | | 303,818,046 | | | | 187,098,978 | | | | 199,527,754 | |
| | | | | | | | | | | | | | | | |
End of period | | $ | 439,427,716 | | | $ | 389,264,965 | | | $ | 174,598,993 | | | $ | 187,098,978 | |
| | | | | | | | | | | | | | | | |
Undistributed (distributions in excess of) net investment income | | $ | 166,541 | | | $ | 132,698 | | | $ | 30,835 | | | $ | 68,247 | |
| | | | | | | | | | | | | | | | |
The accompanying notes are an integral part of these financial statements.
|
| Hartford Funds – Tax-Exempt Fixed Income Funds |
Notes to Financial Statements
April 30, 2015 (Unaudited)
The Hartford Mutual Funds, Inc. and The Hartford Mutual Funds II, Inc. (the “Companies” and each a “Company”) each is an open-end management investment company comprised of forty-two and four series, respectively as of April 30, 2015. The financial statements for certain series of the Companies are presented in separate reports. The following series (individually, a “Fund” and collectively, the “Funds”) are included in this report.
The Hartford Mutual Funds, Inc.:
The Hartford Municipal Opportunities Fund (the “Municipal Opportunities Fund”)
The Hartford Mutual Funds II, Inc.:
The Hartford Municipal Real Return Fund (the “Municipal Real Return Fund”)
Each Company is organized under the laws of the State of Maryland and is registered with the Securities and Exchange Commission (“SEC”) under the Investment Company Act of 1940, as amended (“1940 Act”). Each Fund is a diversified open-end management investment company. Each Fund applies specialized accounting and reporting under Accounting Standards and Codification Topic 946, Financial Services – Investment Companies.
The Municipal Opportunities Fund offers Class A, Class B, Class C and Class I. The Municipal Real Return Fund offers Class A, Class B, Class C, Class I and Class Y. Class A shares are sold with a front-end sales charge of up to 4.50%. Class B shares were sold with a contingent deferred sales charge which is assessed on the lesser of the per share net asset value (“NAV”) of the shares at the time of redemption or the original purchase price, and declines from up to 5.00% to zero depending on the period of time the shares are held (see note below regarding the closing of Class B shares). Class C shares are sold with a contingent deferred sales charge of up to 1.00% on shares redeemed within twelve months of purchase. Class I shares are sold without sales charges to certain eligible investors primarily through advisory fee-based wrap programs. Class Y shares, which are sold to certain eligible institutional investors, are sold without a sales charge. All classes of shares have identical voting, redemption, dividend, liquidation and other rights and the same terms and conditions, with the exceptions that each class may have different expenses, which may affect performance, and that Class B shares automatically convert to Class A shares after 8 years.
No new or additional investments are allowed in Class B shares of each Fund (including investments through any systematic investment plan). Existing shareholders of Class B shares may continue to hold their Class B shares, exchange their Class B shares for Class B shares of another Hartford Fund (as permitted by existing exchange privileges), or redeem their Class B shares as described in each Fund’s prospectus. Reinstatement privileges with respect to Class B shares are set forth in each Fund’s prospectus. For investors electing to reinvest capital gains and dividends, any such capital gains or dividends on Class B shares will continue to be reinvested in Class B shares of each Fund. All Class B share attributes, including the 12b-1 fee, contingent deferred sales charge schedule, and conversion to Class A shares, remain unchanged.
| 2. | Significant Accounting Policies: |
The following is a summary of significant accounting policies of each Fund in the preparation of its financial statements, which are in accordance with United States Generally Accepted Accounting Principles (“U.S. GAAP”). The preparation of financial statements in accordance with U.S. GAAP may require management to make estimates and assumptions that affect the reported amounts of assets and liabilities and disclosure of contingent assets and liabilities at the date of the financial statements and the reported amounts of increases and decreases in net assets from operations during the reporting period. Actual results could differ from those estimates.
| | a) | Determination of Net Asset Value – The NAV of each class of each Fund’s shares is determined as of the close of regular trading (normally 4:00 p.m. Eastern Time) (the “NYSE Close”) on each day that the New York Stock Exchange (the “Exchange”) is open (“Valuation Date”). Information that becomes known to the Funds after the NAV has been calculated on a particular day will not generally be used to retroactively adjust the NAV determined earlier that day. |
| | b) | Investment Valuation and Fair Value Measurements – For purposes of calculating the NAV, portfolio investments and other assets held by each Fund’s portfolio for which market quotes are readily available are valued at market value. Market value is generally determined on the basis of last reported sales prices or official close price. If no sales are reported, market value is based on quotes obtained from a quotation reporting system, established market makers, or independent pricing services. If market prices are not readily available or are deemed unreliable, each Fund will use the fair value of the investment as determined in good faith under |
|
| Hartford Funds – Tax-Exempt Fixed Income Funds |
Notes to Financial Statements – (continued)
April 30, 2015 (Unaudited)
| | policies and procedures established by and under the supervision of each Company’s Board of Directors. Market quotes are considered not readily available where there is an absence of current or reliable market-based data (e.g., trade information or indicative market quotes), including where events occur after the close of the relevant market, but prior to the NYSE Close, that materially affect the values of each Fund’s portfolio investments or assets. In addition, market quotes are considered not readily available when, due to extraordinary circumstances, the exchanges or markets on which the investments trade do not open for trading for the entire day and no other market prices are available. There can be no assurance that each Fund could obtain the fair market value assigned to an investment if the Fund were to sell the investment at approximately the time at which each Fund determines its NAV. |
Fixed income investments (other than short-term obligations), non-exchange traded derivatives and centrally cleared swaps held by a Fund are normally valued on the basis of quotes obtained from independent pricing services or brokers and dealers in accordance with procedures established by each Company’s Board of Directors. Prices obtained from independent pricing services use information provided by market makers or estimates of market values through accepted market modeling, trading and pricing conventions. Inputs to the models may include, but are not limited to, prepayment speeds, pricing spread, yield, trade information, dealer quotes, market color, cash flow models and the investment’s terms and conditions. Generally, the Funds may use fair valuation in regard to fixed income investments when the Funds hold defaulted or distressed investments or investments in a company in which a reorganization is pending. Short-term investments maturing in 60 days or less are generally valued at amortized cost, if their original term to maturity was 60 days or less, or by amortizing their value on the 61st day prior to maturity, if the original term to maturity exceeded 60 days, which approximates fair value.
Investments in open-end mutual funds are valued at the respective NAV of each open-end mutual fund on the Valuation Date.
Financial instruments for which prices are not available from an independent pricing service may be valued using market quotations obtained from one or more dealers that make markets in the respective financial instrument in accordance with procedures established by each Company’s Board of Directors.
U.S. GAAP defines fair value as the price that the Funds would receive to sell an asset or pay to transfer a liability in an orderly transaction between market participants. The U.S. GAAP fair value measurement standards require disclosure of a fair value hierarchy for each major category of assets and liabilities. Various inputs are used in determining the fair value of each Fund’s investments. These inputs are summarized into three broad hierarchy levels. This hierarchy is based on whether the valuation inputs are observable or unobservable. These levels are:
| | • | | Level 1 – Quoted prices in active markets for identical investments. Level 1 may include exchange traded instruments, such as domestic equities, some foreign equities, options, futures, mutual funds, exchange traded funds, rights and warrants. |
| | • | | Level 2 – Observable inputs other than Level 1 prices, such as quoted prices for similar investments; quoted prices in markets that are not active; or other inputs that are observable or can be corroborated by observable market data. Level 2 may include debt investments that are traded less frequently than exchange traded instruments and which are valued using independent pricing services; foreign equities, which are principally traded on certain foreign markets and are adjusted daily pursuant to a fair value pricing service in order to reflect an adjustment for the factors occurring after the close of certain foreign markets but before the NYSE Close; senior floating rate interests, which are valued using an aggregate of dealer bids; short-term investments, which are valued at amortized cost; and swaps, which are valued based upon the terms of each swap contract. |
| | • | | Level 3 – Significant unobservable inputs that are supported by limited or no market activity. Level 3 may include financial instruments whose values are determined using indicative market quotes or require significant management judgment or estimation. These unobservable valuation inputs may include estimates for current yields, maturity/duration, prepayment speed, and indicative market quotes for comparable investments along with other assumptions relating to credit quality, collateral value, complexity of the investment structure, general market conditions and liquidity. This category may include investments where trading has been halted or there are certain restrictions on trading. While these investments are priced using unobservable inputs, the valuation of these investments reflects the best available data and management believes the prices are a reasonable representation of exit price. |
The Board of Directors of each Company generally reviews and approves the “Procedures for Valuation of Portfolio Securities” at least once a year. These procedures define how investments are to be valued, including the formation and activities of a Valuation Committee. The Valuation Committee is responsible for determining in good faith the fair value of investments when the value cannot be obtained from primary pricing services or alternative sources or if the valuation of an investment as provided by the primary pricing
|
| Hartford Funds – Tax-Exempt Fixed Income Funds |
Notes to Financial Statements – (continued)
April 30, 2015 (Unaudited)
service or alternative source is believed not to reflect the investment’s fair value as of the Valuation Date. Voting members of the Valuation Committee include each Company’s Treasurer or designee and a Vice President of the investment manager or designee. An Assistant Vice President of each Company with legal expertise or designee is also included on the Valuation Committee as a non-voting advisory member. In addition, each Company’s Chief Compliance Officer shall designate a member of the compliance group to attend Valuation Committee meetings as a non-voting resource, to monitor for and provide guidance with respect to compliance with these procedures. Two members of the Valuation Committee or their designees, representing different departments, shall constitute a quorum for purposes of permitting the Valuation Committee to take action. The Valuation Committee will consider all relevant factors in determining an investment’s fair value, and may seek the advice of each Fund’s subadviser, as applicable, knowledgeable brokers, and legal counsel in making such determination. The Valuation Committee reports to the Audit Committee of each Company’s Board of Directors. The Audit Committee receives quarterly written reports which include details of all fair-valued investments, including the reason for the fair valuation, and an indication, when possible, of the accuracy of the valuation by disclosing the next available reliable public price quotation or the disposition price of such investments (the “lookback” test). The Board of Directors of each Company then must consider for ratification all of the fair value determinations made during the previous quarter.
Valuation levels are not necessarily indicative of the risk associated with investing in such investments. Individual investments within any of the above mentioned asset classes may be assigned a different hierarchical level than those presented above, as individual circumstances dictate.
For additional information, refer to the Fair Valuation Summary and the Level 3 roll-forward reconciliation, if applicable, which follow the Schedule of Investments.
| | c) | Investment Transactions and Investment Income – Investment transactions are recorded as of the trade date (the date the order to buy or sell is executed) for financial reporting purposes. Investments purchased or sold on a when-issued or delayed-delivery basis may be settled a month or more after the trade date. Realized gains and losses are determined on the basis of identified cost. |
Dividend income from domestic securities is accrued on the ex-dividend date. Interest income, including amortization of premium, accretion of discounts and additional principal received in-kind in lieu of cash, is accrued on a daily basis.
| | d) | Fund Share Valuation and Dividend Distributions to Shareholders – Orders for each Fund’s shares are executed in accordance with the investment instructions of the shareholders. The NAV of each Fund’s shares is determined as of the close of business on each business day of the Exchange (see Note 2 (a)). The NAV is determined separately for each class of shares of the Fund by dividing the Fund’s net assets attributable to that class by the number of shares of the class outstanding. Each class of shares offered by the Funds has equal rights as to assets and voting privileges (except that shareholders of a class have exclusive voting rights regarding any matter relating solely to that class of shares). Income and non-class specific expenses are allocated daily to each class on the basis of the relative net assets of the class. Realized and unrealized gains and losses are allocated daily based on the relative net assets of each class of shares of each Fund. |
Orders for the purchase of the Funds’ shares received prior to the close of the Exchange on any day the Exchange is open for business are priced at the NAV determined as of the close of the Exchange. Orders received after the close of the Exchange, or on a day on which the Exchange and/or the Funds are not open for business, are priced at the next determined NAV.
Dividends are declared pursuant to a policy adopted by each Company’s Board of Directors. Dividends and/or distributions to shareholders are recorded on ex-date. Normally, dividends and/or distributions from net investment income are declared daily and paid monthly. Dividends from realized gains, if any, are paid at least once a year.
Income dividends and capital gains distributions are determined in accordance with federal income tax regulations, which may differ from U.S. GAAP with respect to character and timing (see Federal Income Taxes: Distributions and Components of Distributable Earnings and Reclassification of Capital Accounts).
| 3. | Securities and Other Investments: |
| | a) | Illiquid and Restricted Investments – Each Fund is permitted to invest up to 15% of its net assets in illiquid investments. Illiquid investments are those that may not be sold or disposed of in the ordinary course of business within seven days, at approximately the price used to determine a Fund’s NAV. A Fund may not be able to sell illiquid investments when its sub-adviser considers it desirable to do so or may have to sell such investments at a price that is lower than the price that could be obtained if the investments were |
|
| Hartford Funds – Tax-Exempt Fixed Income Funds |
Notes to Financial Statements – (continued)
April 30, 2015 (Unaudited)
| | more liquid. A sale of illiquid investments may require more time and may result in higher dealer discounts and other selling expenses than does the sale of those that are liquid. Illiquid investments also may be more difficult to value due to the unavailability of reliable market quotations for such investments, and an investment in them may have an adverse impact on a Fund’s NAV. Each Fund may also purchase certain restricted investments that can only be resold to certain qualified investors and may be determined to be liquid pursuant to policies and guidelines established by each Company’s Board of Directors. See each Fund’s Schedule of Investments, if applicable, for illiquid or restricted investments as of April 30, 2015. |
| | b) | Investments Purchased on a When-Issued or Delayed-Delivery Basis – Delivery and payment for investments that have been purchased by a Fund on a forward commitment, or when-issued or delayed-delivery basis, take place beyond the customary settlement period. A Fund may dispose of or renegotiate a delayed-delivery transaction after it is entered into, and may sell delayed-delivery investments before they are delivered, which may result in a realized gain or loss. During this period, such investments are subject to market fluctuations, and a Fund identifies investments segregated in its records with a value at least equal to the amount of the commitment. See each Fund’s Schedule of Investments, if applicable, for when-issued or delayed-delivery investments as of April 30, 2015. |
| 4. | Financial Derivative Instruments: |
The following disclosures contain information on how and why the Funds use derivative instruments, the credit-risk-related contingent features in certain derivative instruments, and how derivative instruments affect a Fund’s financial position and results of operations. The location and fair value amounts of these instruments on the Statements of Assets and Liabilities and the realized gains and losses and changes in unrealized gains and losses on the Statements of Operations, each categorized by type of derivative contract, are included in the following Additional Derivative Instrument Information footnote. The derivative instruments outstanding as of period-end are disclosed in the notes to or within the Schedules of Investments for purchased options, if applicable. The amounts of realized gains and losses and changes in unrealized gains and losses on derivative instruments during the period are disclosed in the Statements of Operations.
| | a) | Swap Contracts – Certain Funds may invest in swap contracts. Swap contracts are agreements to exchange or swap investment cash flows, assets, foreign currencies or market-linked returns at specified, future intervals. Swap contracts are either privately negotiated in the over-the-counter market (“OTC swaps”) or cleared in a central clearing house (“centrally cleared swaps”). A Fund may enter into credit default, total return, cross-currency, interest rate, inflation and other forms of swap contracts to manage its exposure to credit, currency, interest rate, commodity and inflation risk. Swap contracts are also used to gain exposure to certain markets. In connection with these contracts, investments or cash may be identified as collateral or margin in accordance with the terms of the respective swap contracts and/or master netting arrangement to provide assets of value and recourse in the event of default or bankruptcy/insolvency. |
Swaps are valued based on custom valuations furnished by an independent pricing service. Swaps for which prices are not available from an independent pricing service are valued in accordance with procedures established by the Company’s Board of Directors. Changes in market value, if any, are reflected as a component of net changes in unrealized appreciation or depreciation on the Statement of Operations. Daily changes in valuation of centrally cleared swaps, if any, are recorded as a receivable or payable for the change in value (“variation margin”) on the Statement of Assets and Liabilities. Realized gains or losses on centrally cleared swaps are recorded upon the termination of the swap. OTC swap payments received or paid at the beginning of the measurement period are reflected as such on the Statement of Assets and Liabilities and represent premiums paid or received upon entering into the swap contract to compensate for differences between the stated terms of the swap contract and prevailing market conditions (credit spreads, currency exchange rates, interest rates and other relevant factors). These upfront premiums are recorded as realized gains or losses on the Statement of Operations upon termination or maturity of the swap. A liquidation payment received or made at the termination or maturity of the swap is recorded as a realized gain or loss on the Statement of Operations. Net periodic payments received or paid by the Fund are included as part of realized gains or losses on the Statement of Operations.
Entering into these contracts involves, to varying degrees, elements of liquidation, counterparty, credit and market risk in excess of the amounts recognized on the Statement of Assets and Liabilities. Such risks involve the possibility that there will be no liquid market for these contracts, that the counterparty to the contracts may default on its obligation to perform or disagree as to the meaning of contractual terms in the contracts, and that there may be unfavorable changes in market conditions (credit spreads, currency exchange rates, interest rates and other relevant factors).
|
| Hartford Funds – Tax-Exempt Fixed Income Funds |
Notes to Financial Statements – (continued)
April 30, 2015 (Unaudited)
A Fund’s maximum risk of loss from counterparty risk for OTC swaps is the net value of the discounted cash flows to be received from the counterparty over the contract’s remaining life, and current market value, to the extent that amount is positive. The risk is mitigated by having a master netting arrangement between a Fund and the counterparty, which allows for the netting of payments made or received (although such amounts are presented on a gross basis within the Statement of Assets and Liabilities, as applicable) as well as the posting of collateral to a Fund to cover the Fund’s exposure to the counterparty. In a centrally cleared swap, while a Fund enters into an agreement with a clearing broker to execute contracts with a counterparty, the performance of the swap is guaranteed by the central clearinghouse, which reduces a Fund’s exposure to counterparty risk. A Fund is still exposed to the counterparty risk through the clearing broker and clearinghouse. The clearinghouse attempts to minimize this risk to its participants through the use of mandatory margin requirements, daily cash settlements and other procedures. Likewise, the clearing broker reduces its risk through margin requirements and required segregation of customer balances.
| | b) | Futures Contracts – The Funds may enter into futures contracts. A futures contract is an agreement between two parties to buy or sell an asset at a set price on a future date. A Fund uses futures contracts to manage or obtain exposure to the investment markets, commodities, or movements in interest rates and currency values. The primary risks associated with the use of futures contracts are the imperfect correlation between the change in market value of the investments held by a Fund and the prices of futures contracts and the possibility of an illiquid market. Upon entering into a futures contract, a Fund is required to deposit with a futures commission merchant (“FCM”) an amount of cash or U.S. Government or Agency Obligations in accordance with the initial margin requirements of the broker or exchange. Futures contracts are marked to market daily at the most recent settlement price reported by an exchange on which, over time, they are traded most extensively, and an appropriate payable or receivable for the change in value (“variation margin”) is recorded by the Funds. Gains or losses are recognized but not considered realized until the contracts expire or are closed. Futures contracts involve, to varying degrees, risk of loss in excess of the variation margin disclosed on the Statements of Assets and Liabilities; however, the Funds seek to reduce this risk through the use of an FCM. See each Fund’s Schedule of Investments, if applicable, for outstanding futures contracts as of April 30, 2015. |
| | c) | Additional Derivative Instrument Information: |
Municipal Opportunities Fund
Fair Value of Derivative Instruments on the Statement of Assets and Liabilities as of April 30, 2015:
| | | | | | | | | | | | | | | | | | | | | | | | | | | | |
| | | Risk Exposure Category | |
| | | Interest Rate
Contracts | | | Foreign
Exchange
Contracts | | | Credit
Contracts | | | Equity
Contracts | | | Commodity
Contracts | | | Other
Contracts | | | Total | |
Assets: | | | | | | | | | | | | | | | | | | | | | | | | | | | | |
Unrealized appreciation on futures contracts(1) | | $ | 359,305 | | | $ | — | | | $ | — | | | $ | — | | | $ | — | | | $ | — | | | $ | 359,305 | |
| | | | | | | | | | | | | | | | | | | | | | | | | | | | |
Total | | $ | 359,305 | | | $ | — | | | $ | — | | | $ | — | | | $ | — | | | $ | — | | | $ | 359,305 | |
| | | | | | | | | | | | | | | | | | | | | | | | | | | | |
| | (1) | Cumulative appreciation (depreciation) on futures contracts is disclosed within the Schedule of Investments under the open “Futures Contracts” section. Only current day’s variation margin, if any, are reported within the Statements of Assets and Liabilities. |
The volume of derivatives that is presented in the Schedules of Investments is consistent with the Fund’s derivatives activity during the six-month period ended April 30, 2015.
The Effect of Derivative Instruments on the Statement of Operations for the six-month period ended April 30, 2015
| | | | | | | | | | | | | | | | | | | | | | | | | | | | |
| | | Risk Exposure Category | |
| | | Interest Rate
Contracts | | | Foreign
Exchange
Contracts | | | Credit
Contracts | | | Equity
Contracts | | | Commodity
Contracts | | | Other
Contracts | | | Total | |
Net Change in Unrealized Appreciation (Depreciation) on Derivatives Recognized as a Result of Operations: | | | | | | | | | | | | | | | | | | | | | | | | | | | | |
Net change in unrealized appreciation (depreciation) of futures | | $ | 359,305 | | | $ | — | | | $ | — | | | $ | — | | | $ | — | | | $ | — | | | $ | 359,305 | |
| | | | | | | | | | | | | | | | | | | | | | | | | | | | |
Total | | $ | 359,305 | | | $ | — | | | $ | — | | | $ | — | | | $ | — | | | $ | — | | | $ | 359,305 | |
| | | | | | | | | | | | | | | | | | | | | | | | | | | | |
|
| Hartford Funds – Tax-Exempt Fixed Income Funds |
Notes to Financial Statements – (continued)
April 30, 2015 (Unaudited)
Municipal Real Return Fund
Fair Value of Derivative Instruments on the Statement of Assets and Liabilities as of April 30, 2015:
| | | | | | | | | | | | | | | | | | | | | | | | | | | | |
| | | Risk Exposure Category | |
| | | Interest Rate
Contracts | | | Foreign
Exchange
Contracts | | | Credit
Contracts | | | Equity
Contracts | | | Commodity
Contracts | | | Other
Contracts | | | Total | |
Assets: | | | | | | | | | | | | | |
Unrealized appreciation on OTC swap contracts | | $ | 45,271 | | | $ | — | | | $ | — | | | $ | — | | | $ | — | | | $ | — | | | $ | 45,271 | |
| | | | | | | | | | | | | | | | | | | | | | | | | | | | |
Total | | $ | 45,271 | | | $ | — | | | $ | — | | | $ | — | | | $ | — | | | $ | — | | | $ | 45,271 | |
| | | | | | | | | | | | | | | | | | | | | | | | | | | | |
| | | | | | | |
Liabilities: | | | | | | | | | | | | | | | | | | | | | | | | | | | | |
Unrealized depreciation on OTC swap contracts | | $ | 8,434,134 | | | $ | — | | | $ | — | | | $ | — | | | $ | — | | | $ | — | | | $ | 8,434,134 | |
| | | | | | | | | | | | | | | | | | | | | | | | | | | | |
Total | | $ | 8,434,134 | | | $ | — | | | $ | — | | | $ | — | | | $ | — | | | $ | — | | | $ | 8,434,134 | |
| | | | | | | | | | | | | | | | | | | | | | | | | | | | |
The volume of derivatives that is presented in the Schedules of Investments is consistent with the Fund’s derivatives activity during the six-month period ended April 30, 2015.
The Effect of Derivative Instruments on the Statement of Operations for the six-month period ended April 30, 2015
| | | | | | | | | | | | | | | | | | | | | | | | | | | | |
| | | Risk Exposure Category | |
| | | Interest Rate
Contracts | | | Foreign
Exchange
Contracts | | | Credit
Contracts | | | Equity
Contracts | | | Commodity
Contracts | | | Other
Contracts | | | Total | |
Realized Gain on Derivatives Recognized as a Result of Operations: | | | | | | | | | | | | | | | | | | | | | | | | | | | | |
Net realized gain (loss) on swap contracts | | $ | (1,302,536 | ) | | $ | — | | | $ | — | | | $ | — | | | $ | — | | | $ | — | | | $ | (1,302,536 | ) |
| | | | | | | | | | | | | | | | | | | | | | | | | | | | |
Total | | $ | (1,302,536 | ) | | $ | — | | | $ | — | | | $ | — | | | $ | — | | | $ | — | | | $ | (1,302,536 | ) |
| | | | | | | | | | | | | | | | | | | | | | | | | | | | |
| | | | | | | |
Net Change in Unrealized Appreciation (Depreciation) on Derivatives Recognized as a Result of Operations: | | | | | | | | | | | | | | | | | | | | | | | | | | | | |
Net change in unrealized appreciation (depreciation) of swap contracts | | $ | (1,891,759 | ) | | $ | — | | | $ | — | | | $ | — | | | $ | — | | | $ | — | | | $ | (1,891,759 | ) |
| | | | | | | | | | | | | | | | | | | | | | | | | | | | |
Total | | $ | (1,891,759 | ) | | $ | — | | | $ | — | | | $ | — | | | $ | — | | | $ | — | | | $ | (1,891,759 | ) |
| | | | | | | | | | | | | | | | | | | | | | | | | | | | |
| | d) | Balance Sheet Offsetting Information – Set forth below are tables which disclose both gross information and net information about instruments and transactions eligible for offset in the financial statements, and instruments and transactions that are subject to a master netting arrangement, as well as amounts related to margin, reflected as financial collateral (including cash collateral), held at clearing brokers, counterparties and the Funds’ custodian. The master netting arrangements (“MNA”) allow the clearing brokers to net any collateral held in or on behalf of the Funds, or liabilities or payment obligations of the clearing brokers to the Funds, against any liabilities or payment obligations of the Funds to the clearing brokers. The Funds are required to deposit financial collateral (including cash collateral) at the Funds’ custodian on behalf of clearing brokers and counterparties to continually meet the original and maintenance requirements established by the clearing brokers and counterparties. Such requirements are specific to the respective clearing broker or counterparty. Certain master netting arrangements may not be enforceable in a bankruptcy. |
The following tables present the Funds’ derivative assets and liabilities, if any, by counterparty net of amounts available for offset under a master netting agreement or similar agreement (“MNA”) and net of the related collateral received/pledged by the Funds as of April 30, 2015:
| | | | | | | | |
| Municipal Real Return Fund | |
Derivative Financial Instruments: | | Assets ($) | | | Liabilities ($) | |
Swap contracts | | | 45,271 | | | | (8,434,134 | ) |
| | | | | | | | |
Total gross amount of derivative assets and liabilities in the Statement of Assets and Liabilities | | | 45,271 | | | | (8,434,134 | ) |
| | | | | | | | |
Derivatives not subject to a MNA | | | — | | | | — | |
| | | | | | | | |
Total gross amount of assets and liabilities subject to MNA or similar agreements | | | 45,271 | | | | (8,434,134 | ) |
| | | | | | | | |
|
| Hartford Funds – Tax-Exempt Fixed Income Funds |
Notes to Financial Statements – (continued)
April 30, 2015 (Unaudited)
| | | | | | | | | | | | | | | | | | | | |
| Municipal Real Return Fund | |
Counterparty | | Gross Amount of
Assets ($) | | | Financial
Instruments
and
Derivatives
Available for
Offset ($) | | | Non-cash
Collateral
Received ($)* | | | Cash
Collateral
Received ($)* | | | Net Amount
of
Assets ($) | |
Barclays | | | 5,902 | | | | (5,902 | ) | | | — | | | | — | | | | — | |
BNP Paribas Securities Services | | | 23,988 | | | | (23,988 | ) | | | — | | | | — | | | | — | |
Deutsche Bank Securities, Inc. | | | 1,457 | | | | (1,457 | ) | | | — | | | | — | | | | — | |
JP Morgan Chase & Co. | | | 13,924 | | | | (13,924 | ) | | | — | | | | — | | | | — | |
| | | | | | | | | | | | | | | | | | | | |
Total | | | 45,271 | | | | (45,271 | ) | | | — | | | | — | | | | — | |
| | | | | | | | | | | | | | | | | | | | |
| | | | | | | | | | | | | | | | | | | | |
Counterparty | | Gross Amount of
Liabilities ($) | | | Financial
Instruments
and
Derivatives
Available for
Offset ($) | | | Non-cash
Collateral
Pledged ($)* | | | Cash
Collateral
Pledged ($)* | | | Net Amount
of
Liabilities ($) | |
Bank of America Securities LLC | | | (450,258 | ) | | | — | | | | — | | | | 260,000 | | | | (190,258 | ) |
Barclays | | | (2,124,297 | ) | | | 5,902 | | | | — | | | | 2,118,395 | | | | — | |
BNP Paribas Securities Services | | | (80,981 | ) | | | 23,988 | | | | — | | | | — | | | | (56,993 | ) |
Citibank NA | | | (92,967 | ) | | | — | | | | — | | | | — | | | | (92,967 | ) |
Deutsche Bank Securities, Inc. | | | (358,727 | ) | | | 1,457 | | | | — | | | | 357,270 | | | | — | |
JP Morgan Chase & Co. | | | (2,404,117 | ) | | | 13,924 | | | | — | | | | 2,390,193 | | | | — | |
Morgan Stanley | | | (127,269 | ) | | | — | | | | — | | | | 127,269 | | | | — | |
UBS AG | | | (2,795,518 | ) | | | — | | | | — | | | | 2,795,518 | | | | — | |
| | | | | | | | | | | | | | | | | | | | |
Total | | | (8,434,134 | ) | | | 45,271 | | | | — | | | | 8,048,645 | | | | (340,218 | ) |
| | | | | | | | | | | | | | | | | | | | |
| | * | In some instances, the actual collateral received and/or pledged may be more than the amount shown. |
Credit risk depends largely on the perceived financial health of bond issuers. In general, the credit rating is inversely related to the credit risk of the issuer. Higher rated bonds generally are deemed to have less credit risk, while lower or unrated bonds are deemed to have higher risk of default. The share price, yield and total return of a fund that holds securities with higher credit risk may be more volatile than those of a fund that holds bonds with lower credit risk. Similar to credit risk, a Fund may be exposed to counterparty risk, or the risk that an institution or other entity with which a Fund has unsettled or open transactions will default.
Each Fund’s investments expose the Fund to various risks which may include, but are not limited to, interest rate, prepayment and extension risks. Interest rate risk is the risk that fixed income securities will decline in value because of changes in interest rates. As nominal interest rates rise, the values of certain fixed income securities held by the Funds are likely to decrease. A nominal interest rate can be described as the sum of a real interest rate and an expected inflation rate. Fixed income securities with longer durations tend to be more sensitive to changes in interest rates, usually making them more volatile than securities with shorter durations. Duration is useful primarily as a measure of the sensitivity of a fixed income security’s market price to interest rate (i.e., yield) movements. Rising interest rates may cause prepayments to occur at a slower than expected rate, thereby effectively lengthening the maturity of the security and making the security more sensitive to interest rate changes.
| | a) | Each Fund intends to continue to qualify as a Regulated Investment Company (“RIC”) under Subchapter M of the Internal Revenue Code (“IRC”) by distributing substantially all of its taxable net investment income and net realized capital gains to its shareholders. |
|
| Hartford Funds – Tax-Exempt Fixed Income Funds |
Notes to Financial Statements – (continued)
April 30, 2015 (Unaudited)
| | Each Fund has distributed substantially all of its income and capital gains in prior years, if applicable, and intends to distribute substantially all of its income and capital gains during the calendar year ending December 31, 2015. Accordingly, no provision for federal income or excise taxes has been made in the accompanying financial statements. Distributions from short-term capital gains are treated as ordinary income distributions for federal income tax purposes. |
| | b) | Net Investment Income (Loss), Net Realized Gains (Losses) and Distributions – Net investment income (loss) and net realized gains (losses) may differ for financial statement and tax purposes primarily because of losses deferred due to wash sale adjustments, foreign currency gains and losses, adjustments related to Passive Foreign Investment Companies (“PFICs”), Real Estate Investment Trusts (“REITs”), RICs, certain derivatives and partnerships. The character of distributions made during the year from net investment income or net realized gains may differ from their ultimate characterization for federal income tax purposes. Also, due to the timing of dividend distributions, the fiscal year in which amounts are distributed may differ from the year that the income or realized gains (losses) were recorded by the Funds. |
| | c) | Distributions and Components of Distributable Earnings – The tax character of distributions paid by each Fund for the years ended October 31, 2014 and October 31, 2013 are as follows (as adjusted for dividends payable, if applicable): |
| | | | | | | | | | | | | | | | |
Fund | | Tax Exempt Income
for the Year Ended
October 31, 2014 | | | Ordinary Income
for the Year Ended
October 31, 2014 | | | Tax Exempt Income
for the Year Ended
October 31, 2013 | | | Ordinary Income
for the Year Ended
October 31, 2013 | |
Municipal Opportunities Fund | | $ | 9,362,323 | | | $ | 72,719 | | | $ | 11,647,489 | | | $ | 67,786 | |
Municipal Real Return Fund | | $ | 5,041,336 | | | $ | 2,592 | | | $ | 5,666,286 | | | $ | — | |
As of October 31, 2014, the components of distributable earnings (deficit) for each Fund on a tax basis are as follows:
| | | | | | | | | | | | | | | | |
| | | Undistributed
Ordinary
Income | | | Accumulated
Capital and
Other
Losses(1) | | | Unrealized
Appreciation
(Depreciation)
on
Investments(2) | | | Total
Accumulated
Earnings
(Deficit) | |
Municipal Opportunities Fund | | $ | 278,600 | | | $ | (28,932,232 | ) | | $ | 17,522,183 | | | $ | (11,131,449 | ) |
Municipal Real Return Fund | | $ | 112,582 | | | $ | (43,953,986 | ) | | $ | 3,445,875 | | | $ | (40,395,529 | ) |
| | (1) | The Funds have capital loss carryforwards that are identified in the Capital Loss Carryforward note that follows. |
| | (2) | Differences between book-basis and tax-basis unrealized appreciation (depreciation) may be attributable to the losses deferred due to wash sale adjustments and short-term capital gain adjustments. |
| | d) | Reclassification of Capital Accounts – The Funds may record reclassifications in its capital accounts. These reclassifications have no impact on the total net assets of the Funds. The reclassifications are a result of permanent differences between U.S. GAAP and tax accounting for such items as foreign currency, PFICs, expiration or utilization of capital loss carryforwards or net operating losses. Adjustments are made to reflect the impact these items have on current and future distributions to shareholders. Therefore, the source of the Funds’ distributions may be shown in the accompanying Statements of Changes in Net Assets as from undistributed net investment income, from accumulated net realized gains on investments or from capital depending on the type of book and tax differences that exist. For the period ended April 30, 2015, the Funds had no reclassifications. |
| | e) | Capital Loss Carryforward – On December 22, 2010, the Regulated Investment Company Modernization Act of 2010 (the “Act”) was enacted, which made changes to the capital loss carryforward rules. The changes are effective for taxable years beginning after the date of enactment. Under the Act, funds are permitted to carry forward capital losses for an unlimited period. However, any losses incurred during those future taxable years will be required to be utilized prior to the losses incurred in pre-enactment taxable years, which carry an expiration date. As a result of this ordering rule, pre-enactment capital loss carryforwards may be more likely to expire unused. Additionally, post-enactment capital loss carryforwards retain their character as either short-term or long-term capital losses rather than being considered all short-term as permitted under prior regulation. |
|
| Hartford Funds – Tax-Exempt Fixed Income Funds |
Notes to Financial Statements – (continued)
April 30, 2015 (Unaudited)
At October 31, 2014 (tax year end), the capital loss carryforwards for U.S. federal income tax purposes were as follows:
| | | | | | | | | | | | | | | | | | | | |
| | | Year of Expiration | | | Unlimited
Long-Term
Capital Loss
Carryforward | |
Fund | | 2016 | | | 2017 | | | 2018 | | | 2019 | | |
Municipal Opportunities Fund | | $ | — | | | $ | 12,265,503 | | | $ | 6,120,720 | | | $ | 10,546,009 | | | $ | — | |
Municipal Real Return Fund | | $ | 18,856,445 | | | $ | 16,621,393 | | | $ | 6,087,643 | | | $ | 1,653,837 | | | $ | 734,668 | |
As a result of mergers in The Hartford Municipal Real Return Fund, certain provisions in the IRC may limit the future utilization of capital losses. During the year ended October 31, 2014, the Municipal Real Return Fund utilized $149,766 of post RIC modernization capital loss carryforwards and Municipal Opportunities Fund utilized $2,243,064 of prior year capital loss carryforwards.
| | f) | Accounting for Uncertainty in Income Taxes – Under provisions set forth by U.S. GAAP, the Adviser reviews each Fund’s tax positions for all open tax years. As of October 31, 2014, the Adviser had reviewed the open tax years and concluded that there was no reason to record a liability for net unrecognized tax benefits relating to uncertain income tax positions. Each Fund files U.S. tax returns. Although the statute of limitations for examining a Fund’s U.S. tax returns remains open for 3 years, no examination is currently in progress. No Fund is aware of any tax positions for which it is reasonably possible that the total amounts of unrecognized tax benefits will significantly change in the next twelve months. |
| | a) | Investment Management Agreement – Hartford Funds Management Company, LLC (“HFMC”) serves as each Fund’s investment manager pursuant to an Investment Management Agreement with each Company. HFMC is an indirect subsidiary of The Hartford Financial Services Group, Inc. (“The Hartford”). The investment manager has overall investment supervisory responsibility for the Fund. In addition, the investment manager provides administrative personnel, services, equipment, facilities and office space for proper operation of each Fund. HFMC has contracted with Wellington Management Company LLP (“Wellington Management”) under a sub-advisory agreement for the provision of day-to-day investment management services to each Fund in accordance with each Fund’s investment objective and policies. Each Fund pays a fee to the investment manager, a portion of which may be used to compensate Wellington Management. |
The schedule below reflects the rates of compensation paid to the investment manager for investment management services rendered as of April 30, 2015; the rates are accrued daily and paid monthly based on each Fund’s average daily net assets, at the following annual rates:
| | |
| | | Management Fee Rates |
Municipal Opportunities Fund | | 0.5500% on first $500 million and; |
| | 0.5000% on next $500 million and; |
| | 0.4750% on next $1.5 billion and; |
| | 0.4650% on next $2.5 billion and; |
| | 0.4550% on next $5 billion and; |
| | 0.4450% over $10 billion |
| |
Municipal Real Return Fund | | 0.50% on first $500 million and; |
| | 0.45% on next $500 million and; |
| | 0.44% on next $1.5 billion and; |
| | 0.43% on next $2.5 billion and; |
| | 0.42% on next $5 billion and; |
| | 0.41% over $10 billion |
|
| Hartford Funds – Tax-Exempt Fixed Income Funds |
Notes to Financial Statements – (continued)
April 30, 2015 (Unaudited)
| | b) | Accounting Services Agreement – Pursuant to the Fund Accounting Agreement between HFMC and each Company, on behalf of each Fund, HFMC provides accounting services to each Fund and receives monthly compensation based on each Fund’s average daily net assets at the rates set forth below. Each Fund’s accounting services fees are accrued daily and paid monthly. |
| | |
| | | Accounting Services Fee Rates |
Municipal Opportunities Fund | | 0.018% on first $5 billion and; |
| | 0.014% on next $5 billion and; |
| | 0.010% over $10 billion |
| |
Municipal Real Return Fund | | 0.016% on first $5 billion and; |
| | 0.013% on next $5 billion and; |
| | 0.010% over $10 billion |
Effective February 28, 2015, HFMC has delegated certain accounting and administrative services functions to State Street Bank and Trust Company (“State Street”). The costs and expenses of such delegation will be borne by HFMC, not by the Funds, and HFMC will compensate State Street for its services out of its own resources.
| | c) | Operating Expenses – Allocable expenses incurred by each Company are allocated to each Fund and allocated to classes within each Fund in proportion to the average daily net assets of each Fund and each class, except where allocation of certain expenses is more fairly made directly to each Fund or to specific classes within a Fund. As of April 30, 2015, HFMC contractually limited the total operating expenses of each Fund, exclusive of taxes, interest expense, brokerage commissions and extraordinary expenses, through February 29, 2016 as follows: |
| | | | | | | | | | | | | | | | | | | | |
| | | Expense Limit as a Percentage of Average Daily Net Assets | |
Fund | | Class A | | | Class B | | | Class C | | | Class I | | | Class Y | |
Municipal Opportunities Fund | | | 0.69 | % | | | 1.44 | % | | | 1.44 | % | | | 0.44 | % | | | N/A | |
Municipal Real Return Fund | | | 0.69 | % | | | 1.44 | % | | | 1.44 | % | | | 0.44 | % | | | 0.44 | % |
From November 1, 2014 through February 28, 2015, the investment manager contractually limited the total operating expenses of the following funds, exclusive of taxes, interest expense, brokerage commissions, acquired fund fees and expenses and extraordinary expenses as follows:
| | | | | | | | | | | | | | | | | | | | |
| | | Expense Limit as a Percentage of Average Daily Net Assets | |
Fund | | Class A | | | Class B | | | Class C | | | Class I | | | Class Y | |
Municipal Opportunities Fund | | | 0.90 | % | | | 1.65 | % | | | 1.65 | % | | | 0.65 | % | | | N/A | |
Municipal Real Return Fund | | | 0.85 | % | | | 1.60 | % | | | 1.60 | % | | | 0.60 | % | | | 0.60 | % |
| | d) | Distribution and Service Plan for Class A, B and C Shares – Hartford Funds Distributors, LLC (“HFD”), an indirect subsidiary of The Hartford, is the principal underwriter and distributor of the Funds. HFD is engaged in distribution activities, which include marketing and distribution of shares through broker/dealers, financing distribution costs and maintaining financial books and records. For the six-month period ended April 30, 2015, HFD received front-end sales charges and contingent deferred sales charges for each Fund as follows: |
| | | | | | | | |
Fund | | Front-end Load
Sales Charges | | | Contingent Deferred
Sales Charges | |
Municipal Opportunities Fund | | $ | 351,744 | | | $ | 2,837 | |
Municipal Real Return Fund | | | 130,389 | | | | 1,930 | |
| | e) | Other Related Party Transactions – Certain officers of the Funds are directors and/or officers of HFMC and/or The Hartford or its subsidiaries. For the six-month period ended April 30, 2015, a portion of the Funds’ Chief Compliance Officer’s compensation was paid by all of the investment companies in the Hartford fund complex. Hartford Administrative Services Company (“HASCO”), an indirect subsidiary of The Hartford, provides transfer agent services to the Funds. HASCO has contractually agreed to reimburse any portion of the transfer agency fees over 0.30% of average daily net assets per fiscal year for each class. Any transfer agency fee reimbursement is determined before considering the contractual operating expense limitation. For providing such services, HASCO is compensated on a per account basis that varies by account type, except with respect to Class Y, for which it is compensated based |
|
| Hartford Funds – Tax-Exempt Fixed Income Funds |
Notes to Financial Statements – (continued)
April 30, 2015 (Unaudited)
| | on average daily net assets. Effective December 1, 2014, pursuant to a sub-transfer agency agreement between HASCO and Boston Financial Data Services, Inc. (“BFDS”), HASCO delegated certain transfer agent, dividend disbursing agent and shareholder servicing agent functions to BFDS. HASCO is compensated based on average daily net assets, plus out of pocket expenses for providing such services, a portion of which may be used to compensate BFDS. The amount paid to HASCO and any related contractual reimbursement amounts, if applicable, can be found in the Statement of Operations. These fees are accrued daily and paid monthly. |
| 8. | Investment Transactions: |
For the six-month period ended April 30, 2015, the cost of purchases and proceeds from sales of investment securities (excluding short-term investments) were as follows:
| | | | | | | | |
| | | Cost of Purchases
Excluding U.S.
Government
Obligations | | | Sales Proceeds
Excluding U.S.
Government
Obligations | |
| | | | | | | | |
Municipal Opportunities Fund | | $ | 104,849,458 | | | $ | 51,517,263 | |
Municipal Real Return Fund | | $ | 26,607,209 | | | $ | 39,162,161 | |
| | |
| | | Cost of Purchases
Including U.S.
Government
Obligations | | | Sales Proceeds
Including U.S.
Government
Obligations | |
Municipal Opportunities Fund | | $ | — | | | $ | — | |
Municipal Real Return Fund | | $ | — | | | $ | — | |
| | |
| | | Total Cost of
Purchases | | | Total Sales
Proceeds | |
Municipal Opportunities Fund | | $ | 104,849,458 | | | $ | 51,517,263 | |
Municipal Real Return Fund | | $ | 26,607,209 | | | $ | 39,162,161 | |
| 9. | Capital Share Transactions: |
The following information is for the six-month period ended April 30, 2015, and the year ended October 31, 2014:
Municipal Opportunities Fund
| | | | | | | | | | | | | | | | |
| | | For the Six-Month Period
Ended April 30, 2015 | | | For the Year Ended
October 31, 2014 | |
| | | Shares | | | Amount | | | Shares | | | Amount | |
Class A | | | | | | | | | | | | | | | | |
Shares Sold | | | 4,269,744 | | | $ | 36,598,941 | | | | 9,411,693 | | | $ | 79,052,562 | |
Shares Issued for Reinvested Dividends | | | 288,728 | | | | 2,475,212 | | | | 546,686 | | | | 4,576,431 | |
Shares Redeemed | | | (2,554,097 | ) | | | (21,867,459 | ) | | | (6,068,228 | ) | | | (50,732,364 | ) |
Shares converted (from) Class B into Class A | | | — | | | | — | | | | 816 | | | | 6,782 | |
| | | | | | | | | | | | | | | | |
Net Increase (Decrease) | | | 2,004,375 | | | | 17,206,694 | | | | 3,890,967 | | | | 32,903,411 | |
| | | | | | | | | | | | | | | | |
Class B | | | | | | | | | | | | | | | | |
Shares Sold | | | 9,750 | | | $ | 83,922 | | | | 6,605 | | | $ | 55,424 | |
Shares Issued for Reinvested Dividends | | | 2,755 | | | | 23,598 | | | | 7,655 | | | | 63,892 | |
Shares Redeemed | | | (46,916 | ) | | | (402,236 | ) | | | (141,778 | ) | | | (1,179,527 | ) |
Shares converted (from) Class B into Class A | | | — | | | | — | | | | (816 | ) | | | (6,782 | ) |
| | | | | | | | | | | | | | | | |
Net Increase (Decrease) | | | (34,411 | ) | | | (294,716 | ) | | | (128,334 | ) | | | (1,066,993 | ) |
| | | | | | | | | | | | | | | | |
|
| Hartford Funds – Tax-Exempt Fixed Income Funds |
Notes to Financial Statements – (continued)
April 30, 2015 (Unaudited)
| | | | | | | | | | | | | | | | |
| | | For the Six-Month Period
Ended April 30, 2015 | | | For the Year Ended
October 31, 2014 | |
| | | Shares | | | Amount | | | Shares | | | Amount | |
Class C | | | | | | | | | | | | | | | | |
Shares Sold | | | 1,520,136 | | | $ | 13,050,178 | | | | 2,441,067 | | | $ | 20,487,206 | |
Shares Issued for Reinvested Dividends | | | 89,255 | | | | 765,500 | | | | 191,265 | | | | 1,600,816 | |
Shares Redeemed | | | (931,688 | ) | | | (8,002,215 | ) | | | (2,489,065 | ) | | | (20,731,107 | ) |
| | | | | | | | | | | | | | | | |
Net Increase (Decrease) | | | 677,703 | | | | 5,813,463 | | | | 143,267 | | | | 1,356,915 | |
| | | | | | | | | | | | | | | | |
Class I | | | | | | | | | | | | | | | | |
Shares Sold | | | 4,685,227 | | | $ | 40,276,268 | | | | 7,905,472 | | | $ | 66,313,480 | |
Shares Issued for Reinvested Dividends | | | 134,966 | | | | 1,159,375 | | | | 195,316 | | | | 1,640,570 | |
Shares Redeemed | | | (1,571,160 | ) | | | (13,483,094 | ) | | | (3,278,613 | ) | | | (27,372,366 | ) |
| | | | | | | | | | | | | | | | |
Net Increase (Decrease) | | | 3,249,033 | | | | 27,952,549 | | | | 4,822,175 | | | | 40,581,684 | |
| | | | | | | | | | | | | | | | |
Total Net Increase (Decrease) | | | 5,896,700 | | | $ | 50,677,990 | | | | 8,728,075 | | | $ | 73,775,017 | |
| | | | | | | | | | | | | | | | |
Municipal Real Return Fund
| | | | | | | | | | | | | | | | |
| | | For the Six-Month Period
Ended April 30, 2015 | | | For the Year Ended
October 31, 2014 | |
| | | Shares | | | Amount | | | Shares | | | Amount | |
Class A | | | | | | | | | | | | | | | | |
Shares Sold | | | 1,407,770 | | | $ | 13,214,531 | | | | 2,426,699 | | | $ | 22,922,294 | |
Shares Issued for Reinvested Dividends | | | 150,630 | | | | 1,412,665 | | | | 317,370 | | | | 2,988,751 | |
Shares Redeemed | | | (1,874,789 | ) | | | (17,577,813 | ) | | | (3,921,484 | ) | | | (36,602,552 | ) |
Shares converted (from) Class B into Class A | | | 992 | | | | 9,280 | | | | 6,274 | | | | 58,966 | |
| | | | | | | | | | | | | | | | |
Net Increase (Decrease) | | | (315,397 | ) | | | (2,941,337 | ) | | | (1,171,141 | ) | | | (10,632,541 | ) |
| | | | | | | | | | | | | | | | |
Class B | | | | | | | | | | | | | | | | |
Shares Sold | | | 4,512 | | | $ | 41,783 | | | | 399 | | | $ | 3,672 | |
Shares Issued for Reinvested Dividends | | | 1,365 | | | | 12,687 | | | | 4,127 | | | | 38,486 | |
Shares Redeemed | | | (39,964 | ) | | | (371,850 | ) | | | (77,983 | ) | | | (727,552 | ) |
Shares converted (from) Class B into Class A | | | (1,001 | ) | | | (9,280 | ) | | | (6,274 | ) | | | (58,966 | ) |
| | | | | | | | | | | | | | | | |
Net Increase (Decrease) | | | (35,088 | ) | | | (326,660 | ) | | | (79,731 | ) | | | (744,360 | ) |
| | | | | | | | | | | | | | | | |
Class C | | | | | | | | | | | | | | | | |
Shares Sold | | | 293,464 | | | $ | 2,738,840 | | | | 335,006 | | | $ | 3,143,215 | |
Shares Issued for Reinvested Dividends | | | 25,235 | | | | 235,262 | | | | 56,403 | | | | 527,991 | |
Shares Redeemed | | | (514,285 | ) | | | (4,793,170 | ) | | | (1,143,070 | ) | | | (10,642,005 | ) |
| | | | | | | | | | | | | | | | |
Net Increase (Decrease) | | | (195,586 | ) | | | (1,819,068 | ) | | | (751,661 | ) | | | (6,970,799 | ) |
| | | | | | | | | | | | | | | | |
Class I | | | | | | | | | | | | | | | | |
Shares Sold | | | 431,337 | | | $ | 4,048,024 | | | | 1,465,588 | | | $ | 13,967,717 | |
Shares Issued for Reinvested Dividends | | | 21,162 | | | | 199,046 | | | | 35,945 | | | | 340,242 | |
Shares Redeemed | | | (765,033 | ) | | | (7,187,182 | ) | | | (1,125,206 | ) | | | (10,595,529 | ) |
| | | | | | | | | | | | | | | | |
Net Increase (Decrease) | | | (312,534 | ) | | | (2,940,112 | ) | | | 376,327 | | | | 3,712,430 | |
| | | | | | | | | | | | | | | | |
Class Y | | | | | | | | | | | | | | | | |
Shares Sold | | | 7,287 | | | $ | 67,905 | | | | 3,898 | | | $ | 36,133 | |
Shares Issued for Reinvested Dividends | | | 26,726 | | | | 249,951 | | | | 60,266 | | | | 566,040 | |
Shares Redeemed | | | (158,913 | ) | | | (1,489,065 | ) | | | (272,927 | ) | | | (2,555,287 | ) |
| | | | | | | | | | | | | | | | |
Net Increase (Decrease) | | | (124,900 | ) | | | (1,171,209 | ) | | | (208,763 | ) | | | (1,953,114 | ) |
| | | | | | | | | | | | | | | | |
Total Net Increase (Decrease) | | | (983,505 | ) | | $ | (9,198,386 | ) | | | (1,834,969 | ) | | $ | (16,588,384 | ) |
| | | | | | | | | | | | | | | | |
|
| Hartford Funds – Tax-Exempt Fixed Income Funds |
Notes to Financial Statements – (continued)
April 30, 2015 (Unaudited)
Each Fund, together with certain other Hartford Funds, participates in a $350 million committed revolving line of credit facility. The facility is to be used for temporary or emergency purposes. Under the arrangement, the funds are required to own securities having a market value in excess of 300% of the total bank borrowings. The interest rate on borrowings varies depending on the nature of the loan. The facility also requires a fee to be paid based on the amount of the commitment. This commitment fee is allocated to all the funds participating in the line of credit based on the average net assets of the funds. During the six-month period ended April 30, 2015, neither of the Funds had borrowings under this facility.
| 11. | Pending Legal Proceedings: |
On February 25, 2011, Jennifer L. Kasilag, Louis Mellinger, Judith M. Menendez, Jacqueline M. Robinson, and Linda A. Russell filed a derivative lawsuit against Hartford Investment Financial Services, LLC (“HIFSCO”) (now known as HFD) on behalf of six Hartford retail mutual funds in the United States District Court for the District of New Jersey, alleging that HIFSCO received excessive advisory and distribution fees in violation of its statutory fiduciary duty under Section 36(b) of the 1940 Act when serving as investment manager and principal underwriter, respectively, to the Hartford retail mutual funds. Although this action was purportedly filed on behalf of certain of the Hartford Funds, none of the Hartford Funds is itself a defendant to the suit. HIFSCO moved to dismiss and, in September 2011, the motion was granted in part and denied in part, with leave to amend the complaint. In November 2011, plaintiffs filed an amended complaint on behalf of certain Hartford retail mutual funds, The Hartford Global Health Fund (now known as The Hartford Healthcare Fund), The Hartford Conservative Allocation Fund, The Hartford Growth Opportunities Fund, The Hartford Inflation Plus Fund, The Hartford Advisers Fund (now known as The Hartford Balanced Fund), and The Hartford Capital Appreciation Fund. Plaintiffs seek to rescind the investment management agreements and distribution plans between HIFSCO and these funds and to recover the total fees charged thereunder or, in the alternative, to recover any improper compensation HIFSCO received, in addition to lost earnings. HIFSCO filed a partial motion to dismiss the amended complaint and, in December 2012, the court dismissed without prejudice the claims regarding distribution fees and denied the motion with respect to the advisory fees claims. In March 2014, the plaintiffs filed a new complaint that added as new plaintiffs The Hartford Floating Rate Fund and The Hartford Small Company Fund and named as a defendant HFMC, which assumed the role as investment manager to the funds as of January 2013. In March 2015, the plaintiffs filed a new complaint that removed The Hartford Small Company Fund as a plaintiff. Discovery is ongoing. HFMC and HIFSCO dispute the allegations and have filed a motion for summary judgment.
No accrual for litigation relating to this matter has been recorded in the financial statements of the Funds because the Funds are not party to the suit.
Under the Company’s organizational documents, each Company shall indemnify its officers and directors to the full extent required or permitted under Maryland General Corporation Law and the federal securities laws. In addition, each Company, on behalf of each Fund, may enter into contracts that contain a variety of indemnifications. Each Company’s maximum exposure under these arrangements is unknown. However, as of the date of these financial statements, each Company has not had prior claims or losses pursuant to these contracts and expects the risk of loss to be remote.
| 13. | Recent Accounting Pronouncement: |
In June 2014, the Financial Accounting Standards Board (FASB) issued Accounting Standards Update (ASU) No. 2014-11, Transfers and Servicing (Topic 860): Repurchase-to-Maturity Transactions, Repurchase Financings, and Disclosures, modifying Accounting Standards Codification Topic 860. The amended guidance changes the accounting for repurchase-to-maturity transactions and repurchase financing arrangements. The guidance also requires new disclosures for certain transfers accounted for as sales and collateral supporting transactions that are accounted for as secured borrowings. ASU 2014-11 is effective for annual and interim periods beginning after December 15, 2014, except for the disclosures related to secured borrowings, which are effective for annual periods beginning after December 15, 2014, and for interim periods beginning after March 15, 2015. The adoption of ASU 2014-11 is not expected to have a material impact on the Fund’s results of operations or financial position, but may impact the Fund’s disclosures.
|
| Hartford Funds – Tax-Exempt Fixed Income Funds |
Financial Highlights
| | | | | | | | | | | | | | | | | | | | | | | | | | | | | | | | | | | | | | | | | | | | | | | | | | | | | | | | | | | | |
| | | — Selected Per-Share Data(1) — | | | — Ratios and Supplemental Data — | |
Class | | Net Asset
Value at,
Beginning
of Period | | | Net
Investment
Income
(Loss) | | | Net
Realized
and
Unrealized
Gain (Loss)
on
Investments | | | Total from
Investment
Operations | | | Dividends
from Net
Investment
Income | | | Distributions
from
Realized
Capital
Gains | | | Distributions
Capital | | | Total
Dividends
and
Distributions | | | Net
Asset
Value
End of
Period | | | Total
Return(2) | | | Net
Assets at
End of
Period
(000s) | | | Ratio of
Expenses
to
Average
Net
Assets
Before
Adjust-
ments(3) | | | Ratio of
Expenses
to
Average
Net
Assets
After
Adjust-
ments(3) | | | Ratio of
Net
Investment
Income
(Loss) to
Average
Net Assets | | | Portfolio
Turnover | |
| The Hartford Municipal Opportunities Fund | |
For the Six-Month Period Ended April 30, 2015 (Unaudited) | |
A | | $ | 8.53 | | | $ | 0.12 | | | $ | (0.01 | ) | | $ | 0.11 | | | $ | (0.11 | ) | | $ | — | | | $ | — | | | $ | (0.11 | ) | | $ | 8.53 | | | | 1.24 | %(4) | | $ | 209,536 | | | | 0.89 | %(5) | | | 0.82 | %(5) | | | 2.73 | %(5) | | | 13 | % |
B | | | 8.53 | | | | 0.08 | | | | (0.01 | ) | | | 0.07 | | | | (0.08 | ) | | | — | | | | — | | | | (0.08 | ) | | | 8.52 | | | | 0.74 | (4) | | | 2,921 | | | | 1.71 | (5) | | | 1.58 | (5) | | | 1.97 | (5) | | | 13 | |
C | | | 8.54 | | | | 0.08 | | | | (0.01 | ) | | | 0.07 | | | | (0.08 | ) | | | — | | | | — | | | | (0.08 | ) | | | 8.53 | | | | 0.86 | (4) | | | 96,915 | | | | 1.65 | (5) | | | 1.58 | (5) | | | 1.97 | (5) | | | 13 | |
I | | | 8.55 | | | | 0.13 | | | | (0.02 | ) | | | 0.11 | | | | (0.12 | ) | | | — | | | | — | | | | (0.12 | ) | | | 8.54 | | | | 1.36 | (4) | | | 130,055 | | | | 0.66 | (5) | | | 0.57 | (5) | | | 2.99 | (5) | | | 13 | |
|
For the Year Ended October 31, 2014 | |
A | | $ | 8.24 | | | $ | 0.25 | | | $ | 0.30 | | | $ | 0.55 | | | $ | (0.26 | ) | | $ | — | | | $ | — | | | $ | (0.26 | ) | | $ | 8.53 | | | | 6.70 | % | | $ | 192,531 | | | | 0.90 | % | | | 0.85 | % | | | 3.03 | % | | | 29 | % |
B | | | 8.23 | | | | 0.19 | | | | 0.30 | | | | 0.49 | | | | (0.19 | ) | | | — | | | | — | | | | (0.19 | ) | | | 8.53 | | | | 6.04 | | | | 3,216 | | | | 1.72 | | | | 1.60 | | | | 2.30 | | | | 29 | |
C | | | 8.24 | | | | 0.19 | | | | 0.30 | | | | 0.49 | | | | (0.19 | ) | | | — | | | | — | | | | (0.19 | ) | | | 8.54 | | | | 6.03 | | | | 91,177 | | | | 1.66 | | | | 1.60 | | | | 2.29 | | | | 29 | |
I | | | 8.25 | | | | 0.27 | | | | 0.31 | | | | 0.58 | | | | (0.28 | ) | | | — | | | | — | | | | (0.28 | ) | | | 8.55 | | | | 7.08 | | | | 102,341 | | | | 0.65 | | | | 0.60 | | | | 3.26 | | | | 29 | |
|
For the Year Ended October 31, 2013 | |
A | | $ | 8.66 | | | $ | 0.29 | | | $ | (0.42 | ) | | $ | (0.13 | ) | | $ | (0.29 | ) | | $ | — | | | $ | — | | | $ | (0.29 | ) | | $ | 8.24 | | | | (1.58 | )% | | $ | 153,818 | | | | 0.91 | % | | | 0.91 | %(6) | | | 3.35 | % | | | 37 | % |
B | | | 8.66 | | | | 0.22 | | | | (0.43 | ) | | | (0.21 | ) | | | (0.22 | ) | | | — | | | | — | | | | (0.22 | ) | | | 8.23 | | | | (2.44 | ) | | | 4,161 | | | | 1.72 | | | | 1.66 | (6) | | | 2.60 | | | | 37 | |
C | | | 8.67 | | | | 0.22 | | | | (0.43 | ) | | | (0.21 | ) | | | (0.22 | ) | | | — | | | | — | | | | (0.22 | ) | | | 8.24 | | | | (2.44 | ) | | | 86,844 | | | | 1.66 | | | | 1.66 | (6) | | | 2.60 | | | | 37 | |
I | | | 8.68 | | | | 0.31 | | | | (0.43 | ) | | | (0.12 | ) | | | (0.31 | ) | | | — | | | | — | | | | (0.31 | ) | | | 8.25 | | | | (1.45 | ) | | | 58,996 | | | | 0.66 | | | | 0.66 | (6) | | | 3.60 | | | | 37 | |
|
For the Year Ended October 31, 2012(7) | |
A | | $ | 8.01 | | | $ | 0.34 | | | $ | 0.65 | | | $ | 0.99 | | | $ | (0.34 | ) | | $ | — | | | $ | — | | | $ | (0.34 | ) | | $ | 8.66 | | | | 12.58 | % | | $ | 202,931 | | | | 0.91 | % | | | 0.91 | %(6) | | | 4.05 | % | | | 51 | % |
B | | | 8.01 | | | | 0.28 | | | | 0.65 | | | | 0.93 | | | | (0.28 | ) | | | — | | | | — | | | | (0.28 | ) | | | 8.66 | | | | 11.75 | | | | 5,597 | | | | 1.72 | | | | 1.66 | (6) | | | 3.32 | | | | 51 | |
C | | | 8.02 | | | | 0.28 | | | | 0.65 | | | | 0.93 | | | | (0.28 | ) | | | — | | | | — | | | | (0.28 | ) | | | 8.67 | | | | 11.73 | | | | 117,699 | | | | 1.67 | | | | 1.66 | (6) | | | 3.31 | | | | 51 | |
I | | | 8.03 | | | | 0.36 | | | | 0.65 | | | | 1.01 | | | | (0.36 | ) | | | — | | | | — | | | | (0.36 | ) | | | 8.68 | | | | 12.83 | | | | 78,183 | | | | 0.67 | | | | 0.66 | (6) | | | 4.31 | | | | 51 | |
|
For the Year Ended October 31, 2011(7) | |
A | | $ | 8.47 | | | $ | 0.44 | | | $ | (0.46 | ) | | $ | (0.02 | ) | | $ | (0.44 | ) | | $ | — | | | $ | — | | | $ | (0.44 | ) | | $ | 8.01 | | | | 0.03 | % | | $ | 177,569 | | | | 0.94 | % | | | 0.93 | %(6) | | | 5.58 | % | | | 41 | % |
B | | | 8.47 | | | | 0.38 | | | | (0.46 | ) | | | (0.08 | ) | | | (0.38 | ) | | | — | | | | — | | | | (0.38 | ) | | | 8.01 | | | | (0.72 | ) | | | 5,739 | | | | 1.75 | | | | 1.68 | (6) | | | 4.84 | | | | 41 | |
C | | | 8.48 | | | | 0.38 | | | | (0.46 | ) | | | (0.08 | ) | | | (0.38 | ) | | | — | | | | — | | | | (0.38 | ) | | | 8.02 | | | | (0.72 | ) | | | 103,439 | | | | 1.70 | | | | 1.68 | (6) | | | 4.83 | | | | 41 | |
I | | | 8.49 | | | | 0.46 | | | | (0.46 | ) | | | — | | | | (0.46 | ) | | | — | | | | — | | | | (0.46 | ) | | | 8.03 | | | | 0.28 | | | | 69,575 | | | | 0.70 | | | | 0.68 | (6) | | | 5.82 | | | | 41 | |
|
For the Year Ended October 31, 2010(7) | |
A | | $ | 8.02 | | | $ | 0.45 | | | $ | 0.45 | | | $ | 0.90 | | | $ | (0.45 | ) | | $ | — | | | $ | — | | | $ | (0.45 | ) | | $ | 8.47 | | | | 11.56 | % | | $ | 238,332 | | | | 0.92 | % | | | 0.92 | %(8) | | | 5.49 | % | | | 15 | % |
B | | | 8.01 | | | | 0.38 | | | | 0.47 | | | | 0.85 | | | | (0.39 | ) | | | — | | | | — | | | | (0.39 | ) | | | 8.47 | | | | 10.82 | | | | 7,475 | | | | 1.72 | | | | 1.72 | (8) | | | 4.68 | | | | 15 | |
C | | | 8.02 | | | | 0.39 | | | | 0.46 | | | | 0.85 | | | | (0.39 | ) | | | — | | | | — | | | | (0.39 | ) | | | 8.48 | | | | 10.85 | | | | 128,723 | | | | 1.68 | | | | 1.68 | (8) | | | 4.72 | | | | 15 | |
I | | | 8.03 | | | | 0.47 | | | | 0.46 | | | | 0.93 | | | | (0.47 | ) | | | — | | | | — | | | | (0.47 | ) | | | 8.49 | | | | 11.93 | | | | 81,795 | | | | 0.68 | | | | 0.68 | (8) | | | 5.72 | | | | 15 | |
The accompanying notes are an integral part of these financial statements.
|
| Hartford Funds – Tax-Exempt Fixed Income Funds |
Financial Highlights – (continued)
| | | | | | | | | | | | | | | | | | | | | | | | | | | | | | | | | | | | | | | | | | | | | | | | | | | | | | | | | | | | |
| | | — Selected Per-Share Data(1) — | | | — Ratios and Supplemental Data — | |
Class | | Net Asset
Value at,
Beginning
of Period | | | Net
Investment
Income
(Loss) | | | Net
Realized
and
Unrealized
Gain (Loss)
on
Investments | | | Total from
Investment
Operations | | | Dividends
from Net
Investment
Income | | | Distributions
from
Realized
Capital
Gains | | | Distributions
Capital | | | Total
Dividends
and
Distributions | | | Net
Asset
Value
End of
Period | | | Total
Return(2) | | | Net
Assets at
End of
Period
(000s) | | | Ratio of
Expenses
to
Average
Net
Assets
Before
Adjust-
ments(3) | | | Ratio of
Expenses
to
Average
Net
Assets
After
Adjust-
ments(3) | | | Ratio of
Net
Investment
Income
(Loss) to
Average
Net Assets | | | Portfolio
Turnover | |
| The Hartford Municipal Real Return Fund | |
For the Six-Month Period Ended April 30, 2015 (Unaudited) | |
A | | $ | 9.50 | | | $ | 0.13 | | | $ | (0.17 | ) | | $ | (0.04 | ) | | $ | (0.13 | ) | | $ | — | | | $ | — | | | $ | (0.13 | ) | | $ | 9.33 | | | | (0.41 | )%(4) | | $ | 110,952 | | | | 0.93 | %(5) | | | 0.80 | %(5) | | | 2.78 | %(5) | | | 15 | % |
B | | | 9.41 | | | | 0.09 | | | | (0.15 | ) | | | (0.06 | ) | | | (0.10 | ) | | | — | | | | — | | | | (0.10 | ) | | | 9.25 | | | | (0.67 | )(4) | | | 1,145 | | | | 1.76 | (5) | | | 1.55 | (5) | | | 2.03 | (5) | | | 15 | |
C | | | 9.45 | | | | 0.09 | | | | (0.16 | ) | | | (0.07 | ) | | | (0.10 | ) | | | — | | | | — | | | | (0.10 | ) | | | 9.28 | | | | (0.78 | )(4) | | | 29,636 | | | | 1.67 | (5) | | | 1.55 | (5) | | | 2.03 | (5) | | | 15 | |
I | | | 9.53 | | | | 0.14 | | | | (0.17 | ) | | | (0.03 | ) | | | (0.14 | ) | | | — | | | | — | | | | (0.14 | ) | | | 9.36 | | | | (0.28 | )(4) | | | 13,461 | | | | 0.70 | (5) | | | 0.55 | (5) | | | 3.03 | (5) | | | 15 | |
Y | | | 9.48 | | | | 0.14 | | | | (0.17 | ) | | | (0.03 | ) | | | (0.14 | ) | | | — | | | | — | | | | (0.14 | ) | | | 9.31 | | | | (0.28 | )(4) | | | 19,405 | | | | 0.63 | (5) | | | 0.55 | (5) | | | 3.03 | (5) | | | 15 | |
|
For the Year Ended October 31, 2014 | |
A | | $ | 9.27 | | | $ | 0.27 | | | $ | 0.23 | | | $ | 0.50 | | | $ | (0.27 | ) | | $ | — | | | $ | — | | | $ | (0.27 | ) | | $ | 9.50 | | | | 5.46 | % | | $ | 115,957 | | | | 0.90 | % | | | 0.85 | % | | | 2.89 | % | | | 31 | % |
B | | | 9.19 | | | | 0.20 | | | | 0.22 | | | | 0.42 | | | | (0.20 | ) | | | — | | | | — | | | | (0.20 | ) | | | 9.41 | | | | 4.62 | | | | 1,497 | | | | 1.73 | | | | 1.60 | | | | 2.15 | | | | 31 | |
C | | | 9.22 | | | | 0.20 | | | | 0.23 | | | | 0.43 | | | | (0.20 | ) | | | — | | | | — | | | | (0.20 | ) | | | 9.45 | | | | 4.71 | | | | 32,022 | | | | 1.64 | | | | 1.60 | | | | 2.14 | | | | 31 | |
I | | | 9.29 | | | | 0.29 | | | | 0.25 | | | | 0.54 | | | | (0.30 | ) | | | — | | | | — | | | | (0.30 | ) | | | 9.53 | | | | 5.82 | | | | 16,682 | | | | 0.66 | | | | 0.60 | | | | 3.12 | | | | 31 | |
Y | | | 9.25 | | | | 0.29 | | | | 0.23 | | | | 0.52 | | | | (0.29 | ) | | | — | | | | — | | | | (0.29 | ) | | | 9.48 | | | | 5.74 | | | | 20,941 | | | | 0.60 | | | | 0.60 | | | | 3.14 | | | | 31 | |
|
For the Year Ended October 31, 2013 | |
A | | $ | 9.73 | | | $ | 0.24 | | | $ | (0.46 | ) | | $ | (0.22 | ) | | $ | (0.24 | ) | | $ | — | | | $ | — | | | $ | (0.24 | ) | | $ | 9.27 | | | | (2.30 | )% | | $ | 124,008 | | | | 0.88 | % | | | 0.85 | % | | | 2.51 | % | | | 20 | % |
B | | | 9.65 | | | | 0.17 | | | | (0.46 | ) | | | (0.29 | ) | | | (0.17 | ) | | | — | | | | — | | | | (0.17 | ) | | | 9.19 | | | | (3.05 | ) | | | 2,194 | | | | 1.71 | | | | 1.60 | | | | 1.76 | | | | 20 | |
C | | | 9.68 | | | | 0.17 | | | | (0.46 | ) | | | (0.29 | ) | | | (0.17 | ) | | | — | | | | — | | | | (0.17 | ) | | | 9.22 | | | | (3.05 | ) | | | 38,185 | | | | 1.62 | | | | 1.60 | | | | 1.76 | | | | 20 | |
I | | | 9.75 | | | | 0.26 | | | | (0.46 | ) | | | (0.20 | ) | | | (0.26 | ) | | | — | | | | — | | | | (0.26 | ) | | | 9.29 | | | | (2.05 | ) | | | 12,776 | | | | 0.64 | | | | 0.60 | | | | 2.75 | | | | 20 | |
Y | | | 9.70 | | | | 0.26 | | | | (0.44 | ) | | | (0.18 | ) | | | (0.27 | ) | | | — | | | | — | | | | (0.27 | ) | | | 9.25 | | | | (1.94 | ) | | | 22,365 | | | | 0.58 | | | | 0.58 | | | | 2.78 | | | | 20 | |
|
For the Year Ended October 31, 2012 | |
A | | $ | 9.20 | | | $ | 0.27 | | | $ | 0.54 | | | $ | 0.81 | | | $ | (0.28 | ) | | $ | — | | | $ | — | | | $ | (0.28 | ) | | $ | 9.73 | | | | 8.87 | % | | $ | 157,918 | | | | 0.88 | % | | | 0.85 | % | | | 2.89 | % | | | 61 | % |
B | | | 9.13 | | | | 0.21 | | | | 0.52 | | | | 0.73 | | | | (0.21 | ) | | | — | | | | — | | | | (0.21 | ) | | | 9.65 | | | | 8.03 | | | | 3,497 | | | | 1.68 | | | | 1.60 | | | | 2.18 | | | | 61 | |
C | | | 9.15 | | | | 0.20 | | | | 0.54 | | | | 0.74 | | | | (0.21 | ) | | | — | | | | — | | | | (0.21 | ) | | | 9.68 | | | | 8.11 | | | | 49,791 | | | | 1.62 | | | | 1.60 | | | | 2.13 | | | | 61 | |
I | | | 9.22 | | | | 0.29 | | | | 0.54 | | | | 0.83 | | | | (0.30 | ) | | | — | | | | — | | | | (0.30 | ) | | | 9.75 | | | | 9.12 | | | | 20,061 | | | | 0.64 | | | | 0.60 | | | | 3.07 | | | | 61 | |
Y | | | 9.18 | | | | 0.30 | | | | 0.52 | | | | 0.82 | | | | (0.30 | ) | | | — | | | | — | | | | (0.30 | ) | | | 9.70 | | | | 9.08 | | | | 27,549 | | | | 0.58 | | | | 0.58 | | | | 3.18 | | | | 61 | |
|
For the Year Ended October 31, 2011(7) | |
A(9) | | $ | 9.50 | | | $ | 0.41 | | | $ | (0.30 | ) | | $ | 0.11 | | | $ | (0.41 | ) | | $ | — | | | $ | — | | | $ | (0.41 | ) | | $ | 9.20 | | | | 1.28 | % | | $ | 137,766 | | | | 0.90 | % | | | 0.85 | % | | | 4.52 | % | | | 29 | % |
B | | | 9.43 | | | | 0.34 | | | | (0.30 | ) | | | 0.04 | | | | (0.34 | ) | | | — | | | | — | | | | (0.34 | ) | | | 9.13 | | | | 0.54 | | | | 4,565 | | | | 1.70 | | | | 1.60 | | | | 3.75 | | | | 29 | |
C | | | 9.46 | | | | 0.34 | | | | (0.31 | ) | | | 0.03 | | | | (0.34 | ) | | | — | | | | — | | | | (0.34 | ) | | | 9.15 | | | | 0.43 | | | | 43,214 | | | | 1.64 | | | | 1.60 | | | | 3.72 | | | | 29 | |
I | | | 9.52 | | | | 0.43 | | | | (0.30 | ) | | | 0.13 | | | | (0.43 | ) | | | — | | | | — | | | | (0.43 | ) | | | 9.22 | | | | 1.53 | | | | 10,671 | | | | 0.64 | | | | 0.60 | | | | 4.71 | | | | 29 | |
Y | | | 9.48 | | | | 0.43 | | | | (0.30 | ) | | | 0.13 | | | | (0.43 | ) | | | — | | | | — | | | | (0.43 | ) | | | 9.18 | | | | 1.54 | | | | 29,686 | | | | 0.60 | | | | 0.60 | | | | 4.73 | | | | 29 | |
|
For the Year Ended October 31, 2010(7) | |
A | | $ | 9.11 | | | $ | 0.43 | | | $ | 0.40 | | | $ | 0.83 | | | $ | (0.44 | ) | | $ | — | | | $ | — | | | $ | (0.44 | ) | | $ | 9.50 | | | | 9.26 | % | | $ | 156,092 | | | | 0.86 | % | | | 0.85 | % | | | 4.69 | % | | | 19 | % |
B | | | 9.04 | | | | 0.36 | | | | 0.40 | | | | 0.76 | | | | (0.37 | ) | | | — | | | | — | | | | (0.37 | ) | | | 9.43 | | | | 8.53 | | | | 7,376 | | | | 1.67 | | | | 1.60 | | | | 3.94 | | | | 19 | |
C | | | 9.07 | | | | 0.36 | | | | 0.40 | | | | 0.76 | | | | (0.37 | ) | | | — | | | | — | | | | (0.37 | ) | | | 9.46 | | | | 8.50 | | | | 47,918 | | | | 1.62 | | | | 1.60 | | | | 3.94 | | | | 19 | |
I | | | 9.13 | | | | 0.46 | | | | 0.39 | | | | 0.85 | | | | (0.46 | ) | | | — | | | | — | | | | (0.46 | ) | | | 9.52 | | | | 9.52 | | | | 8,343 | | | | 0.62 | | | | 0.60 | | | | 4.93 | | | | 19 | |
Y | | | 9.09 | | | | 0.46 | | | | 0.39 | | | | 0.85 | | | | (0.46 | ) | | | — | | | | — | | | | (0.46 | ) | | | 9.48 | | | | 9.59 | | | | 33,050 | | | | 0.57 | | | | 0.57 | | | | 4.97 | | | | 19 | |
| (1) | Information presented relates to a share outstanding throughout the indicated period. Net investment income (loss) per share amounts are calculated based on average shares outstanding unless otherwise noted. |
| (2) | Assumes initial investment at net asset value at the beginning of each period, reinvestment of all distributions, the complete redemption of the investment at net asset value at the end of each period and no sales charge. Total return would be reduced if sales charges were taken into account. |
| (3) | Adjustments include waivers and reimbursements, if applicable. |
| (6) | Excluding the expenses not subject to cap, the ratio would have been 0.90%, 1.65%, 1.65% and 0.65% for Class A, Class B, Class C and Class I, respectively. |
| (7) | Net investment income (loss) per share amounts have been calculated using the Securities and Exchange Commission method. |
| (8) | Excluding the expenses not subject to cap, the ratio would have been 0.90%, 1.70%, 1.66% and 0.66% for Class A, Class B, Class C and Class I, respectively. |
| (9) | Class L was merged into Class A on August 5, 2011. |
The accompanying notes are an integral part of these financial statements.
|
| Hartford Funds – Tax-Exempt Fixed Income Funds |
Directors and Officers (Unaudited)
The Board of Directors of The Hartford Mutual Funds, Inc. and The Hartford Mutual Funds II, Inc. (the “Companies”) appoints officers who are responsible for the day-to-day operations of the Fund and who execute policies formulated by the Board of Directors of the companies (the “Directors”). Each Director serves until his or her death, resignation, or retirement or until the next annual meeting of shareholders is held or until his or her successor is elected and qualifies.
Directors and officers who are employed by or who have a financial interest in The Hartford Financial Services Group, Inc. (“The Hartford”) are considered “interested” persons of the Fund pursuant to the 1940 Act. Each officer and one of the Company’s Directors, as noted in the chart below, are “interested” persons of the Fund. Each Director serves as a director for The Hartford Mutual Funds, Inc., The Hartford Mutual Funds II, Inc., Hartford Series Fund, Inc., and Hartford HLS Series Fund II, Inc., and as a trustee for The Hartford Alternative Strategies Fund, which, as of June 2015, collectively, consist of 68 funds. Correspondence may be sent to Directors and officers c/o Hartford Funds, 5 Radnor Corporate Center, Suite 300, 100 Matsonford Road, Radnor, Pennsylvania 19087.
The table below sets forth, for each Director and officer, his or her name, year of birth, current position with the Company and date first elected or appointed to The Hartford Mutual Funds, Inc. (“MF”) and The Hartford Mutual Funds II, Inc. (“MF2”), principal occupation, and, for Directors, other directorships held. The Fund’s Statement of Additional Information contains further information on the Directors and is available free of charge by calling 1-888-843-7824 or writing to: Hartford Funds, P.O. Box 55022, Boston, MA 02205-5022.
Information on the aggregate remuneration paid to the directors of the Company can be found in the Statement of Operations herein. The Fund pays to The Hartford a portion of the Chief Compliance Officer’s compensation, but does not pay salaries or compensation to any of its other officers or Directors who are employed by The Hartford.
Non-Interested Directors
Hilary E. Ackermann (1956) Director since 2014
Ms. Ackermann served as Chief Risk Officer at Goldman Sachs Bank USA from October 2008 to November 2011 and serves as a Director of Dynegy, Inc., an independent power company, from October 2012 to present.
Lynn S. Birdsong (1946) Director since 2003, Chairman of the Investment Committee since 2014
Mr. Birdsong currently serves as a Director of Aberdeen Global and Aberdeen Global II (investment Funds) (September 2014 to present) and as a Director of the Sovereign High Yield Investment Company (April 2010 to June 2014). Mr. Birdsong served as an Independent Director of Nomura Partners Funds, Inc. (formerly, The Japan Fund) (April 2003 to February 2015). From 2003 to March 2005, Mr. Birdsong was an Independent Director of the Atlantic Whitehall Funds. From 1979 to 2002, Mr. Birdsong was a Managing Director of Zurich Scudder Investments, an investment management firm. During his employment with Scudder, Mr. Birdsong was an Interested Director of The Japan Fund. From January 1981 through December 2013, Mr. Birdsong was a partner in Birdsong Company, an advertising specialty firm.
Robert M. Gavin, Jr. (1940) Director since 2002 (MF) and 1986 (MF2), Chairman of the Board for each since 2004
Dr. Gavin is an educational consultant. Prior to September 1, 2001, he was President of Cranbrook Education Community and prior to July 1996, he was President of Macalester College, St. Paul, Minnesota.
Duane E. Hill (1945) Director since 2001 (MF) and 2002 (MF2), Chairman of the Nominating Committee since 2003
Mr. Hill is a Partner of TSG Ventures L.P., a private equity investment company. Mr. Hill is a former partner of TSG Capital Group, a private equity investment firm that served as sponsor and lead investor in leveraged buyouts of middle market companies.
Sandra S. Jaffee (1941) Director since 2005
Ms. Jaffee is the founder and Chief Executive Officer of a private company, Homeworks Concierge, LLC, which provides residential property management services in Westchester County, New York (January 2012 to present). Ms. Jaffee served as Chairman (2008 to 2009) and Chief Executive Officer of Fortent (formerly Searchspace Group), a leading provider of compliance/regulatory technology to financial institutions from August 2005 to August 2009. From August 2004 to August 2005, Ms. Jaffee served as an Entrepreneur in Residence with Warburg Pincus, a private equity firm. Prior to joining Warburg Pincus, Ms. Jaffee served as Executive Vice President at Citigroup, from September 1995 to July 2004, where she was President and Chief Executive Officer of Citibank’s Global Securities Services (1995 to 2003). Ms. Jaffee served as a member of the Board of Directors of Broadridge Financial Solutions (November 2010 to November 2014). Ms. Jaffee currently serves as a member of the Board of Directors of Global Corp. Africa (a non-profit organization) (January 2015 to present) as well as a Trustee of Muhlenberg College.
|
| Hartford Funds – Tax-Exempt Fixed Income Funds |
Directors and Officers (Unaudited) – (continued)
William P. Johnston (1944) Director since 2005, Chairman of the Compliance Committee since 2005
In June 2006, Mr. Johnston was appointed as Senior Advisor to The Carlyle Group, a global private equity and other alternative asset investment firm and currently serves as an Operating Executive. In July 2006, Mr. Johnston was elected to the Board of Directors of MultiPlan, Inc. and served as a Director (July 2006 to August 2010). In August 2007, Mr. Johnston was elected to the Board of Directors of LifeCare Holdings, Inc. and served as a Director (August 2007 to June 2013). In February 2008, Mr. Johnston was elected to the Board of Directors of HCR-ManorCare, Inc. In May 2006, Mr. Johnston was elected to the Supervisory Board of Fresenius Medical Care AG & Co. KGaA, after its acquisition of Renal Care Group, Inc. in March 2006. Mr. Johnston joined Renal Care Group in November 2002 as a member of the Board of Directors and served as Chairman of the Board from March 2003 through March 2006. From 2002 through 2013, Mr. Johnston served as a Board member of the Georgia O’Keefe Museum. From September 1987 to December 2002, Mr. Johnston was with Equitable Securities Corporation (and its successors, SunTrust Equitable Securities and SunTrust Robinson Humphrey) serving in various investment banking and managerial positions, including Managing Director and Head of Investment Banking, Chief Executive Officer and Vice Chairman.
Phillip O. Peterson (1944) Director since 2002 (MF) and 2000 (MF2), Chairman of the Audit Committee since 2002
Mr. Peterson is a mutual fund industry consultant. He was a partner of KPMG LLP (an accounting firm) until July 1999. Mr. Peterson joined William Blair Funds in February 2007 as a member of the Board of Trustees. From February 2012 to February 2014, Mr. Peterson served as a Trustee of Symetra Variable Mutual Funds. From January 2004 to April 2005, Mr. Peterson served as Independent President of the Strong Mutual Funds.
Lemma W. Senbet (1946) Director since 2005
Dr. Senbet is the William E. Mayer Chair Professor of Finance and Founding Director, Center for Financial Policy, at the University of Maryland, Robert H. Smith School of Business. He was chair of the Finance Department of the University of Maryland, Robert H. Smith School of Business from 1998 to 2006. Since June 2013, he has been on leave from the University to serve as Executive Director of African Economic Research Consortium which focuses on economic policy research and training. Previously, he was a chaired professor of finance at the University of Wisconsin-Madison. Also, he was a Director of the Fortis Funds from March 2000 to July 2002. Dr. Senbet served as Director of the American Finance Association and President of the Western Finance Association. In 2006, Dr. Senbet was inducted Fellow of Financial Management Association International for his career-long distinguished scholarship and professional service.
Interested Directors and Officers
James E. Davey (1964) Director since 2012, President and Chief Executive Officer since 2010
Mr. Davey serves as Executive Vice President of Hartford Life Insurance Company (“HLIC”) and The Hartford. Additionally, Mr. Davey serves as Chairman of the Board, Manager and Senior Managing Director of Hartford Funds Distributors, LLC (“HFD”). He also currently serves as Director, Chairman of the Board, President and Senior Managing Director of Hartford Administrative Services Company (“HASCO”). Mr. Davey also serves as Manager, Chairman of the Board and Senior Managing Director for Hartford Funds Management Company, LLC (“HFMC”) and Director, Chairman of the Board and Senior Managing Director for Hartford Funds Management Group, Inc. (“HFMG”). Mr. Davey has served in various positions within The Hartford and its subsidiaries in connection with the operation of the Hartford Funds. Mr. Davey joined The Hartford in 2002.
Other Officers
Andrew S. Decker (1963) AML Compliance Officer since 2015
Mr. Decker currently serves as Chief Compliance Officer and AML Compliance Officer of HASCO and as AML Officer of HFD. Prior to joining The Hartford, Mr. Decker served as Vice President and AML Officer at Janney Montgomery Scott (a broker dealer) from April 2011 to January 2015. Mr. Decker served as AML Compliance and Sanctions Enforcement Officer at SEI Investments from December 2007 to April 2011.
Michael Flook (1965) Vice President, Treasurer and Controller since 2015
Mr. Flook currently serves as the Treasurer of HFMG. Mr. Flook served as Assistant Treasurer for each Company, The Hartford Alternative Strategies Fund and the Retail Funds from February 2015 to March 2015. Mr. Flook joined The Hartford in 2014. Prior to joining The Hartford, Mr. Flook served as Director, Vice President and Assistant Treasurer at UBS Global Asset Management from May 2006 to November 2014.
|
| Hartford Funds – Tax-Exempt Fixed Income Funds |
Directors and Officers (Unaudited) – (continued)
Edward P. Macdonald (1967) Vice President, Secretary and Chief Legal Officer since 2005
Mr. Macdonald currently serves as Assistant Secretary, Executive Vice President and Deputy General Counsel of HFD, HASCO, HFMC and HFMG. He also serves as Vice President of HLIC. Mr. Macdonald has served in various positions within The Hartford and its subsidiaries in connection with the operation of the Hartford Funds. Mr. Macdonald joined The Hartford in 2005.
Joseph G. Melcher (1973) Vice President and Chief Compliance Officer since 2013
Mr. Melcher currently serves as Executive Vice President of HFD, HFMG and HASCO. Mr. Melcher also currently serves as Executive Vice President and Chief Compliance Officer of HFMC. Mr. Melcher has served in various positions within The Hartford and its subsidiaries in connection with the operation of the Hartford Funds since joining The Hartford in 2012. Prior to joining The Hartford, Mr. Melcher worked at Touchstone Investments, a member of the Western & Southern Financial Group, where he held the position of Vice President and Chief Compliance Officer from 2010 through 2012 and Assistant Vice President, Compliance from 2005 to 2010.
Vernon J. Meyer (1964) Vice President since 2006
Mr. Meyer currently serves as Senior Vice President of HLIC. He also currently serves as Managing Director and Chief Investment Officer of HFMC and Managing Director of HFMG. Mr. Meyer has served in various positions within The Hartford and its subsidiaries in connection with the operation of the Hartford Funds. Mr. Meyer joined The Hartford in 2004.
Laura S. Quade (1969) Vice President since 2012
Ms. Quade currently serves as Vice President of HASCO, HFD and HFMG. She is the Head of Operations of HASCO and formerly served as Director, Enterprise Operations of HLIC. Ms. Quade has served in various positions within The Hartford and its subsidiaries in connection with the operation of the Hartford Funds. Ms. Quade joined The Hartford in 2001.
HOW TO OBTAIN A COPY OF THE FUNDS’ PROXY VOTING POLICIES AND VOTING RECORDS (UNAUDITED)
A description of the policies and procedures that each Fund uses to determine how to vote proxies relating to portfolio securities and information about how each Fund voted proxies relating to portfolio securities during the most recent twelve-month period ended June 30 are available (1) without charge, upon request, by calling 888-843-7824 and (2) on the SEC’s website at http://www.sec.gov.
QUARTERLY PORTFOLIO HOLDINGS INFORMATION (UNAUDITED)
Each Fund files a complete schedule of portfolio holdings with the SEC for the first and third quarters of each fiscal year on Form N-Q. Each Funds’ Form N-Q is available (1) without charge, upon request, by calling 888-843-7824 and (2) on the SEC’s website at http://www.sec.gov. The Form N-Q may be reviewed and copied at the SEC’s Public Reference Room in Washington, DC. Information on the operation of the Public Reference Room may be obtained by calling 1-800-SEC-0330.
|
| Hartford Funds – Tax-Exempt Fixed Income Funds |
Expense Example (Unaudited)
Your Fund’s Expenses
As a shareholder of a Fund, you incur two types of costs: (1) transaction costs and (2) ongoing costs, including investment management fees, distribution and/or service (12b-1) fees, if any, and other fund expenses. This example is intended to help you understand your ongoing costs (in dollars) of investing in a Fund and to compare these costs with the ongoing costs of investing in other mutual funds. The example is based on an investment of $1,000 invested at the beginning of the period and held for the entire period of November 1, 2014 through April 30, 2015.
Actual Expenses
The first set of columns of the table below provides information about actual account values and actual expenses. You may use the information in this row, together with the amount you invested, to estimate the expenses that you paid over the period. Simply divide your account value by $1,000 (for example, an $8,600 account value divided by $1,000 = 8.6), then multiply the result by the number in the line under the heading entitled “Expenses Paid During Period” to estimate the expenses you paid on your account during this period.
Hypothetical Example for Comparison Purposes
The second set of columns of the table below provides information about hypothetical account values and hypothetical expenses based on a Fund’s actual expense ratio and an assumed rate of return of 5% per year before expenses, which is not the Fund’s actual return. The hypothetical account values and expenses may not be used to estimate the actual ending account balance or expenses you paid for the period. You may use this information to compare the ongoing costs of investing in a Fund and other funds. To do so, compare this 5% hypothetical example with the 5% hypothetical examples that appear in the shareholder reports of the other funds.
Please note that the expenses shown in the table are meant to highlight your ongoing costs only and do not reflect any transactional costs, such as sales charges (loads) or fees which may be applied at the variable life insurance, variable annuity, or qualified retirement plan product level. Therefore, the second set of columns of the table is useful in comparing ongoing costs only, and will not help you determine the relative total costs of owning different funds. In addition, if these transactional costs were included, your costs would be higher. Expenses are equal to the Fund’s annualized expense ratios multiplied by average account value over the period, multiplied by 181/365 (to reflect the one-half year period).
The Hartford Municipal Opportunities Fund
| | | | | | | | | | | | | | | | | | | | | | | | | | | | | | | | | | | | |
| | | Actual Return | | | Hypothetical (5% return before expenses) | | | | | | | | | | |
| | | Beginning
Account
Value
November 1,
2014 | | | Ending
Account
Value
April 30,
2015 | | | Expenses paid
during the period
November 1, 2014
through April 30,
2015 | | | Beginning
Account
Value
November 1,
2014 | | | Ending
Account
Value
April 30,
2015 | | | Expenses paid
during the period
November 1, 2014
through April 30,
2015 | | | Annualized
expense
ratio | | | Days in
the
current
1/2 year | | | Days in
the full
year | |
Class A | | $ | 1,000.00 | | | $ | 1,012.40 | | | $ | 4.09 | | | $ | 1,000.00 | | | $ | 1,020.73 | | | $ | 4.11 | | | | 0.82 | % | | | 181 | | | | 365 | |
Class B | | $ | 1,000.00 | | | $ | 1,007.40 | | | $ | 7.86 | | | $ | 1,000.00 | | | $ | 1,016.96 | | | $ | 7.90 | | | | 1.58 | % | | | 181 | | | | 365 | |
Class C | | $ | 1,000.00 | | | $ | 1,008.60 | | | $ | 7.87 | | | $ | 1,000.00 | | | $ | 1,016.96 | | | $ | 7.90 | | | | 1.58 | % | | | 181 | | | | 365 | |
Class I | | $ | 1,000.00 | | | $ | 1,013.60 | | | $ | 2.85 | | | $ | 1,000.00 | | | $ | 1,021.97 | | | $ | 2.86 | | | | 0.57 | % | | | 181 | | | | 365 | |
The Hartford Municipal Real Return Fund
| | | | | | | | | | | | | | | | | | | | | | | | | | | | | | | | | | | | |
| | | Actual Return | | | Hypothetical (5% return before expenses) | | | | | | | | | | |
| | | Beginning
Account
Value
November 1,
2014 | | | Ending
Account
Value
April 30,
2015 | | | Expenses paid
during the period
November 1, 2014
through April 30,
2015 | | | Beginning
Account
Value
November 1,
2014 | | | Ending
Account
Value
April 30,
2015 | | | Expenses paid
during the period
November 1, 2014
through April 30,
2015 | | | Annualized
expense
ratio | | | Days in
the
current
1/2 year | | | Days in
the full
year | |
Class A | | $ | 1,000.00 | | | $ | 995.90 | | | $ | 3.96 | | | $ | 1,000.00 | | | $ | 1,020.83 | | | $ | 4.01 | | | | 0.80 | % | | | 181 | | | | 365 | |
Class B | | $ | 1,000.00 | | | $ | 993.30 | | | $ | 7.66 | | | $ | 1,000.00 | | | $ | 1,017.11 | | | $ | 7.75 | | | | 1.55 | % | | | 181 | | | | 365 | |
Class C | | $ | 1,000.00 | | | $ | 992.20 | | | $ | 7.66 | | | $ | 1,000.00 | | | $ | 1,017.11 | | | $ | 7.75 | | | | 1.55 | % | | | 181 | | | | 365 | |
Class I | | $ | 1,000.00 | | | $ | 997.20 | | | $ | 2.72 | | | $ | 1,000.00 | | | $ | 1,022.07 | | | $ | 2.76 | | | | 0.55 | % | | | 181 | | | | 365 | |
Class Y | | $ | 1,000.00 | | | $ | 997.20 | | | $ | 2.72 | | | $ | 1,000.00 | | | $ | 1,022.07 | | | $ | 2.76 | | | | 0.55 | % | | | 181 | | | | 365 | |
|
| Hartford Funds – Tax-Exempt Fixed Income Funds |
Main Risks (Unaudited)
The main risks of investing in each Fund are described below. Each Fund’s Prospectus contains further information on the risks applicable to that Fund.
Active Trading Risk: (Municipal Real Return Fund only) Actively trading investments may result in higher costs and higher taxable income.
Derivatives Risk: Investments in derivatives can be volatile. Potential risks include currency risk, leverage risk (the risk that small market movements may result in large changes in the value of an investment), liquidity risk, index risk, pricing risk, and counterparty risk (the risk that the counterparty may be unwilling or unable to honor its obligations).
Inflation-Protected Securities Risk: (Municipal Real Return Fund only) The market for inflation-protected securities may be less developed or liquid, and more volatile, than other securities markets.
Junk Bond Risk: (Municipal Opportunities Fund only) Investments in junk bonds involve greater risk of price volatility, illiquidity, and default than higher-rated debt securities.
Market, Selection and Strategy Risk: A Fund’s share price may fluctuate due to market risk and/or security selections that may underperform the market or relevant benchmarks. If the sub-adviser’s investment strategy does not perform as expected, Fund could underperform its peers or lose money. There is no guarantee a Fund will achieve its stated objective.
Muni Bond Risk: Municipal securities are subject to interest rate risk (the risk that the value of an investment decreases when interest rates rise), credit risk (the risk that the issuing company of a security is unable to pay interest and principal when due), liquidity risk (the risk that an investment may be difficult to sell at an advantageous time or price), call risk (the risk that an investment may be redeemed early), and risks related to changes in the tax-exempt status of the securities.
THIS PRIVACY POLICY IS NOT PART OF THIS REPORT
Privacy Policy and Practices of The Hartford Financial Services Group, Inc. and its Affiliates
(herein called “we, our and us”)
This Privacy Policy applies to our United States Operations
We value your trust. We are committed to the responsible:
a) management;
b) use; and
c) protection;
of Personal Information.
This notice describes how we collect, disclose, and protect Personal Information.
We collect Personal Information to:
a) service your Transactions with us; and
b) support our business functions.
We may obtain Personal Information from:
a) You;
b) your Transactions with us; and
c) third parties such as a consumer-reporting agency.
Based on the type of product or service You apply for or get from us, Personal Information such as:
a) your name;
b) your address;
c) your income;
d) your payment; or
e) your credit history;
may be gathered from sources such as applications, Transactions, and consumer reports.
To serve You and service our business, we may share certain Personal Information. We will share Personal Information, only as allowed by law, with affiliates such as:
a) our insurance companies;
b) our employee agents;
c) our brokerage firms; and
d) our administrators.
As allowed by law, we may share Personal Financial Information with our affiliates to:
a) market our products; or
b) market our services;
to You without providing You with an option to prevent these disclosures.
We may also share Personal Information, only as allowed by law, with unaffiliated third parties including:
a) independent agents;
b) brokerage firms;
c) insurance companies;
d) administrators; and
e) service providers;
who help us serve You and service our business.
When allowed by law, we may share certain Personal Financial Information with other unaffiliated third parties who assist us by performing services or functions such as:
a) taking surveys;
b) marketing our products or services; or
c) offering financial products or services under a joint agreement between us and one or more financial institutions.
We, and third parties we partner with, may track some of the pages You visit through the use of:
a) cookies;
b) pixel tagging; or
c) other technologies;
and currently do not process or comply with any web browser’s “do not track” signal or similar mechanism that indicates a request to disable online tracking of individual users who visit our websites or use our services.
We will not sell or share your Personal Financial Information with anyone for purposes unrelated to our business functions without offering You the opportunity to:
a) “opt-out;” or
b) “opt-in;”
as required by law.
We only disclose Personal Health Information with:
a) your proper written authorization; or
b) as otherwise allowed or required by law.
Our employees have access to Personal Information in the course of doing their jobs, such as:
a) underwriting policies;
b) paying claims;
c) developing new products; or
d) advising customers of our products and services.
We use manual and electronic security procedures to maintain:
a) the confidentiality; and
b) the integrity of;
Personal Information that we have. We use these procedures to guard against unauthorized access.
Some techniques we use to protect Personal Information include:
a) secured files;
b) user authentication;
c) encryption;
d) firewall technology; and
e) the use of detection software.
We are responsible for and must:
a) identify information to be protected;
b) provide an adequate level of protection for that data;
c) grant access to protected data only to those people who must use it in the performance of their job-related duties.
Employees who violate our Privacy Policy will be subject to discipline, which may include ending their employment with us.
At the start of our business relationship, we will give You a copy of our current Privacy Policy.
We will also give You a copy of our current Privacy Policy once a year if You maintain a continuing business relationship with us.
We will continue to follow our Privacy Policy regarding Personal Information even when a business relationship no longer exists between us.
As used in this Privacy Notice:
Application means your request for our product or service.
Personal Financial Information means financial information such as:
a) credit history;
b) income;
c) financial benefits; or
d) policy or claim information.
Personal Health Information means health information such as:
a) your medical records; or
b) information about your illness, disability or injury.
Personal Information means information that identifies You personally and is not otherwise available to the public. It includes:
a) Personal Financial Information; and
b) Personal Health Information .
Transaction means your business dealings with us, such as:
a) your Application;
b) your request for us to pay a claim; and
c) your request for us to take an action on your account.
You means an individual who has given us Personal Information in conjunction with:
a) asking about;
b) applying for; or
c) obtaining;
a financial product or service from us if the product or service is used mainly for personal, family, or household purposes.
This Privacy Policy is being provided on behalf of the following affiliates of The Hartford Financial Services Group, Inc.:
1stAGChoice, Inc.; Access CoverageCorp, Inc.; Access CoverageCorp Technologies, Inc.; American Maturity Life Insurance Company; Archway 60 R, LLC; Business Management Group, Inc.; DMS R, LLC; First State Insurance Company; Fountain Investors I LLC; Fountain Investors II LLC; Fountain Investors III LLC; Fountain Investors IV LLC; FTC
Resolution Company LLC; Hart Re Group L.L.C.; Hartford Accident and Indemnity Company; Hartford Administrative Services Company; Hartford Casualty General Agency, Inc.; Hartford Casualty Insurance Company; Hartford Financial Services, LLC; Hartford Fire General Agency, Inc.; Hartford Fire Insurance Company; Hartford Funds Distributors, LLC; Hartford Funds Management Company, LLC; Hartford Funds Management Group, Inc.; Hartford Holdings, Inc.; Hartford HLS Series Fund II, Inc.; Hartford Insurance Company of Illinois; Hartford Insurance Company of the Midwest; Hartford Insurance Company of the Southeast; Hartford Integrated Technologies, Inc.; Hartford International Life Reassurance Corporation; Hartford Investment Management Company; Hartford Life and Accident Insurance Company; Hartford Life and Annuity Insurance Company; Hartford Life Insurance Company; Hartford Life, Inc.; Hartford Life International Holding Company; Hartford Life Private Placement, LLC; Hartford Lloyd’s Corporation; Hartford Lloyd’s Insurance Company; Hartford of Texas General Agency, Inc.; Hartford Residual Market, L.C.C.; Hartford Securities Distribution Company, Inc.; Hartford Series Fund, Inc.; Hartford Specialty Insurance Services of Texas, LLC; Hartford Strategic Investments, LLC; Hartford Underwriters General Agency, Inc.; Hartford Underwriters Insurance Company; Hartford-Comprehensive Employee Benefit Service Company; HDC R, LLC .; Heritage Holdings, Inc.; HIMCO Distribution Services Company; HIMCO Variable Insurance Trust; HLA LLC; HL Investment Advisors, LLC; Horizon Management Group, LLC; HRA Brokerage Services, Inc.; Lanidex Class B, LLC; New England Insurance Company; New England Reinsurance Corporation; Nutmeg Insurance Agency, Inc.; Nutmeg Insurance Company; Pacific Insurance Company, Limited; Planco, LLC; Property and Casualty Insurance Company of Hartford; Revere R, LLC; RVR R, LLC; Sentinel Insurance Company, Ltd.; Sunstone R, LLC; Symphony R, LLC; The Evergreen Group Incorporated; The Hartford Alternative Strategies Fund; The Hartford Mutual Funds, Inc.; The Hartford Mutual Funds II, Inc.; Trumbull Flood Management, L.L.C.; Trumbull Insurance Company; Twin City Fire Insurance Company.
HPP Revised February 2015

This report is submitted for the general information of the shareholders of the Funds referenced in this report. It is not authorized for distribution to persons who are not shareholders of one or more Funds referenced in this report unless preceded or accompanied by a current prospectus for the relevant Funds. Nothing herein contained is to be considered an offer of sale or a solicitation of an offer to buy shares of any Fund listed in this report. Such offering is only made by prospectus, which includes details as to the offering price and other material information.
The information cannot be used or relied upon for the purpose of avoiding IRS penalties. These materials are not intended to provide tax, accounting or legal advice. As with all matters of a tax or legal nature, you should consult your own tax or legal counsel for advice.
Investors should carefully consider the investment objectives, risks, charges, and expenses of Hartford Funds before investing. This and other information can be found in the prospectus and summary prospectus, which can be obtained by calling 888-843-7824 (or 800-279-1541 for institutional investors). Investors should read them carefully before they invest.
Hartford Funds are underwritten and distributed by Hartford Funds Distributors, LLC.
| | | | |
MFSAR-TEF15 6/15 118054 Printed in U.S.A. | | | | hartfordfunds.com |
Item 2. Code of Ethics.
Not applicable to this semi-annual filing.
Item 3. Audit Committee Financial Expert.
Not applicable to this semi-annual filing.
Item 4. Principal Accountant Fees and Services.
Not applicable to this semi-annual filing.
Item 5. Audit Committee of Listed Registrants.
Not applicable
Item 6. Investments.
| | (a) | The Schedule of Investments in securities of unaffiliated issuers as of the close of the reporting period is included as part of the semi-annual report filed under Item 1 of this form. |
Item 7. Disclosure of Proxy Voting Policies and Procedures for Closed-End Management Investment Companies.
Not applicable.
Item 8. Portfolio Managers of Closed-End Management Investment Companies.
Not applicable.
Item 9. Purchases of Equity Securities by Closed-End Management Investment Company and Affiliated Purchasers.
Not applicable.
Item 10. Submission of Matters to a Vote of Security Holders.
There have been no material changes to the procedures by which shareholders may recommend nominees to the registrant’s board of directors since registrant last provided disclosure in response to this requirement.
Item 11. Controls and Procedures.
| | (a) | The registrant’s principal executive and principal financial officers, or persons performing similar functions, have concluded that the registrant’s disclosure controls and procedures (as defined in Rule 30a-3(c) under the Investment |
Company Act of 1940, as amended (the “1940 Act”) (17 CFR 270.30a-3(c))) are generally effective to provide reasonable assurance, as of a date within 90 days of the filing date of the report that includes the disclosure required by this paragraph, based on their evaluation of these controls and procedures required by Rule 30a-3(b) under the 1940 Act (17 CFR 270.30a-3(b)) and Rules 13a-15(b) or 15d-15(b) under the Securities Exchange Act of 1934, as amended (17 CFR 240.13a-15(b) or 240.15d-15(b)).
| | (b) | There have been changes in the registrant’s internal control over financial reporting (as defined in Rule 30a-3(d) under the 1940 Act)(“internal controls”) that occurred during the second fiscal quarter of the period covered by this report that has materially affected, or is reasonably likely to materially affect, the registrant’s internal control over financial reporting. The internal controls were revised to reflect that State Street Bank and Trust Company now provides certain administrative and accounting services to the registrant. |
Item 12. Exhibits.
| | | | |
| | (a)(1) | | Not applicable. |
| | (a)(2) | | Separate certifications for each principal executive officer and principal financial officer of the registrant as required by Rule 30a-2(a) under the 1940 Act (17 CFR 270.30a-2(a)) and Section 302 of the Sarbanes-Oxley Act of 2002 are attached herewith. |
| | (a)(3) | | Not applicable. |
| | (b) | | Certifications pursuant to Rule 30a-2(b) under the 1940 Act and Section 906 of the Sarbanes-Oxley Act of 2002 are attached hereto. |
SIGNATURES
Pursuant to the requirements of the Securities Exchange Act of 1934 and the Investment Company Act of 1940, the registrant has duly caused this report to be signed on its behalf by the undersigned, thereunto duly authorized.
| | | | | | |
| | | | THE HARTFORD MUTUAL FUNDS II, INC. |
| | | |
| Date: July 9, 2015 | | | | By: | | /s/ James E. Davey |
| | | | | | James E. Davey, President and |
| | | | | | Chief Executive Officer |
Pursuant to the requirements of the Securities Exchange Act of 1934 and the Investment Company Act of 1940, this report has been signed below by the following persons on behalf of the registrant and in the capacities and on the dates indicated.
| | | | | | |
| Date: July 9, 2015 | | | | By: | | /s/ James E. Davey |
| | | | | | James E. Davey, President and Chief Executive Officer |
| | | | | |
| | | |
| Date: July 9, 2015 | | | | By: | | /s/ Michael Flook |
| | | | | | Michael Flook, Vice President, |
| | | | | | Treasurer and Controller |