Exhibit 99.3
|

INVESTOR MEETING
FEBRUARY 2017
|
Diane Bryant
Executive Vice President & General Manager Data Center Group
|
Disclosures
Statements in this presentation that refer to Business Outlook, forecast, future plans and expectations are forward-looking statements that involve a number of risks and uncertainties. Words such as “anticipates,” “expects,” “intends,”
“goals,” “plans,” “believes,” “seeks,” “estimates,” “continues,” “may,” “will,” “would,” “should,” “could,” and variations of such words and similar expressions are intended to identify such forward-looking statements. Statements that refer to or are based on projections, uncertain events or assumptions also identify forward-looking statements. Such statements are based on management’s expectations as of February 9, 2017 and involve many risks and uncertainties that could cause actual results to differ materially from those expressed or implied in these forward-looking statements. Important factors that could cause actual results to differ materially from the company’s expectations are set in Intel’s earnings release dated January 26, 2017, which is included as an exhibit to Intel’s Form8-K furnished to the SEC on such date. Additional information regarding these and other factors that could affect Intel’s results is included in Intel’s SEC filings, including the company’s most recent reports on Forms10-K and10-Q. Copies of Intel’s Form10-K,10-Q and8-K reports may be obtained by visiting our Investor Relations website at www.intc.com or the SEC’s website at www.sec.gov.
3
|
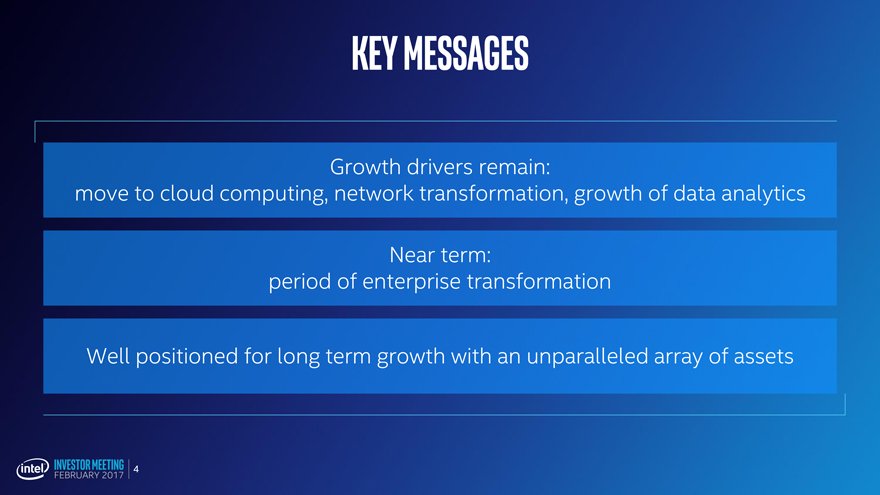
Key Messages
Growth drivers remain:
move to cloud computing, network transformation, growth of data analytics
Near term:
period of enterprise transformation
Well positioned for long term growth with an unparalleled array of assets
4
|
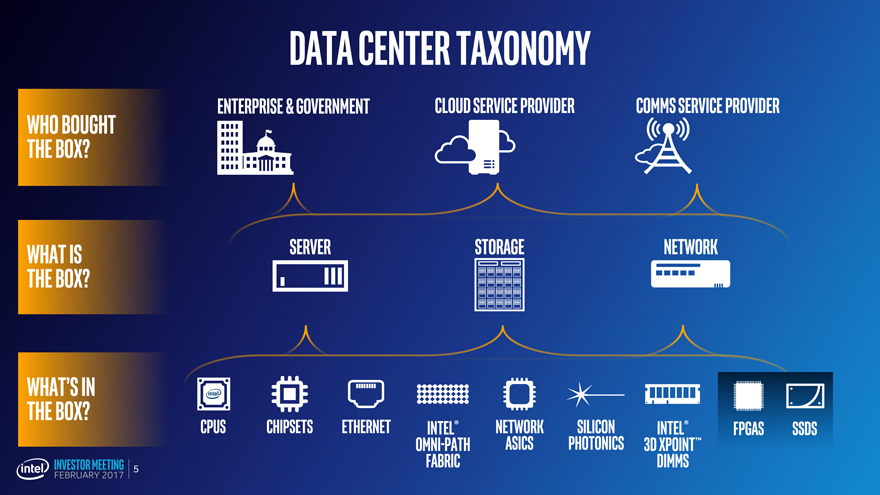
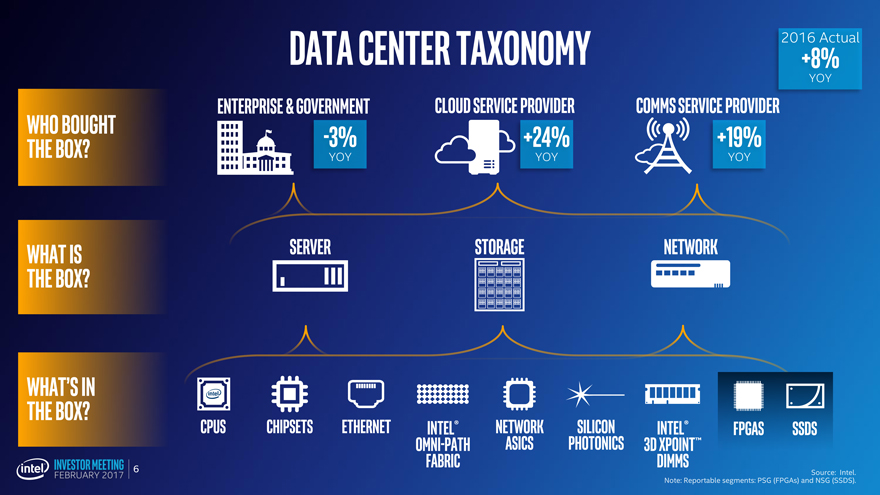
Data Center Taxonomy
Enterprise & Government Cloud Service ProviderComms Service Provider
WHO BOUGHT
THE BOX?
WHAT IS ServerStorageNetwork
THE BOX?
WHAT’S IN
THE BOX? CPUs ChipsetsEthernetintel®NetworkSiliconintel®FPGAsSSDs
Omni-PathASICsPhotonics3D XPoint™
5 FabricDIMMs
|
Data Center Taxonomy2016 +8%Actual
YOY
Enterprise & Government Cloud Service ProviderComms Service Provider
WHO BOUGHT -3%+24%+19%
THE BOX? YOYYOYYOY
WHAT IS ServerStorageNetwork
THE BOX?
WHAT’S IN
THE BOX? CPUs ChipsetsEthernetintel®NetworkSiliconintel®FPGAsSSDs
Omni-PathASICsPhotonics3D XPoint™
6 FabricDIMMs
Source: Intel.
Note: Reportable segments: PSG (FPGAs) and NSG (SSDS).
|
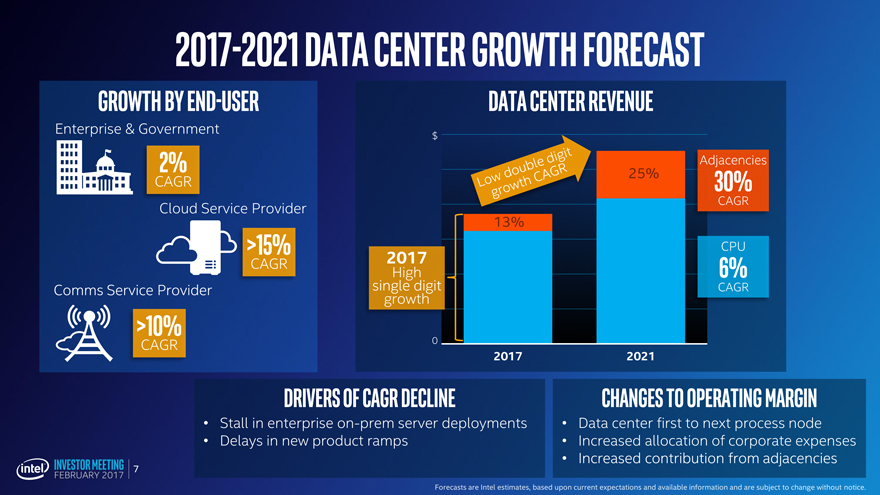
2017-2021 Data Center Growth Forecast
Growth byEnd-User
Enterprise & Government
2%
CAGR
Cloud Service Provider
>15%
CAGR
Comms Service Provider
>10%
CAGR
Data Center Revenue
$
Adjacencies
25%
30%
CAGR
13%
CPU
2017 High
6%
single digit
CAGR
growth
0
2017
2021
Drivers of CAGR Decline
• Stall in enterpriseon-prem server deployments
• Delays in new product ramps
Changes to Operating Margin
• Data center first to next process node
• Increased allocation of corporate expenses
• Increased contribution from adjacencies
Forecasts are Intel estimates, based upon current expectations and available information and are subject to change without notice.
7
|
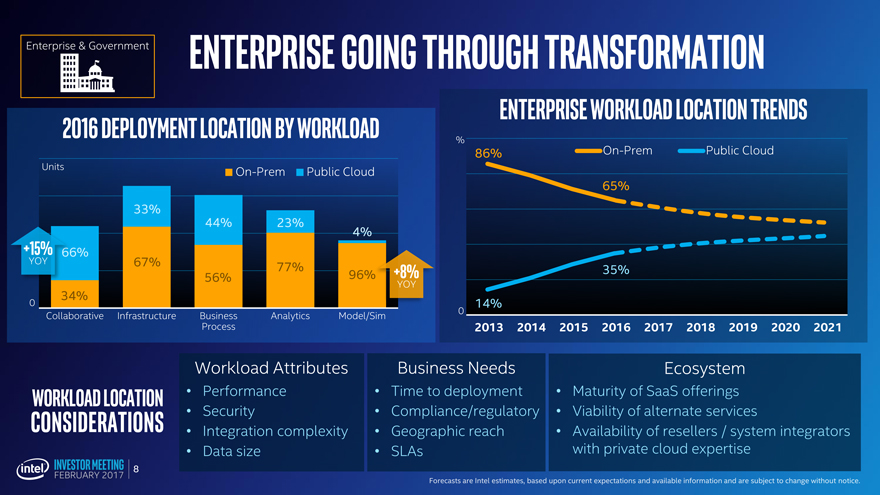
Enterprise & Government Enterprise going through transformation
2016 Deployment Location by Workload
Units On-PremPublic Cloud
33%
44%23%4%
+15% 66%
YOY 67% 77%+8%
56%96%YOY
0 34%
Collaborative Infrastructure Business Analytics Model/Sim
Process
Enterprise Workload location Trends
%
86% On-PremPublic Cloud
65%
35%
0 14%
2013 2014 2015 2016 2017 2018 2019 2020 2021
Workload Attributes Business Needs Ecosystem
• Performance • Time to deployment • Maturity of SaaS offerings
• Security • Compliance/regulatory • Viability of alternate services
• Integration complexity • Geographic reach • Availability of resellers / system integrators
• Data size • SLAs with private cloud expertise
Forecasts are Intel estimates, based upon current expectations and available information and are subject to change without notice.
8
|
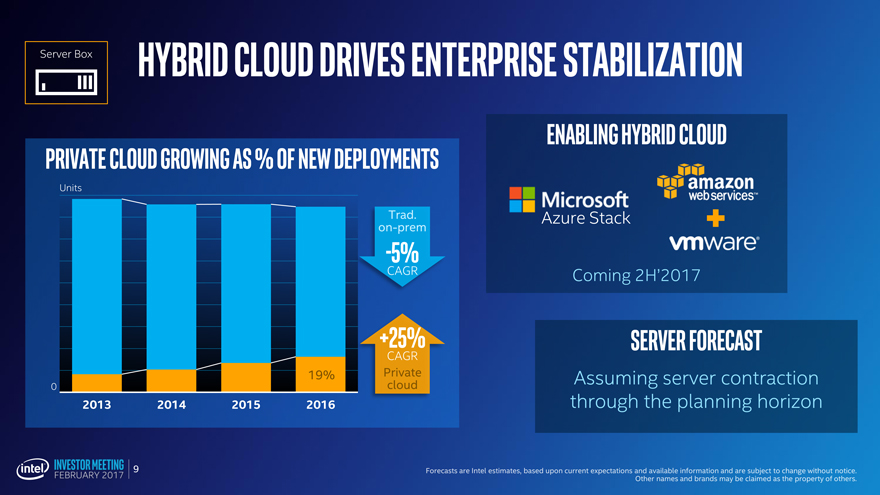
Server Box Hybrid cloud Drives Enterprise stabilization
Private Cloud Growing as % of New Deployments
Units
Trad.
on-prem
-5%
CAGR
+25%
CAGR
19%Private
0 cloud
2013 2014 20152016
Enabling Hybrid Cloud
Azure Stack
Coming 2H’2017
Server forecast
Assuming server contraction
through the planning horizon
Forecasts are Intel estimates, based upon current expectations and available information and are subject to change without notice.
Other names and brands may be claimed as the property of others.
9
|
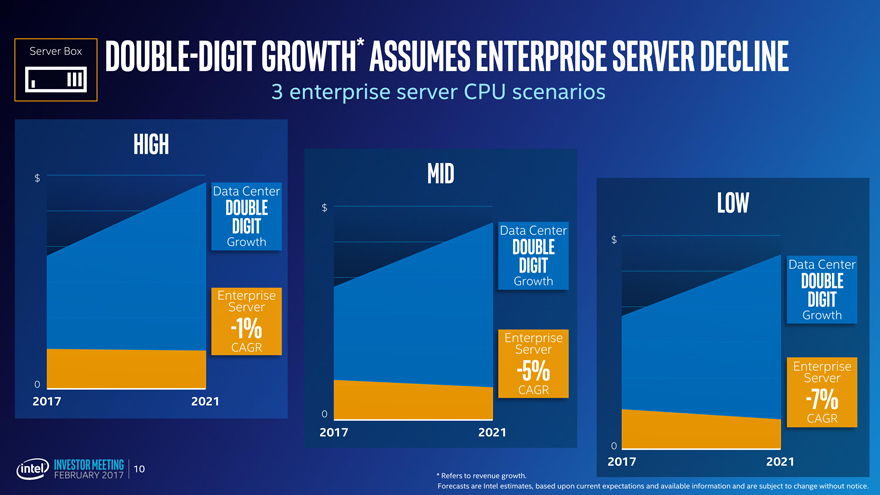
High
$
Data Center
Double
Digit
Growth
Enterprise
Server
-1%
CAGR
0
2017 2021
Mid
$
Data Center
Double
Digit
Growth
Enterprise
Server
-5%
CAGR
0
2017 2021
Low
$
Data Center
Double
Digit
Growth
Enterprise
Server
-7%
CAGR
0
2017 2021
* Refers to revenue growth.
Forecasts are Intel estimates, based upon current expectations and available information and are subject to change without notice.
10
|
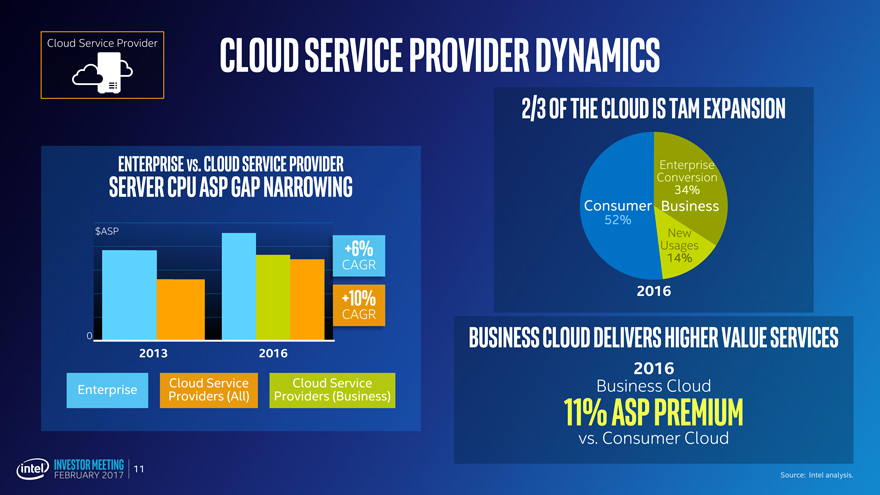
Cloud Service Provider Cloud Service Provider Dynamics
Enterprise VS. Cloud Service Provider
Server CPU ASP Gap Narrowing
$ASP
+6%
CAGR
+10%
CAGR
0
2013 2016
Cloud Service Cloud Service
Enterprise Providers (All) Providers (Business)
2/3 of the Cloud is TAM Expansion
Enterprise
Conversion
34%
Consumer Business
52%
New
Usages
14%
2016
Business Cloud delivers higher value services
Business 2016 Cloud
11% ASP Premium
vs. Consumer Cloud
Source: Intel analysis.
11
|
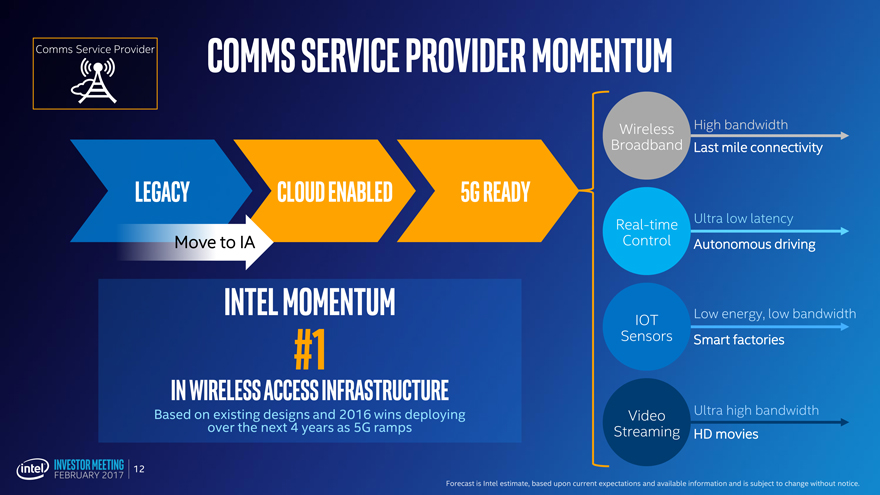
Comms Service Provider Comms Service Provider Momentum
Legacy Cloud Enabled 5G Ready
Move to IA
Intel Momentum
#1
in Wireless Access Infrastructure
Based on existing designs and 2016 wins deploying
over the next 4 years as 5G ramps
Wireless High bandwidth
Broadband Last mile connectivity
Real-time Ultra low latency
Control Autonomous driving
IOT Low energy, low bandwidth
Sensors Smart factories
Video Ultra high bandwidth
Streaming HD movies
Forecast is Intel estimate, based upon current expectations and available information and is subject to change without notice.
12
|
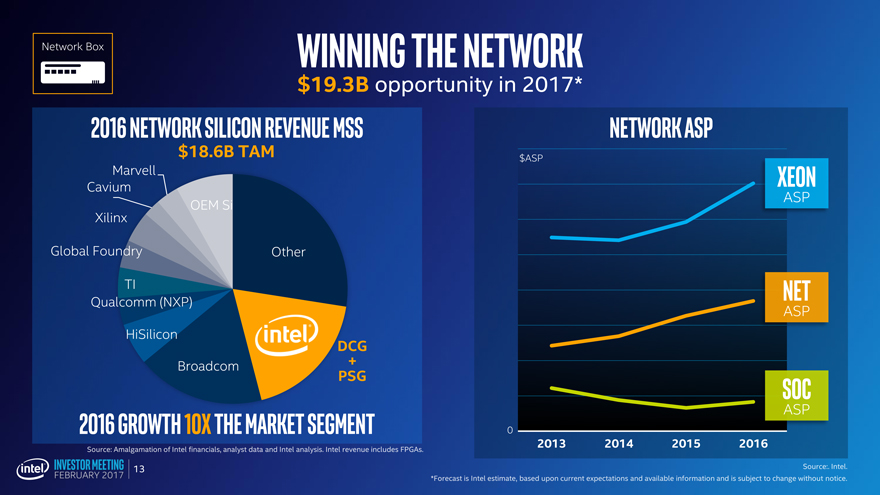
Network Box Winning the Network
$19.3B opportunity in 2017*
2016 Network Silicon Revenue MSS
$18.6B TAM
Marvell
Cavium
OEM Si
Xilinx
Global Foundry Other
TI
Qualcomm (NXP)
HiSilicon
DCG
Broadcom +
PSG
2016 Growth 10X the Market Segment
Source: Amalgamation of Intel financials, analyst data and Intel analysis. Intel revenue includes FPGAs.
Network ASP
$ASP
Xeon
ASP
Net
ASP
SOC
ASP
0
2013 201420152016
Source:. Intel.
*Forecast is Intel estimate, based upon current expectations and available information and is subject to change without notice.
13
|
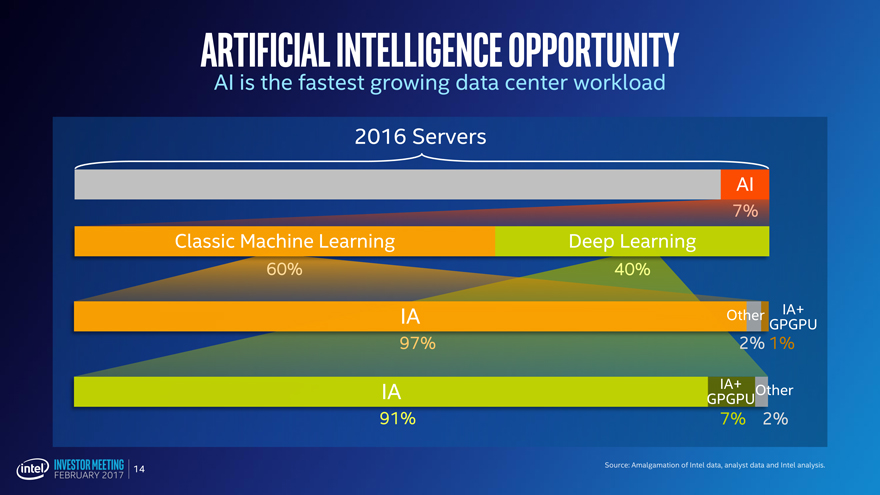
Artificial Intelligence Opportunity
AI is the fastest growing data center workload
2016 Servers
AI
7%
Classic Machine Learning Deep Learning
60%
IA Other GPGPU IA+
2% 1%
IA GPGPUIA+ Other
2%
Source: Amalgamation of Intel data, analyst data and Intel analysis.
14
|
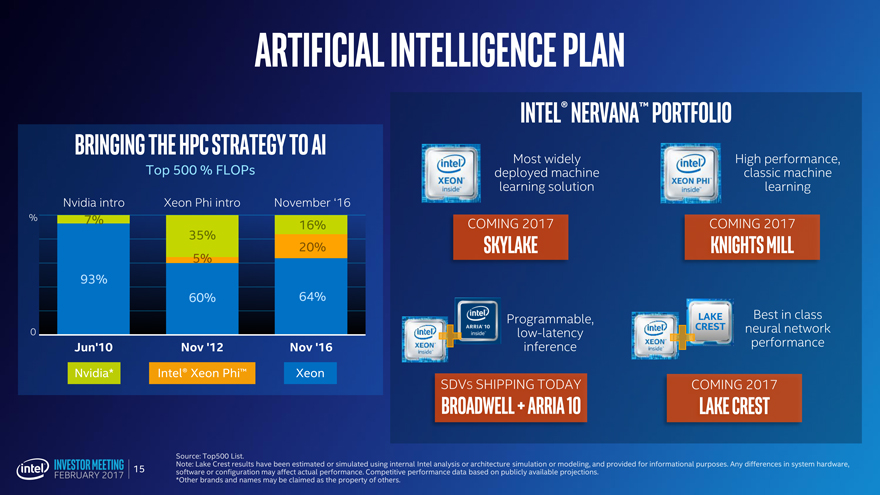
Artificial Intelligence Plan
Bringing the HPC Strategy to AI
Top 500 % FLOPs
Nvidia intro Xeon Phi introNovember ‘16
% 7% 16%
35%
20%
5%
93%
60%64%
0
Jun’10 Nov ‘12Nov ‘16
Nvidia* Intel® Xeon Phi™Xeon
Intel® Nervana™ Portfolio
Most widely High performance,
deployed machine classic machine
learning solution learning
COMING 2017 COMING 2017
SKYLAKE KNIGHTS MILL
Programmable, LAKE Best in class
low-latency CREST neural network
inference performance
SDVS SHIPPING TODAY COMING 2017
BROADWELL + ARRIA 10 LAKE CREST
Source: Top500 List.
Note: Lake Crest results have been estimated or simulated using internal Intel analysis or architecture simulation or modeling, and provided for informational purposes. Any differences in system hardware, software or configuration may affect actual performance. Competitive performance data based on publicly available projections.
*Other brands and names may be claimed as the property of others.
15
|
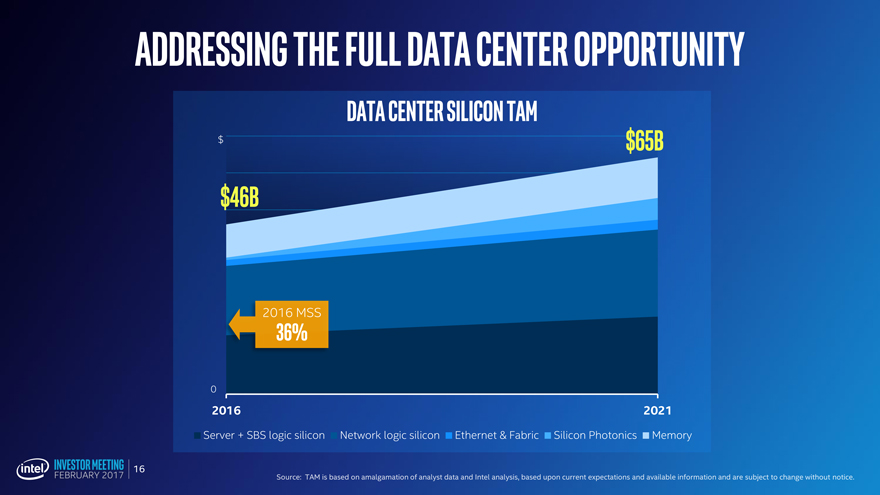
Addressing the Full Data Center Opportunity
Data Center Silicon TAM
$ $65B
$46B
2016 36%MSS
0
2016 2021
Server + SBS logic silicon Network logic silicon Ethernet & Fabric Silicon Photonics Memory
Source: TAM is based on amalgamation of analyst data and Intel analysis, based upon current expectations and available information and are subject to change without notice.
16
|
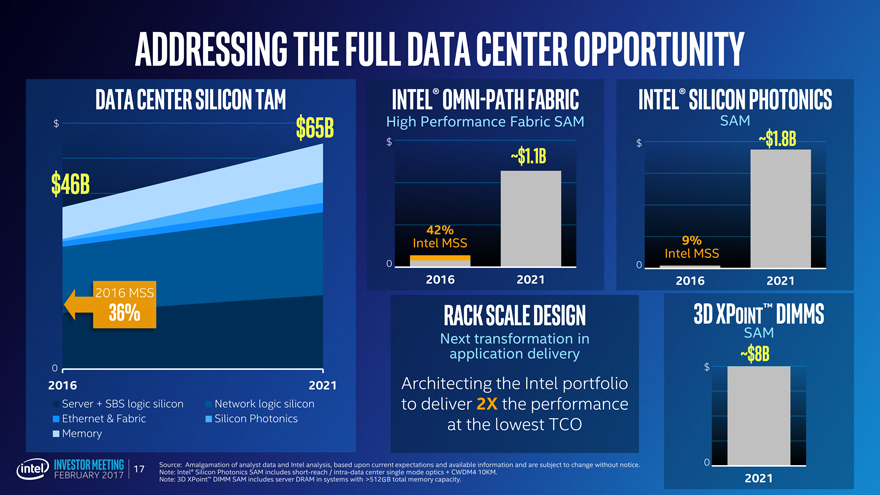
Addressing the Full Data Center Opportunity
Data Center Silicon TAM
$ $65B
$46B
2016 36%MSS
0
2016 2021
Server + SBS logic silicon Network logic silicon
Ethernet & Fabric Silicon Photonics
Memory
Intel® Omni-Path Fabric
High Performance Fabric SAM
$
~$1.1B
42%
Intel MSS
0
2016 2021
Intel® Silicon Photonics
SAM ~$1.8B
$
9%
Intel MSS
0
2016 2021
Rack Scale Design
Next application transformation delivery in
Architecting the Intel portfolio to deliver 2X the performance at the lowest TCO
3D XPOINT™ DIMMs
SAM
~$8B
$
0
2021
Source: Amalgamation of analyst data and Intel analysis, based upon current expectations and available information and are subject to change without notice.
Note: Intel® Silicon Photonics SAM includes short-reach / intra-data center single mode optics + CWDM4 10KM.
Note: 3D XPoint™ DIMM SAM includes server DRAM in systems with >512GB total memory capacity.
17
|
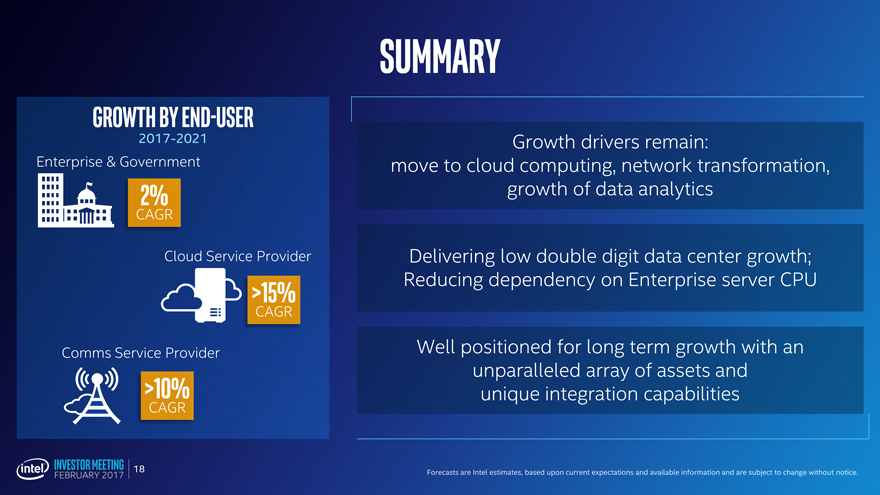
Summary
Growth byEnd-User
2017-2021
Enterprise & Government
2%
CAGR
Cloud Service Provider
>15%
CAGR
Comms Service Provider
>10%
CAGR
Growth drivers remain: move to cloud computing, network transformation, growth of data analytics
Delivering low double digit data center growth; Reducing dependency on Enterprise server CPU
Well positioned for long term growth with an unparalleled array of assets and unique integration capabilities
Forecasts are Intel estimates, based upon current expectations and available information and are subject to change without notice.
18
|
INVESTOR MEETING
FEBRUARY 2017