Exhibit 99.4
|
Investor Meeting FEBRUARY 2017
|
Rob crooke
Senior vice president & general manager volatile Memory Solutions group
|
DISCLOSURES
Statements in this presentation that refer to Business Outlook, forecast, future plans and expectations are forward-looking statements that involve a number of risks and uncertainties. Words such as “anticipates,” “expects,” “intends,” “goals,” “plans,”
“believes,” “seeks,” “estimates,” “continues,” “may,” “will,” “would,” “should,” “could,” and variations of such words and similar expressions are intended to identify such forward-looking statements. Statements that refer to or are based on projections, uncertain events or assumptions also identify forward-looking statements. Such statements are based on management’s expectations as of February 9, 2017 and involve many risks and uncertainties that could cause actual results to differ materially from those expressed or implied in these forward-looking statements. Important factors that could cause actual results to differ materially from the company’s expectations are set in Intel’s earnings release dated January 26, 2017, which is included as an exhibit to Intel’s Form8-K furnished to the SEC on such date. Additional information regarding these and other factors that could affect Intel’s results is included in Intel’s SEC filings, including the company’s most recent reports on Forms10-K and10-Q. Copies of Intel’s Form10-K,10-Q and8-K reports may be obtained by visiting our Investor Relations website at www.intc.com or the SEC’s website at www.sec.gov.
| 3
|
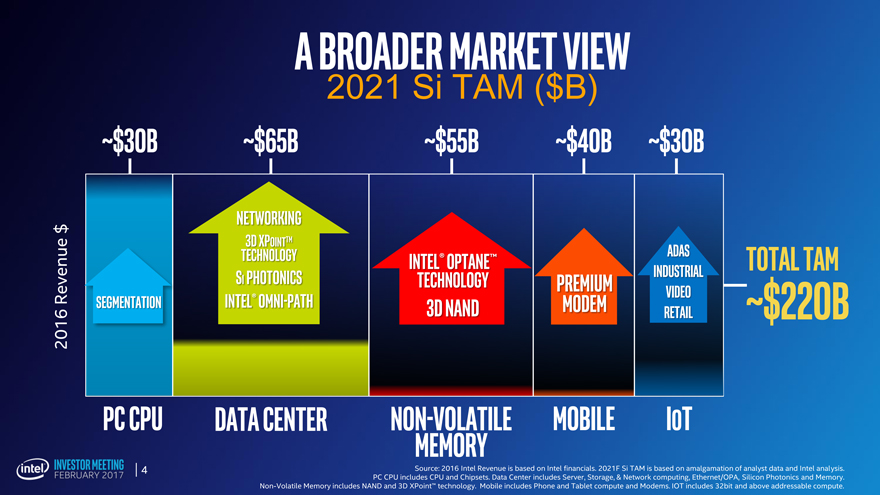
A broader market view
2021 Si TAM ($B)
~$30B ~$65B~$55B~$40B~$30B
Networking
$
TechnologyADASTotal Tam
PhotonicstechnologyIndustrial
Video
Revenue 2016 Segmentation Intel® Omni path3D NANDmodemRetail~$220B
PC CPU DatacenterNon-volatileMobileIoT
Memory
Source: 2016 Intel Revenue is based on Intel financials. 2021F Si TAM is based on amalgamation of analyst data and Intel analysis.
PC CPU includes CPU and Chipsets. Data Center includes Server, Storage, & Network computing, Ethernet/OPA, Silicon Photonics and Memory.
Non-Volatile Memory includes NAND and 3D XPoint™ technology. Mobile includes Phone and Tablet compute and Modems. IOT includes 32bit and above addressable compute.
| 4
|
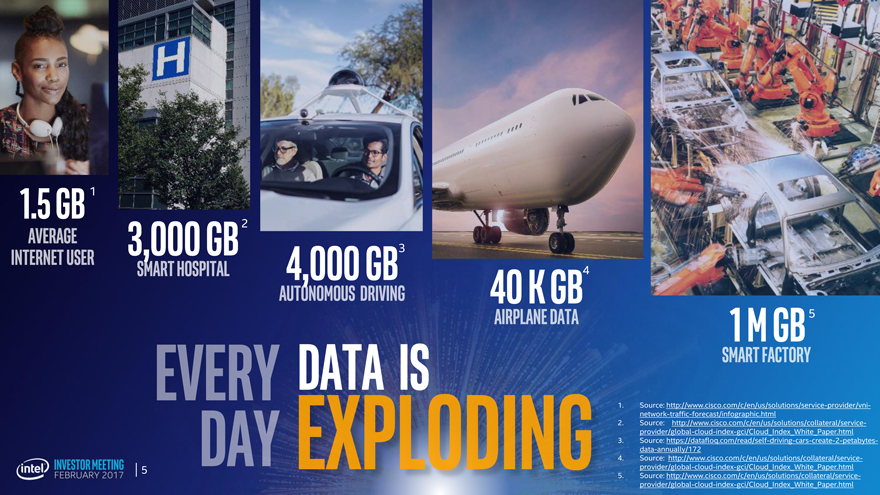
1.5 GB 1
2
3,000 GB 3
4,000 GB 40 K GB4
1 M GB5
1. Source:http://www.cisco.com/c/en/us/solutions/service-provider/vni- network-traffic-forecast/infographic.html
2. Source: http://www.cisco.com/c/en/us/solutions/collateral/service-provider/global-cloud-index-gci/Cloud_Index_White_Paper.html
3. Source:https://datafloq.com/read/self-driving-cars-create-2-petabytes- data-annually/172
4. Source: http://www.cisco.com/c/en/us/solutions/collateral/service-provider/global-cloud-index-gci/Cloud_Index_White_Paper.html
5. Source: http://www.cisco.com/c/en/us/solutions/collateral/service-provider/global-cloud-index-gci/Cloud_Index_White_Paper.html
5
|
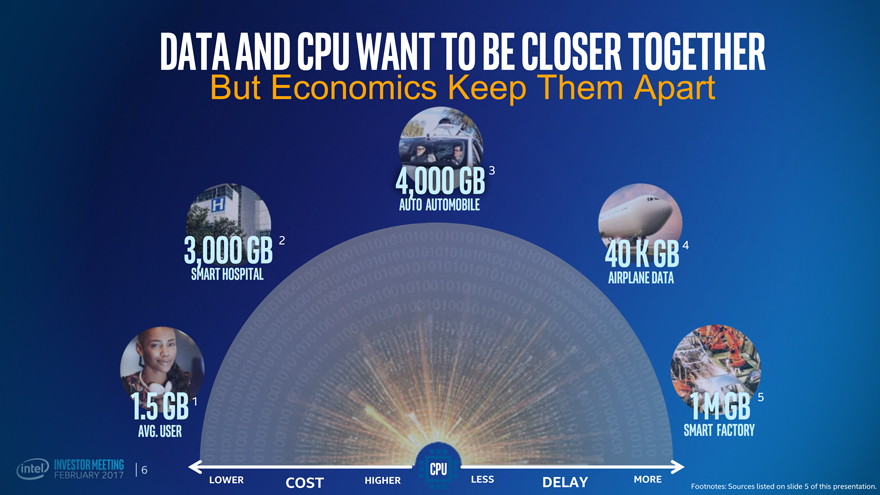
Data and CPU want to be closer together
But Economics Keep Them Apart
4,000 GB 3
Auto Automobile
3,000 GB 2 40 K GB 4
Smart Hospital Airplane Data
1.5 GB 1 1 M GB 5
AVG. USER Smart Factory
CPU
LOWER COST HIGHERLESSDELAYMOREFootnotes: Sources listed on slide 5 of this presentation.
|
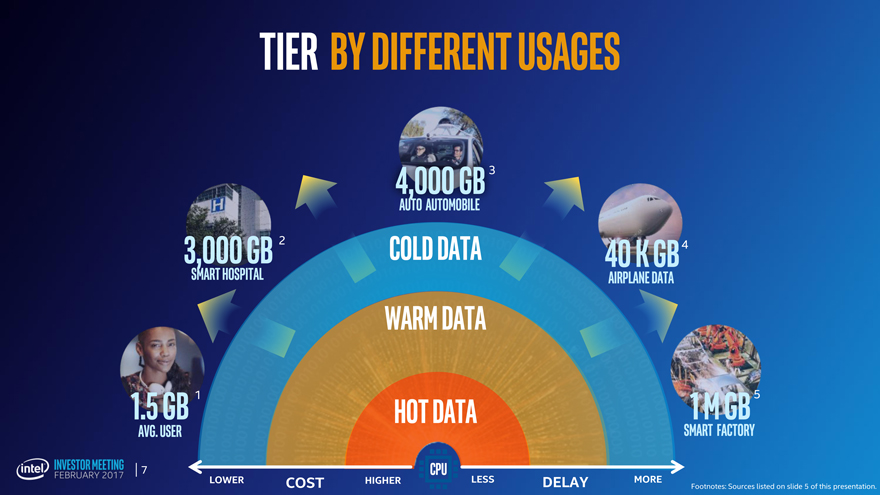
Tier by different usages
4,000 GB 3
Auto Automobile
3,000 GB 2 Cold data40 K GB 4
Smart Hospital Airplane Data
warm data
1.5 GB 1 Hot data1 M GB 5
AVG. USER Smart Factory
| 7 CPU
LOWER COST HIGHERLESSDELAYMOREFootnotes: Sources listed on slide 5 of this presentation.
|
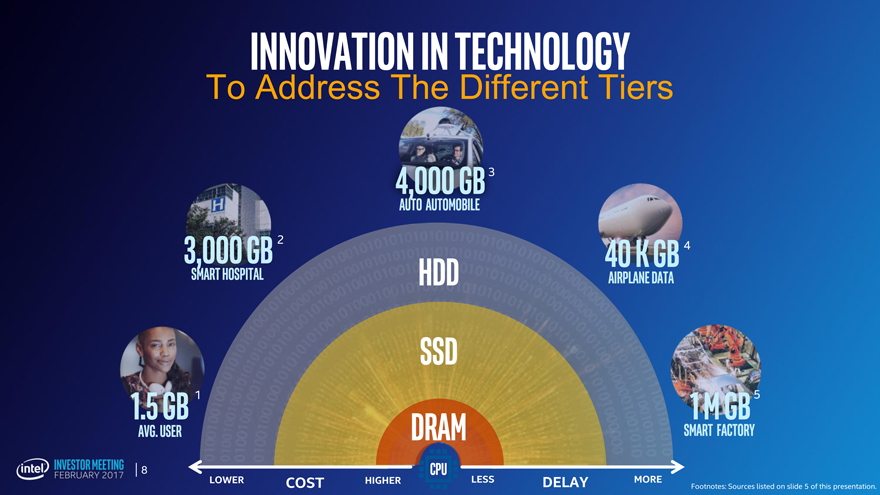
Innovation in technology
To Address The Different Tiers
4,000 GB 3
Auto Automobile
3,000 GB 2 40 K GB 4
Smart Hospital HDDAirplane Data
ssd
1.5 GB 1 1 M GB 5
AVG. USER DRAMSmart Factory
| 8 CPU
LOWER COST HIGHERLESSDELAYMOREFootnotes: Sources listed on slide 5 of this presentation.
|
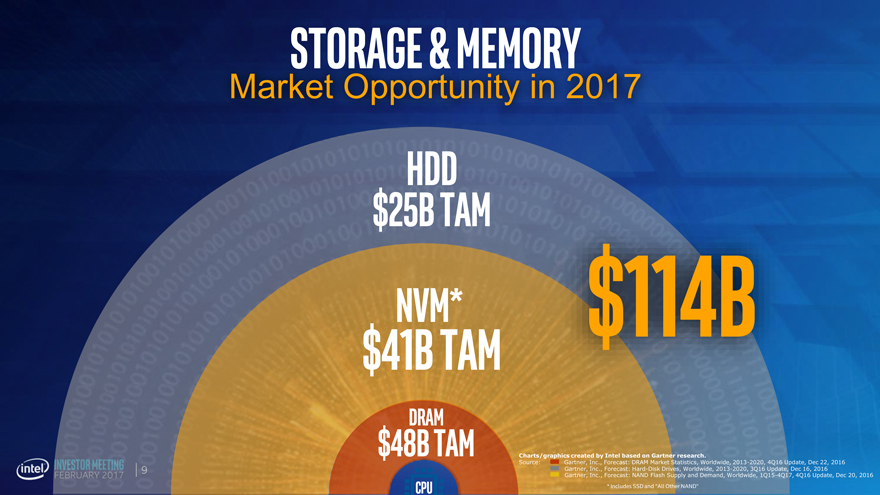
Storage & Memory
Market Opportunity in 2017
$25B HDDTAM
NVM* $114B
$41B TAM
$48BDRAM TAM
Charts/graphics created by Intel based on Gartner research.
Source: Gartner, Inc., Forecast: DRAM Market Statistics, Worldwide, 2013-2020, 4Q16 Update, Dec 22, 2016
Gartner, Inc., Forecast: Hard-Disk Drives, Worldwide, 2013-2020, 3Q16 Update, Dec 16, 2016
Gartner, Inc., Forecast: NAND Flash Supply and Demand, Worldwide, 1Q15-4Q17, 4Q16 Update, Dec 20, 2016
CPU * Includes SSD and “All Other NAND”
|
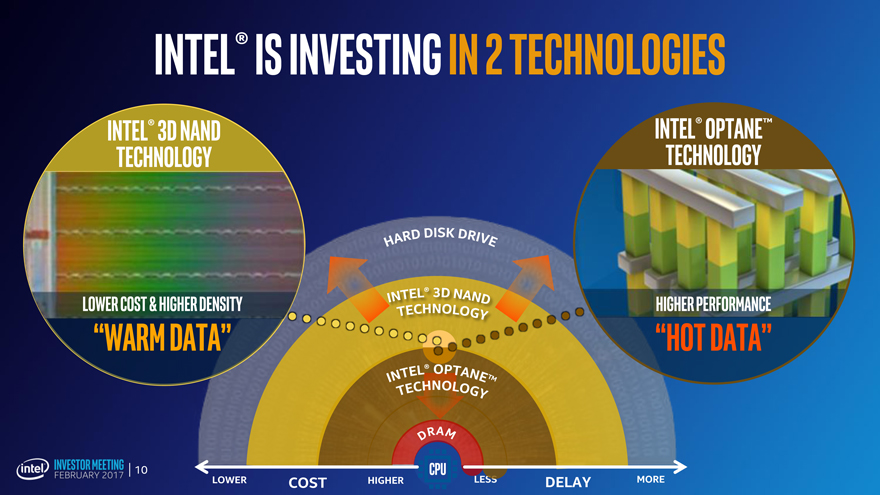
Intel® is investing in 2
Intel® 3D NAND Intel® Optane™
technology technology
lower cost & higher density Higher Performance
“Warm Data” “HOT DATA”
| CPU
LOWER COSTHIGHERLESSDELAYMORE
|
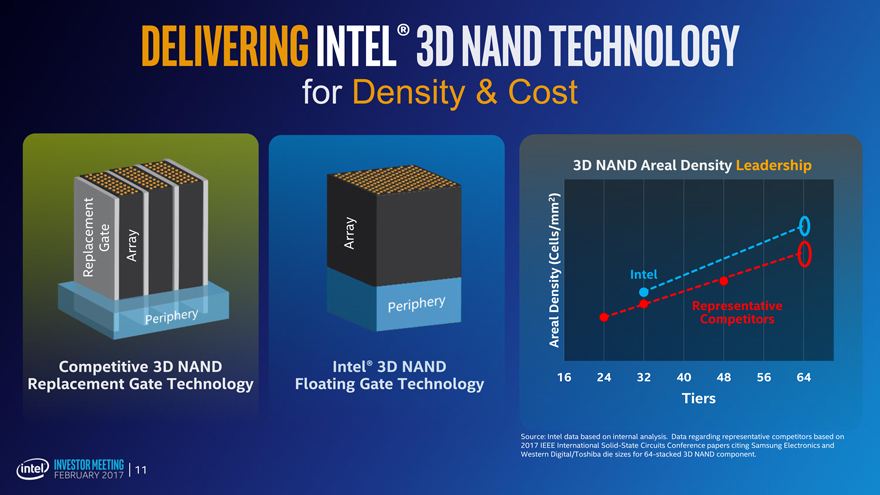
Delivering Intel® 3D NAND technology for Density & Cost
3D NAND Areal Density Leadership
)
2
Replacement Gate Array Array(Cells/mm
Intel
Density Representative
Competitors
Areal
16 24 3240485664
Tiers
Competitive 3D NAND Replacement Gate Technology
Source: Intel data based on internal analysis. Data regarding representative competitors based on
2017 IEEE International Solid-State Circuits Conference papers citing Samsung Electronics and
Western Digital/Toshiba die sizes for64-stacked 3D NAND component.
| 11
|
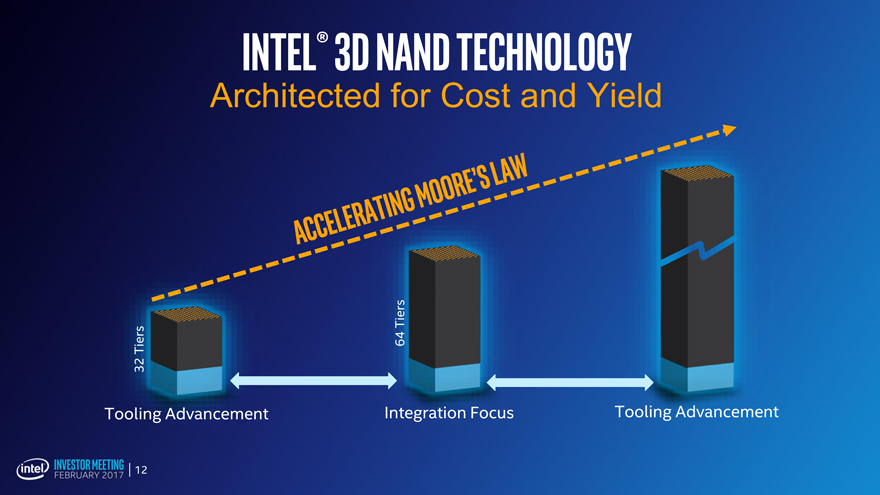
Intel® 3D NAND Technology
Architected for Cost and Yield
Tiers
Tiers 64
32
Tooling Advancement Integration Focus
Tooling Advancement
| 12
|
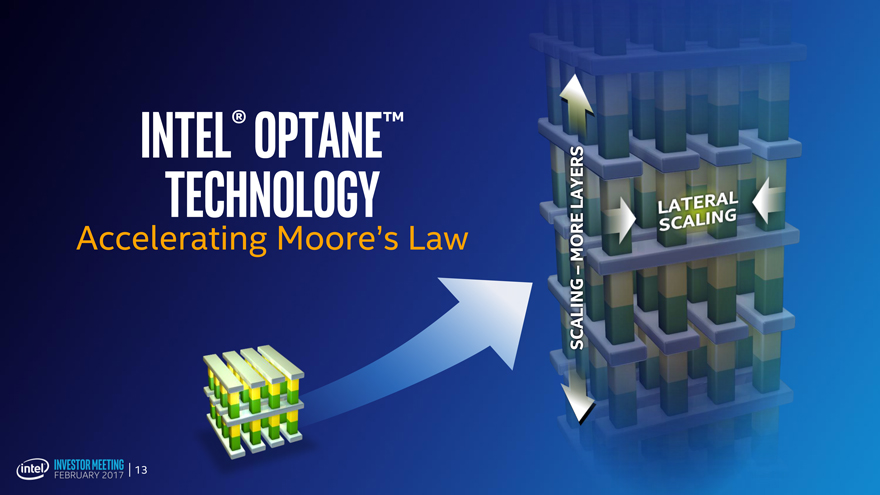
Intel® Optane™ Technology
Accelerating Moore’s Law
SCALING – MORE LAYER
LATERAL SCALING
| 13
|
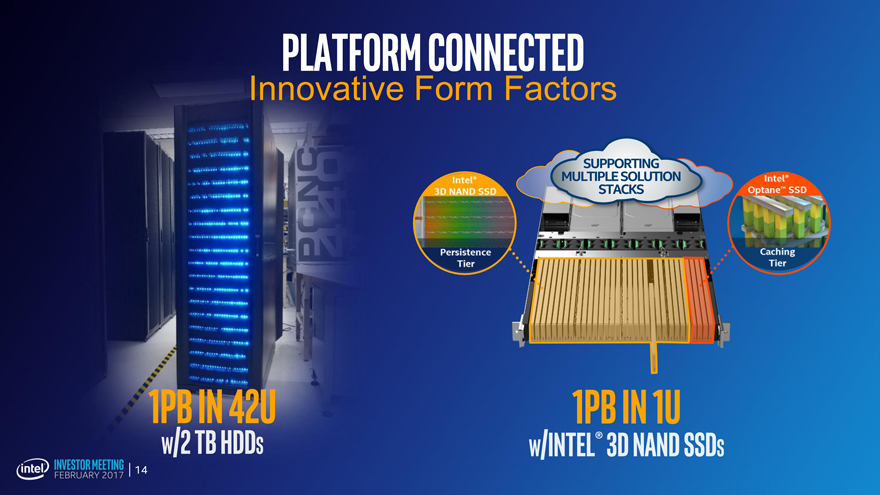
Platform Connected
Innovative Form Factors
SUPPORTING MULTIPLE SOLUTION STACKS
1PB IN 42u
W/2 TB HDDs
1PB in 1U
w/Intel® 3D NAND SSDs
|
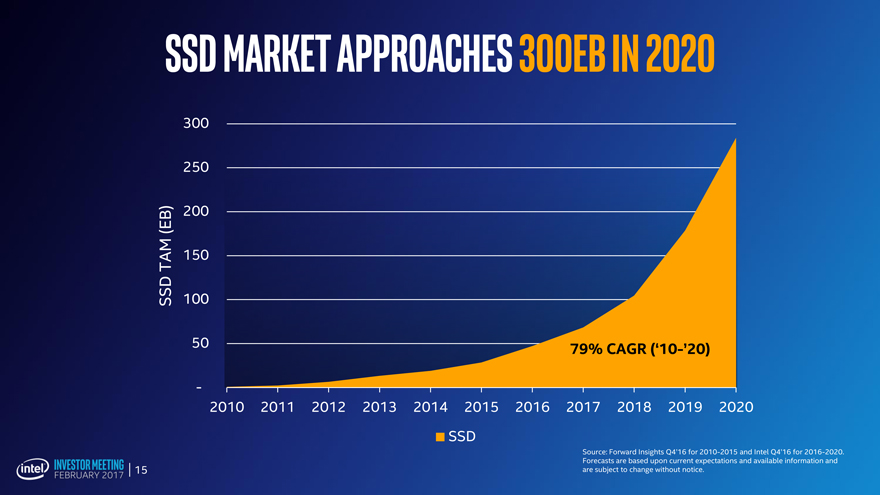
SSD Market approaches 300EB in 2020
300
250
(EB) 200 TAM 150 SSD 100
50 79% CAGR(‘10-’20)
-
2010 2011 2012 2013 2014 2015 2016 2017 2018 2019 2020 SSD
Source: Forward Insights Q4’16 for 2010-2015 and Intel Q4’16 for 2016-2020. Forecasts are based upon current expectations and available information and
| 15 are subject to change without notice.
|
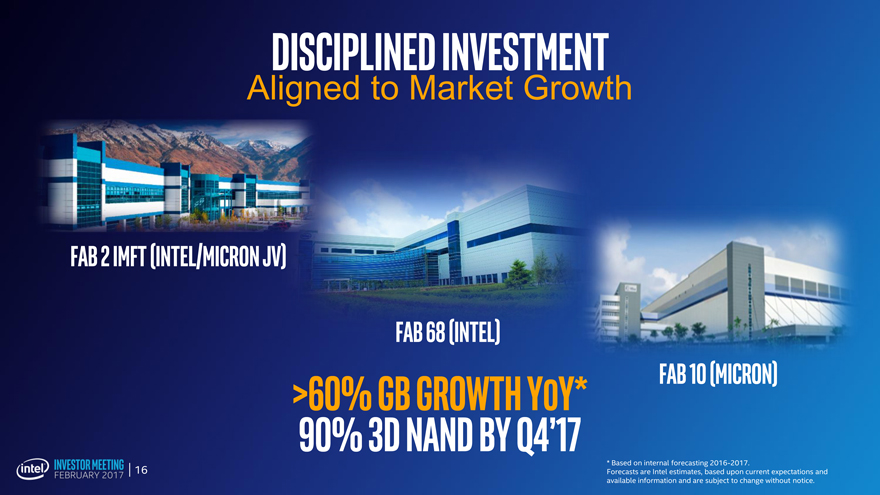
Disciplined investment
Aligned to Market Growth
Fab 2 imft (Intel/Micron JV)
Fab 68 (Intel)
>60% GB growth YoY* Fab 10 (Micron)
90% 3d NAND by q4’17
* Based on internal forecasting 2016-2017.
| 16 Forecasts are Intel estimates, based upon current expectations and available information and are subject to change without notice.
|
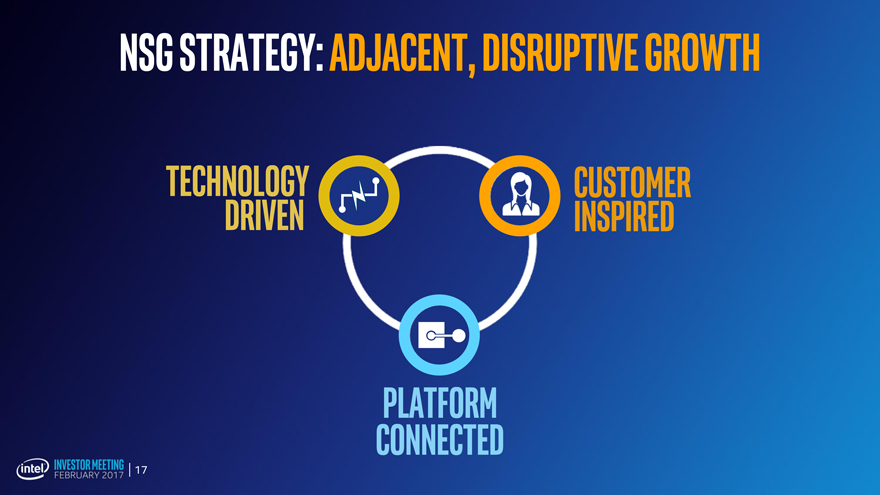
NSG Strategy: Adjacent, Disruptive Growth
Technology
Driven
Customer
inspired
Platform
connected
| 17
|
intel