Dear Shareholders:
I am pleased to deliver to you the American Growth Fund Series Two Annual Report for the six months ended January 31, 2019.
As you know, on July 29, 2016 your American Growth Fund, Inc. Series Two switched its Investment Strategy to focus on the budding cannabis business. Thus, the historical financial information and numbers, such as performance and expenses, that by regulation we are required to provide may not give investors a current, relevant picture of Series Two financial data.
2018 was a very interesting year in the cannabis business with what we call the Trump/Sessions Effect coming to an official end when Sessions resigned his position of U. S. Attorney General on November 7, 2018. William Barr has since taken over the position on February 14, 2019 and has signaled that he, unlike Jeff Sessions, may take a hands off approach and not go after companies as long as they abide by state laws.2While 10 states and Washington, D.C. have legalized recreational adult use of marijuana, and more than 20 other states allow some medical uses, U.S. attorneys can still prosecute its possession and sale under federal law. Last year, Sessions reversed an Obama-era policy that encouraged federal prosecutors to take a hands-off approach in states where marijuana is legal. This put business owners back at higher risk of coming under federal scrutiny.
While Barr's stance may seem like a departure from his previous get-tough approach to drug policy, he made it clear during his testimony that he doesn't support federal legalization.
"I think it's a mistake to back off on marijuana," said Barr. "However, if we want a federal approach, if we want states to have their own laws, then let's get there and let's get there the right way." He said Department of Justice policy should align with congressional legislation.2In 2019, now that the House of Representatives will be controlled by Democrats, some of whom have made legalization part of their campaign promises, we can probably expect a lot of talk on various national bills. There will probably be dozens of ideas tossed around, a lot of enthusiasm and a general expectation that the U.S. is moving toward an end of prohibition at the federal level. In fact, Rep. Earl Blumenauer (D-OR) has even laid out a step-by-step process for making cannabis legal in 2019.1Those that oppose federal laws legalizing cannabis for medical and/or adult recreational use certainly are influential. However there are those that feel that legalizing cannabis would allow for greater regulation especially in the area of illegal marijuana activities where there is no oversight at all.
Canada recently enacted their law federally legalizing cannabis (“Bill C-45”), the second nation to do so.
However, stringent rules will still govern the purchase and use of marijuana.
Consumers are expected to purchase marijuana from retailers regulated by provinces, territories or -- when neither of those options are available -- federally licensed producers. Marijuana will also not be sold in the same location as alcohol or tobacco.
The Canadian government has also implemented changes to their impaired driving laws, to address repercussions for driving under the influence of cannabis.
The bill set a floor on the minimum age of the consumer at 18 years, and makes the production, distribution, or sale of cannabis products an offense for minors.
Bill C-45 is also expected to spark a billion-dollar industry, given total spending on marijuana could surge as high as 58%, especially as users are expected to be willing to pay a premium for legal access to marijuana.
In the United States, BDS Analytics estimated that the marijuana industry took in nearly $9 billion in sales in 2017. The revenue from the sales is equivalent to the entire snack bar industry.3Another trend we are beginning to see is increased competition. In the past the rising industry has buoyed up everyone without regard for who, what, where, etc. Now we are seeing the more organized and better planned out endeavors rising and taking over some of the less organized companies.
This is particularly important when you consider worldwide consumer spending on legal cannabis is expected to jump 40% to $18.1 billion next year, according to Arcview and BDS Analytics and reported by Investor’s Business Daily. The research firms expect $14.4 billion of that to come from the U.S., where cannabis isn't even federally legal but the market is nonetheless the biggest.4

Expansion of product is another trend. More than 30% of all cannabis sales in California in 2018 were vapes. We believe other states will probably follow California’s lead with surging vape sales in 2019. Low-dose products, designed to attract new consumers to the cannabis space such as edibles, will start to make a showing this year. The beverage category will also make a lot of noise in 2019. It’s going to be a hot topic and will get some additional traction. However, despite the hype, it probably won’t get a lot of actual market share until 2020 or 2021. It will take time to fine-tune beverages, but they are expected to be a $600 million business by 2022.1The legal marijuana industry grew to $10.4 billion in the U.S. this year and employs more than 250,000 people, senior economist and vice president at analytics firm New Frontier Data Beau Whitney told the Associated Press in an interview as reported by Fortune.5Whitney added that in 2018, alone, investors invested $10 billion into the North American legal marijuana industry. Just $5 billion was invested in the three years prior. Next year, Whitney believes investors will funnel more than $16 billion into the industry.5
American Growth Fund, Inc. - Series Two – Page 2
Marijuana has been gaining in support over the last few years both across North America and internationally. In the U.S., dozens of states allow marijuana to be used for medicinal purposes and some states, including California and Massachusetts, have made it legal for recreational use. New York Governor Andrew Cuomo is pushing his state to legalize recreational use in 2019.5
There is still much talk about what could happen if the laws change to allow the banking industry to accept funds from the sale of cannabis and if the laws change to allow the companies that touch the plant to go public. The Investment Committee believes that eventually these changes will take place.
It is important to note Cannabis Industry Risk–The cannabis industry is a very young, fast evolving industry with possible increased exposure to rule changes, changes in laws, increasing regulations, increasing competition which may cause businesses to suddenly close or businesses to shrink as well as the possibility that a company currently operating legally may suddenly find itself exposed to illegal activities. Series Two invests in over the counter securities and does not invest in the sale of cannabis or the activity of growing cannabis crops. However, if federal laws change so may how we invest your money in the legal cannabis business.

Investment Committee
The Investment Committee that manages your Fund is made up of two veterans of the securities industry, Mr. Timothy Taggart and Mr. Robert Fleck. Mr. Taggart joined the securities industry in 1985 and is registered as a General Securities Principal, Financial and Operations Principal, Registered Options Principal and Municipal Securities Principal. He is also an Arbitrator for the Financial Industry Regulatory Authority (FINRA). Mr. Robert Fleck also joined the securities industry in 1985. He has held a General Securities license and currently is an Investment Advisor Representative.
Investment Strategy
The Fund searches for companies/investments with growth potential that could show faster growth than markets indexes. We also look for securities that are considered undervalued or out of favor with investors or are expected to increase in price over time. We use a consistent approach to build the Fund’s security portfolio which is made up primarily of common stocks involved, in at least some way, in the legal cannabis business. Examples of companies associated with the legal cannabis business could include legally registered publicly traded companies in fields such as agriculture, pharmaceutical, hydroponic or tobacco companies or Real Estate Investment Trusts. These securities may be issued by large companies and also small and mid-sized companies, Micro Cap companies and REITs. The legal cannabis business does not need to be the sole focus point of a company for Series Two to invest in it; nor does it need to account for a majority of its overall revenues. For example, Series Two may invest in Company XYZ, a pharmaceutical company developing uses for medical cannabis even if the revenues produced as a result of the sales of medical cannabis is responsible for less than 5% of XYZ’s overall revenue.
Performance Overview
Of the top ten stocks that were held in the Series Two portfolio, most of them contributed to the growth of the Fund.
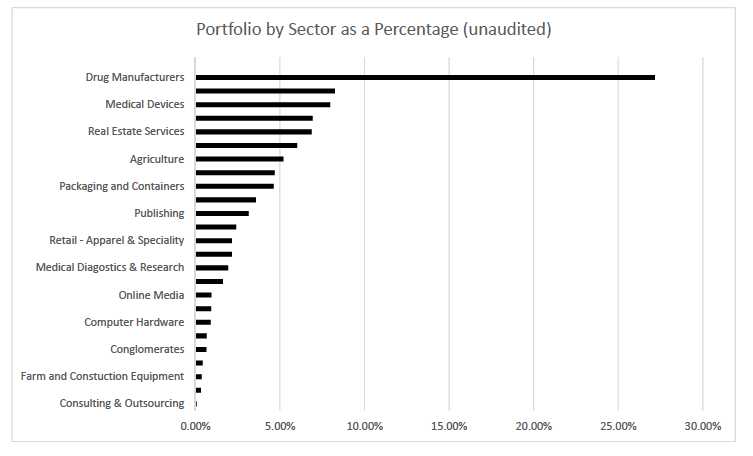
Looking at Series Two’s portfolio, Drug Manufacturers makes up the largest sector of your Series Two portfolio at 27.17% and contains the portfolio’s largest investment, GW Pharmaceuticals at $74,230.
GW Pharmaceuticals is engaged in the research, development and commercialization of cannabinoid prescription medicines using botanical extracts derived from the Cannabis Sativa plant. When examining the rest of the portfolio, the largest market value gain was Freedom Leaf which rose 118.90% (which contributed to a gain of 17.35% of the total gain on investments). Innovative Industrial Properties, Inc. followed with a market value gain of 91.23%, (which contributed to a gain of 33.34% of the total gain on
investments). CV Sciences Inc. had the third highest market value gain at 79.49%, (which contributed to gain of 31.52% of the total gain on investments).
Unfortunately, not all investments performed as well. Blue line Protection Group, Inc. (Consulting & Outsourcing) market value was a negative 88.14%, or a negative 5.51% of the total gain on investments. GB Sciences (Biotechnologies) was a negative 54.33%, or a negative 3.55% of the total gain on investments, and Axim Biotechnologies, Inc. (Conglomerates) was a negative 51.97%, or a negative 0.98% of the total gain on investments.
Publishing, Real Estate Services, and Personal Services, all boosted Series Two’s portfolio Market Value while Consulting & Outsourcing, Farm and Construction Equipment, and Computer Hardware worked against Series Two’s portfolio Market Return.
Overall, your American Growth Fund Series Two Class E Shares delivered you a negative 0.24% return (this number includes a sales load of 5.75% as well as Fund expenses and change in Market Value) since July 31, 2018 through close of business on January 31, 2019. The Dow Jones Industrial Average posted a loss of 0.49% since July 31, 2018 through close of business on January 31, 2019 while the S&P 500 posted a loss of 3.00% since July 31, 2018 through close of business on January 31, 2019.
Additional data, including long-term performance data, can be found on page 24 of this report. Past performance is no guarantee of future results.
American Growth Fund, Inc. - Series Two – Page 3
Lastly, overall, both the United States Marijuana Index and Canadian Marijuana Index show December 2018’s market turmoil and the recovery that began in January 2019. This Index tracks the performance of the legal marijuana industry, which includes companies that directly handle legal marijuana, such as marijuana producers, processors, distributors, and retailers. It also includes companies that do not directly handle the plant products, but cater to those who do, as well as to consumers. It is important to remember that past performance does not guarantee future results.
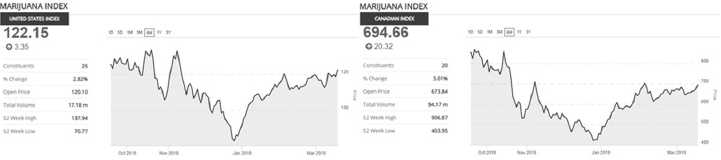
The United States Marijuana Index and Canadian Marijuana Index 6 month charts beginning September 18, 2018 and ending March 18, 2019.
As we look at how the cannabis business is performing, we are optimistic and will continue to look for growth opportunities for our shareholders but will remain somewhat guarded yet optimistic due to the current administration. It is our opinion that we will see more growth in the legal cannabis business in the upcoming months.
My staff and I are always available to discuss your account or answer any questions you might have. Please call our toll free number, 800 525-2406 or, within Colorado, 303-626-0600.
American Growth Fund wishes youA GoodFuture!
| 1. | https://www.forbes.com/sites/nickkovacevich/2019/01/02/budding-cannabis-trends-in-2019/#72537af4586f |
| 2. | https://www.cbsnews.com/news/william-barr-on-marijuana-legalization-attorney-general-nominee/ |
| 3. | https://www.cnn.com/2018/06/20/health/canada-legalizes-marijuana/index.html |
| 4. | https://www.investors.com/news/marijuana-stocks-2019-outlook-farm-bill/ |
| 5. | http://fortune.com/2018/12/27/legal-marijuana-industry-sales/ |
American Growth Fund, Inc. - Series Two – Page 4
This page intentionally left blank.
American Growth Fund, Inc. - Series Two – Page 5
How American Growth Fund, Inc. Series Two
Has Its Shareholders' Money Invested
STATEMENT OF INVESTMENTS
JANUARY 31, 2019 (unaudited)
| | | | |
| | | | | Market |
| Description of Security | | Shares | | Value |
| |
| COMMON STOCK |
| |
| Drug Manufacturers 27.17% |
| GW Pharmaceuticals Plc* | | 520 | $ | 74,230 |
| (Engaged in the research, development and commercialization of cannabinoid prescription medicines | | | |
| using botanical extracts derived from the Cannabis Sativa plant.) | | | | |
| CV Sciences Inc.* | | 11,260 | | 63,056 |
| (A Life Science company which operates two business segments specialty pharmaceuticals and | | | |
| consumer products.) | | | | |
| Merck & Company Inc. | | 640 | | 47,635 |
| (A health care company that delivers health solutions through its prescription medicines, vaccines, | | | |
| biologic therapies, and animal health.) | | | | |
| AbbVie Inc. | | 420 | | 33,722 |
| (A research-based biopharmaceutical company. It engaged in the discovery, development, manufacture | | | |
| and sale of a broad line of pharmaceutical products for treating chronic autoimmune diseases virology | | | |
| and neurological disorders.) | | | | |
| Bausch Health COS Inc.* | | 935 | | 22,954 |
| (Is a global specialty pharmaceutical, consumer health, and medical device company with a focus on | | | |
| branded products for the dermatology, gastrointestinal, and ophthalmology markets.) | | | |
| Medical Marijuana Inc.* | | 34,720 | | 2,750 |
| (Engaged in the development, sale and distribution of hemp oil that contains naturally occurring | | | |
| cannabinoids, including cannabidiol, and other products containing CBD-rich hemp oil.) | | | |
| EVIO Inc.* | | 1,221 | | 525 |
| (EVIO Inc offers a full suite of analytical services for Cannabis flowers, extracts, and infused products | | | |
| including cannabinoid and terpene profiling, pesticide and residual solvent screening, microbiological | | | |
| testing, and other.) | | | | |
| | | | | 244,872 |
| |
| Biotechnologies 8.25% |
| Cara Therapeutics Inc.* | | 2,265 | | 34,541 |
| (Develops technologies and processes to convert the cannabis plant into medicines, therapies and | | | |
| treatments for ailments.) | | | | |
| Corbus Pharmaceuticals* | | 4,030 | | 30,467 |
| (Is a clinical stage biopharmaceutical company focused on the development and commercialization of | | | |
| novel therapeutics to treat rare, life-threating inflammatory-fibrotic diseases.) | | | |
| Nemus Bioscience Inc.* | | 21,255 | | 6,738 |
| (Is a biopharmaceutical company engaged in the discovery, development, and the commercialization of | | | |
| cannabis-based therapeutics.) | | | | |
| GB Sciences Inc.* | | 17,260 | | 2,641 |
| (A clinical-stage biopharmaceutical company focused on developing and commercializing new chemical | | | |
| entities designed to alleviate pain and purities by selectively targeting kappa opioid receptors.) | | | |
| | | | | 74,387 |
| |
| Medical Devices 7.97% |
| Abbott Laboratories | | 740 | | 54,005 |
| (Discovers, Develops, Manufactures and sells health care products. | Its products include branded generic | | | |
| pharmaceuticals manufactured internationally, marketed and sold outside the United States.) | | | |
| Cannabix Technologies Inc* | | 12,890 | | 17,805 |
| (Is a technology company engaged in developing Cannabix marijuana breathalyzer.) | | | |
| | | | | 71,810 |
| *Non-income producing security | | | | |
| See accompanying notes to financial statements. | | | | |
American Growth Fund, Inc. - Series Two – Page 6
| | | | |
| How American Growth Fund, Inc. Series Two | | | | |
| Has Its Shareholders' Money Invested | | | | |
| STATEMENT OF INVESTMENTS | | | | |
| JANUARY 31, 2019 (unaudited) | | | | |
| |
| | | | | Market |
| Description of Security | | Shares | | Value |
| |
| COMMON STOCK (continued) |
| |
| Real Estate Services 6.87% |
| Innovative Industrial Properties, Inc.* | | 1000 | $ | 61,920 |
| (Is engaged in the acquisitions, ownership, and management of specialized industrial properties leased to | | | |
| state-licensed operators for their regulated medical-use cannabis facilities.) | | | | |
| |
| Application Software 6.01% |
| Microsoft Corporation | | 510 | | 53,259 |
| (Engaged in designing, manufacturing, selling devices, and online advertising. Its products include | | | |
| operating systems for computing devices, servers, phones and other devices.) | | | | |
| MassRoots Inc.* | | 15,110 | | 907 |
| (A network for the cannabis community. Through its mobile applications, systems and websites, the | | | |
| Company enables people to share their cannabis-related content and for businesses to connect with those | | | |
| consumers.) | | | | |
| | | | | 54,166 |
| |
| Agriculture 5.20% |
| Scotts Miracle-Gro Company | | 630 | | 46,840 |
| (Engaged in the manufacturing, marketing and selling of dry, granular slow-release lawn fertilizers, | | | |
| combination lawn fertilizer and control products, and continuous release garden and indoor plant foods.) | | | |
| |
| Industrial Products 4.69% |
| Vestas Wind Systems A/S | | 1,525 | | 42,242 |
| (Is one of the largest manufacturers of wind turbines in the world.) | | | | |
| |
| Packaging and Containers 4.63% |
| Kush Bottles Inc.* | | 7,670 | | 41,725 |
| (Engaged in the wholesale distribution of packaging supplies for the cannabis industry. | Its brands include | | | |
| Futurola, Philips RX, Boveda, and Nectar Collector.) | | | | |
| |
| Consumer Packaged Goods 3.58% |
| Lexaria Bioscience Corp* | | 17,390 | | 25,911 |
| (Lexaria Bioscience Corp is a food sciences company. It has two distinct consumer product brands: ViPova | | | |
| and Lexaria Energy. It uses patent pending technology to infuse hemp oil ingredients within lipids in | | | |
| popular foods.) | | | | |
| Charlottes Web Holding Inc. | | 390 | | 6,439 |
| (Is engaged in the production and distribution of hemp-based cannabidiol (CBD) wellness products. Its | | | |
| product categories include tinctures (liquid product), capsules and topical products.) | | | | |
| | | | | 32,350 |
| |
| Publishing 3.14% |
| Freedom Leaf* | | 104,840 | | 28,296 |
| (Freedom Leaf Inc is a development stage company. The Company is engaged in the print and online | | | |
| publications of news, art, fashion, lifestyle, entertainment and the cannabis industry through social media | | | |
| and on its website.) | | | | |
| |
| |
| |
| *Non-income producing security | | | | |
| See accompanying notes to financial statements. | | | | |
American Growth Fund, Inc. - Series Two – Page 7
| | | |
| How American Growth Fund, Inc. Series Two | | | |
| Has Its Shareholders' Money Invested | | | |
| STATEMENT OF INVESTMENTS | | | |
| JANUARY 31, 2019 (unaudited) | | | |
| |
| | | | Market |
| Description of Security | Shares | | Value |
| |
| COMMON STOCK (continued) |
| |
| Beverages – Alcoholic 2.41% |
| Constellation Brands, Inc.* | 125 | $ | 21,708 |
| (Produces beer, wine, and spirits and is one of the largest multicategory alcoholic beverage suppliers in the | | | |
| U.S.) | | | |
| |
| Retail – Apparel & Specialty 2.15% |
| LeafBuyer Technologies | 13,400 | | 11,926 |
| (Operates an online portal for cannabis deals and specials. The company primarily serves legal cannabis | | | |
| dispensaries and companies who create cannabis-related products.) | | | |
| AeroGrow International | 3,100 | | 7,440 |
| (Engaged in developing, marketing, and distribution indoor aeroponic garden systems designed and priced | | | |
| to appeal to the consumer gardening, cooking and small indoor appliance markets.) | | | |
| | | | 19,366 |
| |
| Exchange Traded Funds 2.15% |
| ETF Managers Alternative Harvest* | 550 | | 19,338 |
| |
| |
| Medical Diagnostics & Research 1.93% |
| Cannabis Sciences Inc.* | 347,210 | | 17,360 |
| (Engaged in the creation of cannabis-based medicines, both with and without psychoactive properties, to | | | |
| treat disease and the symptoms of disease, as well as for general health maintenance.) | | | |
| |
| Business Services 1.63% |
| CannaGrow Holdings Inc.* | 8,260 | | 6,938 |
| (A lessor, liaison, and consultant to licensed growers providing growing facilities for medical and | | | |
| recreational cannabis industry in the State of Colorado.) | | | |
| Americann, Inc.* | 2,875 | | 5,750 |
| (Develops and supports medical cannabis cultivation and processing facilities.) | | | |
| Medicine Man Technologies Inc.* | 1,000 | | 2,020 |
| (A cannabis consulting company. The Company provides consulting services for cannabis growing | | | |
| technologies and methodologies, as well as retail operations of cannabis products.) | | | |
| | | | 14,708 |
| |
| Online Media 0.95% |
| Chineseinvestors.com* | 17,210 | | 8,614 |
| (Chineseinvestors.com Inc provides real-time market commentary and analysis in the Chinese language. | | | |
| The company offers various levels of information relative to the US Equity and Financial Markets as well as | | | |
| certain other specific financial markets.) | | | |
| |
| Personal Services 0.93% |
| Cannabis Sativa Inc.* | 2,300 | | 8,349 |
| (Engaged in research, development, and licensing of specialized natural cannabis products, including | | | |
| cannabis formulas, edibles, topicals, strains, recipes and delivery systems.) | | | |
| |
| |
| |
| *Non-income producing security | | | |
| See accompanying notes to financial statements. | | | |
American Growth Fund, Inc. - Series Two – Page 8
| | | |
| How American Growth Fund, Inc. Series Two | | |
| Has Its Shareholders' Money Invested | | |
| STATEMENT OF INVESTMENTS | | | |
| JANUARY 31, 2019 (unaudited) | | | |
| |
| | | | Market |
| Description of Security | | Shares | Value |
| |
| COMMON STOCK (continued) |
| |
| Computer Hardware 0.91% |
| Generation Alpha, Inc. * | | 13,930 | 8,219 |
| (Researches, designs, develops and manufactures advanced, energy efficient indoor horticulture lighting | | |
| and ancillary equipment.) | | | |
| |
| Tobacco 0.66% |
| MCIG Inc.* | | 33,960 | 5,943 |
| (Is a diversified holdings company focused on technology and consulting, cultivation, biotech, vaporizers, | | |
| dispensary supplies, and payment processing business.) | | |
| |
| Conglomerates 0.65% |
| MTech Acquisition Corp. | | 500 | 5,070 |
| (Is a blank check company that aquired MJ Freeway which is a seed-to-sale technology provider for the | | |
| cannabis industry and developer of enterprise resource planning platform.) | | |
| Axim Biotechnologies, Inc * | | 820 | 804 |
| (Is a biotechnology company in a development stage. | They are beginning Phase II Trails for a cannabidoil | | |
| chewing gum for Irritable Bowel Syndrome.) | | | |
| | | | 5,874 |
| |
| Industrial Distribution 0.43% |
| GrowGeneration Corp.* | | 1,300 | 3,887 |
| (GrowGeneration Corp operates hydroponic and organic specialty gardening retail outlets in the United | | |
| States. It sells products including organic nutrients and soil, advanced lighting technology, hydroponic and | | |
| aquaponics equipment and other products.) | | | |
| |
| Farm and Construction Equipment 0.37% |
| Surna, Inc.* | | 45,880 | 3,326 |
| (Designs, manufactures, and distributes systems for controlled environmental agriculture.) | | |
| |
| Forest Products 0.32% |
| Sugarmade Inc. Com | | 42,860 | 2,872 |
| (Is a product and brand marketing company, which engages in investing in products and brands with | | |
| disruptive potential. It is engaged in marketing and distribution of environmental friendly non-tree-based | | |
| paper products.) | | | |
| |
| Consulting & Outsourcing 0.07% |
| Blue Line Protection Group Inc.* | | 313,020 | 657 |
| (Engaged in providing armed protection, asset management, logistics, and compliance services for | | |
| business engaged in the legal cannabis industry.) | | | |
| |
| |
| |
| |
| *Non-income producing security | | | |
| See accompanying notes to financial statements. | | | |
American Growth Fund, Inc. - Series Two – Page 9
How American Growth Fund, Inc. Series Two
Has Its Shareholders' Money Invested
STATEMENT OF INVESTMENTS
JANUARY 31, 2019 (unaudited)
| | | | | |
| | | | | Market | |
| Description of Security | Shares | | | Value | |
| |
| COMMON STOCK (continued) |
| |
| Total Common Stocks(cost $696,165) – 93.07% | | | | 838,829 | |
| |
| |
| Total Investments, at Market Value(cost $696,165) | 93.07 | % | | 838,829 | |
| Other Assets, Less Liabilities | 6.93 | % | | 62,490 | |
| Net Assets | 100.00 | % | $ | 901,319 | |
*Non-income producing security
See accompanying notes to financial statements.
American Growth Fund, Inc. - Series Two – Page 10
| | | |
| Financial Statements | | | |
| AMERICAN GROWTH FUND, INC. SERIES TWO | | | |
| STATEMENT OF ASSETS AND LIABILITIES, JANUARY 31, 2019 (unaudited) | | | |
| |
| ASSETS: | | | |
| Investments, at market value(cost $696,165) | $ | 838,829 | |
| Cash | | 65,634 | |
| Receivables: | | | |
| Shares of beneficial interest sold | | 95 | |
| Securities sold | | - | |
| Dividends and interest | | 687 | |
| Other | | 847 | |
| Total assets | | 906,092 | |
| LIABILITIES: | | | |
| Shares of beneficial interest redeemed | | - | |
| Securities purchased payable | | - | |
| 12b-1 fees | | 1,475 | |
| Management fee | | 715 | |
| Other Payables | | 2,488 | |
| Total liabilities | | 4,678 | |
| NET ASSETS | $ | 901,414 | |
| COMPOSITION OF NET ASSETS: | | | |
| Paid-in capital | $ | 906,196 | |
| Accumulated Net Investment Loss | | (45,219 | ) |
| Accumulated net realized loss from investment transactions | | (102,227 | ) |
| Net unrealized appreciation of investments | | 142,664 | |
| Net assets | $ | 901,414 | |
| NET ASSET VALUE PER SHARE: | | | |
| Class E Shares: | | | |
| Net asset value and redemption price per share (based on net assets of | $ | 4.07 | |
| $901,414 and 221,408 shares of beneficial interest outstanding) | | | |
| Maximum offering price per share (net asset value plus sales charge of 5.75% of | $ | 4.32 | |
| offering price) | | | |
See accompanying notes to financial statements
American Growth Fund, Inc. - Series Two – Page 11
| | | |
| Financial Statements | | | |
| AMERICAN GROWTH FUND, INC. SERIES TWO | | | |
| STATEMENT OF OPERATIONS FOR THE SIX MONTHS ENDED JANUARY 31, 2019 (unaudited) | | | |
| |
| INVESTMENT INCOME: | | | |
| Dividends | $ | 4,247 | |
| Interest | | 73 | |
| Total investment income | | 4,320 | |
| |
| EXPENSES: | | | |
| Investment advisory fees (Note 4) | | 4,185 | |
| Administration expenses (Note 4) | | 4,461 | |
| Transfer agent, shareholder servicing and data processing fees | | 2,849 | |
| Accounting fees | | 3,000 | |
| Rent expense (Note 4) | | 2,481 | |
| Custodian fees | | 2,464 | |
| Professional fees | | 20,107 | |
| Registration and filing fees (Note 1): | | 2,236 | |
| Shareholder reports | | 1,088 | |
| Distribution and service fees (Note 4): | | | |
| Class E | | 1,255 | |
| Class F | | - | |
| Directors fees (Note 4) | | 1,084 | |
| D&O / E&O Insurance | | - | |
| Other expenses | | 4,329 | |
| Total expenses | | 49,539 | |
| Net investment loss | | (45,219 | ) |
| |
| REALIZED AND UNREALIZED GAIN OR LOSS ON INVESTMENTS: | | | |
| Net realized loss on investments | | - | |
| Net change in unrealized appreciation on investments | | 88,592 | |
| Net loss on investments | | 88,592 | |
| Net decrease in net assets resulting from operations | $ | 43,373 | |
See accompanying notes to financial statements
American Growth Fund, Inc. - Series Two – Page 12
| | | | | | | |
| Financial Statements | | | | | | | |
| AMERICAN GROWTH FUND, INC. SERIES TWO | | | | | | | |
| STATEMENTS OF CHANGES | | | | | | | |
| |
| | | | Six Months | | | | |
| | | | Ended | | | Year Ended | |
| | | | January 31, 2019 | | | July 31, 2018 | |
| | | | (unaudited) | | | | |
| INCREASE (DECREASE) IN NET ASSETS FROM | | | | | | | |
| OPERATIONS: | | | | | | | |
| Net investment loss | | $ | (45,219 | ) | $ | (101,412 | ) |
| Net realized gain (loss) on investments | | | - | | | (45,313 | ) |
| Net change in unrealized appreciation/depreciation on investments. | | | 88,592 | | | 68,629 | |
| Net increase (decrease) in net assets resulting from operations | | | 43,373 | | | (78,096 | ) |
| |
| BENEFICIAL INTEREST TRANSACTIONS: | | | | | | | |
| Net increase (decrease) in net assets resulting from beneficial interest transactions (Note 2): | | | | | | | |
| Class E | | | 93,242 | | | 253,592 | |
| Class F1 | | | - | | | - | |
| Net change in net assets derived from beneficial interest | | | | | | | |
| transactions | | | 93,242 | | | 253,592 | |
| Total increase (decrease) | | | 136,615 | | | 175,496 | |
| Net Assets - Beginning of year | | | 764,799 | | | 589,303 | |
| Net Assets - End of year | | $ | 901,414 | | $ | (764,799 | ) |
| | | | | | | |
1 As of October 2016, all Class F shareholders were redeemed or transferred to other share classes. As of July 31, 2018 Class F shares remained open with no outstanding shares.
.
See accompanying notes to financial statements
American Growth Fund, Inc. - Series Two – Page 13
| | | | | | | | | | | | | | | | | | |
| Financial Highlights | | | | | | | | | | | | | | | | | | |
| AMERICAN GROWTH FUND, INC. SERIES TWO | | | | | | | | | | | | | | | | | | |
| |
| Class E | | | | | | | | | | | | | | | | | | |
| | Six | | | | | | | | | | | | | | | | |
| | Month | | | | | | | | | | | | | | | | |
| | | Ended | | | Year Ended | | | | | | | | | | | | | |
| | January 31 | | | July 31, | | | | | | | | | | | | | |
| | (unaudited) | | | | | | | | | | | | | | | | |
| | | 2019 | | | 2018 | | | 2017 | | | 2016 | | | 2015 | | | 2014 | |
| Per Share Operating Data: | | | | | | | | | | | | | | | | | | |
| Net Asset Value, | | | | | | | | | | | | | | | | | | |
| Beginning of Period | $ | 3.85 | | $ | 4.04 | | $ | 11.15 | | $ | 12.28 | | $ | 11.28 | | $ | 10.14 | |
| Income gain (loss) from investment operations: | | | | | | | | | | | | | | | | | | |
| Net investment loss3 | | (0.22 | ) | | (0.58 | ) | | (0.64 | ) | | (0.78 | ) | | (0.62 | ) | | (0.50 | ) |
| Net realized and unrealized gain (loss) | | 0.44 | | | 0.39 | | | (0.61 | ) | | (0.35 | ) | | 1.62 | | | 1.64 | |
| Total income gain (loss) from investment | | | | | | | | | | | | | | | | | | |
| operations | | 0.22 | | | (0.19 | ) | | (1.25 | ) | | (1.13 | ) | | 1.00 | | | 1.14 | |
| Distributions: | | | | | | | | | | | | | | | | | | |
| Long-term capital gains distributions | | - | | | - | | | (5.73 | ) | | - | | | - | | | - | |
| Return of capital distributions | | - | | | - | | | (0.13 | ) | | - | | | - | | | - | |
| Total distributions | | - | | | - | | | (5.86 | ) | | - | | | - | | | - | |
| Net Asset Value, End of Period | $ | 4.07 | | $ | 3.85 | | $ | 4.04 | | $ | 11.15 | | $ | 12.28 | | $ | 11.28 | |
| Total Return at Net Asset Value1 | | 5.7 | %4 | | (4.7 | )% | | (23.8 | )% | | (9.2 | )% | | 8.9 | % | | 11.2 | % |
| Ratios/Supplemental Data: | | | | | | | | | | | | | | | | | | |
| Net assets, end of period (in thousands) | | 1,283 | | | 765 | | | 589 | | | 1,225 | | | 1,476 | | | 1,584 | |
| Ratio to average net assets: | | | | | | | | | | | | | | | | | | |
| Net investment loss3 | | (10.86 | )% | | (14.30 | )% | | (13.37 | )% | | (7.00 | )% | | (5.24 | )% | | (4.58 | )% |
| Expenses. | | 11.89 | %5 | | 15.15 | % | | 14.53 | % | | 8.94 | % | | 6.87 | % | | 6.16 | % |
| Portfolio Turnover Rate2 | | 0 | % | | 8 | % | | 151 | % | | 0 | % | | 0 | % | | 4 | % |
1. Assumes a hypothetical initial investment on the business day before the first day of the fiscal period with all dividends and
distributions reinvested in additional shares on the reinvestment date and redemption at the net asset value calculated on the last
business day of the fiscal period. Sales charges are not reflected in total returns.
2. The lesser of purchases or sales of portfolio securities for a period, divided by the monthly average of the market value of
securities owned during the period. Securities with a maturity or expiration date at the time of acquisition of one year or less are
excluded from the calculation. Purchases and sales of investment securities (other than short-term securities) from the six months
ended January 31, 2019, aggregated $37,696 and $0, respectively.
3. Per share amounts have been calculated using the Average Shares Method.
4. Six Months Ended Calculation has not been annualized.
5. Six Months Ended Calculation has been annualized.
See accompanying notes to financial statements
American Growth Fund, Inc. - Series Two – Page 14
Notes to Financial Statements
American Growth Fund, Inc. Series Two (unaudited)
1.Summary of Significant Accounting Policies
American Growth Fund, Inc. Series Two (the "Fund") is registered under the Investment Company Act of 1940, as amended, as a diversified, open-end management investment company. The Fund follows the investment company accounting and reporting guidance of the Financial Accounting Standards Board Accounting Standards Codification Topic 946 “Financial Services – Investment Companies.” The Fund's primary investment objective is growth of capital. The Fund's investment advisor is Investment Research Corporation (IRC). The Fund offers Class E and Class F shares. Class E has a maximum sales charge (load) imposed on purchases (as a percentage of offering price) of 5.75%. Purchases of Class E shares in amounts of $1,000,000 or more which are not subject to an initial sales charge generally will be subject to a contingent deferred sales charge of 1.0% of amounts redeemed within the first year of purchase. Class F has a maximum deferred sales charge as a percentage of original purchase price or redemption proceeds, whichever is lower, of 1% for the first year. As of July 31, 2018, there were no shares of Class F outstanding. All classes of shares have identical rights to earnings, assets and voting privileges, except that each class has its own distribution and/or service plan and expenses directly attributable to that class and exclusive voting rights with respect to matters affecting that class.
Reclassifications -Accounting principles generally accepted in the United States of America require that certain components of net assets be reclassified between financial and tax reporting. These reclassifications have no effect on net assets or net asset value per share. For the year ended July 31, 2018, the Fund decreased net investment loss by $101,412, and decreased paid-in capital by $101,412.
Investment Valuation –Investment securities traded on the New York Stock Exchange or other stock exchange approved for this purpose by the board of directors will be valued on the basis of the closing sale thereof on such stock exchange, or, if such sale is lacking, at the mean between closing bid and asked prices on such day. If no bid and asked prices are quoted for such day or information as to New York or other approved exchange transactions is not readily available, the security will be valued by reference to recognized composite quotations or such other method as the board of directors in good faith deems will reflect its fair market value. Securities not traded on any stock exchange but for which market quotations are readily available are valued on the basis of the mean of the last bid and asked prices. Short-term securities are valued at the mean between the closing bid and asked prices or by such other method as the board of directors determines to reflect their fair market value. The board of directors in good faith determines the manner of ascertaining the fair market value of other securities and assets.
Allocation of Income, Expenses, Gains and Losses -Income, expenses (other than those attributable to a specific class), gains and losses are allocated daily to each class of shares based upon the relative proportion of net assets represented by such class. Operating expenses directly attributable to a specific class are charged against the operations of that class.
Federal Income Taxes -No provision for federal income or excise taxes has been made because the Fund intends to comply with the provisions of subchapter M of the Internal Revenue Code applicable to regulated investment companies and to distribute all of its taxable income to shareholders. The Fund recognizes the tax benefits of uncertain tax positions only where the position is "more likely than not" to be sustained assuming examination by tax authorities. Management has analyzed the Fund’s tax positions, and has concluded that no liability for unrecognized tax benefits should be recorded related to uncertain tax positions taken on the open tax year 2015-2017 and expected to be taken in the Fund's 2018 tax returns. The Fund identifies its major tax jurisdictions as U.S. Federal, Colorado State and foreign jurisdictions where the Fund makes significant investments; however the Fund is not aware of any tax positions for which it is reasonably possible that the total amounts of unrecognized tax benefits will change materially in the next twelve months.
Classification of Distributions to Shareholders -The character of distributions made during the year from net investment income or net realized gains may differ from its ultimate characterization for federal income tax purposes. Also, due to timing of dividend distributions, the fiscal year in which amounts are distributed may differ from the fiscal year in which the income or realized gain was recorded by the Fund.
Security Transactions and Related Investment Income -Investment transactions are accounted for on the date the investments are purchased or sold (trade date). Dividend income and distributions to shareholders are recorded on the ex-dividend date. Interest income is recorded on the accrual basis. Realized gains and losses from investment transactions and unrealized appreciation and depreciation of investments are reported on an identified cost basis which is the same basis used for federal income tax purposes.
Use of Estimates -The preparation of financial statements in conformity with accounting principles generally accepted in the United States requires management to make estimates and assumptions that affect the reported amounts of assets and liabilities and disclosure of contingent assets and liabilities at the date of the financial statements and the reported amounts of increases and decreases in net assets from operations during the reporting period. Actual results could differ from those estimates.
Securities Valuations –As described in note 1, the Fund utilizes various methods to measure the fair value of most of its investments on a recurring basis. U.S. GAAP establishes a hierarchy that prioritizes inputs to valuation methods. The three levels of inputs are:
Level 1 – Unadjusted quoted prices in active markets for identical assets or liabilities that the Fund has the ability to access.
Level 2 – Observable inputs other than quoted prices included in level 1 that are observable for the asset or liability, either directly or indirectly. These inputs include quoted prices for the identical instrument on an inactive market, prices for similar instruments, interest rates, prepayment speeds, credit risk, yield curves, default rates and similar data.
Level 3 – Unobservable inputs for the asset or liability, to the extent relevant observable inputs are not available, represent the Fund’s own assumptions about the assumptions a market participant would use in valuing the asset or liability, and would be based on the best information available.
The availability of observable inputs can vary from security to security and is affected by a wide variety of factors, including, for example, the type of security, whether the security is new and not yet established in the marketplace, the liquidity of markets, and other characteristics particular to the security. To the extent that valuation is based on models or inputs that are less observable or unobservable in the market, the determination of fair value requires more judgment. Accordingly, the degree of judgment exercised in determining fair value is greatest for instruments categorized in level 3. The inputs used to measure fair value fall into different levels of the fair value hierarchy. In such cases, for disclosure purposes, the level in the fair value hierarchy within which the fair value measurement falls in its entirety, is determined based on the lowest level input that is significant to the fair value measurement in its entirety.
The following is a summary of the inputs used, as of January 31, 2019, in valuing the Fund’s assets carried at fair value:
| | | | | | |
| Equity | | Level 1 | Level 2 | Level 3 | | Total |
| Common Stock | $ | 838,829 | 0 | 0 | $ | 838,829 |
The industry classifications of Level 1 investments are included in the Statement of Investments.
There were no transfers in to or out of Level 1 or Level 2 for the six months ended January 31, 2019. Transfers are recognized at the end of the reporting period.
Semi-Annual Report for the six months ended January 31, 2019
American Growth Fund, Inc. - Series Two – Page 15
Notes to Financial Statements
American Growth Fund, Inc. Series Two (unaudited)
2.Shares of Beneficial Interest
The Fund has authorized an unlimited number of no par value shares of beneficial interest of each class. Transactions in shares of beneficial interest were as follows:
| | | | | | | | | | |
| | For the six months ended | | For the year ended | |
| | | | | January 31, 2019 | | | | | July 31, 2018 | |
| | | | | (unaudited) | | | | | | |
| | Shares | | | Amount | | Shares | | | Amount | |
| Class E: | | | | | | | | | | |
| Sold | 39,240 | | $ | 159,595 | | 104,556 | | $ | 463,679 | |
| Dividends and distributions | | | | | | | | | | |
| reinvested | - | | | - | | - | | | - | |
| Redeemed | (16,506 | ) | | (66,353 | ) | (51,840 | ) | | (210,087 | ) |
| Net decrease | 22,734 | | $ | 93,242 | | 52,716 | | $ | 253,592 | |
| Class F: | | | | | | | | | | |
| Sold | - | | $ | - | | - | | $ | - | |
| Dividends and distributions | | | | | | | | | | |
| reinvested | | | | | | | | | | |
| Redeemed | - | | | - | | - | | | - | |
| Net (decrease) increase | - | | $ | - | | - | | $ | - | |
3. Realized and Unrealized Gains and Losses on Investments (unaudited)
The identified tax cost basis of investments at January 31, 2019 was $696,165. Net unrealized appreciation on investments of $142,664, based on identified tax cost as of January 31, 2019, was comprised of gross appreciation of $257,390 and gross depreciation of $114,726.
4. Underwriting, Investment Advisory Contracts, Service Fees and Other Related Parties (unaudited)
Under the investment advisory contract with IRC, the advisor receives annual compensation for investment advice, computed and paid monthly, equal to 1% of the first $30 million of the Fund's average annual net assets and 0.75% such assets in excess of $30 million. The Fund pays its own operating expenses.
Class F shares are subject to annual service and distribution fees of 0.25% and 0.75% of average daily net assets, respectively. Class E shares are subject to annual service and distribution fees no greater than 0.30% of average daily net assets, respectively.
For the six months ended January 31, 2019 commissions and sales charges paid by investors on the purchase of Fund shares totaled $8,176 of which $1,188 was retained by World Capital Brokerage, Inc. ("WCB"), an affiliated broker/dealer which serves as the underwriter and distributor of the Fund.
No payments were made by the Fund to WCB for brokerage commission on securities transactions.
Certain officers of the Fund are also officers of WCB and IRC. For the six months ended January 31, 2019, the Fund paid directors' fees of $1,084, expenses of $5, and the audit chair $239 for review.
For the six months ended January 31, 2019, under an agreement with IRC, the Fund was charged $4,461 for the costs and expenses related to employees of IRC who provided administrative, clerical and accounting services to the Fund. In addition, the Fund was charged $2,481 by an affiliated company of IRC for the rental of office space.
5. Federal Income Tax Matters
Dividends paid by the Fund from net investment income and distributions of net realized short-term capital gains are, for federal income tax purposes, taxable as ordinary income to shareholders.
The Fund distributes net realized capital gains, if any, to its shareholders at least annually, if not offset by capital loss carryovers. Income distributions and capital gain distributions are determined in accordance with income tax regulations, which may differ from accounting principles generally accepted in the United States. These differences are primarily due to the differing treatment of net operating losses, foreign currency and tax allocations. Accordingly, these permanent differences in the character of income and distributions between financial statements and tax basis have been reclassified to paid-in capital.
As of July 31, 2018 the components of accumulated gains on a tax-basis were as follows:
| | | |
| Unrealized appreciation | $ | (54,072 | ) |
| Accumulated realized losses | | (95,181 | ) |
| Total accumulated loss | $ | (41,109 | ) |
Net capital losses incurred after October 31, and within the taxable year, are deemed to arise on the first business day of the fund’s next taxable year. At July 31, 2018, the fund did not have any post-October losses. As of July 31, 2018 the Fund had non-expiring capital loss carryovers of $70,836 and $24,345, which maintain their characters as short term and long term (respectively).
The tax character distributions paid during the year ended July 31, 2018 and July 31, 2017 was as follows:
| | | |
| | July 31, 2018 | | July 31, 2017 |
| Long-Term Capital Gains | - | $ | 907,505 |
| Return of capital | - | | 20,821 |
| Total | - | $ | 928,326 |
American Growth Fund, Inc. - Series Two – Page 16
Semi-Annual Report for the six moths ended January 31, 2019
Notes to Financial Statements
American Growth Fund, Inc. Series Two (unaudited)
American Growth Fund, Inc. Series Two is a diversified Mutual Fund that primarily invests in over-the-counter stocks of companies that are involved, in at least some way, in the legal cannabis business. Because the Fund follows industry diversification standards, it does not expect any impact as it relates to IRS Subchapter M or RIC diversification requirements. A checklist is employed when securities are purchased that acts as a tool to help ensure that industry diversification standards are maintained. A full explanation of the investment strategies that guides Series Two is available in its Statement of Additional Information which is available on its website, www.agfseries2.com, or by calling 800-525-2406.
6. Subsequent Events
In preparing these financial statements, the Fund has evaluated events and transactions for potential recognition or disclosure through the date these financial statements were issued.
7.Review of Affiliated Company’s Expenses (unaudited) –The Trust’s Audit Committee reviews, on a monthly and quarterly basis, the details of each expense incurred by the Trust in order to determine the appropriateness. These expense are then presented to the Trust’s Board of Directors for review and approval at the next quarterly Board Meeting.
For the six months ended January 31, 2019 the Trust paid to its affiliated companies, World Capital Brokerage, Inc. $37,341, Investment Research Corporation $91,442, and AGF Properties, Inc. $77,671 for services they provided to the Trust and its shareholders. These payments resulted in these affiliated companies earning profit or losses totaling World Capital Brokerage, Inc. $3,436, Investment Research Corporation $(45,631), and AGF Properties, Inc. $(13,827).
8. Cannabis Industry Risk –The cannabis industry is a very young, fast evolving industry with possible increased exposure to rule changes, changes in laws, increasing regulations, increasing competition which may cause businesses to suddenly close or businesses to shrink as well as the possibility that a company currently operating legally may suddenly find itself exposed to illegal activities. Series Two invests in over the counter securities and does not invest in the sale of cannabis or the activity of growing cannabis crops.
Semi-Annual Report for the six months ended January 31, 2019
American Growth Fund, Inc. - Series Two – Page 17
Analysis of Expenses(unaudited)
As a shareholder of the Fund, you may incur two types of costs: (1) transaction costs, including front-end sales charges with respect to Class E shares; and (2) ongoing costs, including management fees; distribution and/or service (12b-1) fees; and other Fund expenses.
The tables below are intended to help you understand your ongoing costs (in dollars) of investing in the Fund and to compare these costs with the ongoing costs of investing in other mutual funds.
The tables below are based on an investment of $1,000 invested on August 01, 2018 and held for the six months ended January 31, 2019.
Actual expenses(unaudited)
This table provides information about actual account values and actual expenses. You may use the information provided in this table, together with the amount you invested, to estimate the expenses that you paid over the period. To estimate the expenses you paid on your account, divide your ending account value by $1,000 (for example, an $8,600 ending account value divided by $1,000 = 8.6), then multiply the result by the number under the heading entitled "Expenses Paid During the year".
| | | | | | | |
| For six months ended January 31, 2019 | | | | |
| |
| | Actual | | | | | | |
| | Total Return | | | | | | |
| | Without | | Beginning | | Ending | | Expenses |
| | Sales | | Account | | Account | | Paid During |
| | Charges(1) | | Value | | Value | | The Period(2) |
| Class E | 5.71)% | $ | 1,000.00 | $ | 996.32 | $ | 112.06 |
(1) Assumes reinvestment of all dividends and capital gain distributions, if any, at net asset value and does not reflect the deduction of the applicable sales charges with respect to Class E shares.
(2) Expenses are equal to the annualized expense ratio of 11.89% for the Fund’s Class E shares, multiplied by 184/365.
Hypothetical example for comparison purposes(unaudited)
The table below provides information about hypothetical account values and hypothetical expenses based on the actual expense ratio and an assumed rate of return of 5.00% per year before expenses, which is not the Fund's actual return. The hypothetical account values and expenses may not be used to estimate the actual ending account balance or expenses you paid for the period. You may use the information provided in this table to compare the ongoing costs of investing in the Fund and other mutual funds. To do so, compare this 5.00% hypothetical example relating to the Fund with the 5.00% hypothetical examples that appear in the shareholder reports of other mutual funds.
Please note that the expenses shown in the table below are meant to highlight your ongoing costs only and do not reflect any transactional costs. Therefore, the table is useful in comparing ongoing costs only, and will not help you determine the relative total costs of owning different mutual funds. In addition, if these transaction costs were included, your costs would have been higher.
| | | | | | | |
| For the six months ended January 31, 2019 | | | | |
| |
| | Hypothetical | | | | | | |
| | Annualized | | Beginning | | Ending | | Expenses |
| | Total | | Account | | Account | | Paid During |
| | Return | | Value | | Value | | The Period(1) |
| Class E | 5.00)% | $ | 1,000.00 | $ | 989.63 | $ | 112.06 |
| (1) | Expenses are equal to the annualized expense ratio of 11.89% for the Fund’s Class E shares, multiplied by 184/365. |
American Growth Fund, Inc. - Series Two – Page 18
Semi-Annual Report for the six moths ended January 31, 2019
| | |
| Allocation of Portfolio Assets(unaudited) | | |
| (Calculated as a percentage of Net Assets) | | |
| January 31, 2019 (unaudited) | | |
| Sector Breakdown | | |
| |
| Drug Manufacturers | 27.17 | % |
| Biotechnologies | 8.25 | % |
| Medical Devices | 7.97 | % |
| Real Estate Services | 6.87 | % |
| Application Software | 6.01 | % |
| Agriculture | 5.20 | % |
| Industrial Products | 4.69 | % |
| Packaging and Containers | 4.63 | % |
| Consumer Packaged Goods | 3.58 | % |
| Publishing | 3.14 | % |
| Beverages – Alcoholic | 2.41 | % |
| Retail – Apparel & Specialty | 2.15 | % |
| Exchange Traded Funds | 2.15 | % |
| Medical Diagnostics & Research | 1.93 | % |
| Business Services | 1.63 | % |
| Online Media | 0.95 | % |
| Personal Services | 0.93 | % |
| Computer Hardware | 0.91 | % |
| Tobacco | 0.66 | % |
| Conglomerates | 0.65 | % |
| Industrial Distribution | 0.43 | % |
| Farm and Construction Equipment | 0.37 | % |
| Forest Products | 0.32 | % |
| Consulting and Outsourcing | 0.07 | % |
| Investments - Common Stocks | 93.07 | % |
| Cash and Receivables, less Liabilities | 6.93 | % |
| Total Net Assets | 100.00 | % |
NOTICE TO SHAREHOLDERS at July 31, 2018 (Unaudited)
How to Obtain a Copy of the Fund’s Proxy Voting Policies
A description of the policies and procedures that the Fund uses to determine how to vote proxies relating to portfolio securities is available without charge upon request by calling 1-800-525-2406 or on the SEC’s website at http://www.sec.gov.
How to Obtain a Copy of the Fund’s Proxy Voting Records for the 12-Month Period Ended June 30, 2018
Information regarding how the Fund voted proxies relating to portfolio securities during the most recent 12-month period ended June 30 is available without charge, upon request, by calling 1-800-525-2406. Furthermore, you can obtain the Fund’s proxy voting records on the SEC’s website at http://www.sec.gov.
Quarterly Filings on Form N-Q
The Fund files its complete schedule of portfolio holdings with the SEC for the first and third quarters of each fiscal year on Form N-Q. The Fund’s Form N-Q is available on the SEC’s website at http://www.sec.gov. The Fund’s Form N-Q may be reviewed and copied at the SEC’s Public Reference Room in Washington, DC and information on the operation of the Public Reference Room may be obtained by calling 1-800-SEC-0330. Information included in the Fund’s Form N-Q is also available by calling 1-800-525-2406.
Beginning April 30, 2020, the Fund will cease to disclose its holdings on Form N-Q. Monthly portfolio disclosures will be filed with the SEC on Form N-PORT no later than 60 days after the end of each fiscal quarter. The monthly holdings reports on Form N-PORT for the first and second months of the fiscal quarter will remain non-public and the monthly holdings report for the third month of the fiscal quarter will become publicly available upon filing (with the exception of certain items).
Semi-Annual Report for the six months ended January 31, 2019
American Growth Fund, Inc. - Series Two – Page 19
INFORMATION ABOUT TRUSTEES AND OFFICERS (Unaudited) (as of July 31, 2018)
The day-to-day operations of the Fund are managed by its officers subject to the overall supervision and control of the board of directors. The Fund´s Audit Committee meets quarterly and is responsible for reviewing the financial statements of the Fund. The following information about the interested directors2of the Fund includes their principal occupations for the past five years:
| | | |
| | | Number of Portfolios | |
| | Term of Office1and | Principal | Other Directorships |
| | Position(s) Held with | in Fund Complex | |
| Name, Address, and Age | Length of Time | Occupation(s) | Held by Director for |
| | Fund | Overseen by | |
| | Served | During Past 5YearsDirector | the Past Five Years |
| | | Principal financial | |
| | | and accounting | Director of World |
| Timothy E. Taggart, 1636 | | officer, employee of | Capital Brokerage, |
| Logan Street, Denver, | President, Director Since April 2004 | Adviser since 1983. 2 | Inc. and Investment |
| CO | and Treasurer | See below for | Research |
| DOB: October 18, 1953 | | affiliation with | Corporation |
| | | Distributor. | |
The following information about the non-interested directors, officers and advisors of the Fund includes their principal occupations for the past five years:
| | | | | |
| | | | | Number of Portfolios | |
| | | Term of Office1and | Principal | | Other Directorships |
| | Position(s) Held with | | | in Fund Complex | |
| Name, Address, and Age | | Length of Time | Occupation(s) | | Held by Director for |
| | Fund | | | Overseen by | |
| |
| | | Served | During Past 5YearsDirector | the Past Five Years |
| |
| Eddie R. Bush, 1400 W. | Director and Audit | | | | |
| |
| |
| 122nd Ave., Suite 100, | Committee | Since September | Certified Public | 2 | None |
| Westminster, CO | Chairman (financial | 1987 | Accountant | | |
| |
| DOB: December 31, 1939expert) | | | | |
| |
| |
| |
| DarrellBush, | | | | | |
| West 2714 E.118 Aveh Ave, | | Since September | | | |
| Westminster, CO | Director | | Accountant | 2 | None |
| |
| DOB: February 19, 1971 | | 2013 | | | |
| |
| |
| |
| |
| Michael L. Gaughan, | | | | | World Capital |
| | Chief Compliance | | | | Brokerage, Inc. and |
| 2001 Avenue D, | | Since September | Employee of the | | |
| | Officer and | | | N/A | Investment |
| Scottsbluff, NE | | 2004 | Fund since 1995. | | |
| | Secretary | | | | Research |
| |
| DOB: November 29, 1967 | | | | | Corporation |
| |
| Patricia A. Blum, 1636 | | | | | |
| |
| Logan Street, Denver, | | | Employee of the | | World Capital |
| | Vice President | Since June 2013 | | N/A | |
| CO | | | Fund since 2001. | | Brokerage, Inc. |
| |
| DOB: June 27, 1959 | | | | | |
1. Trustees and officers of the fund serve until their resignation, removal or retirement.
2. Timothy Taggart is an "interested person” of the Fund as defined by the Investment Company Act of 1940 because of the following positions which he holds.
Timothy Taggart is the sole shareholder, president and a director of Investment Research Corporation. He is also president and a director of World Capital Brokerage, Inc., the Distributor.
The above named person received no retirement benefits or other form of deferred compensation from the Fund. There are no other funds that together with the Fund constitute a Fund Complex.
The Fund's Statement of Additional Information includes additional information about the Fund's trustees, and is available without charge upon request by calling 1-800-525-2406.
BOARD APPROVAL OF INVESTMENT ADVISORY AGREEMENT (Unaudited) Meeting of the Board of Directors Held on October 18, 2018
At a regular meeting of the Board of Directors (the “Board”) held on October 18, 2018 (the “meeting”), the Board, assisted by legal counsel representing the Fund and the Independent Directors, including a majority of the Directors who are not interested persons of the Board (the “Independent Directors”), considered the approval for another year of the investment advisory agreement (the
American Growth Fund, Inc. - Series Two – Page 20
Semi-Annual Report for the six moths ended January 31, 2019
“Agreement”) between Investment Research Corporation (the “Adviser”) and American Growth Fund, Inc. (the “Fund”) for Series One
and Series Two.
In connection with its review and approval of the Agreement for another year at the Meeting, the Independent Directors present
considered materials furnished by the Adviser, including information about, but not limited to, the Adviser’s personnel, operations and
financial condition. The Independent Directors also submitted questions to the Adviser prior to the Meeting. At the Meeting,
representatives from the Adviser, presented information to the Board regarding the Adviser and the Series One Fund, discussed with
the Independent Directors all information provided, and responded to questions from the Board.
Matters considered by the Board, including the Independent Directors, at the Meeting in connection with its re-approval of the
Agreement included the following:
Performance. The Board reviewed each Fund’s investment performance reports, which compared the performance of each
Fund with several other mutual funds with generally similar investment strategies, at least in part, over various time periods, as well as
with relevant benchmarks, and discussed these reports with representatives of the Adviser. The Board considered each Fund’s
comparative performance over short-term and longer-term time periods, noting that Series One generally underperformed its peer
group average performance over the one-year, five-year and ten-year periods and that Series Two generally outperformed its peer
group average performance over the one-year and underperformed its peer group average performance over the five-year and ten-year
periods.
Costs of Services and Profitability. The Board reviewed and considered the contractual annual advisory fee paid by each Fund
to the Adviser, in light of the extent and quality of the advisory services provided by the Adviser to the Fund. The Board received and
considered information including a comparison of the Fund’s contractual advisory fee rate with those of peer funds. The Board also
reviewed and considered the total expense ratio for each Series, alongside comparative total expense ratio information for peer funds.
In doing so, the Board also considered the relative size of each series compared to the peer funds.
In addition, the Board, including the Independent Directors, specifically considered the profits realized by the Adviser and its
affiliates, based in part on the Adviser financial information presented at the meeting and information regarding amounts paid to the
Adviser and its affiliates.
Nature, Extent, and Quality of the Services under the Investment Advisory Agreement: The Board received and
considered information regarding the nature, extent, and quality of services provided to each Series under the Agreement. The
Trustees reviewed certain background materials supplied by the Adviser in its presentation, including its Form ADV.
The Board reviewed and considered the Adviser’s investment advisory personnel, its history as an asset manager, and its
performance and the amount of assets currently under management by the Adviser and its affiliated entities. The Board also reviewed
the research and decision-making processes utilized by the Adviser, including the methods adopted to seek to achieve compliance with
the investment objectives, and policies of each Series.
The Board considered the background and experience of the Adviser’s management in connection with the Fund, including
reviewing the qualifications, backgrounds, and responsibilities of the parties primarily responsible for the day-to-day portfolio
management of each Series and the extent of the resources devoted to research and analysis of actual and potential investments.
Economies of Scale. After discussion, it was the consensus of the Board and the Independent Directors that the Fund had not
reached an asset level where any material economies of scale were being realized by the Adviser that could be shared with the Fund.
The Board specifically noted the existence of the “break point” on advisory fees in the Agreement. The Board noted that the Adviser
does not have any soft dollar arrangements.
Other Benefits to the Adviser: The Board reviewed and considered any other incidental benefits derived or to be derived by the
Adviser from its relationship with the Fund.
In reviewing the factors above, the Board concluded that no single factor was identified by the Directors to be determinative as
the principal factor in whether to renew the Agreement. The Board concluded that:
(1) The nature and quality of services provided to each Series and its shareholders by IRC were reasonable and adequate;
(2) The profitability of IRC and its affiliates from their relationships with each Series was not unreasonable with respect to each
Series;
(3) There were no material economies of scale or other incidental benefits accruing to the Adviser in connection with its
relationship with each Series;
(4) Performance of each Series generally lagged behind performance of respective peer funds and benchmarks over recent
time periods; The Board considered substantive information which was discussed in length at the meeting regarding the lag in
performance, as well as, measures aimed at improving performance; and
(5) Each Series’ contractual advisory fee rate was within an acceptable range of the median for peer funds; The Board noted
that while each Series’ total expense ratio was generally greater than the median for peer funds, this could be attributed in part to the
disparities in relative fund size;
The Directors gave consideration into the circumstances, which positively affected its decision to reapprove the Investment
Advisory Agreement.
Based on the Board’s’ deliberations and their evaluation of the information described above, the Directors, including all of the
Independent Directors, concluded that the Adviser’s compensation for investment advisory services is consistent with the best interests
of its shareholders and accordingly approved continuation of the Investment Advisory Agreement for an additional period.
Semi-Annual Report for the six months ended January 31, 2019
American Growth Fund, Inc. - Series Two – Page 21
This page intentionally left blank.
American Growth Fund, Inc. - Series Two – Page 22
Semi-Annual Report for the six moths ended January 31, 2019
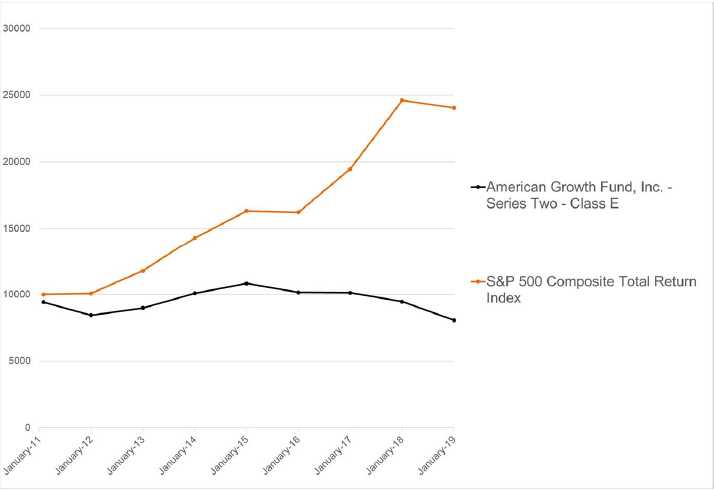
PERFORMANCE CHARTS(unaudited)
The following charts compare the change in value of a $10,000 investment in the American Growth Fund versus the Standard and Poors Index. Returns reflect a sales load for Class E.
Performance data quoted represents past performance and is no guarantee of future results. The investment return and principal value of an investment will fluctuate, so that an investor’s shares, when redeemed, may be worth more or less than their original cost. The graph and table do not reflect the deduction of taxes that a shareholder would pay on fund distributions or the redemption of fund shares. Indices are unmanaged and generally do not reflect deductions for management fees. You cannot invest directly in an index. Current performance data to the most recent month end can be obtained by calling 1-800-525-2406.
Semi-Annual Report for the six months ended January 31, 2019
American Growth Fund, Inc. - Series Two – Page 23
American Growth Fund Returns
On 2/23/2011, the Fund introduced a new Series consisting of Class E shares. Class E shares are subject to a maximum front-end sales charge of 5.75%. The Fund may incur 12b-1 expenses up to an annual maximum of .30 of 1% on its average daily net assets of its Class E shares. The investment return and principal value of an investment will fluctuate so that the investor's shares, when redeemed, may be worth more or less than their original cost. Data presented represents past performance and cannot be used to predict future results. Current performance may be lower or higher than the performance data quoted. This material must be preceded or accompanied by a current prospectus. If you have not received, or need a current prospectus, please feel free to call for one at 1-800-525-2406. Please read the prospectus carefully before investing. Period ending 01/31/2019.
For current month-end performance figures please call 1-800-525-2406.
| | | | | | |
| | | | 5year | | Since Inception | |
| Series Two (unaudited) | 1Year | | annualized | | annualized (February 23, 2011) | |
| Class E without load | (14.68 | )% | (4.36 | )% | (1.94 | )% |
| Class E with load* | (19.57 | )% | (5.49 | )% | (2.67 | )% |
| *Includes a 5.75% sales charge based on a $10,000 initial purchase. | | | |
TRANSFER AGENT:Fund Services, Inc., 8730 Stony Point Parkway, Stony Point Bldg. III - Suite # 205, Richmond, Va. 23235CUSTODIAN:UMB Bank NA Investment Services Group, 928 Grand Blvd, Fifth Floor, Kansas City, MO 64106RETIREMENT PLAN CUSTODIAN:UMB Bank NA Investment Services Group, 928 Grand Blvd, Fifth Floor, Kansas City, MO 64106INDEPENDENT REGISTERED PUBLIC ACCOUNTING FIRM:Tait, Weller & Baker LLP, Two Liberty Place, 50 South 16thStreet, Suite 2900, Philadelphia, PA 19102LEGAL COUNSEL:K&L Gates LLP, 1601 K St NW, Washington, DC 20006UNDERWRITER/DISTRIBUTOR:World Capital Brokerage, Inc., 1636 Logan Street, Denver, CO 80203
| | | |
| OFFICERS AND DIRECTORS | INVESTMENT ADVISORS | |
| Timothy E. Taggart | President and Director | Investment Research Corporation | |
| Eddie R. Bush | Director | 1636 Logan Street | |
| Darrell E. Bush | Director | Denver, CO 80203 | |
| Patricia A. Blum | Vice President | OFFICERS AND DIRECTORS | |
| Michael L. Gaughan | Chief Compliance Officer | Timothy E. Taggart | President, Treasurer, and |
| | and Corporate Secretary | | Director |
| | | Michael L. Gaughan | Vice President, |
| | | | Secretary |
| | | | and Director |
| | | Patricia A. Blum | Vice President |
3/2019