| |
| Table of Contents | |
| American Growth Fund, Inc – Series One | 3 |
| President’s Letter | 4 |
| Statement of Investments | 8 |
| American Growth Fund, Inc. – Series Two | 15 |
| President’s Letter | 16 |
| Statement of Investments | 21 |
| American Growth Fund, Inc. Financial Statements | 25 |
| Statement of Assets and Liabilities | 25 |
| American Growth Fund, Inc. – Series One | 25 |
| American Growth Fund, Inc. – Series Two | 25 |
| Statement of Operations | 26 |
| American Growth Fund, Inc. – Series One | 26 |
| American Growth Fund, Inc. – Series Two | 26 |
| Statement of Changes | 27 |
| American Growth Fund, Inc. – Series One | 27 |
| American Growth Fund, Inc. – Series Two | 27 |
| American Growth Fund, Inc. Financial Highlights | 28 |
| American Growth Fund, Inc. – Series One | 28 |
| American Growth Fund, Inc. – Series Two | 30 |
| American Growth Fund, Inc. Notes to Financial Statements | 31 |
| Summary of Significant Accounting Policies | 31 |
| Shares of Beneficial Interest | 32 |
| American Growth Fund, Inc. – Series One | 32 |
| American Growth Fund, Inc. – Series Two | 32 |
| Realized and Unrealized Gain and Losses on Investments | 32 |
| American Growth Fund, Inc. – Series One | 32 |
| American Growth Fund, Inc. – Series Two | 32 |
| Underwriting, Investment Advisory Contracts, Service Fees and Other Related Parties | 33 |
| Federal Income Tax Matters | 33 |
| American Growth Fund, Inc. – Series One | 33 |
| American Growth Fund, Inc. – Series Two | 33 |
| Subsequent Events | 33 |
| Review of Affiliated Company’s Expenses | 34 |
| Cannabis Industry Risk | 34 |
| American Growth Fund, Inc. Analysis of Expenses | 35 |
| American Growth Fund, Inc. Hypothetical example for comparison purposes | 35 |
| American Growth Fund, Inc. Allocation of Portfolio Assets | 36 |
| American Growth Fund, Inc. – Series One | 36 |
| American Growth Fund, Inc. – Series Two | 36 |
| American Growth Fund, Inc. Notice to Shareholders | 36 |
| American Growth Fund, Inc. How to Obtain a Copy of the Fund’s Proxy Voting Records | 36 |
| American Growth Fund, Inc. Quarterly Filings on Form N-Q | 36 |
| American Growth Fund, Inc. Information About Trustees and Officers | 37 |
| American Growth Fund, Inc. Board Approval of Investment Advisory Agreement | 38 |
| American Growth Fund, Inc. Performance Charts | 43 |
American Growth Fund, Inc – Page 2

Dear Shareholders:
I am pleased to deliver to you the American Growth Fund Series One Semi-Annual Report for the six months ending January 31, 2020.
There is so much to discuss that has happened over the past year in the market, but it is difficult to get past what we are all seeing on our TVs and what we are all reading on our phones. So, before we begin let’s start with two market basics. First, the market loves predictability. When things become questionable, when the traders and researchers struggle with their predictions, we can see market events like we are seeing now resulting from the spread of the COVID-19 virus. Second, the market losses will not last. The market has historically time and time again rebounded. While it is tempting to sell everything, we believe it is prudent to remain calm. Long term investments are designed for just that; the long term. So while it may be difficult to watch and while it may be scary to endure; make your financial decisions with a cool head. Discuss your concerns with your financial professionals and with your tax advisors first, so that you understand the whole picture.
We found thought you might find the following chart interesting.
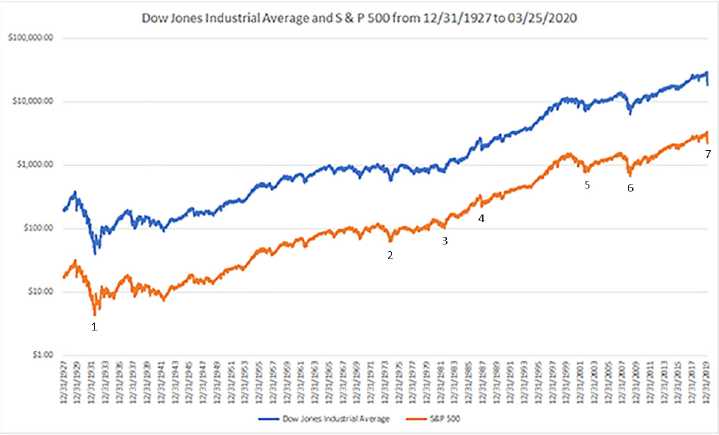
Data Source from MicroTrends.com / Pinnacle Data. Graph is using Logarithmic scale or log scale (Per Wikipedia’s article on Logarithmic scale8“a way of displaying numerical data over a very wide range of values in a compact way-typically the largest numbers in the data are hundred or even thousand of times larger than the smallest numbers”) base 10 (Per Wikipedia’s article on Logarithmic scale8“Such a scale is nonlinear: the numbers 10 and 20, and 90 and 100, are not the same distance apart on a log scale. Rather, the numbers 10 and 100, and 100 and 1000 are equally spaced.”)
| 1. | Recession of 1937-38. Lasting around a year, this share price fall was triggered by an economic recession within the Great Depression and doubts about the effectiveness of Franklin D. Roosevelt's New Deal policy.9 |
| 2. | 1973-74 stock market crash. Lasting 23 months, dramatic rise in oil prices, the miners' strike and the downfall of the Heath government. From May 31, 1932 to January 5, 1973 the Dow Jones Industrial Average saw an increase of 2,241% and the S&P 500 saw an increase of 2,624%.9 |
American Growth Fund, Inc – Series One - Page 4
3. 1982 Souk l-Manakh stock market crash. The Souk Al-Manakh stock market crash was the 1982 stock market crash of Kuwait's unofficial stock market, the Souk Al-Manakh. At its peak, its market capitalization was the third highest in the world, behind only the U.S. and Japan, and ahead of the U.K. and France.10
4. 1987 Black Monday. Infamous stock market crash that represented the greatest one-day percentage decline in U.S. stock market history, culminating in a bear market after a more than 20% plunge in the S&P 500 and Dow Jones Industrial Average. Among the primary causes of the chaos were program trading and illiquidity, both of which fueled the vicious decline for the day as stocks continued lower even as volume grew lighter. Today, circuit breakers are in place to prevent a repeat of Black Monday. After a 7% drop, trading would be suspended for 15 minutes, with the same 15 minute suspension kicking in after a 13% drop. However, in the event of a 20% drop, trading would be shut down for the remainder of the day. From August 12, 1982 to August 25, 1987 Dow Jones Industrial Average saw an increase of 250% and the S&P 500 saw an increase of 229%.9
5. Stock Market Downturn of 2002. Downturn in stock prices during 2002 in stock exchange across the United States, Canada, Asia, and Europe. After recovering from lows reached following the September 11 attacks, indices slid steadily starting in March 2002, with dramatic declines In July and September leading to lows last reached in 1997 and 1998. See stock market downturn of 2002. From December 4, 1987 to September 1, 2000 the Dow Jones Industrial Average saw an increase of 25% and the S&P 500 saw an increase of 21%.9
6. Financial Crisis of 2007-2008. On September 16, 2008, failures of large financial institutions In the United States, due primarily to exposure of securities of packaged subprime loans and credit default swaps issued to insure these loans and their issuers, rapidly devolved into a global crisis resulting in a number of bank failures in Europe and sharp reductions in the value of equities (stock) and commodities worldwide. The failure of banks in Iceland resulted in a devaluation of the Icelandic krona and threatened the government with bankruptcy. Iceland was able to secure an emergency loan from the IMF in November. Later on, U.S. President George W. Bush signs the Emergency Economic Stabilization Act into law, creating a Troubled Asset Relief Program (TARP) to purchase failing bank assets. Had disastrous effects on the world economy along with world trade. From October 9, 2020 to August 28, 2008 the Dow Jones Industrial Average saw an increase of 61% and the S&P 500 saw an increase of 67%.9
7. 2020 Stock Market Crash. The COVID-19 outbreak caused supply disruptions, leading to the fastest U.S. stock market plunge from record highs into a correction (and subsequently a new bear market). Stock markets around the world fell simultaneously amid the turmoil. From March 9, 2009 to February 19, 2020 the Dow Jones Industrial Average saw an increase of 348% and S&P 500 saw an increase of 401%.9
Now let’s talk about last year. The S&P 500 Index had one of its best years in a long time, closing out 2019 up 31.49%. The only other year in this century showing this kind of growth was in 2013. Technology shares performed best within the S&P 500 Index, helped by strong gains in Apple and Microsoft which, together, ended the year accounting for nearly 40% of the sector’s market capitalization1. Both of those stocks are in your portfolio. The worst performing sector in the S&P 500 in 2019 was the energy sector; a sector we avoided last year2.
The second quarter was a bit of a rollercoaster ride for investors led by low inflation, a trade war between the U.S. and China and volatile oil prices. In the end, the large caps of the S&P 500 led the way at the end of the second quarter, gaining 3.79%, followed closely by the tech stocks of the Nasdaq, the Dow, the Global Dow, and the small caps of the Russell 2000, which eked out a quarterly gain of 1.74%3.
The third quarter remained a bit elusive also as trade concerns continued and speculation loomed over the President as impeachment rhetoric increased. However, as we stated above, the S&P 500 overcame and ended the year impressively on a high note with a 9.1% gain4.
In the past we have discussed our optimism that the U.S. economy would continue to lead the world market, that domestically there continues to be political infighting within, as well as between, the presidential and legislative branches of our government. Those beliefs have not changed. Brexit negotiations are ongoing. There are a few items that we feel need monitoring. First and foremost is COVID-19 which we discussed above. Second is increased tensions in the Middle East which are now compounded by the possibility of an oil price war between OPEC and Russia. These concerns can have an effect on not only our stock market but on markets worldwide so your investment committee will remain vigilant.
American Growth Fund, Inc. – Series One – Page 5
Real gross domestic product (GDP) increased at an annual rate of 2.1 percent in the fourth quarter of 2019 (table 1), according to the "second" estimate released by the Bureau of Economic Analysis. In the third quarter, real GDP also increased 2.1 percent.6Additionally, total non-farm payroll employment rose by 273,000 in February 2020, and the unemployment rate was little changed at 3.5 percent, as the U.S. Bureau of Labor Statistics has reported. Notable job gains occurred in health care and social assistance, food services and drinking places, government, construction, professional and technical services, and financial activities.
Investment Committee
The Investment Committee that manages your Fund is made up of two veterans of the securities industry, Mr. Timothy Taggart and Mr. Robert Fleck. Mr. Taggart joined the securities industry in 1985 and is registered as a General Securities Principal, Financial and Operations Principal, Registered Options Principal and Municipal Securities Principal. He is also an Arbitrator for the Financial Industry Regulatory Authority (FINRA). Mr. Robert Fleck also joined the securities industry in 1985. He has held a General Securities license and currently is an Investment Advisor Representative.
Investment Strategy
Your Investment Committee uses a fundamental top down approach to manage your portfolio. First, we look at the general economic outlook, then we look at the industries that we feel have the biggest growth potential in the current and upcoming economies. From that, our objective is to choose the best companies in those industries. Many of these companies are established, large cap (defined as companies with a market capitalization of $5 billion or more) securities many of which are household names that you will easily recognize.
Performance Overview
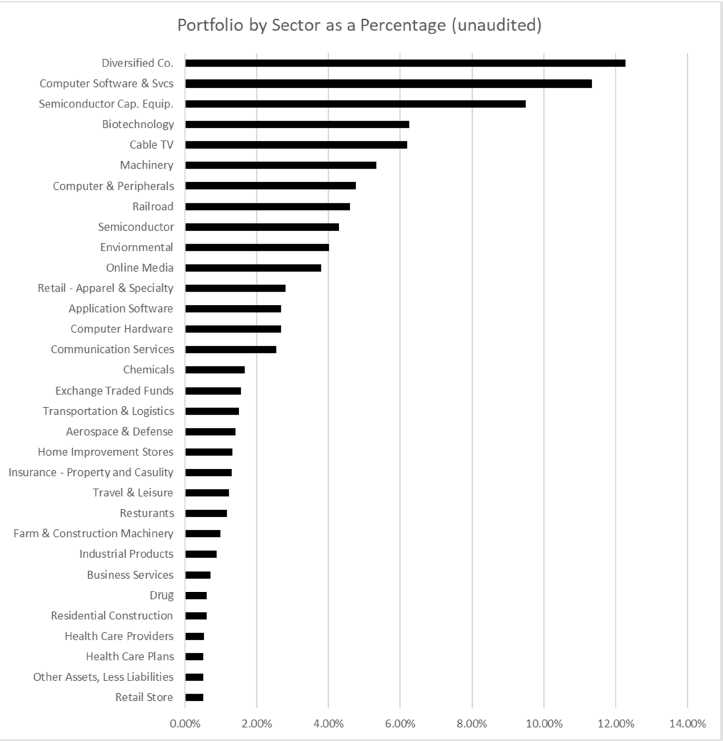
Series One is invested primarily in large cap, growth-oriented domestic common stocks. When you review the portfolio on the following pages you will note that the largest investment sector is Diversified Company Industry at 12.28% of your portfolio, and the largest security in your portfolio is Fair Isaac Corp at $2,237,233 which provides decision-making solutions to clients in the financial services, telecommunications and retail industries.

Your American Growth Fund Series One Class A Shares delivered you a 1.57% return (this number includes a sales load of 5.75% as well as Fund expenses and change in Market
Value), since July 31, 2019 through close of business on January 31, 2020. The Dow Jones Industrial Average posted a gain of 6.47% while the S&P 500 posted a gain of 9.31% for the same time period as listed above.
Top 3 Performing Investments (The three stocks that contributed positively to the return are)
| | | | | |
| | | Percent Contribution to | | | |
| | | the Gain on the Portfolio | | Percent Gain on Market | |
| | | for the six months ended | | Value for the six months | |
| Investment | Industry | January 31, 2020 | | ended January 31, 2020 | |
| Charter Communications, | Cable TV | 1.69 | % | 34.27 | % |
| Inc. | | | | | |
| Fair Isaac & Co. | Computer Software and | 1.67 | % | 15.59 | % |
| | Services | | | | |
| Teradyne, Inc. | Semiconductor Capital | 1.62 | % | 18.53 | % |
| | Equipment | | | | |
Bottom 3 Performing Investments (The three stocks that contributed negatively to the return are)
| | | | | |
| | | Percent Contribution to | | | |
| | | the Gain on the Portfolio | | Percent Loss on Market | |
| | | for the six months ended | | Value for the six months | |
| Investment | Industry | January 31, 2020 | | ended January 31, 2020 | |
| Cisco Systems | Computer and Peripherals | (1.04 | )% | (17.02 | )% |
| Middleby Corp | Machinery | (0.66 | )% | (16.54 | )% |
| ULTA Beauty Inc | Retail - Apparel & Specialty | (0.24 | )% | (32.14 | )% |
American Growth Fund, Inc – Series One - Page 6
The investment sectors that had the most positive influence on your Series One portfolio were Cable TV, Computer Software and Services, and Semiconductor Capital Equipment. The investment sectors that had the most adverse effect on your portfolio were Entertainment Industry, Machinery Industry, and Computer & Peripherals.
Additional data, including long-term performance data, can be located on page 44 of this report. Past performance is never a guarantee of future results.
Liquidity
As you are aware, Series One invests primarily in common stocks and securities convertible into common stock. These securities are issued by large companies, and to a lesser extent, small and mid-sized companies. Your Fund does not invest in illiquid securities. There are times where the Fund has sold shares of stock in order to pay for certain required services such as the annual audit performed by an independent outside auditor or legal fees. The Fund may also sell shares of stock when orders are placed to redeem shares. When either of these situations happen, your Investment Committee generally will first sell those holdings that they believe are currently, or in the future may, underperform in the market or, alternatively, they may sell holdings in sectors that the committee believes may over-weight that sector when looking at the portfolio as a whole to maintain or improve diversification.
Like we discussed in our last reports, over the next six months we will likely see some more changes in the world. Our Investment Committee will continue to monitor the dollar’s value against the world currencies, signs of changes COVID-19 and its effects on the markets, as well as other major world developments that might affect the U.S. economy and the stocks we are invested in.
As we look at these indicators of how our economy is doing, we generally continue to be cautiously optimistic. It is our hope that we will see continued growth in the upcoming months.
My staff and I are always available to discuss your account or answer any questions you may have. Please call our toll-free number, 800 525-2406 or, within Colorado, 303-626-0600.
American Growth Fund wishes youA GoodFuture!

Timothy Taggart
President and Investment Committee Member
American Growth Fund, Inc.
| 1. | https://www.troweprice.com/financial-intermediary/us/en/insights/articles/2020/q1/quarterly-market-review.html |
| 2. | https://www.cnbc.com/2019/12/31/the-stock-market-boomed-in-2019-heres-how-it-happened.html |
| 3. | https://www.rivettifinancial.com/2nd-quarter-2019-market-summary/ |
| 4. | https://braggfinancial.com/4th-quarter-2019-market-and-economy/ |
| 6. | https://www.bea.gov/news/2020/gross-domestic-product-fourth-quarter-and-year-2019-second-estimate |
| 7. | https://www.bls.gov/news.release/empsit.nr0.htm |
| 8. | https://en.wikipedia.org/wiki/Logarithmic_scale |
| 9. | https://en.wikipedia.org/wiki/List_of_stock_market_crashes_and_bear_markets |
| 10. | https://en.wikipedia.org/wiki/Souk_Al-Manakh_stock_market_crash |
American Growth Fund, Inc. – Series One – Page 7
| | | | |
| How American Growth Fund, Inc. Series One | | | | |
| Has Its Shareholders' Money Invested | | | | |
| STATEMENT OF INVESTMENTS | | | | |
| JANUARY 31, 2020 (UNAUDITED) | | | | |
| |
| | | | Market | |
| Description of Security | Shares | | Value | |
| |
| COMMON STOCK |
| |
| Diversified Company Industry 12.28% |
| Chemed Corp | 4,340 | $ | 2,026,954 | |
| (Operates two wholly owned subsidiaries: VITAS Healthcare Corp., end of life hospice care, and | | | | |
| Roto-Rooter, plumbing and drain cleaning services.) | | | | |
| Honeywell International, Inc. | 2,291 | | 396,847 | |
| (A Diversified technology and manufacturing company, serving customers worldwide with | | | | |
| aerospace products and services, control, sensing and security technologies for buildings, | | | | |
| homes, and industry; turbocharges and automotive products; and specialty chemicals, electronic | | | | |
| and advanced materials, and process technology for refining and petrochemicals.) | | | | |
| | | | 2,423,801 | |
| |
| Computer Software and Services Industry 11.33% |
| Fair Isaac Corp* | 5,560 | | 2,237,233 | |
| (Provides decision-making solutions to clients in the financial services, telecommunications and | | | | |
| retail industries.) | | | | |
| |
| Semiconductor Capital Equipment 9.49% |
| Teradyne, Inc | 28,380 | | 1,872,796 | |
| (The world's largest producer of automated test equipment for semiconductors.) | | | | |
| |
| Biotechnology Industry 6.25% |
| Amgen Inc. | 4,731 | | 1,022,133 | |
| (Utilizes biotechnology to develop human pharmaceutical products.) | | | | |
| Novo Nordisk A/S | 3,490 | | 212,297 | |
| (Is a healthcare company that is engaged in the discovery, development, manufacturing and | | | | |
| marketing of pharmaceutical products. The Company has two business segments: diabetes & | | | | |
| obesity care and biopharmaceuticals.) | | | | |
| | | | 1,234,430 | |
| |
| Cable TV Industry 6.19% |
| Charter Communications, Inc * | 2,363 | | 1,222,758 | |
| (Is a providers of cable services in the United States. The Company offers entertainment, | | | | |
| information and communications solutions to residential and commercial customers.) | | | | |
| |
| Machinery Industry 5.33% |
| Middleby Corp* | 5,522 | | 619,348 | |
| (Develops, manufactures, markets and services equipment used for commercial food cooking, | | | | |
| preparation, and processing.) | | | | |
| Flowserve Corp | 9,281 | | 433,237 | |
| (Makes, designs and markets fluid-handling equipment (pumps, valves and mechanical seals) | | | | |
| for industries that use difficult-to-handle or corrosive fluids.) | | | | |
| | | | 1,052,585 | |
| |
| Computer & Peripherals Industry 4.76% |
| Cisco Systems | 20,438 | | 939,535 | |
| (The leading supplier of high-performance inter-networking products.) | | | | |
*Non-income producing security
See accompanying notes to financial statements.
American Growth Fund, Inc – Series One - Page 8
| | | | |
| How American Growth Fund, Inc. Series One | | | | |
| Has Its Shareholders' Money Invested | | | | |
| STATEMENT OF INVESTMENTS | | | | |
| JANUARY 31, 2020 (UNAUDITED) | | | | |
| |
| | | | Market | |
| Description of Security | Shares | | Value | |
| |
| COMMON STOCK (continued) |
| |
| Railroad 4.59% |
| Kansas City Southern | 5,368 | $ | 905,528 | |
| (A holding company that has railroad investments in the U.S., Mexico and Panama.) | | | |
| |
| Semiconductor Industry 4.29% |
| Intel Corp | 12,569 | | 803,536 | |
| (A leading manufacturer of integrated circuits.) | | | | |
| NVIDIA Corp | 180 | | 42,557 | |
| (Is a developer of graphics processing unit.) | | | | |
| | | | 846,093 | |
| |
| Environmental Industry 4.01% |
| Waste Management | 6,498 | | 790,807 | |
| (The largest solid-waste disposal company in North America.) | | | | |
| |
| Online Media 3.80% |
| Alphabet Inc. Class A* | 235 | | 336,703 | |
| (Engaged in improving the ways people connect with information & products including Search, | | | |
| Android, YouTube, Apps, Maps & Ads. It also produces internet-connected home devices & | | | |
| provides internet services.) | | | | |
| Facebook Inc.* | 1,521 | | 307,105 | |
| (Operates a social networking website. The Company’s products are Facebook, Instagram, | | | |
| Messenger, WhatsApp, and Oculus. Its products enable people to connect and share through | | | |
| mobile devices and personal computers.) | | | | |
| Tencent Holdings Ltd. ADR | 2,200 | | 105,402 | |
| (A Chinese Internet giant with businesses and investments in a large variety of Internet services | | | |
| and contents.) | | | | |
| | | | 749,210 | |
| |
| Retail – Apparel & Specialty 2.80% |
| Alibaba Group Holding Ltd* | 1,120 | | 231,381 | |
| (Is the world's largest online and mobile commerce company which operates China's most- | | | |
| visited online marketplaces.) | | | | |
| Amazon* | 100 | | 200,872 | |
| (is among the world's highest-grossing online retailers, with $281 billion in net sales and roughly | | | |
| $365 billion in estimated physical/digital gross merchandise volume in 2019) | | | | |
| Tractor Supply Company | 1,300 | | 120,835 | |
| (Is the largest operator of retail farm and ranch stores in the United States.) | | | | |
| | | | 553,088 | |
*Non-income producing security
See accompanying notes to financial statements.
American Growth Fund, Inc – Series One - Page 9
| | | | | |
| How American Growth Fund, Inc. Series One | | | | | |
| Has Its Shareholders' Money Invested | | | | | |
| STATEMENT OF INVESTMENTS | | | | | |
| JANUARY 31, 2020 (UNAUDITED) | | | | | |
| |
| | | | | Market | |
| Description of Security | | Shares | | Value | |
| |
| COMMON STOCK (continued) |
| |
| Application Software 2.68% |
| Microsoft Corporation | | 3,109 | $ | 529,245 | |
| (Engaged in designing, manufacturing, selling devices, and online advertising. | Its products | | | | |
| include operating systems for computing devices, servers, phones and other devices.) | | | | |
| |
| Computer Hardware 2.67% |
| Apple Inc. | | 1,704 | | 527,405 | |
| (Designs, manufactures, & markets mobile communication & media devices, personal | | | | |
| computers, & portable digital music plays, & sells a variety of related software, services, | | | | |
| accessories, networking solutions, & third-party digital content.) | | | | | |
| |
| Communication Services 2.54% |
| AT&T Inc. | | 11,851 | | 445,835 | |
| (Is the second-largest U.S. wireless carrier, serving more than 100 million subscribers, including | | | | |
| about 65 million postpaid phone subscribers. The firm also provides fixed-line services, | | | | |
| including voice, data, and television services, to consumers and small businesses in 21 states | | | | |
| and to larger enterprises worldwide.) | | | | | |
| Verizon Communications, Inc. | | 940 | | 55,874 | |
| (Is a provider of communications, information and entertainment products and services to | | | | |
| consumers, businesses and governmental agencies.) | | | | | |
| | | | | 501,709 | |
| |
| Chemicals 1.67% |
| Balchem Corporation | | 1,575 | | 170,131 | |
| (Is engaged in the development, manufacture and marketing of specialty performance | | | | |
| ingredients and products for the food, nutritional, feed, pharmaceutical, medical sterilization and | | | | |
| industrial markets.) | | | | | |
| NewMarket Corp. | | 362 | | 159,142 | |
| (Manufactures and sells petroleum additives used in lubricating oils and fuels to enhance their | | | | |
| performance in machinery, vehicles, and other equipment. The petroleum additives market has | | | | |
| two products: lubricant additives and fuel additives.) | | | | | |
| | | | | 329,273 | |
| |
| Exchange Traded Funds 1.55% |
| Krane Shares Bosera MSCI China A | | 3,550 | | 104,831 | |
| |
| IShares TR MSCI India | | 2,970 | | 102,435 | |
| |
| Franklin FTSE India | | 4,400 | | 99,572 | |
| |
| | | | | 306,838 | |
*Non-income producing security
See accompanying notes to financial statements.
American Growth Fund, Inc – Series One - Page 10
| | | | |
| How American Growth Fund, Inc. Series One | | | | |
| Has Its Shareholders' Money Invested | | | | |
| STATEMENT OF INVESTMENTS | | | | |
| JANUARY 31, 2020 (UNAUDITED) | | | | |
| |
| | | | Market | |
| Description of Security | Shares | | Value | |
| |
| COMMON STOCK (continued) |
| |
| Transportation and Logistics 1.50% |
| Norfolk Southern Corp | 620 | $ | 129,090 | |
| (Is a $10.6 billion railroad operating in the Eastern United States. On 21,000 miles of track, | | | | |
| Norfolk Southern hauls shipments of coal, intermodal traffic, and a diverse mix of automobile, | | | | |
| agriculture, metal, chemical, and forest products.) | | | | |
| Old Dominion Freight Line Inc. | 630 | | 123,625 | |
| (Is the fourth-largest less-than-truckload carrier in the United States, with more than 225 service | | | | |
| centers and 6,900-plus tractors.) | | | | |
| JB Hunt Transportation | 400 | | 43,172 | |
| (Its primary operating segments are intermodal delivery, which uses the Class I rail carriers for | | | | |
| the underlying line-haul movement; dedicated contract services that provide customer-specific | | | | |
| fleet needs; and highway brokerage.) | | | | |
| | | | 295,887 | |
| |
| Aerospace & Defense 1.41% |
| The Boeing Company | 540 | | 171,866 | |
| (Manufactures commercial airplanes, provides defense equipment, and maintains a small | | | | |
| captive finance division.) | | | | |
| Raytheon Company | 480 | | 106,051 | |
| (Is a U.S. defense contractor with over $25 billion in sales. It operates through five segments: | | | | |
| integrated defense systems, intelligence and information, missile systems, space and airborne | | | | |
| systems, and a cybersecurity business branded Forcepoint.) | | | | |
| | | | 277,917 | |
| |
| Home Improvement Stores 1.32% |
| Home Depot Inc. (The) | 1,140 | | 260,034 | |
| (Is a home improvement retailer. Its stores sell an assortment of building materials, home | | | | |
| improvement and lawn and garden products and provide a number of services.) | | | | |
| |
| Insurance (Property and Causality) 1.30% |
| Selective Insurance Group Inc. | 2,088 | | 138,330 | |
| (Is a holding company that offers property and casualty insurance products and services in | | | | |
| United States.) | | | | |
| Markel Corp* | 100 | | 117,297 | |
| (Markel Corp is engaged in the business of property and casualty insurance. It focuses primarily | | | | |
| on specialty lines, such as executive liability to commercial equine insurance. It also invests in | | | | |
| bakery equipment manufacturing and residential homebuilding.) | | | | |
| | | | 255,627 | |
| |
| Travel & Leisure 1.22% |
| Hilton Worldwide Holdings Inc | 1,220 | | 131,516 | |
| (Operates hotels and resorts. The company manages a total or approximately 750,000 rooms | | | | |
| across over 10 brands.) | | | | |
| Marriott International Inc. | 780 | | 109,247 | |
| (Operates 1.29 million rooms across 30 brands. Luxury represents nearly 10% of total rooms, | | | | |
| while full service, limited service, and timeshares.) | | | | |
| | | | 240,763 | |
*Non-income producing security
See accompanying notes to financial statements.
American Growth Fund, Inc – Series One - Page 11
| | | | | |
| How American Growth Fund, Inc. Series One | | | | |
| Has Its Shareholders' Money Invested | | | | |
| STATEMENT OF INVESTMENTS | | | | | |
| JANUARY 31, 2020 (UNAUDITED) | | | | | |
| |
| | | | | Market | |
| Description of Security | | Shares | | Value | |
| |
| COMMON STOCK (continued) |
| |
| Restaurants 1.18% |
| Starbucks Corporation | | 2,748 | $ | 233,113 | |
| (A roaster, marketer, & retailer of specialty coffee in the world, operating globally. It sells a | | | | |
| variety of coffee & tea products. It sells goods and services under brands including Teavana, | | | | |
| Tazo, and Seattle's Best Coffee.) | | | | | |
| |
| Farm & Construction Machinery 0.98% |
| Caterpillar Inc. | | 1,471 | | 193,216 | |
| (Manufacturer of construction and mining equipment, diesel and natural gas engines, industrial | | | | |
| gas turbines and diesel-electric locomotives. | The Company is also a U.S. exporter.) | | | | |
| |
| Industrial Products 0.88% |
| Eaton Corp PLC | | 970 | | 91,636 | |
| (Provides power-management solutions to diversified industrial customers, including electrical | | | | |
| transmission systems, lighting, hydraulics, aerospace fuel systems, and truck and auto | | | | |
| powertrain systems.) | | | | | |
| Vestas Wind Systems A/S | | 2,500 | | 82,642 | |
| (Is one of the largest manufacturers of wind turbines in the world ) | | | | |
| | | | | 174,278 | |
| |
| Business Services 0.72% |
| Paychex, Inc. | | 1,651 | | 141,606 | |
| (Is a provider of integrated payroll, human resources, insurance, and benefits outsourcing | | | | |
| solutions for small- to medium-sized business in the United States.) | | | | |
| |
| Drug 0.60% |
| Johnson & Johnson | | 796 | | 118,501 | |
| (Engaged in the research and development, manufacture and sale of products in the health care | | | | |
| field within its Consumer, Pharmaceutical and Medical Devices, and Diagnostic business | | | | |
| segments.) | | | | | |
| |
| Residential Construction 0.60% |
| NVR Inc.* | | 31 | | 118,326 | |
| (NVR Inc is a United States based company engaged in the construction and sale of single- | | | | |
| family detached homes, town homes and condominium buildings. It also operates in mortgage | | | | |
| banking and title services business.) | | | | | |
| |
| Health Care Providers 0.53% |
| HCA Healthcare Inc. | | 760 | | 105,488 | |
| (It operates general acute care hospitals, psychiatric hospitals, and rehabilitation hospitals.) | | | | |
| |
| Health Care Plans 0.52% |
| UnitedHealth Group Inc. | | 380 | | 103,531 | |
| (Is a diversified health care company in the United States.) | | | | |
| |
| Retail Store 0.51% |
| Dollar Tree, Inc.* | | 1,145 | | 99,695 | |
| (Operates discount variety stores in the United States and Canada. Its stores offer merchandise | | | | |
| primarily at the fixed price of $1.00.) | | | | | |
| |
| |
| *Non-income producing security | | | | | |
| See accompanying notes to financial statements. | | | | | |
American Growth Fund, Inc – Series One - Page 12
| | | | | |
| How American Growth Fund, Inc. Series One | | | | | |
| Has Its Shareholders' Money Invested | | | | | |
| STATEMENT OF INVESTMENTS | | | | | |
| JANUARY 31, 2020 (UNAUDITED) | | | | | |
| |
| | | | | Market | |
| Description of Security | Shares | | | Value | |
| |
| COMMON STOCK (continued) |
| |
| Total Common Stocks(cost $7,770,776) – 99.48% | | | $ | 19,640,316 | |
| |
| Total Investments, at Market Value (cost $7,770,776) | 99.48 | % | | 19,640,316 | |
| Other Assets, Less Liabilities | 0.52 | % | | 102,247 | |
| Net Assets | 100.00 | % | | 19,742,563 | |
*Non-income producing security
See accompanying notes to financial statements.
American Growth Fund, Inc – Series One - Page 13
| | |
| How American Growth Fund, Inc. Series One | | |
| Has Its Shareholders' Money Invested | | |
| STATEMENT OF INVESTMENTS | | |
| JANUARY 31, 2020 (UNAUDITED) | | |
| |
| | | Market |
| Description of Security | Shares | Value |
| |
| COMMON STOCK (continued) |
See accompanying notes to financial statements.
American Growth Fund, Inc – Series One - Page 14

Dear Shareholders:
I am pleased to deliver to you the American Growth Fund Series Two Semi-Annual Report for the six months ended January 31, 2020.
As you know, on July 29, 2016 your American Growth Fund, Inc. Series Two switched its Investment Strategy to focus on the budding cannabis business. Thus, the historical financial information and numbers, such as performance and expenses, that by regulation we are required to provide may not give investors a current, relevant picture of Series Two financial data.
The cannabis industry continues to evolve and as such, your Series Two is preparing to reposition itself to try and take better advantage of the cannabis opportunities before us. Our new direction will also allow us to rename your investment. You will receive more material on that later in the mail. Your annualized expense ratio for these past six months is at 14.19% (after the fee waiver), however, much of that was one-time necessary legal fees. Without those one-time legal expenses, the total expense ratio of the Fund would have declined slightly from the expense ratio set forth in the annual report we sent you about six months ago. You can find more financial highlights on page 31.
In our last report, we reported to you that 10 states and Washington, D.C. have legalized recreational adult use of marijuana, and more than 20 other states allow some medical uses. We also reported that an article in Forbes reported that by 2020 at least 11 states will have legalized cannabis for adult use and 33 states will have legalized medicinal cannabis use in some form. 2020 started out with 33 states having laws supporting at least some sort of legal cannabis use. Ten states and the District of Columbia have legalized cannabis for recreational use. Stansberry Research estimates that in 2020, 7 more states will legalize cannabis in some way. That would mean roughly 80% of the U.S. would have legalized cannabis use either medically or recreationally. Additionally, a recent review of market sizing from Frontier Research, Arcview Market Research, and BDS Analytics forecast a legal U.S. market of more than $20 billion by 20231.
2019 was a year of licensing growth for the cannabis industry and with any young industry there are going to be growing pains and surprises. The vaping sector certainly had its share of bad news this past year but there are several other areas which people generally might not be aware of so we would like to focus on those. First, is with recreational cannabis use legalization in California many assumed that that the state would lead the country in cannabis business licenses. It did not. Oklahoma led that pack issuing three times more licenses than California. Why is this important for a Mutual Fund that only invests in the legal cannabis industry? Because it leads to the idea that cannabis use is becoming more and more acceptable in mainstream America2.
Colorado, Oregon and Washington found themselves with a supply and demand problem. When there is too much supply prices tend to drop, production may be cut, rules may be changed. To help solve this issue Colorado stopped issuing licenses and Washington put a cap on their licensing. Oregon took the novel approach of increasing how much an individual can purchase and opening up delivery options2.
Growth of the industry may have been somewhat slowed due to various regulatory requirements and differing state laws; the ability to issue licenses for distribution and over taxation, amongst other things.
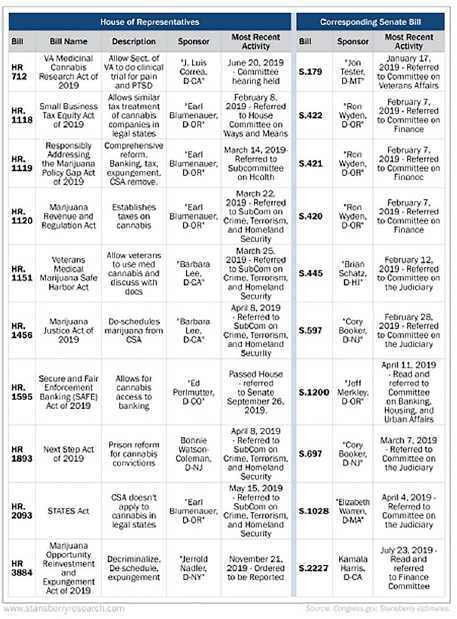
In December 2018, the Farm Bill passed opening up hemp farming. In 2018, 23 states grew a total of 78,175 acres of hemp. By September 2019, 48 states had laws allowing hemp production, 34 states had licensed hemp cultivation, and the Cannabiz Media License Database was already tracking 11,944 active hemp licenses in the U.S. On October 29, 2019 the USDA released their hemp rules which now allows states to write and submit their own hemp rules for approval by the USDA2.Other important events in 2019: 1. The Secure and Fair Enforcement ("SAFE") Banking Act passed the House of Representatives in a landslide vote.
2. The Marijuana Opportunity Reinvestment and Expungement ("MORE") Act moved out of committee and headed to the House floor.
3. The Federal Reserve said that hemp businesses can have full access to the U.S. banking system just like other businesses.
4. The U.S. FDA held its first national meeting on CBD and began formal policymaking.
5. Colorado hit $1 billion in cannabis tax revenues.

American Growth Fund, Inc – Series Two - Page 16
If passed and signed into law, the SAFE Act would permit legal cannabis businesses to access the federal banking system and all of its protections. Ed Perlmutter, a Colorado Democrat, sponsored the bill in the House. In the Senate, the companion bill was sponsored by Oregon Democrat Jeff Merkley.
If passed and signed into law, the MORE Act would remove cannabis from the Controlled Substances Act, effectively legalizing the plant at the federal level. In addition, it would seek to expunge prior convictions for cannabis use or possession1.
This chart contains a very brief summary of the bills introduced in 2019. There can be no assurance that any of this legislation will be enacted into law, or if enacted that it will have an impact on the value of the shares of the Fund.
It’s important to realize a few key industry factors. As Forbes reported on September 5, 2019, “Then there’s a lack of history that can be used to predict performance. Cannabis doesn’t have 100 years of crop reports to measure against current conditions and yields. It doesn’t have leaders with decades of experience in the industry and a track record. Stocks can’t be evaluated on their historical performances. Cannabis doesn’t have a raft of analysts whose opinions can be trusted based on their deep knowledge of the industry and most investors don’t have a basic knowledge of how the industry works.”
Your Investment Committee, whose industry experience we will discuss later in this letter, carefully considers each company before they invest in it, as well as the risks involved with each investment. Mr. Taggart routinely attends industry conferences to help stay on top of new regulations as well as new investment opportunities.
It is important to note Cannabis Industry Risk–The cannabis industry is a very young, fast evolving industry with possible increased exposure to rule changes, changes in laws, increasing regulations, increasing competition which may cause businesses to suddenly close or businesses to shrink as well as the possibility that a company currently operating legally may suddenly find itself exposed to illegal activities. Series Two invests in over-the-counter securities and does not invest in the sale of cannabis or the activity of growing cannabis crops. However, if federal laws change, so may how we invest your money in the legal cannabis business.
Investment Committee
The Investment Committee that manages your Fund is made up of two veterans of the securities industry, Mr. Timothy Taggart and Mr. Robert Fleck. Mr. Taggart joined the securities industry in 1985 and is registered as a General Securities Principal, Financial and Operations Principal, Registered Options Principal and Municipal Securities Principal.
American Growth Fund, Inc – Series Two - Page 17
He is also an Arbitrator for the Financial Industry Regulatory Authority (FINRA). Mr. Robert Fleck also joined the securities industry in 1985. He has held a General Securities license and currently is an Investment Advisor Representative.
Investment Strategy
The Fund searches for companies/investments with growth potential that could show faster growth than markets indexes. We also look for securities that are considered undervalued or out of favor with investors or are expected to increase in price over time. We use a consistent approach to build the Fund’s security portfolio which is made up primarily of common stocks involved, in at least some way, in the legal cannabis business. Examples of companies associated with the legal cannabis business could include legally registered, publicly traded companies in fields such as agriculture, pharmaceutical, hydroponic or tobacco companies or Real Estate Investment Trusts (REIT). These securities may be issued by large companies and also small and mid-sized companies, Micro Cap companies and REITs. The legal cannabis business does not need to be the sole focus point of a company for Series Two to invest in it; nor does it need to account for a majority of its overall revenues. For example, Series Two may invest in Company XYZ, a pharmaceutical company developing uses for medical cannabis even if the revenues produced as a result of the sales of medical cannabis is responsible for less than 5% of XYZ’s overall revenue.
Performance Overview
Of the top ten stocks that were held in the Series Two portfolio, most of them contributed to the growth of the Fund.
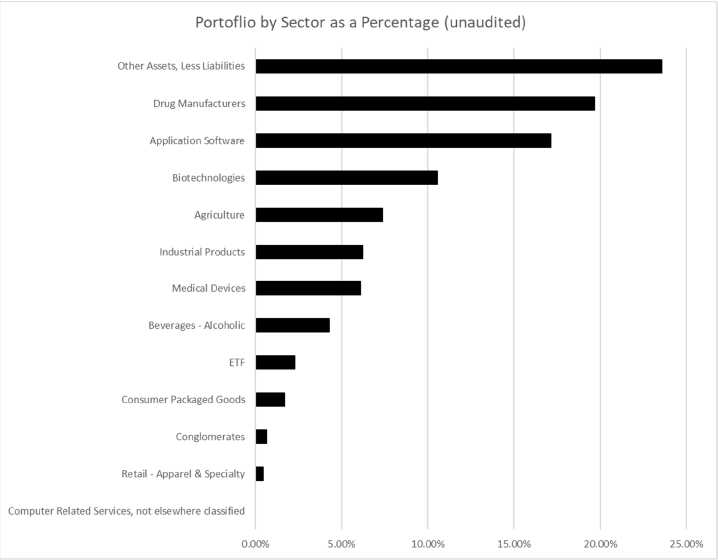
Looking at Series Two’s portfolio, Drug Manufacturers (sector) continue to make up the largest sector of your Series Two portfolio at 19.67% and contains the portfolio’s largest investment, GW Pharmaceuticals at $60,076. GW Pharmaceuticals is engaged in the research, development and commercialization of cannabinoid prescription medicines using botanical extracts derived from the Cannabis Sativa plant.
Top 3 Performing Investments (The three stocks that contributed positively to the return are)
| | | | | |
| | | Percent Contribution to | | | |
| | | the Loss on the Portfolio | | Percent Gain on Market | |
| | | for the six months ended | | Value for the six months | |
| Investment | Industry | January 31, 2020 | | ended January 31, 2020 | |
| Microsoft Corporation | Application Software | 1.97 | % | 24.92 | % |
| Teladoc Health Inc. | Application Software | 1.94 | % | 49.05 | % |
| Vestas Wind ADR | Industrial Products | 0.97 | % | 20.47 | % |
Bottom 3 Performing Investments (The three stocks that contributed negatively to the return are)
| | | | | |
| | | Percent Contribution to | | | |
| | | the Loss on the Portfolio | | Percent Loss on Market | |
| | | for the six months ended | | Value for the six months | |
| Investment | Industry | January 31, 2020 | | ended January 31, 2020 | |
| CV Sciences | Drug Manufactures | (3.38 | )% | (65.84 | )% |
| Kushco Holdings, Inc. | Packaging and Containers | (3.38 | )% | (65.61 | )% |
| GW Pharmaceuticals | Drug Manufacturers | (2.76 | )% | (28.82 | )% |
Application Software, Industrial Products, and Business Services, all boosted Series Two’s portfolio Market Value while Biotechnologies, Packaging and Containers, and Drug Manufacturers worked against Series Two’s portfolio Market Return.
Overall, your American Growth Fund Series Two Class E Shares delivered you a negative 21.48% return (this number includes a sales load of 5.75% as well as Fund expenses and change in Market Value) since July 31, 2019 through close of business on January 31, 2020. The Dow Jones Industrial Average posted a gain of 6.47% since July 31, 2019 through close of business on January 31, 2020 while the S&P 500 posted a gain of 9.31% since July 31, 2019 through close of business on January 31, 2020.
Additional data, including long-term performance data, can be found on page 44 of this report. Past performance is no guarantee of future results.
American Growth Fund, Inc – Series Two - Page 18
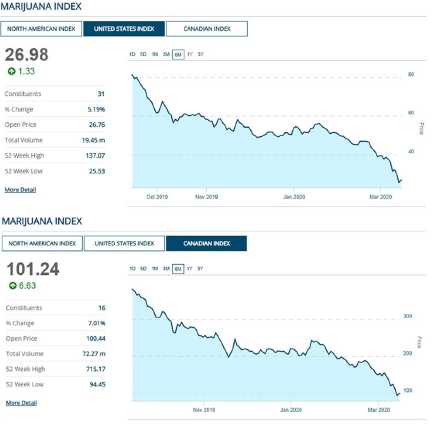
Lastly, overall, the United States Marijuana Index and Canadian Marijuana Index tracks the performance of the legal marijuana industry, which includes companies that directly handle legal marijuana, such as marijuana producers, processors, distributors, and retailers. It also includes companies that do not directly handle the plant products, but cater to those who do, as well as to consumers. It is important to remember that past performance does not guarantee future results.
The United States Marijuana Index (left) and Canadian Marijuana Index (right) 6-month charts beginning September 13, 2019 and ending March 13, 2020 are above. Please note, the data to the left of each chart is specifically for March 13, 2020.
Liquidity
As you are aware, Series Two investments are made up primarily of common stocks involved, in at least some way, in the legal cannabis business. In addition to the principal investment strategy, we may also invest in securities convertible
into common stock in companies involved, in at least some way, in the legal cannabis business. Your Fund does purchase Micro Cap stocks. Micro Cap stocks are low-priced stocks issued by the smallest of companies. Many microcap companies do not file financial reports with the SEC, so it's hard for investors to get the facts about the company's management, products, services, and finances. Microcap stocks historically have been more volatile and less liquid than the stock of larger companies. Before we purchase a Micro Cap stock, your Investment Committee considers items such as prior purchases and sales of that equity to help them assess liquidity issues. The Investment Committee also purchases smaller percentages of Micro Cap stocks to help hedge against illiquidity. In the past six months there were no instances where a Micro Cap stock that the Investment Committee purchased, could not be readily sold. However, your portfolio does include 31 shares of OBITX, Inc., a stock that was a result of a dividend payout that is currently not publicly traded and is thus considered illiquid. OBITX, Inc. anticipates that an application will be filed with FINRA for the public trading of common stock on the OTC Bulletin Board or the OTC Markets within 90 days of the distribution, but there is no assurance that the OBITX common stock will be quoted on the OTC Bulletin Board, the OTC Markets, or any Exchange. Your Investment Committee continues to monitor this event. There are also times where the Fund has sold shares of stock in order to pay for certain required services such as the annual audit performed by an independent outside auditor or legal fees. The Fund may also sell shares of stock when orders are placed to redeem shares. When either of these situations happen, your Investment Committee generally will first sell those holdings that they believe are currently, or in the future may, underperform in the market or, alternatively, they may sell holdings in sectors that the committee believes may over-weight that sector when looking at the portfolio as a whole to maintain or improve diversification.
As we look at how the cannabis business is performing, we are optimistic and will continue to look for growth opportunities for our shareholders but will remain somewhat guarded yet optimistic due to the current administration. It is our opinion that we will see more growth in the legal cannabis business in the upcoming months.
American Growth Fund, Inc – Series Two - Page 19
My staff and I are always available to discuss your account or answer any questions you may have. Please call our toll free number, 800 525-2406 or, within Colorado, 303-626-0600.
American Growth Fund wishes youA GoodFuture!

Timothy Taggart
President
American Growth Fund, Inc.
| 1. | https://members.stansberryresearch.com/articles/our-annual-outlook-buy-2020-cannabis-st |
| 2. | https://cannabiz.media/2019-cannabis-licensing-and-industry-the-year-in-review/ |
American Growth Fund, Inc – Series Two - Page 20
| | | | | |
| How American Growth Fund, Inc. Series Two | | | | | |
| Has Its Shareholders' Money Invested | | | | | |
| STATEMENT OF INVESTMENTS | | | | | |
| JANUARY 31, 2020 (UNAUDITED) | | | | | |
| |
| | | | | Market | |
| Description of Security | Shares | | | Value | |
| |
| COMMON STOCK |
| |
| Drug Manufacturers 19.67% |
| GW Pharmaceuticals Plc* | | 520 | $ | 60,076 | |
| (Engaged in the research, development and commercialization of cannabinoid prescription medicines | | | | | |
| using botanical extracts derived from the Cannabis Sativa plant.) | | | | | |
| Merck & Company Inc. | | 462 | | 39,473 | |
| (A health care company that delivers health solutions through its prescription medicines, vaccines, | | | | | |
| biologic therapies, and animal health.) | | | | | |
| AbbVie Inc. | | 420 | | 34,028 | |
| (A research-based biopharmaceutical company. It engaged in the discovery, development, manufacture | | | | | |
| and sale of a broad line of pharmaceutical products for treating chronic autoimmune diseases virology | | | | | |
| and neurological disorders.) | | | | | |
| Bausch Health COS Inc.* | | 935 | | 25,647 | |
| (Is a global specialty pharmaceutical, consumer health, and medical device company with a focus on | | | | | |
| branded products for the dermatology, gastrointestinal, and ophthalmology markets.) | | | | | |
| | | | | 159,224 | |
| |
| Application Software 17.13% |
| Microsoft Corporation | | 510 | | 86,817 | |
| (Engaged in designing, manufacturing, selling devices, and online advertising. Its products include | | | | | |
| operating systems for computing devices, servers, phones and other devices.) | | | | | |
| Teladoc Health Inc.* | | 510 | | 51,872 | |
| (Is a telehealth platform that delivers 24-hour, on-demand healthcare via mobile devices, the Internet, | | | | | |
| video, and phone. Its platform connects members with a network of physicians and behavioral health | | | | | |
| professionals.) | | | | | |
| | | | | 138,689 | |
| |
| Biotechnologies 10.56% |
| Corbus Pharmaceuticals* | | 5,880 | | 38,044 | |
| (Is a clinical stage biopharmaceutical company focused on the development and commercialization of | | | | | |
| novel therapeutics to treat rare, life-threating inflammatory-fibrotic diseases.) | | | | | |
| Cara Therapeutics Inc.* | | 2,265 | | 36,467 | |
| (Develops technologies and processes to convert the cannabis plant into medicines, therapies and | | | | | |
| treatments for ailments.) | | | | | |
| 22ndCentury Group Inc.* | | 7,920 | | 7,340 | |
| (Is a US-based plant biotechnology company.) | | | | | |
| Emerald Bioscience Inc.* | | 21,255 | | 3,609 | |
| (Is a biopharmaceutical company engaged in the discovery, development, and the commercialization of | | | | | |
| cannabis-based therapeutics.) | | | | | |
| | | | | 85,460 | |
| |
| Agriculture 7.36% |
| Scotts Miracle-Gro Company | | 485 | | 59,529 | |
| (Engaged in the manufacturing, marketing and selling of dry, granular slow-release lawn fertilizers, | | | | | |
| combination lawn fertilizer and control products, and continuous release garden and indoor plant foods.) | | | | | |
| |
| |
| *Non-income producing security | | | | | |
| 1Value was determined using significant unobservable inputs. | | | | | |
| See accompanying notes to financial statements. | | | | | |
American Growth Fund, Inc – Series Two - Page 21
| | | | | |
| How American Growth Fund, Inc. Series Two | | | | | |
| Has Its Shareholders' Money Invested | | | | | |
| STATEMENT OF INVESTMENTS | | | | | |
| JANUARY 31, 2020 (UNAUDITED) | | | | | |
| |
| | | | | Market | |
| Description of Security | Shares | | | Value | |
| |
| COMMON STOCK (continued) |
| |
| Industrial Products 6.23% |
| Vestas Wind Systems A/S | | 1,525 | $ | 50,412 | |
| (Is one of the largest manufacturers of wind turbines in the world.) | | | | | |
| |
| Medical Devices 6.08% |
| Abbott Laboratories | | 565 | | 49,2341 | |
| (Discovers, Develops, Manufactures and sells health care products. Its products include branded generic | | | | |
| pharmaceuticals manufactured internationally, marketed and sold outside the United States.) | | | | | |
| |
| Beverages – Alcoholic 4.30% |
| Constellation Brands, Inc. | | 185 | | 34,835 | |
| (Produces beer, wine, and spirits and is one of the largest multicategory alcoholic beverage suppliers in the | | | | |
| U.S.) | | | | | |
| |
| Exchange Traded Funds 2.29% |
| ETF Managers Alternative Harvest* | | 1,120 | | 18,525 | |
| |
| |
| Consumer Packaged Goods 1.69% |
| Neptune Wellness Solutions Inc.* | | 4,600 | | 10,902 | |
| (Is a health and wellness products company, with more than 50 years of combined experience in | | | | | |
| extraction, purification and formulation of value-added differentiated science-based products.) | | | | | |
| Charlottes Web Holding Inc.* | | 390 | | 2,808 | |
| (Is engaged in the production and distribution of hemp-based cannabidiol (CBD) wellness products. Its | | | | |
| product categories include tinctures (liquid product), capsules and topical products.) | | | | | |
| | | | | 13,710 | |
| |
| Conglomerates 0.65% |
| Akerna Corp.* | | 650 | | 5,278 | |
| (Is a blank check company that acquired MJ Freeway which is a seed-to-sale technology provider for the | | | | |
| cannabis industry and developer of enterprise resource planning platform.) | | | | | |
| |
| Retail – Apparel & Specialty 0.45% |
| AeroGrow International | | 3,100 | | 3,658 | |
| (Engaged in developing, marketing, and distribution indoor aeroponic garden systems designed and priced | | | | |
| to appeal to the consumer gardening, cooking and small indoor appliance markets.) | | | | | |
| |
| Computer Related Services 0.00% |
| OBITX Inc.*1 | | 33 | | 0 | |
| (Is engaged in the business of marketing and advertising through its proprietary software. Management | | | | |
| believes that their products will provide our consumers in the tech, internet, blockchain, and cannabis | | | | | |
| markets with an advertising and marketing approach uniquely designed for them.) | | | | | |
*Non-income producing security
1Value was determined using significant unobservable inputs.
See accompanying notes to financial statements.
American Growth Fund, Inc – Series Two - Page 22
How American Growth Fund, Inc. Series Two
Has Its Shareholders' Money Invested
STATEMENT OF INVESTMENTS
JANUARY 31, 2020 (UNAUDITED)
| | | | | |
| | | | | Market | |
| Description of Security | Shares | | | Value | |
| |
| COMMON STOCK (continued) |
| |
| Total Common Stocks(cost $500,556) – 76.41% | | | | 618,554 | |
| |
| |
| Total Investments, at Market Value(cost $500,556) | 76.41 | % | | 618,554 | |
| Other Assets, Less Liabilities | 23.59 | % | | 190,904 | |
| Net Assets | 100.00 | % | $ | 809,458 | |
*Non-income producing security
1Value was determined using significant unobservable inputs.
See accompanying notes to financial statements.
American Growth Fund, Inc – Series Two - Page 23
| | |
| How American Growth Fund, Inc. Series Two | | |
| Has Its Shareholders' Money Invested | | |
| STATEMENT OF INVESTMENTS | | |
| JANUARY 31, 2020 (UNAUDITED) | | |
| |
| | | Market |
| Description of Security | Shares | Value |
| |
| COMMON STOCK (continued) |
See accompanying notes to financial statements.
American Growth Fund, Inc – Series Two - Page 24
| | | | | | |
| Financial Statements | | | | | | |
| AMERICAN GROWTH FUND, INC. | | | | | | |
| STATEMENTS OF ASSETS AND LIABILITIES, JANUARY 31, 2020 (UNAUDITED) | | | | | | |
| |
| | | SERIES ONE | | | SERIES TWO | |
| ASSETS: | | | | | | |
| Investments, at market value | $ | 19,640,3161 | | $ | 618,5542 | |
| Cash | | 107,761 | | | 190,277 | |
| Receivables: | | | | | | |
| Shares of beneficial interest sold | | 2,410 | | | 100 | |
| Securities sold | | - | | | - | |
| Dividends and interest | | 9,295 | | | 749 | |
| Prepaid Insurance | | 19,356 | | | 923 | |
| Other | | 36 | | | - | |
| Total assets | | 19,779,174 | | | 810,603 | |
| LIABILITIES: | | | | | | |
| Shares of beneficial interest redeemed | | - | | | - | |
| Securities purchased payable | | - | | | - | |
| 12b-1 fees | | 19,638 | | | 1,145 | |
| Management fee | | 16,973 | | | - | |
| Other Payables | | - | | | - | |
| Total liabilities | | 36,611 | | | 1,145 | |
| NET ASSETS | $ | 19,742,563 | | $ | 809,458 | |
| COMPOSITION OF NET ASSETS: | | | | | | |
| Paid-in capital | $ | 7,925,437 | | $ | 866,988 | |
| Distributable earnings (loss) | | 11,817,126 | | | (57,530 | ) |
| Net assets | $ | 19,742,563 | | $ | 809,458 | |
| NET ASSET VALUE PER SHARE: | | | | | | |
| Series One - Class A Shares: | | | | | | |
| Net asset value and redemption price per share (based on net assets of | $ | 6.49 | | | | |
| $11,126,820 and 1,714,425 shares of beneficial interest outstanding) | | | | | | |
| Maximum offering price per share (net asset value plus sales charge of 5.75% of | $ | 6.89 | | | | |
| offering price) | | | | | | |
| Series One - Class B Shares: | | | | | | |
| Net asset value and redemption price per share (based on net assets of | $ | 5.23 | | | | |
| $162,629 and 31,086 shares of beneficial interest outstanding) | | | | | | |
| Series One - Class C Shares: | | | | | | |
| Net asset value and redemption price per share (based on net assets of | $ | 5.45 | | | | |
| $1,582,341 and 290,252 shares of beneficial interest outstanding) | | | | | | |
| Series One - Class D Shares: | | | | | | |
| Net asset value and redemption price per share (based on net assets of | $ | 6.94 | | | | |
| $6,870,773 and 990,024 shares of beneficial interest outstanding) | | | | | | |
| Maximum offering price per share (net asset value plus sales charge of 5.75% of | $ | 7.36 | | | | |
| offering price) | | | | | | |
| Series Two - Class E Shares: | | | | | | |
| Net asset value and redemption price per share (based on net assets of | | | | $ | 3.29 | |
| $809,458 and 246,040 shares of beneficial interest outstanding) | | | | | | |
| Maximum offering price per share (net asset value plus sales charge of 5.75% of | | | | $ | 3.49 | |
| offering price) | | | | | | |
1 Cost of Investments for Series One was $7,770,776
2 Cost of Investments for Series Two was $500,556
See accompanying notes to financial statements.
American Growth Fund, Inc – Page 25
| | | | | | |
| Financial Statements | | | | | | |
| AMERICAN GROWTH FUND, INC. | | | | | | |
| STATEMENTS OF OPERATIONS FOR THE SIX MONTHS ENDED JANUARY 31, 2020 (UNAUDITED) | | | | | | |
| |
| | | SERIES ONE | | | SERIES TWO | |
| INVESTMENT INCOME: | | | | | | |
| Dividends(Net of Foreign tax withholding of $420 / $- respectively) | $ | 108,855 | | $ | 4,559 | |
| Interest | | 157 | | | 87 | |
| Other | | - | | | - | |
| Total investment income | | 109,012 | | | 4,646 | |
| |
| EXPENSES: | | | | | | |
| Investment advisory fees (Note 4) | | 94,635 | | | 3,918 | |
| Administration expenses (Note 4) | | 87,008 | | | 3,588 | |
| Transfer agent, shareholder servicing and data processing fees | | 51,956 | | | 2,984 | |
| Accounting fees | | 30,000 | | | 3,000 | |
| Rent expense (Note 4) | | 51,975 | | | 2,187 | |
| Custodian fees | | 11,880 | | | 2,538 | |
| Professional fees | | 76,189 | | | 29,508 | |
| Registration and filing fees (Note 1): | | 12,285 | | | 6,839 | |
| Shareholder reports | | 3,803 | | | 152 | |
| Distribution and service fees (Note 4): | | | | | | |
| Class A | | 15,865 | | | - | |
| Class B | | 1,062 | | | - | |
| Class C | | 7,349 | | | - | |
| Class E | | - | | | 1,381 | |
| Class F | | - | | | - | |
| Directors fees (Note 4) | | 21,483 | | | 897 | |
| D&O / E&O Insurance | | 15,935 | | | 760 | |
| Other expenses | | 43,627 | | | 1,709 | |
| Total expenses | | 525,052 | | | 59,461 | |
| Less fees waived and expenses reimbursed by Advisor | | - | | | (3,918 | ) |
| Net Expenses | | 525,052 | | | 55,543 | |
| Net investment loss | | (416,040 | ) | | (50,897 | ) |
| |
| REALIZED AND UNREALIZED GAIN OR LOSS ON INVESTMENTS: | | | | | | |
| Net realized gain (loss) on investments | | 201,161 | | | (53,234 | ) |
| Net change in unrealized appreciation on investments | | 1,681,175 | | | (48,028 | ) |
| Net gain on investments | | 1,882,336 | | | (101,262 | ) |
| Net increase in net assets resulting from operations | $ | 1,466,296 | | $ | (152,159 | ) |
See accompanying notes to financial statements.
American Growth Fund, Inc – Page 26
| | | | | | |
| Financial Statements | | | | | | |
| AMERICAN GROWTH FUND, INC. | | | | | | |
| STATEMENTS OF CHANGES IN NET ASSETS | | | | | | |
| |
| SERIES ONE | | | | | | |
| | | Six Months | | | | |
| | | Ended | | | | |
| | | January 31, 2020 | | | Year Ended | |
| | | (unaudited) | | | July 31, 2019 | |
| INCREASE (DECREASE) IN NET ASSETS FROM | | | | | | |
| OPERATIONS: | | | | | | |
| Net investment loss | $ | (416,040 | ) | $ | (700,865 | ) |
| Net realized gain (loss) on investments | | 201,161 | | | 1,760,107 | |
| Net change in unrealized appreciation/depreciation on investments | | 1,681,175 | | | 1,223,449 | |
| Net increase (decrease) in net assets resulting from operations | | 1,466,296 | | | 2,282,691 | |
| |
| BENEFICIAL INTEREST TRANSACTIONS: | | | | | | |
| Net increase (decrease) in net assets resulting from beneficial interest transactions (Note 2): | | | | | | |
| Class A | | 80,139 | | | 471,118 | |
| Class B | | (15,123 | ) | | (17,645 | ) |
| Class C | | (116,538 | ) | | (1,124,015 | ) |
| Class D | | (213,431 | ) | | (416,830 | ) |
| Net change in net assets derived from beneficial interest | | | | | | |
| transactions | | (264,953 | ) | | (1,087,372 | ) |
| Total increase (decrease) | | 1,201,343 | | | 1,195,319 | |
| Net Assets - Beginning of year | | 18,541,220 | | | 17,345,901 | |
| Net Assets - End of year1 | $ | 19,742,563 | | $ | 18,541,220 | |
| |
| |
| |
| |
| SERIES TWO | | | | | | |
| | | Six Months | | | | |
| | | Ended | | | | |
| | | January 31, 2020 | | | Year Ended | |
| | | (unaudited) | | | July 31, 2019 | |
| INCREASE (DECREASE) IN NET ASSETS FROM | | | | | | |
| OPERATIONS: | | | | | | |
| Net investment loss | $ | (50,897 | ) | $ | (79,563 | ) |
| Net realized gain (loss) on investments | | (53,234 | ) | | (20,055 | ) |
| Net change in unrealized appreciation/depreciation on investments | | (48,028 | ) | | 111,953 | |
| Net increase (decrease) in net assets resulting from operations | | (152,159 | ) | | 12,335 | |
| |
| BENEFICIAL INTEREST TRANSACTIONS: | | | | | | |
| Net increase (decrease) in net assets resulting from beneficial interest transactions (Note 2): | | | | | | |
| Class E | | 7,164 | | | 177,319 | |
| Net change in net assets derived from beneficial interest | | | | | | |
| transactions | | 7,164 | | | 177,319 | |
| Total increase (decrease) | | (144,995 | ) | | 189,654 | |
| Net Assets - Beginning of year | | 954,453 | | | 764,799 | |
| Net Assets - End of year1 | $ | 809,458 | | $ | 954,453 | |
See accompanying notes to financial statements.
American Growth Fund, Inc – Page 27
| | | | | | | | | | | | | | | | | | | |
| Financial Highlights | | | | | | | | | | | | | | | | | | | |
| AMERICAN GROWTH FUND, INC. | | | | | | | | | | | | | | | | | | | |
| |
| |
| Series One - Class A | | | | | | | | | | | | | | | | | | | |
| | | | Six | | | | | | | | | | | | | | | | |
| | | | Month | | | | | | | | | | | | | | | | |
| | | | Ended | | | Year Ended | | | | | | | | | | | | | |
| | | | January 31 | | | July 31, | | | | | | | | | | | | | |
| | | | (unaudited) | | | | | | | | | | | | | | | | |
| | | | 2020 | | | 2019 | | | 2018 | | | 2017 | | | 2016 | | | 2015 | |
| Per Share Operating Data: | | | | | | | | | | | | | | | | | | | |
| Net Asset Value, | | | | | | | | | | | | | | | | | | | |
| Beginning of Period | | $ | 6.02 | | $ | 5.28 | | $ | 4.92 | | $ | 4.40 | | $ | 4.50 | | $ | 4.02 | |
| Income gain (loss) from investment operations: | | | | | | | | | | | | | | | | | | | |
| Net investment loss4 | | | (0.14 | ) | | (0.22 | ) | | (0.21 | ) | | (0.22 | ) | | (0.18 | ) | | (0.16 | ) |
| Net realized and unrealized gain (loss) | | | 0.61 | | | 0.96 | | | 0.57 | | | 0.74 | | | 0.08 | | | 0.64 | |
| Total income gain (loss) from investment | | | | | | | | | | | | | | | | | | | |
| operations | | | 0.47 | | | 0.74 | | | 0.36 | | | 0.52 | | | (0.10 | ) | | 0.48 | |
| Net Asset Value, End of Period | | $ | 6.49 | | $ | 6.02 | | $ | 5.28 | | $ | 4.92 | | $ | 4.40 | | $ | 4.50 | |
| Total Return at Net Asset Value1 | | | 7.8 | %4 | | 14.0 | % | | 7.3 | % | | 11.8 | % | | (2.2 | )% | | 11.9 | % |
| Ratios/Supplemental Data: | | | | | | | | | | | | | | | | | | | |
| Net assets, end of period (in thousands) | | $ | 11,127 | | $ | 10,236 | | $ | 8,431 | | $ | 7,777 | | $ | 6,001 | | $ | 6,469 | |
| Ratio to average net assets: | | | | | | | | | | | | | | | | | | | |
| Net investment loss4 | | | (4.43 | )% | | (4.10 | )% | | (4.10 | )% | | (4.81 | )% | | (4.33 | )% | | (3.64 | )% |
| Expenses. | | | 5.58 | % | | 5.44 | % | | 5.51 | % | | 6.37 | % | | 6.13 | % | | 5.30 | % |
| Portfolio Turnover Rate2 | | | 0 | % | | 7 | % | | 11 | % | | 15 | % | | 3 | % | | 2 | % |
| |
| Series One - Class B | | | | | | | | | | | | | | | | | | | |
| | | | Six | | | | | | | | | | | | | | | | |
| | | | Month | | | | | | | | | | | | | | | | |
| | | | Ended | | | Year Ended | | | | | | | | | | | | | |
| | | | January 31 | | | July 31, | | | | | | | | | | | | | |
| | | | (unaudited) | | | | | | | | | | | | | | | | |
| | | | 2020 | | | 2019 | | | 2018 | | | 2017 | | | 2016 | | | 2015 | |
| Per Share Operating Data: | | | | | | | | | | | | | | | | | | | |
| Net Asset Value, | | | | | | | | | | | | | | | | | | | |
| Beginning of Period | | $ | 4.94 | | $ | 4.48 | | $ | 4.22 | | $ | 3.80 | | $ | 3.92 | | $ | 3.53 | |
| Income gain (loss) from investment operations: | | | | | | | | | | | | | | | | | | | |
| Net investment loss4 | | | (0.20 | ) | | (0.34 | ) | | (0.33 | ) | | (0.22 | ) | | (0.18 | ) | | (0.17 | ) |
| Net realized and unrealized gain (loss) | | | 0.49 | | | 0.80 | | | 0.59 | | | 0.64 | | | 0.06 | | | 0.56 | |
| Total income gain (loss) from investment | | | | | | | | | | | | | | | | | | | |
| operations | | | 0.29 | | | 0.46 | | | 0.26 | | | 0.42 | | | (0.12 | ) | | 0.39 | |
| Net Asset Value, End of Period | | $ | 5.23 | | $ | 4.94 | | $ | 4.48 | | $ | 4.22 | | $ | 3.80 | | $ | 3.92 | |
| Total Return at Net Asset Value1 | | | 5.9 | %4 | | 10.3 | % | | 6.2 | % | | 11.1 | % | | (3.1 | )% | | 11.0 | % |
| Ratios/Supplemental Data: | | | | | | | | | | | | | | | | | | | |
| Net assets, end of period (in thousands) | | $ | 163 | | $ | 169 | | $ | 170 | | $ | 150 | | $ | 145 | | $ | 159 | |
| Ratio to average net assets: | | | | | | | | | | | | | | | | | | | |
| Net investment loss4 | | | (7.95 | )% | | (7.55 | )% | | (7.60 | )% | | (5.51 | )% | | (5.02 | )% | | (4.34 | )% |
| Expenses. | | | 9.10 | % | | 8.89 | % | | 8.95 | % | | 7.07 | % | | 6.82 | % | | 6.01 | % |
| Portfolio Turnover Rate2 | | | 0 | % | | 7 | % | | 11 | % | | 15 | % | | 3 | % | | 2 | % |
1. Assumes a hypothetical initial investment on the business day before the first day of the fiscal period with all dividends and distributions reinvested in additional shares on the reinvestment date and redemption at the net asset value calculated on the last business day of the fiscal period. Sales charges are not reflected in total returns.
2. The lesser of purchases or sales of Series One portfolio securities for a period, divided by the monthly average of the market value of securities owned during the period. Securities with a maturity or expiration date at the time of acquisition of one year or less are excluded from the calculation. Purchases and sales of investment securities (other than short-term securities) from the six month ended January 31, 2020, aggregated $0 and $756,764, respectively.
3. The lesser of purchases or sales of Series Two portfolio securities for a period, divided by the monthly average of the market value of securities owned during the period. Securities with a maturity or expiration date at the time of acquisition of one year or less are excluded from the calculation. Purchases and sales of investment securities (other than short-term securities) from the six months ended January 31, 2020, aggregated $0 and $134,185, respectively.
4. Per share amounts have been calculated using the Average Shares Method.
See accompanying notes to financial statements.
American Growth Fund, Inc – Page 28
| | | | | | | | | | | | | | | | | | | |
| Financial Highlights | | | | | | | | | | | | | | | | | | | |
| AMERICAN GROWTH FUND, INC. | | | | | | | | | | | | | | | | | | | |
| |
| |
| Series One - Class C | | | | | | | | | | | | | | | | | | | |
| | | | Six | | | | | | | | | | | | | | | | |
| | | | Month | | | | | | | | | | | | | | | | |
| | | | Ended | | | Year Ended | | | | | | | | | | | | | |
| | | | January 31 | | | July 31, | | | | | | | | | | | | | |
| | | | (unaudited) | | | | | | | | | | | | | | | | |
| | | | 2020 | | | 2019 | | | 2018 | | | 2017 | | | 2016 | | | 2015 | |
| Per Share Operating Data: | | | | | | | | | | | | | | | | | | | |
| Net Asset Value, | | | | | | | | | | | | | | | | | | | |
| Beginning of Period | | $ | 5.03 | | $ | 4.47 | | $ | 4.20 | | $ | 3.79 | | $ | 3.90 | | $ | 3.51 | |
| Income gain (loss) from investment operations: | | | | | | | | | | | | | | | | | | | |
| Net investment loss4 | | | (0.14 | ) | | (0.23 | ) | | (0.20 | ) | | (0.22 | ) | | (0.18 | ) | | (0.16 | ) |
| Net realized and unrealized gain (loss) | | | 0.56 | | | 0.79 | | | 0.47 | | | 0.63 | | | 0.07 | | | 0.55 | |
| Total income gain (loss) from investment | | | | | | | | | | | | | | | | | | | |
| operations | | | 0.42 | | | 0.56 | | | 0.27 | | | 0.41 | | | (0.11 | ) | | 0.39 | |
| Net Asset Value, End of Period | | $ | 5.45 | | $ | 5.03 | | $ | 4.47 | | $ | 4.20 | | $ | 3.79 | | $ | 3.90 | |
| Total Return at Net Asset Value1 | | | 8.3 | %4 | | 12.5 | % | | 6.4 | % | | 10.8 | % | | (2.8 | )% | | 11.1 | % |
| Ratios/Supplemental Data: | | | | | | | | | | | | | | | | | | | |
| Net assets, end of period (in thousands) | | $ | 1,582 | | $ | 1,578 | | $ | 2,593 | | $ | 2,720 | | $ | 2,697 | | $ | 2,753 | |
| Ratio to average net assets: | | | | | | | | | | | | | | | | | | | |
| Net investment loss4 | | | (5.34 | )% | | (5.05 | )% | | (4.60 | )% | | (5.51 | )% | | (5.02 | )% | | (4.34 | )% |
| Expenses. | | | 6.50 | % | | 6.41 | % | | 5.91 | % | | 7.07 | % | | 6.82 | % | | 6.00 | % |
| Portfolio Turnover Rate2 | | | 0 | % | | 7 | % | | 11 | % | | 15 | % | | 3 | % | | 2 | % |
| |
| Series One - Class D | | | | | | | | | | | | | | | | | | | |
| | | | Six | | | | | | | | | | | | | | | | |
| | | | Month | | | | | | | | | | | | | | | | |
| | | | Ended | | | Year Ended | | | | | | | | | | | | | |
| | | | January 31 | | | July 31, | | | | | | | | | | | | | |
| | | | (unaudited) | | | | | | | | | | | | | | | | |
| | | | 2020 | | | 2019 | | | 2018 | | | 2017 | | | 2016 | | | 2015 | |
| Per Share Operating Data: | | | | | | | | | | | | | | | | | | | |
| Net Asset Value, | | | | | | | | | | | | | | | | | | | |
| Beginning of Period | | $ | 6.42 | | $ | 5.61 | | $ | 5.21 | | $ | 4.65 | | $ | 4.74 | | $ | 4.23 | |
| Income gain (loss) from investment operations: | | | | | | | | | | | | | | | | | | | |
| Net investment loss4 | | | (0 13 | ) | | (0.21 | ) | | (0.19 | ) | | (0.22 | ) | | (0.18 | ) | | (0.20 | ) |
| Net realized and unrealized gain (loss) | | | 0.65 | | | 1.02 | | | 0.59 | | | 0.78 | | | 0.09 | | | 0.71 | |
| Total income gain (loss) from investment | | | | | | | | | | | | | | | | | | | |
| operations | | | 0.52 | | | 0.81 | | | 0.40 | | | 0.56 | | | (0.09 | ) | | 0.51 | |
| Net Asset Value, End of Period | | $ | 6.94 | | $ | 6.42 | | $ | 5.61 | | $ | 5.21 | | $ | 4.65 | | $ | 4.74 | |
| Total Return at Net Asset Value1 | | | 8.1 | %4 | | 14.4 | % | | 7.7 | % | | 12.0 | % | | (1.9 | )% | | 12.1 | % |
| Ratios/Supplemental Data: | | | | | | | | | | | | | | | | | | | |
| Net assets, end of period (in thousands) | | | 6,871 | | $ | 6,558 | | $ | 6,153 | | $ | 6,200 | | $ | 6,087 | | $ | 6,590 | |
| Ratio to average net assets: | | | | | | | | | | | | | | | | | | | |
| Net investment loss4 | | | (4.03 | )% | | (3.75 | )% | | (3.51 | )% | | (4.51 | )% | | (4.03 | )% | | (3.34 | )% |
| Expenses. | | | 5.18 | % | | 5.09 | % | | 4.83 | % | | 6.07 | % | | 5.83 | % | | 5.00 | % |
| Portfolio Turnover Rate2 | | | 0 | % | | 7 | % | | 11 | % | | 15 | % | | 3 | % | | 2 | % |
1. Assumes a hypothetical initial investment on the business day before the first day of the fiscal period with all dividends and distributions reinvested in additional shares on the reinvestment date and redemption at the net asset value calculated on the last business day of the fiscal period. Sales charges are not reflected in total returns.
2. The lesser of purchases or sales of Series One portfolio securities for a period, divided by the monthly average of the market value of securities owned during the period. Securities with a maturity or expiration date at the time of acquisition of one year or less are excluded from the calculation. Purchases and sales of investment securities (other than short-term securities) from the six month ended January 31, 2020, aggregated $0 and $756,764, respectively.
3. The lesser of purchases or sales of Series Two portfolio securities for a period, divided by the monthly average of the market value of securities owned during the period. Securities with a maturity or expiration date at the time of acquisition of one year or less are excluded from the calculation. Purchases and sales of investment securities (other than short-term securities) from the six months ended January 31, 2020, aggregated $0 and $160,127, respectively.
4. Per share amounts have been calculated using the Average Shares Method.
See accompanying notes to financial statements.
American Growth Fund, Inc – Page 29
| | | | | | | | | | | | | | | | | | | |
| Financial Highlights | | | | | | | | | | | | | | | | | | | |
| AMERICAN GROWTH FUND, INC. | | | | | | | | | | | | | | | | | | | |
| |
| |
| |
| Series Two - Class E | | | | | | | | | | | | | | | | | | | |
| | | | Six | | | | | | | | | | | | | | | | |
| | | | Month | | | | | | | | | | | | | | | | |
| | | | Ended | | | Year Ended | | | | | | | | | | | | | |
| | | | January 31 | | | July 31, | | | | | | | | | | | | | |
| | | | (unaudited) | | | | | | | | | | | | | | | | |
| | | | 2020 | | | 2019 | | | 2018 | | | 2017 | | | 2016 | | | 2015 | |
| Per Share Operating Data: | | | | | | | | | | | | | | | | | | | |
| Net Asset Value, | | | | | | | | | | | | | | | | | | | |
| Beginning of Period | | $ | 3.95 | | $ | 3.85 | | $ | 4.04 | | $ | 11.15 | | $ | 12.28 | | $ | 11.28 | |
| Income gain (loss) from investment operations: | | | | | | | | | | | | | | | | | | | |
| Net investment loss4 | | | (0.22 | ) | | (0.36 | ) | | (0.58 | ) | | (0.64 | ) | | (0.78 | ) | | (0.62 | ) |
| Net realized and unrealized gain (loss) | | | (0.44 | ) | | 0.46 | | | 0.39 | | | (0.61 | ) | | (0.35 | ) | | 1.62 | |
| Total income gain (loss) from investment | | | | | | | | | | | | | | | | | | | |
| operations | | | (0.66 | ) | | 0.10 | | | (0.19 | ) | | (1.25 | ) | | (1.13 | ) | | 1.00 | |
| Distributions: | | | | | | | | | | | | | | | | | | | |
| Long-term capital gains distributions | | | - | | | - | | | - | | | (5.73 | ) | | - | | | - | |
| Return of capital distributions | | | - | | | - | | | - | | | (0.13 | ) | | - | | | - | |
| Total distributions | | | - | | | - | | | - | | | (5.86 | ) | | - | | | - | |
| Net Asset Value, End of Period | | $ | 3.29 | | $ | 3.95 | | $ | 3.85 | | $ | 4.04 | | $ | 11.15 | | $ | 12.28 | |
| Total Return at Net Asset Value1 | | | (16.7 | )%4 | | 2.6 | % | | (4.7 | )% | | (23.8 | )% | | (9.2 | )% | | 8.9 | % |
| Ratios/Supplemental Data: | | | | | | | | | | | | | | | | | | | |
| Net assets, end of period (in thousands) | | | 809 | | $ | 954 | | $ | 765 | | $ | 589 | | $ | 1,225 | | $ | 1,476 | |
| Ratio to average net assets: | | | | | | | | | | | | | | | | | | | |
| Net investment loss (After Fee Waiver)4 | | | (13.00 | )% | | (8.87 | )% | | (14.30 | )% | | (13.37 | )% | | (7.00 | )% | | (5.24 | )% |
| Expenses (Before Fee Waiver) | | | 15.19 | % | | 9.90 | % | | 15.15 | % | | 14.53 | % | | 8.94 | % | | 6.87 | % |
| Expenses (After Fee Waiver) | | | 14.19 | % | | 9.90 | % | | 15.15 | % | | 14.53 | % | | 8.94 | % | | 6.87 | % |
| Portfolio Turnover Rate3 | | | 0 | % | | 16 | % | | 8 | % | | 151 | % | | 0 | % | | 0 | % |
1. Assumes a hypothetical initial investment on the business day before the first day of the fiscal period with all dividends and distributions reinvested in additional shares on the reinvestment date and redemption at the net asset value calculated on the last business day of the fiscal period. Sales charges are not reflected in total returns.
2. The lesser of purchases or sales of Series One portfolio securities for a period, divided by the monthly average of the market value of securities owned during the period. Securities with a maturity or expiration date at the time of acquisition of one year or less are excluded from the calculation. Purchases and sales of investment securities (other than short-term securities) from the six month ended January 31, 2020, aggregated $0 and $756,764, respectively.
3. The lesser of purchases or sales of Series Two portfolio securities for a period, divided by the monthly average of the market value of securities owned during the period. Securities with a maturity or expiration date at the time of acquisition of one year or less are excluded from the calculation. Purchases and sales of investment securities (other than short-term securities) from the six months ended January 31, 2020, aggregated $0 and $134,185, respectively.
4. Per share amounts have been calculated using the Average Shares Method.
See accompanying notes to financial statements.
American Growth Fund, Inc – Page 30
Notes to Financial Statements
American Growth Fund, Inc.
1.Summary of Significant Accounting Policies
American Growth Fund, Inc. Series One ("Series One"), and American Growth Fund, Inc. Series Two (“Series Two”) are registered under the Investment Company Act of 1940, as amended, as a diversified, open-end management investment company. Series One and Series Two follow the investment company accounting and reporting guidance of the Financial Accounting Standards Board Accounting Standards Codification Topic 946 “Financial Services – Investment Companies.” Series One’s and Series Two’s primary investment objectives are growth of capital. Series One’s and Series Two’s investment advisor is Investment Research Corporation (IRC). Series One offers Class A, Class B, Class C, and Class D shares and Series Two offers Class E and Class F shares. Class D shares are available to shareholders of accounts established prior to March 1, 1996. Class A, Class D, and Class E have a maximum sales charge (load) imposed on purchases (as a percentage of offering price) of 5.75%. Purchases of Class A, Class D, and Class E shares in amounts of $1,000,000 or more which are not subject to an initial sales charge generally will be subject to a contingent deferred sales charge of 1.0% of amounts redeemed within the first year of purchase. Class B has a maximum deferred sales charge (Contingent Deferred Sales Charge) as a percentage of original purchase price or redemption proceeds, whichever is lower, for the first 2 years of 5%, 3rd & 4thyears - 4%, 5th yr. - 3%, 6th yr. -2%, 7th yr. - 1%. Class C and Class F have a maximum deferred sales charge as a percentage of original purchase price or redemption proceeds, whichever is lower, of 1% for the first year. As of January 31, 2020, there were no shares of Class F outstanding. All classes of shares have identical rights to earnings, assets and voting privileges, except that each class has its own distribution and/or service plan and expenses directly attributable to that class and exclusive voting rights with respect to matters affecting that class.
Reclassifications -Accounting principles generally accepted in the United States of America require that certain components of net assets be reclassified between financial and tax reporting. These reclassifications have no effect on net assets nor net asset value per share. For the year ended July 31, 2019, the following reclassifications were made:
| | | | | | | | | |
| | Series One | | | | | Series Two | | | |
| | Distributable | | | | | Distributable | | | |
| | earnings (loss) | | Paid-In Capital | | | earnings (loss) | | Paid-In Capital | |
| $ | 2,222,145 | $ | (2,222,145 | ) | $ | 79,563 | $ | (79,563 | ) |
Investment Valuation –Investment securities traded on the New York Stock Exchange or other stock exchange approved for this purpose by the board of directors will be valued on the basis of the closing sale thereof on such stock exchange, or, if such sale is lacking, at the mean between closing bid and asked prices on such day. If no bid and asked prices are quoted for such day or information as to New York or other approved exchange transactions is not readily available, the security will be valued by reference to recognized composite quotations or such other method as the board of directors in good faith deem will reflect its fair market value. Securities not traded on any stock exchange but for which market quotations are readily available are valued on the basis of the mean of the last bid and asked prices. Short-term securities are valued at the mean between the closing bid and asked prices or by such other method as the board of directors determines to reflect their fair market value. The board of directors in good faith determine the manner of ascertaining the fair market value of other securities and assets.
Allocation of Income, Expenses, Gains and Losses -Income, expenses (other than those attributable to a specific class), gains and losses are allocated daily to each class of shares based upon the relative proportion of net assets represented by such class. Operating expenses directly attributable to a specific class are charged against the operations of that class.
Federal Income Taxes -No provision for federal income nor excise taxes have been made because the Fund intends to comply with the provisions of subchapter M of the Internal Revenue Code applicable to regulated investment companies and to distribute all of its taxable income to shareholders. The Fund recognizes the tax benefits of uncertain tax positions only where the position is "more likely than not" to be sustained assuming examination by tax authorities. Management has analyzed the Fund’s tax positions, and has concluded that no liability for unrecognized tax benefits should be recorded related to uncertain tax positions taken on the open tax year 2016-2018 and expected to be taken in the Fund's 2019 tax returns. The Fund identifies its major tax jurisdictions as U.S. Federal, Colorado State and foreign jurisdictions where the Fund makes significant investments; however the Fund is not aware of any tax positions for which it is reasonably possible that the total amounts of unrecognized tax benefits will change materially in the next twelve months.Classification of Distributions to Shareholders -The character of distributions made during the year from net investment income or net realized gains may differ from its ultimate characterization for federal income tax purposes. Also, due to timing of dividend distributions, the fiscal year in which amounts are distributed may differ from the fiscal year in which the income or realized gain was recorded by the Fund.
Security Transactions and Related Investment Income -Investment transactions are accounted for on the date the investments are purchased or sold (trade date). Dividend income and distributions to shareholders are recorded on the ex-dividend date. Interest income is recorded on the accrual basis. Realized gains and losses from investment transactions and unrealized appreciation and depreciation of investments are reported on an identified cost basis which is the same basis used for federal income tax purposes.
Use of Estimates -The preparation of financial statements in conformity with accounting principles generally accepted in the United States requires management to make estimates and assumptions that affect the reported amounts of assets and liabilities and disclosure of contingent assets and liabilities at the date of the financial statements and the reported amounts of increases and decreases in net assets from operations during the reporting period. Actual results could differ from those estimates.
Securities Valuations –As described in note 1, the Fund utilizes various methods to measure the fair value of most of its investments on a recurring basis. U.S. GAAP establishes a hierarchy that prioritizes inputs to valuation methods. The three levels of inputs are: Level 1 – Unadjusted quoted prices in active markets for identical assets or liabilities that the Fund has the ability to access.
Level 2 – Observable inputs other than quoted prices included in level 1 that are observable for the asset or liability, either directly or indirectly. These inputs include quoted prices for the identical instrument on an inactive market, prices for similar instruments, interest rates, prepayment speeds, credit risk, yield curves, default rates and similar data.
Level 3 – Unobservable inputs for the asset or liability, to the extent relevant observable inputs are not available, represent the Fund’s own assumptions about the assumptions a market participant would use in valuing the asset or liability, and would be based on the best information available.
The availability of observable inputs can vary from security to security and is affected by a wide variety of factors, including, for example, the type of security, whether the security is new and not yet established in the marketplace, the liquidity of markets, and other characteristics particular to the security. To the extent that valuation is based on models or inputs that are less observable or unobservable in the market, the determination of fair value requires more judgment. Accordingly, the degree of judgment exercised in determining fair value is greatest for instruments categorized in level 3.
The inputs used to measure fair value fall into different levels of the fair value hierarchy. In such cases, for disclosure purposes, the level in the fair value hierarchy within which the fair value measurement falls in its entirety, is determined based on the lowest level input that is significant to the fair value measurement in its entirety.
Semi-Annual Report for the Six Month Ended January 31, 2020
American Growth Fund, Inc – Page 31
Notes to Financial Statements American Growth Fund, Inc.
The following is a summary of the inputs used, as of January 31, 2020, in valuing the Fund’s assets carried at fair value:
| | | | | | | |
| Series One | | | | | | | |
| Equity | | Level 1 | Level 2 | Level 3 | | | Total |
| Common Stock | $ | 19,640,316 | 0 | 0 | | $ | 19,640,316 |
| Series Two | | | | | | | |
| Equity | | Level 1 | Level 2 | Level 3 | | | Total |
| Common Stock | $ | 618,554 | 0 | 0 | (1) | $ | 618,554 |
The industry classifications of Level 1 investments are included in the Statement of Investments.
There were no transfers in to or out of Level 1 or Level 2 for the six months ended January 31, 2020. Transfers are recognized at the end of the reporting period.
(1) The industry classification of Level 3 investments was Computer Related Services.
2.Shares of Beneficial Interest
Series One and Series Two have authorized an unlimited number of no par value shares of beneficial interest of each class. Transactions in shares of beneficial interest were as follows:
| | | | | | | | | | |
| | For the six months ended | | For the year ended | |
| | | | | January 31, 2020 | | | | | July 31, 2019 | |
| | Shares | | | Amount | | Shares | | | Amount | |
| Series One - Class A: | | | | | | | | | | |
| Sold | 78,747 | | $ | 474,818 | | 313,325 | | $ | 1,104,489 | |
| Dividends and distributions | | | | | | | | | | |
| Reinvested | - | | | - | | - | | | - | |
| Redeemed | (64,865 | ) | $ | (394,679 | ) | (210,597 | ) | $ | (1,023,889 | ) |
| Net increase | 13,882 | | $ | 80,139 | | 102,728 | | $ | 80,600 | |
| Series One - Class B: | | | | | | | | | | |
| Sold | 2,496 | | | 12,091 | | 8,952 | | | 28,377 | |
| Dividends and distributions | | | | | | | | | | |
| Reinvested | - | | | - | | - | | | - | |
| Redeemed | (5,602 | ) | | (27,214 | ) | (12,648 | ) | | (18,162 | ) |
| Net increase (decrease) | (3,106 | ) | | (15,123 | ) | (3,696 | ) | | 10,215 | |
| Series One - Class C: | | | | | | | | | | |
| Sold | 5,165 | | | 27,214 | | 81,263 | | | 241,970 | |
| Dividends and distributions | | | | | | | | | | |
| Reinvested | - | | | - | | - | | | - | |
| Redeemed | (28,699 | ) | | (143,752 | ) | (347,058 | ) | | (539,090 | ) |
| Net decrease | (23,534 | ) | | (116,538 | ) | (265,795 | ) | | (297,120 | ) |
| Series One - Class D: | | | | | | | | | | |
| Sold | 247 | | | 1,622 | | 2,291 | | | 104,339 | |
| Dividends and distributions | | | | | | | | | | |
| Reinvested | - | | | - | | - | | | - | |
| Redeemed | (32,324 | ) | | (215,053 | ) | (77,294 | ) | | (606,398 | ) |
| Net decrease | (32,077 | ) | | (213,431 | ) | (75,003 | ) | | (502,059 | ) |
| Series Two - Class E: | | | | | | | | | | |
| Sold | 85,505 | | | 287,236 | | 75,295 | | | 463,679 | |
| Dividends and distributions | | | | | | | | | | |
| reinvested | - | | | - | | - | | | - | |
| Redeemed | (80,839 | ) | | (280,072 | ) | (32,595 | ) | | (210,087 | ) |
| Net increase | 4,666 | | | 7,164 | | 42,700 | | | 253,592 | |
| Series Two - Class F: | | | | | | | | | | |
| Sold | - | | | - | | - | | | - | |
| Dividends and distributions | | | | | | | | | | |
| reinvested | | | | | | | | | | |
| Redeemed | - | | | - | | - | | | - | |
| Net (decrease) increase | - | | | - | | - | | | - | |
3. Realized and Unrealized Gains and Losses on Investments (unaudited)
The identified tax cost basis of investments for Series One and Series Two at January 31, 2020 was $8,024,351 and $500,556, respectively. Net unrealized appreciation on investments for Series One and Series Two of $11,615,965 and $117,998, respectively, based on identified tax cost as of January 31, 2020, was comprised of gross appreciation of $11,658,409 and $177,818, respectively, and gross depreciation of $42,444 and $59,820, respectively.
American Growth Fund, Inc – Page 32
Semi-Annual Report for the Six Month Ended January 31, 2020
Notes to Financial Statements American Growth Fund, Inc.
4. Underwriting, Investment Advisory Contracts, Service Fees and Other Related Parties (unaudited)
Under the investment advisory contract with IRC, the advisor receives annual compensation for investment advice, computed and paid monthly, equal to 1% of the first $30 million of the Fund's average annual net assets and 0.75% such assets in excess of $30 million. Series One and Series Two pay their own operating expenses.
Class B and Class C shares each are subject to annual service and distribution fees of 1.00% of average daily net assets. Class A shares are subject to annual service and distribution fees no greater than 0.30% of average daily net assets.
Class F shares are subject to annual service and distribution fees of 0.25% and 0.75% of average daily net assets, respectively. Class E shares are subject to annual service and distribution fees no greater than 0.30% of average daily net assets, respectively.
For the six months ended January 31, 2020 commissions and sales charges paid by investors on the purchase of Series One and Series Two shares to totaled $12,133 and $7,156, respectively, of which $1,719 and $1,401, respectively, was retained by World Capital Brokerage, Inc. ("WCB"), an affiliated broker/dealer which serves as the underwriter and distributor of the Series One and Series Two. Sales charges advanced to broker/dealers by WCB on sales of Series One Class B and C shares and Series Two Class F shares totaled $743 and $0, respectively, of which $0 and $0, respectively, was retained by WCB. For the six months ended January 31, 2020, WCB received contingent deferred sales charges of $74 and $0 upon redemption of Class B and C shares and F shares, respectively, as reimbursement for sales commissions advanced by WCB upon the sale of such shares. No payments were made by Series One nor Series Two to WCB for brokerage commission on securities transactions.
Certain officers of Series One and Series Two are also officers of WCB and IRC. For the six months ended January 31, 2020, Series One and Series Two paid directors' fees of $16,983 and $695, respectively, expenses of $4,500 and $202, respectively, and the audit chair $0 and $0, respectively, for review.
For the six months ended January 31, 2020, under an agreement with IRC, Series One and Series Two were charged $87,008 and $3,588, respectively, for the costs and expenses related to employees of IRC who provided administrative, clerical and accounting services to the Fund. In addition, Series One and Series Two were charged $51,975 and $2,187, respectively, by an affiliated company of IRC for the rental of office space.
5. Federal Income Tax Matters
Dividends paid by Series One and Series Two from net investment income and distributions of net realized short-term capital gains are, for federal income tax purposes, taxable as ordinary income to shareholders.
Series One and Series Two distributes net realized capital gains, if any, to its shareholders at least annually, if not offset by capital loss carryovers. Income distributions and capital gain distributions are determined in accordance with income tax regulations, which may differ from accounting principles generally accepted in the United States of America. These differences are primarily due to the differing treatment of net operating losses, foreign currency and tax allocations. Accordingly, these permanent differences in the character of income and distributions between financial statements and tax basis have been reclassified to paid-in capital.
At July 31, 2019, Series One had available for federal income tax purposes an unused capital loss carryover of $0. Series One utilized $1,746,165 of capital loss carryover. $1,521,280 of unused capital loss carryover expired July 31, 2019.
As of July 31, 2019 Series Two had non-expiring capital loss carryovers of $70,836 and $24,345, which maintain their characters as short term and long term (respectively).
Net capital losses incurred after October 31, and within the taxable year, are deemed to arise on the first business day of Series One’s and Series Two’s next taxable year.
At July 31, 2019, Series One did not have any post-October losses. Series Two did have post-October losses of $20,055.
There were no tax character distributions paid during the year ended July 31, 2019 and July 31, 2018 for Series One nor Series Two.
As of July 31, 2019 the components of accumulated gains (loss) on a tax-basis were as follows:
| | | | | | |
| | | Series One | | | Series Two | |
| Capital loss carry forward | $ | - | | $ | (95,181 | ) |
| Unrealized appreciation | | 9,934,789 | | | (166,026 | ) |
| Post-October loss | | - | | | (20,055 | ) |
| Total accumulated gain (loss) | $ | 9,934,789 | | $ | 50,790 | |
American Growth Fund, Inc. Series Two is a diversified Mutual Fund that primarily invests in over-the-counter stocks of companies that are involved, in at least some way, in the legal cannabis business. Because Series Two follows industry diversification standards, it does not expect any impact as it relates to IRS Subchapter M or RIC diversification requirements. A checklist is employed when securities are purchased that acts as a tool to help ensure that industry diversification standards are maintained. A full explanation of the investment strategies that guides Series Two is available in its Statement of Additional Information which is available on its website, www.agfseries2.com, or by calling 800-525-2406.
6. Subsequent Events
In preparing these financial statements, the Fund has evaluated events and transactions for potential recognition or disclosure through the date these financial statements were issued.
Management is currently evaluating the recent introduction of the COVID-19 virus and its impact on the financial services industry and has concluded that while it is reasonably possible that the virus could have a negative effect on the fair value of the Company’s investments and results of its operations, the specific impact is not readily determinable as of the date of these financial statements. The financial statements do not include any adjustments that might result from the outcome of this uncertainty.
Semi-Annual Report for the Six Month Ended January 31, 2020
American Growth Fund, Inc – Page 33
Notes to Financial Statements American Growth Fund, Inc.
In early 2020, an outbreak of a novel strain of coronavirus (COVID-19) emerged globally. As a result, there have been mandates from federal, state and local authorities resulting in an overall decline in economic activity The ultimate impact of COVID-19 on the financial performance of the Fund’s investments is not reasonably estimable at this time.
7.Review of Affiliated Company’s Expenses (unaudited) –The Trust’s Audit Committee reviews, on a monthly and quarterly basis, the details of each expense incurred by the Trust in order to determine the appropriateness. These expenses are then presented to the Trust’s Board of Directors for review and approval at the next quarterly Board Meeting.
For the six months ended January 31, 2020 the Trust paid to its affiliated companies, World Capital Brokerage, Inc. $17,032, Investment Research Corporation $96,574, and AGF Properties, Inc. $98,173 for services they provided to the Trust and its shareholders. These payments resulted in these affiliated companies earning profit or losses totaling World Capital Brokerage, Inc. $(358), Investment Research Corporation $(61,041), and AGF Properties, Inc. $(32,226).
8. Cannabis Industry Risk (SERIES TWO) –The cannabis industry is a very young, fast evolving industry with possible increased exposure to rule changes, changes in laws, increasing regulations, increasing competition which may cause businesses to suddenly close or businesses to shrink as well as the possibility that a company currently operating legally may suddenly find itself exposed to illegal activities. Series Two invests in over the counter securities and does not invest in the sale of cannabis nor the activity of growing cannabis crops. For more details on the risks of investing within the cannabis industry, please refer to the Series Two’s Prospectus/Statement of Additional Information available at www.agfseries2.com or by calling 800-525-2406
American Growth Fund, Inc – Page 34
Semi-Annual Report for the Six Month Ended January 31, 2020
Analysis of Expenses (unaudited)
As a shareholder of the Fund, you may incur two types of costs: (1) transaction costs, including front-end sales charges with respect to Class A, D, and E shares or contingent deferred sales charges ("CDSC") with respect to Class B, C, and F shares; and (2) ongoing costs, including management fees; distribution and/or service (12b-1) fees; and other Fund expenses. The tables below are intended to help you understand your ongoing costs (in dollars) of investing in the Fund and to compare these costs with the ongoing costs of investing in other mutual funds.
The tables below are based on an investment of $1,000 invested on August 1, 2019 and held for the six months ended January 31, 2020.
Actual expenses (unaudited)
This table provides information about actual account values and actual expenses. You may use the information provided in this table, together with the amount you invested, to estimate the expenses that you paid over the period. To estimate the expenses you paid on your account, divide your ending account value by $1,000 (for example, an $8,600 ending account value divided by $1,000 = 8.6), then multiply the result by the number under the heading entitled "Expenses Paid During the Period".
For the six month period ended January 31, 2020 (August 1, 2019 to January 31, 2020)
| | | | | | | | |
| | Actual | | | | | | | |
| | Total Return | | | | | | | |
| | Without | | | Beginning | | Ending | | Expenses |
| | Sales | | | Account | | Account | | Paid During |
| | Charges(1) | | | Value | | Value | | The Period(2) |
| Class A | 7.8 | % | $ | 1,000.00 | $ | 1,016.08 | $ | 56.70 |
| Class B | 5.9 | % | $ | 1,000.00 | $ | 1,058.70 | $ | 96.34 |
| Class C | 8.3 | % | $ | 1,000.00 | $ | 1,083.50 | $ | 70.43 |
| Class D | 8.1 | % | $ | 1,000.00 | $ | 1,018.84 | $ | 52.78 |
| Class E | (16.70 | )% | $ | 1,000.00 | $ | 785.02 | $ | 111.39 |
(1) Assumes reinvestment of all dividends and capital gain distributions, if any, at net asset value and does not reflect the deduction of the applicable sales charges with respect to Class A, D or E shares or the applicable Contingent Deferred Sales Charges ("CDSC") with respect to Class B, C, or F Shares.
(2) Expenses are equal to the annualized expense ratio (after fee waivers) of 5.58%, 9.10%, 6.50%, 5.18% and 14.19% for the Fund’s Class A, B, C, D, and E shares, respectively, multiplied by the average account value over the period multiplied by 184/365 (to reflect the one-half year period).
Hypothetical example for comparison purposes (unaudited)
The table below provides information about hypothetical account values and hypothetical expenses based on the actual expense ratio and an assumed rate of return of 5.00% per year before expenses, which is not the Fund's actual return. The hypothetical account values and expenses may not be used to estimate the actual ending account balance nor expenses you paid for the period. You may use the information provided in this table to compare the ongoing costs of investing in the Fund and other mutual funds. To do so, compare this 5.00% hypothetical example relating to the Fund with the 5.00% hypothetical examples that appear in the shareholder reports of other mutual funds.
Please note that the expenses shown in the table below are meant to highlight your ongoing costs only and do not reflect any transactional costs. The example does not reflect the deduction of contingent deferred sales charges ("CDSC") with respect to Class B and C shares. Therefore, the table is useful in comparing ongoing costs only, and will not help you determine the relative total costs of owning different mutual funds. In addition, if these transaction costs were included, your costs would have been higher.
For the six month period ended January 31, 2020 (August 1, 2019 to January 31, 2020)
| | | | | | | | |
| | Hypothetical | | | | | | | |
| | Annualized | | | Beginning | | Ending | | Expenses |
| | Total | | | Account | | Account | | Paid Expenses |
| | Return | | | Value | | Value | | The Period(2) |
| Class A | 5.00 | % | $ | 1,000.00 | $ | 989.47 | $ | 55.21 |
| Class B | 5.00 | % | $ | 1,000.00 | $ | 1,050.61 | $ | 95.61 |
| Class C | 5.00 | % | $ | 1,000.00 | $ | 1,049.70 | $ | 68.23 |
| Class D | 5.00 | % | $ | 1,000.00 | $ | 989.48 | $ | 51.26 |
| Class E | 5.00 | % | $ | 1,000.00 | $ | 990.22 | $ | 140.51 |
(2) Expenses are equal to the annualized expense ratio (after fee waivers) of 5.58%, 9.10%, 6.50%, 5.18% and 14.19% for the Fund’s Class A, B, C, D, and E shares, respectively, multiplied by the average account value over the period multiplied by 184/365 (to reflect the one-half year period).
Semi-Annual Report for the Six Month Ended January 31, 2020
American Growth Fund, Inc – Page 35
| | | | | |
| Allocation of Portfolio Assets (unaudited) | | | | | |
| (Calculated as a percentage of Net Assets) | | | | | |
| |
| January 31, 2020 | | | | | |
| Series One | | | Series Two | | |
| Sector Breakdown | | | Sector Breakdown | | |
| Diversified Company | 12.28 | % | Drug Manufacturers | 19.67 | % |
| Computer Software and Services | 11.33 | % | Application Software | 17.13 | % |
| Semiconductor Capital Equipment | 9.49 | % | Biotechnologies | 10.56 | % |
| Biotechnology | 6.25 | % | Agriculture | 7.35 | % |
| Cable TV | 6.19 | % | Industrial Products | 6.23 | % |
| Machinery | 5.33 | % | Medical Devices | 6.08 | % |
| Computer & Peripherals | 4.76 | % | Beverages – Alcoholic | 4.30 | % |
| Railroad | 4.59 | % | Exchange Traded Funds | 2.29 | % |
| Semiconductor | 4.29 | % | Consumer Packaged Goods | 1.69 | % |
| Environmental | 4.01 | % | Conglomerates | 0.65 | % |
| Online Media | 3.80 | % | Retail - Apparel & Specialty | 0.45 | % |
| Retail - Apparel & Specialty | 2.80 | % | Computer Related Services | 0.00 | % |
| Application Software | 2.68 | % | | | |
| Computer Hardware | 2.67 | % | | | |
| Communication Services | 2.54 | % | | | |
| Chemicals | 1.67 | % | | | |
| Exchange Traded Funds | 1.55 | % | | | |
| Transportation and Logistics | 1.50 | % | | | |
| Aerospace & Defense | 1.41 | % | | | |
| Home Improvement Stores | 1.32 | % | | | |
| Insurance (Property and Causality) | 1.29 | % | | | |
| Travel & Leisure | 1.22 | % | | | |
| Restaurants | 1.18 | % | | | |
| Farm & Construction Machinery | 0.98 | % | | | |
| Industrial Products | 0.88 | % | | | |
| Business Services | 0.72 | % | | | |
| Drug | 0.60 | % | | | |
| Residential Construction | 0.60 | % | | | |
| Health Care Providers | 0.53 | % | | | |
| Health Care Plans | 0.52 | % | | | |
| Retail Store | 0.51 | % | | | |
| |
| Investments – Common Stocks | 99.49 | % | Investments – Common Stocks | 76.40 | % |
| Cash and Receivables, less Liabilities | 0.51 | % | Cash and Receivables, less Liabilities | 23.60 | % |
| Total Net Assets | 100.00 | % | Total Net Assets | 100.00 | % |
NOTICE TO SHAREHOLDERS AT JANUARY 31, 2020 (UNAUDITED)
How to Obtain a Copy of the Fund’s Proxy Voting Records for the 12-Month Period Ended June 30, 2019
Information regarding how the Fund voted proxies relating to portfolio securities during the most recent 12-month period ended June 30th is available without charge, upon request, by calling 1-800-525-2406. Furthermore, you can obtain the Fund’s proxy voting records on the SEC’s website at http://www.sec.gov.
Quarterly Filings on Form N-Q
The Fund files its complete schedule of portfolio holdings with the SEC for the first and third quarters of each fiscal year on Form N-Q. The Fund’s Form N-Q is available on the SEC’s website at http://www.sec.gov. The Fund’s Form N-Q may be reviewed and copied at the SEC’s Public Reference Room in Washington, DC and information on the operation of the Public Reference Room may be obtained by calling 1-800-SEC-0330. Information included in the Fund’s Form N-Q is also available by calling 1-800-525-2406.
Beginning April 30, 2020, the Fund will cease to disclose its holdings on Form N-Q. Monthly portfolio disclosures will be filed with the SEC on Form N-PORT no later than 60 days after the end of each fiscal quarter. The monthly holdings reports on Form N-PORT for the first and second months of the fiscal quarter will remain non-public and the monthly holdings report for the third month of the fiscal quarter will become publicly available upon filing (with the exception of certain items).
American Growth Fund, Inc – Page 36
Semi-Annual Report for the Six Month Ended January 31, 2020
INFORMATION ABOUT TRUSTEES AND OFFICERS (Unaudited)
The day-to-day operations of the Fund are managed by its officers, subject to the overall supervision and control of the board of directors. The Fund´s Audit Committee meets quarterly and is responsible for reviewing the financial statements of the Fund.The following information about the interested directors2of the Fund includes their principal occupations for thepast five years:
| | | | | |
| | | | Principal | Number of | |
| | | Term of Office1and | | | Other Directorships |
| | Position(s) Held | | Occupation(s) | Portfolios in Fund | |
| Name, Address, and Age | | Length of Time | | | Held by Director for |
| | with Fund | | During Past 5 | Complex Overseen | |
| | | Served | | | the Past Five Years |
| | | | Years | by Director | |
| |
| |
| | | | Principal financial | | |
| |
| | | | and accounting | | Director of World |
| |
| Timothy E. Taggart, | | | officer, employee of | | Capital Brokerage, |
| 1636 Logan Street, | President, Director | | | | |
| |
| Denver, CO | and Treasurer | Since April 2004 | Adviser since 1983. | 2 | Inc. and Investment |
| | | | See below for | | Research |
| |
| DOB: October 18, 1953 | | | affiliation with | | Corporation |
| |
| | | | Distributor. | | |
The following information about the non-interested directors, officers and advisors of the Fund includes their principal occupations for the past five years:
| | | | | |
| | | Term of | Principal | Number of | Other |
| Name, Address, and | Position(s) Held | Office and | Occupation(s) | Portfolios in Fund | Directorships |
| | | 1 | | Complex | Held by Director |
| Age | with Fund | Length of Time | During Past 5 | Overseen by | for the Past Five |
| | | Served | Years | Director | Years |
| | Director, Audit | | | | |
| Eddie R. Bush, 1400 | Committee | | | | |
| W. 122nd Ave., Suite | Chairman | Since September | Certified Public | | |
| 100, Westminster, CO | (financial expert), | | | 2 | None |
| DOB: December 31, | Lead | 1987 | Accountant | | |
| 1939 | Independent | | | | |
| | Director | | | | |
| Darrell E. Bush, 2714 | | | | | |
| West 118th Ave, | | Since September | | | |
| Westminster, CO | Director | | Accountant | 2 | None |
| DOB: February 19, | | 2013 | | | |
| 1971 | | | | | |
| |
| Michael L. Gaughan, | | | | | World Capital |
| | Chief Compliance | | | | Brokerage, Inc. |
| 2001 Avenue D, | | Since September | Employee of the | | |
| | Officer and | | | N/A | and Investment |
| Scottsbluff, NE DOB: | | 2004 | Fund since 1995. | | |
| | Secretary | | | | Research |
| November 29, 1967 | | | | | Corporation |
| Patricia A. Blum, 1636 | | | | | |
| Logan Street, Denver, | | | Employee of the | | World Capital |
| | Vice President | Since June 2013 | | N/A | |
| CO DOB: June 27, | | | Fund since 2001. | | Brokerage, Inc. |
| 1959 | | | | | |
1. Trustees and officers of the fund serve until their resignation, removal or retirement.
2. Timothy Taggart is an "interested person” of the Fund as defined by the Investment Company Act of 1940 because of the following position which he holds.
Timothy Taggart is the sole shareholder, president and a director of Investment Research Corporation. He is also president and a director of World Capital Brokerage, Inc., the Distributor.
None of the above named persons received any retirement benefits or other form of deferred compensation from the Fund. There are no other funds that together with the Fund constitute a Fund Complex.
The Fund's Statement of Additional Information includes additional information about the Fund's trustees, and is available without charge upon request by calling 1-800-525-2406.
Semi-Annual Report for the Six Month Ended January 31, 2020
American Growth Fund, Inc – Page 37
BOARD APPROVAL OF INVESTMENT ADVISORY AGREEMENT (Unaudited)Meeting of the Board of Directors Held on October 17, 2019
At a regular meeting of the Board of Directors (the “Board”) held on October 17, 2019 (the “meeting”), the Board, assisted by legal counsel representing the American Growth Fund, Inc. and the Independent Directors, including a majority of the Directors who are not interested persons of the Board (the “Independent Directors”), considered the approval for another year of the investment advisory agreement (the “Agreement”) between Investment Research Corporation (the “Adviser”) and the Trust for Series One and Series Two.
In connection with its review and approval of the Agreement for another year at the Meeting, the Independent Directors present considered materials furnished by the Adviser, including information about, but not limited to, the Adviser’s personnel, operations and financial condition. The Independent Directors also submitted questions to the Adviser prior to the Meeting. At the Meeting, representatives from the Adviser, presented information to the Board regarding the Adviser and each Fund, discussed with the Independent Directors all information provided, and responded to questions from the Board.
Matters considered by the Board, including the Independent Directors, at the Meeting in connection with its re-approval of the Agreement included the following:
Performance. The Board reviewed each Fund’s investment performance reports, which compared the performance of each Fund with several other mutual funds with generally similar investment strategies, at least in part, over various time periods, as well as with relevant benchmarks, and discussed these reports with representatives of the Adviser. The Board considered each Fund’s comparative performance over short-term and longer-term time periods, noting that Series One and Series Two generally underperformed its peer group average performance over the one-year, five-year and ten-year periods. The Board also noted the planned changes to the investment strategy and name of Series Two and several possible impacts that could have on Series Two including, for example, effects on the performance and expense ratio.
Costs of Services and Profitability. The Board reviewed and considered the contractual annual advisory fee paid by each Fund to the Adviser, in light of the extent and quality of the advisory services provided by the Adviser to each Fund. The Board received and considered information including a comparison of each Fund’s contractual advisory fee rate with those of peer funds. The Board also reviewed and considered the total expense ratio for each Series, alongside comparative total expense ratio information for peer funds. In doing so, the Board also considered the relative size of each series compared to the peer funds.
In addition, the Board, including the Independent Directors, specifically considered the profits realized by the Adviser and its affiliates, based in part on the Adviser financial information presented at the meeting and information regarding amounts paid to the Adviser and its affiliates. The Board also reviewed "fall out" benefits realized by the Adviser and its affiliates arising from its relationship with the Trust, and the profitability of each Fund to the Adviser and its affiliates.
The Board noted that the Fund entered into a fee waiver agreement for Series Two with the Adviser. The Board took into account the fee waiver agreement and the benefits thereof to shareholders, and determined to continue to closely monitor expenses and assess additional measures to reduce fund expenses.
Nature, Extent, and Quality of the Services under the Investment Advisory Agreement: The Board received and considered information regarding the nature, extent, and quality of services provided to each Series under the Agreement. The Trustees reviewed certain background materials supplied by the Adviser in its presentation, including its Form ADV.
The Board reviewed and considered the Adviser’s investment advisory personnel, its history as an asset manager, and its performance and the amount of assets currently under management by the Adviser and its affiliated entities. The Board also reviewed the research and decisionmaking processes utilized by the Adviser, including the methods adopted to seek to achieve compliance with the investment objectives, and policies of each Series.
The Board considered the background and experience of the Adviser’s management in connection with the Fund, including reviewing the qualifications, backgrounds, and responsibilities of the parties primarily responsible for the daytoday portfolio management of each Series and the extent of the resources devoted to research and analysis of actual and potential investments.
Economies of Scale. After discussion, it was the consensus of the Board and the Independent Directors that the Fund had not reached an asset level where any material economies of scale were being realized by the Adviser that could be shared with the Fund. The Board discussed the economies of scale for each Fund and the fact that while economies of scale is not something that can be applied to each Fund now given the small asset bases, it would be revisited at a later date.Other Benefits to the Adviser: The Board reviewed and considered any other incidental benefits derived or to be derived by the Adviser from its relationship with the Fund.
In reviewing the factors above, the Board concluded that no single factor was identified by the Directors to be determinative as the principal factor in whether to renew the Agreement. The Board concluded that: (1) The nature and quality of services provided to each Series and its shareholders by IRC were reasonable and adequate; (2) The profitability of IRC and its affiliates from their relationships with each Series was not unreasonable with respect to each Series; (3) There were no material economies of scale or other incidental benefits accruing to the Adviser in connection with its relationship with each Series; (4) Performance of each Series generally lagged behind performance of respective peer funds and benchmarks over recent time periods; The Board considered substantive information which was discussed in length at the meeting regarding the lag in performance, as well as, measures aimed at improving performance; and
American Growth Fund, Inc – Page 38
Semi-Annual Report for the Six Month Ended January 31, 2020
(5) Each Series’ contractual advisory fee rate was within an acceptable range of the median for peer funds; The Board noted that while each Series’ total expense ratio was generally greater than the median for peer funds, this could be attributed in part to the disparities in relative fund size; The Directors gave consideration into the circumstances, which positively affected its decision to reapprove the Investment Advisory Agreement.
Based on the Board’s’ deliberations and their evaluation of the information described above, the Directors, including all of the Independent Directors, concluded that the Adviser’s compensation for investment advisory services is consistent with the best interests of its shareholders and accordingly approved continuation of the Investment Advisory Agreement for an additional period.
Semi-Annual Report for the Six Month Ended January 31, 2020
American Growth Fund, Inc – Page 39
This page intentionally left blank
American Growth Fund, Inc – Page 40
Semi-Annual Report for the Six Month Ended January 31, 2020
This page intentionally left blank
Semi-Annual Report for the Six Month Ended January 31, 2020
American Growth Fund, Inc – Page 41
This page intentionally left blank
American Growth Fund, Inc – Page 42
Semi-Annual Report for the Six Month Ended January 31, 2020
PERFORMANCE CHARTS(unaudited)
The following charts compare the change in value of a $10,000 investment in the American Growth Fund versus the Standard and Poors 500. Returns reflect a sales load for Class A, D, and E while Class B and C are without a sales load.
Performance data quoted represents past performance and is no guarantee of future results. The investment return and principal value of an investment will fluctuate, so that an investor’s shares, when redeemed, may be worth more or less than their original cost. The graph and table do not reflect the deduction of taxes that a shareholder would pay on fund distributions or the redemption of fund shares. Indices are unmanaged and generally do not reflect deductions for management fees. You cannot invest directly in an index. Current performance data to the most recent month end can be obtained by calling 1-800-525-2406.
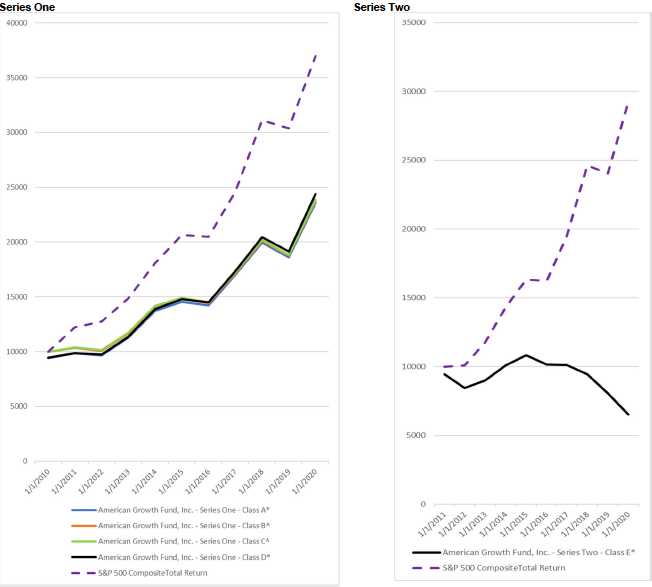
*Includes a 5.75% sales charge based on a $10,000 initial purchase.
^Includes conversion to A Shares after 7 years.
Semi-Annual Report for the Six Month Ended January 31, 2020
American Growth Fund, Inc – Page 43
On 3/1/96, Series One adopted a multi-class distribution arrangement to issue additional classes of shares, designated as Class A, Class B and Class C shares. Shares existing prior to 3/1/96 became Class D shares. Class A and Class D shares are subject to a maximum front-end sales charge of 5.75%, Class B shares are subject to a maximum contingent deferred sales charge of 5% and Class C shares are subject to a 1% contingent deferred sales charge within the first year of purchase. The Fund may incur 12b-1 expenses up to an annual maximum of .30 of 1% on its average daily net assets of its Class A shares, 1% of its average daily net assets of its Class B shares, and 1% of its average daily net assets of its Class C shares. Class D shares have no 12b-1 fees. Performance figures for Class D shares include the 5.75% initial sales charge and assume the reinvestment of income dividends and capital gain distributions.
On 2/23/2011, Series Two introduced a new Series consisting of Class E shares. Class E shares are subject to a maximum front-end sales charge of 5.75%. The Fund may incur 12b-1 expenses up to an annual maximum of .30 of 1% on its average daily net assets of its Class E shares.
Performance quoted for the period ending 1/31/2020 represents past performance and cannot be used to predict future results. The investment return and principal value of an investment will fluctuate so that the investor’s shares, when redeemed, may be worth more or less than their original cost. This material must be preceded or accompanied by a current prospectus. If you have not received, or need a current prospectus, please feel free to call for one at 1-800-525-2406. Please read the prospectus carefully before investing.. For current performance figures please call 1-800-525-2406.
| | | | | | |
| | | | 5 years | | 10 years | |
| Series One(unaudited) | 1 | year | annualized | | annualized | |
| Class D without load | 27.52 | % | 10.55 | % | 9.96 | % |
| Class D with load* | 20.24 | % | 9.23 | % | 9.32 | % |
| Class A without load | 26.76 | % | 10.16 | % | 9.62 | % |
| Class A with load* | 19.52 | % | 8.89 | % | 8.97 | % |
| Class B without load | 20.51 | % | 8.43 | % | 9.05 | %1 |
| Class C without load | 25.17 | % | 9.33 | % | 9.09 | %2 |
| |
| | | | 5 years | | Since Inception | |
| Series Two(unaudited) | 1 | year | annualized | | annualized (February 23, 2011) | |
| |
| Class E without load | (19.16 | )% | (9.63 | )% | (4.04 | )% |
| Class E with load* | (23.84 | )% | (10.69 | )% | (4.67 | )% |
*Includes a 5.75% sales charge based on a $10,000 initial purchase.
1 Includes the B Share to A Share conversion after 7 years.
2 Includes the C Share to A Share conversion after 7 years.
TRANSFER AGENT:Fund Services, Inc., 8730 Stony Point Parkway, Stony Point Bldg. III - Suite # 205, Richmond, Va. 23235CUSTODIAN:UMB Bank NA Investment Services Group, 928 Grand Blvd, Fifth Floor, Kansas City, MO 64106RETIREMENT PLAN CUSTODIAN:UMB Bank NA Investment Services Group, 928 Grand Blvd, Fifth Floor, Kansas City, MO 64106
INDEPENDENT REGISTERED PUBLIC ACCOUNTING FIRM:Tait, Weller & Baker LLP, Two Liberty Place, 50 South 16thStreet, Suite 2900, Philadelphia, PA 19102LEGAL COUNSEL:K&L Gates LLP, 1601 K St NW, Washington, DC 20006UNDERWRITER/DISTRIBUTOR:World Capital Brokerage, Inc., 1636 Logan Street, Denver, CO 80203
| | | |
| OFFICERS AND DIRECTORS | | INVESTMENT ADVISORS | |
| Timothy E. Taggart | President and Director | Investment Research Corporation |
| Eddie R. Bush | Director | 1636 Logan Street | |
| Darrell E. Bush | Director | Denver, CO 80203 | |
| Patricia A. Blum | Vice President | OFFICERS AND DIRECTORS | |
| Michael L. Gaughan | Chief Compliance Officer | Timothy E. Taggart | President, Treasurer, and |
| | and Corporate Secretary | | Director |
| | | Michael L. Gaughan | Vice President, |
| | | | Secretary |
| | | | and Director |
| | | Patricia A. Blum | Vice President |
03/20/2020