UNITED STATES
SECURITIES AND EXCHANGE COMMISSION
Washington, D.C. 20549
FORM N-CSRS/A
CERTIFIED SHAREHOLDER REPORT OF REGISTERED
MANAGEMENT INVESTMENT COMPANIES
Investment Company Act file number_811-825_______________________________________________
American Growth Fund, Inc.______________________________________________________________
(Exact name of registrant as specified in charter)
1636 Logan Street, Denver, CO 80203______________________________________________________
(Address of principal executive offices)
(Zip code)
(Name and address of agent for service)
Registrant’s telephone number, including area code: _303-626-0600_____________________________
Date of fiscal year end: _July 31, 2019______________________________________________________
Date of reporting period: _January 31, 2019_________________________________________________
Form N-CSR is to be used by management investment companies to file reports with the Commission not later than 10 days after the transmission to stockholders of any report that is required to be transmitted to stockholders under Rule 30e-1 under the Investment Company Act of 1940 (17 CFR 270.30e-1). The Commission may use the information provided on Form N-CSR in its regulatory, disclosure review, inspection, and policymaking roles.
A registrant is required to disclose the information specified by Form N-CSR, and the Commission will make this information public. A registrant is not required to respond to the collection of information contained in Form N-CSR unless the Form displays a currently valid Office of Management and Budget (“OMB”) control number. Please direct comments concerning the accuracy of the information collection burden estimate and any suggestions for reducing the burden to Secretary, Securities and Exchange Commission, 450 Fifth Street, NW, Washington, DC 20549-0609. The OMB has reviewed this collection of information under the clearance requirements of 44 U.S.C. § 3507.
This filing is being made to include Sections 2-13, updated certifications and a code of ethics.
Dear Shareholders:
I am pleased to deliver to you the American Growth Fund Series One Semi Annual Report for the year ending January 31, 2019.
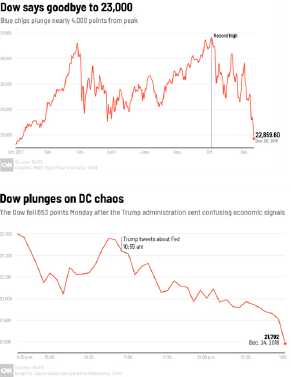
December 2018 was a volatile month for financial markets. The S&P 500 fell 9.6% for the month of December, making it the worst closing month to the year since 1931, when it sank 14.5%1. December’s volatility left many in the market with slack jaws. According to a December 2018 CNN Business article, In one ten-day span, the Dow Jones Industrial Average fell more than 350 points six times. There was also one day when the Dow rose by 1,000 points —the biggest point gain ever. The S&P 500 was up or down more than 1% nine times in December and 64 times this year. In all of 2017, that happened only eight times. In a show of global economics;
December 14th - China, one of the world’s largest economies, decelerated to its weakest pace in 15 years and its industrial production was the slowest since 2002.
December 17th - The Dow falls 508 points as President Trump worries Wall Street that he will interfere with the Federal Reserve's independence.
December 19th - The Dow rises as much as 382 points after the Federal Reserve hikes rates but then proceeds to tumble 352 points to the lowest level of the year. The Fed lowers its economic growth forecast for 2019 while still signaling that it will continue to raise rates at a slower pace.
December 20th - The Dow falls 464 points, closing below 23,000 for the first time since October 2017. Volatility climbs to the highest level since February.
December 21st - The Dow closes 414 points, or 1.8%, lower ending its worst week since 2008. The Nasdaq plummets 3%, closing in its first bear market since the Great Recession. Facebook (FB) fell 6%. Stock markets in China, Italy, Germany, Japan and South Korea are in bear markets.
December 23rd - The Dow loses 653 points. The Dow and S&P 500 suffer their biggest Christmas Eve declines ever.
December 26th - The Dow has its biggest day ever, rising a stunning 1,086 points — a 5% rise. The S&P 500 also soars 5%. The Nasdaq rises 5.8%, pulling out of bear market territory. All but one of 505 stocks in the S&P 500 end the day higher.
December 27th - The Dow falls as much as 611 points before roaring back at the close. It ends 260 points higher to cap off another volatile day on Wall Street. The swing of nearly 900 points is one of the biggest trading ranges of the year.2
However, the beginning of the market’s recovery was just around the corner. In January 2019, both developed and emerging market equities gained over 7% in total return terms, boosted by signals from the US Federal Reserve that it would be more patient with further rate rises then it had stated it would be in 2018, as well as by improving rhetoric towards China from the White House. Even so, political uncertainty remains a headwind, while recent data continues to send mixed signals about the outlook for the global economy.3 Stocks recorded solid gains in February making for the best start to a year in nearly three decades with the S&P 500 closing up 11.48% year to date (ended February 28, 2019). The S&P 500 Index recorded only two daily moves exceeding 1% during February—a notable contrast from the fourth quarter of 2018, when such swings occurred on four out of every five trading days.4 As always its important to remember that past performance does not guarantee future results.
In my last report I discussed my optimism that the U.S. economy would continue to lead the world market, that domestically there continues to be political infighting within, as well as between, the presidential and legislative branches of our government. Neither of those beliefs have changed. Although Series One is invested primarily in Large Cap domestic stocks, it is important to remember that other world economies affect the holdings in your portfolio. Notably, as you may have seen on the news, there are two additional items to keep an eye on. First is the slowing of China’s economy that we touched on above. The slowing of its economy and tariffs imposed by President Trump warrant a watchful eye. Second, Brexit and the turmoil that it has placed not only on England but also on the European Union and the world market.
American Growth Fund, Inc. - Series One – Page 2
Real gross domestic product (GDP) increased at an annual rate of 2.6 percent in the fourth quarter of 2018. Real gross domestic income for the third quarter of 2018, the percent change in real GDI was revised from 4.3 percent to 4.6 percent based on newly available tabulations from the BLS Quarterly Census of Employment and Wages program. Real GDP increased 2.9 percent in 2018 (from the 2017 annual level to the 2018 annual level), compared with an increase of 2.2 percent in 2017.5 Additionally, the Unemployment Rate has lowered slightly since our last report from 3.9% in July 2018 to 3.8% in February 2019.6 It is the Investment Committee’s outlook that the U.S. Economy will likely continue to be strong.

Investment Committee
The Investment Committee that manages your Fund is made up of two veterans of the securities industry, Mr. Timothy Taggart and Mr. Robert Fleck. Mr. Taggart joined the securities industry in 1985 and is registered as a General Securities Principal, Financial and Operations Principal, Registered Options Principal and Municipal Securities Principal. He is also an Arbitrator for the Financial Industry Regulatory Authority (FINRA). Mr. Robert Fleck also joined the securities industry in 1985. He has held a General Securities license and currently is an Investment Advisor Representative.
Investment Strategy
Your Investment Committee uses a fundamental top down approach to manage your portfolio. First, we look at the general economic outlook, then we look at the industries that we feel have the biggest growth potential in the current and upcoming economies. From that, our objective is to choose the best companies in those industries. Many of these companies are established, large cap (defined as companies with a market capitalization of $5 billion or more) securities many of which are household names that you will easily recognize.
Performance Overview
Series One is invested primarily in large cap, growth-oriented domestic common stocks. When you examine the portfolio on the following pages you will note that the largest investment sector is Computer Software and Services Industry at 11.04% of your portfolio, and the largest security in your portfolio is Fair Isaac Corporation at $1,786,962 which provides decision-making solutions to clients in the financial services, telecommunications and retail industries.
Your American Growth Fund Series One Class A Shares delivered you a (3.03)% return since July 31, 2018 through close of business on January 31, 2019. The Dow Jones Industrial Average posted a loss of 0.49% while the S&P 500 posted a loss of 3.00% for the same time period as listed above. Of the stocks in your Series One portfolio, most of them contributed to the growth of the Fund. The top three active performing investments were Starbucks Corp whose market value rose 29.78% (which contributed to a gain of 17.63% of the total loss on investments), Vestas Wind Systems A/S whose market value rose 29.26% (which contributed to a gain of 6.27% of the total loss on investments) and Ulta Beauty, Inc. whose market value rose 19.45% (which contributed to a gain of 7.61% of the total loss on investments).
Unfortunately, not all investments fared as well. NVIDIA Corp whose market value fell 46.04% (which contributed to a loss of 8.84% of the total loss on investments), General Electric whose market value fell 39.89% (which contributed to a loss of 8.70% of the total loss on investments) and Balchem Corp whose market value fell 17.20% (which contributed to a loss of 11.45% to the total loss on investments).
The investment sectors that had the most positive influence on your Series One portfolio were Restaurants, Computer & Peripherals, and Computer Software and Services. The investment sectors that had the most adverse effect on your portfolio were Semiconductor Capital Equipment, Drugs, and Computer Hardware.
Additional data, including long-term performance data, can be located on page 28 of this report. Past performance is no guarantee of future results.
Like our last report, over the next six months we will likely see some more changes in the world. Our Investment Committee will continue to monitor the dollar’s value against the world currencies, signs of a possible trade war, the European economy, as well as the global impact of economic sanctions against North Korea and any other major world developments that might affect the U.S. economy and the stocks we are invested in.
American Growth Fund, Inc. - Series One – Page 3
As we look at these indicators of how our economy is doing, we generally continue to be cautiously optimistic. It is our hope that we will see continued growth in the upcoming months.
My staff and I are always available to discuss your account or answer any questions you might have. Please call our toll free number, 800 525-2406 or, within Colorado, 303-626-0600.
American Growth Fund wishes you A Good Future!

Timothy Taggart
President and Investment Committee Member
American Growth Fund, Inc.
| 1. | https://markets.businessinsider.com/news/stocks/stock-market-news-on-track-worst-december-since-great-depression-2018-12-1027837251 |
| 2. | https://www.cnn.com/2018/12/28/investing/stock-market-december-volatility/index.html |
| 3. | https://am.jpmorgan.com/gb/en/asset-management/gim/adv/insights/market-insights-monthly-market-review-january-2019 |
| 4. | https://www.troweprice.com/financial-intermediary/us/en/insights/articles/2019/q1/monthly-market-review.html |
| 5. | https://www.bea.gov/news/2019/initial-gross-domestic-product-4th-quarter-and-annual-2018 |
| 6. | http://data.bls.gov/timeseries/LNS14000000 |
American Growth Fund, Inc. - Series One – Page 4
This page intentionally left blank
American Growth Fund, Inc. - Series One – Page 5
| | | | |
| How American Growth Fund, Inc. Series One | | | | |
| Has Its Shareholders' Money Invested | | | | |
| STATEMENT OF INVESTMENTS | | | | |
| January 31, 2019 (unaudited) | | | | |
| |
| | | | Market | |
| Description of Security | Shares | | Value | |
| |
| COMMON STOCK |
| |
| Computer Software and Services Industry 11.04% |
| Fair Isaac Corp* | 7,935 | $ | 1,786,962 | |
| (Provides decision-making solutions to clients in the financial services, telecommunications and | | | | |
| retail industries.) | | | | |
| |
| Diversified Company Industry 10.24% |
| Chemed Corp | 4,455 | | 1,327,323 | |
| (Operates two wholly owned subsidiaries: VITAS Healthcare Corp., end of life hospice care, and | | | | |
| Roto-Rooter, plumbing and drain cleaning services.) | | | | |
| Honeywell International, Inc. | 2,291 | | 329,056 | |
| (A Diversified technology and manufacturing company, serving customers worldwide with | | | | |
| aerospace products and services, control, sensing and security technologies for buildings, | | | | |
| homes, and industry; turbocharges and automotive products; and specialty chemicals, electronic | | | | |
| and advanced materials, and process technology for refining and petrochemicals.) | | | | |
| | | | 1,656,379 | |
| |
| Biotechnology Industry 8.17% |
| Amgen Inc. | 5,019 | | 939,105 | |
| (Utilizes biotechnology to develop human pharmaceutical products.) | | | | |
| Biogen Inc.* | 656 | | 218,960 | |
| (Is a biopharmaceutical company. It is engaged in discovering, developing, manufacturing and | | | | |
| delivering therapies to patients for the treatment of neurodegenerative diseases, hematologic | | | | |
| conditions and autoimmune disorders.) | | | | |
| Novo Nordisk A/S | 3,490 | | 164,100 | |
| (A Diversified technology and manufacturing company, serving customers worldwide with | | | | |
| aerospace products and services, control, sensing and security technologies for buildings, | | | | |
| homes, and industry; turbocharges and automotive products; and specialty chemicals, electronic | | | | |
| and advanced materials, and process technology for refining and petrochemicals.) | | | | |
| | | | 1,322,165 | |
| |
| Machinery Industry 6.54% |
| Middleby Corp* | 5,522 | | 649,498 | |
| (Develops, manufactures, markets and services equipment used for commercial food cooking, | | | | |
| preparation, and processing.) | | | | |
| Flowserve Corp | 9,281 | | 408,735 | |
| (Makes, designs and markets fluid-handling equipment (pumps, valves and mechanical seals) | | | | |
| for industries that use difficult-to-handle or corrosive fluids.) | | | | |
| | | | 1,058,233 | |
| |
| Semiconductor Capital Equipment 6.48% |
| Teradyne, Inc | 29,110 | | 1,047,669 | |
| (The world's largest producer of automated test equipment for semiconductors.) | | | | |
| |
| Computer & Peripherals Industry 5.97% |
| Cisco Systems | 20,438 | | 966,513 | |
| (The leading supplier of high-performance inter-networking products.) | | | | |
| |
| Cable TV Industry 4.83% |
| Charter Communications, Inc * | 2,363 | | 782,271 | |
| (Is a providers of cable services in the United States. The Company offers entertainment, | | | | |
| information and communications solutions to residential and commercial customers.) | | | | |
| |
| *Non-income producing security | | | | |
| See accompanying notes to financial statements. | | | | |
American Growth Fund, Inc. - Series One – Page 6
| | | | | |
| How American Growth Fund, Inc. Series One | | | | |
| Has Its Shareholders' Money Invested | | | | |
| STATEMENT OF INVESTMENTS | | | | | |
| JANUARY 31, 2019 (unaudited) | | | | | |
| |
| | | | | Market | |
| Description of Security | | Shares | | Value | |
| |
| COMMON STOCK (continued) |
| |
| |
| Environmental Industry 3.84% |
| Waste Management | | 6,498 | $ | 621,664 | |
| (The largest solid-waste disposal company in North America.) | | | | |
| |
| Semiconductor Industry 3.82% |
| Intel Corp | | 12,569 | | 592,251 | |
| (A leading manufacturer of integrated circuits.) | | | | |
| NVIDIA Corp | | 180 | | 25,875 | |
| (Is a developer of graphics processing unit.) | | | | |
| | | | | 618,126 | |
| |
| Online Media 3.81% |
| Alphabet Inc. Class A* | | 235 | | 264,584 | |
| (Engaged in improving the ways people connect with information & products including Search, | | | | |
| Android, YouTube, Apps, Maps & Ads. It also produces internet-connected home devices & | | | | |
| provides internet services.) | | | | | |
| Facebook Inc.* | | 1,521 | | 253,535 | |
| (Operates a social networking website. | The Company’s products are Facebook, Instagram, | | | | |
| Messenger, WhatsApp, and Oculus. Its products enable people to connect and share through | | | | |
| mobile devices and personal computers.) | | | | |
| Tencent Holdings Ltd. ADR | | 2,200 | | 98,142 | |
| (A Chinese Internet giant with businesses and investments in a large variety of Internet services | | | | |
| and contents.) | | | | | |
| | | | | 616,261 | |
| |
| Railroad 3.51% |
| Kansas City Southern | | 5,368 | | 567,666 | |
| (A holding company that has railroad investments in the U.S., Mexico and Panama.) | | | | |
| |
| Communication Services 2.52% |
| AT&T Inc. | | 11,851 | | 356,241 | |
| (Is the second-largest U.S. wireless carrier, serving more than 100 million subscribers, including | | | | |
| about 65 million postpaid phone subscribers. The firm also provides fixed-line services, including | | | | |
| voice, data, and television services, to consumers and small businesses in 21 states and to | | | | |
| larger enterprises worldwide.) | | | | | |
| Verizon Communications, Inc. | | 940 | | 51,756 | |
| (Is a provider of communications, information and entertainment products and services to | | | | |
| consumers, businesses and governmental agencies.) | | | | |
| | | | | 407,997 | |
| |
| Drug 2.14% |
| Bristol-Myers Squibb Company | | 4,871 | | 240,481 | |
| (Engages in discovering, developing and delivering medicines that help patients prevail over | | | | |
| serious diseases.) | | | | | |
| Johnson & Johnson | | 796 | | 105,932 | |
| (Engaged in the research and development, manufacture and sale of products in the health care | | | | |
| field within its Consumer, Pharmaceutical and Medical Devices, and Diagnostic business | | | | |
| segments.) | | | | | |
| | | | | 346,413 | |
| |
| |
| *Non-income producing security | | | | | |
| See accompanying notes to financial statements | | | | |
American Growth Fund, Inc. - Series One – Page 7
| | | | | |
| How American Growth Fund, Inc. Series One | | | | |
| Has Its Shareholders' Money Invested | | | | | |
| STATEMENT OF INVESTMENTS | | | | | |
| JANUARY 31, 2019 (unaudited) | | | | | |
| |
| | | | | Market | |
| Description of Security | | Shares | | Value | |
| |
| COMMON STOCK (continued) |
| |
| Retail – Apparel & Specialty 2.04% |
| Ulta Beauty Inc.* | | 400 | $ | 116,768 | |
| (Is a North American beauty retailer for cosmetics, skin-care products, fragrance, hair-care | | | | |
| products, and salon services.) | | | | | |
| Tractor Supply Company | | 1,300 | | 111,020 | |
| (Is the largest operator of retail farm and ranch stores in the United States.) | | | | |
| Alibaba Group Holding Ltd* | | 610 | | 102,779 | |
| (Is the world's largest online and mobile commerce company which operates China's most- | | | | |
| visited online marketplaces.) | | | | | |
| | | | | 330,567 | |
| |
| Application Software 2.01% |
| Microsoft Corporation | | 3,109 | | 324,673 | |
| (Engaged in designing, manufacturing, selling devices, and online advertising. Its products | | | | |
| include operating systems for computing devices, servers, phones and other devices.) | | | | |
| |
| Computer Hardware 1.96% |
| Apple Inc. | | 1,704 | | 283,614 | |
| (Designs, manufactures, & markets mobile communication & media devices, personal | | | | |
| computers, & portable digital music plays, & sells a variety of related software, services, | | | | |
| accessories, networking solutions, & third-party digital content.) | | | | |
| Enersys | | 400 | | 34,104 | |
| (One of the world's leading producers and distributors of industrial batteries, with product lines | | | | |
| that include reserve and motive power products. Reserve power products are used for backup | | | | |
| power solutions for the continuous operation of critical applications, primarily within the | | | | |
| telecommunications industry.) | | | | | |
| | | | | 317,718 | |
| |
| Exchange Traded Funds 1.79% |
| IShares TR MSCI India | | 2,970 | | 97,416 | |
| |
| Franklin FTSE India | | 3,550 | | 96,560 | |
| |
| Krane Shares Bosera MSCI China A | | 4,440 | | 95,549 | |
| |
| | | | | 289,525 | |
| |
| Chemicals 1.71% |
| NewMarket Corp. | | 362 | | 145,195 | |
| (Manufactures and sells petroleum additives used in lubricating oils and fuels to enhance their | | | | |
| performance in machinery, vehicles, and other equipment. | The petroleum additives market has | | | | |
| two products: lubricant additives and fuel additives.) | | | | | |
| Balchem Corporation | | 1,575 | | 130,756 | |
| (Is engaged in the development, manufacture and marketing of specialty performance | | | | |
| ingredients and products for the food, nutritional, feed, pharmaceutical, medical sterilization and | | | | |
| industrial markets.) | | | | | |
| | | | | 275,951 | |
*Non-income producing security
See accompanying notes to financial statements.
American Growth Fund, Inc. - Series One – Page 8
How American Growth Fund, Inc. Series One
Has Its Shareholders' Money Invested
STATEMENT OF ASSETS AND LIABILITIES (unaudited)
January 31, 2019 (unaudited)
| | | | | |
| | | | | Market | |
| Description of Security | | Shares | | Value | |
| |
| COMMON STOCK (continued) |
| |
| Insurance (Property and Causality) 1.44% |
| Selective Insurance Group Inc. | | 2,088 | $ | 127,201 | |
| (Is a holding company that offers property and casualty insurance products and services in | | | | |
| United States.) | | | | | |
| Markel Corp* | | 100 | | 105,351 | |
| (Markel Corp is engaged in the business of property and casualty insurance. It focuses primarily | | | | |
| on specialty lines, such as executive liability to commercial equine insurance. It also invests in | | | | |
| bakery equipment manufacturing and residential homebuilding.) | | | | |
| | | | | 232,552 | |
| |
| Transportation and Logistics - 1.44% |
| Norfolk Southern Corp | | 620 | | 103,999 | |
| (Is a $10.6 billion railroad operating in the Eastern United States. On 21,000 miles of track, | | | | |
| Norfolk Southern hauls shipments of coal, intermodal traffic, and a diverse ix of automobile, | | | | |
| agriculture, metal, chemical, and forest products.) | | | | |
| Old Dominion Freight Line Inc. | | 630 | | 85,636 | |
| (Is the fourth-largest less-than-truckload carrier in the United States, with more than 225 service | | | | |
| centers and 6,900-plus tractors.) | | | | | |
| JB Hunt Transportation | | 400 | | 42,816 | |
| (Its primary operating segments are intermodal delivery, which uses the Class I rail carriers for | | | | |
| the underlying line-haul movement; dedicated contract services that provide customer-specific | | | | |
| fleet needs; and highway brokerage.) | | | | | |
| | | | | 232,451 | |
| |
| Banks 1.37% |
| Bank of America Corp. | | 4,000 | | 113,880 | |
| (Bank of America Corporation is a bank holding and a financial holding company. The company | | | | |
| provides financial products and services to people, companies and institutional investors.) | | | | |
| JPMorgan Chase & Co. | | 1,040 | | 107,640 | |
| (JPMorgan Chase & Co is a financial services firm and a banking institution. It is engaged in | | | | |
| investment banking, commercial banking, treasury and securities services, asset management, | | | | |
| retail financial services, and credit card businesses.) | | | | |
| | | | | 221,520 | |
| |
| Home Improvement Stores 1.29% |
| Home Depot Inc. (The) | | 1,140 | | 209,224 | |
| (Is a home improvement retailer. Its stores sell an assortment of building materials, home | | | | |
| improvement and lawn and garden products and provide a number of services.) | | | | |
| |
| Farm & Construction Machinery 1.21% |
| Caterpillar Inc. | | 1,471 | | 195,878 | |
| (Manufacturer of construction and mining equipment, diesel and natural gas engines, industrial | | | | |
| gas turbines and diesel-electric locomotives. | The Company is also a U.S. exporter.) | | | | |
| |
| Retail Store 1.18% |
| Dollar Tree, Inc.* | | 1,965 | | 190,271 | |
| (Operates discount variety stores in the United States and Canada. Its stores offer merchandise | | | | |
| primarily at the fixed price of $1.00.) | | | | | |
| |
| |
| |
| |
| *Non-income producing security | | | | | |
| See accompanying notes to financial statements | | | | | |
American Growth Fund, Inc. - Series One – Page 9
| | | | | |
| How American Growth Fund, Inc. Series One | | | | | |
| Has Its Shareholders' Money Invested | | | | | |
| STATEMENT OF INVESTMENTS | | | | | |
| JANUARY 31, 2019 (unaudited) | | | | | |
| |
| | | | | Market | |
| Description of Security | | Shares | | Value | |
| |
| COMMON STOCK (continued) |
| |
| Restaurants 1.16% |
| Starbucks Corporation | | 2,748 | $ | 187,249 | |
| (A roaster, marketer, & retailer of specialty coffee in the world, operating globally. | It sells a | | | | |
| variety of coffee & tea products. It sells goods and services under brands including Teavana, | | | | |
| Tazo, and Seattle's Best Coffee.) | | | | | |
| |
| Aerospace & Defense 1.13% |
| The Boeing Company | | 270 | | 104,117 | |
| (Manufactures commercial airplanes, provides defense equipment, and maintains a small | | | | |
| captive finance division.) | | | | | |
| Raytheon Company | | 480 | | 79,085 | |
| (Is a U.S. defense contractor with over $25 billion in sales. It operates through five segments: | | | | |
| integrated defense systems, intelligence and information, missile systems, space and airborne | | | | |
| systems, and a cybersecurity business branded Forcepoint.) | | | | | |
| | | | | 183,202 | |
| |
| Travel & Leisure 1.11% |
| Hilton Worldwide Holdings Inc | | 1,220 | | 90,866 | |
| (Markel Corp is engaged in the business of property and casualty insurance. It focuses primarily | | | | |
| on specialty lines, such as executive liability to commercial equine insurance. It also invests in | | | | |
| bakery equipment manufacturing and residential homebuilding.) | | | | | |
| Marriott International Inc. | | 780 | | 89,333 | |
| (Operates 1.29 million rooms across 30 brands. Luxury represents nearly 10% of total rooms, | | | | |
| while full service, limited service, and timeshares.) | | | | | |
| | | | | 180,199 | |
| |
| Entertainment Industry 1.08% |
| Netflix Inc.* | | 513 | | 174,164 | |
| (Provides multimedia content through the internet and subscription based platform for television | | | | |
| shows, movies, and original series.) | | | | | |
| |
| Industrial Products 0.89% |
| Eaton Corp PLC | | 970 | | 73,962 | |
| (Provides power-management solutions to diversified industrial customers, including electrical | | | | |
| transmission systems, lighting, hydraulics, aerospace fuel systems, and truck and auto | | | | |
| powertrain systems.) | | | | | |
| Vestas Wind Systems A/S | | 2,500 | | 69,250 | |
| (Is one of the largest manufacturers of wind turbines in the world ) | | | | | |
| | | | | 143,212 | |
| |
| Business Services 0.72% |
| Paychex, Inc. | | 1,651 | | 116,891 | |
| (Is a provider of integrated payroll, human resources, insurance, and benefits outsourcing | | | | |
| solutions for small- to medium-sized business in the United States.) | | | | | |
| |
| Health Care Providers 0.65% |
| HCA Holdings Inc. | | 760 | | 105,967 | |
| (It operates general acute care hospitals, psychiatric hospitals, and rehabilitation hospitals.) | | | | |
*Non-income producing security
See accompanying notes to financial statements.
American Growth Fund, Inc. - Series One – Page 10
How American Growth Fund, Inc. Series One
Has Its Shareholders' Money Invested
STATEMENT OF ASSETS AND LIABILITIES (unaudited)
January 31, 2019 (unaudited)
| | | | | |
| | | | | Market | |
| Description of Security | Shares | | | Value | |
| |
| COMMON STOCK (continued) |
| |
| Steel 0.64% |
| Nucor Corp | 1,680 | | $ | 102,883 | |
| (Is engaged in the manufacturing of steel and steel products.) | | | | | |
| |
| Health Care Plans 0.63% |
| UnitedHealth Group Inc. | 380 | | | 102,676 | |
| (Is a diversified health care company in the United States.) | | | | | |
| |
| Residential Construction 0.51% |
| NVR Inc.* | 31 | | | 82,460 | |
| (NVR Inc is a United States based company engaged in the construction and sale of single- | | | | | |
| family detached homes, town homes and condominium buildings. It also operates in mortgage | | | | | |
| banking and title services business.) | | | | | |
| |
| Total Common Stocks (cost $8,340,482) – 98.87% | | | | 15,997,552 | |
| |
| Total Investments, at Market Value (cost $8,340,482) | 98.87 | % | | 15,997,552 | |
| Other Assets, Less Liabilities | 1.13 | % | | 182,225 | |
| Net Assets | 100.00 | % | | 16,179,777 | |
*Non-income producing security
See accompanying notes to financial statements
American Growth Fund, Inc. - Series One – Page 11
| | |
| How American Growth Fund, Inc. Series One | | |
| Has Its Shareholders' Money Invested | | |
| STATEMENT OF ASSETS AND LIABILITIES (unaudited) | | |
| January 31, 2019 (unaudited) | | |
| |
| | | Market |
| Description of Security | Shares | Value |
| |
| COMMON STOCK (continued) |

*Non-income producing security
See accompanying notes to financial statements.
American Growth Fund, Inc. - Series One – Page 12
| | | |
| Financial Statements | | | |
| AMERICAN GROWTH FUND, INC. SERIES ONE | | | |
| STATEMENTS OF ASSETS AND LIABILITIES, JANUARY 31, 2019 (unaudited) | | | |
| |
| ASSETS: | | | |
| Investments, at market value (cost $8,340,482) | $ | 15,997,552 | |
| Cash | | 93,822 | |
| Receivables: | | | |
| Shares of beneficial interest sold | | - | |
| Securities sold | | - | |
| Dividends and interest | | 11,476 | |
| Recoverable Tax | | 36 | |
| Other | | 130,275 | |
| Total assets | $ | 16,233,161 | |
| LIABILITIES: | | | |
| Payables: | | | |
| Shares of beneficial interest redeemed | | - | |
| Securities purchased | | - | |
| Other | | 11,525 | |
| 12b-1 fees | | 28,679 | |
| Management fee | | 13,180 | |
| Total liabilities | | 53,384 | |
| NET ASSETS | $ | 16,179,777 | |
| |
| COMPOSITION OF NET ASSETS: | | | |
| Paid-in capital | $ | 11,246,509 | |
| Accumulated net investment loss | | (246,864 | ) |
| Accumulated net realized loss from investment transactions | | (2,476,938 | ) |
| Net unrealized appreciation of investments | | 7,657,070 | |
| Net assets | $ | 16,179,777 | |
| |
| NET ASSET VALUE PER SHARE: | | | |
| |
| Class A Shares: | | | |
| Net asset value, redemption price and offering price per shares (based on net assets of $9,027,208 and | $ | 5.12 | |
| 1,761,780 shares of beneficial interest outstanding) | | | |
| Maximum offering price per share (net asset value plus sales charge of 5.75% of offering price) | $ | 5.43 | |
| |
| Class B Shares: | | | |
| Net asset value, redemption price and offering price per shares (based on net assets of $156,131 and 36,003 | $ | 4.34 | |
| shares of beneficial interest outstanding) | | | |
| |
| Class C Shares: | | | |
| Net asset value, redemption price and offering price per shares (based on net assets of $1,283,457 and | $ | 4.33 | |
| 296,315 shares of beneficial interest outstanding) | | | |
| |
| Class D Shares: | | | |
| Net asset value, redemption price and offering price per shares (based on net assets of $5,712,981 and | $ | 5.45 | |
| 1,047,392 shares of beneficial interest outstanding) | | | |
| Maximum offering price per share (net asset value plus sales charge of 5.75% of offering price) | $ | 5.78 | |
See accompanying notes to financial statements
American Growth Fund, Inc. - Series One – Page 13
| | | |
| Financial Statements | | | |
| AMERICAN GROWTH FUND, INC. SERIES ONE | | | |
| STATEMENTS OF OPERATIONS FOR THE SIX MONTHS ENDED JANUARY 31, 2019 (unaudited) | | | |
| |
| INVESTMENT INCOME: | | | |
| Dividends (Net of $0 foreign withholding tax) | $ | 114,478 | |
| Interest | | 88 | |
| Miscellaneous | | 100,708 | |
| Total investment income | $ | 215,274 | |
| |
| EXPENSES: | | | |
| Investment advisory fees (Note 4) | | 83,300 | |
| Administration expenses (Note 4) | | 87,741 | |
| Transfer agent, shareholder servicing and data processing fees | | 47,450 | |
| Accounting Fees | | 30,000 | |
| Rent expense (Note 4) | | 50,628 | |
| Custodian fees | | 4,263 | |
| Professional fees | | 69,399 | |
| Registration and filing fees (Note 1) | | 9,630 | |
| Shareholder reports | | 4,025 | |
| Distribution and service fees (Note 4): | | | |
| Class A | | 12,213 | |
| Class B | | 820 | |
| Class C | | 12,277 | |
| Directors fees (Note 4) | | 22,032 | |
| Other expenses | | 28,360 | |
| Total expenses | $ | (462,138 | ) |
| Net Investment Loss | $ | (246,864 | ) |
| |
| REALIZED AND UNREALIZED GAIN OR LOSS ON INVESTMENTS: | | | |
| Net realized gain on investments | | 1,058,028 | |
| Net change in unrealized appreciation on investments | | (1,307,847 | ) |
| Net loss on investments | | (249,819 | ) |
| Net decrease in net assets resulting from operations | | (496,683 | ) |
See accompanying notes to financial statements.
American Growth Fund, Inc. - Series One – Page 14
| | | | |
| Financial Statements | | | | |
| AMERICAN GROWTH FUND, INC. SERIES ONE | | | | |
| STATEMENT OF CHANGE | | | | |
| |
| | Six | | | |
| | Months Ended | | Year Ended | |
| | January 31, 2019 | | July 31, 2018 | |
| | (unaudited) | | | |
| INCREASE (DECREASE) IN NET ASSETS FROM OPERATIONS: | | | | |
| Net investment loss | (246,864 | ) | (685,742 | ) |
| Net realized gain on investments | 1,058,028 | | 1,395,178 | |
| Net change in unrealized appreciation on investments | (1,307,847 | ) | 496,652 | |
| Net increase in net assets resulting from operations | (496,683 | ) | 1,206,088 | |
| |
| BENEFICIAL INTEREST TRANSACTIONS: | | | | |
| Net increase (decrease) in net assets resulting form beneficial interest | | | | |
| transactions (Note 2): | | | | |
| Class A | 813,755 | | 80,600 | |
| Class B | (7,703 | ) | 10,214 | |
| Class C | (1,206,913 | ) | (297,120 | ) |
| Class D | (268,580 | ) | (502,058 | ) |
| Net change in net assets derived from beneficial interest transactions | (669,441 | ) | (708,364 | ) |
| Total increase (decrease) | (1,166,124 | ) | 497,724 | |
| Net Assets – Beginning of year | 17,345,901 | | 16,848,177 | |
| Net Assets – End of year | 16,179,777 | | 17,345,901 | |
| | | | |
See accompanying notes to financial statements.
American Growth Fund, Inc. - Series One – Page 15
| | | | | | | | | | | | | | | | | | |
| Financial Highlights | | | | | | | | | | | | | | | | | | |
| AMERICAN GROWTH FUND, INC. SERIES ONE | | | | | | | | | | | | | | | | | | |
| |
| Class A | | | | | | | | | | | | | | | | | | |
| | Six | | | | | | | | | | | | | | | | |
| | Month | | | | | | | | | | | | | | | | |
| | | Ended | | | Year Ended | | | | | | | | | | |
| | January 31 | | | July 31, | | | | | | | | | | | | | |
| | (unaudited) | | | | | | | | | | | | | | | | |
| | | 2019 | | | 2018 | | | 2017 | | | 2016 | | | 2015 | | | 2014 | |
| Per Share Operating Data: | | | | | | | | | | | | | | | | | | |
| Net Asset Value, | | | | | | | | | | | | | | | | | | |
| Beginning of Period | $ | 5.28 | | $ | 4.92 | | $ | 4.40 | | $ | 4.50 | | $ | 4.02 | | $ | 3.53 | |
| Income gain (loss) from investment operations: | | | | | | | | | | | | | | | | | | |
| Net investment loss 4 | | (0.08 | ) | | (0.21 | ) | | (0.22 | ) | | (0.18 | ) | | (0.16 | ) | | (0.13 | ) |
| Net realized and unrealized gain (loss) | | (0.08 | ) | | 0.57 | | | 0.74 | | | 0.08 | | | 0.64 | | | 0.62 | |
| Total income gain (loss) from investment | | | | | | | | | | | | | | | | | | |
| operations | | (0.16 | ) | | 0.36 | | | 0.52 | | | (0.10 | ) | | 0.48 | | | 0.49 | |
| Net Asset Value, End of Period | $ | 5.12 | | $ | 5.28 | | $ | 4.92 | | $ | 4.40 | | $ | 4.50 | | $ | 4.02 | |
| Total Return at Net Asset Value1 5 | | (3.0 | )% | | 7.3 | % | | 11.8 | % | | (9.2 | )% | | 8.9 | % | | 11.2 | % |
| Ratios/Supplemental Data: | | | | | | | | | | | | | | | | | | |
| Net assets, end of period (in thousands) | | 9,026 | | | 8,431 | | | 7,777 | | | 6,001 | | | 6,469 | | | 5,814 | |
| Ratio to average net assets: | | | | | | | | | | | | | | | | | | |
| Net investment loss4 | | (2.97 | )% | | (4.10 | )% | | (4.81 | )% | | (4.33 | )% | | (3.64 | )% | | (3.32 | )% |
| Expenses6 | | 5.50 | % | | 5.51 | % | | 6.37 | % | | 6.13 | % | | 5.30 | % | | 4.96 | % |
| Portfolio Turnover Rate2 | | 5 | % | | 11 | % | | 15 | % | | 3 | % | | 2 | % | | 8 | % |
| |
| |
| |
| Class B | | | | | | | | | | | | | | | | | | |
| | Six | | | | | | | | | | | | | | | | |
| | Month | | | | | | | | | | | | | | | | |
| | | Ended | | | Year Ended | | | | | | | | | | |
| | January 31 | | | July 31, | | | | | | | | | | | | | |
| | (unaudited) | | | | | | | | | | | | | | | | |
| | | 2019 | | | 2018 | | | 2017 | | | 2016 | | | 2015 | | | 2014 | |
| Per Share Operating Data: | | | | | | | | | | | | | | | | | | |
| Net Asset Value, | | | | | | | | | | | | | | | | | | |
| Beginning of Period | $ | 4.48 | | $ | 4.22 | | $ | 3.80 | | $ | 3.92 | | $ | 3.53 | | $ | 3.11 | |
| Income gain (loss) from investment operations: | | | | | | | | | | | | | | | | | | |
| Net investment loss 4 | | (0.08 | ) | | (0.33 | ) | | (0.22 | ) | | (0.18 | ) | | (0.17 | ) | | (0.14 | ) |
| Net realized and unrealized gain (loss) | | (0.06 | ) | | 0.59 | | | 0.64 | | | 0.06 | | | 0.56 | | | 0.56 | |
| Total income gain (loss) from investment | | | | | | | | | | | | | | | | | | |
| operations | | (0.14 | ) | | 0.26 | | | 0.42 | | | (0.12 | ) | | 0.39 | | | 0.42 | |
| Net Asset Value, End of Period | $ | 4.34 | | $ | 4.48 | | $ | 4.22 | | $ | 3.80 | | $ | 3.92 | | $ | 3.53 | |
| Total Return at Net Asset Value1 5 | | (3.1 | )%5 | | 6.2 | % | | 11.1 | % | | (3.1 | )% | | 11.0 | % | | 13.5 | % |
| Ratios/Supplemental Data: | | | | | | | | | | | | | | | | | | |
| Net assets, end of period (in thousands) | | 156 | | | 170 | | | 150 | | | 145 | | | 159 | | | 215 | |
| Ratio to average net assets: | | | | | | | | | | | | | | | | | | |
| Net investment loss4 | | (3.61 | )% | | (7.60 | )% | | (5.51 | )% | | (5.02 | )% | | (4.34 | )% | | (4.05 | )% |
| Expenses6 | | 8.58 | %6 | | 8.95 | % | | 7.07 | % | | 6.82 | % | | 6.01 | % | | 5.69 | % |
| Portfolio Turnover Rate2 | | 5 | % | | 11 | % | | 15 | % | | 3 | % | | 2 | % | | 8 | % |
1. Assumes a hypothetical initial investment on the business day before the first day of the fiscal period with all dividends and distributions reinvested
in additional shares on the reinvestment date and redemption at the net asset value calculated on the last business day of the fiscal period. Sales
charges are not reflected in total returns.
2. The lesser of purchases and sales of portfolio securities for a period, divided by the monthly average of the market value of securities owned during
the period. Securities with a maturity or expiration date at the time of acquisition of one year or less are excluded from the calculation. Purchases and
sales of investment securities (other than short-term securities) for the six months ended January 31, 2019, aggregated $853,990 and $1,865,669,
respectively.
3. Amount less than 0.5%.
4. Per share amounts have been calculated using the Average Shares Method
5. Total Return at Net Asset Value for the Six Months Ended Calculation has not been annualized.
6. Expenses for the Six Months Ended Calculation has been annualized.
See accompanying notes to financial statements.
American Growth Fund, Inc. - Series One – Page 16
| | | | | | | | | | | | | | | | | | |
| Financial Highlights | | | | | | | | | | | | | | | | | | |
| AMERICAN GROWTH FUND, INC. SERIES ONE | | | | | | | | | | | | | | | | | | |
| |
| Class C | | | | | | | | | | | | | | | | | | |
| | Six | | | | | | | | | | | | | | | | |
| | Month | | | | | | | | | | | | | | | | |
| | | Ended | | | Year Ended | | | | | | | | | | |
| | January 31 | | | July 31, | | | | | | | | | | | | | |
| | (unaudited) | | | | | | | | | | | | | | | | |
| | | 2019 | | | 2018 | | | 2017 | | | 2016 | | | 2015 | | | 2014 | |
| Per Share Operating Data: | | | | | | | | | | | | | | | | | | |
| Net Asset Value, | | | | | | | | | | | | | | | | | | |
| Beginning of Period | $ | 4.47 | | $ | 4.20 | | $ | 3.79 | | $ | 3.90 | | $ | 3.51 | | $ | 3.10 | |
| Income gain (loss) from investment operations: | | | | | | | | | | | | | | | | | | |
| Net investment loss 4 | | (0.08 | ) | | (0.20 | ) | | (0.22 | ) | | (0.18 | ) | | (0.16 | ) | | (0.13 | ) |
| Net realized and unrealized gain (loss) | | (0.06 | ) | | 0.47 | | | 0.63 | | | 0.07 | | | 0.55 | | | 0.54 | |
| Total income gain (loss) from investment | | | | | | | | | | | | | | | | | | |
| operations | | (0.14 | ) | | 0.27 | | | 0.41 | | | (0.11 | ) | | 0.39 | | | 0.41 | |
| Net Asset Value, End of Period | $ | 4.33 | | $ | 4.47 | | $ | 4.20 | | $ | 3.79 | | $ | 3.90 | | $ | 3.51 | |
| Total Return at Net Asset Value1 5 | | (3.1 | )%5 | | 6.4 | % | | 10.8 | % | | (2.8 | )% | | 11.1 | % | | 13.2 | % |
| Ratios/Supplemental Data: | | | | | | | | | | | | | | | | | | |
| Net assets, end of period (in thousands) | | 1,283 | | | 2,593 | | | 2,720 | | | 2,697 | | | 2,753 | | | 2,460 | |
| Ratio to average net assets: | | | | | | | | | | | | | | | | | | |
| Net investment loss4 | | (3.61 | )% | | (4.60 | )% | | (5.51 | )% | | (5.02 | )% | | (4.34 | )% | | (4.02 | )% |
| Expenses6 | | 6.42 | %6 | | 5.91 | % | | 7.07 | % | | 6.82 | % | | 6.00 | % | | 5.66 | % |
| Portfolio Turnover Rate2 | | 5 | % | | 11 | % | | 15 | % | | 3 | % | | 2 | % | | 8 | % |
| |
| |
| |
| Class D | | | | | | | | | | | | | | | | | | |
| | Six | | | | | | | | | | | | | | | | |
| | Month | | | | | | | | | | | | | | | | |
| | | Ended | | | Year Ended | | | | | | | | | | |
| | January 31 | | | July 31, | | | | | | | | | | | | | |
| | (unaudited) | | | | | | | | | | | | | | | | |
| | | 2019 | | | 2018 | | | 2017 | | | 2016 | | | 2015 | | | 2014 | |
| Per Share Operating Data: | | | | | | | | | | | | | | | | | | |
| Net Asset Value, | | | | | | | | | | | | | | | | | | |
| Beginning of Period | $ | 5.61 | | $ | 5.21 | | $ | 4.65 | | $ | 4.74 | | $ | 4.23 | | $ | 3.69 | |
| Income gain (loss) from investment operations: | | | | | | | | | | | | | | | | | | |
| Net investment loss 4 | | (0.07 | ) | | (0.19 | ) | | (0.22 | ) | | (0.18 | ) | | (0.20 | ) | | (0.17 | ) |
| Net realized and unrealized gain (loss) | | (0.09 | ) | | 0.59 | | | 0.78 | | | 0.09 | | | 0.71 | | | 0.71 | |
| Total income gain (loss) from investment | | | | | | | | | | | | | | | | | | |
| operations | | (0.16 | ) | | 0.40 | | | 0.56 | | | (0.09 | ) | | 0.51 | | | 0.54 | |
| Net Asset Value, End of Period | $ | 5.45 | | $ | 5.61 | | $ | 5.21 | | $ | 4.65 | | $ | 4.74 | | $ | 4.23 | |
| Total Return at Net Asset Value1 5 | | 2.9 | %5 | | 7.7 | % | | 12.0 | % | | (1.9 | )% | | 11.1 | % | | 14.6 | % |
| Ratios/Supplemental Data: | | | | | | | | | | | | | | | | | | |
| Net assets, end of period (in thousands) | | 5,712 | | | 6,153 | | | 6,200 | | | 6,087 | | | 6,590 | | | 6,468 | |
| Ratio to average net assets: | | | | | | | | | | | | | | | | | | |
| Net investment loss4 | | (2.68 | )% | | (3.51 | )% | | (4.51 | )% | | (4.03 | )% | | (3.34 | )% | | (3.02 | )% |
| Expenses6 | | 5.17 | %6 | | 4.83 | % | | 6.07 | % | | 5.83 | % | | 5.00 | % | | 4.65 | % |
| Portfolio Turnover Rate2 | | 5 | % | | 11 | % | | 15 | % | | 3 | % | | 2 | % | | 8 | % |
1. Assumes a hypothetical initial investment on the business day before the first day of the fiscal period with all dividends and distributions reinvested
in additional shares on the reinvestment date and redemption at the net asset value calculated on the last business day of the fiscal period. Sales
charges are not reflected in total returns.
2. The lesser of purchases and sales of portfolio securities for a period, divided by the monthly average of the market value of securities owned during
the period. Securities with a maturity or expiration date at the time of acquisition of one year or less are excluded from the calculation. Purchases and
sales of investment securities (other than short-term securities) for the six months ended January 31, 2019, aggregated $853,990 and $1,865,669,
respectively.
3. Amount less than 0.5%.
4. Per share amounts have been calculated using the Average Shares Method
5. Total Return at Net Asset Value for the Six Months Ended Calculation has not been annualized.
6. Expenses for the Six Months Ended Calculation has been annualized.
See accompanying notes to financial statements.
American Growth Fund, Inc. - Series One – Page 17
This page intentionally left blank
American Growth Fund, Inc. - Series One – Page 18
Notes to Financial Statements
American Growth Fund, Inc. Series One (unaudited)
1. Summary of Significant Accounting Policies
American Growth Fund, Inc. Series One (the "Fund") is registered under the Investment Company Act of 1940, as amended, as a diversified, open-end management investment company. The Fund is an investment company and accordingly follows the investment company accounting and reporting guidance of the Financial Accounting Standards Board Accounting Standards Codification Topic 946 “Financial Services – Investment Companies.” The Fund's primary investment objective is growth of capital. The Fund's investment advisor is Investment Research Corporation (IRC). The Fund offers Class A, Class B, Class C and Class D shares. Class D shares are available to shareholders of accounts established prior to March 1, 1996. Class A and Class D have a maximum sales charge (load) imposed on purchases (as a percentage of offering price) of 5.75%. Purchases of Class A and Class D shares in amounts of $1,000,000 or more which are not subject to an initial sales charge generally will be subject to a contingent deferred sales charge of 1.0% of amounts redeemed within the first year of purchase. Class B has a maximum deferred sales charge (Contingent Deferred Sales Charge) as a percentage of original purchase price or redemption proceeds, whichever is lower, for the first 2 years of 5%, 3rd & 4th years - 4%, 5th yr. - 3%, 6th yr. - 2%, 7th yr. - 1%. Class C has a maximum deferred sales charge as a percentage of original purchase price or redemption proceeds, whichever is lower, of 1% for the first year. All classes of shares have identical rights to earnings, assets and voting privileges, except that each class has its own distribution and/or service plan and expenses directly attributable to that class and exclusive voting rights with respect to matters affecting that class. Class B and Class C shares will automatically convert to Class A shares seven years after date of purchase. The following is a summary of significant accounting policies consistently followed by the Fund.
Reclassifications - Accounting principles generally accepted in the United States of America require that certain components of net assets be reclassified between financial and tax reporting. These reclassifications have no effect on net assets or net asset value per share.
For the year ended July 31, 2018, the following reclassifications were made:
| | | | | | |
| | Accumulated | | Accumulated | | | |
| | Net Investment | | Net Realized | | Paid-In | |
| | Loss | | Loss | | Capital | |
| $ | 685,742 | $ | 5,265,634 | $ | (5,951,376 | ) |
Investment Valuation – Investment securities traded on the New York Stock Exchange or other stock exchange approved for this purpose by the board of directors will be valued on the basis of the closing sale thereof on such stock exchange, or, if such sale is lacking, at the mean between closing bid and asked prices on such day. If no bid and asked prices are quoted for such day or information as to New York or other approved exchange transactions is not readily available, the security will be valued by reference to recognized composite quotations or such other method as the board of directors in good faith deems will reflect its fair market value. Securities not traded on any stock exchange but for which market quotations are readily available are valued on the basis of the mean of the last bid and asked prices. Short-term securities are valued at the mean between the closing bid and asked prices or by such other method as the board of directors determines to reflect their fair market value. The board of directors in good faith determines the manner of ascertaining the fair market value of other securities and assets.
Allocation of Income, Expenses, Gains and Losses - Income, expenses (other than those attributable to a specific class), gains and losses are allocated daily to each class of shares based upon the relative proportion of net assets represented by such class. Operating expenses directly attributable to a specific class are charged against the operations of that class.
Federal Income Taxes - No provision for federal income or excise taxes has been made because the Fund intends to comply with the provisions of subchapter M of the Internal Revenue Code applicable to regulated investment companies and to distribute all of its taxable income to shareholders. The Fund recognizes the tax benefits of uncertain tax positions only where the position is "more likely than not" to be sustained assuming examination by tax authorities. Management has analyzed the Fund’s tax positions, and has concluded that no liability for unrecognized tax benefits should be recorded related to uncertain tax positions taken on returns filed for open tax years (2015-2017), or expected to be taken in the Fund's 2018 tax returns. The Fund identifies its major tax jurisdictions as U.S. Federal, Colorado State and foreign jurisdictions where the Fund makes significant investments; however the Fund is not aware of any tax positions for which it is reasonably possible that the total amounts of unrecognized tax benefits will change materially in the next twelve months.
Classification of Distributions to Shareholders - The character of distributions made during the year from net investment income or net realized gains may differ from its ultimate characterization for federal income tax purposes. Also, due to timing of dividend distributions, the fiscal year in which amounts are distributed may differ from the fiscal year in which the income or realized gain was recorded by the Fund.
Security Transactions and Related Investment Income - Investment transactions are accounted for on the date the investments are purchased or sold (trade date). Dividend income and distributions to shareholders are recorded on the ex-dividend date. Interest income is recorded on the accrual basis. Realized gains and losses from investment transactions are reported on an identified cost basis which is the same basis used for federal income tax purposes.
Use of Estimates - The preparation of financial statements in conformity with accounting principles generally accepted in the United States requires management to make estimates and assumptions that affect the reported amounts of assets and liabilities and disclosure of contingent assets and liabilities at the date of the financial statements and the reported amounts of increases and decreases in net assets from operations during the reporting period. Actual results could differ from those estimates.
Securities Valuations – As described in note 1, the Fund utilizes various methods to measure the fair value of most of its investments on a recurring basis. U.S. GAAP establishes a hierarchy that prioritizes inputs to valuation methods. The three levels of inputs are:
Level 1 – Unadjusted quoted prices in active markets for identical assets or liabilities that the Fund has the ability to access.
Level 2 – Observable inputs other than quoted prices included in level 1 that are observable for the asset or liability, either directly or indirectly. These inputs may include quoted prices for the identical instrument on an inactive market, prices for similar instruments, interest rates, prepayment speeds, credit risk, yield curves, default rates and similar data.
Level 3 – Unobservable inputs for the asset or liability, to the extent relevant observable inputs are not available, representing the Fund’s own assumptions about the assumptions a market participant would use in valuing the asset or liability, and would be based on the best information available.
The availability of observable inputs can vary from security to security and is affected by a wide variety of factors, including, for example, the type of security, whether the security is new and not yet established in the marketplace, the liquidity of markets, and other characteristics particular to the security. To the extent that valuation is based on models or inputs that are less observable or unobservable in the market, the determination of fair value requires more judgment. Accordingly, the degree of judgment exercised in determining fair value is greatest for instruments categorized in level 3.
The inputs used to measure fair value may fall into different levels of the fair value hierarchy. In such cases, for disclosure purposes, the level in the fair value hierarchy within which the fair value measurement falls in its entirety, is determined based on the lowest level input that is significant to the fair value measurement in its entirety.
Semi-Annual Report for the six months ended January 31, 2019
American Growth Fund, Inc. - Series One – Page 19
Notes to Financial Statements
American Growth Fund, Inc. Series One (unaudited)
The following is a summary of the inputs used, as of January 31, 2019, in valuing the Fund’s assets carried at fair value:
| | | | | | |
| Equity | | Level 1 | Level 2 | Level 3 | | Total |
| Common Stock | $ | 15,997,552 | 0 | 0 | $ | 15,997,552 |
The industry classifications of Level 1 investments are included in the Statement of Investments. There were no transfers in to or out of Level 1 or Level 2 for the six months ended January 31, 2019. Transfers between levels are recognized at the end of the reporting period.
2. Shares of Beneficial Interest
The Fund has authorized an unlimited number of no par value shares of beneficial interest of each class. Transactions in shares of beneficial interest were as follows:
| | | | | | | | | | |
| | | | | Six | | | | | | |
| | Months Ended | | Year Ended | |
| | January 31, 2019 | | July 31, 2018 | |
| | | | | (unaudited) | | | | | | |
| | Shares | | | Amount | | Shares | | | Amount | |
| Class A: | | | | | | | | | | |
| Sold | 283,215 | | $ | 1,429,581 | | 214,654 | | $ | 1,104,489 | |
| Dividends and distributions | | | | | | | | | | |
| reinvested | - | | | - | | - | | | - | |
| Redeemed | (119,300 | ) | $ | (615,826 | ) | (197,956 | ) | $ | (1,023,889 | ) |
| Net increase (decrease) | 163,915 | | $ | 813,755 | | 16,698 | | $ | 80,600 | |
| Class B: | | | | | | | | | | |
| Sold | 240 | | $ | 1,023 | | 6,329 | | $ | 28,377 | |
| Dividends and distributions | | | | | | | | | | |
| reinvested | - | | | - | | - | | | - | |
| Redeemed | (2,125 | ) | $ | (8,726 | ) | (4,087 | ) | $ | (18,162 | ) |
| Net decrease | (1,885 | ) | | (7,703 | ) | 2,242 | | | 10,215 | |
| Class C: | | | | | | | | | | |
| Sold | 20,077 | | | 87,347 | | 53,854 | | | 241,970 | |
| Dividends and distributions | | | | | | | | | | |
| reinvested | - | | | - | | - | | | - | |
| Redeemed | (303,344 | ) | | (1,294,260 | ) | (121,884 | ) | | (539,090 | ) |
| Net decrease | (283,267 | ) | | (1,206,913 | ) | (68,030 | ) | | (297,120 | ) |
| Class D: | | | | | | | | | | |
| Sold | 404 | | | 2,194 | | 19,561 | | | 104,339 | |
| Dividends and distributions | | | | | | | | | | |
| reinvested | - | | | - | | - | | | - | |
| Redeemed | (50,117 | ) | | (270,774 | ) | (111,878 | ) | | (606,398 | ) |
| Net decrease | (49,713 | ) | | (268,580 | ) | (92,317 | ) | | (502,059 | ) |
| |
| 3. Realized and Unrealized Gains and Losses on Investments (unaudited) | | | | | | |
The identified tax cost basis of investments at January 31, 2019 was $8,340,482. Net unrealized appreciation on investments of $7,657,070, based on identified tax cost as of January 31, 2019, was comprised of gross appreciation of $7,802,668 and gross depreciation of $(145,598). The difference between book-basis and tax-basis unrealized appreciation is attributed primarily to the tax deferral of losses on wash sales.
4. Underwriting, Investment Advisory Contracts, Service Fees and Other Related Parties (unaudited)
Under the investment advisory contract with IRC, the advisor receives annual compensation for investment advice, computed and paid monthly, equal to 1% of the first $30 million of the Fund's average annual net assets and 0.75% such assets in excess of $30 million. The Fund pays its own operating expenses.
Class B and Class C shares each are subject to annual service and distribution fees of 1.00% of average daily net assets. Class A shares are subject to annual service and distribution fees no greater than 0.30% of average daily net assets.
For the six months ended January 31, 2019 commissions and sales charges paid by investors on the purchase of Fund shares totaled $12,275 of which $1,773 was retained by World Capital Brokerage, Inc. ("WCB"), an affiliated broker/dealer which serves as the underwriter and distributor of the Fund. Sales charges advanced to broker/dealers by WCB on sales of the Fund's Class B and C shares totaled $889 of which $0 was retained by WCB. For the six months ended January 31, 2019, WCB received contingent deferred sales charges of $544 upon redemption of Class B and C shares, as reimbursement for sales commissions advanced by WCB upon the sale of such shares. No payments were made by the Fund to WCB for brokerage commission on securities transactions.
Certain officers of the Fund are also officers of WCB and IRC. For the six months ended January 31, 2019, the Fund paid directors' fees of $22,032, expenses of $93, and the audit chair $5,007 for review.
For the six months ended January 31, 2019, under an agreement with IRC, the Fund was charged $87,741 for the costs and expenses related to employees of IRC who provided administrative, clerical and accounting services to the Fund. In addition, the Fund was charged $50,628 by an affiliated company of IRC for the rental of office space.
American Growth Fund, Inc. - Series One – Page 20
Semi-Annual Report for the six months ended January 31, 2019
Notes to Financial Statements
American Growth Fund, Inc. Series One (unaudited)
5. Federal Income Tax Matters
Dividends paid by the Fund from net investment income and distributions of net realized short-term capital gains are, for federal income tax purposes, taxable as ordinary income to shareholders.
At July 31, 2018, the Fund had available for federal income tax purposes an unused capital loss carryover of $3,267,445, which expires 2019. The Fund utilized $1,279,919 of capital loss carryover. $5,265,635 of unused capital loss carryover expired July 31, 2018.
The Fund distributes net realized capital gains, if any, to its shareholders at least annually, if not offset by capital loss carryovers. Income distributions and capital gain distributions are determined in accordance with income tax regulations, which may differ from accounting principles generally accepted in the United States of America. These differences are primarily due to the differing treatment of net operating losses, foreign currency tax allocations. Accordingly, these permanent differences in the character of income and distributions between financial statements and tax basis have been reclassified to paid-in capital.
Net capital losses incurred after October 31, within the taxable year are deemed to arise on the first business day of the Fund’s next taxable year.
As of July 31, 2018 the components of accumulated gains on a tax-basis were as follows:
| | |
| Capital loss carry forward | (3,267,445 | ) |
| Unrealized appreciation | 8,697,397 | |
| | 5,429,952 | |
6. Subsequent Events
In preparing these financial statements, the Fund has evaluated events and transactions for potential recognition or disclosure through the date these financial statements were issued.
7. Review of Affiliated Company’s Expenses (unaudited) – The Trust’s Audit Committee reviews, on a monthly and quarterly basis, the details of each expense incurred by the Trust in order to determine the appropriateness. These expense are then presented to the Trust’s Board of Directors for review and approval at the next quarterly Board Meeting.
For the six months ended January 31, 2019 the Trust paid to its affiliated companies, World Capital Brokerage, Inc. $37,341, Investment Research Corporation $91,442, and AGF Properties, Inc. $77,671 for services they provided to the Trust and its shareholders. These payments resulted in these affiliated companies earning profit or losses totaling World Capital Brokerage, Inc. $3,436, Investment Research Corporation $(45,631), and AGF Properties, Inc. $(13,827).
Semi-Annual Report for the six months ended January 31, 2019
American Growth Fund, Inc. - Series One – Page 21
Analysis of Expenses (unaudited)
As a shareholder of the Fund, you may incur two types of costs: (1) transaction costs, including front-end sales charges with respect to Class A and D shares or contingent deferred sales charges ("CDSC") with respect to Class B and C shares; and (2) ongoing costs, including management fees; distribution and/or service (12b-1) fees; and other Fund expenses. The tables below are intended to help you understand your ongoing costs (in dollars) of investing in the Fund and to compare these costs with the ongoing costs of investing in other mutual funds.
The tables below are based on an investment of $1,000 invested on August 1, 2018 and held for the six months ended January 31, 2019.
Actual expenses (unaudited)
This table provides information about actual account values and actual expenses. You may use the information provided in this table, together with the amount you invested, to estimate the expenses that you paid over the period. To estimate the expenses you paid on your account, divide your ending account value by $1,000 (for example, an $8,600 ending account value divided by $1,000 = 8.6), then multiply the result by the number under the heading entitled "Expenses Paid During the Period".
| | | | | | | | |
| For the six months ended January 31, 2019 | | | | |
| |
| | Actual | | | | | | | |
| | Total Return | | | | | | | |
| | Without | | | Beginning | | Ending | | Expenses |
| | Sales | | | Account | | Account | | Paid During |
| | Charges(1) | | | Value | | Value | | The Period(2) |
| Class A | (3.03 | )% | $ | 1,000.00 | $ | 913.94 | $ | 51.84 |
| Class B | (3.13 | )% | $ | 1,000.00 | $ | 968.70 | $ | 85.80 |
| Class C | (3.13 | )% | $ | 1,000.00 | $ | 968.70 | $ | 64.20 |
| Class D | (2.85 | )% | $ | 1,000.00 | $ | 915.64 | $ | 48.73 |
(1) Assumes reinvestment of all dividends and capital gain distributions, if any, at net asset value and does not reflect the deduction of the applicable sales charges with respect to Class A or D shares or the applicable Contingent Deferred Sales Charges ("CDSC") with respect to Class B or C Shares.
(2) Expenses are equal to the annualized expense ratio of 5.50%, 8.58%, 6.42% and 5.17% for the Fund’s Class A, B, C, and D shares, respectively, multiplied by the average account value over the period multiplied by 184/365 (to reflect the one-half year period).
Hypothetical example for comparison purposes (unaudited)
The table below provides information about hypothetical account values and hypothetical expenses based on the actual expense ratio and an assumed rate of return of 5.00% per year before expenses, which is not the Fund's actual return. The hypothetical account values and expenses may not be used to estimate the actual ending account balance or expenses you paid for the period. You may use the information provided in this table to compare the ongoing costs of investing in the Fund and other mutual funds. To do so, compare this 5.00% hypothetical example relating to the Fund with the 5.00% hypothetical examples that appear in the shareholder reports of other mutual funds.
Please note that the expenses shown in the table below are meant to highlight your ongoing costs only and do not reflect any transactional costs. The example does not reflect the deduction of contingent deferred sales charges ("CDSC") with respect to Class B and C shares. Therefore, the table is useful in comparing ongoing costs only, and will not help you determine the relative total costs of owning different mutual funds. In addition, if these transaction costs were included, your costs would have been higher.
| | | | | | | | |
| For the six months ended January 31, 2019 | | | | |
| |
| | Hypothetical | | | | | | | |
| | Annualized | | | Beginning | | Ending | | Expenses |
| | Total | | | Account | | Account | | Paid Expenses |
| | Return | | | Value | | Value | | The Period(1) |
| Class A | 5.00 | % | $ | 1,000.00 | $ | 989.63 | $ | 51.84 |
| Class B | 5.00 | % | $ | 1,000.00 | $ | 1,050 | $ | 85.80 |
| Class C | 5.00 | % | $ | 1,000.00 | $ | 1,050 | $ | 64.20 |
| Class D | 5.00 | % | $ | 1,000.00 | $ | 9989.63 | $ | 48.73 |
(1) Expenses are equal to the annualized expense ratio 5.50%, 8.58%, 6.42% and 5.17% for the Fund’s Class A, B, C, and D shares, respectively, multiplied by the average account value over the period multiplied by 184/365 (to reflect the one-half year period).
American Growth Fund, Inc. - Series One – Page 22
Semi-Annual Report for the six months ended January 31, 2019
Allocation of Portfolio Assets (unaudited)
(Calculated as a percentage of Net Assets)
January 31, 2019 (unaudited)
Sector Breakdown
| | |
| Computer Software and Services | 11.04 | % |
| Diversified Company | 10.24 | % |
| Biotechnology | 8.17 | % |
| Machinery | 6.54 | % |
| Semiconductor Capital Equipment | 6.48 | % |
| Computer & Peripherals | 5.97 | % |
| Cable TV | 4.83 | % |
| Environmental | 3.84 | % |
| Semiconductor | 3.82 | % |
| Online Media | 3.81 | % |
| Railroad | 3.51 | % |
| Communication Services | 2.52 | % |
| Drug | 2.14 | % |
| Retail - Apparel & Specialty | 2.04 | % |
| Application Software | 2.01 | % |
| Computer Hardware | 1.96 | % |
| Exchange Traded Funds | 1.79 | % |
| Chemicals | 1.71 | % |
| Insurance (Property and Causality) | 1.44 | % |
| Transportation & Logistics | 1.44 | % |
| Banks | 1.37 | % |
| Home Improvement Stores | 1.29 | % |
| Farm & Construction Machinery | 1.21 | % |
| Retail Store | 1.18 | % |
| Restaurants | 1.16 | % |
| Aerospace & Defense | 1.13 | % |
| Travel & Leisure | 1.11 | % |
| Entertainment | 1.08 | % |
| Industrial Products | 0.89 | % |
| Business Services | 0.72 | % |
| Health Care Providers | 0.65 | % |
| Steel | 0.64 | % |
| Health Care Plans | 0.63 | % |
| Residential Construction | 0.51 | % |
| |
| Investments – Common Stocks | 98.87 | % |
| Cash and Receivables, less Liabilities | 1.13 | % |
| Total Net Assets | 100.00 | % |
NOTICE TO SHAREHOLDERS at July 31, 2018 (Unaudited)
How to Obtain a Copy of the Fund’s Proxy Voting Policies
A description of the policies and procedures that the Fund uses to determine how to vote proxies relating to portfolio securities is available without charge upon request by calling 1-800-525-2406 or on the SEC’s website at http://www.sec.gov.
How to Obtain a Copy of the Fund’s Proxy Voting Records for the 12-Month Period Ended June 30, 2018
Information regarding how the Fund voted proxies relating to portfolio securities during the most recent 12-month period ended June 30 is available without charge, upon request, by calling 1-800-525-2406. Furthermore, you can obtain the Fund’s proxy voting records on the SEC’s website at http://www.sec.gov.
Quarterly Filings on Form N-Q
The Fund files its complete schedule of portfolio holdings with the SEC for the first and third quarters of each fiscal year on Form N-Q. The Fund’s Form N-Q is available on the SEC’s website at http://www.sec.gov. The Fund’s Form N-Q may be reviewed and copied at the SEC’s Public Reference Room in Washington, DC and information on the operation of the Public Reference Room may be obtained by calling 1-800-SEC-0330. Information included in the Fund’s Form N-Q is also available by calling 1-800-525-2406.
Beginning April 30, 2020, the Fund will cease to disclose its holdings on Form N-Q. Monthly portfolio disclosures will be filed with the SEC on Form N-PORT no later than 60 days after the end of each fiscal quarter. The monthly holdings reports on Form N-PORT for the first and second months of the fiscal quarter will remain non-public and the monthly holdings report for the third month of the fiscal quarter will become publicly available upon filing (with the exception of certain items).
Semi-Annual Report for the six months ended January 31, 2019
American Growth Fund, Inc. - Series One – Page 23
INFORMATION ABOUT TRUSTEES AND OFFICERS (Unaudited)
The day-to-day operations of the Fund are managed by its officers subject to the overall supervision and control of the board of directors. The Fund´s Audit Committee meets quarterly and is responsible for reviewing the financial statements of the Fund. The following information about the interested directors2 of the Fund includes their principal occupations for the past five years:
| | | | | |
| | | | | Number of | |
| | | Term of Office1 and | Principal | | Other Directorships |
| | Position(s) Held | | | Portfolios in Fund | |
| Name, Address, and Age | | Length of Time | Occupation(s) | | Held by Director for |
| | with Fund | | | Complex Overseen | |
| | | Served | During Past 5 Years | | the Past Five Years |
| | | | | by Director | |
| |
| | | | Principal financial | | |
| |
| Timothy E. Taggart, 1636 | | | and accounting | | Director of World |
| | | | officer, employee of | | Capital Brokerage, |
| Logan Street, Denver, | President, Director | Since April 2004 | Adviser since 1983. | 2 | Inc. and Investment |
| CO | and Treasurer | | See below for | | Research |
| DOB: October 18, 1953 | | | affiliation with | | Corporation |
| | | | Distributor. | | |
The following information about the non-interested directors, officers and advisors of the Fund includes their principal occupations for the past five years:
| | | | | |
| | | | | Number of | Other |
| | | Term of | Principal | Portfolios in Fund Directorships |
| Age Name, Address, and | with Position(s) Fund Held | Length Office1 and of Time | During Occupation(s) Past 5 | Complex | Held by Director |
| | | | | Overseen by | for the Past Five |
| | | Served | Years | Director | Years |
| | Director, Audit | | | | |
| Eddie R. Bush, 1400 | Committee | | | | |
| W. 122nd Ave., Suite | Chairman | Since September | Certified Public | | |
| 100, Westminster, CO | | | | 2 | None |
| | (financial expert), | 1987 | Accountant | | |
| DOB: December 31, | Lead Independent | | | | |
| 1939 | Director | | | | |
| Darrell E. Bush, 2714 | | | | | |
| West 118th Ave, | | Since September | | | |
| Westminster, CO | Director | | Accountant | 2 | None |
| DOB: February 19, | | 2013 | | | |
| 1971 | | | | | |
| |
| Michael L. Gaughan, | | | | | World Capital |
| | Chief Compliance | | | | Brokerage, Inc. |
| 2001 Avenue D, | | Since September | Employee of the | | |
| | Officer and | | | N/A | and Investment |
| Scottsbluff, NE DOB: | | 2004 | Fund since 1995. | | |
| November 29, 1967 | Secretary | | | | Research |
| | | | | | Corporation |
| Patricia A. Blum, 1636 | | | | | |
| Logan Street, Denver, | | | Employee of the | | World Capital |
| | Vice President | Since June 2013 | | N/A | |
| CO DOB: June 27, | | | Fund since 2001. | | Brokerage, Inc. |
| 1959 | | | | | |
1. Trustees and officers of the fund serve until their resignation, removal or retirement.
2. Timothy Taggart is an "interested person” of the Fund as defined by the Investment Company Act of 1940 because of the following position which he holds.
Timothy Taggart is the sole shareholder, president and a director of Investment Research Corporation. He is also president and a director of World Capital Brokerage, Inc., the Distributor.
None of the above named persons received any retirement benefits or other form of deferred compensation from the Fund. There are no other funds that together with the Fund constitute a Fund Complex.
The Fund's Statement of Additional Information includes additional information about the Fund's trustees, and is available without charge upon request by calling 1-800-525-2406.
American Growth Fund, Inc. - Series One – Page 24
Semi-Annual Report for the six months ended January 31, 2019
BOARD APPROVAL OF INVESTMENT ADVISORY AGREEMENT (Unaudited)
Meeting of the Board of Directors Held on October 18, 2018
At a regular meeting of the Board of Directors (the “Board”) held on October 18, 2018 (the “meeting”), the Board, assisted by legal
counsel representing the Fund and the Independent Directors, including a majority of the Directors who are not interested persons
of the Board (the “Independent Directors”), considered the approval for another year of the investment advisory agreement (the
“Agreement”) between Investment Research Corporation (the “Adviser”) and American Growth Fund, Inc. (the “Fund”) for Series One
and Series Two.
In connection with its review and approval of the Agreement for another year at the Meeting, the Independent Directors present
considered materials furnished by the Adviser, including information about, but not limited to, the Adviser’s personnel, operations and
financial condition. The Independent Directors also submitted questions to the Adviser prior to the Meeting. At the Meeting,
representatives from the Adviser, presented information to the Board regarding the Adviser and the Series One Fund, discussed with
the Independent Directors all information provided, and responded to questions from the Board.
Matters considered by the Board, including the Independent Directors, at the Meeting in connection with its re-approval of the
Agreement included the following:
Performance. The Board reviewed each Fund’s investment performance reports, which compared the performance of each
Fund with several other mutual funds with generally similar investment strategies, at least in part, over various time periods, as well
as with relevant benchmarks, and discussed these reports with representatives of the Adviser. The Board considered each Fund’s
comparative performance over short-term and longer-term time periods, noting that Series One generally underperformed its peer
group average performance over the one-year, five-year and ten-year periods and that Series Two generally outperformed its peer
group average performance over the one-year and underperformed its peer group average performance over the five-year and ten-
year periods.
Costs of Services and Profitability. The Board reviewed and considered the contractual annual advisory fee paid by each
Fund to the Adviser, in light of the extent and quality of the advisory services provided by the Adviser to the Fund. The Board
received and considered information including a comparison of the Fund’s contractual advisory fee rate with those of peer funds. The
Board also reviewed and considered the total expense ratio for each Series, alongside comparative total expense ratio information
for peer funds. In doing so, the Board also considered the relative size of each series compared to the peer funds.
In addition, the Board, including the Independent Directors, specifically considered the profits realized by the Adviser and its
affiliates, based in part on the Adviser financial information presented at the meeting and information regarding amounts paid to the
Adviser and its affiliates.
Nature, Extent, and Quality of the Services under the Investment Advisory Agreement: The Board received and
considered information regarding the nature, extent, and quality of services provided to each Series under the Agreement. The
Trustees reviewed certain background materials supplied by the Adviser in its presentation, including its Form ADV.
The Board reviewed and considered the Adviser’s investment advisory personnel, its history as an asset manager, and its
performance and the amount of assets currently under management by the Adviser and its affiliated entities. The Board also
reviewed the research and decision-making processes utilized by the Adviser, including the methods adopted to seek to achieve
compliance with the investment objectives, and policies of each Series.
The Board considered the background and experience of the Adviser’s management in connection with the Fund, including
reviewing the qualifications, backgrounds, and responsibilities of the parties primarily responsible for the day-to-day portfolio
management of each Series and the extent of the resources devoted to research and analysis of actual and potential investments.
Economies of Scale. After discussion, it was the consensus of the Board and the Independent Directors that the Fund had
not reached an asset level where any material economies of scale were being realized by the Adviser that could be shared with the
Fund. The Board specifically noted the existence of the “break point” on advisory fees in the Agreement. The Board noted that the
Adviser does not have any soft dollar arrangements.
Other Benefits to the Adviser: The Board reviewed and considered any other incidental benefits derived or to be derived by
the Adviser from its relationship with the Fund.
In reviewing the factors above, the Board concluded that no single factor was identified by the Directors to be determinative
as the principal factor in whether to renew the Agreement. The Board concluded that:
(1) The nature and quality of services provided to each Series and its shareholders by IRC were reasonable and adequate;
(2) The profitability of IRC and its affiliates from their relationships with each Series was not unreasonable with respect to
each Series;
(3) There were no material economies of scale or other incidental benefits accruing to the Adviser in connection with its
relationship with each Series;
(4) Performance of each Series generally lagged behind performance of respective peer funds and benchmarks over recent
time periods; The Board considered substantive information which was discussed in length at the meeting regarding the lag in
performance, as well as, measures aimed at improving performance; and
(5) Each Series’ contractual advisory fee rate was within an acceptable range of the median for peer funds; The Board
noted that while each Series’ total expense ratio was generally greater than the median for peer funds, this could be attributed in part
to the disparities in relative fund size;
The Directors gave consideration into the circumstances, which positively affected its decision to reapprove the Investment
Advisory Agreement.
Based on the Board’s’ deliberations and their evaluation of the information described above, the Directors, including all of the
Independent Directors, concluded that the Adviser’s compensation for investment advisory services is consistent with the best
interests of its shareholders and accordingly approved continuation of the Investment Advisory Agreement for an additional period.
Semi-Annual Report for the six months ended January 31, 2019
American Growth Fund, Inc. - Series One – Page 25
This page intentionally left blank
American Growth Fund, Inc. - Series One – Page 26
Semi-Annual Report for the six months ended January 31, 2019
PERFORMANCE CHARTS (unaudited)
The following charts compare the change in value of a $10,000 investment in the American Growth Fund versus the Standard and Poors 500. Returns reflect a sales load for Class A and D while Class B and C are without a sales load.
Performance data quoted represents past performance and is no guarantee of future results. The investment return and principal value of an investment will fluctuate, so that an investor’s shares, when redeemed, may be worth more or less than their original cost. The graph and table do not reflect the deduction of taxes that a shareholder would pay on fund distributions or the redemption of fund shares. Indices are unmanaged and generally do not reflect deductions for management fees. You cannot invest directly in an index. Current performance data to the most recent month end can be obtained by calling 1-800-525-2406.
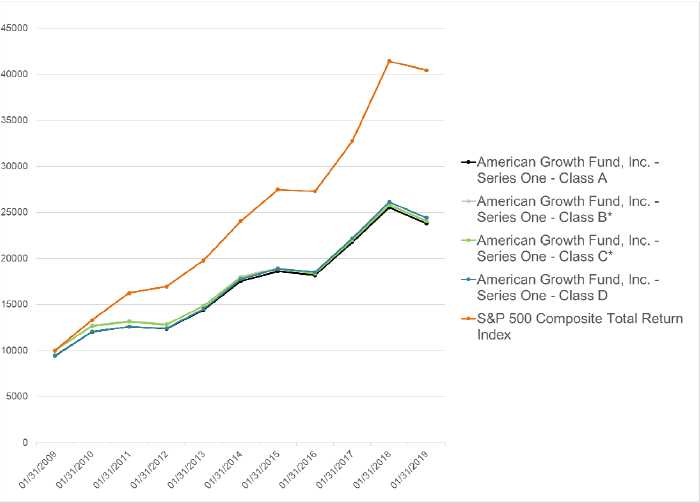
*Includes conversion to A Shares after 7 years.
Semi-Annual Report for the six months ended January 31, 2019
American Growth Fund, Inc. - Series One – Page 27
On 3/1/96, the Fund adopted a multi-class distribution arrangement to issue additional classes of shares, designated as Class A, Class B and Class C shares. Shares existing prior to 3/1/96 became Class D shares. Class A and Class D shares are subject to a maximum front-end sales charge of 5.75%, Class B shares are subject to a maximum contingent deferred sales charge of 5% and Class C shares are subject to a 1% contingent deferred sales charge within the first year of purchase. The Fund may incur 12b-1 expenses up to an annual maximum of .30 of 1% on its average daily net assets of its Class A shares, 1% of its average daily net assets of its Class B shares, and 1% of its average daily net assets of its Class C shares. Class D shares have no 12b-1 fees. Performance figures for Class D shares include the 5.75% initial sales charge and assume the reinvestment of income dividends and capital gain distributions. Performance quoted represents past performance and cannot be used to predict future results. The investment return and principal value of an investment will fluctuate so that the investors shares, when redeemed, may be worth more or less than their original cost. This material must be preceded or accompanied by a current prospectus. If you have not received, or need a current prospectus, please feel free to call for one at 1-800-525-2406. Please read the prospectus carefully before investing. Period ending 01/31/2019. For current performance figures please call 1-800-525-2406.
| | | | | | |
| | | | 5 years | | 10 years | |
| Series One (unaudited) | 1 | year | annualized | | annualized | |
| Class D without load | (6.52 | )% | 6.60 | % | 10.01 | % |
| Class D with load* | (11.95 | )% | 5.35 | % | 9.35 | % |
| Class A without load | (6.74 | )% | 6.31 | % | 9.69 | % |
| Class A with load* | (12.03 | )% | 5.06 | % | 9.06 | % |
| Class B without load | (7.46 | )% | 5.50 | % | 9.21 | %1 |
| Class C without load | (7.28 | )% | 5.58 | % | 9.17 | %2 |
*Includes a 5.75% sales charge based on a $10,000 initial purchase.
1 Includes the B Share to A Share conversion after 7 years.
2 Includes the C Share to A Share conversion after 7 years.
TRANSFER AGENT: Fund Services, Inc., 8730 Stony Point Parkway, Stony Point Bldg. III - Suite # 205, Richmond, Va. 23235 CUSTODIAN: UMB Bank NA Investment Services Group, 928 Grand Blvd, Fifth Floor, Kansas City, MO 64106 RETIREMENT PLAN CUSTODIAN: UMB Bank NA Investment Services Group, 928 Grand Blvd, Fifth Floor, Kansas City, MO 64106
INDEPENDENT REGISTERED PUBLIC ACCOUNTING FIRM: Tait, Weller & Baker LLP, Two Liberty Plaza, 50 South 16th Street, Suite 2900, Philadelphia, PA 19102 LEGAL COUNSEL: K&L Gates LLP, 1601 K St NW, Washington, DC 20006 UNDERWRITER/DISTRIBUTOR: World Capital Brokerage, Inc., 1636 Logan Street, Denver, CO 80203
| | | |
| OFFICERS AND DIRECTORS | INVESTMENT ADVISORS | |
| Timothy E. Taggart | President and Director | Investment Research Corporation | |
| Eddie R. Bush | Director | 1636 Logan Street | |
| Darrell E. Bush | Director | Denver, CO 80203 | |
| Patricia A. Blum | Vice President | OFFICERS AND DIRECTORS | |
| Michael L. Gaughan | Chief Compliance Officer | Timothy E. Taggart | President, Treasurer, and |
| | and Corporate Secretary | | Director |
| | | Michael L. Gaughan | Vice President, |
| | | | Secretary |
| | | | and Director |
| | | Patricia A. Blum | Vice President |
3/2019
2019-01-31(a) – Series 1
ITEM 2 – Code of Ethics
The Fund has adopted a Code of Ethics that applies to its Principal Executive Officer and Principal Financial Officer.
The Fund undertakes to provide to any person without charge, upon request, a copy of the Code of Ethics. Such
request can be made to American Growth Fund, Inc. at 800-525-2406 or to 1636 Logan Street, Denver, CO 80203.
ITEM 3 – Audit Committee Financial Expert
The Fund’s board has determined that Eddie R. Bush, CPA, a member of the Fund’s audit committee, is an “audit
committee financial expert” and "independent," as such terms are defined in this Item. This designation will not
increase the designee’s duties, obligations or liability as compared to his or her duties, obligations and liability as a
member of the audit committee and of the board, nor will it reduce the responsibility of the other audit
committee members. There may be other individuals who, through education or experience, would qualify as
"audit committee financial experts" if the board had designated them as such. Most importantly, the board
believes each member of the audit committee contributes significantly to the effective oversight of the Fund’s
financial statements and condition.
ITEM 4 – Principal Accountant Fees and Services
n/a
ITEM 5 – Audit Committee of Listed Funds
n/a
ITEM 6 – Schedule of Investments
Not applicable, insofar as the schedule is included as part of the report to shareholders filed under Item 1 of this
Form.
ITEM 7 – Disclosure of Proxy Voting Policies and Procedures for Closed End Management Investment Companies
Not applicable to this Fund, insofar as the Fund is not a closed end management investment company.
ITEM 8 – Portfolio Managers of Closed End Management Investment Companies
Not applicable to this Fund, insofar as the Fund is not a closed end management investment company.
ITEM 9 – Purchases of Equity Securities by Closed End Management Investment Company and Affiliated
Purchasers
Not applicable to this Fund, insofar as the Fund is not a closed end management investment company.
ITEM 10 – Submission of Matters to a Vote of Security Holders
There were no material changes to the procedures by which shareholders may recommend nominees to the
registrant’s board of Directors.
ITEM 11 – Controls and Procedures
(a) The Fund’s Principal Executive Officer and Principal Financial Officer have concluded, based on their
evaluation of the Fund’s disclosure controls and procedures (as such term is defined in Rule 30a-3 under the
Investment Company Act of 1940), that such controls and procedures are adequate and reasonably designed
to achieve the purposes described in paragraph (c) of such rule.
(b) There were no changes in the Fund’s internal controls over financial reporting (as defined in Rule 30a 3(d)
under the Investment Company Act of 1940) that occurred during the Fund’s second fiscal quarter of the
period covered by this report that has materially affected, or is reasonably likely to materially affect, the
Fund’s internal control over financial reporting.
ITEM 12 – Disclosure of Securities Lending Activities for Closed-End Management Investment Companies.
Not applicable to this Fund, insofar as the Fund is not a closed end management investment company.
ITEM 13 – Exhibits
(a)(1) The Code of Ethics that is the subject of the disclosure required by Item 2 is attached as an exhibit hereto.
(a)(2) The certifications required by Rule 30a 2 of the Investment Company Act of 1940 and Sections 302 and
906 of the Sarbanes Oxley Act of 2002 are attached as exhibits hereto.
SIGNATURES
Pursuant to the requirements of the Securities Exchange Act of 1934 and the Investment Company Act of 1940, the
Fund has duly caused this report to be signed on its behalf by the undersigned, thereunto duly authorized.
AMERICAN GROWTH FUND, INC.
By/s/Timothy E. Taggart
Timothy E Taggart, President
Principal Executive and Principal Financial Officer
Date: November 9, 2020
Pursuant to the requirements of the Securities Exchange Act of 1934 and the Investment Company Act of 1940,
this report has been signed below by the following persons on behalf of the Fund and in the capacities and on the
dates indicated.
By /s/Timothy E. Taggart
Timothy E. Taggart, President
Principal Executive and Principal Financial Officer
Date: November 9, 2020