UNITED STATES
SECURITIES AND EXCHANGE COMMISSION
Washington, D.C. 20549
FORM N-CSR
Certified Shareholder Report of
Registered Management Investment Companies
Investment Company Act File Number: 811-00116
The Investment Company of America
(Exact Name of Registrant as Specified in Charter)
333 South Hope Street
Los Angeles, California 90071
(Address of Principal Executive Offices)
Registrant's telephone number, including area code: (213) 486-9200
Date of fiscal year end: December 31
Date of reporting period: December 31, 2012
Vincent P. Corti
The Investment Company of America
333 South Hope Street
Los Angeles, California 90071
(Name and Address of Agent for Service)
Copies to:
Eric A. S. Richards
O’Melveny & Myers LLP
400 South Hope Street, 10th Floor
Los Angeles, California 90071
(Counsel for the Registrant)
ITEM 1 – Reports to Stockholders

The right choice for the long term ®
ICA The Investment
Company of America®
Special feature
New challenges,
enduring strengths
4 See page 8
Annual report for the year ended December 31, 2012
ICA seeks long-term growth of capital and income, placing greater emphasis on the potential for capital appreciation and future dividends than on current yield.
The Investment Company of America is one of more than 40 funds offered by American Funds, which is one of the nation’s largest mutual fund families. For more than 80 years, Capital Research and Management Company,SM the American Funds adviser, has invested with a long-term focus based on thorough research and attention to risk.
Fund results shown in this report, unless otherwise indicated, are for Class A shares at net asset value. If a sales charge (maximum 5.75%) had been deducted, the results would have been lower. Results are for past periods and are not predictive of results for future periods. Current and future results may be lower or higher than those shown. Share prices and returns will vary, so investors may lose money. Investing for short periods makes losses more likely. Investments are not FDIC-insured, nor are they deposits of or guaranteed by a bank or any other entity, so they may lose value. For current information and month-end results, visit americanfunds.com.
See page 4 for Class A share results with relevant sales charges deducted. Results for other share classes can be found on page 3.
Investment results assume all distributions are reinvested and reflect applicable fees and expenses. When applicable, investment results reflect fee waivers, without which results would have been lower. Visit americanfunds.com for more information.
The fund’s 30-day yield for Class A shares as of January 31, 2013, reflecting the 5.75% maximum sales charge and calculated in accordance with the U.S. Securities and Exchange Commission formula, was 1.78%.
Investing outside the United States may be subject to risks such as currency fluctuations, political instability, differing securities regulations and periods of illiquidity. Global diversification can help reduce these risks. Refer to the fund prospectus and the Risk Factors section of this report for more information on these and other risks associated with investing in the fund.
2012 results at a glance
Year ended December 31, 2012 (with all distributions reinvested)
| ICA (Class A shares) | Standard & Poor’s 500 Composite Index* | |||||||
| Income return | 2.68 | % | 2.51 | % | ||||
| Capital return | 12.92 | 13.48 | ||||||
| Total return | 15.60 | % | 15.99 | % | ||||
* The S&P 500 is unmanaged and, therefore, has no expenses.
Dividends and capital gain distribution paid in 2012
| Per share | Payment date | |||||||
| Income dividends | $ | 0.13 | March 14 | |||||
| 0.13 | June 8 | |||||||
| 0.13 | Sept. 14 | |||||||
| 0.33 | Dec. 21 | |||||||
| $ | 0.72 | |||||||
| Capital gain distribution | $ | 0.42 | Dec. 21 | |||||
Expense ratios and portfolio turnover rates1
Year ended December 31, 2012
| Expense ratio | Portfolio turnover rate | |||||||
| ICA | 0.62 | % | 21 | % | ||||
| Industry average2 | 1.16 | % | 50 | % | ||||
| 1 | The expense ratio is the annual percentage of net assets used to pay fund expenses. The ratio shown is for Class A shares as of the prospectus dated March 1, 2013 (unaudited). The portfolio turnover rate is a measure of how often securities are bought and sold by a fund. |
| 2 | Lipper Growth & Income Funds Average (industry average expense ratio based on statistics for front-end load funds, excluding funds of funds, for the most recent fiscal year-ends available as of 12/31/12). |
Fellow investors:
As The Investment Company of America marks its 79th anniversary, our overarching philosophy of “invest for the long term” has never been more relevant. Over the course of the fiscal year, lingering investor pessimism and negative headlines centering on several macroeconomic issues in the U.S., Europe, and China could have tempted an investor into selling equities. However, that investor would have lost out on a year of solid gains.
The Investment Company of America rose 15.6% for the 12-month period ended December 31, 2012, with all distributions reinvested, while the unmanaged Standard & Poor’s 500 Composite Index, a broad measure of the U.S. stock market, had a 16.0% total return for the year.
Of course, one year does not tell a full enough story for the fund’s investors. Longer periods of time are a better measure, as illustrated with the chart beginning on page 4. The last 20 years have been quite interesting as we have experienced the ups and downs of both the Internet bubble (1998–2000) and the financial crisis (2008–2009). Over that period, ICA posted an average annual total return of 8.6% compared with 8.2% by the S&P 500. Over its 79-year history, ICA had an average annual total return of 12.0% compared with 10.6% for the S&P 500.
Market strength through mixed indicators
The year 2012 was boosted early on by strong corporate earnings and progress in resolving the European debt crisis, which contributed to a global rally in equities and a double-digit first quarter rise in the S&P 500.
In May, stocks retreated amid sluggish economic data in the U.S., fears about a “hard landing” in China and a renewal of concern about Europe, centered on Spanish banks.
The equity markets resumed their climb in June as they were aided by improvements in U.S. housing and unemployment rates, and supportive measures by major central banks. The Federal Reserve announced another round of quantitative easing to hold interest rates near zero, and the European Central Bank pledged to buy back unlimited amounts of debt from struggling EU nations.
In the fourth quarter, uncertainty surrounding the elections and the combination of austerity measures, coined the “fiscal cliff,” weighed on the S&P 500 during the final three months.

In this report
| Special feature | |
| 8 | New challenges, enduring strengths |
| Contents | |
| 1 | Letter to investors |
| 3 | The value of a long-term perspective |
| 14 | Summary investment portfolio |
| 18 | Financial statements |
| 34 | Board of trustees and other officers |
On the cover
A bald eagle soars above a mountainscape in the Pacific Northwest.
|
| The Investment Company of America | 1 |
Portfolio review
In a robust year for U.S. equities, nine of ICA’s top-10 holdings gained in stock price. Among the most significant contributors to fund results were health care holdings, which demonstrated the benefits of stock selection. Amgen, the fund’s fifth-largest holding, gained 34.4%; Abbott Laboratories, the seventh-largest holding, was up 16.5%; and biotech company Gilead Sciences, the fund’s eighth-largest holding, rose 79.5%.
Consumer discretionary holdings also buoyed fund results. This was highlighted by General Motors, the fund’s fourth-largest holding, which gained 42.2% and by Home Depot, which was up 47.1%.
ICA had significant industry concentration in information technology, in which holdings were a mixed bag but helped on an absolute basis. The two largest positions were Microsoft, which was up 3.0%, and Oracle, which rose 29.9%.
ICA also had a significant industry exposure to energy. Schlumberger, a U.S.-based oil-field services and equipment manufacturer, rose 1.4%, and third-largest holding Royal Dutch Shell lost 6.2%. Overall, energy holdings were a relative drag on results.
A low exposure to financial stocks, some of which made substantial gains this year, somewhat detracted — in relative terms — from fund results. Part of this lower industry concentration is due to the fact that many of the major U.S. banks cut their dividends after the financial crisis and still do not pay a meaningful dividend.
In the long run, international flexibility has been beneficial to ICA, however, this was not the case for this fiscal year. In particular, a couple of energy companies not domiciled in the U.S. were a drag on results. In addition to Royal Dutch Shell, BP also declined, by 3.0%. Going forward, we still believe that fund shareholders can benefit from our firm’s outstanding global research and a touch of international flexibility.
Concerns about macroeconomic and fiscal issues are reflected in our cash levels, which represented 8.7% of the fund’s net assets. The fund’s cash holdings serve as a buffer in volatile times and some of our portfolio counselors feel it is prudent to maintain cash in this environment. But such holdings were a drag in the broadly positive year for equities.
A look ahead
Continued volatility in stock markets would not be surprising. The core structural debt issues in the U.S. and Europe are long term in nature, so we will continue to grind against these problems. There may be “tough medicine” solutions that could destabilize the market in the short term but strengthen it in the long term. Or, we may see more “kick the can down the road” approaches. Global markets will be evaluating trajectories over the long term — not just the short term — to determine whether the financial issues are improving or not.
We firmly believe that ICA’s commitment to growth and income investing, and to fundamental research, should continue to provide superior returns over the long term. These are cornerstones to our unique approach to investing that has stood the test of time for 79 years and counting. We thank you for your trust in The Investment Company of America and look forward to reporting about the fund in the years ahead.
Sincerely,

James B. Lovelace
Vice Chairman

Donald D. O’Neal
President
February 6, 2013
For current information about the fund, visit americanfunds.com.
| 2 | The Investment Company of America |

The value of a long-term perspective (1934 to 2012) Fund results shown are for Class A shares and reflect deduction of the maximum sales charge of 5.75% on a $10,000 investment.* Thus, the net amount invested was $9,425.† Results are for past periods and are not predictive of results for future periods. Current and future results may be lower or higher than those shown. Share prices and returns will vary, so investors may lose money. For current information and month-end results, visit americanfunds.com. This chart illustrates a hypothetical $10,000 investment in The Investment Company of America over the past 79 years, from January 1, 1934, through December 31, 2012, showing the high, low and closing values for each year. The figures in the table below the chart include the fund’s total return for each of those years. As you look through the table, you will see that the fund’s total return can fluctuate greatly from year to year. In some years, it was well into double digits. In other years, the fund had a negative return. Over the entire period, a $10,000 investment in the fund, with all dividends reinvested, would have grown to $73,628,532, compared with $28,967,727 in Standard & Poor’s 500 Composite Index. You can use this table to estimate how the value of your own holdings has grown. Let’s say, for example, that you have been reinvesting all of your dividends and want to know how your investment has done since the end of 2002. At that time, the value of the investment illustrated here was $38.7 million. Since then, it has increased to $73.6 million. Thus, in the same period, the value of your 2002 investment — regardless of size — has also increased. *As outlined in the prospectus, the sales charge is reduced for accounts (and aggregated investments) of $25,000 or more and is eliminated for purchases of $1 million or more. There is no sales charge on dividends or capital gain distributions that are reinvested in additional shares.†The maximum initial sales charge was 8.5% prior to July 1, 1988.
| Year ended December 31 | 1934 | 1935 | 1936 | 1937 | 1938 | 1939 | 1940 | 1941 | 1942 | 1943 | 1944 | 1945 | 1946 | 1947 | 1948 | 1949 | 1950 | 1951 | ||||||||||||||||||||||||||||||||||||||||||||||||||||||
| Year-by-year summary of results (dollars in thousands) | ||||||||||||||||||||||||||||||||||||||||||||||||||||||||||||||||||||||||
| Dividends reinvested | — | — | $ | 0.4 | 1.0 | 0.2 | 0.5 | 0.9 | 1.3 | 1.2 | 1.1 | 1.2 | 1.2 | 1.8 | 2.4 | 2.7 | 2.7 | 3.2 | 3.4 | |||||||||||||||||||||||||||||||||||||||||||||||||||||
| Value at year-end | $ | 11.8 | 21.6 | 31.6 | 19.4 | 24.8 | 25.0 | 24.4 | 22.6 | 26.4 | 35.0 | 43.2 | 59.1 | 57.7 | 58.2 | 58.4 | 63.9 | 76.6 | 90.3 | |||||||||||||||||||||||||||||||||||||||||||||||||||||
| Dividends in cash | — | — | $ | 0.4 | 1.0 | 0.2 | 0.5 | 0.8 | 1.1 | 1.0 | 0.9 | 0.9 | 0.9 | 1.3 | 1.7 | 1.8 | 1.7 | 1.9 | 2.0 | |||||||||||||||||||||||||||||||||||||||||||||||||||||
| Value at year-end | $ | 11.8 | 21.6 | 31.0 | 18.3 | 23.2 | 22.9 | 21.5 | 18.8 | 20.9 | 26.9 | 32.1 | 42.9 | 40.7 | 39.3 | 37.7 | 39.4 | 45.2 | 51.2 | |||||||||||||||||||||||||||||||||||||||||||||||||||||
| Annual percentage returns assuming dividends reinvested | ||||||||||||||||||||||||||||||||||||||||||||||||||||||||||||||||||||||||
| Income return | 0.0 | % | 0.0 | 1.8 | 3.2 | 0.9 | 2.2 | 3.6 | 5.2 | 5.3 | 4.2 | 3.5 | 2.8 | 3.0 | 4.2 | 4.6 | 4.6 | 4.9 | 4.4 | |||||||||||||||||||||||||||||||||||||||||||||||||||||
| Capital return | 18.2 | % | 83.1 | 44.0 | (41.7 | ) | 26.7 | (1.4 | ) | (6.0 | ) | (12.6 | ) | 11.5 | 28.6 | 19.8 | 34.0 | (5.4 | ) | (3.3 | ) | (4.2 | ) | 4.8 | 14.9 | 13.4 | ||||||||||||||||||||||||||||||||||||||||||||||
| ICA total return | 18.2 | % | 83.1 | 45.8 | (38.5 | ) | 27.6 | 0.8 | (2.4 | ) | (7.4 | ) | 16.8 | 32.8 | 23.3 | 36.8 | (2.4 | ) | 0.9 | 0.4 | 9.4 | 19.8 | 17.8 | |||||||||||||||||||||||||||||||||||||||||||||||||
| Fund expenses3 | 0.94 | % | 1.13 | 1.19 | 1.53 | 1.89 | 2.02 | 1.88 | 1.95 | 2.13 | 1.72 | 1.45 | 1.06 | 0.98 | 1.10 | 1.08 | 0.96 | 1.01 | 0.93 | |||||||||||||||||||||||||||||||||||||||||||||||||||||
The results shown are before taxes on fund distributions and sale of fund shares.
The S&P 500 is unmanaged and, therefore, has no expenses.
| The Investment Company of America | 3 |

Average annual total returns based on a $1,000 investment (for periods ended December 31, 2012)* 1 year 5 years 10 years Class A shares 8.96% –0.30% 6.01% *Assumes reinvestment of all distributions and payment of the maximum 5.75% sales charge. The total annual fund operating expense ratio is 0.62% for Class A shares as of the prospectus dated March 1, 2013 (unaudited). Investment results assume all distributions are reinvested and reflect applicable fees and expenses. When applicable, investment results reflect fee waivers, without which results would have been lower. Visit americanfunds.com for more information.
| 1952 | 1953 | 1954 | 1955 | 1956 | 1957 | 1958 | 1959 | 1960 | 1961 | 1962 | 1963 | 1964 | 1965 | 1966 | 1967 | 1968 | 1969 | 1970 | 1971 | 1972 | 1973 | ||||||||||||||||||||||||||||||||||||||||||
| 3.5 | 3.9 | 4.1 | 5.1 | 5.6 | 6.2 | 6.5 | 7.0 | 8.1 | 8.4 | 9.1 | 9.6 | 10.7 | 12.1 | 15.5 | 18.4 | 22.6 | 25.3 | 27.3 | 28.6 | 29.9 | 33.4 | ||||||||||||||||||||||||||||||||||||||||||
| 101.3 | 101.7 | 158.9 | 199.2 | 220.6 | 194.4 | 281.5 | 321.4 | 336.0 | 413.6 | 358.8 | 440.9 | 512.6 | 650.7 | 657.1 | 846.9 | 990.6 | 884.8 | 908.0 | 1,062.7 | 1,231.1 | 1,024.1 | ||||||||||||||||||||||||||||||||||||||||||
| 2.0 | 2.1 | 2.1 | 2.6 | 2.7 | 3.0 | 3.0 | 3.2 | 3.6 | 3.6 | 3.8 | 3.9 | 4.3 | 4.7 | 5.9 | 6.9 | 8.3 | 9.0 | 9.4 | 9.6 | 9.7 | 10.6 | ||||||||||||||||||||||||||||||||||||||||||
| 55.3 | 53.4 | 80.8 | 98.5 | 106.3 | 90.9 | 128.0 | 142.9 | 145.6 | 175.4 | 148.2 | 177.8 | 202.3 | 251.6 | 248.0 | 312.5 | 356.6 | 309.6 | 307.4 | 349.7 | 394.7 | 317.9 | ||||||||||||||||||||||||||||||||||||||||||
| 3.9 | 3.9 | 4.0 | 3.2 | 2.8 | 2.8 | 3.4 | 2.5 | 2.5 | 2.5 | 2.2 | 2.7 | 2.4 | 2.4 | 2.4 | 2.8 | 2.7 | 2.6 | 3.1 | 3.1 | 2.8 | 2.7 | ||||||||||||||||||||||||||||||||||||||||||
| 8.3 | (3.5 | ) | 52.1 | 22.2 | 8.0 | (14.7 | ) | 41.4 | 11.7 | 2.0 | 20.6 | (15.4 | ) | 20.2 | 13.9 | 24.5 | (1.4 | ) | 26.1 | 14.3 | (13.3 | ) | (0.5 | ) | 13.9 | 13.1 | (19.5 | ) | |||||||||||||||||||||||||||||||||||
| 12.2 | 0.4 | 56.1 | 25.4 | 10.8 | (11.9 | ) | 44.8 | 14.2 | 4.5 | 23.1 | (13.2 | ) | 22.9 | 16.3 | 26.9 | 1.0 | 28.9 | 17.0 | (10.7 | ) | 2.6 | 17.0 | 15.9 | (16.8 | ) | ||||||||||||||||||||||||||||||||||||||
| 0.81 | 0.85 | 0.88 | 0.86 | 0.80 | 0.76 | 0.68 | 0.64 | 0.62 | 0.59 | 0.61 | 0.59 | 0.58 | 0.57 | 0.52 | 0.50 | 0.49 | 0.48 | 0.55 | 0.51 | 0.49 | 0.47 |
| 1 | Includes dividends of $22,258,771 and capital gain distributions of $33,096,127 reinvested in the years 1936 to 2012. |
| 4 | The Investment Company of America |
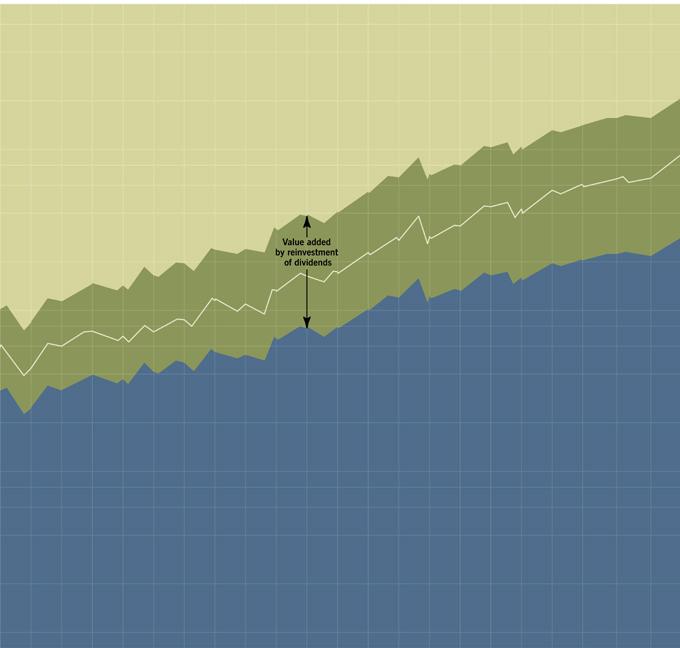
Value added by reinvestment of dividends
| 1974 | 1975 | 1976 | 1977 | 1978 | 1979 | 1980 | 1981 | 1982 | 1983 | 1984 | 1985 | 1986 | 1987 | 1988 | 1989 | 1990 | 1991 | 1992 | 1993 | 1994 | 1995 | |||||||||||||||||||||||||||||||||||||||||||||||||||||||||||||||
| 52.2 | 49.8 | 46.4 | 49.8 | 56.0 | 70.0 | 91.3 | 115.9 | 146.1 | 147.2 | 160.4 | 174.9 | 203.8 | 267.5 | 318.7 | 370.8 | 406.3 | 320.4 | 357.8 | 374.4 | 407.2 | 450.1 | |||||||||||||||||||||||||||||||||||||||||||||||||||||||||||||||
| 840.3 | 1,137.7 | 1,474.4 | 1,436.4 | 1,647.5 | 1,963.3 | 2,380.2 | 2,401.1 | 3,212.0 | 3,859.7 | 4,117.2 | 5,491.9 | 6,685.7 | 7,049.2 | 7,989.3 | 10,338.6 | 10,409.0 | 13,171.9 | 14,092.3 | 15,729.4 | 15,753.9 | 20,578.7 | |||||||||||||||||||||||||||||||||||||||||||||||||||||||||||||||
| 15.9 | 14.3 | 12.8 | 13.3 | 14.4 | 17.3 | 21.7 | 26.4 | 31.6 | 30.3 | 31.7 | 33.2 | 37.3 | 47.5 | 54.4 | 60.7 | 64.1 | 48.7 | 53.0 | 54.0 | 57.3 | 61.7 | |||||||||||||||||||||||||||||||||||||||||||||||||||||||||||||||
| 245.5 | 317.7 | 398.1 | 374.3 | 414.4 | 475.7 | 552.2 | 530.9 | 670.6 | 774.5 | 792.0 | 1,017.9 | 1,200.5 | 1,220.9 | 1,327.4 | 1,652.8 | 1,598.8 | 1,969.9 | 2,052.2 | 2,234.2 | 2,180.6 | 2,779.7 | |||||||||||||||||||||||||||||||||||||||||||||||||||||||||||||||
| 5.1 | 5.9 | 4.1 | 3.4 | 3.9 | 4.2 | 4.7 | 4.9 | 6.1 | 4.6 | 4.2 | 4.2 | 3.7 | 4.0 | 4.5 | 4.6 | 3.9 | 3.1 | 2.7 | 2.7 | 2.6 | 2.9 | |||||||||||||||||||||||||||||||||||||||||||||||||||||||||||||||
| (23.0) | 29.5 | 25.5 | (6.0 | ) | 10.8 | 15.0 | 16.5 | (4.0 | ) | 27.7 | 15.6 | 2.5 | 29.2 | 18.0 | 1.4 | 8.8 | 24.8 | (3.2 | ) | 23.4 | 4.3 | 8.9 | (2.4 | ) | 27.7 | |||||||||||||||||||||||||||||||||||||||||||||||||||||||||||
| (17.9) | 35.4 | 29.6 | (2.6 | ) | 14.7 | 19.2 | 21.2 | 0.9 | 33.8 | 20.2 | 6.7 | 33.4 | 21.7 | 5.4 | 13.3 | 29.4 | 0.7 | 26.5 | 7.0 | 11.6 | 0.2 | 30.6 | ||||||||||||||||||||||||||||||||||||||||||||||||||||||||||||||
| 0.49 | 0.48 | 0.46 | 0.49 | 0.49 | 0.47 | 0.46 | 0.45 | 0.46 | 0.44 | 0.47 | 0.43 | 0.41 | 0.42 | 0.48 | 0.52 | 0.55 | 0.59 | 0.58 | 0.59 | 0.60 | 0.60 |
| 2 | Includes reinvested capital gain distributions of $4,414,496, but does not reflect income dividends of $2,870,929 taken in cash. |
| The Investment Company of America | 5 |
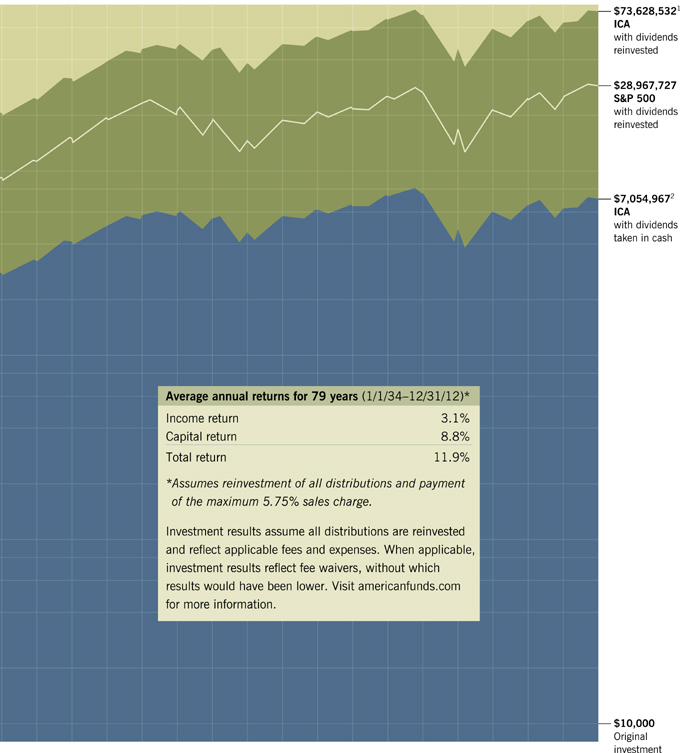
Average annual returns for 79 years (1/1/34–12/31/12)* Income return 3.1% Capital return 8.8% Total return 11.9% *Assumes reinvestment of all distributions and payment of the maximum 5.75% sales charge.Investment results assume all distributions are reinvested and reflect applicable fees and expenses. When applicable, investment results reflect fee waivers, without which results would have been lower. Visit americanfunds.com for more information.
| 1996 | 1997 | 1998 | 1999 | 2000 | 2001 | 2002 | 2003 | 2004 | 2005 | 2006 | 2007 | 2008 | 2009 | 2010 | 2011 | 2012 | ||||||||||||||||||||||||||||||||||||||||||||||||
| 480.1 | 510.3 | 584.1 | 651.8 | 743.4 | 804.1 | 833.3 | 864.3 | 887.4 | 1,196.3 | 1,364.6 | 1,319.3 | 1,466.7 | 1,264.7 | 1,272.4 | 1,345.5 | 1,707.1 | ||||||||||||||||||||||||||||||||||||||||||||||||
| 24,560.6 | 31,881.2 | 39,193.5 | 45,682.2 | 47,435.2 | 45,258.6 | 38,709.1 | 48,891.6 | 53,674.5 | 57,361.4 | 66,504.4 | 70,456.8 | 45,983.8 | 58,481.1 | 64,830.6 | 63,692.5 | 73,628.51 | ||||||||||||||||||||||||||||||||||||||||||||||||
| 64.3 | 67.0 | 75.4 | 82.8 | 93.0 | 99.0 | 100.7 | 102.2 | 103.0 | 136.3 | 152.1 | 144.0 | 156.9 | 131.5 | 129.2 | 133.8 | 166.1 | ||||||||||||||||||||||||||||||||||||||||||||||||
| 3,247.9 | 4,142.7 | 5,008.2 | 5,748.5 | 5,875.5 | 5,507.5 | 4,616.9 | 5,713.5 | 6,163.0 | 6,446.5 | 7,313.2 | 7,601.9 | 4,835.7 | 5,986.9 | 6,496.8 | 6,249.9 | 7,055.02 | ||||||||||||||||||||||||||||||||||||||||||||||||
| 2.3 | 2.1 | 1.8 | 1.7 | 1.6 | 1.7 | 1.8 | 2.2 | 1.8 | 2.2 | 2.4 | 2.0 | 2.1 | 2.8 | 2.2 | 2.0 | 2.7 | ||||||||||||||||||||||||||||||||||||||||||||||||
| 17.0 | 27.7 | 21.1 | 14.9 | 2.2 | (6.3 | ) | (16.3 | ) | 24.1 | 8.0 | 4.7 | 13.5 | 3.9 | (36.8 | ) | 24.4 | 8.7 | (3.8 | ) | 12.9 | ||||||||||||||||||||||||||||||||||||||||||||
| 19.3 | 29.8 | 22.9 | 16.6 | 3.8 | (4.6 | ) | (14.5 | ) | 26.3 | 9.8 | 6.9 | 15.9 | 5.9 | (34.7 | ) | 27.2 | 10.9 | (1.8 | ) | 15.6 | ||||||||||||||||||||||||||||||||||||||||||||
| 0.59 | 0.56 | 0.55 | 0.55 | 0.56 | 0.57 | 0.59 | 0.59 | 0.57 | 0.57 | 0.57 | 0.56 | 0.59 | 0.66 | 0.61 | 0.61 | 0.62 |
| 3 | Fund expense percentages do not reflect a fee waiver and are provided as additional information. They should not be subtracted from any other figure on the table because all fund results already reflect their effect. |
| 6 | The Investment Company of America |
| Other share class results | unaudited |
Classes B, C, F and 529
Fund results shown are for past periods and are not predictive of results for future periods. Current and future results may be lower or higher than those shown. Share prices and returns will vary, so investors may lose money. For current information and month-end results, visit americanfunds.com.
| 10 years/ | ||||||||||||
| Average annual total returns for periods ended December 31, 2012: | 1 year | 5 years | Life of class1 | |||||||||
| Class B shares2 | ||||||||||||
| Reflecting applicable contingent deferred sales charge (CDSC), maximum of 5%, payable only if shares are sold within six years of purchase | 9.74 | % | –0.26 | % | 5.98 | % | ||||||
| Not reflecting CDSC | 14.74 | 0.11 | 5.98 | |||||||||
| Class C shares | ||||||||||||
| Reflecting CDSC, maximum of 1%, payable only if shares are sold within one year of purchase | 13.70 | 0.07 | 5.76 | |||||||||
| Not reflecting CDSC | 14.70 | 0.07 | 5.76 | |||||||||
| Class F-1 shares3 | ||||||||||||
| Not reflecting annual asset-based fee charged by sponsoring firm | 15.58 | 0.85 | 6.59 | |||||||||
| Class F-2 shares3 — first sold 8/1/08 | ||||||||||||
| Not reflecting annual asset-based fee charged by sponsoring firm | 15.86 | — | 4.32 | |||||||||
| Class 529-A shares4 | ||||||||||||
| Reflecting 5.75% maximum sales charge | 8.84 | –0.39 | 5.92 | |||||||||
| Not reflecting maximum sales charge | 15.47 | 0.80 | 6.55 | |||||||||
| Class 529-B shares2,4 | ||||||||||||
| Reflecting applicable CDSC, maximum of 5%, payable only if shares are sold within six years of purchase | 9.58 | –0.37 | 5.84 | |||||||||
| Not reflecting CDSC | 14.58 | 0.00 | 5.84 | |||||||||
| Class 529-C shares4 | ||||||||||||
| Reflecting CDSC, maximum of 1%, payable only if shares are sold within one year of purchase | 13.59 | 0.01 | 5.68 | |||||||||
| Not reflecting CDSC | 14.59 | 0.01 | 5.68 | |||||||||
| Class 529-E shares3,4 | 15.23 | 0.53 | 6.23 | |||||||||
| Class 529-F-1 shares3,4 | ||||||||||||
| Not reflecting annual asset-based fee charged by sponsoring firm | 15.74 | 1.02 | 6.69 | |||||||||
| 1 | Applicable to Class F-2 shares only. All other share classes reflect 10-year results. |
| 2 | These shares are not available for purchase. |
| 3 | These shares are sold without any initial or contingent deferred sales charge. |
| 4 | Results shown do not reflect the $10 account setup fee and an annual $10 account maintenance fee. |
Investment results assume all distributions are reinvested and reflect applicable fees and expenses. When applicable, investment results reflect fee waivers, without which results would have been lower. Visit americanfunds.com for more information.
For information regarding the differences among the various share classes, refer to the fund prospectus.
| The Investment Company of America | 7 |

New challenges,
enduring strengths
| 8 | The Investment Company of America |
Financial systems and economies around the world are still stressed from the global financial crisis, as demonstrated in the U.S. by high unemployment rates and by short-term interest rates close to zero. These symptoms of stress reveal that the U.S. economy has not yet healed. Yet, as the country navigates this sluggish recovery and hopefully regains full strength, there are many positive aspects worth highlighting. “Strong cash flows characterized corporate America in 2012, and profits are at record levels,” says Jim Lovelace, vice chairman of the fund and a portfolio counselor.
Signs of recovery in the housing market and auto industry, two of the hardest hit sectors, have become apparent as contracts to buy previously-owned homes continue to rise and auto sales closed the year on an upswing. ICA was able to participate in some of this growth. “There were plenty of gains to enjoy in 2012,” adds Jim, “and there remains no lack of investment opportunities going forward.”
We’ve seen difficult economic cycles before
ICA has experienced its share of difficult investment cycles before, and while there might be some precedent, the current challenges have not come together this particular way before. ICA’s record begins in 1934, the middle of the Great Depression. The fund generated decent returns1 during that challenging period and its record of consistency has persisted through many difficult cycles since.
Some of the pessimism in 2012 might have been unnecessarily high. A presidential election year is often perceived as more volatile and negative than an average year, but it typically is not. In fact, dating back to 1936, presidential election years have averaged an annual increase of 10.6%. Of those 20 elections, the market experienced only three negative years. ICA’s portfolio counselors, with an average of 24 years of investment experience,2 have the benefit of having invested throughout many elections and can weigh investor pessimism accordingly.

| 1 | For the fiscal years of 1934–1939, ICA’s returns were 25.4%, 83.1%, 45.8%, –38.5%, 27.6% and 0.8% respectively. Returns do not reflect any sales charges. |
| 2 | As of 12/31/12. |
| The Investment Company of America | 9 |
The U.S. remains well-positioned in global markets, is very innovative and has a lot of flexibility, so there are plenty of reasons to be excitedabout the U.S. economy.

The equity results for the year may indicate, in part, that the United States has enacted some policies better than most countries. The Federal Reserve has kept borrowing rates down and continued the bond-buying program of quantitative easing, which some believe has helped stave off a double-dip recession. Nevertheless, there are long-term debt issues that need a more substantial fix over a longer period of time. For the first time since World War II, the U.S. national debt has exceeded 100% of total annual U.S. gross domestic product (GDP).
Some believe the fiscal cliff deal by the U.S. Congress delayed progress toward a more permanent solution that would make the federal government’s finances sustainable. The compromise was one that met the least resistance — it raised most of the tax revenue from wealthy people and postponed most of the scheduled spending cuts. The concern is that high levels of government debt and deficits, if unaddressed, might have a long-term effect on the economy and create a drag on the financial markets.
While there may be theoretical differences about the effect of debt and deficits on the economy, there is broad consensus that pro-growth policies are the best remedy to bring the unemployment rate down, boost the U.S. financial system and get the economy running again. As consumption picks up, businesses will respond to consumer demand and will invest to keep up, creating jobs and buoying the economy.
Given where the economy stands in this current cycle, ICA’s portfolio counselors are still able to identify and invest in many solid companies with favorable valuations. The U.S. remains well-positioned in global markets, is very innovative and has a lot of flexibility, so there are plenty of reasons to be excited about the U.S. economy.
The importance of growing dividends
In this volatile but recovering economic environment, a dividend is once again showing itself to be an important factor in total return. “It gets masked in years when stocks are up significantly,” explains Jim, “but in years when returns are flat, the dividend becomes more critical.” A stock’s dividend generates income over the long term that helps to improve total return, manage risk and lessen volatility.
| 10 | The Investment Company of America |
Myth: Paying dividends signals a stock is overvalued
Fact: Steady dividend growers strongly outperform over time
Returns of S&P 500 stocks by dividend policy
Returns based on monthly equal-weighted geometric average of total returns of S&P 500 component stocks, with components reconstituted monthly. Equal-weighted geometric average calculates a constant return for each period rather than a compounded average which would consider the amount invested in the funds per period.

Year ended December 31
Source: Ned Davis Research, Inc.
Copyright 2013 Ned Davis Research, Inc. Further distribution prohibited without prior permission. All Rights Reserved.
See NDR Disclaimer at www.ndr.com/copyright.html. For data vendor disclaimers refer to www.ndr.com/vendorinfo/.
| The Investment Company of America | 11 |
Dividends are an integral part of, and reinforce ICA’s commitment to, both the growth and income strategy of the fund.

“Dividends tend to be more protective in tough market environments, and are a nice discipline for managements,” says ICA president and portfolio counselor Don O’Neal. “They basically ensure that part of a company’s free cash flow goes directly to shareholders, which is additive to shareholder value through thick and thin.”
ICA is focused on companies that are growing, and on the power of a company with a growing dividend. Companies that not only pay dividends but have shown sustainable dividend increases have been very successful investments. Studies by Ned Davis Research show that during the past 40 years, the returns of companies that have raised their dividends have significantly outpaced both the returns of companies that cut dividends and the returns of companies that maintain or don’t increase dividends (please refer to the chart on page 11).
However, a company can’t just artificially grow its dividend; having the wherewithal to grow a dividend is borne out of a company’s fundamental strength. Dividends are an integral part of, and reinforce ICA’s commitment to, both the growth and income strategy of the fund.
ICA and a balanced portfolio
The ability to identify and select investments from the bottom up, company by company, has been one of ICA’s greatest sources of success over the years. The fund’s portfolio counselors thoroughly analyze each company’s fundamentals before buying shares in that company, and maintain a broadly diversified portfolio by holding assets in companies across many different industries. This helps to manage risk for our shareholders.
“You want to reflect your highest convictions, but you never own just one idea,” explains Don, “So at the individual level there’s a certain amount of diversification, but when you add in multiple portfolio counselors, the fund becomes extraordinarily well-diversified. That’s been one of our sources of strength for a long time.”
ICA’s positioning for future opportunities
Macroeconomic headwinds remain, but on an individual stock basis ICA will continue to identify attractively valued companies that the fund’s portfolio counselors believe have long-term potential. There may be a new element to the current economic landscape, but it still comes down to fundamental research and having a long-term orientation.
| 12 | The Investment Company of America |
ICA is well-positioned to seek to take advantage of these long-term investment opportunities. The GDP of the U.S. is around $15 trillion — more than one-fifth of the world’s GDP. This figure represents 315 million people needing goods and services, like cars, high-tech equipment and health care products, as well as energy to power vehicles, businesses and machinery. It’s a tremendously large opportunity, and it presents superior long-term prospects for ICA and our shareholders.
We can gain inspiration and learn lessons from the past. As some uncertainty subsides and is replaced by growing consumer, business and investor confidence, we see tremendous opportunity and potential for growth in the U.S. “We’re in this unclear period, so it becomes imperative for us to do the fundamental research and really look at companies,” says Don. “Because if the broad environment is one of uncertainty that can go either way, we need to find companies that can do well in almost any environment; that’s how we can add the most value for ICA’s shareholders.”
A wealth of experience
The Investment Company of America’s six portfolio counselors have a combined 148 years of investment experience as of December 31, 2012. The knowledge and wisdom they have accumulated over the years have helped them manage your fund through many stock market cycles.
Portfolio counselors and years of investment experience
(as of December 31, 2012)
| Joyce E. Gordon | James B. Lovelace | ||
| 32 years | 31 years |
| Donald D. O’Neal | Eric Richter | ||
| 27 years | 21 years |
| C. Ross Sappenfield | Chris Buchbinder | ||
| 20 years | 17 years |
| The Investment Company of America | 13 |
Summary investment portfolio December 31, 2012
The following summary investment portfolio is designed to streamline the report and help investors better focus on the fund’s principal holdings. See the inside back cover for details on how to obtain a complete schedule of portfolio holdings.
| Industry sector diversification (percent of net assets) |

| Common stocks — 89.87% | Shares | Value (000) | Percent of net assets | |||||||||
| Energy — 13.55% | ||||||||||||
| Baker Hughes Inc. | 12,821,000 | $ | 523,610 | .92 | % | |||||||
| BP PLC1 | 136,457,810 | 945,484 | 1.92 | |||||||||
| BP PLC (ADR) | 3,676,953 | 153,108 | ||||||||||
| Chevron Corp. | 7,980,000 | 862,957 | 1.51 | |||||||||
| ConocoPhillips | 11,925,000 | 691,531 | 1.21 | |||||||||
| EOG Resources, Inc. | 4,232,200 | 511,207 | .89 | |||||||||
| Royal Dutch Shell PLC, Class A (ADR) | 11,923,700 | 822,139 | ||||||||||
| Royal Dutch Shell PLC, Class B1 | 12,150,000 | 430,017 | 2.56 | |||||||||
| Royal Dutch Shell PLC, Class B (ADR) | 2,975,498 | 210,933 | ||||||||||
| Schlumberger Ltd. | 15,364,999 | 1,064,641 | 1.86 | |||||||||
| Other securities | 1,532,657 | 2.68 | ||||||||||
| 7,748,284 | 13.55 | |||||||||||
| Materials — 4.04% | ||||||||||||
| Dow Chemical Co. | 42,502,000 | 1,373,665 | 2.40 | |||||||||
| Other securities | 937,941 | 1.64 | ||||||||||
| 2,311,606 | 4.04 | |||||||||||
| Industrials — 10.72% | ||||||||||||
| CSX Corp. | 35,337,748 | 697,214 | 1.22 | |||||||||
| General Dynamics Corp. | 14,042,800 | 972,745 | 1.70 | |||||||||
| General Electric Co. | 21,875,000 | 459,156 | .80 | |||||||||
| Illinois Tool Works Inc. | 6,400,000 | 389,184 | .68 | |||||||||
| Union Pacific Corp. | 3,193,900 | 401,537 | .70 | |||||||||
| United Parcel Service, Inc., Class B | 5,365,000 | 395,561 | .69 | |||||||||
| United Technologies Corp. | 6,961,852 | 570,941 | 1.00 | |||||||||
| Waste Management, Inc. | 12,616,700 | 425,687 | .74 | |||||||||
| Other securities | 1,820,097 | 3.19 | ||||||||||
| 6,132,122 | 10.72 | |||||||||||
| 14 | The Investment Company of America |
| Common stocks | Shares | Value (000) | Percent of net assets | |||||||||
| Consumer discretionary — 12.09% | ||||||||||||
| Amazon.com, Inc.2 | 2,885,000 | $ | 724,539 | 1.27 | % | |||||||
| Comcast Corp., Class A | 9,273,400 | 346,640 | 1.05 | |||||||||
| Comcast Corp., Class A, special nonvoting shares | 7,000,000 | 251,650 | ||||||||||
| General Motors Co.2 | 35,490,500 | 1,023,191 | 1.79 | |||||||||
| Home Depot, Inc. | 19,942,100 | 1,233,419 | 2.15 | |||||||||
| Time Warner Cable Inc. | 4,362,727 | 424,014 | .74 | |||||||||
| Time Warner Inc. | 8,604,000 | 411,529 | .72 | |||||||||
| Other securities | 2,501,115 | 4.37 | ||||||||||
| 6,916,097 | 12.09 | |||||||||||
| Consumer staples — 11.07% | ||||||||||||
| Altria Group, Inc. | 33,780,000 | 1,061,368 | 1.86 | |||||||||
| Coca-Cola Co. | 13,606,600 | 493,239 | .86 | |||||||||
| CVS/Caremark Corp. | 10,450,000 | 505,258 | .88 | |||||||||
| Mondelez International, Inc. | 16,090,000 | 409,812 | .72 | |||||||||
| Philip Morris International Inc. | 26,354,572 | 2,204,296 | 3.85 | |||||||||
| Other securities | 1,656,873 | 2.90 | ||||||||||
| 6,330,846 | 11.07 | |||||||||||
| Health care — 10.92% | ||||||||||||
| Abbott Laboratories | 20,103,038 | 1,316,753 | 2.30 | |||||||||
| Aetna Inc. | 8,763,000 | 405,727 | .71 | |||||||||
| Amgen Inc. | 16,225,000 | 1,400,542 | 2.45 | |||||||||
| Gilead Sciences, Inc.2 | 17,149,300 | 1,259,616 | 2.20 | |||||||||
| Novartis AG1 | 5,199,000 | 329,157 | .68 | |||||||||
| Novartis AG (ADR) | 921,556 | 58,334 | ||||||||||
| Other securities | 1,478,988 | 2.58 | ||||||||||
| 6,249,117 | 10.92 | |||||||||||
| Financials — 3.79% | ||||||||||||
| Aon PLC, Class A | 8,975,000 | 499,010 | .87 | |||||||||
| JPMorgan Chase & Co. | 10,330,000 | 454,210 | .80 | |||||||||
| Other securities | 1,212,600 | 2.12 | ||||||||||
| 2,165,820 | 3.79 | |||||||||||
| Information technology — 13.30% | ||||||||||||
| Apple Inc. | 1,290,000 | 687,609 | 1.20 | |||||||||
| Hewlett-Packard Co. | 37,500,000 | 534,375 | .94 | |||||||||
| Microsoft Corp. | 56,520,500 | 1,510,793 | 2.64 | |||||||||
| Oracle Corp. | 33,835,000 | 1,127,382 | 1.97 | |||||||||
| Samsung Electronics Co. Ltd.1 | 331,700 | 474,737 | .83 | |||||||||
| Texas Instruments Inc. | 24,825,000 | 768,085 | 1.34 | |||||||||
| Other securities | 2,502,045 | 4.38 | ||||||||||
| 7,605,026 | 13.30 | |||||||||||
| Telecommunication services — 5.96% | ||||||||||||
| AT&T Inc. | 34,203,000 | 1,152,983 | 2.01 | |||||||||
| Sprint Nextel Corp., Series 12 | 141,042,400 | 799,710 | 1.40 | |||||||||
| Verizon Communications Inc. | 20,744,600 | 897,619 | 1.57 | |||||||||
| Other securities | 558,985 | .98 | ||||||||||
| 3,409,297 | 5.96 | |||||||||||
| The Investment Company of America | 15 |
| Common stocks | Shares | Value (000) | Percent of net assets | |||||||||
| Utilities — 2.32% | ||||||||||||
| Dominion Resources, Inc. | 9,403,824 | $ | 487,118 | .85 | % | |||||||
| Other securities | 839,413 | 1.47 | ||||||||||
| 1,326,531 | 2.32 | |||||||||||
| Miscellaneous — 2.11% | ||||||||||||
| Other common stocks in initial period of acquisition3 | 1,204,365 | 2.11 | ||||||||||
| Total common stocks (cost: $37,393,054,000) | 51,399,111 | 89.87 | ||||||||||
| Convertible securities — 0.82% | ||||||||||||
| Consumer discretionary — 0.70% | ||||||||||||
| General Motors Co., Series B, 4.75% convertible preferred 2013 | 9,060,850 | 399,855 | .70 | |||||||||
| Other — 0.12% | ||||||||||||
| Other securities | 71,110 | .12 | ||||||||||
| Total convertible securities (cost: $491,702,000) | 470,965 | .82 | ||||||||||
| Bonds & notes — 0.59% | Principal amount (000 | |||||||||||
| Financials — 0.13% | ||||||||||||
| JPMorgan Chase & Co., Series I, junior subordinated 7.90% (undated)4 | $ | 62,936 | 71,562 | .13 | ||||||||
| Telecommunication services — 0.46% | ||||||||||||
| Sprint Capital Corp. 6.90% 2019 | 17,200 | 18,834 | .46 | |||||||||
| Sprint Nextel Corp. 8.375%–11.50% 2017–2021 | 193,000 | 246,552 | ||||||||||
| 265,386 | .46 | |||||||||||
| Total bonds & notes (cost: $271,138,000) | 336,948 | .59 | ||||||||||
| Short-term securities — 8.98% | ||||||||||||
| Chariot Funding, LLC 0.21% due 3/4–3/19/20135 | 39,400 | 39,390 | .20 | |||||||||
| Jupiter Securitization Co., LLC 0.19%–0.21% due 1/15–3/21/20135 | 75,800 | 75,789 | ||||||||||
| Coca-Cola Co. 0.16%–0.24% due 1/17–2/8/20135 | 129,346 | 129,334 | .23 | |||||||||
| Fannie Mae 0.125%–0.18% due 1/2–10/1/2013 | 1,286,193 | 1,285,967 | 2.25 | |||||||||
| Federal Farm Credit Banks 0.14%–0.22% due 2/25–11/21/2013 | 722,600 | 722,013 | 1.26 | |||||||||
| Federal Home Loan Bank 0.11%–0.22% due 1/8–9/12/2013 | 811,000 | 810,807 | 1.42 | |||||||||
| Freddie Mac 0.10%–0.22% due 1/7–7/8/2013 | 1,173,505 | 1,173,296 | 2.05 | |||||||||
| U.S. Treasury Bills 0.135%–0.193% due 1/24–9/19/2013 | 458,900 | 458,700 | .80 | |||||||||
| Other securities | 438,874 | .77 | ||||||||||
| Total short-term securities (cost: $5,133,157,000) | 5,134,170 | 8.98 | ||||||||||
| Total investment securities (cost: $43,289,051,000) | 57,341,194 | 100.26 | ||||||||||
| Other assets less liabilities | (146,250 | ) | (.26 | ) | ||||||||
| Net assets | $ | 57,194,944 | 100.00 | % | ||||||||
As permitted by U.S. Securities and Exchange Commission regulations, “Miscellaneous” securities include holdings in their first year of acquisition that have not previously been publicly disclosed.
“Other securities” includes all issues that are not disclosed separately in the summary investment portfolio.
| 16 | The Investment Company of America |
Investments in affiliates
A company is considered to be an affiliate of the fund under the Investment Company Act of 1940 if the fund’s holdings in that company represent 5% or more of the outstanding voting shares. The value of the fund’s holdings in affiliated companies is included in “Other securities” under the respective industry sectors in the summary investment portfolio. Further details on these holdings and related transactions during the year ended December 31, 2012, appear below.
| Beginning shares | Additions | Reductions | Ending shares | Dividend income (000) | Value of affiliates at 12/31/2012 (000) | |||||||||||||||||||
| Masco Corp. | 23,258,069 | — | 929,000 | 22,329,069 | $ | 6,908 | $ | 372,002 | ||||||||||||||||
| R.R. Donnelley & Sons Co. | 8,935,000 | 1,200,000 | — | 10,135,000 | 10,430 | 91,215 | ||||||||||||||||||
| $ | 17,338 | $ | 463,217 | |||||||||||||||||||||
The following footnotes apply to either the individual securities noted or one or more of the securities aggregated and listed as a single line item.
| 1 | Valued under fair value procedures adopted by authority of the board of trustees. The total value of all such securities, including those in “Miscellaneous” and “Other securities,” was $4,625,307,000, which represented 8.09% of the net assets of the fund. This entire amount relates to certain securities trading outside the U.S. whose values were adjusted as a result of significant market movements following the close of local trading. |
| 2 | Security did not produce income during the last 12 months. |
| 3 | Includes a security that has been authorized but not yet issued. |
| 4 | Coupon rate may change periodically. |
| 5 | Acquired in a transaction exempt from registration under section 4(2) of the Securities Act of 1933. May be resold in the U.S. in transactions exempt from registration, normally to qualified institutional buyers. The total value of all such securities, including those in “Other securities,” was $614,632,000, which represented 1.07% of the net assets of the fund. |
Key to abbreviation
ADR = American Depositary Receipts
See Notes to Financial Statements
| The Investment Company of America | 17 |
Financial statements
| Statement of assets and liabilities at December 31, 2012 | (dollars in thousands) | |||||||
| Assets: | ||||||||
| Investment securities, at value: | ||||||||
| Unaffiliated issuers (cost: $42,896,157) | $ | 56,877,977 | ||||||
| Affiliated issuers (cost: $392,894) | 463,217 | $ | 57,341,194 | |||||
| Cash | 13,666 | |||||||
| Receivables for: | ||||||||
| Sales of investments | 36,576 | |||||||
| Sales of fund’s shares | 136,438 | |||||||
| Dividends and interest | 87,638 | 260,652 | ||||||
| 57,615,512 | ||||||||
| Liabilities: | ||||||||
| Payables for: | ||||||||
| Purchases of investments | 180,154 | |||||||
| Repurchases of fund’s shares | 202,128 | |||||||
| Investment advisory services | 11,757 | |||||||
| Services provided by related parties | 19,552 | |||||||
| Trustees’ deferred compensation | 6,397 | |||||||
| Other | 580 | 420,568 | ||||||
| Net assets at December 31, 2012 | $ | 57,194,944 | ||||||
| Net assets consist of: | ||||||||
| Capital paid in on shares of beneficial interest | $ | 43,050,329 | ||||||
| Undistributed net investment income | 92,244 | |||||||
| Net unrealized appreciation | 14,052,371 | |||||||
| Net assets at December 31, 2012 | $ | 57,194,944 | ||||||
| (dollars and shares in thousands, except per-share amounts) | ||||
| Shares of beneficial interest issued and outstanding (no stated par value) — | ||||
| unlimited shares authorized (1,897,358 total shares outstanding) | ||||
| Shares | Net asset value | |||||||||||
| Net assets | outstanding | per share | ||||||||||
| Class A | $ | 44,501,136 | 1,475,564 | $ | 30.16 | |||||||
| Class B | 551,933 | 18,361 | 30.06 | |||||||||
| Class C | 1,619,901 | 54,084 | 29.95 | |||||||||
| Class F-1 | 1,842,176 | 61,178 | 30.11 | |||||||||
| Class F-2 | 769,665 | 25,527 | 30.15 | |||||||||
| Class 529-A | 1,561,680 | 51,859 | 30.11 | |||||||||
| Class 529-B | 81,241 | 2,701 | 30.07 | |||||||||
| Class 529-C | 372,260 | 12,391 | 30.04 | |||||||||
| Class 529-E | 61,350 | 2,042 | 30.05 | |||||||||
| Class 529-F-1 | 36,684 | 1,219 | 30.09 | |||||||||
| Class R-1 | 72,561 | 2,418 | 30.01 | |||||||||
| Class R-2 | 584,313 | 19,456 | 30.03 | |||||||||
| Class R-3 | 743,007 | 24,694 | 30.09 | |||||||||
| Class R-4 | 705,122 | 23,420 | 30.11 | |||||||||
| Class R-5 | 696,513 | 23,102 | 30.15 | |||||||||
| Class R-6 | 2,995,402 | 99,342 | 30.15 | |||||||||
See Notes to Financial Statements
| 18 | The Investment Company of America |
| Statement of operations for the year ended December 31, 2012 | (dollars in thousands) | |||||||
| Investment income: | ||||||||
| Income: | ||||||||
| Dividends (net of non-U.S. taxes of $23,261; also includes $17,338 from affiliates) | $ | 1,471,415 | ||||||
| Interest | 47,190 | $ | 1,518,605 | |||||
| Fees and expenses*: | ||||||||
| Investment advisory services | 139,056 | |||||||
| Distribution services | 151,505 | |||||||
| Transfer agent services | 70,924 | |||||||
| Administrative services | 10,448 | |||||||
| Reports to shareholders | 2,627 | |||||||
| Registration statement and prospectus | 570 | |||||||
| Trustees’ compensation | 1,158 | |||||||
| Auditing and legal | 150 | |||||||
| Custodian | 698 | |||||||
| State and local taxes | 287 | |||||||
| Other | 2,264 | 379,687 | ||||||
| Net investment income | 1,138,918 | |||||||
| Net realized gain and unrealized appreciation on investments and currency: | ||||||||
| Net realized gain (loss) on: | ||||||||
| Investments (also includes $1,946 net gain from affiliates) | 1,302,026 | |||||||
| Currency transactions | (2,046 | ) | 1,299,980 | |||||
| Net unrealized appreciation on: | ||||||||
| Investments | 5,801,686 | |||||||
| Currency translations | 492 | 5,802,178 | ||||||
| Net realized gain and unrealized appreciation on investments and currency | 7,102,158 | |||||||
| Net increase in net assets resulting from operations | $ | 8,241,076 | ||||||
* Additional information related to class-specific fees and expenses is included in the Notes to Financial Statements.
| Statements of changes in net assets | (dollars in thousands) | |||||||
| Year ended December 31 | ||||||||
| 2012 | 2011 | |||||||
| Operations: | ||||||||
| Net investment income | $ | 1,138,918 | $ | 1,184,346 | ||||
| Net realized gain on investments and currency transactions | 1,299,980 | 1,354,309 | ||||||
| Net unrealized appreciation (depreciation) on investments and currency translations | 5,802,178 | (3,588,402 | ) | |||||
| Net increase (decrease) in net assets resulting from operations | 8,241,076 | (1,049,747 | ) | |||||
| Dividends and distributions paid to shareholders: | ||||||||
| Dividends from net investment income | (1,351,622 | ) | (1,183,860 | ) | ||||
| Distributions from net realized gain on investments | (781,791 | ) | — | |||||
| Total dividends and distributions paid to shareholders | (2,133,413 | ) | (1,183,860 | ) | ||||
| Net capital share transactions | (3,668,713 | ) | (5,098,241 | ) | ||||
| Total increase (decrease) in net assets | 2,438,950 | (7,331,848 | ) | |||||
| Net assets: | ||||||||
| Beginning of year | 54,755,994 | 62,087,842 | ||||||
| End of year (including undistributed net investment income: | ||||||||
| $92,244 and $297,149, respectively) | $ | 57,194,944 | $ | 54,755,994 | ||||
See Notes to Financial Statements
| The Investment Company of America | 19 |
Notes to financial statements
1. Organization
The Investment Company of America (the “fund”) is registered under the Investment Company Act of 1940 as an open-end, diversified management investment company. The fund seeks long-term growth of capital and income, placing greater emphasis on the potential for capital appreciation and future dividends than on current yield.
The fund has 16 share classes consisting of five retail share classes (Classes A, B and C, as well as two F share classes, F-1 and F-2), five 529 college savings plan share classes (Classes 529-A, 529-B, 529-C, 529-E and 529-F-1) and six retirement plan share classes (Classes R-1, R-2, R-3, R-4, R-5 and R-6). The 529 college savings plan share classes can be used to save for college education. The retirement plan share classes are generally offered only through eligible employer-sponsored retirement plans. The fund’s share classes are further described below:
| Contingent deferred sales | ||||||
| Share class | Initial sales charge | charge upon redemption | Conversion feature | |||
| Classes A and 529-A | Up to 5.75% | None (except 1% for certain redemptions within one year of purchase without an initial sales charge) | None | |||
| Classes B and 529-B* | None | Declines from 5% to 0% for redemptions within six years of purchase | Classes B and 529-B convert to Classes A and 529-A, respectively, after eight years | |||
| Class C | None | 1% for redemptions within one year of purchase | Class C converts to Class F-1 after 10 years | |||
| Class 529-C | None | 1% for redemptions within one year of purchase | None | |||
| Class 529-E | None | None | None | |||
| Classes F-1, F-2 and 529-F-1 | None | None | None | |||
| Classes R-1, R-2, R-3, R-4, R-5 and R-6 | None | None | None |
* Class B and 529-B shares of the fund are not available for purchase.
Holders of all share classes have equal pro rata rights to assets, dividends and liquidation proceeds. Each share class has identical voting rights, except for the exclusive right to vote on matters affecting only its class. Share classes have different fees and expenses (“class-specific fees and expenses”), primarily due to different arrangements for distribution, administrative and shareholder services. Differences in class-specific fees and expenses will result in differences in net investment income and, therefore, the payment of different per-share dividends by each class.
2. Significant accounting policies
The financial statements have been prepared to comply with accounting principles generally accepted in the United States of America. These principles require management to make estimates and assumptions that affect reported amounts and disclosures. Actual results could differ from those estimates. The fund follows the significant accounting policies described below, as well as the valuation policies described in the next section on valuation.
Security transactions and related investment income — Security transactions are recorded by the fund as of the date the trades are executed with brokers. Realized gains and losses from security transactions are determined based on the specific identified cost of the securities. In the event a security is purchased with a delayed payment date, the fund will segregate liquid assets sufficient to meet its payment obligations. Dividend income is recognized on the ex-dividend date and interest income is recognized on an accrual basis. Market discounts, premiums and original issue discounts on fixed-income securities are amortized daily over the expected life of the security.
Class allocations — Income, fees and expenses (other than class-specific fees and expenses) and realized and unrealized gains and losses are allocated daily among the various share classes based on their relative net assets. Class-specific fees and expenses, such as distribution, administrative and shareholder services, are charged directly to the respective share class.
Dividends and distributions to shareholders — Dividends and distributions paid to shareholders are recorded on the ex-dividend date.
Currency translation — Assets and liabilities, including investment securities, denominated in currencies other than U.S. dollars are translated into U.S. dollars at the exchange rates supplied by one or more pricing vendors on the valuation date. Purchases and sales of investment securities and income and expenses are translated into U.S. dollars at the exchange rates on the dates of such transactions.
| 20 | The Investment Company of America |
On the accompanying financial statements, the effects of changes in exchange rates on investment securities are included with the net realized gain or loss and net unrealized appreciation or depreciation on investments. The realized gain or loss and unrealized appreciation or depreciation resulting from all other transactions denominated in currencies other than U.S. dollars are disclosed separately.
3. Valuation
Capital Research and Management Company (“CRMC”), the fund’s investment adviser, values the fund’s investments at fair value as defined by accounting principles generally accepted in the United States of America. The net asset value of each share class of the fund is generally determined as of approximately 4:00 p.m. New York time each day the New York Stock Exchange is open.
Methods and inputs — The fund’s investment adviser uses the following methods and inputs to establish the fair value of the fund’s assets and liabilities. Use of particular methods and inputs may vary over time based on availability and relevance as market and economic conditions evolve.
Equity securities are generally valued at the official closing price of, or the last reported sale price on, the exchange or market on which such securities are traded, as of the close of business on the day the securities are being valued or, lacking any sales, at the last available bid price. Prices for each security are taken from the principal exchange or market on which the security trades.
Fixed-income securities, including short-term securities purchased with more than 60 days left to maturity, are generally valued at prices obtained from one or more pricing vendors. Vendors value such securities based on one or more of the inputs described in the following table. The table provides examples of inputs that are commonly relevant for valuing particular classes of fixed-income securities in which the fund is authorized to invest. However, these classifications are not exclusive, and any of the inputs may be used to value any other class of fixed-income security.
| Fixed-income class | Examples of standard inputs |
| All | Benchmark yields, transactions, bids, offers, quotations from dealers and trading systems, new issues, spreads and other relationships observed in the markets among comparable securities; and proprietary pricing models such as yield measures calculated using factors such as cash flows, financial or collateral performance and other reference data (collectively referred to as “standard inputs”) |
| Corporate bonds & notes; convertible securities | Standard inputs and underlying equity of the issuer |
| Bonds & notes of governments & government agencies | Standard inputs and interest rate volatilities |
| Mortgage-backed; asset-backed obligations | Standard inputs and cash flows, prepayment information, default rates, delinquency and loss assumptions, collateral characteristics, credit enhancements and specific deal information |
When the fund’s investment adviser deems it appropriate to do so (such as when vendor prices are unavailable or not deemed to be representative), fixed-income securities will be valued in good faith at the mean quoted bid and ask prices that are reasonably and timely available (or bid prices, if ask prices are not available) or at prices for securities of comparable maturity, quality and type.
Securities with both fixed-income and equity characteristics, or equity securities traded principally among fixed-income dealers, are generally valued in the manner described above for either equity or fixed-income securities, depending on which method is deemed most appropriate by the fund’s investment adviser. Short-term securities purchased within 60 days to maturity are valued at amortized cost, which approximates fair value. The value of short-term securities originally purchased with maturities greater than 60 days is determined based on an amortized value to par when they reach 60 days.
Securities and other assets for which representative market quotations are not readily available or are considered unreliable by the fund’s investment adviser are fair valued as determined in good faith under fair value guidelines adopted by authority of the fund’s board of trustees as further described below. The investment adviser follows fair valuation guidelines, consistent with U.S. Securities and Exchange Commission rules and guidance, to consider relevant principles and factors when making fair value determinations. The investment adviser considers relevant indications of value that are reasonably and timely available to it in determining the fair value to be assigned to a particular security, such as the type and cost of the security; contractual or legal restrictions on resale of the security; relevant financial or business developments of the issuer; actively traded similar or related securities; conversion or exchange rights on the security; related corporate actions; significant events occurring after the close of trading in the security; and changes in overall market conditions. In addition, the closing prices of equity securities that trade in markets outside U.S. time zones may be adjusted to reflect significant events that occur after the close of local trading
| The Investment Company of America | 21 |
but before the net asset value of each share class of the fund is determined. Fair valuations and valuations of investments that are not actively trading involve judgment and may differ materially from valuations that would have been used had greater market activity occurred.
Processes and structure — The fund’s board of trustees has delegated authority to the fund’s investment adviser to make fair value determinations, subject to board oversight. The investment adviser has established a Joint Fair Valuation Committee (the “Fair Valuation Committee”) to administer, implement and oversee the fair valuation process, and to make fair value decisions. The Fair Valuation Committee regularly reviews its own fair value decisions, as well as decisions made under its standing instructions to the investment adviser’s valuation teams. The Fair Valuation Committee reviews changes in fair value measurements from period to period and may, as deemed appropriate, update the fair valuation guidelines to better reflect the results of back testing and address new or evolving issues. The Fair Valuation Committee reports any changes to the fair valuation guidelines to the board of trustees with supplemental information to support the changes. The fund’s board and audit committee also regularly review reports that describe fair value determinations and methods.
The fund’s investment adviser has also established a Fixed-Income Pricing Review Group to administer and oversee the fixed-income valuation process, including the use of fixed-income pricing vendors. This group regularly reviews pricing vendor information and market data. Pricing decisions, processes and controls over security valuation are also subject to additional internal reviews, including an annual control self-evaluation program facilitated by the investment adviser’s compliance group.
Classifications — The fund’s investment adviser classifies the fund’s assets and liabilities into three levels based on the inputs used to value the assets or liabilities. Level 1 values are based on quoted prices in active markets for identical securities. Level 2 values are based on significant observable market inputs, such as quoted prices for similar securities and quoted prices in inactive markets. Certain securities trading outside the U.S. may transfer between Level 1 and Level 2 due to valuation adjustments resulting from significant market movements following the close of local trading. Level 3 values are based on significant unobservable inputs that reflect the investment adviser’s determination of assumptions that market participants might reasonably use in valuing the securities. The valuation levels are not necessarily an indication of the risk or liquidity associated with the underlying investment. For example, U.S. government securities are reflected as Level 2 because the inputs used to determine fair value may not always be quoted prices in an active market. The following table presents the fund’s valuation levels as of December 31, 2012 (dollars in thousands):
| Investment securities | ||||||||||||||||
| Level 1 | Level 2* | Level 3 | Total | |||||||||||||
| Assets: | ||||||||||||||||
| Common stocks | ||||||||||||||||
| Energy | $ | 6,134,916 | $ | 1,613,368 | $ | — | $ | 7,748,284 | ||||||||
| Materials | 2,136,613 | 174,993 | — | 2,311,606 | ||||||||||||
| Industrials | 5,977,896 | 154,226 | — | 6,132,122 | ||||||||||||
| Consumer discretionary | 6,648,624 | 267,473 | — | 6,916,097 | ||||||||||||
| Consumer staples | 6,330,846 | — | — | 6,330,846 | ||||||||||||
| Health care | 5,606,270 | 642,847 | — | 6,249,117 | ||||||||||||
| Financials | 1,803,548 | 362,272 | — | 2,165,820 | ||||||||||||
| Information technology | 7,023,617 | 581,409 | — | 7,605,026 | ||||||||||||
| Telecommunication services | 3,193,144 | 216,153 | — | 3,409,297 | ||||||||||||
| Utilities | 1,118,723 | 207,808 | — | 1,326,531 | ||||||||||||
| Miscellaneous | 799,607 | 404,758 | — | 1,204,365 | ||||||||||||
| Convertible securities | 399,855 | 71,110 | — | 470,965 | ||||||||||||
| Bonds & notes | — | 336,948 | — | 336,948 | ||||||||||||
| Short-term securities | — | 5,134,170 | — | 5,134,170 | ||||||||||||
| Total | $ | 47,173,659 | $ | 10,167,535 | $ | — | $ | 57,341,194 | ||||||||
| * | Securities with a market value of $3,180,611,000, which represented 5.56% of the net assets of the fund, transferred from Level 1 to Level 2 since the prior fiscal year-end, primarily due to significant market movements following the close of local trading. |
4. Risk factors
Investing in the fund may involve certain risks including, but not limited to, those described below.
Market conditions — The prices of, and the income generated by, the common stocks and other securities held by the fund may decline due to market conditions and other factors, including those directly involving the issuers of securities held by the fund.
| 22 | The Investment Company of America |
Investing in income-oriented stocks — Income provided by the fund may be reduced by changes in the dividend policies of, and the capital resources available at, the companies in which the fund invests.
Investing in growth-oriented stocks — Growth-oriented stocks may involve larger price swings and greater potential for loss than other types of investments.
Investing outside the U.S. — Securities of issuers domiciled outside the U.S., or with significant operations outside the U.S., may lose value because of adverse political, social, economic or market developments in the countries or regions in which the issuer operates. These securities may also lose value due to changes in foreign currency exchange rates against the U.S. dollar and/or currencies of other countries. Securities markets in certain countries may be more volatile and/or less liquid than those in the U.S. Investments outside the U.S. may also be subject to different settlement and accounting practices and different regulatory, legal and reporting standards, and may be more difficult to value, than those in the U.S.
Management — The investment adviser to the fund actively manages the fund’s investments. Consequently, the fund is subject to the risk that the methods and analyses employed by the investment adviser in this process may not produce the desired results. This could cause the fund to lose value or its investment results to lag relevant benchmarks or other funds with similar objectives.
5. Taxation and distributions
Federal income taxation — The fund complies with the requirements under Subchapter M of the Internal Revenue Code applicable to mutual funds and intends to distribute substantially all of its net taxable income and net capital gains each year. The fund is not subject to income taxes to the extent such distributions are made. Therefore, no federal income tax provision is required.
As of and during the period ended December 31, 2012, the fund did not have a liability for any unrecognized tax benefits. The fund recognizes interest and penalties, if any, related to unrecognized tax benefits as income tax expense in the statement of operations. During the period, the fund did not incur any interest or penalties.
The fund is not subject to examination by U.S. federal tax authorities for tax years before 2009 and by state tax authorities for tax years before 2008.
Non-U.S. taxation — Dividend and interest income are recorded net of non-U.S. taxes paid.
Distributions — Distributions paid to shareholders are based on net investment income and net realized gains determined on a tax basis, which may differ from net investment income and net realized gains for financial reporting purposes. These differences are due primarily to different treatment for items such as currency gains and losses; short-term capital gains and losses; deferred expenses; net capital losses; and income on certain investments. The fiscal year in which amounts are distributed may differ from the year in which the net investment income and net realized gains are recorded by the fund for financial reporting purposes. The fund may also designate a portion of the amount paid to redeeming shareholders as a distribution for tax purposes.
During the year ended December 31, 2012, the fund reclassified $7,892,000 from undistributed net realized gain to undistributed net investment income; and $93,000 from undistributed net investment income and $27,369,000 from undistributed net realized gain to capital paid in on shares of beneficial interest to align financial reporting with tax reporting. The fund also utilized capital loss carryforward of $387,836,000.
As of December 31, 2012, the tax basis components of distributable earnings, unrealized appreciation (depreciation) and cost of investment securities were as follows (dollars in thousands):
| Undistributed ordinary income | $ | 99,819 | ||
| Gross unrealized appreciation on investment securities | 15,663,705 | |||
| Gross unrealized depreciation on investment securities | (1,613,568 | ) | ||
| Net unrealized appreciation on investment securities | 14,050,137 | |||
| Cost of investment securities | 43,291,057 |
| The Investment Company of America | 23 |
The tax character of distributions paid to shareholders was as follows (dollars in thousands):
| Year ended December 31, 2012 | Year ended December 31, 2011 | |||||||||||||||||||||||
| Total | Total | |||||||||||||||||||||||
| Ordinary | Long-term | distributions | Ordinary | Long-term | distributions | |||||||||||||||||||
| Share class | income | capital gains | paid | income | capital gains | paid | ||||||||||||||||||
| Class A | $ | 1,071,006 | $ | 609,471 | $ | 1,680,477 | $ | 945,530 | $ | — | $ | 945,530 | ||||||||||||
| Class B | 9,875 | 7,562 | 17,437 | 13,329 | — | 13,329 | ||||||||||||||||||
| Class C | 26,640 | 22,282 | 48,922 | 24,855 | — | 24,855 | ||||||||||||||||||
| Class F-1 | 44,021 | 25,194 | 69,215 | 35,112 | — | 35,112 | ||||||||||||||||||
| Class F-2 | 18,360 | 10,625 | 28,985 | 14,859 | — | 14,859 | ||||||||||||||||||
| Class 529-A | 35,107 | 21,292 | 56,399 | 27,601 | — | 27,601 | ||||||||||||||||||
| Class 529-B | 1,300 | 1,113 | 2,413 | 1,534 | — | 1,534 | ||||||||||||||||||
| Class 529-C | 5,636 | 5,099 | 10,735 | 4,236 | — | 4,236 | ||||||||||||||||||
| Class 529-E | 1,246 | 841 | 2,087 | 983 | — | 983 | ||||||||||||||||||
| Class 529-F-1 | 881 | 498 | 1,379 | 671 | — | 671 | ||||||||||||||||||
| Class R-1 | 1,243 | 1,016 | 2,259 | 988 | — | 988 | ||||||||||||||||||
| Class R-2 | 9,632 | 8,027 | 17,659 | 7,914 | — | 7,914 | ||||||||||||||||||
| Class R-3 | 15,612 | 10,228 | 25,840 | 13,622 | — | 13,622 | ||||||||||||||||||
| Class R-4 | 16,637 | 9,624 | 26,261 | 13,842 | — | 13,842 | ||||||||||||||||||
| Class R-5 | 19,488 | 9,503 | 28,991 | 19,777 | — | 19,777 | ||||||||||||||||||
| Class R-6 | 74,938 | 39,416 | 114,354 | 59,007 | — | 59,007 | ||||||||||||||||||
| Total | $ | 1,351,622 | $ | 781,791 | $ | 2,133,413 | $ | 1,183,860 | $ | — | $ | 1,183,860 | ||||||||||||
6. Fees and transactions with related parties
CRMC, the fund’s investment adviser, is the parent company of American Funds Distributors,® Inc. (“AFD”), the principal underwriter of the fund’s shares, and American Funds Service Company® (“AFS”), the fund’s transfer agent.
Investment advisory services — The fund has an investment advisory and service agreement with CRMC that provides for monthly fees accrued daily. These fees are based on a series of decreasing annual rates beginning with 0.390% on the first $1 billion of daily net assets and decreasing to 0.219% on such assets in excess of $89 billion. For the year ended December 31, 2012, the investment advisory services fee was $139,056,000, which was equivalent to an annualized rate of 0.242% of average daily net assets.
Class-specific fees and expenses — Expenses that are specific to individual share classes are accrued directly to the respective share class. The principal class-specific fees and expenses are described below:
Distribution services — The fund has plans of distribution for all share classes, except Class F-2, R-5 and R-6 shares. Under the plans, the board of trustees approves certain categories of expenses that are used to finance activities primarily intended to sell fund shares and service existing accounts. The plans provide for payments, based on an annualized percentage of average daily net assets, ranging from 0.25% to 1.00% as noted on the following page. In some cases, the board of trustees has limited the amounts that may be paid to less than the maximum allowed by the plans. All share classes with a plan may use up to 0.25% of average daily net assets to pay service fees, or to compensate AFD for paying service fees, to firms that have entered into agreements with AFD to provide certain shareholder services. The remaining amounts available to be paid under each plan are paid to dealers to compensate them for their sales activities.
For Class A and 529-A shares, distribution-related expenses include the reimbursement of dealer and wholesaler commissions paid by AFD for certain shares sold without a sales charge. These share classes reimburse AFD for amounts billed within the prior 15 months but only to the extent that the overall annual expense limit of 0.25% is not exceeded. As of December 31, 2012, there were no unreimbursed expenses subject to reimbursement for Class A or 529-A shares.
| 24 | The Investment Company of America |
| Share class | Currently approved limits | Plan limits | ||||||
| Class A | 0.25 | % | 0.25 | % | ||||
| Class 529-A | 0.25 | 0.50 | ||||||
| Classes B and 529-B | 1.00 | 1.00 | ||||||
| Classes C, 529-C and R-1 | 1.00 | 1.00 | ||||||
| Class R-2 | 0.75 | 1.00 | ||||||
| Classes 529-E and R-3 | 0.50 | 0.75 | ||||||
| Classes F-1, 529-F-1 and R-4 | 0.25 | 0.50 | ||||||
Transfer agent services — The fund has a shareholder services agreement with AFS under which the fund compensates AFS for providing transfer agent services to each of the fund’s share classes. These services include recordkeeping, shareholder communications and transaction processing. In addition, the fund reimburses AFS for amounts paid to third parties for performing transfer agent services on behalf of fund shareholders.
Administrative services — The board of trustees approved an amended administrative services agreement with CRMC effective January 1, 2012. Under this agreement, Class A shares pay an annual fee of 0.01% and Class C, F, 529 and R shares pay an annual fee of 0.05% of their respective average daily net assets to compensate CRMC for providing administrative services. These services include, but are not limited to, coordinating, monitoring, assisting and overseeing third parties that provide services to fund shareholders.
529 plan services — Each 529 share class is subject to service fees to compensate the Commonwealth of Virginia for the maintenance of the 529 college savings plan. The quarterly fee is based on a series of decreasing annual rates beginning with 0.10% on the first $30 billion of the net assets invested in Class 529 shares of the American Funds and decreasing to 0.06% on such assets between $120 billion and $150 billion. The fee for any given calendar quarter is accrued and calculated on the basis of the average net assets of Class 529 shares of the American Funds for the last month of the prior calendar quarter. The fee is included in other expenses on the accompanying financial statements. The Commonwealth of Virginia is not considered a related party.
Class-specific expenses under the agreements described above for the year ended December 31, 2012, were as follows (dollars in thousands):
| Distribution | Transfer agent | Administrative | 529 plan | |||||||||||||
| Share class | services | services | services | services | ||||||||||||
| Class A | $ | 103,711 | $ | 58,225 | $ | 4,479 | Not applicable | |||||||||
| Class B | 6,869 | 911 | Not applicable | Not applicable | ||||||||||||
| Class C | 17,203 | 2,244 | 864 | Not applicable | ||||||||||||
| Class F-1 | 4,753 | 2,173 | 953 | Not applicable | ||||||||||||
| Class F-2 | Not applicable | 653 | 327 | Not applicable | ||||||||||||
| Class 529-A | 3,311 | 1,509 | 752 | $ | 1,494 | |||||||||||
| Class 529-B | 969 | 116 | 49 | 97 | ||||||||||||
| Class 529-C | 3,615 | 398 | 182 | 362 | ||||||||||||
| Class 529-E | 299 | 41 | 30 | 59 | ||||||||||||
| Class 529-F-1 | — | 34 | 17 | 34 | ||||||||||||
| Class R-1 | 789 | 88 | 39 | Not applicable | ||||||||||||
| Class R-2 | 4,412 | 2,103 | 297 | Not applicable | ||||||||||||
| Class R-3 | 3,843 | 1,362 | 387 | Not applicable | ||||||||||||
| Class R-4 | 1,731 | 687 | 349 | Not applicable | ||||||||||||
| Class R-5 | Not applicable | 375 | 375 | Not applicable | ||||||||||||
| Class R-6 | Not applicable | 5 | 1,348 | Not applicable | ||||||||||||
| Total class-specific expenses | $ | 151,505 | $ | 70,924 | $ | 10,448 | $ | 2,046 | ||||||||
Trustees’ deferred compensation — Trustees who are unaffiliated with CRMC may elect to defer the cash payment of part or all of their compensation. These deferred amounts, which remain as liabilities of the fund, are treated as if invested in shares of the fund or other American Funds. These amounts represent general, unsecured liabilities of the fund and vary according to the total returns of the selected funds. Trustees’ compensation of $1,158,000, shown on the accompanying financial statements, includes $397,000 in current fees (either paid in cash or deferred) and a net increase of $761,000 in the value of the deferred amounts.
Affiliated officers and trustees — Officers and certain trustees of the fund are or may be considered to be affiliated with CRMC, AFS and AFD. No affiliated officers or trustees received any compensation directly from the fund.
| The Investment Company of America | 25 |
7. Warrants
As of December 31, 2012, the fund had warrants outstanding which may be exercised at any time for the purchase of 818,231 Class A shares at approximately $5.24 per share. If these warrants had been exercised as of December 31, 2012, the net asset value of each share class would have been reduced by less than $0.02 per share. There were 25 warrants exercised during the year ended December 31, 2012, but there were no warrants exercised during the year ended December 31, 2011.
8. Capital share transactions
Capital share transactions in the fund were as follows (dollars and shares in thousands):
| Reinvestments of | ||||||||||||||||||||||||||||||||
| Sales* | dividends and distributions | Repurchases* | Net (decrease) increase | |||||||||||||||||||||||||||||
| Share class | Amount | Shares | Amount | Shares | Amount | Shares | Amount | Shares | ||||||||||||||||||||||||
| Year ended December 31, 2012 | ||||||||||||||||||||||||||||||||
| Class A | $ | 2,174,749 | 73,644 | $ | 1,615,317 | 53,779 | $ | (6,701,282 | ) | (226,250 | ) | $ | (2,911,216 | ) | (98,827 | ) | ||||||||||||||||
| Class B | 7,619 | 260 | 17,272 | 577 | (394,365 | ) | (13,507 | ) | (369,474 | ) | (12,670 | ) | ||||||||||||||||||||
| Class C | 130,503 | 4,448 | 47,679 | 1,596 | (516,276 | ) | (17,641 | ) | (338,094 | ) | (11,597 | ) | ||||||||||||||||||||
| Class F-1 | 638,424 | 21,717 | 67,835 | 2,262 | (798,017 | ) | (27,302 | ) | (91,758 | ) | (3,323 | ) | ||||||||||||||||||||
| Class F-2 | 237,373 | 7,947 | 26,777 | 892 | (166,548 | ) | (5,596 | ) | 97,602 | 3,243 | ||||||||||||||||||||||
| Class 529-A | 181,153 | 6,153 | 56,376 | 1,879 | (193,436 | ) | (6,533 | ) | 44,093 | 1,499 | ||||||||||||||||||||||
| Class 529-B | 1,600 | 54 | 2,413 | 80 | (45,368 | ) | (1,550 | ) | (41,355 | ) | (1,416 | ) | ||||||||||||||||||||
| Class 529-C | 43,544 | 1,483 | 10,724 | 358 | (56,394 | ) | (1,913 | ) | (2,126 | ) | (72 | ) | ||||||||||||||||||||
| Class 529-E | 6,280 | 214 | 2,085 | 70 | (8,484 | ) | (287 | ) | (119 | ) | (3 | ) | ||||||||||||||||||||
| Class 529-F-1 | 8,346 | 282 | 1,378 | 46 | (7,063 | ) | (239 | ) | 2,661 | 89 | ||||||||||||||||||||||
| Class R-1 | 15,321 | 524 | 2,255 | 75 | (27,662 | ) | (937 | ) | (10,086 | ) | (338 | ) | ||||||||||||||||||||
| Class R-2 | 124,036 | 4,217 | 17,641 | 589 | (197,834 | ) | (6,721 | ) | (56,157 | ) | (1,915 | ) | ||||||||||||||||||||
| Class R-3 | 162,790 | 5,547 | 25,806 | 861 | (265,357 | ) | (8,976 | ) | (76,761 | ) | (2,568 | ) | ||||||||||||||||||||
| Class R-4 | 153,761 | 5,196 | 26,249 | 875 | (208,799 | ) | (7,071 | ) | (28,789 | ) | (1,000 | ) | ||||||||||||||||||||
| Class R-5 | 82,906 | 2,815 | 28,957 | 965 | (259,411 | ) | (8,771 | ) | (147,548 | ) | (4,991 | ) | ||||||||||||||||||||
| Class R-6 | 569,190 | 19,132 | 114,353 | 3,808 | (423,129 | ) | (14,298 | ) | 260,414 | 8,642 | ||||||||||||||||||||||
| Total net increase (decrease) | $ | 4,537,595 | 153,633 | $ | 2,063,117 | 68,712 | $ | (10,269,425 | ) | (347,592 | ) | $ | (3,668,713 | ) | (125,247 | ) | ||||||||||||||||
| Year ended December 31, 2011 | ||||||||||||||||||||||||||||||||
| Class A | $ | 2,591,052 | 92,718 | $ | 900,445 | 32,702 | $ | (7,911,508 | ) | (283,675 | ) | $ | (4,420,011 | ) | (158,255 | ) | ||||||||||||||||
| Class B | 13,395 | 481 | 13,081 | 475 | (580,423 | ) | (20,926 | ) | (553,947 | ) | (19,970 | ) | ||||||||||||||||||||
| Class C | 154,710 | 5,562 | 23,946 | 876 | (547,074 | ) | (19,844 | ) | (368,418 | ) | (13,406 | ) | ||||||||||||||||||||
| Class F-1 | 690,634 | 24,783 | 33,781 | 1,233 | (469,661 | ) | (16,930 | ) | 254,754 | 9,086 | ||||||||||||||||||||||
| Class F-2 | 123,467 | 4,385 | 11,412 | 417 | (175,136 | ) | (6,287 | ) | (40,257 | ) | (1,485 | ) | ||||||||||||||||||||
| Class 529-A | 190,204 | 6,835 | 27,593 | 1,005 | (163,462 | ) | (5,894 | ) | 54,335 | 1,946 | ||||||||||||||||||||||
| Class 529-B | 2,120 | 76 | 1,530 | 55 | (52,467 | ) | (1,896 | ) | (48,817 | ) | (1,765 | ) | ||||||||||||||||||||
| Class 529-C | 45,157 | 1,625 | 4,235 | 154 | (51,698 | ) | (1,871 | ) | (2,306 | ) | (92 | ) | ||||||||||||||||||||
| Class 529-E | 7,000 | 253 | 983 | 36 | (7,539 | ) | (273 | ) | 444 | 16 | ||||||||||||||||||||||
| Class 529-F-1 | 9,630 | 343 | 671 | 25 | (5,879 | ) | (215 | ) | 4,422 | 153 | ||||||||||||||||||||||
| Class R-1 | 17,478 | 629 | 985 | 36 | (19,456 | ) | (700 | ) | (993 | ) | (35 | ) | ||||||||||||||||||||
| Class R-2 | 135,837 | 4,886 | 7,908 | 289 | (197,884 | ) | (7,129 | ) | (54,139 | ) | (1,954 | ) | ||||||||||||||||||||
| Class R-3 | 196,980 | 7,044 | 13,617 | 496 | (269,855 | ) | (9,708 | ) | (59,258 | ) | (2,168 | ) | ||||||||||||||||||||
| Class R-4 | 178,597 | 6,386 | 13,835 | 504 | (187,204 | ) | (6,684 | ) | 5,228 | 206 | ||||||||||||||||||||||
| Class R-5 | 147,341 | 5,225 | 19,748 | 717 | (262,051 | ) | (9,659 | ) | (94,962 | ) | (3,717 | ) | ||||||||||||||||||||
| Class R-6 | 450,260 | 15,942 | 58,995 | 2,147 | (283,571 | ) | (10,167 | ) | 225,684 | 7,922 | ||||||||||||||||||||||
| Total net increase (decrease) | $ | 4,953,862 | 177,173 | $ | 1,132,765 | 41,167 | $ | (11,184,868 | ) | (401,858 | ) | $ | (5,098,241 | ) | (183,518 | ) | ||||||||||||||||
* Includes exchanges between share classes of the fund.
| 26 | The Investment Company of America |
9. Investment transactions
The fund made purchases and sales of investment securities, excluding short-term securities and U.S. government obligations, if any, of $11,130,245,000 and $17,019,498,000, respectively, during the year ended December 31, 2012.
| The Investment Company of America | 27 |
Financial highlights
| Income (loss) from investment operations1 | Dividends and distributions | |||||||||||||||||||||||||||||||||||||||||||||||||||
| Net gains | ||||||||||||||||||||||||||||||||||||||||||||||||||||
| (losses) on | Ratio of | Ratio of | Ratio | |||||||||||||||||||||||||||||||||||||||||||||||||
| Net asset | securities | Dividends | Distributions | Total | expenses to | expenses to | of net | |||||||||||||||||||||||||||||||||||||||||||||
| value, | Net | (both | Total from | (from net | (from | dividends | Net asset | Net assets, | average net | average net | income | |||||||||||||||||||||||||||||||||||||||||
| beginning | investment | realized and | investment | investment | capital | and | value, end | Total | end of period | assets before | assets after | to average | ||||||||||||||||||||||||||||||||||||||||
| of period | income | unrealized) | operations | income) | gains) | distributions | of period | return | 2,3 | (in millions) | waivers | waivers3 | net assets3 | |||||||||||||||||||||||||||||||||||||||
| Class A: | ||||||||||||||||||||||||||||||||||||||||||||||||||||
| Year ended 12/31/2012 | $ | 27.09 | $ | .60 | $ | 3.61 | $ | 4.21 | $ | (.72 | ) | $ | (.42 | ) | $ | (1.14 | ) | $ | 30.16 | 15.60 | % | $ | 44,501 | .62 | % | .62 | % | 2.02 | % | |||||||||||||||||||||||
| Year ended 12/31/2011 | 28.16 | .57 | (1.06 | ) | (.49 | ) | (.58 | ) | — | (.58 | ) | 27.09 | (1.76 | ) | 42,643 | .61 | .61 | 2.05 | ||||||||||||||||||||||||||||||||||
| Year ended 12/31/2010 | 25.95 | .55 | 2.22 | 2.77 | (.56 | ) | — | (.56 | ) | 28.16 | 10.86 | 48,789 | .61 | .61 | 2.12 | |||||||||||||||||||||||||||||||||||||
| Year ended 12/31/2009 | 20.96 | .52 | 5.04 | 5.56 | (.57 | ) | — | (.57 | ) | 25.95 | 27.18 | 49,136 | .66 | .66 | 2.32 | |||||||||||||||||||||||||||||||||||||
| Year ended 12/31/2008 | 32.95 | .63 | (11.94 | ) | (11.31 | ) | (.68 | ) | — | (.68 | ) | 20.96 | (34.74 | ) | 43,244 | .59 | .57 | 2.25 | ||||||||||||||||||||||||||||||||||
| Class B: | ||||||||||||||||||||||||||||||||||||||||||||||||||||
| Year ended 12/31/2012 | 26.99 | .37 | 3.60 | 3.97 | (.48 | ) | (.42 | ) | (.90 | ) | 30.06 | 14.74 | 552 | 1.38 | 1.38 | 1.25 | ||||||||||||||||||||||||||||||||||||
| Year ended 12/31/2011 | 28.05 | .35 | (1.06 | ) | (.71 | ) | (.35 | ) | — | (.35 | ) | 26.99 | (2.53 | ) | 838 | 1.38 | 1.38 | 1.27 | ||||||||||||||||||||||||||||||||||
| Year ended 12/31/2010 | 25.84 | .35 | 2.21 | 2.56 | (.35 | ) | — | (.35 | ) | 28.05 | 10.03 | 1,431 | 1.38 | 1.38 | 1.36 | |||||||||||||||||||||||||||||||||||||
| Year ended 12/31/2009 | 20.87 | .35 | 5.02 | 5.37 | (.40 | ) | — | (.40 | ) | 25.84 | 26.19 | 2,017 | 1.43 | 1.43 | 1.57 | |||||||||||||||||||||||||||||||||||||
| Year ended 12/31/2008 | 32.81 | .41 | (11.89 | ) | (11.4 8 | ) | (.46 | ) | — | (.46 | ) | 20.87 | (35.25 | ) | 2,191 | 1.36 | 1.34 | 1.48 | ||||||||||||||||||||||||||||||||||
| Class C: | ||||||||||||||||||||||||||||||||||||||||||||||||||||
| Year ended 12/31/2012 | 26.90 | .36 | 3.59 | 3.95 | (.48 | ) | (.42 | ) | (.90 | ) | 29.95 | 14.70 | 1,620 | 1.43 | 1.43 | 1.21 | ||||||||||||||||||||||||||||||||||||
| Year ended 12/31/2011 | 27.97 | .34 | (1.06 | ) | (.72 | ) | (.35 | ) | — | (.35 | ) | 26.90 | (2.58 | ) | 1,767 | 1.42 | 1.42 | 1.24 | ||||||||||||||||||||||||||||||||||
| Year ended 12/31/2010 | 25.78 | .34 | 2.20 | 2.54 | (.35 | ) | — | (.35 | ) | 27.97 | 9.95 | 2,212 | 1.43 | 1.43 | 1.31 | |||||||||||||||||||||||||||||||||||||
| Year ended 12/31/2009 | 20.82 | .34 | 5.01 | 5.35 | (.39 | ) | — | (.39 | ) | 25.78 | 26.20 | 2,243 | 1.46 | 1.46 | 1.53 | |||||||||||||||||||||||||||||||||||||
| Year ended 12/31/2008 | 32.74 | .40 | (11.86 | ) | (11.46 | ) | (.46 | ) | — | (.46 | ) | 20.82 | (35.29 | ) | 1,974 | 1.41 | 1.38 | 1.44 | ||||||||||||||||||||||||||||||||||
| Class F-1: | ||||||||||||||||||||||||||||||||||||||||||||||||||||
| Year ended 12/31/2012 | 27.04 | .58 | 3.62 | 4.20 | (.71 | ) | (.42 | ) | (1.13 | ) | 30.11 | 15.58 | 1,842 | .67 | .67 | 1.98 | ||||||||||||||||||||||||||||||||||||
| Year ended 12/31/2011 | 28.12 | .56 | (1.07 | ) | (.51 | ) | (.57 | ) | — | (.57 | ) | 27.04 | (1.84 | ) | 1,744 | .66 | .66 | 2.01 | ||||||||||||||||||||||||||||||||||
| Year ended 12/31/2010 | 25.92 | .54 | 2.21 | 2.75 | (.55 | ) | — | (.55 | ) | 28.12 | 10.78 | 1,558 | .66 | .66 | 2.07 | |||||||||||||||||||||||||||||||||||||
| Year ended 12/31/2009 | 20.93 | .51 | 5.05 | 5.56 | (.57 | ) | — | (.57 | ) | 25.92 | 27.21 | 1,209 | .68 | .68 | 2.31 | |||||||||||||||||||||||||||||||||||||
| Year ended 12/31/2008 | 32.91 | .62 | (11.93 | ) | (11.31 | ) | (.67 | ) | — | (.67 | ) | 20.93 | (34.77 | ) | 1,009 | .62 | .60 | 2.23 | ||||||||||||||||||||||||||||||||||
| Class F-2: | ||||||||||||||||||||||||||||||||||||||||||||||||||||
| Year ended 12/31/2012 | 27.08 | .67 | 3.61 | 4.28 | (.79 | ) | (.42 | ) | (1.21 | ) | 30.15 | 15.86 | 770 | .40 | .40 | 2.25 | ||||||||||||||||||||||||||||||||||||
| Year ended 12/31/2011 | 28.15 | .63 | (1.06 | ) | (.43 | ) | (.64 | ) | — | (.64 | ) | 27.08 | (1.54 | ) | 604 | .40 | .40 | 2.27 | ||||||||||||||||||||||||||||||||||
| Year ended 12/31/2010 | 25.95 | .61 | 2.21 | 2.82 | (.62 | ) | — | (.62 | ) | 28.15 | 11.07 | 669 | .39 | .39 | 2.34 | |||||||||||||||||||||||||||||||||||||
| Year ended 12/31/2009 | 20.96 | .56 | 5.06 | 5.62 | (.63 | ) | — | (.63 | ) | 25.95 | 27.50 | 533 | .42 | .42 | 2.37 | |||||||||||||||||||||||||||||||||||||
| Period from 8/1/2008 to 12/31/20084 | 28.53 | .26 | (7.47 | ) | (7.21 | ) | (.36 | ) | — | (.36 | ) | 20.96 | (25.39 | ) | 83 | .17 | .16 | 1.24 | ||||||||||||||||||||||||||||||||||
| Class 529-A: | ||||||||||||||||||||||||||||||||||||||||||||||||||||
| Year ended 12/31/2012 | 27.05 | .57 | 3.60 | 4.17 | (.69 | ) | (.42 | ) | (1.11 | ) | 30.11 | 15.47 | 1,562 | .72 | .72 | 1.93 | ||||||||||||||||||||||||||||||||||||
| Year ended 12/31/2011 | 28.12 | .55 | (1.06 | ) | (.51 | ) | (.56 | ) | — | (.56 | ) | 27.05 | (1.84 | ) | 1,362 | .70 | .70 | 1.97 | ||||||||||||||||||||||||||||||||||
| Year ended 12/31/2010 | 25.92 | .53 | 2.22 | 2.75 | (.55 | ) | — | (.55 | ) | 28.12 | 10.77 | 1,362 | .68 | .68 | 2.05 | |||||||||||||||||||||||||||||||||||||
| Year ended 12/31/2009 | 20.93 | .50 | 5.04 | 5.54 | (.55 | ) | — | (.55 | ) | 25.92 | 27.12 | 1,173 | .73 | .73 | 2.24 | |||||||||||||||||||||||||||||||||||||
| Year ended 12/31/2008 | 32.91 | .60 | (11.92 | ) | (11.32 | ) | (.66 | ) | — | (.66 | ) | 20.93 | (34.79 | ) | 898 | .67 | .65 | 2.19 | ||||||||||||||||||||||||||||||||||
| Class 529-B: | ||||||||||||||||||||||||||||||||||||||||||||||||||||
| Year ended 12/31/2012 | 27.00 | .33 | 3.60 | 3.93 | (.44 | ) | (.42 | ) | (.86 | ) | 30.07 | 14.58 | 81 | 1.52 | 1.52 | 1.12 | ||||||||||||||||||||||||||||||||||||
| Year ended 12/31/2011 | 28.06 | .32 | (1.05 | ) | (.73 | ) | (.33 | ) | — | (.33 | ) | 27.00 | (2.63 | ) | 111 | 1.50 | 1.50 | 1.16 | ||||||||||||||||||||||||||||||||||
| Year ended 12/31/2010 | 25.86 | .33 | 2.20 | 2.53 | (.33 | ) | — | (.33 | ) | 28.06 | 9.87 | 165 | 1.48 | 1.48 | 1.26 | |||||||||||||||||||||||||||||||||||||
| Year ended 12/31/2009 | 20.89 | .32 | 5.03 | 5.35 | (.38 | ) | — | (.38 | ) | 25.86 | 26.07 | 201 | 1.53 | 1.53 | 1.45 | |||||||||||||||||||||||||||||||||||||
| Year ended 12/31/2008 | 32.83 | .38 | (11.88 | ) | (11.50 | ) | (.44 | ) | — | (.44 | ) | 20.89 | (35.29 | ) | 169 | 1.47 | 1.45 | 1.38 | ||||||||||||||||||||||||||||||||||
| Class 529-C: | ||||||||||||||||||||||||||||||||||||||||||||||||||||
| Year ended 12/31/2012 | 26.99 | .34 | 3.59 | 3.93 | (.46 | ) | (.42 | ) | (.88 | ) | 30.04 | 14.59 | 372 | 1.50 | 1.50 | 1.14 | ||||||||||||||||||||||||||||||||||||
| Year ended 12/31/2011 | 28.06 | .33 | (1.06 | ) | (.73 | ) | (.34 | ) | — | (.34 | ) | 26.99 | (2.62 | ) | 336 | 1.49 | 1.49 | 1.18 | ||||||||||||||||||||||||||||||||||
| Year ended 12/31/2010 | 25.86 | .33 | 2.21 | 2.54 | (.34 | ) | — | (.34 | ) | 28.06 | 9.91 | 352 | 1.47 | 1.47 | 1.26 | |||||||||||||||||||||||||||||||||||||
| Year ended 12/31/2009 | 20.89 | .32 | 5.03 | 5.35 | (.38 | ) | — | (.38 | ) | 25.86 | 26.09 | 321 | 1.52 | 1.52 | 1.45 | |||||||||||||||||||||||||||||||||||||
| Year ended 12/31/2008 | 32.84 | .38 | (11.89 | ) | (11.51 | ) | (.44 | ) | — | (.44 | ) | 20.89 | (35.31 | ) | 249 | 1.46 | 1.44 | 1.39 | ||||||||||||||||||||||||||||||||||
| Class 529-E: | ||||||||||||||||||||||||||||||||||||||||||||||||||||
| Year ended 12/31/2012 | 26.99 | .49 | 3.61 | 4.10 | (.62 | ) | (.42 | ) | (1.04 | ) | 30.05 | 15.23 | 61 | .97 | .97 | 1.68 | ||||||||||||||||||||||||||||||||||||
| Year ended 12/31/2011 | 28.07 | .47 | (1.07 | ) | (.60 | ) | (.48 | ) | — | (.48 | ) | 26.99 | (2.15 | ) | 55 | .97 | .97 | 1.70 | ||||||||||||||||||||||||||||||||||
| Year ended 12/31/2010 | 25.87 | .46 | 2.21 | 2.67 | (.47 | ) | — | (.47 | ) | 28.07 | 10.46 | 57 | .97 | .97 | 1.76 | |||||||||||||||||||||||||||||||||||||
| Year ended 12/31/2009 | 20.89 | .43 | 5.04 | 5.47 | (.49 | ) | — | (.49 | ) | 25.87 | 26.77 | 51 | 1.02 | 1.02 | 1.96 | |||||||||||||||||||||||||||||||||||||
| Year ended 12/31/2008 | 32.85 | .52 | (11.90 | ) | (11.38 | ) | (.58 | ) | — | (.58 | ) | 20.89 | (34.98 | ) | 38 | .96 | .94 | 1.90 | ||||||||||||||||||||||||||||||||||
| 28 | The Investment Company of America |
| Income (loss) from investment operations1 | Dividends and distributions | |||||||||||||||||||||||||||||||||||||||||||||||||||
| Net gains | ||||||||||||||||||||||||||||||||||||||||||||||||||||
| (losses) on | Ratio of | Ratio of | Ratio | |||||||||||||||||||||||||||||||||||||||||||||||||
| Net asset | securities | Dividends | Distributions | Total | expenses to | expenses to | of net | |||||||||||||||||||||||||||||||||||||||||||||
| value, | Net | (both | Total from | (from net | (from | dividends | Net asset | Net assets, | average net | average net | income | |||||||||||||||||||||||||||||||||||||||||
| beginning | investment | realized and | investment | investment | capital | and | value, end | Total | end of period | assets before | assets after | to average | ||||||||||||||||||||||||||||||||||||||||
| of period | income | unrealized) | operations | income) | gains) | distributions | of period | return | 3 | (in millions) | waivers | waivers3 | net assets3 | |||||||||||||||||||||||||||||||||||||||
| Class 529-F-1: | ||||||||||||||||||||||||||||||||||||||||||||||||||||
| Year ended 12/31/2012 | $ | 27.03 | $ | .63 | $ | 3.61 | $ | 4.24 | $ | (.76 | ) | $ | (.42 | ) | $ | (1.18 | ) | $ | 30.09 | 15.74 | % | $ | 37 | .50 | % | .50 | % | 2.15 | % | |||||||||||||||||||||||
| Year ended 12/31/2011 | 28.10 | .61 | (1.06 | ) | (.45 | ) | (.62 | ) | — | (.62 | ) | 27.03 | (1.62 | ) | 31 | .49 | .49 | 2.19 | ||||||||||||||||||||||||||||||||||
| Year ended 12/31/2010 | 25.90 | .59 | 2.21 | 2.80 | (.60 | ) | — | (.60 | ) | 28.10 | 11.00 | 28 | .47 | .47 | 2.26 | |||||||||||||||||||||||||||||||||||||
| Year ended 12/31/2009 | 20.92 | .55 | 5.03 | 5.58 | (.60 | ) | — | (.60 | ) | 25.90 | 27.37 | 22 | .52 | .52 | 2.44 | |||||||||||||||||||||||||||||||||||||
| Year ended 12/31/2008 | 32.90 | .66 | (11.92 | ) | (11.26 | ) | (.72 | ) | — | (.72 | ) | 20.92 | (34.66 | ) | 15 | .46 | .44 | 2.40 | ||||||||||||||||||||||||||||||||||
| Class R-1: | ||||||||||||||||||||||||||||||||||||||||||||||||||||
| Year ended 12/31/2012 | 26.95 | .36 | 3.60 | 3.96 | (.48 | ) | (.42 | ) | (.90 | ) | 30.01 | 14.74 | 73 | 1.41 | 1.41 | 1.23 | ||||||||||||||||||||||||||||||||||||
| Year ended 12/31/2011 | 28.02 | .35 | (1.06 | ) | (.71 | ) | (.36 | ) | — | (.36 | ) | 26.95 | (2.55 | ) | 74 | 1.41 | 1.41 | 1.25 | ||||||||||||||||||||||||||||||||||
| Year ended 12/31/2010 | 25.83 | .35 | 2.20 | 2.55 | (.36 | ) | — | (.36 | ) | 28.02 | 9.96 | 78 | 1.41 | 1.41 | 1.32 | |||||||||||||||||||||||||||||||||||||
| Year ended 12/31/2009 | 20.87 | .34 | 5.02 | 5.36 | (.40 | ) | — | (.40 | ) | 25.83 | 26.18 | 66 | 1.44 | 1.44 | 1.52 | |||||||||||||||||||||||||||||||||||||
| Year ended 12/31/2008 | 32.81 | .40 | (11.88 | ) | (11.48 | ) | (.46 | ) | — | (.46 | ) | 20.87 | (35.25 | ) | 45 | 1.39 | 1.36 | 1.48 | ||||||||||||||||||||||||||||||||||
| Class R-2: | ||||||||||||||||||||||||||||||||||||||||||||||||||||
| Year ended 12/31/2012 | 26.98 | .37 | 3.59 | 3.96 | (.49 | ) | (.42 | ) | (.91 | ) | 30.03 | 14.70 | 584 | 1.40 | 1.40 | 1.25 | ||||||||||||||||||||||||||||||||||||
| Year ended 12/31/2011 | 28.05 | .35 | (1.06 | ) | (.71 | ) | (.36 | ) | — | (.36 | ) | 26.98 | (2.55 | ) | 577 | 1.41 | 1.41 | 1.25 | ||||||||||||||||||||||||||||||||||
| Year ended 12/31/2010 | 25.85 | .34 | 2.21 | 2.55 | (.35 | ) | — | (.35 | ) | 28.05 | 9.96 | 654 | 1.44 | 1.44 | 1.30 | |||||||||||||||||||||||||||||||||||||
| Year ended 12/31/2009 | 20.88 | .32 | 5.03 | 5.35 | (.38 | ) | — | (.38 | ) | 25.85 | 26.08 | 621 | 1.52 | 1.52 | 1.45 | |||||||||||||||||||||||||||||||||||||
| Year ended 12/31/2008 | 32.83 | .38 | (11.89 | ) | (11.51 | ) | (.44 | ) | — | (.44 | ) | 20.88 | (35.33 | ) | 468 | 1.48 | 1.46 | 1.37 | ||||||||||||||||||||||||||||||||||
| Class R-3: | ||||||||||||||||||||||||||||||||||||||||||||||||||||
| Year ended 12/31/2012 | 27.03 | .49 | 3.60 | 4.09 | (.61 | ) | (.42 | ) | (1.03 | ) | 30.09 | 15.19 | 743 | .98 | .98 | 1.67 | ||||||||||||||||||||||||||||||||||||
| Year ended 12/31/2011 | 28.10 | .47 | (1.06 | ) | (.59 | ) | (.48 | ) | — | (.48 | ) | 27.03 | (2.11 | ) | 737 | .97 | .97 | 1.70 | ||||||||||||||||||||||||||||||||||
| Year ended 12/31/2010 | 25.90 | .46 | 2.21 | 2.67 | (.47 | ) | — | (.47 | ) | 28.10 | 10.45 | 827 | .97 | .97 | 1.77 | |||||||||||||||||||||||||||||||||||||
| Year ended 12/31/2009 | 20.92 | .44 | 5.04 | 5.48 | (.50 | ) | — | (.50 | ) | 25.90 | 26.76 | 768 | 1.00 | 1.00 | 1.97 | |||||||||||||||||||||||||||||||||||||
| Year ended 12/31/2008 | 32.88 | .53 | (11.90 | ) | (11.37 | ) | (.59 | ) | — | (.59 | ) | 20.92 | (34.94 | ) | 568 | .92 | .90 | 1.91 | ||||||||||||||||||||||||||||||||||
| Class R-4: | ||||||||||||||||||||||||||||||||||||||||||||||||||||
| Year ended 12/31/2012 | 27.04 | .59 | 3.61 | 4.20 | (.71 | ) | (.42 | ) | (1.13 | ) | 30.11 | 15.60 | 705 | .65 | .65 | 2.00 | ||||||||||||||||||||||||||||||||||||
| Year ended 12/31/2011 | 28.12 | .56 | (1.07 | ) | (.51 | ) | (.57 | ) | — | (.57 | ) | 27.04 | (1.83 | ) | 660 | .65 | .65 | 2.02 | ||||||||||||||||||||||||||||||||||
| Year ended 12/31/2010 | 25.91 | .54 | 2.22 | 2.76 | (.55 | ) | — | (.55 | ) | 28.12 | 10.82 | 681 | .65 | .65 | 2.08 | |||||||||||||||||||||||||||||||||||||
| Year ended 12/31/2009 | 20.93 | .50 | 5.05 | 5.55 | (.57 | ) | — | (.57 | ) | 25.91 | 27.16 | 624 | .68 | .68 | 2.21 | |||||||||||||||||||||||||||||||||||||
| Year ended 12/31/2008 | 32.90 | .61 | (11.91 | ) | (11.30 | ) | (.67 | ) | — | (.67 | ) | 20.93 | (34.78 | ) | 304 | .65 | .62 | 2.21 | ||||||||||||||||||||||||||||||||||
| Class R-5: | ||||||||||||||||||||||||||||||||||||||||||||||||||||
| Year ended 12/31/2012 | 27.08 | .68 | 3.61 | 4.29 | (.80 | ) | (.42 | ) | (1.22 | ) | 30.15 | 15.92 | 697 | .35 | .35 | 2.28 | ||||||||||||||||||||||||||||||||||||
| Year ended 12/31/2011 | 28.15 | .65 | (1.07 | ) | (.42 | ) | (.65 | ) | — | (.65 | ) | 27.08 | (1.50 | ) | 761 | .35 | .35 | 2.31 | ||||||||||||||||||||||||||||||||||
| Year ended 12/31/2010 | 25.94 | .61 | 2.23 | 2.84 | (.63 | ) | — | (.63 | ) | 28.15 | 11.14 | 895 | .35 | .35 | 2.33 | |||||||||||||||||||||||||||||||||||||
| Year ended 12/31/2009 | 20.95 | .58 | 5.04 | 5.62 | (.63 | ) | — | (.63 | ) | 25.94 | 27.57 | 2,123 | .38 | .38 | 2.62 | |||||||||||||||||||||||||||||||||||||
| Year ended 12/31/2008 | 32.95 | .69 | (11.94 | ) | (11.25 | ) | (.75 | ) | — | (.75 | ) | 20.95 | (34.60 | ) | 1,861 | .35 | .33 | 2.52 | ||||||||||||||||||||||||||||||||||
| Class R-6: | ||||||||||||||||||||||||||||||||||||||||||||||||||||
| Year ended 12/31/2012 | 27.08 | .69 | 3.62 | 4.31 | (.82 | ) | (.42 | ) | (1.24 | ) | 30.15 | 15.98 | 2,995 | .30 | .30 | 2.34 | ||||||||||||||||||||||||||||||||||||
| Year ended 12/31/2011 | 28.15 | .66 | (1.06 | ) | (.40 | ) | (.67 | ) | — | (.67 | ) | 27.08 | (1.45 | ) | 2,456 | .30 | .30 | 2.37 | ||||||||||||||||||||||||||||||||||
| Year ended 12/31/2010 | 25.95 | .63 | 2.21 | 2.84 | (.64 | ) | — | (.64 | ) | 28.15 | 11.16 | 2,330 | .30 | .30 | 2.45 | |||||||||||||||||||||||||||||||||||||
| Period from 5/1/2009 to 12/31/20094 | 20.70 | .40 | 5.30 | 5.70 | (.45 | ) | — | (.45 | ) | 25.95 | 27.76 | 534 | .33 | 5 | .33 | 5 | 2.52 | 5 | ||||||||||||||||||||||||||||||||||
| Year ended December 31 | ||||||||||||||||||||
| 2012 | 2011 | 2010 | 2009 | 2008 | ||||||||||||||||
| Portfolio turnover rate for all share classes | 21 | % | 28 | % | 23 | % | 28 | % | 31 | % | ||||||||||
| 1 | Based on average shares outstanding. |
| 2 | Total returns exclude any applicable sales charges, including contingent deferred sales charges. |
| 3 | This column reflects the impact, if any, of certain waivers from CRMC. During some of the periods shown, CRMC reduced fees for investment advisory services. |
| 4 | Based on operations for the period shown and, accordingly, is not representative of a full year. |
| 5 | Annualized. |
See Notes to Financial Statements
| The Investment Company of America | 29 |
Report of Independent Registered Public Accounting Firm
To the Shareholders and Board of Trustees of The Investment Company of America:
We have audited the accompanying statement of assets and liabilities of The Investment Company of America (the “Fund”), including the summary investment portfolio, as of December 31, 2012, and the related statement of operations for the year then ended, the statements of changes in net assets for each of the two years in the period then ended, and the financial highlights for each of the three years in the period then ended. These financial statements and financial highlights are the responsibility of the Fund’s management. Our responsibility is to express an opinion on these financial statements and financial highlights based on our audits. The financial highlights for each of the two years in the period ended December 31, 2009 were audited by other auditors whose report, dated February 8, 2010, expressed an unqualified opinion on those financial highlights.
We conducted our audits in accordance with the standards of the Public Company Accounting Oversight Board (United States). Those standards require that we plan and perform the audit to obtain reasonable assurance about whether the financial statements and financial highlights are free of material misstatement. The Fund is not required to have, nor were we engaged to perform, an audit of its internal control over financial reporting. Our audits included consideration of internal control over financial reporting as a basis for designing audit procedures that are appropriate in the circumstances, but not for the purpose of expressing an opinion on the effectiveness of the Fund’s internal control over financial reporting. Accordingly, we express no such opinion. An audit also includes examining, on a test basis, evidence supporting the amounts and disclosures in the financial statements, assessing the accounting principles used and significant estimates made by management, as well as evaluating the overall financial statement presentation. Our procedures included confirmation of securities owned as of December 31, 2012, by correspondence with the custodian and brokers; where replies were not received from brokers, we performed other auditing procedures. We believe that our audits provide a reasonable basis for our opinion.
In our opinion, such financial statements and financial highlights referred to above present fairly, in all material respects, the financial position of The Investment Company of America as of December 31, 2012, the results of its operations for the year then ended, the changes in its net assets for each of the two years in the period then ended, and the financial highlights for each of the three years in the period then ended, in conformity with accounting principles generally accepted in the United States of America.
Deloitte & Touche LLP
Costa Mesa, California
February 6, 2013
| 30 | The Investment Company of America |
| Tax information | unaudited |
We are required to advise you of the federal tax status of certain distributions received by shareholders during the fiscal year. The fund hereby designates the following amounts for the fund’s fiscal year ended December 31, 2012:
| Long-term capital gains | $ | 781,791,000 | ||
| Qualified dividend income | 100 | % | ||
| Corporate dividends received deduction | 100 | % | ||
| U.S. government income that may be exempt from state taxation | $ | 5,407,000 |
Individual shareholders should refer to their Form 1099 or other tax information, which was mailed in January 2013, to determine the calendar year amounts to be included on their 2012 tax returns. Shareholders should consult their tax advisers.
| The Investment Company of America | 31 |
| Expense example | unaudited |
As a shareholder of the fund, you incur two types of costs: (1) transaction costs, such as initial sales charges on purchase payments and contingent deferred sales charges on redemptions (loads), and (2) ongoing costs, including management fees, distribution and service (12b-1) fees, and other expenses. This example is intended to help you understand your ongoing costs (in dollars) of investing in the fund so you can compare these costs with the ongoing costs of investing in other mutual funds. The example is based on an investment of $1,000 invested at the beginning of the period and held for the entire six-month period (July 1, 2012, through December 31, 2012).
Actual expenses:
The first line of each share class in the table on the next page provides information about actual account values and actual expenses. You may use the information in this line, together with the amount you invested, to estimate the expenses that you paid over the period. Simply divide your account value by $1,000 (for example, an $8,600 account value divided by $1,000 = 8.6), then multiply the result by the number in the first line under the heading entitled “Expenses paid during period” to estimate the expenses you paid on your account during this period.
Hypothetical example for comparison purposes:
The second line of each share class in the table on the next page provides information about hypothetical account values and hypothetical expenses based on the actual expense ratio for the share class and an assumed rate of return of 5.00% per year before expenses, which is not the actual return of the share class. The hypothetical account values and expenses may not be used to estimate the actual ending account balance or expenses you paid for the period. You may use this information to compare the ongoing costs of investing in the fund and other funds. To do so, compare this 5.00% hypothetical example with the 5.00% hypothetical examples that appear in the shareholder reports of the other funds.
Notes:
There are some account fees that are charged to certain types of accounts, such as individual retirement accounts and 529 college savings plan accounts (generally, a $10 fee is charged to set up the account and an additional $10 fee is charged to the account annually), that would increase the amount of expenses paid on your account. In addition, retirement plan participants may be subject to certain fees charged by the plan sponsor, and Class F-1, F-2 and 529-F-1 shareholders may be subject to fees charged by financial intermediaries, typically ranging from 0.75% to 1.50% of assets annually depending on services offered. You can estimate the impact of these fees by adding the amount of the fees to the total estimated expenses you paid on your account during the period as calculated above. In addition, your ending account value would be lower by the amount of these fees.
Note that the expenses shown in the table are meant to highlight your ongoing costs only and do not reflect any transactional costs, such as sales charges (loads). Therefore, the second line of each share class in the table is useful in comparing ongoing costs only and will not help you determine the relative total costs of owning different funds. In addition, if these transactional costs were included, your costs would have been higher.
| 32 | The Investment Company of America |
| Beginning account value | Ending account value | Expenses paid | Annualized | |||||||||||||
| 7/1/2012 | 12/31/2012 | during period* | expense ratio | |||||||||||||
| Class A — actual return | $ | 1,000.00 | $ | 1,066.58 | $ | 3.17 | .61 | % | ||||||||
| Class A — assumed 5% return | 1,000.00 | 1,022.07 | 3.10 | .61 | ||||||||||||
| Class B — actual return | 1,000.00 | 1,062.59 | 7.10 | 1.37 | ||||||||||||
| Class B — assumed 5% return | 1,000.00 | 1,018.25 | 6.95 | 1.37 | ||||||||||||
| Class C — actual return | 1,000.00 | 1,062.03 | 7.36 | 1.42 | ||||||||||||
| Class C — assumed 5% return | 1,000.00 | 1,018.00 | 7.20 | 1.42 | ||||||||||||
| Class F-1 — actual return | 1,000.00 | 1,066.04 | 3.43 | .66 | ||||||||||||
| Class F-1 — assumed 5% return | 1,000.00 | 1,021.82 | 3.35 | .66 | ||||||||||||
| Class F-2 — actual return | 1,000.00 | 1,067.76 | 2.08 | .40 | ||||||||||||
| Class F-2 — assumed 5% return | 1,000.00 | 1,023.13 | 2.03 | .40 | ||||||||||||
| Class 529-A — actual return | 1,000.00 | 1,065.83 | 3.69 | .71 | ||||||||||||
| Class 529-A — assumed 5% return | 1,000.00 | 1,021.57 | 3.61 | .71 | ||||||||||||
| Class 529-B — actual return | 1,000.00 | 1,061.89 | 7.77 | 1.50 | ||||||||||||
| Class 529-B — assumed 5% return | 1,000.00 | 1,017.60 | 7.61 | 1.50 | ||||||||||||
| Class 529-C — actual return | 1,000.00 | 1,061.88 | 7.77 | 1.50 | ||||||||||||
| Class 529-C — assumed 5% return | 1,000.00 | 1,017.60 | 7.61 | 1.50 | ||||||||||||
| Class 529-E — actual return | 1,000.00 | 1,064.67 | 4.98 | .96 | ||||||||||||
| Class 529-E — assumed 5% return | 1,000.00 | 1,020.31 | 4.88 | .96 | ||||||||||||
| Class 529-F-1 — actual return | 1,000.00 | 1,066.99 | 2.55 | .49 | ||||||||||||
| Class 529-F-1 — assumed 5% return | 1,000.00 | 1,022.67 | 2.49 | .49 | ||||||||||||
| Class R-1 — actual return | 1,000.00 | 1,062.29 | 7.31 | 1.41 | ||||||||||||
| Class R-1 — assumed 5% return | 1,000.00 | 1,018.05 | 7.15 | 1.41 | ||||||||||||
| Class R-2 — actual return | 1,000.00 | 1,062.43 | 7.26 | 1.40 | ||||||||||||
| Class R-2 — assumed 5% return | 1,000.00 | 1,018.10 | 7.10 | 1.40 | ||||||||||||
| Class R-3 — actual return | 1,000.00 | 1,064.86 | 5.09 | .98 | ||||||||||||
| Class R-3 — assumed 5% return | 1,000.00 | 1,020.21 | 4.98 | .98 | ||||||||||||
| Class R-4 — actual return | 1,000.00 | 1,066.53 | 3.38 | .65 | ||||||||||||
| Class R-4 — assumed 5% return | 1,000.00 | 1,021.87 | 3.30 | .65 | ||||||||||||
| Class R-5 — actual return | 1,000.00 | 1,068.00 | 1.82 | .35 | ||||||||||||
| Class R-5 — assumed 5% return | 1,000.00 | 1,023.38 | 1.78 | .35 | ||||||||||||
| Class R-6 — actual return | 1,000.00 | 1,068.27 | 1.56 | .30 | ||||||||||||
| Class R-6 — assumed 5% return | 1,000.00 | 1,023.63 | 1.53 | .30 | ||||||||||||
| * | The “expenses paid during period” are equal to the “annualized expense ratio,” multiplied by the average account value over the period, multiplied by the number of days in the period, and divided by 366 (to reflect the one-half year period). |
| The Investment Company of America | 33 |
Board of trustees and other officers
“Independent” trustees1
| Name and age | Year first elected a trustee of the fund2 | Principal occupation(s) during past five years | Number of portfolios in fund complex3 overseen by trustee | Other directorships4 held by trustee | ||||
| Louise H. Bryson, 68 | 1999 | Chair Emerita of the Board of Trustees, J. Paul Getty Trust; former President, Distribution, Lifetime Entertainment Network; former Executive Vice President and General Manager, Lifetime Movie Network | 7 | None | ||||
| Mary Anne Dolan, 65 Chairman of the Board (Independent and Non-Executive) | 2000 | Founder and President, MAD Ink (communications company) | 10 | None | ||||
| James G. Ellis, 66 | 2008 | Dean and Professor of Marketing, Marshall School of Business, University of Southern California | 65 | Quiksilver, Inc. | ||||
| Leonard R. Fuller, 66 | 2002 | President and CEO, Fuller Consulting (financial management consulting firm) | 65 | None | ||||
| William D. Jones, 57 | 2010 | Real estate developer/owner, President and CEO, CityLink Investment Corporation (acquires, develops and manages real estate ventures in selected urban communities) and City Scene Management Company (provides commercial asset and property management services) | 7 | Sempra Energy | ||||
| L. Daniel Jorndt, 71 | 2006 | Retired | 4 | None | ||||
| William H. Kling, 70 | 2010 | President Emeritus, American Public Media | 10 | None | ||||
| John C. Mazziotta, M.D., Ph.D., 63 | 2011 | Physician; Chair, Department of Neurology, University of California at Los Angeles; Associate Director, Semel Institute, UCLA; Director, Brain Mapping Center, UCLA | 4 | None | ||||
| Bailey Morris-Eck, 68 | 1993 | Director and Programming Chair, WYPR Baltimore/ Washington (public radio station); Senior Adviser, Financial News (London); Senior Fellow, Institute for International Economics | 4 | None | ||||
| Steven B. Sample, Ph.D., 72 | 2010 | President Emeritus, University of Southern California | 4 | Intermec, Inc. |
John G. McDonald, a trustee of the fund since 1976, has retired from the board. The trustees thank Prof. McDonald for his dedication and service to the fund.
“Interested” trustees5,6
| Name, age and position with fund | Year first elected a trustee or officer of the fund2 | Principal occupation(s) during past five years and positions held with affiliated entities or the principal underwriter of the fund | Number of portfolios in fund complex3 overseen by trustee | Other directorships4 held by trustee | ||||
| James B. Lovelace, 56 Vice Chairman of the Board | 1994 | Senior Vice President — Capital Research Global Investors, Capital Research and Management Company; Director, Capital Research and Management Company | 2 | None | ||||
| Donald D. O’Neal, 52 President | 1994 | Senior Vice President — Capital Research Global Investors, Capital Research and Management Company; Director, Capital Research and Management Company | 21 | None |
The fund’s statement of additional information includes further details about fund trustees and is available without charge upon request by calling American Funds Service Company at 800/421-4225 or by visiting the American Funds website at americanfunds.com. The address for all trustees and officers of the fund is 333 South Hope Street, Los Angeles, CA 90071, Attention: Secretary.
| 34 | The Investment Company of America |
Other officers6
| Name, age and position with fund | Year first elected an officer of the fund2 | Principal occupation(s) during past five years and positions held with affiliated entities or the principal underwriter of the fund | ||
| Joyce E. Gordon, 56 Senior Vice President | 1998 | Senior Vice President — Capital Research Global Investors, Capital Research and Management Company; Director, The Capital Group Companies, Inc.7 | ||
| Paul F. Roye, 59 Senior Vice President | 2008 | Senior Vice President — Fund Business Management Group, Capital Research and Management Company; Director, American Funds Service Company;7 former Director, Division of Investment Management, United States Securities and Exchange Commission | ||
| Christopher D. Buchbinder, 41 Vice President | 2010 | Senior Vice President — Capital Research Global Investors, Capital Research Company7 | ||
| Herbert Y. Poon, 40 Vice President | 2012 | Vice President and Senior Counsel — Fund Business Management Group, Capital Research and Management Company | ||
| Jessica Chase Spaly, 36 Vice President | 2010 | Vice President — Capital Research Global Investors, Capital Research Company;7 Director, Capital Research Company7 | ||
| Vincent P. Corti, 56 Secretary | 1994 | Vice President — Fund Business Management Group, Capital Research and Management Company | ||
| Brian D. Bullard, 43 Treasurer | 2008 | Senior Vice President — Fund Business Management Group, Capital Research and Management Company; former Chief Accountant — Division of Investment Management, United States Securities and Exchange Commission | ||
| Raymond F. Sullivan, Jr., 55 Assistant Secretary | 2008 | Vice President — Fund Business Management Group, Capital Research and Management Company | ||
| Dori Laskin, 61 Assistant Treasurer | 2011 | Vice President — Fund Business Management Group, Capital Research and Management Company | ||
| Ari M. Vinocor, 38 Assistant Treasurer | 2010 | Vice President — Fund Business Management Group, Capital Research and Management Company |
| 1 | The term “independent” trustee refers to a trustee who is not an “interested person” of the fund within the meaning of the Investment Company Act of 1940. |
| 2 | Trustees and officers of the fund are elected on an annual basis. |
| 3 | Capital Research and Management Company manages the American Funds. Capital Research and Management Company also manages American Funds Insurance Series,® which is composed of 19 funds and serves as the underlying investment vehicle for certain variable insurance contracts; American Funds Target Date Retirement Series,® which is composed of 10 funds and is available through tax-deferred retirement plans and IRAs; American Funds Portfolio Series,SM which is composed of eight funds; and American Funds College Target Date Series,SM which is composed of seven funds. |
| 4 | This includes all directorships (other than those in the American Funds or other funds managed by Capital Research and Management Company) that are held by each trustee as a trustee or director of a public company or a registered investment company. |
| 5 | “Interested persons” within the meaning of the Investment Company Act of 1940, on the basis of their affiliation with the fund’s investment adviser, Capital Research and Management Company, or affiliated entities (including the fund’s principal underwriter). |
| 6 | All of the officers listed, with the exception of Jessica Chase Spaly, are officers and/or directors/trustees of one or more of the other funds for which Capital Research and Management Company serves as investment adviser. |
| 7 | Company affiliated with Capital Research and Management Company. |
| The Investment Company of America | 35 |
Offices
Offices of the fund and of the investment adviser
Capital Research and Management Company
333 South Hope Street
Los Angeles, CA 90071-1406
6455 Irvine Center Drive
Irvine, CA 92618
Transfer agent for shareholder accounts
American Funds Service Company
(Write to the address near you.)
P.O. Box 6007
Indianapolis, IN 46206-6007
P.O. Box 2280
Norfolk, VA 23501-2280
Custodian of assets
JPMorgan Chase Bank
270 Park Avenue
New York, NY 10017-2070
Counsel
O’Melveny & Myers LLP
400 South Hope Street
Los Angeles, CA 90071-2899
Independent registered public accounting firm
Deloitte & Touche LLP
695 Town Center Drive
Suite 1200
Costa Mesa, CA 92626-7188
Principal underwriter
American Funds Distributors, Inc.
333 South Hope Street
Los Angeles, CA 90071-1406
| 36 | The Investment Company of America |
Investors should carefully consider investment objectives, risks, charges and expenses. This and other important information is contained in the fund prospectus and summary prospectus, which can be obtained from your financial professional and should be read carefully before investing. You may also call American Funds Service Company (AFS) at 800/421-4225 or visit the American Funds website at americanfunds.com.
“American Funds Proxy Voting Procedures and Principles” — which describes how we vote proxies relating to portfolio securities — is available on the American Funds website or upon request by calling AFS. The fund files its proxy voting record with the U.S. Securities and Exchange Commission (SEC) for the 12 months ended June 30 by August 31. The proxy voting record is available free of charge on the SEC website at sec.gov and on the American Funds website.
A complete December 31, 2012, portfolio of The Investment Company of America’s investments is available free of charge by calling AFS or visiting the SEC website (where it is part of Form N-CSR).
The Investment Company of America files a complete list of its portfolio holdings with the SEC for the first and third quarters of each fiscal year on Form N-Q. This filing is available free of charge on the SEC website. You may also review or, for a fee, copy this filing at the SEC’s Public Reference Room in Washington, D.C. Additional information regarding the operation of the Public Reference Room may be obtained by calling the SEC’s Office of Investor Education and Advocacy at 800/SEC-0330. Additionally, the list of portfolio holdings is available by calling AFS.
This report is for the information of shareholders of The Investment Company of America, but it also may be used as sales literature when preceded or accompanied by the current prospectus or summary prospectus, which gives details about charges, expenses, investment objectives and operating policies of the fund. If used as sales material after March 31, 2013, this report must be accompanied by an American Funds statistical update for the most recently completed calendar quarter.
| The right choice for the long term® |
The American Funds difference
Since 1931, American Funds has helped investors pursue long-term investment success. Our consistent approach — in combination with a proven system — has resulted in a superior long-term track record.
 | Consistent approach. We base our decisions on a long-term perspective because we believe it is the best way to achieve superior long-term investment results. Our portfolio counselors average 25 years of investment experience, including 20 years at our company, reflecting a career commitment to our long-term approach.1
|
 | Proven system Our system combines individual accountability with teamwork. Each fund is divided into portions that are managed by investment professionals with varied backgrounds, ages and investment styles. An extensive global research effort is the backbone of our system.
|
 | Superior long-term track record Our equity funds have beaten their Lipper peer indexes in 90% of 10-year periods and 96% of 20-year periods. Our fixed-income funds have beaten their Lipper indexes in 58% of 10-year periods and 63% of 20-year periods.2 Our fund management fees have been among the lowest in the industry.3
|
| 1 | As of 12/31/12. | |
| 2 | Based on Class A share results for periods through 12/31/12. Periods covered are the shorter of the fund’s lifetime or since the comparable Lipper index inception date. | |
| 3 | Based on management fees for the 20-year period ended 12/31/12 versus comparable Lipper categories, excluding funds of funds. |
| American Funds span a range of investment objectives | |
| § | Growth funds |
| AMCAP Fund® | |
| EuroPacific Growth Fund® | |
| The Growth Fund of America® | |
| The New Economy Fund® | |
| New Perspective Fund® | |
| New World Fund® | |
| Smallcap World Fund® | |
| § | Growth-and-income funds |
| American Mutual Fund® | |
| Capital World Growth and Income Fund® | |
| Fundamental InvestorsSM | |
| International Growth and Income FundSM | |
| The Investment Company of America® | |
| Washington Mutual Investors FundSM | |
| § | Equity-income funds |
| Capital Income Builder® | |
| The Income Fund of America® | |
| § | Balanced funds |
| American Balanced Fund® | |
| American Funds Global Balanced FundSM | |
| § | Bond funds |
| American Funds Mortgage Fund® | |
| American High-Income Trust® | |
| The Bond Fund of America® | |
| Capital World Bond Fund® | |
| Intermediate Bond Fund of America® | |
| Short-Term Bond Fund of America® | |
| U.S. Government Securities Fund® | |
| § | Tax-exempt bond funds |
| American Funds Short-Term Tax-Exempt Bond Fund® | |
| American High-Income Municipal Bond Fund® | |
| Limited Term Tax-Exempt Bond Fund of America® | |
| The Tax-Exempt Bond Fund of America® | |
| § | State-specific tax-exempt funds |
| American Funds Tax-Exempt Fund of New York® | |
| The Tax-Exempt Fund of California® | |
| The Tax-Exempt Fund of Maryland® | |
| The Tax-Exempt Fund of Virginia® | |
| § | Money market fund |
| American Funds Money Market Fund® | |
| § | American Funds Portfolio SeriesSM |
| American Funds Global Growth PortfolioSM | |
| American Funds Growth PortfolioSM | |
| American Funds Growth and Income PortfolioSM | |
| American Funds Balanced PortfolioSM | |
| American Funds Income PortfolioSM | |
| American Funds Tax-Advantaged Income PortfolioSM | |
| American Funds Preservation PortfolioSM | |
| American Funds Tax-Exempt Preservation PortfolioSM | |
| § | American Funds Target Date Retirement Series® |
| § | American Funds College Target Date SeriesSM |

| The Capital Group Companies | ||||
| American Funds | Capital Research and Management | Capital International | Capital Guardian | Capital Bank and Trust |
ITEM 2 – Code of Ethics
The Registrant has adopted a Code of Ethics that applies to its Principal Executive Officer and Principal Financial Officer. The Registrant undertakes to provide to any person without charge, upon request, a copy of the Code of Ethics. Such request can be made to American Funds Service Company at 800/421-0180 or to the Secretary of the Registrant, 333 South Hope Street, Los Angeles, California 90071.
ITEM 3 – Audit Committee Financial Expert
The Registrant’s board has determined that James G. Ellis, a member of the Registrant’s audit committee, is an “audit committee financial expert” and "independent," as such terms are defined in this Item. This designation will not increase the designee’s duties, obligations or liability as compared to his or her duties, obligations and liability as a member of the audit committee and of the board, nor will it reduce the responsibility of the other audit committee members. There may be other individuals who, through education or experience, would qualify as "audit committee financial experts" if the board had designated them as such. Most importantly, the board believes each member of the audit committee contributes significantly to the effective oversight of the Registrant’s financial statements and condition.
ITEM 4 – Principal Accountant Fees and Services
| Registrant: | ||||
| a) Audit Fees: | ||||
| 2011 | $87,000 | |||
| 2012 | $89,000 | |||
| b) Audit-Related Fees: | ||||
| 2011 | $19,000 | |||
| 2012 | $19,000 | |||
| The audit-related fees consist of assurance and related services relating to the examination of the Registrant’s investment adviser conducted in accordance with Statement on Standards for Attestation Engagements Number 16 issued by the American Institute of Certified Public Accountants. | ||||
| c) Tax Fees: | ||||
| 2011 | $7,000 | |||
| 2012 | $7,000 | |||
| The tax fees consist of professional services relating to the preparation of the Registrant’s tax returns including returns relating to the Registrant’s investments in non-U.S. jurisdictions. | ||||
| d) All Other Fees: | ||||
| 2011 | None | |||
| 2012 | None | |||
| Adviser and affiliates (includes only fees for non-audit services billed to the adviser and affiliates for engagements that relate directly to the operations and financial reporting of the Registrant and were subject to the pre-approval policies described below): | ||||
| a) Audit Fees: | ||||
| Not Applicable | ||||
| b) Audit-Related Fees: | ||||
| 2011 | $911,000 | |||
| 2012 | $1,055,000 | |||
| The audit-related fees consist of assurance and related services relating to the examination of the Registrant’s transfer agent, principal underwriter and investment adviser conducted in accordance with Statement on Standards for Attestation Engagements Number 16 issued by the American Institute of Certified Public Accountants. | ||||
| c) Tax Fees: | ||||
| 2011 | $43,000 | |||
| 2012 | $34,000 | |||
| The tax fees consist of consulting services relating to the Registrant’s investments. | ||||
| d) All Other Fees: | ||||
| 2011 | $4,000 | |||
| 2012 | $2,000 | |||
| The other fees consist of subscription services related to an accounting research tool. | ||||
All audit and permissible non-audit services that the Registrant’s audit committee considers compatible with maintaining the independent registered public accounting firm’s independence are required to be pre-approved by the committee. The pre-approval requirement will extend to all non-audit services provided to the Registrant, the investment adviser, and any entity controlling, controlled by, or under common control with the investment adviser that provides ongoing services to the Registrant, if the engagement relates directly to the operations and financial reporting of the Registrant. The committee will not delegate its responsibility to pre-approve these services to the investment adviser. The committee may delegate to one or more committee members the authority to review and pre-approve audit and permissible non-audit services. Actions taken under any such delegation will be reported to the full committee at its next meeting. The pre-approval requirement is waived with respect to non-audit services if certain conditions are met. The pre-approval requirement was not waived for any of the non-audit services listed above provided to the Registrant, adviser and affiliates.
Aggregate non-audit fees paid to the Registrant’s auditors, including fees for all services billed to the Registrant, adviser and affiliates that provide ongoing services to the Registrant, were $1,608,000 for fiscal year 2011 and $1,587,000 for fiscal year 2012. The non-audit services represented by these amounts were brought to the attention of the committee and considered to be compatible with maintaining the auditors’ independence.
ITEM 5 – Audit Committee of Listed Registrants
Not applicable to this Registrant, insofar as the Registrant is not a listed issuer as defined in Rule 10A-3 under the Securities Exchange Act of 1934.
ITEM 6 – Schedule of Investments

The Investment Company of America®
Investment portfolio
December 31, 2012
| Value | ||
| Common stocks — 89.87% | Shares | (000) |
| ENERGY — 13.55% | ||
| Apache Corp. | 4,870,000 | $ 382,295 |
| Baker Hughes Inc. | 12,821,000 | 523,610 |
| BP PLC1 | 136,457,810 | 945,484 |
| BP PLC (ADR) | 3,676,953 | 153,108 |
| Canadian Natural Resources, Ltd. | 4,165,000 | 119,921 |
| Chevron Corp. | 7,980,000 | 862,957 |
| ConocoPhillips | 11,925,000 | 691,531 |
| Devon Energy Corp. | 4,305,000 | 224,032 |
| Diamond Offshore Drilling, Inc. | 1,000,000 | 67,960 |
| Eni SpA1 | 3,348,000 | 82,594 |
| EOG Resources, Inc. | 4,232,200 | 511,207 |
| Halliburton Co. | 8,625,000 | 299,201 |
| Kinder Morgan, Inc. | 5,700,000 | 201,381 |
| Royal Dutch Shell PLC, Class A (ADR) | 11,923,700 | 822,139 |
| Royal Dutch Shell PLC, Class B1 | 12,150,000 | 430,017 |
| Royal Dutch Shell PLC, Class B (ADR) | 2,975,498 | 210,933 |
| Schlumberger Ltd. | 15,364,999 | 1,064,641 |
| TOTAL SA1 | 3,000,000 | 155,273 |
| 7,748,284 | ||
| MATERIALS — 4.04% | ||
| ArcelorMittal1 | 7,540,000 | 130,525 |
| Barrick Gold Corp. | 2,489,100 | 87,143 |
| Dow Chemical Co. | 42,502,000 | 1,373,665 |
| International Flavors & Fragrances Inc. | 3,006,500 | 200,053 |
| POSCO1 | 136,000 | 44,468 |
| Praxair, Inc. | 3,439,500 | 376,453 |
| United States Steel Corp. | 4,160,000 | 99,299 |
| 2,311,606 | ||
| INDUSTRIALS — 10.72% | ||
| CSX Corp. | 35,337,748 | 697,214 |
| Danaher Corp. | 3,800,000 | 212,420 |
| Deere & Co. | 2,800,000 | 241,976 |
| Emerson Electric Co. | 2,130,000 | 112,805 |
| European Aeronautic Defence and Space Co. EADS NV1 | 3,935,000 | 154,226 |
| FedEx Corp. | 604,172 | 55,415 |
| General Dynamics Corp. | 14,042,800 | 972,745 |
| General Electric Co. | 21,875,000 | 459,156 |
| Illinois Tool Works Inc. | 6,400,000 | 389,184 |
| Lockheed Martin Corp. | 2,790,820 | 257,565 |
| Masco Corp.2 | 22,329,069 | 372,002 |
| R.R. Donnelley & Sons Co.2 | 10,135,000 | 91,215 |
| Textron Inc. | 5,038,800 | 124,912 |
| Union Pacific Corp. | 3,193,900 | 401,537 |
| United Continental Holdings, Inc.3 | 8,450,000 | 197,561 |
| United Parcel Service, Inc., Class B | 5,365,000 | $ 395,561 |
| United Technologies Corp. | 6,961,852 | 570,941 |
| Waste Management, Inc. | 12,616,700 | 425,687 |
| 6,132,122 | ||
| CONSUMER DISCRETIONARY — 12.09% | ||
| Amazon.com, Inc.3 | 2,885,000 | 724,539 |
| Comcast Corp., Class A | 9,273,400 | 346,640 |
| Comcast Corp., Class A, special nonvoting shares | 7,000,000 | 251,650 |
| Daimler AG1 | 960,000 | 52,459 |
| DIRECTV3 | 2,500,000 | 125,400 |
| Ford Motor Co. | 9,500,000 | 123,025 |
| General Motors Co.3 | 35,490,500 | 1,023,191 |
| Harley-Davidson, Inc. | 2,650,000 | 129,426 |
| Home Depot, Inc. | 19,942,100 | 1,233,419 |
| Johnson Controls, Inc. | 11,898,000 | 365,269 |
| Kohl’s Corp. | 4,244,000 | 182,407 |
| Las Vegas Sands Corp. | 3,430,000 | 158,329 |
| McDonald’s Corp. | 2,000,000 | 176,420 |
| News Corp., Class A | 14,500,000 | 370,330 |
| NIKE, Inc., Class B | 7,156,200 | 369,260 |
| Nissan Motor Co., Ltd.1 | 18,365,000 | 174,310 |
| Nordstrom, Inc. | 1,500,000 | 80,250 |
| Time Warner Cable Inc. | 4,362,727 | 424,014 |
| Time Warner Inc. | 8,604,000 | 411,529 |
| WPP PLC1 | 2,800,000 | 40,704 |
| Wynn Resorts, Ltd. | 1,364,800 | 153,526 |
| 6,916,097 | ||
| CONSUMER STAPLES — 11.07% | ||
| Altria Group, Inc. | 33,780,000 | 1,061,368 |
| Avon Products, Inc. | 3,000,000 | 43,080 |
| Coca-Cola Co. | 13,606,600 | 493,239 |
| ConAgra Foods, Inc. | 5,521,100 | 162,872 |
| CVS/Caremark Corp. | 10,450,000 | 505,258 |
| General Mills, Inc. | 3,920,000 | 158,407 |
| Hillshire Brands Co. | 1,000,000 | 28,140 |
| Kellogg Co. | 3,903,268 | 217,998 |
| Kimberly-Clark Corp. | 1,500,000 | 126,645 |
| Kraft Foods Group, Inc. | 6,124,722 | 278,491 |
| Lorillard, Inc. | 1,773,000 | 206,856 |
| Molson Coors Brewing Co., Class B | 512,708 | 21,939 |
| Mondelez International, Inc. | 16,090,000 | 409,812 |
| PepsiCo, Inc. | 5,220,000 | 357,205 |
| Philip Morris International Inc. | 26,354,572 | 2,204,296 |
| Reynolds American Inc. | 1,333,332 | 55,240 |
| 6,330,846 | ||
| HEALTH CARE — 10.92% | ||
| Abbott Laboratories | 20,103,038 | 1,316,753 |
| Aetna Inc. | 8,763,000 | 405,727 |
| Alexion Pharmaceuticals, Inc.3 | 2,350,000 | 220,454 |
| Allergan, Inc. | 625,000 | 57,331 |
| Amgen Inc. | 16,225,000 | 1,400,542 |
| Bayer AG1 | 1,931,500 | 183,420 |
| Gilead Sciences, Inc.3 | 17,149,300 | 1,259,616 |
| GlaxoSmithKline PLC1 | 6,000,000 | 130,270 |
| Johnson & Johnson | 600,000 | 42,060 |
| Medtronic, Inc. | 3,562,500 | 146,134 |
| Merck & Co., Inc. | 2,800,000 | 114,632 |
| Novartis AG1 | 5,199,000 | $ 329,157 |
| Novartis AG (ADR) | 921,556 | 58,334 |
| Pfizer Inc | 4,025,000 | 100,947 |
| St. Jude Medical, Inc. | 5,798,479 | 209,557 |
| UnitedHealth Group Inc. | 5,055,000 | 274,183 |
| 6,249,117 | ||
| FINANCIALS — 3.79% | ||
| Aon PLC, Class A | 8,975,000 | 499,010 |
| Capital One Financial Corp. | 6,500,000 | 376,545 |
| Citigroup Inc. | 5,310,455 | 210,082 |
| Credit Suisse Group AG1 | 7,239,400 | 181,646 |
| HSBC Holdings PLC (United Kingdom)1 | 4,869,240 | 51,501 |
| HSBC Holdings PLC (ADR) | 1,529,416 | 81,166 |
| JPMorgan Chase & Co. | 10,330,000 | 454,210 |
| Prudential Financial, Inc. | 1,500,000 | 79,995 |
| Société Générale1,3 | 3,432,877 | 129,125 |
| Wells Fargo & Co. | 3,000,000 | 102,540 |
| 2,165,820 | ||
| INFORMATION TECHNOLOGY — 13.30% | ||
| Accenture PLC, Class A | 2,850,000 | 189,525 |
| Adobe Systems Inc.3 | 3,130,000 | 117,938 |
| Apple Inc. | 1,290,000 | 687,609 |
| Automatic Data Processing, Inc. | 4,023,043 | 229,354 |
| Broadcom Corp., Class A | 2,200,000 | 73,062 |
| Corning Inc. | 4,500,000 | 56,790 |
| Flextronics International Ltd.3 | 7,500,000 | 46,575 |
| Google Inc., Class A3 | 486,200 | 344,896 |
| Hewlett-Packard Co. | 37,500,000 | 534,375 |
| Intel Corp. | 16,840,000 | 347,409 |
| International Business Machines Corp. | 1,624,741 | 311,219 |
| KLA-Tencor Corp. | 6,276,900 | 299,785 |
| Linear Technology Corp. | 4,100,000 | 140,630 |
| Maxim Integrated Products, Inc. | 2,757,700 | 81,076 |
| Microsoft Corp. | 56,520,500 | 1,510,793 |
| Nokia Corp.1 | 27,125,000 | 106,672 |
| Nokia Corp. (ADR) | 5,652,400 | 22,327 |
| Oracle Corp. | 33,835,000 | 1,127,382 |
| Samsung Electronics Co. Ltd.1 | 331,700 | 474,737 |
| Texas Instruments Inc. | 24,825,000 | 768,085 |
| Xilinx, Inc. | 3,754,500 | 134,787 |
| 7,605,026 | ||
| TELECOMMUNICATION SERVICES — 5.96% | ||
| AT&T Inc. | 34,203,000 | 1,152,983 |
| CenturyLink, Inc. | 8,763,600 | 342,832 |
| Sprint Nextel Corp., Series 13 | 141,042,400 | 799,710 |
| Verizon Communications Inc. | 20,744,600 | 897,619 |
| Vodafone Group PLC1 | 85,950,000 | 216,153 |
| 3,409,297 | ||
| UTILITIES — 2.32% | ||
| Dominion Resources, Inc. | 9,403,824 | 487,118 |
| Exelon Corp. | 5,120,600 | 152,287 |
| FirstEnergy Corp. | 4,443,500 | 185,561 |
| GDF SUEZ1 | 10,085,861 | 207,808 |
| NextEra Energy, Inc. | 300,000 | 20,757 |
| PG&E Corp. | 2,225,000 | 89,400 |
| Public Service Enterprise Group Inc. | 6,000,000 | 183,600 |
| 1,326,531 | ||
| Value | ||
| Common stocks | (000) | |
| MISCELLANEOUS — 2.11% | ||
| Other common stocks in initial period of acquisition4 | $ 1,204,365 | |
| Total common stocks (cost: $37,393,054,000) | 51,399,111 | |
| Shares or | ||
| Convertible securities — 0.82% | principal amount | |
| MATERIALS — 0.09% | ||
| ArcelorMittal 5.00% convertible debenture 2014 | $48,620,000 | 50,778 |
| CONSUMER DISCRETIONARY — 0.70% | ||
| General Motors Co., Series B, 4.75% convertible preferred 2013 | 9,060,850 | 399,855 |
| FINANCIALS — 0.03% | ||
| Credit Suisse Group AG 4.00% convertible notes 2013 | CHF13,569,000 | 20,332 |
| Total convertible securities (cost: $491,702,000) | 470,965 | |
| Principal amount | ||
| Bonds & notes — 0.59% | (000) | |
| FINANCIALS — 0.13% | ||
| JPMorgan Chase & Co., Series I, junior subordinated 7.90% (undated)5 | $ 62,936 | 71,562 |
| TELECOMMUNICATION SERVICES — 0.46% | ||
| Sprint Capital Corp. 6.90% 2019 | 17,200 | 18,834 |
| Sprint Nextel Corp. 11.50% 2021 | 101,775 | 138,796 |
| Sprint Nextel Corp. 8.375% 2017 | 7,825 | 9,136 |
| Sprint Nextel Corp. 9.125% 2017 | 83,400 | 98,620 |
| 265,386 | ||
| Total bonds & notes (cost: $271,138,000) | 336,948 | |
| Short-term securities — 8.98% | ||
| Chariot Funding, LLC 0.21% due 3/4–3/19/20136 | 39,400 | 39,390 |
| Jupiter Securitization Co., LLC 0.19%–0.21% due 1/15–3/21/20136 | 75,800 | 75,789 |
| Coca-Cola Co. 0.16%–0.24% due 1/17–2/8/20136 | 129,346 | 129,334 |
| Fannie Mae 0.125%–0.18% due 1/2–10/1/2013 | 1,286,193 | 1,285,967 |
| Federal Farm Credit Banks 0.14%–0.22% due 2/25–11/21/2013 | 722,600 | 722,013 |
| Federal Home Loan Bank 0.11%–0.22% due 1/8–9/12/2013 | 811,000 | 810,807 |
| Freddie Mac 0.10%–0.22% due 1/7–7/8/2013 | 1,173,505 | 1,173,296 |
| John Deere Credit Ltd. 0.19% due 2/22/20136 | 52,000 | 51,985 |
| National Rural Utilities Cooperative Finance Corp. 0.15% due 1/8/2013 | 5,000 | 5,000 |
| Paccar Financial Corp. 0.17% due 3/4/2013 | 32,100 | 32,086 |
| Private Export Funding Corp. 0.18%–0.29% due 2/15–6/18/20136 | 92,600 | 92,546 |
| Procter & Gamble Co. 0.15% due 1/10–1/25/20136 | 107,000 | 106,996 |
| Regents of the University of California 0.18% due 1/24/2013 | 31,673 | 31,669 |
| U.S. Treasury Bills 0.135%–0.193% due 1/24–9/19/2013 | 458,900 | 458,700 |
| Variable Funding Capital Corp. 0.17% due 1/23/20136 | 18,200 | 18,198 |
| Wal-Mart Stores, Inc. 0.10% due 1/22–1/24/20136 | 100,400 | 100,394 |
| Total short-term securities (cost: $5,133,157,000) | 5,134,170 | |
| Value | ||
| (000) | ||
| Total investment securities (cost: $43,289,051,000) | $57,341,194 | |
| Other assets less liabilities | (146,250) | |
| Net assets | $57,194,944 |
As permitted by U.S. Securities and Exchange Commission regulations, “Miscellaneous” securities include holdings in their first year of acquisition that have not previously been publicly disclosed.
1Valued under fair value procedures adopted by authority of the board of trustees. The total value of all such securities, including those in “Miscellaneous,” was $4,625,307,000, which represented 8.09% of the net assets of the fund. This entire amount relates to certain securities trading outside the U.S. whose values were adjusted as a result of significant market movements following the close of local trading.
2Represents an affiliated company as defined under the Investment Company Act of 1940.
3Security did not produce income during the last 12 months.
4Includes a security that has been authorized but not yet issued.
5Coupon rate may change periodically.
6Acquired in a transaction exempt from registration under section 4(2) of the Securities Act of 1933. May be resold in the U.S. in transactions exempt from registration, normally to qualified institutional buyers. The total value of all such securities was $614,632,000, which represented 1.07% of the net assets of the fund.
Key to abbreviations
ADR = American Depositary Receipts
CHF = Swiss francs
Investments are not FDIC-insured, nor are they deposits of or guaranteed by a bank or any other entity, so they may lose value.
Investors should carefully consider investment objectives, risks, charges and expenses. This and other important information is contained in the fund prospectus and summary prospectus, which can be obtained from your financial professional and should be read carefully before investing. You may also call American Funds Service Company (AFS) at 800/421-4225 or visit the American Funds website at americanfunds.com.
| MFGEFPX-004-0213O-S32826 |
REPORT OF INDEPENDENT REGISTERED PUBLIC ACCOUNTING FIRM ON INVESTMENT PORTFOLIO
To the Shareholders and Board of Trustees of
The Investment Company of America:
We have audited, in accordance with the standards of the Public Company Accounting Oversight Board (United States), the financial statements of The Investment Company of America (the “Fund”) as of December 31, 2012, and for the year then ended and have issued our report thereon dated February 6, 2013, which report and financial statements are included in Item 1 of this Certified Shareholder Report on Form N-CSR. Our audit also included the Fund’s investment portfolio (the “Schedule”) as of December 31, 2012, appearing in Item 6 of this Form N-CSR. This Schedule is the responsibility of the Fund’s management. Our responsibility is to express an opinion based on our audit. In our opinion, the Schedule referred to above, when considered in relation to the basic financial statements taken as a whole of the Fund referred to above, presents fairly, in all material respects, the information set forth therein.
DELOITTE & TOUCHE LLP
Costa Mesa, California
February 6, 2013
ITEM 7 – Disclosure of Proxy Voting Policies and Procedures for Closed-End Management Investment Companies
Not applicable to this Registrant, insofar as the Registrant is not a closed-end management investment company.
ITEM 8 – Portfolio Managers of Closed-End Management Investment Companies
Not applicable to this Registrant, insofar as the Registrant is not a closed-end management investment company.
ITEM 9 – Purchases of Equity Securities by Closed-End Management Investment Company and Affiliated Purchasers
Not applicable to this Registrant, insofar as the Registrant is not a closed-end management investment company.
ITEM 10 – Submission of Matters to a Vote of Security Holders
There have been no material changes to the procedures by which shareholders may recommend nominees to the Registrant’s board of trustees since the Registrant last submitted a proxy statement to its shareholders. The procedures are as follows. The Registrant has a nominating and governance committee comprised solely of persons who are not considered ‘interested persons’’ of the Registrant within the meaning of the Investment Company Act of 1940, as amended. The committee periodically reviews such issues as the board’s composition, responsibilities, committees, compensation and other relevant issues, and recommends any appropriate changes to the full board of trustees. While the committee normally is able to identify from its own resources an ample number of qualified candidates, it will consider shareholder suggestions of persons to be considered as nominees to fill future vacancies on the board. Such suggestions must be sent in writing to the nominating and governance committee of the Registrant, c/o the Registrant’s Secretary, and must be accompanied by complete biographical and occupational data on the prospective nominee, along with a written consent of the prospective nominee for consideration of his or her name by the nominating and governance committee.
ITEM 11 – Controls and Procedures
| (a) | The Registrant’s Principal Executive Officer and Principal Financial Officer have concluded, based on their evaluation of the Registrant’s disclosure controls and procedures (as such term is defined in Rule 30a-3 under the Investment Company Act of 1940), that such controls and procedures are adequate and reasonably designed to achieve the purposes described in paragraph (c) of such rule. |
| (b) | There were no changes in the Registrant’s internal controls over financial reporting (as defined in Rule 30a-3(d) under the Investment Company Act of 1940) that occurred during the Registrant’s second fiscal quarter of the period covered by this report that has materially affected, or is reasonably likely to materially affect, the Registrant’s internal control over financial reporting. |
ITEM 12 – Exhibits
| (a)(1) | The Code of Ethics that is the subject of the disclosure required by Item 2 is attached as an exhibit hereto. |
| (a)(2) | The certifications required by Rule 30a-2 of the Investment Company Act of 1940 and Sections 302 and 906 of the Sarbanes-Oxley Act of 2002 are attached as exhibits hereto. |
SIGNATURES
Pursuant to the requirements of the Securities Exchange Act of 1934 and the Investment Company Act of 1940, the Registrant has duly caused this report to be signed on its behalf by the undersigned, thereunto duly authorized.
| THE INVESTMENT COMPANY OF AMERICA | |
| By /s/ James B. Lovelace | |
James B. Lovelace, Vice Chairman and Principal Executive Officer | |
| Date: February 28, 2013 |
Pursuant to the requirements of the Securities Exchange Act of 1934 and the Investment Company Act of 1940, this report has been signed below by the following persons on behalf of the Registrant and in the capacities and on the dates indicated.
| By /s/ James B. Lovelace |
James B. Lovelace, Vice Chairman and Principal Executive Officer |
| Date: February 28, 2013 |
| By /s/ Brian D. Bullard |
Brian D. Bullard, Treasurer and Principal Financial Officer |
| Date: February 28, 2013 |