UNITED STATES
SECURITIES AND EXCHANGE COMMISSION
Washington, D.C. 20549
FORM N-CSR
Certified Shareholder Report of
Registered Management Investment Companies
Investment Company Act File Number: 811-00116
The Investment Company of America
(Exact Name of Registrant as Specified in Charter)
333 South Hope Street
Los Angeles, California 90071
(Address of Principal Executive Offices)
Registrant's telephone number, including area code: (213) 486-9200
Date of fiscal year end: December 31
Date of reporting period: December 31, 2014
Michael W. Stockton
The Investment Company of America
333 South Hope Street
Los Angeles, California 90071
(Name and Address of Agent for Service)
Copies to:
Eric A. S. Richards
O’Melveny & Myers LLP
400 South Hope Street, 10th Floor
Los Angeles, California 90071
(Counsel for the Registrant)
ITEM 1 – Reports to Stockholders

Consistency and a
long-term view are at
the core of our active
management philosophy.
Special feature page 8
| | ICA The Investment
Annual report |
ICA seeks long-term growth of capital and income, placing greater emphasis on the potential for capital appreciation and future dividends than on current yield.
The Investment Company of America is one of more than 40 funds offered by one of the nation’s largest mutual fund families, American Funds, from Capital Group. For more than 80 years, Capital has invested with a long-term focus based on thorough research and attention to risk.
Fund results shown in this report, unless otherwise indicated, are for Class A shares at net asset value. If a sales charge (maximum 5.75%) had been deducted, the results would have been lower. Results are for past periods and are not predictive of results for future periods. Current and future results may be lower or higher than those shown. Share prices and returns will vary, so investors may lose money. Investing for short periods makes losses more likely. Investments are not FDIC-insured, nor are they deposits of or guaranteed by a bank or any other entity, so they may lose value. For current information and month-end results, visit americanfunds.com.
See page 5 for Class A share results with relevant sales charges deducted. For other share class results, visit americanfunds.com and americanfundsretirement.com.
Investment results assume all distributions are reinvested and reflect applicable fees and expenses. When applicable, investment results reflect fee waivers, without which results would have been lower. Visit americanfunds.com for more information.
The fund’s 30-day yield for Class A shares as of January 31, 2015, reflecting the 5.75% maximum sales charge and calculated in accordance with the U.S. Securities and Exchange Commission formula, was 1.55%.
Investing outside the United States may be subject to risks, such as currency fluctuations, political instability, differing securities regulations and periods of illiquidity. Global diversification can help reduce these risks. Refer to the fund prospectus and the Risk Factors section of this report for more information on these and other risks associated with investing in the fund.
Special feature
| 8 | ICA’s active advantage has added value over 80 years. |
| Contents | |
| 1 | Letter to investors |
| 4 | The value of a long-term perspective |
| 14 | Summary investment portfolio |
| 17 | Financial statements |
| 35 | Board of trustees and other officers |
Continued expansion of the U.S. economy and accompanying strength in the equity markets led The Investment Company of America 12.09% higher for the 12-month period ended December 31, 2014, with distributions reinvested. In comparison, the unmanaged Standard & Poor’s 500 Composite Index, a market capitalization-weighted index based on the results of 500 widely held common stocks, returned 13.66% during the same time period.
For the 20 years ended December 31, 2014, ICA posted an average annual total return of 10.17% with distributions reinvested, compared with 9.84% by the S&P 500. Over its 81-year history, ICA had an average annual total return of 12.25% with distributions reinvested, compared with 10.90% by the S&P 500.
Progress in the U.S. economy amid global economic struggles
The U.S. economy continued a slow but sure recovery and expansion. As a result, earnings, particularly of U.S. companies, continued to grow. The Federal Reserve ended its latest quantitative easing program in October and, happily, that did not roil the U.S. markets. The Fed has dedicated itself to keeping interest rates low as a stimulative measure, which likely has been a contributing factor to American economic growth.
After a rough first quarter for U.S. economic growth, activity picked up as the year progressed: real gross domestic product growth for the second and third quarters increased at an annual rate of 4.6% and 5.0%, respectively. The advanced estimate for the fourth quarter showed the economy’s pace slowing as real GDP growth rose at an annual rate of 2.6%. The unemployment rate declined to 5.6% at year-end. Falling gasoline prices buoyed consumer confidence, however the housing recovery showed some signs of faltering.
U.S. companies faced a complex landscape as global economies struggled, creating a challenge for multinationals. The U.S. dollar strengthened — diminishing profits from overseas — so the more that companies have focused on the U.S., generally, the better off they’ve been. Companies that do business in emerging markets have had headwinds in those countries. The dip in oil prices hurt the economies of oil-producing nations and, along with the strong dollar, adversely affected some emerging markets.
There were several significant geopolitical events during the year —such as Russia invading Ukraine and increased Middle East turmoil — events that gave people pause for concern but that the stock market digested somewhat easily, which was a positive sign.
| The Investment Company of America | 1 |
2014 results at a glance
Year ended December 31, 2014 (with all distributions reinvested)
| ICA | Standard & Poor’s 500 | |||||||
| (Class A shares) | Composite Index* | |||||||
| Income return | 1.99 | % | 2.15 | % | ||||
| Capital return | 10.10 | 11.51 | ||||||
| Total return | 12.09 | % | 13.66 | % | ||||
| * | The S&P 500 is unmanaged and, therefore, has no expenses. Investors cannot invest directly in an index. |
Dividends and capital gain distribution paid in 2014
| Per Class A | ||||||||
| share | Payment date | |||||||
| Income dividends | $0.140 | March 14 | ||||||
| 0.145 | June 13 | |||||||
| 0.145 | September 19 | |||||||
| 0.295 | December 23 | |||||||
| $0.725 | ||||||||
| Capital gain distribution | $3.340 | December 23 | ||||||
Expense ratios and portfolio turnover rates1
Year ended December 31, 2014
| Portfolio | ||||||||
| Expense ratio | turnover rate | |||||||
| ICA | 0.59% | 29% | ||||||
| Industry average2 | 1.11% | 46% | ||||||
| 1 | The expense ratio is the annual percentage of net assets used to pay fund expenses. The ratio shown is for Class A shares as of the prospectus dated March 1, 2015 (unaudited). The portfolio turnover rate is a measure of how often securities are bought and sold by a fund. |
| 2 | Lipper Growth & Income Funds Average (industry average expense ratio based on statistics for front-end load funds, excluding funds of funds, for the most recent fiscal year-ends available as of 12/31/14). |
ICA’s portfolio in review
Health care holdings drove results more than any other sector, led by Amgen (+39.53%) and Gilead Sciences (+25.43%). Gilead and Amgen have been outstanding stocks not only this year, but for a period of time as the market continues to show appreciation for their impactful drugs and drug pipeline. General Dynamics (+44.03%) highlighted industrials, helped by the abatement of concerns in defense spending cuts and the strength of its Gulfstream business.
Energy was a difficult sector compared to the overall market, but the fund demonstrated good stock picking by avoiding many of the worst-performing companies. Information technology stocks were additive, led by Oracle (+17.54%) and Apple (+37.70%) in absolute terms; those gains were offset by a disappointing year for Google (–5.30%). Our position in financials hurt as the broader market outpaced the fund’s financials holdings.
Non-U.S. holdings — which offer the fund flexibility — represented about one-ninth of the fund’s portfolio and detracted from results, reflecting the general struggles of non-U.S. equity markets.
Other top-10 holdings included Verizon (–4.80%), Philip Morris International (–6.52%), Altria Group (+28.34%), AbbVie (+23.92% ) and Texas Instruments (+21.76%). The fund paid investors a total of $0.725 per share in dividends for the period.
| 2 | The Investment Company of America |

A glance ahead
Since the end of the Fed’s quantitative easing program, hopes are that the U.S. economy has its own “escape velocity” to continue to gain momentum without as much assistance. A rise in interest rates may negatively affect markets. Low gasoline prices are a net positive for the U.S. economy as they help the U.S. consumer save money at the pump, which then supports retail, restaurants, the automotive industry and U.S. industrial companies.
Improving job numbers indicate recovery in the U.S. economy; however, it is arguable that too much regulation still restricts corporate growth below what it could be. Despite that, the U.S. economy remains in good territory with the momentum to keep going.
The fund’s portfolio managers don’t see much U.S. recession risk over the next six months, but will keep an eye on the possibilities of recession in Europe and Russia, and a potential slowdown in China. If there is bad news, or increased volatility occurs, it will not cause panic among the fund’s portfolio managers as it can give them an opportunity to invest in companies with more favorable valuations for the long term.
We remain optimistic about continuing to identify solid companies at good valuations that we believe will prosper in the long run. We thank you for your confidence in our time-tested approach to investing and look forward to reporting to you again in six months.
We invite you to read the feature, which starts on page 8 and further explains our approach and culture, and why they have been so successful over time.
Cordially,

James B. Lovelace
Vice Chairman

Donald D. O’Neal
President
February 5, 2015
For current information about the fund, visit americanfunds.com.
| The Investment Company of America | 3 |
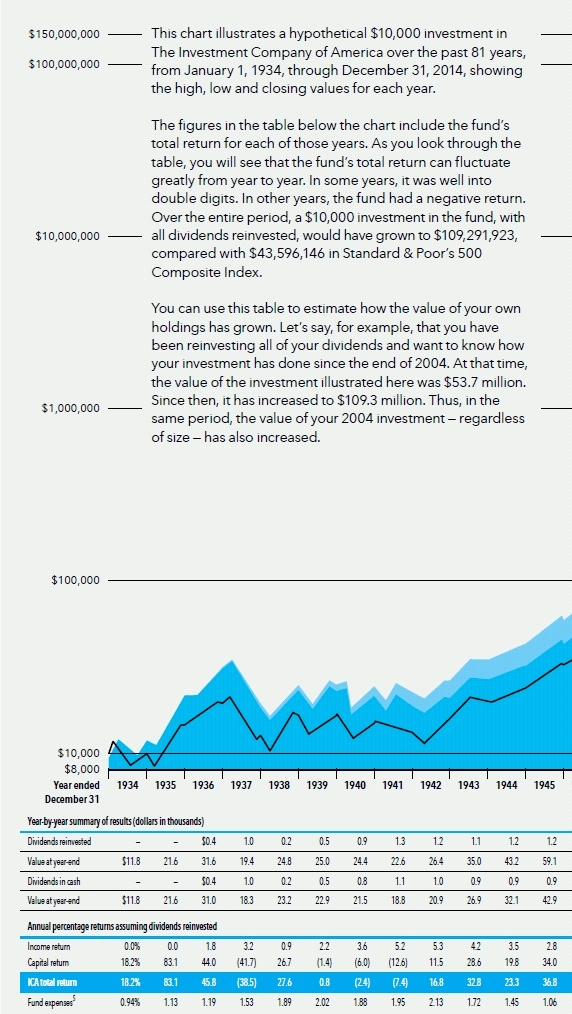
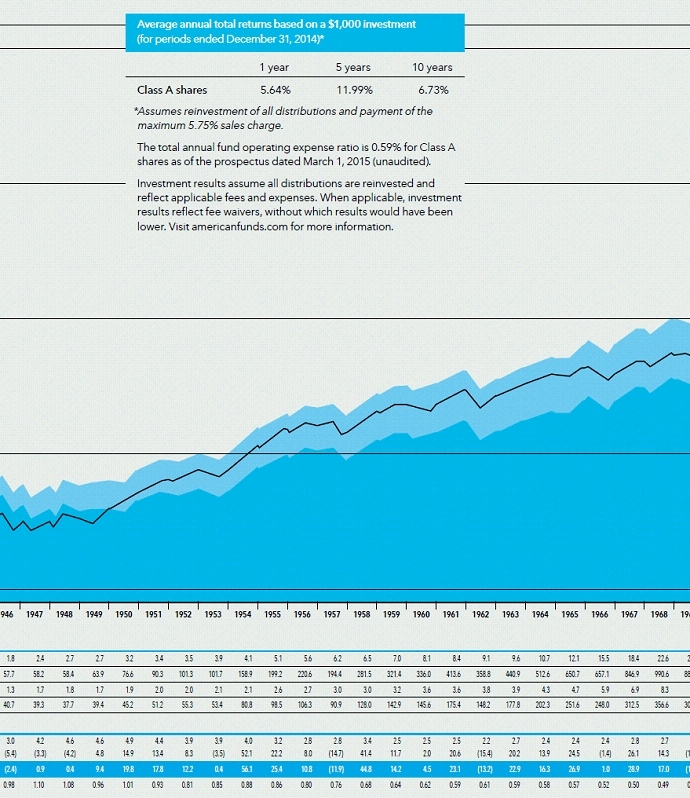
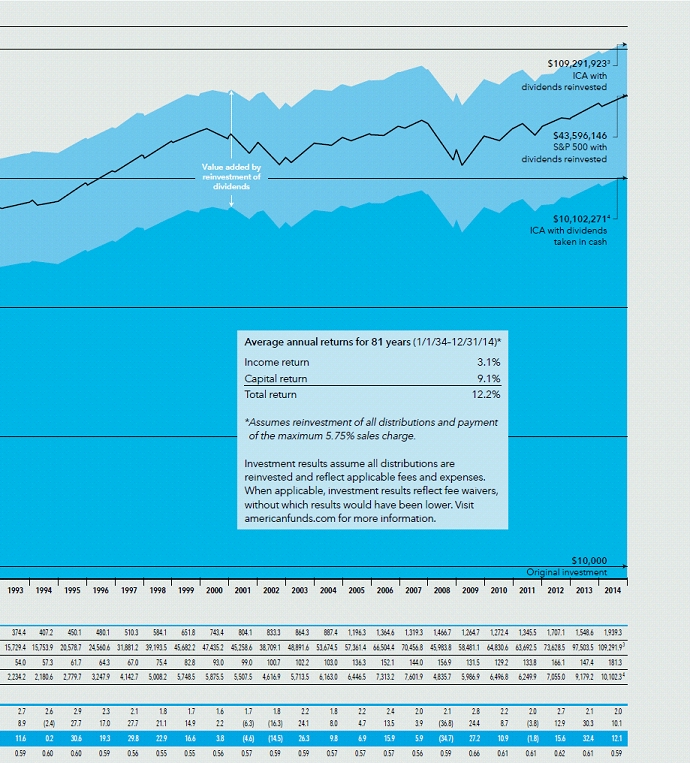
The value of a long-term perspective (1934–2014)
Fund results shown are for Class A shares and reflect deduction of the maximum sales charge of 5.75% on the $10,000 investment.1 Thus, the net amount invested was $9,425.2 Results are for past periods and are not predictive of results for future periods. Current and future results may be lower or higher than those shown. Share prices and returns will vary, so investors may lose money. For current information and month-end results, visit americanfunds.com.
The results shown are before taxes on fund distributions and sale of fund shares.
The S&P 500 is unmanaged and, therefore, has no expenses. Investors cannot invest directly in an index.
| 1 | As outlined in the prospectus, the sales charge is reduced for accounts (and aggregated investments) of $25,000 or more and is eliminated for purchases of $1 million or more. There is no sales charge on dividends or capital gain distributions that are reinvested in additional shares. |
| 2 | The maximum initial sales charge was 8.5% prior to July 1, 1988. |
| 3 | Includes dividends of $25,746,684 and capital gain distributions of $48,270,268 reinvested in the years 1936 to 2014. |
| 4 | Includes reinvested capital gain distributions of $5,837,014, but does not reflect income dividends of $3,199,630 taken in cash. |
| 5 | Fund expense percentages do not reflect a fee waiver and are provided as additional information. They should not be subtracted from any other figure on the table because all fund results already reflect their effect. |
| 4 | The Investment Company of America |
| 5 | The Investment Company of America |

| The Investment Company of America | 6 |
| The Investment Company of America | 7 |

ICA’s active advantage has
added value over 80 years.
Ford vs. Chevy,
Nike vs. Adidas,
Mac vs. PC.
People have long debated which products are best. One such debate compares the merits of actively managed funds, such as The Investment Company of America,® versus passive funds — i.e., those whose holdings mirror an index, like Standard & Poor’s 500 Composite Index. Advocates of passive investing use “the average active portfolio manager” to make their point and, indeed, the average active manager has not consistently outpaced the S&P 500.
Averages, however, do not tell the whole story. After all, just because the average person can’t dunk a basketball doesn’t mean that no one can dunk a basketball. Some can, and do, achieve at a higher level, but using the average to characterize an entire industry muddles the fact that, for instance, there are actively managed funds that have consistently added value over many cycles.
| 8 | The Investment Company of America |
| Jim Lovelace Portfolio Manager | Don O’Neal Portfolio Manager |  | |||||
| 33 years of investment experience | 29 years of investment experience |
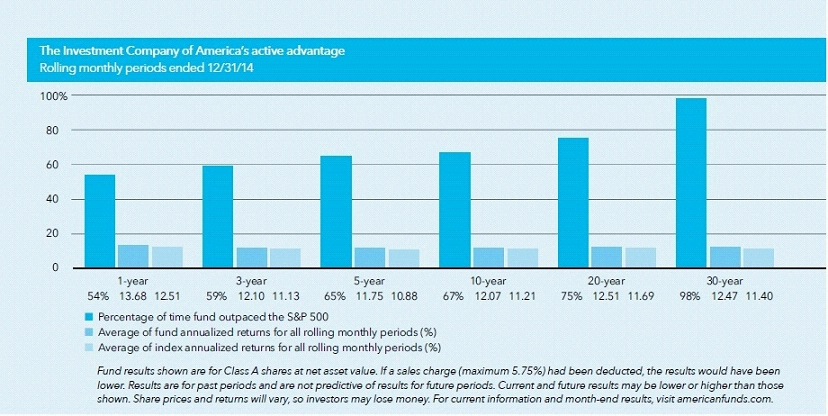
In the chart on page 10, we show results for ICA over every one-, three-, five-, 10-, 20-and 30-year rolling period. The fund did better than the S&P 500 75% of the time over all 20-year rolling periods and 98% of the time over all 30-year rolling periods. Of course, there have been times when ICA’s returns have lagged its benchmark, but the results show a superior long-term track record over the last eight decades.
“ICA’s record over more than 80 years is successful,” says Jim Lovelace, a portfolio manager with the fund since 1991. “It’s hard to know from short-term results whether a manager is good or not, but the more time you give it, the more ‘signal’ there is and the less ‘noise.’ One year there’s a ton of noise, and there’s still noise in five and 10 years, but the signal begins to come through. After 20 years, you have an even stronger sense of whether a manager is good or not.”
What sets ICA apart
There are certain foundational strengths that we believe have allowed us to produce better results than the index and other active managers. ICA’s active advantage can be credited to four main characteristics: a collaborative investment culture and philosophy, experienced portfolio managers and analysts, a commitment to global research, and a long-term focus aligned with client objectives.
A collaborative investment culture and philosophy
Since its inception in 1934, the investment professionals of ICA have applied foundational principles crucial to its success. They are based on fundamental research of companies, identifying stocks at attractive valuations and keeping a long-term focus. “The basic principles of kicking the tires, fundamental research and meeting with management — that’s the due diligence of real investing rather than treating stocks as pieces of paper to be flipped,” says Jim.
Investment professionals’ years of experience shown in this report are as of December 31, 2014.
| The Investment Company of America | 9 |
A culture of collaboration in our investment process combines individual accountability with teamwork. Investment professionals manage portions of the fund independently so each can invest in his or her most strongly held ideas. “This leads to investing with insight and allows individuals to express their own convictions,” explains Jim.
“We want to hire people who are not only smart and hardworking, but also a cultural fit and good teammates. Then, the sum of the parts becomes greater than the individuals,” says Don O’Neal, a portfolio manager with the fund for more than two decades. “That’s the starting point and that’s really important. It’s a group of competitive people, but we also have a culture in which we help each other,” says Don.
Experienced portfolio managers and investment analysts
The six portfolio managers of ICA represent a total of 156 years of investing experience ranging from 18 to 34 years.
The long tenure not only reflects a career commitment to our long-term approach, but also means that each portfolio manager has accrued experience during various types of markets and investing cycles over his or her career.
An ICA investor has the security of knowing that the portfolio managers have likely “seen this before.” Their knowledge can help put into perspective major events and stressors to the stock market such as recessions, debt crises and geopolitical turmoil that could make an investor with less experience excessively worry and only focus on the short term.
Equity investment analysts at American Funds average 15 years of industry investment experience, and many analysts studied their area of focus extensively before joining our organization. Investment analysts not only travel the world to meet with the management of companies, but also are assigned a portion of ICA — known as the research portfolio — to invest in and manage independently.
| 10 | The Investment Company of America |
| Keiko McKibben Investment analyst |  | Dr. Craig Gordon Investment analyst |  | ||||
| 19 years of investment experience | 7 years of investment experience |
This allows the investment analysts to invest in their highest conviction ideas. “It keeps us more engaged in the process — we’re not just writing a research report and hoping the portfolio manager buys the stock,” says Keiko McKibben, an investment analyst with 19 years of experience and research responsibility for industrials and aerospace & defense. “We’re actually making investment decisions; it attracts people who love investing.”
A commitment to global research
The backbone of our long-term results and another advantage over passive investing is a commitment to extensive global research. Gathering insights from research is about collecting — and sharing — information. “The way we conduct research is quite different from everybody else,” says Don. “We take a comprehensive, integrated global look at industries. So not only do the U.S. analysts talk to their counterparts in Europe and Asia, but they also go on trips to visit companies together. If research problems arise, everybody feels empowered to draw on a global network, which enables us to make better decisions.
“Many investment management companies have offices in other parts of the world, but if they don’t have an integrated team of researchers who talk and travel with each other, they’re not getting the same benefit that we get,” continues Don.
As an analyst, Keiko spends a lot of hours in the field visiting sites and listening to customers, competitors, suppliers and other investors to assess the health and long-term potential of a company. “Visiting plants is helpful because the person on the factory floor often has a gut instinct about where we are in an investment cycle,” says Keiko.
She also highly values the importance of management. “The most important characteristics of a CEO are independent-thinking and having good judgment,” says Keiko. “These are important attributes of being a good investor as well.”
Investment analyst Craig D. Gordon, M.D., who has research responsibility for biotechnology and pharmaceutical companies, relies not just on his investment experience, but also on his background as a rheumatologist. This has enabled him to view companies and their products from a distinct perspective.
When he researches drugs in a company’s pipeline, for example, Craig wants to invest in companies where drugs they sell or develop are — or will be — the “standard of care” for a certain patient, illness or clinical circumstance. It helps insulate a drug from payer pushback or changes in the health care environment.
A long-term focus
Essential to the investment culture of ICA is an alignment with investor success over the long term. Decisions are based on a long-term perspective, and incentives for
| The Investment Company of America | 11 |

| Barry Crosthwaite Portfolio Manager |  | |
| 18 years of investment experience |
investment professionals are heavily influenced by results over four- and eight-year periods, as opposed to the quarterly or yearly performance metrics of many competitors.
“A thread through everything we do is a long-term orientation,” says Don. “So many other firms are focused on what’s happening this quarter, and we try to think about what will happen over the next three to five years — and beyond — in an industry and with a company.
“That is a serious competitive advantage when you’re doing the kind of investing that few others are doing. I feel very good about how we’re positioned in a world that seems to get more and more short term every year,” continues Don.
American Funds’ investment philosophy also aligns with the interests of our investors because our company’s associates are significant investors in ICA and the other American Funds.
| 12 | The Investment Company of America |
| Joyce Gordon Portfolio Manager |  | Eric Richter Portfolio Manager |  | Chris Buchbinder Portfolio Manager |  | ||
| 34 years of investment experience | 23 years of investment experience | 19 years of investment experience |
This results in our interests becoming deeply intertwined with those of our investors and means that we share in the funds’ success.
Other benefits of active management
Active management has other advantages over passive investing. Passive investing means mirroring an index and its collection of companies — the good as well as the bad — whereas active investing means always trying to find the best investment. Indexes don’t hold cash so they are always fully in stocks, continuously taking a rather aggressive approach. Active investing uses cash for capital preservation and provides flexibility to buy a stock that looks attractive, without which, another attractive stock would have to be sold to make enough cash.
Indexes typically also don’t consider dividends. “Dividends can help insulate a portfolio during down markets. Income is a form of return, but it’s also a form of risk management because dividends are always positive,” says Jim.
Active management can also help meet an investor’s goal of preserving principal. “The index is not worried about losing principal at all, whereas an active manager is very concerned about losing principal,” continues Jim.
While we see the benefits of active management and have the results to prove it, the debate of active vs. passive will surely continue. “We are a pretty unique company with a strong long-term track record,” says Don. “Academics like to be able to explain things with averages and simple, broad equations. But in the real world, it’s a more granular and complex decision process. We bring some nice advantages in research and how we’re structured that the average active manager can’t offer.” n
| The Investment Company of America | 13 |
| Summary investment portfolio December 31, 2014 | |
| Industry sector diversification | Percent of net assets |

| Common stocks 92.42% | Shares | Value (000) | ||||||
| Energy 8.38% | ||||||||
| BP PLC1 | 110,680,000 | $ | 702,789 | |||||
| Cabot Oil & Gas Corp. | 15,784,000 | 467,364 | ||||||
| Canadian Natural Resources, Ltd. | 19,637,800 | 607,152 | ||||||
| EOG Resources, Inc. | 5,447,200 | 501,524 | ||||||
| Royal Dutch Shell PLC, Class A (ADR) | 8,699,700 | 582,445 | ||||||
| Royal Dutch Shell PLC, Class B1 | 9,250,000 | 317,774 | ||||||
| Other securities | 3,141,732 | |||||||
| 6,320,780 | ||||||||
| Materials 3.19% | ||||||||
| Dow Chemical Co. | 15,955,000 | 727,707 | ||||||
| Praxair, Inc. | 4,880,800 | 632,356 | ||||||
| Other securities | 1,045,347 | |||||||
| 2,405,410 | ||||||||
| Industrials 10.27% | ||||||||
| CSX Corp. | 31,155,771 | 1,128,774 | ||||||
| Cummins Inc. | 4,360,000 | 628,581 | ||||||
| General Dynamics Corp. | 10,974,551 | 1,510,318 | ||||||
| General Electric Co. | 21,875,000 | 552,781 | ||||||
| Illinois Tool Works Inc. | 6,400,000 | 606,080 | ||||||
| Union Pacific Corp. | 4,887,800 | 582,284 | ||||||
| Other securities | 2,738,480 | |||||||
| 7,747,298 | ||||||||
| Consumer discretionary 10.26% | ||||||||
| Amazon.com, Inc.2 | 3,136,500 | 973,413 | ||||||
| Comcast Corp., Class A | 9,593,400 | 556,513 | ||||||
| Comcast Corp., Class A, special nonvoting shares | 6,000,000 | 345,390 | ||||||
| General Motors Co. | 19,018,309 | 663,929 | ||||||
| Home Depot, Inc. | 10,100,000 | 1,060,197 | ||||||
| Johnson Controls, Inc. | 22,359,087 | 1,080,838 | ||||||
| Las Vegas Sands Corp. | 7,775,000 | 452,194 | ||||||
| Time Warner Inc. | 8,104,000 | 692,244 | ||||||
| Other securities | 1,919,052 | |||||||
| 7,743,770 | ||||||||
| Consumer staples 9.87% | ||||||||
| Altria Group, Inc. | 37,442,600 | 1,844,797 | ||||||
| Coca-Cola Co. | 15,744,600 | 664,737 | ||||||
| PepsiCo, Inc. | 5,220,000 | 493,603 | ||||||
| Philip Morris International Inc. | 24,530,019 | 1,997,970 | ||||||
| Other securities | 2,451,097 | |||||||
| 7,452,204 | ||||||||
| 14 | The Investment Company of America |
| Shares | Value (000) | |||||||
| Health care 16.98% | ||||||||
| AbbVie Inc. | 26,035,000 | $ | 1,703,730 | |||||
| Alexion Pharmaceuticals, Inc.2 | 3,207,000 | 593,391 | ||||||
| Amgen Inc. | 22,570,703 | 3,595,287 | ||||||
| Bayer AG1 | 4,181,500 | 571,650 | ||||||
| Gilead Sciences, Inc.2 | 26,975,605 | 2,542,721 | ||||||
| Medtronic, Inc. | 6,277,000 | 453,199 | ||||||
| UnitedHealth Group Inc. | 6,681,123 | 675,395 | ||||||
| Other securities | 2,674,662 | |||||||
| 12,810,035 | ||||||||
| Financials 4.47% | ||||||||
| American International Group, Inc. | 12,830,000 | 718,608 | ||||||
| U.S. Bancorp | 13,565,000 | 609,747 | ||||||
| Other securities | 2,043,405 | |||||||
| 3,371,760 | ||||||||
| Information technology 17.02% | ||||||||
| Accenture PLC, Class A | 8,646,460 | 772,215 | ||||||
| Apple Inc. | 13,117,600 | 1,447,921 | ||||||
| ASML Holding NV1 | 5,350,000 | 573,181 | ||||||
| Broadcom Corp., Class A | 10,639,875 | 461,026 | ||||||
| Google Inc., Class A2 | 1,626,980 | 863,373 | ||||||
| Google Inc., Class C2 | 1,592,980 | 838,545 | ||||||
| Microsoft Corp. | 12,447,100 | 578,168 | ||||||
| Oracle Corp. | 40,732,300 | 1,831,732 | ||||||
| Texas Instruments Inc. | 27,100,773 | 1,448,943 | ||||||
| Western Union Co.3 | 35,700,000 | 639,387 | ||||||
| Other securities | 3,386,683 | |||||||
| 12,841,174 | ||||||||
| Telecommunication services 5.00% | ||||||||
| CenturyLink, Inc. | 18,833,202 | 745,418 | ||||||
| Verizon Communications Inc. | 48,205,798 | 2,255,067 | ||||||
| Other securities | 771,530 | |||||||
| 3,772,015 | ||||||||
| Utilities 3.72% | ||||||||
| Exelon Corp. | 31,293,935 | 1,160,379 | ||||||
| FirstEnergy Corp. | 13,090,025 | 510,380 | ||||||
| Other securities | 1,137,850 | |||||||
| 2,808,609 | ||||||||
| Miscellaneous 3.26% | ||||||||
| Other common stocks in initial period of acquisition | 2,457,494 | |||||||
| Total common stocks (cost: $44,212,555,000) | 69,730,549 | |||||||
| Bonds, notes & other debt instruments 0.06% | Principal amount (000) | |||||||
| U.S. Treasury bonds & notes 0.03% | ||||||||
| Other securities | 26,116 | |||||||
| Corporate bonds & notes 0.03% | ||||||||
| Financials 0.03% | ||||||||
| Other securities | 19,232 | |||||||
| Total bonds, notes & other debt instruments (cost: $41,690,000) | 45,348 | |||||||
| Short-term securities 7.20% | ||||||||
| Coca-Cola Co. 0.12%–0.24% due 2/17/2015–6/11/20154 | $ | 138,900 | 138,857 | |||||
| Fannie Mae 0.05%–0.15% due 1/5/2015–10/5/2015 | 773,400 | 773,095 | ||||||
| Federal Farm Credit Banks 0.04%–0.15% due 2/11/2015–8/27/2015 | 539,300 | 539,000 | ||||||
| Federal Home Loan Bank 0.07%–0.17% due 1/5/2015–7/31/2015 | 1,399,050 | 1,398,908 | ||||||
| The Investment Company of America | 15 |
| Short-term securities (continued) | Principal amount (000) | Value (000) | ||||||
| Freddie Mac 0.07%–0.19% due 1/6/2015–11/23/2015 | $ | 1,350,000 | $ | 1,349,603 | ||||
| Google Inc. 0.09%–0.12% due 2/25/2015–3/18/20154 | 81,600 | 81,583 | ||||||
| Other securities | 1,153,578 | |||||||
| Total short-term securities (cost: $5,434,314,000) | 5,434,624 | |||||||
| Total investment securities 99.68% (cost: $49,688,559,000) | 75,210,521 | |||||||
| Other assets less liabilities 0.32% | 245,209 | |||||||
| Net assets 100.00% | $ | 75,455,730 | ||||||
This summary investment portfolio is designed to streamline the report and help investors better focus on the fund’s principal holdings. See the inside back cover for details on how to obtain a complete schedule of portfolio holdings.
As permitted by U.S. Securities and Exchange Commission regulations, “Miscellaneous” securities include holdings in their first year of acquisition that have not previously been publicly disclosed.
“Other securities” includes all issues that are not disclosed separately in the summary investment portfolio.
Investments in affiliates
A company is an affiliate of the fund under the Investment Company Act of 1940 if the fund’s holdings in that company represent 5% or more of the outstanding voting shares. The value of the fund’s affiliated-company holdings is either shown in the summary investment portfolio or included in the value of “Other securities” under the respective industry sectors. Further details on such holdings and related transactions during the year ended December 31, 2014, appear below.
| Value of | ||||||||||||||||||||||||
| Dividend | affiliates at | |||||||||||||||||||||||
| Beginning | Ending | income | 12/31/2014 | |||||||||||||||||||||
| shares | Additions | Reductions | shares | (000) | (000) | |||||||||||||||||||
| Western Union Co. | 35,700,000 | — | — | 35,700,000 | $ | 17,850 | $ | 639,387 | ||||||||||||||||
| Hasbro, Inc. | 2,921,645 | 3,483,355 | — | 6,405,000 | 8,813 | 352,211 | ||||||||||||||||||
| NRG Energy, Inc.5 | 12,723,600 | 6,786,400 | 5,696,921 | 13,813,079 | 9,499 | — | ||||||||||||||||||
| $ | 36,162 | $ | 991,598 | |||||||||||||||||||||
The following footnotes apply to either the individual securities noted or one or more of the securities aggregated and listed as a single line item.
| 1 | Valued under fair value procedures adopted by authority of the board of trustees. The total value of all such securities, including those in “Miscellaneous” and “Other securities,” was $6,359,878,000, which represented 8.43% of the net assets of the fund. This entire amount relates to certain securities trading outside the U.S. whose values were adjusted as a result of significant market movements following the close of local trading. |
| 2 | Security did not produce income during the last 12 months. |
| 3 | Represents an affiliated company as defined under the Investment Company Act of 1940. |
| 4 | Acquired in a transaction exempt from registration under Section 4(2) of the Securities Act of 1933. May be resold in the U.S. in transactions exempt from registration, normally to qualified institutional buyers. The total value of all such securities, including those in “Other securities,” was $890,615,000, which represented 1.18% of the net assets of the fund. |
| 5 | Unaffiliated issuer at 12/31/2014. |
Key to abbreviation
ADR = American Depositary Receipts
See Notes to Financial Statements
| 16 | The Investment Company of America |
| Financial statements | |
| Statement of assets and liabilities at December 31, 2014 | |
| (dollars in thousands) | |
| Assets: | ||||||||
| Investment securities, at value: | ||||||||
| Unaffiliated issuers (cost: $48,806,529) | $ | 74,218,923 | ||||||
| Affiliated issuers (cost: $882,030) | 991,598 | $ | 75,210,521 | |||||
| Cash denominated in currencies other than U.S. dollars (cost: $3,135) | 3,136 | |||||||
| Cash | 3,317 | |||||||
| Receivables for: | ||||||||
| Sales of investments | 122,196 | |||||||
| Sales of fund’s shares | 185,894 | |||||||
| Dividends and interest | 117,060 | 425,150 | ||||||
| 75,642,124 | ||||||||
| Liabilities: | ||||||||
| Payables for: | ||||||||
| Purchases of investments | 60,928 | |||||||
| Repurchases of fund’s shares | 76,659 | |||||||
| Investment advisory services | 15,387 | |||||||
| Services provided by related parties | 23,470 | |||||||
| Trustees’ deferred compensation | 7,405 | |||||||
| Other | 2,545 | 186,394 | ||||||
| Net assets at December 31, 2014 | $ | 75,455,730 | ||||||
| Net assets consist of: | ||||||||
| Capital paid in on shares of beneficial interest | $ | 49,103,578 | ||||||
| Undistributed net investment income | 298,582 | |||||||
| Undistributed net realized gain | 532,072 | |||||||
| Net unrealized appreciation | 25,521,498 | |||||||
| Net assets at December 31, 2014 | $ | 75,455,730 |
(dollars and shares in thousands, except per-share amounts)
Shares of beneficial interest issued and outstanding (no stated par value) —
unlimited shares authorized (2,036,048 total shares outstanding)
| Shares | Net asset value | |||||||||||
| Net assets | outstanding | per share | ||||||||||
| Class A | $ | 58,429,826 | 1,575,823 | $ | 37.08 | |||||||
| Class B | 308,114 | 8,335 | 36.97 | |||||||||
| Class C | 1,773,796 | 48,238 | 36.77 | |||||||||
| Class F-1 | 2,518,244 | 68,046 | 37.01 | |||||||||
| Class F-2 | 1,761,627 | 47,525 | 37.07 | |||||||||
| Class 529-A | 2,233,969 | 60,362 | 37.01 | |||||||||
| Class 529-B | 48,309 | 1,306 | 36.99 | |||||||||
| Class 529-C | 508,282 | 13,776 | 36.90 | |||||||||
| Class 529-E | 82,494 | 2,235 | 36.91 | |||||||||
| Class 529-F-1 | 61,385 | 1,660 | 36.98 | |||||||||
| Class R-1 | 93,622 | 2,541 | 36.84 | |||||||||
| Class R-2 | 721,983 | 19,575 | 36.88 | |||||||||
| Class R-2E | 25 | 1 | 37.06 | |||||||||
| Class R-3 | 935,687 | 25,309 | 36.97 | |||||||||
| Class R-4 | 997,922 | 26,970 | 37.00 | |||||||||
| Class R-5 | 820,105 | 22,124 | 37.07 | |||||||||
| Class R-6 | 4,160,340 | 112,222 | 37.07 | |||||||||
See Notes to Financial Statements
| The Investment Company of America | 17 |
| Statement of operations for the year ended December 31, 2014 | |
| (dollars in thousands) | |
| Investment income: | ||||||||
| Income: | ||||||||
| Dividends (net of non-U.S. taxes of $21,012; also includes $36,162 from affiliates) | $ | 2,019,690 | ||||||
| Interest | 9,737 | $ | 2,029,427 | |||||
| Fees and expenses*: | ||||||||
| Investment advisory services | 173,526 | |||||||
| Distribution services | 183,293 | |||||||
| Transfer agent services | 68,620 | |||||||
| Administrative services | 13,442 | |||||||
| Reports to shareholders | 2,566 | |||||||
| Registration statement and prospectus | 890 | |||||||
| Trustees’ compensation | 1,016 | |||||||
| Auditing and legal | 155 | |||||||
| Custodian | 1,207 | |||||||
| Other | 2,816 | 447,531 | ||||||
| Net investment income | 1,581,896 | |||||||
| Net realized gain and unrealized depreciation on investments, forward currency contracts and currency: | ||||||||
| Net realized gain (loss) on: | ||||||||
| Investments (includes $24,328 net gain from affiliates) | 7,249,201 | |||||||
| Forward currency contracts | (66 | ) | ||||||
| Currency transactions | (2,567 | ) | 7,246,568 | |||||
| Net unrealized (depreciation) appreciation on: | ||||||||
| Investments | (548,390 | ) | ||||||
| Forward currency contracts | 1,204 | |||||||
| Currency translations | (1,098 | ) | (548,284 | ) | ||||
| Net realized gain and unrealized depreciation on investments, forward currency contracts and currency | 6,698,284 | |||||||
| Net increase in net assets resulting from operations | $ | 8,280,180 |
*Additional information related to class-specific fees and expenses is included in the Notes to Financial Statements.
Statements of changes in net assets
| Year ended December 31 | ||||||||
| 2014 | 2013 | |||||||
| Operations: | ||||||||
| Net investment income | $ | 1,581,896 | $ | 1,089,886 | ||||
| Net realized gain on investments, forward currency contracts and currency transactions | 7,246,568 | 4,609,531 | ||||||
| Net unrealized (depreciation) appreciation on investments, forward currency contracts and currency translations | (548,284 | ) | 12,017,411 | |||||
| Net increase in net assets resulting from operations | 8,280,180 | 17,716,828 | ||||||
| Dividends and distributions paid to shareholders: | ||||||||
| Dividends from net investment income | (1,336,966 | ) | (1,120,099 | ) | ||||
| Distributions from net realized gain on investments | (6,231,464 | ) | (4,478,432 | ) | ||||
| Total dividends and distributions paid to shareholders | (7,568,430 | ) | (5,598,531 | ) | ||||
| Net capital share transactions | 4,823,324 | 607,415 | ||||||
| Total increase in net assets | 5,535,074 | 12,725,712 | ||||||
| Net assets: | ||||||||
| Beginning of year | 69,920,656 | 57,194,944 | ||||||
| End of year (including undistributed net investment income: $298,582 and $56,154, respectively) | $ | 75,455,730 | $ | 69,920,656 | ||||
See Notes to Financial Statements
| 18 | The Investment Company of America |
Notes to financial statements
1. Organization
The Investment Company of America (the “fund”) is registered under the Investment Company Act of 1940 as an open-end, diversified investment company. The fund seeks long-term growth of capital and income, placing greater emphasis on the potential for capital appreciation and future dividends than on current yield.
The fund has 17 share classes consisting of five retail share classes (Classes A, B and C, as well as two F share classes, F-1 and F-2), five 529 college savings plan share classes (Classes 529-A, 529-B, 529-C, 529-E and 529-F-1) and seven retirement plan share classes (Classes R-1, R-2, R-2E, R-3, R-4, R-5 and R-6). The 529 college savings plan share classes can be used to save for college education. The retirement plan share classes are generally offered only through eligible employer-sponsored retirement plans. The fund’s share classes are described further in the following table:
| Share class | Initial sales charge | Contingent deferred sales charge upon redemption | Conversion feature | ||||
| Classes A and 529-A | Up to 5.75% | None (except 1% for certain redemptions within one year of purchase without an initial sales charge) | None | ||||
| Classes B and 529-B* | None | Declines from 5% to 0% for redemptions within six years of purchase | Classes B and 529-B convert to Classes A and 529-A, respectively, after eight years | ||||
| Class C | None | 1% for redemptions within one year of purchase | Class C converts to Class F-1 after 10 years | ||||
| Class 529-C | None | 1% for redemptions within one year of purchase | None | ||||
| Class 529-E | None | None | None | ||||
| Classes F-1, F-2 and 529-F-1 | None | None | None | ||||
| Classes R-1, R-2, R-2E, R-3, R-4, R-5 and R-6 | None | None | None |
*Class B and 529-B shares of the fund are not available for purchase.
On August 29, 2014, the fund made an additional retirement plan share class (Class R-2E) available for sale pursuant to an amendment to its registration statement filed with the U.S. Securities and Exchange Commission. Refer to the fund’s prospectus for more details.
Holders of all share classes have equal pro rata rights to the assets, dividends and liquidation proceeds of the fund. Each share class has identical voting rights, except for the exclusive right to vote on matters affecting only its class. Share classes have different fees and expenses (“class-specific fees and expenses”), primarily due to different arrangements for distribution, transfer agent and administrative services. Differences in class-specific fees and expenses will result in differences in net investment income and, therefore, the payment of different per-share dividends by each share class.
2. Significant accounting policies
The fund is an investment company that applies the accounting and reporting guidance issued in Topic 946 by the U.S. Financial Accounting Standards Board. The fund’s financial statements have been prepared to comply with U.S. generally accepted accounting principles (“U.S. GAAP“). These principles require the fund’s investment adviser to make estimates and assumptions that affect reported amounts and disclosures. Actual results could differ from those estimates. The fund follows the significant accounting policies described in this section, as well as the valuation policies described in the next section on valuation.
Security transactions and related investment income — Security transactions are recorded by the fund as of the date the trades are executed with brokers. Realized gains and losses from security transactions are determined based on the specific identified cost of the securities. In the event a security is purchased with a delayed payment date, the fund will segregate liquid assets sufficient to meet its payment obligations. Dividend income is recognized on the ex-dividend date and interest income is recognized on an accrual basis. Market discounts, premiums and original issue discounts on fixed-income securities are amortized daily over the expected life of the security.
| The Investment Company of America | 19 |
Class allocations — Income, fees and expenses (other than class-specific fees and expenses) and realized and unrealized gains and losses are allocated daily among the various share classes based on their relative net assets. Class-specific fees and expenses, such as distribution, transfer agent and administrative services, are charged directly to the respective share class.
Dividends and distributions to shareholders — Dividends and distributions to shareholders are recorded on the ex-dividend date.
Currency translation — Assets and liabilities, including investment securities, denominated in currencies other than U.S. dollars are translated into U.S. dollars at the exchange rates supplied by one or more pricing vendors on the valuation date. Purchases and sales of investment securities and income and expenses are translated into U.S. dollars at the exchange rates on the dates of such transactions. The effects of changes in exchange rates on investment securities are included with the net realized gain or loss and net unrealized appreciation or depreciation on investments in the fund’s statement of operations. The realized gain or loss and unrealized appreciation or depreciation resulting from all other transactions denominated in currencies other than U.S. dollars are disclosed separately.
3. Valuation
Capital Research and Management Company (“CRMC”), the fund’s investment adviser, values the fund’s investments at fair value as defined by U.S. GAAP. The net asset value of each share class of the fund is generally determined as of approximately 4:00 p.m. New York time each day the New York Stock Exchange is open.
Methods and inputs — The fund’s investment adviser uses the following methods and inputs to establish the fair value of the fund’s assets and liabilities. Use of particular methods and inputs may vary over time based on availability and relevance as market and economic conditions evolve.
Equity securities are generally valued at the official closing price of, or the last reported sale price on, the exchange or market on which such securities are traded, as of the close of business on the day the securities are being valued or, lacking any sales, at the last available bid price. Prices for each security are taken from the principal exchange or market on which the security trades.
Fixed-income securities, including short-term securities, are generally valued at prices obtained from one or more pricing vendors. Vendors value such securities based on one or more of the inputs described in the following table. The table provides examples of inputs that are commonly relevant for valuing particular classes of fixed-income securities in which the fund is authorized to invest. However, these classifications are not exclusive, and any of the inputs may be used to value any other class of fixed-income security.
| Fixed-income class | Examples of standard inputs |
| All | Benchmark yields, transactions, bids, offers, quotations from dealers and trading systems, new issues, spreads and other relationships observed in the markets among comparable securities; and proprietary pricing models such as yield measures calculated using factors such as cash flows, financial or collateral performance and other reference data (collectively referred to as “standard inputs”) |
| Corporate bonds & notes; convertible securities | Standard inputs and underlying equity of the issuer |
| Bonds & notes of governments & government agencies | Standard inputs and interest rate volatilities |
| Mortgage-backed; asset-backed obligations | Standard inputs and cash flows, prepayment information, default rates, delinquency and loss assumptions, collateral characteristics, credit enhancements and specific deal information |
When the fund’s investment adviser deems it appropriate to do so (such as when vendor prices are unavailable or not deemed to be representative), fixed-income securities will be valued in good faith at the mean quoted bid and ask prices that are reasonably and timely available (or bid prices, if ask prices are not available) or at prices for securities of comparable maturity, quality and type.
Securities with both fixed-income and equity characteristics, or equity securities traded principally among fixed-income dealers, are generally valued in the manner described for either equity or fixed-income securities, depending on which method is deemed most appropriate by the fund’s investment adviser. Forward currency contracts are valued at the mean of representative quoted bid and ask prices, generally based on prices supplied by one or more pricing vendors.
Securities and other assets for which representative market quotations are not readily available or are considered unreliable by the fund’s investment adviser are fair valued as determined in good faith under fair valuation guidelines adopted by authority of the fund’s board of trustees as further described. The investment adviser follows fair valuation guidelines, consistent with U.S. Securities and Exchange
| 20 | The Investment Company of America |
Commission rules and guidance, to consider relevant principles and factors when making fair value determinations. The investment adviser considers relevant indications of value that are reasonably and timely available to it in determining the fair value to be assigned to a particular security, such as the type and cost of the security; contractual or legal restrictions on resale of the security; relevant financial or business developments of the issuer; actively traded similar or related securities; conversion or exchange rights on the security; related corporate actions; significant events occurring after the close of trading in the security; and changes in overall market conditions. In addition, the closing prices of equity securities that trade in markets outside U.S. time zones may be adjusted to reflect significant events that occur after the close of local trading but before the net asset value of each share class of the fund is determined. Fair valuations and valuations of investments that are not actively trading involve judgment and may differ materially from valuations that would have been used had greater market activity occurred.
Processes and structure — The fund’s board of trustees has delegated authority to the fund’s investment adviser to make fair value determinations, subject to board oversight. The investment adviser has established a Joint Fair Valuation Committee (the “Fair Valuation Committee”) to administer, implement and oversee the fair valuation process, and to make fair value decisions. The Fair Valuation Committee regularly reviews its own fair value decisions, as well as decisions made under its standing instructions to the investment adviser’s valuation teams. The Fair Valuation Committee reviews changes in fair value measurements from period to period and may, as deemed appropriate, update the fair valuation guidelines to better reflect the results of back testing and address new or evolving issues. The Fair Valuation Committee reports any changes to the fair valuation guidelines to the board of trustees with supplemental information to support the changes. The fund’s board and audit committee also regularly review reports that describe fair value determinations and methods.
The fund’s investment adviser has also established a Fixed-Income Pricing Review Group to administer and oversee the fixed-income valuation process, including the use of fixed-income pricing vendors. This group regularly reviews pricing vendor information and market data. Pricing decisions, processes and controls over security valuation are also subject to additional internal reviews, including an annual control self-evaluation program facilitated by the investment adviser’s compliance group.
Classifications — The fund’s investment adviser classifies the fund’s assets and liabilities into three levels based on the inputs used to value the assets or liabilities. Level 1 values are based on quoted prices in active markets for identical securities. Level 2 values are based on significant observable market inputs, such as quoted prices for similar securities and quoted prices in inactive markets. Certain securities trading outside the U.S. may transfer between Level 1 and Level 2 due to valuation adjustments resulting from significant market movements following the close of local trading. Level 3 values are based on significant unobservable inputs that reflect the investment adviser’s determination of assumptions that market participants might reasonably use in valuing the securities. The valuation levels are not necessarily an indication of the risk or liquidity associated with the underlying investment. For example, U.S. government securities are reflected as Level 2 because the inputs used to determine fair value may not always be quoted prices in an active market. The following tables present the fund’s valuation levels as of December 31, 2014 (dollars in thousands):
| Investment securities | ||||||||||||||||
| Level 1 | Level 2* | Level 3 | Total | |||||||||||||
| Assets: | ||||||||||||||||
| Common stocks: | ||||||||||||||||
| Energy | $ | 4,933,377 | $ | 1,387,403 | $ | — | $ | 6,320,780 | ||||||||
| Materials | 2,049,868 | 355,542 | — | 2,405,410 | ||||||||||||
| Industrials | 7,680,594 | 66,704 | — | 7,747,298 | ||||||||||||
| Consumer discretionary | 7,404,882 | 338,888 | — | 7,743,770 | ||||||||||||
| Consumer staples | 7,249,219 | 202,985 | — | 7,452,204 | ||||||||||||
| Health care | 11,838,786 | 971,249 | — | 12,810,035 | ||||||||||||
| Financials | 2,269,905 | 1,101,855 | — | 3,371,760 | ||||||||||||
| Information technology | 11,908,880 | 932,294 | — | 12,841,174 | ||||||||||||
| Telecommunication services | 3,336,385 | 435,630 | — | 3,772,015 | ||||||||||||
| Utilities | 2,808,609 | — | — | 2,808,609 | ||||||||||||
| Miscellaneous | 1,890,166 | 567,328 | — | 2,457,494 | ||||||||||||
| Bonds, notes & other debt instruments | — | 45,348 | — | 45,348 | ||||||||||||
| Short-term securities | — | 5,434,624 | — | 5,434,624 | ||||||||||||
| Total | $ | 63,370,671 | $ | 11,839,850 | $ | — | $ | 75,210,521 | ||||||||
| * | Securities with a value of $5,137,809,000, which represented 6.81% of the net assets of the fund, transferred from Level 1 to Level 2 since the prior fiscal year-end, primarily due to significant market movements following the close of local trading. |
| The Investment Company of America | 21 |
4. Risk factors
Investing in the fund may involve certain risks including, but not limited to, those described below.
Market conditions — The prices of, and the income generated by, the common stocks and other securities held by the fund may decline — sometimes rapidly or unpredictably — due to various factors, including events or conditions affecting the general economy or particular industries; overall market changes; local, regional or global political, social or economic instability; governmental or governmental agency responses to economic conditions; and currency exchange, interest rate and commodity price fluctuations.
Issuer risks — The prices of, and the income generated by, securities held by the fund may decline in response to various factors directly related to the issuers of such securities, including reduced demand for an issuer’s goods or services, poor management performance and strategic initiatives such as mergers, acquisitions or dispositions and the market response to any such initiatives.
Investing in income-oriented stocks — Income provided by the fund may be reduced by changes in the dividend policies of, and the capital resources available for dividend payments at, the companies in which the fund invests.
Investing in growth-oriented stocks — Growth-oriented common stocks and other equity-type securities (such as preferred stocks, convertible preferred stocks and convertible bonds) may involve larger price swings and greater potential for loss than other types of investments.
Investing outside the U.S. — Securities of issuers domiciled outside the U.S., or with significant operations or revenues outside the U.S., may lose value because of adverse political, social, economic or market developments (including social instability, regional conflicts, terrorism and war) in the countries or regions in which the issuers operate or generate revenue. These securities may also lose value due to changes in foreign currency exchange rates against the U.S. dollar and/or currencies of other countries. Issuers of these securities may be more susceptible to actions of foreign governments such as the imposition of price controls or punitive taxes, that could adversely impact revenues. Securities markets in certain countries may be more volatile and/or less liquid than those in the U.S. Investments outside the U.S. may also be subject to different accounting practices and different regulatory, legal and reporting standards and practices, and may be more difficult to value, than those in the U.S. In addition, the value of investments outside the U.S. may be reduced by foreign taxes, including foreign withholding taxes on interest and dividends. Further, there may be increased risks of delayed settlement of securities purchased or sold by the fund. The risks of investing outside the U.S. may be heightened in connection with investments in emerging markets.
Management — The investment adviser to the fund actively manages the fund’s investments. Consequently, the fund is subject to the risk that the methods and analyses employed by the investment adviser in this process may not produce the desired results. This could cause the fund to lose value or its investment results to lag relevant benchmarks or other funds with similar objectives.
5. Certain investment techniques
Forward currency contracts — The fund has entered into forward currency contracts, which represent agreements to exchange currencies on specific future dates at predetermined rates. The fund’s investment adviser uses forward currency contracts to manage the fund’s exposure to changes in exchange rates. Upon entering into these contracts, risks may arise from the potential inability of counterparties to meet the terms of their contracts and from possible movements in exchange rates.
On a daily basis, the fund’s investment adviser values forward currency contracts and records unrealized appreciation or depreciation for open forward currency contracts in the fund’s statement of assets and liabilities. Realized gains or losses are recorded at the time the forward currency contract is closed or offset by another contract with the same broker for the same settlement date and currency.
Closed forward currency contracts that have not reached their settlement date are included in the respective receivables or payables for closed forward currency contracts in the fund’s statement of assets and liabilities. Net realized gains or losses from closed forward currency contracts and net unrealized appreciation or depreciation from open forward currency contracts are recorded in the fund’s statement of operations. As of December 31, 2014, the fund did not have any open forward currency contracts.
| 22 | The Investment Company of America |
The following table presents the financial statement impacts resulting from the fund’s use of forward currency contracts as of December 31, 2014 (dollars in thousands):
| Contract | Location on statement of operations | Value | Location on statement of operations | Value | ||||||||
| Forward currency | Net realized loss on forward currency contracts | $(66 | ) | Net unrealized appreciation on forward currency contracts | $ | 1,204 | ||||||
Collateral — The fund participates in a collateral program due to its use of forward currency contracts. The program calls for the fund to either receive or pledge collateral based on the net gain or loss on unsettled forward currency contracts by counterparty. The purpose of the collateral is to cover potential losses that could occur in the event that either party cannot meet its contractual obligations.
6. Taxation and distributions
Federal income taxation — The fund complies with the requirements under Subchapter M of the Internal Revenue Code applicable to mutual funds and intends to distribute substantially all of its net taxable income and net capital gains each year. The fund is not subject to income taxes to the extent such distributions are made. Therefore, no federal income tax provision is required.
As of and during the period ended December 31, 2014, the fund did not have a liability for any unrecognized tax benefits. The fund recognizes interest and penalties, if any, related to unrecognized tax benefits as income tax expense in the statement of operations. During the period, the fund did not incur any interest or penalties.
The fund is not subject to examination by U.S. federal tax authorities for tax years before 2011 and by state tax authorities for tax years before 2010.
Non-U.S. taxation — Dividend and interest income are recorded net of non-U.S. taxes paid.
Distributions — Distributions paid to shareholders are based on net investment income and net realized gains determined on a tax basis, which may differ from net investment income and net realized gains for financial reporting purposes. These differences are due primarily to different treatment for items such as currency gains and losses; short-term capital gains and losses; and unrealized appreciation of certain investments in securities outside the U.S. The fiscal year in which amounts are distributed may differ from the year in which the net investment income and net realized gains are recorded by the fund for financial reporting purposes. The fund may also designate a portion of the amount paid to redeeming shareholders as a distribution for tax purposes.
During the year ended December 31, 2014, the fund reclassified $2,416,000 and $86,000 from undistributed net investment income to undistributed net realized gain and capital paid in on shares of beneficial interest, respectively, and $453,936,000 from undistributed net realized gain to capital paid in on shares of beneficial interest to align financial reporting with tax reporting.
As of December 31, 2014, the tax-basis components of distributable earnings, unrealized appreciation (depreciation) and cost of investment securities were as follows (dollars in thousands):
| Undistributed ordinary income | $ | 307,116 | ||
| Undistributed long-term capital gains | 532,130 | |||
| Gross unrealized appreciation on investment securities | 26,502,778 | |||
| Gross unrealized depreciation on investment securities | (982,253 | ) | ||
| Net unrealized appreciation on investment securities | 25,520,525 | |||
| Cost of investment securities | 49,689,996 |
| The Investment Company of America | 23 |
The tax character of distributions paid to shareholders was as follows (dollars in thousands):
| Year ended December 31, 2014 | Year ended December 31, 2013 | |||||||||||||||||||||||
| Share class | Ordinary income | Long-term capital gains | Total distributions paid | Ordinary income | Long-term capital gains | Total distributions paid | ||||||||||||||||||
| Class A | $ | 1,058,744 | $ | 4,835,143 | $ | 5,893,887 | $ | 898,154 | $ | 3,524,457 | $ | 4,422,611 | ||||||||||||
| Class B | 3,566 | 25,504 | 29,070 | 4,674 | 29,574 | 34,248 | ||||||||||||||||||
| Class C | 18,486 | 147,247 | 165,733 | 16,802 | 115,255 | 132,057 | ||||||||||||||||||
| Class F-1 | 43,711 | 208,522 | 252,233 | 35,803 | 151,778 | 187,581 | ||||||||||||||||||
| Class F-2 | 31,823 | 148,398 | 180,221 | 19,215 | 72,114 | 91,329 | ||||||||||||||||||
| Class 529-A | 37,776 | 183,803 | 221,579 | 30,756 | 129,369 | 160,125 | ||||||||||||||||||
| Class 529-B | 482 | 3,990 | 4,472 | 618 | 4,483 | 5,101 | ||||||||||||||||||
| Class 529-C | 4,892 | 41,998 | 46,890 | 3,957 | 30,156 | 34,113 | ||||||||||||||||||
| Class 529-E | 1,213 | 6,800 | 8,013 | 1,021 | 4,966 | 5,987 | ||||||||||||||||||
| Class 529-F-1 | 1,099 | 4,941 | 6,040 | 845 | 3,209 | 4,054 | ||||||||||||||||||
| Class R-1 | 968 | 7,735 | 8,703 | 804 | 5,559 | 6,363 | ||||||||||||||||||
| Class R-2 | 7,656 | 59,808 | 67,464 | 6,739 | 44,862 | 51,601 | ||||||||||||||||||
| Class R-2E* | — | † | 2 | 2 | ||||||||||||||||||||
| Class R-3 | 13,698 | 77,606 | 91,304 | 12,066 | 58,476 | 70,542 | ||||||||||||||||||
| Class R-4 | 17,366 | 82,279 | 99,645 | 14,438 | 58,105 | 72,543 | ||||||||||||||||||
| Class R-5 | 16,450 | 67,108 | 83,558 | 15,941 | 54,504 | 70,445 | ||||||||||||||||||
| Class R-6 | 79,036 | 330,580 | 409,616 | 58,266 | 191,565 | 249,831 | ||||||||||||||||||
| Total | $ | 1,336,966 | $ | 6,231,464 | $ | 7,568,430 | $ | 1,120,099 | $ | 4,478,432 | $ | 5,598,531 | ||||||||||||
| * | Class R-2E shares were offered beginning August 29, 2014. |
| † | Amount less than one thousand. |
7. Fees and transactions with related parties
CRMC, the fund’s investment adviser, is the parent company of American Funds Distributors,® Inc. (“AFD”), the principal underwriter of the fund’s shares, and American Funds Service Company® (“AFS”), the fund’s transfer agent. CRMC, AFD and AFS are considered related parties to the fund.
Investment advisory services — The fund has an investment advisory and service agreement with CRMC that provides for monthly fees accrued daily. These fees are based on a series of decreasing annual rates beginning with 0.390% on the first $1 billion of daily net assets and decreasing to 0.219% on such assets in excess of $89 billion. For the year ended December 31, 2014, the investment advisory services fee was $173,526,000, which was equivalent to an annualized rate of 0.238% of average daily net assets.
Class-specific fees and expenses — Expenses that are specific to individual share classes are accrued directly to the respective share class. The principal class-specific fees and expenses are further described below:
Distribution services — The fund has plans of distribution for all share classes, except Class F-2, R-5 and R-6 shares. Under the plans, the board of directors approves certain categories of expenses that are used to finance activities primarily intended to sell fund shares and service existing accounts. The plans provide for payments, based on an annualized percentage of average daily net assets, ranging from 0.25% to 1.00% as noted in this section. In some cases, the board of directors has limited the amounts that may be paid to less than the maximum allowed by the plans. All share classes with a plan may use up to 0.25% of average daily net assets to pay service fees, or to compensate AFD for paying service fees, to firms that have entered into agreements with AFD to provide certain shareholder services. The remaining amounts available to be paid under each plan are paid to dealers to compensate them for their sales activities.
| 24 | The Investment Company of America |
For Class A and 529-A shares, distribution-related expenses include the reimbursement of dealer and wholesaler commissions paid by AFD for certain shares sold without a sales charge. These share classes reimburse AFD for amounts billed within the prior 15 months but only to the extent that the overall annual expense limit of 0.25% is not exceeded. As of December 31, 2014, there were no unreimbursed expenses subject to reimbursement for Class A or 529-A shares.
| Share class | Currently approved limits | Plan limits | ||||||||
| Class A | 0.25 | % | 0.25 | % | ||||||
| Class 529-A | 0.25 | 0.50 | ||||||||
| Classes B and 529-B | 1.00 | 1.00 | ||||||||
| Classes C, 529-C and R-1 | 1.00 | 1.00 | ||||||||
| Class R-2 | 0.75 | 1.00 | ||||||||
| Class R-2E | 0.60 | 0.85 | ||||||||
| Classes 529-E and R-3 | 0.50 | 0.75 | ||||||||
| Classes F-1, 529-F-1 and R-4 | 0.25 | 0.50 | ||||||||
Transfer agent services — The fund has a shareholder services agreement with AFS under which the fund compensates AFS for providing transfer agent services to each of the fund’s share classes. These services include recordkeeping, shareholder communications and transaction processing. In addition, the fund reimburses AFS for amounts paid to third parties for performing transfer agent services on behalf of fund shareholders.
Administrative services — The fund has an administrative services agreement with CRMC under which the fund compensates CRMC for providing administrative services to Class A, C, F, 529 and R shares. These services include, but are not limited to, coordinating, monitoring, assisting and overseeing third parties that provide services to fund shareholders. Under the agreement, Class A shares pay an annual fee of 0.01% and Class C, F, 529 and R shares pay an annual fee of 0.05% of their respective average daily net assets.
529 plan services — Each 529 share class is subject to service fees to compensate the Virginia College Savings Plan (“Virginia529”) for its oversight and administration of the 529 college savings plan. During the period January 1, 2014, to March 31, 2014, the quarterly fee was based on a series of decreasing annual rates beginning with 0.10% on the first $30 billion of the net assets invested in Class 529 shares of the American Funds and decreasing to 0.06% on such assets between $120 billion and $150 billion. Effective April 1, 2014, the quarterly fee was amended to provide for reduced annual rates of 0.07%, 0.06% and 0.05% over $30 billion, $50 billion and $70 billion, respectively, of the net assets invested in Class 529 shares of the American Funds. The fee for any given calendar quarter is accrued and calculated on the basis of the average net assets of Class 529 shares of the American Funds for the last month of the prior calendar quarter. The fee is included in other expenses in the fund’s statement of operations. Virginia529 is not considered a related party to the fund.
For the year ended December 31, 2014, class-specific expenses under the agreements were as follows (dollars in thousands):
| Share class | Distribution services | Transfer agent services | Administrative services | 529 plan services | |||||||||||
| Class A | $132,135 | $54,680 | $5,688 | Not applicable | |||||||||||
| Class B | 3,738 | 378 | Not applicable | Not applicable | |||||||||||
| Class C | 17,494 | 1,680 | 879 | Not applicable | |||||||||||
| Class F-1 | 6,153 | 3,068 | 1,232 | Not applicable | |||||||||||
| Class F-2 | Not applicable | 1,375 | 717 | Not applicable | |||||||||||
| Class 529-A | 4,810 | 1,637 | 1,068 | $1,947 | |||||||||||
| Class 529-B | 578 | 53 | 29 | 53 | |||||||||||
| Class 529-C | 4,854 | 402 | 245 | 446 | |||||||||||
| Class 529-E | 398 | 38 | 40 | 73 | |||||||||||
| Class 529-F-1 | — | 41 | 27 | 49 | |||||||||||
| Class R-1 | 900 | 91 | 45 | Not applicable | |||||||||||
| Class R-2 | 5,262 | 2,312 | 353 | Not applicable | |||||||||||
| Class R-2E* | — | † | — | † | — | † | Not applicable | ||||||||
| Class R-3 | 4,585 | 1,500 | 460 | Not applicable | |||||||||||
| Class R-4 | 2,386 | 958 | 478 | Not applicable | |||||||||||
| Class R-5 | Not applicable | 400 | 394 | Not applicable | |||||||||||
| Class R-6 | Not applicable | 7 | 1,787 | Not applicable | |||||||||||
| Total class-specific expenses | $183,293 | $68,620 | $13,442 | $2,568 | |||||||||||
| * | Class R-2E shares were offered beginning August 29, 2014. |
| † | Amount less than one thousand. |
| The Investment Company of America | 25 |
Trustees’ deferred compensation — Trustees who are unaffiliated with CRMC may elect to defer the cash payment of part or all of their compensation. These deferred amounts, which remain as liabilities of the fund, are treated as if invested in shares of the fund or other American Funds. These amounts represent general, unsecured liabilities of the fund and vary according to the total returns of the selected funds. Trustees’ compensation of $1,016,000 in the fund’s statement of operations includes $368,000 in current fees (either paid in cash or deferred) and a net increase of $648,000 in the value of the deferred amounts.
Affiliated officers and trustees — Officers and certain trustees of the fund are or may be considered to be affiliated with CRMC, AFD and AFS. No affiliated officers or trustees received any compensation directly from the fund.
8. Warrants
As of December 31, 2014, the fund had warrants outstanding which may be exercised at any time for the purchase of 818,231 Class A shares at approximately $5.24 per share. If these warrants had been exercised as of December 31, 2014, the net asset value of each share class would have been reduced by less than $0.02 per share. No warrants were exercised during the year ended December 31, 2014, or the prior fiscal year ended December 31, 2013.
9. Capital share transactions
Capital share transactions in the fund were as follows (dollars and shares in thousands):
| Sales1 | Reinvestments of dividends and distributions | Repurchases1 | Net increase (decrease) | |||||||||||||||||||||||||||||
| Share class | Amount | Shares | Amount | Shares | Amount | Shares | Amount | Shares | ||||||||||||||||||||||||
| Year ended December 31, 2014 | ||||||||||||||||||||||||||||||||
| Class A | $ | 3,263,761 | 84,516 | $ | 5,720,607 | 152,396 | $ | (6,185,028 | ) | (160,753 | ) | $ | 2,799,340 | 76,159 | ||||||||||||||||||
| Class B | 5,051 | 131 | 28,895 | 773 | (197,048 | ) | (5,174 | ) | (163,102 | ) | (4,270 | ) | ||||||||||||||||||||
| Class C | 287,635 | 7,503 | 163,114 | 4,388 | (486,900 | ) | (12,816 | ) | (36,151 | ) | (925 | ) | ||||||||||||||||||||
| Class F-1 | 619,565 | 16,154 | 247,499 | 6,608 | (747,253 | ) | (19,313 | ) | 119,811 | 3,449 | ||||||||||||||||||||||
| Class F-2 | 771,196 | 19,780 | 143,257 | 3,816 | (240,922 | ) | (6,232 | ) | 673,531 | 17,364 | ||||||||||||||||||||||
| Class 529-A | 201,751 | 5,250 | 221,486 | 5,913 | (240,042 | ) | (6,221 | ) | 183,195 | 4,942 | ||||||||||||||||||||||
| Class 529-B | 1,075 | 28 | 4,472 | 119 | (28,794 | ) | (753 | ) | (23,247 | ) | (606 | ) | ||||||||||||||||||||
| Class 529-C | 48,579 | 1,264 | 46,873 | 1,257 | (62,850 | ) | (1,636 | ) | 32,602 | 885 | ||||||||||||||||||||||
| Class 529-E | 7,048 | 183 | 8,010 | 215 | (10,696 | ) | (278 | ) | 4,362 | 120 | ||||||||||||||||||||||
| Class 529-F-1 | 13,709 | 352 | 6,038 | 161 | (9,096 | ) | (236 | ) | 10,651 | 277 | ||||||||||||||||||||||
| Class R-1 | 16,242 | 422 | 8,691 | 233 | (18,965 | ) | (492 | ) | 5,968 | 163 | ||||||||||||||||||||||
| Class R-2 | 135,815 | 3,544 | 67,402 | 1,808 | (187,138 | ) | (4,894 | ) | 16,079 | 458 | ||||||||||||||||||||||
| Class R-2E2 | 26 | 1 | 1 | — | 3 | — | — | 27 | 1 | |||||||||||||||||||||||
| Class R-3 | 184,997 | 4,812 | 91,232 | 2,439 | (261,582 | ) | (6,844 | ) | 14,647 | 407 | ||||||||||||||||||||||
| Class R-4 | 210,201 | 5,462 | 99,605 | 2,660 | (231,203 | ) | (5,980 | ) | 78,603 | 2,142 | ||||||||||||||||||||||
| Class R-5 | 155,679 | 3,975 | 83,478 | 2,224 | (280,612 | ) | (7,349 | ) | (41,455 | ) | (1,150 | ) | ||||||||||||||||||||
| Class R-6 | 1,106,012 | 28,925 | 409,615 | 10,909 | (367,164 | ) | (9,521 | ) | 1,148,463 | 30,313 | ||||||||||||||||||||||
| Total net increase (decrease) | $ | 7,028,342 | 182,302 | $ | 7,350,275 | 195,919 | $ | (9,555,293 | ) | (248,492 | ) | $ | 4,823,324 | 129,729 | ||||||||||||||||||
| 26 | The Investment Company of America |
| Sales1 | Reinvestments of dividends and distributions | Repurchases1 | Net increase (decrease) | |||||||||||||||||||||||||||||
| Share class | Amount | Shares | Amount | Shares | Amount | Shares | Amount | Shares | ||||||||||||||||||||||||
| Year ended December 31, 2013 | ||||||||||||||||||||||||||||||||
| Class A | $ | 2,576,535 | 74,668 | $ | 4,285,280 | 119,187 | $ | (5,856,875 | ) | (169,755 | ) | $ | 1,004,940 | 24,100 | ||||||||||||||||||
| Class B | 6,700 | 193 | 33,990 | 946 | (234,543 | ) | (6,895 | ) | (193,853 | ) | (5,756 | ) | ||||||||||||||||||||
| Class C | 205,242 | 5,976 | 129,425 | 3,614 | (499,996 | ) | (14,511 | ) | (165,329 | ) | (4,921 | ) | ||||||||||||||||||||
| Class F-1 | 564,466 | 16,284 | 184,356 | 5,132 | (608,802 | ) | (17,997 | ) | 140,020 | 3,419 | ||||||||||||||||||||||
| Class F-2 | 294,908 | 8,484 | 84,767 | 2,358 | (216,272 | ) | (6,208 | ) | 163,403 | 4,634 | ||||||||||||||||||||||
| Class 529-A | 178,365 | 5,185 | 160,077 | 4,458 | (209,953 | ) | (6,082 | ) | 128,489 | 3,561 | ||||||||||||||||||||||
| Class 529-B | 1,172 | 34 | 5,099 | 142 | (33,085 | ) | (965 | ) | (26,814 | ) | (789 | ) | ||||||||||||||||||||
| Class 529-C | 43,786 | 1,273 | 34,101 | 949 | (59,218 | ) | (1,722 | ) | 18,669 | 500 | ||||||||||||||||||||||
| Class 529-E | 6,673 | 194 | 5,987 | 167 | (9,979 | ) | (288 | ) | 2,681 | 73 | ||||||||||||||||||||||
| Class 529-F-1 | 9,313 | 268 | 4,054 | 113 | (7,600 | ) | (217 | ) | 5,767 | 164 | ||||||||||||||||||||||
| Class R-1 | 14,722 | 432 | 6,353 | 177 | (22,163 | ) | (649 | ) | (1,088 | ) | (40 | ) | ||||||||||||||||||||
| Class R-2 | 127,014 | 3,715 | 51,541 | 1,435 | (187,554 | ) | (5,489 | ) | (8,999 | ) | (339 | ) | ||||||||||||||||||||
| Class R-3 | 175,244 | 5,152 | 70,468 | 1,962 | (236,349 | ) | (6,906 | ) | 9,363 | 208 | ||||||||||||||||||||||
| Class R-4 | 160,254 | 4,684 | 72,506 | 2,020 | (184,341 | ) | (5,296 | ) | 48,419 | 1,408 | ||||||||||||||||||||||
| Class R-5 | 116,731 | 3,365 | 70,368 | 1,960 | (176,710 | ) | (5,153 | ) | 10,389 | 172 | ||||||||||||||||||||||
| Class R-6 | 703,791 | 20,489 | 249,831 | 6,968 | (1,482,264 | ) | (4,489 | ) | (528,642 | ) | (17,433 | ) | ||||||||||||||||||||
| Total net increase (decrease) | $ | 5,184,916 | 150,396 | $ | 5,448,203 | 151,588 | $ | (10,025,704 | ) | (293,023 | ) | $ | 607,415 | 8,961 | ||||||||||||||||||
| 1 | Includes exchanges between share classes of the fund. |
| 2 | Class R-2E shares were offered beginning August 29, 2014. |
| 3 | Amount less than one thousand. |
10. Investment transactions
The fund made purchases and sales of investment securities, excluding short-term securities and U.S. government obligations, if any, of $19,961,422,000 and $23,785,323,000, respectively, during the year ended December 31, 2014.
| The Investment Company of America | 27 |
Financial highlights
| Income (loss) from | ||||||||||||||||||||||||||||||||||||||||||||||||
| investment operations1 | Dividends and distributions | |||||||||||||||||||||||||||||||||||||||||||||||
| Net gains | ||||||||||||||||||||||||||||||||||||||||||||||||
| (losses) on | Ratio of | |||||||||||||||||||||||||||||||||||||||||||||||
| Net asset | Net | securities | Dividends | Total | Net asset | Ratio of | net income | |||||||||||||||||||||||||||||||||||||||||
| value, | investment | (both | Total from | (from net | Distributions | dividends | value, | Net assets, | expenses to | (loss) to | ||||||||||||||||||||||||||||||||||||||
| beginning | income | realized and | investment | investment | (from capital | and | end | Total | end of period | average | average | |||||||||||||||||||||||||||||||||||||
| of period | (loss)2 | unrealized) | operations | income) | gains) | distributions | of period | return3,4 | (in millions) | net assets | net assets2 | |||||||||||||||||||||||||||||||||||||
| Class A: | ||||||||||||||||||||||||||||||||||||||||||||||||
| Year ended 12/31/2014 | $ | 36.70 | $ | .85 | $ | 3.60 | $ | 4.45 | $ | (.73 | ) | $ | (3.34 | ) | $ | (4.07 | ) | $ | 37.08 | 12.09 | % | $ | 58,430 | .59 | % | 2.21 | % | |||||||||||||||||||||
| Year ended 12/31/2013 | 30.16 | .61 | 9.07 | 9.68 | (.63 | ) | (2.51 | ) | (3.14 | ) | 36.70 | 32.42 | 55,032 | .61 | 1.76 | |||||||||||||||||||||||||||||||||
| Year ended 12/31/2012 | 27.09 | .60 | 3.61 | 4.21 | (.72 | ) | (.42 | ) | (1.14 | ) | 30.16 | 15.60 | 44,501 | .62 | 2.02 | |||||||||||||||||||||||||||||||||
| Year ended 12/31/2011 | 28.16 | .57 | (1.06 | ) | (.49 | ) | (.58 | ) | — | (.58 | ) | 27.09 | (1.76 | ) | 42,643 | .61 | 2.05 | |||||||||||||||||||||||||||||||
| Year ended 12/31/2010 | 25.95 | .55 | 2.22 | 2.77 | (.56 | ) | — | (.56 | ) | 28.16 | 10.86 | 48,789 | .61 | 2.12 | ||||||||||||||||||||||||||||||||||
| Class B: | ||||||||||||||||||||||||||||||||||||||||||||||||
| Year ended 12/31/2014 | 36.58 | .58 | 3.56 | 4.14 | (.41 | ) | (3.34 | ) | (3.75 | ) | 36.97 | 11.26 | 308 | 1.34 | 1.52 | |||||||||||||||||||||||||||||||||
| Year ended 12/31/2013 | 30.06 | .34 | 9.04 | 9.38 | (.35 | ) | (2.51 | ) | (2.86 | ) | 36.58 | 31.42 | 461 | 1.37 | 1.00 | |||||||||||||||||||||||||||||||||
| Year ended 12/31/2012 | 26.99 | .37 | 3.60 | 3.97 | (.48 | ) | (.42 | ) | (.90 | ) | 30.06 | 14.74 | 552 | 1.38 | 1.25 | |||||||||||||||||||||||||||||||||
| Year ended 12/31/2011 | 28.05 | .35 | (1.06 | ) | (.71 | ) | (.35 | ) | — | (.35 | ) | 26.99 | (2.53 | ) | 838 | 1.38 | 1.27 | |||||||||||||||||||||||||||||||
| Year ended 12/31/2010 | 25.84 | .35 | 2.21 | 2.56 | (.35 | ) | — | (.35 | ) | 28.05 | 10.03 | 1,431 | 1.38 | 1.36 | ||||||||||||||||||||||||||||||||||
| Class C: | ||||||||||||||||||||||||||||||||||||||||||||||||
| Year ended 12/31/2014 | 36.42 | .54 | 3.56 | 4.10 | (.41 | ) | (3.34 | ) | (3.75 | ) | 36.77 | 11.20 | 1,774 | 1.39 | 1.41 | |||||||||||||||||||||||||||||||||
| Year ended 12/31/2013 | 29.95 | .33 | 9.00 | 9.33 | (.35 | ) | (2.51 | ) | (2.86 | ) | 36.42 | 31.36 | 1,791 | 1.41 | .95 | |||||||||||||||||||||||||||||||||
| Year ended 12/31/2012 | 26.90 | .36 | 3.59 | 3.95 | (.48 | ) | (.42 | ) | (.90 | ) | 29.95 | 14.70 | 1,620 | 1.43 | 1.21 | |||||||||||||||||||||||||||||||||
| Year ended 12/31/2011 | 27.97 | .34 | (1.06 | ) | (.72 | ) | (.35 | ) | — | (.35 | ) | 26.90 | (2.58 | ) | 1,767 | 1.42 | 1.24 | |||||||||||||||||||||||||||||||
| Year ended 12/31/2010 | 25.78 | .34 | 2.20 | 2.54 | (.35 | ) | — | (.35 | ) | 27.97 | 9.95 | 2,212 | 1.43 | 1.31 | ||||||||||||||||||||||||||||||||||
| Class F-1: | ||||||||||||||||||||||||||||||||||||||||||||||||
| Year ended 12/31/2014 | 36.63 | .82 | 3.59 | 4.41 | (.69 | ) | (3.34 | ) | (4.03 | ) | 37.01 | 12.02 | 2,518 | .67 | 2.13 | |||||||||||||||||||||||||||||||||
| Year ended 12/31/2013 | 30.11 | .58 | 9.06 | 9.64 | (.61 | ) | (2.51 | ) | (3.12 | ) | 36.63 | 32.32 | 2,366 | .68 | 1.68 | |||||||||||||||||||||||||||||||||
| Year ended 12/31/2012 | 27.04 | .58 | 3.62 | 4.20 | (.71 | ) | (.42 | ) | (1.13 | ) | 30.11 | 15.58 | 1,842 | .67 | 1.98 | |||||||||||||||||||||||||||||||||
| Year ended 12/31/2011 | 28.12 | .56 | (1.07 | ) | (.51 | ) | (.57 | ) | — | (.57 | ) | 27.04 | (1.84 | ) | 1,744 | .66 | 2.01 | |||||||||||||||||||||||||||||||
| Year ended 12/31/2010 | 25.92 | .54 | 2.21 | 2.75 | (.55 | ) | — | (.55 | ) | 28.12 | 10.78 | 1,558 | .66 | 2.07 | ||||||||||||||||||||||||||||||||||
| Class F-2: | ||||||||||||||||||||||||||||||||||||||||||||||||
| Year ended 12/31/2014 | 36.69 | .90 | 3.62 | 4.52 | (.80 | ) | (3.34 | ) | (4.14 | ) | 37.07 | 12.31 | 1,762 | .39 | 2.32 | |||||||||||||||||||||||||||||||||
| Year ended 12/31/2013 | 30.15 | .68 | 9.07 | 9.75 | (.70 | ) | (2.51 | ) | (3.21 | ) | 36.69 | 32.69 | 1,107 | .41 | 1.96 | |||||||||||||||||||||||||||||||||
| Year ended 12/31/2012 | 27.08 | .67 | 3.61 | 4.28 | (.79 | ) | (.42 | ) | (1.21 | ) | 30.15 | 15.86 | 770 | .40 | 2.25 | |||||||||||||||||||||||||||||||||
| Year ended 12/31/2011 | 28.15 | .63 | (1.06 | ) | (.43 | ) | (.64 | ) | — | (.64 | ) | 27.08 | (1.54 | ) | 604 | .40 | 2.27 | |||||||||||||||||||||||||||||||
| Year ended 12/31/2010 | 25.95 | .61 | 2.21 | 2.82 | (.62 | ) | — | (.62 | ) | 28.15 | 11.07 | 669 | .39 | 2.34 | ||||||||||||||||||||||||||||||||||
| Class 529-A: | ||||||||||||||||||||||||||||||||||||||||||||||||
| Year ended 12/31/2014 | 36.64 | .81 | 3.58 | 4.39 | (.68 | ) | (3.34 | ) | (4.02 | ) | 37.01 | 11.97 | 2,234 | .69 | 2.10 | |||||||||||||||||||||||||||||||||
| Year ended 12/31/2013 | 30.11 | .57 | 9.07 | 9.64 | (.60 | ) | (2.51 | ) | (3.11 | ) | 36.64 | 32.32 | 2,030 | .71 | 1.66 | |||||||||||||||||||||||||||||||||
| Year ended 12/31/2012 | 27.05 | .57 | 3.60 | 4.17 | (.69 | ) | (.42 | ) | (1.11 | ) | 30.11 | 15.47 | 1,562 | .72 | 1.93 | |||||||||||||||||||||||||||||||||
| Year ended 12/31/2011 | 28.12 | .55 | (1.06 | ) | (.51 | ) | (.56 | ) | — | (.56 | ) | 27.05 | (1.84 | ) | 1,362 | .70 | 1.97 | |||||||||||||||||||||||||||||||
| Year ended 12/31/2010 | 25.92 | .53 | 2.22 | 2.75 | (.55 | ) | — | (.55 | ) | 28.12 | 10.77 | 1,362 | .68 | 2.05 | ||||||||||||||||||||||||||||||||||
| Class 529-B: | ||||||||||||||||||||||||||||||||||||||||||||||||
| Year ended 12/31/2014 | 36.60 | .53 | 3.56 | 4.09 | (.36 | ) | (3.34 | ) | (3.70 | ) | 36.99 | 11.10 | 48 | 1.47 | 1.38 | |||||||||||||||||||||||||||||||||
| Year ended 12/31/2013 | 30.07 | .30 | 9.04 | 9.34 | (.30 | ) | (2.51 | ) | (2.81 | ) | 36.60 | 31.27 | 70 | 1.50 | .87 | |||||||||||||||||||||||||||||||||
| Year ended 12/31/2012 | 27.00 | .33 | 3.60 | 3.93 | (.44 | ) | (.42 | ) | (.86 | ) | 30.07 | 14.58 | 81 | 1.52 | 1.12 | |||||||||||||||||||||||||||||||||
| Year ended 12/31/2011 | 28.06 | .32 | (1.05 | ) | (.73 | ) | (.33 | ) | — | (.33 | ) | 27.00 | (2.63 | ) | 111 | 1.50 | 1.16 | |||||||||||||||||||||||||||||||
| Year ended 12/31/2010 | 25.86 | .33 | 2.20 | 2.53 | (.33 | ) | — | (.33 | ) | 28.06 | 9.87 | 165 | 1.48 | 1.26 | ||||||||||||||||||||||||||||||||||
| 28 | The Investment Company of America |
| Income (loss) from | ||||||||||||||||||||||||||||||||||||||||||||||||
| investment operations1 | Dividends and distributions | |||||||||||||||||||||||||||||||||||||||||||||||
| Net gains | ||||||||||||||||||||||||||||||||||||||||||||||||
| (losses) on | Ratio of | |||||||||||||||||||||||||||||||||||||||||||||||
| Net asset | Net | securities | Dividends | Total | Net asset | Ratio of | net income | |||||||||||||||||||||||||||||||||||||||||
| value, | investment | (both | Total from | (from net | Distributions | dividends | value, | Net assets, | expenses to | (loss) to | ||||||||||||||||||||||||||||||||||||||
| beginning | income | realized and | investment | investment | (from capital | and | end | Total | end of period | average | average | |||||||||||||||||||||||||||||||||||||
| of period | (loss)2 | unrealized) | operations | income) | gains) | distributions | of period | return3,4 | (in millions) | net assets | net assets2 | |||||||||||||||||||||||||||||||||||||
| Class 529-C: | ||||||||||||||||||||||||||||||||||||||||||||||||
| Year ended 12/31/2014 | $ | 36.54 | $ | .51 | $ | 3.58 | $ | 4.09 | $ | (.39 | ) | $ | (3.34 | ) | $ | (3.73 | ) | $ | 36.90 | 11.13 | % | $ | 509 | 1.46 | % | 1.33 | % | |||||||||||||||||||||
| Year ended 12/31/2013 | 30.04 | .30 | 9.04 | 9.34 | (.33 | ) | (2.51 | ) | (2.84 | ) | 36.54 | 31.29 | 471 | 1.49 | .88 | |||||||||||||||||||||||||||||||||
| Year ended 12/31/2012 | 26.99 | .34 | 3.59 | 3.93 | (.46 | ) | (.42 | ) | (.88 | ) | 30.04 | 14.59 | 372 | 1.50 | 1.14 | |||||||||||||||||||||||||||||||||
| Year ended 12/31/2011 | 28.06 | .33 | (1.06 | ) | (.73 | ) | (.34 | ) | — | (.34 | ) | 26.99 | (2.62 | ) | 336 | 1.49 | 1.18 | |||||||||||||||||||||||||||||||
| Year ended 12/31/2010 | 25.86 | .33 | 2.21 | 2.54 | (.34 | ) | — | (.34 | ) | 28.06 | 9.91 | 352 | 1.47 | 1.26 | ||||||||||||||||||||||||||||||||||
| Class 529-E: | ||||||||||||||||||||||||||||||||||||||||||||||||
| Year ended 12/31/2014 | 36.55 | .71 | 3.58 | 4.29 | (.59 | ) | (3.34 | ) | (3.93 | ) | 36.91 | 11.70 | 82 | .93 | 1.86 | |||||||||||||||||||||||||||||||||
| Year ended 12/31/2013 | 30.05 | .49 | 9.03 | 9.52 | (.51 | ) | (2.51 | ) | (3.02 | ) | 36.55 | 31.96 | 77 | .95 | 1.41 | |||||||||||||||||||||||||||||||||
| Year ended 12/31/2012 | 26.99 | .49 | 3.61 | 4.10 | (.62 | ) | (.42 | ) | (1.04 | ) | 30.05 | 15.23 | 61 | .97 | 1.68 | |||||||||||||||||||||||||||||||||
| Year ended 12/31/2011 | 28.07 | .47 | (1.07 | ) | (.60 | ) | (.48 | ) | — | (.48 | ) | 26.99 | (2.15 | ) | 55 | .97 | 1.70 | |||||||||||||||||||||||||||||||
| Year ended 12/31/2010 | 25.87 | .46 | 2.21 | 2.67 | (.47 | ) | — | (.47 | ) | 28.07 | 10.46 | 57 | .97 | 1.76 | ||||||||||||||||||||||||||||||||||
| Class 529-F-1: | ||||||||||||||||||||||||||||||||||||||||||||||||
| Year ended 12/31/2014 | 36.61 | .89 | 3.59 | 4.48 | (.77 | ) | (3.34 | ) | (4.11 | ) | 36.98 | 12.23 | 61 | .46 | 2.32 | |||||||||||||||||||||||||||||||||
| Year ended 12/31/2013 | 30.09 | .65 | 9.05 | 9.70 | (.67 | ) | (2.51 | ) | (3.18 | ) | 36.61 | 32.59 | 51 | .49 | 1.88 | |||||||||||||||||||||||||||||||||
| Year ended 12/31/2012 | 27.03 | .63 | 3.61 | 4.24 | (.76 | ) | (.42 | ) | (1.18 | ) | 30.09 | 15.74 | 37 | .50 | 2.15 | |||||||||||||||||||||||||||||||||
| Year ended 12/31/2011 | 28.10 | .61 | (1.06 | ) | (.45 | ) | (.62 | ) | — | (.62 | ) | 27.03 | (1.62 | ) | 31 | .49 | 2.19 | |||||||||||||||||||||||||||||||
| Year ended 12/31/2010 | 25.90 | .59 | 2.21 | 2.80 | (.60 | ) | — | (.60 | ) | 28.10 | 11.00 | 28 | .47 | 2.26 | ||||||||||||||||||||||||||||||||||
| Class R-1: | ||||||||||||||||||||||||||||||||||||||||||||||||
| Year ended 12/31/2014 | 36.49 | .54 | 3.56 | 4.10 | (.41 | ) | (3.34 | ) | (3.75 | ) | 36.84 | 11.19 | 94 | 1.40 | 1.40 | |||||||||||||||||||||||||||||||||
| Year ended 12/31/2013 | 30.01 | .33 | 9.01 | 9.34 | (.35 | ) | (2.51 | ) | (2.86 | ) | 36.49 | 31.36 | 87 | 1.40 | .96 | |||||||||||||||||||||||||||||||||
| Year ended 12/31/2012 | 26.95 | .36 | 3.60 | 3.96 | (.48 | ) | (.42 | ) | (.90 | ) | 30.01 | 14.74 | 73 | 1.41 | 1.23 | |||||||||||||||||||||||||||||||||
| Year ended 12/31/2011 | 28.02 | .35 | (1.06 | ) | (.71 | ) | (.36 | ) | — | (.36 | ) | 26.95 | (2.55 | ) | 74 | 1.41 | 1.25 | |||||||||||||||||||||||||||||||
| Year ended 12/31/2010 | 25.83 | .35 | 2.20 | 2.55 | (.36 | ) | — | (.36 | ) | 28.02 | 9.96 | 78 | 1.41 | 1.32 | ||||||||||||||||||||||||||||||||||
| Class R-2: | ||||||||||||||||||||||||||||||||||||||||||||||||
| Year ended 12/31/2014 | 36.53 | .55 | 3.56 | 4.11 | (.42 | ) | (3.34 | ) | (3.76 | ) | 36.88 | 11.20 | 722 | 1.37 | 1.43 | |||||||||||||||||||||||||||||||||
| Year ended 12/31/2013 | 30.03 | .34 | 9.04 | 9.38 | (.37 | ) | (2.51 | ) | (2.88 | ) | 36.53 | 31.45 | 698 | 1.36 | 1.00 | |||||||||||||||||||||||||||||||||
| Year ended 12/31/2012 | 26.98 | .37 | 3.59 | 3.96 | (.49 | ) | (.42 | ) | (.91 | ) | 30.03 | 14.70 | 584 | 1.40 | 1.25 | |||||||||||||||||||||||||||||||||
| Year ended 12/31/2011 | 28.05 | .35 | (1.06 | ) | (.71 | ) | (.36 | ) | — | (.36 | ) | 26.98 | (2.55 | ) | 577 | 1.41 | 1.25 | |||||||||||||||||||||||||||||||
| Year ended 12/31/2010 | 25.85 | .34 | 2.21 | 2.55 | (.35 | ) | — | (.35 | ) | 28.05 | 9.96 | 654 | 1.44 | 1.30 | ||||||||||||||||||||||||||||||||||
| Class R-2E: | ||||||||||||||||||||||||||||||||||||||||||||||||
| Period from 8/29/2014 to 12/31/20145,6 | 40.36 | .25 | .25 | .50 | (.46 | ) | (3.34 | ) | (3.80 | ) | 37.06 | 1.08 | 7 | — | 8 | .23 | 4,7 | .62 | 4,7 | |||||||||||||||||||||||||||||
| Class R-3: | ||||||||||||||||||||||||||||||||||||||||||||||||
| Year ended 12/31/2014 | 36.60 | .71 | 3.58 | 4.29 | (.58 | ) | (3.34 | ) | (3.92 | ) | 36.97 | 11.68 | 936 | .96 | 1.83 | |||||||||||||||||||||||||||||||||
| Year ended 12/31/2013 | 30.09 | .48 | 9.05 | 9.53 | (.51 | ) | (2.51 | ) | (3.02 | ) | 36.60 | 31.94 | 912 | .96 | 1.40 | |||||||||||||||||||||||||||||||||
| Year ended 12/31/2012 | 27.03 | .49 | 3.60 | 4.09 | (.61 | ) | (.42 | ) | (1.03 | ) | 30.09 | 15.19 | 743 | .98 | 1.67 | |||||||||||||||||||||||||||||||||
| Year ended 12/31/2011 | 28.10 | .47 | (1.06 | ) | (.59 | ) | (.48 | ) | — | (.48 | ) | 27.03 | (2.11 | ) | 737 | .97 | 1.70 | |||||||||||||||||||||||||||||||
| Year ended 12/31/2010 | 25.90 | .46 | 2.21 | 2.67 | (.47 | ) | — | (.47 | ) | 28.10 | 10.45 | 827 | .97 | 1.77 | ||||||||||||||||||||||||||||||||||
See footnotes at end of table.
| The Investment Company of America | 29 |
Financial highlights (continued)
| Income (loss) from | ||||||||||||||||||||||||||||||||||||||||||||||||
| investment operations1 | Dividends and distributions | |||||||||||||||||||||||||||||||||||||||||||||||
| Net gains | ||||||||||||||||||||||||||||||||||||||||||||||||
| (losses) on | Ratio of | |||||||||||||||||||||||||||||||||||||||||||||||
| Net asset | Net | securities | Dividends | Total | Net asset | Ratio of | net income | |||||||||||||||||||||||||||||||||||||||||
| value, | investment | (both | Total from | (from net | Distributions | dividends | value, | Net assets, | expenses to | (loss) to | ||||||||||||||||||||||||||||||||||||||
| beginning | income | realized and | investment | investment | (from capital | and | end | Total | end of period | average | average | |||||||||||||||||||||||||||||||||||||
| of period | (loss)2 | unrealized) | operations | income) | gains) | distributions | of period | return3,4 | (in millions) | net assets | net assets2 | |||||||||||||||||||||||||||||||||||||
| Class R-4: | ||||||||||||||||||||||||||||||||||||||||||||||||
| Year ended 12/31/2014 | $ | 36.63 | $ | .83 | $ | 3.58 | $ | 4.41 | $ | (.70 | ) | $ | (3.34 | ) | $ | (4.04 | ) | $ | 37.00 | 12.02 | % | $ | 998 | .65 | % | 2.15 | % | |||||||||||||||||||||
| Year ended 12/31/2013 | 30.11 | .59 | 9.06 | 9.65 | (.62 | ) | (2.51 | ) | (3.13 | ) | 36.63 | 32.37 | 909 | .65 | 1.72 | |||||||||||||||||||||||||||||||||
| Year ended 12/31/2012 | 27.04 | .59 | 3.61 | 4.20 | (.71 | ) | (.42 | ) | (1.13 | ) | 30.11 | 15.60 | 705 | .65 | 2.00 | |||||||||||||||||||||||||||||||||
| Year ended 12/31/2011 | 28.12 | .56 | (1.07 | ) | (.51 | ) | (.57 | ) | — | (.57 | ) | 27.04 | (1.83 | ) | 660 | .65 | 2.02 | |||||||||||||||||||||||||||||||
| Year ended 12/31/2010 | 25.91 | .54 | 2.22 | 2.76 | (.55 | ) | — | (.55 | ) | 28.12 | 10.82 | 681 | .65 | 2.08 | ||||||||||||||||||||||||||||||||||
| Class R-5: | ||||||||||||||||||||||||||||||||||||||||||||||||
| Year ended 12/31/2014 | 36.69 | .96 | 3.58 | 4.54 | (.82 | ) | (3.34 | ) | (4.16 | ) | 37.07 | 12.36 | 820 | .35 | 2.50 | |||||||||||||||||||||||||||||||||
| Year ended 12/31/2013 | 30.15 | .70 | 9.07 | 9.77 | (.72 | ) | (2.51 | ) | (3.23 | ) | 36.69 | 32.77 | 854 | .35 | 2.02 | |||||||||||||||||||||||||||||||||
| Year ended 12/31/2012 | 27.08 | .68 | 3.61 | 4.29 | (.80 | ) | (.42 | ) | (1.22 | ) | 30.15 | 15.92 | 697 | .35 | 2.28 | |||||||||||||||||||||||||||||||||
| Year ended 12/31/2011 | 28.15 | .65 | (1.07 | ) | (.42 | ) | (.65 | ) | — | (.65 | ) | 27.08 | (1.50 | ) | 761 | .35 | 2.31 | |||||||||||||||||||||||||||||||
| Year ended 12/31/2010 | 25.94 | .61 | 2.23 | 2.84 | (.63 | ) | — | (.63 | ) | 28.15 | 11.14 | 895 | .35 | 2.33 | ||||||||||||||||||||||||||||||||||
| Class R-6: | ||||||||||||||||||||||||||||||||||||||||||||||||
| Year ended 12/31/2014 | 36.69 | .95 | 3.61 | 4.56 | (.84 | ) | (3.34 | ) | (4.18 | ) | 37.07 | 12.41 | 4,160 | .30 | 2.45 | |||||||||||||||||||||||||||||||||
| Year ended 12/31/2013 | 30.15 | .71 | 9.08 | 9.79 | (.74 | ) | (2.51 | ) | (3.25 | ) | 36.69 | 32.84 | 3,005 | .30 | 2.07 | |||||||||||||||||||||||||||||||||
| Year ended 12/31/2012 | 27.08 | .69 | 3.62 | 4.31 | (.82 | ) | (.42 | ) | (1.24 | ) | 30.15 | 15.98 | 2,995 | .30 | 2.34 | |||||||||||||||||||||||||||||||||
| Year ended 12/31/2011 | 28.15 | .66 | (1.06 | ) | (.40 | ) | (.67 | ) | — | (.67 | ) | 27.08 | (1.45 | ) | 2,456 | .30 | 2.37 | |||||||||||||||||||||||||||||||
| Year ended 12/31/2010 | 25.95 | .63 | 2.21 | 2.84 | (.64 | ) | — | (.64 | ) | 28.15 | 11.16 | 2,330 | .30 | 2.45 | ||||||||||||||||||||||||||||||||||
| Year ended December 31 | |||||||||||
| 2014 | 2013 | 2012 | 2011 | 2010 | |||||||
| Portfolio turnover rate for all share classes | 29% | 24% | 21% | 28% | 23% | ||||||
| 1 | Based on average shares outstanding. |
| 2 | For the year ended December 31, 2014, this column reflects the impact of a corporate action event that resulted in a one-time increase to net investment income. If the corporate action event had not occurred, the Class A net investment income per share and ratio of net income to average net assets would have been lower by $.20 and .52 percentage points, respectively. The impact to the other share classes would have been similar. |
| 3 | Total returns exclude any applicable sales charges, including contingent deferred sales charges. |
| 4 | Not annualized. |
| 5 | Based on operations for the period shown and, accordingly, is not representative of a full year. |
| 6 | Class R-2E shares were offered beginning August 29, 2014. |
| 7 | Although the fund has a plan of distribution for Class R-2E shares, fees for distribution services are not paid by the fund on accounts for which a broker-dealer (or other financial intermediary) has not been assigned, including amounts invested in the fund by CRMC and/or its affiliates. If fees for distribution services were charged on these assets, fund expenses would be higher and net income and total return would be lower. |
| 8 | Amount less than $1 million. |
See Notes to Financial Statements
| 30 | The Investment Company of America |
Report of Independent Registered Public Accounting Firm
To the Shareholders and Board of Trustees of The Investment Company of America:
We have audited the accompanying statement of assets and liabilities of The Investment Company of America (the “Fund”), including the summary investment portfolio, as of December 31, 2014, and the related statement of operations for the year then ended, the statements of changes in net assets for each of the two years in the period then ended, and the financial highlights for each of the periods presented. These financial statements and financial highlights are the responsibility of the Fund’s management. Our responsibility is to express an opinion on these financial statements and financial highlights based on our audits.
We conducted our audits in accordance with the standards of the Public Company Accounting Oversight Board (United States). Those standards require that we plan and perform the audit to obtain reasonable assurance about whether the financial statements and financial highlights are free of material misstatement. The Fund is not required to have, nor were we engaged to perform, an audit of its internal control over financial reporting. Our audits included consideration of internal control over financial reporting as a basis for designing audit procedures that are appropriate in the circumstances, but not for the purpose of expressing an opinion on the effectiveness of the Fund’s internal control over financial reporting. Accordingly, we express no such opinion. An audit also includes examining, on a test basis, evidence supporting the amounts and disclosures in the financial statements, assessing the accounting principles used and significant estimates made by management, as well as evaluating the overall financial statement presentation. Our procedures included confirmation of securities owned as of December 31, 2014, by correspondence with the custodian and brokers; where replies were not received from brokers, we performed other auditing procedures. We believe that our audits provide a reasonable basis for our opinion.
In our opinion, such financial statements and financial highlights referred to above present fairly, in all material respects, the financial position of The Investment Company of America as of December 31, 2014, the results of its operations for the year then ended, the changes in its net assets for each of the two years in the period then ended, and the financial highlights for each of the periods presented, in conformity with accounting principles generally accepted in the United States of America.
Deloitte & Touche LLP
Costa Mesa, California
February 5, 2015
| The Investment Company of America | 31 |
| Expense example | unaudited |
As a fund shareholder, you incur two types of costs: (1) transaction costs, such as initial sales charges on purchase payments and contingent deferred sales charges on redemptions (loads), and (2) ongoing costs, including management fees, distribution and service (12b-1) fees, and other expenses. This example is intended to help you understand your ongoing costs (in dollars) of investing in the fund so you can compare these costs with the ongoing costs of investing in other mutual funds. The example is based on an investment of $1,000 invested at the beginning of the period and held for the entire six-month period (July 1, 2014, through December 31, 2014).
Actual expenses:
The first line of each share class in the table on the following page provides information about actual account values and actual expenses. You may use the information in this line, together with the amount you invested, to estimate the expenses that you paid over the period. Simply divide your account value by $1,000 (for example, an $8,600 account value divided by $1,000 = 8.6), then multiply the result by the number in the first line under the heading entitled “Expenses paid during period” to estimate the expenses you paid on your account during this period.
Hypothetical example for comparison purposes:
The second line of each share class in the table on the following page provides information about hypothetical account values and hypothetical expenses based on the actual expense ratio for the share class and an assumed rate of return of 5.00% per year before expenses, which is not the actual return of the share class. The hypothetical account values and expenses may not be used to estimate the actual ending account balance or expenses you paid for the period. You may use this information to compare the ongoing costs of investing in the fund and other funds. To do so, compare this 5.00% hypothetical example with the 5.00% hypothetical examples that appear in the shareholder reports of the other funds.
Notes:
Retirement plan participants may be subject to certain fees charged by the plan sponsor, and Class F-1, F-2 and 529-F-1 shareholders may be subject to fees charged by financial intermediaries, typically ranging from 0.75% to 1.50% of assets annually depending on services offered. You can estimate the impact of these fees by adding the amount of the fees to the total estimated expenses you paid on your account during the period as calculated above. In addition, your ending account value would be lower by the amount of these fees.
Note that the expenses shown in the table on the following page are meant to highlight your ongoing costs only and do not reflect any transactional costs, such as sales charges (loads). Therefore, the second line of each share class in the table is useful in comparing ongoing costs only and will not help you determine the relative total costs of owning different funds. In addition, if these transactional costs were included, your costs would have been higher.
| 32 | The Investment Company of America |
| Beginning account value 7/1/2014 | Ending account value 12/31/2014 | Expenses paid during period* | Annualized expense ratio | |||||||||||||
| Class A - actual return | $ | 1,000.00 | $ | 1,035.46 | $ | 2.98 | .58 | % | ||||||||
| Class A - assumed 5% return | 1,000.00 | 1,022.28 | 2.96 | .58 | ||||||||||||
| Class B - actual return | 1,000.00 | 1,031.72 | 6.81 | 1.33 | ||||||||||||
| Class B - assumed 5% return | 1,000.00 | 1,018.50 | 6.77 | 1.33 | ||||||||||||
| Class C - actual return | 1,000.00 | 1,031.07 | 7.06 | 1.38 | ||||||||||||
| Class C - assumed 5% return | 1,000.00 | 1,018.25 | 7.02 | 1.38 | ||||||||||||
| Class F-1 - actual return | 1,000.00 | 1,035.13 | 3.44 | .67 | ||||||||||||
| Class F-1 - assumed 5% return | 1,000.00 | 1,021.83 | 3.41 | .67 | ||||||||||||
| Class F-2 - actual return | 1,000.00 | 1,036.51 | 2.00 | .39 | ||||||||||||
| Class F-2 - assumed 5% return | 1,000.00 | 1,023.24 | 1.99 | .39 | ||||||||||||
| Class 529-A - actual return | 1,000.00 | 1,034.80 | 3.49 | .68 | ||||||||||||
| Class 529-A - assumed 5% return | 1,000.00 | 1,021.78 | 3.47 | .68 | ||||||||||||
| Class 529-B - actual return | 1,000.00 | 1,030.91 | 7.52 | 1.47 | ||||||||||||
| Class 529-B - assumed 5% return | 1,000.00 | 1,017.80 | 7.48 | 1.47 | ||||||||||||
| Class 529-C - actual return | 1,000.00 | 1,030.88 | 7.47 | 1.46 | ||||||||||||
| Class 529-C - assumed 5% return | 1,000.00 | 1,017.85 | 7.43 | 1.46 | ||||||||||||
| Class 529-E - actual return | 1,000.00 | 1,033.52 | 4.77 | .93 | ||||||||||||
| Class 529-E - assumed 5% return | 1,000.00 | 1,020.52 | 4.74 | .93 | ||||||||||||
| Class 529-F-1 - actual return | 1,000.00 | 1,035.92 | 2.36 | .46 | ||||||||||||
| Class 529-F-1 - assumed 5% return | 1,000.00 | 1,022.89 | 2.35 | .46 | ||||||||||||
| Class R-1 - actual return | 1,000.00 | 1,031.26 | 7.12 | 1.39 | ||||||||||||
| Class R-1 - assumed 5% return | 1,000.00 | 1,018.20 | 7.07 | 1.39 | ||||||||||||
| Class R-2 - actual return | 1,000.00 | 1,031.09 | 6.96 | 1.36 | ||||||||||||
| Class R-2 - assumed 5% return | 1,000.00 | 1,018.35 | 6.92 | 1.36 | ||||||||||||
| Class R-2E - actual return† | 1,000.00 | 1,010.85 | 2.39 | .70 | ||||||||||||
| Class R-2E - assumed 5% return† | 1,000.00 | 1,021.68 | 3.57 | .70 | ||||||||||||
| Class R-3 - actual return | 1,000.00 | 1,033.35 | 4.87 | .95 | ||||||||||||
| Class R-3 - assumed 5% return | 1,000.00 | 1,020.42 | 4.84 | .95 | ||||||||||||
| Class R-4 - actual return | 1,000.00 | 1,034.96 | 3.28 | .64 | ||||||||||||
| Class R-4 - assumed 5% return | 1,000.00 | 1,021.98 | 3.26 | .64 | ||||||||||||
| Class R-5 - actual return | 1,000.00 | 1,036.70 | 1.80 | .35 | ||||||||||||
| Class R-5 - assumed 5% return | 1,000.00 | 1,023.44 | 1.79 | .35 | ||||||||||||
| Class R-6 - actual return | 1,000.00 | 1,036.96 | 1.54 | .30 | ||||||||||||
| Class R-6 - assumed 5% return | 1,000.00 | 1,023.69 | 1.53 | .30 | ||||||||||||
| * | The “expenses paid during period” are equal to the “annualized expense ratio,” multiplied by the average account value over the period, multiplied by the number of days in the period, and divided by 365 (to reflect the one-half year period). |
| † | The period for the “annualized expense ratio” and “actual return” line is based on the number of days since the initial sale of the share class on August 29, 2014. The “assumed 5% return” line is based on 184 days. |
| The Investment Company of America | 33 |
| Tax information | unaudited |
We are required to advise you of the federal tax status of certain distributions received by shareholders during the fiscal year. The fund hereby designates the following amounts for the fund’s fiscal year ended December 31, 2014:
| Long-term capital gains | $6,551,084,000 | |||
| Qualified dividend income | 100% | |||
| Corporate dividends received deduction | 100% | |||
| U.S. government income that may be exempt from state taxation | $1,457,000 |
Individual shareholders should refer to their Form 1099 or other tax information, which was mailed in January 2015, to determine the calendar year amounts to be included on their 2014 tax returns. Shareholders should consult their tax advisors.
| 34 | The Investment Company of America |
Board of trustees and other officers
Independent trustees1
| Name and year of birth | Year first elected a trustee of the fund2 | Principal occupation(s) during past five years | Number of portfolios in fund complex overseen by trustee | Other directorships3 held by trustee | ||||
| Louise H. Bryson, 1944 | 1999 | Chair Emerita of the Board of Trustees, J. Paul Getty Trust; former President, Distribution, Lifetime Entertainment Network (retired 2008); former Executive Vice President and General Manager, Lifetime Movie Network (retired 2008) | 7 | None | ||||
| Mary Anne Dolan, 1947 Chairman of the Board (Independent and Non-Executive) | 2000 | Founder and President, MAD Ink (communications company) | 10 | None | ||||
| James G. Ellis, 1947 | 2008 | Dean and Professor of Marketing, Marshall School of Business, University of Southern California | 72 | Mercury General Corp. | ||||
| Leonard R. Fuller, 1946 | 2002 | President and CEO, Fuller Consulting (financial management consulting firm) | 72 | None | ||||
| William D. Jones, 1955 | 2010 | Real estate developer/owner, President and CEO, CityLink Investment Corporation (acquires, develops and manages real estate ventures in selected urban communities) and City Scene Management Company (provides commercial asset and property management services) | 8 | Sempra Energy | ||||
| L. Daniel Jorndt, 1941 | 2006 | Retired | 4 | None | ||||
| William H. Kling, 1942 | 2010 | President Emeritus and former CEO, American Public Media | 10 | None | ||||
| John C. Mazziotta, MD, PhD, 1949 | 2011 | Physician; Chair, Department of Neurology, University of California at Los Angeles; Associate Director, Semel Institute, UCLA; Director, Brain Mapping Center, UCLA | 4 | None | ||||
| Bailey Morris-Eck, 1944 | 1993 | Director and Programming Chair, WYPR Baltimore/Washington (public radio station); Senior Adviser, Financial News (London); Senior Fellow, Institute for International Economics | 4 | None |
Interested trustees4,5
| Name, year of birth and position with fund | Year first elected a trustee or officer of the fund2 | Principal occupation(s) during past five years and positions held with affiliated entities or the principal underwriter of the fund | Number of portfolios in fund complex overseen by trustee | Other directorships3 held by trustee | ||||
| James B. Lovelace, 1956 Vice Chairman of the Board | 1994 | Partner — Capital Research Global Investors, Capital Research and Management Company; Director, Capital Research and Management Company | 2 | None | ||||
| Donald D. O’Neal, 1960 President | 1994 | Partner — Capital Research Global Investors, Capital Research and Management Company; Director, Capital Research and Management Company | 26 | None |
The fund’s statement of additional information includes further details about fund trustees and is available without charge upon request by calling American Funds Service Company at (800) 421-4225 or by visiting the American Funds website at americanfunds.com. The address for all trustees and officers of the fund is 333 South Hope Street, Los Angeles, CA 90071, Attention: Secretary.
See page 36 for footnotes.
| The Investment Company of America | 35 |
Other officers5
| Name, year of birth and position with fund | Year first elected an officer of the fund2 | Principal occupation(s) during past five years and positions held with affiliated entities or the principal underwriter of the fund | ||
| Christopher D. Buchbinder, 1971 Senior Vice President | 2010 | Partner — Capital Research Global Investors, Capital Research and Management Company | ||
| Joyce E. Gordon, 1956 Senior Vice President | 1998 | Partner — Capital Research Global Investors, Capital Research and Management Company; Director, Capital Research and Management Company | ||
| Paul F. Roye, 1953 Senior Vice President | 2008 | Senior Vice President — Fund Business Management Group, Capital Research and Management Company; Director, American Funds Service Company6 | ||
| Herbert Y. Poon, 1973 Vice President | 2012 | Vice President and Senior Counsel — Fund Business Management Group, Capital Research and Management Company | ||
| Jessica Chase Spaly, 1977 Vice President | 2010 | Partner — Capital Research Global Investors, Capital Research and Management Company | ||
| Michael W. Stockton, 1967 Secretary | 2013 | Vice President — Fund Business Management Group, Capital Research and Management Company | ||
| Brian D. Bullard, 1969 Treasurer | 2008 | Senior Vice President — Investment Operations, Capital Research and Management Company | ||
| Raymond F. Sullivan, Jr., 1957 Assistant Secretary | 2008 | Vice President — Fund Business Management Group, Capital Research and Management Company | ||
| Dori Laskin, 1951 Assistant Treasurer | 2011 | Vice President — Investment Operations, Capital Research and Management Company | ||
| Ari M. Vinocor, 1974 Assistant Treasurer | 2010 | Vice President — Investment Operations, Capital Research and Management Company |
| 1 | The term independent trustee refers to a trustee who is not an “interested person” of the fund within the meaning of the Investment Company Act of 1940. |
| 2 | Trustees and officers of the fund are elected on an annual basis. |
| 3 | This includes all directorships/trusteeships (other than those in the American Funds or other funds managed by Capital Research and Management Company or its affiliates) that are held by each trustee as a trustee or director of a public company or a registered investment company. |
| 4 | The term interested trustee refers to a trustee who is an “interested person” within the meaning of the Investment Company Act of 1940, on the basis of their affiliation with the fund’s investment adviser, Capital Research and Management Company, or affiliated entities (including the fund’s principal underwriter). |
| 5 | All of the directors/trustees and/or officers listed, with the exception of Jessica Chase Spaly, are officers and/or directors/trustees of one or more of the other funds for which Capital Research and Management Company serves as investment adviser. |
| 6 | Company affiliated with Capital Research and Management Company. |
| 36 | The Investment Company of America |
Offices of the fund and of the investment adviser
Capital Research and Management Company
333 South Hope Street
Los Angeles, CA 90071-1406
6455 Irvine Center Drive
Irvine, CA 92618-4518
Transfer agent for shareholder accounts
American Funds Service Company
(Write to the address near you.)
P.O. Box 6007
Indianapolis, IN 46206-6007
P.O. Box 2280
Norfolk, VA 23501-2280
Custodian of assets
JPMorgan Chase Bank
270 Park Avenue
New York, NY 10017-2070
Counsel
O’Melveny & Myers LLP
400 South Hope Street
Los Angeles, CA 90071-2899
Independent registered public accounting firm
Deloitte & Touche LLP
695 Town Center Drive
Suite 1200
Costa Mesa, CA 92626-7188
Principal underwriter
American Funds Distributors, Inc.
333 South Hope Street
Los Angeles, CA 90071-1406
Investors should carefully consider investment objectives, risks, charges and expenses. This and other important information is contained in the fund prospectus and summary prospectus, which can be obtained from your financial professional and should be read carefully before investing. You may also call American Funds Service Company (AFS) at (800) 421-4225 or visit the American Funds website at americanfunds.com.
“American Funds Proxy Voting Procedures and Principles” — which describes how we vote proxies relating to portfolio securities — is available on the American Funds website or upon request by calling AFS. The fund files its proxy voting record with the U.S. Securities and Exchange Commission (SEC) for the 12 months ended June 30 by August 31. The proxy voting record is available free of charge on the SEC website at sec.gov and on the American Funds website.
A complete December 31, 2014, portfolio of The Investment Company of America’s investments is available free of charge by calling AFS or visiting the SEC website (where it is part of Form N-CSR).
The Investment Company of America files a complete list of its portfolio holdings with the SEC for the first and third quarters of each fiscal year on Form N-Q. This filing is available free of charge on the SEC website. You may also review or, for a fee, copy this filing at the SEC’s Public Reference Room in Washington, D.C. Additional information regarding the operation of the Public Reference Room may be obtained by calling the SEC’s Office of Investor Education and Advocacy at (800) SEC-0330. Additionally, the list of portfolio holdings is available by calling AFS.
This report is for the information of shareholders of The Investment Company of America, but it also may be used as sales literature when preceded or accompanied by the current prospectus or summary prospectus, which gives details about charges, expenses, investment objectives and operating policies of the fund. If used as sales material after March 31, 2015, this report must be accompanied by an American Funds statistical update for the most recently completed calendar quarter.
The American Funds Advantage
Since 1931, American Funds, part of Capital Group, has helped investors pursue long-term investment success. Our consistent approach — in combination with The Capital SystemSM — has resulted in a superior long-term track record.
| Aligned with investor success | |
| We base our decisions on a long-term perspective, which we believe aligns our goals with the interests of our clients. Our portfolio managers average 27 years of investment experience, including 22 years at our company, reflecting a career commitment to our long-term approach.1 | |
| The Capital SystemSM Our investment process, The Capital System, combines individual accountability with teamwork. Each fund is divided into portions that are managed independently by investment professionals with diverse backgrounds, ages and investment approaches. An extensive global research effort is the backbone of our system. | |
| Superior long-term track record | |
| Our equity funds have beaten their Lipper peer indexes in 91% of 10-year periods and 96% of 20-year periods. Our fixed-income funds have beaten their Lipper indexes in 54% of 10-year periods and 57% of 20-year periods.2 Our fund management fees have been among the lowest in the industry.3 |
| 1 | Portfolio manager experience as of December 31, 2014. | |
| 2 | Based on Class A share results for rolling periods through December 31, 2014. Periods covered are the shorter of the fund’s lifetime or since the comparable Lipper index inception date (except SMALLCAP World Fund, for which the Lipper average was used). | |
| 3 | On average, our management fees were in the lowest quintile 70% of the time, based on the 20-year period ended December 31, 2014, versus comparable Lipper categories, excluding funds of funds. |

ITEM 2 – Code of Ethics
The Registrant has adopted a Code of Ethics that applies to its Principal Executive Officer and Principal Financial Officer. The Registrant undertakes to provide to any person without charge, upon request, a copy of the Code of Ethics. Such request can be made to American Funds Service Company at 800/421-9225 or to the Secretary of the Registrant, 333 South Hope Street, Los Angeles, California 90071.
ITEM 3 – Audit Committee Financial Expert
The Registrant’s board has determined that James G. Ellis, a member of the Registrant’s audit committee, is an “audit committee financial expert” and "independent," as such terms are defined in this Item. This designation will not increase the designee’s duties, obligations or liability as compared to his or her duties, obligations and liability as a member of the audit committee and of the board, nor will it reduce the responsibility of the other audit committee members. There may be other individuals who, through education or experience, would qualify as "audit committee financial experts" if the board had designated them as such. Most importantly, the board believes each member of the audit committee contributes significantly to the effective oversight of the Registrant’s financial statements and condition.
ITEM 4 – Principal Accountant Fees and Services
| Registrant: | ||||
| a) Audit Fees: | ||||
| 2013 | $94,000 | |||
| 2014 | $100,000 | |||
| b) Audit-Related Fees: | ||||
| 2013 | $25,000 | |||
| 2014 | $16,000 | |||
| The audit-related fees consist of assurance and related services relating to the examination of the Registrant’s investment adviser conducted in accordance with Statement on Standards for Attestation Engagements Number 16 issued by the American Institute of Certified Public Accountants. | ||||
| c) Tax Fees: | ||||
| 2013 | None | |||
| 2014 | $7,000 | |||
| The tax fees consist of professional services relating to the preparation of the Registrant’s tax returns including returns relating to the Registrant’s investments in non-U.S. jurisdictions. | ||||
| d) All Other Fees: | ||||
| 2013 | None | |||
| 2014 | None | |||
| Adviser and affiliates (includes only fees for non-audit services billed to the adviser and affiliates for engagements that relate directly to the operations and financial reporting of the Registrant and were subject to the pre-approval policies described below): | ||||
| a) Audit Fees: | ||||
| Not Applicable | ||||
| b) Audit-Related Fees: | ||||
| 2013 | $1,020,000 | |||
| 2014 | $927,000 | |||
| The audit-related fees consist of assurance and related services relating to the examination of the Registrant’s transfer agent, principal underwriter and investment adviser conducted in accordance with Statement on Standards for Attestation Engagements Number 16 issued by the American Institute of Certified Public Accountants. | ||||
| ||||
| c) Tax Fees: | ||||
| 2013 | $10,000 | |||
| 2014 | $33,000 | |||
| The tax fees consist of consulting services relating to the Registrant’s investments. | ||||
| d) All Other Fees: | ||||
| 2013 | $3,000 | |||
| 2014 | $3,000 | |||
| The other fees consist of subscription services related to an accounting research tool. | ||||
All audit and permissible non-audit services that the Registrant’s audit committee considers compatible with maintaining the independent registered public accounting firm’s independence are required to be pre-approved by the committee. The pre-approval requirement will extend to all non-audit services provided to the Registrant, the investment adviser, and any entity controlling, controlled by, or under common control with the investment adviser that provides ongoing services to the Registrant, if the engagement relates directly to the operations and financial reporting of the Registrant. The committee will not delegate its responsibility to pre-approve these services to the investment adviser. The committee may delegate to one or more committee members the authority to review and pre-approve audit and permissible non-audit services. Actions taken under any such delegation will be reported to the full committee at its next meeting. The pre-approval requirement is waived with respect to non-audit services if certain conditions are met. The pre-approval requirement was not waived for any of the non-audit services listed above provided to the Registrant, adviser and affiliates.
Aggregate non-audit fees paid to the Registrant’s auditors, including fees for all services billed to the Registrant, adviser and affiliates that provide ongoing services to the Registrant, were $1,471,000 for fiscal year 2013 and $1,286,000 for fiscal year 2014. The non-audit services represented by these amounts were brought to the attention of the committee and considered to be compatible with maintaining the auditors’ independence.
ITEM 5 – Audit Committee of Listed Registrants
Not applicable to this Registrant, insofar as the Registrant is not a listed issuer as defined in Rule 10A-3 under the Securities Exchange Act of 1934.
ITEM 6 – Schedule of Investments

| Common stocks 92.42% Energy 8.38% | Shares | Value (000) |
| Apache Corp. | 2,150,000 | $134,740 |
| Baker Hughes Inc. | 4,846,950 | 271,768 |
| BG Group PLC1 | 8,328,000 | 110,852 |
| BP PLC1 | 110,680,000 | 702,789 |
| Cabot Oil & Gas Corp. | 15,784,000 | 467,364 |
| Canadian Natural Resources, Ltd. | 19,637,800 | 607,152 |
| Chesapeake Energy Corp. | 13,100,000 | 256,367 |
| Chevron Corp. | 1,516,000 | 170,065 |
| ConocoPhillips | 6,250,000 | 431,625 |
| Devon Energy Corp. | 2,865,000 | 175,367 |
| Eni SpA1 | 14,657,000 | 255,988 |
| EOG Resources, Inc. | 5,447,200 | 501,524 |
| Exxon Mobil Corp. | 843,000 | 77,935 |
| Halliburton Co. | 1,642,576 | 64,603 |
| Kinder Morgan, Inc. | 8,115,000 | 343,346 |
| Royal Dutch Shell PLC, Class A (ADR) | 8,699,700 | 582,445 |
| Royal Dutch Shell PLC, Class B1 | 9,250,000 | 317,774 |
| Schlumberger Ltd. | 2,737,999 | 233,852 |
| Southwestern Energy Co.2 | 12,240,100 | 334,032 |
| Suncor Energy Inc. | 8,853,342 | 281,192 |
| 6,320,780 | ||
| Materials 3.19% | ||
| Barrick Gold Corp. | 1,725,000 | 18,544 |
| Dow Chemical Co. | 15,955,000 | 727,707 |
| International Flavors & Fragrances Inc. | 2,464,756 | 249,828 |
| Monsanto Co. | 3,310,000 | 395,446 |
| Newmont Mining Corp. | 1,375,000 | 25,987 |
| Praxair, Inc. | 4,880,800 | 632,356 |
| Rio Tinto PLC1 | 7,717,000 | 355,542 |
| 2,405,410 | ||
| Industrials 10.27% | ||
| Caterpillar Inc. | 1,989,000 | 182,053 |
| CSX Corp. | 31,155,771 | 1,128,774 |
| Cummins Inc. | 4,360,000 | 628,581 |
| Danaher Corp. | 2,000,000 | 171,420 |
| Emerson Electric Co. | 2,130,000 | 131,485 |
| General Dynamics Corp. | 10,974,551 | 1,510,318 |
| General Electric Co. | 21,875,000 | 552,781 |
| Illinois Tool Works Inc. | 6,400,000 | 606,080 |
| Lockheed Martin Corp. | 1,000,000 | 192,570 |
| Nielsen NV | 5,682,000 | 254,156 |
| Precision Castparts Corp. | 1,673,100 | 403,016 |
| R.R. Donnelley & Sons Co. | 9,169,400 | 154,092 |
| Rockwell Automation | 350,000 | 38,920 |
| Schneider Electric SE1 | 918,000 | 66,704 |
| Common stocks Industrials (continued) | Shares | Value (000) |
| Textron Inc. | 2,836,343 | $119,438 |
| Union Pacific Corp. | 4,887,800 | 582,284 |
| United Parcel Service, Inc., Class B | 1,700,000 | 188,989 |
| United Technologies Corp. | 3,740,952 | 430,209 |
| Waste Management, Inc. | 7,900,000 | 405,428 |
| 7,747,298 | ||
| Consumer discretionary 10.26% | ||
| Amazon.com, Inc.2 | 3,136,500 | 973,413 |
| Comcast Corp., Class A | 9,593,400 | 556,513 |
| Comcast Corp., Class A, special nonvoting shares | 6,000,000 | 345,390 |
| DIRECTV2 | 1,026,604 | 89,007 |
| Ford Motor Co. | 9,500,000 | 147,250 |
| General Motors Co. | 19,018,309 | 663,929 |
| Hasbro, Inc.3 | 6,405,000 | 352,211 |
| Home Depot, Inc. | 10,100,000 | 1,060,197 |
| Johnson Controls, Inc. | 22,359,087 | 1,080,838 |
| Kohl’s Corp. | 2,794,000 | 170,546 |
| Las Vegas Sands Corp. | 7,775,000 | 452,194 |
| News Corp., Class A2 | 1,860,000 | 29,183 |
| NIKE, Inc., Class B | 2,650,200 | 254,817 |
| Nissan Motor Co., Ltd.1 | 6,045,000 | 52,653 |
| Time Warner Inc. | 8,104,000 | 692,244 |
| Toyota Motor Corp.1 | 4,590,000 | 286,235 |
| Twenty-First Century Fox, Inc., Class A | 5,463,700 | 209,833 |
| Wynn Resorts, Ltd. | 2,200,300 | 327,317 |
| 7,743,770 | ||
| Consumer staples 9.87% | ||
| Altria Group, Inc. | 37,442,600 | 1,844,797 |
| Anheuser-Busch InBev NV1 | 1,008,000 | 113,434 |
| Coca-Cola Co. | 15,744,600 | 664,737 |
| ConAgra Foods, Inc. | 12,075,867 | 438,113 |
| General Mills, Inc. | 3,920,000 | 209,054 |
| Kellogg Co. | 1,000,000 | 65,440 |
| Kraft Foods Group, Inc. | 6,124,722 | 383,775 |
| Mead Johnson Nutrition Co. | 3,730,000 | 375,014 |
| Mondelez International, Inc. | 11,825,000 | 429,543 |
| PepsiCo, Inc. | 5,220,000 | 493,603 |
| Philip Morris International Inc. | 24,530,019 | 1,997,970 |
| Procter & Gamble Co. | 2,165,000 | 197,210 |
| Reynolds American Inc. | 2,333,332 | 149,963 |
| SABMiller PLC1 | 1,730,380 | 89,551 |
| 7,452,204 | ||
| Health care 16.98% | ||
| Abbott Laboratories | 6,635,000 | 298,708 |
| AbbVie Inc. | 26,035,000 | 1,703,730 |
| Aetna Inc. | 1,990,000 | 176,772 |
| Alexion Pharmaceuticals, Inc.2 | 3,207,000 | 593,391 |
| Amgen Inc. | 22,570,703 | 3,595,287 |
| Bayer AG1 | 4,181,500 | 571,650 |
| Express Scripts Holding Co.2 | 1,241,674 | 105,133 |
| Gilead Sciences, Inc.2 | 26,975,605 | 2,542,721 |
| Humana Inc. | 2,159,197 | 310,125 |
| Common stocks Health care (continued) | Shares | Value (000) |
| Johnson & Johnson | 600,000 | $62,742 |
| Medtronic, Inc. | 6,277,000 | 453,199 |
| Merck & Co., Inc. | 2,800,000 | 159,012 |
| Novartis AG1 | 4,345,000 | 399,599 |
| Novartis AG (ADR) | 256,556 | 23,772 |
| St. Jude Medical, Inc. | 5,039,400 | 327,712 |
| Stryker Corp. | 4,488,960 | 423,444 |
| Teva Pharmaceutical Industries Ltd. (ADR) | 4,100,000 | 235,791 |
| Thermo Fisher Scientific Inc. | 1,212,000 | 151,852 |
| UnitedHealth Group Inc. | 6,681,123 | 675,395 |
| 12,810,035 | ||
| Financials 4.47% | ||
| American International Group, Inc. | 12,830,000 | 718,608 |
| Barclays PLC1 | 74,200,000 | 278,955 |
| Berkshire Hathaway Inc., Class B2 | 1,335,000 | 200,450 |
| Citigroup Inc. | 4,950,000 | 267,844 |
| CME Group Inc., Class A | 2,300,000 | 203,895 |
| Credit Suisse Group AG1 | 12,685,937 | 318,021 |
| HSBC Holdings PLC (ADR) | 1,529,416 | 72,234 |
| HSBC Holdings PLC (GBP denominated)1 | 4,869,240 | 46,017 |
| HSBC Holdings PLC (HKD denominated)1 | 15,000,000 | 142,707 |
| JPMorgan Chase & Co. | 3,150,000 | 197,127 |
| Prudential PLC1 | 7,470,000 | 171,901 |
| Société Générale1 | 3,432,877 | 144,254 |
| U.S. Bancorp | 13,565,000 | 609,747 |
| 3,371,760 | ||
| Information technology 17.02% | ||
| Accenture PLC, Class A | 8,646,460 | 772,215 |
| Adobe Systems Inc.2 | 3,130,000 | 227,551 |
| Apple Inc. | 13,117,600 | 1,447,921 |
| ASML Holding NV1 | 5,350,000 | 573,181 |
| Automatic Data Processing, Inc. | 3,323,043 | 277,042 |
| Avago Technologies Ltd. | 4,000,000 | 402,360 |
| Broadcom Corp., Class A | 10,639,875 | 461,026 |
| Cisco Systems, Inc. | 15,755,000 | 438,225 |
| Google Inc., Class A2 | 1,626,980 | 863,373 |
| Google Inc., Class C2 | 1,592,980 | 838,545 |
| Hewlett-Packard Co. | 7,700,000 | 309,001 |
| Intel Corp. | 4,840,000 | 175,644 |
| International Business Machines Corp. | 924,741 | 148,365 |
| Intuit Inc. | 1,950,000 | 179,770 |
| KLA-Tencor Corp. | 6,026,900 | 423,812 |
| Linear Technology Corp. | 2,000,000 | 91,200 |
| Microsoft Corp. | 12,447,100 | 578,168 |
| Motorola Solutions, Inc. | 1,842,396 | 123,588 |
| Nintendo Co., Ltd.1 | 470,000 | 48,984 |
| Oracle Corp. | 40,732,300 | 1,831,732 |
| salesforce.com, inc.2 | 3,895,000 | 231,012 |
| Samsung Electronics Co. Ltd.1 | 258,000 | 310,129 |
| Texas Instruments Inc. | 27,100,773 | 1,448,943 |
| Western Union Co.3 | 35,700,000 | 639,387 |
| 12,841,174 |
| Common stocks Telecommunication services 5.00% | Shares | Value (000) |
| AT&T Inc. | 10,000,000 | $335,900 |
| CenturyLink, Inc. | 18,833,202 | 745,418 |
| SoftBank Corp.1 | 7,320,000 | 435,630 |
| Verizon Communications Inc. | 48,205,798 | 2,255,067 |
| 3,772,015 | ||
| Utilities 3.72% | ||
| Dominion Resources, Inc. | 5,623,824 | 432,472 |
| Exelon Corp. | 31,293,935 | 1,160,379 |
| FirstEnergy Corp. | 13,090,025 | 510,380 |
| NextEra Energy, Inc. | 300,000 | 31,887 |
| NRG Energy, Inc. | 13,813,079 | 372,262 |
| Sempra Energy | 2,705,000 | 301,229 |
| 2,808,609 | ||
| Miscellaneous 3.26% | ||
| Other common stocks in initial period of acquisition | 2,457,494 | |
| Total common stocks (cost: $44,212,555,000) | 69,730,549 | |
| Bonds, notes & other debt instruments 0.06% U.S. Treasury bonds & notes 0.03% U.S. Treasury 0.03% | Principal amount (000) | |
| U.S. Treasury 0.25% 2015 | $22,000 | 22,015 |
| U.S. Treasury 4.25% 2015 | 4,000 | 4,101 |
| 26,116 | ||
| Corporate bonds & notes 0.03% Financials 0.03% | ||
| JPMorgan Chase & Co., Series I, junior subordinated 7.90% (undated)4 | 17,786 | 19,232 |
| Total bonds, notes & other debt instruments (cost: $41,690,000) | 45,348 | |
| Short-term securities 7.20% | ||
| Abbott Laboratories 0.09%–0.11% due 1/22/2015–2/19/20155 | 65,000 | 64,995 |
| CAFCO, LLC 0.17%–0.23% due 2/6/2015–3/16/2015 | 100,000 | 99,972 |
| Caterpillar Inc. 0.10% due 2/6/2015 | 40,000 | 39,994 |
| Chariot Funding, LLC 0.25%–0.27% due 2/25/2015–3/2/20155 | 50,000 | 49,989 |
| Chevron Corp. 0.12%–0.14% due 1/20/2015–2/17/20155 | 100,000 | 99,987 |
| Ciesco LLC 0.24% due 6/8/2015 | 25,000 | 24,968 |
| Coca-Cola Co. 0.12%–0.24% due 2/17/2015–6/11/20155 | 138,900 | 138,857 |
| Emerson Electric Co. 0.09%–0.15% due 1/6/2015–3/10/20155 | 27,100 | 27,094 |
| ExxonMobil Corp. 0.08%–0.14% due 1/27/2015–3/2/2015 | 102,400 | 102,387 |
| Fannie Mae 0.05%–0.15% due 1/5/2015–10/5/2015 | 773,400 | 773,095 |
| Federal Farm Credit Banks 0.04%–0.15% due 2/11/2015–8/27/2015 | 539,300 | 539,000 |
| Federal Home Loan Bank 0.07%–0.17% due 1/5/2015–7/31/2015 | 1,399,050 | 1,398,908 |
| Freddie Mac 0.07%–0.19% due 1/6/2015–11/23/2015 | 1,350,000 | 1,349,603 |
| General Electric Capital Corp. 0.18% due 4/21/2015–4/29/2015 | 110,000 | 109,941 |
| Google Inc. 0.09%–0.12% due 2/25/2015–3/18/20155 | 81,600 | 81,583 |
| John Deere Capital Corp. 0.10%–0.14% due 1/20/2015–2/3/20155 | 75,000 | 74,993 |
| Jupiter Securitization Co., LLC 0.25%–0.27% due 3/4/2015–8/14/20155 | 140,000 | 139,849 |
| Microsoft Corp. 0.10% due 2/3/20155 | 50,000 | 49,999 |
| National Rural Utilities Cooperative Finance Corp. 0.12% due 1/12/2015 | 50,000 | 49,998 |
| Short-term securities | Principal amount (000) | Value (000) |
| Paccar Financial Corp. 0.11%–0.12% due 1/27/2015–2/5/2015 | $56,150 | $56,143 |
| Private Export Funding Corp. 0.19%–0.26% due 1/20/2015–4/13/20155 | 73,900 | 73,882 |
| Procter & Gamble Co. 0.08%–0.11% due 2/6/2015–3/9/20155 | 89,400 | 89,387 |
| Total short-term securities (cost: $5,434,314,000) | 5,434,624 | |
| Total investment securities 99.68% (cost: $49,688,559,000) | 75,210,521 | |
| Other assets less liabilities 0.32% | 245,209 | |
| Net assets 100.00% | 75,455,730 |
| 1 | Valued under fair value procedures adopted by authority of the board of trustees. The total value of all such securities, including those in “Miscellaneous,“ was $6,359,878,000, which represented 8.43% of the net assets of the fund. This entire amount relates to certain securities trading outside the U.S. whose values were adjusted as a result of significant market movements following the close of local trading. |
| 2 | Security did not produce income during the last 12 months. |
| 3 | Represents an affiliated company as defined under the Investment Company Act of 1940. |
| 4 | Coupon rate may change periodically. |
| 5 | Acquired in a transaction exempt from registration under Section 4(2) of the Securities Act of 1933. May be resold in the U.S. in transactions exempt from registration, normally to qualified institutional buyers. The total value of all such securities was $890,615,000, which represented 1.18% of the net assets of the fund. |
| Key to abbreviations |
| ADR = American Depositary Receipts |
| GBP= British pounds |
| HKD= Hong Kong dollars |
| MFGEFPX-004-0215O-S42201 | The Investment Company of America — Page 5 of 5 |
REPORT OF INDEPENDENT REGISTERED PUBLIC ACCOUNTING FIRM
To the Shareholders and Board of Trustees of
The Investment Company of America:
We have audited the accompanying statement of assets and liabilities of The Investment Company of America (the “Fund”), including the summary schedule of investments, as of December 31, 2014, and the related statements of operations for the year then ended, the statements of changes in net assets for each of the two years in the period then ended (collectively, the “financial statements”), the financial highlights for each of the five years in the period then ended (the financial statements and financial highlights are included in Item 1 of this Form N-CSR), and the schedule of investments in securities as of December 31, 2014 (included in Item 6 of this Form N-CSR). These financial statements, financial highlights, and schedule of investments in securities are the responsibility of the Fund’s management. Our responsibility is to express an opinion on these financial statements, financial highlights, and schedule of investments in securities based on our audits.
We conducted our audits in accordance with the standards of the Public Company Accounting Oversight Board (United States). Those standards require that we plan and perform the audit to obtain reasonable assurance about whether the financial statements, financial highlights, and schedule of investments in securities are free of material misstatement. An audit includes examining, on a test basis, evidence supporting the amounts and disclosures in the financial statements and schedule of investments in securities. Our procedures included confirmation of securities owned as of December 31, 2014, by correspondence with the custodian and brokers; where replies were not received from brokers, we performed other auditing procedures. An audit also includes assessing the accounting principles used and significant estimates made by management, as well as evaluating the overall financial statement presentation. We believe that our audits provide a reasonable basis for our opinion.
In our opinion, the financial statements, financial highlights, and schedule of investments in securities referred to above present fairly, in all material respects, the financial position of The Investment Company of America as of December 31, 2014, and the results of its operations for the year then ended, the changes in its net assets for each of the two years in the period then ended, and the financial highlights for each of the five years in the period then ended, in conformity with accounting principles generally accepted in the United States of America.
DELOITTE & TOUCHE LLP
Costa Mesa, California
February 5, 2015
ITEM 7 – Disclosure of Proxy Voting Policies and Procedures for Closed-End Management Investment Companies
Not applicable to this Registrant, insofar as the Registrant is not a closed-end management investment company.
ITEM 8 – Portfolio Managers of Closed-End Management Investment Companies
Not applicable to this Registrant, insofar as the Registrant is not a closed-end management investment company.
ITEM 9 – Purchases of Equity Securities by Closed-End Management Investment Company and Affiliated Purchasers
Not applicable to this Registrant, insofar as the Registrant is not a closed-end management investment company.
ITEM 10 – Submission of Matters to a Vote of Security Holders
There have been no material changes to the procedures by which shareholders may recommend nominees to the Registrant’s board of trustees since the Registrant last submitted a proxy statement to its shareholders. The procedures are as follows. The Registrant has a nominating and governance committee comprised solely of persons who are not considered ‘‘interested persons’’ of the Registrant within the meaning of the Investment Company Act of 1940, as amended. The committee periodically reviews such issues as the board’s composition, responsibilities, committees, compensation and other relevant issues, and recommends any appropriate changes to the full board of trustees. While the committee normally is able to identify from its own resources an ample number of qualified candidates, it will consider shareholder suggestions of persons to be considered as nominees to fill future vacancies on the board. Such suggestions must be sent in writing to the nominating and governance committee of the Registrant, c/o the Registrant’s Secretary, and must be accompanied by complete biographical and occupational data on the prospective nominee, along with a written consent of the prospective nominee for consideration of his or her name by the nominating and governance committee.
ITEM 11 – Controls and Procedures
| (a) | The Registrant’s Principal Executive Officer and Principal Financial Officer have concluded, based on their evaluation of the Registrant’s disclosure controls and procedures (as such term is defined in Rule 30a-3 under the Investment Company Act of 1940), that such controls and procedures are adequate and reasonably designed to achieve the purposes described in paragraph (c) of such rule. |
| (b) | There were no changes in our internal control over financial reporting during the quarter ended December 31, 2014, which were identified in connection with management's evaluation required by paragraph (d) of Rule 13a-15 and 15d-15 under the Exchange Act, that have materially affected, or are reasonably likely to materially affect, our internal control over financial reporting, other than as provided below.
Effective November 10, 2014, the The Investment Company of America’s investment adviser implemented a new accounting system. In connection with introducing this new system, additional automated and manual controls were implemented and some existing controls were modified. None of these changes were in response to any identified deficiency or weakness in the The Investment Company of America’s internal control over financial reporting. |
ITEM 12 – Exhibits
| (a)(1) | The Code of Ethics that is the subject of the disclosure required by Item 2 is attached as an exhibit hereto. |
| (a)(2) | The certifications required by Rule 30a-2 of the Investment Company Act of 1940 and Sections 302 and 906 of the Sarbanes-Oxley Act of 2002 are attached as exhibits hereto. |
SIGNATURES
Pursuant to the requirements of the Securities Exchange Act of 1934 and the Investment Company Act of 1940, the Registrant has duly caused this report to be signed on its behalf by the undersigned, thereunto duly authorized.
| THE INVESTMENT COMPANY OF AMERICA | |
| By /s/ James B. Lovelace | |
James B. Lovelace, Vice Chairman and Principal Executive Officer | |
| Date: February 27, 2015 |
Pursuant to the requirements of the Securities Exchange Act of 1934 and the Investment Company Act of 1940, this report has been signed below by the following persons on behalf of the Registrant and in the capacities and on the dates indicated.
| By /s/ James B. Lovelace |
James B. Lovelace, Vice Chairman and Principal Executive Officer |
| Date: February 27, 2015 |
| By /s/ Brian D. Bullard |
Brian D. Bullard, Treasurer and Principal Financial Officer |
| Date: February 27, 2015 |