Exhibit (1)
Description of
The Republic of Italy
The Republic of Italy
INCORPORATION OF DOCUMENTS BY REFERENCE
This document is The Republic of Italy's Annual Report on Form 18-K ("Annual Report") under the U.S. Securities Exchange Act of 1934 for the fiscal year ended December 31, 2020. All amendments to the Annual Report filed by The Republic of Italy on Form 18-K following the date hereof shall be incorporated by reference into this document. Any statement contained herein, or deemed to be incorporated by reference herein, shall be deemed to be modified or superseded for purposes of this document to the extent that a statement contained herein or in any other subsequently filed document that also is or is deemed to be incorporated by reference herein modifies or supersedes such statement. Any statement so modified or superseded shall not be deemed, except as so modified or superseded, to constitute a part of this document.
FORWARD-LOOKING STATEMENTS
As required by Form 18-K, The Republic of Italy's most recent budget is filed as an exhibit to this Annual Report. In addition, other Italian Government budgetary papers may from time to time be filed as exhibits to amendments to this Annual Report. This Annual Report, any amendments hereto and exhibits hereto contain or may contain budgetary papers or other forward-looking statements that are not historical facts, including statements about the Italian Government's beliefs and expectations for the forthcoming budget period. Forward-looking statements are contained principally in the sections titled "The Italian Economy", "Monetary System" and "Public Finance." Forward-looking statements can generally be identified by the use of terms such as "will", "may", "could", "should", "would", "expect", "intend", "estimate", "anticipate", "believe", "continue", "project", "aim" or other similar terms. These forward-looking statements include, but are not limited to, statements relating to:
| • | Italy's goals and strategies; |
| • | potential changes to Italy's legal and regulatory frameworks at the national, regional or municipal level, as well as changes to the European Union's legal, regulatory, and banking frameworks; |
| • | the expected timing of proposed legislation and Italy's ability to effectively implement such legislation; |
| • | the aims of certain legal, regulatory, and economic measures, and the impact of such measures on Italy's political and macroeconomic results and outlook, including with respect to projected government spending, economic growth, national, regional, municipal or local taxation levels, and deficit reductions; |
| • | expected or potential improvements to Italy's banking system and corporate governance regulations; |
| • | forecasts in respect of Italy's economy, including GDP growth, debt-to-GDP ratios and pension expenditures, as well as Italy's implementation of the related government-designed policies; |
| • | Italy's public finance objectives, macroeconomic and finance indicators forecasts, and the potential financial impact of the 2020 National Reform Programme; |
| • | Italy's ability to reduce its net borrowing, net structural borrowings, primary balances and public debts, and the expected timing of such reductions; |
| • | potential or expected improvements in Italy's capital position and capital ratios; |
1
| • | Italy's ability to increase its revenues through its proposed privatization program, and the expected timing thereof; |
| • | certain terms of bonds which may be potentially issued by The Republic of Italy; |
| • | Italy's inclusion in the European Financial Stability Facility and the European Stability Mechanism, The Republic of Italy's maximum commitment to such programs, and the expected timing of financings to any requesting countries; and |
| • | the availability of funding for European Union members from the European Central Bank, including through its asset-backed securities, covered bonds and euro-denominated securities purchase programs. |
Those statements are or will be based on plans, estimates and projections that are current only as of the original date of release by the Italian Government of those budgetary papers and speak only as of the date they are so made. The information included in those budgetary papers may also have changed since that date. In addition, these budgets are prepared for government planning purposes, not as future predictions, and actual results may differ and have in fact differed, in some cases materially, from results contemplated by the budgets or other forward-looking statements. Therefore, those forward-looking statements are not a guarantee of performance and you should not rely on the information in those budgetary papers or forward-looking statements. If the information included or incorporated by reference in this Annual Report differs from the information in those budgetary papers or forward-looking statements, you should consider only the most current information included in this Annual Report, any amendments hereto and exhibits hereto. Certain figures regarding prior fiscal years have been updated to reflect more recent data that were not previously available. You should read all the information in this Annual Report.
There are important factors that could cause actual outcomes to differ materially from those expressed or implied in the forward-looking statements. These factors include, but are not limited to:
| • | External factors, such as: |
| • | interest rates in financial markets outside Italy; |
| • | present and future exchange rates of the Euro; |
| • | the impact of changes in the credit rating of Italy; |
| • | the impact of changes in the international prices of commodities; and |
| • | the international economy, and in particular the rates of growth (or contraction) of Italy's major trading partners, including the United States. |
| • | Internal factors, such as: |
| • | general economic and business conditions in Italy; |
| • | the level of public debt, domestic inflation and domestic consumption; |
| • | the ability of Italy to effect key economic reforms; |
| • | increases or decreases in Italy's labor force participation and productivity; |
| • | the level of budget deficit and investments; |
| • | the strength of the banking sector; |
2
| • | the level of inventories; and |
| • | the level of foreign direct and portfolio investment. |
3
TABLE OF CONTENTS
| SUMMARY INFORMATION | 10 | |
| REPUBLIC OF ITALY | 13 | |
| Area and Population | 13 | |
| Coronavirus Pandemic | 16 | |
| Government and Political Parties | 20 | |
| The European Union | 23 | |
| Membership of International Organizations | 26 | |
| THE ITALIAN ECONOMY | 27 | |
| General | 27 | |
| Key Measures related to the Italian Economy | 29 | |
| Gross Domestic Product | 38 | |
| Principal Sectors of the Economy | 39 | |
| Role of the Government in the Economy | 40 | |
| Employment and Labor | 45 | |
| Prices and Wages | 46 | |
| Social Welfare System | 47 | |
| MONETARY SYSTEM | 50 | |
| Monetary Policy | 50 | |
| Exchange Rate Policy | 53 | |
| Banking Regulation | 53 | |
| Risk-Based Capital Requirements and Solvency Ratios | 57 | |
| Equity Participations by Banks | 58 | |
| Measures to assess the condition of Italian Banking System | 59 | |
| Credit Allocation | 60 | |
| Exchange Controls | 60 | |
| THE EXTERNAL SECTOR OF THE ECONOMY | 62 | |
| Foreign Trade | 62 | |
| Geographic Distribution of Trade | 64 | |
| Balance of Payments | 66 | |
| Current Account | 67 | |
| Capital Account | 68 | |
| Financial Account and the Net External Position | 68 | |
| Reserves and Exchange Rates | 70 | |
| PUBLIC FINANCE | 72 | |
| The Budget Process | 72 | |
| European Economic and Monetary Union | 73 | |
4
| Accounting Methodology | 75 | |
| Measures of Fiscal Balance | 75 | |
| The 2020 Economic and Financial Document | 77 | |
| The 2021 Economic and Financial Document | 82 | |
| Revenues and Expenditures | 87 | |
| Expenditures | 88 | |
| Revenues | 89 | |
| Government Enterprises | 91 | |
| PUBLIC DEBT | 93 | |
| General | 93 | |
| Summary of Internal Debt | 97 | |
| Summary of External Debt | 98 | |
| Debt Record | 101 | |
| TABLES AND SUPPLEMENTARY INFORMATION | 101 | |
5
_______________
Except as otherwise specified, all amounts are expressed in euro ("euro"). See "External Sector of the Economy—Reserves and Exchange Rates—U.S. Dollar/Euro Exchange Rate" for certain information concerning the exchange rate of the euro against the U.S. dollar and certain other currencies. We make no representation that the euro amounts referred to in this Annual Report could have been converted into U.S. dollars at any particular rate.
_______________
6
Defined Terms and Conventions
We use terms in this Annual Report that may not be familiar to you. These terms are commonly used to refer to economic concepts that are discussed in this Annual Report. Set forth below are some of the terms used in this Annual Report.
| • | Gross domestic product, or GDP, means the total value of products and services produced inside a country during the relevant period. |
| • | Imports and Exports. Imports are goods brought into a country from a foreign country for trade or sale. Exports are goods taken out of a country for trade or sale abroad. Data on imports and exports included in this Annual Report are derived from customs documents for non-European Union countries and data supplied by other Member States of the European Union. |
| • | The unemployment rate is calculated as the ratio of the members of the labor force who register with local employment agencies as being unemployed to the total labor force. "Labor force" means people employed and people over the age of 16 looking for a job. The reference population used to calculate the Italian labor force in this Annual Report consists of all household members present and resident in Italy and registered with local authorities. |
| • | The inflation rate is measured by the year-on-year percentage change in the general retail price index, unless otherwise specified. The European Union harmonized consumer price index ("HICP") is calculated on the basis of a weighted basket of goods and services taking into account all families resident in a given territory. Year-on-year rates are calculated by comparing the average of the twelve monthly indices for the later period against the average of the twelve monthly indices for the prior period. |
| • | Net borrowing, or government deficit, is consolidated revenues minus consolidated expenditures of the general government. This is the principal measure of fiscal balance for countries participating in the European Economic and Monetary Union and is calculated in accordance with the EU Protocol on Excessive Deficit Procedure, which implements the European System of Accounts ("ESA2010"). |
| • | Net borrowing-to-GDP, or deficit-to-GDP, means the ratio of net borrowing or government deficit to nominal GDP. |
| • | Debt-to-GDP means the ratio of public debt to nominal GDP. Public debt includes debt incurred by the central government (including Treasury securities and borrowings), regional and other local government, public social security agencies and other public agencies. |
| • | Primary balance is net borrowing less interest payments and other borrowing costs of the general government. The primary balance is used to measure the effect of discretionary actions taken to control expenditures and increase revenues. |
Unless otherwise indicated, we have expressed:
| • | all annual rates of growth as average annual compounded rates; |
| • | all rates of growth or percentage changes in financial data in constant prices adjusted for inflation; and |
| • | all financial data in current prices. |
7
Amounts included in this Annual Report are normally rounded. In particular, amounts stated as a percentage are normally rounded to the first decimal place. Totals in certain tables of this Annual Report may differ from the sum of the individual items in such tables due to rounding.
Information Sources
The source for most of the financial and demographic statistics for Italy included in this Annual Report is data prepared by Istituto Nazionale di Statistica, or ISTAT, an independent Italian public agency that produces statistical information regarding Italy (including GDP data), in particular financial and demographic statistics for Italy published in the Annual Report of ISTAT dated July 9, 2021 and appendices thereto (together the "2021 ISTAT Annual Report") and elaborations on such data and other data published in the Annual Report of the Bank of Italy (Banca d'Italia, Italy's central bank) dated May 31, 2021 and appendices thereto (together the "2021 Bank of Italy Annual Report"). We also include in this Annual Report information published by the Statistical Office of the European Communities or Eurostat.
Certain other financial and statistical information contained in this Annual Report has been derived from other Italian Government sources, including: (i) the economic and financial document of 2021 (Documento di Economia e Finanza 2021), dated April 15, 2021 (the "2021 Economic and Financial Document"), which includes the 2021 stability programme (the "2021 Stability Programme") filed by paper under cover of Form SE as Exhibit 15 to Amendment No. 3 to the Annual Report for the Fiscal year ended December 31, 2019 on April 23, 2021; (ii) the update of the 2021 Economic and Financial Document (Nota di Aggiornamento del Documento di Economia e Finanza 2021), dated September 29, 2021 (the "Update of the 2021 Economic and Financial Document"), attached as Exhibit 2 to this Annual Report (condensed English version of the Update of the 2021 Economic and Financial Document attached as Exhibit 3 to this Annual Report); and (iii) the Report on Public Debt in 2020 (Rapporto sul Debito Pubblico 2020), dated September 16, 2021 (the "2021 Report on Public Debt") attached as Exhibit 4 to this Annual Report.
Revised National Accounts
In 1999, ISTAT introduced a new system of national accounts in accordance with the new European System of Accounts (ESA95) as set forth in European Union Regulation 2223/1996. This system was intended to contribute to the harmonization of the accounting framework, concepts and definitions within the European Union. Under ESA95, all European Union countries apply a uniform methodology and present their results on a common calendar. Both state sector accounting and public sector accounting transactions are recorded on an accrual basis. Since introducing the ESA95 accounting system, ISTAT has published revisions to the national system of accounts, including replacing its methodology for calculating real growth, which had been based on a fixed base index, with a methodology linking real growth between consecutive time periods, or a chain-linked index.
Effective September 2014, ISTAT has adopted a new system of national accounts in accordance with the new European System of National and Regional Accounts (ESA2010) as set forth in European Union Regulation 549/2013. ESA2010 has introduced several key differences from its predecessor ESA95, reflecting certain developments in the methodological and statistical tools widely used at international level to measure modern economies. Unless otherwise provided in this Annual Report, Italy's GDP data were prepared in accordance with the ESA2010 accounting system. For additional information regarding Italy's accounting methodology, see "Public Finance—Accounting Methodology".
8
_______________
All references herein to "Italy," the "State" or the "Republic" are to The Republic of Italy, all references herein to the "Government" are to the central Government of The Republic of Italy and all references to the "general government" are collectively to the central Government and local government sectors and social security funds (those institutions whose principal activity is to provide social benefits), but exclude government owned corporations. In addition, all references herein to the "Treasury" or the "Ministry of Economy and Finance" are interchangeable and refer to the same entity.
_______________
9
SUMMARY INFORMATION
The following summary is qualified in its entirety by, and should be read in conjunction with, the more detailed information appearing elsewhere in this Annual report, any amendments hereto and annexes hereto.
Gross Domestic Product. According to International Monetary Fund estimates, the economy of Italy, as measured by 2020 GDP (at current prices in U.S. dollars), is the eighth largest in the world. In 2020, Italy's real GDP decreased by 8.9 per cent, compared to a 0.3 per cent increase in 2019. In the last ten years, Italy's GDP growth rate has generally been lower than the average GDP growth rate of the euro area. This trend reflects the persistence of several medium and long-term factors, including the difficulties in fully integrating southern Italian regions into the more dynamic economy of northern and central Italy, inadequate infrastructure, the incomplete liberalization process and insufficient flexibility of national markets. For additional information with respect to Italy's GDP, see "The Italian Economy—Gross Domestic Product".
The European Economic and Monetary Union. Italy is a signatory of the Treaty on European Union of 1992, also known as the "Maastricht Treaty," which established the European Economic and Monetary Union, or EMU, culminating in the introduction of a single currency. Eleven member countries, including Italy, met the government deficit, inflation, exchange rate and interest rate requirements of the Maastricht Treaty and were included in the first group of countries to join the EMU on January 1, 1999. On that date, conversion from each EMU member's old national currency into the euro was irrevocably fixed and the euro became legal tender. The euro was introduced in physical form in the countries participating in the EMU on January 1, 2002 and replaced national notes and coins entirely on February 28, 2002. On January 1, 1999, the exchange rate between the euro and Italian lire ("lira" or "lire") was irrevocably fixed at Lit. 1,936.27 per €1.00. On January 4, 1999, the noon buying rate for the euro as reported by the European Central Bank (the "Noon Buying Rate") was €1.00 for US$1.1789. On December 31, 2020, the European Central Bank ("ECB") exchange reference rate was €1.00 for US$1.2271. For additional information regarding the historic dollar/euro exchange rate, see "The External Sector of the Economy—Reserves and Exchange Rates".
Foreign Trade. Over half of Italy's exports and imports involve other European Union countries. Italy's main exports are manufactured goods, including industrial machinery, office machinery, automobiles, clothing, shoes and textiles. In recent years, Italy has recorded a trade surplus, increasing from €49.6 billion in 2016 to €56.1 billion in 2019. In 2020, the trade surplus was €63.6 billion, mainly boosted by the export of manufactured products, in particular production machinery, textiles, and leather products, and rubber, plastic, non-metallic mineral products, and by a decrease in imports of electrical energy, gas, steam, air conditioning.
Inflation. In 2020, Italy recorded an average deflation of 0.1 per cent measured by the harmonized EU consumer price index (HICP), compared to a 0.6 per cent inflation in 2019. Among other factors, the moderate deflation rate was caused by a decrease in prices of manufactured goods. The average increase in the price of both goods and services in 2020 was 0.4 per cent.
Public Finance. Italy has historically experienced substantial government deficits and high public debt. Countries participating in the EMU are required to reduce "excessive deficits", adopting budgetary balance as a medium-term objective, and to reduce public debt. Italy recorded net borrowing amounts as a percentage of GDP higher than the 3.0 per cent ratio imposed by the Maastricht Treaty in 2001 and each year during 2003-2006 and 2009-2011. Italy's deficit-to-GDP ratio was 2.4 per cent in 2016. Italy's net borrowing-to-GDP ratio was 9.5 per cent in 2020 and its debt-to-GDP ratio (gross of euro
10
area financial support) was 155.8 per cent in 2020. For additional information with respect to Italy's debt-to-GDP, see "The Italian Economy", "Public Finance".
The Italian Political System. Italy is a democratic republic. Italy is a civil law jurisdiction, with judicial power vested in ordinary courts, administrative courts and courts of accounts. The Government operates under a Constitution that provides for a division of powers among Parliament, the executive branch and the judiciary. Parliament comprises a Senate and a Chamber of Deputies. The executive branch consists of a Council of Ministers selected and headed by a Prime Minister. The Prime Minister is appointed by the President of the Republic and the Prime Minister’s government is confirmed by Parliament. The general Parliamentary elections held on March 4, 2018 resulted in no political party or coalition having a majority of either the Chamber of Deputies or the Senate. The center-right coalition, led by Lega, obtained the highest number of votes on a national level for the elections of both the Chamber of Deputies and the Senate, while Movimento 5 Stelle obtained the highest number of votes on a national level for an individual political party. After 89 days of consultations with the main political parties, and following a political agreement between Lega and Movimento 5 Stelle, on May 31, 2018 President Sergio Mattarella appointed Mr. Giuseppe Conte to form a new government, and Mr. Giuseppe Conte was sworn in as Prime Minister on June 1, 2018. In August 2019, Mr. Matteo Salvini called for a no confidence vote in the Prime Minister following a breakdown in the coalition between Lega and Movimento 5 Stelle. Preempting the no confidence vote, Mr. Giuseppe Conte tendered his resignation to President Sergio Mattarella on August 20, 2019. After nine days of consultations with the main political parties, and following a political agreement between Movimento 5 Stelle and Partito Democratico, on August 29, 2019, Mr. Giuseppe Conte was re-appointed as Prime Minister by President Sergio Mattarella, and was sworn in on September 5, 2019. In January 2021, the second Government lead by Mr. Giuseppe Conte faced a crisis. After some days of consultations, Mr. Conte resigned as Prime Minister and on February 2, 2021, President Mattarella invited Mr. Mario Draghi, former head of the European Central Bank, to form a new Government. The coalition Government under Mr. Draghi currently has the support of the following six political parties: Movimento 5 Stelle; Lega; Forza Italia; Partito Democratico; Italia Viva; Articolo Uno. Mr. Draghi has held office as Prime Minister since February 13, 2021.
2020 Developments. As a result of the outbreak of Coronavirus in Italy, the Government has enacted a number of measures aimed at preventing the spread of the virus, reducing the burden on the national health system, mitigating the negative economic effects of Coronavirus and supporting the Italian economy throughout the Coronavirus pandemic. For additional information regarding measures adopted by Italy in connection with the Coronavirus pandemic, see “Republic of Italy—Coronavirus Pandemic.” In addition to the measures adopted by Italy in connection with the Coronavirus pandemic, other measures adopted by the Government in 2020 included the Decrees of the Ministry of Education No. 24 of June 5, 2020, No. 28 of June 9, 2020, and No. 72 of July 25, 2020, granting financial support to local authorities for the development and implementation of school expansion plans in certain areas of Central Italy affected by earthquakes in 2016 and 2017.
2021 Developments. In addition to the measures adopted by Italy in connection with the Coronavirus pandemic, in 2021 the Government adopted a series of measures including:
| • | Law Decree No. 56 of April 30, 2021, (i) extending from June 30 to December 31, 2021 the term during which the Government may prohibit or impose conditions on the acquisition of strategic Italian businesses by non-Italian acquirers; and (ii) extending the term for filing financial statements with the competent Chamber of Commerce for certain categories of companies. This Law Decree was not subsequently converted into law; and |
11
| • | Law Decree No. 99 of June 30, 2021, enacted to implement rules regulating individual dismissals for business-related reasons following the expiration of the grace period during which dismissal procedure were suspended. Further, Law Decree No. 99 introduced certain provisions regarding the use of electronic payment methods, such as allocating cash reimbursements for purchases made through the use of electronic payment methods (so-called cash back). This Law Decree was not subsequently converted into law. |
Rating of the Republic of Italy's Indebtedness. As of the date hereof, the Republic of Italy's long-term credit is rated BBB with stable outlook by Standard & Poor's, BBB- with stable outlook by Fitch Ratings and Baa3 with stable outlook by Moody's.
12
REPUBLIC OF ITALY
Area and Population
Geography. Italy is situated in south central Europe on a peninsula approximately 1,200 kilometers (745.645 miles) long and includes the islands of Sicily and Sardinia in the Mediterranean Sea and numerous smaller islands. To the north, Italy borders on France, Switzerland, Austria and Slovenia along the Alps, and to the east, west and south it is surrounded by the Mediterranean Sea. Italy’s total area is approximately 302,068 square kilometers (116,629 square miles), and it has 8,970 kilometers (5,574 miles) of coastline. The independent States of San Marino and Vatican City, whose combined area is approximately 61 square kilometers (24 square miles), are located within the same geographic area. The Apennine Mountains running along the peninsula and the Alps north of the peninsula give much of Italy a rugged terrain.
The following is a map of the European Union and the countries, including Italy, within the Euro area.
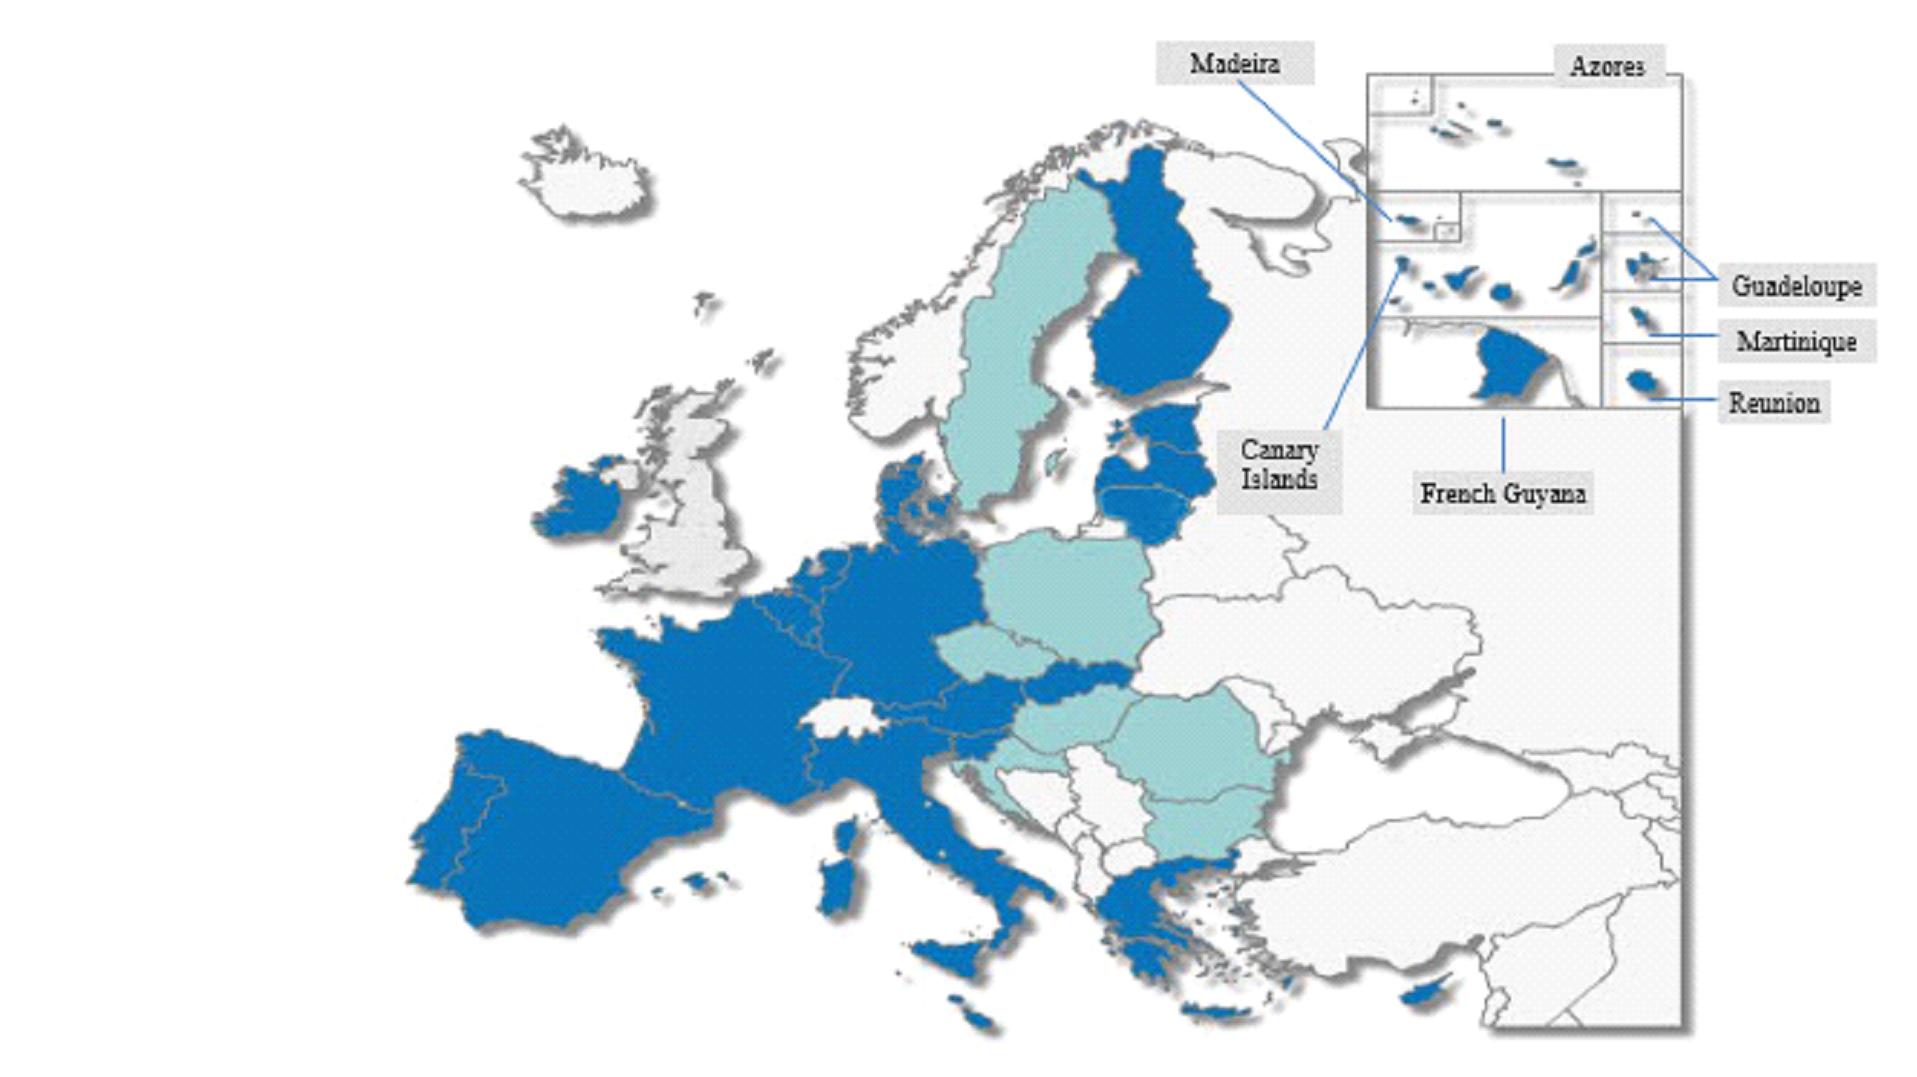
13
The following is a map of Italy.
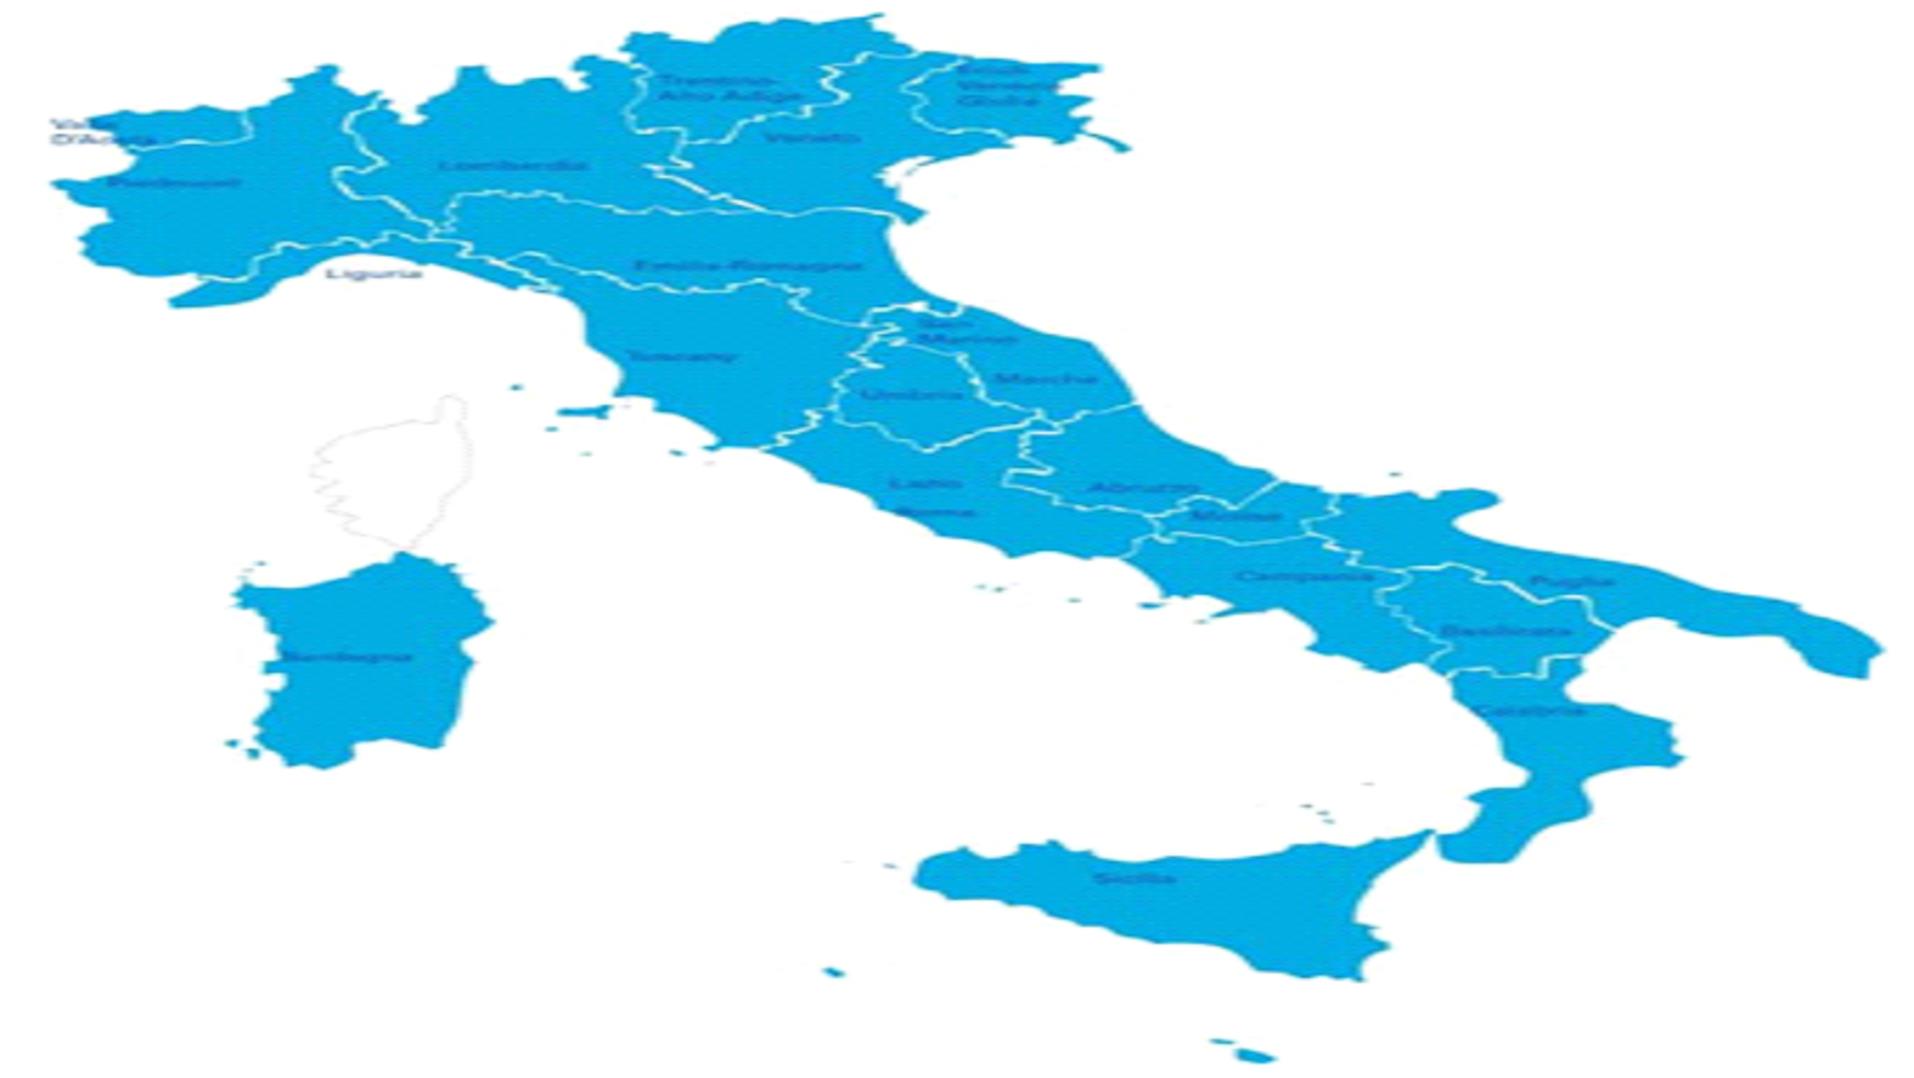
Population. According to ISTAT data, as of December 31, 2020, Italy’s resident population was estimated to be approximately 59.258 million, accounting for approximately 13.3 per cent of the EU population, compared to approximately 59.642 million as of December 31, 2019. Italy is the third most populated country in the EU after Germany and France.
According to ISTAT data, as of December 31, 2020, the six regions in the southern part of the peninsula together with Sicily and Sardinia, known as the Mezzogiorno, had a population of approximately 20.1 million. As of the same date, northern and central Italy had a population of approximately 27.5 million and 11.8 million respectively.
As of December 31, 2020, the breakdown of the resident population by age group was as follows:
| • | under 20 | 17.6 per cent |
| • | 20 to 39 | 21.6 per cent |
| • | 40 to 59 | 30.7 per cent |
| • | 60 and over | 30.1 per cent |
Source: ISTAT.
Italy’s fertility rate is one of the lowest in the world, while life expectancy for Italians is among the highest in the world. The average age of the resident population is increasing, mainly due to resident population decreasing in recent years.
Rome, the capital of Italy and its largest city, is situated near the western coast approximately halfway down the peninsula, and had a population of approximately 4.23 million as of December 31,
14
2020. The next largest cities are Milan, with a population of approximately 3.25 million, Naples, with approximately 3.02 million inhabitants, and Turin, with approximately 2.21 million inhabitants. Based on ISTAT data, as of December 31, 2020, population density was approximately 196.2 persons per square kilometer.
According to ISTAT data, as of December 31, 2020, there were approximately 5.0 million foreigners holding permits to live in Italy, a 0.1 per cent decrease from December 31, 2019. Immigration legislation has been the subject of intense political debate since the early 1990s. Since 2002, Italy has tightened its immigration laws through Law No. 189 of July 30, 2002 (Legge Bossi-Fini), and in the past decade initiated bilateral agreements with several countries for cooperation in identifying illegal immigrants. In addition to measures aimed at controlling illegal immigration, the Government has also introduced measures aimed at regularizing the position of illegal immigrants, such as Legislative Decree No. 109 of July 16, 2012 and Law Decree No. 76 of June 28, 2013 (converted into Law No. 99 of August 9, 2013), and Law Decree No. 130 of October 21, 2020 (converted into Law No. 173 of December 18, 2020). While these legislative efforts have resulted in the regularization of large numbers of illegal immigrants, Italy continues to have a relatively large number of foreigners living in Italy illegally.
In 2020, approximately 130 thousand people – refugees, displaced persons and other migrants –made their way to Europe, impacting transit countries, such as Italy and Greece. This represented a decrease by approximately 10 thousand people from 140 thousand people arriving in 2019, and by 20 thousand people from 150 thousand people arriving in 2018. The relative decrease in 2020 compared with previous years was mostly due to a drop in migrants arriving to Europe through the Central and Western Mediterranean routes. By contrast, detections on the Eastern Mediterranean, Western Balkan and Western African routes recorded significantly higher numbers than in 2019.
The EU's Common European Asylum System (EU Regulation No. 439/2010) regulates the allocation of asylum applications among Member States. On June 26, 2013, the EU introduced the so-called Dublin Regulation (EU Regulation No. 604/2013) providing for criteria and mechanisms for determining the Member State responsible for examining an application for international protection lodged in one of the Member States by a third-country national or a stateless person. In May 2016, the European Commission submitted proposals to amend the Dublin Regulation. To this end, the European Commission proposed the introduction of a structured EU resettlement framework, also known as the Common European Asylum System (CEAS).
In July 2019, to overcome the difficult negotiation process of the 2016 Common European Asylum System (CEAS) package, the European Commission’s President-designate von der Leyen announced the development of a New Pact on Migration and Asylum, which is to provide a comprehensive approach to migration and asylum to be implemented over the lifetime of the new Commission, covering all aspects including external borders, systems for asylum and return, the Schengen area of free movement, creating legal pathways for migration, and working with partners outside the EU. Significant legal instruments were also adopted including the updated European Border and Coast Guard Regulation (EU Regulation No. 2019/1896) and two Interoperability Regulations (EU Regulation No. 2019/817 and EU Regulation No. 2019/818) which provide for an interoperability framework between EU information systems respectively in the field of border and visas as well as in the field of police and judicial cooperation, asylum and migration. As a result of the Coronavirus pandemic, including its effects on travel and migratory flows, the European Commission proposed a new regulation entitled Regulation on Asylum and Migration Management (EU Regulation No. 2020/613). The new proposed regulation aimed to broaden the scope of the current regulations beyond determining the responsible Member State and establishing a common framework that contributes a comprehensive approach to migration management, also harmonizing policy‑making activities in the field.
15
In 2020, approximately 34,100 immigrants arrived illegally in Italy by sea, compared to approximately 11,500 and 23,400 arriving illegally in 2019 and 2018, respectively. This is due in part to the increase in the number of immigrants from North Africa entering Europe through the Central and Western Mediterranean routes.
As of September 30, 2021, the Government hosted approximately 80,000 migrants. The number of Asylum seekers has continued to decrease in 2020, with the number of applications falling from 43,770 in 2019 to 26,535 in 2020.
Coronavirus Pandemic
On December 31, 2019, the World Health Organization (“WHO”) was informed of cases of pneumonia of unknown cause in Wuhan City, China. In early January 2020, Chinese authorities identified the cause of these as a novel Coronavirus, temporarily named 2019-nCov and now identified as SARS‑CoV-2, with COVID-19 being the name of the disease associated with the Coronavirus. On March 11, 2020, the WHO announced that the outbreak could be characterized as a global pandemic.
As of September 30, 2021, Italy reported 4,672,355 cases of Coronavirus and 130,921 deaths related to COVID-19.
Government measures enacted in response to Coronavirus – “phase 1”. As a result of the outbreak of Coronavirus in Italy, on January 31, 2020, the Government declared a state of emergency which was subsequently extended on multiple occasions until December 31, 2021. In addition, since February 2020, the Government has enacted a number of measures aimed at preventing the spread of the virus, reducing the burden on the national health system, mitigating the negative economic effects of Coronavirus and supporting the Italian economy throughout the pandemic, including what follows:
| • | On February 23, 2020, the Government enacted Law Decree No. 6 (“Law Decree No. 6/2020”), converted into Law No. 13 of March 5, 2020, introducing urgent measures to prevent the spread of Coronavirus. Law Decree No. 6/2020 gave government authorities the power to enact measures in a proportionate manner in connection with the development of the epidemiologic situation in relation to Coronavirus. Pursuant to Law Decree No. 6/2020, the Prime Minister enacted the Prime Minister Decree of February 23, 2020, applying lockdown measures to towns in the Lombardia and Veneto regions where a large number of cases of Coronavirus had manifested (the so-called “red zone”). The Ministry of Economy and Finance Decree of February 24, 2020 suspended tax payment and filing obligations for people and businesses resident in these towns. |
| • | On March 1, 2020, the Prime Minister enacted a Prime Minister Decree, introducing additional restrictions in the red zone. On March 4, 2020, the Prime Minister enacted a further Prime Minister Decree extending restrictions to the whole of Italy. |
| • | On March 2, 2020, the Government enacted Law Decree No. 9 containing urgent measures to support families, workers and businesses in connection with the Coronavirus pandemic. |
| • | On March 8, 2020, the Prime Minister enacted a further Prime Minister Decree introducing lockdown measures across northern Italy. The Prime Minister Decree also included financial support measures for certain businesses and self-employed people as well as mortgage holidays and the suspension of certain tax, utility and other payments. These measures were extended to the whole of Italy by the Prime Minister Decree of March 9, 2020 (the so-called Decreto Io Resto a Casa). On March 11, 2020, the Prime Minister extended the lockdown |
16
measures by a further Prime Minister Decree, providing for the closure of all retail, restaurant and beauty businesses, subject to limited exceptions.
| • | On March 11, 2020, the Government approved an amendment to the 2020 report to Parliament (relazione al parlamento per il 2020), to obtain Parliament’s consent for incurring an additional €13.75 billion in national debt in connection with the response to the Coronavirus pandemic. |
| • | On March 17, 2020, the Government enacted Law Decree No. 18 (the so-called Decreto Cura Italia, the “Cure Italy Decree”), converted into Law No. 27 of April 24, 2020, which included €25.0 billion of support measures to counter the Coronavirus pandemic. Measures introduced by the Cure Italy Decree included suspension of tax payments and related obligations, tax credits for certain businesses, suspension of civil and criminal proceedings, financial support to business and self-employed people including wage supplements, aid to businesses in sectors that had been particularly affected, including tourism, transport, entertainment, sport, restaurants and bars, suspension of employee dismissals, cash payments to certain employees and self-employed persons, mortgage holidays for first homes for certain workers and protection from eviction, encouraging remote working, support for working families with children, funding for remote learning including the provision of the necessary tech to certain students, funds for the production of face masks, financial support measures for SMEs including state guarantees for certain loans, as well as additional funding for public services, the healthcare system and medical workers’ salaries. |
| • | On March 20 and 22, 2020, the Health Minister enacted two Ordinances and on March 22, 2020 the Prime Minister adopted a Prime Minister Decree further strengthening the lockdown measures. On March 25, 2020, the Government introduced Law Decree No. 19 (converted into Law No. 35 of May 22, 2020), which partly repealed Law Decree No. 6/2020 and expanded the list of lockdown measures that the government could enact. On April 10, 2020, these further lockdown measures were applied to the whole of Italy. |
| • | On April 8, 2020 the Government enacted Law Decree No. 23 (the so-called Decreto Liquidità, the “Liquidity Decree”), converted into Law No. 40 of June 5, 2020, aimed at generating further cashflow for businesses, delaying payment terms for certain taxes and other dues, and protecting businesses in strategic industries from takeovers. The measures introduced included an expansion of the so-called Golden Power, pursuant to which Italy may prohibit or impose conditions on the acquisition of strategic businesses by non-Italian acquirers. The Golden Power regime (first introduced by Law Decree No. 21 of March 15, 2012, converted into Law No. 56 of May 11, 2012) was extended to additional sectors that are deemed to be strategic, such as infrastructure and key basic goods, key technologies, food security, access to sensitive or personal information, freedom and plurality of the media and financial institutions, extending the application of the powers to any acquisition of strategic businesses by persons based in the EU until December 31, 2020. The Liquidity Decree also introduced a number of measures to address the effects of the Coronavirus pandemic on business, including state guarantees for business loans for up to €200.0 billion in total and additional provisions for SMEs including state loans, a moratorium on starting insolvency proceedings, delaying payment for business taxes and other dues, suspension of civil and administrative proceedings and certain criminal proceedings, additional support for hospitals which had to expand their intensive care units, and extending the mortgage holiday fund to include further beneficiaries. |
17
Easing of lockdown – “phase 2”. On April 26, 2020, the Prime Minister enacted a Prime Minister Decree effective as of May 4, 2020, easing certain restrictions which had been previously enforced, starting the so-called “phase 2 period”. The new measures permitted certain intra-regional travel and allowed certain businesses to reopen. Further restrictions were lifted on May 16, 2020 with the enactment of Law Decree No. 33 (the so-called Decreto Ripresa), converted into Law No. 74 of July 14, 2020, and Prime Minister Decree of May 17, 2020. The measures included the easing of travel restrictions, first within regions (effective as of May 18, 2020) and then both between regions and towards specific third countries, including all those in the Schengen Area and in the EU (effective as of June 3, 2020).
On May 19, 2020, the Government enacted Law Decree No. 34 (the so-called Decreto Rilancio, the “Restart Decree”), converted into Law No. 77 of July 17, 2020, introducing measures to counter the economic effects of the Coronavirus pandemic and to support households, businesses and self-employed people. The measures included: a fund for education aimed at workers changing roles, financial support to the self-employed, financial support to working families with children, financial support to low-income households, remote working as of right for households with small children, financial and tax support to businesses in the hospitality sector, delaying payment terms for business taxes and other dues, further financial support for workers made redundant, grants up to a value of €50,000 for certain businesses, reduced utilities, and tax credits for rent and sanitising costs for SMEs, hiring of additional teachers for the new school year, financial support to the healthcare system to hire additional nursing staff and expand intensive care units.
Previous restrictions were further eased by certain Prime Minister Decrees enacted on June 11, 2020 and July 14, 2020.
On August 14, 2020, the Government enacted Law Decree No. 104, amending, restating or supplementing measures previously introduced by the Cure Italy Decree and the Restart Decree. This Law Decree provided for additional €25.0 billion in support of economic recovery against the adverse effects of the Coronavirus pandemic, bringing the total amount of funds committed by the Government to counter the Coronavirus pandemic to approximately €100.0 billion (approximately 6.0 per cent of Italian GDP). Measures included additional financial support to businesses, particularly those in the hospitality, travel and tourism sectors, a suspension on the obligation to pay social security for certain businesses, continued suspension of employee dismissals, cash payments to certain households and workers in specific industries in the tourism sector, additional funding to the Restart Decree fund aimed at workers changing roles. The measures also included further relaxation of the payment terms for taxes for both individuals and businesses, as well as tax incentives and rebates for certain businesses, particularly in the entertainment and tourism sectors. Additional funding was also allocated to various local authorities, partly to make up for the shortfall in taxes as well as to support the implementation of anti-Coronavirus measures.
On August 12 and 16, 2020, the Health Minister enacted various ordinances, partly in response to an increase in cases of Coronavirus in Italy. The measures included ordering the closure of various businesses, stricter rules on wearing masks in public places, and compulsory testing for travellers arriving from certain countries.
On November 3, 2020, the Prime Minister enacted a further Prime Minister Decree pursuant to which the territory of the Republic of Italy was divided into areas labelled in three different colors - yellow, orange and red - depending on the level of concern for Coronavirus spread in the region. The most restrictive measures were reserved for regions with maximum severity risk (so-called red area); slightly less restrictive measures were reserved for regions at high risk (so-called orange area), and milder
18
restrictions were imposed on the third band (so-called yellow area) including all the remaining regions other than red and orange areas.
On November 9, 2020, the Government approved Law Decree No. 149 (the so-called Decreto Ristori-bis) which, inter alia, allocated approximately additional €2.5 billion to the restoration of the economic activities affected, directly or indirectly, by Coronavirus related restrictions and to the support of affected workers. On November 23, 2020 and November 30, 2020, the Government approved Law Decree No. 154 (so-called Decreto Ristori-ter) and Law Decree No. 157 (so-called Decreto Ristori-quarter), which allocated a further €1.95 billion and €8.0 billion, respectively, to the restoration of the economic activities affected, directly or indirectly, by the Coronavirus related restrictions and to the support of affected workers. None of these Law Decrees were subsequently converted into Law.
On December 3, 2020, the Prime Minister enacted a further Prime Minister Decree extending the restrictions among the different Italian regions and imposing stricter lockdown provisions over the Christmas period. The lockdown restrictions and the ban on intra-region and foreign travel were extended multiple times, until March 27, 2021. Law Decree No. 2 of January 14, 2021 (converted into Law No. 29 of March 12, 2021) extended the state of emergency to April 30, 2021, and provided for a plan for the rollout of the vaccination campaign across Italy.
On March 22, 2021, the Government enacted Law Decree No. 41 (the so-called Decreto Sostegni), converted into Law No. 69 of May 21, 2021, providing for financial measures totaling €32.0 billion, aimed at supporting the service sector. The measures included new grants for businesses which suffered a decline in turnover, further extensions and suspensions of tax payment terms, extension of financial support for furloughs, suspension of employee dismissals, financial support to the unemployed, additional funding for vaccines and drugs, and financial support for remote learning.
On April 22, 2021, the Government enacted Law Decree No. 52 (the so-called Decreto Riaperture), converted into Law No. 87 of June 17, 2021, which outlined the timeline for the progressive lifting of the restrictions previously imposed to face the Coronavirus pandemic.
On May 25, 2021, the Government enacted Law Decree No. 73, converted into Law No. 106 of July 23, 2021, to allocate approximately €40.0 billion to contain the social and economic impact of the Coronavirus related restrictions. The main areas of action included, inter alia: support for businesses; access to credit and business liquidity; support for the health sector; work and social policies; support to local authorities.
EU measures enacted in response to Coronavirus. On April 1, 2020, as part of its Coronavirus response, the European Parliament and Council approved the extension of the scope of the EU Solidarity Fund to include giving relief in the event of major health emergencies. The EU Solidarity Fund has €800.0 million at its disposal for 2020, to provide financial support to EU Member States affected by the Coronavirus pandemic. On April 27, 2020, Italy gave a preliminary notice to the EU of its intention to apply for relief from the fund. Applications to the EU Solidarity Fund closed on June 24, 2020 and the EU is currently reviewing these to determine the amount of funding to be granted to EU Member States that applied, with the amounts granted to be determined as a percentage of the money spent by EU Member States on medical, health sector and civil-protection-type measures to assist the public, as well as any measure taken to contain the Coronavirus pandemic.
On May 15, 2020, a credit line was put in place by the ESM (as defined below) to support Euro area countries in connection with the Coronavirus pandemic (the “ESM Credit Line”), with lower pricing than the ESM’s usual precautionary credit lines. Eligible states may borrow up to 2.0 per cent of their GDP as of the end of 2019, with drawing limited to a monthly maximum of 15.0 per cent of the
19
aggregate amount granted. Funds drawn from the ESM Credit Line may only be applied to financing of direct and indirect healthcare, cure and prevention related costs due to the Coronavirus pandemic and will be available until the end of 2022. As of the date of this report, Italy has not made use of the ESM Credit Line.
On May 19, 2020, the EU approved Council Regulation 2020/672 (“SURE Regulation”) which sets forth the legal framework for providing financial assistance in an aggregate amount of up to €100.0 billion to Member States which are experiencing, or are seriously threatened by, severe economic setbacks caused by the Coronavirus pandemic. Loans granted under the SURE Regulation, the terms of which are to be agreed in a loan agreement between the beneficiary Member State and the European Commission, are intended to help Member States to cover the costs related to the financing of national short-time work schemes and similar measures put in place at a national level in response to the Coronavirus pandemic, as well as health-related measures adopted by Member States so as to ensure a safe return to normal economic activity. On September 17, 2020, the EU approved a grant for Italy under the SURE Regulation for €27.4 billion, with a maximum average maturity of 15 years (the “SURE Facility”), which Italy has already received.
On February 11, 2021, the EU council adopted a regulation establishing a facility, the so-called Recovery and Resilience Facility, which was intended to be disbursed to Member States partly as loans and partly as grants. The total amount granted as of October 2021 is €723.8 billion. The overall EU recovery package to tackle the Coronavirus pandemic amounted to approximately €2,018 billion as of October 2021.
Government and Political Parties
Italy was originally a loose-knit collection of city-states, most of which united into one kingdom in 1861. It has been a democratic republic since 1946. The Government operates under a Constitution, originally adopted in 1948, that provides for a division of powers among the legislative, executive and judicial branches.
The Legislative Branch. Parliament consists of a Chamber of Deputies, with 630 elected members, and a Senate, with 315 elected members and a small number of life tenure Senators, currently six, consisting of former Presidents of the Republic and prominent individuals appointed by the President. Except for life Senators, members of Parliament are elected for five years by direct universal adult suffrage, although elections have been held more frequently in the past because the instability of multi-party coalitions has led to premature dissolutions of Parliament. The Chamber of Deputies and the Senate rank equally and have substantially the same legislative power. Any statute must be approved by both the Chamber of Deputies and the Senate before being enacted. Constitutional Law No. 1 of October 19, 2020 provides for a reduction in the number of members of the Chamber of Deputies, from 630 to 400 deputies, and of the Senate, from 315 to 200 senators.
The Executive Branch. The head of State is the President, elected for a seven-year term by an electoral college that includes the members of Parliament and 58 regional delegates. President Giorgio Napolitano was re-elected in April 2013 and resigned on January 14, 2015 before the end of his term in 2020. On January 31, 2015, Parliament along with 58 regional delegates elected Mr. Sergio Mattarella as the new President. The President nominates and Parliament confirms the Prime Minister, who is the effective head of government. The President has the power to dissolve Parliament. The Council of Ministers is appointed by the President on the Prime Minister’s advice. The Prime Minister and the Council of Ministers answer to the Chamber of Deputies and the Senate and must resign if Parliament passes a vote of no confidence in the administration. The Constitution also grants the President the power to appoint one-third of the members of the Constitutional Court, call general elections and lead the army.
20
The Judicial Branch. Italy is a civil law jurisdiction. Judicial power is vested in ordinary courts, administrative courts and courts of accounts. The highest ordinary court is the Corte di Cassazione in Rome, where judgments of lower courts of local jurisdiction may be appealed. The highest of the administrative courts, which hear claims against the State and local entities, is the Consiglio di Stato in Rome. The Corte dei Conti in Rome supervises the preparation of, and adjudicates, the State budget of Italy.
There is also a Constitutional Court (Corte Costituzionale) that does not exercise general judicial powers, but adjudicates conflicts among the other branches of government and determines the constitutionality of statutes. Each of the President, the Parliament (in joint session) and representatives of the highest civil and administrative courts appoint five members of the Constitutional Court, for a total of 15 members.
Criminal matters are within the jurisdiction of the criminal law divisions of ordinary courts, which consist of magistrates who either act as judges in criminal trials or are responsible for investigating and prosecuting criminal cases.
Political Parties. The main political parties are: (i) Movimento 5 Stelle, a non-aligned political party led by Mr. Giuseppe Conte, (ii) Lega, a right-wing political party led by Mr. Matteo Salvini, (iii) Partito Democratico, a center-left political party led by Mr. Enrico Letta, (iv) Forza Italia, a center-right political party led by Mr. Silvio Berlusconi, (v) Fratelli d’Italia, a center-right political party led by Ms. Giorgia Meloni, and (vi) Italia Viva, a liberal party led by Mr. Matteo Renzi.
The general Parliamentary elections held on March 4, 2018 resulted in no political party or coalition having a majority of either the Chamber of Deputies or the Senate. The center-right coalition, led by Lega, obtained the highest number of votes on a national level for the elections of both the Chamber of Deputies and the Senate, while Movimento 5 Stelle obtained the highest number of votes on a national level for an individual political party.
After 89 days of consultations with the main political parties, and following a political agreement between Lega and Movimento 5 Stelle, on May 31, 2018 President Sergio Mattarella appointed Mr. Giuseppe Conte to form a new government, and Mr. Giuseppe Conte was sworn in as Prime Minister on June 1, 2018.
In August 2019, Mr. Matteo Salvini called for a no confidence vote in the Prime Minister following a breakdown in the coalition between Lega and Movimento 5 Stelle. Preempting the no confidence vote, Mr. Giuseppe Conte tendered his resignation to President Sergio Mattarella on August 20, 2019. After nine days of consultations with the main political parties, and following a political agreement between Movimento 5 Stelle and Partito Democratico, on August 29, 2019, Mr. Giuseppe Conte was re-appointed as Prime Minister by President Sergio Mattarella, and was sworn in on September 5, 2019.
In January 2021, the second Government lead by Mr. Giuseppe Conte faced a crisis. After some days of consultations, Mr. Conte resigned as Prime Minister and on February 2, 2021, President Mattarella invited Mr. Mario Draghi, former head of the European Central Bank, to form a new Government. The coalition Government under Mr. Draghi currently has the support of the following six political parties: Movimento 5 Stelle; Lega; Forza Italia; Partito Democratico; Italia Viva; Articolo Uno. Mr. Draghi has held office as Prime Minister since February 13, 2021.
21
Elections. Except for a brief period, since Italy became a democratic republic in 1946 no single party has been able to command an overall majority in Parliament, and, as a result, Italy has a long history of coalition governments.
On October 26, 2017, Parliament adopted Law No. 165, the new electoral law (so-called Rosatellum) that became effective on November 12, 2017 (the “2017 Electoral Law”). The 2017 Electoral Law provides for a mixed system of proportional and majority method with 35.0 per cent of seats awarded using a first past the post electoral system and 64.0 per cent of seats awarded using a proportional method, with one round of voting. As a result of the adoption of the 2017 Electoral Law, the 630 seats in the Chamber of Deputies are awarded as follows: (i) 232 seats are awarded through a first past the post vote in an equivalent number of single-member districts, (ii) 386 seats are awarded by vote based on regional proportional representation, and (iii) 12 seats are awarded by vote of Italians abroad. Excluding the life tenure Senators (currently six), who includes senators appointed at the discretion of the President, and former presidents of Italy, the 315 seats in the Senate are awarded as follows: (i) 109 seats are awarded through a first past the post vote in an equivalent number of single-member districts, (ii) 200 seats are awarded by vote based on regional proportional representation, and (iii) 6 seats are awarded by vote of Italians abroad. Both the Senate and the Chamber of Deputies are elected on a single ballot. Parties are not eligible for any seats unless they obtain at least 3.0 per cent of the total votes, while the minimum threshold for party coalitions is 10.0 per cent (on the assumption that at least one party in the coalition obtain at least 3.0 per cent of the total votes).
Regional and Local Governments. Italy is divided into 20 regions made up of 14 metropolitan areas, 80 provinces and 6 municipal consortia. The Italian Constitution reserves certain functions, including police services, education and other local services, for the regional and local governments. Following a Constitutional reform passed by Parliament in 2001, additional legislative and executive powers were transferred to the regions. Legislative competence that historically had belonged exclusively to Parliament was transferred in certain areas (including foreign trade, health and safety, ports and airports, transport network and energy production and distribution) to a regime of shared responsibility whereby the national government promulgates legislation defining fundamental principles and the regions promulgate implementing legislation. Furthermore, as to all areas that are neither subject to exclusive competence of Parliament nor in a regime of shared responsibility between Parliament and the regions, exclusive regional competence is conferred to a region upon its request, subject to Parliamentary approval. In July 2009, Italy adopted legislation designed to increase the fiscal autonomy of regional and local governments. Under the new system, lower levels of government are able to levy their own taxes and will have a share in central tax revenues, including income tax and value added tax. In addition, a “standard cost” for public services such as health, education, welfare and public transport has been determined to set budgets for local governments.
The Italian Constitution grants special status to five regions (Sicily, Sardinia, Trentino-Alto Adige, Friuli-Venezia Giulia and Valle d’Aosta) providing them with additional legislative and executive powers.
Referenda. An important feature of Italy’s Constitution is the right to hold a referendum to abrogate laws passed by Parliament. Upon approval, a referendum has the legal effect of annulling legislation to which it relates. Referenda cannot be held on matters relating to taxation, the State budget, the ratification of international treaties or judicial amnesties. A referendum can be held at the request of 500,000 signatories or five regional councils. In order for a referendum to be approved, a majority of the Italian voting population must vote in the referendum and a majority of such voters must vote in favor of the referendum.
22
Constitutional reforms can be approved by two thirds of the members of each of the Chamber of Deputies and the Senate. If a constitutional reform fails to be approved by this super majority, the relevant reform may be submitted to a popular referendum at the request of one-fifth of the members of either the Chamber of Deputies or the Senate, 500,000 petitioners or five regional councils. Unlike any other referendum, referenda called to amend the Constitution do not require a quorum of the majority of the Italian voting population to vote in such referenda.
On October 12, 2019, the Italian Government proposed a law amending the Constitution, reducing the number of members of the Chamber of Deputies from 630 to 400, and the number of elected Senators from 315 to 200. Pursuant to the Constitution, on January 10, 2020, 71 Senators requested that the constitutional law be put to a confirmatory referendum, with no quorum requirements for its validity. The purpose of the amendment is to improve the decision-making process in Parliament and to reduce costs (with savings estimated to be approximately €500 million per legislature). Voting for the confirmatory referendum was held on September 20 and 21, 2020 and received approval. Accordingly, the reduction will be effective as of the next parliamentary elections.
The European Union
Italy is a founding member of the European Economic Community, which now forms part of the European Union. Italy is one of the 27 current members of the EU together with Austria, Belgium, Bulgaria, Croatia, Cyprus, the Czech Republic, Denmark, Estonia, Finland, France, Germany, Greece, Hungary, Ireland, Latvia, Lithuania, Luxembourg, Malta, The Netherlands, Poland, Portugal, Romania, Slovakia, Slovenia, Spain and Sweden. The United Kingdom left the European Union on February 1, 2020.
The European Union is currently negotiating the terms and conditions of accession to the EU of the following candidate countries: Albania, North Macedonia, Montenegro, Serbia, and Turkey. Potential candidates are Bosnia and Herzegovina and Kosovo.
EU Member States have agreed to delegate sovereignty for certain matters to independent institutions that represent the interests of the union as a whole, its Member States and its citizens. Set forth below is a summary description of the main EU institutions and their role in the European Union.
The Council of the EU. The Council of the EU, or the Council, is the EU’s main decision-making body. It meets in different compositions by bringing together on a regular basis ministers of the Member States to decide on matters such as foreign affairs, finance, education and telecommunications. When the Council meets to address economic and financial affairs, it is referred to as ECOFIN. The presidency of the Council rotates amongst Member States every six months according to a pre-set order. Romania and Finland were in charge of the presidency of the Council from January 2019 to June 2019 and from July 2019 to December 2019 respectively. Croatia and Germany were in charge of the presidency of the Council from January 2020 to June 2020 and from July 2020 to December 2020. Slovenia is currently in charge of the presidency of the Council, while Portugal was in charge during the first half of the year.
The Council mainly exercises, together with the European Parliament, the European Union’s legislative function and promulgates:
| • | regulations, which are EU laws directly applicable in Member States; |
| • | directives, which set forth guidelines that Member States are required to enact by promulgating national laws; and |
23
| • | decisions, through which the Council implements EU policies. |
The Council also coordinates the broad economic policies of the Member States and concludes, on behalf of the EU, international agreements with one or more Member States or international organizations. In addition, the Council:
| • | shares budgetary authority with the European Parliament; |
| • | makes the decisions necessary for framing and implementing a common foreign and security policy; and |
| • | coordinates the activities of Member States and adopts measures in the field of police and judicial cooperation in criminal matters. |
Generally, decisions of the Council are made by qualified majority vote on a proposal by the Commission or the High Representative of the Union for Foreign Affairs and Security Policy. Starting from November 1, 2014, pursuant to changes enacted by the Treaty of Lisbon, qualified majority is achieved if:
| • | 55 per cent of Member States vote in favor (72 per cent in case the proposal is not coming from the Commission or from the High Representative); and |
| • | the proposal is supported by Member States representing at least 65 per cent of the total EU population. |
A minority of at least four Council members representing 35 per cent of the population may block a qualified majority vote.
The European Parliament. The European Parliament is elected every five years by direct universal suffrage. The European Parliament has three essential functions:
| • | it shares with the Council the power to adopt directives, regulations and decisions; |
| • | it shares budgetary authority with the Council and can therefore influence EU spending; and |
| • | it approves the nomination of EU Commissioners, has the right to censure the EU Commission and exercises political supervision over all the EU institutions. |
The latest EU election was held between May 23, 2019 and May 26, 2019, and Member State were allocated 751 (the maximum allowed under the EU treaties) seats in the European Parliament. Following the United Kingdom's withdrawal from the EU on January 31, 2020, the 73 seats previously allocated to the United Kingdom were reallocated, with 27 seats being redistributed to other countries and the remaining 46 being kept in reserve for potential future enlargements. This reallocation resulted in each Member State being allocated the following number of seats in the European Parliament starting from February 1, 2020:
| Austria ............................... | 19 | Latvia ................................. | 8 | |
| Belgium ............................. | 21 | Lithuania ............................ | 11 | |
| Bulgaria ............................. | 17 | Luxembourg ....................... | 6 | |
| Cyprus ............................... | 6 | Malta ................................. | 6 | |
| Croatia................................ | 12 | Netherlands ........................ | 29 |
24
| Czech Republic ................... | 21 | Poland ................................ | 52 | |
| Denmark ............................ | 14 | Portugal .............................. | 21 | |
| Estonia ............................... | 7 | Romania ............................. | 33 | |
| Finland ............................... | 14 | Slovakia ............................. | 14 | |
| France ................................ | 79 | Slovenia ............................. | 8 | |
| Germany ............................ | 96 | Spain .................................. | 59 | |
| Greece ................................ | 21 | Sweden .............................. | 21 | |
| Hungary ............................. | 21 | |||
| Ireland ................................ | 13 | |||
| Italy ................................... | 76 | Total .................................. | 705 |
The five largest political groups in the European Parliament as a result of the United Kingdom’s withdrawal from the EU are:
| • | the European People's Party (Christian Democrats), which comprises politicians of Christian democratic, conservative and liberal-conservative orientation, cumulatively representing approximately 25 per cent of the total seats; |
| • | the Progressive Alliance of Socialists and Democrats in the European Parliament, which is the political group of the Party of European Socialists, cumulatively representing approximately 21 per cent of the total seats; |
| • | Renew Europe, which comprises politicians of liberal-centrist orientation, cumulatively representing approximately 14 per cent of the total seats; |
| • | the Greens/European Free Alliance, which comprises primarily green and regionalist politicians, cumulatively representing approximately 10 per cent of the total seats; and |
| • | Identity and Democracy, which comprises politicians of nationalist orientation, cumulatively representing approximately 10 per cent of the total seats. |
In the European Parliamentary elections held in Italy on May 26, 2019, Lega, a right-wing political party, which is part of the Identity and Democracy coalition, won approximately 34 per cent of the votes increasing significantly the votes won in the 2018 Italian Parliamentary elections. Partito Democratico, a left-wing political party, remained the second largest party with approximately 23 per cent of the votes. Movimento 5 Stelle, which had come first in the 2018 Italian Parliamentary elections, fell to third place with approximately 17 per cent of the votes.
The European Commission. The European Commission traditionally upholds the interests of the EU as a whole and has the right to initiate draft legislation by presenting legislative proposals to the European Parliament and Council. Currently, the European Commission consists of 27 members, one appointed by each Member State for five year terms.
Court of Justice. The Court of Justice ensures that Community law is uniformly interpreted and effectively applied. It has jurisdiction in disputes involving Member States, EU institutions, businesses and individuals. A Court of First Instance has been attached to it since 1989.
Other Institutions. Other institutions that play a significant role in the European Union are:
25
| • | the European Central Bank, which is responsible for defining and implementing a single monetary policy in the euro area; |
| • | the Court of Auditors, which checks that all the European Union’s revenues has been received and that all its expenditures have been incurred in a lawful and regular manner and oversees the financial management of the EU budget; and |
| • | the European Investment Bank, which is the European Union’s financial institution, supporting EU objectives by providing long-term finance for specific capital projects. |
Membership of International Organizations
Italy is a member of the North Atlantic Treaty Organization (NATO), as well as many other regional and international organizations, including the United Nations and many of its affiliated agencies. Italy is one of the Group of Seven (G-7) industrialized nations, together with the United States, Japan, Germany, France, the United Kingdom and Canada, and a member of the Group of Twenty (G-20), which brings together the world’s major advanced and emerging economies, comprising the European Union and 19 country members. Italy is also a member of the Organization for Economic Co-operation and Development (OECD), the World Trade Organization (WTO), the IMF, the International Bank for Reconstruction and Development (World Bank), the European Bank for Reconstruction and Development (EBRD) and other regional development banks.
26
THE ITALIAN ECONOMY
General
According to IMF data, the Italian economy, as measured by 2020 GDP (at current prices in U.S. dollars), is the eighth largest in the world after the United States, the People’s Republic of China, Japan, Germany, the United Kingdom, India and France.
The Italian economy developed rapidly in the period following World War II as large-scale, technologically advanced industries flourished along with more traditional agricultural and industrial enterprises. Between 1960 and 1974, Italian GDP, adjusted for changes in prices, or “real GDP,” grew by an average of 5.2 per cent per year. As a result of the 1973-74 oil price shocks and the accompanying worldwide recession, output declined by 2.1 per cent in 1975, but between 1976 and 1980 real GDP again grew by an average rate of approximately 4.0 per cent per year. During this period, however, the economy experienced higher inflation, driven in part by wage inflation and high levels of borrowing by the Government. For the 1980s as a whole, real GDP growth in Italy averaged 2.4 per cent per year.
Italy’s economic growth slowed down substantially in the 1990s. Tighter fiscal policy, which followed the lira’s suspension from the Exchange Rate Mechanism in September 1992, led Italy’s economy into recession in 1993. The economy recovered in 1994; however, Italy’s GDP grew at a modest pace, an average of 1.6 per cent per year from 1996 through 1999, lagging behind those of other major European countries. This trend reflects the persistence of several medium and long-term factors, including the difficulties in fully integrating Southern Italian regions into the more dynamic economy of Northern and Central Italy, unfavorable export specialization in traditional goods, inadequate infrastructure, the incomplete liberalization process and insufficient flexibility of national markets. The slowness of the recovery in economic activity is due to shortcomings in the Italian productive economy that make it fragile in the new competitive environment. These deficiencies depend both on factors internal to firms, such as small size and the limitations of exclusive family control and on external factors, such as insufficient infrastructure, high tax rates combined with widespread tax evasion, an uncertain and complex regulatory framework and long administrative procedures.
Over the seven-year period from 2000 to 2007, average annual GDP growth in Italy was of 1.5 per cent compared to the average annual GDP growth of the euro area of 2.2 per cent. Between 2008 and 2015, as a result of the global financial and economic crisis, average annual GDP growth in Italy was negative 1.0 per cent compared to positive 0.3 per cent in the euro area. The table below shows the annual percentage change in real GDP growth for Italy and the countries participating in the EU and in the euro area, including Italy, for the period 2016 through 2020.
Annual Per Cent Change in Real GDP (2016-2020)
| 2016 | 2017 | 2018 | 2019 | 2020 | ||||||||||||||||
| Italy | 1.3 | 1.7 | 0.9 | 0.3 | (8.9 | ) | ||||||||||||||
EU(1) | 2.0 | 2.8 | 2.1 | 1.8 | (5.9 | ) | ||||||||||||||
Euro area(2) | 1.9 | 2.6 | 1.9 | 1.5 | (6.3 | ) | ||||||||||||||
________________________________
| (1) | The EU represents the 27 countries participating in the European Union. |
| (2) | The euro area represents the 19 countries participating in the European Monetary Union. |
Source: Bank of Italy and Eurostat.
In 2016, Italy’s GDP increased by 1.3 per cent compared to 2015, primarily due to fiscal and monetary policies adopted by the Government to support growth, and to a continued increase in domestic
27
demand from 2015. The decline in global commerce first measured in the second half of 2015 continued in the first half of 2016, with resulting low prices impacting GDP growth, partly offset by low financing costs, and leading to deflation. Domestic demand further increased, mainly due to a 1.9 per cent increase in disposable income.
In 2017, Italy’s GDP increased by 1.7 per cent compared to 2016, further consolidating the growth trend started in the second half of 2013. This increase in Italy’s GDP was mainly due to a general increase in global commerce, resulting in a 1.3 per cent increase in domestic demand and a 1.6 per cent increase in exports of goods and services. Exports, in particular, benefitted from lower increases in prices compared to Italy’s trading partners, offsetting the negative impact of the euro nominal exchange-rate appreciation.
In 2018, Italy’s GDP increased by 0.9 per cent compared to 2017, at a slower pace than expected and experiencing a stop in the last few months of the year. This was mainly due to both the slowdown in foreign sales and the weakening of national demand, which in the second half of the year affected investments (especially in capital goods) and, to a lesser extent, household spending.
In 2019, Italy’s GDP increased by 0.3 per cent compared to 2018, evidencing a further slow-down in the growth of Italian economy. This was mainly due to lower investments than in 2018 as a result of an increased uncertainty in the global economy, and a slowdown in disposable income.
In 2020, Italy’s GDP decreased by 8.9 per cent compared to 2019, mainly as a result of the contraction of global activities, exports and tourist inflows, as well as the reduction in internal mobility and consumption, due to the containment measures adopted in Italy and worldwide to face the Coronavirus pandemic. Uncertainty around the pandemic and its effects also caused a decline in business investments. For additional information regarding the key measures adopted by Italy in connection with the Coronavirus pandemic, see “Republic of Italy – Coronavirus Pandemic.”
In the past, the Government has historically experienced substantial government deficits. Among other factors, this has been largely attributable to high levels of social spending and the fact that social services and other non-market activities of the central and local governments accounted for a relatively significant percentage of total employment as well as high interest expense resulting from the size of Italy’s public debt. Countries participating in the European Economic and Monetary Union are required to reduce “excessive deficits” and adopt budgetary balance as a medium-term objective. For additional information on the budget and financial planning process, see “Public Finance—Measures of Fiscal Balance,” “Public Finance—Revenues and Expenditures” and, “Public Debt—Summary of External Debt—Excessive Deficit Procedure.”
A longstanding objective of the Government has been to control Italy’s debt-to-GDP ratio. However, largely due to the Coronavirus pandemic and the measures adopted by the Government to counter its effects, Italy’s debt-to-GDP ratio increased in 2020 to 152.3 per cent net of euro area financial support and 155.8 per cent gross of euro area financial support, while the primary deficit amounted to 6.0 per cent. Excluding the financial support provided to European Monetary Union (“EMU”) countries, the increase from 2019 was of 21.0 percentage points.
On September 23, 2019, the Bank of Italy announced that Italy’s debt-to-GDP ratio had been revised upwards for the previous years, due to a change in the methodology employed to calculate public debt at a European level, as set out in the Manual on Government Deficit and Debt published by Eurostat on August 2, 2019 (“Eurostat Manual”). The methodology change affected how interest on certain non-negotiable notes is accounted for. In Italy, this has mainly affected the accounting treatment of postal savings (Buoni Postali Fruttiferi) (“BPF”) issued up to 2001. BPFs are bearer instruments payable on
28
demand, on or prior to their maturity date; accrued interest on BPFs is paid on redemption, at the same time as the principal amount. Outstanding BPFs have maturity dates up to 2031 and their holders have up to ten years from the relevant maturity date to redeem BPFs. The Eurostat Manual requires that accrued interest on BPFs be taken into account when calculating their face value, rather than just when BPFs are redeemed. As of December 31, 2020, the outstanding BPFs had an aggregate principal amount and accrued interest of €10.5 billion and €52.6 billion, respectively.
Specific accounts were created by the Treasury in 2003 in order to fund BPF redemptions. As of December 31, 2020, approximately €42.6 billion had been set aside on these accounts.
According to Italy’s most recent estimates, Italy’s debt-to-GDP ratio, gross of euro area financial support, is expected to reach 156.5 per cent in 2021, 153.2 per cent in 2022, 152.0 per cent in 2023, and 149.9 per cent in 2024, respectively.
Historically, Italy has had a high savings rate, calculated as a percentage of gross national disposable income, which measures aggregate income of a country’s citizens after providing for capital consumption (the replacement value of capital used up in the process of production). Private sector savings as a percentage of gross national disposable income averaged 19.5 per cent in the period from 2001 to 2010. Private sector savings as a percentage of gross national disposable income were 19.6 per cent in 2019 and 25.5 per cent in 2020, respectively. Because of the historically high savings rate, the Government has been able to raise large amounts of funds through issuances of Treasury securities in the domestic market, with limited recourse to external financing. As of May 31, 2021, non-resident holders owned 30.0 per cent of the total outstanding government securities, while the Bank of Italy and resident holders owned 22.7 per cent and 47.3 per cent of the total outstanding government securities, respectively.
The Italian economy is characterized by significant regional disparities, with the level of economic development of Southern Italy usually below that of Northern and Central Italy. In 2019, the per capita GDP in Southern Italy, also known as the Mezzogiorno, increased by 0.2 per cent. GDP increased by 0.4 per cent and 0.5 per cent in the North West and the North East of Italy, respectively, while GDP in the Centre of Italy increased by 0.2 per cent. The marked regional divide in Italy is also evidenced by significantly higher unemployment in the Mezzogiorno. For additional information on Italian employment, see “—Employment and Labor.”
In 2020, following a 0.7 per cent average harmonized inflation in 2019, Italy recorded a 0.2 per cent average harmonized deflation as measured by the HICP.
Key Measures related to the Italian Economy
Since 2009, the Government has acted to limit the effects of the global crisis, support the economy and facilitate its recovery. The Government also injected significant liquidity into the financial system by accelerating payment of past debts and reducing the accrual of tax refunds. During the years 2009 to 2017, the Government adopted a series of measures aimed at increasing Government receipts, reducing Government spending, fighting tax evasion, reforming the Italian banking system, simplifying the public administration, sustaining the economic and financial growth of Italy, achieving the financing targets adopted by the EU and balancing the general government’s budget.
29
Measures adopted in 2018
During 2018, the Government adopted a series of measures aimed at improving, among other things, the flexibility of Italy’s labor market. The main measures adopted by the Government in 2018 comprised, inter alia:
| • | Law Decree No. 38 of April 27, 2018 (converted into Law No. 77 of June 21, 2018), extending the term for repayment of the bridge loan to Alitalia to December 15, 2018, and Law Decree No. 135 of December 14, 2018 (converted into Law No. 12 of February 11, 2019), which further extended the maturity of the bridge loan to the earlier of the date falling 30 days after completion of a sale of Alitalia, and June 30, 2019; |
| • | Law Decree No. 87 of July 12, 2018 (so-called Decreto Dignità) (converted into Law No. 96 of August 9, 2018), which reduced the maximum term applicable to fixed-term employment contracts to 24 months, increased minimum compensation for wrongful dismissals, introduced fines for companies relocating abroad after having received State aid, increased employer social contributions and abolished the so-called split payment for professionals; and |
| • | Law Decree No. 91 of July 25, 2018 (converted into Law No. 108 of September 21, 2018), which extended the culture bonus program for young Italians until the end of 2018, and introduced a new 180 days deadline for small co-operative banks to adhere to the ‘cohesion contracts’ introduced for co-operative banking groups. |
On December 30, 2018, Parliament approved the stability law for 2019 and the budget law for 2019-2021 through Law No. 145 of December 30, 2018 (the “2019 Budget”). The 2019 Budget includes measures for the introduction of a basic universal income (so-called Reddito di Cittadinanza), a flat tax rate and certain changes to the pensions system (so-called Quota Cento).
Measures adopted in 2019
During the first months of 2019, the Government adopted Law Decree No. 4 of January 28, 2019 (converted into Law No. 26 of March 28, 2019), aimed at implementing some of the key measures included in the 2019 Budget, namely:
Reddito di Cittadinanza, a basic universal income aimed at preventing poverty and social disparity. This measure will allow people with low income to apply for the so-called assegno di cittadinanza, a monetary support of up to €500 per month, and a contribution for accommodation of up to €150 per month for citizens owning a property that is subject to a mortgage and up to €280 per month for citizens renting (but not owning) a property, respectively.
Quota Cento, allowing people to qualify for an early retirement. The measure will allow workers with at least 62 years of age and 38 years of social contribution to the national pension fund to apply for retirement.
On April 18, 2019, the Government adopted Law Decree No. 32 (the so-called Decreto Sblocca Cantieri, the “Decree Favoring Construction”), converted into Law No. 55 of June 14, 2019, aimed at fostering economic growth by reviving public investment. In particular, the Decree Favoring Construction aims at incentivizing investment in public infrastructure and construction sites through several measures designed to facilitate the public procurement process. These measures include the implementation of simplified bidding procedures to counter the difficulties faced by firms, especially smaller sized ones, when participating in public procurement. Moreover, the Decree Favoring Construction includes ad hoc
30
measures aimed, among other things, at facilitating and promoting the reconstruction of those areas of Italy that have been affected by earthquakes, reconstructing the Morandi bridge in Genoa which collapsed on August 14, 2018 (reconstruction was completed on August 3, 2020), and simplifying the authorization process for the construction of waste facilities in Rome.
On April 30, 2019, the Government adopted Law Decree No. 34 (the so-called Decreto Crescita, the “Growth Decree”),converted into Law No. 58 of June 28, 2019, aimed at fostering the economic growth of the country. The Growth Decree includes:
| 1) | fiscal measures such as: (i) reduced corporate income tax rates; (ii) measures allowing companies and professionals to apply a higher base price for capital goods for depreciation purposes; (iii) additional deductions on tax payable on real estate; (iv) reduced income tax rates for certain categories of Italian citizens moving their tax residence to Italy from abroad; |
| 2) | financial measures such as: (i) measures intended to simplify the securitization process of non-performing loans; (ii) the introduction of simplified investment companies with fixed capital; and (iii) simplified regulation for companies operating in the financial technology sector; |
| 3) | measures intended to promote private investments such as measures extending the circumstances in which small and medium enterprises (or SME) can access the SMEs Protection Fund; and |
| 4) | measures aimed at protecting “made in Italy” including: (i) the creation of a fund for venture capital investments into entities that own or license historical Italian brands; and (ii) provisions for the protection of Italian products against Italian sounding (i.e., the practice of using names, images, geographical indications or brands reminiscent of Italy in marketing products which have no connections with Italy). |
On December 27, 2019, Parliament approved the stability law for 2020 and the budget law for 2020-2022 through Law No. 160 of December 27, 2019 (the “2020 Budget”). The 2020 Budget includes measures for the reduction of labor taxes and the promotion of investments in the environmental, social and welfare sectors.
Measures adopted in 2020
In addition to the measures adopted by Italy in connection with the Coronavirus pandemic (see “Republic of Italy—Coronavirus Pandemic”), other measures adopted by the Government in 2020 included the Decrees of the Ministry of Education No. 24 of June 5, 2020, No. 28 of June 9, 2020, and No. 72 of July 25, 2020, granting financial support to local authorities for the development and implementation of school expansion plans in certain areas of Central Italy affected by earthquakes in 2016 and 2017.
On December 30, 2020, Parliament approved the stability law for 2021 and the budget law for 2021-2023 through Law No. 178 of December 30, 2020 (the “2021 Budget”). The 2021 Budget allocates funds to the healthcare sector for hiring medical personnel and healthcare workers, and includes measures aimed at stimulating the job market, such as offering certain tax incentives for hiring young people (up to 35 years of age) and women (with no age limits). Furthermore, €5.0 billion have been allocated to fund certain tax exemptions granted to private employers hiring employees in the South of Italy, and a new social safety net, the Extraordinary Indemnity for Income and Operational Continuity (ISCRO), has been
31
introduced granting protection to those registered for VAT within a separate contribution regime (partite Iva in gestione separata).
Measures adopted in 2021
In addition to the measures adopted by Italy in connection with the Coronavirus pandemic (see “Republic of Italy—Coronavirus Pandemic”), in 2021, the Government adopted a series of measures including:
| • | Law Decree No. 56 of April 30, 2021, (i) extending from June 30 to December 31, 2021 the term during which the Government may prohibit or impose conditions on the acquisition of strategic Italian businesses by non-Italian acquirers; and (ii) extending the term for filing financial statements with the competent Chamber of Commerce for certain categories of companies. This Law Decree was not subsequently converted into law; |
| • | Law Decree No. 99 of June 30, 2021, enacted to implement rules regulating individual dismissals for business-related reasons following the expiration of the grace period during which dismissal procedure were suspended. Further, Law Decree No. 99 introduced certain provisions regarding the use of electronic payment methods, such as allocating cash reimbursements for purchases made through the use of electronic payment methods (so-called cash back). This Law Decree was not subsequently converted into law. |
Financial Assistance to EU Member States
The EFSF. In June 2010, the EU Member States created the European Financial Stability Facility (the “EFSF”) whose objective is to preserve financial stability of Europe’s monetary union by providing temporary assistance to euro area Member States. In order to fund any such assistance, the EFSF has the ability to issue bonds or other debt instruments in the financial markets. Such debt is guaranteed by the Member States on a several basis based on each Member State’s participation in the ECB’s share capital. Initially, the limit to these guarantees (and therefore of the facility itself) was capped at €440.0 billion. Italy’s share of the EFSF is approximately 19.0 per cent. Financing granted by the EFSF increases the public debt of the participating countries proportionally to the share of the EFSF.
The EFSF financing is combined with the financing granted under the European Financial Stabilization Mechanism (the “EFSM”), a €60.0 billion facility organized by the European Commission, and additional financings from the IMF. The EFSM allows the European Commission to borrow in financial markets on behalf of the Union and then lend the proceeds to the beneficiary Member State. All interest and loan principal is repaid by the beneficiary Member State via the European Commission. The EU budget guarantees the repayment of the bonds in case of default by the borrower. The EFSF, EFSM and IMF can only act after a request for support is made by a euro area Member State and a country program has been negotiated with the European Commission and the IMF. As a result, any financial assistance by the EFSF, EFSM and IMF to a country in need is linked to strict policy conditions. The EFSF and EFSM could only grant new financings until June 2013; after this date, only existing financings could be administered.
A set of measures designed to expand the EFSF’s role were approved during the course of 2011: (i) the cap to guarantees provided by the euro area countries was increased from €440.0 billion to €780.0 billion; (ii) the facility was authorized to make purchases of Member States’ government bonds in the primary and secondary markets; (iii) it was authorized to take action under precautionary programs and to finance the recapitalization of financial institutions; and (iv) it was allowed to use the leverage options
32
offered by granting partial risk protection on new government bond issues by euro area countries and/or by setting up one or more vehicles to raise funds from investors and financial institutions.
The ESM. From July 2013, the European Stability Mechanism (“ESM”), a facility with lending capacity of €500.0 billion, has assumed the role of the EFSF and the EFSM. The ESM has a subscribed capital of €700.0 billion, of which €80 billion is in the form of paid-in capital provided by the euro area Member States and €620.0 billion as committed callable capital and guarantees from euro area Member States, who have committed to maintain a minimum 15.0 per cent ratio of paid-in capital to outstanding amount of ESM issuances in the transitional phase from 2013 to 2017. Italy’s maximum commitment to the ESM is approximately €125.3 billion. The ESM will grant financings to requesting countries in the euro area under strict conditions and following a debt sustainability analysis.
On February 2, 2012, a number of revisions were made to the treaty instituting the ESM. Its entry into force was brought forward by one year, to July 2012, and the voting rules were amended to allow decisions to be taken by a qualified majority of 85 per cent in certain circumstances. This majority rule can be invoked in place of the requirement of unanimous decisions if the European Commission and the ECB determine that financial assistance measures need to be taken urgently and in the interests of the euro area’s financial and economic stability. Furthermore, as in the case of the EFSF, the ESM has additional means available to it to support countries in difficulty: it can purchase member countries’ government bonds, both directly or on the secondary market, and is allowed greater flexibility in its direct purchases of government bonds; it can take action under precautionary programs; and it can finance the recapitalization of financial institutions. Finally, in order to strengthen investors’ confidence in the new arrangements, on March 30, 2012, the EU announced that the ESM’s endowment capital would be paid up by 2014 instead of 2017 as originally planned. It was also agreed that as of July 2012 the ESM has become the main instrument for financing new support packages. The EFSF will continue to operate until existing financing arrangements terminate. Total EFSF loans (in net disbursed terms) amounted to €172.6 billion as of October 2020, including €130.9 billion to Greece, €24.0 billion to Portugal, and €17.7 billion to Ireland. For information regarding ESM measure adopted in connection with the Coronavirus pandemic, see “Republic of Italy—Coronavirus Pandemic.”
The EU Solidarity Fund. In 2002, the EU Solidarity Fund was originally set up to respond to major natural disasters within Europe. The fund was created as a reaction to the severe floods in Central Europe in the summer of 2002. Since then, it has been used for 80 natural disasters covering a range of different catastrophic events including floods, forest fires, earthquakes, storms and drought. The fund can provide financial aid if total direct damage caused by a disaster exceeds €3.0 billion (at 2011 prices) or 0.6 per cent of an EU country’s gross national income (GNI), whichever is lower, or for more limited regional disasters, the eligibility threshold is 1.5 per cent of the region’s gross domestic product (GDP), or 1.0 per cent for an outermost region. On September 11, 2020, the European Commission announced that it had granted €211.7 million from the EU Solidarity Fund to Italy, following the extreme weather damages in late October and November 2019. The grant will finance retroactively the restoration of vital infrastructures, measures to prevent further damage and to protect cultural heritage, as well as cleaning operations in the affected areas. For information regarding the extension of the scope of the EU Solidarity Fund in connection with the Coronavirus pandemic, see “Republic of Italy—Coronavirus Pandemic.”
Quantitative Easing. On January 22, 2015, the ECB announced an expanded asset purchase program (“Quantitative Easing”) comprising the ongoing purchase programs for asset-backed securities (ABSPP) and covered bonds (CBPP3), and, as a new element, purchases of certain euro-denominated securities issued by euro area central governments, agencies and European institutions (PSPP). Combined monthly purchases were originally capped at €60.0 billion, and were initially intended to be carried out until September 2016 or until the ECB sees a sustained adjustment in the path of inflation that is consistent with its aim of achieving inflation rates close to 2.0 per cent over the medium term. In early
33
December 2015, the ECB announced the extension of Quantitative Easing until March 2017, maintaining combined monthly purchases at the level of €60.0 billion. On March 10, 2016, the ECB announced an increase to €80.0 billion in the monthly purchase under the Quantitative Easing program and four new targeted longer-term refinancing operations (TLTRO II) to reinforce its accommodative monetary policy stance and to foster new lending, which will be conducted from June 2016 to March 2017, on a quarterly basis. On December 8, 2016, the ECB decided to extend the Quantitative Easing program decreasing the combined monthly purchases to €60.0 billion until the end of December 2017. On October 26, 2017, the ECB decided to further extend the Quantitative Easing program until September 2018, decreasing the combined monthly purchases to €30.0 billion from January 1, 2018. With respect to the PSPP, the percentage of securities issued in the euro area and purchased by the ECB was increased from 8.0 per cent in 2015 to 10.0 per cent in 2016, while the percentage of securities issued in the euro area and purchased by national central banks of a Member State different from the Member State where the relevant securities were issued was decreased from 12.0 per cent in 2015 to 10.0 per cent in 2016. The residual 80.0 per cent of PSPP securities issued in the euro area were purchased by the national central bank of the Member State where the relevant securities were issued. On December 13, 2018, the ECB announced that net purchases under Quantitative Easing would end in December 2018. At the same time, the ECB announced that it would continue reinvesting, in full, the principal payments from maturing securities purchased under the Quantitative Easing for an extended period of time past the date when it starts raising the key ECB interest rates, and in any case for as long as necessary to maintain favorable liquidity conditions and an ample degree of monetary accommodation. On September 12, 2019, the ECB announced that it would resume making net purchases under the Quantitative Easing program, beginning November 1, 2019, at a rate of €20.0 billion per month. The ECB expects this to run for as long as necessary to reinforce the accommodative impact of its policy rates, and to end shortly before it starts raising the key interest rates. In March 2020, as a consequence of the Coronavirus pandemic, the ECB implemented the Pandemic Emergency Purchase Program (PEPP), a temporary asset purchase program of private and public sector securities. The initial €750.0 billion appropriation for the PEPP has been increased by €600.0 billion on June 4, 2020 and by €500.0 billion on December 10, 2020, for a total of €1,850 billion. The program is scheduled to terminate once the ECB determines that the Coronavirus pandemic related crisis is terminated, but in any case not before the end of March 2022.
The National Recovery and Resilience Plan. The National Recovery and Resilience Plan (Piano Nazionale di Ripresa e Resilienza) (“NRRP”) is part of the Next Generation EU programme, namely the €750.0 billion package –about half of which is in the form of grants – that the European Union negotiated in response to the pandemic crisis to support its Member States. The main component of the Next Generation EU programme is the Recovery and Resilience Facility (RRF), which has a duration of six years – from 2021 to 2026 – and a total size of €672.5 billion (€312.5 billion in the form of grants, and the remaining €360.0 billion in the form of low-interest loans). The NRRP presented by Italy envisages investments and a reform package, with €191.5 billion in resources being allocated through the RRF and €30.6 billion being funded through a complementary fund established by Law Decree No. 59 of May 6, 2021 (converted into Law No. 101 of July 1, 2021). In addition, €26.0 billion has been earmarked for the implementation of specific works and for replenishing the resources of the development and cohesion fund by 2032 and €13.0 billion will be available pursuant the REACT-EU programme under Next Generation EU. The NRRP is developed around three strategic axes shared at a European level: (i) digitization and innovation; (ii) ecological transition; and (iii) social inclusion. The NRRP allocates approximately €82.0 billion of the total €206.0 billion to the regions of Southern Italy according to geographical criteria (i.e., 40%) and also provides for investments in young people and women.
The NRRP has six missions:
| 1. | Digitization, Innovation, Competitiveness, Culture: €49.2 billion (€40.7 billion from the RRF and €8.5 billion from the complementary fund) has been allocated to the promotion of the |
34
country's digital transformation, supporting innovation in the production system, and investing in two key sectors for Italy, namely tourism and culture;
| 2. | Green Revolution and Ecological Transition: €68.6 billion (€59.3 billion from the RRF and €9.3 billion from the complementary fund) has been allocated to improving the sustainability and resilience of the economic system and ensuring a fair and inclusive environmental transition; |
| 3. | Infrastructure for Sustainable Mobility: €31.4 billion (€25.1 billion from the RRF and €6.3 billion from the complementary fund) has been allocated to the development of a modern and sustainable transportation infrastructure throughout the country; |
| 4. | Education and Research: €31.9 billion (€30.9 billion from the RRF and €1.0 billion from the complementary fund) has been allocated to education, digitalisation and technical-scientific skills, research and technology transfer; |
| 5. | Inclusion and Cohesion: €22.4 billion (€19.8 billion from the RRF and €2.6 billion from the complementary fund) has been allocated to the promotion of labor market participation, including through training, strengthen active labor market policies and foster social inclusion; and |
| 6. | Health: €18.5 billion (€15.6 billion from the RRF and €2.9 billion from the complementary fund) has been allocated to local health services, to allow modernization and digitization of the health system and ensuring equal access to care. |
The NRRP also includes a programme of reforms to facilitate the implementation phase and, more generally, to contribute to the modernization of the country and make the economic environment more favourable to the development of business activities:
| • | a Public Administration reform to provide better services, encourage the recruitment of young people, invest in human capital and increase the level of digitization; |
| • | a justice reform to reduce the length of legal proceedings, especially civil proceedings, and the heavy burden of backlogs; and |
| • | simplification measures horizontal to the NRRP, e.g., in matters of permits and authorisations and public procurement, to ensure the implementation and maximum impact of investments. |
| • | Reforms to promote competition as an instrument of social cohesion and economic growth. |
The following table shows the estimated financial impact of the measures contained in the NRRP on Italy’s GDP for the years 2021 to 2026.
35
Financial Impact of the NRRP on GDP
| 2021 | 2022 | 2023 | 2024-2026 | |||||||||||||
| Mission 1 | 0.2 | 0.5 | 0.8 | 0.8 | ||||||||||||
| Mission 2 | 0.2 | 0.6 | 0.7 | 0.7 | ||||||||||||
| Mission 3 | 0.0 | 0.1 | 0.2 | 0.3 | ||||||||||||
| Mission 4 | 0.1 | 0.3 | 0.5 | 0.5 | ||||||||||||
| Mission 5 | 0.1 | 0.3 | 0.5 | 0.4 | ||||||||||||
| Mission 6 | 0.1 | 0.1 | 0.2 | 0.3 | ||||||||||||
| Total NRRP | 0.7 | 2.0 | 3.0 | 3.1 | ||||||||||||
________________________________
Source: Ministry of Economy and Finance.
Similarly, the following table shows the estimated financial impact of the measures contained in the NRRP on consumption, public expenditure, investments, exports, imports and employment, in each case for the period 2021 to 2026:
| 2021 | 2022 | 2023 | 2024-2026 | |||||||||||||
| Consumption | 0.9 | 2.3 | 3.0 | 2.9 | ||||||||||||
| Public expenditure | 0.5 | 1.5 | 2.0 | 0.7 | ||||||||||||
| Investments | 1.6 | 5.5 | 9.4 | 10.6 | ||||||||||||
| Exports | (0.2 | ) | (0.4 | ) | (0.6 | ) | 0.4 | |||||||||
| Imports | 1.0 | 2.6 | 4.0 | 4.7 | ||||||||||||
| Employment | 0.7 | 2.2 | 3.2 | 3.2 | ||||||||||||
________________________________
Source: Ministry of Economy and Finance.
The Ministry of Economy and Finance periodically monitors progress in the implementation of reforms and investments, and is the primary point of contact with the European Commission. A steering committee has been also set up at the Presidency of the Italian Council of Ministers.
SURE Facility. On May 19, 2020, the EU approved Council Regulation 2020/672 (“SURE Regulation”) which sets forth the legal framework for providing financial assistance in an aggregate amount of up to €100.0 billion to Member States which are experiencing, or are seriously threatened with, a severe economic disturbance caused by the Coronavirus pandemic. Loans granted under the SURE Regulation, the terms of which are to be agreed in a loan agreement between the beneficiary Member State and the European Commission, are intended to help Member States cover the costs related to the financing of national short-time work schemes and similar measures put in place at a national level in response to the Coronavirus pandemic, as well as health-related measures adopted by Member States so as to ensure a safe return to normal economic activity. Loans provided to Member States under the SURE instrument are underpinned by a system of voluntary guarantees from Member States. Each Member State’s contribution to the overall amount of the guarantee corresponds to its relative share in the total gross national income (GNI) of the European Union, based on the 2020 EU budget. On May 25, 2021, the EU disbursed €14.1 billion to 12 EU Member States in the seventh instalment of financial support under the SURE instrument. With the latest disbursement, the EU has provided nearly €90.0 billion in back-to-
36
back loans. The EU approved granting Italy loans pursuant to the SURE Regulation in an aggregate principal amount of €27.4 billion, with a maximum average maturity of 15 years (the “SURE Facility”).
Collective Action Clauses. Following recommendations of the IMF and the release of a draft model form of collective action clause, Italy introduced a form of collective action clause into the documentation of all of its New York law governed bonds issued since June 16, 2003.
The rights of bondholders have generally been individual rather than collective. As a result of each bondholder having individual rights, the restructuring or amending of a bond would legally have to be negotiated with each bondholder individually and any one bondholder that did not agree with restructuring or amendment terms could refuse to accept such terms or “hold out” for better terms thereby delaying the restructuring or amendment process and potentially forcing an issuer into costly litigation. These risks increase as the bondholder base is more geographically dispersed or is comprised of both individual and institutional investors.
In an effort to minimize these risks, issuers began including so-called collective action clauses into their bond documentation. These collective action clauses are intended to minimize the risk that one or a few “hold out” bondholders delay a restructuring or amendment where a majority of the other bondholders favor the terms of the restructuring or amendment, by permitting a qualified majority of the bondholders to accept the terms and bind the entire bondholder base to such terms.
The treaty instituting the ESM, as revised on February 2, 2012 (and ratified by Italy through Law No. 116 of July 23, 2012), required that all new government debt securities with a maturity of more than one year, issued on or after January 1, 2013, include the same collective action clauses as other countries in the Eurozone (the “EU Collective Action Clauses”). These standardized clauses for all euro area Member States, as set out in the document “Common Terms of Reference” dated February 17, 2012, developed and agreed by the European Economic and Financial Committee (EFC) and published on the EU Commissions website, allow a qualified majority of creditors to agree on certain “reserved matter modifications” to the most important terms and conditions of the bonds of a single series (including the financial terms) that are binding for all the holders of the bonds of that series with either (i) the affirmative vote of the holders of at least 75 per cent represented at a meeting or (ii) a written resolution signed by or on behalf of holders of at least 66 2/3 per cent of the aggregate principal amount of the outstanding bonds of that series and the consent of the Issuer. The EU Collective Action Clauses also include an aggregation clause enabling a majority of bondholders across multiple bond issues to agree on certain “reserved matter modifications” to the most important terms and conditions of all outstanding series of bonds (including the financial terms) that are binding for the holders of all outstanding series of bonds with (1) either (i) the affirmative vote of all holders of at least 75 per cent represented at separate meetings or (ii) a written resolution signed by or on behalf of all holders of at least 66 2/3 per cent of the aggregate principal amount of all outstanding series of bonds (taken in the aggregate) and (2) either (i) the affirmative vote of the holders of more than 66 2/3 per cent represented at a meeting or (ii) a written resolution signed by or on behalf of holders of more than 50 per cent of the aggregate principal amount of each outstanding series of bonds (taken individually) and the consent of the Issuer (so-called “Cross Series Modification Clauses”). Italy, as all EU Member States, has included the EU Collective Action Clauses and the Cross Series Modification Clauses in the documentation of all new bonds issued since January 1, 2013. On December 14, 2018, a reform of the model EU Collective Action Clauses was announced during the Euro Summit. The main purpose of the new model was to introduce a “single-limb” voting mechanism under which Cross Series Modification Clauses are binding on all holders of series of debt securities aggregated in one voting group if the proposed modifications are approved by holders of a majority of all securities aggregated in the voting group. Further, on December 4, 2019, the Eurogroup in inclusive format reached an agreement in principle on the terms of reference and explanatory note of the single-limb voting mechanism as part of the ESM reform package. The provisions are included in new
37
euro area government securities with maturity above one year issued on or after January 1, 2022, but will not apply retroactively to bonds issued prior to that date. For additional information regarding Italy’s implementation of EU Collective Action Clauses, see “Public Debt—Summary of External Debt.”
Gross Domestic Product
In 2017, Italy’s GDP increased by 1.5 per cent compared to 2016, mainly due to a continued expansion of domestic demand (net of inventories) and private consumption, with continuing improved conditions for having access to credit offsetting a decrease in real disposable income.
In 2018 and 2019, Italy’s GDP increased by 0.9 per cent compared to 2017 and by 0.3 per cent compared to 2018, respectively. These increases were mainly due to a continued expansion of domestic demand (net of inventories) albeit at a slower rate than in previous years. Contraction in inventories limited growth.
In 2020, Italy’s GDP decreased by 8.9 per cent compared to 2019, mainly due the Coronavirus pandemic and the decline in production levels recorded in the first half of the year at the onset of the emergency. The strong resumption of production activities marked in the third quarter was also halted by a new and more acute resurgence of the infection starting from the end of October 2020.
The following table sets forth information relating to nominal (unadjusted for changing prices) GDP and real GDP for the periods indicated.
GDP Summary
| 2016 | 2017 | 2018 | 2019 | 2020 | ||||||||||||||||
Nominal GDP (in € millions)(1) | 1,695,787 | 1,736,593 | 1,771,391 | 1,794,935 | 1,653,577 | |||||||||||||||
Real GDP (in € millions)(2) | 1,676,766 | 1,704,733 | 1,720,787 | 1,725,733 | 1,572,641 | |||||||||||||||
| Real GDP per cent change | 1.3 | 1.7 | 0.9 | 0.3 | (8.9 | ) | ||||||||||||||
| Population (in thousands) | 60,164 | 60,067 | 59,938 | 59,817 | 59,258 | |||||||||||||||
________________________________
| (1) | Nominal GDP (in € millions) calculated at current prices. |
| (2) | Real GDP (in € millions) at constant euro with purchasing power equal to the average for 2015. |
Source: ISTAT.
Private Sector Consumption. In 2020, private sector consumption in Italy decreased by 10.7 per cent, compared to a 0.4 per cent increase in 2019. In 2020, private sector consumption represented approximately 58.8 per cent of real GDP compared to 60.4 per cent in 2019. This trend in private sector consumption is in line with the slowdown in disposable income, which was mostly driven by an increase in the propensity of the private sector to save income. Purchases of non-durable goods and purchases of durable goods such as motor vehicles, white goods and consumer electronics, decreased by 2.6 per cent and 8.7 per cent in 2020, respectively, while consumption of semi-durable goods decreased by 20.9 per cent. Services decreased at a pace of 16.4 per cent compared to 2019, but still represented 49.9 per cent of the total private sector consumption.
Public Sector Consumption. In 2020, public sector consumption in Italy increased by 1.6 per cent compared to a 0.4 per cent decrease in 2019. In 2020, public sector consumption represented approximately 20.8 per cent of real GDP.
38
Gross Fixed Investment. In 2020, gross fixed investment in Italy decreased by 9.1 per cent compared to a 1.1 per cent increase in 2019. However, in line with 2019, gross fixed investment represented approximately 18 per cent of real GDP in 2020.
Net Exports. In 2020, exports of goods and services decreased by 13.8 per cent in volume compared to a 1.2 per cent increase in 2019. The decline, common to the major euro area countries, largely mirrored that of world trade. Exports of goods increased at a slower pace compared to 2019 by approximately 9.8 per cent. Italy’s world market share in 2020 remained stable at approximately 2.8 per cent at current prices and exchange.
Imports. In 2020, imports of goods and services registered a 12.6 per cent decrease compared to 2019, mainly due to a contraction in services, deriving from the lower expenses of Italians for travels abroad.
Strategic Infrastructure Projects. Italy’s infrastructure is still significantly underdeveloped compared to other major European countries.
Italy adopted legislation in 2001 (the “Strategic Infrastructure Law”) providing the government with special powers to plan and realize those infrastructure projects considered to be of strategic importance for the growth and modernization of the country, particularly in the Mezzogiorno. The Strategic Infrastructure Law is aimed at simplifying the administrative process necessary to award contracts in connection with strategic infrastructure projects and increase the proportion of privately financed projects. In the last decade, beginning with the Strategic Infrastructure Law, progress was made in the planning of public works, starting to overcome historical weakness linked to long procedures due to overlapping powers and responsibilities among different levels of government. In 2019 and 2020 general government expenditure for investments was 2.3 per cent and 2.7 per cent of GDP, respectively.
Principal Sectors of the Economy
In 2020, value added decreased by 8.6 per cent, compared to an increase of 0.2 per cent in 2019.
The following table sets forth value added by sector and the percentage of such sector of the total value added at purchasing power parity with 2015 prices.
Value Added by Sector(1)
| 2016 | 2017 | 2018 | 2019 | 2020 | ||||||||||||||||||||||||||||||||||||
| in € millions | per cent of Total | in € millions | per cent of Total | in € millions | per cent of Total | in € millions | per cent of Total | in € millions | per cent of Total | |||||||||||||||||||||||||||||||
| Agriculture, fishing and forestry | 34,168 | 2.3 | 32,882 | 2.1 | 33,491 | 2.2 | 32,952 | 2.1 | 30,869 | 2.2 | ||||||||||||||||||||||||||||||
| Industry | 289,513 | 19.2 | 299,348 | 19.5 | 305,399 | 19.7 | 304,412 | 19.6 | 271,208 | 19.1 | ||||||||||||||||||||||||||||||
| of which: Manufacturing | 245,380 | 16.3 | 253,908 | 16.6 | 258,285 | 16.7 | 256,878 | 16.5 | 227,372 | 16.0 | ||||||||||||||||||||||||||||||
| Mining | 5,840 | 0.4 | 6,347 | 0.4 | 6,304 | 0.4 | 5,885 | 0.4 | 5,332 | 0.4 | ||||||||||||||||||||||||||||||
| Supply of Energy, Gas, Steam, and Conditioned Air | 23,075 | 1.5 | 23,919 | 1.6 | 25,465 | 1.6 | 26,194 | 1.7 | 24,694 | 1.7 | ||||||||||||||||||||||||||||||
| Water Supply Drainage and Wasting | 15,217 | 1.0 | 15,304 | 1.0 | 15,418 | 1.0 | 15,426 | 1.0 | 13,749 | 1.0 | ||||||||||||||||||||||||||||||
| Construction | 65,036 | 4.3 | 65,580 | 4.3 | 66,386 | 4.3 | 68,451 | 4.4 | 64,105 | 4.5 | ||||||||||||||||||||||||||||||
| Services | 1,119,541 | 74.2 | 1,134,499 | 74.0 | 1,141,389 | 73.8 | 1,147,172 | 73.9 | 1,051,752 | 74.2 | ||||||||||||||||||||||||||||||
| of which: | ||||||||||||||||||||||||||||||||||||||||
39
| 2016 | 2017 | 2018 | 2019 | 2020 | ||||||||||||||||||||||||||||||||||||
| in € millions | per cent of Total | in € millions | per cent of Total | in € millions | per cent of Total | in € millions | per cent of Total | in € millions | per cent of Total | |||||||||||||||||||||||||||||||
| Commerce, repairs, transport and storage, hotels and restaurants | 316,401 | 21.0 | 326,042 | 21.3 | 327,311 | 21.2 | 332,596 | 21.4 | 277,271 | 19.6 | ||||||||||||||||||||||||||||||
| Information and communication services | 56,529 | 3.7 | 57,547 | 3.8 | 57,190 | 3.7 | 58,642 | 3.8 | 59,714 | 4.2 | ||||||||||||||||||||||||||||||
| Financial and monetary intermediation | 83,172 | 5.5 | 83,045 | 5.4 | 82,717 | 5.3 | 83,332 | 5.4 | 81,609 | 5.8 | ||||||||||||||||||||||||||||||
| Real estate activities | 205,465 | 13.6 | 206,646 | 13.5 | 208,678 | 13.5 | 210,574 | 13.6 | 204,866 | 14.4 | ||||||||||||||||||||||||||||||
| Professional, scientific and technical activities | 144,346 | 9.6 | 148,302 | 9.7 | 153,636 | 9.9 | 151,394 | 9.7 | 135,418 | 9.6 | ||||||||||||||||||||||||||||||
| Public administration and defense, mandatory social insurance, education, public health, social and personal services | 250,894 | 16.6 | 249,415 | 16.3 | 248,462 | 16.1 | 247,259 | 15.9 | 239,540 | 16.9 | ||||||||||||||||||||||||||||||
| Recreational and artistic activities, repairs of goods and homes, and other services | 62,734 | 4.2 | 63,478 | 4.1 | 63,297 | 4.1 | 63,434 | 4.1 | 54,011 | 3.8 | ||||||||||||||||||||||||||||||
| Value added at market prices | 1,508,257 | 100 | 1,532,443 | 100 | 1,546,749 | 100 | 1,553,098 | 100 | 1,417,989 | 100 | ||||||||||||||||||||||||||||||
________________________________
| (1) | Value added in this table is calculated by reference to prices of products and services, excluding any taxes on any such products. |
Source: Istat.
Role of the Government in the Economy
Until the early 1990’s, State-owned enterprises played a significant role in the Italian economy. The State participated in the energy, banking, shipping, transportation and communications industries, among others, and owned or controlled approximately 45.0 per cent of the Italian industrial and services sector and 80.0 per cent of the banking sector. As a result of the implementation of its privatization program, which started in 1992, the State exited the insurance, banking, telecommunications and tobacco sectors and significantly reduced its interest in the energy sector (principally through sales of shareholdings in ENI S.p.A. (“ENI”) and ENEL S.p.A. (“ENEL”)) and in the defense sector (principally through sales of shareholdings in Leonardo S.p.A., formerly known as Finmeccanica S.p.A.). For additional information on the role of the Government in the Italian economy, see “Monetary System—Equity Participations by Banks—Structure of the Banking Industry” and “Public Finance—Government Enterprises.”
Services
Transport. Italy’s transport sector has been relatively fast-growing and, during the period from 1980 to 1996, grew at more than twice the rate of industrial production growth. The expansion of the transport sector was largely the result of trade integration with European markets. Historically, motorways and railways have been controlled, directly and indirectly, by the Government, and railways in particular have posted large financial losses. In recent years, many of these enterprises have been restructured in order to place them on a sounder financial footing and/or have been privatized.
Roadways are the dominant mode of transportation in Italy. The road network includes, among others, municipal roads that are managed and maintained by local authorities, roads outside municipal areas that are managed and maintained by the State Road Board (“ANAS”) and a system of toll highways that in part are managed and maintained by several concessionaries, the largest of which is controlled by Autostrade S.p.A. (“Autostrade”), which was privatized in 1999.
40
Italy’s railway network is small in relation to its population and land area. Approximately 40.0 per cent of the network carries 80.0 per cent of the traffic, resulting in congestion and under-utilization of large parts of the network. Projects for the construction of new high-speed train systems (Treno ad alta velocità or “TAV”) linking the principal urban centers of Italy with one another and with neighboring European countries, as well as other infrastructure projects designed to upgrade the railway network, are under way or, in some cases, have been completed. The corridors of Milano-Bologna-Rome-Naples-Salerno and Milano-Torino have been completed. As of June 30, 2018, there were 24,477 kilometers of railroad track, including 1,467 kilometers of high-speed railroad track, of which 68.6 per cent are managed by State-owned enterprises, with the remainder managed by private firms operating under concession from the Government.
In 1992, the Italian State railway company was converted from a public law entity into a commercial State-owned corporation, FS, with greater autonomy over investment, decision-making and management. In response to EU directives and the intervention by the Italian Antitrust Authority (Autorità Garante della Concorrenza e del Mercato), since March 1999 Italy has been implementing a plan aimed at preparing Italy’s railways for competition. Italy liberalized railway transportation by creating two separate legal entities wholly owned by FS: (i) Trenitalia S.p.A., managing the transportation services business; and (ii) Rete Ferroviaria Italiana S.p.A. (“RFI”), managing railway infrastructure components and the efficiency, safety and technological development of the network. Starting from the end of April 2012, Nuovo Trasporto Viaggiatori S.p.A. (“NTV”) brought competition to FS through “Italo”, another high-speed train that started serving the Milano-Bologna-Rome-Naples corridor.
In February 2015, the Ministry of Economy and Finance announced that a potential privatization of FS was under discussion for the second semester of 2016. On May 16, 2016, the Government set the criteria for the privatization process and the procedure to be followed for the disposal of the stake held by the State in FS. No further steps have been formally taken with regards to this privatization process. In 2020, FS’s revenues amounted to €10,837 million compared to €12,423 million in 2019 and net loss of €562 million compared to a net profit of €584 million in 2019.
On October 29, 2020, Italia Trasporto Aereo (“ITA”), a wholly owned subsidiary of the Italian Ministry of Economy and Finance was incorporated to replace Alitalia, which used to be Italy’s national airline and was nationalized by the Government in compliance with EU regulation on State Aid following a €3.0 billion recapitalization provided for by Law Decree No. 34 of May 19, 2020 (converted into Law No. 77 of July 17, 2020). On July 15, 2021, the board of directors of ITA approved the 2021-2025 industrial plan (the “Plan”) according to which ITA acquired certain of Alitalia’s assets excluding, however, Alitalia’s brand which was separately acquired on October 14, 2021 for €90 million. Upon the approval of the Plan, on July 28, 2021, the Government subscribed for an initial capital increase of €700 million.
Communications. In 1997, the Italian Parliament enacted legislation to reform the telecommunications market to promote competition in accordance with EU directives. This legislation permits companies to operate in all sectors of the telecommunications market, including radio, television and telephone, subject to certain antitrust limitations, and provides for the appointment of a supervisory authority. The Italian Telecommunication Authority (Autorità per le Garanzie nelle Comunicazioni, or “AGCOM”), consists of five members appointed by the Italian Parliament and a president appointed by the government. It is responsible for issuing licenses and has the power to regulate tariffs and impose fines and other sanctions. Each fixed and mobile telephony operator must obtain an individual license, which is valid for 15 years and is renewable.
Italy’s telecommunications market is one of the largest in Europe. The telecommunications market was deregulated in January 1998 and while Telecom Italia, which was privatized in 1997, remains
41
the largest operator, it is facing increasing competition from new operators that have been granted licenses for national and local telephone services. Competition among telecommunications operators has resulted in lower charges and a wider range of services offered. In January 2000, access to local loop telephony was liberalized. Wind Tre, resulting from the business combination of Wind and Hutchison 3G’s Italian businesses in 2016, is the largest mobile operator by revenues, followed by Telecom Italia Mobile (TIM) and Vodafone Italia (controlled by the Vodafone Group). On July 25, 2016, the Government granted a Mobile Network Operator license to a new operator, Iliad Italia, which commenced its operations in May 2018.
Internet and personal computer penetration rates in Italy have grown consistently in recent years. Nonetheless, the data significantly differs geographically. For example, there is a significant difference between North and Center regions of Italy, where penetration of broadband and ultrabroadband connections is far higher, compared to Southern regions of Italy, even though significant investments have been made in recent years in the Mezzogiorno area, aimed at bridging this gap. At the end of 2020, residential and business broadband and ultrabroadband accesses exceeded 18.1 million units, equal to a ratio of 30.4 lines per 100 inhabitants. Telecom Italia remains the largest internet provider, followed by Fastweb, Vodafone Italia, Wind Tre and others (including BT Italia and Eolo).
Tourism. Tourism is an important sector of the Italian economy. In 2020, tourism revenues, net of amounts spent by Italians traveling abroad, were approximately €7.8 billion. The sharp decline in spending by foreign travelers was only in part offset by the reduction in foreign travel by residents due to restrictions on international travel and preference for destinations in Italy. In 2020 spending by foreign tourists in Italy decreased by 60.9 per cent compared to 2019, and spending by Italian tourists abroad decreased by 63.9 per cent.
Financial Services. The percentage of investment of households allocated to shares and investment fund units amounted to approximately 34.0 per cent at the end of 2020, compared to 32.6 per cent in 2019. Bank deposits accounted for 28.9 per cent (29.1 per cent in 2019), insurances and pension funds accounted for 24.9 per cent (25.3 per cent in 2019), and bonds accounted for 5.2 per cent (5.7 per cent in 2019). In the past, a significant portion of Italy’s households used to be invested in public debt. In 2020, however, households investments in public securities accounted for only 2.8 per cent of total households financial assets (2.7 per cent in 2019).
The general Italian share price index decreased by 7.0 per cent in 2020. This decrease was mainly driven by the uncertainty on the evolution of the Coronavirus pandemic and its negative effects on economic activity.
Italian household indebtedness as a percentage of disposable income remained increased in 2020 to 64.7 per cent. Lending to families increased by 1.5 per cent in 2020. The amount of mortgages granted increased by 4.1 per cent in 2020, compared to a 0.5 per cent increase in 2019, while consumer credit by banks decreased by 0.6 per cent compared to an increase of 8.5 per cent in 2019. For additional information on the Italian banking system, see “Monetary System—Banking Regulation.”
Manufacturing
In 2020, the manufacturing sector represented 13.8 per cent of GDP and 15.7 per cent of total employment. In 2020, value added in manufacturing decreased by 11.5 per cent compared to a 0.5 per cent decrease in 2019.
Italy has compensated for its lack of natural resources by specializing in transformation and processing industries. Italy’s principal manufacturing industries include metal products, precision
42
instruments and machinery, textiles, leather products and clothing, wood and wood products, paper and paper products, food and tobacco, chemical and pharmaceutical products and transport equipment, including motor vehicles.
The number of large manufacturing companies in Italy is small in comparison to other European Union countries. In 2020, the most significant companies included FCA Italy S.p.A. (automobiles and other transportation equipment), Leonardo S.p.A. (formerly known as Finmeccanica S.p.A.) (defense, aeronautics, helicopters and space), Esselunga S.p.A. (retail store chain), Guccio Gucci S.p.A. (fashion), Luxottica Group S.p.A. (eyewear), Pirelli & C. S.p.A. (tires and industrial rubber products), and Barilla S.p.A. (food).
Much of Italy’s industrial output is produced by small and medium-sized enterprises, which also account for much of the economic growth over the past 20 years. These firms are especially active in light industries (including the manufacture of textiles, production machinery, clothing, food, shoes and paper), where they have been innovators, and export a significant share of their production. The profit margins of large manufacturing firms, however, have generally been higher than those of their smaller counterparts. Various government programs (in addition to EU programs) to support small firms provide, among other things, for loans, grants, tax allowances and support to venture capital entities.
Traditionally, investment in research and development (“R&D”) has been subdued in Italy. Total and corporate R&D spending has continued to be proportionally lower in Italy than in other industrialized countries, reflecting the Italian industry’s persistent difficulty in closing the technology gap with other advanced economies. Total R&D spending in Italy was 1.5 per cent of GDP in 2019 (the most recent year for which data is available), compared to 3.2 per cent in Germany and 2.1 per cent in the EU.
The following table shows the growth by sector of indexed industrial production for the years indicated.
Industrial Production by Sector (Index: 2015 = 100)
| 2015 | 2016 | 2017 | 2018 | 2019 | 2020 | |||||||||||||||||||
| Food and tobacco | 100.0 | 102.0 | 104.5 | 107.0 | 109.9 | 107.4 | ||||||||||||||||||
| Textiles, clothing and leather | 100.0 | 97.7 | 97.3 | 99.0 | 94.1 | 67.5 | ||||||||||||||||||
| Wood, paper and printing | 100.0 | 98.3 | 97.9 | 94.7 | 94.0 | 84.5 | ||||||||||||||||||
| Coke and refinery | 100.0 | 97.9 | 101.4 | 99.8 | 97.4 | 82.2 | ||||||||||||||||||
| Chemical products | 100.0 | 101.8 | 104.7 | 105.8 | 106.2 | 98.5 | ||||||||||||||||||
| Pharmaceutical products | 100.0 | 100.5 | 106.7 | 111.8 | 114.5 | 109.4 | ||||||||||||||||||
| Rubber, plastic materials and non-ferrous minerals | 100.0 | 103.1 | 106.8 | 104.6 | 101.2 | 91.4 | ||||||||||||||||||
| Metals and ferrous products | 100.0 | 102.1 | 105.9 | 107.8 | 103.1 | 90.1 | ||||||||||||||||||
| Electronic and optic materials | 100.0 | 99.2 | 100.3 | 102.0 | 104.7 | 97.3 | ||||||||||||||||||
| Electric appliances for households | 100.0 | 98.9 | 100.7 | 106.8 | 106.3 | 95.5 | ||||||||||||||||||
| Machinery and equipment | 100.0 | 103.0 | 109.1 | 114.0 | 111.6 | 95.7 | ||||||||||||||||||
| Transport means | 100.0 | 104.1 | 107.4 | 108.0 | 103.4 | 84.6 | ||||||||||||||||||
| Other industrial products | 100.0 | 102.9 | 107.8 | 113.1 | 117.1 | 106.3 | ||||||||||||||||||
________________________________
Source: ISTAT.
43
Energy Consumption
Energy consumption, measured in terms of millions of tons of oil equivalent, or “MTOE”, decreased by 9.2 per cent in 2020 compared to a decrease of 1.3 per cent in 2019. In 2020 (in MTOE), oil represented 33.1 per cent of Italy’s energy consumption compared to 35.8 per cent in 2019, natural gas represented 40.6 per cent of Italy’s energy consumption compared to 38.5 per cent in 2019, renewable energy resources represented 20.2 per cent of Italy’s energy consumption compared to 18.7 per cent in 2019, solid combustibles represented 3.3 per cent of Italy’s energy consumption compared to 4.1 per cent in 2019, and net imported electricity represented 2.4 per cent of Italy’s energy consumption compared to 4.9 in 2019. In 2020, Italy’s production (in MTOE) of oil, natural gas, renewable energy and solid combustibles represented 26.4 per cent of the national energy consumption, compared to 25.3 per cent in 2019. Therefore, in 2020 Italy continued to rely heavily on energy imports, mainly of oil and natural gas.
The Italian energy sector is governed by regulations that aim to promote competition at the production, transport and sales level. The Electricity and Gas Authority (Autorità per l’Energia Elettrica e il Gas) regulates electricity and natural gas activities, with the aim of promoting competition and service quality; it has significant powers, including the power to establish tariffs. Italy’s domestic energy industry includes several major companies in which the Government holds an interest.
ENI is the largest oil and gas company in Italy and is engaged in the exploration, development and production of oil and natural gas in Italy and abroad, the refining and distribution of petroleum products, petrochemical products, the supply, transmission and distribution of natural gas and oil field services contracting and engineering. As of September 2021, the Ministry of Economy and Finance held approximately 4.4 per cent of the share capital of ENI directly and 26.0 per cent through Cassa Depositi e Prestiti S.p.A. (“CDP”).
ENEL is the largest electricity company in Italy and is engaged principally in the generation, importation and distribution of electricity. As of September 2021, the Ministry of Economy and Finance held approximately 23.6 per cent of ENEL’s share capital directly.
CDP is a privately held corporation in which the Ministry of Economy and Finance owns approximately 82.8 per cent of the share capital. CDP is engaged in the financing of investments in the public sector, i.e., of the state, the regions, the provinces and the city administrations and other public bodies. For additional information regarding CDP, see “Public Debt—General—Public Debt Management.” As of September 2021, CDP also indirectly holds approximately 29.9 per cent of the share capital of Terna S.p.A. (“Terna”). Formerly owned by ENEL, Terna is a profitable public company that pays dividends regularly, which owns and operates a major portion of the transmission assets of Italy’s national electricity grid.
Construction
In 2020, construction represented 3.9 per cent of GDP and 6.2 per cent of total employment. Investment in construction (characterized, as in the past, by more persistent cyclical fluctuation) represented 46.1 per cent of fixed investments in 2020. Housing investments decreased by 8.5 per cent in 2020, compared to a 1.7 per cent increase in 2019, while house prices increased by 1.9 per cent, an inversion of trend with respect to the slight decrease of 0.1 per cent in 2019. Investment in non-residential construction decreased by 3.9 per cent in 2020, compared to a 2.8 per cent increase in 2019, while investment in residential construction decreased by 8.5 per cent, compared to a 1.7 per cent increase in 2019.
44
Agriculture, Fishing and Forestry
In 2020, agriculture, fishing and forestry decreased by 6.3 per cent compared to 2019 and accounted for 1.9 per cent of GDP and 3.7 per cent of total employment. Agriculture’s share of Italian GDP has generally declined with the growth of industrial output since the 1960s. Italy is a net importer of all categories of food except fruits and vegetables. The principal crops are wheat (including the durum wheat used to make pasta), maize, olives, grapes and tomatoes. Cereals are grown principally in the Po valley in the North and in the South-Eastern plains, olives are grown principally in Central and Southern Italy and grapes are grown throughout the country.
Employment and Labor
General. Job creation has been and continues to be a key objective of the Government. Employment decreased by approximately 0.9 per cent in 2020, an inversion of trend compared to the positive trend that began in 2015.
The unemployment rate in Italy decreased to 9.2 per cent in 2020 from 10.0 per cent in 2019, marking a 0.8 per cent decrease. The decrease in unemployment rate mainly resulted from the measures adopted in connection with the Coronavirus pandemic, causing those who were unemployed to stop looking for a job, while transiting through inactivity.
The following table shows the change in total employment in standard labor units, labor market participation rate and unemployment rate for each of the periods indicated. A standard labor unit is the amount of work undertaken by a full-time employee over the year and is used to measure the amount of work employed to produce goods and services.
Employment
| 2016 | 2017 | 2018 | 2019 | 2020 | ||||||||||||||||
| Employment in standard labor units (per cent on prior year) | 1.4 | 0.8 | 0.8 | 0.0 | (10.3 | ) | ||||||||||||||
Participation rate (per cent)(1) | 64.9 | 65.4 | 65.6 | 65.7 | 64.1 | |||||||||||||||
Unemployment rate (per cent)(2) | 11.7 | 11.2 | 10.6 | 10.0 | 9.2 | |||||||||||||||
________________________________
| (1) | Participation rate is the rate of employment for the population between the ages of 15 and 64. |
| (2) | Unemployment rate does not include workers paid by Cassa Integrazione Guadagni, or Wage Supplementation Fund, which compensates workers who are temporarily laid off or who have had their hours cut. |
Source: ISTAT.
Employment by sector. In 2020, approximately 73.0 per cent were employed in the service sector, 15.7 per cent were employed in the industrial sector (excluding construction), 6.2 per cent were employed in the construction sector and 3.7 per cent were employed in the agriculture, fishing and forestry sector.
Employment by geographic area and gender. Unemployment in Southern Italy, which in 2020 reached 16.1 per cent, has been historically higher than in Northern and Central Italy, respectively 6.3 and 8.7 per cent. In 2020, unemployment in the South decreased by 1.6 per cent compared to a 0.2 per cent decrease in the Centre and a 0.1 per cent increase in the North. However, the number of persons employed decreased throughout the country by 0.9 per cent. In 2020, the unemployment rate of females in Italy was 10.4 per cent, a 0.9 per cent decrease compared to 2019. In 2020, the unemployment rate of males in Italy decreased by 1.3 per cent compared to 2019 and was 9.3 per cent in 2019. The participation rate remained stable.
45
Employment of the population between the ages 15-24. The unemployment rate of the population in Italy aged 15-24 increased by 0.2 per cent from 2019, reaching 29.4 per cent in 2020, compared to 29.2 per cent in 2019. In 2014, the euro area registered a decrease in the unemployment rate of the population aged 15-24 for the first time since 2007, to 23.7 per cent. This positive trend continued in 2015, 2016, 2017, 2018, 2019, and 2020 when unemployment rate in the euro area for the population aged 15-24 reached 22.2 per cent, 20.8 per cent, 18.6 per cent, 16.8 per cent, 15.6 per cent, and 18.2 per cent, respectively.
The following table shows the unemployment rate of the population between ages of 15-24 in Italy and the euro area for the periods provided.
Unemployment of the Population aged 15-24
| 2015 | 2016 | 2017 | 2018 | 2019 | 2020 | |||||||||||||||||||
| Italy | 40.3 | 37.8 | 34.7 | 32.2 | 29.2 | 29.4 | ||||||||||||||||||
Euro area(1) | 22.6 | 21.2 | 19.0 | 17.2 | 16.0 | 17.7 | ||||||||||||||||||
________________________________
| (1) | The euro area represents the 19 countries participating in the European Union. For euro area countries other than Italy, Spain, and the United Kingdom, data is related to population aged 15-24. |
Source: Eurostat.
Government programs and regulatory framework. The Government has adopted a number of programs aimed at correcting the imbalances in employment, particularly between southern Italy and the rest of the country, and reducing unemployment.
Through the Cassa Integrazione Guadagni (“CIG”), or Wage Supplementation Fund, the Government guarantees a portion of the wages of workers in the industrial sector that are temporarily laid off or who have had their working hours reduced. Workers laid off permanently as a consequence of restructuring or other collective redundancies are entitled to receive unemployment compensation for a period of 24 months, which is extendable to up to 36 months for workers nearing retirement age. In March 2020, the Government introduced an ad hoc Wage Supplementation Fund directed specifically to workers who had lost their jobs due to the Coronavirus pandemic. The system of the CIG was conceived for a context of transitory sectoral and / or business crises, and for this reason in 2020 its reach was extended in order to include the businesses and the sectors that in ordinary situations would not have had access to CIG.In total, the Istituto Nazionale di Previdenza Sociale (“INPS”) authorized 2.96 billion hours under the CIG in 2020, compared to the 260 million hours authorized in 2019.
Prices and Wages
Wages. Unit labor costs have historically been lower in Italy, on average, than in most other European countries. This is due to lower average earnings per employee, combined with lower productivity levels.
Real earnings decreased by 2.6 per cent in 2020, following a decrease by 2.8 per cent in gross earnings compared to 2019. Employees earnings decreased by 6.9 per cent compared to a 12.2 per cent decrease of self-employed workers’ earnings. In the private sector, nominal earnings increased by 0.7 per cent compared to 2019, with a larger increase for those employed in the agriculture sector as opposed to those employed in the industry sector or in services. In the public sector, nominal wages did not increase. Unit labor decreased by 10.3 per cent in 2020, after remaining unchanged in 2019 compared to 2018.
46
Prices. The HICP reflects the change in price of a basket of goods and services taking into account all families resident in a given territory. The inflation rate in the euro area, as measured by the HICP, was 0.2 per cent in 2020, compared to 1.2 per cent in 2019. Since Italy’s entry into the euro area in 1999, monetary policy decisions are made for all euro zone countries by the European Central Bank. For additional information on monetary policy in the euro zone, see “Monetary System—Monetary Policy.”
In 2020, as measured by the HICP, Italy recorded an average deflation of 0.1 per cent compared to an average inflation of 0.6 per cent in 2019. Among other factors, the moderate deflation rate was caused by a decrease in prices of manufactured goods.
The following table illustrates trends in prices and wages for the periods indicated.
Prices and Wages (in per cent)
| 2016 | 2017 | 2018 | 2019 | 2020 | ||||||||||||||||
Cost of Living Index(1) | (0.1 | ) | 1.1 | 1.1 | 0.5 | (0.3 | ) | |||||||||||||
EU Harmonized Consumer Price Index(1) | (0.1 | ) | 1.3 | 1.2 | 0.6 | (0.1 | ) | |||||||||||||
Core Inflation Index(2) | 0.5 | 0.7 | 0.5 | 0.5 | 0.4 | |||||||||||||||
Change in Unit Labor Cost(3) | 0.4 | (0.1 | ) | 2.0 | 1.4 | 1.9 | ||||||||||||||
________________________________
| (1) | The cost of living index reflects the change in price of a basket of goods and services (net of tobacco) typically purchased by non-farming families headed by an employee. It differs from the harmonized consumer price index in that the cost of living index is smaller in scope. |
| (2) | The basket of goods and services used to measure the core inflation index is equivalent to the harmonized consumer price index basket less energy, unprocessed food, alcohol and tobacco products. |
| (3) | Unit labor costs are per capita wages reduced by productivity gains. |
Source: Bank of Italy, OECD, Eurostat.
Social Welfare System
Italy has a comprehensive social welfare system, including public health, public education and pension, disability and unemployment benefits programs, most of which are administered by the Government or by local authorities receiving government funding. These social services are funded in part by contributions from employers and employees and in part from general tax revenues. They represent the largest single government expenditure. For additional information on government revenues and expenditures, see “Public Finance—Revenues and Expenditures.”
Social benefits in cash include expenditures for pensions, disability and unemployment benefits. The two principal social security agencies, INPS and the Istituto Nazionale Assicurazioni e Infortuni sul Lavoro (“INAIL”), provide old-age pensions and temporary and permanent disability compensation for all government employees and employees of the private sector and their qualified dependents, as well as coverage for accidents in the workplace or permanent disability as a consequence of employment. In 2020, pensions were provided to approximately 16.0 million beneficiaries, totaling disbursements for approximately €307.2 billion.
Old-age pensions in Italy, as in much of the developed world, continue to present a significant structural fiscal problem. Controlling pension spending is a particularly important government objective given Italy’s aging population. Beginning in 1992, the Government adopted several measures designed to control the growth of pension expenditures. The Government adopted additional pension reforms in 1995, 2004 and 2007. Then in each of 2009, 2010 and 2011, the Government adopted further reforms of the pension system.
47
Law No. 92 of June 28, 2012, and Law Decree No. 69 of June 21, 2013 (Decreto del Fare) (converted into Law No. 98 of August 9, 2013) included additional reforms with a view to contributing to the economic and social development of Italy and stimulating competitiveness and job creation. The most significant of these reforms are:
| • | the reform of employment termination programs (ammortizzatori sociali). Starting from January 1, 2013, the Social Insurance for Labor (Assicurazione Sociale per l’Impiego) will begin to provide to workers that have lost their jobs certain unemployment benefits (indennità di disoccupazione), subject to certain conditions; |
| • | provisions designed to increase flexibility of the labor market by introducing new circumstances under which employers will be able to make employees redundant; |
| • | amendments to certain types of employment contracts (e.g., fixed duration and apprenticeship/training employment contracts) in order to contribute to increased job creation, particularly for the younger population; and |
| • | the reorganization of labor court procedures, in order to reduce the duration of trials. |
The stability law for 2016 (Law No. 208 of December 28, 2015) included measures for the protection of certain income-deprived voluntary early retirees (so-called esodati) and allowed women with at least 35 years of contributions to elect to take early retirement subject to a pension reduction. Further, the stability law for 2016 introduced certain measures supporting the turnover of employees by allowing soon-to-be-retired employees to opt for part-time work and provided that, in the event of deflation, pensions for the following year would not be subject to negative adjustment.
The stability law for 2017 (Law No. 232 of December 11, 2016) included measures for the increase in the amount of the so-called fourteenth month payment and its extension to retirees with income between 1.5 and 2 times the minimum pension threshold (i.e., €6,596.46 p.a.), and facilitations for accessing retirement for certain categories of workers. Further, the stability law for 2017 provided for a further extension of the term by which the pension safeguard mechanism (the so-called eighth safeguard), that has tightened the eligibility requirements for accessing retirement, will come into effect.
The stability law for 2018 (Law No. 172 of December 4, 2017) included measures to exempt certain categories of workers from the increase to 67 years in the age requirement allowing workers to retire. The stability law for 2018 also included measures providing for an extension to December 31, 2019, of the experimental pension advance scheme introduced by the budget law for 2017 (so-called voluntary APE), and expanded its scope to additional categories of workers whose-fixed term contracts expire close to the age requirement.
The 2019 Budget law included measures to allow workers with at least 62 years of age and 38 years of social contribution to the national pension fund to apply for early retirement. These measures were implemented through the adoption of Law Decree No. 4 of January 28, 2019 (converted into Law No. 26 of March 28, 2019). For additional information on Law Decree No. 4 of January 28, 2019, see “Public Debt—Key Measures related to the Italian Economy—Measures adopted in 2019.”
The 2021 Budget law changed the calculation rules for companies employing more than 250 employees to facilitate access to a pension to part-time workers.
In September 2021, a parliamentary committee led by Cesare Damiano, a former leading member of the CGIL trade union, identified 203 jobs that could grant early retirement benefits due to the wearying
48
value of work. The list was drawn up in collaboration with INAIL applying specific indexes such as frequency of accidents, absences due to accidents, and absences due to illness. The new categories include also primary school teachers, taxi drivers, cashiers, and janitors. Subject to Parliament approval, the measure is expected to be part of the 2022 reform of the pension system.
The following table shows estimated public expenditure for pensions as a percentage of GDP based on the implementation of the various reforms described above.
Estimated Pension Expenditure (as a per cent of GDP)
| 2015 | 2020 | 2025 | 2030 | 2035 | 2040 | 2045 | 2050 | 2055 | 2060 | 2065 | 2070 | |||||||||||||||||||||||||||||||||||||
| Current Legislation | 15.6 | 17.0 | 15.4 | 16.2 | 17.1 | 17.1 | 16.8 | 15.8 | 14.7 | 13.8 | 13.4 | 13.3 | ||||||||||||||||||||||||||||||||||||
________________________________
Source: Ministry of Economy and Finance.
49
MONETARY SYSTEM
The Italian financial system consists of banking institutions such as commercial banks, leasing companies, factoring companies and household finance companies, as well as non-bank financial intermediaries such as investment funds, portfolio management companies, securities investment firms, insurance companies and pension funds.
Monetary Policy
The Eurosystem and the European System of Central Banks. As of January 1, 1999, which marked the beginning of Stage III of the EMU, the 11 countries joining the EMU officially adopted the euro, and the Eurosystem became responsible for conducting a single monetary policy. Greece and Slovenia joined the EMU on January 1, 2001 and January 1, 2007, respectively. Cyprus and Malta joined the EMU on January 1, 2008 and Slovakia on January 1, 2009. Estonia and Latvia adopted the euro beginning on January 1, 2011 and January 1, 2014, respectively. Lithuania joined the Eurozone and adopted the euro on January 1, 2015.
The European System of Central Banks (“ESCB”) consists of the ECB, established on June 1, 1998, and the national central banks of the EU Member States. The Eurosystem consists of the ECB and the 19 national central banks of those countries that have adopted the euro. So long as there are EU Member States that have not yet adopted the euro (currently Bulgaria, Croatia, the Czech Republic, Denmark, Hungary, Poland, Romania and Sweden), there will be a distinction between the 19-country Eurosystem and the 27-country ESCB. The eight national central banks of non-participating countries do not take part in the decision-making of the single monetary policy; they maintain their own national currencies and conduct their own monetary policies. The Bank of Italy, as a member of the Eurosystem, participates in Eurosystem decision-making.
The Eurosystem is principally responsible for:
| • | defining and implementing the monetary policy of the euro area, including fixing rates on the main refinancing lending facility (regular liquidity-providing reverse transactions with a weekly frequency and a maturity of two weeks, executed by the national central banks on the basis of standard tenders), the marginal lending facility (overnight liquidity facility provided to members of the Eurosystem by the national central banks against eligible assets, usually with no credit limits or other restrictions on access to credit) and the deposit facility (overnight deposit facility with the national central banks available to members of the Eurosystem, usually with no deposit limits or other restrictions); |
| • | conducting foreign exchange operations and holding and managing the official foreign reserves of the euro area countries; |
| • | issuing banknotes in the euro area; |
| • | promoting the smooth operation of payment systems; and |
| • | cooperating in the supervision of credit institutions and the stability of the financial system. |
| • | The ESCB is governed by the decision-making bodies of the ECB which are: |
50
| • | the Executive Board, composed of the President, Vice-President and four other members, responsible for implementing the monetary policy formulated by the Governing Council and managing the day-to-day business of the ECB; |
| • | the Governing Council, composed of the six members of the Executive Board and the governors of the 19 national central banks, in charge of implementing the tasks assigned to the Eurosystem, formulating the euro area’s monetary policy and to adopt decisions relating to the general framework under which supervisory decisions are taken; |
| • | the General Council, composed of the President and the Vice-President of the ECB and the governors of the 27 national central banks of the EU Member States. The General Council contributes to the advisory functions of the ECB and will remain in existence as long as there are EU Member States that have not adopted the euro; and |
| • | the Supervisory Board, composed of the Chair, the Vice-Chair, four ECB representatives and representatives of national supervisors, carries out ECB’s supervisory tasks. |
The ECB is independent of the national central banks and the governments of the Member States and has its own budget, independent of that of the EU; its capital is not funded by the EU but has been subscribed and paid up by the national central banks of the Member States, pro-rated, for each Member State that has adopted the euro, to the GDP and population of each such Member State. The ECB has exclusive authority for the issuance of currency within the euro area. As of December 29, 2020, the ECB had subscribed capital of approximately €10.8 billion and paid up capital of approximately €7.6 billion. As of December 29, 2020, the Bank of Italy had subscribed for approximately €1.3 billion, fully paid up, based on the capital key used to calculate each of the euro area national central banks’ subscription to the capital of the ECB, which in the case of Italy is equal to 13.8 per cent.
The Bank of Italy. The Bank of Italy, founded in 1893, is the banker to the Treasury and had historically been the lender of last resort for Italian banks prior to the onset of the European sovereign debt crisis in 2009. It supervises and regulates the Italian banking industry and operates services for the banking industry as a whole. It also supervises and regulates non-bank financial intermediaries. As of December 31, 2020, the Bank of Italy had assets of approximately €1,296.2 billion, held gold in the amount of approximately €121.7 billion (including gold receivables) and capital and reserves of approximately €26.2 billion.
The ECB’s Monetary Policy. The primary objective of the ECB is to preserve the euro’s purchasing power and consequently to maintain price stability in the euro area. In 2003, clarifying previous positions taken since October 1998, the Governing Council stated that the ECB monetary strategy, in the pursuit of price stability, aims to maintain inflation rates below, but close to, 2.0 per cent over the medium term. Inflation rate has been defined as an annual increase in the HICP for the euro. Moreover, in order to assess the outlook for price developments and the risks for future price stability, a two-pillar approach was adopted by the ECB: monetary analysis and economic analysis.
The first pillar, monetary analysis, focuses on a longer term horizon than the economic analysis. It mainly serves as a means of cross-checking, from a medium to long-term perspective, the short to medium-term indications for monetary policy coming from the economic analysis. Monetary analysis assigns a prominent role to money supply, the growth rate of which is measured through three monetary aggregates, a narrow monetary aggregate (M1), an intermediate monetary aggregate (M2) and a broad monetary aggregate (M3). These aggregates differ with regard to the degree of liquidity of the assets they include. M1 comprises currency (banknotes and coins) and overnight deposits, which can immediately be converted into currency or used for cashless payments. M2 comprises M1 and deposits with an agreed
51
maturity of up to and including two years or redeemable at a period of notice of up to and including three months. These deposits can be converted into M1 components, subject to certain restrictions such as the need for advance notice, penalties and fees. M3 comprises M2 as well as repurchase agreements, debt securities of up to two years, money market fund shares and money market paper. These additional instruments have a high degree of liquidity and price certainty, which make them close substitutes for deposits. As a result, M3 is less affected by substitution between various liquid asset categories and is more stable than narrower (M1 and M2) money.
In December 1998, the Governing Council set the first quantitative reference value for monetary growth at an annual growth rate of 4.5 per cent. This reference value was confirmed by the Governing Council in 1999, 2000, 2001 and 2002. On May 8, 2003, the Governing Council decided to stop its practice of reviewing the reference value annually, given its long-term nature. The reference value has not been changed since.
The second pillar consists of a broad assessment of the outlook for price developments and the risks to price stability in the euro area and is made in parallel with the analysis of M3 growth in relation to its reference value. This assessment encompasses a wide range of financial market and other economic indicators, including developments in overall output, demand and labor market conditions, a broad range of price and cost indicators, fiscal policy and the balance of payments for the euro area as well as the production and review of macroeconomic projections.
Based on a thorough analysis of the information provided by the two pillars of its strategy, the Governing Council determines monetary policy aiming at price stability over the medium term.
The ECB’s monetary and exchange rate policy is aimed at supporting general and economic policies in order to achieve the economic objectives of the EU, including sustainable growth and a high level of employment without prejudice to the objective of price stability.
ECB Money Supply and Credit.
In May 2018, the annual growth rate of the broad monetary aggregate M3 increased to 4.0 per cent from 3.8 per cent in April 2018. The annual growth rate of M1, increased to 7.5 per cent in May 2018, from 7.0 per cent in April 2018. The annual growth rate of short-term deposits other than overnight deposits (M2-M1) increased to -1.7 per cent in May 2018, from -2.1 per cent in March 2018. The annual growth rate of marketable instruments (M3-M2) decreased to -5.1 per cent in May 2018, from -1.2 per cent in April 2018.
In May 2019, the annual growth rate of the broad monetary aggregate M3 increased to 4.8 per cent from 4.7 per cent in April 2019. The annual growth rate of M1, decreased to 7.2 per cent in May 2019, from 7.4 per cent in April 2019. The annual growth rate of short-term deposits other than overnight deposits (M2-M1) increased to 0.7 per cent in May 2019, from 0.6 per cent in April 2019. The annual growth rate of marketable instruments (M3-M2) increased to -2.5 per cent in May 2019, from -5.4 per cent in April 2019.
In May 2020, the annual growth rate of the broad monetary aggregate M3 increased to 8.9 per cent from 8.2 per cent in April 2020. The annual growth rate of M1, increased to 12.5 per cent in May 2020, from 8.2 per cent in April 2020. The annual growth rate of short-term deposits other than overnight deposits (M2-M1) increased to 0.7 per cent in May 2020, from -0.3 per cent in April 2020. The annual growth rate of marketable instruments (M3-M2) decreased to 5.8 per cent in May 2020, from 5.9 per cent in April 2020.
52
In May 2021, the annual growth rate of the broad monetary aggregate M3 decreased to 8.4 per cent from 9.2 per cent in April 2021. The annual growth rate of M1, decreased to 11.6 per cent in May 2021, from 12.3 per cent in April 2021. The annual growth rate of short-term deposits other than overnight deposits (M2-M1) decreased to -0.7 per cent in May 2021, from 0.3 per cent in April 2021. The annual growth rate of marketable instruments (M3-M2) increased to 11.3 per cent in May 2021, from 10.5 per cent in April 2021.
ECB Interest Rates. The following table shows the movement in the ECB interest rate on main refinancing operations and on marginal lending and deposit facilities from 2015 to date.
Main Refinancing Operations1 | ||||||||||||||||
| Effective date | Deposit Facility per cent interest rate | Fixed rate tenders | Variable rate tenders – minimum bid rate | Marginal lending facility per cent interest rate | ||||||||||||
2015 December 9 | (0.30 | ) | 0.05 | — | 0.30 | |||||||||||
2016 March 16 | (0.40 | ) | 0.00 | — | 0.25 | |||||||||||
2019 September 18 | (0.50 | ) | 0.00 | — | 0.25 | |||||||||||
________________________________
| (1) | The table presents only changes in key ECB interest rates. No changes to key ECB interest rates were recorded in 2017,2018 and 2020. |
Source: European Central Bank.
Exchange Rate Policy
Under the Maastricht Treaty, the ECB and ECOFIN are responsible for foreign exchange rate policy. The EU Council formulates the general orientation of exchange rate policy, either on the recommendation of the Commission, following consultation with the ECB, or on the recommendation of the ECB. However, the EU Council’s general orientation cannot conflict with the ECB’s primary objective of maintaining price stability. The ECB has exclusive authority for effecting transactions in foreign exchange markets.
Banking Regulation
Regulatory Framework. Italian banks fall into one of the following categories:
| • | joint stock banks; or |
| • | co-operative banks. |
Pursuant to the principle of “home country control”, non-Italian EU banks may carry out banking activities and activities subject to “mutual recognition” in Italy within the framework set out by Directive 2006/48/EC and Directive 2006/49/EC (collectively known as Capital Requirements Directive, or CRD I), as amended by Directive 2009/27/EC, Directive 2009/83/EC and Directive 2009/111/EC (collectively known as CRD II), by Directive 2010/76/EU (known as CRD III), and by Directive 2013/36/EU (known as CRD IV). Under the principle of “home country control”, a non-Italian EU bank remains subject to the regulation of its home-country supervisory authorities. It may carry out in Italy those activities described in the aforesaid directives that it is permitted to carry out in its home country, provided the Bank of Italy is informed by the entity supervising the non-Italian EU bank. Subject to certain authorization requirements, non-EU banks may also carry out banking activities in Italy.
53
Deregulation and Rationalization of the Italian Banking Industry. Historically, the Italian banking industry was highly fragmented and characterized by high levels of State ownership and influence. During the 1980s, Italian banking and European Community authorities began a process of deregulation. The principal components of deregulation at the European level are set forth in EU Directives and provide for:
| • | the free movement of capital among member countries; |
| • | the easing of restrictions on new branch openings; |
| • | the range of domestic and international services that banks are able to offer throughout the European Union; and |
| • | the elimination of limitations on annual lending volumes and loan maturities. |
The effect of the deregulation, in the context of the implementation of the EU Directives, has been a significant increase in competition in the Italian banking industry in virtually all bank and bank-related services.
The Consolidated Banking Law. In 1993, Legislative Decree No. 385 of September 1, 1993, (the “Consolidated Banking Law”) consolidated most Italian banking legislation into one statute. Provisions in the Consolidated Banking Law relate, inter alia, to the role of supervisory authorities, the definition of banking and related activities, the authorization of banking activities, the scope of banking supervision, special bankruptcy procedures for banks and the supervision of financial companies. Banking activities may be performed by banks, without any restriction as to the type of bank. Furthermore, subject to their respective bylaws and applicable regulations, banks may engage in all the business activities that are integral to banking.
The Draghi Law. Legislative Decree No. 58 of February 24, 1998, (the “Draghi Law”) entered into force in 1998 and introduced a comprehensive regulation of investment services, securities markets and publicly traded companies. While the Draghi Law did not significantly amend Italian legislation governing the banking industry, it is generally applicable to Italian publicly traded companies and it has implemented the EU directives on securities. In particular, the Draghi Law introduced a comprehensive regulation of investment services and collective investment management which applies to banks, investment firms and asset managers.
Directive 2004/39/EC - The Markets in Financial Instruments EU Directive (MiFID). On November 1, 2017, Directive 2004/39/EC (“MiFID”) came into force and replaced the existing Investment Services Directive (Directive 93/22/EEC). The purpose of the MiFID is to harmonize rules governing the operation of regulated markets. The MiFID resulted in significant changes to the regulation of financial instruments and widened the range of investment services and activities that firms can offer in EU Member States other than their home state. In addition, the MiFID:
| • | provides for tailored disclosure requirements, depending on the level of sophistication of investors; |
| • | establishes detailed standards for fair dealings and fair negotiations between investment firms and investors; |
| • | introduces the operation of multilateral trading facilities as a new core investment service; and |
54
| • | extends the scope of the definition of financial instruments to include commodity derivatives, credit derivatives and swap agreements. |
The MiFID also sets out detailed requirements governing the organization of investment firms and their conduct of business.
Further to the implementation of the MiFID in Italy, the Italian Stock Exchange Commission (“Consob”) and the Bank of Italy adopted a joint regulation coordinating their respective supervisory competences with regard to the Italian financial markets and the institutions operating in those markets.
Directive 2014/65/EU - The Markets in Financial Instruments EU Directive II (MiFID II). In April 2014, the European Parliament repealed and recast the MiFID into a new Directive (Directive 2014/65/EU)(“MiFID II”) alongside a new regulation (Regulation 600/2014) (“MiFIR”). The new framework aims to make financial markets more efficient, resilient and transparent. The measures are intended to increase investor protection by introducing more stringent organizational and conduct requirements and strengthen the role of management bodies and the supervisory powers of regulators. Both MiFID II and MiFIR came into force on July 2, 2014. Member States had until January 3, 2018 to transpose these new measures into national law.
Law No. 33 of March 24, 2015. In March 2015, Parliament converted Law Decree No. 3 of January 24, 2015 into Law No. 33 of March 24, 2015, also known as “Investment Compact.” Law No. 33/2015 required co-operative banks exceeding €8.0 billion in assets to incorporate as joint stock banks by December 2016. Law No. 33/2015 also mandated for a change in the corporate governance structure of those banks, providing for proportionality of voting rights to the number of shares owned by shareholders (as opposed to the previous method where every member of the bank held one vote, independently of its share ownership).
Law No. 49 of April 8, 2016. In April 2016, Parliament converted Law Decree No. 18 of February 14, 2016, into Law No. 49 of April 8, 2016, also known as “BCC Reform.” The BCC Reform requires co-operative banks to join a banking group in order to obtain or maintain their authorization for carrying out banking activities. Alternatively, co-operative banks with net assets in excess of €200 million could opt to maintain such authorization by re-incorporating as joint stock banks by June 14, 2016.
Supervision. Supervisory authorities, in accordance with the Consolidated Banking Law, include the Inter-Ministerial Committee for Credit and Savings (Comitato Interministeriale per il Credito ed il Risparmio, or “CICR”), the Ministry of Economy and Finance and the Bank of Italy. The principal objectives of supervision are to ensure the sound and prudent management of the institutions subject to supervision and the overall stability, efficiency and competitiveness of the financial system.
The CICR. The CICR is composed of the Minister of Economy and Finance who acts as chairman, the Minister of International Trade, the Minister of Agriculture and Forest Policies, the Minister of Economic Development, the Minister of Infrastructure, the Minister of Transportation and the Minister of EU Policies. The Governor of the Bank of Italy, although not a member of the CICR, attends all meetings of the CICR but does not have the right to vote at such meetings. Where provided for by the law, the CICR establishes general guidelines that the Bank of Italy must follow when adopting regulations applicable to supervised entities.
The Ministry of Economy and Finance. The Ministry of Economy and Finance has certain powers in relation to banking and financial activities. It sets eligibility standards to be met by holders of equity interests in the share capital of a bank and the level of professional experience required of directors and executives of banks and other financial intermediaries. The Ministry of Economy and Finance may, in
55
cases of urgency, adopt measures that are generally within the sphere of CICR’s powers and may also issue decrees that subject banks and other supervised entities to mandatory liquidation (liquidazione coatta amministrativa) or extraordinary management (amministrazione straordinaria), upon the proposal of the Bank of Italy. Furthermore, the Ministry of Economy and Finance may exercise certain powers in relation to regulating wholesale markets for government securities.
The Bank of Italy. The Bank of Italy supervises banks and certain other financial intermediaries through its regulatory powers (in accordance with the guidelines issued by the CICR). The Consolidated Banking Law identifies four main areas of oversight: capital requirements, risk management, acquisitions of participations, administrative and accounting organization and internal controls, and public disclosure requirements. The Bank of Italy also regulates other fields, such as transparency in banking and financial transactions of banks and financial intermediaries, international payments, money laundering and terrorism financing. The Bank of Italy supervises banks and other supervised entities by, inter alia, authorizing the acquisition of shareholdings in banks in excess of certain thresholds and exercising off-site and on-site supervision. Certain acquisitions by non-EU entities based in jurisdictions that do not contemplate reciprocal rights by Italian banks to purchase banks based in those jurisdictions, may be denied by the President of the Council of Ministers, upon prior notice to the Bank of Italy.
On-site visits carried out by the Bank of Italy may be either “general” or “special” (directed toward specific aspects of banking activity). Matters covered by an on-site visit include the accuracy of reported data, compliance with banking laws and regulations, organizational aspects and conformity with a bank’s own bylaws.
The Bank of Italy requires all banks to report periodic statistical information related to all components of their non-consolidated balance sheet and consolidated accounts. Other data reviewed by the Bank of Italy include minutes of meetings of each bank’s board of directors. Banks are also required to submit any other data or documentation that the Bank of Italy may request.
In addition to its supervisory role, the Bank of Italy – as the Italian Central Bank – performs monetary policy functions by participating in the ESCB, and acts as treasurer to the Ministry of Economy and Finance. It also operates services for the banking industry as a whole, most notably the Credit Register (Centrale dei Rischi), a central information database on credit risk. Furthermore, the Bank of Italy may exercise a supervisory authority on wholesale markets for domestic government securities.
On December 28, 2005, Law No. 262 was passed to modify the powers and organization of the Bank of Italy. In particular, while prior to the reform the Governor was appointed for an indefinite term, in accordance with the new legal framework, the Governor of the Bank of Italy is now appointed for a 6-year term, and may be reappointed only once. In addition, the Law No. 262/2005 transferred most of the powers of the Bank of Italy regarding competition in the banking sector to the Antitrust Authority, although joint clearance of the Bank of Italy and the Antitrust Authority is required in cases of mergers and acquisitions.
The SSM. On October 29, 2013, following Council Regulation 1024/2013 and Regulation 1022/2013, the EU approved the creation of the Single Supervisory Mechanism (“SSM”) as the new system of banking supervision for Europe, which has been effective since November 4, 2014. The SSM grants the ECB, in conjunction with national supervisory authorities, a supervisory role to monitor the financial stability of banks based in eurozone countries. The SSM’s main aims are to:
| • | ensure the safety and soundness of the European banking system; |
| • | increase financial integration and stability; and |
56
| • | ensure consistent banking supervision. |
Eurozone countries automatically joined the SSM, while Member States of the EU outside the eurozone can voluntarily participate. Other countries that do not yet have the euro as their currency can choose to participate. To do so, their national supervisors enter into “close cooperation” with the ECB. Bulgaria and Croatia joined European banking supervision through close cooperation in October 2020. The ECB directly supervises the 114 most significant banks of the participating countries, representing approximately 82.0 per cent of the total banking assets in the euro area. Banks that are not considered eligible for ECB supervision continue to be supervised by their national supervisors, in close cooperation with the ECB.
The SSM functions in conjunction with the Single Resolution Mechanism (“SRM”), created by Regulation 806/2014. The SRM is composed of the National Resolution Authorities (“NRAs”) and the Single Resolution Board, a European agency that is also staffed by representatives of the NRAs. By Legislative Decree No. 180 of November 16, 2015, the Bank of Italy established the Italian National Resolution Fund, an essential part of the SRM which harmonizes the resolution procedures for credit institutions and some investment firms within the 19 Member States of the euro area. The Italian National Resolution Fund is financed by contributions from the Italian banking sector and some investment firms. The SRM is also responsible for the orderly management of crises at banks that are classified as systemically important financial institutions or which operate across borders within the euro area, and at major investment firms, resolving any problems arising from the fragmentation of procedures along national lines.
Reserve Requirements. Pursuant to ECB, ESCB and EU regulations, each Italian bank must deposit with the Bank of Italy an interest-bearing reserve expressed as a percentage of its total overnight deposits, deposits with an agreed maturity of up to and including two years, deposits redeemable at notice of up to and including two years and debt securities with an original maturity of up to and including two years.
Risk-Based Capital Requirements and Solvency Ratios
Basel III and the Capital Requirements Directive IV (“CRD IV”). In 2013, the European Union adopted a legislative package of measures aimed at improving the banking sector’s ability to absorb shocks arising from financial and economic stress, improving risk management and governance and strengthening banks’ transparency and disclosure with the effect of limiting the instruments that qualify as regulatory capital and increasing the amount of capital required.
The Basel III rules have been implemented in the EU through the Capital Requirements Regulation (“CRR”) and Directive 2013/36/EU, or CRD IV, which replace CRD I, II and III. CRD IV came into force on January 1, 2014 with other provisions being phased in by 2019. Basel III rules require banks to meet certain minimum capital ratios. In addition, Basel III rules provide additional rules on liquidity by requiring that banks meet a liquidity coverage ratio and a net stable funding ratio and rules on leverage by requiring that banks meet a leverage ratio. In January 2013, the original proposal with respect to the liquidity requirements was reviewed; the phasing-in of the liquidity coverage ratio begun in 2015 and has been increasing by 10.0 per cent annually, currently expecting to reach 100 per cent effective January 1, 2019. The definition of high quality liquid assets was expanded to include lower quality corporate securities, equities and residential mortgage backed securities.
CRD IV also introduces new rules for counterparty risk, and new macroprudential standards including a countercyclical capital buffer and capital buffers for systemically important institutions. CRD IV amends rules on corporate governance, including remuneration, and introduces COREP and FINREP,
57
standardized EU regulatory reporting requirements which stipulate the information that firms will have to report to supervisory authorities in areas such as own funds, large exposures and financial information.
Italian capital adequacy requirements are mainly governed by CRD IV, the Consolidated Banking Law, CICR Regulations and other implementing regulations issued by the Bank of Italy (Nuove disposizioni di vigilanza prudenziale per le banche). Under the implementing regulations of the Bank of Italy, Italian banks are required to maintain certain ratios of regulatory capital to risk-weighted assets.
Risk Concentration Limitations. The Bank of Italy has issued implementing regulations which require stand-alone banks and banking groups to limit each risk position to no more than 25.0 per cent of supervisory capital and their exposures to any single customer or group of related customers to 25.0 per cent of the bank’s regulatory capital. Under specific conditions, for exposures to related or connected parties, the credit risk position may overcome the 25.0 per cent of supervisory capital limit.
Banks belonging to banking groups shall be subject to an individual limit of 40.0 per cent of their supervisory capital provided that the group to which they belong complies with the above limits at the consolidated level. The exception is therefore not applicable to Italian banks that do not belong to a banking group and are stand-alone entities.
Equity Participations by Banks
Implementing regulations adopted by the Bank of Italy in December 2013, and subsequently amended, have updated the legislation regulating equity participations by banks.
Prior approval of the Bank of Italy is required for any direct and indirect equity investments by a bank in other banks or financial or insurance companies: (1) exceeding 10.0 per cent of the regulatory capital of the acquiring bank; or (2) resulting in the control of the share capital of, or significant influence on, a bank or financial or insurance company having its registered office in a non-EU State other than Canada, Japan, Switzerland or the United States.
The acquisition by banks and banking groups of shareholdings in non-financial companies is also subject to certain limitations. Aggregate shareholdings in non-financial companies purchased by banks and banking groups cannot exceed 60.0 per cent of the acquiring bank’s regulatory capital. Banks and banking groups may not acquire shareholdings in any single non-financial company exceeding 15.0 per cent of the acquiring bank’s regulatory capital.
Deposit Insurance. The Interbank Fund (Fondo Interbancario di Tutela dei Depositi) was established in 1987 by a group consisting of the main Italian banks to protect depositors against the risk of bank insolvency and the loss of deposited funds. The Interbank Fund assists banks that are declared insolvent or are subject to temporary financial difficulties.
Participation in the Interbank Fund is compulsory for all Italian banks. The Interbank Fund intervenes when a bank has entered into extraordinary administration (amministrazione straordinaria) or is undergoing mandatory liquidation (liquidazione coatta amministrativa). If a bank becomes subject to extraordinary administration, the Interbank Fund may make payments to support the business of the relevant bank, which may take the form of debt financing or taking an equity stake in the bank. In the case of mandatory liquidation, the Interbank Fund guarantees the refund of deposits to banking customers up to a maximum of €100,000 per depositor per bank. The guarantee does not cover customer deposit instruments in bearer form, deposits by financial and insurance companies and by collective investment vehicles and deposits by bank managers and executives with the bank that employs them.
58
Structure of the Banking Industry. Italy had 474 banks as of December 31, 2020, as opposed to 488 banks as of December 31, 2019. As of December 31, 2020, there were 59 banking groups in Italy, from 55 banking groups as of December 31, 2019. The ownership structure of the Italian banking sector has undergone substantial changes since 1992, reflecting significant privatizations through 1998. Since 1999, the Italian banking sector has experienced significant consolidation and this process has resulted in the formation of Italian banking groups of international standing. In 2020, the three largest banking groups in Italy were: UniCredit S.p.A., IntesaSanpaolo S.p.A., and Banco BPM S.p.A. The degree of banking concentration in Italy, measured by the share of assets held by the 11 most significant banks in Italy under the SSM, was 80.0 per cent in 2020.
In July 2021, UniCredit S.p.A. entered into exclusive talks with the Italian Ministry of Economy and Finance to buy Monte dei Paschi di Siena S.p.A.
Capitalization. In 2020, the Italian banking system’s aggregate capitalization increased from 2019. At the end of the year, consolidated regulatory capital amounted to €249.0 billion, a 4.7 per cent increase from the end of 2019. In 2020, Tier 1 capital increased to €219.4 billion compared to €206.7 billion in 2019.
In 2020, the banking system’s capital ratios increased compared to 2019. As of December 31, 2020, the Common Equity Tier 1 (“CET1”) ratio was 15.5 per cent and the Tier 1 ratio 16.9 per cent. The total capital ratio increased to 19.2 per cent from 17.2 per cent in 2019. As of December 31, 2020, the Tier 1 ratio and total capital ratio of the five largest Italian banking groups were 17.1 per cent and 19.5 per cent, respectively, compared to 15.0 and 17.4 respectively in 2019.
At the end of 2020, the capital ratios of the five largest Italian banking groups were in line with the average ratios observed by the EBA for a number of European banks of comparable size. In particular, the CET1 ratio of the five largest Italian banking groups was 15.5 per cent as opposed to the same weighted average for the largest European banks of 15.5 per cent.
Bad Debts and Non-Performing Exposure. Bad debts (i.e. debts whose full repayment is uncertain because the relevant debtors are insolvent) decreased by 62.9 per cent in 2020 to €47,209 million, compared to €76,915 million in 2019. As a percentage of total outstanding loans, bad debts decreased to 2.0 per cent in 2020 from 3.5 per cent in 2019. The non-performing exposure (i.e. material exposures that are more than 90 days past-due) of Italian banks continued to decrease in 2020, both generally and at the five largest Italian banks. The non-performing exposures of the entire Italian banking system in 2020 amounted to 4.4 per cent of the total outstanding loans compared to 6.7 per cent in 2019. Similarly, for Italy’s five largest banks non-performing exposure amounted to 4.1 per cent in 2020, against 6.7 per cent in 2019. The average provisioning ratio against non-performing exposure of Italian banks stood at 51.2 per cent as of December 31, 2020.
Measures to assess the condition of Italian Banking System
In order to stabilize the banking system and protect private savings, the Government has enacted measures, which, among other things, allow the Ministry of Economy and Finance to support the recapitalization of Italian banks by subscribing for financial instruments and guaranteeing share capital increases, to provide a state guarantee on funds granted by the Bank of Italy to banks needing emergency liquidity and, in addition to the existing domestic bank deposit guaranty, to guarantee in full all Italian bank deposits. The measures adopted in Italy to preserve the stability of the financial system are aimed at protecting savers and maintaining adequate levels of bank liquidity and capitalization.
59
On December 23, 2016, the Government created a €20.0 billion fund to support the Italian banking system. The fund aims at supporting access to liquidity of Italian banks by providing a government guarantee to the issuance of banks’ securities. Furthermore, the fund is intended to provide support to the recapitalization of banks that during the stress tests would suffer severe impacts as a result of adverse scenarios. Access to the fund is subject to the approval by the ECB of a recapitalization plan and requires the mandatory conversion of the bank’s outstanding junior bonds into shares.
The Bank of Italy and the European Banking Authority ("EBA") periodically conduct stress tests to assess the banking system’s ability to operate in adverse situations.
In January 2020, the EBA launched a EU-wide stress test. However, on March 19, 2020, the EBA announced that the EU-wide stress test would be postponed to 2021 to allow banks to prioritize operational continuity. The stress test was launched in January 2021 to provide supervisors, banks and other market participants with a common analytical framework to consistently compare and assess the resilience of EU banks to adverse market developments and shocks, providing valuable input for assessing the resilience of the European banking sector. It has been conducted on a sample of 50 banks from 15 EU and EEA countries, including 38 banks from euro area countries and 12 banks from Denmark, Hungary, Norway, Poland and Sweden. The Italian banks included in the stress test are Banco BPM S.p.A., Banca Monte dei Paschi di Siena S.p.A., Intesa Sanpaolo S.p.A., Mediobanca Banca di Credito Finanziario S.p.A. and Unicredit S.p.A. The exercise was not designed as a pass-fail test but as a supervisory tool and an input for the Pillar 2 assessment of banks. The adverse scenario is based on a narrative of a prolonged Coronavirus pandemic effect in a ‘lower for longer’ interest rate environment, in which negative confidence shocks would prolong the economic contraction. . The banks included in the 2021 stress test sample reported a 15.3 per cent weighted average transitional CET1 capital ratio as of December 2020. The aggregate capital ratio at the starting point was above the aggregate ratio reported by banks at the beginning of previous EU-wide stress test exercises. Over the stress test horizon, in the adverse scenario the weighted average CET1 capital ratio moved from 15.3 per cent transitional (15.0 per cent fully loaded) as of end of 2020, to 10.3 per cent (10.2 per cent fully loaded) at the end of 2023. Therefore, under the adverse scenario the aggregate transitional CET1 capital ratio decreases by 497 bps over the three-year period of the exercise (485 bps on a fully loaded basis).
Credit Allocation
The Italian credit system has changed substantially during the past decade. Banking institutions have faced increased competition from other forms of intermediation, principally securities markets.
During 2020, overall lending activity, including repos and bad debts, increased by 4.1 per cent as compared to a 0.5 per cent decrease 2019. Lending activity in the Mezzogiorno showed an increase in 2020, with an increase by 3.7 per cent compared to a 0.6 per cent decrease in 2019, whereas in the central and northern regions the increase was of 4.1 per cent in 2020 compared to a decrease by 0.7 per cent in 2019.
Exchange Controls
Following the complete liberalization of capital movements in the European Union in 1990, all exchange controls in Italy were abolished. Residents and non-residents of Italy may make any investments, divestments and other transactions that entail a transfer of assets to or from Italy, subject only to limited reporting, record-keeping and disclosure requirements referred to below. In particular, residents of Italy may hold foreign currency and foreign securities of any kind, within and outside Italy, while non-residents may invest in Italian securities without restriction and may export from Italy cash,
60
instruments of credit or payment and securities, whether in foreign currency or euro, representing interest, dividends, other asset distributions and the proceeds of dispositions.
Italian legislation contains certain requirements regarding the reporting and record-keeping of movements of capital and the declaration in annual tax returns of investments or financial assets held or transferred abroad. Breach of certain requirements may result in the imposition of administrative fines or criminal penalties.
61
THE EXTERNAL SECTOR OF THE ECONOMY
Foreign Trade
Italy is fully integrated into the European and world economies, with imports and exports in 2020 representing 23.5 and 27.6 per cent of real GDP, respectively. Italian exports were affected by the contraction of world trades and the temporary suspensions of productive activities due to Coronavirus pandemic related restrictions as well as by the appreciation of the euro relative to other currencies. However, after an initial decline in the first half of 2020, sales of goods quickly rose to the levels of previous years and Italy's share of world trade of goods remained substantially unchanged. In recent years, Italy has recorded a trade surplus, increasing from €49.6 billion in 2016 to €56.1 billion in 2019. In 2020, the trade surplus was €63.6 billion, mainly boosted by the export of manufactured products, in particular production machinery, textiles, and leather products, and rubber, plastic, non-metallic mineral products, and by a decrease in imports of electrical energy, gas, steam, air conditioning. In 2020, imports decreased by 12.7 per cent, mainly due to a decrease in imports relating to extractive industries and manufacturing industries, compared to a 0.7 per cent increase in 2019. Exports decreased by approximately €10.5 billion in 2019 and €46.8 billion in 2020, mainly affected by manufactured products, which decreased to €461.3 billion and €415.1 billion in 2019 and 2020, respectively, from €447.0 billion in 2018.
The following table illustrates Italy’s exports and imports for the periods indicated. Export amounts do not include insurance and freight costs and only include the costs associated with delivering and loading the goods for delivery. This is frequently referred to as “free on board” or “fob.” Import amounts include all costs, insurance and freight, frequently referred to as “cif.” A fob valuation includes the transaction value of the goods and the value of services performed to deliver the goods to the border of the exporting country; in a cif valuation, the value of the services performed to deliver the goods from the border of the exporting country to the border of the importing country is also included.
Foreign Trade (cif-fob)
| 2016 | 2017 | 2018 | 2019 | 2020 | ||||||||||||||||
| (in € millions) | ||||||||||||||||||||
Exports (fob)(1) | ||||||||||||||||||||
Agriculture, forestry and fishing | 6,852 | 7,115 | 6,876 | 6,934 | 6,982 | |||||||||||||||
Extractive industries | 1,018 | 1,243 | 1,174 | 962 | 940 | |||||||||||||||
Manufactured products | 400,189 | 430,742 | 447,013 | 461,297 | 415,099 | |||||||||||||||
Food, beverage and tobacco products | 31,577 | 34,162 | 35,474 | 38,399 | 39,143 | |||||||||||||||
| Textiles, leather products, clothing, accessories | 48,725 | 51,018 | 53,189 | 57,347 | 46,141 | |||||||||||||||
Wood, wood products, paper, printing | 8,348 | 8,599 | 8,966 | 9,012 | 7,956 | |||||||||||||||
Coke and refined oil products | 10,040 | 13,362 | 14,659 | 13,405 | 7,774 | |||||||||||||||
Chemical substances and products | 27,552 | 30,127 | 31,282 | 30,905 | 29,352 | |||||||||||||||
| Pharmaceutical, chemical-medical, botanical products | 21,361 | 24,722 | 25,923 | 32,690 | 33,927 | |||||||||||||||
| Rubber, plastic, non-metallic mineral products | 25,319 | 26,463 | 27,277 | 27,479 | 25,391 | |||||||||||||||
| Base metal, metal (non-machine) products | 43,433 | 47,333 | 50,088 | 51,483 | 48,690 | |||||||||||||||
Computers, electronic and optical devices | 13,642 | 14,500 | 15,597 | 15,700 | 15,138 | |||||||||||||||
Electrical equipment | 22,065 | 23,343 | 24,249 | 23,889 | 21,745 | |||||||||||||||
| Machines and other non-classified products | 75,960 | 80,143 | 82,280 | 82,719 | 72,320 | |||||||||||||||
Transportation means | 47,634 | 51,044 | 51,573 | 50,569 | 44,674 | |||||||||||||||
62
| 2016 | 2017 | 2018 | 2019 | 2020 | ||||||||||||||||
| (in € millions) | ||||||||||||||||||||
| Products from other manufacturing activities | 24,533 | 25,928 | 26,456 | 27,689 | 22,847 | |||||||||||||||
| Electrical energy, gas, steam, air conditioning | 351 | 355 | 269 | 321 | 315 | |||||||||||||||
Other products | 8,860 | 9,674 | 9,993 | 10,838 | 10,224 | |||||||||||||||
| Total exports | 417,269 | 449,129 | 465,325 | 480,352 | 433,560 | |||||||||||||||
Imports (cif)(1) | ||||||||||||||||||||
Agriculture, forestry and fishing | 13,836 | 14,483 | 14,495 | 14,768 | 14,472 | |||||||||||||||
Extractive industries | 31,179 | 39,821 | 46,728 | 43,351 | 25,550 | |||||||||||||||
Manufactured products | 311,165 | 334,209 | 351,716 | 353,254 | 317,848 | |||||||||||||||
Food, beverage and tobacco products | 29,235 | 30,665 | 30,322 | 30,602 | 28,574 | |||||||||||||||
| Textiles, leather products, clothing, accessories | 30,571 | 31,310 | 32,500 | 32,603 | 29,983 | |||||||||||||||
Wood, wood products, paper, printing | 9,803 | 10,331 | 11,374 | 10,811 | 9,063 | |||||||||||||||
Coke and refined oil products | 6,648 | 8,053 | 9,899 | 8,913 | 5,644 | |||||||||||||||
Chemical substances and products | 34,726 | 37,331 | 39,454 | 38,244 | 36,256 | |||||||||||||||
| Pharmaceutical, chemical-medical, botanical products | 22,942 | 24,243 | 26,539 | 28,956 | 29,570 | |||||||||||||||
| Rubber, plastic, non-metallic mineral products | 13,510 | 14,301 | 14,821 | 15,250 | 13,825 | |||||||||||||||
| Base metal, metal (non-machine) products | 35,806 | 41,283 | 45,148 | 44,325 | 41,788 | |||||||||||||||
Computers, electronic and optical devices | 25,673 | 27,558 | 28,062 | 28,343 | 27,483 | |||||||||||||||
Electrical equipment | 15,654 | 16,793 | 18,012 | 18,172 | 17,351 | |||||||||||||||
| Machines and other non-classified products | 27,984 | 29,562 | 31,300 | 31,424 | 27,862 | |||||||||||||||
Transportation means | 45,452 | 49,058 | 49,977 | 50,763 | 38,267 | |||||||||||||||
| Products from other manufacturing activities | 13,161 | 13,721 | 14,307 | 14,849 | 12,182 | |||||||||||||||
| Electrical energy, gas, steam, air conditioning | 1,681 | 2,067 | 2,619 | 2,089 | 1,572 | |||||||||||||||
Other products | 9,765 | 10,908 | 10,488 | 10,773 | 10,528 | |||||||||||||||
Total imports | 367,626 | 401,487 | 426,046 | 424,236 | 369,970 | |||||||||||||||
Trade balance | 49,643 | 47,642 | 39,280 | 56,116 | 63,590 | |||||||||||||||
________________________________
| (1) | At current prices. |
Source: ISTAT.
The Italian economy relies heavily on foreign sources for energy and other natural resources and Italy is also a net importer of chemical products, agricultural and food industry products, wood and wood products, computers, electronic and optical devices.
Of all the major European countries, Italy is one of the most heavily dependent on imports of energy. Italy’s trade balance remains vulnerable to fluctuations in oil prices, given the high proportion of energy imports. In 2019 and 2020, the energy deficit slightly decreased from 2.0 per cent of GDP to 1.3 per cent of GDP, respectively.
In 2020, exports of goods and services decreased by 13.8 per cent in volume compared to 2019. Exports of goods in 2020 decreased by 9.8 per cent, mainly due to a reduction in demand and, to a lesser extent, to supply related issues linked to Coronavirus related restrictions on non-essential production activities in force between March and April, 2020. This resulted in a 9.8 per cent decrease in exports to
63
non-EU countries, together with a 9.7 per cent decrease in exports to countries in the euro area, leading to a €46.8 billion decrease in exports in 2020.
During 2020, imports of goods and services decreased by 12.6 per cent by volume compared to a 0.4 per cent decrease by volume in 2019. The decrease in imports of goods and services was mainly attributable to a contraction in services provided to Italians traveling abroad (negative 64.7 percent in value). Reductions in the use of means of transport, mining products and mechanics were the main drivers of the decline in purchases of goods, which was more marked in relation to EU trading partners.
Geographic Distribution of Trade
As a member of the European Union, Italy enjoys free access to the markets of the other EU Member States and applies the external tariff common to all EU countries. During the past several years, EU countries have made significant progress in reducing non-tariff barriers such as technical standards and other administrative barriers to trade amongst themselves, and Italy has incorporated into its national law most of the EU directives on trade and other matters. With the accession of new members, the EU now encompasses many of Italy’s most important central and eastern European trading partners. The following tables show the distribution of Italy’s trade for the periods indicated.
Distribution of Trade (cif-fob) - Exports
| 2016 | 2017 | 2018 | 2019 | 2020 | ||||||||||||||||
| (in € millions) | ||||||||||||||||||||
Exports (fob)(1) | ||||||||||||||||||||
| Total EU | 210,996 | 227,102 | 239,283 | 245,447 | 221,663 | |||||||||||||||
| of which | ||||||||||||||||||||
| EMU | 171,293 | 183,058 | 191,674 | 196,416 | 178,492 | |||||||||||||||
| of which | ||||||||||||||||||||
| Austria | 8,884 | 9,522 | 10,248 | 10,465 | 9,188 | |||||||||||||||
| Belgium | 13,525 | 13,488 | 13,304 | 14,257 | 14,874 | |||||||||||||||
| France | 44,008 | 46,333 | 48,655 | 50,561 | 44,660 | |||||||||||||||
| Germany | 52,703 | 56,043 | 58,179 | 58,516 | 55,685 | |||||||||||||||
| Netherlands | 9,710 | 10,500 | 11,661 | 12,000 | 11,256 | |||||||||||||||
| Spain | 21,054 | 23,260 | 24,200 | 24,520 | 20,429 | |||||||||||||||
| Poland | 11,240 | 12,650 | 13,617 | 13,544 | 12,985 | |||||||||||||||
| United Kingdom | 22,417 | 23,185 | 23,798 | 25,233 | 22,420 | |||||||||||||||
| China | 11,057 | 13,489 | 13,127 | 12,969 | 12,887 | |||||||||||||||
| Japan | 6,022 | 6,554 | 6,465 | 7,711 | 7,125 | |||||||||||||||
OPEC countries(2) | 20,828 | 19,124 | 17,668 | 15,875 | 13,360 | |||||||||||||||
| Russia | 6,690 | 7,955 | 7,567 | 7,882 | 7,101 | |||||||||||||||
| Switzerland | 18,966 | 20,575 | 22,328 | 25,990 | 25,231 | |||||||||||||||
| Turkey | 9,599 | 10,112 | 8,780 | 8,346 | 7,727 | |||||||||||||||
| United States | 36,888 | 40,433 | 42,406 | 45,536 | 42,468 | |||||||||||||||
Other(3) | 93,978 | 98,998 | 100,282 | 100,446 | 86,294 | |||||||||||||||
| Total | 417,269 | 449,129 | 465,325 | 480,352 | 433,559 | |||||||||||||||
__________________
| (1) | At current prices. |
| (2) | Gabon terminated its membership to the Organization of the Petroleum Exporting Countries (“OPEC”) in January 1995 and rejoined as of July 2016. Equatorial Guinea and the Republic of Congo became full members of OPEC in May 2017 and June 2018, respectively, while Qatar left OPEC in January 2019. Ecuador suspended its membership in December 1992, rejoined OPEC in October 2007, but decided to withdraw its membership of OPEC effective January 1, 2020. Indonesia suspended its membership in January 2009, reactivated it again in January 2016, but decided to suspend its membership once more in November 2016. For the purposes of the above table, exports to these countries are not included in OPEC countries. |
64
| (3) | Other represents all other countries and/or regions with whom Italy trades; none of such countries or regions accounts for a material amount. |
Source: ISTAT.
Distribution of Trade (cif-fob) - Imports
| 2016 | 2017 | 2018 | 2019 | 2020 | ||||||||||||||||
| (in € millions) | ||||||||||||||||||||
Imports (fob)(1) | ||||||||||||||||||||
| Total EU | 212,083 | 230,015 | 239,454 | 241,671 | 215,243 | |||||||||||||||
| of which | ||||||||||||||||||||
| EMU | 175,930 | 191,322 | 198,917 | 199,805 | 178,309 | |||||||||||||||
| of which | ||||||||||||||||||||
| Austria | 8,428 | 9,349 | 9,627 | 10,181 | 8,460 | |||||||||||||||
| Belgium | 17,756 | 17,745 | 19,289 | 19,786 | 18,162 | |||||||||||||||
| France | 32,767 | 35,072 | 36,626 | 34,827 | 31,316 | |||||||||||||||
| Germany | 59,959 | 65,761 | 70,193 | 68,580 | 60,317 | |||||||||||||||
| Netherlands | 20,182 | 22,724 | 22,693 | 22,247 | 21,926 | |||||||||||||||
| Spain | 19,820 | 21,385 | 20,759 | 22,997 | 19,596 | |||||||||||||||
| Poland | 8,791 | 9,891 | 9,787 | 10,644 | 9,275 | |||||||||||||||
| United Kingdom | 11,254 | 11,550 | 11,265 | 10,388 | 8,417 | |||||||||||||||
| China | 27,346 | 28,460 | 30,889 | 31,663 | 32,144 | |||||||||||||||
| Japan | 4,018 | 4,182 | 3,764 | 4,113 | 3,645 | |||||||||||||||
OPEC countries(2) | 18,538 | 22,817 | 27,569 | 22,114 | 16,832 | |||||||||||||||
| Russia | 10,643 | 12,349 | 14,970 | 14,324 | 9,329 | |||||||||||||||
| Switzerland | 10,618 | 11,223 | 10,961 | 10,933 | 9,519 | |||||||||||||||
| Turkey | 7,468 | 8,300 | 9,039 | 9,457 | 7,456 | |||||||||||||||
| United States | 13,917 | 15,007 | 15,958 | 17,007 | 14,785 | |||||||||||||||
Other(3) | 68,645 | 78,685 | 88,121 | 82,761 | 67,954 | |||||||||||||||
| Total | 367,626 | 401,487 | 426,046 | 424,236 | 369,969 | |||||||||||||||
_______________________________
| (1) | At current prices. |
| (2) | Gabon terminated its membership to the Organization of the Petroleum Exporting Countries (“OPEC”) in January 1995 and rejoined as of July 2016. Equatorial Guinea and the Republic of Congo became full members of OPEC in May 2017 and June 2018, respectively, while Qatar left OPEC in January 2019. Ecuador suspended its membership in December 1992, rejoined OPEC in October 2007, but decided to withdraw its membership of OPEC effective January 1, 2020. Indonesia suspended its membership in January 2009, reactivated it again in January 2016, but decided to suspend its membership once more in November 2016. For the purposes of the above table, exports to these countries are not included in OPEC countries. |
| (3) | Other represents all other countries and/or regions with whom Italy trades; none of which country or region represents a material amount. |
Source: ISTAT.
As in the previous year, during 2020 over half of Italian trade was with other EU countries, with approximately 51.1 per cent of Italian exports and 58.2 per cent of imports attributable to trade with EU countries. Germany remains Italy’s single most important trade partner and in 2020 supplied 16.3 per cent of Italian imports and purchased 12.8 per cent of Italian exports.
In 2020, the trade balance was the result of surpluses both with EU countries and non-EU countries. Italy’s trade balance with EU countries was positive in 2020, with a surplus of approximately €6.4 billion, increasing from the surplus of €3.8 billion recorded in 2019. With respect to non-EU countries, the trade balance in 2020 resulted in a surplus of €57.2 billion, compared to a surplus of €52.3 billion in 2019. Such increase in the trade surplus was driven by a decrease in imports from Russia, OPEC and other countries.
65
In 2020, Italian exports worldwide decreased by 9.7 per cent compared to 2019, as a result of a 9.7 per cent decrease in exports to Eurozone countries and a 9.8 per cent decrease in exports to countries outside the Eurozone.
Balance of Payments
The balance of payments tabulates the credit and debit transactions of a country with foreign countries and international institutions for a specific period. Transactions are divided into three broad groups: current account, capital account and financial account. The current account is made up of (i) trade in goods (visible trade) and (ii) invisible trade, which consists of trade in services, income from profits and interest earned on overseas assets, net of those paid abroad, and net capital transfers to international institutions, principally the European Union. The capital account primarily comprises net capital transfers from international institutions, principally the European Union. The financial account is made up of items such as the inward and outward flow of money for direct investment, investment in debt and equity portfolios, international grants and loans and changes in the official reserves.
In 2010, the gathering and compilation system of the balance of payments and foreign financial position of Italy was updated with the abandonment of bank settlement reporting. The integration of international markets increased the complexity of transactions, which affected the reliability of gathering systems based on bank payments. Models of data collection based on direct gathering with entities involved in international exchanges are now preferred, the use of sample analysis was extended and the banks’ obligation of statistical reporting on behalf of clients was almost entirely eliminated. The new system is based on various sources: (i) census-based collections, such as statistical reports of entities subject to oversight by the Bank of Italy; (ii) administrative data collected by other institutions for compliance purposes; and (iii) sample-based investigations, in particular with non-financial and insurance businesses. Reports of flux and amount are required for financial transactions.
In October 2014, ISTAT adopted new statistical standards outlined by the IMF in the sixth edition of Balance of Payments and International Investment Position Manual (“BPM6”). BPM6, which, consistent with ESA2010, provides the standard framework for the compilation of statistics on balance of payments and international investment positions between an economy and the rest of the world. Relevant methodological innovations include, among others, (i) computation of net revenues of merchanting, (ii) separation between primary income and secondary income, (iii) computation of goods for processing as manufacturing services, and (iv) sign conventions and nomenclature changes in line with national accounts. Unless otherwise provided, all data presented below was prepared in accordance with BPM6.
The following table illustrates the balance of payments of Italy for the periods indicated.
Balance of Payments
| 2016 | 2017 | 2018 | 2019 | 2020 | ||||||||||||||||
| (in € billions) | ||||||||||||||||||||
Current Account(1) | 44.0 | 44.8 | 44.5 | 57.4 | 58.6 | |||||||||||||||
| per cent of GDP | 2.6 | 2.6 | 2.5 | 3.2 | 3.5 | |||||||||||||||
Goods | 60.0 | 54.4 | 45.9 | 60.2 | 67.6 | |||||||||||||||
Non-energy products | 84.9 | 85.9 | 85.4 | 95.9 | 88.4 | |||||||||||||||
Energy products | (25.0 | ) | (31.5 | ) | (39.5 | ) | (35.7 | ) | (20.8 | ) | ||||||||||
Services | (4.1 | ) | (3.8 | ) | (2.9 | ) | (0.8 | ) | (6.8 | ) | ||||||||||
Primary Income | 4.8 | 9.3 | 18.9 | 15.2 | 17.0 | |||||||||||||||
Secondary Income | (16.7 | ) | (15.1 | ) | (17.4 | ) | (17.1 | ) | (19.3 | ) | ||||||||||
66
| 2016 | 2017 | 2018 | 2019 | 2020 | ||||||||||||||||
| (in € billions) | ||||||||||||||||||||
EU Institutions | (14.8 | ) | (11.8 | ) | (14.7 | ) | (14.0 | ) | (15.6 | ) | ||||||||||
Capital Account(1) | (2.6 | ) | 1.2 | (0.3 | ) | (1.8 | ) | (0.4 | ) | |||||||||||
Intangible assets | (2.0 | ) | (1.2 | ) | (1.5 | ) | (2.6 | ) | (1.1 | ) | ||||||||||
Transfers | (0.7 | ) | 2.4 | 1.2 | 0.8 | 0.7 | ||||||||||||||
EU Institutions and Italian PPAA | 1.0 | 4.0 | 2.4 | 2.7 | 2.8 | |||||||||||||||
Financial Account(1) | 32.7 | 47.6 | 26.7 | 46.5 | 49.1 | |||||||||||||||
Direct investment | (11.1 | ) | 0.4 | (4.1 | ) | (1.5 | ) | 9.4 | ||||||||||||
Outward | 12.2 | 10.9 | 33.8 | 29.3 | 4.3 | |||||||||||||||
Inward | 23.4 | 10.5 | 37.9 | 27.8 | (5.1 | ) | ||||||||||||||
Portfolio investment | 139.9 | 84.1 | 120.2 | (52.8 | ) | 109.7 | ||||||||||||||
Equity and investment funds | 44.5 | 85.8 | 28.6 | 37.7 | 58.7 | |||||||||||||||
Debt Securities | 22.7 | 29.3 | 17.2 | 31.3 | 33.7 | |||||||||||||||
Financial Derivatives | (3.3 | ) | (7.2 | ) | (2.7 | ) | 2.5 | (2.9 | ) | |||||||||||
Other investment | (91.6 | ) | (32.3 | ) | (89.3 | ) | 92.2 | (71.1 | ) | |||||||||||
Change in official reserves | (1.2 | ) | 2.7 | 2.6 | 3.2 | 4.0 | ||||||||||||||
Errors and omissions | (8.6 | ) | 1.6 | (17.5 | ) | (9.1 | ) | (9.1 | ) | |||||||||||
________________________________
| (1) | At current prices. |
Source: Bank of Italy.
Current Account
Italy has continued to maintain a current account surplus since 2013. In 2020, Italy’s current account surplus increased to €58.6 billion (3.5 per cent of GDP) compared to €57.4 billion (3.2 per cent of GDP) in 2019. The improvement has mainly reflected a decrease in the energy costs that was partially offset by a decrease in income from non-energy products and the deficit in services. In the first quarter of 2021, the current account surplus stood at €7.4 billion, compared to €7.2 billion in the first quarter of 2020.
Visible Trade. Italy’s fob-fob goods trade surplus increased to €67.6 billion (4.0 per cent of GDP) in 2020 compared to €60.2 billion (3.4 per cent of GDP) in 2019. The non-energy component recorded a surplus of €88.4 billion or 5.3 per cent of GDP in 2020, compared to a surplus of €95.9 billion or 5.3 per cent of GDP in 2019. The energy deficit decreased to €20.8 billion or 1.2 per cent of GDP in 2020 from €35.7 billion or 2.0 per cent of GDP in 2019. In the first quarter of 2021, Italy’s fob-fob goods trade surplus stood at €12.5 billion, compared to €13.2 billion in the first quarter of 2020, with the non-energy component recording a surplus of €19.3 billion and the energy deficit decreasing to €6.8 billion in the first quarter of 2021, respectively, compared to a surplus of €20.6 billion and a deficit of €7.4 billion in the first quarter of 2020, respectively.
Invisible Trade. The deficit in services increased to €6.8 billion in 2020, compared to €0.8 billion in 2019. The higher deficit mainly resulted from a sharp decrease in spending by foreign tourists and was only partially offset by the reduction of foreign travel by Italian residents. In the first quarter of 2021, the deficit in services increased to €3.1 billion, compared to €4.8 billion in the first quarter of 2020, with the surplus in tourism services decreasing to a deficit of €0.1 billion from a surplus of €0.5 billion in the first quarter of 2020, partially offset by the decrease in the transport services deficit, to €1.7 billion from €2.8 billion.
67
Primary Income. For a fifth consecutive year, the primary income account ran a surplus in 2020, which increased to €17.0 billion, compared to €15.2 billion in 2019. In the first quarter of 2021, the primary income surplus remained stable compared to the first quarter of 2020 at €4.4 billion. The primary income surplus increase was driven by the income component from capital, favored in turn by the improvement of the net position abroad and the positive differential between the yield on foreign securities held by residents and that of Italian securities in the portfolios of non-residents.
Secondary Income. In 2020, the deficit on the secondary income account increased to €19.3 billion, compared to €17.1 billion in 2019. The increase in the deficit was mainly caused by the decrease of payments by EU institutions, which decreased from €1.7 billion in 2019 to €1.6 billion in 2020. In the first quarter of 2021, the secondary income deficit increased to €6.4 billion, compared to €5.6 billion in the first quarter of 2020.
Capital Account
In 2020, the capital account ran a deficit of €0.4 billion, compared to a deficit of approximately €1.8 billion in 2019. In the first quarter of 2021, the capital account deficit increased to €0.6 billion, compared to €0.5 billion in the first quarter of 2020.
Financial Account and the Net External Position
In 2020, the financial account surplus increased to €49.1 billion from €46.5 billion in 2019 due to an increase in other investments which decreased by €163.3 billion from 2019, partially offset by a net increase in portfolio investment, which increased by €162.5 billion from 2019. The financial account showed that, at the end of 2020, for the first time in thirty years, Italy’s net external debtor position amounted to positive €30.4 billion, or 1.8 per cent of GDP, increasing by €46.9 billion compared to 2019, mainly due to the current account surplus. In the first quarter of 2021, the financial account increased to a €15.2 billion surplus, compared to a €2.5 billion deficit in the first quarter of 2020.
Direct Investment. Italian direct investment abroad decreased to €4.3 billion in 2020, compared to €29.3 billion in 2019, mainly due to the decrease of net investment in EU Member States, such as The Netherlands and Spain, as well as in the United States. Foreign direct investment in Italy, in the form of intra-company loans from foreign parent companies to Italian subsidiaries, decreased to negative €5.1 billion in 2020 from €27.8 billion in 2019.
The following table shows total direct investment abroad by Italian entities and total direct investment in Italy by foreign entities for the periods indicated.
Direct Investment by Country(1)
| 2016 | 2017 | 2018 | 2019 | 2020 | ||||||||||||||||
| (in € millions) | ||||||||||||||||||||
| Direct investment abroad | ||||||||||||||||||||
Netherlands | 2,370 | 2,564 | 3,191 | (192 | ) | (6,429 | ) | |||||||||||||
Luxembourg | (397 | ) | 214 | 3,322 | 99 | 2,052 | ||||||||||||||
United States | (1,309 | ) | 1,376 | 4,160 | 1,634 | 480 | ||||||||||||||
United Kingdom | (1,699 | ) | (1,726 | ) | 117 | 1,045 | 1,199 | |||||||||||||
France | 1,605 | 769 | 3,186 | 1,722 | (1,342 | ) | ||||||||||||||
Switzerland | 700 | (602 | ) | 380 | 1,856 | 194 | ||||||||||||||
Germany | (1,000 | ) | (1,228 | ) | 2,637 | 24 | 1,059 | |||||||||||||
Spain | (481 | ) | (6,096 | ) | 5,912 | 2,420 | (900 | ) | ||||||||||||
Brazil | 1,309 | 287 | 710 | 535 | 1296 | |||||||||||||||
68
| 2016 | 2017 | 2018 | 2019 | 2020 | ||||||||||||||||
| (in € millions) | ||||||||||||||||||||
Belgium | 1,974 | (3,053 | ) | (2,447 | ) | 1,987 | 679 | |||||||||||||
Argentina | (1,097 | ) | 241 | 98 | (39 | ) | 1,103 | |||||||||||||
Sweden | (260 | ) | (383 | ) | 785 | (11 | ) | 317 | ||||||||||||
Other | 10,534 | 18,549 | 11,720 | 15,537 | 4,608 | |||||||||||||||
Total | 12,249 | 10,912 | 33,817 | 29,282 | 4,316 | |||||||||||||||
| Direct investment in Italy | ||||||||||||||||||||
Netherlands | 6,676 | 6,065 | 4,296 | 12,735 | (4,421 | ) | ||||||||||||||
Luxembourg | (9,653 | ) | (3,775 | ) | (5,502 | ) | 7,711 | (5,810 | ) | |||||||||||
United States | 1,031 | 724 | 136 | (497 | ) | 183 | ||||||||||||||
United Kingdom | 3,258 | (1,086 | ) | 3,791 | (3,380 | ) | (1,785 | ) | ||||||||||||
France | 16,949 | (1,573 | ) | 31,214 | 1,304 | 1,559 | ||||||||||||||
Switzerland | 1,784 | 2,265 | 1,496 | 2,558 | 551 | |||||||||||||||
Germany | 3,430 | 3,072 | 3,141 | 5,195 | 1,613 | |||||||||||||||
Spain | 610 | 740 | (637 | ) | 912 | 758 | ||||||||||||||
Brazil | (44 | ) | 84 | 38 | (30 | ) | 200 | |||||||||||||
Belgium | (3,217 | ) | 1,364 | (391 | ) | (1,271 | ) | (51 | ) | |||||||||||
Argentina | 79 | 73 | 147 | 37 | 116 | |||||||||||||||
Sweden | 94 | 305 | 791 | 1,353 | 182 | |||||||||||||||
Other | 2,018 | 2,075 | -640 | 1,180 | 1,767 | |||||||||||||||
Total | 23,350 | 10,484 | 37,936 | 27,816 | (5,090 | ) | ||||||||||||||
________________________________
| (1) | Figures do not include real estate investment, investments made by Italian banks abroad and investments made by foreign entities in Italian banks. Data for the period 2015-2019 is calculated in accordance with the sixth edition of the IMF Balance of Payments and International Investment Position Manual. |
Source: ISTAT and National Institute for International Trade.
Portfolio Investment. In 2020, the balance of portfolio investment registered net outflows of €109.7 billion compared to net inflows of €52.8 billion in 2019. In addition to Italian residents purchasing of foreign securities for €92.4 billion in 2020 (compared to purchases for €69.0 billion in 2019), foreign investors disposed of Italian securities for €17.3 billion in 2020 (compared to purchases for €121.8 billion in 2018).
Following significant investments in 2019 both in shares (€15.3 billion, compared to €4.9 billion invested in 2018) and debt securities (€106.5 billion, compared to €69.5 billion disposed in 2018), in 2020 Italian securities experienced disposals both in shares (€4.1 billion) and debt securities (€13.3 billion).
In the first quarter of 2021, the balance of portfolio investment registered net outflows of €19.5 billion, compared to net inflows of €37.8 billion in the first quarter of 2020.
Other Investment. Other investment includes trade receivables, deposits and other transactions, recording a net decrease of approximately €71.1 billion in 2020, compared to a net increase of €92.2 billion in 2019. In 2020, Italy’s cumulative contributions to financial support of EMU countries stood at €57.7 billion (decreasing from €57.8 in 2019 and €58.2 billion in 2018, 2017, 2016 and 2015). This amount includes Italy’s exposure in the financial assistance operations of the European Financial Stability Facility, which also involved entering into bilateral loans (€43.3 billion) as well as capital contributions to the European Stability Mechanism (€14.3 billion).
The Bank of Italy’s Trans-European Automated Real-Time Gross Settlement Express Transfer (“TARGET2”) debtor position increased in 2020 by approximately €77.0 billion. This decrease was
69
mainly caused by a decrease in portfolio outflows in the first half of 2020 in conjunction with the reduction of net deposits collected by resident banks, partially offset by the surplus of the current account.
Errors and Omissions. In 2020, the item “errors and omissions” amounted to a negative €9.1 billion, compared to a negative €9.1 billion in 2019. The amount recorded in the errors and omissions account typically reflects unreported international transactions, such as unreported funds transferred abroad by Italian residents and exporters’ unreported payments by non-residents to accounts held abroad.
Reserves and Exchange Rates
The following table sets forth, for the periods indicated, certain information regarding the U.S. Dollar/Euro reference rate, as reported by the European Central Bank, expressed in U.S. dollar per euro.
US Dollar/Euro Exchange Rate
| Period | Period End | Yearly Average Rate (1) | High | Low | ||||||||||||
| (U.S.$ per €1.00) | ||||||||||||||||
2016 | 1.0541 | 1.1069 | 1.1569 | 1.0364 | ||||||||||||
2017 | 1.1993 | 1.1297 | 1.2060 | 1.0385 | ||||||||||||
2018 | 1.1145 | 1.1711 | 1.3953 | 1.0364 | ||||||||||||
2019 | 1.1234 | 1.1195 | 1.1535 | 1.0899 | ||||||||||||
2020 | 1.2271 | 1.1422 | 1.2281 | 1.0707 | ||||||||||||
________________________________
| (1) | Average of the reference rates for the period. |
Source: European Central Bank.
The following table sets forth information relating to euro exchange rates for certain other major currencies for the periods indicated.
Euro Exchange Rates
Yearly Average Rate(1) per €1.00 | ||||||||||||||||||||
| 2016 | 2017 | 2018 | 2019 | 2020 | ||||||||||||||||
Japanese Yen | 120.20 | 126.71 | 130.40 | 122.02 | 121.85 | |||||||||||||||
British Pound | 0.8195 | 0.8767 | 0.8847 | 0.8778 | 0.8897 | |||||||||||||||
Swiss Franc | 1.0902 | 1.1117 | 1.1550 | 1.1124 | 1.0705 | |||||||||||||||
Czech Koruna | 27.034 | 26.326 | 25.647 | 25.670 | 26.455 | |||||||||||||||
________________________________
| (2) | Average of the reference rates for the period. |
Source: European Central Bank.
In 2020, official reserves increased to €172.0 billion from €156.0 billion in 2019. The increase was mainly due to the value adjustments of gold reserves and flows of securities. As of December 31, 2020, the share held by the Bank of Italy into the capital of the European Central Bank stood at approximately €1.3 billion (representing 13.8 per cent of the capital of the European Central Bank), increasing by 1.5 per cent as a result of the disposal by the Bank of England of its share in the European Central Bank following Brexit.
As of December 31, 2020, gold reserves were worth €121.7 billion, compared with €106.4 billion in 2019.
70
The following table illustrates the official reserves of Italy as of the end of each of the periods indicated.
Official Reserves
| 2016 | 2017 | 2018 | 2019 | 2020 | ||||||||||||||||
| (in € billion) | ||||||||||||||||||||
Gold(1) | 86.6 | 85.3 | 88.4 | 106.7 | 121.7 | |||||||||||||||
| Special Drawing Rights | 6.5 | 6.4 | 6.7 | 7.1 | 6.9 | |||||||||||||||
| Total position with IMF | 2.5 | 2.2 | 3.0 | 3.4 | 4.7 | |||||||||||||||
| Other reserves | 33.5 | 32.3 | 35.1 | 38.8 | 38.7 | |||||||||||||||
| Total reserves | 129.1 | 126.1 | 133.2 | 156.0 | 172.0 | |||||||||||||||
_____________________________
| (1) | Valued at market exchange rates and prices. |
Source: Bank of Italy.
71
PUBLIC FINANCE
The Budget Process
Italy’s fiscal year is the calendar year. The budget and financial planning process of the Government is governed by Law No. 196 of December 31, 2009, as amended by Law No. 39 of April 7, 2011 and Law No. 163 of August 4, 2016.
Budget Process. The budget process complies with European requirements, whose principal aim is to allow the EU to review all Member States’ budgetary policies and reform strategies simultaneously. The “European Semester” is the first phase of the EU’s annual cycle of economic policy guidance and surveillance. Following certain changes enacted by the Commission in October 2015, the European Semester starts in November with the publication by the Commission of the Annual Growth Survey, following which the Commission issues recommendations and opinions on draft budgetary plans, identifying the Member States for which a further analysis is required (i.e., the Alert Mechanism Report). During the period from December to January, bilateral meetings with Member States and discussions with the EU Council take place. During the same period, among other things, each Member State adopts the relevant budget law. In February, the Commission issues country-specific reports, analyzing the economic situation and policies of each Member State and assessing whether imbalances exist in the Member States for which a further analysis is required. In March, the EU Council, based on the Annual Growth Survey (after consulting the Economic and Financial Committee), identifies the main economic goals and strategies of the EU and the euro area and provides strategic guidance on policies. In April, the Member States, following bilateral meetings with the Commission and taking the EU Council’s guidelines into account, provide to the Commission their medium-term budgetary and economic strategies by submitting their updated stability programs and national reform programs. In May, the Commission makes country-specific recommendations and, in June or July, the EU Parliament and the EU Council discuss such country-specific recommendations before a definitive endorsement is made by the EU Council. These policy recommendations are incorporated by governments into their national budgets and other reform plans during the “National Semester” (i.e. the second phase of the EU’s annual cycle of economic policy guidance and surveillance). Following the adoption in May 2013 of European Union Regulations No. 472/2013 and No. 473/2013 (Two Pack Regulation), Member States are required to submit by October 15 a draft budgetary plan for the following year. The Commission then delivers an opinion on each draft budgetary plan by November 30 of that year.
Consistent with the European Semester, the Government submits to Parliament, by April 10, the Economic and Financial Document (Documento di Economia e Finanza or “EFD”), which consists of three sections: (i) the stability program, which establishes public finance targets; (ii) the analysis and tendencies in public finance, which contains data and information regarding the prior fiscal year, any discrepancies from previous program documents, and projections for at least the three following years; and (iii) the national reform program, which sets forth the country’s priorities and main structural reforms to be effected in the following year. Following Parliament’s approval of the EFD, the stability program and the national reform program are submitted to the EU Council and the Commission by April 30. Following the EU Council’s review, by September 27, the Government submits to Parliament an update note to the EFD, which provides updates to the macroeconomic and financial projections and program targets contained in an EFD and incorporates any requests of the EU Council.
Subsequently, the Government submits (i) to the Commission, by October 15, a Draft Budgetary Plan for the following year, and (ii) to Parliament, by October 20, the final budgetary package, which consists of the Legge di Bilancio (“Budget Law”) and the Legge di Stabilità (“Stability Law”). The Budget Law authorizes general government revenues and expenditures for the upcoming three-year period. The Stability Law includes legal and financial measures for the three-year period covered by the
72
Budget Law, implementing the budget and the targets contemplated in an EFD. The Ministry of Economy and Finance (“MEF”) submits to Parliament by April of the subsequent year the Report on the General Economic Situation of the Country, which details the performance of the Italian economy of the previous year.
Approval of financial year. In addition, by May 31 of the following year, the MEF is required to submit the “Rendiconto Generale dello Stato” (the “Rendiconto”) to the Court of Auditors (Corte dei Conti). The Rendiconto contains the statement of income and the balance sheet of Italy for the previous fiscal year. The Corte dei Conti verifies that the Rendiconto is consistent with the budget provisions contained in the Budget Law of the previous year. Upon completion of the Corte dei Conti’s review, the MEF submits the Rendiconto to Parliament by June 30 for approval.
European Economic and Monetary Union
Under the terms of the Maastricht Treaty, Member States participating in the EMU, or “Participating States”, are required to avoid excessive government deficits. In particular, they are required to maintain:
| • | a government deficit, or net borrowing, that does not exceed 3.0 per cent of GDP, unless the excess is exceptional and temporary and the actual deficit remains close to the 3.0 per cent ceiling; and |
| • | a gross accumulated public debt that does not exceed 60.0 per cent of GDP or is declining at a satisfactory pace toward this reference value (defined as a decrease of the excess debt by 5.0 per cent per year on average over three years). |
For additional information on Italy’s status under these covenants, see “—The 2020 Economic and Financial Document.”
Although Italy’s public debt exceeded 60.0 per cent of GDP in 1998, Italy was included in the first group of countries to join the EMU on January 1, 1999 on the basis that public debt was declining at a satisfactory pace toward the 60.0 per cent reference value.
In order to ensure the ongoing convergence of the economies participating in the EMU, to consolidate the single market and maintain price stability, effective on July 1, 1998, the Participating States agreed to a Stability and Growth Pact (the “SGP”). The SGP is an agreement among the Participating States aimed at clarifying the Maastricht Treaty’s provisions for an excessive deficit procedure and strengthening the surveillance and co-ordination of economic policies. The SGP also calls on Participating States to target budgetary positions aimed at a balance or surplus in order to adjust for potential adverse fluctuations, while keeping the overall government deficit below a reference value of 3.0 per cent of GDP.
Under SGP regulations, Participating States are required to submit each year a stability program and non-participating Member States are required to submit a convergence program. These programs cover the current year, the preceding year and at least the three following years, and are required to set forth:
| • | projections for a medium-term budgetary objective (a country-specific target which, for Participating States having adopted the euro, must fall within 1.0 per cent of GDP and balance or surplus, net of one-off and temporary measures) and the adjustment path towards this objective, including information on expenditure and revenues ratios and on their main components; |
73
| • | the main assumptions about expected economic developments and the variables (and related assumptions) that are relevant to the realization of the stability program such as government investment expenditure, real GDP growth, employment and inflation; |
| • | the budgetary strategy and other economic policy measures to achieve the medium-term budgetary objective comprising detailed cost-benefit analysis of major structural reforms having direct cost-saving effects and concrete indications on the budgetary strategy for the following year; |
| • | an analysis of how changes in the main economic assumptions would affect the budgetary and debt position, indicating the underlying assumptions about how revenues and expenditures are projected to react to variations in economic variables; and |
| • | if applicable, the reasons for a deviation from the adjustment path towards the budgetary objective. |
Based on assessments by the Commission and the Economic and Financial Committee, the EU Council delivers an opinion on whether:
| • | the economic assumptions on which the program is based are plausible; |
| • | the adjustment path toward the budgetary objective is appropriate; and |
| • | the measures being taken and/or proposed are sufficient to achieve the medium-term budgetary objective. |
The EU Council can issue recommendations to the Participating State to take the necessary adjustment measures to reduce an excessive deficit. When assessing the adjustment path taken by Participating States, the EU Council will examine whether the Participating State concerned pursued the annual improvement of its cyclically adjusted balance, net of one-off and other temporary measures, with 0.5 per cent of GDP as a benchmark. When defining the adjustment path for those Participating States that have not yet reached the respective budgetary objective, or in allowing those that have already reached it to temporarily depart from it, the EU Council will take into account structural reforms which have long-term cost-saving effects, implementation of certain pension reforms and whether higher adjustment effort is made in economic “good times.” If the Participating State repeatedly fails to comply with the EU Council’s recommendations, the EU Council may require the Participating State to make a non-interest-bearing deposit equal to the sum of:
| • | 0.2 per cent of the Participating State’s GDP, and |
| • | one tenth of the difference between the government deficit as a percentage of GDP in the preceding year and the reference value of 3.0 per cent of GDP. |
This deposit may be increased in subsequent years if the Participating State fails to comply with the EU Council’s recommendations, up to a maximum of 0.5 per cent of GDP, and may be converted into a fine if the excessive deficit has not been corrected within two years after the decision to require the Participating State to make the deposit. In addition to requiring a non-interest-bearing deposit, in the event of repeated non-compliance with its recommendations, the EU Council may require the Participating State to publish additional information, to be specified by the EU Council, before issuing bonds and securities and invite the European Investment Bank to reconsider its lending policy towards the Participating State. If the Participating State has taken effective action in compliance with the
74
recommendation, but unexpected adverse economic events with major unfavorable consequences for government finances occur after the adoption of that recommendation, the EU Council may adopt a revised recommendation, which may extend the deadline for correction of the excessive deficit by one year.
Finally, the Fiscal Compact contained within the inter-governmental Treaty on Stability, Coordination and Governance (the “TSCG”) complements, and in some areas enhances further, key provisions of the SGP. Specifically, the Fiscal Compact requires Member States to enshrine in national law a balanced budget rule with a lower limit of a structural deficit of 0.5 per cent of GDP, centered on the concept of the country-specific medium-term objective (“MTO”) as defined in the SGP. The Fiscal Compact’s provisions also increase the role of independent bodies, which are given the task of monitoring compliance with national fiscal rules, including the national correction mechanism in case of deviation from the MTO or the adjustment path towards it. The TSCG entered into force on January 1, 2013 and is binding for all euro area Member States that have ratified it, while other contracting parties will be bound only once they adopt the euro or earlier if they sign it. Italy ratified the TSCG in July 2012.
Accounting Methodology
Pursuant to Law No. 196 of December 31, 2009 and its implementing regulation, Italy utilizes the system of “general government accounting.” European Union countries are required to use general government accounting for purposes of financial reporting. EUROSTAT is the European Union entity responsible for decisions with respect to the application of such general government accounting criteria. General government accounting includes revenues and expenditures from both central and local government and from social security funds, or those institutions whose principal activity is to provide social benefits. Italy utilizes general government accounting on both an accrual and cash-basis.
ESA2010 National Accounts. Effective September 2014, ISTAT adopted a new system of national accounts in accordance with the new European System of National and Regional Accounts (ESA2010) as set forth in European Union Regulation 549/2013. ESA2010 introduced several key changes to its predecessor European System of Accounts (ESA95), reflecting developments in the methodological and statistical tools widely used at international level to measure modern economies. Among others, changes are aimed at the harmonization of accounting methods among EU Members States and include the following: (i) research and development expenditure have been recognized as capital assets; (ii) goods sent abroad, or received from abroad, for processing without change in ownership have been excluded from the corresponding export and import figures, which only include the related processing activity; (iii) public defense spending has been reclassified from intermediate consumption to gross fixed investment; (iv) the list of institutional units belonging to the general government sector has been revised; and (v) interest accruing on financial derivatives (including public debt swaps) has been excluded from net borrowing. Italy’s GDP data for the years 2009 to 2020 was prepared in accordance with ESA2010 accounting system.
Measures of Fiscal Balance
Italy reports its fiscal balance using two principal methods:
| • | Net borrowing, or government deficit, which is consolidated revenues less consolidated expenditures of the general government. This is the principal measure of fiscal balance, and is calculated in accordance with European Union accounting requirements. Italy also reports its structural net borrowing, which is a measure, calculated in accordance with methods adopted by the Commission, of the level of net borrowing after the effects of the business cycle have been taken into account. Structural net borrowing assumes that the output gap, which measures how |
75
much the economy is outperforming or underperforming its actual capacity, is zero. As there can be no precise measure of the output gap, there can be no precise measure of the structural government deficit. Accordingly, the structural net borrowing figures shown in this document are necessarily estimates.
| • | Primary balance, which is consolidated revenues less consolidated expenditures of the general government excluding interest payments and other borrowing costs of the general government. The primary balance is used to measure the effect of discretionary actions taken to control expenditures and increase revenues. |
The table below shows selected public finance indicators for the periods indicated.
Selected Public Finance Indicators(*)
| 2016 | 2017 | 2018 | 2019 | 2020 | ||||||||||||||||
| (in € millions, except percentage) | ||||||||||||||||||||
General government expenditure(1) | 832,265 | 846,807 | 857,152 | 871,003 | 946,219 | |||||||||||||||
General government expenditure, as a percentage of GDP(2) | 49.1 | 48.8 | 48.4 | 48.6 | 57.3 | |||||||||||||||
| General government revenues | 791,500 | 804,807 | 818,524 | 843,102 | 789,359 | |||||||||||||||
General government revenues, as a percentage of GDP(2) | 46.7 | 46.3 | 46.2 | 47.1 | 47.8 | |||||||||||||||
| Net borrowing | 40,765 | 42,000 | 38,628 | 27,901 | 156,860 | |||||||||||||||
| Net borrowing, as a percentage of GDP | 2.4 | 2.4 | 2.2 | 1.6 | 9.5 | |||||||||||||||
| Primary balance | 25,623 | 23,457 | 25,967 | 32,450 | (99,551 | ) | ||||||||||||||
| Primary balance, as a percentage of GDP | 1.5 | 1.4 | 1.5 | 1.8 | (6.0 | ) | ||||||||||||||
| Public debt | 2,285,647 | 2,329,347 | 2,380982 | 2,409,942 | 2,573,386 | |||||||||||||||
Public debt as a percentage of GDP(2) | 134.8 | 134.1 | 134.4 | 134.6 | 155.8 | |||||||||||||||
| GDP (nominal value) | 1,676,766 | 1,724,070 | 1,752,671 | 1,778,659 | 1,634,493 | |||||||||||||||
________________________________
| (*) | Figures are taken from the data published in the 2020 Bank of Italy Annual Report and the warehouse of statistics produced by ISTAT. Accordingly, figures do not necessarily match GDP and Public Debt data included elsewhere in this Prospectus. |
| (1) | Includes revenues from the divestiture of state-owned real estate (deducted from capital expenditures). |
| (2) | Figures are gross of euro area financial support. |
Source: Bank of Italy.
Large net borrowing requirements and high levels of public debt were features of the Italian economy until the early 1990s. In accordance with the Maastricht Treaty, the reduction of net borrowing and public debt became a national priority for Italy. Italy gradually reduced its net borrowing as a percentage of GDP to comply with the 3.0 per cent threshold set by the Maastricht Treaty. In 2016, net borrowing as a percentage of GDP decreased to 2.4 per cent compared to 2.6 per cent in 2015. In 2017 and 2018, net borrowing as a percentage of GDP remained substantially unchanged at 2.4 per cent and 2.2 per cent, respectively. In 2019, net borrowing as a percentage of GDP decreased to 1.6 per cent, mainly as a result of a revenue increase and a decrease in interest fees. As of December 31, 2020, Italy’s net borrowing had increased substantially and was approximately €156.9 billion, representing 9.5 per cent of GDP, as a result of the additional indebtedness incurred to implement measures to recover from the negative effects of the Coronavirus pandemic.
76
Since 2010, the Government has provided financial support in respect of Greece and other Participating States, via bilateral loans, participation to the ESFS and direct contributions to the ESM. In 2020, government cumulative expenditure on euro area financial support decreased by 0.2 per cent to €57.7 billion, of which €43.4 billion via bilateral loans and participation to the EFSF and €14.3 billion through contributions to the ESM programme.
Since 1999, the Government has taken steps to lengthen the average maturity of debt and reduce the floating rate portion. This element, together with the introduction of the single currency, made government debt less sensitive to variations in short-term interest rates and exchange rates. Consistent with the past, the government’s debt management policy in 2020 was to maintain exposure to market risks, mainly interest rate and refinancing risks, within the limits set out in 2014. For additional information on Italy’s debt-to-GDP ratio, see “Public Debt.”
The 2020 Economic and Financial Document
On April 24, 2020, the Italian Council of Ministers approved the 2020 Economic and Financial Document. Due to the Coronavirus pandemic, and in line with other EU member states, public finance forecasts were limited to the period 2020-2021 and approval of the 2020 National Reform Programme was postponed. The 2020 National Reform Programme was approved on July 29, 2020.
The 2020 Stability Programme. The 2020 Stability Programme reflected the impact of the Coronavirus pandemic on the Italian economy and focused on measures to be adopted to sustain the economy. The table below presents the main public finance objectives (taking into account the expected effects resulting from the implementation of new policies) and the public finance trends (estimated at unchanged legislation) included in the 2020 Stability Programme, as well as the difference (if any) between these two scenarios. The substantial changes from the estimates included in the 2019 Stability Programme were primarily caused by an expected fall in nominal GDP over the same period of 2019 as a consequence of the national lockdown imposed by the Government from March 9, 2020 to May 4, 2020, and other direct and indirect effects of the Coronavirus pandemic on the Italian economy.
Public Finance Objectives and Trends (in per cent of GDP)
| 2020 Stability Program | 2019 | 2020 | 2021 | |||||||||
| Net Borrowing | ||||||||||||
| Objectives | (1.6 | ) | (10.4 | ) | (5.7 | ) | ||||||
| Trends | (1.6 | ) | (7.1 | ) | (4.2 | ) | ||||||
| Difference | 0.0 | 3.3 | 1.5 | |||||||||
| Primary Balance | ||||||||||||
| Objectives | 1.7 | (6.8 | ) | (2.0 | ) | |||||||
| Trends | 1.7 | (3.5 | ) | (0.6 | ) | |||||||
| Difference | 0.0 | 3.3 | 1.4 | |||||||||
| Interest Expenditure | ||||||||||||
| Objectives | (3.4 | ) | (3.7 | ) | (3.7 | ) | ||||||
| Trends | (3.4 | ) | (3.6 | ) | (3.6 | ) | ||||||
| Difference | 0.0 | 0.1 | 0.1 | |||||||||
| Structural Net Borrowing | ||||||||||||
| Objectives | N/A | N/A | N/A | |||||||||
| Trends | (1.9 | ) | (3.6 | ) | (3.0 | ) | ||||||
| Difference | N/A | N/A | N/A | |||||||||
| Structural Change | ||||||||||||
| Objectives | N/A | N/A | N/A | |||||||||
| Trends | 0.6 | (1.7 | ) | 0.6 | ||||||||
| Difference | N/A | N/A | N/A | |||||||||
77
| 2020 Stability Program | 2019 | 2020 | 2021 | |||||||||
| Public Debt, gross of euro area financial support | ||||||||||||
| Objectives | 134.8 | 155.7 | 152.7 | |||||||||
| Trends | 134.8 | 151.8 | 147.5 | |||||||||
| Difference | 0.0 | (3.9 | ) | (5.2 | ) | |||||||
| Public Debt, net of euro area financial support | ||||||||||||
| Objectives | 131.6 | 152.3 | 149.4 | |||||||||
| Trends | 131.6 | 148.4 | 144.3 | |||||||||
| Difference | 0.0 | (3.9 | ) | (5.1 | ) | |||||||
________________________________
Source: Ministry of Economy and Finance
The table below sets out the macroeconomic forecasts prepared by Italy through 2021 in connection with the 2020 Stability Programme.
Macroeconomic Forecasts (in per cent)
| 2020 Stability Programme | 2019 | 2020 | 2021 | |||||||||
| Real GDP | 0.3 | (8.0 | ) | 4.7 | ||||||||
| Nominal GDP | 1.2 | (7.1 | ) | 6.1 | ||||||||
| Private consumption | 0.4 | (7.2 | ) | 4.0 | ||||||||
| Public consumption | (0.4 | ) | 0.7 | 0.3 | ||||||||
| Gross fixed investment | 1.4 | (12.3 | ) | 4.3 | ||||||||
| Inventories (per cent of GDP) | (0.6 | ) | (0.7 | ) | 0.2 | |||||||
| Exports of goods and services | 1.2 | (14.4 | ) | 13.5 | ||||||||
| Imports of goods and services | (0.4 | ) | (13.0 | ) | 10.0 | |||||||
| Domestic demand | 0.4 | (6.5 | ) | 3.3 | ||||||||
| Change in inventories | (0.6 | ) | (0.7 | ) | 0.2 | |||||||
| Net exports | 0.5 | (0.8 | ) | 1.2 | ||||||||
________________________________
Source: Ministry of Economy and Finance.
The 2020 National Reform Programme. As part of the 2020 National Reform Programme, the Government identified ten policy areas where structural reform is necessary. These areas are: (i) a fully digital country; (ii) a country with safe and efficient infrastructure; (iii) a country that is more green and sustainable; (iv) public administration dedicated to citizens and businesses; (v) a comprehensive plan for sustaining supply chains; (vi) a more competitive and sustainable economic framework; (vii) greater investments in research and education; (viii) a more fair an inclusive Italy; (ix) a more modern and efficient judiciary; and (x) structural funds.
The following table compares the main finance indicators included in the Update of the 2019 Economic and Financial Document and the 2020 Economic and Financial Document. Due to the uncertainty caused by the ongoing Coronavirus pandemic, and in line with other EU Member States, public forecasts were limited to the period 2020-2021.
78
Main Finance Indicators – Update of the 2019 Economic and Financial Document v. 2020 Economic and Financial Document
| 2019 | 2020 | 2021 | ||||||||||
| Nominal GDP growth rate | ||||||||||||
| Update of the 2019 Economic and Financial Document | 1.0 | 2.3 | 2.3 | |||||||||
| 2020 Economic and Financial Document | 1.2 | (7.1 | ) | 6.1 | ||||||||
| Difference | 0.2 | (9.4 | ) | 3.8 | ||||||||
| Net Borrowing, as a % of GDP | ||||||||||||
| Update of the 2019 Economic and Financial Document | (2.2 | ) | (2.2 | ) | (1.8 | ) | ||||||
| 2020 Economic and Financial Document | (1.6 | ) | (10.4 | ) | (5.7 | ) | ||||||
| Difference | 0.6 | (8.2 | ) | (3.9 | ) | |||||||
| Public Debt, as a % of GDP | ||||||||||||
| Update of the 2019 Economic and Financial Document | 132.6 | 131.3 | 130.2 | |||||||||
| 2020 Economic and Financial Document | 135.7 | 135.2 | 133.4 | |||||||||
| Difference | 3.1 | 3.9 | 3.2 | |||||||||
________________________________
Source: Ministry of Economy and Finance.
The Update of the 2020 Economic and Financial Document
In October 2020, Italy published its Update of the 2020 Economic and Financial Document, which included revised projections and forecasts on the economic situation in Italy and Europe.
The table below presents the main public finance objectives (taking into account the expected effects resulting from the implementation of new policies) and the public finance trends (estimated at unchanged legislation) included in the 2020 Economic and Financial Document, as well as the difference (if any) between these two scenarios.
Public Finance Objectives and Trends (in % of GDP)
| Update of the 2020 Economic and Financial Document | 2019 | 2020 | 2021 | 2022 | 2023 | |||||||||||||||
| Net Borrowing | ||||||||||||||||||||
| Objectives | (1.6 | ) | (10.8 | ) | (7.0 | ) | (4.7 | ) | (3.0 | ) | ||||||||||
| Trends | (1.6 | ) | (10.8 | ) | (5.7 | ) | (4.1 | ) | (3.3 | ) | ||||||||||
| Difference | 0.0 | 0.0 | 1.3 | 0.6 | (0.3 | ) | ||||||||||||||
| Primary Balance | ||||||||||||||||||||
| Objectives | 1.8 | (7.3 | ) | (3.7 | ) | (1.6 | ) | 0.1 | ||||||||||||
| Trends | 1.8 | (7.3 | ) | (2.4 | ) | (0.9 | ) | (0.1 | ) | |||||||||||
| Difference | 0.0 | 0.0 | 1.3 | 0.7 | (0.2 | ) | ||||||||||||||
| Interest Expenditure | ||||||||||||||||||||
| Objectives | 3.4 | 3.5 | 3.3 | 3.1 | 3.1 | |||||||||||||||
| Trends | 3.4 | 3.5 | 3.3 | 3.2 | 3.2 | |||||||||||||||
| Difference | 0.0 | 0.0 | 0.0 | 0.1 | 0.1 | |||||||||||||||
| Structural Net Borrowing | ||||||||||||||||||||
| Objectives | (1.9 | ) | (6.4 | ) | (5.7 | ) | (4.7 | ) | (3.5 | ) | ||||||||||
| Trends | (2.0 | ) | (6.6 | ) | (4.2 | ) | (3.8 | ) | (3.2 | ) | ||||||||||
| Difference | (0.1 | ) | (0.2 | ) | 1.5 | 0.9 | 0.3 | |||||||||||||
79
| Update of the 2020 Economic and Financial Document | 2019 | 2020 | 2021 | 2022 | 2023 | |||||||||||||||
| Structural Change | ||||||||||||||||||||
| Objectives | 0.4 | (4.5 | ) | 0.7 | 0.9 | 1.2 | ||||||||||||||
| Trends | 0.4 | (4.5 | ) | 2.4 | 0.4 | 0.5 | ||||||||||||||
| Difference | 0.0 | 0.0 | 1.7 | (0.5 | ) | (0.7 | ) | |||||||||||||
| Public Debt, gross of euro area financial support | ||||||||||||||||||||
| Objectives | 134.6 | 158.0 | 155.6 | 153.4 | 151.5 | |||||||||||||||
| Trends | 134.6 | 158.0 | 155.8 | 154.3 | 154.1 | |||||||||||||||
| Difference | 0.0 | 0.0 | 0.2 | 0.9 | 2.6 | |||||||||||||||
| Public Debt, net of euro area financial support | ||||||||||||||||||||
| Objectives | 131.4 | 154.5 | 152.3 | 150.3 | 148.6 | |||||||||||||||
| Trends | 131.4 | 154.5 | 152.5 | 151.2 | 151.1 | |||||||||||||||
| Difference | 0.0 | 0.0 | 0.2 | 0.9 | 2.5 | |||||||||||||||
________________________________
Source: Ministry of Economy and Finance.
The table below presents macroeconomic forecasts prepared by Italy through 2023 in connection with the Update of the 2020 Economic and Financial Document.
Macroeconomic Forecasts (in %)
| Update of the 2019 Economic and Financial Document | 2019 | 2020 | 2021 | 2022 | 2023 | |||||||||||||||
| Real GDP | 0.3 | (9.0 | ) | 5.1 | 3.0 | 1.8 | ||||||||||||||
| Nominal GDP | 1.1 | (8.0 | ) | 5.8 | 4.2 | 2.8 | ||||||||||||||
| Private consumption | 0.4 | (8.9 | ) | 4.9 | 2.8 | 1.8 | ||||||||||||||
| Public consumption | (0.2 | ) | 2.0 | 0.2 | 0.0 | (0.2 | ) | |||||||||||||
| Investments | 1.6 | (13.0 | ) | 7.4 | 4.8 | 2.9 | ||||||||||||||
| Exports of goods and services | 1.0 | (17.4 | ) | 9.5 | 5.6 | 3.5 | ||||||||||||||
| Imports of goods and services | (0.6 | ) | (13.8 | ) | 8.3 | 4.7 | 3.6 | |||||||||||||
| Domestic demand | 0.5 | (7.4 | ) | 4.3 | 2.5 | 1.6 | ||||||||||||||
| Change in inventories | (0.7 | ) | 0.0 | 0.3 | 0.1 | 0.1 | ||||||||||||||
| Net exports | 0.5 | (1.5 | ) | 0.4 | 0.4 | 0.0 | ||||||||||||||
________________________________
Source: Ministry of Economy and Finance.
The following table compares the main finance indicators included in the 2020 Economic and Financial Document and the Update of the 2020 Economic and Financial Document.
Main Finance Indicators – 2020 Economic and Financial Document
v. Update of the 2020 Economic and Financial Document
v. Update of the 2020 Economic and Financial Document
| 2019 | 2020 | 2021 | 2022 | 2023 | ||||||||||||||||
| Nominal GDP growth rate | ||||||||||||||||||||
| 2020 Economic and Financial Document | 1.2 | (7.1 | ) | 6.1 | N/A | N/A | ||||||||||||||
| Update of the 2020 Economic and Financial Document | 1.1 | (8.0 | ) | 5.8 | 4.2 | 2.8 | ||||||||||||||
| Difference | (0.1 | ) | (0.9 | ) | (0.3 | ) | N/A | N/A | ||||||||||||
| Net Borrowing, as a % of GDP | ||||||||||||||||||||
| 2020 Economic and Financial Document | (1.6 | ) | (10.4 | ) | (5.7 | ) | N/A | N/A | ||||||||||||
80
| 2019 | 2020 | 2021 | 2022 | 2023 | ||||||||||||||||
| Update of the 2020 Economic and Financial Document | (1.6 | ) | (10.8 | ) | (7.0 | ) | (4.7 | ) | (3.0 | ) | ||||||||||
| Difference | 0.0 | (0.4 | ) | (1.3 | ) | N/A | N/A | |||||||||||||
| Public Debt, as a % of GDP | ||||||||||||||||||||
| 2020 Economic and Financial Document | 134.8 | 155.7 | 152.7 | N/A | N/A | |||||||||||||||
| Update of the 2020 Economic and Financial Document | 134.6 | 158.0 | 155.6 | 153.4 | 151.5 | |||||||||||||||
| Difference | (0.2 | ) | 2.3 | 2.9 | N/A | N/A | ||||||||||||||
________________________________
Source: Ministry of Economy and Finance.
The EU Council’s policy recommendations to Italy for the period 2020-2021
As part of the European Semester process, in May 2020, the EU Council, acting through ECOFIN, issued specific recommendations to Italy, based on assessments of Italy’s macroeconomic and fiscal situation as outlined in the 2020 Stability Programme. ECOFIN recommended that Italy take action over the period 2020-2021 to:
| • | take all necessary measures to effectively address the Coronavirus pandemic, sustain the economy and support the ensuing recovery; |
| • | when economic conditions allow, pursue fiscal policies aimed at achieving prudent medium-term fiscal positions and ensuring debt sustainability, while enhancing investment; |
| • | strengthen the resilience and capacity of the health system, in the areas of health workers, critical medical products and infrastructure; |
| • | enhance coordination between national and regional authorities; |
| • | provide adequate income replacement and access to social protection, notably for atypical workers; |
| • | mitigate the employment impact of the crisis, including through flexible working arrangements and active support to employment; |
| • | strengthen distance learning and skills, including digital ones; |
| • | ensure effective implementation of measures to provide liquidity to the real economy, including to small and medium-sized enterprises, innovative firms and the self-employed, and avoid late payments; |
| • | front-load mature public investment projects and promote private investment to foster the economic recovery; |
| • | focus investment on the green and digital transition, in particular on clean and efficient production and use of energy, research and innovation, sustainable public transport, waste and water management as well as reinforced digital infrastructure to ensure the provision of essential services; and |
| • | improve the efficiency of the judicial system and the effectiveness of public administration. |
81
The 2021 Economic and Financial Document
In April 2021, the Italian Council of Ministers approved the 2021 Economic and Financial Document.
The 2021 Stability Programme. The table below presents the main public finance objectives (taking into account the expected effects resulting from the implementation of new policies) and the public finance trends (estimated at unchanged legislation) included in the 2021 Stability Programme, as well as the difference (if any) between these two scenarios.
Public Finance Objectives and Trends (in per cent of GDP)
| 2021 Stability Programme | 2020 | 2021 | 2022 | 2023 | 2024 | |||||||||||||||
| Net Borrowing | ||||||||||||||||||||
| Objectives | (9.5 | ) | (11.8 | ) | (5.9 | ) | (4.3 | ) | (3.4 | ) | ||||||||||
| Trends | (9.5 | ) | (9.5 | ) | (5.4 | ) | (3.7 | ) | (3.4 | ) | ||||||||||
| Difference | 0.0 | 2.3 | 0.5 | 0.6 | 0.0 | |||||||||||||||
| Primary Balance | ||||||||||||||||||||
| Objectives | (6.0 | ) | (8.5 | ) | (3.0 | ) | (1.5 | ) | (0.8 | ) | ||||||||||
| Trends | (6.0 | ) | (6.2 | ) | (2.5 | ) | (0.8 | ) | (0.8 | ) | ||||||||||
| Difference | 0.0 | 2.3 | 0.5 | 0.7 | 0.0 | |||||||||||||||
| Interest Expenditure | ||||||||||||||||||||
| Objectives | 3.5 | 3.3 | 3.0 | 2.8 | 2.6 | |||||||||||||||
| Trends | 3.5 | 3.3 | 3.0 | 2.8 | 2.6 | |||||||||||||||
| Difference | 0.0 | 0.0 | 0.0 | 0.0 | 0.0 | |||||||||||||||
| Structural Net Borrowing | ||||||||||||||||||||
| Objectives | (4.7 | ) | (9.3 | ) | (5.4 | ) | (4.4 | ) | (3.8 | ) | ||||||||||
| Trends | (4.9 | ) | (7.2 | ) | (5.0 | ) | (3.8 | ) | (3.9 | ) | ||||||||||
| Difference | (0.2 | ) | 2.1 | 0.4 | 0.6 | (0.1 | ) | |||||||||||||
| Structural Change | ||||||||||||||||||||
| Objectives | (3.0 | ) | (4.5 | ) | 3.8 | 1.0 | 0.6 | |||||||||||||
| Trends | (3.1 | ) | (2.2 | ) | 2.2 | 1.1 | (0.1 | ) | ||||||||||||
| Difference | (0.1 | ) | 2.3 | (1.6 | ) | 0.1 | (0.7 | ) | ||||||||||||
| Public Debt, gross of euro area financial support | ||||||||||||||||||||
| Objectives | 155.8 | 159.8 | 156.3 | 155.0 | 152.7 | |||||||||||||||
| Trends | 155.8 | 157.8 | 154.7 | 153.1 | 150.9 | |||||||||||||||
| Difference | 0.0 | (2.0 | ) | (1.6 | ) | (1.9 | ) | (1.8 | ) | |||||||||||
| Public Debt, net of euro area financial support | ||||||||||||||||||||
| Objectives | 152.3 | 156.5 | 153.2 | 152.0 | 149.9 | |||||||||||||||
| Trends | 152.3 | 154.5 | 151.6 | 150.2 | 148.1 | |||||||||||||||
| Difference | 0.0 | (2.0 | ) | (1.6 | ) | (1.8 | ) | (1.8 | ) | |||||||||||
________________________________
Source: Ministry of Economy and Finance.
The table below sets out the macroeconomic forecasts prepared by Italy through 2024 in connection with the 2021 Stability Programme.
82
Macroeconomic Forecasts (in per cent)
| 2021 Stability Programme | 2020 | 2021 | 2022 | 2023 | 2024 | |||||||||||||||
| Real GDP | (8.9 | ) | 4.5 | 4.8 | 2.6 | 1.8 | ||||||||||||||
| Nominal GDP | (7.8 | ) | 5.6 | 6.2 | 4.0 | 3.2 | ||||||||||||||
| Private consumption | (10.7 | ) | 4.1 | 5.2 | 2.5 | 1.9 | ||||||||||||||
| Public consumption | 1.6 | 2.6 | 0.2 | (0.1 | ) | (0.3 | ) | |||||||||||||
| Gross fixed investment | (9.1 | ) | 8.7 | 9.0 | 4.7 | 3.4 | ||||||||||||||
| Inventories (per cent of GDP) | (0.3 | ) | 0.1 | 0.1 | 0.0 | 0.0 | ||||||||||||||
| Exports of goods and services | (13.8 | ) | 8.2 | 5.7 | 4.0 | 3.4 | ||||||||||||||
| Imports of goods and services | (12.6 | ) | 9.4 | 6.6 | 3.8 | 3.3 | ||||||||||||||
| Domestic demand | (7.9 | ) | 4.5 | 4.8 | 2.4 | 1.7 | ||||||||||||||
| Change in inventories | (0.3 | ) | 0.1 | 0.1 | 0.0 | 0.0 | ||||||||||||||
| Net exports | (0.7 | ) | (0.1 | ) | (0.1 | ) | 0.1 | 0.1 | ||||||||||||
________________________________
Source: Ministry of Economy and Finance.
The 2021 National Reform Programme. The 2021 Economic and Financial Document did not contain the National Reform Programme, which was intended to be absorbed by the measures included in the NRRP (National Recovery and Resilience Plan). These measures are divided by 'Missions', in accordance with the guidelines set forth by the European Commission. For additional information on the NRRP, see “The Italian Economy – Financial Assistance to EU Member States – The National Recovery and Resilience Plan.”
The following table compares the main finance indicators included in the Update of the 2020 Economic Financial Document against the main finance indicators included in the 2021 Economic and Financial Document.
83
Main Finance Indicators – Update of the 2020 Economic and Financial Document v. 2021 Economic and Financial Document
| 2020 | 2021 | 2022 | 2023 | 2024 | ||||||||||||||||
| Nominal GDP growth rate | ||||||||||||||||||||
| Update of the 2020 Economic and Financial Document | (8.0 | ) | 5.8 | 4.2 | 2.8 | N/A | ||||||||||||||
| 2021 Economic and Financial Document | (7.8 | ) | 5.2 | 5.6 | 3.8 | 3.2 | ||||||||||||||
| Difference | 0.2 | (0.6 | ) | 1.4 | 1.0 | N/A | ||||||||||||||
| Net Borrowing, as a % of GDP | ||||||||||||||||||||
| Update of the 2020 Economic and Financial Document | (10.8 | ) | (7.0 | ) | (4.7 | ) | (3.0 | ) | N/A | |||||||||||
| 2021 Economic and Financial Document | (9.5 | ) | (11.8 | ) | (5.9 | ) | (4.3 | ) | (3.4 | ) | ||||||||||
| Difference | 1.3 | (4.8 | ) | (1.2 | ) | (1.3 | ) | N/A | ||||||||||||
| Public Debt, as a % of GDP | ||||||||||||||||||||
| Update of the 2020 Economic and Financial Document | 158.0 | 155.6 | 153.4 | 151.5 | N/A | |||||||||||||||
| 2021 Economic and Financial Document | 155.8 | 159.8 | 156.3 | 155.0 | 152.7 | |||||||||||||||
| Difference | (2.2 | ) | 4.2 | 2.9 | 3.5 | N/A | ||||||||||||||
________________________________
Source: Ministry of Economy and Finance.
The Update of the 2021 Economic and Financial Document
In September 2021, Italy published its Update of the 2021 Economic and Financial Document, which included revised projections and forecasts on the economic situation in Italy and Europe.
The table below presents the main public finance objectives (taking into account the expected effects resulting from the implementation of new policies) and the public finance trends (estimated at unchanged legislation) included in the Update of the 2021 Economic and Financial Document, as well as the difference (if any) between these two scenarios.
Public Finance Objectives and Trends (in % of GDP)
| Update of the 2021 Economic and Financial Document | 2020 | 2021 | 2022 | 2023 | 2024 | |||||||||||||||
| Net Borrowing | ||||||||||||||||||||
| Objectives | (9.6 | ) | (9.4 | ) | (5.6 | ) | (3.9 | ) | (3.3 | ) | ||||||||||
| Trends | (9.6 | ) | (9.4 | ) | (4.4 | ) | (2.4 | ) | (2.1 | ) | ||||||||||
| Difference | 0.0 | 0.0 | 1.2 | 1.5 | 1.2 | |||||||||||||||
| Primary Balance | ||||||||||||||||||||
| Objectives | (6.1 | ) | (6.0 | ) | (2.7 | ) | (1.2 | ) | (0.8 | ) | ||||||||||
| Trends | (6.1 | ) | (6.0 | ) | (1.5 | ) | 0.3 | (0.4 | ) | |||||||||||
| Difference | 0.0 | 0.0 | 1.2 | 1.5 | 0.4 | |||||||||||||||
| Interest Expenditure | ||||||||||||||||||||
| Objectives | 3.5 | 3.4 | 2.9 | 2.7 | 2.5 | |||||||||||||||
| Trends | 3.5 | 3.4 | 2.9 | 2.7 | 2.5 | |||||||||||||||
| Difference | 0.0 | 0.0 | 0.0 | 0.0 | 0.0 | |||||||||||||||
84
| Update of the 2021 Economic and Financial Document | 2020 | 2021 | 2022 | 2023 | 2024 | |||||||||||||||
| Structural Net Borrowing | ||||||||||||||||||||
| Objectives | (4.7 | ) | (7.6 | ) | (5.5 | ) | (4.5 | ) | (3.9 | ) | ||||||||||
| Trends | (4.8 | ) | (7.6 | ) | (4.2 | ) | (2.8 | ) | (2.6 | ) | ||||||||||
| Difference | (0.1 | ) | 0.0 | 1.3 | 1.7 | 1.3 | ||||||||||||||
| Structural Change | ||||||||||||||||||||
| Objectives | (2.9 | ) | (2.9 | ) | 2.1 | 1.0 | 0.6 | |||||||||||||
| Trends | (2.9 | ) | (2.9 | ) | 3.4 | 1.4 | 0.2 | |||||||||||||
| Difference | 0.0 | 0.0 | 1.3 | 0.4 | (0.4 | ) | ||||||||||||||
| Public Debt, gross of euro area financial support | ||||||||||||||||||||
| Objectives | 155.6 | 153.5 | 149.4 | 147.6 | 146.1 | |||||||||||||||
| Trends | 155.6 | 153.5 | 148.8 | 145.9 | 143.3 | |||||||||||||||
| Difference | 0.0 | 0.0 | (0.6 | ) | (1.7 | ) | (2.8 | ) | ||||||||||||
| Public Debt, net of euro area financial support | . | |||||||||||||||||||
| Objectives | 152.1 | 150.3 | 146.4 | 144.8 | 143.3 | |||||||||||||||
| Trends | 152.1 | 150.3 | 145.8 | 143.0 | 140.6 | |||||||||||||||
| Difference | 0.0 | 0.0 | (0.6 | ) | (1.8 | ) | (2.7 | ) | ||||||||||||
________________________________
Source: Ministry of Economy and Finance.
The table below presents macroeconomic forecasts prepared by Italy through 2024 in connection with the Update of the 2021 Economic and Financial Document.
Macroeconomic Forecasts (in %)
| Update of the 2021 Economic and Financial Document | 2020 | 2021 | 2022 | 2023 | 2024 | |||||||||||||||
| Real GDP | (8.9 | ) | 10.4 | 8.6 | 5.2 | 4.2 | ||||||||||||||
| Nominal GDP | (7.9 | ) | 7.6 | 5.8 | 4.1 | 3.4 | ||||||||||||||
| Private consumption | (10.7 | ) | 5.2 | 4.8 | 2.4 | 2.0 | ||||||||||||||
| Public consumption | 1.9 | 0.7 | 0.4 | 0.3 | 0.1 | |||||||||||||||
| Investments | (9.2 | ) | 15.5 | 5.8 | 4.3 | 3.9 | ||||||||||||||
| Exports of goods and services | (14.0 | ) | 11.4 | 6.0 | 4.1 | 3.1 | ||||||||||||||
| Imports of goods and services | (12.9 | ) | 11.6 | 6.6 | 4.4 | 3.6 | ||||||||||||||
| Domestic demand | (7.8 | ) | 5.9 | 4.0 | 2.4 | 2.0 | ||||||||||||||
| Change in inventories | (0.4 | ) | (0.1 | ) | 0.2 | 0.2 | 0.0 | |||||||||||||
| Net exports | (0.7 | ) | 0.2 | (0.1 | ) | 0.0 | (0.1 | ) | ||||||||||||
________________________________
Source: Ministry of Economy and Finance.
The following table compares the main finance indicators included in the 2021 Economic and Financial Document and the Update of the 2021 Economic and Financial Document.
85
Main Finance Indicators – 2021 Economic and Financial Document
v. Update of the 2021 Economic and Financial Document
v. Update of the 2021 Economic and Financial Document
| 2020 | 2021 | 2022 | 2023 | 2024 | ||||||||||||||||
| Nominal GDP growth rate | ||||||||||||||||||||
| 2021 Economic and Financial Document | (8.9 | ) | 4.1 | 4.3 | 2.5 | 2.0 | ||||||||||||||
| Update of the 2021 Economic and Financial Document | (7.9 | ) | 7.6 | 5.8 | 4.1 | 3.4 | ||||||||||||||
| Difference | 1.0 | 3.5 | 1.5 | 1.6 | 1.4 | |||||||||||||||
| Net Borrowing, as a % of GDP | ||||||||||||||||||||
| 2021 Economic and Financial Document | (9.5 | ) | (11.8 | ) | (5.9 | ) | (4.3 | ) | (3.4 | ) | ||||||||||
| Update of the 2021 Economic and Financial Document | (9.6 | ) | (9.4 | ) | (5.6 | ) | (3.9 | ) | (3.3 | ) | ||||||||||
| Difference | (0.1 | ) | 2.4 | 0.3 | 0.4 | 0.1 | ||||||||||||||
| Public Debt, as a % of GDP | ||||||||||||||||||||
| 2021 Economic and Financial Document | 155.8 | 159.8 | 156.3 | 155.0 | 152.7 | |||||||||||||||
| Update of the 2021 Economic and Financial Document | 155.6 | 153.5 | 149.4 | 147.6 | 146.1 | |||||||||||||||
| Difference | (0.2 | ) | (6.3 | ) | (6.9 | ) | (7.4 | ) | (6.6 | ) | ||||||||||
________________________________
Source: Ministry of Economy and Finance.
The EU Council’s policy recommendations to Italy for the period 2021-2022
As part of the European Semester process, in July 2021, the EU Council, acting through ECOFIN, issued specific recommendations to Italy on its economic, employment and fiscal policies:
| • | use the Recovery and Resilience Facility to finance additional investment in support of the recovery while pursuing a prudent fiscal policy; |
| • | preserve nationally financed investment; |
| • | limit the growth of nationally financed current expenditure; |
| • | when economic conditions allow, pursue a fiscal policy aimed at achieving prudent medium-term fiscal positions and ensuring fiscal sustainability in the medium term; |
| • | at the same time, enhance investment to boost growth potential; |
| • | pay particular attention to the composition of public finances, both on the revenue and expenditure sides of the budget, and to the quality of budgetary measures, to ensure a sustainable and inclusive recovery; |
| • | prioritize sustainable and growth enhancing investment, notably supporting the green and digital transition; and |
| • | give priority to fiscal structural reforms that will help provide financing for public policy priorities and contribute to the long-term sustainability of public finances, including by strengthening the coverage, adequacy, and sustainability of health and social protection systems for all. |
86
Revenues and Expenditures
The following table sets forth general government revenues and expenditures and certain other key public finance measures for the periods indicated. This data is prepared on an accrual basis. The table does not include revenues from privatizations, which are deposited into a special fund for the repayment of Treasury outstanding securities and cannot be used to finance current expenditures. While proceeds from privatizations do not affect the primary balance, they contribute to a decrease in the public debt and consequently the debt-to-GDP ratio.
General Government Revenues and Expenditures
| 2016 | 2017 | 2018 | 2019 | 2020 | ||||||||||||||||
| (in € millions, except percentages) | ||||||||||||||||||||
| Expenditures | ||||||||||||||||||||
| Compensation of employees | 166,387 | 167,221 | 172,633 | 173,912 | 173,356 | |||||||||||||||
| Intermediate consumption | 96,435 | 98,802 | 100,745 | 101,384 | 104,220 | |||||||||||||||
| Market purchases of social benefits in kind | 44,436 | 45,121 | 46,078 | 45,611 | 46,580 | |||||||||||||||
| Social benefits in cash | 336,370 | 341,404 | 348,474 | 361,203 | 399,412 | |||||||||||||||
| Subsidies to firms | 29,295 | 26,601 | 27,325 | 27,906 | 31,944 | |||||||||||||||
| Interest payments | 66,388 | 65,457 | 64,595 | 60,351 | 57,309 | |||||||||||||||
| Other expenditures | 37,335 | 35,401 | 38,694 | 39,624 | 43,124 | |||||||||||||||
| Total current expenditures | 776,646 | 780,007 | 798,544 | 808,991 | 855,945 | |||||||||||||||
| Gross fixed investments | 39,022 | 38,276 | 37,824 | 41,418 | 44,182 | |||||||||||||||
| Investments grants | 9,283 | 10,014 | 13,477 | 14,288 | 17,583 | |||||||||||||||
| Other capital expenditures | 7,314 | 18,510 | 7,307 | 6,306 | 28,509 | |||||||||||||||
| Total capital account expenditures | 55,619 | 66,800 | 58,608 | 62,012 | 90,274 | |||||||||||||||
| Total expenditures | 832,265 | 846,807 | 857,152 | 871,003 | 946,219 | |||||||||||||||
| as a per cent of GDP | 49.1 | 48.8 | 48.4 | 48.6 | 57.3 | |||||||||||||||
| Deficit (surplus) on current expenditures | 5.2 | % | 5.4 | % | 4.8 | % | 3.4 | % | 18.3 | % | ||||||||||
| Net borrowing | 40,765 | 42,000 | 38,628 | 27,901 | 156,860 | |||||||||||||||
| as a per cent of GDP | 2.4 | 2.4 | 2.2 | 1.6 | 9.5 | |||||||||||||||
| Revenues | ||||||||||||||||||||
| Direct taxes | 247,608 | 250,309 | 248,638 | 258,088 | 252,565 | |||||||||||||||
| Indirect taxes | 242,534 | 248,508 | 254,406 | 257,771 | 228,890 | |||||||||||||||
| Actual social security contributions | 216,622 | 221,393 | 230,414 | 238,054 | 224,262 | |||||||||||||||
| Imputed social security contributions | 4,005 | 4,172 | 4,038 | 4,176 | 4,381 | |||||||||||||||
| Income from capital | 11,768 | 11,873 | 13,585 | 17,241 | 18,935 | |||||||||||||||
| Other revenues | 19,266 | 19,056 | 19,193 | 19,065 | 16,890 | |||||||||||||||
| Total current revenues | 784,446 | 797,911 | 814,220 | 838,781 | 785,341 | |||||||||||||||
| Capital taxes | 5,360 | 2,325 | 1,573 | 1,251 | 957 | |||||||||||||||
| Other capital revenues | 1,694 | 4,571 | 2,731 | 3,070 | 3,061 | |||||||||||||||
| Total capital revenues | 7,054 | 6,896 | 4,304 | 4,321 | 4,018 | |||||||||||||||
| Total revenues | 791,500 | 804,807 | 818,524 | 843,102 | 789,359 | |||||||||||||||
| as a per cent of GDP | 46.7 | 46.3 | 46.2 | 47.1 | 47.8 | |||||||||||||||
| Primary balance | 25,623 | 23,457 | 25,967 | 32,450 | (99,551 | ) | ||||||||||||||
| as a per cent of GDP | 1.5 | 1.4 | 1.5 | 1.8 | (6.0 | ) | ||||||||||||||
________________________________
Source: Bank of Italy.
General government revenues decreased by 6.4 per cent or €53.7 billion in 2020, compared to a 3.0 per cent or €24.6 billion increase in 2019, mainly due to the support measures and budgetary expansion measures enacted in response to the Coronavirus pandemic. In 2020, the ratio of tax revenues
87
and social contributions to GDP increased to 43.0 per cent compared to 42.8 in 2019 and 42.1 in 2018, mainly due to the decrease in social contributions expenditure and tax revenues being balanced out by a decrease in the gross domestic product. Social security contributions in 2020 decreased by 5.6 per cent, while current tax revenues decreased by 6.5 per cent.
Direct taxes decreased by 2.1 per cent in 2020, driven by a 2.2 per cent decrease in personal income taxes and a 1.0 per cent increase in corporate income taxes. In the course of 2020, some tax deadlines were postponed in line with the 2010 ESA accounting principles. Indirect taxes, whose dynamics resulted substantially in line with the decline in household consumption, decreased by 11.2 per cent.
General government expenditures increased by 8.6 per cent in 2020, increasing to 57.3 per cent of GDP in 2020 from 48.6 per cent of GDP in 2019. The increase in general government expenditures was due to a 31.3 per cent increase in capital account expenditures, from €62.0 billion in 2019 to €90.3 billion in 2020, and an increase of social benefits in cash from €361.2 billion in 2019 to €399.4 billion in 2020, partially offset by a decrease in interest payments from €60.4 billion in 2019 to €57.3 billion in 2020.
Italy recorded a current account surplus of €58.6 billion in 2020 (3.5 per cent of GDP) , reflecting mainly the reduction of the energy bill, which offset the lower surplus of non-energy products and the greater deficit of services caused by a contraction of the tourist sector, compared to an account surplus of €57.4 billion in 2019 (3.0 per cent of GDP), and of €44.0 billion in 2018 (2.5 per cent of GDP).
Expenditures
Compensation of employees. Compensation of employees marginally increased by 0.3 per cent in 2020, compared to a 0.2 per cent increase in 2019, mainly due to the ongoing pandemic. In 2020, compensation of employees as a percentage of GDP increased to 10.5 per cent compared to 9.7 per cent in 2019.
Intermediate consumption. Intermediate consumption, which measures the value of the goods and services consumed as inputs by a process of production, increased by 2.8 per cent in 2020 compared to a 0.6 per cent increase in 2019. This increase was mainly driven by higher expenses of local administrations.
Market purchases of social benefits in kind. Expenditure on social benefits in kind increased by €1.0 billion or 2.1 per cent in 2020, compared to a decrease of 1.0 per cent in 2019. In 2020, expenditure on social benefits in kind remained steady at 24.1 per cent of GDP.
Expenditure for public health and education are accounted for under wages and salaries, cost of goods and services and production grants.
Italy has a public health service managed principally by regional governments with funds provided by the Government. Local health units adopt their own budgets, establish targets and monitor budget developments. Approximately 7.5 per cent of expenditure on social benefits in kind in 2020 related to health care.
Italy has a public education system consisting of elementary, middle and high schools and universities. Attendance at public elementary, middle and high schools is generally without charge to students, while tuition payments based on income level are required to attend public universities.
88
Social benefits in cash. Social benefits in cash include expenditures for pensions, disability and unemployment benefits. Social benefits in cash increased by 10.5 per cent in 2020 and by 3.7 per cent in 2019. Expenditure on pensions increased by 2.5 per cent and 2.4 per cent in 2020 and 2019, respectively, while the non-pension component grew by 36.6 per cent following a 7.8 per cent increase in 2019, mainly driven by a significant increase in expenditure for social safety nets and for other welfare checks and subsidies as well as by a partial increase in expenditure for sickness and maternity benefits.
Subsidies to firms. Subsidies to firms, which are current payments by the Government to resident producers that are not required to be reimbursed, increased by 14.4 per cent in 2020 compared to a 2.1 per cent increase in 2019, mainly due to the support measures enacted in response to the Coronavirus pandemic.
Interest payments. Interest payments by the Government decreased by €3.1 billion or 5.0 per cent in 2020 as compared to the €4.2 billion or 6.6 per cent decrease in 2019. The ratio of interest payments to nominal GDP was 3.5 per cent and 3.4 per cent in 2020 and 2019, respectively. For additional information on Italy’s public debt, see “Public Debt.”
Other Expenditures. Other expenditures, which decreased by 13.7 per cent in 2019, increased by more than three times in 2020 compared to 2019. Again, this increase mainly due to the measures enacted in response to the Coronavirus pandemic.
Revenues
Taxes. Italy’s tax structure includes taxes imposed at the state and local levels and provides for both direct taxation through income taxes and indirect taxation through a VAT and other transaction-based taxes. Indirect taxes include VAT, excise duties, stamp duties and other taxes levied on expenditures. Income taxes consist of an individual tax levied at progressive rates and a corporate tax levied at a flat rate. Corporations also pay local taxes, and the deductibility of those taxes for income tax purposes has been gradually eliminated over the last years.
VAT is imposed on the sale of goods, the rendering of services performed for consideration in connection with business or professions and on all imports of goods or services. In addition to VAT, indirect taxes include customs duties, taxes on real estate and certain personal property, stamp taxes and excise taxes on energy consumption, tobacco and alcoholic beverages.
Italy has entered into bilateral treaties for the avoidance of double taxation with virtually all industrialized countries.
Low taxpayer compliance has been a longstanding concern for the Government, which has adopted measures to increase compliance. Some of these measures are aimed at identifying tax evasion and include systems of cross-checks between the tax authorities and social security agencies, public utilities and others. One of the areas of greatest concern to the Government has been under-reporting of income by self-employed persons and small enterprises. The Government’s efforts to increase tax compliance since 2001 have led to an increase in the general tax base and to an improvement in compliance.
Italy’s fiscal burden, which is the aggregate of direct and indirect tax revenues and social security contributions as a percentage of GDP, was 43.1 per cent in 2020, compared to 42.4 per cent in 2019. Indirect tax revenues decreased by 11.2 per cent in 2020 compared to a 1.3 per cent increase in 2019, while direct tax revenues slightly decreased by 2.1 per cent in 2020, compared to a 3.8 per cent decrease
89
in 2019. Further, total tax revenues increased from 27.8 per cent of GDP in 2019 to 28.9 per cent of GDP in 2020.
The following table sets forth the composition of tax revenues for the periods indicated
Composition of Tax Revenues(1)
| 2016 | 2017 | 2018 | 2019 | 2020 | ||||||||||||||||
| (in million €) | ||||||||||||||||||||
| Direct taxes | ||||||||||||||||||||
| Personal income tax | 180,004 | 182,354 | 187,428 | 192,774 | 190,675 | |||||||||||||||
| Corporate income tax | 35,251 | 35,162 | 32,662 | 35,645 | 34,410 | |||||||||||||||
| Investment Income tax | 11,580 | 11,410 | 11,070 | 8,130 | 8,222 | |||||||||||||||
| Other | 18,459 | 16,694 | 16,611 | 19,075 | 23,214 | |||||||||||||||
| Total direct taxes | 245,294 | 245,620 | 247,771 | 255,624 | 256,521 | |||||||||||||||
| Indirect taxes | ||||||||||||||||||||
| VAT | 124,336 | 129,574 | 133,577 | 141,166 | 126,698 | |||||||||||||||
| Other transaction-based taxes | 20,585 | 20,107 | 21,451 | 21,000 | 19,442 | |||||||||||||||
| Taxes on production of mineral oil | 25,428 | 25,795 | 25,457 | 25,383 | 21,354 | |||||||||||||||
| Taxes on production of methane gas | 3,416 | 3,447 | 3,480 | 4,220 | 3,589 | |||||||||||||||
| Tax on electricity consumption | 2,853 | 2,537 | 2,639 | 2,752 | 2,683 | |||||||||||||||
| Tax on tobacco consumption | 10,882 | 10,498 | 10,536 | 10,548 | 10,603 | |||||||||||||||
| Taxes on lotto and lotteries | 13,621 | 13,212 | 13,706 | 14,540 | 9,393 | |||||||||||||||
Other(2) | 4,666 | 4,854 | 5,158 | 4,396 | 3,935 | |||||||||||||||
| Total indirect taxes | 205,787 | 210,024 | 216,004 | 224,005 | 197,697 | |||||||||||||||
| Total taxes | 451,081 | 455,645 | 463,775 | 479,629 | 454,218 | |||||||||||||||
________________________________
| (1) | The data presented in this “Composition of Tax Revenues” table does not correspond to the general government direct and indirect tax revenues figures contained in the preceding table entitled “General Government Revenues and Expenditures,” primarily because the “Composition of Tax Revenues” table is prepared on a cash basis while the “General Government Revenues and Expenditures” table is prepared on an accrual basis in accordance with ESA2010. Generally, State sector accounting does not include indirect taxes levied by, and certain amounts allocable to, regional and other local governments and entities. However, because this “Composition of Tax Revenues” table is prepared on a cash basis, it reflects tax receipts of entities that are excluded from State sector accounting (such as local government entities) that are collected on their behalf by the State (and subsequently transferred by the State to those entities). |
| (2) | Taxes classified as “other” are non-recurring, therefore highly variable. |
Source: Ministry of Economy and Finance.
In 2020, total taxation revenues (as reported in the “Composition of Tax Revenues” table on a cash basis) decreased by 5.2 per cent compared to 2019. This was due to a 11.7 per cent decrease in indirect tax revenues, mainly driven by a decrease in VAT that in 2020 amounted to €126.7 billion as compared to €141.2 billion in 2019 and, to a lower extent, by a 35.4 per cent decrease in lotto and lotteries taxes. Direct tax revenues increased by 0.4 per cent compared to 2019, mainly driven by a fivefold increase in substitute taxes on the asset value of pension funds compared to 2019 and, to a lower extent, by an increase in substitute taxes on capital gains, which almost doubled compared to 2019.
90
Actual social security contributions. Actual social security contributions, which consist of payments made for the benefit of employees, decreased by 5.8 per cent in 2020 compared to a 3.3 per cent increase in 2019.
Imputed social security contributions. Imputed social security contributions, which represent the counterpart to unfunded social benefits paid directly to employees and former employees and other eligible persons without involving an insurance company or autonomous pension fund, and without creating a special fund or segregated reserve for the purpose, increased by 4.9 per cent in 2020 compared to a decrease by 3.4 per cent in 2019.
Income from capital. Income from capital increased by 9.8 per cent in 2020 compared to an increase of 26.9 per cent in 2019.
Other Revenues. Other revenues decreased by 11.4 per cent in 2020 compared to a 0.7 per cent increase in 2019.
Government Enterprises
The following chart summarizes certain basic data regarding the largest companies in which the Government holds an interest, for the periods indicated. The Government continues to participate in the election of the boards of directors, but does not directly participate in the management, of these companies.
Largest Government Companies(1)(2)
| Company | Industry Sector | Per cent of Government Ownership as of December 31, 2020 | Total Assets | Total Liabilities | Net profit (loss) | ||||||||||||||||||||
| At December 31, | For the year ended December 31, | ||||||||||||||||||||||||
| 2019 | 2020 | 2018 | 2019 | 2020 | |||||||||||||||||||||
| (in € millions, except percentages) | |||||||||||||||||||||||||
Cassa Depositi e Prestiti S.p.A.(3) | Financial Services | 82.77 | 449,509 | 512,408 | 2,891 | 1,784 | (369 | ) | |||||||||||||||||
| ENEL S.p.A. | Electricity | 23.59 | 171,426 | 163,453 | 4,789 | 2,174 | 2,610 | ||||||||||||||||||
ENI S.p.A.(4) | Oil and Gas | 30.10 | 123,440 | 190,648 | 4,126 | 148 | (8,635 | ) | |||||||||||||||||
| Ferrovie dello Stato Italiane S.p.A. | Railroads | 100.00 | 73,814 | 71,088 | 540 | 573 | (570 | ) | |||||||||||||||||
Leonardo S.p.A.(5) | Defense/Aerospace | 30.20 | 26,893 | 27,073 | 510 | 822 | 243 | ||||||||||||||||||
| Monte dei Paschi di Siena S.p.A. | Banking | 68.25 | 132,196 | 150,356 | 279 | (1,033 | ) | (1,689 | ) | ||||||||||||||||
Poste Italiane S.p.A.(6) | Post/Financial Services | 64.26 | 237,093 | 272,357 | 1,399 | 1,342 | 1,206 | ||||||||||||||||||
| ENAV S.p.A. | Aviation | 53.28 | 2,111 | 2,191 | 102,935 | 111,881 | 43,342 | ||||||||||||||||||
________________________________
| (1) | Percentages refer to the relevant holding company, while financial data is presented on a consolidated basis. |
| (2) | Including shares indirectly owned by the Government through CDP. |
| (3) | As of December 31, 2020, the residual 15.93 per cent of CDP was owned by various banking foundations. |
| (4) | As of December 31, 2020, 25.76 per cent of ENI S.p.A. was owned indirectly through Cassa Depositi e Prestiti S.p.A., with 4.34 per cent owned directly by the Government. |
| (5) | Finmeccanica S.p.A. has changed its name to Leonardo S.p.A. with effect as of January 1, 2017. |
91
| (6) | As of December 31, 2020, 35.00 per cent of Poste Italiane S.p.A. was owned indirectly through Cassa Depositi e Prestiti S.p.A., with 29.26 per cent owned directly by the Government. |
Source: Ministry of Economy and Finance.
92
PUBLIC DEBT
General
Italy’s public debt includes debt incurred by the Italian Government (including Treasury securities and other borrowings), local governments, social security funds and other public agencies.
The Treasury manages the Italian Government debt and the financial assets of Italy. The Bank of Italy provides technical assistance to the Treasury in connection with auctions for domestic bonds and acts as paying agent for Treasury securities. The Stability Law and the Budget Law authorize the incurrence of debt by the Italian Government. For additional information on Italy’s budget and financial planning process and the Stability Law and the Budget Law, see “Public Finance—The Budget Process.”
The aggregate amount of government bonds issued in 2020 was approximately €550.7 billion, compared to an aggregate amount of approximately €414.2 billion in 2019. In both cases such amounts include bonds issued in switch-bond transactions. The aggregate amount of government bonds with maturity in 2020 increased to €376.0 billion from €355.7 billion in 2019.
The following table summarizes Italy’s public debt as of the dates indicated, that is mainly represented by debt incurred by the Treasury.
Total Public Debt(*)
| December 31 | ||||||||||||||||||||
| 2016 | 2017 | 2018 | 2019 | 2020 | ||||||||||||||||
| Millions of Euro | ||||||||||||||||||||
| Debt incurred by the Treasury: | ||||||||||||||||||||
Short term bonds (BOT)(1) | 107,113 | 106,601 | 107,453 | 113,929 | 121,283 | |||||||||||||||
| Medium- and long-term bonds (initially incurred or issued in Italy) | 1,712,257 | 1,755,585 | 1,810,949 | 1,846,270 | 1,975,511 | |||||||||||||||
External bonds (initially incurred or issued outside Italy) (2) | 39,240 | 35,589 | 32,399 | 36,867 | 45,090 | |||||||||||||||
| Total Treasury Issues | 1,858,609 | 1,897,776 | 1,950,802 | 1,997,066 | 2,141,884 | |||||||||||||||
Postal savings(3) | 76,908 | 74,432 | 72,307 | 67,586 | 65,066 | |||||||||||||||
Treasury accounts(4) | 154,064 | 159,012 | 107,084 | 159,706 | 163,863 | |||||||||||||||
| Other debt incurred by: | ||||||||||||||||||||
ISPA (bonds and other loans)(5) | 10,105 | 10,114 | 10,127 | 9,200 | 9,200 | |||||||||||||||
Central Government entities(6) | 89,710 | 101,975 | 98,474 | 93,573 | 109,237 | |||||||||||||||
Other general Government entities(7) | 96,251 | 86,529 | 142,697 | 82,851 | 84,218 | |||||||||||||||
| Total public debt | 2,285,647 | 2,329,838 | 2,381,490 | 2,409,982 | 2,573,468 | |||||||||||||||
| as a percentage of GDP | 134.8 | % | 134.2 | % | 134.4 | % | 134.3 | % | 155.6 | % | ||||||||||
Liquidity buffer(8) | (34,835 | ) | (29,323 | ) | (35,078 | ) | (32,918 | ) | (42,475 | ) | ||||||||||
| Total public debt net of liquidity buffer | 2,250,811 | 2,300,515 | 2,346,412 | 2,377,064 | 2,530,993 | |||||||||||||||
________________________________
| (*) | Figures in this table have not been restated and, therefore, are not comparable to the figures in the table entitled “Selected Public Finance Indicators” in “Public Finance” and to the figures presented in the sections “Italian Economy” and “Public Debt”. |
| (1) | BOTs (Buoni Ordinari del Tesoro) are short-term, zero-coupon notes with a maturity up to twelve months. |
| (2) | Italy ordinarily enters into currency swap agreements for hedging purposes. The total amount of external bonds shown above takes into account the effect of these arrangements. |
| (3) | Postal savings are medium and long-term certificates issued by CDP that may be withdrawn by the holder prior to maturity with nominal penalties. As of the date of conversion of CDP into a joint stock company in 2003, the Ministry of Economy and Finance assumed part of the postal savings liabilities of CDP in the amount that is referred to in the table. |
93
| (4) | Treasury accounts are short- and medium-term deposit accounts held by non-central Government entities at the Treasury. Treasury accounts also include liabilities for Euro coins minted by Italy. |
| (5) | The liabilities of Infrastrutture S.p.A., or “ISPA,” in relation to the TAV project (high-speed railroad infrastructure), have been included in the Government debt since 2006, when such liabilities were assumed by the Government following their reclassification. |
| (6) | The line item includes all internal and external liabilities incurred by other central Government entities. |
| (7) | The line item includes all internal and external liabilities incurred by local authorities. |
| (8) | The line item includes all the funds of the Treasury deposited with the Bank of Italy and the sinking fund, which is mainly funded by privatization proceeds, as well as liquidity invested in the money market through operations on behalf of the Italian Treasury (“OPTES”). OPTES are overnight or very short-term transactions involving non collateralized deposits, conducted through auctions or bilateral trades undertaken between the Italian Ministry of Economy and Finance and OPTES counterparties. |
Source: Ministry of Economy and Finance and Bank of Italy.
In the period from 2016 to 2019, Italy’s debt-to-GDP ratio increased from 129.0 per cent net of euro area financial support (and 132.4 per cent gross of euro area financial support) to 131.3 per cent net of euro area financial support (and 134.6 per cent gross of euro area financial support). This growth trend resulted from Italy’s budget deficit (primarily resulting from the cost of servicing Italy’s debt) and its substantially unchanged nominal GDP from 2016 to 2019. In 2020, Italy’s debt-to-GDP ratio further increased reaching the highest amount on record at 152.1 per cent net of euro area financial support (and 155.6 per cent gross of euro area financial support), mainly due to the direct and indirect effects of the Coronavirus pandemic on the Italian economy which resulted in an increase in debt and a fall in GDP. For additional information on the GDP trends, see “The Italian Economy—General.”
The Italian Government’s latest forecasts of the debt-to-GDP ratio are included in the Economic and Financial Document of 2021. The table below shows the Italian Government’s forecasts of the debt-to-GDP ratio for the period 2020-2024. Based on preliminary estimates, Italy’s debt-to-GDP ratio gross of euro area financial support is expected to set at 153.5 per cent in 2021 decreasing from 2020 level, to then further decrease to 149.4 per cent in 2022, as a consequence of the increase in the GDP level.
Forecasted Debt-to-GDP Ratios
| 2020 | 2021 | 2022 | 2023 | 2024 | ||||||||||||||||
| Public Debt, gross of euro area financial support | 155.6 | 153.5 | 149.4 | 147.6 | 146.1 | |||||||||||||||
________________________________
Source: Ministry of Economy and Finance.
Government Guarantees. Government guarantees on liabilities or assets of third parties are contingent liabilities that may become actual government liabilities if specific conditions are met. They include (i) standardised government guarantees, which are guarantees issued in large number, usually for fairly small amounts, among identical lines, and (ii) one-off government guarantees, which are provided on a case-by-case basis, generally for rather significant amounts and under individual contractual arrangements.
The table below shows data on Government standardised and one-off guarantees as a percentage of GDP in the years 2016 to 2020.
94
Government Guarantees
| 2016 | 2017 | 2018 | 2019 | 2020 | ||||||||||||||||
| % of GDP | ||||||||||||||||||||
| Standardised Government guarantees | 1.2 | 1.4 | 1.7 | 1.9 | 7.6 | |||||||||||||||
| One-off Government guarantees | 1.2 | 2.5 | 2.6 | 2.9 | 5.6 | |||||||||||||||
| Total Government guarantees | 2.4 | 3.9 | 4.3 | 4.8 | 13.2 | |||||||||||||||
________________________________
Source: Eurostat.
Public Debt Management. Debt management continues to be geared towards lengthening the average residual maturity of public debt. The average maturity of government debt increased from 6.9 years at the end of 2019 to 7.0 years at the end of 2020. The average refixing period, the main index for measuring interest risk, also increased from 5.8 years in 2019 to 6.0 years in 2020.
Public Debt Management for 2020 was regulated by (i) the general management directive of the Ministry of Economy and Finance, and (ii) the Decree of the Ministry of Economy and Finance of January 3, 2020 (so-called Decreto Cornice), setting forth the objectives for the management of public debt as follows:
| 1. | guarantee that demand is met in line with market prices; |
| 2. | maintain exposure to main risks, especially interest rate and refinancing risks, in line with previous years; |
| 3. | contribute to improving the liquidity of the secondary market; and |
| 4. | improve the efficiency of the management of cash, also through diversification of instruments. |
These objectives translated into the following guidelines for 2020:
| 1. | ensure foreseeability and regularity of domestic issuances; |
| 2. | adapt the volumes offered in order to favorite the secondary market sectors which are more liquid; |
| 3. | use liability management instruments; |
| 4. | diversify the investor basis also through issuances in other currency, in particular in dollars; and |
| 5. | start using innovative instruments. |
| 6. | implement organizational and market interventions to initiate the issuance of "green" bonds. |
At the end of 2020, the debt represented by government bonds was 84.0 per cent of the aggregate public debt of Italy. The table below presents the breakdown of the total government bonds issued in 2018, 2019 and 2020, respectively.
95
Breakdown of Total Issued Government Bonds
| 2018 | % on total | 2019 | % on total | 2020 | % on total | |||||||||||||||||||
| BOT mini | 0 | 0.0 | 0 | 0.0 | 0 | 0.0 | ||||||||||||||||||
| BOT 3 months | 0 | 0.0 | 0 | 0.0 | 6,500 | 1.2 | ||||||||||||||||||
| BOT 6 months | 75,303 | 18.8 | 80,810 | 19.7 | 82,192 | 14.9 | ||||||||||||||||||
| BOT 12 months | 76,350 | 19.0 | 80,029 | 19.5 | 93,123 | 16.9 | ||||||||||||||||||
| Commercial Paper | 0 | 0.0 | 0 | 0.0 | 0 | 0.0 | ||||||||||||||||||
| Total short-term | 151,653 | 37.8 | 160,839 | 39.2 | 181,815 | 33.0 | ||||||||||||||||||
| CTZ | 29,169 | 7.3 | 31,156 | 7.6 | 37,949 | 6.9 | ||||||||||||||||||
| CCTeu | 23,863 | 6.0 | 14,771 | 3.6 | 16,444 | 3.0 | ||||||||||||||||||
| BTP 3 years | 36,700 | 9.2 | 32,430 | 7.9 | 49,905 | 9.1 | ||||||||||||||||||
| BTP 5 years | 31,675 | 7.9 | 33,686 | 8.2 | 44,404 | 8.1 | ||||||||||||||||||
| BTP 7 years | 33,434 | 8.3 | 29,552 | 7.2 | 37,458 | 6.8 | ||||||||||||||||||
| BTP 10 years | 38,976 | 9.7 | 39,054 | 9.5 | 63,951 | 11.6 | ||||||||||||||||||
| BTP 15 years | 5,471 | 1.4 | 13,600 | 3.3 | 19,576 | 3.6 | ||||||||||||||||||
| BTP 20 years | 14,134 | 3.5 | 8,470 | 2.1 | 16,605 | 3.0 | ||||||||||||||||||
| BTP 30 years | 8,482 | 2.1 | 15,480 | 3.8 | 24,735 | 4.5 | ||||||||||||||||||
| BTP 50 years | 883 | 0.2 | 3,000 | 0.7 | 0 | 0.0 | ||||||||||||||||||
| BTP€i 5 years | 7,782 | 1.9 | 2,149 | 0.5 | 6,038 | 1.1 | ||||||||||||||||||
| BTP€i 10 years | 5,645 | 1.4 | 7,369 | 1.8 | 4,972 | 0.9 | ||||||||||||||||||
| BTP€i 15 years | 2,745 | 0.7 | 2,334 | 0.6 | 600 | 0.1 | ||||||||||||||||||
| BTP€i 30 years | 494 | 0.1 | 2,018 | 0.5 | 841 | 0.2 | ||||||||||||||||||
| BTPItalia | 9,873 | 2.5 | 6,750 | 1.6 | 22,298 | 4.0 | ||||||||||||||||||
| BTP Futura | - | - | - | - | 11,844 | 2.2 | ||||||||||||||||||
| Foreign | 0.0 | 0.0 | 7,371 | 1.8 | 11,255 | 2.0 | ||||||||||||||||||
| Total medium/long-term | 249,324 | 62.2 | 249,191 | 60.8 | 368,873 | 67.0 | ||||||||||||||||||
| Total | 400,977 | 100 | 410,030 | 100 | 550,688 | 100 | ||||||||||||||||||
________________________________
Source: 2020 Report on Public Debt.
The table below presents the percentage of total outstanding government bonds represented by fixed rate securities, the securities indexed to the inflation rate (BTP€i+BTP Italia) and floating rate securities as of December 31, 2018, 2019 and 2020, respectively.
Breakdown of Total Outstanding Government Bonds (in %)
| December 31, | ||||||||||||
| 2018 | 2019 | 2020 | ||||||||||
| Fixed rate securities | 75.7 | 76.0 | 76.7 | |||||||||
| Securities indexed to the inflation rate (BTP€i+BTP Italia) | 11.9 | 11.7 | 11.4 | |||||||||
| Floating rate securities | 12.4 | 12.2 | 11.9 | |||||||||
| Total Outstanding Government Bonds | 100 | 100 | 100 | |||||||||
________________________________
Source: Ministry of Economy and Finance.
In 2020, the weighted average cost at issuance of Government securities decreased to 0.6 per cent from 0.9 per cent in 2019, maintaining financing costs close to a historical minimum low. Such decrease was mainly due to exceptionally favorable market conditions. Yields on short-term government bonds
96
stood slightly below -0.2 continuing to record negative interest rates in 2020, whereas yields on long-term government bonds decreased to 1.0 per cent 2020 from 1.5 per cent in 2019.
The table below shows the yields on 3-year and 10-year BTPs issued by the Treasury for each quarter of 2019 and 2020 and the first two quarters of 2021.
Quarterly Yields on 3-Year and 10-Year BTPs
| 2019 | 2020 | 2021 | ||||||||||||||||||||||||||||||||||||||
| Q1 | Q2 | Q3 | Q4 | Q1 | Q2 | Q3 | Q4 | Q1 | Q2 | |||||||||||||||||||||||||||||||
| BTP 3-year | 1.0 | 1.1. | 0.2 | 0.1 | 0.3 | 0.7 | 0.2 | (0.2 | ) | (0.3 | ) | (0.2 | ) | |||||||||||||||||||||||||||
| BTP 10-year | 2.7 | 2.5 | 1.5 | 1.1 | 1.1 | 1.6 | 1.1 | 0.8 | 0.6 | 0.9 | ||||||||||||||||||||||||||||||
________________________________
Source: Ministry of Economy and Finance.
BTP-Bund Spread. The spread between BTPs and German government bonds, in each case with a maturity of 10 years, decreased to approximately 111 bps as of December 31, 2020 from approximately 160 bps as of December 31, 2019, due to a generally improved perception of credit risk for Italy relative to other countries.
Summary of Internal Debt
Internal debt is debt, payable in Euro, initially incurred or issued in Italy. Italy’s total internal public debt as of December 31, 2020 was €2,475,732 million, an increase of €153,942 million from December 31, 2019. The following table summarizes the internal public debt as of December 31 of each of the years indicated.
Internal Public Debt
| 2016 | 2017 | 2018 | 2019 | 2020 | ||||||||||||||||
| (Millions of Euros) | ||||||||||||||||||||
| Debt incurred by the Treasury: | ||||||||||||||||||||
Short-Term Bonds (BOT)(1) | 107,113 | 106,601 | 107,453 | 113,929 | 121,283 | |||||||||||||||
| Medium- and Long-Term Bonds | ||||||||||||||||||||
CTZ(2) | 39,607 | 40,692 | 45,591 | 51,139 | 54,480 | |||||||||||||||
CCT(3) | 134,707 | 132,936 | 128,876 | 125,586 | 126,552 | |||||||||||||||
BTP(4) | 1,300,594 | 1,368,729 | 1,408,853 | 1,440,280 | 1,542,121 | |||||||||||||||
BTP Futura(5) | 11,844 | |||||||||||||||||||
BTP€i(6) | 147,337 | 146,847 | 155,175 | 151,707 | 163,464 | |||||||||||||||
BTP Italia(7) | 90,012 | 66,381 | 72,454 | 77,558 | 77,050 | |||||||||||||||
| Total | 1,819,370 | 1,862,186 | 1,918,402 | 1,960,200 | 2,096,794 | |||||||||||||||
| Postal savings | 76,908 | 74,432 | 72,307 | 67,586 | 65,066 | |||||||||||||||
Treasury accounts(8) | 154,064 | 159,012 | 107,084 | 159,706 | 163,863 | |||||||||||||||
ISPA loans(9) | 500 | 500 | 500 | 500 | 500 | |||||||||||||||
| Central Government entities | 46,907 | 60,521 | 56,133 | 51,470 | 65,574 | |||||||||||||||
| Other general Government entities | 95,714 | 85,963 | 142,175 | 82,328 | 83,935 | |||||||||||||||
| Total internal public debt | 2,193,462 | 2,242,615 | 2,296,600 | 2,321,790 | 2,475,732 | |||||||||||||||
Liquidity buffer(10) | (34,835 | ) | (29,323 | ) | (35,078 | ) | (32,918 | ) | (42,475 | ) | ||||||||||
97
| 2016 | 2017 | 2018 | 2019 | 2020 | ||||||||||||||||
| (Millions of Euros) | ||||||||||||||||||||
| Total internal public debt net of liquidity buffer | 2,158,627 | 2,213,292 | 2,261,522 | 2,288,872 | 2,433,257 | |||||||||||||||
________________________________
| (1) | BOTs (Buoni Ordinari del Tesoro) are short-term, zero-coupon notes with a maturity up to twelve months. |
| (2) | CTZs (Certificati del Tesoro Zero-Coupon) are zero-coupon notes with maturities of twenty-four months. |
| (3) | CCTs (Certificati di Credito del Tesoro) are floating rate medium-term notes indexed to the six-month BOT rate with maturities of typically seven years and a semiannual coupon. The BOT rate is the interest rate at the BOT auction held at the end of the month prior to the one in which the coupons become payable. CCTs also include CCTEUs, which are indexed to six-month Euribor. As of December 31, 2017, no CCTs remain outstanding. |
| (4) | BTPs (Buoni del Tesoro Poliennali) are medium- and long-term notes that pay a fixed rate of interest, with a semiannual coupon. |
| (5) | BTPs Futura are government bonds with semi-annual nominal coupons and maturities from 8 to 16 years, exclusively targeted to retail investors, with proceeds being entirely used to finance the measures adopted by the Government to counter the economic effects of the Coronavirus pandemic. |
| (6) | BTP€is (inflation-linked BTPs) are medium- and long-term notes with a semiannual coupon. Both the principal amount under the notes and the coupon are indexed to the euro-zone harmonized index of consumer prices, excluding tobacco. |
| (7) | BTPItalia (Italian inflation-linked BTPs) are medium- and long-term notes with a semiannual coupon. Both the principal amount under the notes and the coupon are indexed to the Italian inflation rate, excluding tobacco. These notes were first issued by the Treasury in March 2012. |
| (8) | Treasury accounts are demand, short- and medium-term deposit accounts held by non-central Government entities at the Treasury. Treasury accounts also include liabilities for Euro coins minted by Italy. |
| (9) | The item includes the portion of debt incurred by ISPA in Italy, guaranteed by the State, in connection with the financing of the high-speed railway link between Turin, Milan, Rome and Naples. |
| (10) | The item includes all the funds of the Treasury deposited with the Bank of Italy and the sinking fund, which is mainly funded by privatizations, as well as liquidity invested on the money market through OPTES. For additional information, see “Monetary System—Monetary Policy”. |
Source: Ministry of Economy and Finance and Bank of Italy.
In 2019 and 2020, the ratio of short-term bonds to total securities issued by the Treasury was approximately 5.7 per cent and approximately 5.6 per cent, respectively.
The following table divides the internal public debt into floating debt and funded debt as of December 31 of each of the years indicated. Floating debt is debt that has a maturity at issuance of less than one year. Funded debt is debt that has a maturity at issuance of one year or more.
Summary of Floating and Funded Internal Debt
| December 31, | ||||||||||||||||||||
| 2016 | 2017 | 2018 | 2019 | 2020 | ||||||||||||||||
| (Millions of euro) | ||||||||||||||||||||
Floating internal debt(1) | 187,904 | 191,764 | 140,939 | 193,606 | 198,023 | |||||||||||||||
| Funded internal debt | 2,005,559 | 2,050,850 | 2,155,661 | 2,128,184 | 2,277,708 | |||||||||||||||
| Total internal public debt | 2,193,462 | 2,242,615 | 2,296,600 | 2,321,790 | 2,475,732 | |||||||||||||||
________________________________
| (1) | Includes BOTs with a maturity at issuance of three and six months and postal accounts. |
Source: Ministry of Economy and Finance.
Summary of External Debt
External debt is debt initially incurred or issued in a currency other than Euro or outside Italy. Total external public debt as of December 31, 2020 was €97,737million. Historically, Italy has not relied
98
heavily on external debt. The following table summarizes the external public debt as of December 31 of each of the years indicated.
Summary of External Debt
| December 31, | ||||||||||||||||||||
| 2016 | 2017 | 2018 | 2019 | 2020 | ||||||||||||||||
| (Millions of euros) | ||||||||||||||||||||
External Treasury Bonds(1) | 39,240 | 35,586 | 32,399 | 36,867 | 45,090 | |||||||||||||||
ISPA (bonds and loans)(2) | 9,605 | 9,614 | 9,627 | 8,700 | 8,700 | |||||||||||||||
| Central Government entities | 42,803 | 41,454 | 42,341 | 42,103 | 43,663 | |||||||||||||||
| Other general Government entities | 536 | 566 | 522 | 522 | 283 | |||||||||||||||
| Total external public debt | 92,184 | 87,220 | 84,890 | 88,192 | 97,737 | |||||||||||||||
________________________________
| (1) | Italy often enters into currency swap agreements in the ordinary course of the management of its debt. The total amount of external bonds shown above takes into account the effect of these arrangements. |
| (2) | The item includes the full amount of ISPA bonds and a portion of loans incurred by ISPA in connection with the financing of the high-speed railway link between Turin, Milan, Rome and Naples. |
Source: Ministry of Economy and Finance.
The following table sets forth a breakdown of the external public debt of Italy, by currency, as of December 31 of each of the years indicated. The amounts shown below are nominal values at issuance, before giving effect to currency swaps, and do not include external public debt of state sector entities and other general Government entities. Italy often enters into currency swap agreements in the ordinary course of the management of its debt.
| December 31 | ||||||||||||||||||||
2016 | 2017 | 2018 | 2019 | 2020 | ||||||||||||||||
| (in millions) | ||||||||||||||||||||
Euro(1) | 27,321 | 26,815 | 24,456 | 22,917 | 28,868 | |||||||||||||||
| British Pounds | 1,750 | 1,750 | 1,750 | 1,750 | 1,750 | |||||||||||||||
| Swiss Francs | 1,000 | 1,000 | 0 | 0 | 0 | |||||||||||||||
| U.S. Dollars | 7,500 | 5,500 | 5,500 | 12,500 | 15,500 | |||||||||||||||
| Japanese Yen | 235,000 | 110,000 | 60,000 | 25,000 | 25,000 | |||||||||||||||
| Norwegian Kroner | 0 | 0 | 0 | 0 | 0 | |||||||||||||||
| Czech Koruna | 7,470 | 4,980 | 4,980 | 0 | 0 | |||||||||||||||
________________________________
| (1) | The item does not include the amount of debt incurred in euros by ISPA and guaranteed by the State, which is shown in the previous table. |
Source: Ministry of Economy and Finance.
Italy accesses the international capital markets through (i) a global bond program registered under the United States Securities Act of 1933 on Schedule B (the “Global Bond Programme”), (ii) a US$80 billion medium-term note program established in 1998 and last updated in December 2014, and (iii) a US$15 billion commercial paper program established in 1999 and last updated in July 2020. Italy introduced collective action clauses (CACs) in the documentation of all New York law governed bonds issued after June 16, 2003, including the Global Bond Programme. Italy has included the EU Collective Action Clauses, including Cross Series Modification Clauses, in the documentation of all bonds it has issued after January 1, 2013. For additional information regarding Italy’s implementation of Collective Action Clauses, see “The Italian Economy—Key measures related to the Italian Economy—Financial Assistance to EU Member States—Collective Action Clauses.”
99
Excessive Deficit Procedure. In accordance with the Treaty on the Functioning of the EU (“TFEU”), the EU Commission monitors compliance with budgetary discipline of each Member State, on the basis of two criteria: (1) whether the ratio of the planned or actual government deficit to GDP exceeds the reference value of 3.0 per cent; and (2) whether the ratio of government debt to GDP exceeds the reference value of 60.0 per cent, unless the ratio is diminishing and approaching the reference value at a satisfactory pace. Further, the EU Commission takes into account whether the government deficit exceeds government investment expenditure and all other relevant factors, including the medium-term economic and budgetary position of the Member State. For additional information on the budget process, see “Public Finance – The Budget Process.”
Between May 2018 and June 2019, the EU Commission issued three different reports to Italy under Article 126(3) of TFEU, at first requesting documents to attest Italy’s compliance with budgetary discipline and then to state that Italy’s public debt-to-GDP ratio, which stood at 132.2 per cent in 2018, was well above the 60.0 per cent of GDP reference value set for in the TFEU, and that Italy did not comply with the debt reduction benchmark in 2018.
Italy responded to these reports providing the required documentation and confirming its intention to comply with the applicable budgetary rules, to then adopt, in July 2019, certain fiscal correction measures for 2019 in an aggregate amount of €7.6 billion or 0.4 per cent of GDP in nominal terms and €8.2 billion or 0.5 per cent of GDP in structural terms. This intervention allowed for a lower deficit of 2.0 per cent of GDP for 2019, in line with the EU Commission’s recommendations. Among others, key measures included a freeze on certain funds (€1.5 billion) which, under the 2019 Budget, were originally allocated to the basic universal income (Reddito di Cittadinanza), and the new early retirement scheme (Quota Cento) (see “The Italian Economy – Key Measures related to the Italian Economy – Measures adopted in 2019”). Such fiscal correction measures were described in a letter by the Government to the EU Commission dated July 2, 2019.
On July 3, 2019, the EU Commission formally informed the EU Council that the fiscal correction measures for 2019 adopted by Italy on July 1, 2019 were material enough for the EU Commission not to recommend to the EU Council the opening of an excessive deficit procedure against Italy.
In March 2020, the EU Commission activated the general escape clause under the EU fiscal framework, allowing for a coordinated and orderly temporary deviation from the normal requirements for all Member States in a situation of generalised crisis caused by a severe economic downturn of the euro area or the EU as a whole. The general escape clause, however, does not suspend the excessive deficit procedure under the TFEU.
On May 20, 2020, the EU Commission issued a report to Italy under Article 126(3) of TFEU. In this report, the EU Commission stated that Italy’s planned deficit for 2020, which stood at 10.4 per cent of GDP, provided evidence of the existence of an excessive deficit. However, the Economic and Financial Committee issued an opinion in June 2020 concluding that, after taking into account Italy’s data from 2019, among other things, there was not enough evidence to recommend an excessive deficit procedure against Italy.
On June 2, 2021, the EU Commission issued an omnibus report to 26 Member States, including Italy, under Article 126(3) of TFEU. In this report, the EU Commission stated that Italy's 2020 general government deficit exceeded the 3 per cent GDP reference value and that the 2021 spring forecasts indicated that the government deficit would remain above this value. The EU Commission also stated that at the end of 2020, the general government gross debt exceeded the 60 per cent of GDP reference value set by the EU. In June 2021, the Economic and Financial Committee issued an opinion concluding that an excessive deficit procedure against several Member States, including Italy, should not be taken given
100
the high degree of uncertainty, caused by the ongoing Coronavirus pandemic, the Member States’ fiscal response to it, and after giving consideration to the EU Council’s recommendations of July 20, 2020.
Debt Record
Since its founding in 1946, Italy has never defaulted in the payment of principal or interest on any of its internal or external indebtedness.
TABLES AND SUPPLEMENTARY INFORMATION
Floating Internal Debt (1) as of December 31, 2020
| Interest Rate | Maturity Date | Outstanding principal amount | ||||
| (Millions of euro) | ||||||
| BOT (3 months) | various | various | 0 | |||
| BOT (6 months) | various | various | 34,160 | |||
| Treasury accounts | floating | none | 163,863 | |||
| Total floating internal debt of the Treasury | 198,023 | |||||
| Liquidity buffer | floating | none | (42,475 | ) | ||
| Total floating internal debt net of liquidity buffer | 155,548 | |||||
________________________________
| (1) | Floating debt is debt that has a maturity at issuance of less than one year. Funded debt is debt that has a maturity at issuance of one year or more. |
Source: Ministry of Economy and Finance and Bank of Italy.
Funded Internal Debt(1) as of December 31, 2020
| Interest Rate | Maturity Date | Outstanding principal amount | ||||
| (Millions of euro) | ||||||
| BOT (12 months) | various | various | 87,123 | |||
| CTZ | various | various | 54,480 | |||
| CCT | various | various | 126,552 | |||
| BTP | various | various | 1,542,121 | |||
| BTP Futura | various | various | 11,843 | |||
| BTP€I | various | various | 163,464 | |||
| BTP Italia | various | various | 77,050 | |||
| Other funded internal debt | various | various | 215,075 | |||
| Total funded internal debt of the Treasury | 2,277,708 | |||||
________________________________
| (1) | Floating debt is debt that has a maturity at issuance of less than one year. Funded debt is debt that has a maturity at issuance of one year or more. This table does not include the loans under the SURE Facility. For further information on the SURE Facility see “Republic of Italy – EU measures enacted in response to the Coronavirus pandemic”. |
Source: Ministry of Economy and Finance and Bank of Italy.
External Bonds of the Treasury as of December 31, 2020
The following table shows the external bonds of the Treasury issued and outstanding as of December 31, 2020
101
| Original Currency Nominal Amount | Interest Rate | Initial Public Offering Price (%) | Date of Issue | Maturity Date | Amount Outstanding | Equivalent in Euro | ||||||||||||||
United States Dollar(1)(*) | ||||||||||||||||||||
| $ | 3,500,000,000 | 6.88 | % | 98.73 | September 27, 1993 | September 27, 2023 | $ | 3,500,000,000 | € | 2,852,253,280 | ||||||||||
| $ | 2,000,000,000 | 5.38 | % | 98.44 | February 27, 2003 | June 15, 2033 | $ | 2,000,000,000 | € | 1,629,859,017 | ||||||||||
| $ | 2,500,000,000 | 2.38 | % | 99.72 | October 17, 2019 | October 17, 2024 | $ | 2,500,000,000 | € | 2,037,323,771 | ||||||||||
| $ | 2,000,000,000 | 2.88 | % | 99.09 | October 17, 2019 | October 17, 2029 | $ | 2,000,000,000 | € | 1,629,859,017 | ||||||||||
| $ | 2,500,000,000 | 4.00 | % | 99.62 | October 17, 2019 | October 17, 2049 | $ | 2,500,000,000 | € | 2,037,323,771 | ||||||||||
| $ | 3,000,000,000 | 1.25 | % | 99.09 | November 24, 2020 | February 17, 2026 | $ | 3,000,000,000 | € | 2,444,788,526 | ||||||||||
| $ | 15,500,000,000 | € | 12,631,407,383 | |||||||||||||||||
Euro (2) | ||||||||||||||||||||
| € | 1,000,000,000 | Floating | 101.60 | June 28, 1999 | June 28, 2029 | € | 905,000,000 | € | 905,000,000 | |||||||||||
| € | 150,000,000 | Zero Coupon | 100.00 | February 20, 2001 | February 19, 2031 | € | 150,000,000 | € | 150,000,000 | |||||||||||
| € | 300,000,000 | Floating | 100.00 | May 31, 2005 | May 31, 2035 | € | 300,000,000 | € | 300,000,000 | |||||||||||
| € | 395,000,000 | 3.75 | % | 100.00 | June 2, 2005 | June 2, 2030 | € | 395,000,000 | € | 395,000,000 | ||||||||||
| € | 300,000,000 | Floating | 100.00 | June 28, 2005 | June 28, 2021 | € | 300,000,000 | € | 300,000,000 | |||||||||||
| € | 200,000,000 | Floating | 100.00 | November 9, 2005 | November 2, 2025 | € | 200,000,000 | € | 200,000,000 | |||||||||||
| € | 900,000,000 | Floating | 99.38 | March 17, 2006 | March 17, 2021 | € | 900,000,000 | € | 900,000,000 | |||||||||||
| € | 192,000,000 | 4.42 | % | 100.00 | March 28, 2006 | March 28, 2036 | € | 192,000,000 | € | 192,000,000 | ||||||||||
| € | 215,000,000 | Floating | 100.00 | May 11, 2006 | May 11, 2026 | € | 215,000,000 | € | 215,000,000 | |||||||||||
| € | 1,000,000,000 | 1.85% Inflation Indexed | 99.80 | January 5, 2007 | September 15, 2057 | € | 1,196,320,000 | € | 1,196,320,000 | |||||||||||
| € | 250,000,000 | 2.00% Inflation Indexed | 99.02 | March 30, 2007 | September 15, 2062 | € | 299,145,000 | € | 299,145,000 | |||||||||||
| € | 160,000,000 | 4.49 | % | 99.86 | April 5, 2007 | April 5, 2027 | € | 160,000,000 | € | 160,000,000 | ||||||||||
| € | 500,000,000 | 2.20% Inflation Indexed | 98.86 | January 23, 2008 | September 15, 2058 | € | 587,580,000 | € | 587,580,000 | |||||||||||
| € | 258,000,000 | 5.26 | % | 99.79 | March 16, 2009 | March 16, 2026 | € | 258,000,000 | € | 258,000,000 | ||||||||||
| € | 250,000,000 | 4.85 | % | 98.50 | June 11, 2010 | June 11, 2060 | € | 250,000,000 | € | 250,000,000 | ||||||||||
| € | 125,000,000 | 4.10 | % | 99.46 | September 6, 2010 | November 1, 2023 | € | 125,000,000 | € | 125,000,000 | ||||||||||
| € | 125,000,000 | 4.20 | % | 99.38 | September 6, 2010 | March 3, 2025 | € | 125,000,000 | € | 125,000,000 | ||||||||||
| € | 150,000,000 | 4.45 | % | 99.40 | December 23, 2010 | December 23, 2021 | € | 150,000,000 | € | 150,000,000 | ||||||||||
| € | 500,000,000 | 2.85% Inflation Indexed | 99.48 | January 4, 2011 | September 1, 2022 | € | 558,570,000 | € | 558,570,000 | |||||||||||
| € | 2,259,500,000 | 6.07 | % | 100.00 | July 1, 2011 | December 31, 2027 | € | 1,014,865,975 | € | 1,014,865,975 | ||||||||||
| € | 230,000,000 | 4.20% Inflation Indexed | 100.00 | February 1, 2012 | July 25, 2042 | € | 250,010,000 | € | 250,010,000 | |||||||||||
| € | 437,500,000 | 3.44 | % | 100.00 | February 13, 2012 | December 31, 2024 | € | 15,718,983 | € | 15,718,983 | ||||||||||
| € | 500,000,000 | 4.75 | % | 99.85 | May 28, 2013 | May 28, 2063 | € | 500,000,000 | € | 500,000,000 | ||||||||||
| € | 500,000,000 | 5.05 | % | 99.53 | September 11, 2013 | September 11, 2053 | € | 500,000,000 | € | 500,000,000 | ||||||||||
| € | 250,000,000 | 2.97% Inflation Indexed | 100.00 | January 24, 2014 | January 24, 2044 | € | 262,117,500 | € | 262,117,500 | |||||||||||
| € | 1,000,000,000 | 1.51% Inflation Indexed | 100.00 | October 15, 2014 | September 15, 2028 | € | 1,048,890,000 | € | 1,048,890,000 | |||||||||||
| € | 1,000,000,000 | 1.86 | % | 100.00 | February 2, 2015 | February 2, 2028 | € | 1,000,000,000 | € | 1,000,000,000 | ||||||||||
| € | 500,000,000 | 2.19 | % | 100.00 | February 2, 2015 | February 2, 2032 | € | 500,000,000 | € | 500,000,000 | ||||||||||
| € | 300,000,000 | 1.19% Inflation Indexed | 96.02 | February 18, 2015 | February 18, 2043 | € | 314,091,000 | € | 314,091,000 | |||||||||||
| € | 500,000,000 | 1.77 | % | 94.21 | March 5, 2015 | March 5, 2029 | € | 500,000,000 | € | 500,000,000 | ||||||||||
| € | 500,000,000 | 2.00 | % | 92.16 | March 5, 2015 | September 5, 2032 | € | 500,000,000 | € | 500,000,000 | ||||||||||
| € | 500,000,000 | 1.67 | % | 100.00 | May 6, 2015 | May 6, 2028 | € | 500,000,000 | € | 500,000,000 | ||||||||||
| € | 700,000,000 | 2.13 | % | 100.00 | May 22, 2015 | May 22, 2027 | € | 700,000,000 | € | 700,000,000 | ||||||||||
| € | 636,000,000 | 1,48% Inflation Indexed | 100.00 | May 4, 2016 | May 4, 2046 | € | 673,110,600 | € | 673,110,600 | |||||||||||
| € | 700,000,000 | 1.91 | % | 100.00 | May 18, 2016 | May 18, 2029 | € | 800,000,000 | € | 800,000,000 | ||||||||||
| € | 800,000,000 | 1.90 | % | 100.00 | June 22, 2016 | June 22, 2031 | € | 700,000,000 | € | 700,000,000 | ||||||||||
| € | 900,000,000 | 1.45 | % | 100.00 | October 17, 2016 | April 17, 2027 | € | 900,000,000 | € | 900,000,000 | ||||||||||
| € | 801,000,000 | 0.91% Inflation Indexed | 100.00 | December 2, 2019 | September 1, 2039 | € | 797,712,000 | € | 797,712,000 | |||||||||||
| € | 1,400,000,000 | 5.35 | % | 100.00 | January 27, 2020 | January 27, 2048 | € | 1,400,000,000 | € | 1,400,000,000 | ||||||||||
| € | 2,000,000,000 | Zero Coupon | 99.49 | April 29,2020 | March 24, 2021 | € | 2,000,000,000 | € | 2,000,000,000 | |||||||||||
| € | 2,000,000,000 | Zero Coupon | 99.40 | April 29, 2020 | May 5, 2021 | € | 2,000,000,000 | € | 2,000,000,000 | |||||||||||
| € | 2,000,000,000 | Zero Coupon | 99.79 | May 12,2020 | April 28, 2021 | € | 2,000,000,000 | € | 2,000,000,000 | |||||||||||
| € | 2,000,000,000 | Zero Coupon | 99.89 | May 29, 2020 | June 09, 2021 | € | 2,000,000,000 | € | 2,000,000,000 | |||||||||||
| € | 725,000,000 | Floating | 100.00 | December 2, 2020 | December 2, 2040 | € | 725,000,000 | € | 725,000,000 | |||||||||||
102
| Original Currency Nominal Amount | Interest Rate | Initial Public Offering Price (%) | Date of Issue | Maturity Date | Amount Outstanding | Equivalent in Euro | ||||||||||||||
| �� | € | 28,868,131,058 | € | 28,868,131,058 | ||||||||||||||||
Euro Ispa Bonds(3) | ||||||||||||||||||||
| € | 3,250,000,000 | 5.12 | % | 98.93 | February 6, 2004 | July 31, 2024 | € | 3,250,000,000 | € | 3,250,000,000 | ||||||||||
| € | 2,200,000,000 | 5.20 | % | 105.12 | February 6, 2004 | July 31, 2034 | € | 2,200,000,000 | € | 2,200,000,000 | ||||||||||
| € | 850,000,000 | Floating | 100.00 | March 4, 2005 | July 31, 2045 | € | 850,000,000 | € | 850,000,000 | |||||||||||
| € | 1,000,000,000 | Floating | 100.00 | April 25, 2005 | July 31, 2045 | € | 1,000,000,000 | € | 1,000,000,000 | |||||||||||
| € | 300,000,000 | Floating | 100.00 | June 30, 2005 | July 31, 2035 | € | 300,000,000 | € | 300,000,000 | |||||||||||
| € | 100,000,000 | Floating | 100.00 | June 30, 2005 | July 31, 2035 | € | 100,000,000 | € | 100,000,000 | |||||||||||
| € | 7,700,000,000 | € | 7,700,000,000 | |||||||||||||||||
Pound Sterling(4)(*) | ||||||||||||||||||||
| £ | 1,500,000,000 | 6.00 | % | 98.56 | August 4, 1998 | August 4, 2028 | £ | 1,500,000,000 | € | 1,668,464,901 | ||||||||||
| £ | 250,000,000 | 5.25 | % | 99.47 | July 29, 2004 | December 7, 2034 | £ | 250,000,000 | € | 278,077,484 | ||||||||||
| £ | 1,750,000,000 | € | 1,946,542,385 | |||||||||||||||||
Japanese Yen(5)(*) | ||||||||||||||||||||
| ¥ | 25,000,000,000 | 0.88 | % | 100 | March 29, 2019 | March 29, 2023 | ¥ | 25,000,000,000 | € | 197,644,083 | ||||||||||
| ¥ | 25,000,000,000 | € | 197,644,083 | |||||||||||||||||
| TOTAL OUTSTANDING | € | 51,343,724,908 | ||||||||||||||||||
________________________________
| (1) | U.S. dollar amounts have been converted into euro at $1.2271/€1.00, the exchange rate prevailing at December 31, 2020. |
| (2) | External debt denominated in currencies of countries that have adopted the euro have been converted into euro at the fixed rate at which those currencies were converted into euro upon their issuing countries becoming members of the European Monetary Union. |
| (3) | Bonds issued by Infrastrutture S.p.A. |
| (4) | Pounds Sterling amounts have been converted into euro at £0.89903/€1.00, the exchange rate prevailing at December 31, 2020. |
| (5) | Japanese Yen amounts have been converted into euro at ¥126.490/€1.00, the exchange rate prevailing at December 31, 2020. |
(*) The above exchange rates are based on the official exchange rates of the Bank of Italy.
Source: Ministry of Economy and Finance.
| As of December 31, 2020 | ||||||||
| Currency | Before Swap (in %) | After Swap (in %) | ||||||
| US Dollars | 24.60 | 3.47 | ||||||
Euro(1) | 71.22 | 96.00 | ||||||
| Pounds Sterling | 3.79 | 0.53 | ||||||
| Japanese Yen | 0.39 | - | ||||||
| Total External Bonds (in millions of Euro) | 51,343.72 | 52,789.82 | ||||||
________________________________
| (1) | Including Euro ISPA Bonds. |
Source: Ministry of Economy and Finance.
As of December 31, 2020, the holdings of General Government debt were as follows: the Bank of Italy held €566,180 million, other Monetary Financial Institutions held €652,723 million, other resident financial institutions held €363,937 million, other residents held €232,883 million, and other non-residents held €767,662 million.
103
Floating Internal Debt (1) as of September 30, 2021
| Interest Rate | Maturity Date | Outstanding principal amount | ||||
| (Millions of euro) | ||||||
| BOT (3 months) | various | various | 0 | |||
| BOT (6 months) | various | various | 38,722 | |||
Treasury accounts (2) | floating | none | 171,137 | |||
| Total floating internal debt of the Treasury | 209,859 | |||||
Liquidity buffer (2) | floating | none | (139,656 | ) | ||
| Total floating internal debt net of liquidity buffer | 70,203 | |||||
________________________________
| (1) | Floating debt is debt that has a maturity at issuance of less than one year. Funded debt is debt that has a maturity at issuance of one year or more. |
| (2) | Data as of August 31, 2021. |
Source: Ministry of Economy and Finance and Bank of Italy.
Funded Internal Debt(1) as of September 30, 2021
| Interest Rate | Maturity Date | Outstanding principal amount | ||||
| (Millions of euro) | ||||||
| BOT (12 months) | various | various | 85,355 | |||
| CTZ | various | various | 45,826 | |||
| CCT | various | various | 144,033 | |||
| BTP | various | various | 1,638,571 | |||
| BTP Futura | various | various | 17,321 | |||
| BTP€I | various | various | 160,985 | |||
| BTP Italia | various | various | 77,827 | |||
Other funded internal debt (2) | various | various | 261,416 | |||
| Total funded internal debt of the Treasury | 2,431,334 | |||||
________________________________
| (1) | Floating debt is debt that has a maturity at issuance of less than one year. Funded debt is debt that has a maturity at issuance of one year or more. This table does not include the loans under the SURE Facility. For further information on the SURE Facility see “Republic of Italy – EU measures enacted in response to the Coronavirus pandemic” and the table below "Other Debt as of September 30, 2021". |
| (2) | Data as of August 31, 2021. |
Source: Ministry of Economy and Finance and Bank of Italy.
External Bonds of the Treasury as of September 30, 2021
The following table shows the external bonds of the Treasury issued and outstanding as of September 30, 2021.
| Original Currency Nominal Amount | Interest Rate | Initial Public Offering Price (%) | Date of Issue | Maturity Date | Amount Outstanding | Equivalent in Euro | ||||||||||||||
United States Dollar(1)(*) | ||||||||||||||||||||
| $ | 3,500,000,000 | 6.88 | % | 98.73 | September 27, 1993 | September 27, 2023 | $ | 3,500,000,000 | € | 3,022,713,533 | ||||||||||
| $ | 2,000,000,000 | 5.38 | % | 98.44 | February 27, 2003 | June 15, 2033 | $ | 2,000,000,000 | € | 1,727,264,876 | ||||||||||
| $ | 2,500,000,000 | 2.38 | % | 99.72 | October 17, 2019 | October 17, 2024 | $ | 2,500,000,000 | € | 2,159,081,095 | ||||||||||
104
| Original Currency Nominal Amount | Interest Rate | Initial Public Offering Price (%) | Date of Issue | Maturity Date | Amount Outstanding | Equivalent in Euro | ||||||||||||||
| $ | 2,000,000,000 | 2.88 | % | 99.09 | October 17, 2019 | October 17, 2029 | $ | 2,000,000,000 | € | 1,727,264,876 | ||||||||||
| $ | 2,500,000,000 | 4.00 | % | 99.62 | October 17, 2019 | October 17, 2049 | $ | 2,500,000,000 | € | 2,159,081,095 | ||||||||||
| $ | 3,000,000,000 | 1.25 | % | 99.64 | November 18, 2020 | February 17, 2026 | $ | 3,000,000,000 | € | 2,590,897,314 | ||||||||||
| $ | 2,000,000,000 | 0.88 | % | 99.67 | May 6, 2021 | May 6, 2024 | $ | 2,000,000,000 | € | 1,727,264,876 | ||||||||||
| $ | 1,500,000,000 | 4.00 | % | 98.90 | May 6, 2021 | May 6, 2051 | $ | 1,500,000,000 | € | 1,295,448,657 | ||||||||||
| $ | 19,000,000,000 | € | 16,409,016,323 | |||||||||||||||||
Euro (2) | ||||||||||||||||||||
| € | 1,000,000,000 | Floating | 101.60 | June 28, 1999 | June 28, 2029 | € | 905,000,000 | € | 905,000,000 | |||||||||||
| € | 150,000,000 | Zero Coupon | 100.00 | February 20, 2001 | February 20, 2031 | € | 150,000,000 | € | 150,000,000 | |||||||||||
| € | 300,000,000 | Floating | 100.00 | May 31, 2005 | May 31, 2035 | € | 300,000,000 | € | 300,000,000 | |||||||||||
| € | 200,000,000 | Floating | 100.00 | November 9, 2005 | November 9, 2025 | € | 200,000,000 | € | 200,000,000 | |||||||||||
| € | 192,000,000 | 4.42 | % | 100.00 | March 28, 2006 | March 28, 2036 | € | 192,000,000 | € | 192,000,000 | ||||||||||
| € | 215,000,000 | Floating | 100.00 | May 11, 2006 | May 11, 2026 | € | 215,000,000 | € | 215,000,000 | |||||||||||
| € | 1,000,000,000 | 1.85% Inflation Indexed | 99.80 | January 5, 2007 | September 15, 2057 | € | 1,224,180,000 | € | 1,224,180,000 | |||||||||||
| € | 250,000,000 | 2.00% Inflation Indexed | 99.02 | March 30, 2007 | September 15, 2062 | € | 306,112,500 | € | 306,112,500 | |||||||||||
| € | 500,000,000 | 2.20% Inflation Indexed | 98.86 | January 23, 2008 | September 15, 2058 | € | 601,270,000 | € | 601,270,000 | |||||||||||
| € | 258,000,000 | 5.26 | % | 99.79 | March 16, 2009 | March 16, 2026 | € | 258,000,000 | € | 258,000,000 | ||||||||||
| € | 250,000,000 | 4.85 | % | 98.50 | June 11, 2010 | June 11, 2060 | € | 250,000,000 | € | 250,000,000 | ||||||||||
| € | 125,000,000 | 4.10 | % | 99.46 | September 6, 2010 | November 1, 2023 | € | 125,000,000 | € | 125,000,000 | ||||||||||
| € | 125,000,000 | 4.20 | % | 99.38 | September 6, 2010 | March 3, 2025 | € | 125,000,000 | € | 125,000,000 | ||||||||||
| € | 150,000,000 | 4.45 | % | 99.40 | December 23, 2010 | December 23, 2021 | € | 150,000,000 | € | 150,000,000 | ||||||||||
| € | 500,000,000 | 2.85% Inflation Indexed | 99.48 | January 4, 2011 | September 1, 2022 | € | 571,585,000 | € | 571,585,000 | |||||||||||
| € | 2,259,500,000 | 6.07 | % | 100.00 | July 1, 2011 | December 31, 2027 | € | 1,014,865,975 | € | 1,014,865,975 | ||||||||||
| € | 230,000,000 | 4.20% Inflation Indexed | 100.00 | February 1, 2012 | July 25, 2042 | € | 255,833,600 | € | 255,833,600 | |||||||||||
| € | 437,500,000 | 3.44 | % | 100.00 | February 13, 2012 | December 31, 2024 | € | 10,287,622 | € | 10,287,622 | ||||||||||
| € | 500,000,000 | 4.75 | % | 99.85 | May 28, 2013 | May 28, 2063 | € | 500,000,000 | € | 500,000,000 | ||||||||||
| € | 500,000,000 | 5.05 | % | 99.53 | September 11, 2013 | September 11, 2053 | € | 500,000,000 | € | 500,000,000 | ||||||||||
| € | 250,000,000 | 2.97% Inflation Indexed | 100.00 | January 24, 2014 | January 24, 2044 | € | 268,222,500 | € | 268,222,500 | |||||||||||
| € | 1,000,000,000 | 1.51% Inflation Indexed | 100.00 | October 15, 2014 | September 15, 2028 | € | 1,073,320,000 | € | 1,073,320,000 | |||||||||||
| € | 1,000,000,000 | 1.86 | % | 100.00 | February 2, 2015 | February 2, 2028 | € | 1,000,000,000 | € | 1,000,000,000 | ||||||||||
| € | 500,000,000 | 2.19 | % | 100.00 | February 2, 2015 | February 2, 2032 | € | 500,000,000 | € | 500,000,000 | ||||||||||
| € | 300,000,000 | 1.19% Inflation Indexed | 96.02 | February 18, 2015 | February 18, 2043 | € | 321,405,000 | € | 321,405,000 | |||||||||||
| € | 500,000,000 | 1.77 | % | 94.21 | March 5, 2015 | March 5, 2029 | € | 500,000,000 | € | 500,000,000 | ||||||||||
| € | 500,000,000 | 2.00 | % | 92.16 | March 5, 2015 | September 5, 2032 | € | 500,000,000 | € | 500,000,000 | ||||||||||
| € | 500,000,000 | 1.67 | % | 100.00 | May 6, 2015 | May 6, 2028 | € | 500,000,000 | € | 500,000,000 | ||||||||||
| € | 700,000,000 | 2.13 | % | 100.00 | May 22, 2015 | May 22, 2027 | € | 700,000,000 | € | 700,000,000 | ||||||||||
| € | 636,000,000 | 1,48% Inflation Indexed | 100.00 | May 4, 2016 | May 4, 2046 | € | 688,788,000 | € | 688,788,000 | |||||||||||
| € | 700,000,000 | 1.91 | % | 100.00 | May 18, 2016 | May 18, 2029 | € | 800,000,000 | € | 800,000,000 | ||||||||||
| € | 800,000,000 | 1.90 | % | 100.00 | June 22, 2016 | June 22, 2031 | € | 700,000,000 | € | 700,000,000 | ||||||||||
| € | 900,000,000 | 1.45 | % | 100.00 | October 17, 2016 | April 17, 2027 | € | 900,000,000 | € | 900,000,000 | ||||||||||
| € | 801,000,000 | 0.91% Inflation Indexed | 100.00 | December 2, 2019 | September 1, 2039 | € | 816,288,000 | € | 816,288,000 | |||||||||||
| € | 1,400,000,000 | 5.35 | % | 100.00 | January 27, 2020 | January 27, 2048 | € | 1,400,000,000 | € | 1,400,000,000 | ||||||||||
| € | 725,000,000 | Floating | 100.00 | December 2, 2020 | December 2, 2040 | € | 725,000,000 | € | 725,000,000 | |||||||||||
| € | 19,247,158,197 | € | 19,247,158,197 | |||||||||||||||||
Euro Ispa Bonds(3) | ||||||||||||||||||||
| € | 3,250,000,000 | 5.12 | % | 98.93 | February 6, 2004 | July 31, 2024 | € | 3,250,000,000 | € | 3,250,000,000 | ||||||||||
| € | 2,200,000,000 | 5.20 | % | 105.12 | July 6, 2004 | July 31, 2034 | € | 2,200,000,000 | € | 2,200,000,000 | ||||||||||
| € | 850,000,000 | Floating | 100.00 | March 4, 2005 | July 31, 2045 | € | 850,000,000 | € | 850,000,000 | |||||||||||
| € | 1,000,000,000 | Floating | 100.00 | April 25, 2005 | July 31, 2045 | € | 1,000,000,000 | € | 1,000,000,000 | |||||||||||
| € | 300,000,000 | Floating | 100.00 | June 30, 2005 | July 31, 2035 | € | 300,000,000 | € | 300,000,000 | |||||||||||
| € | 100,000,000 | Floating | 100.00 | June 30, 2005 | July 31, 2035 | € | 100,000,000 | € | 100,000,000 | |||||||||||
| € | 7,700,000,000 | € | 7,700,000,000 | |||||||||||||||||
105
| Original Currency Nominal Amount | Interest Rate | Initial Public Offering Price (%) | Date of Issue | Maturity Date | Amount Outstanding | Equivalent in Euro | ||||||||||||||
Pound Sterling(4)(*) | ||||||||||||||||||||
| £ | 1,500,000,000 | 6.00 | % | 98.56 | August 4, 1998 | August 4, 2028 | £ | 1,500,000,000 | € | 1,743,111,803 | ||||||||||
| £ | 250,000,000 | 5.25 | % | 99.47 | July 29, 2004 | December 7, 2034 | £ | 250,000,000 | € | 290,518,634 | ||||||||||
| £ | 1,750,000,000 | € | 2,033,630,437 | |||||||||||||||||
Japanese Yen(5)(*) | ||||||||||||||||||||
| ¥ | 25,000,000,000 | 0.88 | % | 100 | March 29, 2019 | March 29, 2023 | ¥ | 25,000,000,000 | € | 192,797,100 | ||||||||||
| ¥ | 25,000,000,000 | € | 192,797,100 | |||||||||||||||||
| TOTAL OUTSTANDING | € | 45,582,602,057 | ||||||||||||||||||
________________________________
| (1) | U.S. dollar amounts have been converted into euro at $1.1579/€1.00, the exchange rate prevailing at September 30, 2021. |
| (2) | External debt denominated in currencies of countries that have adopted the euro have been converted into euro at the fixed rate at which those currencies were converted into euro upon their issuing countries becoming members of the European Monetary Union. |
| (3) | Bonds issued by Infrastrutture S.p.A. |
| (4) | Pounds Sterling amounts have been converted into euro at £0.86053/€1.00, the exchange rate prevailing at September 30, 2021. |
| (5) | Japanese Yen amounts have been converted into euro at ¥129.67/€1.00, the exchange rate prevailing at September 30, 2021. |
(*) The above exchange rates are based on the official exchange rates of the Bank of Italy.
Source: Ministry of Economy and Finance.
| As of September 30, 2021 | ||||||||
| Currency | Before Swap (in %) | After Swap (in %) | ||||||
| US Dollars | 36.01 | 4.21 | ||||||
Euro(1) | 59.11 | 95.16 | ||||||
| Pounds Sterling | 4.46 | 0.63 | ||||||
| Japanese Yen | 0.42 | - | ||||||
| Total External Bonds (in millions of Euro) | 45,582.60 | 46,187.87 | ||||||
________________________________
| (1) | Including Euro ISPA Bonds. |
Source: Ministry of Economy and Finance.
Other Debt as of September 30, 2021
| Original Currency Nominal Amount | Interest Rate | Initial Public Offering Price (%) | Date of Issue | Maturity Date | Amount Outstanding | Equivalent in Euro | ||||||||||||||
| € | 5,500,000,000 | 0.00 | % | 102,396 | October 27, 2020 | October 4, 2030 | € | 5,500,000,000 | € | 5,500,000,000 | ||||||||||
| € | 4,500,000,000 | 0.10 | % | 99,390 | October 27, 2020 | October 4, 2040 | € | 4,500,000,000 | € | 4,500,000,000 | ||||||||||
| € | 3,100,000,000 | 0.00 | % | 102,566 | November 17, 2020 | November 4, 2025 | € | 3,100,000,000 | € | 3,100,000,000 | ||||||||||
| € | 3,400,000,000 | 0.30 | % | 99,520 | November 17, 2020 | November 4, 2050 | € | 3,400,000,000 | € | 3,400,000,000 | ||||||||||
| € | 4,450,000,000 | 0.00 | % | 103,719 | February 2, 2021 | June 2, 2028 | € | 4,450,000,000 | € | 4,450,000,000 | ||||||||||
| € | 3,857,000,000 | 0.20 | % | 99,582 | March 16, 2021 | June 4, 2036 | € | 3,867,000,000 | € | 3,867,000,000 | ||||||||||
| € | 670,000,000 | 000 | % | 102,440 | March 30, 2021 | March 4, 2026 | € | 670,000,000 | € | 670,000,000 | ||||||||||
| € | 1,200,000,000 | 0.45 | % | 99,386 | March 30, 2021 | May 2, 2046 | € | 1,200,000,000 | € | 1,200,000,000 | ||||||||||
| € | 751,000,000 | 0.75 | % | 99,838 | May 25, 2021 | January 4, 2047 | € | 751,000,000 | € | 751,000,000 | ||||||||||
| € | 15,938,235,000 | n/ | d | n/ | d | August 13, 2021 | August 13, 2051 | € | 15,938,235,000 | € | 15,938,235,000 | |||||||||
| TOTAL OUTSTANDING | € | 43,376,235,352 | ||||||||||||||||||
Source: Ministry of Economy and Finance.
106