The health and economic situation has improved markedly in recent months. In our country, this has been achieved thanks to well-balanced preventive measures, the great effort of health personnel, the conscious discipline shown by citizens, the economic support measures implemented by the Government and, increasingly, the advancement of the Covid-19 vaccination campaign.
The Government's target of vaccinating 80 percent of the population over the age of 12 with a double dose will be achieved in the coming days; more than 83 percent of Italian citizens over 12 has already received at least one vaccine dose and more than 6 percent of frail individuals have already received a third booster inoculation. Early summer saw a resurgence of Covid-19 infections, also due to the spread of the more contagious Delta variant of SARS-Cov-2. However, in September the 'fourth wave' of the epidemic slowed down, and the latest data indicate less than 40 infections per week per 100 thousand inhabitants.
Good news also came from economic data: real GDP growth in the first half of this year has exceeded forecasts and the most up-to-date indicators suggest that the third quarter will see another leap forward in output. Even assuming a physiological growth slowdown in the last three months of the year, the annual forecast of GDP growth rises to 6.0 percent, from the 4.5 percent theorized in the Stability Programme (SP) of April.
The expectations for further GDP recovery in the coming quarters are primarily linked to the evolution of the pandemic and global demand but will also be affected by the shortages of materials and components and sharp increases in energy prices reported in recent months, factors that also impact companies' production costs and may hinder their production plans. The high worldwide circulation of coronavirus and low vaccination rates in Africa and other geographic areas could favor the rise of more contagious variants, or able to evade current vaccines. In addition, the weakness of the real estate sector and the resulting financial tensions in China may affect the global economy.
While acknowledging these risks, the vision behind the Government's new macroeconomic forecasts for 2022-2024, presented here, is positive. The trend of contagions and pressure indicators on the Italian hospital system will be constantly monitored, and the effects of the beginning of the school year, and the upcoming return to in-person work in the public sector on contagions will be carefully evaluated. However, there is a real possibility of gradually recovering normal levels of openness in social, cultural and sports activities, which will help to reach the pre-crisis quarterly GDP level by the middle of next year. Once this first stage has been achieved, the phase of real economic expansion will begin, bringing the GDP and employment growth well above the rates recorded in the last decade.
The growth of the Italian economy in the coming years will be driven by favorable monetary and financial conditions, by the renewed optimism of businesses
| MINISTRY OF ECONOMY AND FINANCE | 1 |
| | UPDATE OF THE ECONOMIC AND FINANCIAL DOCUMENT 2021 |
and consumers and by the National Recovery and Resilience Plan (NRRP), which represents an unprecedented opportunity to relaunch our country in the spirit of environmental and social sustainability. Following the NRRP approval of the Council of the European Union (EU) in late June, Government and Parliament have steadily continued to work on the Plan. In August, Italy received the down-payment from the EU on grants and loans from the Recovery and Resilience Facility (RRF). The Plan's technical management and monitoring structures have been formalized and are now being established. Some of the reform and regulatory objectives agreed with the European Commission have already been achieved, and in the coming months the necessary commitments will be implemented to complete the first stage of the Plan, preparatory to the allocation of the relevant tranche of RFF grants and loans.
The GDP increases that we are witnessing already reflect some of the incentives for innovation and energy efficiency financed by the NRRP, but they do not incorporate yet its strong impetus for public investment, which is already growing significantly (almost 20 percent in nominal terms in 2020 and 16 percent this year). Thanks also to the recovery of competitiveness witnessed by the expansion of the country's trade surplus, the new trend forecast indicates real GDP growth rates of 4.2 percent in 2022, 2.6 percent in 2023 and 1.9 percent in 2024. These forecasts, which have been validated by the Parliamentary Budget Office, would bring the GDP above the pre-crisis trend in 2024; from 2025, also thanks to the remaining two years of the NRRP, there will be a concrete opportunity to increase product, employment, and wellbeing of Italian citizens to a far greater extent than that imagined before the crisis.
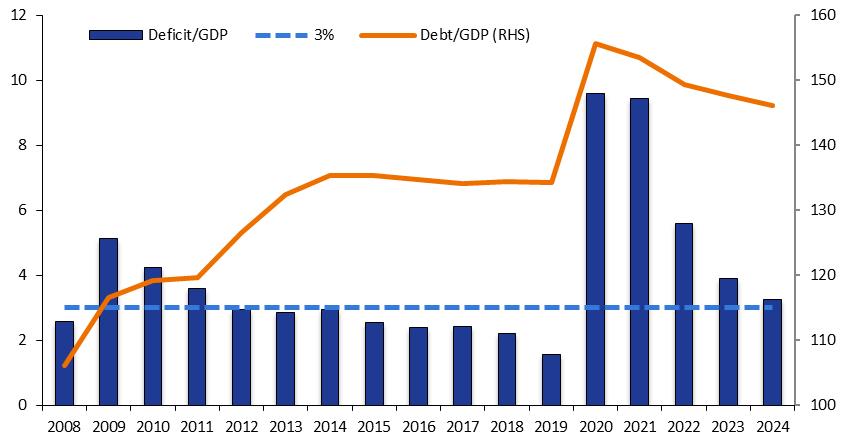
The upward revision of the actual growth forecast, particularly for 2021, and the increase in the GDP deflator also delivers much higher levels of nominal GDP. Expected nominal GDP growth this year is now 7.6 percent, up from 5.6 percent in the SP. In turn, higher nominal growth leads to a significant decrease of general government net borrowing (deficit) forecasts. In 2021 the take-up of extraordinary measures to support workers, households and businesses is also estimated to be lower than originally expected, so that the deficit forecast falls from 11.8 percent of GDP in the SP to 9.4 percent. The levels of net borrowing expected for the coming years also fall sharply, with a trend leading to a deficit of 2.1 percent in 2024 against a projected estimate of 3.4 percent described in the SP.
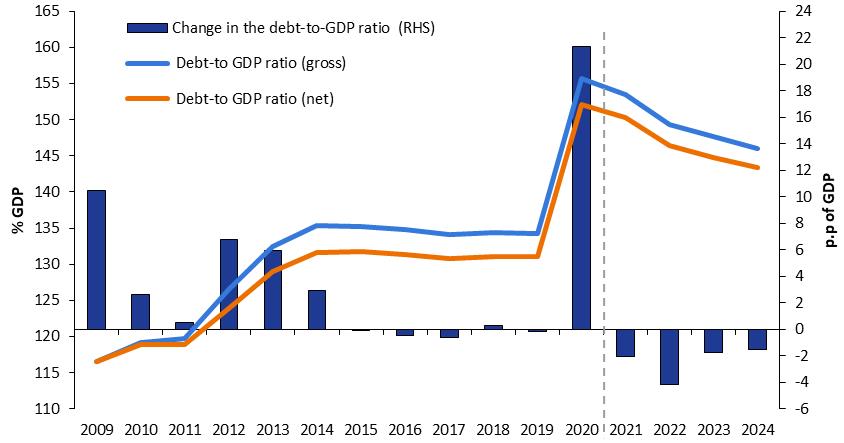
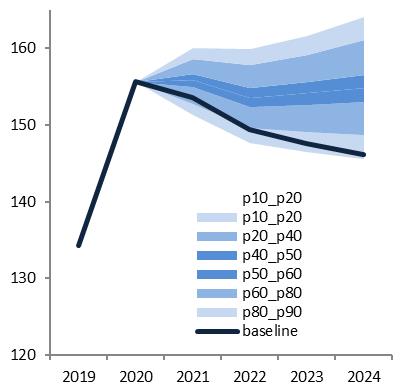
The higher level of GDP and lower deficit also mean that the debt-to-GDP ratio does not rise further this year, as expected in the SP, yet falls to 153.5 percent, from 155.6 percent in 2020.
In the light of this improved economic and financial framework and the Recommendations, country-specific, by the EU Council, the Government confirms the budget policy outlined in the SP, on which Parliament gave its favorable opinion with the motions approved on 22 April.
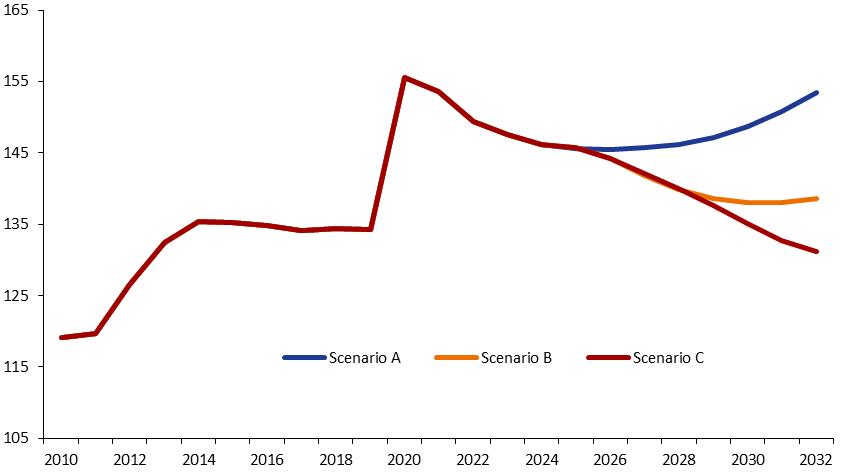
Assuming that the degree of restraint on economic and social activities related to Covid-19 gradually recedes, the budgetary policy will remain expansive until GDP and employment have recovered not only the fall but also the lack of growth from the 2019 level. Based on updated forecasts, this condition can be expected to be met beginning in 2024. From that year onwards, the budgetary policy must be geared more towards reducing the structural deficit and bringing the debt/GDP ratio back to its pre-crisis level (134.3 percent) by 2030.
| 2 | MINISTRY OF ECONOMY AND FINANCE |
The public finance consolidation strategy will be based primarily on GDP growth, boosted by the investments and reforms set forth in the NRRP. In the medium term, it will also be necessary to achieve adequate primary surpluses. To this end, the aim will be to moderate the dynamics of current public spending and increase tax revenues by combating tax evasion. Budget resources will be increasingly steered toward investment and spending on research, innovation, and education.
Consistently with this approach, the maneuver in the 2022-2024 Budget Law will aim to achieve a gradual but significant reduction in net borrowing from 9.4 percent expected for this year to 3.3 percent of GDP in 2024. Compared to the SP, the deficit target for 2022 falls from 5.9 percent of GDP to 5.6 percent, and the expected deficits for the following two years are also lower than those projected in the SP.
The policy scenario for the 2022-2024 three-year period will allow to cover the needs for 'unchanged policies' and the renewal of several measures of economic and social importance, including those relating to the health care system, the Guarantee Fund for SMEs, the energy efficiency implementation measures of buildings and innovative investments. Action will be taken on social safety nets and the easing of tax burdens. The universal single child allowance will be implemented.
Compared to the trend framework, the net borrowing path based on the policy scenario is more than one percentage point of GDP higher starting from 2022. As a result of the related fiscal momentum, the GDP growth projected in the policy scenario is 4.7 percent in 2022, 2.8 percent in 2023, and 1.9 percent in 2024. Employment growth, during the three-year period, is also higher than the trend and the unemployment rate falls accordingly. The decline in the debt-to-GDP ratio will be more gradual in comparison with the trend scenario, but significant, as it will go from 153.5 percent forecast for this year to 146.1 percent in 2024.
In conclusion, this document presents a scenario of growth of the Italian economy and gradual reduction of the deficit and public debt. The budgetary policy remains expansive over the next two years and then gradually becomes more focused on reducing the debt-to-GDP ratio. The full realization of the NRRP remains the great challenge for the coming years, in a global context that is, perhaps, the most complex and intricate in recent history. It is a bet that Italy can win thanks to internal cohesion, good governance, and a strong European rooting.
| | Daniele Franco |
| | Minister of Economy and Finance |
| MINISTRY OF ECONOMY AND FINANCE | 3 |
| | UPDATE OF THE ECONOMIC AND FINANCIAL DOCUMENT 2021 |
| 4 | MINISTRY OF ECONOMY AND FINANCE |
INDEX
FOREWORD
I. RECENT TRENDS IN THE ECONOMY AND THE PUBLIC FINANCES
II. BASELINE MACROECONOMIC AND BUDGET FORECAST
II.1 MACROECONOMIC SCENARIO UNDER EXISTING LEGISLATION
II.2 BUDGETARY OUTLOOK UNDER EXISTING LEGISLATION
III. UPDATED POLICY SCENARIO
III.1 MACROECONOMIC FORECAST AND BUDGET BALANCE - POLICY SCENARIO
III.2 DEBT-TO-GDP RATIO AND THE DEBT RULE
III.3 DEBT-TO-GDP RATIO SCENARIOS IN THE MEDIUM PERIOD
IV. STRUCTURAL REFORMS
V. ANNEX
| MINISTRY OF ECONOMY AND FINANCE | 5 |
| | UPDATE OF THE ECONOMIC AND FINANCIAL DOCUMENT 2021 |
| 6 | MINISTRY OF ECONOMY AND FINANCE |
I. RECENT TRENDS IN THE ECONOMY AND THE PUBLIC FINANCES
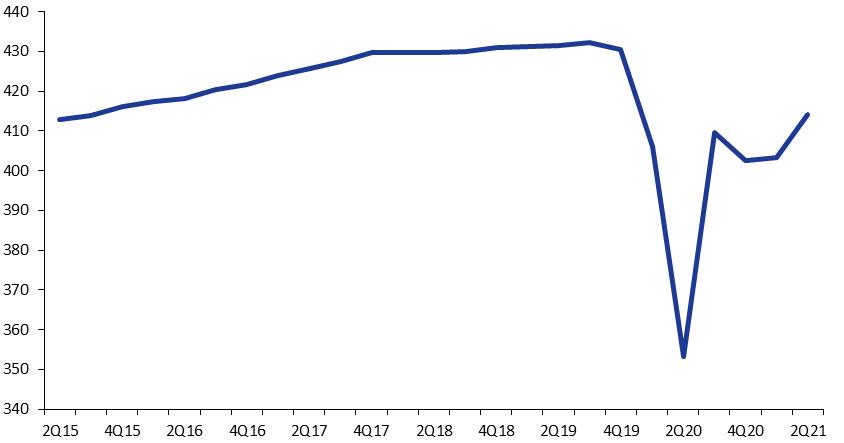
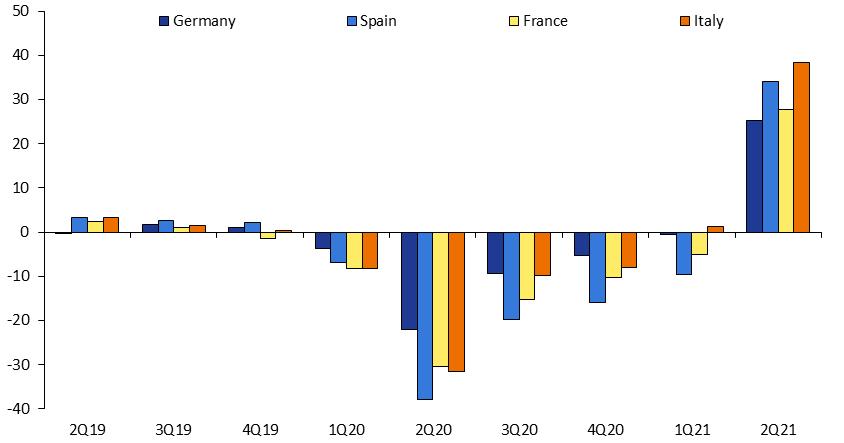
The first half of this year has witnessed a recovery in Gross Domestic Product (GDP) that was well above expectations. A slight increase in the first quarter (0.2 percent over the previous period) was followed by a 2.7 percent rise in the second quarter. The third quarter is expected to mark a further recovery in GDP, with an increase over the previous period of 2.2 percent. Even assuming a more restrained progress of the economic activity in the last three months of the year, the annual forecast of GDP growth rises to 6.0 percent, from the 4.5 percent projected in the 2021 SP.
FIGURE I.1 Gross domestic product at constant prices - quarterly values (billions of €) |
|
SOURCE: ISTAT (ITALIAN NATIONAL INSTITUTE OF STATISTICS) |
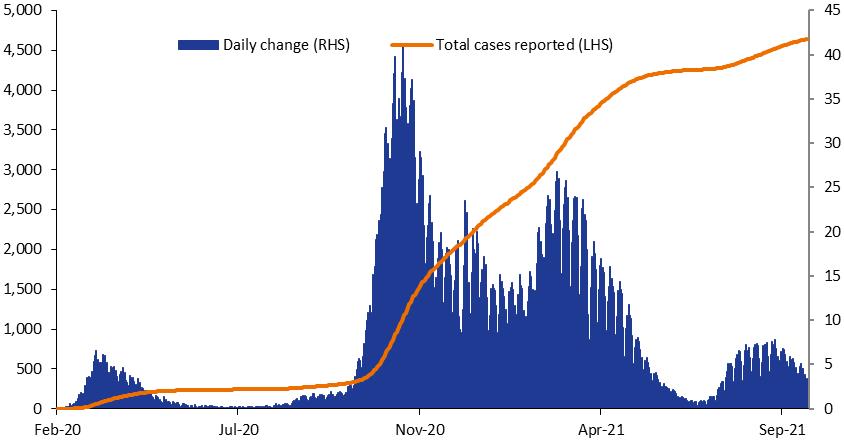
The performance of the economy continues to be primarily determined by Covid-19 outbreak trends and related preventive measures. The significant progress registered with respect to population vaccination in Italy and in our major trading partners has contributed to the easing of restrictions despite the emergence of more contagious variants of SARS-Cov-2. In our country, new infections decreased significantly in May and June, and then increased again in July. However, the 'fourth wave' has visibly slowed down in September; thanks also to levels of hospitalization and intensive care units below the guard threshold, all Italian regions except Sicily remain in the 'white zone'.
| MINISTRY OF ECONOMY AND FINANCE | 7 |
| | UPDATE OF THE ECONOMIC AND FINANCIAL DOCUMENT 2021 |
FIGURE I.2 trend of covid-19 infections in italy (values in thousands) |
|
|
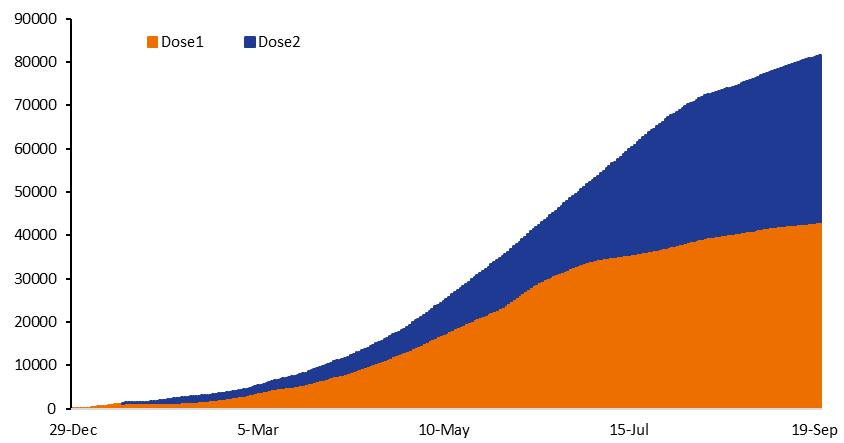
Alongside the slowdown in new infections, vaccinations have come to cover 78.1 percent of the population over the age of 12 with two doses1. Given the recent daily pace of administrations and the announcement of mandatory 'green pass' for all workers, the goal of full vaccination coverage of at least 80 percent of the over-12 population should be achieved in the coming days. Therefore, it can be assumed that no major restrictions on mobility and social contacts should be placed during the fall period.
FIGURE I.3 trend of covid-19 infections in italy (values in thousands) |
|
SOURCE: COVID-19 VACCINE OPENDATA |
1 Data as of 28 September 2021. The percentage of the over-12 population that has received at least one vaccine dose amounts to 83.3 percent. 6.2 percent of frail individuals has received a third booster dose.
| 8 | MINISTRY OF ECONOMY AND FINANCE |
I. RECENT TRENDS IN THE ECONOMY AND THE PUBLIC FINANCES | |
A more reliable assessment will be possible once verified the trend of infections in the weeks following the start of the school year and the expected return to in-presence work in the Public Administration (PA) offices.
In the first half of 2021, the value added in the industrial and construction sectors continued to grow at a relatively strong pace, which in the case of construction, allowed to exceed the pre-pandemic level of output and, in the case of the industrial field, to recover that level. However, starting from the second quarter, it was the service-related sector to drive the recovery in GDP, thanks to the easing of restrictions and social distancing measures.
On the demand side, there was a significant rebound in consumption and further increases in investment. Exports grew significantly, especially in the second quarter. However, the recovery of imports meant that the net contribution of the international trade to the GDP growth in the first half of the year was slightly negative.
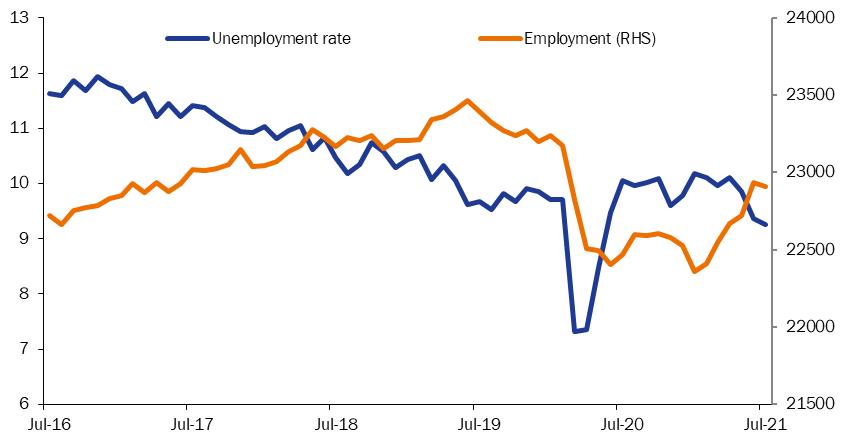
Consistently with the product trends, employment has recovered significantly in the first half of the year. In July, the number of employed persons, according to the labor force survey, was 2.5 percent higher than the lowest level reached at the beginning of the year, although it remained 1.4 percent below the pre-crisis level. The labor input, measured by national accounts (Full-Time Equivalent, FTE) in the first half of the year has marked a recover only slightly higher than that of the GDP, suggesting that much of the productivity gain recorded by the 2020 data has been maintained in the current year.
FIGURE I.4 Employment and unemployment rate - monthly data |
|
|
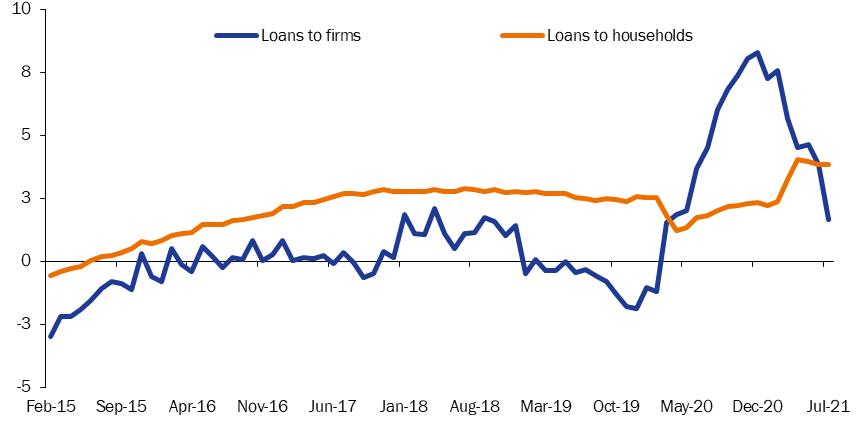
With regard to the trend of credit, after the exceptional increase recorded last year due to the measures implemented by the Government to facilitate access to credit, the overall trend of loans to businesses and households showed a moderate slowdown in 2021, starting from the second quarter. Despite this deceleration, loan levels remain high. The slowdown in the pace of growth of bank loans is attributable
| MINISTRY OF ECONOMY AND FINANCE | 9 |
| | UPDATE OF THE ECONOMIC AND FINANCIAL DOCUMENT 2021 |
to the less intense expansion of those to non-financial companies, while those granted to households continue to grow.
Loans to households regained momentum starting from February; growth accelerated in the following months (+3.8 percent year-on-year in July), benefiting from both the recovery of sales in the real estate market and the expansion of consumer credit2.
As mentioned above, a more contained dynamics has instead characterized the fluctuation over the twelve months in loans to non-financial companies (adjusted to take into account the effects of securitizations): starting in March, the month in which, last year, loans had returned to grow after a moderately long period of contraction, a deceleration of growth was observed compared to the first months of the year, which led in July to an increase of 1.7 percent on an annual basis, almost six points below the expansion rate at the beginning of 2021.
| FIGURE I.5: LOANS TO THE PRIVATE SECTOR (% change y/y) |
|
| Source: Bank of Italy. |
On the credit supply side, financing conditions remain relaxed. Lending rates charged by banks are very low and close to all-time lows. Businesses' ratings of credit access conditions indicate good credit availability. The banks' capital condition remains overall solid. The latest surveys show that the process of disposal of non-performing loans continues. In the first seven months of the year, in fact, the share of impaired loans over total loans to businesses amounted to 4.9 percent (compared to 7.3 percent in the same period of 2020).
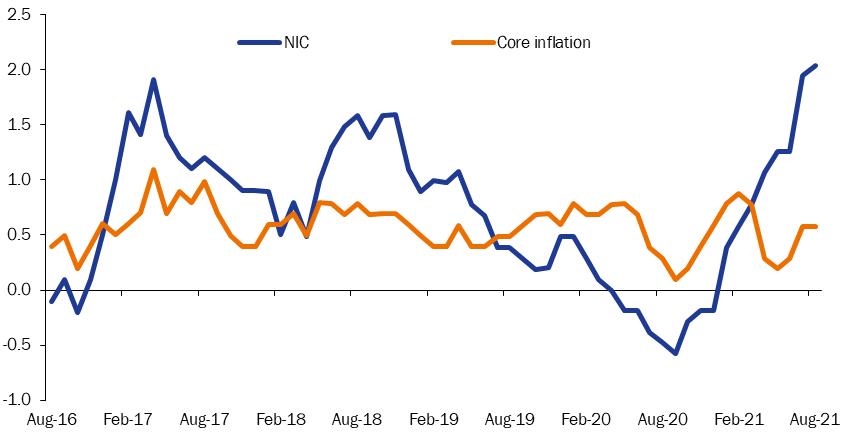
The year 2021 has also been marked so far by a recovery in inflation, less pronounced than in other advanced economies but still significant. The consumer price index for the whole nation (NIC), after an average decline of 0.2 percent in 2020, has increased on average by 1.2 percent in the first eight months of this year over the corresponding period in 2020, driven by a rebound in energy prices. The trend inflation rate in August has risen to 2.0 percent, driven by regulated energy
2 Data extracted from the Real Estate Market Observatory's 2021 Q2 Report.
| 10 | MINISTRY OF ECONOMY AND FINANCE |
I. RECENT TRENDS IN THE ECONOMY AND THE PUBLIC FINANCES | |
goods (+34.4 percent) and other energy ones (+12.8 percent). Core inflation (consumer prices excluding energy, food and tobacco) remains low (0.6 percent in August) and contractual wage growth at the end of June was zero in the public sector and moderate in the private one (trend 1.2 percent in the industrial sector and 0.7 percent in market services). With the exception of hospitality and food services, for which inflation in August stood at 2.3 percent, there is currently no evidence of a widening of the inflationary process in Italy.
It should be noted, however, that the growth in industrial producer prices (IPP) has accelerated considerably (10.4 percent in July), also in the component net excluding energy (6.1 percent). Excluding exported goods, the domestic market-related IPP rose by 12.3 percent as a trend in June, while building construction prices rose by 4.4 percent. Although these trends relate to a very weak 2020 (-4.3 percent for industrial products on the domestic market and +0.2 percent for construction) there is a real risk of transmission of the significant price increases from the production stage to the consumption stage.
The Government has already taken action in July to reduce the cost of electricity bills by cutting the so-called system charges; in view of the recent increases in natural gas and electricity prices, on 23 September a new intervention to reduce tax charges, amounting to €3.5 billion, was announced.
FIGURE I.6: Consumer prices, trend changes (in percentage) |
|
|
In terms of foreign trade, there was a further widening of the trade surplus and the current account balance surplus, both amounting to around 3.9 percent of GDP in the twelve months ending in June. The recovery of imports due to the strengthening of domestic demand should lead to a slight narrowing of the surplus in the second half of the year; nevertheless, 2021 is expected to end with a surplus of 3.6 percent of GDP for both balances.
The outlook for world trade in the second half of 2021 appears favorable, although there are signs of stabilization in the summer months caused by semiconductor shortages and maritime transport delays resulting in longer product
| MINISTRY OF ECONOMY AND FINANCE | 11 |
| | UPDATE OF THE ECONOMIC AND FINANCIAL DOCUMENT 2021 |
delivery times. Foreign demand continues to be steady, with the related PMI index of manufacturing orders remaining in positive territory, reaching 61.4 points in August.
| FIGURE I.7: EXPORTS OF GOODS AND SERVICES IN VOLUME (percentage changes y/y) |
|
| Source: Eurostat. |
Finally, with reference to public finance. The cash requirement of the state sector in the first eight months of the year has shown a much more moderate trend than expected, amounting to 70.1 billion, around 36.2 billion less than in the same period of 2020 (27.2 billion less if grants received in August from the Recovery and Resilience Facility - RRF - are excluded). On the other hand, general government net borrowing in the first quarter amounted to 13.1 percent of GDP in non-seasonally adjusted terms, up from 10.6 percent in 2020 and 6.5 percent in 2019. However, it should be noted that public finances in the first quarter of this year have been fully affected by the pandemic and the related economic support measures, whereas last year they were strongly impacted in just March. In light of the steady performance of tax and contribution revenues (+ 8.8 percent in the first seven months of the year over the corresponding period of 2020) and lower-than-expected expenditure, the annual net borrowing is expected to be lower than in 2020.
| 12 | MINISTRY OF ECONOMY AND FINANCE |
I. RECENT TRENDS IN THE ECONOMY AND THE PUBLIC FINANCES | |
| | Recent initiatives of the Italian Government in response to the COVID-19 health emergency Below are the most relevant decisions taken to contain the epidemiological emergency following the approval of the 2021 Economic and Financial Document, in which the measures taken in the October 2020 - March 2021 period were reported. 21 April. Approval of the “Reopening”3 Decree Law (D.L. ‘Riaperture’), which provides for: the extension of the state of emergency until 31 July; the reintroduction of white and yellow areas; the introduction of 'Covid-19 green certifications' (so-called ‘Green Pass’), certifying the vaccination, recovery, or a negative swab; the establishment of a program for the gradual resumption of economic activities. 26 April. Pursuant to the “Reopening” Decree Law, moving between yellow or white regions is allowed. Green Pass holders may move throughout the whole territory. In-person education is guaranteed up to 70 percent in the red zone and from 70 to 100 percent in yellow and orange zones. Table service at lunch and dinner is allowed again, only outdoors and within curfew limits. Performances open to the public are allowed, subject to capacity limitations. Carrying out any outdoor sports activity is allowed again. 15 May. Pursuant to the “Reopening” Decree Law, carrying out outdoor pool activities is allowed again. 17 May. Approval of Decree Law No. 65/2021, which makes changes to the reopening schedule set forth in the previous “Reopening” Decree Law. Curfew hours adjusted from 10:00 p.m. to 11:00 p.m. 22 May. Pursuant to Decree Law. No. 65/2021, malls reopen on weekends too. 24 May. Pursuant to Decree Law No. 65/2021, gyms reopen. 25 May. Approval of the “Support bis”4 Decree Law (D.L. ‘Sostegni bis’), which provides for an allocation of €40 billion from the budget slippage already authorized by the Parliament, for the support of economic activities. Contributions to enterprises, amounting to €15 billion are expected, with an increase of the number of beneficiaries; implementation of measures to ensure access to credit and the liquidity of businesses, including the extension of the moratorium on loans to 31 December 2021; expected allocation of €2.8 billion for the support and strengthening of the health system; expected implementation of measures amounting to €4.2 billion to protect workers, including the extension of the emergency income and a new one-time allowance for seasonal, tourism and sports workers; €1.9 billion have been allocated to support local authorities, including €500 million for local public transport; 1.4 billion have been allocated for young people, schools and research, including the extension of subsidies for the purchase of first homes; the Italian Fund for Science has been established, with an endowment of €50 million for 2021 and 150 million from 2022, in order to promote research and the development of innovative drugs; expected implementation of measures targeting specific sectors, including transport. 17 June. Signature of a Prime Ministerial Decree to outline the modalities for issuing the Green Certification. From 1 July 2021, the Green Certification will be valid as an EU digital Covid Certificate and will make travel between Schengen countries easier. 21 June. Pursuant to the “Reopening” Decree Law curfew is lifted for regions in white or yellow zones. 26 June. For the first time, all Italian regions are white zones. 30 June. Approval of the 'Labor' Decree5 which, in particular, confirms the removal of the freeze on layoffs as of 1 July 2021, with the exception of companies in the sectors most affected by the crisis, and those requesting access to the ‘CIG in deroga’ (exceptional fund to supplement earnings) scheme. 22 July. The state of emergency is extended through 31 December 2021. Approval of Decree Law No. 105/2021, regulating the use of the Green Pass, made mandatory to access public places such as restaurants, museums and swimming pools, or to participate in shows, events, |
| MINISTRY OF ECONOMY AND FINANCE | 13 |
| | UPDATE OF THE ECONOMIC AND FINANCIAL DOCUMENT 2021 |
| | fairs or public competitions. In addition, for the transition of a region from a zone to a zone of higher severity (e.g., from white to yellow), the criterion of the incidence of positive cases in the population is added to the occupancy rate of ICU beds by Covid-19 patients. 1 September. Mandatory Green Pass required for travel on high-speed and Intercity trains; for interregional transport by ship (with the exception of routes in the Strait of Messina); for all domestic and international flights. In addition, the requirement applies to the entire staff of schools and universities, and undergraduate students. Such rules remain in effect until 31 December 2021. 9 September. The Green Pass requirement is extended to everyone who enters schools and universities, including external staff, and parents. In addition, as of 9 October, the requirement will also apply to staff in residential, social assistance and health care facilities. 16 September. Approval of Decree Law No. 127/2021, providing for mandatory Green Passes for all workers, public and private ones, to access the workplace. Workers who cannot access the workplace because they do not have the Certification shall be considered absent without leave; workers caught on the job without the Certification risk a fine. In no event an employee without a Green Pass shall be dismissed. Moreover, the decree provides for capped prices for rapid antigenic swabs administered by pharmacies and free swabs for those exempt from vaccination. |
| | |
| | 1: Abruzzo; 2 Basilicata; 3: Calabria; 4 Campania; 5: Emilia-Romagna; 6: Friuli-Venezia-Giulia; 7: Lazio; 8: Liguria; 9: Lombardy, 10: Marche; 11: Molise; 12: Autonomous Province of Bolzano; 13: Autonomous Province of Trento; 14: Piemonte; 15: Apulia, 16: Sardinia; 17: Sicily; 18: Tuscany; 19: Umbria; 20: Valle d'Aosta; 21: Veneto. |

3 Decree Law No. 52/2021.
4 Decree Law No. 73/2021.
5 Decree Law No. 99/2021.
| 14 | MINISTRY OF ECONOMY AND FINANCE |
I. RECENT TRENDS IN THE ECONOMY AND THE PUBLIC FINANCES | |
| | (1): Regions may establish areas within their territory in which to apply more restrictive measures than those provided for by their color of severity. Currently the municipality of Francofonte (SR), in Sicily, is an orange zone. |
| | Measures in force in white area: | Only industry protocols and general anti-contagion measures shall apply, i.e., face masks, interpersonal distancing requirements, and Green Pass requirement, where applicable. Mandatory mask in closed places, outdoor only in case of gatherings. Restrictions and attendance quotas shall be required for events involving gatherings. Dance halls and nightclubs closed. School classes take place entirely in person, distance learning (DaD) only provided for students in isolation or quarantine. |
| | Measures in force in yellow areas: | Besides the measures provided for the white zone, outdoor it is also mandatory to wear masks. In restaurants, there is a limit of four people, not living together, allowed to seat at the same table. As of 21 June, the curfew has been lifted. |
| | Measures in force in orange areas: | Moving from the City of residence is prohibited, subject to exceptions or cases of necessity. Distance learning expected for high schools, as long as at least 70 percent of school activities is guaranteed to be carried out in presence. Curfew from 10 p.m. to 5 a.m. Bars and restaurants closed, except for takeaway, cinemas, museums and theaters closed. |
| | Measures in force in red areas: | Traveling is completely prohibited, even within the municipality, subject to exceptions or cases of necessity. Closure of sports centers; closure of stores, except grocery ones, pharmacies, newsstands, tobacco shops, laundries, hairdressers. Distance learning expected in high schools, to an extent between 25 and 50 percent; guaranteed in-presence attendance for lower grade schools. |
| | Source: MEF analysis. |
| MINISTRY OF ECONOMY AND FINANCE | 15 |
| | UPDATE OF THE ECONOMIC AND FINANCIAL DOCUMENT 2021 |
| 16 | MINISTRY OF ECONOMY AND FINANCE |
II. BASELINE MACROECONOMIC AND BUDGET FORECAST
II.1 MACROECONOMIC SCENARIO UNDER EXISTING LEGISLATION
The forward-looking picture remains influenced primarily by the expected pandemic developments, the growth momentum coming from the National Recovery and Resilience Plan (NRRP), and expansionary monetary and fiscal policies at a global level.
Compared to the SP, the exogenous variables in the forecast warrant a significant upward revision to the GDP growth forecast for 2021 and a slight fine-tuning for 2022 and 2023. In detail, the expected growth in world trade and imports of Italy's main trading partners is revised upwards for 2021 and, to a lesser extent, for 2022 and 2023. Euro exchange rate is more competitive than the level used for the SP forecast, especially against the dollar, and further support comes from short-term rates and expected yields on government bonds, which are lower compared with the SP hypothesis. On the other hand, a restraining factor is represented by the expected price of oil (derived from futures quotes), which is higher compared to April forecast.
From the point of view of the impetus provided by the NRRP, the final version of the Plan outlined with the European Commission involves a shift of expenditure flows from the first three years of the Plan to the second ones. However, the year most affected by the downward revision is 2021, for which the projected GDP growth is widely obtained. The momentum coming from the NRRP-activated spending is slightly lower in 2022 and 2023, while it is significantly higher in 2024. This has been taken into account when reshaping the forecast of investment expenditure. The impact of the reforms provided for by the NRRP is indirectly embedded into the forecast, that is, through the potential growth rate towards which the GDP trend tends to converge in the medium term. This is also given the fact that the related impacts will take place over a longer time frame than 2022-2024.
As noted above, the real GDP growth estimate for 2021 rises from 4.5 percent to 6.0 percent. On the other hand, 2022 growth is revised downward from 4.8 percent to 4.2, primarily due to the higher starting point. Overall, according to the new forecast, the 2021-2022 two-year period will record a more marked recovery in output than that forecast in the SP, with a level of real GDP that already in 2022 would be slightly higher than in 2019. For the following two years, considering the combined effect of the revision of the exogenous factors and the assumptions regarding the NRRP, SP forecasts are substantially confirmed, with a growth which, although slowing with respect to 2021-2022, would be well above the pre-crisis trend.
The expected GDP trend reflects, first of all, a recovery in consumption initially greater than the expansion of income, given the assumption of a fall in the rate of
| MINISTRY OF ECONOMY AND FINANCE | 17 |
| | UPDATE OF THE ECONOMIC AND FINANCIAL DOCUMENT 2021 |
household savings compared with the pandemic peak - fall that is also supported by the wealth effect produced by the rise in share and bond prices. However, the hallmark of the recovery expected for the 2022-2024 year is the strong increase in gross fixed investments fueled by the NRRP. Public investments are expected to rise from 2.3 percent of GDP in 2019 to 3.4 percent in 2024. In terms of foreign trade, exports will grow at a slightly higher rate than world trade and imports from Italy's trading partners, also supported by expected gains in competitiveness vis-à-vis EU partners, due to a more moderate trend in prices and wages. A cautious growth projection roughly in line with that of world trade was adopted for the 2023-2024 biennium.
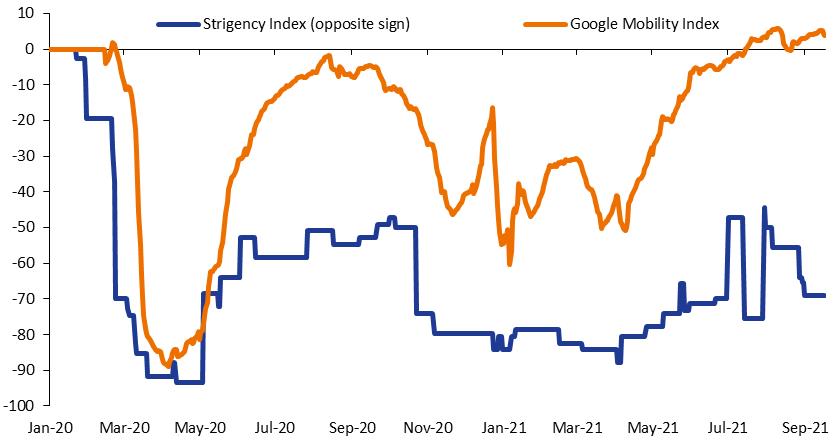
| FIGURE II.1: RESTRICTION AND MOBILITY INDEXES |
|
| Source: Oxford University and Google. |
| | Wholesale prices of natural gas and electricity in Italy and ETS price Natural Gas. Over the period leading up to the pandemic, the price of natural gas in European markets was experiencing a bearish phase due to weak demand and abundance of supply. In the period between September 2018 and December 2019, the price forming on the Italian hub (PSV) decreased by 50 percent (Figure R1). In this respect, in the early 2020s, restrictive measures taken to counter the spread of Covid-19 and relatively mild temperatures caused the European demand for natural gas to plummet. Together with a high availability of liquefied gas (LNG), this has dragged prices to their lowest level in the last decade; the PSV in June 2020 reached a level of 6.1€/MWh (-58.7 percent compared to December 2019). Afterwards, thanks to the gradual easing of restrictive measures and the recovery of economic activity, the European natural gas demand in the last quarter of 2020 returned to values slightly higher than those observed in the same period of 2019. At the same time, the availability of natural gas for Europe has gradually decreased due to both a reduction in supplies from Norway, as a result of infrastructure upgrading works, and an increase in prices charged at Asian hubs, to which part of the international LNG supply has been directed, compared with European ones (price premium). As a result, in the second half of 2020, the wholesale price of natural gas charged on European markets increased significantly; in December, PVS reached €16.6/MWh. |
| 18 | MINISTRY OF ECONOMY AND FINANCE |
II. BASELINE MACROECONOMIC AND BUDGET FORECAST | |
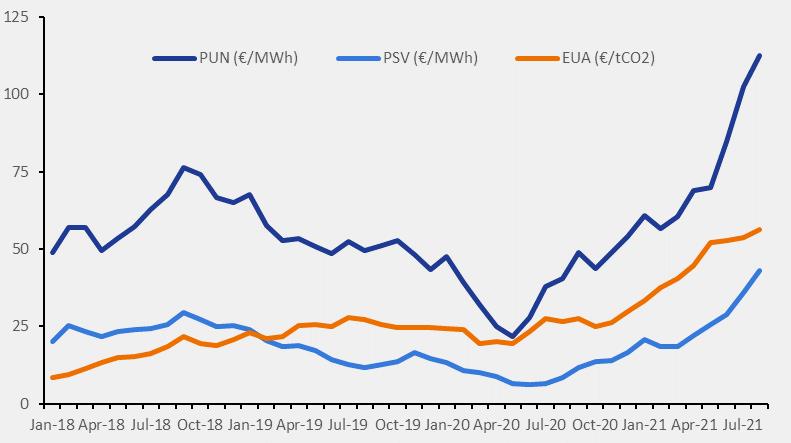
| | Since April 2021, the bullish trend has resumed. In the first six months of the year, as per the latest data available, natural gas consumption in the 27 EU countries has been higher than that observed in the same period of 2020 and 2019 (+10.4 percent and +4.4 percent, respectively) due to the recovery of production activities, the greater use of gas for electricity production compared to last year and weather conditions, which have pushed consumption for heating. As for Italy, data are available for the first seven months of 2021 (Natural Gas. Report - MISE, Ministry of Economic Development), specifically compared to the same period of 2020, show a robust increase in consumption (+8.8 percent); however, these are slightly lower than the level recorded in 2019 (-2.3 percent). On the supply side, there has been a reduction in natural gas supply from Norway and Russia; moreover, the demand for natural gas from Asia has continued to rise, putting upward pressure on international prices. The PSV price reached €43/MWh in August (+€26.4/MWh compared to January 2021, equal to an increase of 307.7 percent). The International Energy Agency estimates global natural gas demand to grow both in 2021 (+3.7 percent y/y), at similar levels to those observed in 2019, and in the two following years (+1.3 percent y/y in 2022 and +1.9 percent y/y in 2023)6. Futures7 contracts on the price of natural gas indicate a further acceleration in the last quarter of 2021, rising above €60/MWh, before falling sharply from the second quarter of 2022, however remaining at levels higher than those observed in the last three years; in 2023, futures prices are at levels similar to those of 2018, before falling further for the 2024-2026 years. Electricity. According to Terna data, Italy's electricity demand in 2020 has registered a 5.8 percent decrease from the previous year. In the first five months of 2020, the wholesale price of electricity in Italy (PUN) fell by 49.7 percent to 21.8€/MWh. However, since June 2020 the trend has reversed and a marked upward dynamic began, which in December pushed the price to 54€/MWh. During 2021, with the exception of February, the bullish phase has proceeded and in the first weeks of September the PUN reached an all-time peak of €143.2/MWh (+€82.5/MWh compared to January 2021, equal to an increase of 135.9 percent). This trend is attributable to the recovery in Italian electricity consumption (up 7.3 percent in the first seven months of the year) and, above all, to generation costs driven up by the rising prices of wholesale natural gas and emission permits8, although the latter had a more limited impact. Emission permits. On average, in 2020, the price of emission permits from stationary plants on the primary market (ETS) was equal to approximately €24.4, in line with what observed in 2019. The price of ETS permits declined in the first part of the year, and then set out on a growth path that led it to exceed €30 in December 2020, the highest value recorded until that moment. The bullish phase has moved forward this year; in the first two weeks of September the price for fixed plants reached a new peak of €61.65. |
6 Gas Market Report Q3-2021.
7 This refers to the average of quarterly futures prices of the TTF (Title Transfer Facility - the main European gas hub located in the Netherlands) over the last ten business days ending 21 September 2021.
8 The European Emissions Trading System (ETS) is the pivotal tool adopted by the European Union to achieve its greenhouse gas emission reduction targets. Businesses falling within the scope of the ETS that belong to the most energy-intensive sectors, which include electricity producers, must purchase a number of permits equal to the greenhouse gas emissions generated in the production process. The price paid for the purchase of permits allows CO2 emissions to be internalized in production costs; in the case of electricity generation this price may be transferred to the wholesale price, making production generated by fossil fuels more expensive.
| MINISTRY OF ECONOMY AND FINANCE | 19 |
| | UPDATE OF THE ECONOMIC AND FINANCIAL DOCUMENT 2021 |
| | FIGURE R1: AVERAGE MONTHLY WHOLESALE NATURAL GAS (PSV) AND ELECTRICITY (PUN) PRICES; AVERAGE MONTHLY EMISSION PERMIT PRICES WEIGHTED FOR ITALIAN VOLUMES (JANUARY 2018-AUGUST 2021) |
| | |
| | Source: Thomson Reuters, GME and EEX. |
| | The large price increase is attributable to a combination of regulatory and market factors. Regarding the former, mention should be made to the 2018 ETS reform, in particular the changes to the operation of the Market Stability Reserve as of 1 January 2019, which reduced the surplus of available permits, and the greater ambition of European Union's climate policies following the adoption, in March 2020, of the European Climate Act. The latter raised the target for reducing greenhouse gas emissions by 2030 from -40 percent to -55 percent compared to 2005, thus changing the expectations of ETS operators. As far as market factors are concerned, the increase in demand for electricity in Europe in the first few months of 2021 has been met largely by making use of fossil sources and among these, given the increase in the price of natural gas, to coal and lignite, with a consequent increase in demand for emission permits. By selling emission permits on the primary market through auctions, EU member states earn revenues that can be used for measures to reduce emissions. Italy collected ETS revenues of nearly € 1.3 billion in 2020, while revenues in the first eight months of 2021 have already exceeded € 1.6 billion. The increase in the wholesale price of electricity would have resulted in a marked increase in electricity bills in the third quarter of 20219. With Law No. 106/202110 the Government adopted urgent measures with which it allocated €1.2 billion to temporarily reduce electricity bills, also through interventions on general system charges, including those in support of renewable energy and energy efficiency that weigh on specific price-related components. Auction proceeds of emissions permits, amounting to €649 million, will also contribute to |
9 See https://www.arera.it/it/schedetecniche/21/210701agg.htm
10 Article 5-bis of Decree Law No. 73 of 25 May 2021, converted with amendments by Law No. 106 of 23 July 2021. For the second quarter of 2021, the Government had taken action with Decree Law No. 41/2021, with which it reduced electricity bills for small businesses (non-domestic low-voltage users, such as small businesses, artisans, bars, restaurants, workshops, professionals and services) by € 600 million. This measure was extended by a further month (July) with an allocation of € 200 million by art. 5 of Decree Law No. 73/2021 converted with amendments by Law No. 106 of 23 July 2021.
| 20 | MINISTRY OF ECONOMY AND FINANCE |
II. BASELINE MACROECONOMIC AND BUDGET FORECAST | |
| | cover these provisions. As a result of this action, the increase in the cost of electricity for a typical household in the third quarter of 2021 has been limited to 9.9 percent compared to the previous quarter11, against a potential increase estimated at about 20 percent12. |
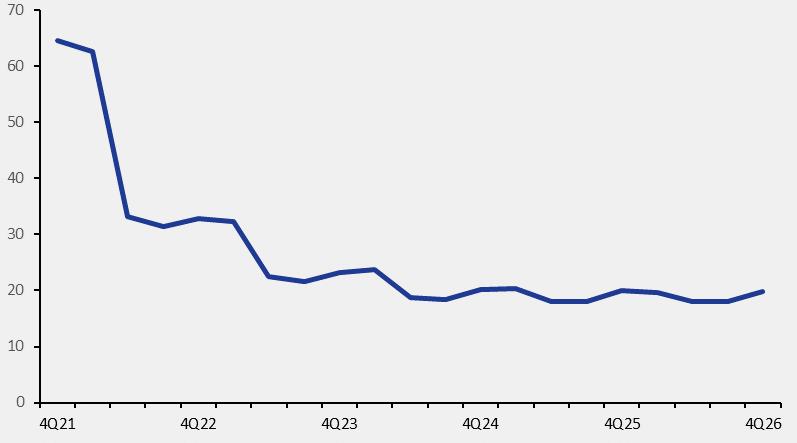
| | FIGURE R2: GAS PRICE - DUTCH TITLE TRANSFER FACILITY (TTF) FUTURES CONTRACTS |
| | |
| | Source: ITA (Italian Trade Agency), MEF analysis. |
| | In order to prevent the persistence of upward trend in the wholesale prices of natural gas and electricity from impacting entirely the final prices, through Decree Law No. 130/2021 of 27 September13 the Government provided for additional temporary measures to contain increases in energy bills for households and businesses. These interventions apply to the fourth quarter of 2021 both on electricity bills - by eliminating the rates relating to general system charges for approximately 29 million households and 6 million small and very small enterprises - and gas bills, by reducing VAT rate to 5 percent for all users (instead of current 10 percent or 22 percent in relation to consumption) and eliminating the rates related to general system charges. Moreover, for the fourth quarter of 2021, additional resources shall be allocated in favor of recipients of social bonuses; specifically, a trend cancellation of any increase in bills for 3 million households benefiting from the electricity bonus, and 2.5 million ones benefiting from the gas bonus is expected. The overall cost of the measures is quantified at €3.5 billion and is partly financed by the auction proceeds of CO2 emission permits. In conclusion, the sharp increase in natural gas and electricity prices appears to be due to a number of temporary factors. Natural gas futures markets are expected to experience a sharp decline in prices over the next few years. The oil price, so far less affected by sudden rises, is also expected to fall in the coming months. In addition, the impact on the cost of living has been softened by a reduction in fixed charges on electricity and gas bills. However, global energy demand is growing, and on the supply side, environmental and geopolitical factors could exert further adverse effects. Therefore, the possibility of a supply shortage and/or |
11 According to the definition provided by ARERA, the typical household has an average consumption of electricity of 2,700 kWh per year and a committed power of 3 kW, while for gas consumption is equal to 1,400 cubic meters per year.
12 See http://documenti.camera.it/leg18/dossier/pdf/D21073a.pdf
13 For the technical report see https://www.senato.it/service/PDF/PDFServer/DF/363999.pdf
| MINISTRY OF ECONOMY AND FINANCE | 21 |
| | UPDATE OF THE ECONOMIC AND FINANCIAL DOCUMENT 2021 |
| | persistence of rising prices is a significant risk factor for the forecast of growth and inflation. |
In 2021, employment is projected to grow slightly more than GDP in terms of Full-Time Equivalent (FTEs) and hours worked, while for subsequent years the forecast expects a moderate productivity growth. The number of employed people, according to the labor force survey, would rise above pre-crisis levels as early as 2022, and then witness a real expansion in the following two years.
With regard to inflation, the forecast for the current year has been revised upwards in view of the stronger-than-expected increases registered in consumer prices. The following years are expected to register an average increase in the consumption deflator in 2022 slightly higher than in 2021, due to the carryover effect of the current energy price increases and, afterwards, a moderation phase. However, the underlying inflation trend would be more sustained than in past years, due to both global factors and the dynamism of aggregate demand. Wage growth can also be expected to respond gradually, in the medium term, to the decline in the unemployment rate and the moderate rise in the cost of living.
The risks to the GDP growth forecast appear balanced. On the one hand, the expected economic recovery could be interrupted by a new escalation of the pandemic, and the forecast for the Italian economy is based on the full implementation of the NRRP - without which the GDP growth rate would be considerably lower. On the other hand, the high level of liquidity collected by households and businesses, as well as the expansive monetary and financial conditions and the momentum to growth provided by the Next Generation EU (NGEU) not only in Italy but throughout the EU, could lead to higher-than-expected GDP growth.
With regard to the inflation forecast, the sharp increases in natural gas and energy prices could be reversed more quickly than expected, but overall, the upward risks for the 2021-2024 forecast appear more significant, as the seemingly temporary factors that have driven up energy prices and the bottlenecks or interruptions in international value chains could prove to be more persistent than assumed. Insofar as this would also have an impact on the GDP deflator, it would result in greater output dynamics in nominal terms, with favorable consequences for the development of public finances and the public debt/GDP ratio. However, a higher-than-expected rise in inflation, not only in Italy but also in the Euro area, could lead to a greater rise in market rates than assumed in the trend forecast and a macroeconomic correction of the financial markets.
This Chapter presents the usual analysis of alternative scenarios to the baseline forecast, including a scenario of Covid-19 infection escalation caused by new variants of the virus, resulting in a slowdown of the recovery currently underway.
The macroeconomic overview was validated by the Parliamentary Budget Office on 24 September at the end of the usual discussions with the Treasury Department.
| 22 | MINISTRY OF ECONOMY AND FINANCE |
II. BASELINE MACROECONOMIC AND BUDGET FORECAST | |
| TABLE II.1: MACROECONOMIC FRAMEWORK UNDER UNCHANGED LEGISLATION (percentage changes, unless otherwise indicated) |
| | 2020 | 2021 | 2022 | 2023 | 2024 |
| INTERNATIONAL EXOGENOUS VARIABLES | | | | | |
| World trade | -8.8 | 10.4 | 8.6 | 5.2 | 4.2 |
| Oil price (Brent, USD/barrel, futures) | 41.7 | 67.9 | 66.0 | 62.9 | 60.7 |
| USD/EUR exchange rate | 1.142 | 1.195 | 1.175 | 1.175 | 1.175 |
| ITALY MACRO DATA (VOLUMES) | | | | | |
| GDP | -8.9 | 6.0 | 4.2 | 2.6 | 1.9 |
| Imports of goods and services | -12.9 | 11.6 | 6.6 | 4.4 | 3.6 |
| Domestic final consumption | -7.8 | 3.9 | 3.7 | 1.9 | 1.5 |
| Private consumption | -10.7 | 5.2 | 4.8 | 2.4 | 2.0 |
| Government consumption expenditure | 1.9 | 0.7 | 0.4 | 0.3 | 0.1 |
| Gross fixed capital formation | -9.2 | 15.5 | 5.8 | 4.3 | 4.0 |
| — machinery, equipment, and intangible assets | -8.7 | 10.0 | 5.4 | 4.3 | 3.9 |
| — transportation means | -27.2 | 18.8 | 9.3 | 6.8 | 4.1 |
— construction | -6.7 | 20.9 | 5.8 | 4.1 | 4.0 |
| Exports | -14.0 | 11.4 | 6.0 | 4.1 | 3.1 |
| | | | | | |
| Memo: current account balance % GDP | 3.5 | 3.6 | 3.2 | 2.9 | 2.8 |
| CONTRIBUTIONS TO GDP GROWTH (1) | | | | | |
| Net exports | -0.7 | 0.2 | -0.1 | 0.0 | -0.1 |
| Inventories | -0.4 | -0.1 | 0.2 | 0.2 | 0.0 |
| Domestic demand net of inventories | -7.8 | 5.9 | 4.0 | 2.4 | 2.0 |
| PRICES | | | | | |
| Imports of goods and services deflator | -4.1 | 7.1 | 2.6 | 1.2 | 1.2 |
| Exports of goods and services deflator | -0.5 | 3.2 | 2.1 | 1.2 | 1.2 |
| GDP deflator | 1.2 | 1.5 | 1.6 | 1.4 | 1.5 |
| Nominal GDP | -7.9 | 7.6 | 5.8 | 4.1 | 3.4 |
| Private consumption deflator | -0.3 | 1.5 | 1.6 | 1.3 | 1.5 |
| | | | | | |
| LABOUR | | | | | |
| Compensation of employees per FTE | 2.8 | 1.3 | 1.1 | 1.3 | 1.5 |
| Labour productivity (measured on GDP) | 1.5 | -0.5 | 0.2 | 0.3 | 0.3 |
| Unit labour cost (measured on GDP) | 1.3 | 1.8 | 0.9 | 1.0 | 1.2 |
| Employment (FTEs) | -10.3 | 6.5 | 4.0 | 2.3 | 1.6 |
| Unemployment rate (%) | 9.3 | 9.6 | 9.2 | 8.6 | 7.9 |
| Employment rate (15-64 years) | 57.5 | 58.1 | 60.1 | 62.0 | 63.3 |
| Memo: Nominal GDP (absolute values in EUR millions) | 1,653,577 | 1,779,295 | 1,883,354 | 1,959,662 | 2,025,473 |
| (1) Any inaccuracies are due to rounding. |
| Note: The international exogenous assumptions are based on the information available on 31 August 2021. |
| GDP and components in volume (chain linked values reference year 2015), not seasonally adjusted data. |
| MINISTRY OF ECONOMY AND FINANCE | 23 |
| | UPDATE OF THE ECONOMIC AND FINANCIAL DOCUMENT 2021 |
| FOCUS | 2021 and 2022 forecasts review 14 In line with the previous documents, this box analyses the main factors underlying the macroeconomic forecast review for 2021-2022 compared to those adopted in the SP 2021. First, this Update of the SP includes new information on the current year's economic activity, referring to quarterly national accounts figures – available for the first and second quarter of the year and the new international perspectives. The values reported in the Table R1 refer to seasonally and working day-adjusted data, The main factors considered for the 2021-2022 macroeconomic forecast review are shown in Table R1. |
| | TABLE R1: SYNTHETIC MACROECONOMIC FRAMEWORK (seasonally adjusted data) |
| | | | of which: revision carry-over effect in 2021 | of which: acquired growth in the first half of 2021 | of which: exogenous impact compared to SP | of which: revision of the outlook for the second half of the year | Forecast 2022 | of which: revision carry-over effect in 2022 | of which: exogenous impact compared to SP | of which: revision of the outlook |
| | | Update | SP 2021 | Delta 2021 | Delta (1) | Delta (2) | Delta (3) | Delta (4) | Update | SP 2021 | Delta 2022 | Delta (1) | Delta (2) | Delta (3) |
| | ITALY MACRO DATA (VOLUMES) | | | | | | | | | | | | | |
| | GDP | 6,0 | 4,5 | 1,5 | 0,16 | 2,3 | 0,4 | -1,3 | 4,3 | 4,9 | -0,6 | -1,2 | -0,1 | 0,7 |
| | Private consumption expenditure | 5,2 | 4,1 | 1,1 | -0,1 | 1,8 | 0 | -0,7 | 4,8 | 5,2 | -0,4 | -0,6 | -0,3 | 0,5 |
| | Government consumption expenditure | 0,7 | 2,6 | -2 | 0 | -1,8 | 0 | -0,2 | 0,4 | 0,2 | 0,2 | -0,5 | -0,1 | 0,8 |
| | Gross fixed capital formation | 15,5 | 8,7 | 6,8 | 0,3 | 7,7 | 0,7 | -1,9 | 5,8 | 9 | -3,2 | -1,4 | -0,1 | -1,7 |
| | - machinery, equipment, and intangible assets | 10 | 6,4 | 3,6 | 0,4 | 4,8 | 0,9 | -2,4 | 5,4 | 9 | -3,7 | -1,9 | -0,1 | -1,6 |
| | - construction | 20,9 | 8,9 | 12 | 1,2 | 12,7 | 0,5 | -2,3 | 5,8 | 8,5 | -2,7 | -1,1 | -0,1 | -1,5 |
| | | | | | | | | | | | | | | |
| | Exports of goods and services | 11,4 | 8,2 | 3,2 | 0,5 | 4,2 | 1,5 | -3 | 6,1 | 5,7 | 0,3 | -0,9 | 0,7 | 0,5 |
| | Imports of goods and services | 11,6 | 9,4 | 2,2 | 0,4 | 3,4 | 0,8 | -2,5 | 6,5 | 6,6 | -0,1 | -1,6 | 0,6 | 0,9 |
| | | | | | | | | | | | | | | |
| | PRICES | | | | | | | | | | | | | |
| | GDP deflator | 1,5 | 1,1 | 0,4 | 0 | 0,4 | 0 | 0 | 1,6 | 1,3 | 0,3 | 0,2 | 0,2 | 0 |
| | Private Consumption deflator | 1,5 | 1 | 0,5 | 0 | 0 | 0,2 | 0,2 | 1,6 | 1,3 | 0,3 | 0,5 | 0,5 | -0,7 |
| | The first two columns report the estimated GDP and GDP components (Update of the SP vs. SP) growth. The differential between the two figures (Delta 2021) is reported in the third column. Overall, the review shows a higher GDP growth forecast, equal to 1.5 percentage points compared to the SP. The review included the following factors: i) update of the carry-over effect on 2021, higher than the one reported in the SP (delta a); ii) better-than-expected results of national accounts data in the first half of the year compared to the estimates reported in SP |
14 This box refers to the quarterly (working-day adjusted) economic accounts data released by ISTAT on 31 August. The quarterly series consistent with the annual national accounts data released on 22 September will be published on 5 October. Changes in the demand components could have an impact on the 2021 drag-on effects.
| 24 | MINISTRY OF ECONOMY AND FINANCE |
II. BASELINE MACROECONOMIC AND BUDGET FORECAST | |
| | 2021 (delta b); iii) the positive impact of exogenous variables (delta c); iv) review of the estimates for the second half of 2021 (delta d). Unlike in April's forecasts, a slight increase in GDP was recorded in the first quarter of the current year; this positive trend increased considerably in the second quarter. Given the smaller gap between the GDP of the second quarter and that of the pre-crisis period, the growth profile in the second half of the year was revised downward with respect to the SP. The GDP and consumption deflators growth was, instead, revised upward considering the ISTAT data related to the first half of the year and the latest prices indicators. The difference between the current forecast and the one projected last April for 2022 is reported in the following columns. Here, the delta (delta 2022 column) related to the GDP forecast is -0.6 percentage points. The downward revision of the GDP growth forecast considers a lower carry-over effect from 2021 due to the recovery already in place in the first half of 2021 and the slightly negative impact of the update of the exogenous variable compared to SP. However, the progress in tackling the pandemic and the outcomes of the vaccination campaign make us assume that the GDP pre-crisis levels might be restored in the first half of 2022. Therefore, the overall 2022 quarterly profile was revised upward compared to the SP forecasts. The new assumptions on the international framework have a positive impact on GDP growth in the current year, while they record a slightly negative average impact over the next three-year period (Table R2). The speeding up of global trade is more pronounced15 and the 2021 forecasts related to the external demand (weighted according to the geographical asset of Italian export) were revised upward, while a higher deceleration is expected in 2024. Therefore, the impact of the global demand on Italian exports, and GDP, shows a positive trend up to 2023 and a negative one in 2024. The nominal effective exchange rate also positively impacts the export growth forecast due to the euro depreciation. A technical assumption was adopted for the projections of currencies implying that the exchange rate remains unchanged and is equal to the average of the last ten working days ending on 31 August. The update of the nominal effective exchange rate compared to April considers the euro depreciation against other currencies, 0.1 percent in 2021 and 0.3 percent in 2022. However, the macroeconomic impact is negligible for both years. The oil price, having a higher stock price than SP, negatively impacts consumer prices and internal demand. The current forecast, based on futures contracts, envisages higher oil prices over the forecast horizon16. Lastly, no significant changes are recorded on the yields of government securities. There is a slightly positive impact in 2024, ascribable to the continuation of favourable conditions for loans to the private sector. |
| | TABLE R2: EFFECT OF GDP FORECASTS OF THE EXOGENOUS VARIABLES COMPARED TO THE SP 2021 SCENARIO (impact on growth rates) |
| | | 2021 | 2022 | 2023 | 2024 |
| | 1. World Trade | 0.4 | 0.2 | 0.0 | -0.1 |
| | 2. Nominal effective exchange rate | 0.0 | 0.0 | 0.0 | 0.0 |
| | 3. Oil Price | 0.0 | -0.3 | -0.2 | 0.0 |
| | 4. Interest rate assumptions | 0.0 | 0.0 | 0.0 | 0.1 |
| | Total (1) | 0.4 | -0.1 | -0.1 | 0.0 |
| | (1) Any inaccuracies are due to rounding. |
| | Source: MEF computations |
15 Please note that projections of global GDP and international trade trends are from Oxford Economics.
16 Reference is made to the average of futures quotations over the last ten working days ending 31 August 2021.
| MINISTRY OF ECONOMY AND FINANCE | 25 |
| | UPDATE OF THE ECONOMIC AND FINANCIAL DOCUMENT 2021 |
| | The growth forecasts of this document were validated by the Parliamentary Budget Office (PBO). After the issue of the ISTAT flash GDP estimate of the second quarter, in August, the PBO published a GDP growth forecast equal to 5.8 percent in 2021 and 4.2 percent in 2022. Compared to the latest forecasts of the European Commission (EC) (Summer Forecast), the GDP growth for 2021 is higher (6.0 percent vs. 5.0 percent), while in 2022 the GDP growth is equal, in both instances, to 4.2 percent. The official forecast in 2021 are more optimistic as they include (as shown in Box R1) the better-than-expected results of the first second quarter. The acquired GDP growth in the first half of the year is equal to 4.7 percent. The latest forecasts issued by international institutions, including data from the second quarter, are in line with this document (Table R3). No misalignments between the growth estimated by this Update and that estimated by the EC or other forecasters emerge for 2022. |
| | TABLE R3: GROWTH PROJECTIONS FOR ITALY |
| | Real GDP (y/y % change) | Forecast date | 2021 | 2022 |
| | Update of the SP 2021 | Sep-21 | 6.0 | 4.2 |
| | OECD (1) | Sep-21 | 5.9 | 4.1 |
| | PBO | Aug-21 | 5.8 | 4.2 |
| | IMF (WEO) | Jul-21 | 4.9 | 4.2 |
| | European Commission | Jul-21 | 5.0 | 4.2 |
| | (1) OECD data adjusted for working days. |
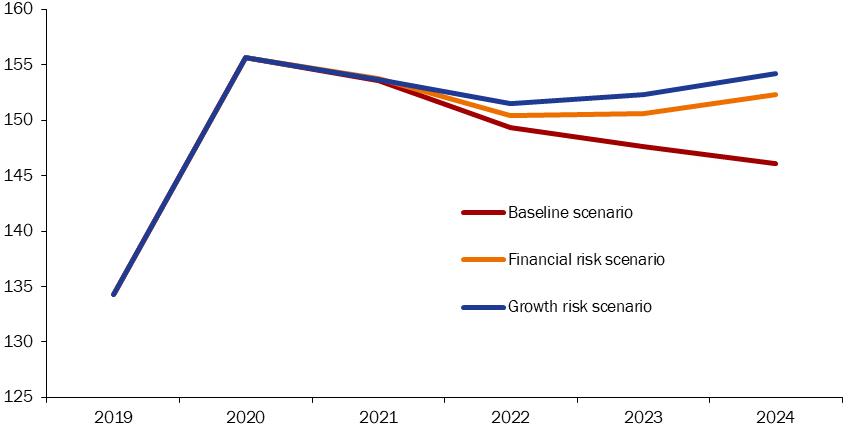
| | FOCUS | A risk (or sensitivity) analysis on exogenous variables The uncertainty related to the containment of the pandemic and the development of the international economy decreased compared to last year. However, some risk elements remain which are worth attention. For this reason, some less favourable assumptions were considered against those included in the macroeconomic trend, and their impact on the GDP trend was evaluated. The alternative assumptions involve both the pandemic development and the exogenous variables of the international reference framework (world trade, exchange rates, oil price, conditions of the financial markets). Five scenarios were simulated and analysed through the ITEM econometric model, each envisaging a specific risk factor against the general trend. The first scenario envisages an assumption in which vaccines are weaker in tackling the new Covid-19 variants. This would push the authorities to restore restrictions and limitations that would affect part of the businesses over the last quarter of the current year, possibly extending up to the first half of 2022. Said restrictions, however, would be less pervasive than in the past, given the high vaccination rate among the population and the requirement of Green Pass to access several businesses, which help reduce the virus spread. Although recording lower growth in 2021 and 2022, this scenario would not permanently negatively affect the product levels. A second, less favourable, scenario involves the world trade dynamics. Over the fourth quarter of 2021 and the first two quarters of 2022, in case of increased contagion and reduced effectiveness of the vaccines against the new COVID variants – which would lead to further restrictions -, these dynamics would be less sustained compared to the general forecasts. More specifically, in 2021, it is assumed that the rebound of the world demand (in terms of trade with Italy) would be slightly lower than the general forecasts (with a growth rate equal to 10.5 percent vs. 10.8 percent); similarly, in 2022, the world demand would show a less intense increase equal to 4.3 percent vs. 5.7 percent of the general forecasts. However, starting from the third quarter of 2022, the trade evolution would recover sustainably, with levels matching the general trend at the beginning of 2023. |
| 26 | MINISTRY OF ECONOMY AND FINANCE |
II. BASELINE MACROECONOMIC AND BUDGET FORECAST | |
| | As for the exchange rates, the technical assumption behind the general forecast is that the exchange rates in the forecast horizon remain unchanged at the average levels of the latest daily quotations (more specifically, at the beginning of September 2021, the estimate considered the quotations of the last ten working days). In the alternative scenario, the bilateral exchange rates are equal to the forward exchange rates by considering the quotations recorded over the ten working days preceding September. Through the information on forward exchange rates, in 2021, the appreciation of the euro vs. the US dollar is slightly higher than that of the general forecast (4.6 percent vs. 4.4 percent), while a lower depreciation is recorded in the following year (-0.6 percent vs. -1.4 percent). The appreciation of the euro against the other currencies is higher compared to the forecast. More specifically, the change in the nominal effective exchange rate is 1.1 percent in 2021 vs. 1.0 percent of the general trend scenario and 0.6 percent in 2022 due to a slight depreciation of the euro in the general trend (-0.4 percent). In 2023 and 2024, the appreciation of the European currency would be equal to 2.0 percent and 1.4 percent respectively, due to the invariance of the effective exchange rate in the general trend. This development of the exchange rate strongly depends on the expectations (implicit expectations related to the forward exchange rates) of a substantial depreciation of the currencies of Developing Countries such as Brazil, Turkey, Russia, and India. Another risk factor might involve oil quotations. For the general trend, the forecast of oil prices was based on the price information taken from future contracts on crude oil. This trend shows no price change in 2022 vs. 2021 (from 65.9 to 66.1 $/bbl.) and a decrease of quotations in the following years (approximately 63.0 and 60.7 $/bbl. in 2023 and 2024). The alternative and less favourable scenario assumes higher crude oil quotations than the general trend. More specifically, starting from 2022, the price of crude oil would be 20$/bbl. higher over the forecast horizon (86.1, 83, and 80.7$/bbl., in 2022, 2023, and 2024 respectively). The last scenario refers to risk elements connected to the financial conditions of the economy. More specifically, for years 2022-2024, the levels of the rate of return for 10-year BTP and BTP spread – Bund higher than 100 percentage points compared to those calculated in the general trend scenario. This assumption reflects the risk of less relaxed conditions in the financial markets and would push the banks to adopt more expensive loan requirements to families and businesses. Table R1 reports the forecast impact on the GDP trends. This allows performing a sensitivity analysis of the reference macroeconomic forecasts. The assumption of the partial efficacy of vaccines against other Covid-19 variants would lead to a less substantial product recovery in 2021 and 2022. The growth rate would be -0.5 percent vs. the general trend scenario. Also, in 2022, the growth would be –1.4 percent compared to the general trend (shifting from 4.2 percent of the baseline scenario to 1.8 percent). In 2023, the GDP would record an acceleration, with a growth rate exceeding 1.8 percent compared to the general trend scenario (equal to 2.6 percent). At the end of 2023, the volumes of the economic activity forecasted in the baseline scenario would be recovered. In 2024, the product growth rate would be equal to that of the reference scenario. |
| | TABLE R1: IMPACT OF RISK SCENARIOS ON GDP (impact on growth rates) |
| | | 2021 | 2022 | 2023 | 2024 |
| | 1a. Limited vaccine effectiveness on Covid-19 variants (new restrictive measures in Italy) | -0.5 | -1.4 | 1.8 | 0.0 |
| | 1b. Limited vaccine effectiveness on Covid-19 variants (World trade) | -0.1 | -0.4 | 0.3 | 0.2 |
| | 2. Appreciation of nominal effective exchange rate | 0.0 | -0.1 | -0.5 | -0.8 |
| | 3. Higher oil price increase | 0.0 | -0.5 | -0.4 | -0.2 |
| | 5. Worsening financial conditions | 0.0 | -0.1 | -0.5 | -0.7 |
| MINISTRY OF ECONOMY AND FINANCE | 27 |
| | UPDATE OF THE ECONOMIC AND FINANCIAL DOCUMENT 2021 |
| | | Assuming a less sustained dynamics of world trade between the end of 2021 and the first half of 2022 leads to a minimum impact of the 2021 GDP growth rate (with a reduction of – 0.1 percent compared to the estimated general trend) and a more relevant effect in 2022 (the growth rate would be - 0.4 percent compared to the general trend). Over the following years, the product change rates would be higher than those forecasted in the trend scenario. If evaluated together, the two scenarios envisaging difficulties in the virus containment would record lower product growth rates in 2021 and 2022 than the trend scenario (0.6 percent and 1.8 percent, respectively). In 2023, the GDP growth rate would be higher than the trend scenario (2.1 percent in 2023 and 0.2 percent in 2024). Assuming a euro appreciation higher than expected in the trend scenario, the GDP growth rate would record -0.1 percent in 2022, -0.5 percent in 2023, and -0.8 percent in 2024, compared to the general trend. In case of oil prices higher than those of the forecasted general trend, the GDP growth rate would record a decrease of 0.5 percent in 2022, 0.4 percent in 2023, and 0.2 percent in 2024. Lastly, in case of a deterioration of the financial conditions starting from 2022, against the forecasted ones, the economic growth would record a negative impact. More specifically, the product growth rate would be -0.1 percent compared to the reference scenario in 2022 and -0.4 percent and -0.7 percent in 2023 and 2024, respectively. |
II.2 BUDGETARY OUTLOOK UNDER EXISTING LEGISLATION
In the light of the latest figures on PA's revenues and expenditures, the revision of the macro framework, and the updated forward yields on government securities, the net borrowing projections were revised in an improvement perspective. The deficit forecasted in the current year is equal to 9.4 percent of the GDP, with a decreasing trend compared to 9.6 percent recorded in 2020 based on the ISTAT data published on 22 September. The new estimate for 2021 is significantly lower than the percentage of 11.8 percent forecasted in the SP. The deficit profile across the next three-year period is equally lower compared to the SP forecasts, as the net borrowing shifts from 5.9 percent to 4.4 percent of the GDP in 2022, from 4.3 percent to 2.4 percent in 2023, and up to 2.1 percent of the GDP in 2024 vs. 3.4 percent forecasted in the SP.
The primary balance will mark a further worsening of around €6 billion in 2021. Concerning the GDP, the amount will drop for one-tenth of a percentage point to -6.0 percent. From 2022, the primary balance will markedly improve by shifting from -1.5 percent of the GDP in 2022 to a 0.3 percent surplus in 2023 and a 0.4 percent surplus in 2024.
The debt interest expenditure will be subject to a nominal increase in 2021, followed by subsequent reductions. The 2021 increase is connected to the inflation trend resulting in higher interest expenditure for inflation-linked securities. However, the ratio of interest expenditure on GDP will record a slight reduction to 3.4 percent starting from the current year; said reduction will gradually drop to 2.5 percent of the GDP at the end of the forecast horizon.
| 28 | MINISTRY OF ECONOMY AND FINANCE |
II. BASELINE MACROECONOMIC AND BUDGET FORECAST | |
| FIGURE II.2: NET BORROWING AND PRIMARY BALANCE (% OF THE GDP) |
|
| Source: ISTAT. From 2021, trend forecasts. |
The trend shows little differences compared to the SP, reflecting higher 2021 BTP yields than April and a less steep curve of interest rates over the following years.
To analyse the details of the Account, the trend of tax revenue forecast, specifically indirect taxes, is positively affected by improvement in the macroeconomic contest of the current year and the following one. Overall, the tax pressure will decrease by around 0.9 percent in 2021 vs. 2020, reaching 41.9 percent of the GDP. In 2022, the trend will be stable, while an average decrease of 0.2 GDP point/year is expected over the following years.
As far as the public expenditure is concerned, the ratio of total primary expenditure to GDP will decrease over the forecast years. The expected shrinking will allow reaching a level equal to 46.0 percent at the end of the period.
The current primary expenditure as a ratio to GDP will follow a similar trend, reaching 41.3 percent of the GDP in 2024.
The dynamics clearly shows how the expansionary fiscal impulse resulting from the increase of public expenditure due to the Covid-19 crisis will mitigate in the short term, as a result of the expiration of the temporary measures issued in favour of the families and the businesses, and how the primary expenditure will converge towards – or become even lower than – the pre-crisis levels if we consider the current nature of this component.
As for the structural balance, the worsening forecasted in this year is subject to a sharp reduction compared to the SP (from -4.5 to -2.9 percent of GDP). The improvement expected for 2022 reduces from +3.8 to +2.1 percent of GDP but remains significant. The structural balance in the new forecast shows a net gain in 2023 (+1.0 percentage point as estimated in the SP) and in 2024 (+0.6 percentage point as calculated in the SP). It should be reminded that the actions to strengthen healthcare and support workers, families, and businesses implemented during the pandemic were deemed as "structural" actions by the European Commission. The
| MINISTRY OF ECONOMY AND FINANCE | 29 |
| | UPDATE OF THE ECONOMIC AND FINANCIAL DOCUMENT 2021 |
more these actions end, and the balance rebalances, the structural balance also improves without any tax increase or cut in the current ordinary expenditure.
As for the public debt, the updated projection of public finance implies a decrease in the debt-to GDP ratio, shifting from the peak of 155.6 percent recorded in 2020 to 153.5 percent this year. This is a very positive result compared to the SP forecast (159.8 percent), which reflects both the GDP dynamics and that of the cash borrowing requirement of the PAs. The debt-to-GDP ratio would decrease by ten percentage points over the next three-year period, reaching 143.3 percent of the GDP in 2024.
| 30 | MINISTRY OF ECONOMY AND FINANCE |
III. UPDATED POLICY SCENARIO
III.1 MACROECONOMIC FORECAST AND BUDGET OUTLOOK – POLICY SCENARIO
In the light of the reforming commitments undertaken by the Country with the NRRP, the Recommendations issued by the Council of the European Union this year focus on the budgetary policy. The first recommendation invites Italy to fully use the funds of the Recovery and Resilience Facility – RRF to finance additional investments to support recovery without replacing the existing public investment programmes and by limiting the increase in the current public expenditure.
The second recommendation invites our Country to adopt a "cautious" budgetary policy as soon as the economic situation will allow it. This recommendation is to ensure the full sustainability of public finance in the medium term. Moreover, the advice restates the need for increased investments to improve the economic growth potential.
Lastly, the third recommendation concerns the quality of public finance and economic policy measures. These elements aim to boost growth and improve environmental and social sustainability. Italy is called to strengthen the long-term sustainability of public finance by improving the coverage, adequacy, and sustainability of the social security and healthcare systems.
The Government confirms the general approach of the budgetary policy as shown in the SP, approved by the Parliament through the resolutions passed last 22 April. The funds allocated by the Decree Law Sostegni-bis at the end of May will provide adequate support to the people and productive sectors, which mostly suffered from prevention measures adopted in the current year. If necessary, further extraordinary measures to support the workers and businesses affected by the pandemic impacts will be promptly introduced.
Assuming a gradual decrease of the restrictions imposed on economic and social activities due to Covid-19, the budgetary policy will remain expansionary until the GDP and the employment rate have recovered from the fall and the lack of growth compared to the 2019 level. Presumably, these conditions will be fulfilled from 2024 on17. From 2024, the budgetary policy will reduce the structural deficit and restore the debt-to-GDP ratio to defined levels by 2030.
17 In line with the growth rates estimated in the 2020-2022 macroeconomic framework issued by the Update of the Stability Programme 2019 and assuming said rates extend up to 2024, gradually converging towards the potential growth rate forecasted at that time (0.6 percent), according to the forecast of this document the GDP will exceed the pre-crisis levels after 2023. This element will lead to identify year 2024 as a year of transition to a gradual budgetary consolidation.
| MINISTRY OF ECONOMY AND FINANCE | 31 |
| | UPDATE OF THE ECONOMIC AND FINANCIAL DOCUMENT 2021 |
| TABLE III.1: MACROECONOMIC IMPACT OF POLICY MEASURES COMPARED TO THE TREND SCENARIO (impact on GDP growth rates) |
| | 2022 | 2023 | 2024 |
| Expansionary policies on the expenditure side | 0.4 | 0.1 | 0.0 |
| Lower revenues and fiscal incentives | 0.1 | 0.1 | 0.0 |
| Total | 0.5 | 0.2 | 0.0 |
The consolidation strategy of public finance will primarily rely on the GDP growth boosted by the investments and reforms included in the NRRP. It will also be necessary to achieve adequate surpluses in the primary budget in the medium term. To this extent, the focus will be put on mitigating the current public expenditure dynamics and increasing tax returns by tackling tax evasion. The returns resulting from the revision of environmental taxes and environmentally harmful subsidies will be increasingly addressed to investments in research, innovation, and education.
In line with this approach, the manoeuvre to be defined in the Budget Law 2022-2024 and accompanying acts will significantly reduce the net borrowing (from 9.4 percent forecast for this year to 3.3 percent of the GDP in 2024). Compared to the SP, the 2022 deficit objective drops from 5.9 percent of the GDP to 5.6 percent. A decrease is also visible in the net borrowing levels of the two following years, compared to the SP forecasts.
The policy scenario for 2022-2024 allows addressing the needs of the so-called unchanged policies and renewing several economic and social measures, including those linked to the healthcare system, the SME Guarantee Fund, the energy efficiency incentives, and innovative investments. Moreover, this will enable the social safety net reform and the first stage of the fiscal reform. The universal child benefit will be implemented.
Compared to the trend scenario, in the policy scenario the net borrowing records an increase of more than one GDP percentage point starting from 2022. Subsequently, the impact on GDP can be assessed in almost 0.5 growth percentage points in addition to the trend scenario in 2022. The net borrowing differential between the two scenarios records further increase in 2023, with +1.5 percentage point of deficit, by generating an impact of almost 0.2 percent on the growth rate of the real GDP. In the final year, the deficit differential decreases to 1.2 percentage points, with a negative impact on the GDP, but offset by the delayed impulse inherited from the previous two years18.
As a result, the GDP growth in the policy scenario is equal to 4.7 percent in 2022, 2.8 percent in 2003, and 1.9 percent in 2024. The growth is also higher than the trend growth rate of employment during the three years, hence with a decreased employment rate. The price dynamics are slightly higher; the surplus in the current account is affected by a slight decrease.
18 It should also be noted that the forecast of the budget balances does not include any feedbacks from the higher level of nominal GDP in the policy scenario. Such feedbacks would improve the budget balance, reducing the need for hedging measures for the same nominal balance, which would have positive effects on real GDP growth.
| 32 | MINISTRY OF ECONOMY AND FINANCE |
III. UPDATED POLICY SCENARIO | |
| TABLE III.2: MACROECONOMIC FRAMEWORK UNDER POLICY SCENARIO (percentage changes, unless otherwise indicated) |
| | 2020 | 2021 | 2022 | 2023 | 2024 |
| INTERNATIONAL EXOGENOUS VARIABLES | | | | | |
| World trade | -8.8 | 10.4 | 8.6 | 5.2 | 4.2 |
| Oil price (Brent, USD/barrel, futures) | 41.7 | 67.9 | 66.0 | 62.9 | 60.7 |
| USD/EUR exchange rate | 1.142 | 1.195 | 1.175 | 1.175 | 1.175 |
| ITALY MACRO DATA (VOLUMES) | | | | | |
| GDP | -8.9 | 6.0 | 4.7 | 2.8 | 1.9 |
| Imports of goods and services | -12.9 | 11.6 | 6.9 | 4.8 | 4.0 |
| Domestic final consumption | -7.8 | 3.9 | 4.2 | 2.1 | 1.5 |
| Private consumption expenditure | -10.7 | 5.2 | 5.0 | 2.7 | 2.0 |
| Government consumption expenditure | 1.9 | 0.7 | 1.7 | 0.4 | -0.2 |
| Gross fixed capital formation | -9.2 | 15.5 | 6.8 | 4.9 | 4.3 |
| - machinery, equipment, and intangible assets | -8.7 | 10.0 | 6.6 | 4.8 | 4.3 |
| - transportation means | -27.2 | 18.8 | 10.6 | 7.6 | 5.1 |
| - construction | -6.7 | 20.9 | 6.5 | 4.6 | 4.3 |
| Exports of goods and services | -14.0 | 11.4 | 6.0 | 4.1 | 3.1 |
| | | | | | |
| Memo: current account balance. % GDP | 3.5 | 3.6 | 3.1 | 2.7 | 2.5 |
| CONTRIBUTIONS TO REAL GDP GROWTH (1) | | | | | |
| Net exports | -0.7 | 0.2 | -0.1 | -0.1 | -0.2 |
| Inventories | -0.4 | -0.1 | 0.2 | 0.2 | 0.1 |
| Domestic demand net of inventories | -7.8 | 5.9 | 4.6 | 2.7 | 2.0 |
| PRICES | | | | | |
| Imports of goods and services deflator | -4.1 | 7.1 | 2.6 | 1.2 | 1.2 |
| Exports of goods and services deflator | -0.5 | 3.2 | 2.1 | 1.3 | 1.2 |
| GDP deflator | 1.2 | 1.5 | 1.6 | 1.5 | 1.7 |
| Nominal GDP | -7.9 | 7.6 | 6.4 | 4.3 | 3.6 |
| Private consumption deflator | -0.3 | 1.5 | 1.6 | 1.4 | 1.7 |
| Planned inflation | -0.2 | 0.5 | 1.5 | | |
| LABOUR | | | | | |
| Compensation of employees per FTE | 2.8 | 1.3 | 1.2 | 1.5 | 1.8 |
| Labour productivity (measured on GDP) | 1.5 | -0.5 | 0.5 | 0.3 | 0.2 |
| Unit labour cost (measured on GDP) | 1.3 | 1.8 | 0.7 | 1.2 | 1.6 |
| Employment (FTEs) | -10.3 | 6.5 | 4.1 | 2.5 | 1.7 |
| Unemployment rate | 9.3 | 9.6 | 9.1 | 8.4 | 7.7 |
| Employment rate (15-64 years) | 57.5 | 58.1 | 60.2 | 62.1 | 63.4 |
| Memo: Nominal GDP (absolute values in EUR millions) | 1,653,577 | 1,779,295 | 1,892,517 | 1,974,595 | 2,045,376 |
| (1) Any inaccuracies are due to rounding. |
| Note: The international exogenous assumptions are based on the information available on 31 August 2021. |
| GDP and components in volume (chain linked values reference year 2015), not seasonally adjusted data. |
Compared to the trend scenario, the highest deficit involves a gradual drop of the gross public debt-to-GDP ratio, although the higher nominal growth partly offsets this effect. The debt-to-GDP ratio is expected to drop from 153.5 percent estimated for this year to 146.1 percent in 2024.
| MINISTRY OF ECONOMY AND FINANCE | 33 |
| | UPDATE OF THE ECONOMIC AND FINANCIAL DOCUMENT 2021 |
figurE III.1: deficit and public debt – policy scenario (% of GDP) |
|
SOURCE: ISTAT. FORECASTS OF POLICY SCENARIO FROM 2021. |
In compliance with the public accounting and finance law provisions concerning the mandatory requirements of the Update of the Stability Programme, the net balance to be financed of the State budget in accrual terms might increase up to 203.0 billion in 2022; 180.5 billion in 2023; and 116.8 billion in 2024. The corresponding net balance to be financed in cash terms might increase up to 280.0 billion in 2022, 245.5 billion in 2023, and 174.0 billion in 2024.
| 34 | MINISTRY OF ECONOMY AND FINANCE |
III. UPDATED POLICY SCENARIO | |
TABLE III.3: PUBLIC FINANCE INDICATORS (percent of GDP) (1) |
| | 2019 | 2020 | 2021 | 2022 | 2023 | 2024 |
| POLICY SCENARIO | | | | | | |
| Net borrowing | -1.5 | -9.6 | -9.4 | -5.6 | -3.9 | -3.3 |
| Primary balance | 1.8 | -6.1 | -6.0 | -2.7 | -1.2 | -0.8 |
| Interest expenditure | 3.4 | 3.5 | 3.4 | 2.9 | 2.7 | 2.5 |
| Structural net borrowing (2) | -1.8 | -4.7 | -7.6 | -5.4 | -4.4 | -3.8 |
| Structural change | 0.4 | -2.9 | -2.9 | 2.1 | 1.0 | 0.6 |
| Public debt (gross of financial aids) (3) | 134.3 | 155.6 | 153.5 | 149.4 | 147.6 | 146.1 |
| Public debt (net of financial aids) (3) | 131.0 | 152.1 | 150.3 | 146.4 | 144.8 | 143.3 |
| TREND SCENARIO UNDER UNCHANGED LEGISLATION |
| Net borrowing | -1.5 | -9.6 | -9.4 | -4.4 | -2.4 | -2.1 |
| Primary balance | 1.8 | -6.1 | -6.0 | -1.5 | 0.3 | 0.4 |
| Interest expenditure | 3.4 | 3.5 | 3.4 | 2.9 | 2.7 | 2.5 |
| Structural net borrowing (2) | -1.8 | -4.8 | -7.6 | -4.2 | -2.8 | -2.6 |
| Structural change | 0.4 | -2.9 | -2.9 | 3.4 | 1.4 | 0.2 |
| Public debt (gross of financial aids) (3) | 134.3 | 155.6 | 153.5 | 148.8 | 145.9 | 143.3 |
| Public debt (net of financial aids) (3) | 131.0 | 152.1 | 150.3 | 145.8 | 143.0 | 140.6 |
| MEMO: 2021 STABILITY PROGRAMME (POLICY SCENARIO) |
| Net borrowing | -1.6 | -9.5 | -11.8 | -5.9 | -4.3 | -3.4 |
| Primary balance | 1.8 | -6.0 | -8.5 | -3.0 | -1.5 | -0.8 |
| Interest expenditure | 3.4 | 3.5 | 3.3 | 3.0 | 2.8 | 2.6 |
| Structural net borrowing (2) | -1.7 | -4.7 | -9.3 | -5.4 | -4.4 | -3.8 |
| Structural change | 0.6 | -3.0 | -4.5 | 3.8 | 1.0 | 0.6 |
| Public debt (gross of financial aids) | 134.6 | 155.8 | 159.8 | 156.3 | 155.0 | 152.7 |
| Public debt (net of financial aids) | 131.3 | 152.3 | 156.5 | 153.2 | 152.0 | 149.9 |
| Nominal GDP under unchanged legislation (absolute values x 1,000) | 1794,9 | 1653,6 | 1779,3 | 1883,4 | 1959,7 | 2025,5 |
| Nominal GDP under policy scenario (absolute values x 1,000) | 1794,9 | 1653,6 | 1779,3 | 1892,5 | 1974,6 | 2045,4 |
(1) Any inaccuracies are due to rounding. (2) Net of one-offs and the cyclical component. (3) Gross or net of Italy’s share of loans to EMU Member States, either bilaterally or through the EFSF, and of the contribution to the capital of the ESM. At the end of 2020, the amount of these shares was approximately € 57.7 billion, of which € 43.4 billion for bilateral loans and through the EFSF and € 14.3 billion for the ESM programme (see Bank of Italy, ‘Statistical Bulletin of Public Finances, Borrowing Requirement and Debt, 15 September 2021’). The MEF’s liquidity stock is assumed to reduce by 0.3 per cent of GDP in the first year and to progressively reduce in the following years, in order to bring back the liquidity stock to the level of end 2019. In addition, the estimates take into account the repurchase of SACE, the use of earmarked assets of Patrimonio Destinato, and the loans of SURE and NGEU programmes. The interest rate scenario used for the estimates is based on the implicit forecasts derived from the forward rates on Italian government bonds for the period in which this document was compiled. |
| MINISTRY OF ECONOMY AND FINANCE | 35 |
| | UPDATE OF THE ECONOMIC AND FINANCIAL DOCUMENT 2021 |
III.2 DEBT-TO-GDP RATIO AND THE DEBT RULE
Public debt as a ratio of GDP: forecast under the policy scenario
The latest estimates of the Bank of Italy and ISTAT19 slightly reduced the debt-to-GDP ratio over the last two years, following the upward revision of the nominal GDP of almost 4 billion in 2019 and 2 billion in 2020.
Following these revisions, the 2019 debt-to-GDP ratio drops to 134.3 percent compared to the 134.6 percent indicated in March; the same figure for year 2020 drops to 155.6 percent compared to the previous level (155.8 percent). The increase in the 2020 debt-to-GDP ratio was, therefore, 21.4 percent compared to 2019.
The recovery of economic growth, exceeding the expectations, with improved public finance trends compared to the SP forecasts, will lead to a decrease in the debt-to-GDP ratio starting from 2021. In the current year, the updated debt-to-GDP ratio objective is set at 153.5 percent, with a reduction of 2.1 percent compared to 2020.
From 2021, the debt-to-GDP ratio will decrease thanks to the so-called snow-ball effect, which greatly contributed to the exceptional increase in the debt-to-GDP ratio in 2020. The projected robust economic growth, the containment of primary deficit at lower levels compared to SP, and the maintenance of low yields over the curve of government securities will support the reduction of the debt-to-GDP ratio over the next three years.
In 2022, the debt-to-GDP target is revised at 149.4 percent. The expected reduction will result from the decrease of public sector requirements (about -3.7 percent of the GDP vs. 2021) and the robust growth of nominal GDP (+6.4 percent), which is affected by the expansionary impact of the tax measures and next public finance action to be implemented in 2022-2024.
In 2023, a further decrease in the debt-to-GDP ratio is expected (147.6). The reduction pace will be slightly slower than the previous year due to the nominal growth effect (equal to 4.3 percent) and a modest decrease of public sector requirements (about -0.5 percent of the GDP).
In 2024, the net borrowing and GDP ratio will converge at -3.3 percent, thus reducing the debt-to-GDP ratio to 146.1 percent.
Net of Italy's minority interest in loans to the Member States of the EM, both bilateral and through the ESFS, the capital contribution to the ESM, the estimate of the financial statement in the debt-to-GDP ratio was equal to 152.1 percent. In comparison, the projection for 2024 is around 143.3 percent.
19 Banca d’Italia, ‘Bollettino statistico Finanza Pubblica, fabbisogno e debito', 15 September 2021; ISTAT, ‘Conti Economici Nazionali’, 22 September 2021.
| 36 | MINISTRY OF ECONOMY AND FINANCE |
III. UPDATED POLICY SCENARIO | |
| TABLE III.4 GENERAL GOVERNMENT DEBT BY SUB-SECTOR (1) (EUR millions and as percent of GDP) |
| | 2020 | 2021 | 2022 | 2023 | 2024 |
| Gross of Euro Area financial support (2) | | | | | |
| General government | 2,573,386 | 2,732,010 | 2,827,082 | 2,914,751 | 2,987,753 |
| as % of GDP | 155.6 | 153.5 | 149.4 | 147.6 | 146.1 |
| Central government (3) | 2,499,515 | 2,658,283 | 2,754,617 | 2,843,772 | 2,918,254 |
| Local government (3) | 122,345 | 122,201 | 120,941 | 119,454 | 117,974 |
| Social security funds (3) | 144 | 144 | 144 | 144 | 144 |
| Net of Euro Area financial support (2) | | | | | |
| General government | 2,515,669 | 2,674,686 | 2,770,258 | 2,858,427 | 2,931,930 |
| as % of GDP | 152.1 | 150.3 | 146.4 | 144.8 | 143.3 |
| Central government (3) | 2,441,799 | 2,600,959 | 2,697,793 | 2,787,449 | 2,862,431 |
| Local government (3) | 122,345 | 122,201 | 120,941 | 119,454 | 117,974 |
| Social security funds (3) | 144 | 144 | 144 | 144 | 144 |
(1) Note: Any inaccuracies result from rounding. (2) Gross or net of Italy’s shares of loans to EMU Member States, bilateral or through the EFSF, and the contribution to the capital of the ESM. At the end of 2020 the amount of these shares amounted to approximately 57.7 billion, of which 43.4 billion for bilateral loans and through the EFSF and 14.3 billion for the ESM programme (see Bank of Italy, 'Statistical Bulletin of Public Finance, Borrowing Requirements and Debt of 15 September 2021). The MEF’s liquidity stocks are expected to be reduced by 0.3 percent of GDP, followed by a progressive decrease in the next years with the objective to take back the stock towards the level of end 2019. In addition, estimates take into account the repurchase of SACE, the use of earmarked assets, and the EIB and SURE guarantees. The interest rate scenario used for the estimates is based on the implicit forecasts arising from the forward rates on Italian government bonds during the period covered by this document. (3) Gross of liabilities vis-à-vis other sub-sectors. (4) Including the effects of the Italian contribution in support of the Euro Area: Greek Loan Facility (GLF), EFSF and ESM. |
FIGURE III.2: DEBT-TO-GDP RATIO TREND, GROSS AND NET OF EUROPEAN AID |
|
| Source: ISTAT and Bank of Italy. From 2021, policy scenario forecasts. |
Assessment of the debt rule compliance
In 2020, the public debt-to-GDP ratio increased in the States of the European Union and the euro area. About fourteen member states (Belgium, Germany, Greece, Spain, France, Croatia, Italy, Cyprus, Hungary, Austria, Portugal, Slovenia, Slovakia, and Finland) exceeded the reference threshold (60 percent of public debt
| MINISTRY OF ECONOMY AND FINANCE | 37 |
| | UPDATE OF THE ECONOMIC AND FINANCIAL DOCUMENT 2021 |
of GDP) defined by the Treaty and Regulation of the European Commission (EC) No 1467/1997. Consequently, on 2 June, the Commission published a report according to Article 126(3) of the Treaty. The debt analysis shows that, in 2020, Belgium, Greece, Croatia, Italy, Cyprus, Hungary, Austria, Portugal and Slovenia did not comply with the reference benchmark for debt reduction20. The Commission recognised that the deterioration of fiscal sustainability depends on the significant nominal GDP contraction and substantial public debt issued to finance abnormally high deficits.
The Italian public debt stood at 134.3 percent of GDP at the end of 2019, substantially unchanged compared to 2018 (134.4 percent of the GDP). After the pandemic, the public debt increased to 155.6 of the GDP at the end of 2020. Since 2021, a gradual decrease is projected – from 153.5 percent of the GDP at the end of the year to lower than 150 points by the end of 2022 – resulting from a better GDP dynamic and the net borrowing adjustment. The debt reduction path, however, is not in line with the rate set out by the SGP debt rule to achieve 60 percent debt-to-GDP over 20 years. As from the following Table, according to the backward-looking criterion, the reduction of the gap between the national debt-to-GDP ratio and the 60 percent target had to be implemented over the three previous years - 1/20 per year21. With respect to this benchmark, the public debt-to-GDP ratio will be around 20 percent higher in 2021 and almost 10 in 2022. As for the forward-looking criterion of the debt rule, the public debt-to-GDP ratio should near the 60 percent threshold over the next two years. In the policy scenario forecasted by the Government, the public debt in 2023 (as regarded for 2021 compliance) would be at least 4 percentage points higher than provided by the rule. If we examine the cyclically-adjusted configuration22, the gap with respect to its backward benchmark is approximately 7 percentage points of GDP in 2021, while almost vanishing in 2022.
20 The debt reduction benchmark is calculated over a three-year horizon that can be prospective (t-1 to t+ 1), retrospective (t-3 to t-1) and cyclically adjusted. If the debt ratio is below 60 % of GDP in any of the years, the benchmark cannot be calculated in a meaningful way.
21 For the exact calculation of the debt rule according to the methodology agreed at European level, please refer to the Vademecum on the 2019 Stability and Growth Pact published by the European Commission, p.46, https://ec.europa.eu/info/publications/vade-mecum-stability-and-growth-pact-2019-edition_en
22 The configuration of the cycle-adjusted debt rule involves correcting the debt ratio: at the numerator for the cyclical component of net borrowing over the last three years, and at the denominator, by adjusting the level of GDP for cyclical fluctuations. The debt-to-GDP ratio thus corrected is compared with the value prescribed by the debt rule in the backward projection.
| 38 | MINISTRY OF ECONOMY AND FINANCE |
III. UPDATED POLICY SCENARIO | |
| TABLE III.5: COMPLIANCE WITH THE DEBT RULE, FORWARD LOOKING AND CYCLICALLY ADJUSTED CRITERION |
| | 2020 | 2021 | 2022 |
| Debt in year t+ 2 (% of GDP) | 149.4 | 147.6 | 146.1 |
Gap compared to backward looking benchmark
(% of GDP) | 28.5 | 19.7 | 9.8 |
Gap compared to forward looking benchmark
(% of GDP) | 9.8 | 3.8 | 14.5 |
Cyclically adjusted debt gap (% of GDP) | 11.2 | 6.9 | 0.9 |
III. 3 DEBT-TO-GDP RATIO SCENARIOS IN THE MEDIUM TERM
This section presents sensitivity analyses on public finance objectives under different financial and macroeconomic risk scenarios. First, the effects on the budget balance and the debt-to-GDP ratio of shocks on economic growth and on the yield curve are presented; these shocks correspond to those described in chapter II. The subsequent section presents stochastic simulations of the debt-to-GDP ratio, displayed through fan charts. The last section offers an update of the medium-term (up to year 2032) debt-to-GDP ratio projection, based on the growth and budget outlook underlying the policy scenario presented in this document; two alternative projections show debt-to-GDP ratio profiles in line with the political commitment of this Government to continue on a path of fiscal consolidation beyond the 2024 horizon.
Sensitivity of public finance to growth and interest rates
This section presents the simulation of two risk scenarios in which the macroeconomic shocks affect the 2021-2024 public finance trend, according to standard sensitivity assumptions23.
The baseline scenario corresponds to the policy framework of this document. The sensitivity analysis aims at outlining the budget balance trend and the debt dynamics implied by assuming two alternative scenarios based on the results reported in Chapter II – Focus "A risk (or sensitivity) analysis on exogenous variables".
The "financial risk" scenario considers risk elements linked to the economy’s financial conditions, incorporating a widening of 100 basis points of the BTP-Bund spread and a subsequent impact on economic growth. The "growth risk" scenario combines the effects of the risk scenarios related to international trade, exchange rate and oil price; no shock is simulated on the yield curve.
The outcomes on GDP (used to estimate potential output and the output gap) are derived from the ITEM model, as explained in the Focus. The figures related to interest rates (in the "financial risk" scenario) and to changes in interest expenditure are calculated with the Treasury's SAPE model – based on data on current and projected government securities.
23 See Section III.4 of the Methodological Note on the criteria for making trend forecasts for the 2021 DEF, available at: https://www.rgs.mef.gov.it/_Documenti/VERSIONE-I/Attivit--i/Contabilit_e_finanza_pubblica/DEF/2021/NotaMetodologica-allegata-alla-sezione-II.pdf.
| MINISTRY OF ECONOMY AND FINANCE | 39 |
| | UPDATE OF THE ECONOMIC AND FINANCIAL DOCUMENT 2021 |
Table III.6 shows the estimates of the main macroeconomic and public finance variables across the three different scenarios in the planning horizon considered in this document (up to 2024).
| TABLE III.6: SENSITIVITY SCENARIOS (percentage values) |
| | | 2020 | 2021 | 2022 | 2023 | 2024 |
| Growth rate of nominal GDP | Baseline | -7.9 | 7.6 | 6.4 | 4.3 | 3.5 |
| Financial risk scenario | -7.9 | 7.6 | 6.3 | 3.8 | 2.6 |
| Growth risk scenario | -7.9 | 7.5 | 5.4 | 3.3 | 2.3 |
| Growth rate of real GDP | Baseline | -8.9 | 6.0 | 4.7 | 2.8 | 1.9 |
| Financial risk scenario | -8.9 | 6.0 | 4.6 | 2.2 | 1.1 |
| Growth risk scenario | -8.9 | 5.9 | 3.6 | 2.2 | 1.1 |
| Deficit/GDP | Baseline | -9.6 | -9.4 | -5.6 | -3.9 | -3.3 |
| Financial risk scenario | -9.6 | -9.5 | -5.9 | -5.0 | -5.2 |
| Growth risk scenario | -9.6 | -9.5 | -6.3 | -5.1 | -5.2 |
| Primary balance/GDP | Baseline | -6.1 | -6.0 | -2.7 | -1.3 | -0.8 |
| Financial risk scenario | -6.1 | -6.1 | -2.8 | -1.9 | -2.2 |
| Growth risk scenario | -6.1 | -6.1 | -3.3 | -2.4 | -2.6 |
| Implicit interest rate | Baseline | 2.4 | 2.4 | 2.0 | 1.9 | 1.7 |
| Financial risk scenario | 2.4 | 2.4 | 2.1 | 2.1 | 2.1 |
| Growth risk scenario | 2.4 | 2.4 | 2.0 | 1.9 | 1.7 |
| Debt/GDP | Baseline | 155.6 | 153.5 | 149.4 | 147.6 | 146.1 |
| Financial risk scenario | 155.6 | 153.7 | 150.4 | 150.6 | 152.4 |
| Growth risk scenario | 155.6 | 153.7 | 151.5 | 152.3 | 154.3 |
The following Figure shows the change of the debt-to-GDP ratio across the three scenarios. The baseline, namely the official policy forecast, shows a continuous decreasing trend. As a result of the intensity of the simulated shocks, the alternative scenarios present a trend reversal in the debt-to-GDP ratio starting from 2023. To assess the "plausibility" and the probability of these trends, the following section presents stochastic simulations.
FIGURe III.3: dynamics of THE debt-to-gdp ratio in sensitivity scenarios |
|
|
| 40 | MINISTRY OF ECONOMY AND FINANCE |
III. UPDATED POLICY SCENARIO | |
Stochastic simulations of debt-to-GDP dynamics
To present a sensitivity analysis on the debt-to-GDP ratio trend that considers the uncertainties underlying the forecasts on yield curve, public finances and economic growth, stochastic simulations have been implemented. These simulations consider the historical volatility of short and long-term interest rates, and the volatility of nominal economic growth and primary budget balances. The simulations have been carried out using the Monte Carlo method, applying stochastic shocks on the debt-to-GDP ratio dynamics in the reference scenario presented in this Update. Said shocks are simulated based on the historical volatility of interest rates (short and long-term), nominal GDP growth rates and primary budget balances. They result from 2,000 draws from a normal distribution with average equal to zero and variance/covariance matrix as recorded in 1999-2020.
More specifically, we assume two scenarios: the first scenario simulates symmetrical shocks on primary balances, while in the second scenario, negative shocks are given a larger weight; the shocks on nominal growth and short and long-term interest rates, in line with the Commission's approach, are always symmetrical and of temporary nature24.
It is possible to identify a debt-to-GDP ratio distribution through fan charts (Figures III.4A and III.4B) for each forecast year in the macroeconomic framework, and for each kind of shock on primary balances (symmetrical and asymmetrical).
In case of symmetrical shocks, the debt stands around an average value of 146.4 percent of GDP at the end of the time horizon, 12 pp higher than the figure recorded in 2019 (134.3), but 9 pp lower than the 2020 value (155.6). There is great uncertainty in the 2024 outcomes as shown by a gap of 18.6 pp between the 10th and 90th percentile of the expected debt distribution. Following the sudden increase in 2020, the debt-to-GDP ratio would decrease in all simulated scenarios starting from the following year.
Compared to symmetrical shocks, asymmetrical shocks lead to an equally broad debt-to-GDP distribution around the central scenario, but trend and level show clear differences. The end-of-period average value is 154.8, approximately 20.5 pp higher than the 2019 figure, and about 1 pp lower than the 2020 value. After increasing in 2020, 50 percent of simulated scenarios present a decreasing trend of the debt-to-GDP dynamics starting from 2021. In the remaining cases, the 2024 level would be higher than that recorded in 2020.
The debt stochastic projections presented in this section also allow the computation of the "non-increasing debt cap", which is the median value of public debt in 2024 which ensures (with 90 percent probability) that even in adverse conditions the debt-to-GDP ratio will not exceed the value forecasted in the policy scenario. In case of symmetrical shocks, this value is 146.2, namely 0.1 pp higher
24 For further information on the adopted methodology, see Berti K., (2013), “Stochastic public debt projections using the historical variance-covariance matrix approach for EU countries”, Economic Papers 480 and European Commission, 2020, Debt Sustainability Monitor 2019, Institutional Papers 120, available at: https://ec.europa.eu/info/sites/info/files/economy-finance/ip120_en.pdf.
The simulation of the shocks is directly carried out on the fiscal variable of the primary balance. In line with the recent DSM 2020, the two scenarios presented are not distinguished by the different assumptions on rate shocks (temporary or permanent, as previously proposed), but by the assumptions on primary balance shocks (symmetric or asymmetric). In the case of the asymmetric scenarios, an upper limit on positive balance shocks is set at half the standard deviation of the time series.
| MINISTRY OF ECONOMY AND FINANCE | 41 |
| | UPDATE OF THE ECONOMIC AND FINANCIAL DOCUMENT 2021 |
than the debt-to-GDP ratio projected for 2024. In case of asymmetrical shocks, said value is 146.4.
The stochastic simulation shows that the shocks suggested in the previous section are particularly high, and the outcomes of the debt-to-GDP ratio are to be placed in the upper (and less favourable) portion of the fan charts. It is likely that the decreasing trend in the debt-to-GDP ratio will continue over the next years, unless extremely adverse scenarios emerge and last in time.
| FIGURE III.4A: STOCHASTIC PROJECTION OF THE DEBT-TO-GDP RATIO WITH SYMMETRICAL SHOCKS | FIGURE III.4B: STOCHASTIC PROJECTION OF THE DEBT-TO-GDP RATIO WITH ASYMMETRICAL SHOCKS |
| |
Note: The graphs show the 10th, 20th, 40th, 50th, 60th, 80th and 90th percentile of the debt-to-GDP ratio distribution, as in the stochastic simulation. Source: MEF analysis. |
Medium-term projections of the debt-to-GDP ratio
In this section, the debt-to-GDP ratio related to the macroeconomic and public finance framework underlying this document is projected beyond the forecast horizon up to 2032.
The macroeconomic scenario matches the policy framework up to 2024. Starting from 2025, the medium-term growth rate is in line with the estimated potential GDP growth (according with the "t+10" methodology developed by the Output Gap Working Group).
Yearly interests are calculated with the Treasury's SAPE model, by taking the composition and maturity structure of the existing debt stock related to the last projection year (2024).
In terms of public finance, three scenarios have been simulated: in scenario A, the primary structural balance is set equal to the value forecasted for 2024 and adjusted in the medium term for variations in property income of the general government sector (obtained following the methodology described in the 2018 European Commission Ageing Report) and in Age Related Expenditures, AGE (calculated by the State General Accounting Office based on the trend scenario of
| 42 | MINISTRY OF ECONOMY AND FINANCE |
III. UPDATED POLICY SCENARIO | |
this document)25. In scenario B, the deficit-to-nominal GDP ratio improves by 0.6 pp in 2025 and 2026; in scenario C, the deficit has the same improvement recorded in B and a further yearly improvement of 0.5 pp in the primary structural balance is added, until a 2 percent surplus is reached in 2029.
The additional fiscal adjustment under B and C scenarios (vs. A) causes a feedback effect on real GDP in line with the EC methodology adopted in the 2020 Debt Sustainability Monitor. Beyond the last year of adjustment (2026 and 2029 respectively), the primary balance is forecasted up to 2032 in line with the methodology used in the A scenario.
The following Figure shows the development of the debt-to-GDP ratio across the three simulated scenarios. As for Scenario A – without fiscal adjustments after 2024 – the debt-to-GDP ratio drops up to 2026, then increases up to 153.5 percent in 2032. As for Scenario B, the debt drops up to 2030 and remains unchanged at 138.6 percent; while in Scenario C, the debt keeps dropping up to the end of the simulation horizon, reaching 131.1 percent of the GDP in 2032.
FIGURE III.5: MEDIUM-TERM PROJECTION OF THE DEBT-TO-GDP RATIO |
|
|
The increasing trend of the debt-to-GDP ratio in Scenario A is mainly due to two factors that worsen both primary balance and interest expenditure. On the one hand, the projection includes an increase in ageing costs; on the other hand, present projections of forward rates reflect market expectations and lead to an increase of the implicit rate paid on public debt securities from 202626.
25 For methodological details, see: "Le tendenze di medio-lungo periodo del sistema pensionistico e socio-sanitario - Rapporto n. 22", prepared by the State General Accounting Department, available on: http://www.rgs.mef.gov.it/VERSIONE-I/attivita_istituzionali/monitoraggio/spesa_pensionistica/.
26 Unlike the medium-term simulations contained in the 2021 Economic and Financial Document, no medium-term growth projection was made based on a scenario that fully incorporated the effects of the RRP, extending the forecast to 2026. If this were done, the growth outlook would be slightly more favourable.
| MINISTRY OF ECONOMY AND FINANCE | 43 |
| | UPDATE OF THE ECONOMIC AND FINANCIAL DOCUMENT 2021 |
The alternative scenarios (B and C), envisaging a fiscal adjustment, serve to prove that once the recovery is consolidated and the economic growth properly boosted, a further consolidation of public finances will be due to ensure a reduction in the debt-to-GDP ratio in the long term.
In addition to that, in view of the improved growth projections not yet incorporated in the estimate of potential growth underlying the simulations, some of the projected fiscal adjustment may become unnecessary.
| 44 | MINISTRY OF ECONOMY AND FINANCE |
IV. STRUCTURAL REFORMS
The Italian National Recovery and Resilience Plan (NRRP) is a unique opportunity to overcome the country's significant shortcomings and to relaunch its growth in the aftermath of the pandemic crisis.
By implementing the reforms and investments provided for in the NRRP, the Italian Government seeks to create a country that is more innovative and digitalised, more respectful of the environment, more inclusive of people with disabilities, more open to young people and women, and more territorially cohesive27. Acting on the regulatory and structural context the reform strategy is an integral part of the Plan and, at the same time, a necessary condition for its effective implementation. Furthermore, the resources allocated in the NRRP will also serve to address the macroeconomic imbalances revealed by the In-depth Review carried out by the European Commission as part of the Macroeconomic Imbalance Procedure (MIP) and to respond to the Country Specific Recommendations (CSR)28.
The wide range of reforms envisaged in the NRRP allows to address many of the structural problems of the Italian economy through long-awaited measures, including Public Administration (PA) and Justice reforms and the simplification agenda. The first two are the so-called horizontal or contextual reforms and pertain to all the Plan's Missions. The simplification measures fall within the enabling reforms, which are aimed at ensuring the implementation of the NRRP through the removal of administrative, regulatory and procedural obstacles; they include the annual law on competition, the enabling law on corruption, fiscal federalism (to be implemented by March 2026), and the reduction of PA payment times (by 2021) and of the tax gap (by 2022).
In addition, sectoral reforms are envisaged, with interventions in specific economic sectors or activities, also based on legislative changes to improve the regulatory framework.
Further measures that do not fall within the operational scope of the Plan but may contribute to achieving its general objectives include interventions for the rationalisation and fairness of the tax system and the extension and strengthening of the social safety nets.
With the first Monitoring Report29 presented in September, the Government gave initial feedback on the implementation status of the measures foreseeing
27 The interventions are divided into sixteen Components, grouped into six Missions. All six Missions have three common core priorities: gender equality, protection and empowerment of young people, and overcoming territorial disparities.
28 In addition to the 2019 and 2020 Recommendations, which are addressed in the NRRP, in 2021 the European Commission provided Italy with qualitative Recommendations on fiscal policy.
29 The Report was presented by the Undersecretary to the Presidency of the Council of Ministers and by the Minister for the Economy.
| MINISTRY OF ECONOMY AND FINANCE | 45 |
| | UPDATE OF THE ECONOMIC AND FINANCIAL DOCUMENT 2021 |
milestones and targets (M&T) to be achieved by the end of 2021: specifically, 51 measures, divided between reforms and investments30.
On 22 September 2021, five investments had already been defined, corresponding to 21 percent of the total M&T on investments to be completed by the end of the year. Implementation procedures have already been initiated for all the remaining investments.
As for the reforms expiring on 31 December 2021, 8 of them, which account for 30 percent of the total, have already been finalised; the other 19 are in the process of being approved.
In line with the NRRP's timetable, a number of initial actions have already been taken by the Government to reform the PA and the justice system. As regards the PA, governance, simplification and recruitment were the first 'goals' achieved through the prompt issuance of the relevant decrees between the first and second half of 2021.
First of all, in order to ensure the most effective implementation of the investments envisaged in the NRRP, provisions have been approved31 for the management and governance of the Plan, with particular regard to the roles of the different administrations involved, the monitoring procedures and the dialogue with European institutions. The same decree introduces important measures to simplify procedures affecting some of the areas covered by the NRRP (including ecological transition and digitisation) in order to facilitate the full implementation of the projects.
The simplification process also applies to the public procurement sector and refers to the authorisation and procedural barriers that hinder the implementation of projects and jeopardise the viability of works.
A new governance for Special Economic Zones has also been approved, in which the Extraordinary Commissioner can act as a contracting authority and exercise extraordinary powers for public contracts related to the NRRP. A single authorisation has also been introduced, which may derogate from urban and regional planning instruments.
Then, the organisational measures necessary to ensure a stable administrative capacity within the PA were introduced 32, defining the modalities for recruiting staff for the NRRP and for strengthening the functional capacity of the PA as well as the organisational measures to support the Plan and its projects.
The recently approved reforms of the justice system follow the lines repeatedly indicated by the European Commission in the Country Specific Recommendations and aim at speeding up the functioning of the courts and stimulating a culture of consensual conflict resolution - as far as civil justice is concerned - and at reducing the number of criminal proceedings requiring a trial, as well as the time required
https://www.governo.it/sites/governo.it/files/MONITORAGGIO_E_STATO_DI_ATTUAZIONE_DELLE_MISURE_PREVISTE_DAL_PNRR_NEL_2021.pdf
30 Investments also include the adoption of primary and secondary legislation or administrative acts aimed at regulating specific sectors and which determine whether dedicated financial resources can be used for lines of action.
Specifically, of the 51 measures, 24 relate to investments and 27 to reforms to be adopted.
31 Decree Law No. 77/2021.
32 Decree Law No. 80/2021.
| 46 | MINISTRY OF ECONOMY AND FINANCE |
for preliminary investigations while increasing the use of procedural alternatives to the ordinary proceeding.
As regards environmental policies, the criteria for selecting projects relating to waste collection and recycling plants were defined. An operational plan was also approved to provide the country with technologically advanced monitoring and prevention tools to safeguard the territory and infrastructures.
Alongside the implementation of the timetable, the Government is also proceeding to draw up reforms to accompany the NRRP in order to speed up the ongoing recovery. A draft enabling law on taxation has just been approved, based on four key principles: greater efficiency of the tax system and lower tax burden on factors of production; reduction of obligations and elimination of micro-taxes; progressivity of the tax system, which is to be preserved, following the provisions of the Constitution calling for a general principle of justice and equity; and fight against tax evasion and tax avoidance.
More in detail, the following is envisaged: the personal income tax (IRPEF) reform with the establishment of a proportional tax for capital income and a readjustment of the effective tax rates for labour income; the replacement of regional and municipal additionals to the IRPEF with corresponding surcharges; the modification of corporate income tax (IRES) to align it with the taxation of capital income; the rationalisation of VAT, including with regard to the levels of rates and the distribution of taxable bases across the rates; the gradual elimination of the regional income tax (IRAP); the introduction of regulatory and operational changes to the cadastral system to ensure that real estate and unregistered lands are detected; the reform of the tax collection system and the adoption of new organisational models; the reorganisation of all tax rules within single Codes.
The Government intends to guarantee the annual presentation of the Law for the Market and Competition, whose contents are an enabling condition for the NRRP. The law for 2021 will be presented to the Parliament by the end of the year, with the aim of obtaining a final approval by 2022.
The reforms that will follow, in line with the commitments undertaken in the NRRP, will concern important sectors of the economy and in particular the spending review framework, tertiary education, the promotion of the production and consumption of renewable gas, the management and sustainable use of the water system, the Customs one-stop shop, support for tourist businesses, active labour market policies, disability, the national air pollution control programme, student housing and Special Economic Zones (with reference to the ministerial decrees approving the operational plan).
Further sectoral interventions will take place with the implementation of the simplification decree and will facilitate infrastructure projects, in particular for the safety and monitoring of bridges and viaducts.
| MINISTRY OF ECONOMY AND FINANCE | 47 |
| | UPDATE OF THE ECONOMIC AND FINANCIAL DOCUMENT 2021 |
| 48 | MINISTRY OF ECONOMY AND FINANCE |
V. ANNEX
| TABLE V.1a: GENERAL GOVERNMENT BUDGETARY PROSPECTS UNDER UNCHANGED LEGISLATION (eur millions) |
| | 2020 | 2021 | 2022 | 2023 | 2024 |
| COMPONENTS OF EXPENDITURE | | | | | |
| Compensation of employees | 173,767 | 179,401 | 188,787 | 183,289 | 183,843 |
| Intermediate consumption | 150,881 | 161,930 | 153,614 | 154,048 | 153,753 |
| Social benefits | 399,171 | 403,970 | 403,750 | 410,400 | 418,970 |
| of which: Pensions | 281,451 | 287,640 | 296,240 | 304,730 | 312,420 |
| Other social benefits | 117,720 | 116,330 | 107,510 | 105,670 | 106,550 |
| Other current expenditure | 74,657 | 87,645 | 80,831 | 79,673 | 79,362 |
| Total current expenditure net of interest | 798,476 | 832,946 | 826,981 | 827,410 | 835,927 |
| Interest expenditure | 57,252 | 60,480 | 55,282 | 52,449 | 50,445 |
| Total current expenditure | 855,728 | 893,425 | 882,263 | 879,858 | 886,373 |
| of which: Health expenditure | 123,474 | 129,449 | 125,708 | 123,554 | 124,428 |
| | | | | | |
| Total capital expenditure | 88,758 | 107,333 | 93,577 | 94,895 | 94,937 |
| Gross fixed capital formation | 42,595 | 51,000 | 59,000 | 65,185 | 69,654 |
| Capital contributions | 17,617 | 24,665 | 26,976 | 24,548 | 20,645 |
| Other transfers | 28,546 | 31,668 | 7,601 | 5,162 | 4,637 |
| Total final expenditure net of interest | 887,234 | 940,278 | 920,558 | 922,305 | 930,864 |
| Total final expenditure | 944,486 | 1,000,758 | 975,840 | 974,754 | 981,309 |
| COMPONENTS OF REVENUE | | | | | |
| Total tax revenues | 479,482 | 513,565 | 538,835 | 557,172 | 572,296 |
| Direct taxes | 250,977 | 260,662 | 265,761 | 275,067 | 281,949 |
| Indirect taxes | 227,546 | 251,419 | 271,558 | 280,568 | 288,795 |
| Capital taxes | 959 | 1,484 | 1,516 | 1,537 | 1,552 |
| Social contributions | 228,641 | 232,806 | 252,324 | 260,360 | 269,055 |
| Actual contributions | 224,262 | 228,326 | 247,786 | 255,767 | 264,405 |
| Imputed contributions | 4,379 | 4,480 | 4,538 | 4,593 | 4,650 |
| Other current revenues | 74,747 | 78,194 | 84,234 | 83,485 | 81,296 |
| Total current revenues | 781,911 | 823,082 | 873,877 | 899,480 | 921,095 |
| Non-tax capital revenues | 3,175 | 8,428 | 17,566 | 26,247 | 16,530 |
| Total final revenues | 786,045 | 832,994 | 892,959 | 927,265 | 939,178 |
| Memo: Tax burden | 42.8 | 41.9 | 42.0 | 41.7 | 41.5 |
| Tax burden net of € 100 measure | 42.1 | 41.2 | 41.3 | 41.0 | 40.9 |
| BALANCES | | | | | , |
| Primary balance | -101,189 | -107,284 | -27,599 | 4,960 | 8,314 |
| as % of GDP | -6.1 | -6.0 | -1.5 | 0.3 | 0.4 |
| Current balance | -73,817 | -70,343 | -8,385 | 19,622 | 34,723 |
| as % of GDP | -4.5 | -4.0 | -0.4 | 1.0 | 1.7 |
| Net borrowing | -158,441 | -167,764 | -82,880 | -47,489 | -42,132 |
| as % of GDP | -9.6 | -9.4 | -4.4 | -2.4 | -2.1 |
| Trend nominal GDP (x 1,000) | 1,653.6 | 1,779.3 | 1,883.4 | 1,959.7 | 2,025.5 |
| Note: Any inaccuracies result from rounding. |
| MINISTRY OF ECONOMY AND FINANCE | 49 |
| | UPDATE OF THE ECONOMIC AND FINANCIAL DOCUMENT 2021 |
| TABLE V.1b: GENERAL GOVERNMENT BUDGETARY PROSPECTS UNDER UNCHANGED LEGISLATION (percent of GDP) |
| | 2020 | 2021 | 2022 | 2023 | 2024 |
| COMPONENTS OF EXPENDITURE | | | | | |
| Compensation of employees | 10.5 | 10.1 | 10.0 | 9.4 | 9.1 |
| Intermediate consumption | 9.1 | 9.1 | 8.2 | 7.9 | 7.6 |
| Social benefits | 24.1 | 22.7 | 21.4 | 20.9 | 20.7 |
| of which: Pensions | 17.0 | 16.2 | 15.7 | 15.6 | 15.4 |
| Other social benefits | 7.1 | 6.5 | 5.7 | 5.4 | 5.3 |
| Other current expenditure | 4.5 | 4.9 | 4.3 | 4.1 | 3.9 |
| Total current expenditure net of interest | 48.3 | 46.8 | 43.9 | 42.2 | 41.3 |
| | | | | | |
| Interest expenditure | 3.5 | 3.4 | 2.9 | 2.7 | 2.5 |
| | | | | | |
| Total current expenditure | 51.8 | 50.2 | 46.8 | 44.9 | 43.8 |
| of which: Health expenditure | 7.5 | 7.3 | 6.7 | 6.3 | 6.1 |
| | | | | | |
| Total capital expenditure | 5.4 | 6.0 | 5.0 | 4.8 | 4.7 |
| Gross fixed capital formation | 2.6 | 2.9 | 3.1 | 3.3 | 3.4 |
| Capital contributions | 1.1 | 1.4 | 1.4 | 1.3 | 1.0 |
| Other transfers | 1.7 | 1.8 | 0.4 | 0.3 | 0.2 |
| | | | | | |
| Total final expenditure net of interest | 53.7 | 52.8 | 48.9 | 47.1 | 46.0 |
| Total final expenditure | 57.1 | 56.2 | 51.8 | 49.7 | 48.4 |
| | | | | | |
| COMPONENTS OF REVENUE | | | | | |
| Total tax revenues | 29.0 | 28.9 | 28.6 | 28.4 | 28.3 |
| Direct taxes | 15.2 | 14.6 | 14.1 | 14.0 | 13.9 |
| Indirect taxes | 13.8 | 14.1 | 14.4 | 14.3 | 14.3 |
| Capital taxes | 0.1 | 0.1 | 0.1 | 0.1 | 0.1 |
| Social contributions | 13.8 | 13.1 | 13.4 | 13.3 | 13.3 |
| Actual contributions | 13.6 | 12.8 | 13.2 | 13.1 | 13.1 |
| Imputed contributions | 0.3 | 0.3 | 0.2 | 0.2 | 0.2 |
| Other current revenues | 4.5 | 4.4 | 4.5 | 4.3 | 4.0 |
| Total current revenues | 47.3 | 46.3 | 46.4 | 45.9 | 45.5 |
| | | | | | |
| Non-tax capital revenues | 0.2 | 0.5 | 0.9 | 1.3 | 0.8 |
| | | | | | |
| Total final revenues | 47.5 | 46.8 | 47.4 | 47.3 | 46.4 |
| Memo: Tax burden | 42.8 | 41.9 | 42.0 | 41.7 | 41.5 |
| BALANCES | | | | | |
| Primary balance | -6.1 | -6.0 | -1.5 | 0.3 | 0.4 |
| Current balance | -4.5 | -4.0 | -0.4 | 1.0 | 1.7 |
| Net borrowing | -9.6 | -9.4 | -4.4 | -2.4 | -2.1 |
| Note: GDP ratios are forecasts of the unchanged legislation scenario. Any inaccuracies result from rounding. | |
| 50 | MINISTRY OF ECONOMY AND FINANCE |
| TABLE V.1c: GENERAL COVERNMENT BUDGETARY PROSPECTS UNDER UNCHANGED LEGISLATION (percentage changes) |
| | 2021 | 2022 | 2023 | 2024 |
| COMPONENTS OF EXPENDITURE | | | | |
| Compensation of employees | 3.2 | 5.2 | -2.9 | 0.3 |
| Intermediate consumption | 7.3 | -5.1 | 0.3 | -0.2 |
| Social benefits | 1.2 | -0.1 | 1.6 | 2.1 |
| of which: Pensions | 2.2 | 3.0 | 2.9 | 2.5 |
| Other social benefits | -1.2 | -7.6 | -1.7 | 0.8 |
| Other current expenditure | 17.4 | -7.8 | -1.4 | -0.4 |
| Total current expenditure net of interest | 4.3 | -0.7 | 0.1 | 1.0 |
| | | | | |
| Interest expenditure | 5.6 | -8.6 | -5.1 | -3.8 |
| | | | | |
| Total current expenditure | 4.4 | -1.2 | -0.3 | 0.7 |
| of which: Health expenditure | 4.8 | -2.9 | -1.7 | 0.7 |
| | | | | |
| Total capital expenditure | 20.9 | -12.8 | 1.4 | 0.0 |
| Gross fixed capital formation | 19.7 | 15.7 | 10.5 | 6.9 |
| Capital contributions | 40.0 | 9.4 | -9.0 | -15.9 |
| Other transfers | 10.9 | -76.0 | -32.1 | -10.2 |
| | | | | |
| Total final expenditure net of interest | 6.0 | -2.1 | 0.2 | 0.9 |
| Total final expenditure | 6.0 | -2.5 | -0.1 | 0.7 |
| | | | | |
| COMPONENTS OF REVENUE | | | | |
| Total tax revenues | 7.1 | 4.9 | 3.4 | 2.7 |
| Direct taxes | 3.9 | 2.0 | 3.5 | 2.5 |
| Indirect taxes | 10.5 | 8.0 | 3.3 | 2.9 |
| Capital taxes | 54.7 | 2.2 | 1.4 | 1.0 |
| Social contributions | 1.8 | 8.4 | 3.2 | 3.3 |
| Actual contributions | 1.8 | 8.5 | 3.2 | 3.4 |
| Imputed contributions | 2.3 | 1.3 | 1.2 | 1.2 |
| Other current revenues | 4.6 | 7.7 | -0.9 | -2.6 |
| Total current revenues | 5.3 | 6.2 | 2.9 | 2.4 |
| | | | | |
| Non-tax capital revenues | 165.5 | 108.4 | 49.4 | -37.0 |
| | | | | |
| Total final revenues | 6.0 | 7.2 | 3.8 | 1.3 |
| TABLE V.2: IMPACT OF RECOVERY AND RESILIENCE FACILITY ON GENERAL GOVERNMENT BUDGETARY PROSPECTS - GRANTS |
| | 2020 (1) | 2021 | 2022 | 2023 | 2024 |
| Revenues from RRF grants (% GDP) |
| RRF GRANTS as included in the revenue projections | 0.0 | 0.3 | 0.7 | 1.0 | 0.7 |
| Cash disbursements of RRF GRANTS from EU | 0.0 | 0.5 | 1.1 | 0.6 | 0.4 |
| Expenditure financed by RRF grants (% GDP) |
| TOTAL CURRENT EXPENDITURE | 0.0 | 0.1 | 0.2 | 0.2 | 0.1 |
| Gross fixed capital formation P.51g | 0.0 | 0.1 | 0.2 | 0.3 | 0.3 |
| Capital transfers D.9 | 0.0 | 0.1 | 0.3 | 0.3 | 0.2 |
| TOTAL CAPITAL ACCOUNT EXPENDITURE | 0.0 | 0.2 | 0.5 | 0.6 | 0.4 |
| Other costs financed by RRF grants (% GDP) (2) |
| Reduction in tax revenue | 0.0 | 0.0 | 0.1 | 0.2 | 0.2 |
| Other costs with impact on revenue | 0.0 | 0.0 | 0.0 | 0.0 | 0.0 |
| Financial transactions | 0.0 | 0.0 | 0.0 | 0.0 | 0.0 |
(1) MEF projections. (2) Reference is made to cost items not recorded as expenditure in the national accounts. |
| MINISTRY OF ECONOMY AND FINANCE | 51 |
| | UPDATE OF THE ECONOMIC AND FINANCIAL DOCUMENT 2021 |
| TAVOLA V.3: IMPACT OF RECOVERY AND RESILIENCE FACILITY ON GENERAL GOVERNMENT BUDGETARY PROSPECTS - LOANS |
| | 2020 (1) | 2021 | 2022 | 2023 | 2024 |
CASH FLOW FROM RRF LOANS PROJECTED IN THE PROGRAMME (% GDP) |
| Disbursements of RRF LOANS from EU | 0.0 | 0.9 | 1.2 | 1.2 | 1.0 |
| Repayments of RRF LOANS to EU | 0.0 | 0.0 | 0.0 | 0.0 | 0.0 |
| Expenditure financed by RRF loans (% GDP) (1) |
| TOTAL CURRENT EXPENDITURE | 0.0 | 0.0 | 0.0 | 0.0 | 0.1 |
| Gross fixed capital formation P.51g | 0.1 | 0.3 | 0.6 | 0.8 | 1.4 |
| Capital transfers D.9 | 0.0 | 0.1 | 0.0 | 0.0 | 0.0 |
| TOTAL CAPITAL ACCOUNT EXPENDITURE | 0.1 | 0.4 | 0.6 | 0.8 | 1.4 |
| Other costs financed by RRF loans (% GDP) (2) |
| Reduction in tax revenue | 0.0 | 0.0 | 0.0 | 0.0 | 0.0 |
| Other costs with impact on revenue | 0.0 | 0.0 | 0.0 | 0.0 | 0.0 |
| Financial transactions | 0.0 | 0.0 | 0.0 | 0.0 | 0.0 |
(1) MEF projections. (2) Reference is made to cost items not recorded as expenditure in the national accounts. |
| TABLE V.4: SUMMARY OF PUBLIC FINANCE UNDER THE POLICY SCENARIO (percent of GDP) |
| | | 2020 | 2021 | 2022 | 2023 | 2024 |
| NET BORROWING | (Update) | -9.6 | -9.4 | -5.6 | -3.9 | -3.3 |
| (SP 2021) | -9.5 | -11.8 | -5.9 | -4.3 | -3.4 |
| INTEREST EXPENDITURE | (Update) | 3.5 | 3.4 | 2.9 | 2.7 | 2.5 |
| (SP 2021) | 3.5 | 3.3 | 3.0 | 2.8 | 2.6 |
| PRIMARY BALANCE | (Update) | -6.1 | -6.0 | -2.7 | -1.2 | -0.8 |
| (SP 2021) | -6.0 | -8.5 | -3.0 | -1.5 | -0.8 |
| STRUCTURAL NET BORROWING (1) | (Update) | -4.7 | -7.6 | -5.4 | -4.4 | -3.8 |
| (SP 2021) | -4.7 | -9.3 | -5.4 | -4.4 | -3.8 |
| Debt (gross of support) (2) | (Update) | 155.6 | 153.5 | 149.4 | 147.6 | 146.1 |
| (SP 2021) | 155.8 | 159.8 | 156.3 | 155.0 | 152.7 |
| Debt (net of support) (2) | (Update) | 152.1 | 150.3 | 146.4 | 144.8 | 143.3 |
| (SP 2021) | 152.3 | 156.5 | 153.2 | 152.0 | 149.9 |
| PUBLIC SECTOR BALANCE | (Update) | -9.6 | -8.9 | -5.2 | -4.7 | -3.8 |
| (SP 2021) | -9.5 | -12.6 | -5.8 | -4.7 | -2.7 |
| STATE SECTOR BALANCE | (Update) | -9.6 | -8.9 | -5.3 | -4.8 | -3.9 |
| | | | | | |
1) Net of one-off measures and cyclical components. 2) Gross or net of Italy’s shares of loans to EMU Member States, whether bilateral or through the EFSF, and the contribution to the capital of the ESM. At the end of 2020, the amount of these allowances amounted to approximately 57.7 billion, of which 43.4 billion for bilateral loans and through the EFSF and 14.3 billion for the ESM programme. |
| 52 | MINISTRY OF ECONOMY AND FINANCE |
| TABLE V.5: CYCLICALLY ADJUSTED PUBLIC FINANCE (percent of GDP) | |
| | 2018 | 2019 | 2020 | 2021 | 2022 | 2023 | 2024 |
| 1. Growth rate of GDP at constant prices | 0.9 | 0.4 | -8.9 | 6.0 | 4.7 | 2.8 | 1.9 |
| 2. Net borrowing | -2.2 | -1.6 | -9.6 | -9.4 | -5.6 | -3.9 | -3.3 |
| 3. Interest expenditure | 3.6 | 3.4 | 3.5 | 3.4 | 2.9 | 2.7 | 2.5 |
| 4. One-off measures (2) | 0.1 | 0.1 | 0.1 | 0.4 | 0.3 | 0.2 | 0.0 |
| Of which: Revenue measures | 0.2 | 0.1 | 0.2 | 0.4 | 0.3 | 0.2 | 0.0 |
| Expenditure measures | 0.0 | -0.1 | -0.1 | 0.0 | 0.0 | 0.0 | 0.0 |
| 5. Potential GDP growth rate | 0.2 | 0.0 | 0.4 | 0.5 | 1.1 | 1.4 | 1.5 |
| Factor contribution to potential growth: | | | | | | | |
| Labour | -0.1 | -0.4 | 0.1 | 0.0 | 0.5 | 0.6 | 0.6 |
| Capital | 0.0 | 0.0 | -0.1 | 0.1 | 0.3 | 0.3 | 0.4 |
| Total factor productivity | 0.3 | 0.4 | 0.4 | 0.4 | 0.4 | 0.4 | 0.4 |
| 6. Output gap | -0.2 | 0.2 | -9.1 | -4.1 | -0.7 | 0.6 | 1.0 |
| 7. Cyclical component of budget balance | -0.1 | 0.1 | -4.9 | -2.2 | -0.4 | 0.3 | 0.6 |
| 8. Cyclically adjusted budget balance | -2.1 | -1.7 | -4.6 | -7.2 | -5.1 | -4.2 | -3.8 |
| 9. Cyclically adjusted primary balance | 1.6 | 1.7 | -1.2 | -3.8 | -2.2 | -1.5 | -1.3 |
| 10. Structural budget balance (3) | -2.2 | -1,8 | -4.7 | -7.6 | -5.4 | -4.4 | -3.8 |
| 11. Structural primary balance (3) | 1.4 | 1,6 | -1.3 | -4.2 | -2.5 | -1.8 | -1.3 |
| 12. Change in structural budget balance | -0.3 | 0.4 | -2.9 | -2.9 | 2.1 | 1.0 | 0.6 |
| 13. Change in structural primary balance | -0.4 | 0.2 | -2.8 | -2.9 | 1.7 | 0.8 | 0.4 |
| (1) Any inaccuracies result from rounding. | |
| (2) The positive sign indicates deficit reducing one-off measures. | |
| (3) Cyclically adjusted and net of one-off and other temporary measures. | |
| TABLE V.6: ONE-OFF MEASURES UNDER UNCHANGED LEGISLATION (EUR millions) |
| | FINAL DATA | FORECASTS |
| 2019 | 2020 | 2021 | 2022 | 2023 | 2024 |
| Total one-off measures | 1,437 | 1,174 | 6,734 | 5,554 | 4,453 | 615 |
| as % of GDP | 0.1 | 0.1 | 0.4 | 0.3 | 0.2 | 0.0 |
| - a) Revenue | 2,523 | 2,666 | 6,848 | 5,489 | 4,383 | 580 |
| as % of GDP | 0.1 | 0.2 | 0.4 | 0.3 | 0.2 | 0.0 |
| - Various substitute taxes | 1,867 | 1,582 | 4,667 | 3,330 | 3,113 | 0 |
| - Aligning of balance sheet values to IAS principles | 221 | 423 | 580 | 580 | 580 | 580 |
| - Foreign capital emergence (‘voluntary disclosure’) | 38 | 1 | 0 | 0 | 0 | 0 |
| - Facilitated settlement of tax arrears (1) | 397 | 660 | 1,601 | 1,579 | 690 | 0 |
| | | | | | | |
| - b) Expenditure | -2,064 | -2,437 | -940 | -787 | -735 | -680 |
| as % of GDP | -0.1 | -0.1 | -0.1 | 0.0 | 0.0 | 0.0 |
| - Measures for natural disasters: | -1,607 | -962 | -940 | -787 | -735 | -680 |
| - Reclassification of MPS operation | 0 | -1,045 | 0 | 0 | 0 | 0 |
| - Carige loan reclassification | -457 | 0 | 0 | 0 | 0 | 0 |
- Banca Popolare di Bari loan reclassification | 0 | -430 | 0 | 0 | 0 | 0 |
| | | | | | | |
| - c) Disposals of real estate | 978 | 945 | 826 | 852 | 805 | 715 |
| as % of GDP | 0.1 | 0.1 | 0.0 | 0.0 | 0.0 | 0.0 |
| Breakdown by sub-sectors | | | | | | |
| - Central Government | 500 | 312 | 5,980 | 4,752 | 3,698 | -50 |
| - Local Governments | 765 | 711 | 539 | 500 | 500 | 410 |
| - Social Security Funds | 172 | 151 | 215 | 302 | 255 | 255 |
1) Including the measures of D.L. No. 193/2016, D.L. No. 148/2017, D.L. No. 119/2018, and D.L. No. 124/2019. Note: The positive sign indicates deficit reducing one-off measures. |
| MINISTRY OF ECONOMY AND FINANCE | 53 |