UNITED STATES
SECURITIES AND EXCHANGE COMMISSION
Washington, D.C. 20549
FORM N-CSR
CERTIFIED SHAREHOLDER REPORT
OF
REGISTERED MANAGEMENT INVESTMENT COMPANIES
Investment Company Act file number: 811-1027
Name of Registrant: Vanguard World Funds
Address of Registrant:
P.O. Box 2600
Valley Forge, PA 19482
Name and address of agent for service:
Heidi Stam, Esquire
P.O. Box 876
Valley Forge, PA 19482
Registrant’s telephone number, including area code: (610) 669-1000
Date of fiscal year end: August 31
Date of reporting period: September 1, 2009 – February 28, 2010
Item 1: Reports to Shareholders

|
| Vanguard U.S. Growth Fund |

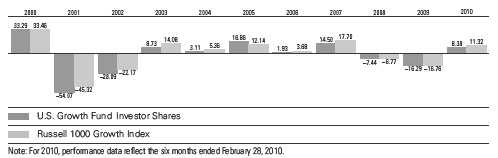
> Vanguard U.S. Growth Fund’s Investor Shares returned about 8% for the six-month period ended February 28, 2010.
> The fund lagged both the return of its benchmark, the Russell 1000 Growth Index, and the average return of large-capitalization growth funds.
> Stock selection in several sectors, including information technology and financials, stifled the fund’s returns relative to its benchmark.
| |
| Contents | |
| Your Fund’s Total Returns. | 1 |
| Chairman’s Letter. | 2 |
| Advisors’ Report. | 6 |
| Fund Profile. | 9 |
| Performance Summary. | 10 |
| Financial Statements. | 11 |
| About Your Fund’s Expenses. | 22 |
| Trustees Approve Advisory Agreements. | 24 |
| Glossary. | 26 |
Please note: The opinions expressed in this report are just that—informed opinions. They should not be considered promises or advice. Also, please keep in mind that the information and opinions cover the period through the date on the front of this report. Of course, the risks of investing in your fund are spelled out in the prospectus.
See the Glossary for definitions of investment terms used in this report.
Cover photograph: Veronica Coia.
| |
| Your Fund’s Total Returns | |
| |
| |
| |
| |
| Six Months Ended February 28, 2010 | |
| | Total |
| | Returns |
| Vanguard U.S. Growth Fund | |
| Investor Shares | 8.38% |
| Admiral™ Shares | 8.49 |
| Russell 1000 Growth Index | 11.32 |
| Large-Cap Growth Funds Average | 10.13 |
| Large-Cap Growth Funds Average: Derived from data provided by Lipper Inc. | |
Admiral Shares are a lower-cost class of shares available to many longtime shareholders and to those with significant investments in the fund.
| | | | |
| Your Fund’s Performance at a Glance | | | | |
| August 31, 2009 , Through February 28, 2010 | | | | |
| | | | Distributions Per Share |
| | Starting | Ending | Income | Capital |
| | Share Price | Share Price | Dividends | Gains |
| Vanguard U.S. Growth Fund | | | | |
| Investor Shares | $14.83 | $15.99 | $0.086 | $0.000 |
| Admiral Shares | 38.41 | 41.39 | 0.292 | 0.000 |
1

Chairman’s Letter
Dear Shareholder,
After rising dramatically throughout most of 2009, domestic stocks leveled off during the first two months of 2010. For the six-month period ended February 28, 2010, the broad U.S. stock market posted a return of about 10%.
Vanguard U.S. Growth Fund returned about 8% for the first half of its fiscal year, an acceptable result that could have been better. The fund lagged the broad market for the period and also fell behind its benchmark, the Russell 1000 Growth Index, which returned about 11%. The fund’s trailing performance was primarily due to poor stock selection in the financial and information technology sectors of the market.
Stock markets caught their breath at the end of a solid six months
The broad stock market rally seemed to downshift toward the end of the fiscal period, as the investor relief that powered markets higher a year ago gave way to a sober-minded assessment of the prospects for corporate earnings growth.
Smaller-capitalization stocks did a little better than larger-cap stocks, and growth-oriented securities bested their value-oriented counterparts, but the uniformity of returns from different market segments was more striking than the differences.
2
International stocks produced more modest returns. In Europe, the precarious financial health of Greece and of smaller economies such as Portugal and Ireland weighed on the markets. In Asia, the Japanese stock market’s weakness held back results for Asia Pacific indexes. Emerging market stocks continued to outpace those from developed markets.
Yields remained low, but Fed began to unwind rescue programs
The yields of longer-term U.S. Treasury bonds rose during the past six months, while those of the shortest-term securities remained near 0%. Although the Federal Reserve Board expects to keep its target for short-term interest rates close to 0% for “an extended period,” it began to wind down credit programs established during the financial crisis. The Fed’s most dramatic (though largely symbolic) act was to raise the interest rate at its discount window, a lending facility designed to help commercial banks and other depository institutions meet emergency short-term funding needs.
The broad taxable bond market returned 3.19%, with notable strength in corporate bonds. The broad municipal bond market returned 4.13%.
Poor stock selection hindered fund performance
During the six-month period covered in this report, Vanguard U.S. Growth Fund posted positive returns in almost all areas of the market, with the exception of the financial and utilities sectors. Although the fund’s overall performance was respectable in
| | | |
| Market Barometer | | | |
| |
| | | | Total Returns |
| | | Periods Ended February 28, 2010 |
| | Six | One | Five Years |
| | Months | Year | (Annualized) |
| Stocks | | | |
| Russell 1000 Index (Large-caps) | 9.91% | 55.32% | 0.77% |
| Russell 2000 Index (Small-caps) | 10.59 | 63.95 | 1.16 |
| Dow Jones U.S. Total Stock Market Index | 10.23 | 56.38 | 1.20 |
| MSCI All Country World Index ex USA (International) | 3.83 | 63.51 | 4.60 |
| |
| Bonds | | | |
| Barclays Capital U.S. Aggregate Bond Index (Broad | | | |
| taxable market) | 3.19% | 9.32% | 5.36% |
| Barclays Capital Municipal Bond Index | 4.13 | 9.98 | 4.50 |
| Citigroup Three-Month U.S. Treasury Bill Index | 0.06 | 0.14 | 2.81 |
| |
| CPI | | | |
| Consumer Price Index | 0.42% | 2.14% | 2.48% |
3
absolute terms, the fund trailed its benchmark by about 3 percentage points for the period.
The U.S. Growth Fund allocated about 12% of its assets to financial stocks, on average, during the period, compared with an index weighting of about 5%. The fund had significant exposure to capital market stocks, including investment firms Goldman Sachs, JPMorgan Chase, and Credit Suisse. These stocks took a hit during the period, as investors continued to be skeptical of big financial institutions.
Information technology stocks accounted for the largest sector weighting in both the fund and index for the period. Technology companies have remained among the U.S. stock market’s top performers since the rally in equities began in March 2009; however, poor stock selection in the sector dampened the fund’s returns. A large exposure to the communications company Qualcomm—which returned –20% for the period—particularly hurt performance. Fortunately, holdings in some of the industry’s top performers, including Apple, Hewlett-Packard, and Google, helped to soften the blow.
Relative to the index, the fund had less of a stake in consumer staples stocks, which also impeded returns. Minimal exposure to food retailers, beverage companies, and household products firms caused the fund to trail its benchmark by more than 1 percentage point in the sector.
| | | |
| Expense Ratios | | | |
| Your Fund Compared With Its Peer Group | | | |
| | Investor | Admiral | Peer Group |
| | Shares | Shares | Average |
| U.S. Growth Fund | 0.49% | 0.30% | 1.37% |
The fund expense ratios shown are from the prospectus dated December 28, 2009, and represent estimated costs for the current fiscal year based on the fund’s net assets as of the prospectus date. For the six months ended February 28, 2010, the annualized expense ratios were 0.48% for Investor Shares and 0.29% for Admiral Shares. The peer-group expense ratio is derived from data provided by Lipper Inc. and captures information through year-end 2009.
Peer group: Large-Cap Growth Funds.
4
On a positive note, the portfolio had strong stock selection in health care and industrials. In health care, the fund’s holdings in biotech companies, including Gilead Sciences and Celgene, boosted returns. These companies saw their stock prices rise as investors’ concerns over changes to the nation’s health care policy began to dissipate. In industrials, the machinery company Danaher, which returned almost 22%, was one of the fund’s leading contributors to performance for the six months.
Long-term performance should always be your focus
After one of the most volatile periods on record, the U.S. financial markets began to rally in March 2009 and stocks made a dramatic comeback. Although stocks have continued to post healthy gains, it’s impossible to know for sure whether the market will continue to climb.
While we can’t control what happens in the financial markets, we can control how we invest our hard-earned money. That’s why, at Vanguard, we urge investors to create and stick with an investment plan that includes a mix of stocks, bonds, and short-term investments that is appropriate for their long-term goals and risk tolerance. Such a well-balanced portfolio can offer some protection during a down market, while also providing an opportunity for long-term growth.
At the end of June, James G. Reilly, an AllianceBernstein portfolio manager who oversees a portion of Vanguard U.S. Growth Fund, plans to retire. We thank Jim for his dedication to the fund’s shareholders. We remain confident that the fund's low-cost, research-intensive approach to large-cap growth stocks can play a useful role in a portfolio.
On another matter, I would like to inform you that as of January 1, 2010, we completed a leadership transition that began in March 2008. I succeeded Jack Brennan as chairman of Vanguard and each of the funds. Jack has agreed to serve as chairman emeritus and senior advisor. Under Jack’s leadership, Vanguard has grown to become a preeminent firm in the mutual fund industry. Jack’s energy, his relentless pursuit of perfection, and his unwavering focus on always doing the right thing for our clients are evident in every facet of Vanguard policy today.
As always, thank you for entrusting your assets to Vanguard.
Sincerely,

F. William McNabb III
Chairman and Chief Executive Officer
March 11, 2010
5
Advisors’ Report
For the half-year ended February 28, 2010, Vanguard U.S. Growth Fund returned 8.38% for Investor Shares and 8.49% for the lower-cost Admiral Shares. Your fund is managed by two independent advisors, a strategy that enhances the fund’s diversification by providing exposure to distinct, yet complementary, investment approaches. It’s not uncommon for different advisors to have different views about individual securities or the broader investment environment.
The table below lists the advisors, the amount and percentage of fund assets each manages, and brief descriptions of their investment strategies. The advisors have provided the following assessment of the investment environment during the past six months and the notable successes and shortfalls in their portfolios. These comments were prepared on March 16, 2010.
AllianceBernstein L.P.
Portfolio Managers:
James G. Reilly, Executive Vice President
P. Scott Wallace, CFA, Senior Vice President
For the six months ended February 28, U.S. equities gained amid gradually growing investor confidence that an economic recovery was under way. Increased merger-and-acquisition activity also boosted investor sentiment. Growth outperformed value during the reporting period, as investors began to show a more
| | | |
| Vanguard U.S. Growth Fund Investment Advisors | |
| |
| | Fund Assets Managed | |
| Investment Advisor | % | $ Million | Investment Strategy |
| AllianceBernstein L.P. | 66 | 2,581 | Uses a fundamentally based, research-driven approach |
| | | | to large-capitalization growth investing. The advisor |
| | | | seeks to build a diversified portfolio of successful, |
| | | | well-managed companies with sustainable competitive |
| | | | advantages and superior prospects for growth not fully |
| | | | reflected in relative valuation. |
| William Blair & Company, LLC | 31 | 1,228 | Uses a fundamental investment approach in pursuit of |
| | | | superior long-term investment results from |
| | | | growth-oriented companies with leadership positions |
| | | | and strong market presence. |
| Cash Investments | 3 | 106 | These short-term reserves are invested by Vanguard in |
| | | | equity index products to simulate investment in stocks. |
| | | | Each advisor may also maintain a modest cash |
| | | | position. |
6
discriminating attitude toward risk, unlike most of 2009, when investors arbitrarily embraced stocks that had sold off more precipitously during the downturn.
We expect investor discrimination to increase going forward, as the market’s attention increasingly shifts to companies with strong growth prospects built on solid fundamentals, precisely the type of investments that we seek. Meanwhile, a number of important market and economic dynamics appear to favor the higher-quality growth stocks that we emphasize in our portfolios.
The extraordinarily low interest rates that have accompanied the recession have muted the importance of strong balance sheets. As interest rates inevitably rise, companies with weaker balance sheets are likely to become less appealing to investors. This could favor large, stable growth companies and our less-leveraged portfolio.
The portfolio’s underperformance during the reporting period can largely be attributed to our positions in JPMorgan Chase and Goldman Sachs, our two largest holdings in financials, as continued market anxiety caused short-term performance volatility. We remain committed to these holdings, relying on our research for a longer-term perspective. Both have strong capital ratios that are well above required levels. They are gaining share in key market segments, and their credit picture is improving. Their valuations relative to book value are very attractive, and they have consistently beaten earnings expectations. Return on equity has been strong and is expected to continue improving.
Nonetheless, their stock prices have recently taken a hit. There’s no question that talk of regulatory reform raises broad uncertainty in the industry, but these are key players that should overcome difficulties resulting from reform efforts. Yet investors are pricing in exaggerated risk, in our view. If the pattern with health care, the portfolio’s largest contributor for the reporting period, is any indication, these stocks stand to come back strongly once the uncertainty over the impact of federal regulation begins to subside and investors again focus on fundamentals.
Overall, we believe that superior growth fundamentals will reap superior rewards over time, and that the portfolio is well positioned to take advantage of the opportunity that exists for growth. Our positioning is well supported by our research, and we expect to be ultimately rewarded as the cycle continues.
William Blair & Company, L.L.C.
Portfolio Manager:
John F. Jostrand, CFA, Principal
As the economic recovery continued, U.S. equity markets rose substantially in the last six months, as demonstrated by the Russell 1000 Growth Index’s return of 11.3%. Performance was volatile, and all of the gains occurred in 2009. Given the massive government intervention in the global economy, stock movements, particularly early in this period, were
7
driven by more macroeconomic factors as investors turned to stocks that were heavily sold early in 2009.
In 2010, some investors took profits amid concerns about the sustainability of the economic recovery, the potential for rising interest rates, and sovereign debt issues. The Russell 1000 Growth’s return for the first two months in 2010 was –1.1%.
For the six-month period, growth stocks outperformed value stocks and mid-capitalization stocks were notably stronger than larger-cap stocks.
In this environment, our portion of the portfolio had strong absolute returns, but trailed its benchmark. There were stock-specific issues with CVS Caremark and Qualcomm, two larger positions at the beginning of the period. CVS Caremark fell as a result of integration issues in its pharmacy benefit manager division. Early this year, we eliminated the stock to take advantage of other opportunities we felt more strongly about. Qualcomm declined because of a disappointing outlook for revenue growth resulting from a lower average selling price estimate for mobile handsets. We continue to believe that the company will have strong earnings power going forward.
In addition, the portfolio remains overweighted in the technology sector; these companies have strong balance sheets with large cash reserves and productivity-enhancing product offerings, which should benefit from increased demand in an improving economy.
The portfolio benefited from strong selection in industrials, particularly positions in Rockwell Automation and J.B. Hunt Transport Services. Both stocks had solid earnings results and are well positioned to take advantage of improved demand and increased volumes as the economy recovers. We added to select industrial companies during the period based on their earnings growth potential and relative valuation, increasing our emphasis on the sector in comparison with the benchmark weighting.
Our energy stocks also contributed nicely. EOG Resources and Apache, for example, each had strong earnings reports. Tighter crude oil supply and demand, improved global and U.S. economic growth, and continued strength in broader markets should be positive news for energy stocks.
In 2010, we believe investors will focus on a company’s ability to increase its earnings through a revival in sales, rather than on earnings that grow because of cost cutting or macroeconomic factors. This environment should favor stock pickers. Our quality growth investment process should assist us in identifying industry-leading companies with competitive products and services, durable business models, compelling earnings profiles, and strong financial positions.
8
U.S. Growth Fund
Fund Profile
As of February 28, 2010
| | |
| Share-Class Characteristics | | |
| | Investor | Admiral |
| | Shares | Shares |
| Ticker Symbol | VWUSX | VWUAX |
| Expense Ratio1 | 0.49% | 0.30% |
| 30-Day SEC Yield | 0.54% | 0.73% |
| | | |
| Portfolio Characteristics | | |
| | | Russell | DJ |
| | | 1000 | U.S. Total |
| | | Growth | Market |
| | Fund | Index | Index |
| Number of Stocks | 79 | 623 | 4,178 |
| Median Market Cap $47.8B | $38.6B | $29.9B |
| Price/Earnings Ratio | 20.2x | 19.1x | 21.5x |
| Price/Book Ratio | 2.7x | 3.5x | 2.1x |
| Return on Equity | 22.4% | 24.5% | 19.3% |
| Earnings Growth Rate 17.5% | 14.8% | 7.8% |
| Dividend Yield | 1.1% | 1.6% | 1.8% |
| Foreign Holdings | 4.5% | 0.0% | 0.0% |
| Turnover Rate | | | |
| (Annualized) | 78% | — | — |
| Short-Term Reserves | 0.7% | — | — |
| | | |
| Sector Diversification (% of equity exposure) |
| | | Russell | DJ |
| | | 1000 | U.S. Total |
| | | Growth | Market |
| | Fund | Index | Index |
| Consumer | | | |
| Discretionary | 10.2% | 10.7% | 10.7% |
| Consumer Staples | 5.9 | 16.2 | 10.1 |
| Energy | 8.0 | 4.1 | 10.4 |
| Financials | 12.4 | 5.0 | 16.8 |
| Health Care | 16.7 | 16.3 | 12.7 |
| Industrials | 11.7 | 10.4 | 10.7 |
| Information | | | |
| Technology | 31.2 | 32.0 | 18.4 |
| Materials | 3.7 | 3.8 | 3.9 |
| Telecommunication | | | |
| Services | 0.1 | 0.6 | 2.7 |
| Utilities | 0.1 | 0.9 | 3.6 |
| | |
| Volatility Measures | | |
| | | DJ |
| | | U.S. Total |
| | Russell 1000 | Market |
| | Growth Index | Index |
| R-Squared | 0.97 | 0.93 |
| Beta | 0.96 | 0.92 |
These measures show the degree and timing of the fund’s fluctuations compared with the indexes over 36 months.
| | |
| Ten Largest Holdings (% of total net assets) |
| Apple Inc. | Computer | |
| | Hardware | 6.1% |
| Google Inc. Class A | Internet Software & | |
| | Services | 5.5 |
| Alcon Inc. | Health Care | |
| | Supplies | 3.7 |
| Microsoft Corp. | Systems Software | 3.6 |
| Hewlett-Packard Co. | Computer | |
| | Hardware | 3.5 |
| JPMorgan Chase & Co. | Diversified Financial | |
| | Services | 3.4 |
| Schlumberger Ltd. | Oil & Gas | |
| | Equipment & | |
| | Services | 3.3 |
| Goldman Sachs Group | Investment Banking | |
| Inc. | & Brokerage | 3.3 |
| Gilead Sciences Inc. | Biotechnology | 3.0 |
| Intel Corp. | Semiconductors | 2.6 |
| Top Ten | | 38.0% |
The holdings listed exclude any temporary cash investments and equity index products.
Investment Focus

1 The expense ratios shown are from the prospectus dated December 28, 2009, and represent estimated costs for the current fiscal year based on the fund’s net assets as of the prospectus date. For the six months ended February 28, 2010, the annualized expense ratios were 0.48% for Investor Shares and 0.29% for Admiral Shares.
9
U.S. Growth Fund
Performance Summary
All of the returns in this report represent past performance, which is not a guarantee of future results that may be achieved by the fund. (Current performance may be lower or higher than the performance data cited. For performance data current to the most recent month-end, visit our website at www.vanguard.com/performance.) Note, too, that both investment returns and principal value can fluctuate widely, so an investor’s shares, when sold, could be worth more or less than their original cost. The returns shown do not reflect taxes that a shareholder would pay on fund distributions or on the sale of fund shares.
Fiscal-Year Total Returns (%): August 31, 1999, Through February 28, 2010
Average Annual Total Returns: Periods Ended December 31, 2009
This table presents average annual total returns through the latest calendar quarter—rather than through the end of
the fiscal period. Securities and Exchange Commission rules require that we provide this information.
| | | | |
| | Inception | One | Five | Ten |
| | Date | Year | Years | Years |
| Investor Shares | 1/6/1959 | 34.95% | 0.90% | -6.81% |
| Admiral Shares | 8/13/2001 | 35.14 | 1.10 | -1.241 |
| 1 Return since inception. | | | | |
Vanguard fund total returns do not include any transaction or account fees that applied in the periods shown. Fund prospectuses provide information about current fees.
See Financial Highlights for dividend and capital gains information.
10
U.S. Growth Fund
Financial Statements (unaudited)
Statement of Net Assets
As of February 28, 2010
The fund reports a complete list of its holdings in regulatory filings four times in each fiscal year, at the quarter-ends. For the second and fourth fiscal quarters, the lists appear in the fund’s semiannual and annual reports to shareholders. For the first and third fiscal quarters, the fund files the lists with the Securities and Exchange Commission on Form N-Q. Shareholders can look up the fund’s Forms N-Q on the SEC’s website at www.sec.gov. Forms N-Q may also be reviewed and copied at the SEC’s Public Reference Room (see the back cover of this report for further information).
| | | |
| | | | Market |
| | | | Value• |
| | | Shares | ($000) |
| Common Stocks (96.9%)1 | | |
| Consumer Discretionary (9.8%) | |
| * | Kohl’s Corp. | 1,598,791 | 86,047 |
| | Johnson Controls Inc. | 2,270,700 | 70,619 |
| | Target Corp. | 960,200 | 49,469 |
| * | Ford Motor Co. | 2,660,300 | 31,232 |
| | McDonald’s Corp. | 452,915 | 28,919 |
| * | O’Reilly Automotive Inc. | 653,500 | 25,682 |
| | Comcast Corp. Class A | 1,388,900 | 22,833 |
| * | Discovery | | |
| | Communications Inc. | | |
| | Class A | 714,000 | 22,241 |
| | Yum! Brands Inc. | 585,000 | 19,726 |
| | Walt Disney Co. | 385,300 | 12,037 |
| * | Hyatt Hotels Corp. Class A | 327,600 | 10,952 |
| | Home Depot Inc. | 166,600 | 5,198 |
| | | | 384,955 |
| Consumer Staples (5.6%) | | |
| | PepsiCo Inc. | 1,437,400 | 89,794 |
| | Costco Wholesale Corp. | 896,300 | 54,648 |
| | Colgate-Palmolive Co. | 377,200 | 31,285 |
| | Mead Johnson Nutrition Co. | 286,300 | 13,542 |
| | CVS Caremark Corp. | 290,000 | 9,788 |
| * | Anheuser-Busch InBev | | |
| | NV ADR | 195,900 | 9,785 |
| | Philip Morris | | |
| | International Inc. | 114,500 | 5,608 |
| | Wal-Mart Stores Inc. | 95,900 | 5,185 |
| | | | 219,635 |
| Energy (7.7%) | | |
| | Schlumberger Ltd. | 2,133,770 | 130,373 |
| | Noble Energy Inc. | 619,300 | 44,986 |
| * | Cameron International Corp. | 932,940 | 38,372 |
| | Occidental Petroleum Corp. | 356,800 | 28,490 |
| | EOG Resources Inc. | 265,740 | 24,993 |
| | Suncor Energy Inc. | 594,400 | 17,184 |
| | Apache Corp. | 153,550 | 15,914 |
| | | | 300,312 |
| | | |
| | | | Market |
| | | | Value• |
| | | Shares | ($000) |
| Exchange-Traded Fund (0.0%) | | |
| 2 | Vanguard Growth ETF | 3,100 | 163 |
| |
| Financials (11.8%) | | |
| | JPMorgan Chase & Co. | 3,147,100 | 132,084 |
| | Goldman Sachs Group Inc. | 820,600 | 128,301 |
| | Franklin Resources Inc. | 487,000 | 49,537 |
| | Bank of America Corp. | 2,947,100 | 49,099 |
| | CME Group Inc. | 150,750 | 45,480 |
| | Credit Suisse Group | | |
| | AG ADR | 609,400 | 27,179 |
| | Invesco Ltd. | 1,198,200 | 23,485 |
| | Principal Financial | | |
| | Group Inc. | 373,300 | 8,664 |
| | | | 463,829 |
| Health Care (16.3%) | | |
| | Alcon Inc. | 905,480 | 144,623 |
| * | Gilead Sciences Inc. | 2,425,840 | 115,494 |
| | Baxter International Inc. | 1,610,000 | 91,657 |
| | Teva Pharmaceutical | | |
| | Industries Ltd. ADR | 1,124,760 | 67,497 |
| * | Celgene Corp. | 994,360 | 59,184 |
| * | Thermo Fisher | | |
| | Scientific Inc. | 851,575 | 41,531 |
| * | Medco Health | | |
| | Solutions Inc. | 585,400 | 37,021 |
| | Covidien PLC | 711,400 | 34,944 |
| * | Vertex | | |
| | Pharmaceuticals Inc. | 519,800 | 21,109 |
| | Allergan Inc. | 325,235 | 19,004 |
| * | Cerner Corp. | 76,900 | 6,379 |
| | | | 638,443 |
| Industrials (11.4%) | | |
| | Danaher Corp. | 1,211,615 | 89,623 |
| | Illinois Tool Works Inc. | 1,586,200 | 72,204 |
| | United Parcel Service Inc. | | |
| | Class B | 741,900 | 43,579 |
| | Cooper Industries PLC | 915,000 | 41,504 |
| | Dover Corp. | 752,400 | 34,054 |
| | Rockwell Automation Inc. | 613,500 | 33,184 |
11
| | | |
| U.S. Growth Fund | | |
| |
| |
| |
| | | | Market |
| | | | Value• |
| | | Shares | ($000) |
| | Goodrich Corp. | 419,000 | 27,499 |
| | WW Grainger Inc. | 262,400 | 26,673 |
| | JB Hunt Transport | | |
| | Services Inc. | 620,310 | 22,009 |
| | Roper Industries Inc. | 355,090 | 19,686 |
| * | Vestas Wind Systems | | |
| | A/S ADR | 948,700 | 15,663 |
| | Manpower Inc. | 228,000 | 11,747 |
| | FedEx Corp. | 96,800 | 8,205 |
| | | | 445,630 |
| Information Technology (30.7%) | |
| * | Apple Inc. | 1,160,206 | 237,401 |
| * | Google Inc. Class A | 411,145 | 216,591 |
| | Microsoft Corp. | 4,852,625 | 139,076 |
| | Hewlett-Packard Co. | 2,686,400 | 136,442 |
| | Intel Corp. | 4,937,710 | 101,371 |
| * | EMC Corp. | 4,764,200 | 83,326 |
| | QUALCOMM Inc. | 2,116,995 | 77,673 |
| | Broadcom Corp. Class A | 1,858,200 | 58,199 |
| * | Cisco Systems Inc. | 1,948,080 | 47,397 |
| | KLA-Tencor Corp. | 970,900 | 28,282 |
| * | McAfee Inc. | 611,600 | 24,275 |
| * | eBay Inc. | 1,037,200 | 23,876 |
| | Amphenol Corp. Class A | 435,800 | 18,151 |
| * | Research In Motion Ltd. | 150,500 | 10,668 |
| | | | 1,202,728 |
| Materials (3.6%) | | |
| | Freeport-McMoRan | | |
| | Copper & Gold Inc. | 696,475 | 52,347 |
| | Praxair Inc. | 402,240 | 30,224 |
| ^ | ArcelorMittal | 576,500 | 22,034 |
| | Dow Chemical Co. | 630,800 | 17,858 |
| | Air Products & | | |
| | Chemicals Inc. | 191,630 | 13,142 |
| | Vale SA Class B ADR | 158,700 | 4,422 |
| | | | 140,027 |
| Total Common Stocks | | |
| (Cost $3,630,757) | | 3,795,722 |
| | |
| | | Market |
| | | Value• |
| | Shares | ($000) |
| Temporary Cash Investments (3.8%)1 | |
| Money Market Fund (3.3%) | |
| 3,4 Vanguard Market | | |
| Liquidity Fund, | | |
| 0.163% | 130,330,265 | 130,330 |
| |
| | Face | |
| | Amount | |
| | ($000) | |
| U.S. Government and Agency Obligations (0.5%) |
| 5,6 Freddie Mac | | |
| Discount Notes, | | |
| 0.245%, 9/21/10 | 18,000 | 17,978 |
| Total Temporary Cash Investments | |
| (Cost $148,306) | | 148,308 |
| Total Investments (100.7%) | |
| (Cost $3,779,063) | | 3,944,030 |
| Other Assets and Liabilities (-0.7%) | |
| Other Assets | | 42,033 |
| Liabilities4 | | (71,333) |
| | | (29,300) |
| Net Assets (100%) | | 3,914,730 |
12
U.S. Growth Fund
| |
| At February 28, 2010, net assets consisted of: |
| | Amount |
| | ($000) |
| Paid-in Capital | 10,310,562 |
| Overdistributed Net Investment Income | (10,063) |
| Accumulated Net Realized Losses | (6,552,176) |
| Unrealized Appreciation (Depreciation) | |
| Investment Securities | 164,967 |
| Futures Contracts | 1,440 |
| Net Assets | 3,914,730 |
| |
| Investor Shares—Net Assets | |
| Applicable to 192,970,948 outstanding | |
| $.001 par value shares of beneficial | |
| interest (unlimited authorization) | 3,084,675 |
| Net Asset Value Per Share— | |
| Investor Shares | $15.99 |
| |
| Admiral Shares—Net Assets | |
| Applicable to 20,056,179 outstanding | |
| $.001 par value shares of beneficial | |
| interest (unlimited authorization) | 830,055 |
| Net Asset Value Per Share— | |
| Admiral Shares | $41.39 |
• See Note A in Notes to Financial Statements.
* Non-income-producing security.
^ Part of security position is on loan to broker-dealers. The total value of securities on loan is $18,827,000.
1 The fund invests a portion of its cash reserves in equity markets through the use of index futures contracts. After giving effect to futures investments, the fund’s effective common stock and temporary cash investment positions represent 99.6% and 1.1%, respectively, of net assets.
2 Considered an affiliated company of the fund as the issuer is another member of The Vanguard Group.
3 Affiliated money market fund available only to Vanguard funds and certain trusts and accounts managed by Vanguard. Rate shown is the 7-day yield.
4 Includes $19,704,000 of collateral received for securities on loan.
5 The issuer operates under a congressional charter; its securities are not backed by the full faith and credit of the U.S. government.
6 Securities with a value of $17,978,000 have been segregated as initial margin for open futures contracts.
ADR—American Depositary Receipt.
See accompanying Notes, which are an integral part of the Financial Statements.
13
| |
| U.S. Growth Fund | |
| |
| |
| Statement of Operations | |
| |
| | Six Months Ended |
| | February 28, 2010 |
| | ($000) |
| Investment Income | |
| Income | |
| Dividends1 | 22,024 |
| Interest1 | 141 |
| Security Lending | 227 |
| Total Income | 22,392 |
| Expenses | |
| Investment Advisory Fees—Note B | |
| Basic Fee | 3,217 |
| Performance Adjustment | (454) |
| The Vanguard Group—Note C | |
| Management and Administrati ve—Investor Shares | 4,984 |
| Management and Administrati ve—Admiral Shares | 553 |
| Marketing and Distribution& #151;Investor Shares | 263 |
| Marketing and Distribution& #151;Admiral Shares | 73 |
| Custodian Fees | 27 |
| Shareholders’ Reports—Investor Shares | 24 |
| Shareholders’ Reports—Admiral Shares | 9 |
| Trustees’ Fees and Expenses | 5 |
| Total Expenses | 8,701 |
| Expenses Paid Indirectly | (118) |
| Net Expenses | 8,583 |
| Net Investment Income | 13,809 |
| Realized Net Gain (Loss) | |
| Investment Securities Sold1 | 153,685 |
| Futures Contracts | 18,107 |
| Realized Net Gain (Loss) | 171,792 |
| Change in Unrealized Appreciation (Depreciation) | |
| Investment Securities | 139,303 |
| Futures Contracts | (6,253) |
| Change in Unrealized Appreciation (Depreciation) | 133,050 |
| Net Increase (Decrease) in Net Assets Resulting from Operations | 318,651 |
| 1 | Dividend income, interest income, and realized net gain (loss) from affiliated companies of the fund were $1,000, $116,000, and $0, respectively. |
See accompanying Notes, which are an integral part of the Financial Statements.
14
| | |
| U.S. Growth Fund | | |
| |
| |
| Statement of Changes in Net Assets | | |
| |
| | Six Months Ended | Year Ended |
| | February 28, | August 31, |
| | 2010 | 2009 |
| | ($000) | ($000) |
| Increase (Decrease) in Net Assets | | |
| Operations | | |
| Net Investment Income | 13,809 | 28,907 |
| Realized Net Gain (Loss) | 171,792 | (587,511) |
| Change in Unrealized Appreciation (Depreciation) | 133,050 | (226,088) |
| Net Increase (Decrease) in Net Assets Resulting from Operations | 318,651 | (784,692) |
| Distributions | | |
| Net Investment Income | | |
| Investor Shares | (16,650) | (23,339) |
| Admiral Shares | (6,066) | (8,835) |
| Realized Capital Gain | | |
| Investor Shares | — | — |
| Admiral Shares | — | — |
| Total Distributions | (22,716) | (32,174) |
| Capital Share Transactions | | |
| Investor Shares | (101,682) | (65,408) |
| Admiral Shares | (72,906) | (77,153) |
| Net Increase (Decrease) from Capital Share Transactions | (174,588) | (142,561) |
| Total Increase (Decrease) | 121,347 | (959,427) |
| Net Assets | | |
| Beginning of Period | 3,793,383 | 4,752,810 |
| End of Period1 | 3,914,730 | 3,793,383 |
1 Net Assets—End of Period includes undistributed (overdistributed) net investment income of ($10,063,000) and ($1,156,000).
See accompanying Notes, which are an integral part of the Financial Statements.
15
| | | | | | | |
| U.S. Growth Fund | | | | | | | |
| |
| |
| Financial Highlights | | | | | | |
| |
| |
| Investor Shares | | | | | | | |
| | Six Months | | | | | |
| | | Ended | | | | | |
| For a Share Outstanding | February 28, | | | | Year Ended August 31, |
| Throughout Each Period | | 2010 | 2009 | 2008 | 2007 | 2006 | 2005 |
| Net Asset Value, Beginning of Period | $14.83 | $17.89 | $19.44 | $17.06 | $16.77 | $14.39 |
| Investment Operations | | | | | | | |
| Net Investment Income | | .052 | .105 | .089 | .113 | .059 | .040 |
| Net Realized and Unrealized Gain (Loss) | | | | | | |
| on Investments | | 1.194 | (3.049) | (1.523) | 2.354 | .266 | 2.385 |
| Total from Investment Operations | 1.246 | (2.944) | (1.434) | 2.467 | .325 | 2.425 |
| Distributions | | | | | | | |
| Dividends from Net Investment Income | (.086) | (.116) | (.116) | (.087) | (.035) | (.045) |
| Distributions from Realized Capital Gains | — | — | — | — | — | — |
| Total Distributions | | (.086) | (.116) | (.116) | (.087) | (.035) | (.045) |
| Net Asset Value, End of Period | | $15.99 | $14.83 | $17.89 | $19.44 | $17.06 | $16.77 |
| |
| Total Return1 | | 8.38% | -16.29% | -7.44% | 14.50% | 1.93% | 16.86% |
| |
| Ratios/Supplemental Data | | | | | | | |
| Net Assets, End of Period (Millions) | $3,085 | $2,956 | $3,637 | $4,308 | $4,530 | $4,848 |
| Ratio of Total Expenses to | | | | | | | |
| Average Net Assets2 | | 0.48%3 | 0.49% | 0.43% | 0.50% | 0.58% | 0.55% |
| Ratio of Net Investment Income to | | | | | | |
| Average Net Assets | | 0.66%3 | 0.79% | 0.47% | 0.60% | 0.34% | 0.30% |
| Portfolio Turnover Rate | | 78%3 | 101% | 107% | 51% | 48% | 38% |
1 Total returns do not include the account service fee that may be applicable to certain accounts with balances below $10,000.
2 Includes performance-based investment advisory fee increases (decreases) of (0.02%), (0.03%), (0.03%), (0.01%), 0.02%, and (0.02%).
3 Annualized.
See accompanying Notes, which are an integral part of the Financial Statements.
16
| | | | | | | |
| U.S. Growth Fund | | | | | | | |
| |
| |
| Financial Highlights | | | | | | |
| |
| |
| Admiral Shares | | | | | | | |
| | Six Months | | | | | |
| | | Ended | | | | | |
| For a Share Outstanding | February 28, | | | | Year Ended August 31, |
| Throughout Each Period | | 2010 | 2009 | 2008 | 2007 | 2006 | 2005 |
| Net Asset Value, Beginning of Period | $38.41 | $46.37 | $50.42 | $44.24 | $43.47 | $37.29 |
| Investment Operations | | | | | | | |
| Net Investment Income | | .175 | .335 | .325 | .416 | .271 | .226 |
| Net Realized and Unrealized Gain (Loss) | | | | | | |
| on Investments | | 3.097 | (7.919) | (3.950) | 6.107 | .677 | 6.163 |
| Total from Investment Operations | 3.272 | (7.584) | (3.625) | 6.523 | .948 | 6.389 |
| Distributions | | | | | | | |
| Dividends from Net Investment Income | (.292) | (.376) | (.425) | (.343) | (.178) | (.209) |
| Distributions from Realized Capital Gains | — | — | — | — | — | — |
| Total Distributions | | (.292) | (.376) | (.425) | (.343) | (.178) | (.209) |
| Net Asset Value, End of Period | | $41.39 | $38.41 | $46.37 | $50.42 | $44.24 | $43.47 |
| |
| Total Return | | 8.49% | -16.15% | -7.28% | 14.80% | 2.16% | 17.16% |
| |
| Ratios/Supplemental Data | | | | | | | |
| Net Assets, End of Period (Millions) | $830 | $838 | $1,116 | $1,325 | $1,262 | $1,012 |
| Ratio of Total Expenses to | | | | | | | |
| Average Net Assets1 | | 0.29%2 | 0.30% | 0.24% | 0.27% | 0.34% | 0.32% |
| Ratio of Net Investment Income to | | | | | | |
| Average Net Assets | | 0.85%2 | 0.98% | 0.66% | 0.83% | 0.58% | 0.53% |
| Portfolio Turnover Rate | | 78%2 | 101% | 107% | 51% | 48% | 38% |
1 Includes performance-based investment advisory fee increases (decreases) of (0.02%), (0.03%), (0.03% ), (0.01%), 0.02%, and (0.02%).
2 Annualized.
See accompanying Notes, which are an integral part of the Financial Statements.
17
U.S. Growth Fund
Notes to Financial Statements
Vanguard U.S. Growth Fund is registered under the Investment Company Act of 1940 as an open-end investment company, or mutual fund. The fund offers two classes of shares, Investor Shares and
Admiral Shares. Investor Shares are available to any investor who meets the fund’s minimum purchase requirements. Admiral Shares are designed for investors who meet certain administrative, service, tenure, and account-size criteria.
A. The following significant accounting policies conform to generally accepted accounting principles for U.S. mutual funds. The fund consistently follows such policies in preparing its financial statements.
1. Security Valuation: Securities are valued as of the close of trading on the New York Stock Exchange (generally 4 p.m., Eastern time) on the valuation date. Equity securities are valued at the latest quoted sales prices or official closing prices taken from the primary market in which each security trades; such securities not traded on the valuation date are value d at the mean of the latest quoted bid and asked prices. Securities for which market quotations are not re adily available, or whose values have been materially affected by events occurring before the fund’s pricing time but after the close of the securities’ primary markets, are valued by methods deemed by the board of trustees to represent fair value. Investments in Vanguard Market Liquidity Fund are valued at that fund’s net asset value.
Temporary cash investments acquired over 60 days to maturity are valued using the latest bid prices or using valuations based on a matrix system (which considers such factors as security prices, yields, maturities, and ratings), both as furnished by independent pricing services. Other temporary cash investments are valued at amortized cost, which approximates market value.
2. Futures Contracts: The fund uses index futures contracts to a limited extent, with the objective of maintaining full exposure to the stock market while maintaining liquidity. The fund may purchase or sell futures contracts to achieve a desired level of investment, whether to accommodate portfolio turnover or cash flows from capital share transactions. The primary risks associated with the use of futures contracts are imperfect correlation between changes in market va lues of stocks held by the fund and the prices of futures contracts, and the possibility of an illiquid market.
Futures contracts are valued at their quoted daily settlement prices. The aggregate principal amounts of the contracts are not recorded in the Statement of Net Assets. Fluctuations in the value of the contracts are recorded in the Statement of Net Assets as an asset (liability) and in the Statement of Operations as unrealized appreciation (depreciation) until the contracts are closed, when they are recorded as realized futures gains (losses).
3. Federal Income Taxes: The fund intends to continue to qualify as a regulated investment company and distribute all of its taxable income. Management has analyzed the fund’s tax positions taken for all open federal income tax years (August 31, 2006–2009), and for the period ended February 28, 201 0, and has concluded that no prov ision for federal income tax is required in the fund’s financ ial statements.
4. Distributions: Distributions to shareholders are recorded on the ex-dividend date.
5. Security Lending: The fund may lend its securities to qualified institutional borrowers to earn additional income. Security loans are required to be secured at all times by collateral at least equal to the market value of securities loaned. The fund invests cash collateral received in Vanguard Market Liquidity Fund, and records a liability for the return of the collateral, during the period the securities are on loan. Security lending income represents the income earned on investing cash collateral, less expenses associated with the loan.
18
U.S. Growth Fund
6. Other: Dividend income is recorded on the ex-dividend date. Interest income includes income distributions received from Vanguard Market Liquidity Fund and is accrued daily. Security transactions are accounted for on the date securities are bought or sold. Costs used to determine realized gains (losses) on the sale of investment securities are those of the specific securities sold.
Each class of shares has equal rights as to assets and earnings, except that each class separately bears certain class-specific expenses related to maintenance of shareholder accounts (included in Management and Administrative expenses) and shareholder reporting. Marketing an d distribution expenses are alloc ated to each class of shares base d on a method approved by the board of trustees. Income, other non-class-specific expenses, and gains and losses on investments are allocated to each class of shares based on its relative net assets.
B. AllianceBernstein L.P. and William Blair & Company, L.L.C., each provide investment advisory services to a portion of the fund for a fee calculated at an annual percentage rate of average net assets managed by the advisor. The basic fees are subject to quarterly adjustments based on performance relative to the Russell 1000 Growth Index over the preceding three years for AllianceBernstein and over the preceding five years for William Blair & Company.
The Vanguard Group manages the cash reserves of the fund on an at-cost basis.
For the six months ended February 28, 2010, the aggregate investment advisory fee represented an effective annual basic rate of 0.16% of the fund’s average net assets, before a decrease of $454,000 (0.02%) based on performance.
C. The Vanguard Group furnishes at cost corporate management, administrative, marketing, and distribution services. The costs of such services are allocated to the fund under methods approved by the board of trustees. The fund has committed to provide up to 0.40% of its net assets in capital contributions to Vanguard. At February 28, 2010, the fund had contributed capital of $760,000 to Vanguard (included in Other Assets), representing 0.02% of the fund’s net assets and 0.30% of
Vanguard’s capitalization. The fund’s trustees and officers are also directors and officers of Vanguard.
D. The fund has asked its investment advisors to direct certain security trades, subject to obtaining the best price and execution, to brokers who have agreed to rebate to the fund part of the commissions generated. Such rebates are used solely to reduce the fund’s management and administrative expenses. For the six months ended February 28, 2010, these arrangements reduced the fund’s expenses by $118,000 (an annual rate of 0.01% of average net assets).
E. Various inputs may be used to determine the value of the fund’s investments. These inputs are summarized in three broad levels for financial statement purposes. The inputs or methodologies used to value securities are not necessarily an indication of the risk associated with investing in those securities.
Level 1—Quoted prices in active markets for identical securities.
Level 2—Other significant observable inputs (including quo ted prices for similar securities, interest rates, prepayment speeds, credit risk, etc.).
Level 3—Significant unobservable inputs (including the fund’s own assumptions used to determine the fair value of investments).
19
U.S. Growth Fund
The following table summarizes the fund’s investments as of February 28, 2010, based on the inputs used to value them:
| | | |
| | Level 1 | Level 2 | Level 3 |
| Investments | ($000) | ($000) | ($000) |
| Common Stocks | 3,795,722 | — | — |
| Temporary Cash Investments | 130,330 | 17,978 | — |
| Futures Contracts—Assets1 | 101 | — | — |
| Total | 3,926,153 | 17,978 | — |
| 1 Represents variation margin on the last day of the reporting period. | | | |
F. At February 28, 2010, the aggregate settlement value of open futures contracts and the related unrealized appreciation (depreciation) were:
| | | | |
| | | | | ($000) |
| | | | Aggregate | |
| | | Number of | Settlement | Unrealized |
| | | Long (Short) | Value | Appreciation |
| Futures Contracts | Expiration | Contracts | Long (Short) | (Depreciation) |
| S&P 500 Index | March 2010 | 157 | 43,308 | (86) |
| S&P Mid-Cap 400 Index | March 2010 | 106 | 39,098 | 1,358 |
| E-mini S&P 500 Index | March 2010 | 375 | 20,689 | 168 |
Unrealized appreciation (depreciation) on open futures contracts is required t o be treated as realized gain (loss) for tax purposes.
G. Distributions are determined on a tax basis and may differ from net investment income and realized capital gains for financial reporting purposes. Differences may be permanent or temporary. Permanent differences are reclassified among capital accounts in the financial statements to reflect their tax character. Temporary differences arise when certain items of income, expense, gain, or loss are recognized in different periods for financial statement and tax purposes; these differences will reverse at some time in the future. Differences in classification may also result from the treatment of shor t-term gains as ordinary income for tax purposes.
The fund’s tax-basis capital gains and losses are determined only at the end of each fiscal year. For tax purposes, at August 31, 2009, the fund had available capital loss carryforwards totaling $6,398,578,000 to offset future net capital gains of $2,582,798,000 through August 31, 2010, $2,548,333,000 through August 31, 2011, $887,490,000 through August 31, 2012, $123,651,000 through August 31, 2013, and $256,306,000 through August 31, 2017. In addition, the fund realized losses of $316,709,000 during the period from November 1, 2008, through August 31, 2009, which are deferred and will be treated as realized for tax purposes in fiscal 2010. The fund will use these capital losses to offset net taxable capital gains, if any, realized during the year ending August 31, 2010; should the fund realize net capital losses for the year, the losses will be added to the loss carryforward balances above.
20
U.S. Growth Fund
At February 28, 2010, the cost of investment securities for tax purposes was $3,779,063,000. Net unrealized app reciation of investment securities for tax purposes was $164,967,000, consisting of unrealized gains of $311,613,000 on securities that had risen in value since their purchase and $146,646,000 in unrealized losses on securit ies that had fallen in value since their purchase.
H. During the six months ended February 28, 2010, the fund purchased $1,490,926,000 of investment securities and sold $1,683,583,000 of investment securities, other than temporary cash investments.
I. Capital share transactions for each class of shares were:
| | | | |
| | Six Months Ended | | Year Ended |
| | February 28, 2010 | August 31, 2009 |
| | Amount | Shares | Amount | Shares |
| | ($000) | (000) | ($000) | (000) |
| Investor Shares | | | | |
| Issued | 135,134 | 8,512 | 397,147 | 30,584 |
| Issued in Lieu of Cash Distributions | 16,386 | 988 | 22,922 | 1,941 |
| Redeemed | (253,202) | (15,873) | (485,477) | (36,477) |
| Net Increase (Decrease)—Investor Shares | (101,682) | (6,373) | (65,408) | (3,952) |
| Admiral Shares | | | | |
| Issued | 67,183 | 1,624 | 135,668 | 4,030 |
| Issued in Lieu of Cash Distributions | 5,753 | 134 | 8,303 | 272 |
| Redeemed | (145,842) | (3,512) | (221,124) | (6,551) |
| Net Increase (Decrease)—Admiral Shares | (72,906) | (1,754) | (77,153) | (2,249) |
J. In preparing the financial statements as of February 28, 2010, management considered the impact of subsequent events for potential recognition or disclosure in these financial statements.
21
About Your Fund’s Expenses
As a shareholder of the fund, you incur ongoing costs, which include costs for portfolio management, administrative services, and shareholder reports (like this one), among others. Operating expenses, which are deducted from a fund’s gross income, directly reduce the investment return of the fund.
A fund’s expenses are expressed as a percentage of its average net assets. This figure is known as the expense ratio. The following examples are intended to help you understand the ongoing costs (in dollars) of investing in your fund and to compare these costs with those of other mutual funds. The examples are based on an investment of $1,000 made at the beginning of the period shown and held for the entire period.
The accompanying table illustrates your fund’s costs in two ways:
• Based on actual fund return. This section helps you to estimate the actual expenses that you paid over the period. The ”Ending Account Value“ shown is derived from the fund‘s actual return, and the third column shows the dollar amount that would have been paid by an investor who started with $1,000 in the fund. You may use the information here, together with the amount you invested, to estimate the expenses that you paid over the period.
To do so, simply divide your account value by $1,000 (for example, an $8,600 account value divided by $1,000 = 8.6), then multiply the result by the number given for your fund under the heading ”Expenses Paid During Period.“
• Based on hypothetical 5% yearly return. This section is intended to help you compare your fund‘s costs with those of other mutual funds. It assumes that the fund had a yearly return of 5% before expenses, but that the expense ratio is unchanged. In this case—because the return used is not the fund’s actual return—the results do not apply to your investment. The example is useful in making comparisons because the Securities and Exchange Commission requires all mutual funds to calculate expenses based on a 5% return. You can assess your fund’s costs by comparing this hypothetical example with the hypothetical examples that appear in shareholder reports of other funds.
Note that the expenses shown in the table are meant to highlight and help you compare ongoing costs only and do not reflect transaction costs incurred by the fund for buying and selling securities. Further, the expenses do not include the account service fee described in the prospectus. If such a fee were applied to your account, your costs would be higher. Your fund does not charge transaction fees, such as purchase or redemption fees, nor does it carry a “sales load.” The calculations assume no shares were bought or sold during the period. Your actual costs may have been higher or lower, depending on the amount of your investment and the timing of any purchases or redemptions.
You can find more information about the fund’s expenses, including annual expense ratios, in the Financial Statements section of this report. For additional information on operating expenses and other shareholder costs, please refer to your fund’s current prospectus.
22
| | | |
| Six Months Ended February 28, 2010 | | | |
| | Beginning | Ending | Expenses |
| | Account Value | Account Value | Paid During |
| U.S. Growth Fund | 8/31/2009 | 2/28/2010 | Period |
| Based on Actual Fund Return | | | |
| Investor Shares | $1,000.00 | $1,083.81 | $2.48 |
| Admiral Shares | 1,000.00 | 1,084.92 | 1.50 |
| Based on Hypothetical 5% Yearly Return | | | |
| Investor Shares | $1,000.00 | $1,022.41 | $2.41 |
| Admiral Shares | 1,000.00 | 1,023.36 | 1.45 |
The calculations are based on expenses incurred in the most recent six-month period. The fund’s annualized six-month expense ratios for that period are 0.48% for Investor Shares and 0.29% for Admiral Shares. The dollar amounts shown as “Expenses Paid” are equal to the annualized expense ratio multiplied by the average account value over the period, multiplied by the number of days in the most recent six-month period, then divided by the number of days in the most recent 12-month period.
23
Trustees Approve Advisory Agreements
The board of trustees of Vanguard U.S. Growth Fund has renewed the fund’s investment advisory agreements with AllianceBernstein L.P. and William Blair & Company, L.L.C. The board determined that the retention of these advisors was in the best interests of the fund and its shareholders.
The board based its decision upon an evaluation of each advisor’s investment staff, portfolio management process, and performance. The trustees considered the factors discussed below, among others. However, no single factor determined whether the board approved the agreements. Rather, it was the totality of the circumstances that drove the board’s decision.
Nature, extent, and quality of services
The board considered the quality of the fund’s investment management over both the short and long term and took into account the organizational depth and stability of each advisor. The board noted the following:
AllianceBernstein. Founded in 1971, AllianceBernstein is a leading global investment management firm. The investment team at AllianceBernstein seeks out companies likely to increase earnings faster and/or sustain them longer than consensus estimates. The team defines growth broadly, beyond forecast growth, to be flexible across sectors and company life cycles. The team looks to internal research to identify and evaluate the most attractive investment opportunities, believing that rigorous, insightful analysis is essential to successful long-term performance. AllianceBernstein has managed a portion of the fund since 2001.
William Blair & Co. Founded in 1935, William Blair is an independently owned, full-service investment firm. The firm uses an investment process that relies on thorough in-depth fundamental analysis.
Based on this process, the advisor invests in companies that it believes are of high quality and that have sustainable, above-average growth. In selecting stocks, the advisor considers each company’s leadership position within the market it serves, the quality of products or services it provides, its return on equity, its accounting policies, and the quality of the management team. William Blair has advised a portion of the fund since 2004.
The board concluded that each advisor’s experience, stability, depth, and performance, among other factors, warranted continuation of the advisory agreements.
Investment performance
The board considered the short- and long-term performance of the fund, including any periods of outperformance or underperformance of a rel evant benchmark and peer group. The board concluded that the advis ors have carried out the fund’s investment strategy in a disciplined fashion, and that the results have been mixed—with periods of outperformance and periods of underperformance versus its benchmark and peer group. Information about the fund’s most recent performance can be found in the Performance Summary section of this report.
Cost
The board concluded that the fund’s expense ratio was well below the average expense ratio charged by funds in its peer group and that the fund’s advisory fee rate was also well below its peer-group average. Information about the fund’s expense ratio appears in the About Your Fund’s Expenses section of this report as well as in the Financial Statements section, which also includes information about the fund’s advisory fee rate.
24
The board did not consider the profitability of the fund’s advisors in determining whether to approve the advisory fees, because the firms are independent of Vanguard, and the advisory fees are the result of arm’s-length negotiations.
The benefit of economies of scale
The board concluded that the fund’s shareholders benefit from economies of scale because of breakpoints in the advisory fee schedules. The breakpoints reduce th e effective rate of the fees as the fund’s assets managed by each firm increase.
The board will consider whether to renew the advisory agreements again after a one-year period.
25
Glossary
30-Day SEC Yield. A fund’s 30-day SEC yield is derived using a formula specified by the U.S. Securities and Exchange Commission. Under the formula, data related to the fund’s security holdings in the previous 30 days are used to calculate the fund’s hypothetical net income for that period, which is then annualized and divided by the fund’s estimated average net assets over the calculation period. For the purposes of this calculation, a security’s income is based on its current market yield to maturity (in the case of bonds) or its projected dividend yield (for stocks). Because the SEC yield represents hypothetical annualized income, it will differ—at times significantly—from the fund’s actual experience. As a result, the fund’s income distributions may be higher or lower than implied by the SEC yield.
Beta. A measure of the magnitude of a fund’s past share-price fluctuations in relation to the ups and downs of a given market index. The index is assigned a beta of 1.00. Compared with a given index, a fund with a beta of 1.20 typically would have seen its share price rise or fall by 12% when the index rose or fell by 10%. For this report, beta is based on returns over the past 36 months for both the fund and the index. Note that a fund’s beta should be reviewed in conjunction with its R-squared (see definition). The lower the R-squared, the less correlation there is between the fund and the index, and the less reliable beta is as an indicator of volatility.
Dividend Yield. Dividend income earned by stocks, expressed as a percentage of the aggregate market value (or of net asset value, for a fund). The yield is determined by dividing the amount of the annual dividends by the aggregate value (or net asset value) at the end of the period. For a fund, the dividend yield is based solely on stock holdings and does not include any income produced by other investments.
Earnings Growth Rate. The average annual rate of growth in earnings over the past five years for the stocks now in a fund.
Equity Exposure. A measure that reflects a fund’s investments in stocks and stock futures. Any holdings in short-term reserves are excluded.
Expense Ratio. The percentage of a fund’s average net assets used to pay its annual administrative and advisory expenses. These expenses directly reduce returns to investors.
Foreign Holdings. The percentage of a fund represented by stocks or depositary receipts of companies based outside the United States.
Inception Date. The date on which the assets of a fund (or one of its share classes) are first invested in accordance with the fund’s investment objective. For funds with a subscription period, the inception date is the day after that period ends. Investment performance is measured from the inception date.
Median Market Cap. An indicator of the size of companies in which a fund invests; the midpoint of market capitalization (market price x shares outstanding) of a fund’s stocks, weighted by the proportion of the fund’s assets invested in each stock. Stocks representing half of the fund’s assets have market capitalizations above the median, and the rest are below it.
Price/Book Ratio. The share price of a stock divided by its net worth, or book value, per share. For a fund, the weighted average price/book ratio of the stocks it holds.
26
Price/Earnings Ratio. The ratio of a stock’s current price to its per-share earnings over the past year. For a fund, the weighted average P/E of the stocks it holds. P/E is an indicator of market expectations about corporate prospects; the higher the P/E, the greater the expectations for a company’s future growth.
R-Squared. A measure of how much of a fund’s past returns can be explained by the returns from the market in general, as measured by a given index. If a fund’s total returns were precisely synchronized with an index’s returns, its R-squared would be 1.00. If the fund’s returns bore no relationship to the index’s returns, its R-squared would be 0. For this report, R-squared is based on returns over the past 36 months for both the fund and the index.
Return on Equity. The annual average rate of return generated by a company during the past five years for each dollar of shareholder’s equity (net income divided by shareholder’s equity). For a fund, the weighted average return on equity for the companies whose stocks it holds.
Short-Term Reserves. The percentage of a fund invested in highly liquid, short-term securities that can be readily converted to cash.
Turnover Rate. An indication of the fund’s trading activity. Funds with high turnover rates incur higher transaction costs and may be more likely to distribute capital gains (which may be taxable to investors). The turnover rate excludes in-kind transactions, which have minimal impact on costs.
27
The People Who Govern Your Fund
The trustees of your mutual fund are there to see that the fund is operated and managed in your best interests since, as a shareholder, you are a part owner of the fund. Your fund’s trustees also serve on the board of directors of The Vanguard Group, Inc., which is owned by the Vanguard funds and provides services to them on an at-cost basis.
A majority of Vanguard’s board members are independent, meaning that they have no affiliation with Vanguard or the funds they oversee, apart from the sizable personal investments they have made as private individuals. The independent board members have distinguished backgrounds in business, academia, and public service. Each of the trustees and executive officers oversees 161 Vanguard funds.
The following table provides information for each trustee and executive officer of the fund. More information about the trustees is in the Statement of Additional Informatio n, which can be obtained, wit hout charge, by contacting Vanguard at 800-662-7447, or online at www.vanguard.com.
| |
| Interested Trustee1 | Rajiv L. Gupta |
| | Born 1945. Trustee Since December 2001.2 Principal |
| F. William McNabb III | Occupation(s) During the Past Five Years: Chairman |
| Born 1957. Trustee Since July 2009. Chairman of the | and Chief Executive Officer (retired 2009) and |
| Board. Principal Occupation(s) During the Past Five | President (2006–2008) of Rohm and Haas Co. |
| Years: Chairman of the Board of The Vanguard Group, | (chemicals); Board Member of American Chemistry |
| Inc., and of each of the investment companies served | Council; Director of Tyco International, Ltd. (diversified |
| by The Vanguard Group, since January 2010; Director | manufacturing and services) and Hewlett-Packard Co. |
| of The Vanguard Group since 2008; Chief Executive | (electronic computer manufacturing); Trustee of The |
| Officer and President of The Vanguard Group and of | Conference Board. |
| each of the investment companies served by The | |
| Vanguard Group since 2008; Director of Vanguard | Amy Gutmann |
| Marketing Corporation; Managing Director of The | Born 1949. Trustee Since June 2006. Principal |
| Vanguard Group (1995–2008). | Occupation(s) During the Past Five Years: President |
| | of the University of Pennsylvania; Christopher H. |
| | Browne Distinguished Professor of Political Science |
| Independent Trustees | in the School of Arts and Sciences with secondary |
| | appointments at the Annenberg School for Commu- |
| Emerson U. Fullwood | nication and the Graduate School of Education of |
| Born 1948. Trustee Since January 2008. Principal | the University of Pennsylvania; Director of Carnegie |
| Occupation(s) During the Past Five Years: Executive | Corporation of New York, Schuylkill River Development |
| Chief Staff and Marketing Officer for North America | Corporation, and Greater Philadelphia Chamber of |
| and Corporate Vice President (retired 2008) of Xerox | Commerce; Trustee of the National Constitution Center. |
| Corporation (documen t management products and | |
| services); Director of SPX Corporation (multi-industry | |
| manufacturing), the United Way of Rochester, the | |
| Boy Scouts of America, Amerigroup Corporation | |
| (managed health care), and Monroe Community | |
| College Foundation. | |
| | |
| JoAnn Heffernan Heisen | Executive Officers | |
| Born 1950. Trustee Since July 1998. Principal | | |
| Occupation(s) During the Past Five Years: Corporate | Thomas J. Higgins | |
| Vice President and Chief Global Diversity Officer since | Born 1957. Chief Financial Officer Since September |
| 2006 (retired 2008) and Member of the Executive | 2008. Principal Occupation(s) During the Past Five |
| Committee (retired 2008) of Johnson & Johnson | Years: Principal of The Vanguard Group, Inc.; Chief |
| (pharmaceuticals/consumer products); Vice President | Financial Officer of each of the investment companies |
| and Chief Information Officer of Johnson & Johnson | served by The Vanguard Group since 2008; Treasurer |
| (1997–2005); Director of the University Medical Center | of each of the investment companies served by The |
| at Princeton and Women’s Research and Education | Vanguard Group (1998–2008). |
| Institute; Member of the Advisory Board of the | | |
| Maxwell School of Citizenship and Public Affairs | Kathryn J. Hyatt | |
| at Syracuse University. | Born 1955. Treasurer Since November 2008. Principal |
| | Occupation(s) During the Past Five Years: Principal |
| F. Joseph Loughrey | of The Vanguard Group, Inc.; Treasurer of each of |
| Born 1949. Trustee Since October 2009. Principal | the investment companies served by The Vanguard |
| Occupation(s) During the Past Five Years: President | Group since 2008; Assistant Treasurer of each of the |
| and Chief Operating Officer since 2005 (retired 2009) | investment companies served by The Vanguard Group |
| and Vice Chairman of the Board (2008–2009) of | (1988–2008). | |
| Cummins Inc. (industrial machinery); Director of | | |
| SKF AB (industrial machinery), Hillenbrand, Inc. | Heidi Stam | |
| (specialized consumer services), Sauer-Danfoss Inc. | Born 1956. Secretary Since July 2005. Principal |
| (machinery), the Lumina Foundation for Education, | Occupation(s) During the Past Five Years: Managing |
| and the Columbus Community Education Coalition; | Director of The Vanguard Group, Inc., since 2006; |
| Chairman of the Advisory Council for the College of | General Counsel of The Vanguard Group since 2005; |
| Arts and Letters at the University of Notre Dame. | Secretary of The Vanguard Group and of each of the |
| | investment companies served by The Vanguard Group |
| André F. Perold | since 2005; Director and Senior Vice President of |
| Born 1952. Trustee Since December 2004. Principal | Vanguard Marketing Corporation since 2005; |
| Occupation(s) During the Past Five Years: George | Principal of The Vanguard Group (1997–2006). |
| Gund Professor of Finance and Banking at the Harvard | | |
| Business School; Chair of the Investment Committee | | |
| of HighVista Strategies LLC (private investment firm). | Vanguard Senior Management Team |
| |
| Alfred M. Rankin, Jr. | R. Gregory Barton | Michael S. Miller |
| Born 1941. Trustee Since January 1993. Principal | Mortimer J. Buckley | James M. Norris |
| Occupation(s) During the Past Five Years: Chairman, | Kathleen C. Gubanich | Glenn W. Reed |
| President, and Chief Executive Officer of NACCO | Paul A. Heller | George U. Sauter |
| Industries, Inc. (forklift trucks/housewares/lignite); | | |
| Director of Goodrich Corporation (industrial products/ | | |
| aircraft systems and services); Deputy Chairman | Chairman Emeritus and Senior Advisor |
| of the Federal Reserve Bank of Cleveland; Trustee | | |
| of University Hospitals of Cleveland, The Cleveland | John J. Brennan | |
| Museum of Art, and Case Western Reserve University. | Chairman, 1996–2009 | |
| | Chief Executive Officer and President, 1996–2008 |
| Peter F. Volanakis | | |
| Born 1955. Trustee Since July 2009. Principal | | |
| Occupation(s) During the Past Five Years: President | Founder | |
| since 2007 and Chief Operating Officer since 2005 | | |
| of Corning Incorporated (communications equipment); | John C. Bogle | |
| President of Corning Technologies (2001–2005); | Chairman and Chief Executive Officer, 1974–1996 |
| Director of Corning Incorporated and Dow Corning; | | |
| Trustee of the Corning Incorporated Foundation and | | |
| the Corning Museum of Glass; Overseer of the | | |
| Amos Tuck School of Business Administration at | | |
| Dartmouth College. | | |
1 Mr. McNabb is considered an “interested person,” as defined in the Investment Company Act of 1940, because he is an officer of the
Vanguard funds.
2 December 2002 for Vanguard Equity Income Fund, Vanguard Growth Equity Fund, the Vanguard Municipal Bond Funds, and the Vanguard
State Tax-Exempt Funds.
| |
|  |
| P.O. Box 2600 |
| Valley Forge, PA 19482-2600 |
Connect with Vanguard® > www.vanguard.com
| Fund Information > 800-662-7447 | |
| CFA® is a trademark owned by CFA Institute. |
| Direct Investor Account Services > 800-662-2739 | |
| |
| Institutional Investor Services > 800-523-1036 | |
| |
| Text Telephone for People | |
| With Hearing Impairment > 800-749-7273 | |
| |
| This material may be used in conjunction | |
| with the offering of shares of any Vanguard | |
| fund only if preceded or accompanied by | |
| the fund’s current prospectus. | |
| |
| All comparative mutual fund data are from Lipper Inc. or | |
| Morningstar, Inc., unless otherwise noted. | |
| |
| You can obtain a free copy of Vanguard’s proxy voting | |
| guidelines by visiting our website, www.vanguard.com, | |
| and searching for “proxy voting guidelines,” or by calling | |
| Vanguard at 800-662-2739. The guidelines are also | |
| available from the SEC’s website, www.sec.gov. In | |
| addition, you may obtain a free report on how your fund | |
| voted the proxies for securities it owned during the 12 | |
| months ended June 30. To get the report, visit either | |
| www.vanguard.com or www.sec.gov. | |
| |
| You can review and copy information about your fund at | |
| the SEC’s Public Reference Room in Washington, D.C. To | |
| find out more about this public service, call the SEC at | |
| 202-551-8090. Information about your fund is also | |
| available on the SEC’s website, and you can receive | |
| copies of this information, for a fee, by sending a | |
| request in either of two ways: via e-mail addressed to | |
| publicinfo@sec.gov or via regular mail addressed to the | |
| Public Reference Section, Securities and Exchange | |
| Commission, Washington, DC 20549-1520. | |

| |
|
| © 2010 The Vanguard Group, Inc. |
| All rights reserved. |
| Vanguard Marketing Corporation, Distributor. |
| | |
| Q232 042010 |
 |
| Vanguard International Growth Fund |
| Semiannual Report |
|
> Vanguard International Growth Fund returned about 5% for the fiscal half-year ended February 28, 2010, ahead of both its benchmark index and the average return of its fund peers.
> International stocks did not keep pace with their domestic counterparts during the period.
> Holdings in emerging markets contributed to the fund’s success, as did strong stock selection, notably in the financials and consumer discretionary sectors.
| |
| Contents | |
| Your Fund’s Total Returns. | 1 |
| Chairman’s Letter. | 2 |
| Advisors’ Report. | 7 |
| Fund Profile. | 12 |
| Performance Summary. | 14 |
| Financial Statements. | 15 |
| About Your Fund’s Expenses. | 29 |
| Trustees Approve Advisory Agreements. | 31 |
| Glossary. | 33 |
Please note: The opinions expressed in this report are just that—informed opinions. They should not be considered promises or advice. Also, please keep in mind that the information and opinions cover the period through the date on the front of this report. Of course, the risks of investing in your fund are spelled out in the prospectus.
See the Glossary for definitions of investment terms used in this report.
Cover photograph: Veronica Coia.
| |
| Your Fund’s Total Returns | |
| |
| |
| |
| |
| Six Months Ended February 28, 2010 | |
| | Total |
| | Returns |
| Vanguard International Growth Fund | |
| Investor Shares | 5.06% |
| Admiral™ Shares | 5.16 |
| MSCI EAFE Index | 0.72 |
| International Funds Average | 2.86 |
| International Funds Average: Derived from data provided by Lipper Inc. | |
Admiral Shares are a lower-cost class of shares available to many longtime shareholders and to those with significant investments in the fund.
| | | | |
| Your Fund’s Performance at a Glance | | | | |
| August 31, 2009 , Through February 28, 2010 | | | | |
| | | | Distributions Per Share |
| | Starting | Ending | Income | Capital |
| | Share Price | Share Price | Dividends | Gains |
| Vanguard International Growth Fund | | | | |
| Investor Shares | $15.73 | $16.25 | $0.286 | $0.000 |
| Admiral Shares | 50.08 | 51.71 | 0.987 | 0.000 |
1

Chairman’s Letter
Dear Shareholder,
For the six months through February 2010, Vanguard International Growth Fund returned about 5%, an unexceptional result compared with the dizzying highs and lows of the previous two years. Although the international stock markets have snapped backed strongly from the global financial crisis, their gains have been restrained recently by the still-fragile nature of the economic recovery.
The fund’s return surpassed both the average return of its peer funds and the return of its market benchmark, the MSCI EAFE Index. Emerging markets, which are not included in the index, drove most of the fund’s gains, but it also recorded solid relative performance in the developed markets of the European and Pacific regions.
Seven of the fund’s ten sectors advanced. Relative to the benchmark, the fund benefited from the advisors’ limited exposure to, and strong stock selection in, the financial sector, one of the period’s weakest areas.
Stock markets caught their breath at the end of a solid six months
For the six months, the broad U.S. stock market returned about 10%. The rally seemed to downshift toward the end of the period, as the relief among investors that had powered markets higher gave way to sober-minded assessment of corporate earnings-growth prospects.
2
Smaller-capitalization stocks did a little better than larger-caps, and growth-oriented securities bested their value-oriented counterparts, but the uniformity of returns from varied market segments was more striking than the differences.
International stocks produced more modest returns. In Europe, the precarious financial health of Greece and smaller economies such as Portugal and Ireland weighed on the markets. In Asia, the Japanese stock market’s weakness held back results for regional indexes. Emerging market stocks continued to outpace those in developed markets.
Yields stayed low, but Fed began to unwind its rescue programs
The yields of longer-term U.S. Treasury bonds rose during the six months, while those of the shortest-term securities remained near 0%. Although the Federal Reserve Board expects to keep its target for short-term interest rates close to zero percent for “an extended period,” it began to wind down credit programs established during the financial crisis.
The Fed’s most dramatic (though largely symbolic) act was to raise the interest rate at its discount window, a lending facility designed to help commercial banks and other depository institutions meet emergency short-term funding needs.
| | | |
| Market Barometer | | | |
| |
| | | | Total Returns |
| | | Periods Ended February 28, 2010 |
| | Six | One | Five Years |
| | Months | Year | (Annualized) |
| Stocks | | | |
| Russell 1000 Index (Large-caps) | 9.91% | 55.32% | 0.77% |
| Russell 2000 Index (Small-caps) | 10.59 | 63.95 | 1.16 |
| Dow Jones U.S. Total Stock Market Index | 10.23 | 56.38 | 1.20 |
| MSCI All Country World Index ex USA (International) | 3.83 | 63.51 | 4.60 |
| |
| Bonds | | | |
| Barclays Capital U.S. Aggregate Bond Index (Broad | | | |
| taxable market) | 3.19% | 9.32% | 5.36% |
| Barclays Capital Municipal Bond Index | 4.13 | 9.98 | 4.50 |
| Citigroup Three-Month U.S. Treasury Bill Index | 0.06 | 0.14 | 2.81 |
| |
| CPI | | | |
| Consumer Price Index | 0.42% | 2.14% | 2.48% |
3
The broad taxable bond market returned 3.19%, with notable strength in corporate bonds. The broad municipal bond market returned 4.13%.
For the fund, a calm half-year follows the drama of 2009
Vanguard International Growth Fund settled into a more pedestrian pace in the first six months of fiscal 2010 following a return of about 56% in the previous half-year. Although international investors’ mood seemed to brighten, several developments tempered their optimism, including debt scares in Dubai and Greece. For U.S.-based investors, the dollar’s six-month climb, while boosting Americans’ purchasing power in most markets abroad, also chipped away at the dollar value of assets denominated in other currencies.
Against this backdrop, the International Growth Fund outperformed its benchmark index and the average return of peer funds. In contrast with the fund’s six-month gain of about 5%, the MSCI EAFE Index returned less than 1% and international funds advanced less than 3% on average.
The fund outperformed the EAFE Index in both Europe and the Pacific region, but gained most of its advantage from emerging markets, which are not a component of the index. The fund’s advisors added to their emerging market
| | | |
| Expense Ratios | | | |
| Your Fund Compared With Its Peer Group | | | |
| | Investor | Admiral | Peer Group |
| | Shares | Shares | Average |
| International Growth Fund | 0.53% | 0.34% | 1.44% |
The fund expense ratios shown are from the prospectus dated December 29, 2009, and represent estimated costs for the current fiscal year based on the fund’s net assets as of the prospectus date. For the six months ended February 28, 2010, the annualized expense ratios were 0.52% for Investor Shares and 0.33% for Admiral Shares. The peer-group expense ratio is derived from data provided by Lipper Inc. and captures information through year-end 2009.
Peer group: International Funds.
4
holdings during the global financial crisis, and the benefits of this positioning have been realized over the past 12 months.
The fund’s Chinese holdings rose about 23% overall, aided in particular by stocks of information technology and consumer discretionary companies. These stocks have rallied as the Chinese economy, after a brief pause, again kicked into high gear. Brazilian holdings gained approximately 20%, sparked by energy, materials, and financial stocks. Petrobras, the Brazilian oil giant and one of the fund’s largest holdings, benefited from the rising price of oil.
In the developed European and Pacific markets, the fund gained an advantage over the benchmark index by avoiding some of the worst-performing financial companies and holding some of the winners. Successful stock selection was also evident in the consumer discretionary, energy, materials, and information technology sectors. The fund lagged the benchmark return in only two sectors, industrials and telecommunication services.
The International Growth Fund’s commendable performance is a testament to the diligent and disciplined approach of its advisors. Schroder Investment Management North America has managed the fund since its 1981 inception. Baillie Gifford Overseas joined the fund in 2003, and M&G Investment Management Limited came aboard in 2008.
Relative to competitors, the fund also benefits from exceptionally low expenses, as you can see in the table on page 4.
International investments provide diversification
International stocks, as measured by market indexes, trailed their domestic counterparts during the past six months by about six percentage points after both enjoyed historic rallies earlier in 2009. Over the past five and ten years, markets abroad have held a slight edge, whereas U.S. stocks did better throughout the 1990s.
While foreign markets often move in the same direction as the U.S. market, they also frequently diverge, sometimes significantly. The past half-year is a case in point, and international fund investors may have been disappointed by the results. This divergent performance, however, is the essence of diversification. Relative performance ebbs and flows. Over time, combining investments with varying patterns of return can help you reduce the volatility that may be associated with a narrowly focused portfolio.
Vanguard counsels investors to build a diversified portfolio that includes not just U.S. and international stocks, but also bond and money market funds, with the allocations tailored to the investor’s own goals, time horizon, and risk tolerance. The International Growth Fund can play an important role in such a portfolio.
5
On another matter, I would like to inform you that as of January 1, 2010, we completed a leadership transition that began in March 2008. I succeeded Jack Brennan as chairman of Vanguard and each of the funds. Jack has agreed to serve as chairman emeritus and senior advisor. Under Jack’s leadership, Vanguard has grown to become a preeminent firm in the mutual fund industry. Jack’s energy, his relentless pursuit of perfection, and his unwavering focus on always doing the right thing for our clients are evident in every facet of Vanguard policy today.
Thank you for entrusting your assets to Vanguard.
Sincerely,

F. William McNabb III
Chairman and Chief Executive Officer
March 11, 2010
6
Advisors’ Report
For the fiscal half-year ended February 28, 2010, Vanguard International Growth Fund returned about 5%. Your fund is managed by three independent advisors, a strategy that enhances the fund’s diversification by providing exposure to distinct, yet complementary, investment approaches. It is not uncommon for different advisors to have different views about individual securities or the broader investment environment.
The advisors, the percentage of fund assets each manages, and brief descriptions of their investment strategies are presented in the table below. The advisors have also prepared a discussion of the investment environment that existed during the fiscal half-year and of how the portfolio’s positioning reflects this assessment. These comments were prepared on March 16, 2010.
Vanguard International Growth Fund Investment Advisors
| | | |
| | Fund Assets Managed | |
| Investment Advisor | % | $ Million | Investment Strategy |
| Schroder Investment | 45 | 6,797 | Equity analysts in 11 countries and an international |
| Management North America, Inc. | | | team of global sector and regional specialists help to |
| | | | identify reasonably priced companies with strong |
| | | | growth prospects and a sustainable competitive |
| | | | advantage. |
| Baillie Gifford Overseas Ltd. | 43 | 6,588 | The advisor seeks stocks that can generate |
| | | | above-average growth in earnings and cash flow, |
| | | | producing a bottom-up, stock-driven approach to |
| | | | country and asset allocation. An in-depth view on each |
| | | | company is measured against the consensus view, |
| | | | leading to discrepancies and potential opportunities to |
| | | | add value. |
| M&G Investment Management | 10 | 1,462 | The advisor constructs a portfolio using a long-term, |
| Limited | | | bottom-up investment approach focusing on identifying |
| | | | underappreciated companies—particularly those with |
| | | | scarce assets—with the ability to deliver high returns |
| | | | and growth potential. |
| Cash Investments | 2 | 375 | These short-term reserves are invested by Vanguard in |
| | | | equity index products to simulate investment in stocks. |
| | | | Each advisor may also maintain a modest cash |
| | | | position. |
7
Schroder Investment Management
North America Inc.
Portfolio Managers:
Virginie Maisonneuve, CFA
Head of Global and International Equities
Simon Webber, CFA
Portfolio Manager
The strong performance of equity markets has slowed in recent months as several uncertainties took the edge off investors’ appetite for risk. These included the lack of clarity surrounding bank regulation, sovereign debt risk (notably in Greece, but even in the United Kingdom), and concerns about how central banks will go about normalizing currently ultra-loose monetary conditions.
European markets came under pressure as Greece revealed worse-than-expected fiscal problems, leading to sharply increasing sovereign debt spreads. Greece’s troubles fed fears that Spain and Portugal would ultimately face similar difficulties, and those concerns in turn put pressure on commercial banks. Global banks’ exposure to Spanish, Portuguese, and Greek debt has been estimated at $1.3 trillion, with a high proportion carried by German and French banks. Our exposure in Europe is concentrated in quality companies with global franchises, such as Danone (consumer staples), ArcelorMittal (materials), Roche Holdings (health care), and BG Group (energy).
Emerging markets and Asian developed markets (excluding Japan) provided strong returns during the period. Despite a year-end rally prompted by signs of a weakening yen, which could boost exports, Japanese securities fell during the period overall. We took profits in some strongly performing emerging market and Pacific holdings, selling our stakes in Shangri-La Asia in Hong Kong and Grupo Televisa in Mexico, as well as trimming our holdings of Teva Pharmaceutical Industries in Israel.
We outperformed our benchmark in all but one sector, and in all regions. Our strongest returns came from the financial sector, where our commitment to quality was rewarded as we steered clear of banks that needed large capital infusions and faced the biggest losses. The financial stocks that contributed the most for us were insurance companies (AXA Group) and firms benefiting from stronger consumption trends in Asian emerging markets (Swire Pacific, China Pacific Insurance, and Ping An Insurance) and in Latin America (BM&FBOVESPA and Itau Unibanco).
In the consumer discretionary sector, the portfolio benefited from our exposure to Chinese consumers. Notable contributors included China Resources Enterprise (retail and food processing) and Ctrip.com International (online travel).
Finally, our health care holdings have been an area of strength, one that we have added to during the period. We own companies such as Fresenius Medical Care (kidney dialysis), Teva Pharmaceuticals, and Novartis, all catering to aging populations in the West. We believe the market is underestimating the long-term earnings growth potential of these companies.
8
From a regional standpoint, our holdings in emerging markets and Japan contributed the most to relative performance. In Japan, our exposure to global companies, such as Mitsubishi, Honda Motor (which has a leading position in fuel-efficient engine technology), and Canon, led the outperformance.
Looking forward, we believe that markets will remain volatile in 2010, warranting a strong focus on valuation and quality. Much uncertainty exists about how and when authorities will act to normalize monetary policies around the world. Interestingly, while the world was mostly united to fight the financial crisis in 2008 and 2009, 2010 may show a divergence in focus. As the recovery strengthens in countries such as Australia, China, and Brazil, along with most of Asia outside Japan, those countries will attempt to slow their economic growth to avert potential inflationary pressure; meanwhile, most developed countries will still be struggling to stimulate their economies. This situation will create “push and pull” forces globally that will add to volatility.
Furthermore, the implementation of financial-sector regulations, such as the Basel 3 recommendations, will not support bank lending at a time when governments in most developed markets cannot afford further measures to address the lending gap. From a company perspective, this dynamic will provide strong marginal competitive advantages to quality companies that possess sizable cash flows and do not depend on borrowing to grow their business. In addition, one benefit of the financial crisis is that many companies are currently in a “sweet spot,” as they have cut their cost bases and should see profits continue to increase while labor costs remain largely in check.
Overall, we believe that the continuing market volatility will create attractive price opportunities in quality growth stocks with strong and sustainable medium-term competitive advantages and earnings growth.
Baillie Gifford Overseas Ltd.
Portfolio Manager: James K. Anderson Chief Investment Officer and Head of Global Equities
During the six months through February 2010, investors’ overall relief, which had powered the rally last summer, became more discriminating. Investors were concerned about the strength and durability of the economic recovery, especially in some of the mature markets. Brazil and China continued to produce good market returns over the period as their economies powered ahead, but Europe and Japan were dull at best, and some of the small southern European markets fell quite sharply. The problems of Greece have few global implications, except to remind us that the legacy of debt cannot easily be sloughed off.
The sectors that depend most on a strong recovery in the mature economies were the feeblest performers in the
9
period. So the big utilities, banks, and telecommunications companies were weak. There is a great deal of market capitalization tied up in these businesses; the phrase “All dressed up and nowhere to go” springs to mind.
On the other hand, those sectors with good long-term prospects, such as raw materials and technology, did well. Supplying the developing world or doing something that the Chinese cannot do more cheaply is a winning strategy.
Company profits and cash flows were generally very strong over the period, and not just because of cost-cutting. A strong industrial recovery is taking place. It is partly because of inventory rebuilding, but mainly reflects increasing demand, especially from Asia. Housing, employment, and consumption are laggards, especially in the mature economies. It may take them a while to catch up, especially if the saving habit becomes deeply embedded. In that case, monetary policy would likely remain loose for a long time, which should be good for real assets, such as stocks, and less good for nominal ones, such as bonds.
We did not change the portfolio’s positioning very much during the half-year. Our policy is optimistic with a bias toward the developing world and technology, so we are overweighted in computer software, capital goods, and retailing. We have tended to avoid utilities, pharmaceuticals, and telecoms. Our search for growth has not tempted us to alter this strategy, rather the opposite; but, as always, the main factor for us is the availability of good companies.
The coming months are likely to see further strains in the foreign exchanges, as currency markets try to reflect both the success of China and the unsustainable size of government debt in some of the mature countries (including those in which the writer and readers of this note live). Stock prices still do not reflect reality concerning where risk and return are likely to arise, and this presents us with an opportunity to add value as the global recovery gradually accelerates.
M&G Investment Management Limited
Portfolio Managers:
Graham E. French, Portfolio Manager
Greg Aldridge, Portfolio Manager
In spite of high volatility, global equities posted healthy gains for the fiscal half-year as investors focused on the improving prospects for a broad-based economic recovery, while company earnings results generally outpaced expectations. Investors’ increased appetite for risk prompted an especially strong rally in emerging market and commodities-related stocks.
Against this backdrop, our holdings that were exposed to growth in developing markets, recovering consumer spending, and rising demand for natural resources proved particularly beneficial. We received
10
strong returns from a range of companies, including China’s leading supplier of agricultural produce, Chaoda Modern Agriculture Holdings, Taiwanese electronics manufacturer Compal Electronics, and Brazilian miner Vale, the world’s largest iron ore producer.
By contrast, our holdings with perceived exposure to slower-growing industries and regions performed weakly. For example, Austrian brick manufacturer Wienerberger suffered from fragility in European construction markets, Japanese auto manufacturer Toyota Motor was hurt by the company’s well-publicized vehicle recalls, and French bank Societe Générale reported weaker-than-expected investment banking returns and cut its dividend for 2009.
In spite of volatile investor sentiment during the past year, the portfolio has consistently focused on high-quality, value-creating businesses in both defensive and cyclical areas whose holdings of scarce assets differentiate them from their competitors. During the period, we continued to invest in those companies that we believe can deliver sustainable returns above their cost of capital and boost their profits through reinvestment. Additions to our portfolio include well-positioned U.K./U.S. cruise operator Carnival, Germany’s Wincor Nixdorf, a leading global provider of cash machines and payment systems for the financial and retail industries, and French-listed CFAO, a specialized distributor in Africa and French territories around the world.
Among sales in our portfolio, we took some profits from some of our strongest performers, including Taiwanese electronics manufacturer Compal Electronics and South Korean tire manufacturer Hankook Tire. We also closed a position in Dutch financial institution ING Groep after a sharp rise in the company’s share price provided a suitable exit point.
11
International Growth Fund
Fund Profile
As of February 28, 2010
| | |
| Share-Class Characteristics | | |
| | Investor | Admiral |
| | Shares | Shares |
| Ticker Symbol | VWIGX | VWILX |
| Expense Ratio1 | 0.53% | 0.34% |
| | | |
| Portfolio Characteristics | | |
| | | | MSCI AC |
| | | MSCI | World |
| | | EAFE | Index |
| | Fund | Index | ex USA |
| Number of Stocks | 179 | 955 | 1,815 |
| Median Market Cap | $35.7B | $32.6B | $27.8B |
| Price/Earnings Ratio | 30.2x | 31.0x | 27.2x |
| Price/Book Ratio | 2.0x | 1.6x | 1.7x |
| Return on Equity | 21.2% | 17.7% | 18.7% |
| Earnings Growth Rate 12.7% | 7.2% | 10.0% |
| Dividend Yield | 2.3% | 3.2% | 2.9% |
| Turnover Rate | | | |
| (Annualized) | 44% | — | — |
| Short-Term Reserves | 1.4% | — | — |
| | | |
| Sector Diversification (% of equity exposure) |
| | | | MSCI AC |
| | | MSCI | World |
| | | EAFE | Index |
| | Fund | Index | ex USA |
| Consumer | | | |
| Discretionary | 13.2% | 9.7% | 8.4% |
| Consumer Staples | 11.9 | 10.3 | 8.7 |
| Energy | 9.0 | 8.0 | 10.8 |
| Financials | 20.5 | 25.1 | 25.6 |
| Health Care | 8.2 | 8.6 | 6.6 |
| Industrials | 13.8 | 11.6 | 10.1 |
| Information | | | |
| Technology | 9.8 | 5.1 | 6.7 |
| Materials | 9.2 | 10.1 | 11.9 |
| Telecommunication | | | |
| Services | 2.8 | 5.7 | 6.2 |
| Utilities | 1.6 | 5.8 | 5.0 |
| | |
| Volatility Measures | | |
| | MSCI | MSCI AC |
| | EAFE | World Index |
| | Index | ex USA |
| R-Squared | 0.97 | 0.98 |
| Beta | 1.07 | 1.00 |
These measures show the degree and timing of the fund’s fluctuations compared with the indexes over 36 months.
| | |
| Ten Largest Holdings (% of total net assets) |
| Tesco PLC | Food Retail | 2.3% |
| Petroleo Brasileiro SA | Integrated Oil & | |
| | Gas | 2.1 |
| Canon Inc. | Office Electronics | 2.1 |
| BG Group PLC | Integrated Oil & | |
| | Gas | 2.0 |
| Novartis AG | Pharmaceuticals | 1.9 |
| Itau Unibanco Holdings | Diversified Banks | |
| SA | | 1.8 |
| Unilever | Packaged Foods & | |
| | Meats | 1.8 |
| Baidu Inc./China ADR | Internet Software & | |
| | Services | 1.7 |
| Cie Generale d'Optique | Health Care | |
| Essilor International SA | Supplies | 1.4 |
| Atlas Copco AB Class A | Industrial | |
| | Machinery | 1.4 |
| Top Ten | | 18.5% |
The holdings listed exclude any temporary cash investments and equity index products.
Allocation by Region (% of equity exposure)

1 The expense ratios shown are from the prospectus dated December 29, 2009, and represent estimated costs for the current fiscal year based on the fund’s net assets as of the prospectus date. For the six months ended February 28, 2010, the annualized expense ratios were 0.52% for Investor Shares and 0.33% for Admiral Shares.
12
International Growth Fund
| | | |
| Market Diversification (% of equity exposure) |
| | | | MSCI AC |
| | | MSCI | World |
| | | EAFE | Index |
| | Fund | Index | ex USA |
| Europe | | | |
| United Kingdom | 19.0% | 21.1% | 15.0% |
| Switzerland | 9.1 | 8.0 | 5.6 |
| France | 8.0 | 10.6 | 7.4 |
| Germany | 6.2 | 7.6 | 5.3 |
| Netherlands | 3.5 | 2.6 | 1.8 |
| Sweden | 3.3 | 2.7 | 1.9 |
| Spain | 2.6 | 4.0 | 2.8 |
| Denmark | 1.7 | 0.9 | 0.7 |
| Other | 1.6 | 7.4 | 5.2 |
| Subtotal | 55.0% | 64.9% | 45.7% |
| Pacific | | | |
| Japan | 15.7% | 22.6% | 15.9% |
| Australia | 4.2 | 8.5 | 6.0 |
| Hong Kong | 3.4 | 2.4 | 1.7 |
| Other | 0.4 | 1.6 | 1.1 |
| Subtotal | 23.7% | 35.1% | 24.7% |
| Emerging Markets | | | |
| China | 6.8% | 0.0% | 4.0% |
| Brazil | 6.7 | 0.0 | 3.7 |
| Israel | 1.5 | 0.0 | 0.7 |
| South Korea | 1.0 | 0.0 | 2.8 |
| Other | 4.1 | 0.0 | 10.9 |
| Subtotal | 20.1% | 0.0% | 22.1% |
| North America | | | |
| Canada | 1.2% | 0.0% | 7.5% |
13
International Growth Fund
Performance Summary
All of the returns in this report represent past performance, which is not a guarantee of future results that may be achieved by the fund. (Current performance may be lower or higher than the performance data cited. For performance data current to the most recent month-end, visit our website at www.vanguard.com/performance.) Note, too, that both investment returns and principal value can fluctuate widely, so an investor’s shares, when sold, could be worth more or less than their original cost. The returns shown do not reflect taxes that a shareholder would pay on fund distributions or on the sale of fund shares.
Fiscal-Year Total Returns (%): August 31, 1999, Through February 28, 2010
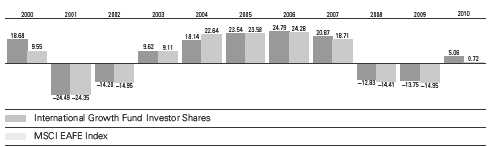
Note: For 2010, performance data reflect the six months ended February 28, 2010.
Average Annual Total Returns: Periods Ended December 31, 2009
This table presents average annual total returns through the latest calendar quarter—rather than through the end of
the fiscal period. Securities and Exchange Commission rules require that we provide this information.
| | | | |
| | Inception | One | Five | Ten |
| | Date | Year | Years | Years |
| Investor Shares | 9/30/1981 | 41.63% | 5.55% | 2.47% |
| Admiral Shares | 8/13/2001 | 41.88 | 5.75 | 6.551 |
| 1 Return since inception. | | | | |
Vanguard fund total returns do not include any transaction or account fees that applied in the periods shown. Fund prospectuses provide
information about current fees.
See Financial Highlights for dividend and capital gains information.
14
International Growth Fund
Financial Statements (unaudited)
Statement of Net Assets
As of February 28, 2010
The fund reports a complete list of its holdings in regulatory filings four times in each fiscal year, at the quarter-ends. For the second and fourth fiscal quarters, the lists appear in the fund’s semiannual and annual reports to shareholders. For the first and third fiscal quarters, the fund files the lists with the Securities and Exchange Commission on Form N-Q. Shareholders can look up the fund’s Forms N-Q on the SEC’s website at www.sec.gov. Forms N-Q may also be reviewed and copied at the SEC’s Public Reference Room (see the back cover of this report for further information).
| | | |
| | | | Market |
| | | | Value• |
| | | Shares | ($000) |
| Common Stocks (96.5%)1 | | |
| Australia (3.9%) | | |
| | Australia & New Zealand | | |
| | Banking Group Ltd. | 8,359,000 | 172,994 |
| | Woolworths Ltd. | 5,214,600 | 125,305 |
| | Woodside Petroleum Ltd. | 2,777,000 | 108,014 |
| | Brambles Ltd. | 14,934,900 | 92,849 |
| * | James Hardie | | |
| | Industries SE | 6,196,069 | 41,385 |
| | Amcor Ltd. | 6,333,889 | 33,631 |
| ^ | Sims Metal | | |
| | Management Ltd. | 1,000,000 | 17,363 |
| | | | 591,541 |
| Austria (0.2%) | | |
| ^ | Wienerberger AG | 1,720,000 | 29,339 |
| |
| Belgium (0.1%) | | |
| | Barco NV | 385,000 | 15,291 |
| |
| Brazil (6.6%) | | |
| | Petroleo Brasileiro SA | | |
| | ADR Type A | 7,733,400 | 296,962 |
| | Itau Unibanco Holding | | |
| | SA ADR | 8,592,375 | 171,504 |
| | BM&FBOVESPA SA | 17,436,600 | 113,565 |
| | Redecard SA | 6,794,952 | 98,814 |
| | Itau Unibanco Holding | | |
| | SA Prior Pfd. | 4,871,490 | 97,637 |
| | Vale SA Class B Pfd. ADR | 3,641,900 | 89,591 |
| ^ | Cia Brasileira de | | |
| | Distribuicao Grupo Pao | | |
| | de Acucar ADR | 475,000 | 32,518 |
| | Petroleo Brasileiro SA | | |
| | Prior Pfd. | 1,515,000 | 28,964 |
| | Vale SA Prior Pfd. | 1,035,000 | 25,469 |
| | Banco do Brasil SA | 1,370,000 | 22,516 |
| | B2W Cia Global Do Varejo | 1,063,000 | 22,088 |
| | Fibria Celulose SA | 716,170 | 13,102 |
| | | | 1,012,730 |
| | | | |
| | | | | Market |
| | | | | Value• |
| | | | Shares | ($000) |
| Canada (1.2%) | | | |
| | Niko Resources Ltd. | 1,052,600 | 100,038 |
| | Canadian Pacific | | | |
| | Railway Ltd. | | 1,264,000 | 61,014 |
| | Sherritt International Corp. | 2,300,000 | 16,241 |
| | Harry Winston | | | |
| | Diamond Corp. | | 732,000 | 7,339 |
| | | | | 184,632 |
| China (6.7%) | | | |
| * | Baidu Inc. ADR | | 505,500 | 262,193 |
| | China Construction | | | |
| | Bank Corp. | 133,709,000 | 101,070 |
| | China Resources | | | |
| | Enterprise Ltd. | | 22,660,000 | 79,919 |
| | CNOOC Ltd. | | 44,035,000 | 69,267 |
| | China Merchants | | | |
| | Holdings International | | |
| | Co. Ltd. | | 18,110,000 | 65,215 |
| * | Ctrip.com | | | |
| | International Ltd. ADR | 1,579,400 | 60,380 |
| | Tencent Holdings Ltd. | 3,040,000 | 59,661 |
| ^ | Dongfang Electric | | | |
| | Corp. Ltd. | | 10,506,200 | 52,801 |
| | Ping An Insurance | | | |
| | Group Co. of China Ltd. | 6,537,000 | 49,824 |
| ^ | China Merchants | | | |
| | Bank Co. Ltd. | | 18,899,500 | 46,524 |
| | Want Want China | | | |
| | Holdings Ltd. | | 64,924,000 | 42,617 |
| | China Unicom | | | |
| | Hong Kong Ltd. | | 29,408,000 | 35,555 |
| | Denway Motors Ltd. | 58,662,000 | 32,809 |
| * | China Pacific | | | |
| | Insurance Group | | | |
| | Co. Ltd. | | 6,531,600 | 26,716 |
| | Chaoda Modern | | | |
| | Agriculture | | | |
| | Holdings Ltd. | | 23,000,719 | 24,871 |
| ^ | Ports Design Ltd. | | 4,958,000 | 12,218 |
| | | | | 1,021,640 |
15
| | | |
| International Growth Fund | | |
| |
| |
| |
| | | | Market |
| | | | Value• |
| | | Shares | ($000) |
| Denmark (1.7%) | | |
| * | Vestas Wind Systems A/S | 1,653,736 | 81,784 |
| | Novo Nordisk A/S Class B | 1,135,200 | 80,569 |
| | Novozymes A/S | 634,400 | 65,133 |
| | AP Moller - Maersk A/S | | |
| | Class B | 3,750 | 28,687 |
| | | | 256,173 |
| France (7.6%) | | |
| | Cie Generale d’Optique | | |
| | Essilor International SA | 3,552,100 | 213,908 |
| | Total SA | 2,983,000 | 166,221 |
| | Danone | 2,617,000 | 152,868 |
| ^ | ArcelorMittal | 2,945,425 | 112,396 |
| | GDF Suez | 2,946,000 | 107,972 |
| | PPR | 821,900 | 94,191 |
| | L’Oreal SA | 901,231 | 93,224 |
| | BNP Paribas | 855,000 | 61,771 |
| | Schneider Electric SA | 516,000 | 55,128 |
| | European Aeronautic | | |
| | Defence and | | |
| | Space Co. NV | 1,720,000 | 35,457 |
| ^ | Publicis Groupe SA | 865,000 | 34,063 |
| | Societe Generale | 500,000 | 27,480 |
| | CFAO SA | 170,000 | 6,535 |
| | | | 1,161,214 |
| Germany (5.9%) | | |
| | SAP AG | 3,435,400 | 153,263 |
| | Siemens AG | 1,366,000 | 117,127 |
| | Adidas AG | 2,217,810 | 109,857 |
| | Linde AG | 861,000 | 96,933 |
| | Fresenius Medical Care | | |
| | AG & Co. KGaA | 1,756,000 | 91,757 |
| | Bayer AG | 1,047,000 | 69,385 |
| | ThyssenKrupp AG | 1,688,000 | 53,428 |
| | Porsche Automobil | | |
| | Holding SE Prior Pfd. | 994,400 | 49,898 |
| *,^ | TUI AG | 3,575,300 | 35,301 |
| | Symrise AG | 1,495,000 | 31,881 |
| | Celesio AG | 1,069,000 | 31,140 |
| | E.ON AG | 800,000 | 28,469 |
| | Wincor Nixdorf AG | 315,820 | 21,410 |
| *,^ | Q-Cells SE | 986,500 | 9,413 |
| | | | 899,262 |
| Hong Kong (3.3%) | | |
| | Swire Pacific Ltd. | 12,493,500 | 139,500 |
| | Jardine Matheson | | |
| | Holdings Ltd. | 3,808,400 | 104,159 |
| ^ | Esprit Holdings Ltd. | 12,264,345 | 87,397 |
| | Hong Kong Exchanges | | |
| | and Clearing Ltd. | 4,514,200 | 75,505 |
| | Li & Fung Ltd. | 10,292,000 | 47,822 |
| | Sun Hung Kai | | |
| | Properties Ltd. | 2,662,000 | 36,971 |
| ^ | Techtronic Industries Co. | 25,499,943 | 19,506 |
| | | | 510,860 |
| | |
| | | Market |
| | | Value• |
| | Shares | ($000) |
| India (0.7%) | | |
| Housing Development | | |
| Finance Corp. | 1,596,500 | 86,506 |
| Reliance Capital Ltd. | 1,454,500 | 24,804 |
| | | 111,310 |
| Indonesia (0.3%) | | |
| Telekomunikasi Indonesia | | |
| Tbk PT | 56,475,000 | 50,448 |
| |
| Ireland (0.2%) | | |
| Kerry Group PLC Class A | 925,000 | 29,287 |
| |
| Israel (1.5%) | | |
| Teva Pharmaceutical | | |
| Industries Ltd. ADR | 3,057,100 | 183,457 |
| Makhteshim-Agan | | |
| Industries Ltd. | 9,033,243 | 46,440 |
| | | 229,897 |
| Italy (0.4%) | | |
| * Intesa Sanpaolo SPA | | |
| (Registered) | 18,981,662 | 66,753 |
| |
| Japan (15.0%) | | |
| Canon Inc. | 7,558,100 | 313,615 |
| Honda Motor Co. Ltd. | 5,587,100 | 193,251 |
| Nintendo Co. Ltd. | 570,100 | 155,275 |
| Rakuten Inc. | 199,916 | 153,870 |
| Mitsubishi Corp. | 5,978,000 | 149,115 |
| Nomura Holdings Inc. | 19,762,000 | 145,502 |
| Bridgestone Corp. | 6,822,000 | 119,380 |
| Toyota Motor Corp. | 3,060,400 | 114,555 |
| Unicharm Corp. | 1,146,000 | 109,823 |
| Sony Financial | | |
| Holdings Inc. | 33,549 | 97,715 |
| Japan Tobacco Inc. | 23,355 | 84,832 |
| Nippon Telegraph & | | |
| Telephone Corp. | 1,929,000 | 84,122 |
| Sekisui Chemical Co. Ltd. | 12,557,000 | 82,899 |
| SMC Corp. | 643,300 | 80,246 |
| Yamaha Motor Co. Ltd. | 5,710,000 | 75,810 |
| Yamada Denki Co. Ltd. | 1,023,570 | 71,369 |
| THK Co. Ltd. | 3,095,300 | 59,966 |
| Hoya Corp. | 2,310,700 | 57,816 |
| Rohm Co. Ltd. | 589,500 | 40,180 |
| Kyocera Corp. | 347,900 | 30,928 |
| Astellas Pharma Inc. | 810,000 | 30,476 |
| Trend Micro Inc. | 695,000 | 23,883 |
| Mitsui Sumitomo | | |
| Insurance Group | | |
| Holdings Inc. | 209,600 | 5,370 |
| | | 2,279,998 |
| Luxembourg (0.1%) | | |
| *,^ Reinet Investments SCA | 542,339 | 8,138 |
16
| | | |
| International Growth Fund | | |
| |
| |
| |
| | | | Market |
| | | | Value• |
| | | Shares | ($000) |
| Mexico (0.8%) | | |
| * | Desarrolladora Homex | | |
| | SAB de CV ADR | 2,117,789 | 57,900 |
| | Wal-Mart de Mexico | | |
| | SAB de CV | 8,200,000 | 40,870 |
| ^ | Consorcio ARA | | |
| | SAB de CV | 30,500,000 | 20,742 |
| | | | 119,512 |
| Netherlands (3.4%) | | |
| | Unilever NV | 8,192,000 | 246,269 |
| * | ING Groep NV | 17,936,000 | 159,881 |
| | SBM Offshore NV | 5,066,035 | 89,867 |
| | TNT NV | 875,000 | 22,629 |
| | | | 518,646 |
| Norway (0.5%) | | |
| * | DnB NOR ASA | 4,178,776 | 45,426 |
| | Statoil ASA | 1,225,000 | 27,509 |
| | | | 72,935 |
| Russia (0.7%) | | |
| | Gazprom OAO ADR | 4,851,000 | 107,974 |
| |
| Singapore (0.4%) | | |
| | Singapore Exchange Ltd. | 6,541,000 | 35,853 |
| | DBS Group Holdings Ltd. | 2,450,000 | 24,368 |
| | | | 60,221 |
| South Africa (0.6%) | | |
| | Impala Platinum | | |
| | Holdings Ltd. | 1,778,600 | 43,313 |
| | MTN Group Ltd. | 1,550,000 | 22,489 |
| | Sasol Ltd. | 565,000 | 20,658 |
| | | | 86,460 |
| South Korea (0.9%) | | |
| | Samsung Electronics | | |
| | Co. Ltd. | 148,996 | 95,519 |
| | Samsung Fire & Marine | | |
| | Insurance Co. Ltd. | 186,900 | 29,716 |
| | Hankook Tire Co. Ltd. | 880,000 | 17,580 |
| | | | 142,815 |
| Spain (2.4%) | | |
| | Banco Santander SA | 13,490,528 | 175,394 |
| | Inditex SA | 2,217,885 | 130,695 |
| | Gamesa Corp. | | |
| | Tecnologica SA | 4,722,000 | 58,656 |
| | | | 364,745 |
| Sweden (3.3%) | | |
| | Atlas Copco AB Class A | 15,095,533 | 213,640 |
| | Sandvik AB | 10,514,363 | 113,259 |
| | Svenska Handelsbanken | | |
| | AB Class A | 3,672,206 | 100,220 |
| | Telefonaktiebolaget LM | | |
| | Ericsson Class B | 3,700,000 | 36,995 |
| | Oriflame Cosmetics SA | 575,000 | 33,537 |
| | | | 497,651 |
| | | |
| | | | Market |
| | | | Value• |
| | | Shares | ($000) |
| Switzerland (9.0%) | | |
| * | Novartis AG | 5,272,000 | 292,117 |
| | Syngenta AG | 746,100 | 193,329 |
| | Roche Holding AG | 1,128,684 | 188,569 |
| | Cie Financiere | | |
| | Richemont SA | 3,635,300 | 122,680 |
| | Credit Suisse Group AG | 2,449,000 | 109,031 |
| | SGS SA | 67,448 | 90,292 |
| | Geberit AG | 494,180 | 84,671 |
| | Julius Baer Group Ltd. | 2,406,000 | 74,851 |
| | ABB Ltd. | 2,863,100 | 58,008 |
| | GAM Holding Ltd. | 4,571,000 | 49,842 |
| | Nestle SA | 710,000 | 35,344 |
| | Zurich Financial | | |
| | Services AG | 140,000 | 33,770 |
| | Holcim Ltd. | 486,000 | 32,151 |
| | | | 1,364,655 |
| Taiwan (0.6%) | | |
| | Taiwan Semiconductor | | |
| | Manufacturing Co. Ltd. | 37,122,508 | 67,972 |
| | Compal Electronics Inc. | 14,998,200 | 21,496 |
| | | | 89,468 |
| Turkey (0.5%) | | |
| | Turkiye Garanti | | |
| | Bankasi AS | 20,354,000 | 74,924 |
| |
| United Kingdom (18.0%) | | |
| | Tesco PLC | 55,830,300 | 357,500 |
| | BG Group PLC | 17,055,213 | 298,099 |
| | BHP Billiton PLC | 6,822,700 | 209,446 |
| | Vodafone Group PLC | 93,450,324 | 201,933 |
| | Standard Chartered PLC | 8,080,300 | 192,588 |
| | HSBC Holdings PLC | 17,530,693 | 192,318 |
| | British American | | |
| | Tobacco PLC | 4,963,464 | 168,762 |
| | Rio Tinto PLC | 3,109,200 | 160,562 |
| | Rolls-Royce Group PLC | 13,797,616 | 117,461 |
| | SABMiller PLC | 3,960,000 | 103,894 |
| | Prudential PLC | 10,627,000 | 97,929 |
| | Centrica PLC | 17,626,000 | 75,239 |
| | BAE Systems PLC | 12,631,000 | 72,145 |
| | Meggitt PLC | 14,917,500 | 63,171 |
| * | Lloyds Banking | | |
| | Group PLC | 59,214,785 | 47,405 |
| * | Signet Jewelers Ltd. | 1,356,000 | 39,075 |
| | Capita Group PLC | 3,551,612 | 38,830 |
| | Unilever PLC | 1,190,000 | 34,993 |
| | Carnival PLC | 920,000 | 34,973 |
| | Reckitt Benckiser | | |
| | Group PLC | 637,000 | 33,535 |
| | GlaxoSmithKline PLC | 1,810,000 | 33,463 |
| | Eurasian Natural | | |
| | Resources Corp. PLC | 2,014,000 | 31,580 |
| | Ultra Electronics | | |
| | Holdings PLC | 1,470,000 | 29,685 |
| | Intertek Group PLC | 1,460,000 | 28,543 |
17
| | | |
| International Growth Fund | | |
| |
| |
| |
| | | | Market |
| | | | Value• |
| | | Shares | ($000) |
| | G4S PLC | 6,850,000 | 28,298 |
| | Inchcape PLC | 64,800,000 | 25,128 |
| | Victrex PLC | 1,706,167 | 22,623 |
| | | | 2,739,178 |
| Total Common Stocks | | |
| (Cost $13,525,163) | | 14,697,697 |
| Temporary Cash Investments (4.4%)1 | |
| Money Market Fund (4.0%) | | |
| 2,3 | Vanguard Market Liquidity | |
| | Fund, 0.163% | 611,930,000 | 611,930 |
| |
| | | Face | |
| | | Amount | |
| | | ($000) | |
| U.S. Government and Agency Obligations (0.4%) |
| 4,5 | Federal Home Loan | | |
| | Bank Discount Notes, | | |
| | 0.220%, 3/26/10 | 5,000 | 4,999 |
| 4,5 | Freddie Mac Discount | | |
| | Notes, 0.215%, 6/14/10 | 7,000 | 6,997 |
| 4,5,6 Freddie Mac Discount | | |
| | Notes, 0.230%, 8/9/10 | 40,000 | 39,962 |
| | | | 51,958 |
| Total Temporary Cash Investments | |
| (Cost $663,883) | | 663,888 |
| Total Investments (100.9%) | | |
| (Cost $14,189,046) | | 15,361,585 |
| Other Assets and Liabilities (-0.9%) | |
| Other Assets | | 111,134 |
| Liabilities3 | | (250,583) |
| | | | (139,449) |
| Net Assets (100%) | | 15,222,136 |
| |
| At February 28, 2010, net assets consisted of: |
| | Amount |
| | ($000) |
| Paid-in Capital | 17,232,283 |
| Overdistributed Net Investment Income | (25,534) |
| Accumulated Net Realized Losses | (3,133,005) |
| Unrealized Appreciation (Depreciation) | |
| Investment Securities | 1,172,539 |
| Futures Contracts | (10,970) |
| Foreign Currencies and Forward | |
| Currency Contracts | (13,177) |
| Net Assets | 15,222,136 |
| |
| Investor Shares—Net Assets | |
| Applicable to 670,676,579 outstanding | |
| $.001 par value shares of beneficial | |
| interest (unlimited authorization) | 10,900,840 |
| Net Asset Value Per Share— | |
| Investor Shares | $16.25 |
| |
| Admiral Shares—Net Assets | |
| Applicable to 83,570,367 outstanding | |
| $.001 par value shares of beneficial | |
| interest (unlimited authorization) | 4,321,296 |
| Net Asset Value Per Share— | |
| Admiral Shares | $51.71 |
• See Note A in Notes to Financial Statements.
* Non-income-producing security.
^ Part of security position is on loan to broker-dealers. The total value of securities on loan is $85,965,000.
1 The fund invests a portion of its cash reserves in equity markets through the use of index futures contracts. After giving effect to futures investments, the fund’s effective common stock and temporary cash investment positions represent 98.9% and 2.0%, respectively, of net assets.
2 Affiliated money market fund available only to Vanguard funds and certain trusts and accounts managed by Vanguard. Rate shown is the 7-day yield.
3 Includes $88,548,000 of collateral received for securities on loan.
4 The issuer operates under a congressional charter; its securities are not backed by the full faith and credit of the U.S. government.
5 Securities with a value of $21,244,000 have been segregated as collateral for open forward currency contracts.
6 Securities with a value of $25,975,000 have been segregated as initial margin for open futures contracts.
ADR—American Depositary Receipt.
See accompanying Notes, which are an integral part of the Financial Statements.
18
| |
| International Growth Fund | |
| |
| |
| Statement of Operations | |
| |
| | Six Months Ended |
| | February 28, 2010 |
| | ($000) |
| Investment Income | |
| Income | |
| Dividends1 | 93,734 |
| Interest2 | 708 |
| Security Lending | 2,503 |
| Total Income | 96,945 |
| Expenses | |
| Investment Advisory Fees—Note B | |
| Basic Fee | 9,601 |
| Performance Adjustment | 2,127 |
| The Vanguard Group—Note C | |
| Management and Administrative—Investor Shares | 17,690 |
| Management and Administrative—Admiral Shares | 2,890 |
| Marketing and Distribution—Investor Shares | 1,049 |
| Marketing and Distribution—Admiral Shares | 388 |
| Custodian Fees | 1,394 |
| Shareholders’ Reports—Investor Shares | 153 |
| Shareholders’ Reports—Admiral Shares | 29 |
| Trustees’ Fees and Expenses | 18 |
| Total Expenses | 35,339 |
| Expenses Paid Indirectly | (100) |
| Net Expenses | 35,239 |
| Net Investment Income | 61,706 |
| Realized Net Gain (Loss) | |
| Investment Securities Sold | (402) |
| Futures Contracts | 71,603 |
| Foreign Currencies and Forward Currency Contracts | 25,240 |
| Realized Net Gain (Loss) | 96,441 |
| Change in Unrealized Appreciation (Depreciation) | |
| Investment Securities | 643,273 |
| Futures Contracts | (71,277) |
| Foreign Currencies and Forward Currency Contracts | (28,002) |
| Change in Unrealized Appreciation (Depreciation) | 543,994 |
| Net Increase (Decrease) in Net Assets Resulting from Operations | 702,141 |
1 Dividends are net of foreign withholding taxes of $7,800,000.
2 Interest income from an affiliated company of the fund was $643,000.
See accompanying Notes, which are an integral part of the Financial Statements.
19
| | |
| International Growth Fund | | |
| |
| |
| Statement of Changes in Net Assets | | |
| |
| | Six Months Ended | Year Ended |
| | February 28, | August 31, |
| | 2010 | 2009 |
| | ($000) | ($000) |
| Increase (Decrease) in Net Assets | | |
| Operations | | |
| Net Investment Income | 61,706 | 331,879 |
| Realized Net Gain (Loss) | 96,441 | (3,200,301) |
| Change in Unrealized Appreciation (Depreciation) | 543,994 | 444,595 |
| Net Increase (Decrease) in Net Assets Resulting from Operations | 702,141 | (2,423,827) |
| Distributions | | |
| Net Investment Income | | |
| Investor Shares | (186,646) | (320,390) |
| Admiral Shares | (79,427) | (134,624) |
| Realized Capital Gain | | |
| Investor Shares | — | (514,799) |
| Admiral Shares | — | (202,398) |
| Total Distributions | (266,073) | (1,172,211) |
| Capital Share Transactions | | |
| Investor Shares | 357,273 | 792,137 |
| Admiral Shares | 268,176 | 150,634 |
| Net Increase (Decrease) from Capital Share Transactions | 625,449 | 942,771 |
| Total Increase (Decrease) | 1,061,517 | (2,653,267) |
| Net Assets | | |
| Beginning of Period | 14,160,619 | 16,813,886 |
| End of Period1 | 15,222,136 | 14,160,619 |
1 Net Assets—End of Period includes undistributed (overdistributed) net investment income of ($25,534,000) and $179,384,000.
See accompanying Notes, which are an integral part of the Financial Statements.
20
| | | | | | | |
| International Growth Fund | | | | | | | |
| |
| |
| Financial Highlights | | | | | | |
| |
| |
| Investor Shares | | | | | | | |
| | Six Months | | | | | |
| | | Ended | | | | | |
| For a Share Outstanding | February 28, | | | | Year Ended August 31, |
| Throughout Each Period | | 2010 | 2009 | 2008 | 2007 | 2006 | 2005 |
| Net Asset Value, Beginning of Period | $15.73 | $20.43 | $26.13 | $23.97 | $19.83 | $16.33 |
| Investment Operations | | | | | | | |
| Net Investment Income | | .063 | .3981 | .473 | .594 | .541 | .341 |
| Net Realized and Unrealized Gain (Loss) | | | | | | |
| on Investments | | .743 | (3.633) | (3.431) | 4.132 | 4.284 | 3.474 |
| Total from Investment Operations | .806 | (3.235) | (2.958) | 4.726 | 4.825 | 3.815 |
| Distributions | | | | | | | |
| Dividends from Net Investment Income | (.286) | (.562) | (.528) | (.530) | (.370) | (.315) |
| Distributions from Realized Capital Gains | — | (.903) | (2.214) | (2.036) | (.315) | — |
| Total Distributions | | (.286) | (1.465) | (2.742) | (2.566) | (.685) | (.315) |
| Net Asset Value, End of Period | | $16.25 | $15.73 | $20.43 | $26.13 | $23.97 | $19.83 |
| |
| Total Return2 | | 5.06% | -13.75% | -12.83% | 20.87% | 24.79% | 23.54% |
| |
| Ratios/Supplemental Data | | | | | | | |
| Net Assets, End of Period (Millions) | $10,901 | $10,226 | $11,969 | $13,219 | $10,466 | $8,182 |
| Ratio of Total Expenses to | | | | | | | |
| Average Net Assets3 | | 0.52%4 | 0.53% | 0.47% | 0.51% | 0.55% | 0.60% |
| Ratio of Net Investment Income to | | | | | | |
| Average Net Assets | | 0.76%4 | 2.84%1 | 2.07% | 2.47% | 2.52% | 1.89% |
| Portfolio Turnover Rate | | 44%4 | 51% | 55% | 41% | 45% | 48% |
1 Net investment income per share and the ratio of net investment income to average net assets include $0.061 and 0.48%, respectively, resulting from income accrued in connection with a spinoff in October 2008 by Reinet Investments SA of British American Tobacco PLC.
2 Total returns do not reflect the 2% fee assessed on redemptions of shares held for less than two months or the account service fee that may be applicable to certain accounts with balanced below $10,000.
3 Includes performance-based investment advisory fee increases (decreases) of 0.03%, 0.03%, 0.02%, 0.01%, (0.01%), and (0.01%).
4 Annualized.
See accompanying Notes, which are an integral part of the Financial Statements.
21
| | | | | | | |
| International Growth Fund | | | | | | | |
| |
| |
| Financial Highlights | | | | | | |
| |
| |
| Admiral Shares | | | | | | | |
| | Six Months | | | | | |
| | | Ended | | | | | |
| For a Share Outstanding | February 28, | | | | Year Ended August 31, |
| Throughout Each Period | | 2010 | 2009 | 2008 | 2007 | 2006 | 2005 |
| Net Asset Value, Beginning of Period | $50.08 | $65.09 | $83.26 | $76.36 | $63.15 | $51.96 |
| Investment Operations | | | | | | | |
| Net Investment Income | | .248 | 1.3401 | 1.649 | 2.051 | 1.861 | 1.222 |
| Net Realized and Unrealized Gain (Loss) | | | | | | |
| on Investments | | 2.369 | (11.571) | (10.929) | 13.159 | 13.639 | 11.063 |
| Total from Investment Operations | 2.617 | (10.231) | (9.280) | 15.210 | 15.500 | 12.285 |
| Distributions | | | | | | | |
| Dividends from Net Investment Income | (.987) | (1.909) | (1.845) | (1.832) | (1.288) | (1.095) |
| Distributions from Realized Capital Gains | — | (2.870) | (7.045) | (6.478) | (1.002) | — |
| Total Distributions | | (.987) | (4.779) | (8.890) | (8.310) | (2.290) | (1.095) |
| Net Asset Value, End of Period | | $51.71 | $50.08 | $65.09 | $83.26 | $76.36 | $63.15 |
| |
| Total Return2 | | 5.16% | -13.57% | -12.67% | 21.11% | 25.03% | 23.84% |
| |
| Ratios/Supplemental Data | | | | | | | |
| Net Assets, End of Period (Millions) | $4,321 | $3,934 | $4,845 | $5,060 | $3,506 | $2,181 |
| Ratio of Total Expenses to | | | | | | | |
| Average Net Assets3 | | 0.33%4 | 0.34% | 0.28% | 0.31% | 0.35% | 0.40% |
| Ratio of Net Investment Income to | | | | | | |
| Average Net Assets | | 0.95%4 | 3.03%1 | 2.26% | 2.67% | 2.72% | 2.07% |
| Portfolio Turnover Rate | | 44%4 | 51% | 55% | 41% | 45% | 48% |
1 Net investment income per share and the ratio of net investment income to average net assets include $0.194 and 0.48%, respectively, resulting from income accrued in connection with a spinoff in October 2008 by Reinet Investments SA of British American Tobacco PLC.
2 Total returns do not reflect the 2% fee assessed on redemptions of shares held for less than two months.
3 Includes performance-based investment advisory fee increases (decreases) of 0.03%, 0.03%, 0.02%, 0.01%, (0.01%), and (0.01%).
4 Annualized.
See accompanying Notes, which are an integral part of the Financial Statements.
22
International Growth Fund
Notes to Financial Statements
Vanguard International Growth Fund is registered under the Investment Company Act of 1940 as an open-end investment company, or mutual fund. The fund invests in securities of foreign issuers, which may subject it to investment risks not normally associated with investing in securities of U.S. corporations. The fund offers two classes of shares: Investor Shares and Admiral Shares. Investor Shares are available to any investor who meets the fund’s minimum purchase requirements. Admiral Shares are designed for investors who meet certain administrative, service, tenure, and account-size criteria.
A. The following significant accounting policies conform to generally accepted accounting principles for U.S. mutual funds. The fund consistently follows such policies in preparing its financial statements.
1. Security Valuation: Securities are valued as of the close of trading on the New York Stock Exchange (generally 4 p.m., Eastern time) on the valuation date. Equity securities are valued at the latest quoted sales prices or official closing prices taken from the primary market in which each security trades; such securities not traded on the valuation date are valued at the mean of the latest quoted bid and asked prices. Securities for which market quotations are not readily available, or whose values have been affected by events occurring before the fund’s pricing time but after the close of the securities’ primary markets, are valued at their fair values calculated according to procedures adopted by the board of trustees. These procedures include obtaining quotations from an independent pricing service, monitoring news to identify significant market- or security-specific events, and evaluating changes in the va lues of foreign market proxies (for example, ADRs, futures contracts, or exchange-traded funds), between the time the foreign markets close and the fund’s pricing time. When fair-value pricing is employed, the prices of securities used by a fund to calculate its net asset value may differ from quoted or published prices for the same securities. Investments in Vanguard Market Liquidity Fund are valued at that fund’s net asset value. Temporary cash investments acquired over 60 days to maturity are valued using the latest bid prices or using valuations based on a matrix system (which considers such factors as security prices, yields, maturities, and ratings), both as furnished by independent pricing services. Other temporary cash investments are valued at amortized cost, which approximates market value.
2. Foreign Currency: Securities and other assets and liabilities denominated in foreign currencies are translated into U.S. dollars using exchange rates obtained from an independent third party as of the fund’s pricing time on the valuation date. Realized gains (losses) and unrealized appreciation (depreciation) on investment securities include the effects of changes in exchange rates since the securities were purchased, combined with the effects of changes in security prices. Fluctuations in the value of other assets and liabilities resulting from changes in exchange rates are recorded as unrealized foreign currency gains (losses) until the assets or liabilities are settled in cash, at which time they are recorded as realized foreign currency gains (losses).
3. Futures and Forward Currency Contracts: The fund uses index futures contracts to a limited extent, with the objective of maintaining full exposure to the stock market while maintaining liquidity. The fund may purchase or sell futures contracts to achieve a desired level of investment, whether to accommodate portfolio turnover or cash flows from capital share transactions. The primary risks associated with the use of futures contracts are imperfect correlation between changes in market values of stocks held by the fund and the prices of futures contracts, and the possibility of an illiquid market.
The fund may also enter into forward currency contracts to provide the appropriate currency exposure related to any open futures contracts or to protect the value of securities and related receivables and payables against changes in foreign exchange rates. The primary risk associated with the fund’s use of these contracts is that a counterparty will fail to fulfill its obligation to pay gains due to the fund under
23
International Growth Fund
the contracts. Counterparty risk is mitigated by entering into forward currency contracts only with highly rated counterparties, by a master netting arrangement between the fund and the counterparty, and by the posting of collateral by the counterparty. The forward currency contracts contain provisions whereby a counterparty may terminate open contracts if the fund’s net assets decline below a certain level, triggering a payment by the fund if the fund is in a net liability position at the time of the termination. The payment amount would be reduced by any collateral the fund has posted. Any securities posted as collateral for open contracts are noted in the Statement of Net Assets.
Futures and forward currency contracts are valued at their quoted daily settlement prices. The aggregate principal amounts of the contracts are not recorded in the Statement of Net Assets. Fluctuations in the value of the contracts are recorded in the Statement of Net Assets as an asset (liability) and in the Statement of Operations as unrealized appreciation (depreciation) until the contracts are closed, when they are recorded as realized gains (losses) on futures or forward currency contracts.
4. Federal Income Taxes: The fund intends to continue to qualify as a regulated investment company and distribute all of its taxable income. Management has analyzed the fund’s tax positions taken for all open federal income tax years (August 31, 2006–2009), and for the period ended February 28, 2010, and has concluded that no provision for federal income tax is required in the fund’s financial statements.
5. Distributions: Distributions to shareholders are recorded on the ex-dividend date.
6. Security Lending: The fund may lend its securities to qualified institutional borrowers to earn additional income. Security loans are required to be secured at all times by collateral at least equal to the market value of securities loaned. The fund invests cash collateral received in Vanguard Market Liquidity Fund, and records a liability for the return of the collateral, during the period the securities are on loan. Security lending income represents the income earned on investing cash collateral, less expenses associated with the loan.
7. Other: Dividend income is recorded on the ex-dividend date. Interest income includes income distributions received from Vanguard Market Liquidity Fund and is accrued daily. Security transactions are accounted for on the date securities are bought or sold. Costs used to determine realized gains (losses) on the sale of investment securities are those of the specific securities sold. Fees assessed on redemptions of capital shares are credited to paid-in capital.
Each class of shares has equal rights as to assets and earnings, except that each class separately bears certain class-specific expenses related to maintenance of shareholder accounts (included in Management and Administrative expenses) and shareholder reporting. Marketing and distribution expenses are allocated to each class of shares based on a method approved by the board of trustees. Income, other non-class-specific expenses, and gains and losses on investments are allocated to each class of shares based on its relative net assets.
B. Schroder Investment Management North America Inc., Baillie Gifford Overseas Ltd., and M&G Investment Management Ltd. each provide investment advisory services to a portion of the fund for a fee calculated at an annual percentage rate of average net assets managed by the advisor. The basic fees of Schroder Investment Management North America Inc. and Baillie Gifford Overseas Ltd. are subject to quarterly adjustments based on performance for the preceding three years relative to the Morgan Stanley Capital International Europe, Australasia, Far East Index. The basic fee of M&G Investment Management Ltd. is subject to quarterly adjustments based on the fund’s performance since February 29, 2008, relative to the MSCI All Country World Index excluding USA.
24
International Growth Fund
The Vanguard Group manages the cash reserves of the fund on an at-cost basis.
For the six months ended February 28, 2010, the aggregate investment advisory fee represented an effective annual basic rate of 0.13% of the fund’s average net assets, before an increase of $2,127,000 (0.03%) based on performance.
C. The Vanguard Group furnishes at cost corporate management, administrative, marketing, and distribution services. The costs of such services are allocated to the fund under methods approved by the board of trustees. The fund has committed to provide up to 0.40% of its net assets in capital contributions to Vanguard. At February 28, 2010, the fund had contributed capital of $3,024,000 to Vanguard (included in Other Assets), representing 0.02% of the fund’s net assets and 1.21% of Vanguard’s capitalization. The fund’s trustees and officers are also directors and officers of Vanguard.
D. The fund has asked its investment advisors to direct certain security trades, subject to obtaining the best price and execution, to brokers who have agreed to rebate to the fund part of the commissions generated. Such rebates are used solely to reduce the fund’s management and administrative expenses. For the six months ended February 28, 2010, these arrangements reduced the fund’s expenses by $100,000 (an annual rate of 0.00% of average net assets).
E. Various inputs may be used to determine the value of the fund’s investments. These inputs are summarized in three broad levels for financial statement purposes. The inputs or methodologies used to value securities are not necessarily an indication of the risk associated with investing in those securities.
Level 1—Quoted prices in active markets for identical securities.
Level 2—Other significant observable inputs (including quoted prices for similar securities, interest rates, prepayment speeds, credit risk, etc.).
Level 3—Significant unobservable inputs (including the fund’s own assumptions used to determine the fair value of investments).
The following table summarizes the fund’s investments as of February 28, 2010, based on the inputs used to value them:
| | | |
| | Level 1 | Level 2 | Level 3 |
| Investments | ($000) | ($000) | ($000) |
| Common Stocks—North and South America | 1,316,875 | — | — |
| Common Stocks—Other | 506,029 | 12,874,793 | — |
| Temporary Cash Investments | 611,930 | 51,958 | — |
| Futures Contracts—Liabilities1 | (3,271) | — | — |
| Forward Currency Contracts—Assets | 1,357 | — | — |
| Forward Currency Contracts—Liabilities | (14,989) | — | — |
| Total | 2,417,931 | 12,926,751 | — |
| 1 Represents variation margin on the last day of the reporting period. | | | |
25
International Growth Fund
F. At February 28, 2010, the fair values of derivatives were reflected in the Statement of Net Assets as follows:
| | | |
| | | Foreign | |
| | Equity | Exchange | |
| | Contracts1 | Contracts | Total |
| Statement of Net Assets Caption | ($000) | ($000) | ($000) |
| Other Assets | — | 1,357 | 1,357 |
| Liabilities | (3,271) | (14,989) | (18,260) |
| 1 Represents variation margin on the last day of the reporting period. | | | |
Realized net gain (loss) and the change in unrealized appreciation (depreciation) on derivatives for the six months ended February 28, 2010, were:
| | | |
| | | Foreign | |
| | Equity | Exchange | |
| | Contracts | Contracts | Total |
| Realized Net Gain (Loss) on Derivatives | ($000) | ($000) | ($000) |
| Futures Contracts | 71,603 | — | 71,603 |
| Forward Currency Contracts | — | 25,791 | 25,791 |
| Realized Net Gain (Loss) on Derivatives | 71,603 | 25,791 | 97,394 |
| |
| Change in Unrealized Appreciation | | | |
| (Depreciation) on Derivatives | | | |
| Futures Contracts | (71,277) | — | (71,277) |
| Forward Currency Contracts | — | (28,045) | (28,045) |
| Change in Unrealized Appreciation | | | |
| (Depreciation) on Derivatives | (71,277) | (28,045) | (99,322) |
At February 28, 2010, the aggregate settlement value of open futures contracts and the related unrealized appreciation (depreciation) were:
| | | | |
| | | | | ($000) |
| | | | Aggregate | |
| | | Number of | Settlement | Unrealized |
| | | Long (Short) | Value | Appreciation |
| Futures Contracts | Expiration | Contracts | Long (Short) | (Depreciation) |
| Dow Jones EURO STOXX 50 Index | March 2010 | 3,768 | 140,073 | (9,872) |
| FTSE 100 Index | March 2010 | 1,191 | 96,760 | 625 |
| Topix Index | March 2010 | 845 | 84,723 | (1,067) |
| S&P ASX 200 Index | March 2010 | 368 | 37,922 | (656) |
Unrealized appreciation (depreciation) on open FTSE 100 Index futures contracts is required to be treated as realized gain (loss) for tax purposes.
26
International Growth Fund
At February 28, 2010, the fund had open forward currency contracts to receive and deliver currencies as follows. Unrealized appreciation (depreciation) on open forward currency contracts is treated as realized gain (loss) for tax purposes.
| | | | |
| | | | | Unrealized |
| | | | | Appreciation |
| | | | Contract Amount (000) | (Depreciation) |
| Contract Settlement Date | | Receive | Deliver | ($000) |
| 3/24/10 | EUR | 112,089 | USD 152,895 | (8,322) |
| 3/24/10 | GBP | 63,432 | USD 96,580 | (6,141) |
| 3/17/10 | JPY | 7,528,259 | USD 84,731 | 967 |
| 3/24/10 | AUD | 43,183 | USD 38,564 | (136) |
| AUD—Australian dollar. | | | | |
| EUR—Euro. | | | | |
| GBP—British pound. | | | | |
| JPY—Japanese yen. | | | | |
| USD—U.S. dollar. | | | | |
The fund had net unrealized foreign currency gains of $455,000 resulting from the translation of other assets and liabilities at February 28, 2010.
G. Distributions are determined on a tax basis and may differ from net investment income and realized capital gains for financial reporting purposes. Differences may be permanent or temporary. Permanent differences are reclassified among capital accounts in the financial statements to reflect their tax character. Temporary differences arise when certain items of income, expense, gain, or loss are recognized in different periods for financial statement and tax purposes; these differences will reverse at some time in the future. Differences in classification may also result from the treatment of short-term gains as ordinary income for tax purposes.
During the six months ended February 28, 2010, the fund realized net foreign currency losses of $551,000, which decreased distributable net income for tax purposes; accordingly, such losses have been reclassified from accumulated net realized losses to undistributed net investment income. Certain of the fund’s investments are in securities considered to be “passive foreign investment companies,” for which any unrealized appreciation and/or realized gains are required to be included in distributable net income for tax purposes. Unrealized appreciation through October 31, 2009, on passive foreign investment company holdings at February 28, 2010, was $547,000, all of which has been distributed and is reflected in the balance of undistributed net investment income.
The fund’s tax-basis capital gains and losses are determined only at the end of each fiscal year. For tax purposes, at August 31, 2009, the fund had available capital loss carryforwards totaling $1,198,712,000 to offset future net capital gains through August 31, 2017. In addition, the fund realized losses of $2,008,606,000 during the period from November 1, 2008, through August 31, 2009, which are deferred and will be treated as realized for tax purposes in fiscal 2010. The fund will use these capital losses to offset net taxable capital gains, if any, realized during the year ending August 31, 2010; should the fund realize net capital losses for the year, the losses will be added to the loss carryforward balances above.
27
International Growth Fund
At February 28, 2010, the cost of investment securities for tax purposes was $14,189,593,000. Net unrealized appreciation of investment securities for tax purposes was $1,171,992,000, consisting of unrealized gains of $2,270,185,000 on securities that had risen in value since their purchase and $1,098,193,000 in unrealized losses on securities that had fallen in value since their purchase.
H. During the six months ended February 28, 2010, the fund purchased $3,882,872,000 of investment securities and sold $3,187,935,000 of investment securities, other than temporary cash investments.
I. Capital share transactions for each class of shares were:
| | | | |
| | Six Months Ended | | Year Ended |
| | February 28, 2010 | August 31, 2009 |
| | Amount | Shares | Amount | Shares |
| | ($000) | (000) | ($000) | (000) |
| Investor Shares | | | | |
| Issued | 1,081,808 | 64,228 | 1,791,374 | 133,321 |
| Issued in Lieu of Cash Distributions | 182,857 | 10,852 | 819,473 | 67,224 |
| Redeemed1 | (907,392) | (54,378) | (1,818,710) | (136,394) |
| Net Increase (Decrease)—Investor Shares | 357,273 | 20,702 | 792,137 | 64,151 |
| Admiral Shares | | | | |
| Issued | 533,723 | 9,984 | 676,458 | 16,117 |
| Issued in Lieu of Cash Distributions | 72,968 | 1,361 | 312,461 | 8,068 |
| Redeemed1 | (338,515) | (6,339) | (838,285) | (20,055) |
| Net Increase (Decrease)—Admiral Shares | 268,176 | 5,006 | 150,634 | 4,130 |
| 1 Net of redemption fees for fiscal 2010 and 2009 of $454,000 and $888,000, respectively (fund totals). | | |
J. In preparing the financial statements as of February 28, 2010, management considered the impact of subsequent events for potential recognition or disclosure in these financial statements.
28
About Your Fund’s Expenses
As a shareholder of the fund, you incur ongoing costs, which include costs for portfolio management, administrative services, and shareholder reports (like this one), among others. Operating expenses, which are deducted from a fund’s gross income, directly reduce the investment return of the fund.
A fund’s expenses are expressed as a percentage of its average net assets. This figure is known as the expense ratio. The following examples are intended to help you understand the ongoing costs (in dollars) of investing in your fund and to compare these costs with those of other mutual funds. The examples are based on an investment of $1,000 made at the beginning of the period shown and held for the entire period.
The accompanying table illustrates your fund’s costs in two ways:
• Based on actual fund return. This section helps you to estimate the actual expenses that you paid over the period. The ”Ending Account Value“ shown is derived from the fund‘s actual return, and the third column shows the dollar amount that would have been paid by an investor who started with $1,000 in the fund. You may use the information here, together with the amount you invested, to estimate the expenses that you paid over the period.
To do so, simply divide your account value by $1,000 (for example, an $8,600 account value divided by $1,000 = 8.6), then multiply the result by the number given for your fund under the heading ”Expenses Paid During Period.“
• Based on hypothetical 5% yearly return. This section is intended to help you compare your fund‘s costs with those of other mutual funds. It assumes that the fund had a yearly return of 5% before expenses, but that the expense ratio is unchanged. In this case—because the return used is not the fund’s actual return—the results do not apply to your investment. The example is useful in making comparisons because the Securities and Exchange Commission requires all mutual funds to calculate expenses based on a 5% return. You can assess your fund’s costs by comparing this hypothetical example with the hypothetical examples that appear in shareholder reports of other funds.
Note that the expenses shown in the table are meant to highlight and help you compare ongoing costs only and do not reflect transaction costs incurred by the fund for buying and selling securities. Further, the expenses do not include the 2% fee on redemptions of shares held for less than two months, nor do they include the account service fee described in the prospectus. If such fees were applied to your account, your costs would be higher. Your fund does not carry a ”sales load.” The calculations assume no shares were bought or sold during the period. Your actual costs may have been higher or lower, depending on the amount of your investment and the timing of any purchases or redemptions.
You can find more information about the fund’s expenses, including annual expense ratios, in the Financial Statements section of this report. For additional information on operating expenses and other shareholder costs, please refer to your fund’s current prospectus.
29
| | | |
| Six Months Ended February 28, 2010 | | | |
| | Beginning | Ending | Expenses |
| | Account Value | Account Value | Paid During |
| International Growth Fund | 8/31/2009 | 2/28/2010 | Period |
| Based on Actual Fund Return | | | |
| Investor Shares | $1,000.00 | $1,050.59 | $2.64 |
| Admiral Shares | 1,000.00 | 1,051.56 | 1.68 |
| Based on Hypothetical 5% Yearly Return | | | |
| Investor Shares | $1,000.00 | $1,022.22 | $2.61 |
| Admiral Shares | 1,000.00 | 1,023.16 | 1.66 |
The calculations are based on expenses incurred in the most recent six-month period. The fund’s annualized six-month expense ratios for that period are 0.52% for Investor Shares and 0.33% for Admiral Shares. The dollar amounts shown as “Expenses Paid” are equal to the annualized expense ratio multiplied by the average account value over the period, multiplied by the number of days in the most recent six-month period, then divided by the number of days in the most recent 12-month period.
30
Trustees Approve Advisory Agreements
The board of trustees of Vanguard International Growth Fund has renewed the fund’s investment advisory agreements with Schroder Investment Management North America Inc. (Schroder Inc.), Baillie Gifford Overseas Ltd., and M&G Investment Management Limited, as well as the sub-advisory agreement with Schroder Investment Management North America Ltd. The board determined that the retention of the advisors was in the best interests of the fund and its shareholders.
The board based its decision upon an evaluation of each advisor’s investment staff, portfolio management process, and performance. The trustees considered the factors discussed below, among others. However, no single factor determined whether the board approved the agreements. Rather, it was the totality of the circumstances that drove the board’s decision.
Nature, extent, and quality of services
The board considered the quality of the fund’s investment management over both the short and long term, and took into account the organizational depth and stability of each advisor. The board noted the following:
Schroder Investment Management North America Inc. Schroder Inc. is a subsidiary of Schroders plc., a firm founded more than 200 years ago, with investment management experience dating back to 1926. The advisor employs a sound process, selecting attractive growth stocks from developed and emerging markets outside the United States. Stocks are chosen using a bottom-up approach supported by Schroder’s worldwide network of analysts, economists, and strategists. The firm has advised the fund since its inception in 1981.
Baillie Gifford Overseas Ltd. Baillie Gifford, a unit of Baillie Gifford & Co., founded in 1908, is among the largest independently owned investment management firms in the United Kingdom. The advisor employs a sound process to build a diversified portfolio of high-quality non-U.S. growth stocks from developed and emerging markets. Stocks are selected using fundamental research conducted by Baillie Gifford’s Edinburgh-based analysts. The firm has advised a portion of the International Growth Fund since 2003.
M&G Investment Management Limited. M&G, founded in 1931, is based in London, England, and specializes in managing equity and fixed income portfolios for both institutional and retail clients worldwide. The advisor employs a sound process to build a diversified portfolio of high-quality, non-U.S. growth stocks from developed and emerging markets. The advisor’s global equity team—made up of the portfolio managers, Greg Aldridge and Graham French, and eight other portfolio managers/analysts—conducts intensive fundamental analysis on companies, including regular company visits. The firm has advised a portion of the fund since 2008.
The board concluded that each advisor’s experience, stability, depth, and performance, among other factors, warranted continuation of the advisory agreements.
Investment performance
The board considered the short- and long-term performance of the fund, including any periods of outperformance or underperformance of a relevant benchmark and peer group. The board concluded that the advisors have carried out the fund’s investment strategy in a disciplined fashion, and the performance results have allowed the fund to remain competitive versus its benchmark and its average peer fund. Information about the fund’s most recent performance can be found in the Performance Summary section of this report.
31
Cost
The board concluded that the fund’s expense ratio was well below the average expense ratio charged by funds in its peer group and that the fund’s advisory fee rate was also well below its peer-group average. Information about the fund’s expense ratio appears in the About Your Fund’s Expenses section of this report as well as in the Financial Statements section, which also includes information about the fund’s advisory fee rate.
The board did not consider profitability of the fund’s advisors in determining whether to approve the advisory fees, because the firms are independent of Vanguard and the advisory fees are the result of arm’s-length negotiations.
The benefit of economies of scale
The board concluded that the fund’s shareholders benefit from economies of scale because of breakpoints in the fund’s advisory fee schedules. The breakpoints reduce the effective rate of the fee as the fund’s assets managed by each firm increase.
The board will consider whether to renew the advisory agreements again after a one-year period.
32
Glossary
Beta. A measure of the magnitude of a fund’s past share-price fluctuations in relation to the ups and downs of a given market index. The index is assigned a beta of 1.00. Compared with a given index, a fund with a beta of 1.20 typically would have seen its share price rise or fall by 12% when the index rose or fell by 10%. For this report, beta is based on returns over the past 36 months for both the fund and the index. Note that a fund’s beta should be reviewed in conjunction with its R-squared (see definition). The lower the R-squared, the less correlation there is between the fund and the index, and the less reliable beta is as an indicator of volatility.
Dividend Yield. Dividend income earned by stocks, expressed as a percentage of the aggregate market value (or of net asset value, for a fund). The yield is determined by dividing the amount of the annual dividends by the aggregate value (or net asset value) at the end of the period. For a fund, the dividend yield is based solely on stock holdings and does not include any income produced by other investments.
Earnings Growth Rate. The average annual rate of growth in earnings over the past five years for the stocks now in a fund.
Equity Exposure. A measure that reflects a fund’s investments in stocks and stock futures. Any holdings in short-term reserves are excluded.
Expense Ratio. The percentage of a fund’s average net assets used to pay its annual administrative and advisory expenses. These expenses directly reduce returns to investors.
Inception Date. The date on which the assets of a fund (or one of its share classes) are first invested in accordance with the fund’s investment objective. For funds with a subscription period, the inception date is the day after that period ends. Investment performance is measured from the inception date.
Median Market Cap. An indicator of the size of companies in which a fund invests; the midpoint of market capitalization (market price x shares outstanding) of a fund’s stocks, weighted by the proportion of the fund’s assets invested in each stock. Stocks representing half of the fund’s assets have market capitalizations above the median, and the rest are below it.
Price/Book Ratio. The share price of a stock divided by its net worth, or book value, per share. For a fund, the weighted average price/book ratio of the stocks it holds.
Price/Earnings Ratio. The ratio of a stock’s current price to its per-share earnings over the past year. For a fund, the weighted average P/E of the stocks it holds. P/E is an indicator of market expectations about corporate prospects; the higher the P/E, the greater the expectations for a company’s future growth.
R-Squared. A measure of how much of a fund’s past returns can be explained by the returns from the market in general, as measured by a given index. If a fund’s total returns were precisely synchronized with an index’s returns, its R-squared would be 1.00. If the fund’s returns bore no relationship to the index’s returns, its R-squared would be 0. For this report, R-squared is based on returns over the past 36 months for both the fund and the index.
Return on Equity. The annual average rate of return generated by a company during the past five years for each dollar of shareholder’s equity (net income divided by shareholder’s equity). For a fund, the weighted average return on equity for the companies whose stocks it holds.
33
Short-Term Reserves. The percentage of a fund invested in highly liquid, short-term securities that can be readily converted to cash.
Turnover Rate. An indication of the fund’s trading activity. Funds with high turnover rates incur higher transaction costs and may be more likely to distribute capital gains (which may be taxable to investors). The turnover rate excludes in-kind transactions, which have minimal impact on costs.
34
This page intentionally left blank.
The People Who Govern Your Fund
The trustees of your mutual fund are there to see that the fund is operated and managed in your best interests since, as a shareholder, you are a part owner of the fund. Your fund’s trustees also serve on the board of directors of The Vanguard Group, Inc., which is owned by the Vanguard funds and provides services to them on an at-cost basis.
A majority of Vanguard’s board members are independent, meaning that they have no affiliation with Vanguard or the funds they oversee, apart from the sizable personal investments they have made as private individuals. The independent board members have distinguished backgrounds in business, academia, and public service. Each of the trustees and executive officers oversees 161 Vanguard funds.
The following table provides information for each trustee and executive officer of the fund. More information about the trustees is in the Statement of Additional Information, which can be obtained, without charge, by contacting Vanguard at 800-662-7447, or online at www.vanguard.com.
| |
| Interested Trustee1 | Rajiv L. Gupta |
| | Born 1945. Trustee Since December 2001.2 Principal |
| F. William McNabb III | Occupation(s) During the Past Five Years: Chairman |
| Born 1957. Trustee Since July 2009. Chairman of the | and Chief Executive Officer (retired 2009) and |
| Board. Principal Occupation(s) During the Past Five | President (2006–2008) of Rohm and Haas Co. |
| Years: Chairman of the Board of The Vanguard Group, | (chemicals); Board Member of American Chemistry |
| Inc., and of each of the investment companies served | Council; Director of Tyco International, Ltd. (diversified |
| by The Vanguard Group, since January 2010; Director | manufacturing and services) and Hewlett-Packard Co. |
| of The Vanguard Group since 2008; Chief Executive | (electronic computer manufacturing); Trustee of The |
| Officer and President of The Vanguard Group and of | Conference Board. |
| each of the investment companies served by The | |
| Vanguard Group since 2008; Director of Vanguard | Amy Gutmann |
| Marketing Corporation; Managing Director of The | Born 1949. Trustee Since June 2006. Principal |
| Vanguard Group (1995–2008). | Occupation(s) During the Past Five Years: President |
| | of the University of Pennsylvania; Christopher H. |
| | Browne Distinguished Professor of Political Science |
| Independent Trustees | in the School of Arts and Sciences with secondary |
| | appointments at the Annenberg School for Commu- |
| Emerson U. Fullwood | nication and the Graduate School of Education of |
| Born 1948. Trustee Since January 2008. Principal | the University of Pennsylvania; Director of Carnegie |
| Occupation(s) During the Past Five Years: Executive | Corporation of New York, Schuylkill River Development |
| Chief Staff and Marketing Officer for North America | Corporation, and Greater Philadelphia Chamber of |
| and Corporate Vice President (retired 2008) of Xerox | Commerce; Trustee of the National Constitution Center. |
| Corporation (document management products and | |
| services); Director of SPX Corporation (multi-industry | |
| manufacturing), the United Way of Rochester, the | |
| Boy Scouts of America, Amerigroup Corporation | |
| (managed health care), and Monroe Community | |
| College Foundation. | |
| | |
| JoAnn Heffernan Heisen | Executive Officers | |
| Born 1950. Trustee Since July 1998. Principal | | |
| Occupation(s) During the Past Five Years: Corporate | Thomas J. Higgins | |
| Vice President and Chief Global Diversity Officer since | Born 1957. Chief Financial Officer Since September |
| 2006 (retired 2008) and Member of the Executive | 2008. Principal Occupation(s) During the Past Five |
| Committee (retired 2008) of Johnson & Johnson | Years: Principal of The Vanguard Group, Inc.; Chief |
| (pharmaceuticals/consumer products); Vice President | Financial Officer of each of the investment companies |
| and Chief Information Officer of Johnson & Johnson | served by The Vanguard Group since 2008; Treasurer |
| (1997–2005); Director of the University Medical Center | of each of the investment companies served by The |
| at Princeton and Women’s Research and Education | Vanguard Group (1998–2008). |
| Institute; Member of the Advisory Board of the | | |
| Maxwell School of Citizenship and Public Affairs | Kathryn J. Hyatt | |
| at Syracuse University. | Born 1955. Treasurer Since November 2008. Principal |
| | Occupation(s) During the Past Five Years: Principal |
| F. Joseph Loughrey | of The Vanguard Group, Inc.; Treasurer of each of |
| Born 1949. Trustee Since October 2009. Principal | the investment companies served by The Vanguard |
| Occupation(s) During the Past Five Years: President | Group since 2008; Assistant Treasurer of each of the |
| and Chief Operating Officer since 2005 (retired 2009) | investment companies served by The Vanguard Group |
| and Vice Chairman of the Board (2008–2009) of | (1988–2008). | |
| Cummins Inc. (industrial machinery); Director of | | |
| SKF AB (industrial machinery), Hillenbrand, Inc. | Heidi Stam | |
| (specialized consumer services), Sauer-Danfoss Inc. | Born 1956. Secretary Since July 2005. Principal |
| (machinery), the Lumina Foundation for Education, | Occupation(s) During the Past Five Years: Managing |
| and the Columbus Community Education Coalition; | Director of The Vanguard Group, Inc., since 2006; |
| Chairman of the Advisory Council for the College of | General Counsel of The Vanguard Group since 2005; |
| Arts and Letters at the University of Notre Dame. | Secretary of The Vanguard Group and of each of the |
| | investment companies served by The Vanguard Group |
| André F. Perold | since 2005; Director and Senior Vice President of |
| Born 1952. Trustee Since December 2004. Principal | Vanguard Marketing Corporation since 2005; |
| Occupation(s) During the Past Five Years: George | Principal of The Vanguard Group (1997–2006). |
| Gund Professor of Finance and Banking at the Harvard | | |
| Business School; Chair of the Investment Committee | | |
| of HighVista Strategies LLC (private investment firm). | Vanguard Senior Management Team |
| |
| Alfred M. Rankin, Jr. | R. Gregory Barton | Michael S. Miller |
| Born 1941. Trustee Since January 1993. Principal | Mortimer J. Buckley | James M. Norris |
| Occupation(s) During the Past Five Years: Chairman, | Kathleen C. Gubanich | Glenn W. Reed |
| President, and Chief Executive Officer of NACCO | Paul A. Heller | George U. Sauter |
| Industries, Inc. (forklift trucks/housewares/lignite); | | |
| Director of Goodrich Corporation (industrial products/ | | |
| aircraft systems and services); Deputy Chairman | Chairman Emeritus and Senior Advisor |
| of the Federal Reserve Bank of Cleveland; Trustee | | |
| of University Hospitals of Cleveland, The Cleveland | John J. Brennan | |
| Museum of Art, and Case Western Reserve University. | Chairman, 1996–2009 | |
| | Chief Executive Officer and President, 1996–2008 |
| Peter F. Volanakis | | |
| Born 1955. Trustee Since July 2009. Principal | | |
| Occupation(s) During the Past Five Years: President | Founder | |
| since 2007 and Chief Operating Officer since 2005 | | |
| of Corning Incorporated (communications equipment); | John C. Bogle | |
| President of Corning Technologies (2001–2005); | Chairman and Chief Executive Officer, 1974–1996 |
| Director of Corning Incorporated and Dow Corning; | | |
| Trustee of the Corning Incorporated Foundation and | | |
| the Corning Museum of Glass; Overseer of the | | |
| Amos Tuck School of Business Administration at | | |
| Dartmouth College. | | |
1 Mr. McNabb is considered an “interested person,” as defined in the Investment Company Act of 1940, because he is an officer of the Vanguard funds.
2 December 2002 for Vanguard Equity Income Fund, Vanguard Growth Equity Fund, the Vanguard Municipal Bond Funds, and the Vanguard State Tax-Exempt Funds.
|  |
| P.O. Box 2600 |
| Valley Forge, PA 19482-2600 |
Connect with Vanguard® > www.vanguard.com
| Fund Information > 800-662-7447 | |
| CFA® is a trademark owned by CFA Institute. |
| Direct Investor Account Services > 800-662-2739 | |
| |
| Institutional Investor Services > 800-523-1036 | |
| |
| Text Telephone for People | |
| With Hearing Impairment > 800-749-7273 | |
| |
| This material may be used in conjunction | |
| with the offering of shares of any Vanguard | |
| fund only if preceded or accompanied by | |
| the fund’s current prospectus. | |
| |
| All comparative mutual fund data are from Lipper Inc. or | |
| Morningstar, Inc., unless otherwise noted. | |
| |
| You can obtain a free copy of Vanguard’s proxy voting | |
| guidelines by visiting our website, www.vanguard.com, | |
| and searching for “proxy voting guidelines,” or by calling | |
| Vanguard at 800-662-2739. The guidelines are also | |
| available from the SEC’s website, www.sec.gov. In | |
| addition, you may obtain a free report on how your fund | |
| voted the proxies for securities it owned during the 12 | |
| months ended June 30. To get the report, visit either | |
| www.vanguard.com or www.sec.gov. | |
| |
| You can review and copy information about your fund at | |
| the SEC’s Public Reference Room in Washington, D.C. To | |
| find out more about this public service, call the SEC at | |
| 202-551-8090. Information about your fund is also | |
| available on the SEC’s website, and you can receive | |
| copies of this information, for a fee, by sending a | |
| request in either of two ways: via e-mail addressed to | |
| publicinfo@sec.gov or via regular mail addressed to the | |
| Public Reference Section, Securities and Exchange | |
| Commission, Washington, DC 20549-1520. | |
| © 2010 The Vanguard Group, Inc. |
| All rights reserved. |
| Vanguard Marketing Corporation, Distributor. |
| |
| Q812 042010 |
 |
| Vanguard FTSE Social Index Fund |
| Semiannual Report |
|
> Vanguard FTSE Social Index Fund returned about 9% for the fiscal half-year ended February 28, 2010, as stock prices continued to rise.
> The socially screened index was heavily exposed to the relatively weak financial sector, keeping the fund a few steps behind the broad market.
> Much of the fund’s strength reflected solid performances from information technology and consumer discretionary stocks, which benefited from an improving economic outlook.
| |
| Contents | |
| Your Fund’s Total Returns. | 1 |
| Chairman’s Letter. | 2 |
| Fund Profile. | 7 |
| Performance Summary. | 8 |
| Financial Statements. | 9 |
| About Your Fund’s Expenses. | 21 |
| Glossary. | 23 |
Please note: The opinions expressed in this report are just that—informed opinions. They should not be considered promises or advice. Also, please keep in mind that the information and opinions cover the period through the date on the front of this report. Of course, the risks of investing in your fund are spelled out in the prospectus.
See the Glossary for definitions of investment terms used in this report.
Cover photograph: Veronica Coia.
| | | | |
| Your Fund’s Total Returns | | | | |
| |
| |
| |
| |
| Six Months Ended February 28, 2010 | | | | |
| | | | | Total |
| | | | | Returns |
| Vanguard FTSE Social Index Fund | | | | |
| Investor Shares | | | | 9.02% |
| Institutional Shares | | | | 9.14 |
| FTSE4Good US Select Index | | | | 9.19 |
| Large-Cap Growth Funds Average | | | | 10.13 |
| Large-Cap Growth Funds Average: Derived from data provided by Lipper Inc. | | | |
| Institutional Shares carry lower costs and are available for a minimum investment of $5 million. | | |
| |
| Your Fund’s Performance at a Glance | | | | |
| August 31, 2009 , Through February 28, 2010 | | | | |
| | | | Distributions Per Share |
| | Starting | Ending | Income | Capital |
| | Share Price | Share Price | Dividends | Gains |
| Vanguard FTSE Social Index Fund | | | | |
| Investor Shares | $6.20 | $6.69 | $0.068 | $0.000 |
| Institutional Shares | 6.20 | 6.69 | 0.075 | 0.000 |
1

Chairman’s Letter
Dear Shareholder,
For the six months ended February 28, 2010, the FTSE Social Index Fund returned about 9%, in line with its benchmark index. Like its index, the fund finished about 1 percentage point behind the broad U.S. market, as the fund’s comparatively heavy representation in financial stocks—almost twice that of the market—weighed on performance. The fund also finished a bit behind the average return of large-capitalization growth funds.
Stock markets caught their breath at the end of a solid six months
For the six months, the broad U.S. stock market returned about 10%. The rally seemed to downshift toward the end of the period, as the investor relief that lifted markets higher a year ago gave way to sober-minded assessment of corporate earnings-growth prospects.
Smaller-capitalization stocks did a little better than larger-cap stocks, and growth-oriented securities bested their value-oriented counterparts, but the uniformity of returns from different market segments was more striking than the differences.
International stocks produced more modest returns. In Europe, the precarious financial health of Greece and that of smaller economies such as Portugal and Ireland weighed on the markets. In Asia, the Japanese stock market’s weakness
2
held back results for Asia Pacific indexes. Emerging market stocks continued to outpace those from developed markets.
Yields remained low, but Fed began to unwind rescue programs
The yields of longer-term U.S. Treasury bonds rose during the past six months, while those of the shortest-term securities remained near 0%. Although the Federal Reserve Board expects to keep its target for short-term interest rates close to 0% for “an extended period,” it began to wind down credit programs established during the financial crisis. The Fed’s most dramatic (though largely symbolic) act was to raise the interest rate at its discount window, a lending facility designed to help commercial banks and other depository institutions meet emergency short-term funding needs.
The broad taxable bond market returned 3.19%, with notable strength in corporate bonds. The broad municipal bond market returned 4.13%.
Weakness in financial services, but strength in tech
The fund seeks to track the return of the FTSE4Good US Select Index, which is made up of companies that, according to the index provider, work to protect the environment, have fair hiring and promotion practices for women and minorities, and maintain safe and healthy workplace
| | | |
| Market Barometer | | | |
| |
| | | | Total Returns |
| | | Periods Ended February 28, 2010 |
| | Six | One | Five Years |
| | Months | Year | (Annualized) |
| Stocks | | | |
| Russell 1000 Index (Large-caps) | 9.91% | 55.32% | 0.77% |
| Russell 2000 Index (Small-caps) | 10.59 | 63.95 | 1.16 |
| Dow Jones U.S. Total Stock Market Index | 10.23 | 56.38 | 1.20 |
| MSCI All Country World Index ex USA (International) | 3.83 | 63.51 | 4.60 |
| |
| Bonds | | | |
| Barclays Capital U.S. Aggregate Bond Index (Broad | | | |
| taxable market) | 3.19% | 9.32% | 5.36% |
| Barclays Capital Municipal Bond Index | 4.13 | 9.98 | 4.50 |
| Citigroup Three-Month U.S. Treasury Bill Index | 0.06 | 0.14 | 2.81 |
| |
| CPI | | | |
| Consumer Price Index | 0.42% | 2.14% | 2.48% |
3
policies. The resulting portfolio is weighted substantially in financial, information technology, health care, and consumer discretionary stocks. Conversely, the fund has relatively modest exposure to the energy sector and therefore benefited little from the strong performance of those energy stocks it did hold. The sector’s surge was powered by rising energy demand as the global economy began to recover.
The fund’s financial stocks, which accounted, on average, for almost 30% of assets, posted anemic returns for the six months. While regional bank stocks registered acceptable gains as the economy stabilized, stocks of some bigger banks lagged. The combination of continued hefty loan losses at those larger institutions and the prospect of regulatory reform that could limit banks’ future activities restrained performance. Insurance company stocks also had less-than-stellar returns, in part because of concerns in the market over investment losses in their portfolios.
Information technology stocks, also about 30% of the fund’s assets, on average, during the half-year, did well almost across the board. Although tech stocks were battered as the recession raged and corporate buyers slashed spending on computers and other technology investments, that trend has now reversed. Companies that
| | | |
| Expense Ratios | | | |
| Your Fund Compared With Its Peer Group | | | |
| | Investor | Institutional | Peer Group |
| | Shares | Shares | Average |
| FTSE Social Index Fund | 0.29% | 0.16% | 1.37% |
The fund expense ratios shown are from the prospectus dated December 28, 2009, and represent estimated costs for the current fiscal year based on the fund’s net assets as of the prospectus date. For the six months ended February 28, 2010, the annualized expense ratios were 0.29% for Investor Shares and 0.16% for Institutional Shares. The peer-group expense ratio is derived from data provided by Lipper Inc. and captures information through year-end 2009.
Peer group: Large-Cap Growth Funds.
4
had tightened their belts seem likely to begin upgrading equipment and software, a shift that has boosted the outlook for the tech sector. The pickup of the overall economy also gave a shot in the arm to consumer discretionary stocks, particularly specialty retailers, and even stocks of hotels, resorts, and cruise lines. While few would foresee a return to the “go-go” consumer spending that propelled the economy a few years ago, indicators that consumers are opening their wallets a bit more buoyed the sector’s stocks.
The fund’s health care stocks also turned in performances that outstripped that of the overall market. In late March, President Obama signed an overhaul of the U.S. health care system into law, but investors seem to have already concluded that reform is unlikely to damage the prospects of most companies in the industry, a factor that bolstered returns for those stocks.
Real-world lessons in the value of balance and perspective
The six months ended February 28, 2010, marked a continuation of the stock market rally that has been under way since March 2009. The nearly 12-month rebound is a welcome reprieve from the previous two years, when just about all equity investors, including shareholders in the FTSE Social Index Fund, endured painful losses.
The lessons of that punishing period and of the recent recovery serve as a reminder—albeit a potentially harsh one—of the importance of maintaining a long-term outlook on investing. Investors who panicked during the market declines of 2008 and early 2009 and sold their stock portfolios missed the robust returns of the last 12 months. Trying to time the up and down movements of the market can be a dangerous and money-losing strategy.
As the economy shows signs of solid recovery, investors are clearly more optimistic. But even if market performance is less volatile in the near term, there are certain to be periods of strong returns followed by painful retreats. That’s why, as always, investors need to focus on building a well-diversified portfolio of stock, bond, and money market holdings that matches their investing goals and time horizon. Such an approach puts you in a position to participate in the stock market’s long-term potential for growth, while providing some protection from its inevitable periods of decline.
The FTSE Social Index Fund can be an important component of such a long-term portfolio. In particular, for investors who prefer to invest in companies that meet strict social and environmental standards, the fund can form a key element of a socially conscious investment strategy that also keeps costs in check.
5
On another matter, I would like to inform you that as of January 1, 2010, we completed a leadership transition that began in March 2008. I succeeded Jack Brennan as chairman of Vanguard and each of the funds. Jack has agreed to serve as chairman emeritus and senior advisor. Under Jack’s leadership, Vanguard has grown to become a preeminent firm in the mutual fund industry. Jack’s energy, his relentless pursuit of perfection, and his unwavering focus on always doing the right thing for our clients are evident in every facet of Vanguard policy today.
Thank you for entrusting your assets to Vanguard.
Sincerely,

F. William McNabb III
Chairman and Chief Executive Officer
March 24, 2010
FTSE Social Index Fund
Fund Profile
As of February 28, 2010
| | |
| Share-Class Characteristics | | |
| | Investor | Institutional |
| | Shares | Shares |
| Ticker Symbol | VFTSX | VFTNX |
| Expense Ratio1 | 0.29% | 0.16% |
| 30-Day SEC Yield | 0.86% | 0.99% |
| | | |
| Portfolio Characteristics | | |
| | | FTSE | DJ |
| | | 4Good | U.S. Total |
| | | US Select | Market |
| | Fund | Index | Index |
| Number of Stocks | 305 | 307 | 4,178 |
| Median Market Cap | $29.0B | $28.7B | $29.9B |
| Price/Earnings Ratio | 23.0x | 22.8x | 21.5x |
| Price/Book Ratio | 2.0x | 2.0x | 2.1x |
| Return on Equity | 18.9% | 18.9% | 19.3% |
| Earnings Growth Rate | 7.6% | 7.8% | 7.8% |
| Dividend Yield | 1.2% | 1.2% | 1.8% |
| Foreign Holdings | 0.0% | 0.0% | 0.0% |
| Turnover Rate | | | |
| (Annualized) | 35% | — | — |
| Short-Term Reserves | 0.6% | — | — |
| | | |
| Sector Diversification (% of equity exposure) |
| | | FTSE | DJ |
| | | 4Good | U.S. Total |
| | | US Select | Market |
| | Fund | Index | Index |
| Consumer | | | |
| Discretionary | 9.5% | 9.5% | 10.7% |
| Consumer Staples | 9.3 | 9.5 | 10.1 |
| Energy | 1.3 | 1.3 | 10.4 |
| Financials | 29.5 | 29.1 | 16.8 |
| Health Care | 14.8 | 15.0 | 12.7 |
| Industrials | 2.6 | 2.6 | 10.7 |
| Information | | | |
| Technology | 29.8 | 29.8 | 18.4 |
| Materials | 1.1 | 1.1 | 3.9 |
| Telecommunication | | | |
| Services | 1.7 | 1.7 | 2.7 |
| Utilities | 0.4 | 0.4 | 3.6 |
| | |
| Volatility Measures | | |
| | FTSE | DJ |
| | 4Good | U.S. Total |
| | US Select | Market |
| | Index | Index |
| R-Squared | 1.00 | 0.97 |
| Beta | 1.00 | 1.14 |
These measures show the degree and timing of the fund’s fluctuations compared with the indexes over 36 months.
| | |
| Ten Largest Holdings (% of total net assets) |
| Procter & Gamble Co. | Household | |
| | Products | 4.3% |
| Apple Inc. | Computer | |
| | Hardware | 4.2 |
| Bank of America Corp. | Diversified Financial | |
| | Services | 3.8 |
| JPMorgan Chase & Co. | Diversified Financial | |
| | Services | 3.8 |
| Cisco Systems Inc. | Communications | |
| | Equipment | 3.2 |
| Wells Fargo & Co. | Diversified Banks | 3.2 |
| Google Inc. Class A | Internet Software & | |
| | Services | 2.9 |
| Oracle Corp. | Systems Software | 2.8 |
| Intel Corp. | Semiconductors | 2.6 |
| McDonald's Corp. | Restaurants | 1.6 |
| Top Ten | | 32.4% |
The holdings listed exclude any temporary cash investments and equity index products.
Investment Focus

1 The expense ratios shown are from the prospectus dated December 28, 2009, and represent estimated costs for the current fiscal year based on the fund’s net assets as of the prospectus date. For the six months ended February 28, 2010, the annualized expense ratios were 0.29% for Investor Shares and 0.16% for Institutional Shares.
7
FTSE Social Index Fund
Performance Summary
All of the returns in this report represent past performance, which is not a guarantee of future results that may be achieved by the fund. (Current performance may be lower or higher than the performance data cited. For performance data current to the most recent month-end, visit our website at www.vanguard.com/performance.) Note, too, that both investment returns and principal value can fluctuate widely, so an investor’s shares, when sold, could be worth more or less than their original cost. The returns shown do not reflect taxes that a shareholder would pay on fund distributions or on the sale of fund shares.
Fiscal-Year Total Returns (%): May 31, 2000, Through February 28, 2010
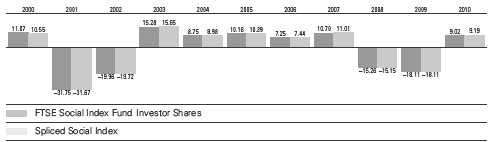
Spliced Social Index: Calvert Social Index though December 16, 2005; FTSE4Good US Select Index thereafter.
Note: For 2010, performance data reflect the six months ended February 28, 2010.
Average Annual Total Returns: Periods Ended December 31, 2009
This table presents average annual total returns through the latest calendar quarter—rather than through the end of
the fiscal period. Securities and Exchange Commission rules require that we provide this information.
| | | | |
| | Inception | One | Five | Since |
| | Date | Year | Years | Inception |
| Investor Shares | 5/31/2000 | 35.12% | -2.19% | -2.97% |
| Institutional Shares | 1/14/2003 | 35.27 | -2.08 | 2.58 |
Vanguard fund total returns do not include any transaction or account fees that applied in the periods shown. Fund prospectuses provide
information about current fees.
See Financial Highlights for dividend and capital gains information.
8
FTSE Social Index Fund
Financial Statements (unaudited)
Statement of Net Assets
As of February 28, 2010
The fund reports a complete list of its holdings in regulatory filings four times in each fiscal year, at the quarter-ends. For the second and fourth fiscal quarters, the lists appear in the fund’s semiannual and annual reports to shareholders. For the first and third fiscal quarters, the fund files the lists with the Securities and Exchange Commission on Form N-Q. Shareholders can look up the fund’s Forms N-Q on the SEC’s website at www.sec.gov. Forms N-Q may also be reviewed and copied at the SEC’s Public Reference Room (see the back cover of this report for further information).
| | | |
| | | | Market |
| | | | Value • |
| | | Shares | ($000) |
| Common Stocks (100.0%) | | |
| Consumer Discretionary (9.5%) | | |
| | McDonald’s Corp. | 108,126 | 6,904 |
| * | Amazon.com Inc. | 33,249 | 3,937 |
| | Lowe’s Cos. Inc. | 146,543 | 3,475 |
| * | DIRECTV Class A | 98,164 | 3,323 |
| | Staples Inc. | 72,577 | 1,870 |
| * | Kohl’s Corp. | 30,447 | 1,639 |
| | Coach Inc. | 31,812 | 1,159 |
| | Gap Inc. | 52,389 | 1,126 |
| * | Bed Bath & Beyond Inc. | 26,303 | 1,094 |
| | McGraw-Hill Cos. Inc. | 31,835 | 1,089 |
| * | Apollo Group Inc. Class A | 15,352 | 919 |
| | Macy’s Inc. | 42,272 | 810 |
| | Nordstrom Inc. | 21,799 | 805 |
| | Mattel Inc. | 36,461 | 802 |
| | Starwood Hotels & | | |
| | Resorts Worldwide Inc. | 18,763 | 726 |
| | Ltd Brands Inc. | 32,480 | 718 |
| | Genuine Parts Co. | 16,131 | 651 |
| | Ross Stores Inc. | 12,661 | 619 |
| | Cablevision Systems Corp. | | |
| | Class A | 24,527 | 591 |
| | H&R Block Inc. | 33,607 | 581 |
| | Harley-Davidson Inc. | 23,575 | 580 |
| | Darden Restaurants Inc. | 13,841 | 561 |
| | Tiffany & Co. | 12,565 | 558 |
| | Hasbro Inc. | 13,816 | 494 |
| * | Dollar Tree Inc. | 8,774 | 489 |
| * | Royal Caribbean Cruises Ltd. | 15,891 | 449 |
| | Wyndham Worldwide Corp. | 17,702 | 407 |
| * | Sirius XM Radio Inc. | 389,424 | 397 |
| | Scripps Networks | | |
| | Interactive Inc. Class A | 9,480 | 375 |
| * | Interpublic Group of Cos. Inc. | 48,245 | 362 |
| * | Mohawk Industries Inc. | 6,970 | 360 |
| | Gannett Co. Inc. | 23,422 | 355 |
| | American Eagle | | |
| | Outfitters Inc. | 20,594 | 347 |
| | | |
| | | | Market |
| | | | Value • |
| | | Shares | ($000) |
| | PetSmart Inc. | 12,363 | 337 |
| | Harman International | | |
| | Industries Inc. | 6,811 | 294 |
| * | GameStop Corp. Class A | 16,135 | 278 |
| | Gentex Corp. | 13,521 | 262 |
| | Lennar Corp. Class A | 15,440 | 253 |
| | RadioShack Corp. | 12,276 | 240 |
| * | Toll Brothers Inc. | 12,397 | 233 |
| * | Lamar Advertising Co. | | |
| | Class A | 7,691 | 231 |
| | Wendy’s/Arby’s Group Inc. | | |
| | Class A | 45,713 | 223 |
| | Foot Locker Inc. | 15,877 | 206 |
| * | Madison Square Garden Inc. | | |
| | Class A | 6,131 | 120 |
| | Weight Watchers | | |
| | International Inc. | 3,838 | 99 |
| | Krispy Kreme Doughnuts Inc. | | |
| | Warrants Exp. 3/2/2012 | 179 | — |
| | | | 41,348 |
| Consumer Staples (9.3%) | | |
| | Procter & Gamble Co. | 293,827 | 18,593 |
| | CVS Caremark Corp. | 141,330 | 4,770 |
| | Costco Wholesale Corp. | 43,202 | 2,634 |
| | General Mills Inc. | 32,899 | 2,369 |
| | Sysco Corp. | 59,253 | 1,713 |
| | Kellogg Co. | 28,416 | 1,482 |
| | HJ Heinz Co. | 31,585 | 1,450 |
| | Avon Products Inc. | 42,784 | 1,302 |
| | Safeway Inc. | 40,798 | 1,017 |
| | Campbell Soup Co. | 26,049 | 868 |
| | Dr Pepper Snapple | | |
| | Group Inc. | 25,390 | 806 |
| | Estee Lauder Cos. Inc. | | |
| | Class A | 11,914 | 716 |
| | Hershey Co. | 16,953 | 674 |
| * | Whole Foods Market Inc. | 17,112 | 607 |
| | McCormick & Co. Inc. | 11,644 | 432 |
| | Hormel Foods Corp. | 10,004 | 411 |
9
FTSE Social Index Fund
| | | |
| | | | Market |
| | | | Value • |
| | | Shares | ($000) |
| | Alberto-Culver Co. Class B | 9,837 | 273 |
| * | Dean Foods Co. | 17,864 | 261 |
| | | | 40,378 |
| Energy (1.3%) | | |
| | Apache Corp. | 33,279 | 3,449 |
| | Noble Corp. | 26,181 | 1,106 |
| * | Newfield Exploration Co. | 13,251 | 677 |
| | Patterson-UTI Energy Inc. | 15,251 | 236 |
| | | | 5,468 |
| Financials (29.5%) | | |
| | Bank of America Corp. | 997,156 | 16,613 |
| | JPMorgan Chase & Co. | 391,129 | 16,416 |
| | Wells Fargo & Co. | 512,553 | 14,013 |
| | US Bancorp | 190,485 | 4,688 |
| | American Express Co. | 118,972 | 4,543 |
| | Bank of New York | | |
| | Mellon Corp. | 120,323 | 3,432 |
| | MetLife Inc. | 82,205 | 2,991 |
| | Travelers Cos. Inc. | 54,737 | 2,879 |
| | PNC Financial Services | | |
| | Group Inc. | 51,898 | 2,790 |
| | Prudential Financial Inc. | 46,158 | 2,419 |
| | Aflac Inc. | 46,757 | 2,312 |
| | Simon Property Group Inc. | 28,500 | 2,231 |
| | State Street Corp. | 49,432 | 2,220 |
| | Charles Schwab Corp. | 115,654 | 2,118 |
| | CME Group Inc. | 6,719 | 2,027 |
| | BB&T Corp. | 69,056 | 1,970 |
| | Franklin Resources Inc. | 17,480 | 1,778 |
| | Chubb Corp. | 34,217 | 1,727 |
| | Capital One Financial Corp. | 45,426 | 1,715 |
| | ACE Ltd. | 33,738 | 1,687 |
| | Loews Corp. | 42,977 | 1,567 |
| | T Rowe Price Group Inc. | 25,737 | 1,305 |
| | Northern Trust Corp. | 24,134 | 1,286 |
| | SunTrust Banks Inc. | 49,967 | 1,190 |
| | Progressive Corp. | 67,855 | 1,164 |
| | Ameriprise Financial Inc. | 25,619 | 1,025 |
| | Equity Residential | 27,702 | 999 |
| | Boston Properties Inc. | 13,948 | 947 |
| | Hartford Financial Services | | |
| | Group Inc. | 38,604 | 941 |
| | M&T Bank Corp. | 11,857 | 918 |
| | HCP Inc. | 29,502 | 849 |
| | Regions Financial Corp. | 119,652 | 808 |
| * | Genworth Financial Inc. | | |
| | Class A | 49,191 | 784 |
| * | IntercontinentalExchange Inc. | 7,289 | 782 |
| | Lincoln National Corp. | 30,415 | 766 |
| | Discover Financial Services | 54,709 | 747 |
| | Principal Financial Group Inc. | 32,049 | 744 |
| | Host Hotels & Resorts Inc. | 62,030 | 726 |
| | Hudson City Bancorp Inc. | 52,492 | 710 |
| | Ventas Inc. | 15,784 | 697 |
| | | |
| | | | Market |
| | | | Value • |
| | | Shares | ($000) |
| | Unum Group | 33,389 | 695 |
| | NYSE Euronext | 26,183 | 691 |
| | AvalonBay Communities Inc. | 8,237 | 671 |
| | New York Community | | |
| | Bancorp Inc. | 42,650 | 661 |
| | KeyCorp | 88,692 | 634 |
| | PartnerRe Ltd. | 7,958 | 633 |
| | XL Capital Ltd. Class A | 34,551 | 631 |
| | Moody’s Corp. | 23,690 | 631 |
| | ProLogis | 46,997 | 606 |
| | Plum Creek Timber Co. Inc. | 16,442 | 587 |
| | Comerica Inc. | 15,223 | 549 |
| | People’s United | | |
| | Financial Inc. | 34,323 | 541 |
| * | SLM Corp. | 47,076 | 526 |
| | Willis Group Holdings PLC | 16,945 | 505 |
| | Axis Capital Holdings Ltd. | 14,046 | 442 |
| | Cincinnati Financial Corp. | 16,165 | 435 |
| | Legg Mason Inc. | 16,017 | 414 |
| | WR Berkley Corp. | 15,814 | 407 |
| | Torchmark Corp. | 8,150 | 379 |
| | Marshall & Ilsley Corp. | 52,067 | 369 |
| | Assurant Inc. | 11,986 | 366 |
| | Macerich Co. | 9,922 | 354 |
| | AMB Property Corp. | 14,504 | 353 |
| * | Markel Corp. | 977 | 345 |
| | RenaissanceRe Holdings Ltd. | 6,158 | 341 |
| | Liberty Property Trust | 11,020 | 341 |
| | Huntington Bancshares Inc. | 70,776 | 340 |
| | Commerce Bancshares Inc. | 8,181 | 331 |
| | First American Corp. | 10,257 | 331 |
| *,^ | American International | | |
| | Group Inc. | 13,199 | 327 |
| | Transatlantic Holdings Inc. | 6,566 | 326 |
| | White Mountains Insurance | | |
| | Group Ltd. | 895 | 310 |
| | Regency Centers Corp. | 8,737 | 303 |
| * | First Horizon National Corp. | 21,904 | 280 |
| | Old Republic | | |
| | International Corp. | 23,662 | 267 |
| | Zions Bancorporation | 14,076 | 261 |
| | SEI Investments Co. | 14,580 | 257 |
| | City National Corp. | 5,138 | 256 |
| * | St. Joe Co. | 9,301 | 256 |
| | Arthur J Gallagher & Co. | 10,447 | 248 |
| | Duke Realty Corp. | 22,066 | 245 |
| | Brown & Brown Inc. | 14,276 | 239 |
| | Janus Capital Group Inc. | 17,913 | 224 |
| | Valley National Bancorp | 14,447 | 208 |
| * | Forest City Enterprises Inc. | | |
| | Class A | 13,637 | 164 |
| | Protective Life Corp. | 8,714 | 160 |
| | Erie Indemnity Co. Class A | 3,976 | 157 |
| | Popular Inc. | 65,215 | 126 |
10
| | | |
| FTSE Social Index Fund | | |
| |
| |
| |
| | | | Market |
| | | | Value • |
| | | Shares | ($000) |
| | Mercury General Corp. | 2,776 | 114 |
| * | CNA Financial Corp. | 2,490 | 61 |
| | Wesco Financial Corp. | 141 | 53 |
| | | | 128,475 |
| Health Care (14.8%) | | |
| * | Amgen Inc. | 102,337 | 5,793 |
| | Medtronic Inc. | 111,118 | 4,823 |
| * | Gilead Sciences Inc. | 90,083 | 4,289 |
| | UnitedHealth Group Inc. | 116,737 | 3,953 |
| * | Medco Health Solutions Inc. | 47,507 | 3,004 |
| * | WellPoint Inc. | 45,919 | 2,841 |
| * | Celgene Corp. | 46,174 | 2,748 |
| * | Express Scripts Inc. | 27,458 | 2,636 |
| | Covidien PLC | 50,414 | 2,476 |
| | Becton Dickinson and Co. | 24,073 | 1,875 |
| | Allergan Inc. | 30,797 | 1,799 |
| * | Biogen Idec Inc. | 28,901 | 1,590 |
| | Stryker Corp. | 29,782 | 1,581 |
| * | Genzyme Corp. | 26,590 | 1,521 |
| | Alcon Inc. | 9,004 | 1,438 |
| | Aetna Inc. | 43,678 | 1,310 |
| * | St. Jude Medical Inc. | 33,447 | 1,278 |
| * | Zimmer Holdings Inc. | 21,567 | 1,236 |
| | Cardinal Health Inc. | 36,197 | 1,230 |
| * | Boston Scientific Corp. | 150,863 | 1,168 |
| | Quest Diagnostics Inc. | 18,595 | 1,055 |
| | CIGNA Corp. | 27,260 | 934 |
| * | Forest Laboratories Inc. | 30,279 | 905 |
| * | Life Technologies Corp. | 17,813 | 904 |
| * | Hospira Inc. | 16,212 | 848 |
| | AmerisourceBergen Corp. | | |
| | Class A | 28,956 | 812 |
| * | Humana Inc. | 16,955 | 803 |
| | CR Bard Inc. | 9,559 | 801 |
| * | Laboratory Corp. of | | |
| | America Holdings | 10,666 | 782 |
| * | Mylan Inc. | 30,599 | 653 |
| * | DaVita Inc. | 10,275 | 633 |
| * | Varian Medical Systems Inc. | 12,504 | 612 |
| * | Waters Corp. | 9,571 | 571 |
| * | CareFusion Corp. | 22,348 | 564 |
| * | Cephalon Inc. | 7,567 | 520 |
| | DENTSPLY International Inc. | 15,427 | 510 |
| * | Millipore Corp. | 5,398 | 510 |
| * | Henry Schein Inc. | 8,881 | 505 |
| | Beckman Coulter Inc. | 7,034 | 461 |
| * | Watson Pharmaceuticals Inc. | 10,522 | 419 |
| * | Patterson Cos. Inc. | 11,982 | 356 |
| * | Coventry Health Care Inc. | 14,677 | 340 |
| * | Community Health | | |
| | Systems Inc. | 9,225 | 316 |
| | Omnicare Inc. | 11,640 | 315 |
| * | Kinetic Concepts Inc. | 6,945 | 291 |
| | | |
| | | | Market |
| | | | Value • |
| | | Shares | ($000) |
| | Universal Health | | |
| | Services Inc. Class B | 9,184 | 285 |
| * | King Pharmaceuticals Inc. | 24,349 | 274 |
| | | | 64,568 |
| Industrials (2.6%) | | |
| | Deere & Co. | 42,322 | 2,425 |
| | PACCAR Inc. | 36,528 | 1,291 |
| | Southwest Airlines Co. | 74,510 | 937 |
| | Rockwell Automation Inc. | 14,251 | 771 |
| | WW Grainger Inc. | 7,481 | 760 |
| * | First Solar Inc. | 6,370 | 675 |
| | Fastenal Co. | 15,166 | 673 |
| * | Iron Mountain Inc. | 20,190 | 523 |
| | Pitney Bowes Inc. | 21,039 | 482 |
| | Robert Half International Inc. | 15,358 | 429 |
| | Equifax Inc. | 12,458 | 402 |
| | Manpower Inc. | 7,710 | 397 |
| | Dun & Bradstreet Corp. | 5,108 | 358 |
| | JB Hunt Transport | | |
| | Services Inc. | 9,371 | 333 |
| | Pentair Inc. | 9,773 | 318 |
| * | Foster Wheeler AG | 12,511 | 308 |
| * | Terex Corp. | 10,959 | 213 |
| | | | 11,295 |
| Information Technology (29.8%) | |
| * | Apple Inc. | 90,216 | 18,460 |
| * | Cisco Systems Inc. | 580,794 | 14,131 |
| * | Google Inc. Class A | 23,644 | 12,456 |
| | Oracle Corp. | 499,586 | 12,315 |
| | Intel Corp. | 557,643 | 11,448 |
| | QUALCOMM Inc. | 166,654 | 6,114 |
| | Visa Inc. Class A | 47,123 | 4,019 |
| * | EMC Corp. | 204,824 | 3,582 |
| * | eBay Inc. | 129,540 | 2,982 |
| * | Dell Inc. | 196,621 | 2,601 |
| | Mastercard Inc. Class A | 11,024 | 2,473 |
| | Automatic Data | | |
| | Processing Inc. | 50,189 | 2,088 |
| * | Adobe Systems Inc. | 52,641 | 1,824 |
| | Applied Materials Inc. | 133,734 | 1,637 |
| * | Juniper Networks Inc. | 52,908 | 1,480 |
| * | Cognizant Technology | | |
| | Solutions Corp. Class A | 29,520 | 1,421 |
| | Broadcom Corp. Class A | 43,669 | 1,368 |
| * | Symantec Corp. | 81,131 | 1,343 |
| * | Marvell Technology | | |
| | Group Ltd. | 61,940 | 1,197 |
| | Tyco Electronics Ltd. | 45,834 | 1,175 |
| | Western Union Co. | 69,292 | 1,093 |
| | Paychex Inc. | 36,440 | 1,091 |
| * | Agilent Technologies Inc. | 34,660 | 1,090 |
| * | Intuit Inc. | 32,222 | 1,043 |
| * | NetApp Inc. | 33,718 | 1,012 |
11
FTSE Social Index Fund
| | | |
| | | | Market |
| | | | Value • |
| | | Shares | ($000) |
| * | Seagate Technology | 50,077 | 997 |
| * | NVIDIA Corp. | 55,706 | 902 |
| | CA Inc. | 39,529 | 889 |
| | Analog Devices Inc. | 29,129 | 852 |
| * | Citrix Systems Inc. | 18,332 | 788 |
| * | Micron Technology Inc. | 85,300 | 773 |
| * | Fiserv Inc. | 15,722 | 758 |
| | Altera Corp. | 29,546 | 722 |
| | Xilinx Inc. | 27,862 | 720 |
| * | Check Point Software | | |
| | Technologies | 21,063 | 687 |
| * | BMC Software Inc. | 18,620 | 686 |
| | Activision Blizzard Inc. | 64,128 | 682 |
| * | SanDisk Corp. | 23,067 | 672 |
| * | Autodesk Inc. | 23,195 | 647 |
| * | McAfee Inc. | 15,862 | 630 |
| | Linear Technology Corp. | 22,264 | 605 |
| * | Flextronics International Ltd. | 80,435 | 560 |
| * | Electronic Arts Inc. | 32,340 | 536 |
| * | Advanced Micro Devices Inc. | 66,266 | 524 |
| * | Teradata Corp. | 17,047 | 520 |
| | KLA-Tencor Corp. | 17,312 | 504 |
| | Microchip Technology Inc. | 18,049 | 488 |
| * | VeriSign Inc. | 19,525 | 487 |
| * | Akamai Technologies Inc. | 17,104 | 450 |
| * | Lam Research Corp. | 12,612 | 428 |
| * | Avnet Inc. | 15,327 | 423 |
| * | LSI Corp. | 64,745 | 349 |
| | National | | |
| | Semiconductor Corp. | 23,472 | 340 |
| * | Arrow Electronics Inc. | 11,803 | 333 |
| | Jabil Circuit Inc. | 21,256 | 322 |
| * | Synopsys Inc. | 14,413 | 316 |
| | Broadridge Financial | | |
| | Solutions Inc. | 13,900 | 292 |
| * | IAC/InterActiveCorp | 13,021 | 291 |
| | Total System Services Inc. | 19,445 | 277 |
| * | Novellus Systems Inc. | 9,958 | 220 |
| * | DST Systems Inc. | 5,005 | 192 |
| | Diebold Inc. | 6,619 | 192 |
| * | Compuware Corp. | 23,455 | 176 |
| | | | 129,673 |
| Materials (1.1%) | | |
| | Praxair Inc. | 30,888 | 2,321 |
| | Sigma-Aldrich Corp. | 12,258 | 585 |
| | Vulcan Materials Co. | 12,427 | 539 |
| | Ball Corp. | 9,560 | 517 |
| | International Flavors & | | |
| | Fragrances Inc. | 8,024 | 338 |
| * | Pactiv Corp. | 13,430 | 332 |
| | Sealed Air Corp. | 15,650 | 320 |
| | | | 4,952 |
| | | |
| | | | Market |
| | | | Value • |
| | | Shares | ($000) |
| Telecommunication Services (1.7%) | |
| * | American Tower Corp. | | |
| | Class A | 40,237 | 1,717 |
| * | Crown Castle | | |
| | International Corp. | 28,985 | 1,096 |
| | CenturyTel Inc. | 29,619 | 1,015 |
| * | Sprint Nextel Corp. | 291,694 | 971 |
| | Millicom International | | |
| | Cellular SA | 10,777 | 913 |
| | Qwest Communications | | |
| | International Inc. | 173,543 | 791 |
| * | NII Holdings Inc. | 16,704 | 625 |
| | Frontier | | |
| | Communications Corp. | 30,523 | 238 |
| | Telephone & | | |
| | Data Systems Inc. | 5,073 | 158 |
| | | | 7,524 |
| Utilities (0.4%) | | |
| | Questar Corp. | 17,518 | 736 |
| | EQT Corp. | 13,130 | 574 |
| | TECO Energy Inc. | 21,074 | 323 |
| | | | 1,633 |
| Total Common Stocks | | |
| (Cost $411,872) | | 435,314 |
| Temporary Cash Investment (0.7%) | |
| Money Market Fund (0.7%) | | |
| 1,2 | Vanguard Market Liquidity | | |
| | Fund, 0.163% | | |
| | (Cost $2,858) | 2,858,388 | 2,858 |
| Total Investments (100.7%) | | |
| (Cost $414,730) | | 438,172 |
| Other Assets and Liabilities (-0.7%) | |
| Other Assets | | 2,763 |
| Liabilities2 | | (5,672) |
| | | | (2,909) |
| Net Assets (100%) | | 435,263 |
12
FTSE Social Index Fund
| |
| At February 28, 2010, net assets consisted of: |
| | Amount |
| | ($000) |
| Paid-in Capital | 538,020 |
| Overdistributed Net Investment Income | (851) |
| Accumulated Net Realized Losses | (125,348) |
| Unrealized Appreciation (Depreciation) | 23,442 |
| Net Assets | 435,263 |
| |
| Investor Shares—Net Assets | |
| Applicable to 48,321,331 outstanding | |
| $.001 par value shares of beneficial | |
| interest (unlimited authorization) | 323,352 |
| Net Asset Value Per Share— | |
| Investor Shares | $6.69 |
| |
| Institutional Shares—Net Assets | |
| Applicable to 16,716,759 outstanding | |
| $.001 par value shares of beneficial | |
| interest (unlimited authorization) | 111,911 |
| Net Asset Value Per Share— | |
| Institutional Shares | $6.69 |
• See Note A in Notes to Financial Statements.
* Non-income-producing security.
^ Part of security position is on loan to broker-dealers. The total value of securities on loan is $320,000.
1 Affiliated money market fund available only to Vanguard funds and certain trusts and accounts managed by Vanguard. Rate shown is the 7-day yield.
2 Includes $374,000 of collateral received for securities on loan.
See accompanying Notes, which are an integral part of the Financial Statements.
13
| |
| FTSE Social Index Fund | |
| |
| |
| Statement of Operations | |
| |
| | Six Months Ended |
| | February 28, 2010 |
| | ($000) |
| Investment Income | |
| Income | |
| Dividends | 2,556 |
| Interest1 | 1 |
| Security Lending | 8 |
| Total Income | 2,565 |
| Expenses | |
| The Vanguard Group—Note B | |
| Investment Advisory Services | 32 |
| Management and Administrati ve—Investor Shares | 379 |
| Management and Administrati ve—Institutional Shares | 58 |
| Marketing and Distribution& #151;Investor Shares | 35 |
| Marketing and Distribution& #151;Institutional Shares | 16 |
| Custodian Fees | 10 |
| Shareholders’ Reports—Investor Shares | 10 |
| Shareholders’ Reports—Institutional Shares | 2 |
| Trustees’ Fees and Expenses | 1 |
| Total Expenses | 543 |
| Net Investment Income | 2,022 |
| Realized Net Gain (Loss) on Investment Securities Sold | (32,676) |
| Change in Unrealized Appreciation (Depreciation) of Investment Securities | 67,945 |
| Net Increase (Decrease) in Net Assets Resulting from Operations | 37,291 |
| 1 Interest income from an affiliated company of the fund was $1,000. | |
See accompanying Notes, which are an integral part of the Financial Statements.
14
| | |
| FTSE Social Index Fund | | |
| |
| |
| Statement of Changes in Net Assets | | |
| |
| | Six Months Ended | Year Ended |
| | February 28, | August 31, |
| | 2010 | 2009 |
| | ($000) | ($000) |
| Increase (Decrease) in Net Assets | | |
| Operations | | |
| Net Investment Income | 2,022 | 5,479 |
| Realized Net Gain (Loss) | (32,676) | (84,100) |
| Change in Unrealized Appreciation (Depreciation) | 67,945 | (23,637) |
| Net Increase (Decrease) in Net Assets Resulting from Operations | 37,291 | (102,258) |
| Distributions | | |
| Net Investment Income | | |
| Investor Shares | (3,306) | (5,643) |
| Institutional Shares | (1,275) | (2,622) |
| Realized Capital Gain | | |
| Investor Shares | — | — |
| Institutional Shares | — | — |
| Total Distributions | (4,581) | (8,265) |
| Capital Share Transactions | | |
| Investor Shares | (5,498) | (12,691) |
| Institutional Shares | (718) | (2,005) |
| Net Increase (Decrease) from Capital Share Transactions | (6,216) | (14,696) |
| Total Increase (Decrease) | 26,494 | (125,219) |
| Net Assets | | |
| Beginning of Period | 408,769 | 533,988 |
| End of Period1 | 435,263 | 408,769 |
| 1 Net Assets—End of Period includes undistributed (overdistributed) net investment income of ($851,000) and $1,708,000. | |
See accompanying Notes, which are an integral part of the Financial Statements.
15
| | | | | | | |
| FTSE Social Index Fund | | | | | | | |
| |
| |
| Financial Highlights | | | | | | |
| |
| |
| Investor Shares | | | | | | | |
| | Six Months | | | | | |
| | | Ended | | | | | |
| For a Share Outstanding | February 28, | | | | Year Ended August 31, |
| Throughout Each Period | | 2010 | 2009 | 2008 | 2007 | 2006 | 2005 |
| Net Asset Value, Beginning of Period | $6.20 | $7.76 | $9.30 | $8.51 | $8.03 | $7.40 |
| Investment Operations | | | | | | | |
| Net Investment Income | | .029 | .080 | .125 | .130 | .110 | .130 |
| Net Realized and Unrealized Gain (Loss) | | | | | | |
| on Investments | | .529 | (1.522) | (1.525) | .780 | .470 | .620 |
| Total from Investment Operations | .558 | (1.442) | (1.400) | .910 | .580 | .750 |
| Distributions | | | | | | | |
| Dividends from Net Investment Income | (.068) | (.118) | (.140) | (.120) | (.100) | (.120) |
| Distributions from Realized Capital Gains | — | — | — | — | — | — |
| Total Distributions | | (.068) | (.118) | (.140) | (.120) | (.100) | (.120) |
| Net Asset Value, End of Period | | $6.69 | $6.20 | $7.76 | $9.30 | $8.51 | $8.03 |
| |
| Total Return1 | | 9.02% | -18.11% | -15.26% | 10.70% | 7.25% | 10.16% |
| |
| Ratios/Supplemental Data | | | | | | | |
| Net Assets, End of Period (Millions) | $323 | $304 | $395 | $540 | $405 | $361 |
| Ratio of Total Expenses to | | | | | | | |
| Average Net Assets | | 0.29%2 | 0.29% | 0.24% | 0.24% | 0.25% | 0.25% |
| Ratio of Net Investment Income to | | | | | | |
| Average Net Assets | | 0.92%2 | 1.50% | 1.48% | 1.48% | 1.41% | 1.74% |
| Portfolio Turnover Rate | | 35%2 | 30% | 41% | 20% | 51%3 | 12% |
1 Total returns do not include the account service fee that may be applicable to certain accounts with balances below $10,000.
2 Annualized.
3 Includes activity related to a change in the fund’s target index.
See accompanying Notes, which are an integral part of the Financial Statements.
16
| | | | | | | |
| FTSE Social Index Fund | | | | | | | |
| |
| |
| Financial Highlights | | | | | | |
| |
| |
| Institutional Shares | | | | | | | |
| | Six Months | | | | | |
| | | Ended | | | | | |
| For a Share Outstanding | February 28, | | | | Year Ended August 31, |
| Throughout Each Period | | 2010 | 2009 | 2008 | 2007 | 2006 | 2005 |
| Net Asset Value, Beginning of Period | $6.20 | $7.77 | $9.32 | $8.52 | $8.04 | $7.41 |
| Investment Operations | | | | | | | |
| Net Investment Income | | .034 | .087 | .137 | .152 | .120 | .138 |
| Net Realized and Unrealized Gain (Loss) | | | | | | |
| on Investments | | .531 | (1.528) | (1.535) | .780 | .470 | .620 |
| Total from Investment Operations | .565 | (1.441) | (1.398) | .932 | .590 | .758 |
| Distributions | | | | | | | |
| Dividends from Net Investment Income | (.075) | (.129) | (.152) | (.132) | (.110) | (.128) |
| Distributions from Realized Capital Gains | — | — | — | — | — | — |
| Total Distributions | | (.075) | (.129) | (.152) | (.132) | (.110) | (.128) |
| Net Asset Value, End of Period | | $6.69 | $6.20 | $7.77 | $9.32 | $8.52 | $8.04 |
| |
| Total Return | | 9.14% | -18.03% | -15.22% | 10.95% | 7.37% | 10.26% |
| |
| Ratios/Supplemental Data | | | | | | | |
| Net Assets, End of Period (Millions) | $112 | $104 | $139 | $111 | $87 | $27 |
| Ratio of Total Expenses to | | | | | | | |
| Average Net Assets | | 0.16%1 | 0.16% | 0.11% | 0.11% | 0.12% | 0.12% |
| Ratio of Net Investment Income to | | | | | | |
| Average Net Assets | | 1.05%1 | 1.63% | 1.61% | 1.61% | 1.54% | 1.83% |
| Portfolio Turnover Rate | | 35%1 | 30% | 41% | 20% | 51%2 | 12% |
1 Annualized.
2 Includes activity related to a change in the fund’s target index.
See accompanying Notes, which are an integral part of the Financial Statements.
17
FTSE Social Index Fund
Notes to Financial Statements
Vanguard FTSE Social Index Fund is registered under the Investment Company Act of 1940 as an open-end investment company, or mutual fund. The fund offers two classes of shares: Investor Shares and Institutional Shares. Investor Shares are available to any investor who meets the fund’s minimum purchase requirements. Institutional Shares are designed for investors who meet certain administrative and service criteria and invest a minimum amount of $5 million.
A. The following significant accounting policies conform to generally accepted accounting principles for U.S. mutual funds. The fund consistently follows such policies in preparing its financial statements.
1. Security Valuation: Securities are valued as of the close of trading on the New York Stock Exchange (generally 4 p.m., Eastern time) on the valuation date. Equity securities are valued at the latest quoted sales prices or official closing prices taken from the primary market in which each security trades; such securities not traded on the valuation date are value d at the mean of the latest quoted bid and asked prices. Securities for which market quotations are not re adily available, or whose values have been materially affected by events occurring before the fund’s pricing time but after the close of the securities’ primary markets, are valued by methods deemed by the board of trustees to represent fair value.
Investments in Vanguard Market Liquidity Fund are valued at that fund’s net asset value.
2. Federal Income Taxes: The fund intends to continue to qualify as a regulated investment company and distribute all of its taxable income. Management has analyzed the fund’s tax positions taken for all open federal income tax years (August 31, 2006–2009), and for the period ended February 28, 201 0, and has concluded that no prov ision for federal income tax is required in the fund’s financ ial statements.
3. Distributions: Distributions to shareholders are recorded on the ex-dividend date.
4. Security Lending: The fund may lend its securities to qualified institutional borrowers to earn additional income. Security loans are required to be secured at all times by collateral at least equal to the market value of securities loaned. The fund invests cash collateral received in Vanguard Market Liquidity Fund, and records a liability for the return of the collateral, during the period the securities are on loan. Security lending income represents the income earned on investing cash collateral, less expenses associated with the loan.
5. Other: Dividend income is recorded on the ex-dividend date. Interest income includes income distributions received from Vanguard Market Liquidity Fund and is accrued daily. Security transactions are accounted for on the date securities are bought or sold. Costs used to determine realized gains (losses) on the sale of investment securities are those of the specific securities sold.
Each class of shares has equal rights as to assets and earnings, except that each class separately bears certain class-specific expenses related to maintenance of shareholder accounts (included in Management and Administrative expenses) and shareholder reporting. Marketing an d distribution expenses are alloc ated to each class of shares base d on a method approved by the board of trustees. Income, other non-class-specific expenses, and gains and losses on investments are allocated to each class of shares based on its relative net assets.
18
FTSE Social Index Fund
B. The Vanguard Group furnishes at cost investment advisory, corporate management, administrative, marketing, and distribution services. The costs of such services are allocated to the fund under methods approved by the board of trustees. The fund has committed to provide up to 0.40% of its net assets in capital contributions to Vanguard. At February 28, 2010, the fund had contributed capital of $84,000 to Vanguard (included in Other Assets), representing 0.02% of the fund’s net assets and 0.03% of
Vanguard’s capitalization. The fund’s trustees and officers are also directors and officers of Vanguard.
C. Various inputs may be used to determine the value of the fund’s investments. These inputs are summarized in three broad levels for financial statement purposes. The inputs or methodologies used to value securities are not necessarily an indication of the risk associated with investing in those securities.
Level 1—Quoted prices in active markets for identical securities.
Level 2—Other significant observable inputs (including quoted prices for similar securities, interest rates, prepayment speeds, credit risk, etc.).
Level 3—Significant unobservable inputs (including the fund’s own assumptions used to determine the fair value of investments).
At February 28, 2010, 100% of the fund’s investments were valued based on Level 1 inputs.
D. Distributions are determined on a tax basis and may differ from net investment income and realized capital gains for financial reporting purposes. Differences may be permanent or temporary. Permanent differences are reclassified among capital accounts in the financial statements to reflect their tax character. Temporary differences arise when certain items of income, expense, gain, or loss are recognized in different periods for financial statement and tax purposes; these differences will reverse at some time in the future. Differences in classification may also result from the treatment of shor t-term gains as ordinary income for tax purposes.
The fund’s tax-basis capital gains and losses are determined only at the end of each fiscal year. For tax purposes, at August 31, 2009, the fund had available capital loss carryforwards totaling $25,902,000 to offset future net capital gains of $79,000 through August 31, 2012, $985,000 through August 31, 2013, $367,000 through A ugust 31, 2014, $2,136,000 through August 31, 2016, and $22,335,000 through August 31, 2017. In addition, the fund realized losses of $66,197,000 during the period from November 1, 2008, through August 31, 2009, which are deferred and will be treated as realized for tax purposes in fiscal 2010. The fund will use these capital losses to offset net taxable capital gains, if any, realized during the year ending August 31, 2010; should the fund realize net capital loss es for the year, the losses will be added to the loss carryforward balances above.
At February 28, 2010, the cost of investment securities for tax purposes was $414,730,000. Net unrealized appreciation of investment securities for tax purposes was $23,442,000, consisting of unrealized gains of $64,665,000 on securities that had risen in value since their purchase and $41,223,000 in unrealized losses on securities that had fallen in value since their purchase.
E. During the six months ended February 28, 2010, the fund purchased $133,521,000 of investment securities and sold $141,649,000 of investment securities, other than temporary cash investments.
19
FTSE Social Index Fund
| | | | |
| F. Capital share transactions for each class of shares were: | | | |
| | Six Months Ended | | Year Ended |
| | February 28, 2010 | August 31, 2009 |
| | Amount | Shares | Amount | Shares |
| | ($000) | (000) | ($000) | (000) |
| Investor Shares | | | | |
| Issued | 32,935 | 5,034 | 69,845 | 13,553 |
| Issued in Lieu of Cash Distributions | 3,123 | 477 | 5,331 | 1,125 |
| Redeemed | (41,556) | (6,325) | (87,867) | (16,390) |
| Net Increase (Decrease)—Investor Shares | (5,498) | (814) | (12,691) | (1,712) |
| Institutional Shares | | | | |
| Issued | 9,647 | 1,478 | 34,054 | 6,299 |
| Issued in Lieu of Cash Distributions | 925 | 141 | 2,022 | 427 |
| Redeemed | (11,290) | (1,714) | (38,081) | (7,838) |
| Net Increase (Decrease)—Institutional Shares | (718) | (95) | (2,005) | (1,112) |
G. In preparing the financial statements as of February 28, 2010, management considered the impact of subsequent events for potential recognition or disclosure in these financial statements.
20
About Your Fund’s Expenses
As a shareholder of the fund, you incur ongoing costs, which include costs for portfolio management, administrative services, and shareholder reports (like this one), among others. Operating expenses, which are deducted from a fund’s gross income, directly reduce the investment return of the fund.
A fund’s expenses are expressed as a percentage of its average net assets. This figure is known as the expense ratio. The following examples are intended to help you understand the ongoing costs (in dollars) of investing in your fund and to compare these costs with those of other mutual funds. The examples are based on an investment of $1,000 made at the beginning of the period shown and held for the entire period.
The accompanying table illustrates your fund’s costs in two ways:
• Based on actual fund return. This section helps you to estimate the actual expenses that you paid over the period. The ”Ending Account Value“ shown is derived from the fund‘s actual return, and the third column shows the dollar amount that would have been paid by an investor who started with $1,000 in the fund. You may use the information here, together with the amount you invested, to estimate the expenses that you paid over the period.
To do so, simply divide your account value by $1,000 (for example, an $8,600 account value divided by $1,000 = 8.6), then multiply the result by the number given for your fund under the heading ”Expenses Paid During Period.“
• Based on hypothetical 5% yearly return. This section is intended to help you compare your fund‘s costs with those of other mutual funds. It assumes that the fund had a yearly return of 5% before expenses, but that the expense ratio is unchanged. In this case—because the return used is not the fund’s actual return—the results do not apply to your investment. The example is useful in making comparisons because the Securities and Exchange Commission requires all mutual funds to calculate expenses based on a 5% return. You can assess your fund’s costs by comparing this hypothetical example with the hypothetical examples that appear in shareholder reports of other funds.
Note that the expenses shown in the table are meant to highlight and help you compare ongoing costs only and do not reflect transaction costs incurred by the fund for buying and selling securities. Further, the expenses do not include the account service fee described in the prospectus. If such a fee were applied to your account, your costs would be higher. Your fund does not charge transaction fees, such as purchase or redemption fees, nor does it carry a “sales load.” The calculations assume no shares were bought or sold during the period. Your actual costs may have been higher or lower, depending on the amount of your investment and the timing of any purchases or redemptions.
You can find more information about the fund’s expenses, including annual expense ratios, in the Financial Statements section of this report. For additional information on operating expenses and other shareholder costs, please refer to your fund’s current prospectus.
21
| | | |
| Six Months Ended February 28, 2010 | | | |
| | Beginning | Ending | Expenses |
| | Account Value | Account Value | Paid During |
| FTSE Social Index Fund | 8/31/2009 | 2/28/2010 | Period |
| Based on Actual Fund Return | | | |
| Investor Shares | $1,000.00 | $1,090.23 | $1.50 |
| Institutional Shares | 1,000.00 | 1,091.39 | 0.83 |
| Based on Hypothetical 5% Yearly Return | | | |
| Investor Shares | $1,000.00 | $1,023.36 | $1.45 |
| Institutional Shares | 1,000.00 | 1,024.00 | 0.80 |
The calculations are based on expenses incurred in the most recent six-month period. The fund’s annualized six-month expense ratios for that period are 0.29% for Investor Shares and 0.16% for Institutional Shares. The dollar amounts shown as “Expenses Paid” are equal to the annualized expense ratio multiplied by the average account value over the period, multiplied by the number of days in the most recent six-month period, then divided by the number of days in the most recent 12-month period.
22
Glossary
30-Day SEC Yield. A fund’s 30-day SEC yield is derived using a formula specified by the U.S. Securities and Exchange Commission. Under the formula, data related to the fund’s security holdings in the previous 30 days are used to calculate the fund’s hypothetical net income for that period, which is then annualized and divided by the fund’s estimated average net assets over the calculation period. For the purposes of this calculation, a security’s income is based on its current market yield to maturity (in the case of bonds) or its projected dividend yield (for stocks). Because the SEC yield represents hypothetical annualized income, it will differ—at times significantly—from the fund’s actual experience. As a result, the fund’s income distributions may be higher or lower than implied by the SEC yield.
Beta. A measure of the magnitude of a fund’s past share-price fluctuations in relation to the ups and downs of a given market index. The index is assigned a beta of 1.00. Compared with a given index, a fund with a beta of 1.20 typically would have seen its share price rise or fall by 12% when the index rose or fell by 10%. For this report, beta is based on returns over the past 36 months for both the fund and the index. Note that a fund’s beta should be reviewed in conjunction with its R-squared (see definition). The lower the R-squared, the less correlation there is between the fund and the index, and the less reliable beta is as an indicator of volatility.
Dividend Yield. Dividend income earned by stocks, expressed as a percentage of the aggregate market value (or of net asset value, for a fund). The yield is determined by dividing the amount of the annual dividends by the aggregate value (or net asset value) at the end of the period. For a fund, the dividend yield is based solely on stock holdings and does not include any income produced by other investments.
Earnings Growth Rate. The average annual rate of growth in earnings over the past five years for the stocks now in a fund.
Equity Exposure. A measure that reflects a fund’s investments in stocks and stock futures. Any holdings in short-term reserves are excluded.
Expense Ratio. The percentage of a fund’s average net assets used to pay its annual administrative and advisory expenses. These expenses directly reduce returns to investors.
Foreign Holdings. The percentage of a fund represented by stocks or depositary receipts of companies based outside the United States.
Inception Date. The date on which the assets of a fund (or one of its share classes) are first invested in accordance with the fund’s investment objective. For funds with a subscription period, the inception date is the day after that period ends. Investment performance is measured from the inception date.
Median Market Cap. An indicator of the size of companies in which a fund invests; the midpoint of market capitalization (market price x shares outstanding) of a fund’s stocks, weighted by the proportion of the fund’s assets invested in each stock. Stocks representing half of the fund’s assets have market capitalizations above the median, and the rest are below it.
Price/Book Ratio. The share price of a stock divided by its net worth, or book value, per share. For a fund, the weighted average price/book ratio of the stocks it holds.
23
Price/Earnings Ratio. The ratio of a stock’s current price to its per-share earnings over the past year. For a fund, the weighted average P/E of the stocks it holds. P/E is an indicator of market expectations about corporate prospects; the higher the P/E, the greater the expectations for a company’s future growth.
R-Squared. A measure of how much of a fund’s past returns can be explained by the returns from the market in general, as measured by a given index. If a fund’s total returns were precisely synchronized with an index’s returns, its R-squared would be 1.00. If the fund’s returns bore no relationship to the index’s returns, its R-squared would be 0. For this report, R-squared is based on returns over the past 36 months for both the fund and the index.
Return on Equity. The annual average rate of return generated by a company during the past five years for each dollar of shareholder’s equity (net income divided by shareholder’s equity). For a fund, the weighted average return on equity for the companies whose stocks it holds.
Short-Term Reserves. The percentage of a fund invested in highly liquid, short-term securities that can be readily converted to cash.
Turnover Rate. An indication of the fund’s trading activity. Funds with high turnover rates incur higher transaction costs and may be more likely to distribute capital gains (which may be taxable to investors). The turnover rate excludes in-kind transactions, which have minimal impact on costs.
24
This page intentionally left blank.
This page intentionally left blank.
This page intentionally left blank.
The People Who Govern Your Fund
The trustees of your mutual fund are there to see that the fund is operated and managed in your best interests since, as a shareholder, you are a part owner of the fund. Your fund’s trustees also serve on the board of directors of The Vanguard Group, Inc., which is owned by the Vanguard funds and provides services to them on an at-cost basis.
A majority of Vanguard’s board members are independent, meaning that they have no affiliation with Vanguard or the funds they oversee, apart from the sizable personal investments they have made as private individuals. The independent board members have distinguished backgrounds in business, academia, and public service. Each of the trustees and executive officers oversees 161 Vanguard funds.
The following table provides information for each trustee and executive officer of the fund. More information about the trustees is in the Statement of Additional Informatio n, which can be obtained, wit hout charge, by contacting Vanguard at 800-662-7447, or online at www.vanguard.com.
| |
| Interested Trustee1 | Rajiv L. Gupta |
| | Born 1945. Trustee Since December 2001.2 Principal |
| F. William McNabb III | Occupation(s) During the Past Five Years: Chairman |
| Born 1957. Trustee Since July 2009. Chairman of the | and Chief Executive Officer (retired 2009) and |
| Board. Principal Occupation(s) During the Past Five | President (2006–2008) of Rohm and Haas Co. |
| Years: Chairman of the Board of The Vanguard Group, | (chemicals); Board Member of American Chemistry |
| Inc., and of each of the investment companies served | Council; Director of Tyco International, Ltd. (diversified |
| by The Vanguard Group, since January 2010; Director | manufacturing and services) and Hewlett-Packard Co. |
| of The Vanguard Group since 2008; Chief Executive | (electronic computer manufacturing); Trustee of The |
| Officer and President of The Vanguard Group and of | Conference Board. |
| each of the investment companies served by The | |
| Vanguard Group since 2008; Director of Vanguard | Amy Gutmann |
| Marketing Corporation; Managing Director of The | Born 1949. Trustee Since June 2006. Principal |
| Vanguard Group (1995–2008). | Occupation(s) During the Past Five Years: President |
| | of the University of Pennsylvania; Christopher H. |
| | Browne Distinguished Professor of Political Science |
| Independent Trustees | in the School of Arts and Sciences with secondary |
| | appointments at the Annenberg School for Commu- |
| Emerson U. Fullwood | nication and the Graduate School of Education of |
| Born 1948. Trustee Since January 2008. Principal | the University of Pennsylvania; Director of Carnegie |
| Occupation(s) During the Past Five Years: Executive | Corporation of New York, Schuylkill River Development |
| Chief Staff and Marketing Officer for North America | Corporation, and Greater Philadelphia Chamber of |
| and Corporate Vice President (retired 2008) of Xerox | Commerce; Trustee of the National Constitution Center. |
| Corporation (documen t management products and | |
| services); Director of SPX Corporation (multi-industry | |
| manufacturing), the United Way of Rochester, the | |
| Boy Scouts of America, Amerigroup Corporation | |
| (managed health care), and Monroe Community | |
| College Foundation. | |
| | |
| JoAnn Heffernan Heisen | Executive Officers | |
| Born 1950. Trustee Since July 1998. Principal | | |
| Occupation(s) During the Past Five Years: Corporate | Thomas J. Higgins | |
| Vice President and Chief Global Diversity Officer since | Born 1957. Chief Financial Officer Since September |
| 2006 (retired 2008) and Member of the Executive | 2008. Principal Occupation(s) During the Past Five |
| Committee (retired 2008) of Johnson & Johnson | Years: Principal of The Vanguard Group, Inc.; Chief |
| (pharmaceuticals/consumer products); Vice President | Financial Officer of each of the investment companies |
| and Chief Information Officer of Johnson & Johnson | served by The Vanguard Group since 2008; Treasurer |
| (1997–2005); Director of the University Medical Center | of each of the investment companies served by The |
| at Princeton and Women’s Research and Education | Vanguard Group (1998–2008). |
| Institute; Member of the Advisory Board of the | | |
| Maxwell School of Citizenship and Public Affairs | Kathryn J. Hyatt | |
| at Syracuse University. | Born 1955. Treasurer Since November 2008. Principal |
| | Occupation(s) During the Past Five Years: Principal |
| F. Joseph Loughrey | of The Vanguard Group, Inc.; Treasurer of each of |
| Born 1949. Trustee Since October 2009. Principal | the investment companies served by The Vanguard |
| Occupation(s) During the Past Five Years: President | Group since 2008; Assistant Treasurer of each of the |
| and Chief Operating Officer since 2005 (retired 2009) | investment companies served by The Vanguard Group |
| and Vice Chairman of the Board (2008–2009) of | (1988–2008). | |
| Cummins Inc. (industrial machinery); Director of | | |
| SKF AB (industrial machinery), Hillenbrand, Inc. | Heidi Stam | |
| (specialized consumer services), Sauer-Danfoss Inc. | Born 1956. Secretary Since July 2005. Principal |
| (machinery), the Lumina Foundation for Education, | Occupation(s) During the Past Five Years: Managing |
| and the Columbus Community Education Coalition; | Director of The Vanguard Group, Inc., since 2006; |
| Chairman of the Advisory Council for the College of | General Counsel of The Vanguard Group since 2005; |
| Arts and Letters at the University of Notre Dame. | Secretary of The Vanguard Group and of each of the |
| | investment companies served by The Vanguard Group |
| André F. Perold | since 2005; Director and Senior Vice President of |
| Born 1952. Trustee Since December 2004. Principal | Vanguard Marketing Corporation since 2005; |
| Occupation(s) During the Past Five Years: George | Principal of The Vanguard Group (1997–2006). |
| Gund Professor of Finance and Banking at the Harvard | | |
| Business School; Chair of the Investment Committee | | |
| of HighVista Strategies LLC (private investment firm). | Vanguard Senior Management Team |
| |
| Alfred M. Rankin, Jr. | R. Gregory Barton | Michael S. Miller |
| Born 1941. Trustee Since January 1993. Principal | Mortimer J. Buckley | James M. Norris |
| Occupation(s) During the Past Five Years: Chairman, | Kathleen C. Gubanich | Glenn W. Reed |
| President, and Chief Executive Officer of NACCO | Paul A. Heller | George U. Sauter |
| Industries, Inc. (forklift trucks/housewares/lignite); | | |
| Director of Goodrich Corporation (industrial products/ | | |
| aircraft systems and services); Deputy Chairman | Chairman Emeritus and Senior Advisor |
| of the Federal Reserve Bank of Cleveland; Trustee | | |
| of University Hospitals of Cleveland, The Cleveland | John J. Brennan | |
| Museum of Art, and Case Western Reserve University. | Chairman, 1996–2009 | |
| | Chief Executive Officer and President, 1996–2008 |
| Peter F. Volanakis | | |
| Born 1955. Trustee Since July 2009. Principal | | |
| Occupation(s) During the Past Five Years: President | Founder | |
| since 2007 and Chief Operating Officer since 2005 | | |
| of Corning Incorporated (communications equipment); | John C. Bogle | |
| President of Corning Technologies (2001–2005); | Chairman and Chief Executive Officer, 1974–1996 |
| Director of Corning Incorporated and Dow Corning; | | |
| Trustee of the Corning Incorporated Foundation and | | |
| the Corning Museum of Glass; Overseer of the | | |
| Amos Tuck School of Business Administration at | | |
| Dartmouth College. | | |
1 Mr. McNabb is considered an “interested person,” as defined in the Investment Company Act of 1940, because he is an officer of the Vanguard funds.
2 December 2002 for Vanguard Equity Income Fund, Vanguard Growth Equity Fund, the Vanguard Municipal Bond Funds, and the Vanguard State Tax-Exempt Funds.
| |
|  |
| P.O. Box 2600 |
| Valley Forge, PA 19482-2600 |
Connect with Vanguard® > www.vanguard.com
| Fund Information > 800-662-7447 | |
| |
| Direct Investor Account Services > 800-662-2739 | FTSE® and FTSE4Good™ are trademarks jointly owned |
| by the London Stock Exchange plc and The Financial |
| Institutional Investor Services > 800-523-1036 | Times Limited and are used by FTSE International |
| Limited under license. The FTSE4Good US Select Index |
| Text Telephone for People | is calculated by FTSE International Limited. FTSE |
| With Hearing Impairment > 800-749-7273 | International Limited does not sponsor, endorse, or |
| | promote the fund; is not in any way connected to it; |
| This material may be used in conjunction | and does not accept any liability in relation to its issue, |
| with the offering of shares of any Vanguard | operation, and trading. |
| fund only if preceded or accompanied by | |
| the fund’s current prospectus. | |
| |
| All comparative mutual fund data are from Lipper Inc. or | |
| Morningstar, Inc., unless otherwise noted. | |
| |
| You can obtain a free copy of Vanguard’s proxy voting | |
| guidelines by visiting our website, www.vanguard.com, | |
| and searching for “proxy voting guidelines,” or by calling | |
| Vanguard at 800-662-2739. The guidelines are also | |
| available from the SEC’s website, www.sec.gov. In | |
| addition, you may obtain a free report on how your fund | |
| voted the proxies for securities it owned during the 12 | |
| months ended June 30. To get the report, visit either | |
| www.vanguard.com or www.sec.gov. | |
| |
| You can review and copy information about your fund at | |
| the SEC’s Public Reference Room in Washington, D.C. To | |
| find out more about this public service, call the SEC at | |
| 202-551-8090. Information about your fund is also | |
| available on the SEC’s website, and you can receive | |
| copies of this information, for a fee, by sending a | |
| request in either of two ways: via e-mail addressed to | |
| publicinfo@sec.gov or via regular mail addressed to the | |
| Public Reference Section, Securities and Exchange | |
| Commission, Washington, DC 20549-1520. | |
| |
| | © 2010 The Vanguard Group, Inc. |
| | All rights reserved. |
| | Vanguard Marketing Corporation, Distributor. |
| |
| | Q2132 042010 |
 |
| Vanguard U.S. Sector Index Funds |
| Semiannual Report |
| |
|
 |
| |
| Vanguard Consumer Discretionary | Vanguard Industrials Index Fund |
| Index Fund | |
| | Vanguard Information Technology Index Fund |
| Vanguard Consumer Staples Index Fund | |
| | Vanguard Materials Index Fund |
| Vanguard Energy Index Fund | |
| | Vanguard Telecommunication Services |
| Vanguard Financials Index Fund | Index Fund |
| |
| Vanguard Health Care Index Fund | Vanguard Utilities Index Fund |
| |
> The U.S. stock market returned about 10% for the six months ended February 28, 2010.
> Returns were positive for all ten of the Vanguard U.S. Sector Index Funds. About 15 percentage points separated the returns of the best- and worst-performing sectors.
> The consumer discretionary and industrial sectors posted the strongest six-month gains, while the weakest sector returns came from utilities and financials.
| |
| Contents | |
| Your Fund’s Total Returns | 1 |
| Chairman’s Letter | 2 |
| Consumer Discretionary Index Fund | 5 |
| Consumer Staples Index Fund | 15 |
| Energy Index Fund | 24 |
| Financials Index Fund | 33 |
| Health Care Index Fund | 44 |
| Industrials Index Fund | 54 |
| Information Technology Index Fund | 64 |
| Materials Index Fund | 74 |
| Telecommunication Services Index Fund | 83 |
| Utilities Index Fund | 91 |
| About Your Fund’s Expenses | 99 |
| Glossary | 101 |

Please note: The opinions expressed in this report are just that—informed opinions. They should not be considered promises or advice. Also, please keep in mind that the information and opinions cover the period through the date on the front of this report. Of course, the risks of investing in your fund are spelled out in the prospectus.
Cover photograph: Veronica Coia.
Your Fund’s Total Returns
Six Months Ended February 28, 2010
| | |
| Admiral™ Shares1 and ETF Shares2 | |
| | Ticker | Total |
| | Symbol | Returns |
| Vanguard Consumer | | |
| Discretionary Index Fund | VCDAX | 17.71% |
| Vanguard Consumer | | |
| Discretionary ETF | VCR | |
| Market Price | | 17.70 |
| Net Asset Value | | 17.72 |
| MSCI® US IMI/Consumer Discretionary | 17.83 |
| |
| Vanguard Consumer Staples | | |
| Index Fund | VCSAX | 10.81% |
| Vanguard Consumer Staples ETF | VDC | |
| Market Price | | 10.75 |
| Net Asset Value | | 10.81 |
| MSCI US IMI/Consumer Staples | | 10.84 |
| |
| Vanguard Energy Index Fund | VENAX | 10.93% |
| Vanguard Energy ETF | VDE | |
| Market Price | | 10.80 |
| Net Asset Value | | 10.96 |
| MSCI US IMI/Energy | | 9.28 |
| |
| Vanguard Financials Index Fund | VFAIX | 2.58% |
| Vanguard Financials ETF | VFH | |
| Market Price | | 2.49 |
| Net Asset Value | | 2.59 |
| MSCI US IMI/Financials | | 2.64 |
| |
| Vanguard Health Care Index Fund | VHCIX | 11.44% |
| Vanguard Health Care ETF | VHT | |
| Market Price | | 11.50 |
| Net Asset Value | | 11.47 |
| MSCI US IMI/Health Care | | 11.52 |
| |
| Vanguard Industrials Index Fund | VINAX | 15.52% |
| Vanguard Industrials ETF | VIS | |
| Market Price | | 15.54 |
| Net Asset Value | | 15.54 |
| MSCI US IMI/Industrials | | 15.69 |
| | |
| | Ticker | Total |
| Symbol Returns |
| Vanguard Information | | |
| Technology Index Fund | VITAX | 10.93% |
| Vanguard Information | | |
| Technology ETF | VGT | |
| Market Price | | 10.93 |
| Net Asset Value | | 10.96 |
| MSCI US IMI/Information Technology | | 11.09 |
| |
| Vanguard Materials Index Fund | VMIAX | 10.30% |
| Vanguard Materials ETF | VAW | |
| Market Price | | 10.20 |
| Net Asset Value | | 10.29 |
| MSCI US IMI/Materials | | 10.41 |
| |
| Vanguard Telecommunication | | |
| Services Index Fund | VTCAX | 6.76% |
| Vanguard Telecommunication | | |
| Services ETF | VOX | |
| Market Price | | 7.01 |
| Net Asset Value | | 6.79 |
| MSCI US IMI/Telecommunication Services | 2.94 |
| |
| Vanguard Utilities Index Fund | VUIAX | 2.55% |
| Vanguard Utilities ETF | VPU | |
| Market Price | | 2.48 |
| Net Asset Value | | 2.54 |
| MSCI US IMI/Utilities | | 2.66 |
| |
| MSCI US IMI/2500 | | 10.10% |
1 A lower-cost class of shares available to many longtime shareholders and to those with significant investments in the fund.
2 These Vanguard ETF™ Shares are traded on the NYSE Arca exchange and are available only through brokers. The table shows the ETF returns based on both the NYSE Arca market price and the net asset value for a share. U.S. Pat. No. 6,879,964 B2; 7,337,138.
Note: MSCI US IMI/2500 is the Morgan Stanley Capital International® US Investable Market 2500 Index.
1

Chairman’s Letter
Dear Shareholder,
For the six months ended February 28, 2010, the broad U.S. stock market returned about 10%. The market rallied through most of the period, while surrendering some gains in January.
All ten Vanguard U.S. Sector Index Funds recorded positive returns for the fiscal period. The consumer discretionary and industrial sectors set the pace, while the telecommunications, financial, and utilities sectors trailed the field.
An index fund measures its success by how closely it matches its target index, regardless of market conditions. Vanguard Quantitative Equity Group, the sector funds’ advisor, tightly tracked the funds’ target indexes in all sectors except for energy and telecommunication services. As we have noted in previous letters, SEC and IRS regulations limit the percentage of a fund’s assets that can be invested in a single stock, sometimes preventing the advisor from duplicating the construction of the target index. When the performance of a stock that is heavily weighted in an index diverges significantly from those of other stocks in the target index, a less-concentrated sector fund may not be able to track the index’s performance, a potential point of confusion for investors evaluating a fund’s return.
At the close of business on February 26, 2010, the final business day of the fiscal period, Vanguard changed the target benchmarks for all ten U.S. Sector Index Funds to address the gaps between the sector indexes’ composition and what Internal Revenue Code regulations allow a real-world fund to hold. The change—to the MSCI 25/50 Indexes—will provide shareholders with a more reasonable standard for evaluating their funds’ index-tracking success, while ensuring that the funds remain compliant with SEC and IRS regulations for favorable tax treatment.
Stock markets caught their breath at the end of a solid six months
For the six months, the broad U.S. stock market returned about 10%. The rally seemed to downshift toward the end of the period, as the investor relief that powered markets higher a year ago gave way to sober-minded assessment of corporate earnings-growth prospects.
Smaller-capitalization stocks did a little better than larger-cap stocks, and growth-oriented securities bested their value-oriented counterparts, but the uniformity of returns from different market segments was more striking than the differences.
| | | |
| Market Barometer | | | |
| | | | Total Returns |
| | | Periods Ended February 28, 2010 |
| | Six Months | One Year | Five Years1 |
| Stocks | | | |
| Russell 1000 Index (Large-caps) | 9.91% | 55.32% | 0.77% |
| Russell 2000 Index (Small-caps) | 10.59 | 63.95 | 1.16 |
| Dow Jones U.S. Total Stock Market Index | 10.23 | 56.38 | 1.20 |
| MSCI All Country World Index ex USA (International) | 3.83 | 63.51 | 4.60 |
| |
| Bonds | | | |
| Barclays Capital U.S. Aggregate Bond Index | | | |
| (Broad taxable market) | 3.19% | 9.32% | 5.36% |
| Barclays Capital Municipal Bond Index | 4.13 | 9.98 | 4.50 |
| Citigroup 3-Month Treasury Bill Index | 0.06 | 0.14 | 2.81 |
| |
| CPI | | | |
| Consumer Price Index | 0.42% | 2.14% | 2.48% |
1 Annualized.
2
International stocks produced more modest returns. In Europe, the precarious financial health of Greece and that of smaller economies such as Portugal and Ireland weighed on the markets. In Asia, the Japanese stock market’s weakness held back results for Asia Pacific indexes. Emerging markets stocks continued to outpace those from developed markets.
Yields remained low, but Fed began to unwind rescue programs
The yields of longer-term U.S. Treasury bonds rose during the past six months, while those of the shortest-term securities remained near 0%. Although the Federal Reserve Board expects to keep its target for short-term interest rates close to 0% for “an extended period,” it began to wind down credit programs established during the financial crisis. The Fed’s most dramatic (though largely symbolic) act was to raise the interest rate at its discount window, a lending facility designed to help commercial banks and other depository institutions meet emergency short-term funding needs.
The broad taxable bond market returned 3.19%, with notable strength in corporate bonds. The broad municipal bond market returned 4.13%.
Consumer discretionary leads productive pack
The broad U.S. stock market continued its climb through the first six months of the fiscal year, although it didn’t maintain the torrid pace set through the spring and summer of 2009. All sectors of the stock market managed positive returns over the six months. Compared to other time periods, there was not a great difference between the best and worst performers.
With a return of more than 17%, the Consumer Discretionary Index Fund was the top Vanguard U.S. Sector Index Fund for the period. A wide variety of companies drove the gains. Media firms, specialty retailers, Internet retailers, hotels, restaurants, and automobile companies were among the businesses that rebounded as cost-cutting measures improved the bottom line and consumer spending increased.
The Industrials Index Fund was the second-highest performer, advancing more than 15%. Manufacturers and farms revved up production in the improving economy. The aerospace and defense and machinery subsectors both shone. Industrial conglomerate General Electric, a bellwether stock for the broader economy, saw improvement in service orders and equipment orders.
Five of the sector index funds––Energy, Materials, Health Care, Information Technology, and Consumer Staples––posted returns of between 10% and 12%, in line with the broad U.S. stock market. Boosts in the returns of oil stocks and of metals and mining stocks lifted the energy and materials sectors, respectively. The health care sector benefited from merger activity. Consumers’ renewed spending on computers and electronic components sparked the IT sector, while major household product and beverage companies were leaders in consumer staples.
The Telecommunication Services Index Fund returned more than 6%. This was several percentage points better than its benchmark, because of regulatory constraints that limited the fund’s exposure to the poorly performing stocks of AT&T and Verizon, both heavily weighted in the index. With the introduction of the new indexes, we don’t expect such return discrepancies to persist in the future. The Financials Index Fund returned about 2% as several major banks still struggled with distressed assets. The Utilities Index Fund, which invests in one of the smaller market sectors, also rose about 2%.
Sector funds offer means to diversify
Diversification, as we often remind investors, is an important element in any investing strategy––a point underscored by the stock and bond markets’ turbulence of the last two years. A portfolio that is diversified and balanced both across and within asset classes can help you tap the market’s top-performing assets while softening the blows from the worst performers.
Any one of the Vanguard U.S. Sector Index Funds, as a solitary investment, would likely be riskier and more unpredictable than the overall U.S. stock market. However, these funds are intended to complement and diversify an investment portfolio, rather than stand as a core holding.
Our commitment to indexing and to low costs, two other Vanguard precepts, is reflected in the U.S. Sector Index Funds. Vanguard Quantitative Equity Group, the funds’ advisor, is a proven global leader in its more than 30 years of expert index fund management. And the funds’ low costs allow you keep more of the returns.
On another matter, I would like to inform you that as of January 1, 2010, we completed a leadership transition that began in March 2008. I succeeded Jack Brennan as chairman of Vanguard and each of the funds. Jack has agreed to serve as chairman emeritus and senior advisor. Under Jack’s leadership, Vanguard has grown to become a preeminent firm in the mutual fund industry. Jack’s energy, his relentless pursuit of perfection, and his unwavering focus on always doing the right thing for our clients are evident in every facet of Vanguard policy today.
Thank you for entrusting your assets to Vanguard.
Sincerely,

F. William McNabb III
Chairman and Chief Executive Officer
March 10, 2010
3
| | | | |
| Your Fund’s Performance at a Glance | | | | |
| August 31, 2009–February 28, 2010 | | | | |
| |
| | | | Distributions Per Share |
| | Starting | Ending | Income | Capital |
| | Share Price | Share Price | Dividends | Gains |
| Consumer Discretionary Index Fund | | | | |
| Admiral Shares | $21.43 | $24.99 | $0.228 | $0.000 |
| ETF Shares | 41.37 | 48.25 | 0.437 | 0.000 |
| Consumer Staples Index Fund | | | | |
| Admiral Shares | $30.62 | $33.06 | $0.850 | $0.000 |
| ETF Shares | 62.07 | 67.01 | 1.738 | 0.000 |
| Energy Index Fund | | | | |
| Admiral Shares | $37.34 | $40.85 | $0.580 | $0.000 |
| ETF Shares | 74.74 | 81.76 | 1.193 | 0.000 |
| Financials Index Fund | | | | |
| Admiral Shares | $14.72 | $14.94 | $0.157 | $0.000 |
| ETF Shares | 29.38 | 29.82 | 0.316 | 0.000 |
| Health Care Index Fund | | | | |
| Admiral Shares | $25.19 | $27.33 | $0.737 | $0.000 |
| ETF Shares | 50.37 | 54.66 | 1.487 | 0.000 |
| Industrials Index Fund | | | | |
| Admiral Shares | $23.85 | $27.20 | $0.345 | $0.000 |
| ETF Shares | 46.45 | 52.94 | 0.715 | 0.000 |
| Information Technology Index Fund | | | | |
| Admiral Shares | $24.39 | $26.94 | $0.118 | $0.000 |
| ETF Shares | 47.64 | 52.62 | 0.250 | 0.000 |
| Materials Index Fund | | | | |
| Admiral Shares | $30.68 | $33.39 | $0.459 | $0.000 |
| ETF Shares | 60.23 | 65.53 | 0.923 | 0.000 |
| Telecommunication Services Index Fund | | | | |
| Admiral Shares | $25.77 | $26.80 | $0.757 | $0.000 |
| ETF Shares | 50.58 | 52.61 | 1.511 | 0.000 |
| Utilities Index Fund | | | | |
| Admiral Shares | $30.73 | $30.92 | $0.610 | $0.000 |
| ETF Shares | 61.24 | 61.60 | 1.227 | 0.000 |
4
Consumer Discretionary Index Fund
Fund Profile
As of February 28, 2010
| | | |
| Portfolio Characteristics | | |
| | | Target | Broad |
| | Fund | Index1 | Index2 |
| Number of Stocks | 378 | 379 | 2,492 |
| Median Market Cap | $15.6B | $15.6B | $29.0B |
| Price/Earnings Ratio | 22.2x | 22.2x | 21.2x |
| Price/Book Ratio | 2.5x | 2.5x | 2.1x |
| Yield3 | | 1.3% | 1.9% |
| Admiral Shares | 1.0% | | |
| ETF Shares | 1.0% | | |
| Return on Equity | 16.0% | 16.0% | 19.4% |
| Earnings Growth Rate | 6.9% | 6.8% | 8.1% |
| Foreign Holdings | 0.0% | 0.0% | 0.0% |
| Turnover Rate4 | 8% | — | — |
| Expense Ratio5 | | — | — |
| Admiral Shares | 0.28% | | |
| ETF Shares | 0.25% | | |
| Short-Term Reserves | 0.0% | — | — |
| | |
| Volatility Measures6 | |
| | Fund Versus | Fund Versus |
| | Target Index1 | Broad Index2 |
| R-Squared | 1.00 | 0.86 |
| Beta | 1.00 | 1.18 |
| |
| Subindustry Diversification (% of equity exposure) | |
| Advertising | 1.5% |
| Apparel Retail | 6.1 |
| Apparel, Accessories & Luxury Goods | 3.2 |
| Auto Parts & Equipment | 3.2 |
| Automotive Manufacturers | 2.8 |
| Automotive Retail | 1.9 |
| Broadcasting | 2.4 |
| Cable & Satellite | 9.6 |
| Casinos & Gaming | 2.2 |
| Computer & Electronics Retail | 1.5 |
| Department Stores | 3.3 |
| Education Services | 2.1 |
| Footwear | 2.5 |
| General Merchandise Stores | 3.9 |
| Home Improvement Retail | 7.4 |
| Homebuilding | 1.7 |
| Homefurnishing Retail | 1.3 |
| Hotels, Resorts & Cruise Lines | 3.5 |
| Housewares & Specialties | 1.4 |
| Internet Retail | 4.7 |
| Leisure Products | 1.4 |
| Movies & Entertainment | 11.5 |
| Publishing | 2.1 |
| Restaurants | 10.3 |
| Specialized Consumer Services | 1.4 |
| Specialty Stores | 3.1 |
| Other Consumer Discretionary | 4.0 |
| |
| Ten Largest Holdings7 (% of total net assets) |
| McDonald’s Corp. | 5.4% |
| Walt Disney Co. | 4.5 |
| Home Depot Inc. | 4.2 |
| Comcast Corp. | 3.6 |
| Amazon.com Inc. | 3.2 |
| Target Corp. | 2.9 |
| Lowe’s Cos. Inc. | 2.7 |
| Ford Motor Co. | 2.7 |
| Time Warner Inc. | 2.7 |
| News Corp. | 2.4 |
| Top Ten | 34.3% |
1 MSCI US IMI/Consumer Discretionary.
2 MSCI US IMI/2500.
3 30-day SEC yield for the fund; annualized dividend yield for the indexes. See the Glossary.
4 Annualized.
5 The expense ratios shown are from the prospectuses dated December 28, 2009, and represent estimated costs for the current fiscal year based on the fund’s net assets as of the prospectus date. For the six months ended February 28, 2010, the annualized expense ratios were 0.26% for the Admiral Shares and 0.23% for the ETF Shares.
6 For an explanation of R-squared, beta, and other terms used here, see the Glossary.
7 The holdings listed exclude any temporary cash investments and equity index products.
5
Consumer Discretionary Index Fund
Performance Summary
All of the returns in this report represent past performance, which is not a guarantee of future results that may be achieved by the fund. (Current performance may be lower or higher than the performance data cited. For performance data current to the most recent month-end, visit our website at www.vanguard.com/performance.) Note, too, that both investment returns and principal value can fluctuate widely, so an investor’s shares, when sold, could be worth more or less than their original cost. The returns shown do not reflect taxes that a shareholder would pay on fund distributions or on the sale of fund shares.
Fiscal-Year Total Returns (%): January 26, 2004–February 28, 2010
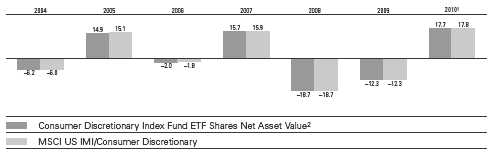
Average Annual Total Returns: Periods Ended December 31, 2009
This table presents average annual total returns through the latest calendar quarter—rather than through the end of the fiscal period. Securities and Exchange Commission rules require that we provide this information.
| | | | |
| | | | | Since |
| | Inception Date | One Year | Five Years | Inception |
| ETF Shares | 1/26/2004 | | | |
| Market Price | | 46.43% | –2.16% | –0.11% |
| Net Asset Value | | 46.52 | –2.15 | –0.11 |
| Admiral Shares3 | 7/14/2005 | 46.45 | — | –2.27 |
1 Six months ended February 28, 2010.
2 For more information about how the ETF Shares’ market prices have compared with their net asset value, visit www.vanguard.com, select your ETF, and then select the Performance tab. The Premium/Discount table there shows the percentages of days on which the ETF Shares’ market price was above or below the NAV.
3 Total returns do not reflect the 2% fee assessed on redemptions of shares held for less than one year.
See Financial Highlights for dividend and capital gains information.
6
Consumer Discretionary Index Fund
Financial Statements (unaudited)
Statement of Net Assets
As of February 28, 2010
The fund reports a complete list of its holdings in regulatory filings four times in each fiscal year, at the quarter-ends. For the second and fourth fiscal quarters, the lists appear in the fund’s semiannual and annual reports to shareholders. For the first and third fiscal quarters, the fund files the lists with the Securities and Exchange Commission on Form N-Q. Shareholders can look up the fund’s Forms N-Q on the SEC’s website at www.sec.gov. Forms N-Q may also be reviewed and copied at the SEC’s Public Reference Room (see the back cover of this report for further information).
| | | |
| | | | Market |
| | | | Value• |
| | | Shares | ($000) |
| Common Stocks (100.0%) | | |
| Auto Components (3.5%) | | |
| | Johnson Controls Inc. | 112,996 | 3,514 |
| * | BorgWarner Inc. | 19,660 | 737 |
| | Autoliv Inc. | 14,310 | 638 |
| * | Goodyear Tire & Rubber Co. | 38,805 | 504 |
| | Gentex Corp. | 23,195 | 450 |
| * | TRW Automotive | | |
| | Holdings Corp. | 11,873 | 319 |
| * | Dana Holding Corp. | 23,420 | 266 |
| * | Tenneco Inc. | 9,972 | 201 |
| | Cooper Tire & Rubber Co. | 9,667 | 170 |
| * | ArvinMeritor Inc. | 14,389 | 168 |
| * | American Axle & | | |
| | Manufacturing Holdings Inc. | 10,539 | 103 |
| * | Federal Mogul Corp. | 5,053 | 98 |
| * | Drew Industries Inc. | 3,531 | 82 |
| * | Modine Manufacturing Co. | 7,784 | 73 |
| * | Exide Technologies | 12,639 | 73 |
| * | Fuel Systems Solutions Inc. | 2,358 | 66 |
| | Superior Industries | | |
| | International Inc. | 3,794 | 55 |
| * | Dorman Products Inc. | 2,070 | 37 |
| | Spartan Motors Inc. | 5,209 | 29 |
| * | Wonder Auto Technology Inc. | 2,660 | 26 |
| * | Raser Technologies Inc. | 10,448 | 11 |
| | | | 7,620 |
| Automobiles (3.2%) | | |
| * | Ford Motor Co. | 490,250 | 5,756 |
| | Harley-Davidson Inc. | 39,430 | 970 |
| | Thor Industries Inc. | 6,094 | 207 |
| * | Winnebago Industries | 4,877 | 57 |
| | | | 6,990 |
| Distributors (0.7%) | | |
| | Genuine Parts Co. | 26,845 | 1,084 |
| * | LKQ Corp. | 21,426 | 410 |
| * | Core-Mark Holding Co. Inc. | 1,569 | 50 |
| | | | 1,544 |
| Diversified Consumer Services (3.5%) | |
| * | Apollo Group Inc. Class A | 22,102 | 1,323 |
| | H&R Block Inc. | 56,398 | 975 |
| | DeVry Inc. | 10,751 | 679 |
| * | ITT Educational Services Inc. | 6,213 | 677 |
| | Strayer Education Inc. | 2,359 | 535 |
| * | Career Education Corp. | 14,553 | 405 |
| | Service Corp. International | 42,617 | 343 |
| * | Brink’s Home | | |
| | Security Holdings Inc. | 7,728 | 323 |
| | Sotheby’s | 11,295 | 274 |
| * | Corinthian Colleges Inc. | 14,012 | 227 |
| | Hillenbrand Inc. | 10,456 | 210 |
| * | Capella Education Co. | 2,381 | 198 |
| | Matthews International Corp. | | |
| | Class A | 5,100 | 171 |
| | Regis Corp. | 9,606 | 159 |
| | | |
| | | | Market |
| | | | Value• |
| | | Shares | ($000) |
| * | Coinstar Inc. | 5,229 | 155 |
| | Weight Watchers | | |
| | International Inc. | 5,818 | 150 |
| * | American Public | | |
| | Education Inc. | 2,935 | 127 |
| * | Steiner Leisure Ltd. | 2,318 | 100 |
| * | Universal Technical | | |
| | Institute Inc. | 3,359 | 85 |
| | Stewart Enterprises Inc. | | |
| | Class A | 13,601 | 67 |
| * | K12 Inc. | 2,983 | 60 |
| * | Grand Canyon Education Inc. | 2,660 | 58 |
| * | Bridgepoint Education Inc. | 3,204 | 54 |
| * | Lincoln Educational | | |
| | Services Corp. | 2,327 | 52 |
| * | Pre-Paid Legal Services Inc. | 1,213 | 50 |
| * | Jackson Hewitt Tax | | |
| | Service Inc. | 4,761 | 12 |
| | | | 7,469 |
| Hotels, Restaurants & Leisure (16.1%) | |
| | McDonald’s Corp. | 181,648 | 11,598 |
| * | Starbucks Corp. | 124,590 | 2,854 |
| | Yum! Brands Inc. | 78,724 | 2,655 |
| | Carnival Corp. | 73,554 | 2,645 |
| | Marriott International Inc. | | |
| | Class A | 50,933 | 1,381 |
| | Starwood Hotels & | | |
| | Resorts Worldwide Inc. | 31,478 | 1,218 |
| * | Las Vegas Sands Corp. | 55,542 | 924 |
| | Darden Restaurants Inc. | 22,353 | 906 |
| | International Game | | |
| | Technology | 49,615 | 871 |
| | Wynn Resorts Ltd. | 12,444 | 791 |
| | Wyndham Worldwide Corp. | 30,102 | 692 |
| * | Royal Caribbean Cruises Ltd. | 23,444 | 663 |
| * | Chipotle Mexican Grill Inc. | | |
| | Class A | 5,349 | 560 |
| * | MGM Mirage | 44,559 | 470 |
| * | WMS Industries Inc. | 9,875 | 375 |
| * | Panera Bread Co. Class A | 5,071 | 369 |
| * | Bally Technologies Inc. | 8,788 | 364 |
| | Wendy’s/Arby’s Group Inc. | | |
| | Class A | 67,537 | 330 |
| | Brinker International Inc. | 17,249 | 312 |
| | Burger King Holdings Inc. | 15,887 | 284 |
| * | Penn National Gaming Inc. | 11,285 | 261 |
| * | Cheesecake Factory Inc. | 9,656 | 228 |
| * | Hyatt Hotels Corp. Class A | 6,378 | 213 |
| * | Jack in the Box Inc. | 9,685 | 204 |
| * | Scientific Games Corp. | | |
| | Class A | 11,766 | 199 |
| | Choice Hotels | | |
| | International Inc. | 5,506 | 182 |
| * | Orient-Express Hotels Ltd. | | |
| | Class A | 15,047 | 172 |
| | | |
| | | | Market |
| | | | Value• |
| | | Shares | ($000) |
| | Cracker Barrel Old | | |
| | Country Store Inc. | 3,840 | 168 |
| * | Life Time Fitness Inc. | 6,265 | 159 |
| * | PF Chang’s China Bistro Inc. | 3,697 | 157 |
| * | Vail Resorts Inc. | 4,288 | 154 |
| | Bob Evans Farms Inc. | 5,249 | 150 |
| * | CEC Entertainment Inc. | 3,824 | 134 |
| * | Buffalo Wild Wings Inc. | 2,908 | 128 |
| * | Texas Roadhouse Inc. Class A | 9,461 | 127 |
| | International Speedway Corp. | | |
| | Class A | 4,693 | 125 |
| * | Gaylord Entertainment Co. | 5,531 | 124 |
| * | Interval Leisure Group Inc. | 6,729 | 97 |
| * | Papa John’s International Inc. | 3,826 | 93 |
| * | Domino’s Pizza Inc. | 7,383 | 92 |
| | CKE Restaurants Inc. | 7,788 | 89 |
| * | Ruby Tuesday Inc. | 10,220 | 83 |
| * | Sonic Corp. | 9,710 | 82 |
| * | Peet’s Coffee & Tea Inc. | 2,181 | 79 |
| * | DineEquity Inc. | 2,537 | 74 |
| * | Shuffle Master Inc. | 9,005 | 74 |
| * | Pinnacle Entertainment Inc. | 10,049 | 73 |
| * | Boyd Gaming Corp. | 9,398 | 72 |
| * | Steak N Shake Co. | 205 | 70 |
| * | BJ’s Restaurants Inc. | 3,120 | 67 |
| | Ameristar Casinos Inc. | 4,341 | 65 |
| * | California Pizza Kitchen Inc. | 3,834 | 60 |
| | Churchill Downs Inc. | 1,604 | 57 |
| * | Red Robin Gourmet | | |
| | Burgers Inc. | 2,623 | 52 |
| * | Denny’s Corp. | 16,213 | 45 |
| | Speedway Motorsports Inc. | 2,509 | 44 |
| | Marcus Corp. | 3,487 | 43 |
| * | Landry’s Restaurants Inc. | 1,897 | 39 |
| * | AFC Enterprises Inc. | 4,249 | 34 |
| * | Krispy Kreme Doughnuts Inc. | 9,602 | 34 |
| | Ambassadors Group Inc. | 2,854 | 32 |
| * | Isle of Capri Casinos Inc. | 2,944 | 22 |
| * | Morgans Hotel Group Co. | 4,409 | 19 |
| * | Monarch Casino & Resort Inc. | 1,588 | 12 |
| | Dover Downs Gaming & | | |
| | Entertainment Inc. | 2,496 | 9 |
| | | | 34,759 |
| Household Durables (5.3%) | | |
| | Fortune Brands Inc. | 25,323 | 1,110 |
| | Whirlpool Corp. | 12,493 | 1,051 |
| | Black & Decker Corp. | 10,143 | 735 |
| * | NVR Inc. | 949 | 672 |
| ^ | Garmin Ltd. | 20,286 | 648 |
| | Newell Rubbermaid Inc. | 46,681 | 642 |
| * | Pulte Homes Inc. | 57,638 | 624 |
| | DR Horton Inc. | 48,174 | 596 |
| * | Mohawk Industries Inc. | 9,796 | 505 |
| | Tupperware Brands Corp. | 10,690 | 500 |
| | Jarden Corp. | 15,011 | 481 |
7
Consumer Discretionary Index Fund
| | | |
| | | | Market |
| | | | Value• |
| | | Shares | ($000) |
| | Harman International | | |
| | Industries Inc. | 11,098 | 479 |
| | Leggett & Platt Inc. | 24,303 | 461 |
| * | Toll Brothers Inc. | 23,063 | 434 |
| | Lennar Corp. Class A | 25,572 | 420 |
| * | Tempur-Pedic | | |
| | International Inc. | 11,382 | 323 |
| | KB Home | 13,375 | 218 |
| | MDC Holdings Inc. | 6,350 | 217 |
| | Ryland Group Inc. | 7,377 | 167 |
| * | Helen of Troy Ltd. | 4,795 | 116 |
| | American Greetings Corp. | | |
| | Class A | 6,013 | 115 |
| * | Meritage Homes Corp. | 5,109 | 109 |
| * | La-Z-Boy Inc. | 8,658 | 109 |
| | National Presto Industries Inc. | 803 | 101 |
| * | Standard Pacific Corp. | 17,695 | 75 |
| | Ethan Allen Interiors Inc. | 4,398 | 70 |
| * | Universal Electronics Inc. | 2,285 | 52 |
| * | iRobot Corp. | 3,133 | 51 |
| * | Beazer Homes USA Inc. | 9,956 | 41 |
| * | M/I Homes Inc. | 2,935 | 38 |
| * | Furniture Brands | | |
| | International Inc. | 6,583 | 36 |
| * | Hovnanian Enterprises Inc. | | |
| | Class A | 8,911 | 35 |
| | Blyth Inc. | 1,046 | 30 |
| * | Sealy Corp. | 7,638 | 26 |
| | CSS Industries Inc. | 1,281 | 22 |
| * | Brookfield Homes Corp. | 1,749 | 13 |
| | | | 11,322 |
| Internet & Catalog Retail (4.8%) | | |
| * | Amazon.com Inc. | 58,304 | 6,903 |
| * | priceline.com Inc. | 7,032 | 1,595 |
| * | Expedia Inc. | 33,221 | 739 |
| * | NetFlix Inc. | 7,811 | 516 |
| * | HSN Inc. | 7,100 | 154 |
| * | Blue Nile Inc. | 2,471 | 127 |
| | NutriSystem Inc. | 4,662 | 90 |
| | PetMed Express Inc. | 3,866 | 75 |
| * | Shutterfly Inc. | 3,196 | 61 |
| * | Orbitz Worldwide Inc. | 6,299 | 37 |
| * | Overstock.com Inc. | 2,687 | 33 |
| * | Gaiam Inc. Class A | 2,668 | 19 |
| * | 1-800-Flowers.com Inc. | | |
| | Class A | 4,485 | 9 |
| | | | 10,358 |
| Leisure Equipment & Products (1.5%) | |
| | Mattel Inc. | 60,888 | 1,339 |
| | Hasbro Inc. | 20,951 | 750 |
| * | Eastman Kodak Co. | 45,106 | 268 |
| | Polaris Industries Inc. | 5,239 | 240 |
| | Brunswick Corp. | 14,802 | 171 |
| | Pool Corp. | 8,260 | 165 |
| | Callaway Golf Co. | 10,788 | 86 |
| * | Jakks Pacific Inc. | 4,646 | 57 |
| * | RC2 Corp. | 3,603 | 51 |
| * | Smith & Wesson | | |
| | Holding Corp. | 9,036 | 39 |
| | Sturm Ruger & Co. Inc. | 3,192 | 37 |
| * | Leapfrog Enterprises Inc. | 5,772 | 31 |
| | Marine Products Corp. | 2,006 | 13 |
| | | | 3,247 |
| Media (27.1%) | | |
| | Walt Disney Co. | 307,576 | 9,609 |
| | Time Warner Inc. | 196,526 | 5,707 |
| * | DIRECTV Class A | 152,955 | 5,178 |
| | Comcast Corp. Class A | 313,588 | 5,155 |
| | News Corp. Class A | 334,612 | 4,474 |
| | Time Warner Cable Inc. | 59,326 | 2,770 |
| | | |
| | | | Market |
| | | | Value• |
| | | Shares | ($000) |
| * | Viacom Inc. Class B | 93,361 | 2,768 |
| | Comcast Corp. | 165,320 | 2,561 |
| | Omnicom Group Inc. | 52,388 | 1,918 |
| | McGraw-Hill Cos. Inc. | 53,032 | 1,814 |
| | CBS Corp. Class B | 100,069 | 1,300 |
| * | Liberty Media Corp.- | | |
| | Interactive | 95,522 | 1,203 |
| | Cablevision Systems Corp. | | |
| | Class A | 41,561 | 1,001 |
| | Virgin Media Inc. | 47,108 | 763 |
| | News Corp. Class B | 45,904 | 723 |
| * | Discovery | | |
| | Communications Inc. | | |
| | Class A | 22,750 | 709 |
| | DISH Network Corp. | | |
| | Class A | 35,130 | 702 |
| * | Sirius XM Radio Inc. | 648,978 | 662 |
| * | Discovery | | |
| | Communications Inc. | 23,835 | 633 |
| * | Interpublic Group of | | |
| | Cos. Inc. | 81,867 | 614 |
| | Scripps Networks | | |
| | Interactive Inc. Class A | 15,244 | 603 |
| | Gannett Co. Inc. | 39,764 | 602 |
| * | Liberty Global Inc. Class A | 21,843 | 587 |
| * | Liberty Global Inc. | 20,099 | 532 |
| * | Liberty Media Corp. - Capital | 15,199 | 514 |
| * | DreamWorks Animation | | |
| | SKG Inc. Class A | 11,409 | 496 |
| | Washington Post Co. Class B | 1,025 | 431 |
| * | Liberty Media Corp. - Starz | 8,328 | 424 |
| | John Wiley & Sons Inc. | | |
| | Class A | 7,421 | 312 |
| * | Live Nation | | |
| | Entertainment Inc. | 22,754 | 296 |
| * | Lamar Advertising Co. | | |
| | Class A | 9,674 | 291 |
| * | New York Times Co. Class A | 23,024 | 252 |
| | Regal Entertainment Group | | |
| | Class A | 14,209 | 212 |
| * | Valassis Communications Inc. | 8,126 | 208 |
| * | Madison Square Garden Inc. | | |
| | Class A | 10,361 | 202 |
| | Interactive Data Corp. | 6,373 | 193 |
| | Meredith Corp. | 6,084 | 187 |
| | Scholastic Corp. | 5,302 | 156 |
| * | Morningstar Inc. | 3,265 | 144 |
| * | CTC Media Inc. | 7,651 | 131 |
| | National CineMedia Inc. | 7,053 | 113 |
| * | Lions Gate | | |
| | Entertainment Corp. | 19,859 | 108 |
| | Cinemark Holdings Inc. | 6,525 | 105 |
| | Belo Corp. Class A | 15,301 | 103 |
| | Arbitron Inc. | 4,433 | 95 |
| | Harte-Hanks Inc. | 6,907 | 82 |
| | World Wrestling | | |
| | Entertainment Inc. Class A | 3,910 | 67 |
| * | RCN Corp. | 6,038 | 66 |
| * | Clear Channel Outdoor | | |
| | Holdings Inc. Class A | 6,826 | 65 |
| * | Ascent Media Corp. Class A | 2,249 | 58 |
| * | Knology Inc. | 5,099 | 58 |
| * | Warner Music Group Corp. | 7,816 | 45 |
| * | Sinclair Broadcast Group Inc. | | |
| | Class A | 8,060 | 40 |
| * | Dolan Media Co. | 3,808 | 40 |
| * | EW Scripps Co. Class A | 4,981 | 38 |
| * | Mediacom | | |
| | Communications Corp. | | |
| | Class A | 6,751 | 31 |
| * | CKX Inc. | 7,103 | 30 |
| | | |
| | | | Market |
| | | | Value• |
| | | Shares | ($000) |
| * | LIN TV Corp. Class A | 4,996 | 26 |
| | Journal Communications Inc. | | |
| | Class A | 6,789 | 25 |
| * | Martha Stewart Living | | |
| | Omnimedia Class A | 4,397 | 24 |
| * | Fisher Communications Inc. | 1,187 | 17 |
| * | Outdoor Channel | | |
| | Holdings Inc. | 2,309 | 13 |
| | | | 58,286 |
| Multiline Retail (7.2%) | | |
| | Target Corp. | 120,280 | 6,197 |
| * | Kohl’s Corp. | 48,864 | 2,630 |
| | Macy’s Inc. | 70,863 | 1,357 |
| | Nordstrom Inc. | 27,411 | 1,012 |
| | JC Penney Co. Inc. | 35,785 | 987 |
| * | Dollar Tree Inc. | 14,844 | 827 |
| *,^ | Sears Holdings Corp. | 7,774 | 744 |
| | Family Dollar Stores Inc. | 22,176 | 731 |
| * | Big Lots Inc. | 13,913 | 466 |
| * | Saks Inc. | 23,156 | 162 |
| | Dillard’s Inc. Class A | 9,463 | 160 |
| * | 99 Cents Only Stores | 8,069 | 133 |
| | Fred’s Inc. Class A | 6,340 | 66 |
| * | Retail Ventures Inc. | 4,851 | 43 |
| | | | 15,515 |
| Specialty Retail (21.3%) | | |
| | Home Depot Inc. | 286,910 | 8,952 |
| | Lowe’s Cos. Inc. | 248,608 | 5,894 |
| | Staples Inc. | 121,584 | 3,132 |
| | TJX Cos. Inc. | 71,351 | 2,970 |
| | Best Buy Co. Inc. | 59,595 | 2,175 |
| * | Bed Bath & Beyond Inc. | 44,229 | 1,840 |
| | Gap Inc. | 82,257 | 1,769 |
| | Ross Stores Inc. | 21,039 | 1,029 |
| | Sherwin-Williams Co. | 16,203 | 1,027 |
| | Ltd Brands Inc. | 46,005 | 1,017 |
| | Tiffany & Co. | 20,884 | 927 |
| * | O’Reilly Automotive Inc. | 23,092 | 908 |
| * | AutoZone Inc. | 5,032 | 835 |
| * | CarMax Inc. | 37,309 | 753 |
| * | Urban Outfitters Inc. | 21,263 | 685 |
| | Advance Auto Parts Inc. | 15,915 | 649 |
| | PetSmart Inc. | 20,782 | 566 |
| | Abercrombie & Fitch Co. | 14,793 | 539 |
| | American Eagle | | |
| | Outfitters Inc. | 31,420 | 530 |
| * | GameStop Corp. Class A | 26,323 | 453 |
| * | J Crew Group Inc. | 10,106 | 425 |
| | RadioShack Corp. | 21,076 | 412 |
| * | Chico’s FAS Inc. | 29,998 | 406 |
| * | Aeropostale Inc. | 11,297 | 399 |
| | Guess? Inc. | 9,307 | 380 |
| * | Dick’s Sporting Goods Inc. | 15,040 | 366 |
| | Foot Locker Inc. | 26,415 | 343 |
| * | AutoNation Inc. | 19,073 | 339 |
| * | Office Depot Inc. | 46,361 | 335 |
| | Williams-Sonoma Inc. | 15,152 | 325 |
| * | Tractor Supply Co. | 5,467 | 299 |
| * | Rent-A-Center Inc. | 11,174 | 248 |
| * | Collective Brands Inc. | 10,829 | 245 |
| * | Dress Barn Inc. | 9,789 | 243 |
| | Aaron’s Inc. | 7,834 | 232 |
| * | Gymboree Corp. | 5,035 | 219 |
| * | OfficeMax Inc. | 12,897 | 206 |
| | Men’s Wearhouse Inc. | 8,385 | 179 |
| * | AnnTaylor Stores Corp. | 9,945 | 171 |
| * | Jo-Ann Stores Inc. | 4,484 | 170 |
| * | Childrens Place | | |
| | Retail Stores Inc. | 3,910 | 149 |
| | Buckle Inc. | 4,701 | 138 |
| * | JOS A Bank Clothiers Inc. | 3,073 | 137 |
8
Consumer Discretionary Index Fund
| | | |
| | | | Market |
| | | | Value• |
| | | Shares | ($000) |
| | Barnes & Noble Inc. | 6,767 | 136 |
| * | Charming Shoppes Inc. | 19,328 | 115 |
| * | Group 1 Automotive Inc. | 4,110 | 114 |
| * | Sally Beauty Holdings Inc. | 13,730 | 112 |
| * | Penske Auto Group Inc. | 7,704 | 112 |
| * | Hibbett Sports Inc. | 4,867 | 112 |
| | Monro Muffler Brake Inc. | 3,149 | 110 |
| | Finish Line Inc. Class A | 8,887 | 107 |
| * | Cabela’s Inc. | 6,738 | 104 |
| | Brown Shoe Co. Inc. | 7,167 | 99 |
| * | Pier 1 Imports Inc. | 15,229 | 93 |
| * | Genesco Inc. | 3,817 | 91 |
| | Cato Corp. Class A | 4,647 | 91 |
| | Stage Stores Inc. | 6,371 | 85 |
| | PEP Boys-Manny Moe & Jack | 8,883 | 84 |
| * | Lumber Liquidators | | |
| | Holdings Inc. | 3,659 | 81 |
| * | Ulta Salon Cosmetics & | | |
| | Fragrance Inc. | 4,344 | 80 |
| * | Citi Trends Inc. | 2,465 | 73 |
| * | Sonic Automotive Inc. | | |
| | Class A | 6,750 | 70 |
| * | DSW Inc. Class A | 2,520 | 68 |
| * | hhgregg Inc. | 3,231 | 67 |
| * | Asbury Automotive | | |
| | Group Inc. | 5,403 | 63 |
| * | Wet Seal Inc. Class A | 15,376 | 62 |
| | Big 5 Sporting Goods Corp. | 3,422 | 52 |
| * | Coldwater Creek Inc. | 10,014 | 52 |
| * | Zumiez Inc. | 3,561 | 51 |
| * | Pacific Sunwear Of California | 11,060 | 50 |
| * | HOT Topic Inc. | 7,429 | 48 |
| * | Talbots Inc. | 4,226 | 46 |
| * | America’s Car-Mart Inc. | 1,685 | 45 |
| | Christopher & Banks Corp. | 6,036 | 42 |
| | Haverty Furniture Cos. Inc. | 2,934 | 39 |
| | Bebe Stores Inc. | 4,344 | 37 |
| * | Stein Mart Inc. | 4,264 | 35 |
| | Systemax Inc. | 1,210 | 20 |
| * | Build-A-Bear Workshop Inc. | 2,923 | 18 |
| * | New York & Co. Inc. | 4,616 | 17 |
| * | Borders Group Inc. | 10,034 | 14 |
| * | Zale Corp. | 5,364 | 13 |
| * | Conn’s Inc. | 1,688 | 8 |
| * | Blockbuster Inc. Class A | 17,290 | 5 |
| * | Blockbuster Inc. Class B | 12,033 | 3 |
| | | | 45,740 |
| Textiles, Apparel & Luxury Goods (5.8%) | |
| | NIKE Inc. Class B | 62,636 | 4,234 |
| | Coach Inc. | 53,695 | 1,957 |
| | VF Corp. | 14,959 | 1,157 |
| | Polo Ralph Lauren Corp. | | |
| | Class A | 9,497 | 759 |
| | | |
| | | | Market |
| | | | Value• |
| | | Shares | ($000) |
| * | Hanesbrands Inc. | 16,051 | 416 |
| | Phillips-Van Heusen Corp. | 8,691 | 378 |
| * | Warnaco Group Inc. | 7,644 | 319 |
| * | Fossil Inc. | 7,888 | 286 |
| * | Carter’s Inc. | 9,588 | 275 |
| * | Deckers Outdoor Corp. | 2,161 | 260 |
| | Jones Apparel Group Inc. | 14,323 | 241 |
| | Wolverine World Wide Inc. | 8,331 | 230 |
| * | Lululemon Athletica Inc. | 6,534 | 187 |
| * | Skechers U.S.A. Inc. Class A | 5,687 | 175 |
| * | Iconix Brand Group Inc. | 12,030 | 157 |
| * | Under Armour Inc. Class A | 5,706 | 149 |
| * | Timberland Co. Class A | 7,031 | 130 |
| | Unifirst Corp. | 2,448 | 129 |
| * | Steven Madden Ltd. | 2,729 | 115 |
| * | Liz Claiborne Inc. | 15,870 | 110 |
| | Columbia Sportswear Co. | 2,269 | 104 |
| * | CROCS Inc. | 14,325 | 101 |
| * | True Religion Apparel Inc. | 4,022 | 99 |
| * | Maidenform Brands Inc. | 3,306 | 57 |
| * | Quiksilver Inc. | 21,509 | 55 |
| * | Fuqi International Inc. | 2,741 | 50 |
| * | FGX International | | |
| | Holdings Ltd. | 2,392 | 47 |
| | Oxford Industries Inc. | 2,376 | 46 |
| * | Volcom Inc. | 2,839 | 46 |
| * | K-Swiss Inc. Class A | 4,517 | 42 |
| * | Movado Group Inc. | 2,978 | 38 |
| * | Unifi Inc. | 7,845 | 30 |
| | Weyco Group Inc. | 1,240 | 28 |
| * | Kenneth Cole | | |
| | Productions Inc. Class A | 1,704 | 20 |
| * | American Apparel Inc. | 5,307 | 15 |
| | | | 12,442 |
| Total Common Stocks | | |
| (Cost $222,616) | | 215,292 |
| Temporary Cash Investment (0.4%) | |
| Money Market Fund (0.4%) | | |
| 1,2 | Vanguard Market | | |
| | Liquidity Fund, 0.163% | | |
| | (Cost $844) | 844,019 | 844 |
| Total Investments (100.4%) | | |
| (Cost $223,460) | | 216,136 |
| Other Assets and Liabilities (–0.4%) | |
| Other Assets | | 1,380 |
| Liabilities2 | | (2,269) |
| | | | (889) |
| Net Assets (100%) | | 215,247 |
| |
| At February 28, 2010, net assets consisted of: |
| | Amount |
| | ($000) |
| Paid-in Capital | 236,481 |
| Undistributed Net Investment Income | 309 |
| Accumulated Net Realized Losses | (14,219) |
| Unrealized Appreciation (Depreciation) | (7,324) |
| Net Assets | 215,247 |
| |
| Admiral Shares—Net Assets | |
| Applicable to 114,182 outstanding | |
| $.001 par value shares of beneficial | |
| interest (unlimited authorization) | 2,853 |
| Net Asset Value Per Share— | |
| Admiral Shares | $24.99 |
| |
| ETF Shares—Net Assets | |
| Applicable to 4,402,208 outstanding | |
| $.001 par value shares of beneficial | |
| interest (unlimited authorization) | 212,394 |
| Net Asset Value Per Share— | |
| ETF Shares | $48.25 |
• See Note A in Notes to Financial Statements.
* Non-income-producing security.
^ Part of security position is on loan to broker-dealers. The total value of securities on loan is $763,000.
1 Affiliated money market fund available only to Vanguard funds and certain trusts and accounts managed by Vanguard. Rate shown is the 7-day yield.
2 Includes $789,000 of collateral received for securities on loan.
See accompanying Notes, which are an integral part of the Financial Statements.
9
Consumer Discretionary Index Fund
Statement of Operations
| |
| Six Months Ended |
| February 28, 2010 |
| | ($000) |
| Investment Income | |
| Income | |
| Dividends | 1,504 |
| Security Lending | 22 |
| Total Income | 1,526 |
| Expenses | |
| The Vanguard Group—Note B | |
| Investment Advisory Services | 13 |
| Management and Administrative— | |
| Admiral Shares | 2 |
| Management and Administrative— | |
| ETF Shares | 161 |
| Marketing and Distribution— | |
| Admiral Shares | — |
| Marketing and Distribution— | |
| ETF Shares | 23 |
| Shareholders’ Reports—Admiral Shares | — |
| Shareholders’ Reports—ETF Shares | 8 |
| Total Expenses | 207 |
| Net Investment Income | 1,319 |
| Realized Net Gain (Loss) on | |
| Investment Securities Sold | (680) |
| Change in Unrealized Appreciation | |
| (Depreciation) of Investment Securities | 27,327 |
| Net Increase (Decrease) in Net Assets | |
| Resulting from Operations | 27,966 |
Statement of Changes in Net Assets
| | |
| | Six Months Ended | Year Ended |
| | February 28, | August 31, |
| | 2010 | 2009 |
| | ($000) | ($000) |
| Increase (Decrease) in Net Assets | | |
| Operations | | |
| Net Investment Income | 1,319 | 1,838 |
| Realized Net Gain (Loss) | (680) | (63,452) |
| Change in Unrealized Appreciation (Depreciation) | 27,327 | 1,356 |
| Net Increase (Decrease) in Net Assets Resulting from Operations | 27,966 | (60,258) |
| Distributions | | |
| Net Investment Income | | |
| Admiral Shares | (19) | (11) |
| ETF Shares | (1,749) | (2,360) |
| Realized Capital Gain | | |
| Admiral Shares | — | — |
| ETF Shares | — | — |
| Total Distributions | (1,768) | (2,371) |
| Capital Share Transactions | | |
| Admiral Shares | 1,312 | 597 |
| ETF Shares | 45,701 | (53,138) |
| Net Increase (Decrease) from Capital Share Transactions | 47,013 | (52,541) |
| Total Increase (Decrease) | 73,211 | (115,170) |
| Net Assets | | |
| Beginning of Period | 142,036 | 257,206 |
| End of Period1 | 215,247 | 142,036 |
1 Net Assets—End of Period includes undistributed net investment income of $309,000 and $758,000.
See accompanying Notes, which are an integral part of the Financial Statements.
10
| | | | | | | |
| Consumer Discretionary Index Fund | | | | | | |
| |
| |
| Financial Highlights | | | | | | |
| |
| Admiral Shares | | | | | | | |
| | Six Months | | | | | July 14, |
| | | Ended | | | | | 20051 to |
| For a Share Outstanding | February 28, | Year Ended August 31, | Aug. 31, |
| Throughout Each Period | | 2010 | 2009 | 2008 | 2007 | 2006 | 2005 |
| Net Asset Value, Beginning of Period | $21.43 | $25.03 | $31.02 | $27.03 | $27.75 | $28.29 |
| Investment Operations | | | | | | | |
| Net Investment Income | | .148 | .398 | .2852 | .217 | .2452 | .1602 |
| Net Realized and Unrealized Gain (Loss) | | | | | | |
| on Investments | | 3.640 | (3.603) | (6.075) | 4.015 | (.808) | (.700) |
| Total from Investment Operations | 3.788 | (3.205) | (5.790) | 4.232 | (.563) | (.540) |
| Distributions | | | | | | | |
| Dividends from Net Investment Income | (.228) | (.395) | (.200) | (.242) | (.157) | — |
| Distributions from Realized Capital Gains | — | — | — | — | — | — |
| Total Distributions | | (.228) | (.395) | (.200) | (.242) | (.157) | — |
| Net Asset Value, End of Period | | $24.99 | $21.43 | $25.03 | $31.02 | $27.03 | $27.75 |
| |
| Total Return3 | | 17.71% | –12.34% | –18.74% | 15.64% | –2.03% | –1.91% |
| |
| Ratios/Supplemental Data | | | | | | | |
| Net Assets, End of Period (Millions) | $2.9 | $1.3 | $0.7 | $1.0 | $0.6 | $0.1 |
| Ratio of Total Expenses to | | | | | | | |
| Average Net Assets | | 0.26%4 | 0.28% | 0.25% | 0.27% | 0.28% | 0.28%4 |
| Ratio of Net Investment Income to | | | | | | |
| Average Net Assets | | 1.45%4 | 1.58% | 1.11% | 0.84% | 0.89% | 0.67%4 |
| Portfolio Turnover Rate5 | | 8%4 | 5% | 12% | 8% | 10% | 13% |
1 Inception.
2 Calculated based on average shares outstanding.
3 Total returns do not reflect the 2% fee assessed on redemptions of shares held for less than one year.
4 Annualized.
5 Excludes the value of portfolio securities received or delivered as a result of in-kind purchases or redemptions of the fund’s capital shares, including ETF Creation Units.
See accompanying Notes, which are an integral part of the Financial Statements.
11
| | | | | | | |
| Consumer Discretionary Index Fund | | | | | | |
| |
| |
| Financial Highlights | | | | | | |
| |
| ETF Shares | | | | | | | |
| | Six Months | | | | | |
| | | Ended | | | | | |
| For a Share Outstanding | February 28, | | | | Year Ended August 31, |
| Throughout Each Period | | 2010 | 2009 | 2008 | 2007 | 2006 | 2005 |
| Net Asset Value, Beginning of Period | $41.37 | $48.38 | $60.02 | $52.28 | $53.65 | $46.99 |
| Investment Operations | | | | | | | |
| Net Investment Income | | .285 | .764 | .5921 | .450 | .4941 | .3501 |
| Net Realized and Unrealized Gain (Loss) | | | | | | |
| on Investments | | 7.032 | (6.988) | (11.772) | 7.760 | (1.556) | 6.660 |
| Total from Investment Operations | 7.317 | (6.224) | (11.180) | 8.210 | (1.062) | 7.010 |
| Distributions | | | | | | | |
| Dividends from Net Investment Income | (.437) | (.786) | (.460) | (.470) | (.308) | (.350) |
| Distributions from Realized Capital Gains | — | — | — | — | — | — |
| Total Distributions | | (.437) | (.786) | (.460) | (.470) | (.308) | (.350) |
| Net Asset Value, End of Period | | $48.25 | $41.37 | $48.38 | $60.02 | $52.28 | $53.65 |
| |
| Total Return | | 17.72% | –12.32% | –18.70% | 15.69% | –1.99% | 14.91% |
| |
| Ratios/Supplemental Data | | | | | | | |
| Net Assets, End of Period (Millions) | $212 | $141 | $257 | $114 | $47 | $32 |
| Ratio of Total Expenses to | | | | | | | |
| Average Net Assets | | 0.23%2 | 0.25% | 0.20% | 0.22% | 0.25% | 0.26% |
| Ratio of Net Investment Income to | | | | | | |
| Average Net Assets | | 1.48%2 | 1.61% | 1.16% | 0.89% | 0.92% | 0.69% |
| Portfolio Turnover Rate3 | | 8%2 | 5% | 12% | 8% | 10% | 13% |
1 Calculated based on average shares outstanding.
2 Annualized.
3 Excludes the value of portfolio securities received or delivered as a result of in-kind purchases or redemptions of the fund’s capital shares, including ETF Creation Units.
See accompanying Notes, which are an integral part of the Financial Statements.
12
Consumer Discretionary Index Fund
Notes to Financial Statements
Vanguard Consumer Discretionary Index Fund is registered under the Investment Company Act of 1940 as an open-end investment company, or mutual fund. The fund offers two classes of shares, Admiral Shares and ETF Shares. Admiral Shares are available to any investor who meets the fund’s minimum purchase requirements. ETF Shares are listed for trading on the NYSE Arca, Inc.; they can be purchased and sold through a broker.
A. The following significant accounting policies conform to generally accepted accounting principles for U.S. mutual funds. The fund consistently follows such policies in preparing its financial statements.
1. Security Valuation: Securities are valued as of the close of trading on the New York Stock Exchange (generally 4 p.m., Eastern time) on the valuation date. Equity securities are valued at the latest quoted sales prices or official closing prices taken from the primary market in which each security trades; such securities not traded on the valuation date are valued at the mean of the latest quoted bid and asked prices. Securities for which market quotations are not readily available, or whose values have been materially affected by events occurring before the fund’s pricing time but after the close of the securities’ primary markets, are valued by methods deemed by the board of trustees to represent fair value. Investments in Vanguard Market Liquidity Fund are valued at that fund’s net asset value.
2. Federal Income Taxes: The fund intends to continue to qualify as a regulated investment company and distribute all of its taxable income. Management has analyzed the fund’s tax positions taken for all open federal income tax years (August 31, 2006–2009), and for the period ended February 28, 2010, and has concluded that no provision for federal income tax is required in the fund’s financial statements.
3. Distributions: Distributions to shareholders are recorded on the ex-dividend date.
4. Security Lending: The fund may lend its securities to qualified institutional borrowers to earn additional income. Security loans are required to be secured at all times by collateral at least equal to the market value of securities loaned. The fund invests cash collateral received in Vanguard Market Liquidity Fund, and records a liability for the return of the collateral, during the period the securities are on loan. Security lending income represents the income earned on investing cash collateral, less expenses associated with the loan.
5. Other: Dividend income is recorded on the ex-dividend date. Interest income includes income distributions received from Vanguard Market Liquidity Fund and is accrued daily. Security transactions are accounted for on the date securities are bought or sold. Costs used to determine realized gains (losses) on the sale of investment securities are those of the specific securities sold. Fees assessed on redemptions of capital shares are credited to paid-in capital.
Each class of shares has equal rights as to assets and earnings, except that each class separately bears certain class-specific expenses related to maintenance of shareholder accounts (included in Management and Administrative expenses) and shareholder reporting. Marketing and distribution expenses are allocated to each class of shares based on a method approved by the board of trustees. Income, other non-class-specific expenses, and gains and losses on investments are allocated to each class of shares based on its relative net assets.
B. The Vanguard Group furnishes at cost investment advisory, corporate management, administrative, marketing, and distribution services. The costs of such services are allocated to the fund under methods approved by the board of trustees. The fund has committed to provide up to 0.40% of its net assets in capital contributions to Vanguard. At February 28, 2010, the fund had contributed capital of $40,000 to Vanguard (included in Other Assets), representing 0.02% of the fund’s net assets and 0.02% of Vanguard’s capitalization. The fund’s trustees and officers are also directors and officers of Vanguard.
C. Various inputs may be used to determine the value of the fund’s investments. These inputs are summarized in three broad levels for financial statement purposes. The inputs or methodologies used to value securities are not necessarily an indication of the risk associated with investing in those securities.
Level 1—Quoted prices in active markets for identical securities.
Level 2—Other significant observable inputs (including quoted prices for similar securities, interest rates, prepayment speeds, credit risk, etc.).
Level 3—Significant unobservable inputs (including the fund’s own assumptions used to determine the fair value of investments).
At February 28, 2010, 100% of the fund’s investments were valued based on Level 1 inputs.
13
Consumer Discretionary Index Fund
D. Distributions are determined on a tax basis and may differ from net investment income and realized capital gains for financial reporting purposes. Differences may be permanent or temporary. Permanent differences are reclassified among capital accounts in the financial statements to reflect their tax character. Temporary differences arise when certain items of income, expense, gain, or loss are recognized in different periods for financial statement and tax purposes; these differences will reverse at some time in the future. Differences in classification may also result from the treatment of short-term gains as ordinary income for tax purposes.
The fund’s tax-basis capital gains and losses are determined only at the end of each fiscal year. For tax purposes, at August 31, 2009, the fund had available capital loss carryforwards totaling $6,383,000 to offset future net capital gains of $36,000 through August 31, 2013, $86,000 through August 31, 2014, $178,000 through August 31, 2015, $1,526,000 through August 31, 2016, and $4,557,000 through August 31, 2017. In addition, the fund realized losses of $7,145,000 during the period from November 1, 2008, through August 31, 2009, which are deferred and will be treated as realized for tax purposes in fiscal 2010. The fund will use these capital losses to offset net taxable capital gains, if any, realized during the year ending August 31, 2010; should the fund realize net capital losses for the year, the losses will be added to the loss carryforward balances above.
At February 28, 2010, the cost of investment securities for tax purposes was $223,460,000. Net unrealized depreciation of investment securities for tax purposes was $7,324,000, consisting of unrealized gains of $13,963,000 on securities that had risen in value since their purchase and $21,287,000 in unrealized losses on securities that had fallen in value since their purchase.
E. During the six months ended February 28, 2010, the fund purchased $53,366,000 of investment securities and sold $6,748,000 of investment securities, other than temporary cash investments.
F. Capital share transactions for each class of shares were:
| | | | |
| | Six Months Ended | | Year Ended |
| | February 28, 2010 | August 31, 2009 |
| | Amount | Shares | Amount | Shares |
| | ($000) | (000) | ($000) | (000) |
| Admiral Shares | | | | |
| Issued | 1,296 | 53 | 659 | 34 |
| Issued in Lieu of Cash Distributions | 16 | 1 | 10 | 1 |
| Redeemed | — | — | (72) | (4) |
| Net Increase (Decrease)—Admiral Shares | 1,312 | 54 | 597 | 31 |
| ETF Shares | | | | |
| Issued | 45,701 | 1,000 | 100,999 | 2,600 |
| Issued in Lieu of Cash Distributions | — | — | — | — |
| Redeemed | — | — | (154,137) | (4,500) |
| Net Increase (Decrease)—ETF Shares | 45,701 | 1,000 | (53,138) | (1,900) |
G. In preparing the financial statements as of February 28, 2010, management considered the impact of subsequent events for potential recognition or disclosure in these financial statements.
14
Consumer Staples Index Fund
Fund Profile
As of February 28, 2010
| | | |
| Portfolio Characteristics | | |
| | | Target | Broad |
| | Fund | Index1 | Index2 |
| Number of Stocks | 115 | 115 | 2,492 |
| Median Market Cap | $49.1B | $49.1B | $29.0B |
| Price/Earnings Ratio | 16.6x | 16.6x | 21.2x |
| Price/Book Ratio | 3.1x | 3.2x | 2.1x |
| Yield3 | | 2.9% | 1.9% |
| Admiral Shares | 2.4% | | |
| ETF Shares | 2.5% | | |
| Return on Equity | 22.9% | 23.5% | 19.4% |
| Earnings Growth Rate | 7.8% | 7.7% | 8.1% |
| Foreign Holdings | 0.0% | 0.0% | 0.0% |
| Turnover Rate4 | 8% | — | — |
| Expense Ratio5 | | — | — |
| Admiral Shares | 0.28% | | |
| ETF Shares | 0.25% | | |
| Short-Term Reserves | 0.0% | — | — |
| | |
| Volatility Measures6 | |
| | Fund Versus | Fund Versus |
| | Target Index1 | Broad Index2 |
| R-Squared | 0.99 | 0.79 |
| Beta | 1.01 | 0.60 |
| |
| Subindustry Diversification (% of equity exposure) | |
| Agricultural Products | 2.7% |
| Drug Retail | 6.9 |
| Food Distributors | 1.8 |
| Food Retail | 3.7 |
| Household Products | 21.4 |
| Hypermarkets & Supercenters | 11.7 |
| Packaged Foods & Meats | 17.2 |
| Personal Products | 3.3 |
| Soft Drinks | 17.6 |
| Tobacco | 12.2 |
| Other Consumer Staples | 1.5 |
| |
| Ten Largest Holdings7 (% of total net assets) |
| Procter & Gamble Co. | 14.1% |
| Wal-Mart Stores Inc. | 9.2 |
| Coca-Cola Co. | 8.0 |
| PepsiCo Inc. | 7.0 |
| Philip Morris International Inc. | 6.6 |
| Kraft Foods Inc. | 4.1 |
| CVS Caremark Corp. | 3.9 |
| Altria Group Inc. | 3.4 |
| Colgate-Palmolive Co. | 3.4 |
| Walgreen Co. | 2.9 |
| Top Ten | 62.6% |
1 MSCI US IMI/Consumer Staples.
2 MSCI US IMI/2500.
3 30-day SEC yield for the fund; annualized dividend yield for the indexes. See the Glossary.
4 Annualized.
5 The expense ratios shown are from the prospectuses dated December 28, 2009, and represent estimated costs for the current fiscal year based on the fund’s net assets as of the prospectus date. For the six months ended February 28, 2010, the annualized expense ratios were 0.26% for the Admiral Shares and 0.23% for the ETF Shares.
6 For an explanation of R-squared, beta, and other terms used here, see the Glossary.
7 The holdings listed exclude any temporary cash investments and equity index products.
15
Consumer Staples Index Fund
Performance Summary
All of the returns in this report represent past performance, which is not a guarantee of future results that may be achieved by the fund. (Current performance may be lower or higher than the performance data cited. For performance data current to the most recent month-end, visit our website at www.vanguard.com/performance.) Note, too, that both investment returns and principal value can fluctuate widely, so an investor’s shares, when sold, could be worth more or less than their original cost. The returns shown do not reflect taxes that a shareholder would pay on fund distributions or on the sale of fund shares.
Fiscal-Year Total Returns (%): January 26, 2004–February 28, 2010
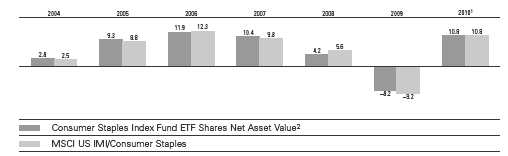
Average Annual Total Returns: Periods Ended December 31, 2009
This table presents average annual total returns through the latest calendar quarter—rather than through the end of the fiscal period. Securities and Exchange Commission rules require that we provide this information.
| | | | |
| | | | | Since |
| | Inception Date | One Year | Five Years | Inception |
| ETF Shares | 1/26/2004 | | | |
| Market Price | | 16.77% | 5.72% | 6.38% |
| Net Asset Value | | 16.95 | 5.71 | 6.38 |
| Admiral Shares3 | 1/30/2004 | 16.95 | 5.67 | 6.44 |
1 Six months ended February 28, 2010.
2 For more information about how the ETF Shares’ market prices have compared with their net asset value, visit www.vanguard.com, select your ETF, and then select the Performance tab. The Premium/Discount table there shows the percentages of days on which the ETF Shares’ market price was above or below the NAV.
3 Total returns do not reflect the 2% fee assessed on redemptions of shares held for less than one year.
See Financial Highlights for dividend and capital gains information.
16
Consumer Staples Index Fund
Financial Statements (unaudited)
Statement of Net Assets
As of February 28, 2010
The fund reports a complete list of its holdings in regulatory filings four times in each fiscal year, at the quarter-ends. For the second and fourth fiscal quarters, the lists appear in the fund’s semiannual and annual reports to shareholders. For the first and third fiscal quarters, the fund files the lists with the Securities and Exchange Commission on Form N-Q. Shareholders can look up the fund’s Forms N-Q on the SEC’s website at www.sec.gov. Forms N-Q may also be reviewed and copied at the SEC’s Public Reference Room (see the back cover of this report for further information).
| | | |
| | | | Market |
| | | | Value• |
| | | Shares | ($000) |
| Common Stocks (100.4%) | | |
| Beverages (19.2%) | | |
| | Coca-Cola Co. | 938,862 | 49,497 |
| | PepsiCo Inc. | 694,389 | 43,378 |
| | Dr Pepper Snapple | | |
| | Group Inc. | 139,441 | 4,427 |
| | Coca-Cola Enterprises Inc. | 164,138 | 4,194 |
| | Molson Coors Brewing Co. | | |
| | Class B | 83,840 | 3,385 |
| | Pepsi Bottling Group Inc. | 83,927 | 3,209 |
| | Brown-Forman Corp. | | |
| | Class B | 45,412 | 2,378 |
| * | Hansen Natural Corp. | 45,914 | 1,910 |
| * | Constellation Brands Inc. | | |
| | Class A | 119,000 | 1,790 |
| * | Central European | | |
| | Distribution Corp. | 42,133 | 1,405 |
| | PepsiAmericas Inc. | 42,857 | 1,285 |
| * | Heckmann Corp. | 100,038 | 598 |
| * | Boston Beer Co. Inc. | | |
| | Class A | 11,376 | 538 |
| | Coca-Cola Bottling Co. | | |
| | Consolidated | 8,384 | 467 |
| | National Beverage Corp. | 32,313 | 368 |
| | | | 118,829 |
| Food & Staples Retailing (24.2%) | |
| | Wal-Mart Stores Inc. | 1,051,336 | 56,846 |
| | CVS Caremark Corp. | 723,484 | 24,418 |
| | Walgreen Co. | 507,285 | 17,877 |
| | Costco Wholesale Corp. | 224,130 | 13,665 |
| | Sysco Corp. | 309,556 | 8,946 |
| | Kroger Co. | 325,781 | 7,200 |
| | Safeway Inc. | 218,714 | 5,450 |
| * | Whole Foods Market Inc. | 82,392 | 2,924 |
| | SUPERVALU Inc. | 126,910 | 1,938 |
| * | BJ’s Wholesale Club Inc. | 36,746 | 1,329 |
| | Casey’s General Stores Inc. | 35,726 | 1,086 |
| * | United Natural Foods Inc. | 31,254 | 918 |
| | Ruddick Corp. | 31,171 | 913 |
| * | Rite Aid Corp. | 512,438 | 779 |
| * | Winn-Dixie Stores Inc. | 54,903 | 601 |
| | Andersons Inc. | 18,207 | 588 |
| | Nash Finch Co. | 15,421 | 544 |
| | Weis Markets Inc. | 14,927 | 521 |
| | Spartan Stores Inc. | 33,688 | 472 |
| | Pricesmart Inc. | 22,051 | 469 |
| * | Pantry Inc. | 33,889 | 444 |
| * | Great Atlantic & | | |
| | Pacific Tea Co. | 55,228 | 401 |
| | Arden Group Inc. | 3,801 | 386 |
| | Ingles Markets Inc. Class A | 27,362 | 385 |
| | Village Super Market Inc. | | |
| | Class A | 14,508 | 359 |
| * | Susser Holdings Corp. | 35,893 | 301 |
| | | | 149,760 |
| | | |
| | | | Market |
| | | | Value• |
| | | Shares | ($000) |
| Food Products (20.0%) | | |
| | Kraft Foods Inc. | 890,827 | 25,326 |
| | General Mills Inc. | 169,684 | 12,219 |
| | Archer-Daniels-Midland Co. | 301,215 | 8,844 |
| | HJ Heinz Co. | 166,280 | 7,632 |
| | Kellogg Co. | 140,346 | 7,319 |
| | ConAgra Foods Inc. | 236,781 | 5,792 |
| | Mead Johnson Nutrition Co. | 110,224 | 5,214 |
| | Sara Lee Corp. | 357,811 | 4,852 |
| | Bunge Ltd. | 72,091 | 4,296 |
| | JM Smucker Co. | 65,317 | 3,898 |
| | Campbell Soup Co. | 114,100 | 3,803 |
| | Hershey Co. | 88,105 | 3,503 |
| | Tyson Foods Inc. Class A | 165,942 | 2,828 |
| | McCormick & Co. Inc. | 68,200 | 2,531 |
| * | Ralcorp Holdings Inc. | 33,273 | 2,223 |
| | Hormel Foods Corp. | 44,749 | 1,840 |
| * | Green Mountain Coffee | | |
| | Roasters Inc. | 21,367 | 1,803 |
| * | Dean Foods Co. | 111,489 | 1,627 |
| * | Smithfield Foods Inc. | 93,455 | 1,608 |
| | Corn Products | | |
| | International Inc. | 47,098 | 1,534 |
| | Del Monte Foods Co. | 124,356 | 1,457 |
| | Flowers Foods Inc. | 53,487 | 1,363 |
| * | TreeHouse Foods Inc. | 23,339 | 1,004 |
| | Lancaster Colony Corp. | 15,072 | 867 |
| * | Fresh Del Monte | | |
| | Produce Inc. | 37,671 | 731 |
| | Sanderson Farms Inc. | 14,601 | 715 |
| * | American Italian Pasta Co. | 18,234 | 708 |
| * | Darling International Inc. | 79,586 | 642 |
| | J&J Snack Foods Corp. | 14,543 | 621 |
| * | Hain Celestial Group Inc. | 37,989 | 603 |
| | Tootsie Roll Industries Inc. | 22,034 | 600 |
| * | Chiquita Brands | | |
| | International Inc. | 41,068 | 598 |
| | Lance Inc. | 26,320 | 571 |
| | Diamond Foods Inc. | 16,132 | 562 |
| | B&G Foods Inc. Class A | 55,496 | 517 |
| | Cal-Maine Foods Inc. | 15,819 | 507 |
| * | Zhongpin Inc. | 37,795 | 465 |
| * | Smart Balance Inc. | 85,119 | 426 |
| | Calavo Growers Inc. | 22,409 | 396 |
| *,^ | American Dairy Inc. | 17,976 | 391 |
| | Farmer Bros Co. | 20,559 | 370 |
| *,^ | AgFeed Industries Inc. | 80,236 | 354 |
| | Alico Inc. | 13,270 | 345 |
| | | | 123,505 |
| Household Products (21.4%) | | |
| | Procter & Gamble Co. | 1,377,420 | 87,163 |
| | Colgate-Palmolive Co. | 255,204 | 21,167 |
| | Kimberly-Clark Corp. | 213,427 | 12,964 |
| | Clorox Co. | 75,804 | 4,648 |
| | Church & Dwight Co. Inc. | 40,312 | 2,708 |
| * | Energizer Holdings Inc. | 38,966 | 2,258 |
| | WD-40 Co. | 17,447 | 546 |
| | | | |
| | | | | Market |
| | | | | Value• |
| | | | Shares | ($000) |
| * | Central Garden and Pet Co. | | |
| | Class A | | 55,840 | 533 |
| * | Central Garden and Pet Co. | 39,124 | 412 |
| | | | | 132,399 |
| Personal Products (3.4%) | | | |
| | Avon Products Inc. | | 224,214 | 6,825 |
| | Estee Lauder Cos. Inc. | | | |
| | Class A | | 62,296 | 3,746 |
| * | NBTY Inc. | | 34,978 | 1,588 |
| | Herbalife Ltd. | | 38,620 | 1,547 |
| | Alberto-Culver Co. Class B | 55,336 | 1,534 |
| | Nu Skin Enterprises Inc. | | |
| | Class A | | 36,573 | 977 |
| * | Bare Escentuals Inc. | | 49,372 | 897 |
| * | Elizabeth Arden Inc. | | 28,687 | 517 |
| * | Prestige Brands | | | |
| | Holdings Inc. | | 57,743 | 464 |
| * | China-Biotics Inc. | | 26,597 | 450 |
| * | American Oriental | | | |
| | Bioengineering Inc. | | 104,737 | 435 |
| *,^ | China Sky One Medical Inc. | 26,277 | 408 |
| | Inter Parfums Inc. | | 29,447 | 400 |
| * | USANA Health Sciences Inc. | 13,757 | 381 |
| * | Revlon Inc. Class A | | 25,326 | 380 |
| | | | | 20,549 |
| Tobacco (12.2%) | | | |
| | Philip Morris | | | |
| | International Inc. | | 833,979 | 40,847 |
| | Altria Group Inc. | 1,057,968 | 21,286 |
| | Lorillard Inc. | | 85,416 | 6,239 |
| | Reynolds American Inc. | 94,418 | 4,985 |
| | Universal Corp. | | 18,071 | 959 |
| | Vector Group Ltd. | | 44,272 | 639 |
| * | Alliance One | | | |
| | International Inc. | | 103,852 | 533 |
| | | | | 75,488 |
| Total Common Stocks | | | |
| (Cost $618,675) | | | 620,530 |
| Temporary Cash Investment (0.1%) | |
| Money Market Fund (0.1%) | | |
| 1,2 | Vanguard Market | | | |
| | Liquidity Fund, 0.163% | | |
| | (Cost $749) | | 748,554 | 749 |
| Total Investments (100.5%) | | |
| (Cost $619,424) | | | 621,279 |
| Other Assets and Liabilities (–0.5%) | |
| Other Assets | | | 4,251 |
| Liabilities2 | | | (7,140) |
| | | | | (2,889) |
| Net Assets (100%) | | | 618,390 |
17
Consumer Staples Index Fund
| |
| At February 28, 2010, net assets consisted of: |
| | Amount |
| | ($000) |
| Paid-in Capital | 635,618 |
| Undistributed Net Investment Income | 918 |
| Accumulated Net Realized Losses | (20,001) |
| Unrealized Appreciation (Depreciation) | 1,855 |
| Net Assets | 618,390 |
| |
| Admiral Shares—Net Assets | |
| Applicable to 864,958 outstanding | |
| $.001 par value shares of beneficial | |
| interest (unlimited authorization) | 28,592 |
| Net Asset Value Per Share— | |
| Admiral Shares | $33.06 |
| |
| ETF Shares—Net Assets | |
| Applicable to 8,801,572 outstanding | |
| $.001 par value shares of beneficial | |
| interest (unlimited authorization) | 589,798 |
| Net Asset Value Per Share— | |
| ETF Shares | $67.01 |
• See Note A in Notes to Financial Statements.
* Non-income-producing security.
^ Part of security position is on loan to broker-dealers. The total value of securities on loan is $487,000.
1 Affiliated money market fund available only to Vanguard funds and certain trusts and accounts managed by Vanguard. Rate shown is the 7-day yield.
2 Includes $525,000 of collateral received for securities on loan.
See accompanying Notes, which are an integral part of the Financial Statements.
18
Consumer Staples Index Fund
Statement of Operations
| |
| Six Months Ended |
| February 28, 2010 |
| | ($000) |
| Investment Income | |
| Income | |
| Dividends | 8,204 |
| Interest1 | 1 |
| Security Lending | 34 |
| Total Income | 8,239 |
| Expenses | |
| The Vanguard Group—Note B | |
| Investment Advisory Services | 45 |
| Management and Administrative— | |
| Admiral Shares | 32 |
| Management and Administrative— | |
| ETF Shares | 488 |
| Marketing and Distribution— | |
| Admiral Shares | 3 |
| Marketing and Distribution— | |
| ETF Shares | 89 |
| Shareholders’ Reports—Admiral Shares | — |
| Shareholders’ Reports—ETF Shares | 42 |
| Trustees’ Fees and Expenses | 1 |
| Total Expenses | 700 |
| Net Investment Income | 7,539 |
| Realized Net Gain (Loss) on | |
| Investment Securities Sold | 2,201 |
| Change in Unrealized Appreciation | |
| (Depreciation) of Investment Securities | 50,527 |
| Net Increase (Decrease) in Net Assets | |
| Resulting from Operations | 60,267 |
Statement of Changes in Net Assets
| | |
| | Six Months Ended | Year Ended |
| | February 28, | August 31, |
| | 2010 | 2009 |
| | ($000) | ($000) |
| Increase (Decrease) in Net Assets | | |
| Operations | | |
| Net Investment Income | 7,539 | 15,458 |
| Realized Net Gain (Loss) | 2,201 | 2,903 |
| Change in Unrealized Appreciation (Depreciation) | 50,527 | (59,656) |
| Net Increase (Decrease) in Net Assets Resulting from Operations | 60,267 | (41,295) |
| Distributions | | |
| Net Investment Income | | |
| Admiral Shares | (745) | (425) |
| ETF Shares | (15,294) | (11,495) |
| Realized Capital Gain | | |
| Admiral Shares | — | — |
| ETF Shares | — | — |
| Total Distributions | (16,039) | (11,920) |
| Capital Share Transactions | | |
| Admiral Shares | (2,254) | 11,397 |
| ETF Shares | (4,634) | 86,801 |
| Net Increase (Decrease) from Capital Share Transactions | (6,888) | 98,198 |
| Total Increase (Decrease) | 37,340 | 44,983 |
| Net Assets | | |
| Beginning of Period | 581,050 | 536,067 |
| End of Period2 | 618,390 | 581,050 |
1 Interest income from an affiliated company of the fund was $1,000.
2 Net Assets—End of Period includes undistributed net investment income of $918,000 and $9,418,000.
See accompanying Notes, which are an integral part of the Financial Statements.
19
| | | | | | | |
| Consumer Staples Index Fund | | | | | | | |
| |
| |
| Financial Highlights | | | | | | |
| |
| Admiral Shares | | | | | | | |
| | Six Months | | | | | |
| | | Ended | | | | | |
| For a Share Outstanding | February 28, | | | | Year Ended August 31, |
| Throughout Each Period | | 2010 | 2009 | 2008 | 2007 | 2006 | 2005 |
| Net Asset Value, Beginning of Period | $30.62 | $34.06 | $33.22 | $30.56 | $27.64 | $25.82 |
| Investment Operations | | | | | | | |
| Net Investment Income | | .402 | .7771 | .6341 | .662 | .5471 | .4271 |
| Net Realized and Unrealized Gain (Loss) | | | | | | |
| on Investments | | 2.888 | (3.648) | .766 | 2.460 | 2.716 | 1.952 |
| Total from Investment Operations | 3.290 | (2.871) | 1.400 | 3.122 | 3.263 | 2.379 |
| Distributions | | | | | | | |
| Dividends from Net Investment Income | (.850) | (.569) | (.560) | (.462) | (.343) | (.440) |
| Distributions from Realized Capital Gains | — | — | — | — | — | (.119) |
| Total Distributions | | (.850) | (.569) | (.560) | (.462) | (.343) | (.559) |
| Net Asset Value, End of Period | | $33.06 | $30.62 | $34.06 | $33.22 | $30.56 | $27.64 |
| |
| Total Return2 | | 10.81% | –8.26% | 4.15% | 10.30% | 11.92% | 9.29% |
| |
| Ratios/Supplemental Data | | | | | | | |
| Net Assets, End of Period (Millions) | $29 | $29 | $18 | $9 | $6 | $4 |
| Ratio of Total Expenses to | | | | | | | |
| Average Net Assets | | 0.26%3 | 0.28% | 0.25% | 0.26% | 0.28% | 0.28% |
| Ratio of Net Investment Income to | | | | | | |
| Average Net Assets | | 2.50%3 | 2.77% | 1.88% | 2.16% | 1.90% | 1.69% |
| Portfolio Turnover Rate4 | | 8%3 | 17% | 13% | 12% | 14% | 7% |
1 Calculated based on average shares outstanding.
2 Total returns do not reflect the 2% fee assessed on redemptions of shares held for less than one year.
3 Annualized.
4 Excludes the value of portfolio securities received or delivered as a result of in-kind purchases or redemptions of the fund’s capital shares, including ETF Creation Units.
See accompanying Notes, which are an integral part of the Financial Statements.
20
| | | | | | | |
| Consumer Staples Index Fund | | | | | | | |
| |
| |
| Financial Highlights | | | | | | |
| |
| ETF Shares | | | | | | | |
| | Six Months | | | | | |
| | | Ended | | | | | |
| For a Share Outstanding | February 28, | | | | Year Ended August 31, |
| Throughout Each Period | | 2010 | 2009 | 2008 | 2007 | 2006 | 2005 |
| Net Asset Value, Beginning of Period | $62.07 | $69.04 | $67.35 | $61.94 | $56.03 | $52.28 |
| Investment Operations | | | | | | | |
| Net Investment Income | | .832 | 1.6161 | 1.3271 | 1.370 | 1.0901 | .9501 |
| Net Realized and Unrealized Gain (Loss) | | | | | | |
| on Investments | | 5.846 | (7.413) | 1.522 | 5.000 | 5.523 | 3.894 |
| Total from Investment Operations | 6.678 | (5.797) | 2.849 | 6.370 | 6.613 | 4.844 |
| Distributions | | | | | | | |
| Dividends from Net Investment Income | (1.738) | (1.173) | (1.159) | (.960) | (.703) | (.853) |
| Distributions from Realized Capital Gains | — | — | — | — | — | (.241) |
| Total Distributions | | (1.738) | (1.173) | (1.159) | (.960) | (.703) | (1.094) |
| Net Asset Value, End of Period | | $67.01 | $62.07 | $69.04 | $67.35 | $61.94 | $56.03 |
| |
| Total Return | | 10.81% | –8.22% | 4.18% | 10.38% | 11.91% | 9.33% |
| |
| Ratios/Supplemental Data | | | | | | | |
| Net Assets, End of Period (Millions) | $590 | $552 | $518 | $310 | $211 | $73 |
| Ratio of Total Expenses to | | | | | | | |
| Average Net Assets | | 0.23%2 | 0.25% | 0.20% | 0.22% | 0.25% | 0.26% |
| Ratio of Net Investment Income to | | | | | | |
| Average Net Assets | | 2.53%2 | 2.80% | 1.93% | 2.20% | 1.93% | 1.71% |
| Portfolio Turnover Rate3 | | 8%2 | 17% | 13% | 12% | 14% | 7% |
1 Calculated based on average shares outstanding.
2 Annualized.
3 Excludes the value of portfolio securities received or delivered as a result of in-kind purchases or redemptions of the fund’s capital shares, including ETF Creation Units.
See accompanying Notes, which are an integral part of the Financial Statements.
21
Consumer Staples Index Fund
Notes to Financial Statements
Vanguard Consumer Staples Index Fund is registered under the Investment Company Act of 1940 as an open-end investment company, or mutual fund. The fund offers two classes of shares, Admiral Shares and ETF Shares. Admiral Shares are available to any investor who meets the fund’s minimum purchase requirements. ETF Shares are listed for trading on the NYSE Arca, Inc.; they can be purchased and sold through a broker.
A. The following significant accounting policies conform to generally accepted accounting principles for U.S. mutual funds. The fund consistently follows such policies in preparing its financial statements.
1. Security Valuation: Securities are valued as of the close of trading on the New York Stock Exchange (generally 4 p.m., Eastern time) on the valuation date. Equity securities are valued at the latest quoted sales prices or official closing prices taken from the primary market in which each security trades; such securities not traded on the valuation date are valued at the mean of the latest quoted bid and asked prices. Securities for which market quotations are not readily available, or whose values have been materially affected by events occurring before the fund’s pricing time but after the close of the securities’ primary markets, are valued by methods deemed by the board of trustees to represent fair value. Investments in Vanguard Market Liquidity Fund are valued at that fund’s net asset value.
2. Federal Income Taxes: The fund intends to continue to qualify as a regulated investment company and distribute all of its taxable income. Management has analyzed the fund’s tax positions taken for all open federal income tax years (August 31, 2006–2009), and for the period ended February 28, 2010, and has concluded that no provision for federal income tax is required in the fund’s financial statements.
3. Distributions: Distributions to shareholders are recorded on the ex-dividend date.
4. Security Lending: The fund may lend its securities to qualified institutional borrowers to earn additional income. Security loans are required to be secured at all times by collateral at least equal to the market value of securities loaned. The fund invests cash collateral received in Vanguard Market Liquidity Fund, and records a liability for the return of the collateral, during the period the securities are on loan. Security lending income represents the income earned on investing cash collateral, less expenses associated with the loan.
5. Other: Dividend income is recorded on the ex-dividend date. Interest income includes income distributions received from Vanguard Market Liquidity Fund and is accrued daily. Security transactions are accounted for on the date securities are bought or sold. Costs used to determine realized gains (losses) on the sale of investment securities are those of the specific securities sold. Fees assessed on redemptions of capital shares are credited to paid-in capital.
Each class of shares has equal rights as to assets and earnings, except that each class separately bears certain class-specific expenses related to maintenance of shareholder accounts (included in Management and Administrative expenses) and shareholder reporting. Marketing and distribution expenses are allocated to each class of shares based on a method approved by the board of trustees. Income, other non-class-specific expenses, and gains and losses on investments are allocated to each class of shares based on its relative net assets.
B. The Vanguard Group furnishes at cost investment advisory, corporate management, administrative, marketing, and distribution services. The costs of such services are allocated to the fund under methods approved by the board of trustees. The fund has committed to provide up to 0.40% of its net assets in capital contributions to Vanguard. At February 28, 2010, the fund had contributed capital of $122,000 to Vanguard (included in Other Assets), representing 0.02% of the fund’s net assets and 0.05% of Vanguard’s capitalization. The fund’s trustees and officers are also directors and officers of Vanguard.
C. Various inputs may be used to determine the value of the fund’s investments. These inputs are summarized in three broad levels for financial statement purposes. The inputs or methodologies used to value securities are not necessarily an indication of the risk associated with investing in those securities.
Level 1—Quoted prices in active markets for identical securities.
Level 2—Other significant observable inputs (including quoted prices for similar securities, interest rates, prepayment speeds, credit risk, etc.).
Level 3—Significant unobservable inputs (including the fund’s own assumptions used to determine the fair value of investments).
At February 28, 2010, 100% of the fund’s investments were valued based on Level 1 inputs.
22
Consumer Staples Index Fund
D. Distributions are determined on a tax basis and may differ from net investment income and realized capital gains for financial reporting purposes. Differences may be permanent or temporary. Permanent differences are reclassified among capital accounts in the financial statements to reflect their tax character. Temporary differences arise when certain items of income, expense, gain, or loss are recognized in different periods for financial statement and tax purposes; these differences will reverse at some time in the future. Differences in classification may also result from the treatment of short-term gains as ordinary income for tax purposes.
During the six months ended February 28, 2010, the fund realized $5,842,000 of net capital gains resulting from in-kind redemptions—in which shareholders exchanged fund shares for securities held by the fund rather than for cash. Because such gains are not taxable to the fund, and are not distributed to shareholders, they have been reclassified from accumulated net realized losses to paid-in capital.
The fund’s tax-basis capital gains and losses are determined only at the end of each fiscal year. For tax purposes, at August 31, 2009, the fund had available capital loss carryforwards totaling $5,981,000 to offset future net capital gains of $276,000 through August 31, 2014, $773,000 through August 31, 2015, $2,261,000 through August 31, 2016, and $2,671,000 through August 31, 2017. In addition, the fund realized losses of $10,379,000 during the period from November 1, 2008, through August 31, 2009, which are deferred and will be treated as realized for tax purposes in fiscal 2010. The fund will use these capital losses to offset net taxable capital gains, if any, realized during the year ending August 31, 2010; should the fund realize net capital losses for the year, the losses will be added to the loss carryforward balances above.
At February 28, 2010, the cost of investment securities for tax purposes was $619,424,000. Net unrealized appreciation of investment securities for tax purposes was $1,855,000, consisting of unrealized gains of $27,502,000 on securities that had risen in value since their purchase and $25,647,000 in unrealized losses on securities that had fallen in value since their purchase.
E. During the six months ended February 28, 2010, the fund purchased $71,667,000 of investment securities and sold $84,827,000 of investment securities, other than temporary cash investments.
F. Capital share transactions for each class of shares were:
| | | | |
| | Six Months Ended | | Year Ended |
| | February 28, 2010 | August 31, 2009 |
| | Amount | Shares | Amount | Shares |
| | ($000) | (000) | ($000) | (000) |
| Admiral Shares | | | | |
| Issued | 3,623 | 111 | 17,568 | 619 |
| Issued in Lieu of Cash Distributions | 690 | 21 | 400 | 14 |
| Redeemed1 | (6,567) | (201) | (6,571) | (236) |
| Net Increase (Decrease)—Admiral Shares | (2,254) | (69) | 11,397 | 397 |
| ETF Shares | | | | |
| Issued | 46,510 | 702 | 258,009 | 4,400 |
| Issued in Lieu of Cash Distributions | — | — | — | — |
| Redeemed1 | (51,144) | (800) | (171,208) | (3,000) |
| Net Increase (Decrease)—ETF Shares | (4,634) | (98) | 86,801 | 1,400 |
| 1 Net of redemption fees for fiscal 2010 and 2009 of $6,000 and $49,000, respectively (fund totals). | | |
G. In preparing the financial statements as of February 28, 2010, management considered the impact of subsequent events for potential recognition or disclosure in these financial statements.
23
Energy Index Fund
Fund Profile
As of February 28, 2010
| | | |
| Portfolio Characteristics | | |
| | | Target | Broad |
| | Fund | Index1 | Index2 |
| Number of Stocks | 161 | 161 | 2,492 |
| Median Market Cap | $35.0B | $64.7B | $29.0B |
| Price/Earnings Ratio | 23.4x | 22.9x | 21.2x |
| Price/Book Ratio | 1.9x | 2.0x | 2.1x |
| Yield3 | | 1.8% | 1.9% |
| Admiral Shares | 1.5% | | |
| ETF Shares | 1.6% | | |
| Return on Equity | 24.9% | 25.2% | 19.4% |
| Earnings Growth Rate | 11.9% | 11.8% | 8.1% |
| Foreign Holdings | 0.0% | 0.0% | 0.0% |
| Turnover Rate4 | 20% | — | — |
| Expense Ratio5 | | — | — |
| Admiral Shares | 0.28% | | |
| ETF Shares | 0.25% | | |
| Short-Term Reserves | 0.0% | — | — |
| | |
| Volatility Measures6 | |
| | Fund Versus | Fund Versus |
| | Target Index1 | Broad Index2 |
| R-Squared | 0.99 | 0.53 |
| Beta | 1.06 | 0.94 |
| |
| Subindustry Diversification (% of equity exposure) | |
| Coal & Consumable Fuels | 3.0% |
| Integrated Oil & Gas | 46.6 |
| Oil & Gas Drilling | 5.5 |
| Oil & Gas Equipment & Services | 16.7 |
| Oil & Gas Exploration & Production | 23.0 |
| Oil & Gas Refining & Marketing | 1.7 |
| Oil & Gas Storage & Transportation | 3.5 |
| |
| Ten Largest Holdings7 (% of total net assets) |
| Exxon Mobil Corp. | 22.6% |
| Chevron Corp. | 10.8 |
| Schlumberger Ltd. | 5.4 |
| ConocoPhillips | 5.0 |
| Occidental Petroleum Corp. | 4.5 |
| Apache Corp. | 2.7 |
| Anadarko Petroleum Corp. | 2.6 |
| Devon Energy Corp. | 2.2 |
| Halliburton Co. | 2.1 |
| Transocean Ltd. | 2.0 |
| Top Ten | 59.9% |
1 MSCI US IMI/Energy.
2 MSCI US IMI/2500.
3 30-day SEC yield for the fund; annualized dividend yield for the indexes. See the Glossary.
4 Annualized.
5 The expense ratios shown are from the prospectuses dated December 28, 2009, and represent estimated costs for the current fiscal year based on the fund’s net assets as of the prospectus date. For the six months ended February 28, 2010, the annualized expense ratios were 0.26% for Admiral Shares and 0.23% for ETF Shares.
6 For an explanation of R-squared, beta, and other terms used here, see the Glossary.
7 The holdings listed exclude any temporary cash investments and equity index products.
24
Energy Index Fund
Performance Summary
All of the returns in this report represent past performance, which is not a guarantee of future results that may be achieved by the fund. (Current performance may be lower or higher than the performance data cited. For performance data current to the most recent month-end, visit our website at www.vanguard.com/performance.) Note, too, that both investment returns and principal value can fluctuate widely, so an investor’s shares, when sold, could be worth more or less than their original cost. The returns shown do not reflect taxes that a shareholder would pay on fund distributions or on the sale of fund shares.
Fiscal-Year Total Returns (%): September 23, 2004–February 28, 2010
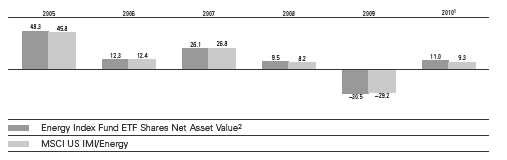
Average Annual Total Returns: Periods Ended December 31, 2009
This table presents average annual total returns through the latest calendar quarter—rather than through the end of the fiscal period. Securities and Exchange Commission rules require that we provide this information.
| | | | |
| | | | | Since |
| | Inception Date | One Year | Five Years | Inception |
| ETF Shares | 9/23/2004 | | | |
| Market Price | | 24.96% | 11.07% | 11.88% |
| Net Asset Value | | 24.90 | 11.08 | 11.88 |
| Admiral Shares3 | 10/7/2004 | 24.85 | 11.04 | 10.75 |
1 Six months ended February 28, 2010.
2 For more information about how the ETF Shares’ market prices have compared with their net asset value, visit www.vanguard.com, select your ETF, and then select the Performance tab. The Premium/Discount table there shows the percentages of days on which the ETF Shares’ market price was above or below the NAV.
3 Total returns do not reflect the 2% fee assessed on redemptions of shares held for less than one year.
See Financial Highlights for dividend and capital gains information.
25
Energy Index Fund
Financial Statements (unaudited)
Statement of Net Assets
As of February 28, 2010
The fund reports a complete list of its holdings in regulatory filings four times in each fiscal year, at the quarter-ends. For the second and fourth fiscal quarters, the lists appear in the fund’s semiannual and annual reports to shareholders. For the first and third fiscal quarters, the fund files the lists with the Securities and Exchange Commission on Form N-Q. Shareholders can look up the fund’s Forms N-Q on the SEC’s website at www.sec.gov. Forms N-Q may also be reviewed and copied at the SEC’s Public Reference Room (see the back cover of this report for further information).
| | | |
| | | | Market |
| | | | Value• |
| | | Shares | ($000) |
| Common Stocks (100.0%) | | |
| Energy Equipment & Services (22.3%) | |
| | Oil & Gas Drilling (5.5%) | | |
| * | Transocean Ltd. | 288,534 | 23,031 |
| | Noble Corp. | 239,084 | 10,104 |
| * | Nabors Industries Ltd. | 263,442 | 5,806 |
| | Diamond Offshore | | |
| | Drilling Inc. | 64,726 | 5,652 |
| * | Pride International Inc. | 163,229 | 4,567 |
| | Helmerich & Payne Inc. | 99,285 | 4,023 |
| * | Rowan Cos. Inc. | 110,303 | 2,870 |
| | Patterson-UTI Energy Inc. | 151,068 | 2,332 |
| * | Unit Corp. | 44,646 | 1,941 |
| * | Atwood Oceanics Inc. | 57,875 | 1,937 |
| * | Parker Drilling Co. | 142,662 | 732 |
| * | Hercules Offshore Inc. | 152,214 | 557 |
| * | Pioneer Drilling Co. | 75,259 | 537 |
| * | Seahawk Drilling Inc. | 19,551 | 402 |
| * | Bronco Drilling Co. Inc. | 60,381 | 292 |
| |
| | Oil & Gas Equipment & Services (16.8%) | |
| | Schlumberger Ltd. | 1,041,061 | 63,609 |
| | Halliburton Co. | 809,116 | 24,395 |
| | National Oilwell Varco Inc. | 379,490 | 16,496 |
| | Baker Hughes Inc. | 281,975 | 13,512 |
| * | Weatherford | | |
| | International Ltd. | 636,520 | 10,624 |
| | Smith International Inc. | 226,680 | 9,292 |
| * | Cameron International Corp. 223,882 | 9,208 |
| * | FMC Technologies Inc. | 113,202 | 6,359 |
| | BJ Services Co. | 272,299 | 5,950 |
| * | Oceaneering | | |
| | International Inc. | 52,792 | 3,191 |
| | Core Laboratories NV | 21,119 | 2,619 |
| * | Dresser-Rand Group Inc. | 80,431 | 2,486 |
| | Tidewater Inc. | 50,874 | 2,267 |
| * | Oil States International Inc. | 49,919 | 2,148 |
| * | Dril-Quip Inc. | 31,989 | 1,750 |
| * | Superior Energy Services Inc. 79,886 | 1,651 |
| * | SEACOR Holdings Inc. | 20,071 | 1,533 |
| * | Exterran Holdings Inc. | 62,395 | 1,420 |
| * | Key Energy Services Inc. | 130,339 | 1,322 |
| | CARBO Ceramics Inc. | 20,970 | 1,280 |
| * | Helix Energy Solutions | | |
| | Group Inc. | 105,468 | 1,214 |
| | Lufkin Industries Inc. | 15,960 | 1,166 |
| * | Bristow Group Inc. | 31,556 | 1,143 |
| * | Complete Production | | |
| | Services Inc. | 67,495 | 942 |
| * | Tetra Technologies Inc. | 86,123 | 868 |
| * | Global Industries Ltd. | 120,183 | 811 |
| * | Cal Dive International Inc. | 109,846 | 774 |
| * | Willbros Group Inc. | 48,720 | 736 |
| * | Gulfmark Offshore Inc. | 29,147 | 717 |
| * | ION Geophysical Corp. | 139,575 | 639 |
| * | Newpark Resources Inc. | 116,768 | 604 |
| | | |
| | | | Market |
| | | | Value• |
| | | Shares | ($000) |
| * | Hornbeck Offshore | | |
| | Services Inc. | 31,553 | 596 |
| * | Tesco Corp. | 43,565 | 594 |
| * | Superior Well Services Inc. | 32,484 | 581 |
| | RPC Inc. | 42,379 | 524 |
| * | T-3 Energy Services Inc. | 20,015 | 475 |
| * | Matrix Service Co. | 43,554 | 466 |
| | Gulf Island Fabrication Inc. | 22,680 | 452 |
| * | Dawson Geophysical Co. | 14,882 | 425 |
| * | Allis-Chalmers Energy Inc. | 107,020 | 405 |
| * | PHI Inc. | 20,463 | 399 |
| * | Basic Energy Services Inc. | 40,061 | 379 |
| * | OYO Geospace Corp. | 8,531 | 367 |
| *,^ | Sulphco Inc. | 383,686 | 146 |
| | | | 261,318 |
| Oil, Gas & Consumable Fuels (77.7%) | |
| | Coal & Consumable Fuels (3.0%) | |
| | Peabody Energy Corp. | 244,420 | 11,236 |
| | Consol Energy Inc. | 166,133 | 8,366 |
| * | Alpha Natural Resources Inc. 112,113 | 5,158 |
| | Massey Energy Co. | 81,101 | 3,493 |
| | Arch Coal Inc. | 154,939 | 3,485 |
| * | Patriot Coal Corp. | 88,575 | 1,476 |
| * | International Coal Group Inc. 165,181 | 720 |
| * | USEC Inc. | 143,266 | 625 |
| * | James River Coal Co. | 35,246 | 561 |
| * | Uranium Energy Corp. | 23,650 | 86 |
| |
| | Integrated Oil & Gas (46.5%) | |
| | Exxon Mobil Corp. | 4,078,613 | 265,110 |
| | Chevron Corp. | 1,761,036 | 127,323 |
| | ConocoPhillips | 1,222,939 | 58,701 |
| | Occidental Petroleum Corp. | 657,176 | 52,475 |
| | Marathon Oil Corp. | 638,040 | 18,471 |
| | Hess Corp. | 267,153 | 15,709 |
| | Murphy Oil Corp. | 166,409 | 8,637 |
| |
| | Oil & Gas Exploration & Production (23.0%) |
| | Apache Corp. | 300,747 | 31,169 |
| | Anadarko Petroleum Corp. | 442,592 | 31,039 |
| | Devon Energy Corp. | 379,050 | 26,101 |
| | XTO Energy Inc. | 496,847 | 22,706 |
| | EOG Resources Inc. | 226,600 | 21,312 |
| | Chesapeake Energy Corp. | 542,984 | 14,427 |
| * | Southwestern Energy Co. | 312,983 | 13,317 |
| | Noble Energy Inc. | 158,253 | 11,495 |
| | Range Resources Corp. | 145,343 | 7,356 |
| * | Ultra Petroleum Corp. | 140,002 | 6,402 |
| * | Newfield Exploration Co. | 123,443 | 6,304 |
| * | Petrohawk Energy Corp. | 279,361 | 5,978 |
| | Pioneer Natural | | |
| | Resources Co. | 107,568 | 5,018 |
| | Cimarex Energy Co. | 78,302 | 4,679 |
| * | Plains Exploration & | | |
| | Production Co. | 131,347 | 4,309 |
| | Cabot Oil & Gas Corp. | 97,927 | 3,931 |
| | | |
| | | | Market |
| | | | Value• |
| | | Shares | ($000) |
| * | Whiting Petroleum Corp. | 48,319 | 3,617 |
| * | Concho Resources Inc. | 73,556 | 3,417 |
| * | Denbury Resources Inc. | 238,564 | 3,359 |
| | EXCO Resources Inc. | 171,892 | 3,250 |
| * | Forest Oil Corp. | 103,543 | 2,806 |
| * | Encore Acquisition Co. | 51,544 | 2,553 |
| * | Atlas Energy Inc. | 72,841 | 2,378 |
| | St. Mary Land & | | |
| | Exploration Co. | 62,306 | 2,030 |
| * | Quicksilver Resources Inc. | 120,526 | 1,798 |
| * | Brigham Exploration Co. | 101,629 | 1,669 |
| * | Comstock Resources Inc. | 47,415 | 1,637 |
| * | Arena Resources Inc. | 39,505 | 1,637 |
| * | Mariner Energy Inc. | 104,761 | 1,574 |
| * | Bill Barrett Corp. | 42,986 | 1,458 |
| * | McMoRan Exploration Co. | 82,017 | 1,417 |
| * | Continental Resources Inc. | 35,181 | 1,389 |
| | Berry Petroleum Co. | | |
| | Class A | 50,588 | 1,356 |
| * | SandRidge Energy Inc. | 162,422 | 1,290 |
| | Penn Virginia Corp. | 48,574 | 1,229 |
| * | Swift Energy Co. | 40,669 | 1,212 |
| * | Rosetta Resources Inc. | 57,010 | 1,068 |
| * | ATP Oil & Gas Corp. | 52,421 | 947 |
| * | CNX Gas Corp. | 34,582 | 906 |
| * | Stone Energy Corp. | 48,518 | 827 |
| * | BPZ Resources Inc. | 102,283 | 800 |
| * | Carrizo Oil & Gas Inc. | 33,284 | 796 |
| * | Contango Oil & Gas Co. | 15,243 | 786 |
| * | Goodrich Petroleum Corp. | 31,525 | 607 |
| * | Petroleum | | |
| | Development Corp. | 25,589 | 602 |
| * | Rex Energy Corp. | 42,945 | 594 |
| * | Northern Oil and Gas Inc. | 41,576 | 514 |
| * | Petroquest Energy Inc. | 87,511 | 469 |
| * | Clayton Williams Energy Inc. | 12,576 | 469 |
| | W&T Offshore Inc. | 51,840 | 457 |
| * | Delta Petroleum Corp. | 318,902 | 446 |
| * | Venoco Inc. | 38,388 | 441 |
| | Vaalco Energy Inc. | 98,396 | 420 |
| * | Gulfport Energy Corp. | 45,260 | 412 |
| * | GMX Resources Inc. | 44,238 | 407 |
| * | Harvest Natural | | |
| | Resources Inc. | 69,395 | 371 |
| * | Warren Resources Inc. | 148,821 | 348 |
| * | Endeavour | | |
| | International Corp. | 266,630 | 328 |
| * | Oilsands Quest Inc. | 463,435 | 315 |
| * | Approach Resources Inc. | 35,577 | 296 |
| * | Energy XXI Bermuda Ltd. | 8,513 | 155 |
| * | Gastar Exploration Ltd. | 12,189 | 60 |
| * | Gran Tierra Energy Inc. | 9,615 | 53 |
| * | Cobalt International | | |
| | Energy Inc. | 2,792 | 34 |
26
Energy Index Fund
| | | |
| | | | Market |
| | | | Value• |
| | | Shares | ($000) |
| | Oil & Gas Refining & Marketing (1.7%) |
| | Valero Energy Corp. | 512,811 | 8,984 |
| | Sunoco Inc. | 112,579 | 2,969 |
| | Tesoro Corp. | 142,954 | 1,704 |
| | World Fuel Services Corp. | 59,250 | 1,565 |
| | Frontier Oil Corp. | 109,529 | 1,357 |
| | Holly Corp. | 45,715 | 1,174 |
| * | Clean Energy Fuels Corp. | 41,338 | 746 |
| * | CVR Energy Inc. | 55,566 | 457 |
| * | Western Refining Inc. | 90,765 | 394 |
| | Delek US Holdings Inc. | 38,925 | 283 |
| | Alon USA Energy Inc. | 36,429 | 255 |
| |
| | Oil & Gas Storage & Transportation (3.5%) |
| | Spectra Energy Corp. | 589,085 | 12,842 |
| | Williams Cos. Inc. | 532,070 | 11,461 |
| | El Paso Corp. | 647,432 | 6,778 |
| * | Kinder Morgan | | |
| | Management LLC | 72,548 | 4,161 |
| | Southern Union Co. | 108,213 | 2,591 |
| | Overseas Shipholding | | |
| | Group Inc. | 27,018 | 1,202 |
| * | Enbridge Energy | | |
| | Management LLC | 16,549 | 827 |
| | General Maritime Corp. | 72,239 | 522 |
| * | Crosstex Energy Inc. | 61,499 | 475 |
| * | Cheniere Energy Inc. | 117,011 | 349 |
| | | | 913,275 |
| Total Common Stocks | | |
| (Cost $1,124,840) | | 1,174,593 |
| Temporary Cash Investment (0.0%) | |
| Money Market Fund (0.0%) | | |
| 1,2 | Vanguard Market | | |
| | Liquidity Fund, 0.163% | | |
| | (Cost $124) | 124,300 | 124 |
| Total Investments (100.0%) | | |
| (Cost $1,124,964) | | 1,174,717 |
| Other Assets and Liabilities (0.0%) | |
| Other Assets | | 50,557 |
| Liabilities2 | | (50,250) |
| | | | 307 |
| Net Assets (100%) | | 1,175,024 |
| |
| At February 28, 2010, net assets consisted of: |
| | Amount |
| | ($000) |
| Paid-in Capital | 1,235,593 |
| Undistributed Net Investment Income | 3,087 |
| Accumulated Net Realized Losses | (113,409) |
| Unrealized Appreciation (Depreciation) | 49,753 |
| Net Assets | 1,175,024 |
| |
| Admiral Shares—Net Assets | |
| Applicable to 2,881,629 outstanding | |
| $.001 par value shares of beneficial | |
| interest (unlimited authorization) | 117,715 |
| Net Asset Value Per Share— | |
| Admiral Shares | $40.85 |
| |
| ETF Shares—Net Assets | |
| Applicable to 12,932,620 outstanding | |
| $.001 par value shares of beneficial | |
| interest (unlimited authorization) | 1,057,309 |
| Net Asset Value Per Share— | |
| ETF Shares | $81.76 |
• See Note A in Notes to Financial Statements.
* Non-income-producing security.
^ Part of security position is on loan to broker-dealers. The total value of securities on loan is $47,000.
1 Affiliated money market fund available only to Vanguard funds and certain trusts and accounts managed by Vanguard. Rate shown is the 7-day yield.
2 Includes $124,000 of collateral received for securities on loan.
See accompanying Notes, which are an integral part of the Financial Statements.
27
Energy Index Fund
| |
| Statement of Operations |
| |
| Six Months Ended |
| February 28, 2010 |
| | ($000) |
| Investment Income | |
| Income | |
| Dividends | 10,652 |
| Interest1 | 1 |
| Security Lending | 13 |
| Total Income | 10,666 |
| Expenses | |
| The Vanguard Group—Note B | |
| Investment Advisory Services | 70 |
| Management and Administrative— | |
| Admiral Shares | 140 |
| Management and Administrative— | |
| ETF Shares | 920 |
| Marketing and Distribution— | |
| Admiral Shares | 9 |
| Marketing and Distribution— | |
| ETF Shares | 142 |
| Custodian Fees | 2 |
| Shareholders’ Reports—Admiral Shares | — |
| Shareholders’ Reports—ETF Shares | 57 |
| Trustees’ Fees and Expenses | 1 |
| Total Expenses | 1,341 |
| Net Investment Income | 9,325 |
| Realized Net Gain (Loss) on | |
| Investment Securities Sold | (10,255) |
| Change in Unrealized Appreciation | |
| (Depreciation) of Investment Securities | 104,967 |
| Net Increase (Decrease) in Net Assets | |
| Resulting from Operations | 104,037 |
| | |
| Statement of Changes in Net Assets | | |
| |
| | Six Months Ended | Year Ended |
| | February 28, | August 31, |
| | 2010 | 2009 |
| | ($000) | ($000) |
| Increase (Decrease) in Net Assets | | |
| Operations | | |
| Net Investment Income | 9,325 | 13,882 |
| Realized Net Gain (Loss) | (10,255) | (45,410) |
| Change in Unrealized Appreciation (Depreciation) | 104,967 | (235,527) |
| Net Increase (Decrease) in Net Assets Resulting from Operations | 104,037 | (267,055) |
| Distributions | | |
| Net Investment Income | | |
| Admiral Shares | (1,675) | (1,381) |
| ETF Shares | (14,832) | (9,252) |
| Realized Capital Gain | | |
| Admiral Shares | — | — |
| ETF Shares | — | — |
| Total Distributions | (16,507) | (10,633) |
| Capital Share Transactions | | |
| Admiral Shares | 65 | 4,816 |
| ETF Shares | 110,418 | 256,766 |
| Net Increase (Decrease) from Capital Share Transactions | 110,483 | 261,582 |
| Total Increase (Decrease) | 198,013 | (16,106) |
| Net Assets | | |
| Beginning of Period | 977,011 | 993,117 |
| End of Period2 | 1,175,024 | 977,011 |
1 Interest income from an affiliated company of the fund was $1,000.
2 Net Assets—End of Period includes undistributed net investment income of $3,087,000 and $10,269,000.
See accompanying Notes, which are an integral part of the Financial Statements.
28
| | | | | | | |
| Energy Index Fund | | | | | | | |
| |
| |
| Financial Highlights | | | | | | |
| |
| Admiral Shares | | | | | | | |
| | Six Months | | | | | Oct. 7, |
| | | Ended | | | | | 20041 to |
| For a Share Outstanding | February 28, | Year Ended August 31, | Aug. 31, |
| Throughout Each Period | | 2010 | 2009 | 2008 | 2007 | 2006 | 2005 |
| Net Asset Value, Beginning of Period | $37.34 | $54.66 | $50.36 | $40.36 | $36.29 | $25.98 |
| Investment Operations | | | | | | | |
| Net Investment Income | | .301 | .578 | .504 | .5012 | .4602 | .5882,3 |
| Net Realized and Unrealized Gain (Loss) | | | | | | |
| on Investments | | 3.789 | (17.335) | 4.246 | 9.944 | 3.960 | 9.833 |
| Total from Investment Operations | 4.090 | (16.757) | 4.750 | 10.445 | 4.420 | 10.421 |
| Distributions | | | | | | | |
| Dividends from Net Investment Income | (.580) | (.563) | (.450) | (.445) | (.350) | (.111) |
| Distributions from Realized Capital Gains | — | — | — | — | — | — |
| Total Distributions | | (.580) | (.563) | (.450) | (.445) | (.350) | (.111) |
| Net Asset Value, End of Period | | $40.85 | $37.34 | $54.66 | $50.36 | $40.36 | $36.29 |
| |
| Total Return4 | | 10.93% | –30.51% | 9.42% | 26.03% | 12.27% | 40.27% |
| |
| Ratios/Supplemental Data | | | | | | | |
| Net Assets, End of Period (Millions) | $118 | $108 | $148 | $115 | $83 | $60 |
| Ratio of Total Expenses to | | | | | | | |
| Average Net Assets | | 0.26%5 | 0.28% | 0.25% | 0.26% | 0.28% | 0.28%5 |
| Ratio of Net Investment Income to | | | | | | |
| Average Net Assets | | 1.62%5 | 1.81% | 0.99% | 1.16% | 1.20% | 1.95%3,5 |
| Portfolio Turnover Rate6 | | 20%5 | 25% | 11% | 15% | 21% | 16% |
1 Inception.
2 Calculated based on average shares outstanding.
3 Net investment income per share and the ratio of net investment income to average net assets include $.163 and 0.52%, respectively, resulting from a cash payment received in connection with the merger of Chevron Corp. and Unocal Corp. in August 2005.
4 Total returns do not reflect the 2% fee assessed on redemptions of shares held for less than one year.
5 Annualized.
6 Excludes the value of portfolio securities received or delivered as a result of in-kind purchases or redemptions of the fund’s capital shares, including ETF Creation Units.
See accompanying Notes, which are an integral part of the Financial Statements.
29
| | | | | | | |
| Energy Index Fund | | | | | | | |
| |
| |
| Financial Highlights | | | | | | |
| |
| ETF Shares | | | | | | | |
| | Six Months | | | | | Sept. 23, |
| | | Ended | | | | | 20041 to |
| For a Share Outstanding | February 28, | Year Ended August 31, | Aug. 31, |
| Throughout Each Period | | 2010 | 2009 | 2008 | 2007 | 2006 | 2005 |
| Net Asset Value, Beginning of Period | $74.74 | $109.54 | $100.92 | $80.90 | $72.72 | $49.24 |
| Investment Operations | | | | | | | |
| Net Investment Income | | .620 | 1.191 | 1.059 | 1.0802 | .9662 | 1.1692,3 |
| Net Realized and Unrealized Gain (Loss) | | | | | | |
| on Investments | | 7.593 | (34.808) | 8.501 | 19.869 | 7.915 | 22.527 |
| Total from Investment Operations | 8.213 | (33.617) | 9.560 | 20.949 | 8.881 | 23.696 |
| Distributions | | | | | | | |
| Dividends from Net Investment Income | (1.193) | (1.183) | (.940) | (.929) | (.701) | (.216) |
| Distributions from Realized Capital Gains | — | — | — | — | — | — |
| Total Distributions | | (1.193) | (1.183) | (.940) | (.929) | (.701) | (.216) |
| Net Asset Value, End of Period | | $81.76 | $74.74 | $109.54 | $100.92 | $80.90 | $72.72 |
| |
| Total Return | | 10.96% | –30.49% | 9.47% | 26.09% | 12.31% | 48.29% |
| |
| Ratios/Supplemental Data | | | | | | | |
| Net Assets, End of Period (Millions) | $1,057 | $869 | $845 | $656 | $340 | $182 |
| Ratio of Total Expenses to | | | | | | | |
| Average Net Assets | | 0.23%4 | 0.25% | 0.20% | 0.22% | 0.25% | 0.26%4 |
| Ratio of Net Investment Income to | | | | | | |
| Average Net Assets | | 1.65%4 | 1.84% | 1.04% | 1.20% | 1.23% | 1.97%3,4 |
| Portfolio Turnover Rate5 | | 20%4 | 25% | 11% | 15% | 21% | 16% |
1 Inception.
2 Calculated based on average shares outstanding.
3 Net investment income per share and the ratio of net investment income to average net assets include $.324 and 0.52%, respectively, resulting from a cash payment received in connection with the merger of Chevron Corp. and Unocal Corp. in August 2005.
4 Annualized.
5 Excludes the value of portfolio securities received or delivered as a result of in-kind purchases or redemptions of the fund’s capital shares, including ETF Creation Units.
See accompanying Notes, which are an integral part of the Financial Statements.
30
Energy Index Fund
Notes to Financial Statements
Vanguard Energy Index Fund is registered under the Investment Company Act of 1940 as an open-end investment company, or mutual fund. The fund offers two classes of shares, Admiral Shares and ETF Shares. Admiral Shares are available to any investor who meets the fund’s minimum purchase requirements. ETF Shares are listed for trading on the NYSE Arca, Inc.; they can be purchased and sold through a broker.
A. The following significant accounting policies conform to generally accepted accounting principles for U.S. mutual funds. The fund consistently follows such policies in preparing its financial statements.
1. Security Valuation: Securities are valued as of the close of trading on the New York Stock Exchange (generally 4 p.m., Eastern time) on the valuation date. Equity securities are valued at the latest quoted sales prices or official closing prices taken from the primary market in which each security trades; such securities not traded on the valuation date are valued at the mean of the latest quoted bid and asked prices. Securities for which market quotations are not readily available, or whose values have been materially affected by events occurring before the fund’s pricing time but after the close of the securities’ primary markets, are valued by methods deemed by the board of trustees to represent fair value. Investments in Vanguard Market Liquidity Fund are valued at that fund’s net asset value.
2. Federal Income Taxes: The fund intends to continue to qualify as a regulated investment company and distribute all of its taxable income. Management has analyzed the fund’s tax positions taken for all open federal income tax years (August 31, 2006–2009), and for the period ended February 28, 2010, and has concluded that no provision for federal income tax is required in the fund’s financial statements.
3. Distributions: Distributions to shareholders are recorded on the ex-dividend date.
4. Security Lending: The fund may lend its securities to qualified institutional borrowers to earn additional income. Security loans are required to be secured at all times by collateral at least equal to the market value of securities loaned. The fund invests cash collateral received in Vanguard Market Liquidity Fund, and records a liability for the return of the collateral, during the period the securities are on loan. Security lending income represents the income earned on investing cash collateral, less expenses associated with the loan.
5. Other: Dividend income is recorded on the ex-dividend date. Interest income includes income distributions received from Vanguard Market Liquidity Fund and is accrued daily. Security transactions are accounted for on the date securities are bought or sold. Costs used to determine realized gains (losses) on the sale of investment securities are those of the specific securities sold. Fees assessed on redemptions of capital shares are credited to paid-in capital.
Each class of shares has equal rights as to assets and earnings, except that each class separately bears certain class-specific expenses related to maintenance of shareholder accounts (included in Management and Administrative expenses) and shareholder reporting. Marketing and distribution expenses are allocated to each class of shares based on a method approved by the board of trustees. Income, other non-class-specific expenses, and gains and losses on investments are allocated to each class of shares based on its relative net assets.
B. The Vanguard Group furnishes at cost investment advisory, corporate management, administrative, marketing, and distribution services. The costs of such services are allocated to the fund under methods approved by the board of trustees. The fund has committed to provide up to 0.40% of its net assets in capital contributions to Vanguard. At February 28, 2010, the fund had contributed capital of $229,000 to Vanguard (included in Other Assets), representing 0.02% of the fund’s net assets and 0.09% of Vanguard’s capitalization. The fund’s trustees and officers are also directors and officers of Vanguard.
C. Various inputs may be used to determine the value of the fund’s investments. These inputs are summarized in three broad levels for financial statement purposes. The inputs or methodologies used to value securities are not necessarily an indication of the risk associated with investing in those securities.
Level 1—Quoted prices in active markets for identical securities.
Level 2—Other significant observable inputs (including quoted prices for similar securities, interest rates, prepayment speeds, credit risk, etc.).
Level 3—Significant unobservable inputs (including the fund’s own assumptions used to determine the fair value of investments).
At February 28, 2010, 100% of the fund’s investments were valued based on Level 1 inputs.
31
Energy Index Fund
D. Distributions are determined on a tax basis and may differ from net investment income and realized capital gains for financial reporting purposes. Differences may be permanent or temporary. Permanent differences are reclassified among capital accounts in the financial statements to reflect their tax character. Temporary differences arise when certain items of income, expense, gain, or loss are recognized in different periods for financial statement and tax purposes; these differences will reverse at some time in the future. Differences in classification may also result from the treatment of short-term gains as ordinary income for tax purposes.
During the six months ended February 28, 2010, the fund realized $16,377,000 of net capital gains resulting from in-kind redemptions—in which shareholders exchanged fund shares for securities held by the fund rather than for cash. Because such gains are not taxable to the fund, and are not distributed to shareholders, they have been reclassified from accumulated net realized losses to paid-in capital.
The fund’s tax-basis capital gains and losses are determined only at the end of each fiscal year. For tax purposes, at August 31, 2009, the fund had available capital loss carryforwards totaling $24,215,000 to offset future net capital gains of $5,000 through August 31, 2013, $789,000 through August 31, 2014, $461,000 through August 31, 2015, $1,694,000 through August 31, 2016, and $21,266,000 through August 31, 2017. In addition, the fund realized losses of $62,562,000 during the period from November 1, 2008, through August 31, 2009, which are deferred and will be treated as realized for tax purposes in fiscal 2010. The fund will use these capital losses to offset net taxable capital gains, if any, realized during the year ending August 31, 2010; should the fund realize net capital losses for the year, the losses will be added to the loss carryforward balances above.
At February 28, 2010, the cost of investment securities for tax purposes was $1,124,964,000. Net unrealized appreciation of investment securities for tax purposes was $49,753,000, consisting of unrealized gains of $108,879,000 on securities that had risen in value since their purchase and $59,126,000 in unrealized losses on securities that had fallen in value since their purchase.
E. During the six months ended February 28, 2010, the fund purchased $270,943,000 of investment securities and sold $167,604,000 of investment securities, other than temporary cash investments.
F. Capital share transactions for each class of shares were:
| | | | |
| | Six Months Ended | | Year Ended |
| | February 28, 2010 | August 31, 2009 |
| | Amount | Shares | Amount | Shares |
| | ($000) | (000) | ($000) | (000) |
| Admiral Shares | | | | |
| Issued | 13,287 | 320 | 40,669 | 1,162 |
| Issued in Lieu of Cash Distributions | 1,465 | 35 | 1,181 | 36 |
| Redeemed1 | (14,687) | (359) | (37,034) | (1,022) |
| Net Increase (Decrease)—Admiral Shares | 65 | (4) | 4,816 | 176 |
| ETF Shares | | | | |
| Issued | 160,081 | 1,902 | 350,914 | 5,017 |
| Issued in Lieu of Cash Distributions | — | — | — | — |
| Redeemed1 | (49,663) | (600) | (94,148) | (1,100) |
| Net Increase (Decrease)—ETF Shares | 110,418 | 1,302 | 256,766 | 3,917 |
| 1 Net of redemption fees for fiscal 2010 and 2009 of $46,000 and $243,000, respectively (fund totals). | | |
G. In preparing the financial statements as of February 28, 2010, management considered the impact of subsequent events for potential recognition or disclosure in these financial statements.
32
Financials Index Fund
Fund Profile
As of February 28, 2010
| | | |
| Portfolio Characteristics | | |
| | | Target | Broad |
| | Fund | Index1 | Index2 |
| Number of Stocks | 489 | 488 | 2,492 |
| Median Market Cap | $22.3B | $23.1B | $29.0B |
| Price/Earnings Ratio | 29.7x | 29.9x | 21.2x |
| Price/Book Ratio | 1.1x | 1.1x | 2.1x |
| Yield3 | | 1.7% | 1.9% |
| Admiral Shares | 1.5% | | |
| ETF Shares | 1.5% | | |
| Return on Equity | 12.5% | 12.5% | 19.4% |
| Earnings Growth Rate | –8.1% | –8.2% | 8.1% |
| Foreign Holdings | 0.0% | 0.0% | 0.0% |
| Turnover Rate4 | 12% | — | — |
| Expense Ratio5 | | — | — |
| Admiral Shares | 0.28% | | |
| ETF Shares | 0.25% | | |
| Short-Term Reserves | 0.0% | — | — |
| | |
| Volatility Measures6 | |
| | Fund Versus | Fund Versus |
| | Target Index1 | Broad Index2 |
| R-Squared | 1.00 | 0.77 |
| Beta | 1.00 | 1.40 |
| |
| Subindustry Diversification | |
| (% of equity exposure) | |
| Asset Management & Custody Banks | 7.9% |
| Consumer Finance | 4.1 |
| Diversified Banks | 9.6 |
| Diversified REITs | 1.0 |
| Insurance Brokers | 1.7 |
| Investment Banking & Brokerage | 7.9 |
| Life & Health Insurance | 5.8 |
| Mortgage REITs | 1.1 |
| Multiline Insurance | 2.3 |
| Office REITs | 2.0 |
| Other Diversified Financial Services | 20.8 |
| Property & Casualty Insurance | 10.2 |
| Regional Banks | 9.2 |
| Reinsurance | 1.8 |
| Residential REITs | 1.8 |
| Retail REITs | 3.0 |
| Specialized Finance | 2.5 |
| Specialized REITs | 3.7 |
| Thrifts & Mortgage Finance | 2.0 |
| Other Financials | 1.6 |
| |
| Ten Largest Holdings7 (% of total net assets) |
| JPMorgan Chase & Co. | 8.6% |
| Bank of America Corp. | 8.2 |
| Wells Fargo & Co. | 6.9 |
| Goldman Sachs Group Inc. | 4.0 |
| Citigroup Inc. | 3.7 |
| US Bancorp | 2.4 |
| Berkshire Hathaway Inc. Class B | 2.4 |
| American Express Co. | 2.1 |
| Morgan Stanley | 1.8 |
| Bank of New York Mellon Corp. | 1.8 |
| Top Ten | 41.9% |
1 MSCI US IMI/Financials.
2 MSCI US IMI/2500.
3 30-day SEC yield for the fund; annualized dividend yield for the indexes. See the Glossary.
4 Annualized.
5 The expense ratios shown are from the prospectuses dated December 28, 2009, and represent estimated costs for the current fiscal year based on the fund’s net assets as of the prospectus date. For the six months ended February 28, 2010, the annualized expense ratios were 0.26% for Admiral Shares and 0.23% for ETF Shares.
6 For an explanation of R-squared, beta, and other terms used here, see the Glossary.
7 The holdings listed exclude any temporary cash investments and equity index products.
33
Financials Index Fund
Performance Summary
All of the returns in this report represent past performance, which is not a guarantee of future results that may be achieved by the fund. (Current performance may be lower or higher than the performance data cited. For performance data current to the most recent month-end, visit our website at www.vanguard.com/performance.) Note, too, that both investment returns and principal value can fluctuate widely, so an investor’s shares, when sold, could be worth more or less than their original cost. The returns shown do not reflect taxes that a shareholder would pay on fund distributions or on the sale of fund shares.
Fiscal-Year Total Returns (%): January 26, 2004–February 28, 2010

Average Annual Total Returns: Periods Ended December 31, 2009
This table presents average annual total returns through the latest calendar quarter—rather than through the end of the fiscal period. Securities and Exchange Commission rules require that we provide this information.
| | | | |
| | | | | Since |
| | Inception Date | One Year | Five Years | Inception |
| ETF Shares | 1/26/2004 | | | |
| Market Price | | 14.57% | –9.41% | –6.68% |
| Net Asset Value | | 14.81 | –9.40 | –6.68 |
| Admiral Shares3 | 2/4/2004 | 14.76 | –9.44 | – 6.48 |
1 Six months ended February 28, 2010.
2 For more information about how the ETF Shares’ market prices have compared with their net asset value, visit www.vanguard.com, select your ETF, and then select the Performance tab. The Premium/Discount table there shows the percentages of days on which the ETF Shares’ market price was above or below the NAV.
3 Total returns do not reflect the 2% fee assessed on redemptions of shares held for less than one year.
See Financial Highlights for dividend and capital gains information.
34
Financials Index Fund
Financial Statements (unaudited)
Statement of Net Assets
As of February 28, 2010
The fund reports a complete list of its holdings in regulatory filings four times in each fiscal year, at the quarter-ends. For the second and fourth fiscal quarters, the lists appear in the fund’s semiannual and annual reports to shareholders. For the first and third fiscal quarters, the fund files the lists with the Securities and Exchange Commission on Form N-Q. Shareholders can look up the fund’s Forms N-Q on the SEC’s website at www.sec.gov. Forms N-Q may also be reviewed and copied at the SEC’s Public Reference Room (see the back cover of this report for further information).
| | | |
| | | | Market |
| | | | Value• |
| | | Shares | ($000) |
| Common Stocks (100.0%) | | |
| Capital Markets (15.8%) | | |
| | Goldman Sachs Group Inc. | 137,705 | 21,530 |
| | Morgan Stanley | 345,169 | 9,727 |
| | Bank of New York | | |
| | Mellon Corp. | 339,746 | 9,690 |
| | State Street Corp. | 139,594 | 6,269 |
| | Charles Schwab Corp. | 278,694 | 5,103 |
| | Franklin Resources Inc. | 45,210 | 4,599 |
| | T Rowe Price Group Inc. | 72,631 | 3,682 |
| | Northern Trust Corp. | 61,305 | 3,267 |
| | Ameriprise Financial Inc. | 71,933 | 2,879 |
| | Invesco Ltd. | 121,069 | 2,373 |
| | BlackRock Inc. | 6,474 | 1,416 |
| * | TD Ameritrade Holding Corp. | 74,593 | 1,305 |
| | Legg Mason Inc. | 45,426 | 1,174 |
| | Eaton Vance Corp. | 31,366 | 947 |
| * | E*Trade Financial Corp. | 526,592 | 848 |
| * | Affiliated Managers | | |
| | Group Inc. | 11,870 | 844 |
| | Waddell & Reed | | |
| | Financial Inc. | 24,023 | 790 |
| | Raymond James | | |
| | Financial Inc. | 27,734 | 717 |
| | Jefferies Group Inc. | 28,677 | 716 |
| | SEI Investments Co. | 37,617 | 663 |
| | Federated Investors Inc. | | |
| | Class B | 26,002 | 650 |
| | Janus Capital Group Inc. | 51,338 | 642 |
| | Apollo Investment Corp. | 49,486 | 577 |
| | Ares Capital Corp. | 36,885 | 482 |
| | Greenhill & Co. Inc. | 6,370 | 455 |
| * | Stifel Financial Corp. | 7,751 | 424 |
| * | Knight Capital Group Inc. | | |
| | Class A | 24,927 | 402 |
| | American Capital Ltd. | 79,155 | 340 |
| * | Piper Jaffray Cos. | 5,464 | 236 |
| * | Allied Capital Corp. | 51,362 | 214 |
| | Prospect Capital Corp. | 18,380 | 214 |
| * | Investment Technology | | |
| | Group Inc. | 12,488 | 212 |
| * | KBW Inc. | 8,943 | 212 |
| * | MF Global Holdings Ltd. | 29,661 | 205 |
| | optionsXpress Holdings Inc. | 12,383 | 196 |
| * | Riskmetrics Group Inc. | 8,944 | 167 |
| | BlackRock Kelso | | |
| | Capital Corp. | 16,218 | 150 |
| | Fifth Street Finance Corp. | 12,946 | 147 |
| | Evercore Partners Inc. | | |
| | Class A | 4,022 | 121 |
| | GFI Group Inc. | 20,615 | 114 |
| | Cohen & Steers Inc. | 4,805 | 105 |
| * | GLG Partners Inc. | 35,834 | 100 |
| | Hercules Technology | | |
| | Growth Capital Inc. | 10,085 | 99 |
| | SWS Group Inc. | 8,218 | 99 |
| | | | |
| | | | | Market |
| | | | | Value• |
| | | | Shares | ($000) |
| | Duff & Phelps Corp. Class A | 5,593 | 93 |
| * | FBR Capital Markets Corp. | 16,354 | 88 |
| | MVC Capital Inc. | | 6,305 | 79 |
| | Calamos Asset | | | |
| | Management Inc. Class A | 5,632 | 75 |
| | Oppenheimer Holdings Inc. | | |
| | Class A | | 2,832 | 71 |
| * | TradeStation Group Inc. | 9,715 | 67 |
| | GAMCO Investors Inc. | | 1,507 | 66 |
| * | LaBranche & Co. Inc. | | 13,954 | 65 |
| | Westwood Holdings | | | |
| | Group Inc. | | 1,620 | 63 |
| * | International Assets | | | |
| | Holding Corp. | | 3,953 | 62 |
| | Capital Southwest Corp. | 700 | 61 |
| | BGC Partners Inc. Class A | 12,082 | 60 |
| | NGP Capital Resources Co. | 6,126 | 50 |
| * | Penson Worldwide Inc. | 4,148 | 39 |
| | | | | 86,041 |
| Commercial Banks (18.9%) | | |
| | Wells Fargo & Co. | 1,370,500 | 37,469 |
| | US Bancorp | | 539,572 | 13,279 |
| | PNC Financial Services | | |
| | Group Inc. | | 145,827 | 7,840 |
| | BB&T Corp. | | 194,010 | 5,535 |
| | SunTrust Banks Inc. | | 140,820 | 3,353 |
| | Fifth Third Bancorp | | 213,129 | 2,602 |
| | Regions Financial Corp. | 335,130 | 2,262 |
| | KeyCorp | | 247,903 | 1,772 |
| | M&T Bank Corp. | | 21,591 | 1,672 |
| | Comerica Inc. | | 42,560 | 1,536 |
| | Marshall & Ilsley Corp. | | 140,623 | 996 |
| | Huntington Bancshares Inc. | 201,754 | 970 |
| | Cullen/Frost Bankers Inc. | 15,178 | 822 |
| | Commerce Bancshares Inc. | 19,847 | 804 |
| * | First Horizon National Corp. | 62,581 | 801 |
| | Zions Bancorporation | | 37,045 | 687 |
| | City National Corp. | | 12,287 | 613 |
| | Associated Banc-Corp | | 44,813 | 579 |
| | Bank of Hawaii Corp. | | 13,518 | 571 |
| | Valley National Bancorp | 38,987 | 561 |
| | FirstMerit Corp. | | 24,480 | 518 |
| | TCF Financial Corp. | | 35,589 | 514 |
| * | SVB Financial Group | | 11,431 | 509 |
| | Prosperity Bancshares Inc. | 11,898 | 498 |
| | Fulton Financial Corp. | | 49,722 | 478 |
| | Westamerica Bancorporation | 8,197 | 450 |
| * | Signature Bank | | 11,440 | 426 |
| | BancorpSouth Inc. | | 21,184 | 412 |
| | Trustmark Corp. | | 16,834 | 384 |
| | East West Bancorp Inc. | 20,663 | 362 |
| | BOK Financial Corp. | | 7,721 | 355 |
| | Synovus Financial Corp. | 123,653 | 352 |
| | Wilmington Trust Corp. | 24,188 | 349 |
| | Popular Inc. | | 180,378 | 348 |
| | Whitney Holding Corp. | | 26,562 | 341 |
| | | |
| | | | Market |
| | | | Value• |
| | | Shares | ($000) |
| | Umpqua Holdings Corp. | 26,965 | 337 |
| | Hancock Holding Co. | 8,290 | 334 |
| | UMB Financial Corp. | 8,514 | 326 |
| | Iberiabank Corp. | 5,527 | 316 |
| | International | | |
| | Bancshares Corp. | 14,428 | 306 |
| | First Financial Bancorp | 16,258 | 302 |
| | Webster Financial Corp. | 18,611 | 298 |
| | United Bankshares Inc. | 11,798 | 290 |
| | Old National Bancorp | 24,308 | 276 |
| | First Midwest Bancorp Inc. | 20,036 | 272 |
| | MB Financial Inc. | 13,180 | 268 |
| | Glacier Bancorp Inc. | 17,628 | 256 |
| | First Financial Bankshares Inc. | 4,763 | 249 |
| | FNB Corp. | 32,759 | 249 |
| | Wintrust Financial Corp. | 6,869 | 234 |
| | National Penn | | |
| | Bancshares Inc. | 33,333 | 230 |
| | CVB Financial Corp. | 24,328 | 226 |
| | PrivateBancorp Inc. Class A | 17,275 | 225 |
| | First Citizens | | |
| | BancShares Inc. Class A | 1,205 | 220 |
| | Community Bank System Inc. | 9,387 | 210 |
| | NBT Bancorp Inc. | 9,804 | 208 |
| | Susquehanna | | |
| | Bancshares Inc. | 24,803 | 207 |
| | Cathay General Bancorp | 20,923 | 204 |
| * | Investors Bancorp Inc. | 14,726 | 190 |
| | PacWest Bancorp | 8,714 | 177 |
| | Park National Corp. | 3,248 | 173 |
| * | Texas Capital Bancshares Inc. | 9,652 | 163 |
| | Columbia Banking System Inc. | 7,579 | 155 |
| | City Holding Co. | 4,524 | 145 |
| * | Pinnacle Financial | | |
| | Partners Inc. | 8,970 | 136 |
| | SCBT Financial Corp. | 3,668 | 133 |
| | Independent Bank Corp. | 5,377 | 132 |
| | Home Bancshares Inc. | 5,328 | 129 |
| | Boston Private Financial | | |
| | Holdings Inc. | 18,687 | 128 |
| | Chemical Financial Corp. | 6,200 | 128 |
| | Sterling Bancshares Inc. | 26,707 | 126 |
| | First Commonwealth | | |
| | Financial Corp. | 21,817 | 122 |
| | Bank of the Ozarks Inc. | 3,890 | 119 |
| | S&T Bancorp Inc. | 6,650 | 118 |
| | Simmons First National Corp. | | |
| | Class A | 4,058 | 108 |
| * | United Community | | |
| | Banks Inc. | 24,332 | 101 |
| | WesBanco Inc. | 6,395 | 97 |
| | Community Trust | | |
| | Bancorp Inc. | 3,680 | 94 |
| * | Western Alliance Bancorp | 16,155 | 93 |
| | Renasant Corp. | 5,778 | 88 |
| * | Nara Bancorp Inc. | 9,761 | 86 |
35
Financials Index Fund
| | | | |
| | | | | Market |
| | | | | Value• |
| | | | Shares | ($000) |
| | Danvers Bancorp Inc. | | 6,045 | 86 |
| | Northfield Bancorp Inc. | | 5,719 | 80 |
| | Suffolk Bancorp | | 2,759 | 79 |
| | Harleysville National Corp. | | 11,757 | 78 |
| | StellarOne Corp. | | 6,542 | 77 |
| | Tompkins Financial Corp. | | 2,141 | 77 |
| | Lakeland Financial Corp. | | 4,299 | 76 |
| | Cardinal Financial Corp. | | 7,762 | 75 |
| | Arrow Financial Corp. | | 2,969 | 75 |
| | First Financial Corp. | | 2,815 | 74 |
| | TowneBank | | 5,965 | 73 |
| | SY Bancorp Inc. | | 3,330 | 73 |
| | Southside Bancshares Inc. | | 3,615 | 72 |
| | Oriental Financial Group Inc. | | 6,549 | 72 |
| | Univest Corp. of Pennsylvania | 4,112 | 71 |
| | Washington Trust Bancorp Inc. | 4,171 | 71 |
| | Bancfirst Corp. | | 1,766 | 70 |
| | Trico Bancshares | | 3,851 | 70 |
| | Sandy Spring Bancorp Inc. | | 4,701 | 66 |
| | Camden National Corp. | | 2,103 | 63 |
| | Union First Market | | | |
| | Bankshares Corp. | | 5,006 | 63 |
| | 1st Source Corp. | | 4,084 | 61 |
| | First Bancorp | | 4,289 | 61 |
| | Great Southern Bancorp Inc. | | 2,475 | 57 |
| | CoBiz Financial Inc. | | 9,094 | 54 |
| | Wilshire Bancorp Inc. | | 5,500 | 52 |
| | First Community | | | |
| | Bancshares Inc. | | 4,433 | 51 |
| | First Busey Corp. | | 13,222 | 50 |
| | Republic Bancorp Inc. | | | |
| | Class A | | 2,902 | 49 |
| | First BanCorp | | 22,895 | 49 |
| | Heartland Financial USA Inc. | | 3,277 | 48 |
| | Lakeland Bancorp Inc. | | 6,173 | 47 |
| | Sterling Bancorp | | 4,953 | 41 |
| | Capital City Bank Group Inc. | | 2,892 | 37 |
| | MainSource Financial | | | |
| | Group Inc. | | 5,548 | 35 |
| | First Merchants Corp. | | 5,822 | 34 |
| | Citizens & Northern Corp. | | 3,006 | 34 |
| | Ames National Corp. | | 1,706 | 32 |
| | Southwest Bancorp Inc. | | 3,885 | 30 |
| | South Financial Group Inc. | | 47,575 | 27 |
| * | Sun Bancorp Inc. | | 4,518 | 16 |
| | | | | 102,410 |
| Consumer Finance (4.1%) | | | |
| | American Express Co. | 301,920 | 11,530 |
| | Capital One Financial Corp. | 126,941 | 4,792 |
| | Discover Financial Services | 153,085 | 2,090 |
| * | SLM Corp. | 133,850 | 1,496 |
| * | AmeriCredit Corp. | | 37,588 | 836 |
| | Cash America | | | |
| | International Inc. | | 8,169 | 313 |
| * | Ezcorp Inc. Class A | | 10,472 | 207 |
| * | World Acceptance Corp. | | 4,135 | 173 |
| * | Dollar Financial Corp. | | 6,867 | 154 |
| * | First Cash Financial | | | |
| | Services Inc. | | 6,808 | 145 |
| | Nelnet Inc. Class A | | 8,311 | 131 |
| * | Credit Acceptance Corp. | | 3,122 | 125 |
| | Advance America Cash | | | |
| | Advance Centers Inc. | | 10,718 | 67 |
| * | First Marblehead Corp. | | 19,024 | 45 |
| * | Cardtronics Inc. | | 4,478 | 44 |
| | Student Loan Corp. | | 1,135 | 41 |
| | CompuCredit Holdings Corp. | | 4,673 | 16 |
| | | | | 22,205 |
| | | | |
| | | | | Market |
| | | | | Value• |
| | | | Shares | ($000) |
| Diversified Financial Services (23.4%) | |
| | JPMorgan Chase & Co. | 1,111,862 | 46,665 |
| | Bank of America Corp. | 2,689,918 | 44,814 |
| * | Citigroup Inc. | 5,981,198 | 20,336 |
| | CME Group Inc. | | 18,765 | 5,661 |
| | NYSE Euronext | | 73,408 | 1,937 |
| * | Intercontinental- | | | |
| | Exchange Inc. | | 17,542 | 1,882 |
| | Moody’s Corp. | | 56,656 | 1,508 |
| * | Leucadia National Corp. | | 54,854 | 1,302 |
| * | MSCI Inc. Class A | | 29,180 | 875 |
| * | NASDAQ OMX Group Inc. | | 41,595 | 775 |
| * | PHH Corp. | | 15,639 | 289 |
| * | Portfolio Recovery | | | |
| | Associates Inc. | | 4,693 | 250 |
| * | Interactive Brokers Group Inc. | 11,848 | 204 |
| * | Pico Holdings Inc. | | 5,775 | 197 |
| | MarketAxess Holdings Inc. | | 8,601 | 129 |
| | Compass Diversified Holdings | 8,438 | 113 |
| * | Broadpoint Gleacher | | | |
| | Securities Inc. | | 17,019 | 68 |
| * | NewStar Financial Inc. | | 8,644 | 54 |
| | Life Partners Holdings Inc. | | 2,105 | 43 |
| * | Asset Acceptance | | | |
| | Capital Corp. | | 4,345 | 25 |
| | Teton Advisors Inc. Class B | | 25 | — |
| | | | | 127,127 |
| Insurance (21.8%) | | | |
| * | Berkshire Hathaway Inc. | | | |
| | Class B | 161,466 | 12,938 |
| | MetLife Inc. | 230,984 | 8,406 |
| | Travelers Cos. Inc. | 154,146 | 8,107 |
| | Prudential Financial Inc. | 130,289 | 6,828 |
| | Aflac Inc. | 131,932 | 6,524 |
| | Chubb Corp. | | 96,287 | 4,859 |
| | ACE Ltd. | | 94,952 | 4,747 |
| | Allstate Corp. | 143,790 | 4,493 |
| | Loews Corp. | | 96,897 | 3,533 |
| | Marsh & McLennan | | | |
| | Cos. Inc. | 148,787 | 3,455 |
| | Progressive Corp. | 180,643 | 3,098 |
| | AON Corp. | | 69,611 | 2,850 |
| | Hartford Financial | | | |
| | Services Group Inc. | 107,971 | 2,631 |
| * | Genworth Financial Inc. | | | |
| | Class A | 137,812 | 2,197 |
| | Lincoln National Corp. | | 85,222 | 2,146 |
| | Principal Financial Group Inc. | 89,935 | 2,087 |
| | Unum Group | | 93,535 | 1,946 |
| | XL Capital Ltd. Class A | | 96,514 | 1,763 |
| | PartnerRe Ltd. | | 18,862 | 1,502 |
| | Everest Re Group Ltd. | | 16,964 | 1,449 |
| | Willis Group Holdings PLC | | 47,429 | 1,412 |
| * | Arch Capital Group Ltd. | | 16,653 | 1,232 |
| | Axis Capital Holdings Ltd. | | 38,145 | 1,200 |
| | Cincinnati Financial Corp. | | 43,523 | 1,171 |
| | Torchmark Corp. | | 23,329 | 1,085 |
| | WR Berkley Corp. | | 40,865 | 1,052 |
| | Assurant Inc. | | 32,878 | 1,003 |
| | Reinsurance Group of | | | |
| | America Inc. Class A | | 20,459 | 972 |
| | RenaissanceRe Holdings Ltd. | 17,540 | 971 |
| * | Markel Corp. | | 2,635 | 929 |
| | HCC Insurance Holdings Inc. | 31,738 | 885 |
| | Fidelity National Financial Inc. | | |
| | Class A | | 61,678 | 879 |
| *,^ | American International | | | |
| | Group Inc. | | 34,252 | 848 |
| | First American Corp. | | 25,543 | 823 |
| | | |
| | | | Market |
| | | | Value• |
| | | Shares | ($000) |
| | Transatlantic Holdings Inc. | 15,864 | 788 |
| | White Mountains | | |
| | Insurance Group Ltd. | 2,248 | 779 |
| | Old Republic | | |
| | International Corp. | 67,822 | 766 |
| | Assured Guaranty Ltd. | 35,616 | 751 |
| | Validus Holdings Ltd. | 26,081 | 730 |
| | Arthur J Gallagher & Co. | 28,654 | 680 |
| | Aspen Insurance | | |
| | Holdings Ltd. | 23,521 | 665 |
| | Hanover Insurance | | |
| | Group Inc. | 14,111 | 595 |
| | StanCorp Financial | | |
| | Group Inc. | 13,825 | 594 |
| | Brown & Brown Inc. | 34,348 | 576 |
| | American Financial | | |
| | Group Inc. | 21,283 | 551 |
| | Allied World Assurance Co. | | |
| | Holdings Ltd. | 11,885 | 548 |
| | Endurance Specialty | | |
| | Holdings Ltd. | 13,620 | 524 |
| | Platinum Underwriters | | |
| | Holdings Ltd. | 13,994 | 523 |
| * | ProAssurance Corp. | 8,590 | 458 |
| * | Alleghany Corp. | 1,630 | 452 |
| | Protective Life Corp. | 24,086 | 442 |
| | Zenith National | | |
| | Insurance Corp. | 10,686 | 407 |
| | Montpelier Re Holdings Ltd. | 22,410 | 398 |
| | Erie Indemnity Co. Class A | 8,817 | 349 |
| | Unitrin Inc. | 14,290 | 345 |
| | Max Capital Group Ltd. | 13,818 | 334 |
| * | Conseco Inc. | 65,963 | 328 |
| | Mercury General Corp. | 7,827 | 321 |
| | Delphi Financial Group Inc. | 13,673 | 292 |
| | RLI Corp. | 5,280 | 281 |
| | Tower Group Inc. | 12,074 | 275 |
| | American National | | |
| | Insurance Co. | 2,293 | 249 |
| | Argo Group International | | |
| | Holdings Ltd. | 8,873 | 247 |
| | Selective Insurance Group | 15,191 | 246 |
| * | MBIA Inc. | 47,737 | 230 |
| | Employers Holdings Inc. | 12,433 | 164 |
| | Infinity Property & | | |
| | Casualty Corp. | 3,894 | 159 |
| * | Navigators Group Inc. | 4,144 | 157 |
| * | Hilltop Holdings Inc. | 12,980 | 155 |
| * | Greenlight Capital Re Ltd. | | |
| | Class A | 6,055 | 153 |
| | Horace Mann | | |
| | Educators Corp. | 11,246 | 151 |
| * | Enstar Group Ltd. | 2,336 | 147 |
| | American Equity Investment | | |
| | Life Holding Co. | 15,950 | 140 |
| * | National Financial | | |
| | Partners Corp. | 12,149 | 140 |
| | Safety Insurance Group Inc. | 3,742 | 139 |
| | Harleysville Group Inc. | 3,951 | 133 |
| | Flagstone Reinsurance | | |
| | Holdings Ltd. | 10,613 | 121 |
| | National Western Life | | |
| | Insurance Co. Class A | 694 | 117 |
| | Amtrust Financial | | |
| | Services Inc. | 7,777 | 110 |
| | Meadowbrook Insurance | | |
| | Group Inc. | 15,497 | 110 |
| | United Fire & Casualty Co. | 6,389 | 109 |
| | Maiden Holdings Ltd. | 15,102 | 106 |
36
Financials Index Fund
| | | |
| | | | Market |
| | | | Value• |
| | | Shares | ($000) |
| | OneBeacon Insurance | | |
| | Group Ltd. Class A | 6,629 | 101 |
| * | eHealth Inc. | 5,926 | 99 |
| * | AMERISAFE Inc. | 5,398 | 93 |
| | FBL Financial Group Inc. | | |
| | Class A | 4,269 | 87 |
| | State Auto Financial Corp. | 4,604 | 84 |
| * | CNA Surety Corp. | 5,125 | 83 |
| * | Phoenix Cos. Inc. | 33,633 | 80 |
| * | Citizens Inc. | 12,090 | 78 |
| * | United America | | |
| | Indemnity Ltd. Class A | 9,551 | 77 |
| * | FPIC Insurance Group Inc. | 2,055 | 76 |
| | American Physicians | | |
| | Capital Inc. | 2,606 | 74 |
| | Stewart Information | | |
| | Services Corp. | 4,848 | 68 |
| * | SeaBright Insurance | | |
| | Holdings Inc. | 6,287 | 66 |
| | Presidential Life Corp. | 6,378 | 62 |
| | First Mercury Financial Corp. | 4,259 | 61 |
| * | Ambac Financial Group Inc. | 82,728 | 59 |
| | Baldwin & Lyons Inc. | 2,216 | 54 |
| | Donegal Group Inc. Class A | 3,435 | 51 |
| | Kansas City Life Insurance Co. | 1,366 | 40 |
| | EMC Insurance Group Inc. | 1,715 | 35 |
| | National Interstate Corp. | 1,935 | 34 |
| | Universal Insurance | | |
| | Holdings Inc. | 5,101 | 31 |
| * | Crawford & Co. Class B | 3,604 | 14 |
| * | Crawford & Co. Class A | 4,070 | 13 |
| | | | 118,576 |
| Real Estate Investment Trusts (13.4%) | |
| | Simon Property Group Inc. | 80,570 | 6,308 |
| | Vornado Realty Trust | 45,834 | 3,012 |
| | Public Storage | 35,837 | 2,945 |
| | Annaly Capital | | |
| | Management Inc. | 155,887 | 2,865 |
| | Equity Residential | 77,839 | 2,808 |
| | Boston Properties Inc. | 39,193 | 2,662 |
| | HCP Inc. | 82,728 | 2,381 |
| | Host Hotels & Resorts Inc. | 178,047 | 2,085 |
| | Ventas Inc. | 44,135 | 1,950 |
| | AvalonBay Communities Inc. | 22,956 | 1,869 |
| | ProLogis | 133,471 | 1,720 |
| | Plum Creek Timber Co. Inc. | 45,875 | 1,639 |
| | Kimco Realty Corp. | 113,460 | 1,576 |
| | Health Care REIT Inc. | 34,751 | 1,472 |
| | Federal Realty | | |
| | Investment Trust | 17,194 | 1,186 |
| | SL Green Realty Corp. | 21,762 | 1,111 |
| | Digital Realty Trust Inc. | 20,471 | 1,056 |
| | Nationwide Health | | |
| | Properties Inc. | 31,589 | 1,048 |
| | AMB Property Corp. | 41,192 | 1,003 |
| | Liberty Property Trust | 31,757 | 982 |
| | Macerich Co. | 27,131 | 967 |
| | Rayonier Inc. | 22,380 | 930 |
| | Regency Centers Corp. | 24,860 | 862 |
| | Realty Income Corp. | 29,361 | 822 |
| | Hospitality Properties Trust | 34,992 | 769 |
| | Alexandria Real Estate | | |
| | Equities Inc. | 12,419 | 765 |
| | Senior Housing | | |
| | Properties Trust | 35,878 | 746 |
| | Mack-Cali Realty Corp. | 22,167 | 744 |
| | UDR Inc. | 43,165 | 725 |
| | Camden Property Trust | 18,070 | 724 |
| | Chimera Investment Corp. | 179,944 | 720 |
| | Duke Realty Corp. | 63,265 | 702 |
| | | |
| | | | Market |
| | | | Value• |
| | | Shares | ($000) |
| | Essex Property Trust Inc. | 8,154 | 700 |
| | Weingarten Realty Investors | 32,093 | 661 |
| | Developers Diversified | | |
| | Realty Corp. | 58,512 | 621 |
| | Corporate Office | | |
| | Properties Trust SBI | 16,432 | 605 |
| | Taubman Centers Inc. | 15,037 | 582 |
| | Highwoods Properties Inc. | 20,028 | 582 |
| | MFA Financial Inc. | 78,298 | 567 |
| | Apartment Investment & | | |
| | Management Co. | 32,958 | 550 |
| | BRE Properties Inc. | 15,149 | 511 |
| | National Retail | | |
| | Properties Inc. | 23,189 | 492 |
| | Tanger Factory | | |
| | Outlet Centers | 11,405 | 475 |
| | Washington Real Estate | | |
| | Investment Trust | 16,655 | 464 |
| | Entertainment | | |
| | Properties Trust | 11,846 | 453 |
| | Omega Healthcare | | |
| | Investors Inc. | 23,795 | 451 |
| | HRPT Properties Trust | 63,089 | 443 |
| | CBL & Associates | | |
| | Properties Inc. | 36,941 | 439 |
| | Home Properties Inc. | 9,486 | 434 |
| | BioMed Realty Trust Inc. | 28,068 | 434 |
| | Mid-America Apartment | | |
| | Communities Inc. | 8,098 | 421 |
| | Equity Lifestyle | | |
| | Properties Inc. | 8,243 | 410 |
| | Brandywine Realty Trust | 36,347 | 407 |
| | American Campus | | |
| | Communities Inc. | 14,663 | 405 |
| | CapitalSource Inc. | 73,236 | 403 |
| | Douglas Emmett Inc. | 27,529 | 388 |
| | Potlatch Corp. | 11,130 | 368 |
| | Healthcare Realty Trust Inc. | 16,992 | 355 |
| | LaSalle Hotel Properties | 17,984 | 349 |
| | Kilroy Realty Corp. | 12,313 | 349 |
| | DiamondRock | | |
| | Hospitality Co. | 34,779 | 311 |
| | Redwood Trust Inc. | 20,866 | 297 |
| | DCT Industrial Trust Inc. | 58,836 | 290 |
| | Hatteras Financial Corp. | 10,420 | 271 |
| | PS Business Parks Inc. | 5,488 | 269 |
| | EastGroup Properties Inc. | 7,462 | 268 |
| | Extra Space Storage Inc. | 23,620 | 266 |
| | Post Properties Inc. | 13,735 | 264 |
| | Franklin Street | | |
| | Properties Corp. | 20,324 | 264 |
| | Capstead Mortgage Corp. | 21,180 | 264 |
| | Sovran Self Storage Inc. | 7,763 | 246 |
| * | Sunstone Hotel | | |
| | Investors Inc. | 27,336 | 244 |
| | Medical Properties Trust Inc. | 22,820 | 235 |
| | DuPont Fabros | | |
| | Technology Inc. | 11,949 | 234 |
| | National Health Investors Inc. | 6,712 | 234 |
| | Equity One Inc. | 12,413 | 229 |
| | Anworth Mortgage | | |
| | Asset Corp. | 30,950 | 209 |
| | Colonial Properties Trust | 17,726 | 209 |
| | Investors Real Estate Trust | 20,540 | 184 |
| | Inland Real Estate Corp. | 21,761 | 183 |
| | Acadia Realty Trust | 10,831 | 181 |
| | Cousins Properties Inc. | 24,226 | 174 |
| * | Alexander’s Inc. | 583 | 170 |
| | Lexington Realty Trust | 26,955 | 160 |
| | | |
| | | | Market |
| | | | Value• |
| | | Shares | ($000) |
| | American Capital | | |
| | Agency Corp. | 6,232 | 158 |
| | LTC Properties Inc. | 6,030 | 157 |
| | U-Store-It Trust | 22,860 | 149 |
| | Government Properties | | |
| | Income Trust | 6,241 | 147 |
| | Saul Centers Inc. | 3,828 | 137 |
| | Getty Realty Corp. | 5,393 | 119 |
| | Hersha Hospitality Trust | 28,105 | 117 |
| | Pennsylvania Real Estate | | |
| | Investment Trust | 11,414 | 115 |
| | First Potomac Realty Trust | 8,317 | 114 |
| * | iStar Financial Inc. | 28,826 | 112 |
| | Universal Health Realty | | |
| | Income Trust | 3,243 | 110 |
| | Cedar Shopping Centers Inc. | 15,721 | 104 |
| | Walter Investment | | |
| | Management Corp. | 7,128 | 103 |
| | Parkway Properties Inc. | 6,215 | 103 |
| | Sun Communities Inc. | 5,043 | 97 |
| * | First Industrial Realty | | |
| | Trust Inc. | 16,071 | 89 |
| | Ramco-Gershenson | | |
| | Properties Trust | 8,462 | 85 |
| | Education Realty | | |
| | Trust Inc. | 15,431 | 84 |
| * | Ashford Hospitality Trust Inc. | 15,148 | 83 |
| | NorthStar Realty | | |
| | Finance Corp. | 18,981 | 81 |
| | Glimcher Realty Trust | 18,552 | 80 |
| | Urstadt Biddle | | |
| | Properties Inc. Class A | 5,018 | 79 |
| | Kite Realty Group Trust | 17,554 | 72 |
| * | FelCor Lodging Trust Inc. | 18,591 | 70 |
| | CapLease Inc. | 14,475 | 64 |
| | Cypress Sharpridge | | |
| | Investments Inc. | 4,632 | 61 |
| * | Strategic Hotels & | | |
| | Resorts Inc. | 21,857 | 59 |
| * | Gramercy Capital Corp. | 11,970 | 46 |
| | Winthrop Realty Trust | 3,851 | 46 |
| * | RAIT Financial Trust | 17,255 | 29 |
| | | | 72,999 |
| Real Estate Management & Development (0.6%) |
| * | CB Richard Ellis Group Inc. | | |
| | Class A | 69,839 | 922 |
| | Jones Lang LaSalle Inc. | 11,801 | 752 |
| * | St. Joe Co. | 26,032 | 716 |
| * | Forest City Enterprises Inc. | | |
| | Class A | 34,051 | 409 |
| * | Forestar Group Inc. | 9,790 | 174 |
| * | Tejon Ranch Co. | 3,618 | 117 |
| * | Altisource Portfolio | | |
| | Solutions SA | 4,109 | 106 |
| | Consolidated-Tomoka | | |
| | Land Co. | 1,588 | 50 |
| * | Avatar Holdings Inc. | 2,241 | 36 |
| * | Grubb & Ellis Co. | 11,729 | 18 |
| | | | 3,300 |
| Thrifts & Mortgage Finance (2.0%) | |
| | Hudson City Bancorp Inc. | 133,389 | 1,803 |
| | New York Community | | |
| | Bancorp Inc. | 113,427 | 1,757 |
| | People’s United | | |
| | Financial Inc. | 105,529 | 1,664 |
| | First Niagara | | |
| | Financial Group Inc. | 53,137 | 746 |
| | Washington Federal Inc. | 31,693 | 618 |
| | Northwest Bancshares Inc. | 30,892 | 365 |
| | TFS Financial Corp. | 26,195 | 337 |
37
Financials Index Fund
| | | |
| | | | Market |
| | | | Value• |
| | | Shares | ($000) |
| | NewAlliance | | |
| | Bancshares Inc. | 27,065 | 324 |
| *,^ | Federal National | | |
| | Mortgage Assn. | 318,075 | 315 |
| | Astoria Financial Corp. | 23,282 | 309 |
| | Radian Group Inc. | 23,568 | 232 |
| * | MGIC Investment Corp. | 30,168 | 231 |
| * | Ocwen Financial Corp. | 20,551 | 222 |
| *,^ | Federal Home Loan | | |
| | Mortgage Corp. | 186,004 | 220 |
| | Capitol Federal Financial | 6,328 | 219 |
| | Brookline Bancorp Inc. | 16,959 | 174 |
| | Provident Financial | | |
| | Services Inc. | 15,443 | 169 |
| | Trustco Bank Corp. NY | 22,021 | 133 |
| | Flushing Financial Corp. | 7,724 | 98 |
| | Provident New York | | |
| | Bancorp | 10,342 | 90 |
| * | Beneficial Mutual | | |
| | Bancorp Inc. | 9,496 | 89 |
| | Dime Community | | |
| | Bancshares | 6,924 | 84 |
| | Bank Mutual Corp. | 12,880 | 84 |
| | Berkshire Hills Bancorp Inc. | 4,032 | 72 |
| | Westfield Financial Inc. | 8,115 | 67 |
| * | PMI Group Inc. | 21,883 | 61 |
| | Kearny Financial Corp. | 5,986 | 60 |
| | United Financial Bancorp Inc. | 4,217 | 55 |
| | First Financial Holdings Inc. | 4,517 | 54 |
| | BankFinancial Corp. | 5,571 | 54 |
| | Oritani Financial Corp. | 3,238 | 51 |
| | |
| | | Market |
| | | Value• |
| | Shares | ($000) |
| WSFS Financial Corp. | 1,584 | 49 |
| ViewPoint Financial Group | 3,131 | 46 |
| ESSA Bancorp Inc. | 3,842 | 45 |
| Abington Bancorp Inc. | 5,687 | 44 |
| First Financial Northwest Inc. | 5,057 | 33 |
| * Meridian Interstate | | |
| Bancorp Inc. | 2,893 | 29 |
| Rockville Financial Inc. | 2,553 | 27 |
| Roma Financial Corp. | 2,168 | 27 |
| Clifton Savings Bancorp Inc. | 2,728 | 24 |
| NASB Financial Inc. | 898 | 17 |
| | | 11,098 |
| Total Common Stocks | | |
| (Cost $761,352) | | 543,756 |
| Temporary Cash Investment (0.2%) | |
| Money Market Fund (0.2%) | | |
| 1,2 Vanguard Market | | |
| Liquidity Fund, 0.163% | | |
| (Cost $975) | 975,019 | 975 |
| Total Investments (100.2%) | | |
| (Cost $762,327) | | 544,731 |
| Other Assets and Liabilities (–0.2%) | |
| Other Assets | | 7,508 |
| Liabilities2 | | (8,770) |
| | | (1,262) |
| Net Assets (100%) | | 543,469 |
| |
| At February 28, 2010, net assets consisted of: |
| | Amount |
| | ($000) |
| Paid-in Capital | 955,664 |
| Overdistributed Net Investment Income | (540) |
| Accumulated Net Realized Losses | (194,059) |
| Unrealized Appreciation (Depreciation) | (217,596) |
| Net Assets | 543,469 |
| |
| Admiral Shares—Net Assets | |
| Applicable to 4,584,874 outstanding | |
| $.001 par value shares of beneficial | |
| interest (unlimited authorization) | 68,510 |
| Net Asset Value Per Share— | |
| Admiral Shares | $14.94 |
| |
| ETF Shares—Net Assets | |
| Applicable to 15,928,783 outstanding | |
| $.001 par value shares of beneficial | |
| interest (unlimited authorization) | 474,959 |
| Net Asset Value Per Share— | |
| ETF Shares | $29.82 |
• See Note A in Notes to Financial Statements.
* Non-income-producing security.
^ Part of security position is on loan to broker-dealers. The total value of securities on loan is $697,000.
1 Affiliated money market fund available only to Vanguard funds and certain trusts and accounts managed by Vanguard. Rate shown is the 7-day yield.
2 Includes $967,000 of collateral received for securities on loan.
REIT—Real Estate Investment Trust.
See accompanying Notes, which are an integral part of the Financial Statements.
38
Financials Index Fund
| |
| Statement of Operations |
| |
| Six Months Ended |
| February 28, 2010 |
| | ($000) |
| Investment Income | |
| Income | |
| Dividends | 4,672 |
| Security Lending | 110 |
| Total Income | 4,782 |
| Expenses | |
| The Vanguard Group—Note B | |
| Investment Advisory Services | 48 |
| Management and Administrative— | |
| Admiral Shares | 78 |
| Management and Administrative— | |
| ETF Shares | 427 |
| Marketing and Distribution— | |
| Admiral Shares | 7 |
| Marketing and Distribution— | |
| ETF Shares | 90 |
| Custodian Fees | 18 |
| Shareholders’ Reports—Admiral Shares | — |
| Shareholders’ Reports—ETF Shares | 60 |
| Trustees’ Fees and Expenses | 1 |
| Total Expenses | 729 |
| Expenses Paid Indirectly | (5) |
| Net Expenses | 724 |
| Net Investment Income | 4,058 |
| Realized Net Gain (Loss) on | |
| Investment Securities Sold | (16,418) |
| Change in Unrealized Appreciation | |
| (Depreciation) of Investment Securities | 24,497 |
| Net Increase (Decrease) in Net Assets | |
| Resulting from Operations | 12,137 |
| | |
| Statement of Changes in Net Assets | | |
| |
| | Six Months Ended | Year Ended |
| | February 28, | August 31, |
| | 2010 | 2009 |
| | ($000) | ($000) |
| Increase (Decrease) in Net Assets | | |
| Operations | | |
| Net Investment Income | 4,058 | 14,751 |
| Realized Net Gain (Loss) | (16,418) | (140,463) |
| Change in Unrealized Appreciation (Depreciation) | 24,497 | (46,975) |
| Net Increase (Decrease) in Net Assets Resulting from Operations | 12,137 | (172,687) |
| Distributions | | |
| Net Investment Income | | |
| Admiral Shares | (763) | (1,971) |
| ETF Shares | (5,771) | (14,745) |
| Realized Capital Gain | | |
| Admiral Shares | — | — |
| ETF Shares | — | — |
| Total Distributions | (6,534) | (16,716) |
| Capital Share Transactions | | |
| Admiral Shares | (6,295) | 13,533 |
| ETF Shares | (109,373) | 96,692 |
| Net Increase (Decrease) from Capital Share Transactions | (115,668) | 110,225 |
| Total Increase (Decrease) | (110,065) | (79,178) |
| Net Assets | | |
| Beginning of Period | 653,534 | 732,712 |
| End of Period1 | 543,469 | 653,534 |
1 Net Assets—End of Period includes undistributed (overdistributed) net investment income of ($540,000) and $1,936,000.
See accompanying Notes, which are an integral part of the Financial Statements.
39
| | | | | | | |
| Financials Index Fund | | | | | | | |
| |
| |
| Financial Highlights | | | | | | |
| |
| Admiral Shares | | | | | | | |
| | Six Months | | | | | |
| | | Ended | | | | | |
| For a Share Outstanding | February 28, | | | | Year Ended August 31, |
| Throughout Each Period | | 2010 | 2009 | 2008 | 2007 | 2006 | 2005 |
| Net Asset Value, Beginning of Period | $14.72 | $20.38 | $30.10 | $29.86 | $26.36 | $25.35 |
| Investment Operations | | | | | | | |
| Net Investment Income | | .098 | .389 | .7001 | .7701 | .7161 | .6601 |
| Net Realized and Unrealized Gain (Loss) | | | | | | |
| on Investments2 | | .279 | (5.596) | (9.699) | .145 | 3.392 | 1.086 |
| Total from Investment Operations | .377 | (5.207) | (8.999) | .915 | 4.108 | 1.746 |
| Distributions | | | | | | | |
| Dividends from Net Investment Income | (.157) | (.453) | (.721) | (.675) | (.608) | (.736) |
| Distributions from Realized Capital Gains | — | — | — | — | — | — |
| Total Distributions | | (.157) | (.453) | (.721) | (.675) | (.608) | (.736) |
| Net Asset Value, End of Period | | $14.94 | $14.72 | $20.38 | $30.10 | $29.86 | $26.36 |
| |
| Total Return3 | | 2.58% | –25.35% | –30.36% | 2.95% | 15.76% | 6.88% |
| |
| Ratios/Supplemental Data | | | | | | | |
| Net Assets, End of Period (Millions) | $69 | $74 | $81 | $19 | $8 | $3 |
| Ratio of Total Expenses to | | | | | | | |
| Average Net Assets | | 0.26%5 | 0.28% | 0.25% | 0.26% | 0.28% | 0.28% |
| Ratio of Net Investment Income to | | | | | | |
| Average Net Assets | | 1.48%5 | 2.97% | 3.06% | 2.37% | 2.49% | 2.59% |
| Portfolio Turnover Rate4 | | 12%5 | 17% | 10% | 12% | 6% | 6% |
1 Calculated based on average shares outstanding.
2 Includes increases from redemption fees of $.00, $.01, $.00, $.00, $.01, and $.00.
3 Total returns do not reflect the 2% fee assessed on redemptions of shares held for less than one year.
4 Excludes the value of portfolio securities received or delivered as a result of in-kind purchases or redemptions of the fund’s capital shares, including ETF Creation Units.
5 Annualized.
See accompanying Notes, which are an integral part of the Financial Statements.
40
| | | | | | | |
| Financials Index Fund | | | | | | | |
| |
| |
| Financial Highlights | | | | | | |
| |
| ETF Shares | | | | | | | |
| | Six Months | | | | | |
| | | Ended | | | | | |
| For a Share Outstanding | February 28, | | | | Year Ended August 31, |
| Throughout Each Period | | 2010 | 2009 | 2008 | 2007 | 2006 | 2005 |
| Net Asset Value, Beginning of Period | $29.38 | $40.66 | $60.04 | $59.57 | $52.57 | $50.57 |
| Investment Operations | | | | | | | |
| Net Investment Income | | .200 | .784 | 1.4491 | 1.5571 | 1.4301 | 1.3161 |
| Net Realized and Unrealized Gain (Loss) | | | | | | |
| on Investments2 | | .556 | (11.150) | (19.368) | .282 | 6.800 | 2.160 |
| Total from Investment Operations | .756 | (10.366) | (17.919) | 1.839 | 8.230 | 3.476 |
| Distributions | | | | | | | |
| Dividends from Net Investment Income | (.316) | (.914) | (1.461) | (1.369) | (1.230) | (1.476) |
| Distributions from Realized Capital Gains | — | — | — | — | — | — |
| Total Distributions | | (.316) | (.914) | (1.461) | (1.369) | (1.230) | (1.476) |
| Net Asset Value, End of Period | | $29.82 | $29.38 | $40.66 | $60.04 | $59.57 | $52.57 |
| |
| Total Return | | 2.59% | –25.31% | –30.30% | 2.97% | 15.82% | 6.85% |
| |
| Ratios/Supplemental Data | | | | | | | |
| Net Assets, End of Period (Millions) | $475 | $580 | $651 | $282 | $125 | $53 |
| Ratio of Total Expenses to | | | | | | | |
| Average Net Assets | | 0.23%4 | 0.25% | 0.20% | 0.22% | 0.25% | 0.26% |
| Ratio of Net Investment Income to | | | | | | |
| Average Net Assets | | 1.51%4 | 3.00% | 3.11% | 2.41% | 2.52% | 2.61% |
| Portfolio Turnover Rate3 | | 12%4 | 17% | 10% | 12% | 6% | 6% |
1 Calculated based on average shares outstanding.
2 Includes increases from redemption fees of $.00, $.02, $.01, $.01, $.01, and $.00.
3 Excludes the value of portfolio securities received or delivered as a result of in-kind purchases or redemptions of the fund’s capital shares, including ETF Creation Units.
4 Annualized.
See accompanying Notes, which are an integral part of the Financial Statements.
41
Financials Index Fund
Notes to Financial Statements
Vanguard Financials Index Fund is registered under the Investment Company Act of 1940 as an open-end investment company, or mutual fund. The fund offers two classes of shares, Admiral Shares and ETF Shares. Admiral Shares are available to any investor who meets the fund’s minimum purchase requirements. ETF Shares are listed for trading on the NYSE Arca, Inc.; they can be purchased and sold through a broker.
A. The following significant accounting policies conform to generally accepted accounting principles for U.S. mutual funds. The fund consistently follows such policies in preparing its financial statements.
1. Security Valuation: Securities are valued as of the close of trading on the New York Stock Exchange (generally 4 p.m., Eastern time) on the valuation date. Equity securities are valued at the latest quoted sales prices or official closing prices taken from the primary market in which each security trades; such securities not traded on the valuation date are valued at the mean of the latest quoted bid and asked prices. Securities for which market quotations are not readily available, or whose values have been materially affected by events occurring before the fund’s pricing time but after the close of the securities’ primary markets, are valued by methods deemed by the board of trustees to represent fair value. Investments in Vanguard Market Liquidity Fund are valued at that fund’s net asset value.
2. Federal Income Taxes: The fund intends to continue to qualify as a regulated investment company and distribute all of its taxable income. Management has analyzed the fund’s tax positions taken for all open federal income tax years (August 31, 2006–2009), and for the period ended February 28, 2010, and has concluded that no provision for federal income tax is required in the fund’s financial statements.
3. Distributions: Distributions to shareholders are recorded on the ex-dividend date.
4. Security Lending: The fund may lend its securities to qualified institutional borrowers to earn additional income. Security loans are required to be secured at all times by collateral at least equal to the market value of securities loaned. The fund invests cash collateral received in Vanguard Market Liquidity Fund, and records a liability for the return of the collateral, during the period the securities are on loan. Security lending income represents the income earned on investing cash collateral, less expenses associated with the loan.
5. Other: Dividend income is recorded on the ex-dividend date. Interest income includes income distributions received from Vanguard Market Liquidity Fund and is accrued daily. Security transactions are accounted for on the date securities are bought or sold. Costs used to determine realized gains (losses) on the sale of investment securities are those of the specific securities sold. Fees assessed on redemptions of capital shares are credited to paid-in capital.
Each class of shares has equal rights as to assets and earnings, except that each class separately bears certain class-specific expenses related to maintenance of shareholder accounts (included in Management and Administrative expenses) and shareholder reporting. Marketing and distribution expenses are allocated to each class of shares based on a method approved by the board of trustees. Income, other non-class-specific expenses, and gains and losses on investments are allocated to each class of shares based on its relative net assets.
B. The Vanguard Group furnishes at cost investment advisory, corporate management, administrative, marketing, and distribution services. The costs of such services are allocated to the fund under methods approved by the board of trustees. The fund has committed to provide up to 0.40% of its net assets in capital contributions to Vanguard. At February 28, 2010, the fund had contributed capital of $112,000 to Vanguard (included in Other Assets), representing 0.02% of the fund’s net assets and 0.04% of Vanguard’s capitalization. The fund’s trustees and officers are also directors and officers of Vanguard.
C. The fund’s custodian bank has agreed to reduce its fees when the fund maintains cash on deposit in the non-interest-bearing custody account. For the six months ended February 28, 2010, custodian fee offset arrangements reduced the fund’s expenses by $5,000 (an annual rate of 0.00% of average net assets).
42
Financials Index Fund
D. Various inputs may be used to determine the value of the fund’s investments. These inputs are summarized in three broad levels for financial statement purposes. The inputs or methodologies used to value securities are not necessarily an indication of the risk associated with investing in those securities.
Level 1—Quoted prices in active markets for identical securities.
Level 2—Other significant observable inputs (including quoted prices for similar securities, interest rates, prepayment speeds, credit risk, etc.).
Level 3—Significant unobservable inputs (including the fund’s own assumptions used to determine the fair value of investments).
At February 28, 2010, 100% of the fund’s investments were valued based on Level 1 inputs.
E. Distributions are determined on a tax basis and may differ from net investment income and realized capital gains for financial reporting purposes. Differences may be permanent or temporary. Permanent differences are reclassified among capital accounts in the financial statements to reflect their tax character. Temporary differences arise when certain items of income, expense, gain, or loss are recognized in different periods for financial statement and tax purposes; these differences will reverse at some time in the future. Differences in classification may also result from the treatment of short-term gains as ordinary income for tax purposes.
During the six months ended February 28, 2010, the fund realized $27,196,000 of net capital gains resulting from in-kind redemptions—in which shareholders exchanged fund shares for securities held by the fund rather than for cash. Because such gains are not taxable to the fund, and are not distributed to shareholders, they have been reclassified from accumulated net realized losses to paid-in capital.
The fund’s tax-basis capital gains and losses are determined only at the end of each fiscal year. For tax purposes, at August 31, 2009, the fund had available capital loss carryforwards totaling $30,027,000 to offset future net capital gains of $85,000 through August 31, 2014, $11,000 through August 31, 2015, $1,313,000 through August 31, 2016, and $28,618,000 through August 31, 2017. In addition, the fund realized losses of $118,026,000 during the period from November 1, 2008, through August 31, 2009, which are deferred and will be treated as realized for tax purposes in fiscal 2010. The fund will use these capital losses to offset net taxable capital gains, if any, realized during the year ending August 31, 2010; should the fund realize net capital losses for the year, the losses will be added to the loss carryforward balances above.
At February 28, 2010, the cost of investment securities for tax purposes was $762,327,000. Net unrealized depreciation of investment securities for tax purposes was $217,596,000, consisting of unrealized gains of $4,550,000 on securities that had risen in value since their purchase and $222,146,000 in unrealized losses on securities that had fallen in value since their purchase.
F. During the six months ended February 28, 2010, the fund purchased $69,538,000 of investment securities and sold $186,528,000 of investment securities, other than temporary cash investments.
G. Capital share transactions for each class of shares were:
| | | | |
| | Six Months Ended | | Year Ended |
| | February 28, 2010 | August 31, 2009 |
| | Amount | Shares | Amount | Shares |
| | ($000) | (000) | ($000) | (000) |
| Admiral Shares | | | | |
| Issued | 6,373 | 434 | 39,058 | 3,069 |
| Issued in Lieu of Cash Distributions | 692 | 47 | 1,834 | 135 |
| Redeemed1 | (13,360) | (916) | (27,359) | (2,179) |
| Net Increase (Decrease)—Admiral Shares | (6,295) | (435) | 13,533 | 1,025 |
| ETF Shares | | | | |
| Issued | 32,071 | 1,100 | 342,606 | 13,213 |
| Issued in Lieu of Cash Distributions | — | — | — | — |
| Redeemed1 | (141,444) | (4,900) | (245,914) | (9,500) |
| Net Increase (Decrease)—ETF Shares | (109,373) | (3,800) | 96,692 | 3,713 |
| 1 Net of redemption fees for fiscal 2010 and 2009 of $85,000 and $383,000, respectively (fund totals). | | |
H. In preparing the financial statements as of February 28, 2010, management considered the impact of subsequent events for potential recognition or disclosure in these financial statements.
43
Health Care Index Fund
Fund Profile
| | | |
| Portfolio Characteristics | | |
| | | Target | Broad |
| | Fund | Index1 | Index2 |
| Number of Stocks | 306 | 307 | 2,492 |
| Median Market Cap | $39.5B | $39.5B | $29.0B |
| Price/Earnings Ratio | 16.3x | 16.2x | 21.2x |
| Price/Book Ratio | 2.8x | 2.8x | 2.1x |
| Yield3 | | 1.7% | 1.9% |
| Admiral Shares | 1.1% | | |
| ETF Shares | 1.2% | | |
| Return on Equity | 19.3% | 19.3% | 19.4% |
| Earnings Growth Rate | 12.5% | 12.5% | 8.1% |
| Foreign Holdings | 0.0% | 0.0% | 0.0% |
| Turnover Rate4 | 10% | — | — |
| Expense Ratio5 | | — | — |
| Admiral Shares | 0.28% | | |
| ETF Shares | 0.25% | | |
| Short-Term Reserves | 0.3% | — | — |
| | |
| Volatility Measures6 | |
| | Fund Versus | Fund Versus |
| | Target Index1 | Broad Index2 |
| R-Squared | 1.00 | 0.68 |
| Beta | 1.00 | 0.70 |
| |
| Subindustry Diversification | |
| (% of equity exposure) | |
| Biotechnology | 14.7% |
| Health Care Distributors | 3.2 |
| Health Care Equipment | 17.8 |
| Health Care Facilities | 1.4 |
| Health Care Services | 6.6 |
| Health Care Supplies | 1.2 |
| Life Sciences Tools & Services | 4.6 |
| Managed Health Care | 7.2 |
| Pharmaceuticals | 42.5 |
| Other Health Care | 0.8 |
| |
| Ten Largest Holdings7 (% of total net assets) |
| Johnson & Johnson | 11.3% |
| Pfizer Inc. | 9.2 |
| Merck & Co. Inc. | 7.3 |
| Abbott Laboratories | 5.5 |
| Amgen Inc. | 3.7 |
| Medtronic Inc. | 3.1 |
| Gilead Sciences Inc. | 2.8 |
| Bristol-Myers Squibb Co. | 2.7 |
| UnitedHealth Group Inc. | 2.6 |
| Eli Lilly & Co. | 2.3 |
| Top Ten | 50.5% |
1 MSCI US IMI/Health Care.
2 MSCI US IMI/2500.
3 30-day SEC yield for the fund; annualized dividend yield for the indexes. See the Glossary.
4 Annualized.
5 The expense ratios shown are from the prospectuses dated December 28, 2009, and represent estimated costs for the current fiscal year based on the fund’s net assets as of the prospectus date. For the six months ended February 28, 2010, the annualized expense ratios were 0.26% for Admiral Shares and 0.23% for ETF Shares.
6 For an explanation of R-squared, beta, and other terms used here, see the Glossary.
7 The holdings listed exclude any temporary cash investments and equity index products.
44
Health Care Index Fund
Performance Summary
All of the returns in this report represent past performance, which is not a guarantee of future results that may be achieved by the fund. (Current performance may be lower or higher than the performance data cited. For performance data current to the most recent month-end, visit our website at www.vanguard.com/performance.) Note, too, that both investment returns and principal value can fluctuate widely, so an investor’s shares, when sold, could be worth more or less than their original cost. The returns shown do not reflect taxes that a shareholder would pay on fund distributions or on the sale of fund shares.
Fiscal-Year Total Returns (%): January 26, 2004–February 28, 2010
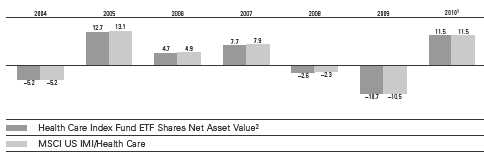
Average Annual Total Returns: Periods Ended December 31, 2009
This table presents average annual total returns through the latest calendar quarter—rather than through the end of the fiscal period. Securities and Exchange Commission rules require that we provide this information.
| | | | |
| | | | | Since |
| | Inception Date | One Year | Five Years | Inception |
| ETF Shares | 1/26/2004 | | | |
| Market Price | | 21.90% | 3.01% | 2.49% |
| Net Asset Value | | 22.01 | 3.04 | 2.49 |
| Admiral Shares3 | 2/5/2004 | 21.99 | 3.00 | 2.45 |
1 Six months ended February 28, 2010.
2 For more information about how the ETF Shares’ market prices have compared with their net asset value, visit www.vanguard.com, select your ETF, and then select the Performance tab. The Premium/Discount table there shows the percentages of days on which the ETF Shares’ market price was above or below the NAV.
3 Total returns do not reflect the 2% fee assessed on redemptions of shares held for less than one year.
See Financial Highlights for dividend and capital gains information.
45
Health Care Index Fund
Financial Statements (unaudited)
Statement of Net Assets
As of February 28, 2010
The fund reports a complete list of its holdings in regulatory filings four times in each fiscal year, at the quarter-ends. For the second and fourth fiscal quarters, the lists appear in the fund’s semiannual and annual reports to shareholders. For the first and third fiscal quarters, the fund files the lists with the Securities and Exchange Commission on Form N-Q. Shareholders can look up the fund’s Forms N-Q on the SEC’s website at www.sec.gov. Forms N-Q may also be reviewed and copied at the SEC’s Public Reference Room (see the back cover of this report for further information).
| | | |
| | | | Market |
| | | | Value• |
| | | Shares | ($000) |
| Common Stocks (100.0%) | | |
| Biotechnology (14.7%) | | |
| * | Amgen Inc. | 473,281 | 26,792 |
| * | Gilead Sciences Inc. | 420,865 | 20,037 |
| * | Celgene Corp. | 214,948 | 12,794 |
| * | Biogen Idec Inc. | 135,263 | 7,441 |
| * | Genzyme Corp. | 124,114 | 7,099 |
| * | Vertex Pharmaceuticals Inc. | 89,969 | 3,654 |
| * | Cephalon Inc. | 35,007 | 2,404 |
| * | Human Genome | | |
| | Sciences Inc. | 84,487 | 2,378 |
| * | Alexion Pharmaceuticals Inc. | 41,491 | 2,055 |
| * | Dendreon Corp. | 61,052 | 1,907 |
| * | United Therapeutics Corp. | 22,654 | 1,301 |
| * | Amylin Pharmaceuticals Inc. | 66,352 | 1,254 |
| * | Myriad Genetics Inc. | 45,050 | 1,036 |
| * | OSI Pharmaceuticals Inc. | 27,183 | 1,006 |
| * | BioMarin Pharmaceutical Inc. | 47,174 | 943 |
| * | Onyx Pharmaceuticals Inc. | 29,020 | 806 |
| * | Regeneron | | |
| | Pharmaceuticals Inc. | 29,302 | 717 |
| * | Cubist Pharmaceuticals Inc. | 27,120 | 571 |
| * | Incyte Corp. Ltd. | 49,942 | 532 |
| * | Acorda Therapeutics Inc. | 17,603 | 531 |
| * | Alkermes Inc. | 43,729 | 501 |
| * | Medivation Inc. | 13,199 | 475 |
| * | Savient Pharmaceuticals Inc. | 31,161 | 420 |
| * | Cepheid Inc. | 27,413 | 414 |
| * | Seattle Genetics Inc. | 39,963 | 408 |
| | PDL BioPharma Inc. | 55,436 | 388 |
| * | Isis Pharmaceuticals Inc. | 43,264 | 382 |
| * | Exelixis Inc. | 49,725 | 322 |
| * | MannKind Corp. | 31,686 | 317 |
| * | InterMune Inc. | 22,567 | 310 |
| * | Martek Biosciences Corp. | 15,388 | 305 |
| * | Alnylam Pharmaceuticals Inc. | 16,448 | 287 |
| * | Allos Therapeutics Inc. | 36,501 | 284 |
| * | Pharmasset Inc. | 13,313 | 282 |
| * | Theravance Inc. | 22,390 | 244 |
| * | Momenta | | |
| | Pharmaceuticals Inc. | 16,475 | 241 |
| * | Geron Corp. | 43,196 | 240 |
| * | Celera Corp. | 38,802 | 232 |
| * | Enzon Pharmaceuticals Inc. | 21,551 | 200 |
| * | Facet Biotech Corp. | 11,486 | 188 |
| * | Halozyme Therapeutics Inc. | 34,137 | 187 |
| * | Cell Therapeutics Inc. | 264,714 | 177 |
| * | Rigel Pharmaceuticals Inc. | 23,381 | 177 |
| * | Targacept Inc. | 9,055 | 172 |
| * | Immunogen Inc. | 25,734 | 170 |
| * | Affymax Inc. | 8,820 | 165 |
| * | Micromet Inc. | 21,252 | 158 |
| * | Clinical Data Inc. | 7,509 | 137 |
| * | Protalix BioTherapeutics Inc. | 20,062 | 136 |
| * | Zymogenetics Inc. | 25,195 | 135 |
| * | Arena Pharmaceuticals Inc. | 43,355 | 132 |
| | | |
| | | | Market |
| | | | Value• |
| | | Shares | ($000) |
| * | Nabi Biopharmaceuticals | 24,126 | 126 |
| * | Abraxis Bioscience Inc. | 3,811 | 123 |
| * | Genomic Health Inc. | 6,850 | 123 |
| * | Dyax Corp. | 33,167 | 116 |
| * | Lexicon Pharmaceuticals Inc. | 56,657 | 101 |
| * | Sangamo Biosciences Inc. | 19,143 | 96 |
| * | Emergent Biosolutions Inc. | 6,475 | 95 |
| * | SIGA Technologies Inc. | 14,294 | 95 |
| * | Ligand Pharmaceuticals Inc. | | |
| | Class B | 48,742 | 86 |
| * | Orexigen Therapeutics Inc. | 12,720 | 80 |
| * | NPS Pharmaceuticals Inc. | 22,523 | 75 |
| * | Opko Health Inc. | 36,015 | 72 |
| * | Arqule Inc. | 20,137 | 66 |
| * | Progenics | | |
| | Pharmaceuticals Inc. | 14,785 | 64 |
| * | Osiris Therapeutics Inc. | 7,807 | 64 |
| * | Maxygen Inc. | 10,810 | 58 |
| * | Biospecifics | | |
| | Technologies Corp. | 1,914 | 55 |
| * | Myriad Pharmaceuticals Inc. | 11,352 | 55 |
| * | XOMA Ltd. | 107,862 | 51 |
| * | Cel-Sci Corp. | 72,420 | 49 |
| * | Idenix Pharmaceuticals Inc. | 15,831 | 43 |
| * | OncoGenex | | |
| | Pharmaceutical Inc. | 2,475 | 41 |
| * | GTx Inc. | 7,427 | 30 |
| | | | 105,208 |
| Health Care Equipment & Supplies (18.9%) | |
| | Medtronic Inc. | 517,608 | 22,464 |
| | Baxter International Inc. | 281,909 | 16,049 |
| | Covidien PLC | 233,544 | 11,472 |
| | Becton Dickinson and Co. | 110,967 | 8,641 |
| | Stryker Corp. | 139,506 | 7,408 |
| * | Intuitive Surgical Inc. | 17,867 | 6,202 |
| * | St. Jude Medical Inc. | 156,327 | 5,975 |
| * | Zimmer Holdings Inc. | 99,654 | 5,713 |
| * | Boston Scientific Corp. | 706,283 | 5,467 |
| * | Hospira Inc. | 75,846 | 3,969 |
| | CR Bard Inc. | 45,184 | 3,785 |
| * | Varian Medical Systems Inc. | 58,228 | 2,851 |
| * | Edwards Lifesciences Corp. | 26,437 | 2,428 |
| | DENTSPLY International Inc. | 67,621 | 2,238 |
| * | CareFusion Corp. | 87,717 | 2,214 |
| | Beckman Coulter Inc. | 32,346 | 2,121 |
| * | Hologic Inc. | 120,698 | 2,082 |
| * | ResMed Inc. | 35,135 | 2,005 |
| * | IDEXX Laboratories Inc. | 27,346 | 1,444 |
| * | Inverness Medical | | |
| | Innovations Inc. | 36,811 | 1,436 |
| * | Kinetic Concepts Inc. | 29,907 | 1,254 |
| | Teleflex Inc. | 18,569 | 1,132 |
| * | Gen-Probe Inc. | 22,820 | 1,029 |
| | STERIS Corp. | 27,545 | 871 |
| | Cooper Cos. Inc. | 20,957 | 840 |
| * | Thoratec Corp. | 26,655 | 769 |
| | | |
| | | | Market |
| | | | Value• |
| | | Shares | ($000) |
| | Hill-Rom Holdings Inc. | 27,584 | 724 |
| * | NuVasive Inc. | 17,931 | 716 |
| * | Sirona Dental Systems Inc. | 19,274 | 692 |
| * | Haemonetics Corp. | 11,908 | 637 |
| * | Immucor Inc. | 32,674 | 632 |
| * | American Medical | | |
| | Systems Holdings Inc. | 34,817 | 631 |
| * | Masimo Corp. | 22,686 | 628 |
| | West Pharmaceutical | | |
| | Services Inc. | 15,492 | 603 |
| * | Align Technology Inc. | 29,534 | 535 |
| * | ev3 Inc. | 31,126 | 453 |
| | Meridian Bioscience Inc. | 18,776 | 416 |
| * | Volcano Corp. | 20,188 | 416 |
| * | Integra LifeSciences | | |
| | Holdings Corp. | 9,888 | 394 |
| | Invacare Corp. | 13,655 | 372 |
| * | Conmed Corp. | 13,768 | 301 |
| * | Wright Medical Group Inc. | 17,869 | 301 |
| * | Conceptus Inc. | 14,461 | 284 |
| * | Abaxis Inc. | 10,306 | 262 |
| * | Zoll Medical Corp. | 9,993 | 259 |
| * | Orthofix International NV | 7,386 | 252 |
| | Analogic Corp. | 6,048 | 250 |
| * | Neogen Corp. | 9,889 | 240 |
| * | Cyberonics Inc. | 13,021 | 232 |
| * | Insulet Corp. | 14,641 | 215 |
| * | ICU Medical Inc. | 6,241 | 214 |
| * | Greatbatch Inc. | 10,880 | 212 |
| * | DexCom Inc. | 21,916 | 198 |
| * | Merit Medical Systems Inc. | 12,434 | 183 |
| * | Natus Medical Inc. | 13,528 | 182 |
| * | Angiodynamics Inc. | 11,041 | 179 |
| * | Quidel Corp. | 12,700 | 166 |
| * | SonoSite Inc. | 5,477 | 162 |
| * | ABIOMED Inc. | 14,658 | 148 |
| * | Symmetry Medical Inc. | 16,784 | 144 |
| * | Accuray Inc. | 21,020 | 142 |
| * | SurModics Inc. | 7,013 | 135 |
| | Atrion Corp. | 833 | 130 |
| | Cantel Medical Corp. | 6,620 | 129 |
| * | Orthovita Inc. | 32,054 | 123 |
| * | OraSure Technologies Inc. | 21,178 | 116 |
| * | Kensey Nash Corp. | 4,738 | 105 |
| * | MAKO Surgical Corp. | 7,636 | 101 |
| * | Somanetics Corp. | 5,741 | 97 |
| * | RTI Biologics Inc. | 25,734 | 96 |
| * | IRIS International Inc. | 8,346 | 96 |
| * | Electro-Optical Sciences Inc. | 9,395 | 92 |
| * | CryoLife Inc. | 12,436 | 88 |
| * | Stereotaxis Inc. | 17,932 | 85 |
| * | Synovis Life Technologies Inc. | 5,507 | 77 |
| * | Exactech Inc. | 3,762 | 73 |
| * | Palomar Medical | | |
| | Technologies Inc. | 7,985 | 72 |
| * | ATS Medical Inc. | 22,172 | 59 |
46
Health Care Index Fund
| | | |
| | | | Market |
| | | | Value• |
| | | Shares | ($000) |
| * | TomoTherapy Inc. | 17,132 | 57 |
| * | Cynosure Inc. Class A | 4,631 | 46 |
| * | Hansen Medical Inc. | 14,175 | 32 |
| | | | 136,043 |
| Health Care Providers & Services (18.4%) | |
| | UnitedHealth Group Inc. | 543,369 | 18,399 |
| * | Medco Health | | |
| | Solutions Inc. | 222,980 | 14,101 |
| * | WellPoint Inc. | 214,329 | 13,261 |
| * | Express Scripts Inc. | 122,056 | 11,719 |
| | McKesson Corp. | 125,381 | 7,416 |
| | Aetna Inc. | 202,778 | 6,081 |
| | Cardinal Health Inc. | 169,652 | 5,763 |
| | CIGNA Corp. | 127,924 | 4,383 |
| | Quest Diagnostics Inc. | 73,488 | 4,170 |
| | AmerisourceBergen Corp. | | |
| | Class A | 134,766 | 3,779 |
| * | Humana Inc. | 79,449 | 3,760 |
| * | Laboratory Corp. of | | |
| | America Holdings | 49,666 | 3,641 |
| * | DaVita Inc. | 47,787 | 2,944 |
| * | Henry Schein Inc. | 42,344 | 2,406 |
| * | Coventry Health Care Inc. | 69,401 | 1,609 |
| | Omnicare Inc. | 55,612 | 1,505 |
| * | Community Health | | |
| | Systems Inc. | 43,489 | 1,490 |
| | Universal Health | | |
| | Services Inc. Class B | 42,581 | 1,321 |
| * | Lincare Holdings Inc. | 31,933 | 1,282 |
| * | Patterson Cos. Inc. | 42,945 | 1,275 |
| * | Tenet Healthcare Corp. | 225,065 | 1,186 |
| * | Mednax Inc. | 21,806 | 1,167 |
| * | Health Net Inc. | 48,636 | 1,123 |
| * | VCA Antech Inc. | 40,069 | 954 |
| | Owens & Minor Inc. | 19,639 | 877 |
| * | Health Management | | |
| | Associates Inc. Class A | 116,158 | 847 |
| * | Amedisys Inc. | 13,126 | 757 |
| * | Healthsouth Corp. | 43,502 | 753 |
| * | LifePoint Hospitals Inc. | 24,374 | 743 |
| * | Magellan Health | | |
| | Services Inc. | 16,308 | 684 |
| * | Emergency Medical | | |
| | Services Corp. Class A | 13,069 | 680 |
| * | Catalyst Health Solutions Inc. | 17,601 | 663 |
| * | AMERIGROUP Corp. | 23,725 | 624 |
| * | Brookdale Senior Living Inc. | 32,968 | 593 |
| * | PSS World Medical Inc. | 27,595 | 582 |
| * | HMS Holdings Corp. | 12,412 | 571 |
| | Chemed Corp. | 10,609 | 568 |
| * | Psychiatric Solutions Inc. | 24,760 | 531 |
| * | WellCare Health Plans Inc. | 19,609 | 524 |
| * | Healthspring Inc. | 22,642 | 417 |
| * | Centene Corp. | 22,379 | 400 |
| * | Gentiva Health Services Inc. | 12,804 | 355 |
| * | Kindred Healthcare Inc. | 18,215 | 317 |
| * | RehabCare Group Inc. | 10,998 | 306 |
| * | Amsurg Corp. Class A | 14,217 | 294 |
| * | Hanger Orthopedic | | |
| | Group Inc. | 15,013 | 280 |
| * | Odyssey HealthCare Inc. | 15,578 | 273 |
| | Landauer Inc. | 4,382 | 266 |
| * | Genoptix Inc. | 8,089 | 263 |
| * | PharMerica Corp. | 14,268 | 245 |
| * | Healthways Inc. | 15,785 | 237 |
| * | LHC Group Inc. | 7,788 | 234 |
| * | inVentiv Health Inc. | 15,933 | 234 |
| | | |
| | | | Market |
| | | | Value• |
| | | Shares | ($000) |
| * | Universal American Corp. | 15,959 | 230 |
| * | MWI Veterinary Supply Inc. | 5,419 | 223 |
| * | Bio-Reference Labs Inc. | 5,567 | 221 |
| * | IPC The Hospitalist Co. Inc. | 6,425 | 212 |
| * | Sun Healthcare Group Inc. | 20,429 | 182 |
| * | Emeritus Corp. | 10,122 | 178 |
| * | Triple-S Management Corp. | | |
| | Class B | 9,599 | 166 |
| * | Almost Family Inc. | 3,932 | 142 |
| * | AMN Healthcare | | |
| | Services Inc. | 15,313 | 141 |
| * | Air Methods Corp. | 5,139 | 137 |
| * | Molina Healthcare Inc. | 6,125 | 131 |
| * | Corvel Corp. | 4,062 | 131 |
| * | Cross Country | | |
| | Healthcare Inc. | 13,139 | 129 |
| * | Assisted Living | | |
| | Concepts Inc. Class A | 4,665 | 129 |
| | National Healthcare Corp. | 3,207 | 118 |
| * | Res-Care Inc. | 11,792 | 108 |
| | Ensign Group Inc. | 5,415 | 90 |
| * | Sunrise Senior Living Inc. | 21,757 | 86 |
| * | Chindex International Inc. | 6,134 | 69 |
| * | Skilled Healthcare Group Inc. | 9,382 | 61 |
| * | Alliance HealthCare | | |
| | Services Inc. | 11,803 | 59 |
| * | Medcath Corp. | 7,585 | 51 |
| * | Clarient Inc. | 21,239 | 45 |
| * | CardioNet Inc. | 6,337 | 38 |
| * | Virtual Radiologic Corp. | 3,333 | 33 |
| * | Nighthawk Radiology | | |
| | Holdings Inc. | 11,111 | 33 |
| | | | 131,996 |
| Health Care Technology (0.8%) | | |
| * | Cerner Corp. | 32,458 | 2,692 |
| * | Allscripts-Misys Healthcare | | |
| | Solutions Inc. | 30,254 | 541 |
| | Quality Systems Inc. | 8,731 | 500 |
| * | Eclipsys Corp. | 26,669 | 496 |
| * | athenahealth Inc. | 10,249 | 378 |
| * | MedAssets Inc. | 12,922 | 280 |
| * | Phase Forward Inc. | 19,993 | 238 |
| * | Omnicell Inc. | 14,127 | 191 |
| | Computer Programs & | | |
| | Systems Inc. | 4,648 | 167 |
| * | Medidata Solutions Inc. | 7,578 | 117 |
| * | Vital Images Inc. | 6,537 | 104 |
| | | | 5,704 |
| Life Sciences Tools & Services (4.6%) | |
| * | Thermo Fisher | | |
| | Scientific Inc. | 190,990 | 9,315 |
| * | Life Technologies Corp. | 83,481 | 4,238 |
| * | Waters Corp. | 44,280 | 2,642 |
| * | Millipore Corp. | 25,973 | 2,452 |
| * | Illumina Inc. | 58,563 | 2,127 |
| * | Covance Inc. | 29,836 | 1,689 |
| * | Mettler-Toledo | | |
| | International Inc. | 15,800 | 1,571 |
| | PerkinElmer Inc. | 54,617 | 1,213 |
| * | Charles River Laboratories | | |
| | International Inc. | 30,701 | 1,164 |
| | Techne Corp. | 16,589 | 1,060 |
| | Pharmaceutical Product | | |
| | Development Inc. | 49,811 | 1,049 |
| * | Bio-Rad Laboratories Inc. | | |
| | Class A | 8,836 | 825 |
| * | Varian Inc. | 13,653 | 706 |
| | | | |
| | | | | Market |
| | | | | Value• |
| | | | Shares | ($000) |
| * | Dionex Corp. | | 8,207 | 561 |
| * | Parexel International Corp. | | 27,282 | 550 |
| * | Bruker Corp. | | 30,415 | 380 |
| * | AMAG Pharmaceuticals Inc. | 9,777 | 373 |
| * | Luminex Corp. | | 18,225 | 267 |
| * | Affymetrix Inc. | | 33,074 | 242 |
| * | Sequenom Inc. | | 27,582 | 178 |
| * | eResearchTechnology Inc. | | 19,515 | 118 |
| * | Kendle International Inc. | | 6,720 | 114 |
| * | Albany Molecular | | | |
| | Research Inc. | | 10,520 | 94 |
| * | Enzo Biochem Inc. | | 15,476 | 81 |
| | | | | 33,009 |
| Pharmaceuticals (42.6%) | | | |
| | Johnson & Johnson | 1,290,081 | 81,275 |
| | Pfizer Inc. | 3,773,102 | 66,218 |
| | Merck & Co. Inc. | 1,428,221 | 52,673 |
| | Abbott Laboratories | | 723,245 | 39,258 |
| | Bristol-Myers Squibb Co. | | 800,455 | 19,619 |
| | Eli Lilly & Co. | | 483,559 | 16,605 |
| | Allergan Inc./United States | | 142,118 | 8,304 |
| * | Forest Laboratories Inc. | | 141,170 | 4,218 |
| * | Mylan Inc. | | 142,966 | 3,051 |
| * | Watson Pharmaceuticals Inc. | 47,162 | 1,877 |
| | Perrigo Co. | | 36,342 | 1,801 |
| * | Warner Chilcott PLC | | | |
| | Class A | | 52,741 | 1,436 |
| * | Valeant Pharmaceuticals | | | |
| | International | | 36,178 | 1,347 |
| * | King Pharmaceuticals Inc. | | 116,088 | 1,306 |
| * | Endo Pharmaceuticals | | | |
| | Holdings Inc. | | 54,592 | 1,242 |
| * | Salix Pharmaceuticals Ltd. | | 25,526 | 729 |
| * | Auxilium | | | |
| | Pharmaceuticals Inc. | | 22,068 | 666 |
| | Medicis | | | |
| | Pharmaceutical Corp. | | | |
| | Class A | | 27,893 | 628 |
| * | Nektar Therapeutics | | 43,637 | 541 |
| * | Viropharma Inc. | | 35,873 | 447 |
| * | Par Pharmaceutical Cos. Inc. | 16,057 | 402 |
| * | Impax Laboratories Inc. | | 24,200 | 373 |
| * | Vivus Inc. | | 35,853 | 301 |
| * | Inspire Pharmaceuticals Inc. | 33,221 | 205 |
| * | Medicines Co. | | 24,683 | 190 |
| * | Questcor | | | |
| | Pharmaceuticals Inc. | | 27,065 | 127 |
| * | XenoPort Inc. | | 12,951 | 104 |
| * | Cadence | | | |
| | Pharmaceuticals Inc. | | 11,991 | 103 |
| * | Pain Therapeutics Inc. | | 16,357 | 99 |
| * | Cypress Bioscience Inc. | | 17,848 | 93 |
| * | Durect Corp. | | 35,057 | 84 |
| * | MAP Pharmaceuticals Inc. | | 6,078 | 83 |
| * | Pozen Inc. | | 11,477 | 69 |
| * | KV Pharmaceutical Co. | | | |
| | Class A | | 15,802 | 50 |
| * | Akorn Inc. | | 26,277 | 40 |
| * | Caraco Pharmaceutical | | | |
| | Laboratories Ltd. | | 4,898 | 21 |
| * | Sucampo | | | |
| | Pharmaceuticals Inc. | | | |
| | Class A | | 3,574 | 12 |
| | | | | 305,597 |
| Total Common Stocks | | | |
| (Cost $780,259) | | | 717,557 |
47
Health Care Index Fund
| | |
| | | Market |
| | | Value• |
| | Shares | ($000) |
| Temporary Cash Investment (0.3%) | |
| Money Market Fund (0.3%) | |
| 1 Vanguard Market | | |
| Liquidity Fund, 0.163% | |
| (Cost $1,997) | 1,997,349 | 1,997 |
| Total Investments (100.3%) | |
| (Cost $782,256) | | 719,554 |
| Other Assets and Liabilities (–0.3%) | |
| Other Assets | | 3,766 |
| Liabilities | | (5,717) |
| | | (1,951) |
| Net Assets (100%) | | 717,603 |
| |
| At February 28, 2010, net assets consisted of: |
| | Amount |
| | ($000) |
| Paid-in Capital | 804,416 |
| Undistributed Net Investment Income | 1,140 |
| Accumulated Net Realized Losses | (25,251) |
| Unrealized Appreciation (Depreciation) | (62,702) |
| Net Assets | 717,603 |
| |
| Admiral Shares—Net Assets | |
| Applicable to 4,440,766 outstanding | |
| $.001 par value shares of beneficial | |
| interest (unlimited authorization) | 121,383 |
| Net Asset Value Per Share— | |
| Admiral Shares | $27.33 |
| |
| ETF Shares—Net Assets | |
| Applicable to 10,907,385 outstanding | |
| $.001 par value shares of beneficial | |
| interest (unlimited authorization) | 596,220 |
| Net Asset Value Per Share— | |
| ETF Shares | $54.66 |
• See Note A in Notes to Financial Statements.
* Non-income-producing security.
1 Affiliated money market fund available only to Vanguard funds and certain trusts and accounts managed by Vanguard. Rate shown is the 7-day yield.
See accompanying Notes, which are an integral part of the Financial Statements.
48
Health Care Index Fund
| |
| Statement of Operations |
| |
| Six Months Ended |
| February 28, 2010 |
| | ($000) |
| Investment Income | |
| Income | |
| Dividends | 14,113 |
| Interest1 | 1 |
| Security Lending | 7 |
| Total Income | 14,121 |
| Expenses | |
| The Vanguard Group—Note B | |
| Investment Advisory Services | 51 |
| Management and Administrative— | |
| Admiral Shares | 134 |
| Management and Administrative— | |
| ETF Shares | 501 |
| Marketing and Distribution— | |
| Admiral Shares | 8 |
| Marketing and Distribution— | |
| ETF Shares | 85 |
| Custodian Fees | 5 |
| Shareholders’ Reports—Admiral Shares | — |
| Shareholders’ Reports—ETF Shares | 38 |
| Trustees’ Fees and Expenses | 1 |
| Total Expenses | 823 |
| Net Investment Income | 13,298 |
| Realized Net Gain (Loss) on | |
| Investment Securities Sold | 4,549 |
| Change in Unrealized Appreciation | |
| (Depreciation) of Investment Securities | 56,531 |
| Net Increase (Decrease) in Net Assets | |
| Resulting from Operations | 74,378 |
Statement of Changes in Net Assets
| | |
| | Six Months Ended | Year Ended |
| | February 28, | August 31, |
| | 2010 | 2009 |
| | ($000) | ($000) |
| Increase (Decrease) in Net Assets | | |
| Operations | | |
| Net Investment Income | 13,298 | 11,142 |
| Realized Net Gain (Loss) | 4,549 | 7,908 |
| Change in Unrealized Appreciation (Depreciation) | 56,531 | (100,604) |
| Net Increase (Decrease) in Net Assets Resulting from Operations | 74,378 | (81,554) |
| Distributions | | |
| Net Investment Income | | |
| Admiral Shares | (3,211) | (1,658) |
| ETF Shares | (16,212) | (8,673) |
| Realized Capital Gain | | |
| Admiral Shares | — | — |
| ETF Shares | — | — |
| Total Distributions | (19,423) | (10,331) |
| Capital Share Transactions | | |
| Admiral Shares | 1,283 | (7,704) |
| ETF Shares | (3,708) | 14,318 |
| Net Increase (Decrease) from Capital Share Transactions | (2,425) | 6,614 |
| Total Increase (Decrease) | 52,530 | (85,271) |
| Net Assets | | |
| Beginning of Period | 665,073 | 750,344 |
| End of Period2 | 717,603 | 665,073 |
1 Interest income from an affiliated company of the fund was $1,000.
2 Net Assets—End of Period includes undistributed net investment income of $1,140,000 and $7,265,000.
See accompanying Notes, which are an integral part of the Financial Statements.
49
| | | | | | | |
| Health Care Index Fund | | | | | | | |
| |
| |
| Financial Highlights | | | | | | |
| |
| Admiral Shares | | | | | | | |
| | Six Months | | | | | |
| | | Ended | | | | | |
| For a Share Outstanding | February 28, | | | | Year Ended August 31, |
| Throughout Each Period | | 2010 | 2009 | 2008 | 2007 | 2006 | 2005 |
| Net Asset Value, Beginning of Period | $25.19 | $28.68 | $29.82 | $27.99 | $26.92 | $23.97 |
| Investment Operations | | | | | | | |
| Net Investment Income | | .5071 | .398 | .345 | .392 | .3042 | .2742 |
| Net Realized and Unrealized Gain (Loss) | | | | | | |
| on Investments | | 2.370 | (3.524) | (1.090) | 1.736 | .951 | 2.762 |
| Total from Investment Operations | 2.877 | (3.126) | (.745) | 2.128 | 1.255 | 3.036 |
| Distributions | | | | | | | |
| Dividends from Net Investment Income | (.737) | (.364) | (.395) | (.298) | (.185) | (.086) |
| Distributions from Realized Capital Gains | — | — | — | — | — | — |
| Total Distributions | | (.737) | (.364) | (.395) | (.298) | (.185) | (.086) |
| Net Asset Value, End of Period | | $27.33 | $25.19 | $28.68 | $29.82 | $27.99 | $26.92 |
| |
| Total Return3 | | 11.44% | –10.74% | –2.59% | 7.65% | 4.68% | 12.70% |
| |
| Ratios/Supplemental Data | | | | | | | |
| Net Assets, End of Period (Millions) | $121 | $111 | $136 | $132 | $108 | $73 |
| Ratio of Total Expenses to | | | | | | | |
| Average Net Assets | | 0.26%4 | 0.28% | 0.25% | 0.26% | 0.28% | 0.28% |
| Ratio of Net Investment Income to | | | | | | |
| Average Net Assets | | 2.66%1,4 | 1.75% | 1.36% | 1.42% | 1.12% | 1.11% |
| Portfolio Turnover Rate5 | | 10%4 | 6% | 8% | 10% | 11% | 9% |
1 Net investment income per share and the ratio of net investment income to average net assets include $.31 and 1.15%, respectively, resulting from a cash payment received in connection with the merger of Schering-Plough Corp. and Merck & Co. Inc., in November 2009.
2 Calculated based on average shares outstanding.
3 Total returns do not reflect the 2% fee assessed on redemptions of shares held for less than one year.
4 Annualized.
5 Excludes the value of portfolio securities received or delivered as a result of in-kind purchases or redemptions of the fund’s capital shares, including ETF Creation Units.
See accompanying Notes, which are an integral part of the Financial Statements.
50
| | | | | | | |
| Health Care Index Fund | | | | | | | |
| |
| |
| Financial Highlights | | | | | | |
| |
| ETF Shares | | | | | | | |
| | Six Months | | | | | |
| | | Ended | | | | | |
| For a Share Outstanding | February 28, | | | | Year Ended August 31, |
| Throughout Each Period | | 2010 | 2009 | 2008 | 2007 | 2006 | 2005 |
| Net Asset Value, Beginning of Period | $50.37 | $57.36 | $59.65 | $55.99 | $53.85 | $47.90 |
| Investment Operations | | | | | | | |
| Net Investment Income | | 1.0221 | .809 | .720 | .809 | .6222 | .5972 |
| Net Realized and Unrealized Gain (Loss) | | | | | | |
| on Investments | | 4.755 | (7.045) | (2.190) | 3.466 | 1.905 | 5.486 |
| Total from Investment Operations | 5.777 | (6.236) | (1.470) | 4.275 | 2.527 | 6.083 |
| Distributions | | | | | | | |
| Dividends from Net Investment Income | (1.487) | (.754) | (.820) | (.615) | (.387) | (.133) |
| Distributions from Realized Capital Gains | — | — | — | — | — | — |
| Total Distributions | | (1.487) | (.754) | (.820) | (.615) | (.387) | (.133) |
| Net Asset Value, End of Period | | $54.66 | $50.37 | $57.36 | $59.65 | $55.99 | $53.85 |
| |
| Total Return | | 11.47% | –10.70% | –2.55% | 7.69% | 4.71% | 12.72% |
| |
| Ratios/Supplemental Data | | | | | | | |
| Net Assets, End of Period (Millions) | $596 | $554 | $614 | $477 | $364 | $205 |
| Ratio of Total Expenses to | | | | | | | |
| Average Net Assets | | 0.23%3 | 0.25% | 0.20% | 0.22% | 0.25% | 0.26% |
| Ratio of Net Investment Income to | | | | | | |
| Average Net Assets | | 2.69%1,3 | 1.78% | 1.41% | 1.46% | 1.15% | 1.13% |
| Portfolio Turnover Rate4 | | 10%3 | 6% | 8% | 10% | 11% | 9% |
1 Net investment income per share and the ratio of net investment income to average net assets include $.62 and 1.15%, respectively, resulting from a cash payment received in connection with the merger of Schering-Plough Corp. and Merck & Co. Inc., in November 2009.
2 Calculated based on average shares outstanding.
3 Annualized.
4 Excludes the value of portfolio securities received or delivered as a result of in-kind purchases or redemptions of the fund’s capital shares,
including ETF Creation Units.
See accompanying Notes, which are an integral part of the Financial Statements.
51
Health Care Index Fund
Notes to Financial Statements
Vanguard Health Care Index Fund is registered under the Investment Company Act of 1940 as an open-end investment company, or mutual fund. The fund offers two classes of shares: Admiral Shares and ETF Shares. Admiral Shares are available to any investor who meets the fund’s minimum purchase requirements. ETF Shares are listed for trading on the NYSE Arca, Inc.; they can be purchased and sold through a broker.
A. The following significant accounting policies conform to generally accepted accounting principles for U.S. mutual funds. The fund consistently follows such policies in preparing its financial statements.
1. Security Valuation: Securities are valued as of the close of trading on the New York Stock Exchange (generally 4 p.m., Eastern time) on the valuation date. Equity securities are valued at the latest quoted sales prices or official closing prices taken from the primary market in which each security trades; such securities not traded on the valuation date are valued at the mean of the latest quoted bid and asked prices. Securities for which market quotations are not readily available, or whose values have been materially affected by events occurring before the fund’s pricing time but after the close of the securities’ primary markets, are valued by methods deemed by the board of trustees to represent fair value. Investments in Vanguard Market Liquidity Fund are valued at that fund’s net asset value.
2. Federal Income Taxes: The fund intends to continue to qualify as a regulated investment company and distribute all of its taxable income. Management has analyzed the fund’s tax positions taken for all open federal income tax years (August 31, 2006–2009), and for the period ended February 28, 2010, and has concluded that no provision for federal income tax is required in the fund’s financial statements.
3. Distributions: Distributions to shareholders are recorded on the ex-dividend date.
4. Security Lending: The fund may lend its securities to qualified institutional borrowers to earn additional income. Security loans are required to be secured at all times by collateral at least equal to the market value of securities loaned. The fund invests cash collateral received in Vanguard Market Liquidity Fund, and records a liability for the return of the collateral, during the period the securities are on loan. Security lending income represents the income earned on investing cash collateral, less expenses associated with the loan.
5. Other: Dividend income is recorded on the ex-dividend date. Interest income includes income distributions received from Vanguard Market Liquidity Fund and is accrued daily. Security transactions are accounted for on the date securities are bought or sold. Costs used to determine realized gains (losses) on the sale of investment securities are those of the specific securities sold. Fees assessed on redemptions of capital shares are credited to paid-in capital.
Each class of shares has equal rights as to assets and earnings, except that each class separately bears certain class-specific expenses related to maintenance of shareholder accounts (included in Management and Administrative expenses) and shareholder reporting. Marketing and distribution expenses are allocated to each class of shares based on a method approved by the board of trustees. Income, other non-class-specific expenses, and gains and losses on investments are allocated to each class of shares based on its relative net assets.
B. The Vanguard Group furnishes at cost investment advisory, corporate management, administrative, marketing, and distribution services. The costs of such services are allocated to the fund under methods approved by the board of trustees. The fund has committed to provide up to 0.40% of its net assets in capital contributions to Vanguard. At February 28, 2010, the fund had contributed capital of $145,000 to Vanguard (included in Other Assets), representing 0.02% of the fund’s net assets and 0.06% of Vanguard’s capitalization. The fund’s trustees and officers are also directors and officers of Vanguard.
C. Various inputs may be used to determine the value of the fund’s investments. These inputs are summarized in three broad levels for financial statement purposes. The inputs or methodologies used to value securities are not necessarily an indication of the risk associated with investing in those securities.
Level 1—Quoted prices in active markets for identical securities.
Level 2—Other significant observable inputs (including quoted prices for similar securities, interest rates, prepayment speeds, credit risk, etc.).
Level 3—Significant unobservable inputs (including the fund’s own assumptions used to determine the fair value of investments).
At February 28, 2010, 100% of the fund’s investments were valued based on Level 1 inputs.
52
Health Care Index Fund
D. Distributions are determined on a tax basis and may differ from net investment income and realized capital gains for financial reporting purposes. Differences may be permanent or temporary. Permanent differences are reclassified among capital accounts in the financial statements to reflect their tax character. Temporary differences arise when certain items of income, expense, gain, or loss are recognized in different periods for financial statement and tax purposes; these differences will reverse at some time in the future. Differences in classification may also result from the treatment of short-term gains as ordinary income for tax purposes.
During the six months ended February 28, 2010, the fund realized $8,459,000 of net capital gains resulting from in-kind redemptions—in which shareholders exchanged fund shares for securities held by the fund rather than for cash. Because such gains are not taxable to the fund, and are not distributed to shareholders, they have been reclassified from accumulated net realized losses to paid-in capital.
The fund’s tax-basis capital gains and losses are determined only at the end of each fiscal year. For tax purposes, at August 31, 2009, the fund had available capital loss carryforwards totaling $10,937,000 to offset future net capital gains of $207,000 through August 31, 2014, $343,000 through August 31, 2015, $3,126,000 through August 31, 2016, and $7,261,000 through August 31, 2017. In addition, the fund realized losses of $10,493,000 during the period from November 1, 2008, through August 31, 2009, which are deferred and will be treated as realized for tax purposes in fiscal 2010. The fund will use these capital losses to offset net taxable capital gains, if any, realized during the year ending August 31, 2010; should the fund realize net capital losses for the year, the losses will be added to the loss carryforward balances above.
At February 28, 2010, the cost of investment securities for tax purposes was $782,256,000. Net unrealized depreciation of investment securities for tax purposes was $62,702,000, consisting of unrealized gains of $35,821,000 on securities that had risen in value since their purchase and $98,523,000 in unrealized losses on securities that had fallen in value since their purchase.
E. During the six months ended February 28, 2010, the fund purchased $97,376,000 of investment securities and sold $105,247,000 of investment securities, other than temporary cash investments.
F. Capital share transactions for each class of shares were:
| | | | |
| | Six Months Ended | | Year Ended |
| | February 28, 2010 | August 31, 2009 |
| | Amount | Shares | Amount | Shares |
| | ($000) | (000) | ($000) | (000) |
| Admiral Shares | | | | |
| Issued | 7,052 | 259 | 9,782 | 428 |
| Issued in Lieu of Cash Distributions | 1,377 | 51 | 758 | 34 |
| Redeemed1 | (7,146) | (269) | (18,244) | (819) |
| Net Increase (Decrease)—Admiral Shares | 1,283 | 41 | (7,704) | (357) |
| ETF Shares | | | | |
| Issued | 48,862 | 905 | 189,315 | 4,100 |
| Issued in Lieu of Cash Distributions | — | — | — | — |
| Redeemed1 | (52,570) | (1,000) | (174,997) | (3,800) |
| Net Increase (Decrease)—ETF Shares | (3,708) | (95) | 14,318 | 300 |
| 1 Net of redemption fees for fiscal 2010 and 2009 of $10,000 and $72,000, respectively (fund totals). | | |
G. In preparing the financial statements as of February 28, 2010, management considered the impact of subsequent events for potential recognition or disclosure in these financial statements.
53
Industrials Index Fund
Fund Profile
As of February 28, 2010
| | | |
| Portfolio Characteristics | | |
| | | Target | Broad |
| | Fund | Index1 | Index2 |
| Number of Stocks | 373 | 374 | 2,492 |
| Median Market Cap | $22.2B | $22.2B | $29.0B |
| Price/Earnings Ratio | 22.4x | 22.5x | 21.2x |
| Price/Book Ratio | 2.4x | 2.4x | 2.1x |
| Yield3 | | 1.9% | 1.9% |
| Admiral Shares | 1.6% | | |
| ETF Shares | 1.6% | | |
| Return on Equity | 19.5% | 19.5% | 19.4% |
| Earnings Growth Rate | 5.6% | 5.6% | 8.1% |
| Foreign Holdings | 0.0% | 0.0% | 0.0% |
| Turnover Rate4 | 15% | — | — |
| Expense Ratio5 | | — | — |
| Admiral Shares | 0.28% | | |
| ETF Shares | 0.25% | | |
| Short-Term Reserves | 0.0% | — | — |
| | |
| Volatility Measures6 | |
| | Fund Versus | Fund Versus |
| | Target Index1 | Broad Index2 |
| R-Squared | 1.00 | 0.92 |
| Beta | 1.00 | 1.23 |
| |
| Subindustry Diversification | |
| (% of equity exposure) | |
| Aerospace & Defense | 22.7% |
| Air Freight & Logistics | 6.6 |
| Airlines | 2.6 |
| Building Products | 1.2 |
| Construction & Engineering | 3.0 |
| Construction & Farm Machinery & Heavy Trucks | 8.5 |
| Diversified Support Services | 1.1 |
| Electrical Components & Equipment | 6.9 |
| Environmental & Facilities Services | 3.1 |
| Human Resource & Employment Services | 1.0 |
| Industrial Conglomerates | 19.4 |
| Industrial Machinery | 10.8 |
| Office Services & Supplies | 1.2 |
| Railroads | 5.7 |
| Research & Consulting Services | 1.5 |
| Trading Companies & Distributors | 1.8 |
| Trucking | 1.4 |
| Other Industrials | 1.5 |
| |
| Ten Largest Holdings7 (% of total net assets) |
| General Electric Co. | 12.9% |
| United Technologies Corp. | 4.6 |
| 3M Co. | 4.1 |
| Boeing Co. | 3.3 |
| United Parcel Service Inc. Class B | 3.1 |
| Emerson Electric Co. | 2.7 |
| Caterpillar Inc. | 2.7 |
| Union Pacific Corp. | 2.6 |
| Honeywell International Inc. | 2.2 |
| FedEx Corp. | 1.9 |
| Top Ten | 40.1% |
1 MSCI US IMI/Industrials.
2 MSCI US IMI/2500.
3 30-day SEC yield for the fund; annualized dividend yield for the indexes. See the Glossary.
4 Annualized.
5 The expense ratios shown are from the prospectuses dated December 28, 2009, and represent estimated costs for the current fiscal year based on the fund’s net assets as of the prospectus date. For the six months ended February 28, 2010, the annualized expense ratios were 0.26% for Admiral Shares and 0.23% for ETF Shares.
6 For an explanation of R-squared, beta, and other terms used here, see the Glossary.
7 The holdings listed exclude any temporary cash investments and equity index products.
54
Industrials Index Fund
Performance Summary
All of the returns in this report represent past performance, which is not a guarantee of future results that may be achieved by the fund. (Current performance may be lower or higher than the performance data cited. For performance data current to the most recent month-end, visit our website at www.vanguard.com/performance.) Note, too, that both investment returns and principal value can fluctuate widely, so an investor’s shares, when sold, could be worth more or less than their original cost. The returns shown do not reflect taxes that a shareholder would pay on fund distributions or on the sale of fund shares.
Fiscal-Year Total Returns (%): September 23, 2004–February 28, 2010
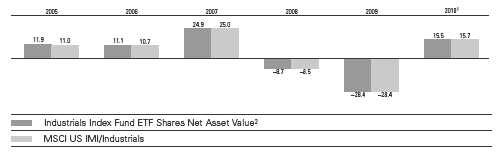
Average Annual Total Returns: Periods Ended December 31, 2009
This table presents average annual total returns through the latest calendar quarter—rather than through the end of the fiscal period. Securities and Exchange Commission rules require that we provide this information.
| | | | |
| | | | | Since |
| | Inception Date | One Year | Five Years | Inception |
| ETF Shares | 9/23/2004 | | | |
| Market Price | | 22.25% | 0.19% | 2.58% |
| Net Asset Value | | 22.39 | 0.21 | 2.59 |
| Admiral Shares3 | 5/8/2006 | 22.34 | — | –5.04 |
1 Six months ended February 28, 2010.
2 For more information about how the ETF Shares’ market prices have compared with their net asset value, visit www.vanguard.com, select your ETF, and then select the Performance tab. The Premium/Discount table there shows the percentages of days on which the ETF Shares’ market price was above or below the NAV.
3 Total returns do not reflect the 2% fee assessed on redemptions of shares held for less than one year.
See Financial Highlights for dividend and capital gains information.
55
Industrials Index Fund
Financial Statements (unaudited)
Statement of Net Assets
As of February 28, 2010
The fund reports a complete list of its holdings in regulatory filings four times in each fiscal year, at the quarter-ends. For the second and fourth fiscal quarters, the lists appear in the fund’s semiannual and annual reports to shareholders. For the first and third fiscal quarters, the fund files the lists with the Securities and Exchange Commission on Form N-Q. Shareholders can look up the fund’s Forms N-Q on the SEC’s website at www.sec.gov. Forms N-Q may also be reviewed and copied at the SEC’s Public Reference Room (see the back cover of this report for further information).
| | | |
| | | | Market |
| | | | Value• |
| | | Shares | ($000) |
| Common Stocks (100.0%) | | |
| Aerospace & Defense (22.6%) | | |
| | United Technologies Corp. | 192,905 | 13,243 |
| | Boeing Co. | 149,503 | 9,443 |
| | Honeywell International Inc. | 157,002 | 6,305 |
| | Lockheed Martin Corp. | 69,621 | 5,414 |
| | General Dynamics Corp. | 71,038 | 5,154 |
| | Raytheon Co. | 82,999 | 4,668 |
| | Northrop Grumman Corp. | 64,557 | 3,955 |
| | Precision Castparts Corp. | 30,469 | 3,435 |
| | L-3 Communications | | |
| | Holdings Inc. | 25,173 | 2,301 |
| | ITT Corp. | 37,601 | 1,926 |
| | Rockwell Collins Inc. | 34,173 | 1,923 |
| | Goodrich Corp. | 26,930 | 1,767 |
| * | Alliant Techsystems Inc. | 7,137 | 567 |
| * | BE Aerospace Inc. | 20,831 | 539 |
| | TransDigm Group Inc. | 10,062 | 505 |
| * | Spirit Aerosystems | | |
| | Holdings Inc. Class A | 22,695 | 434 |
| | Curtiss-Wright Corp. | 9,884 | 317 |
| * | Moog Inc. Class A | 8,895 | 302 |
| * | Teledyne Technologies Inc. | 7,422 | 280 |
| * | Esterline Technologies Corp. | 6,438 | 265 |
| * | Hexcel Corp. | 20,935 | 231 |
| * | Orbital Sciences Corp. | 12,235 | 226 |
| * | AAR Corp. | 8,415 | 191 |
| | Triumph Group Inc. | 3,611 | 189 |
| | American Science & | | |
| | Engineering Inc. | 1,918 | 142 |
| * | DigitalGlobe Inc. | 5,833 | 139 |
| | Cubic Corp. | 3,473 | 120 |
| * | Ceradyne Inc. | 5,286 | 119 |
| | HEICO Corp. Class A | 3,059 | 113 |
| * | Taser International Inc. | 12,727 | 96 |
| * | GeoEye Inc. | 4,028 | 96 |
| * | DynCorp International Inc. | | |
| | Class A | 7,910 | 89 |
| * | Aerovironment Inc. | 3,260 | 79 |
| * | Stanley Inc. | 3,119 | 79 |
| * | Argon ST Inc. | 3,054 | 75 |
| | HEICO Corp. | 1,239 | 59 |
| * | Ladish Co. Inc. | 3,442 | 58 |
| | Applied Signal Technology Inc. | 2,749 | 51 |
| * | GenCorp Inc. | 10,197 | 44 |
| | Ducommun Inc. | 2,223 | 39 |
| | | | 64,978 |
| Air Freight & Logistics (6.6%) | | |
| | United Parcel Service Inc. | | |
| | Class B | 152,959 | 8,985 |
| | FedEx Corp. | 64,303 | 5,450 |
| | CH Robinson Worldwide Inc. | 36,331 | 1,938 |
| | Expeditors International | | |
| | of Washington Inc. | 45,984 | 1,677 |
| | UTi Worldwide Inc. | 20,636 | 308 |
| * | HUB Group Inc. Class A | 8,046 | 217 |
| | | |
| | | | Market |
| | | | Value• |
| | | Shares | ($000) |
| * | Atlas Air Worldwide | | |
| | Holdings Inc. | 4,621 | 208 |
| | Forward Air Corp. | 6,273 | 153 |
| * | Pacer International Inc. | 8,020 | 39 |
| | | | 18,975 |
| Airlines (2.6%) | | |
| * | Delta Air Lines Inc. | 168,834 | 2,181 |
| | Southwest Airlines Co. | 160,721 | 2,022 |
| * | AMR Corp. | 71,811 | 660 |
| * | UAL Corp. | 36,208 | 621 |
| * | Continental Airlines Inc. | | |
| | Class B | 29,927 | 618 |
| * | JetBlue Airways Corp. | 52,086 | 275 |
| * | Alaska Air Group Inc. | 7,607 | 266 |
| * | US Airways Group Inc. | 34,732 | 255 |
| | Skywest Inc. | 12,041 | 178 |
| * | Allegiant Travel Co. Class A | 2,595 | 135 |
| * | AirTran Holdings Inc. | 27,375 | 132 |
| * | Hawaiian Holdings Inc. | 11,162 | 87 |
| * | Republic Airways | | |
| | Holdings Inc. | 7,654 | 47 |
| | | | 7,477 |
| Auto Components (0.1%) | | |
| | WABCO Holdings Inc. | 13,855 | 371 |
| |
| Building Products (1.2%) | | |
| | Masco Corp. | 78,014 | 1,043 |
| * | Owens Corning | 24,874 | 585 |
| | Lennox International Inc. | 10,286 | 434 |
| | Simpson | | |
| | Manufacturing Co. Inc. | 8,500 | 209 |
| * | USG Corp. | 15,040 | 203 |
| * | Armstrong World | | |
| | Industries Inc. | 4,349 | 160 |
| * | Griffon Corp. | 11,550 | 143 |
| | Universal Forest Products Inc. | 3,763 | 133 |
| | Ameron International Corp. | 1,896 | 131 |
| | Quanex Building | | |
| | Products Corp. | 8,153 | 127 |
| | Apogee Enterprises Inc. | 6,038 | 86 |
| * | Gibraltar Industries Inc. | 5,215 | 61 |
| | AAON Inc. | 2,815 | 59 |
| | American Woodmark Corp. | 2,032 | 38 |
| | | | 3,412 |
| Commercial Services & Supplies (6.3%) | | |
| | Waste Management Inc. | 100,749 | 3,327 |
| | Republic Services Inc. | | |
| | Class A | 82,332 | 2,317 |
| | Pitney Bowes Inc. | 44,882 | 1,028 |
| * | Iron Mountain Inc. | 39,587 | 1,025 |
| * | Stericycle Inc. | 17,302 | 955 |
| | RR Donnelley & Sons Co. | 44,502 | 885 |
| | Cintas Corp. | 29,807 | 739 |
| | Avery Dennison Corp. | 21,995 | 695 |
| * | Waste Connections Inc. | 17,017 | 572 |
| * | Copart Inc. | 15,501 | 553 |
| | | |
| | | | Market |
| | | | Value• |
| | | Shares | ($000) |
| * | Corrections Corp. of America | 24,973 | 534 |
| * | Covanta Holding Corp. | 26,881 | 453 |
| * | United Stationers Inc. | 5,148 | 294 |
| * | Clean Harbors Inc. | 5,117 | 291 |
| * | Tetra Tech Inc. | 13,238 | 277 |
| | Brink’s Co. | 9,832 | 251 |
| | Herman Miller Inc. | 12,105 | 220 |
| * | Geo Group Inc. | 11,111 | 220 |
| * | SYKES Enterprises Inc. | 8,704 | 207 |
| | Rollins Inc. | 9,663 | 205 |
| | Deluxe Corp. | 11,077 | 199 |
| | HNI Corp. | 8,283 | 197 |
| | Healthcare Services | | |
| | Group Inc. | 8,944 | 196 |
| | ABM Industries Inc. | 9,450 | 194 |
| | Mine Safety Appliances Co. | 7,398 | 188 |
| | Knoll Inc. | 10,181 | 122 |
| | McGrath Rentcorp | 4,885 | 117 |
| * | Mobile Mini Inc. | 7,681 | 104 |
| * | EnerNOC Inc. | 3,831 | 101 |
| | G&K Services Inc. Class A | 4,007 | 100 |
| | EnergySolutions Inc. | 16,257 | 99 |
| * | Consolidated Graphics Inc. | 2,183 | 97 |
| * | ATC Technology Corp. | 4,297 | 96 |
| | Bowne & Co. Inc. | 8,564 | 95 |
| | Steelcase Inc. Class A | 14,262 | 94 |
| * | Cenveo Inc. | 12,011 | 90 |
| | Interface Inc. Class A | 10,378 | 89 |
| | Ennis Inc. | 5,600 | 86 |
| | Viad Corp. | 4,454 | 85 |
| * | ACCO Brands Corp. | 11,811 | 85 |
| * | M&F Worldwide Corp. | 2,510 | 81 |
| * | Team Inc. | 3,873 | 70 |
| * | Waste Services Inc. | 6,505 | 66 |
| * | Cornell Cos. Inc. | 3,372 | 63 |
| * | American Reprographics Co. | 7,833 | 56 |
| | US Ecology Inc. | 3,757 | 56 |
| * | Standard Parking Corp. | 3,028 | 50 |
| | Schawk Inc. Class A | 3,240 | 42 |
| * | Metalico Inc. | 7,668 | 42 |
| | Kimball International Inc. | | |
| | Class B | 5,631 | 37 |
| * | Innerworkings Inc. | 6,126 | 35 |
| * | APAC Customer Services Inc. | 6,164 | 32 |
| * | Fuel Tech Inc. | 3,881 | 25 |
| | Standard Register Co. | 2,363 | 13 |
| | | | 18,150 |
| Construction & Engineering (3.0%) | |
| | Fluor Corp. | 38,766 | 1,659 |
| * | Jacobs Engineering | | |
| | Group Inc. | 26,922 | 1,045 |
| * | Quanta Services Inc. | 45,232 | 859 |
| * | URS Corp. | 18,277 | 850 |
| | KBR Inc. | 34,772 | 720 |
| * | Foster Wheeler AG | 27,494 | 677 |
| * | Shaw Group Inc. | 18,117 | 629 |
56
Industrials Index Fund
| | | | |
| | | | | Market |
| | | | | Value• |
| | | | Shares | ($000) |
| * | Aecom Technology Corp. | 19,408 | 526 |
| * | EMCOR Group Inc. | | 14,291 | 329 |
| | Granite Construction Inc. | 7,539 | 208 |
| * | Insituform Technologies Inc. | | |
| | Class A | | 8,408 | 206 |
| * | MasTec Inc. | | 9,836 | 130 |
| * | Layne Christensen Co. | | 4,212 | 116 |
| * | Tutor Perini Corp. | | 5,780 | 114 |
| * | Orion Marine Group Inc. | 5,658 | 99 |
| | Comfort Systems USA Inc. | 8,299 | 97 |
| * | Dycom Industries Inc. | | 8,435 | 76 |
| * | MYR Group Inc. | | 4,058 | 64 |
| * | Sterling Construction Co. Inc. | 3,260 | 64 |
| * | Michael Baker Corp. | | 1,729 | 59 |
| | Great Lakes Dredge & | | | |
| | Dock Corp. | | 11,382 | 52 |
| * | Northwest Pipe Co. | | 1,998 | 47 |
| * | Pike Electric Corp. | | 4,130 | 35 |
| * | Furmanite Corp. | | 7,628 | 28 |
| * | Argan Inc. | | 1,332 | 21 |
| | | | | 8,710 |
| Electrical Equipment (7.0%) | | |
| | Emerson Electric Co. | | 162,905 | 7,712 |
| | Rockwell Automation Inc. | 30,813 | 1,667 |
| | Cooper Industries PLC | | 36,143 | 1,639 |
| *,^ | First Solar Inc. | | 11,982 | 1,269 |
| | Roper Industries Inc. | | 19,688 | 1,091 |
| | AMETEK Inc. | | 23,307 | 910 |
| | Hubbell Inc. Class B | | 11,253 | 527 |
| | Regal-Beloit Corp. | | 7,965 | 449 |
| * | Thomas & Betts Corp. | | 11,461 | 414 |
| | Woodward Governor Co. | 13,260 | 382 |
| | Acuity Brands Inc. | | 9,346 | 364 |
| * | GrafTech International Ltd. | 26,106 | 326 |
| | Baldor Electric Co. | | 9,598 | 302 |
| | Brady Corp. Class A | | 10,579 | 296 |
| * | General Cable Corp. | | 11,262 | 275 |
| * | American | | | |
| | Superconductor Corp. | 9,090 | 255 |
| | AO Smith Corp. | | 5,140 | 233 |
| * | EnerSys | | 9,892 | 225 |
| * | SunPower Corp. Class A | 11,825 | 222 |
| | Belden Inc. | | 10,095 | 214 |
| * | II-VI Inc. | | 5,437 | 152 |
| * | SunPower Corp. Class B | 9,102 | 149 |
| | Franklin Electric Co. Inc. | 4,000 | 114 |
| | AZZ Inc. | | 2,634 | 83 |
| * | Harbin Electric Inc. | | 4,242 | 80 |
| | Encore Wire Corp. | | 3,984 | 80 |
| * | Polypore International Inc. | 5,281 | 79 |
| * | Energy Conversion | | | |
| | Devices Inc. | | 9,723 | 70 |
| * | Capstone Turbine Corp. | 50,945 | 61 |
| * | Broadwind Energy Inc. | | 11,534 | 57 |
| * | Powell Industries Inc. | | 1,859 | 54 |
| * | Fushi Copperweld Inc. | | 5,625 | 51 |
| * | Evergreen Solar Inc. | | 42,785 | 48 |
| * | GT Solar International Inc. | 7,971 | 47 |
| * | FuelCell Energy Inc. | | 15,030 | 42 |
| * | Ener1 Inc. | | 9,914 | 42 |
| * | Vicor Corp. | | 4,351 | 41 |
| | Preformed Line Products Co. | 600 | 22 |
| * | Valence Technology Inc. | 14,831 | 14 |
| * | Plug Power Inc. | | 20,670 | 11 |
| | | | | 20,069 |
| Industrial Conglomerates (19.4%) | |
| | General Electric Co. | 2,306,096 | 37,036 |
| | 3M Co. | | 145,668 | 11,675 |
| | Tyco International Ltd. | | 102,846 | 3,709 |
| | | |
| | | | Market |
| | | | Value• |
| | | Shares | ($000) |
| | Textron Inc. | 58,706 | 1,169 |
| * | McDermott International Inc. | 49,836 | 1,139 |
| | Carlisle Cos. Inc. | 13,280 | 456 |
| | Otter Tail Corp. | 7,326 | 146 |
| | Raven Industries Inc. | 3,511 | 103 |
| | Seaboard Corp. | 80 | 102 |
| | Tredegar Corp. | 5,518 | 92 |
| | Standex International Corp. | 2,541 | 63 |
| | | | 55,690 |
| Machinery (19.3%) | | |
| | Caterpillar Inc. | 134,879 | 7,695 |
| | Deere & Co. | 91,605 | 5,249 |
| | Danaher Corp. | 59,139 | 4,375 |
| | Illinois Tool Works Inc. | 92,242 | 4,199 |
| | PACCAR Inc. | 74,817 | 2,645 |
| | Cummins Inc. | 41,558 | 2,360 |
| | Eaton Corp. | 34,102 | 2,323 |
| | Ingersoll-Rand PLC | 69,315 | 2,212 |
| | Parker Hannifin Corp. | 34,795 | 2,098 |
| | Dover Corp. | 40,348 | 1,826 |
| | Flowserve Corp. | 12,123 | 1,213 |
| | Joy Global Inc. | 22,162 | 1,126 |
| | Bucyrus International Inc. | | |
| | Class A | 16,286 | 1,019 |
| | Pall Corp. | 25,280 | 998 |
| | Stanley Works | 15,626 | 895 |
| * | Oshkosh Corp. | 19,346 | 737 |
| * | AGCO Corp. | 20,040 | 686 |
| | Pentair Inc. | 20,246 | 659 |
| | Donaldson Co. Inc. | 15,898 | 656 |
| | SPX Corp. | 10,671 | 635 |
| | IDEX Corp. | 17,497 | 542 |
| * | Navistar International Corp. | 13,769 | 539 |
| | Snap-On Inc. | 12,512 | 528 |
| | Harsco Corp. | 17,411 | 523 |
| | Gardner Denver Inc. | 11,274 | 492 |
| | Timken Co. | 17,843 | 468 |
| | Kennametal Inc. | 17,625 | 459 |
| * | Terex Corp. | 23,416 | 456 |
| | Lincoln Electric Holdings Inc. | 9,220 | 440 |
| | Nordson Corp. | 6,557 | 431 |
| | Wabtec Corp. | 9,800 | 374 |
| | CLARCOR Inc. | 11,048 | 362 |
| | Graco Inc. | 12,997 | 356 |
| | Manitowoc Co. Inc. | 28,316 | 330 |
| | Toro Co. | 7,400 | 326 |
| | Crane Co. | 10,148 | 321 |
| | Trinity Industries Inc. | 17,198 | 289 |
| | Valmont Industries Inc. | 3,988 | 284 |
| | Actuant Corp. Class A | 14,601 | 264 |
| | Kaydon Corp. | 7,197 | 234 |
| | Briggs & Stratton Corp. | 10,828 | 190 |
| | ESCO Technologies Inc. | 5,695 | 186 |
| | Watts Water | | |
| | Technologies Inc. Class A | 6,371 | 186 |
| | Mueller Industries Inc. | 8,077 | 181 |
| * | Middleby Corp. | 3,612 | 168 |
| | Barnes Group Inc. | 9,989 | 160 |
| | Mueller Water | | |
| | Products Inc. Class A | 33,119 | 153 |
| | Robbins & Myers Inc. | 6,045 | 146 |
| * | Chart Industries Inc. | 6,162 | 125 |
| * | EnPro Industries Inc. | 4,370 | 121 |
| * | RBC Bearings Inc. | 4,701 | 119 |
| | Albany International Corp. | 5,966 | 115 |
| | CIRCOR International Inc. | 3,675 | 114 |
| | Badger Meter Inc. | 3,064 | 110 |
| * | Astec Industries Inc. | 4,147 | 101 |
| | John Bean Technologies Corp. | 5,971 | 98 |
| | | |
| | | | Market |
| | | | Value• |
| | | Shares | ($000) |
| * | Blount International Inc. | 8,777 | 97 |
| | Lindsay Corp. | 2,533 | 93 |
| | Tennant Co. | 3,640 | 87 |
| * | K-Tron International Inc. | 552 | 83 |
| * | Force Protection Inc. | 15,138 | 81 |
| | Federal Signal Corp. | 10,014 | 77 |
| | Gorman-Rupp Co. | 3,253 | 76 |
| * | LB Foster Co. Class A | 2,197 | 67 |
| | Sun Hydraulics Corp. | 2,740 | 66 |
| * | Colfax Corp. | 5,513 | 62 |
| | Titan International Inc. | 7,242 | 60 |
| * | 3D Systems Corp. | 4,199 | 59 |
| * | Columbus McKinnon Corp. | 3,975 | 57 |
| | NACCO Industries Inc. | | |
| | Class A | 1,173 | 55 |
| | FreightCar America Inc. | 2,576 | 55 |
| | Cascade Corp. | 1,876 | 52 |
| | Dynamic Materials Corp. | 2,843 | 52 |
| * | SmartHeat Inc. | 4,296 | 51 |
| | Ampco-Pittsburgh Corp. | 1,898 | 49 |
| * | Energy Recovery Inc. | 7,265 | 47 |
| * | Tecumseh Products Co. | | |
| | Class A | 3,027 | 38 |
| * | Kadant Inc. | 2,660 | 36 |
| * | Greenbrier Cos. Inc. | 3,709 | 34 |
| * | Sauer-Danfoss Inc. | 2,728 | 33 |
| * | China Fire & | | |
| | Security Group Inc. | 1,837 | 26 |
| | American Railcar | | |
| | Industries Inc. | 2,224 | 21 |
| * | Tecumseh Products Co. | | |
| | Class B | 837 | 10 |
| | | | 55,421 |
| Marine (0.3%) | | |
| * | Kirby Corp. | 11,088 | 366 |
| | Alexander & Baldwin Inc. | 8,893 | 286 |
| * | Genco Shipping & | | |
| | Trading Ltd. | 6,180 | 130 |
| * | Eagle Bulk Shipping Inc. | 13,419 | 70 |
| * | American Commercial | | |
| | Lines Inc. | 2,102 | 49 |
| | Horizon Lines Inc. Class A | 6,572 | 27 |
| * | TBS International PLC | | |
| | Class A | 3,047 | 18 |
| | | | 946 |
| Media (0.0%) | | |
| | Courier Corp. | 2,255 | 35 |
| |
| Professional Services (2.6%) | | |
| | Equifax Inc. | 27,394 | 884 |
| | Manpower Inc. | 16,992 | 875 |
| | Robert Half International Inc. | 31,274 | 873 |
| | Dun & Bradstreet Corp. | 11,239 | 789 |
| * | Verisk Analytics Inc. Class A | 21,764 | 616 |
| * | IHS Inc. Class A | 8,889 | 460 |
| * | FTI Consulting Inc. | 11,215 | 412 |
| | Towers Watson & Co. Class A | 9,255 | 409 |
| | Corporate Executive Board Co. | 7,390 | 169 |
| * | Korn/Ferry International | 9,886 | 169 |
| * | CoStar Group Inc. | 4,179 | 164 |
| * | Resources Connection Inc. | 9,334 | 159 |
| * | Navigant Consulting Inc. | 10,828 | 126 |
| * | TrueBlue Inc. | 9,478 | 126 |
| * | Advisory Board Co. | 3,362 | 107 |
| | Heidrick & Struggles | | |
| | International Inc. | 3,685 | 99 |
| * | Huron Consulting Group Inc. | 4,194 | 99 |
| * | Kelly Services Inc. Class A | 6,156 | 97 |
| * | Kforce Inc. | 7,060 | 94 |
57
| | | | |
| Industrials Index Fund | | | |
| |
| |
| |
| |
| | | | | Market |
| | | | | Value• |
| | | | Shares | ($000) |
| | Administaff Inc. | | 4,976 | 90 |
| * | School Specialty Inc. | | 4,076 | 87 |
| * | Spherion Corp. | | 11,013 | 87 |
| * | ICF International Inc. | | 3,661 | 86 |
| * | Exponent Inc. | | 2,983 | 79 |
| * | CRA International Inc. | | 2,374 | 63 |
| * | CBIZ Inc. | | 10,102 | 63 |
| | CDI Corp. | | 2,942 | 42 |
| * | Volt Information Sciences Inc. | 3,037 | 32 |
| * | Hill International Inc. | | 5,168 | 27 |
| * | Odyssey Marine | | | |
| | Exploration Inc. | | 13,068 | 17 |
| | | | | 7,400 |
| Road & Rail (7.1%) | | | |
| | Union Pacific Corp. | 109,278 | 7,362 |
| | Norfolk Southern Corp. | | 79,692 | 4,099 |
| | CSX Corp. | | 85,061 | 4,037 |
| * | Kansas City Southern | | 20,810 | 714 |
| | JB Hunt Transport | | | |
| | Services Inc. | | 19,247 | 683 |
| | Landstar System Inc. | | 11,128 | 444 |
| | Ryder System Inc. | | 12,134 | 428 |
| * | Hertz Global Holdings Inc. | 39,943 | 375 |
| | Con-way Inc. | | 10,634 | 345 |
| | Knight Transportation Inc. | 13,506 | 267 |
| * | Genesee & Wyoming Inc. | | |
| | Class A | | 8,324 | 265 |
| * | Avis Budget Group Inc. | | 22,120 | 233 |
| | Werner Enterprises Inc. | | 10,101 | 225 |
| | Heartland Express Inc. | | 12,765 | 195 |
| * | Old Dominion Freight Line Inc. | 6,056 | 186 |
| * | Dollar Thrifty Automotive | | |
| | Group Inc. | | 5,383 | 162 |
| | Arkansas Best Corp. | | 5,203 | 137 |
| * | Amerco Inc. | | 1,501 | 79 |
| * | Marten Transport Ltd. | | 3,549 | 67 |
| * | Saia Inc. | | 3,027 | 38 |
| * | Patriot Transportation | | | |
| | Holding Inc. | | 381 | 34 |
| | Universal Truckload | | | |
| | Services Inc. | | 1,462 | 26 |
| * | YRC Worldwide Inc. | | 24,214 | 11 |
| | | | | 20,412 |
| Trading Companies & Distributors (1.8%) | |
| | WW Grainger Inc. | | 13,653 | 1,388 |
| | Fastenal Co. | | 28,977 | 1,286 |
| | MSC Industrial Direct Co. | | |
| | Class A | | 9,587 | 437 |
| | Watsco Inc. | | 6,032 | 349 |
| | GATX Corp. | | 9,970 | 266 |
| * | WESCO International Inc. | 8,694 | 251 |
| | Applied Industrial | | | |
| | Technologies Inc. | | 8,247 | 186 |
| * | Beacon Roofing Supply Inc. | 9,772 | 170 |
| | Kaman Corp. | | 5,558 | 133 |
| * | Interline Brands Inc. | | 7,029 | 124 |
| | Aircastle Ltd. | | 11,153 | 109 |
| * | United Rentals Inc. | | 11,713 | 88 |
| * | RSC Holdings Inc. | | 10,755 | 76 |
| * | Rush Enterprises Inc. Class A | 5,770 | 63 |
| | TAL International Group Inc. | 3,340 | 61 |
| | Houston Wire & Cable Co. | 3,694 | 45 |
| * | H&E Equipment Services Inc. | 4,628 | 45 |
| | | |
| | | | Market |
| | | | Value• |
| | | Shares | ($000) |
| * | Titan Machinery Inc. | 2,966 | 35 |
| | Aceto Corp. | 5,626 | 29 |
| * | Rush Enterprises Inc. Class B | 1,777 | 17 |
| | Lawson Products Inc. | 941 | 17 |
| | | | 5,175 |
| Transportation Infrastructure (0.1%) | |
| * | Macquarie | | |
| | Infrastructure Co. LLC | 9,250 | 126 |
| Total Common Stocks | | |
| (Cost $358,619) | | 287,347 |
| Temporary Cash Investment (0.2%) | |
| Money Market Fund (0.2%) | | |
| 1,2 | Vanguard Market | | |
| | Liquidity Fund, 0.163% | | |
| | (Cost $456) | 455,802 | 456 |
| Total Investments (100.2%) | | |
| (Cost $359,075) | | 287,803 |
| Other Assets and Liabilities (–0.2%) | |
| Other Assets | | 2,110 |
| Liabilities2 | | (2,606) |
| | | | (496) |
| Net Assets (100%) | | 287,307 |
| |
| At February 28, 2010, net assets consisted of: |
| | Amount |
| | ($000) |
| Paid-in Capital | 381,830 |
| Undistributed Net Investment Income | 795 |
| Accumulated Net Realized Losses | (24,046) |
| Unrealized Appreciation (Depreciation) | (71,272) |
| Net Assets | 287,307 |
| |
| Admiral Shares—Net Assets | |
| Applicable to 239,672 outstanding | |
| $.001 par value shares of beneficial | |
| interest (unlimited authorization) | 6,519 |
| Net Asset Value Per Share— | |
| Admiral Shares | $27.20 |
| |
| ETF Shares—Net Assets | |
| Applicable to 5,303,483 outstanding | |
| $.001 par value shares of beneficial | |
| interest (unlimited authorization) | 280,788 |
| Net Asset Value Per Share— | |
| ETF Shares | $52.94 |
• See Note A in Notes to Financial Statements.
* Non-income-producing security.
^ Part of security position is on loan to broker-dealers. The total value of securities on loan is $455,000.
1 Affiliated money market fund available only to Vanguard funds and certain trusts and accounts managed by Vanguard. Rate shown is the 7-day yield.
2 Includes $456,000 of collateral received for securities on loan.
See accompanying Notes, which are an integral part of the Financial Statements.
58
Industrials Index Fund
| |
| Statement of Operations |
| |
| Six Months Ended |
| February 28, 2010 |
| | ($000) |
| Investment Income | |
| Income | |
| Dividends | 3,115 |
| Security Lending | 1 |
| Total Income | 3,116 |
| Expenses | |
| The Vanguard Group—Note B | |
| Investment Advisory Services | 22 |
| Management and Administrative— | |
| Admiral Shares | 9 |
| Management and Administrative— | |
| ETF Shares | 233 |
| Marketing and Distribution— | |
| Admiral Shares | — |
| Marketing and Distribution— | |
| ETF Shares | 37 |
| Custodian Fees | 16 |
| Shareholders’ Reports—Admiral Shares | — |
| Shareholders’ Reports—ETF Shares | 21 |
| Total Expenses | 338 |
| Expenses Paid Indirectly | (2) |
| Net Expenses | 336 |
| Net Investment Income | 2,780 |
| Realized Net Gain (Loss) on | |
| Investment Securities Sold | 3,627 |
| Change in Unrealized Appreciation | |
| (Depreciation) of Investment Securities | 31,836 |
| Net Increase (Decrease) in Net Assets | |
| Resulting from Operations | 38,243 |
| | |
| Statement of Changes in Net Assets | | |
| |
| | Six Months Ended | Year Ended |
| | February 28, | August 31, |
| | 2010 | 2009 |
| | ($000) | ($000) |
| Increase (Decrease) in Net Assets | | |
| Operations | | |
| Net Investment Income | 2,780 | 5,213 |
| Realized Net Gain (Loss) | 3,627 | (28,412) |
| Change in Unrealized Appreciation (Depreciation) | 31,836 | (81,669) |
| Net Increase (Decrease) in Net Assets Resulting from Operations | 38,243 | (104,868) |
| Distributions | | |
| Net Investment Income | | |
| Admiral Shares | (80) | (158) |
| ETF Shares | (4,648) | (5,112) |
| Realized Capital Gain | | |
| Admiral Shares | — | — |
| ETF Shares | — | — |
| Total Distributions | (4,728) | (5,270) |
| Capital Share Transactions | | |
| Admiral Shares | (154) | (1,396) |
| ETF Shares | 62,069 | (54,110) |
| Net Increase (Decrease) from Capital Share Transactions | 61,915 | (55,506) |
| Total Increase (Decrease) | 95,430 | (165,644) |
| Net Assets | | |
| Beginning of Period | 191,877 | 357,521 |
| End of Period1 | 287,307 | 191,877 |
1 Net Assets—End of Period includes undistributed net investment income of $795,000 and $2,743,000.
See accompanying Notes, which are an integral part of the Financial Statements.
59
| | | | | |
| Industrials Index Fund | | | | | |
| |
| |
| Financial Highlights | | | | | |
| |
| Admiral Shares | | | | | |
| | Six Months | | | | May 8, |
| | Ended | | | | 20061 to |
| For a Share Outstanding | February 28, | Year Ended August 31, | Aug. 31, |
| Throughout Each Period | 2010 | 2009 | 2008 | 2007 | 2006 |
| Net Asset Value, Beginning of Period | $23.85 | $34.20 | $37.94 | $30.72 | $34.10 |
| Investment Operations | | | | | |
| Net Investment Income | .2332 | .635 | .5762 | .5102 | .1642 |
| Net Realized and Unrealized Gain (Loss) | | | | | |
| on Investments | 3.462 | (10.428) | (3.816) | 7.090 | (3.544) |
| Total from Investment Operations | 3.695 | (9.793) | (3.240) | 7.600 | (3.380) |
| Distributions | | | | | |
| Dividends from Net Investment Income | (.345) | (.557) | (.500) | (.380) | — |
| Distributions from Realized Capital Gains | — | — | — | — | — |
| Total Distributions | (.345) | (.557) | (.500) | (.380) | — |
| Net Asset Value, End of Period | $27.20 | $23.85 | $34.20 | $37.94 | $30.72 |
| |
| Total Return3 | 15.52% | –28.44% | –8.67% | 24.90% | –9.91% |
| |
| Ratios/Supplemental Data | | | | | |
| Net Assets, End of Period (Millions) | $7 | $6 | $11 | $4 | $0.2 |
| Ratio of Total Expenses to | | | | | |
| Average Net Assets | 0.26%4 | 0.28% | 0.25% | 0.26% | 0.28%4 |
| Ratio of Net Investment Income to | | | | | |
| Average Net Assets | 1.90%4 | 2.71% | 1.63% | 1.46% | 1.35%4 |
| Portfolio Turnover Rate5 | 15%4 | 8% | 7% | 13% | 9% |
1 Inception.
2 Calculated based on average shares outstanding.
3 Total returns do not reflect the 2% fee assessed on redemptions of shares held for less than one year.
4 Annualized.
5 Excludes the value of portfolio securities received or delivered as a result of in-kind purchases or redemptions of the fund’s capital shares, including ETF Creation Units.
See accompanying Notes, which are an integral part of the Financial Statements.
60
| | | | | | | |
| Industrials Index Fund | | | | | | | |
| |
| |
| Financial Highlights | | | | | | |
| |
| ETF Shares | | | | | | | |
| | Six Months | | | | | Sept. 23, |
| | | Ended | | | | | 20041 to |
| For a Share Outstanding | February 28, | Year Ended August 31, | Aug. 31, |
| Throughout Each Period | | 2010 | 2009 | 2008 | 2007 | 2006 | 2005 |
| Net Asset Value, Beginning of Period | $46.45 | $66.65 | $73.94 | $59.85 | $54.30 | $48.79 |
| Investment Operations | | | | | | | |
| Net Investment Income | | .4982 | 1.253 | 1.1572 | 1.0262 | .8422 | .650 |
| Net Realized and Unrealized Gain (Loss) | | | | | | |
| on Investments | | 6.707 | (20.342) | (7.466) | 13.808 | 5.160 | 5.180 |
| Total from Investment Operations | 7.205 | (19.089) | (6.309) | 14.834 | 6.002 | 5.830 |
| Distributions | | | | | | | |
| Dividends from Net Investment Income | (.715) | (1.111) | (.981) | (.744) | (.452) | (.320) |
| Distributions from Realized Capital Gains | — | — | — | — | — | — |
| Total Distributions | | (.715) | (1.111) | (.981) | (.744) | (.452) | (.320) |
| Net Asset Value, End of Period | | $52.94 | $46.45 | $66.65 | $73.94 | $59.85 | $54.30 |
| |
| Total Return | | 15.54% | –28.41% | –8.65% | 24.95% | 11.08% | 11.94% |
| |
| Ratios/Supplemental Data | | | | | | | |
| Net Assets, End of Period (Millions) | $281 | $186 | $347 | $229 | $120 | $16 |
| Ratio of Total Expenses to | | | | | | | |
| Average Net Assets | | 0.23%3 | 0.25% | 0.20% | 0.22% | 0.25% | 0.26%3 |
| Ratio of Net Investment Income to | | | | | | |
| Average Net Assets | | 1.93%3 | 2.74% | 1.68% | 1.50% | 1.38% | 1.30%3 |
| Portfolio Turnover Rate4 | | 15%3 | 8% | 7% | 13% | 9% | 11% |
1 Inception.
2 Calculated based on average shares outstanding.
3 Annualized.
4 Excludes the value of portfolio securities received or delivered as a result of in-kind purchases or redemptions of the fund’s capital shares, including ETF Creation Units.
See accompanying Notes, which are an integral part of the Financial Statements.
61
Industrials Index Fund
Notes to Financial Statements
Vanguard Industrials Index Fund is registered under the Investment Company Act of 1940 as an open-end investment company, or mutual fund. The fund offers two classes of shares: Admiral Shares and ETF Shares. Admiral Shares are available to any investor who meets the fund’s minimum purchase requirements. ETF Shares are listed for trading on the NYSE Arca, Inc.; they can be purchased and sold through a broker.
A. The following significant accounting policies conform to generally accepted accounting principles for U.S. mutual funds. The fund consistently follows such policies in preparing its financial statements.
1. Security Valuation: Securities are valued as of the close of trading on the New York Stock Exchange (generally 4 p.m., Eastern time) on the valuation date. Equity securities are valued at the latest quoted sales prices or official closing prices taken from the primary market in which each security trades; such securities not traded on the valuation date are valued at the mean of the latest quoted bid and asked prices. Securities for which market quotations are not readily available, or whose values have been materially affected by events occurring before the fund’s pricing time but after the close of the securities’ primary markets, are valued by methods deemed by the board of trustees to represent fair value. Investments in Vanguard Market Liquidity Fund are valued at that fund’s net asset value.
2. Federal Income Taxes: The fund intends to continue to qualify as a regulated investment company and distribute all of its taxable income. Management has analyzed the fund’s tax positions taken for all open federal income tax years (August 31, 2006–2009), and for the period ended February 28, 2010, and has concluded that no provision for federal income tax is required in the fund’s financial statements.
3. Distributions: Distributions to shareholders are recorded on the ex-dividend date.
4. Security Lending: The fund may lend its securities to qualified institutional borrowers to earn additional income. Security loans are required to be secured at all times by collateral at least equal to the market value of securities loaned. The fund invests cash collateral received in Vanguard Market Liquidity Fund, and records a liability for the return of the collateral, during the period the securities are on loan. Security lending income represents the income earned on investing cash collateral, less expenses associated with the loan.
5. Other: Dividend income is recorded on the ex-dividend date. Interest income includes income distributions received from Vanguard Market Liquidity Fund and is accrued daily. Security transactions are accounted for on the date securities are bought or sold. Costs used to determine realized gains (losses) on the sale of investment securities are those of the specific securities sold. Fees assessed on redemptions of capital shares are credited to paid-in capital.
Each class of shares has equal rights as to assets and earnings, except that each class separately bears certain class-specific expenses related to maintenance of shareholder accounts (included in Management and Administrative expenses) and shareholder reporting. Marketing and distribution expenses are allocated to each class of shares based on a method approved by the board of trustees. Income, other non-class-specific expenses, and gains and losses on investments are allocated to each class of shares based on its relative net assets.
B. The Vanguard Group furnishes at cost investment advisory, corporate management, administrative, marketing, and distribution services. The costs of such services are allocated to the fund under methods approved by the board of trustees. The fund has committed to provide up to 0.40% of its net assets in capital contributions to Vanguard. At February 28, 2010, the fund had contributed capital of $54,000 to Vanguard (included in Other Assets), representing 0.02% of the fund’s net assets and 0.02% of Vanguard’s capitalization. The fund’s trustees and officers are also directors and officers of Vanguard.
C. The fund’s custodian bank has agreed to reduce its fees when the fund maintains cash on deposit in the non-interest-bearing custody account. For the six months ended February 28, 2010, custodian fee offset arrangements reduced the fund’s expenses by $2,000 (an annual rate of 0.00% of average net assets).
62
Industrials Index Fund
D. Various inputs may be used to determine the value of the fund’s investments. These inputs are summarized in three broad levels for financial statement purposes. The inputs or methodologies used to value securities are not necessarily an indication of the risk associated with investing in those securities.
Level 1—Quoted prices in active markets for identical securities.
Level 2—Other significant observable inputs (including quoted prices for similar securities, interest rates, prepayment speeds, credit risk, etc.).
Level 3—Significant unobservable inputs (including the fund’s own assumptions used to determine the fair value of investments).
At February 28, 2010, 100% of the fund’s investments were valued based on Level 1 inputs.
E. Distributions are determined on a tax basis and may differ from net investment income and realized capital gains for financial reporting purposes. Differences may be permanent or temporary. Permanent differences are reclassified among capital accounts in the financial statements to reflect their tax character. Temporary differences arise when certain items of income, expense, gain, or loss are recognized in different periods for financial statement and tax purposes; these differences will reverse at some time in the future. Differences in classification may also result from the treatment of short-term gains as ordinary income for tax purposes.
During the six months ended February 28, 2010, the fund realized $10,198,000 of net capital gains resulting from in-kind redemptions—in which shareholders exchanged fund shares for securities held by the fund rather than for cash. Because such gains are not taxable to the fund, and are not distributed to shareholders, they have been reclassified from accumulated net realized losses to paid-in capital.
The fund’s tax-basis capital gains and losses are determined only at the end of each fiscal year. For tax purposes, at August 31, 2009, the fund had available capital loss carryforwards totaling $5,549,000 to offset future net capital gains of $18,000 through August 31, 2014, $283,000 through August 31, 2015, $552,000 through August 31, 2016, and $4,696,000 through August 31, 2017. In addition, the fund realized losses of $11,763,000 during the period from November 1, 2008, through August 31, 2009, which are deferred and will be treated as realized for tax purposes in fiscal 2010. The fund will use these capital losses to offset net taxable capital gains, if any, realized during the year ending August 31, 2010; should the fund realize net capital losses for the year, the losses will be added to the loss carryforward balances above.
At February 28, 2010, the cost of investment securities for tax purposes was $359,075,000. Net unrealized depreciation of investment securities for tax purposes was $71,272,000, consisting of unrealized gains of $2,390,000 on securities that had risen in value since their purchase and $73,662,000 in unrealized losses on securities that had fallen in value since their purchase.
F. During the six months ended February 28, 2010, the fund purchased $173,406,000 of investment securities and sold $113,370,000 of investment securities, other than temporary cash investments.
G. Capital share transactions for each class of shares were:
| | | | |
| | Six Months Ended | | Year Ended |
| | February 28, 2010 | August 31, 2009 |
| | Amount | Shares | Amount | Shares |
| | ($000) | (000) | ($000) | (000) |
| Admiral Shares | | | | |
| Issued | 902 | 28 | 3,309 | 160 |
| Issued in Lieu of Cash Distributions | 54 | 2 | 128 | 6 |
| Redeemed1 | (1,110) | (43) | (4,833) | (231) |
| Net Increase (Decrease)—Admiral Shares | (154) | (13) | (1,396) | (65) |
| ETF Shares | | | | |
| Issued | 153,272 | 3,002 | 77,709 | 1,900 |
| Issued in Lieu of Cash Distributions | — | — | — | — |
| Redeemed1 | (91,203) | (1,700) | (131,819) | (3,100) |
| Net Increase (Decrease)—ETF Shares | 62,069 | 1,302 | (54,110) | (1,200) |
| 1 Net of redemption fees for fiscal 2010 and 2009 of $7,000 and $42,000, respectively (fund totals). | | |
H. In preparing the financial statements as of February 28, 2010, management considered the impact of subsequent events for potential recognition or disclosure in these financial statements.
63
Information Technology Index Fund
Fund Profile
As of February 28, 2010
| | | |
| Portfolio Characteristics | | |
| | | Target | Broad |
| | Fund | Index1 | Index2 |
| Number of Stocks | 419 | 416 | 2,492 |
| Median Market Cap | $72.2B | $114.7B | $29.0B |
| Price/Earnings Ratio | 24.4x | 23.7x | 21.2x |
| Price/Book Ratio | 3.3x | 3.3x | 2.1x |
| Yield3 | | 0.9% | 1.9% |
| Admiral Shares | 0.6% | | |
| ETF Shares | 0.6% | | |
| Return on Equity | 24.3% | 24.1% | 19.4% |
| Earnings Growth Rate | 18.5% | 18.9% | 8.1% |
| Foreign Holdings | 0.0% | 0.0% | 0.0% |
| Turnover Rate4 | 10% | — | — |
| Expense Ratio5 | | — | — |
| Admiral Shares | 0.28% | | |
| ETF Shares | 0.25% | | |
| Short-Term Reserves | 0.0% | — | — |
| | |
| Volatility Measures6 | |
| | Fund Versus | Fund Versus |
| | Target Index1 | Broad Index2 |
| R-Squared | 1.00 | 0.86 |
| Beta | 1.00 | 1.10 |
| |
| Subindustry Diversification | |
| (% of equity exposure) | |
| Application Software | 4.6% |
| Communications Equipment | 12.4 |
| Computer Hardware | 21.4 |
| Computer Storage & Peripherals | 3.7 |
| Data Processing & Outsourced Services | 7.1 |
| Electronic Components | 1.9 |
| Electronic Equipment & Instruments | 1.3 |
| Electronic Manufacturing Services | 1.6 |
| Internet Software & Services | 9.5 |
| IT Consulting & Other Services | 2.7 |
| Semiconductor Equipment | 2.2 |
| Semiconductors | 12.5 |
| Systems Software | 17.0 |
| Other Information Technology | 2.1 |
| |
| Ten Largest Holdings7 (% of total net assets) |
| Microsoft Corp. | 9.7% |
| Apple Inc. | 7.8 |
| International Business Machines Corp. | 7.0 |
| Cisco Systems Inc. | 5.8 |
| Google Inc. Class A | 5.3 |
| Hewlett-Packard Co. | 5.0 |
| Intel Corp. | 4.7 |
| Oracle Corp. | 4.4 |
| QUALCOMM Inc. | 2.7 |
| Visa Inc. Class A | 1.8 |
| Top Ten | 54.2% |
1 MSCI US IMI/Information Technology.
2 MSCI US IMI/2500.
3 30-day SEC yield for the fund; annualized dividend yield for the indexes. See the Glossary.
4 Annualized.
5 The expense ratios shown are from the prospectuses dated December 28, 2009, and represent estimated costs for the current fiscal year based on the fund’s net assets as of the prospectus date. For the six months ended February 28, 2010, the annualized expense ratios were 0.26% for the Admiral Shares and 0.23% for the ETF Shares.
6 For an explanation of R-squared, beta, and other terms used here, see the Glossary.
7 The holdings listed exclude any temporary cash investments and equity index products.
64
Information Technology Index Fund
Performance Summary
All of the returns in this report represent past performance, which is not a guarantee of future results that may be achieved by the fund. (Current performance may be lower or higher than the performance data cited. For performance data current to the most recent month-end, visit our website at www.vanguard.com/performance.) Note, too, that both investment returns and principal value can fluctuate widely, so an investor’s shares, when sold, could be worth more or less than their original cost. The returns shown do not reflect taxes that a shareholder would pay on fund distributions or on the sale of fund shares.
Fiscal-Year Total Returns (%): January 26, 2004–February 28, 2010
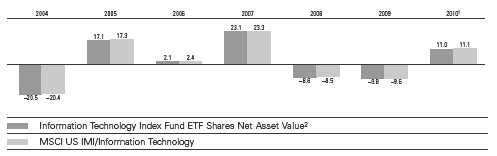
Average Annual Total Returns: Periods Ended December 31, 2009
This table presents average annual total returns through the latest calendar quarter—rather than through the end
of the fiscal period. Securities and Exchange Commission rules require that we provide this information.
| | | | |
| | | | | Since |
| | Inception Date | One Year | Five Years | Inception |
| ETF Shares | 1/26/2004 | | | |
| Market Price | | 62.03% | 3.61% | 1.89% |
| Net Asset Value | | 61.74 | 3.57 | 1.87 |
| Admiral Shares3 | 3/25/2004 | 61.72 | 3.54 | 3.82 |
1 Six months ended February 28, 2010.
2 For more information about how the ETF Shares’ market prices have compared with their net asset value, visit www.vanguard.com, select your ETF, and then select the Performance tab. The Premium/Discount table there shows the percentages of days on which the ETF Shares’ market price was above or below the NAV.
3 Total returns do not reflect the 2% fee assessed on redemptions of shares held for less than one year.
See Financial Highlights for dividend and capital gains information.
65
Information Technology Index Fund
Financial Statements (unaudited)
Statement of Net Assets
As of February 28, 2010
The fund reports a complete list of its holdings in regulatory filings four times in each fiscal year, at the quarter-ends. For the second and fourth fiscal quarters, the lists appear in the fund’s semiannual and annual reports to shareholders. For the first and third fiscal quarters, the fund files the lists with the Securities and Exchange Commission on Form N-Q. Shareholders can look up the fund’s Forms N-Q on the SEC’s website at www.sec.gov. Forms N-Q may also be reviewed and copied at the SEC’s Public Reference Room (see the back cover of this report for further information).
| | | | |
| | | | | Market |
| | | | | Value• |
| | | | Shares | ($000) |
| Common Stocks (100.0%) | | | |
| Communications Equipment (12.4%) | |
| * | Cisco Systems Inc. | 2,562,253 | 62,340 |
| | QUALCOMM Inc. | | 790,652 | 29,009 |
| * | Motorola Inc. | 1,100,949 | 7,442 |
| * | Juniper Networks Inc. | | 250,560 | 7,011 |
| | Harris Corp. | | 63,585 | 2,875 |
| * | F5 Networks Inc. | | 38,613 | 2,155 |
| * | 3Com Corp. | | 194,846 | 1,487 |
| | Tellabs Inc. | | 182,615 | 1,262 |
| * | Brocade Communications | | | |
| | Systems Inc. | | 207,002 | 1,205 |
| * | CommScope Inc. | | 46,628 | 1,189 |
| * | JDS Uniphase Corp. | | 109,516 | 1,175 |
| * | Polycom Inc. | | 42,333 | 1,105 |
| * | Riverbed Technology Inc. | | 28,548 | 778 |
| | Plantronics Inc. | | 25,426 | 723 |
| | ADTRAN Inc. | | 29,470 | 689 |
| * | Ciena Corp. | | 47,589 | 682 |
| * | Arris Group Inc. | | 65,370 | 675 |
| * | Blue Coat Systems Inc. | | 21,076 | 611 |
| * | InterDigital Inc. | | 22,786 | 584 |
| * | Emulex Corp. | | 42,972 | 546 |
| * | Tekelec | | 32,460 | 536 |
| * | Palm Inc. | | 79,882 | 487 |
| * | Comtech | | | |
| | Telecommunications Corp. | 15,383 | 486 |
| * | Netgear Inc. | | 18,953 | 480 |
| * | Viasat Inc. | | 15,677 | 477 |
| * | Aruba Networks Inc. | | 34,438 | 404 |
| * | EchoStar Corp. Class A | | 19,926 | 401 |
| * | Finisar Corp. | | 31,193 | 391 |
| * | DG FastChannel Inc. | | 11,646 | 377 |
| * | Infinera Corp. | | 49,489 | 375 |
| * | Harmonic Inc. | | 55,154 | 362 |
| * | ADC Telecommunications Inc. | 55,013 | 349 |
| * | Sonus Networks Inc. | | 158,449 | 337 |
| | Black Box Corp. | | 10,502 | 304 |
| * | Acme Packet Inc. | | 18,008 | 300 |
| * | Loral Space & | | | |
| | Communications Inc. | | 7,722 | 251 |
| | Sycamore Networks Inc. | | 12,646 | 244 |
| * | Aviat Networks Inc. | | 37,778 | 232 |
| * | Oplink Communications Inc. | 13,987 | 216 |
| * | Hughes Communications Inc. 6,817 | 192 |
| * | ShoreTel Inc. | | 31,843 | 191 |
| * | Extreme Networks | | 66,078 | 182 |
| * | Symmetricom Inc. | | 30,817 | 181 |
| * | Digi International Inc. | | 17,785 | 181 |
| * | UTStarcom Inc. | | 82,046 | 179 |
| * | EMS Technologies Inc. | | 11,759 | 161 |
| * | Seachange International Inc. | 22,675 | 161 |
| | Bel Fuse Inc. Class B | | 6,914 | 157 |
| * | Airvana Inc. | | 20,245 | 154 |
| * | Ixia | | 19,053 | 147 |
| * | Anaren Inc. | | 11,956 | 147 |
| | | | |
| | | | | Market |
| | | | | Value• |
| | | | Shares | ($000) |
| * | Cogo Group Inc. | | 20,764 | 146 |
| * | Powerwave Technologies Inc. 115,922 | 136 |
| * | BigBand Networks Inc. | 40,549 | 117 |
| | Bel Fuse Inc. Class A | | 4,136 | 89 |
| * | Opnext Inc. | | 42,050 | 86 |
| | | | | 133,159 |
| Computers & Peripherals (25.0%) | |
| * | Apple Inc. | | 406,639 | 83,206 |
| | International Business | | | |
| | Machines Corp. | | 590,787 | 75,125 |
| | Hewlett-Packard Co. | 1,045,493 | 53,101 |
| * | EMC Corp. | | 967,153 | 16,916 |
| * | Dell Inc. | | 836,220 | 11,063 |
| * | NetApp Inc. | | 160,985 | 4,831 |
| * | Seagate Technology | | 238,310 | 4,745 |
| * | Western Digital Corp. | | 107,979 | 4,171 |
| * | SanDisk Corp. | | 110,011 | 3,205 |
| * | Teradata Corp. | | 83,048 | 2,532 |
| * | Lexmark International Inc. | | |
| | Class A | | 38,808 | 1,308 |
| * | QLogic Corp. | | 57,657 | 1,049 |
| * | NCR Corp. | | 80,099 | 1,011 |
| | Diebold Inc. | | 33,494 | 970 |
| * | Synaptics Inc. | | 18,381 | 491 |
| * | Intermec Inc. | | 27,955 | 398 |
| * | Quantum Corp. | | 125,549 | 311 |
| * | Electronics for Imaging Inc. | 26,131 | 310 |
| * | Avid Technology Inc. | | 22,386 | 301 |
| * | Stratasys Inc. | | 11,339 | 299 |
| * | Netezza Corp. | | 29,570 | 270 |
| * | Super Micro Computer Inc. | 16,852 | 253 |
| * | Adaptec Inc. | | 77,381 | 238 |
| * | STEC Inc. | | 22,532 | 232 |
| * | Compellent Technologies Inc. | 14,382 | 223 |
| * | Silicon Graphics | | | |
| | International Corp. | | 20,387 | 219 |
| * | Intevac Inc. | | 14,620 | 207 |
| * | Imation Corp. | | 21,192 | 195 |
| * | 3PAR Inc. | | 20,053 | 185 |
| * | Novatel Wireless Inc. | | 23,059 | 154 |
| * | Isilon Systems Inc. | | 19,364 | 143 |
| | | | | 267,662 |
| Diversified Telecommunication | | |
| Services (0.1%) | | | |
| * | NeuStar Inc. Class A | | 37,918 | 879 |
| |
| Electrical Equipment (0.0%) | | |
| * | Power-One Inc. | | 46,387 | 176 |
| |
| Electronic Equipment, Instruments & | |
| Components (5.6%) | | | |
| | Corning Inc. | | 738,678 | 13,023 |
| | Tyco Electronics Ltd. | | 219,210 | 5,618 |
| * | Agilent Technologies Inc. | 165,079 | 5,193 |
| | Amphenol Corp. Class A | 82,547 | 3,438 |
| * | Flextronics International Ltd. | 392,600 | 2,733 |
| | | |
| | | | Market |
| | | | Value• |
| | | Shares | ($000) |
| * | Avnet Inc. | 73,770 | 2,037 |
| * | FLIR Systems Inc. | 74,076 | 1,986 |
| * | Arrow Electronics Inc. | 58,821 | 1,659 |
| * | Trimble Navigation Ltd. | 59,216 | 1,591 |
| * | Dolby Laboratories Inc. | | |
| | Class A | 26,556 | 1,415 |
| | Jabil Circuit Inc. | 90,197 | 1,368 |
| * | Itron Inc. | 19,924 | 1,334 |
| * | Ingram Micro Inc. | 73,057 | 1,293 |
| * | Tech Data Corp. | 25,225 | 1,081 |
| | National Instruments Corp. | 29,577 | 935 |
| * | Vishay Intertechnology Inc. | 88,045 | 902 |
| * | Plexus Corp. | 20,496 | 707 |
| * | Sanmina-SCI Corp. | 41,023 | 679 |
| | Molex Inc. Class A | 38,644 | 672 |
| * | Benchmark Electronics Inc. | 33,558 | 664 |
| | Molex Inc. | 32,436 | 663 |
| * | Anixter International Inc. | 15,281 | 638 |
| * | Checkpoint Systems Inc. | 22,180 | 457 |
| * | Coherent Inc. | 13,556 | 431 |
| * | Littelfuse Inc. | 11,960 | 426 |
| * | L-1 Identity Solutions Inc. | 48,347 | 412 |
| | Cognex Corp. | 21,178 | 400 |
| * | Scansource Inc. | 15,016 | 390 |
| | AVX Corp. | 29,261 | 360 |
| * | Rofin-Sinar Technologies Inc. | 16,801 | 344 |
| * | DTS Inc. | 10,632 | 340 |
| * | Insight Enterprises Inc. | 26,551 | 340 |
| * | SYNNEX Corp. | 11,781 | 337 |
| | Park Electrochemical Corp. | 11,507 | 313 |
| * | OSI Systems Inc. | 9,652 | 298 |
| | Methode Electronics Inc. | 22,501 | 280 |
| * | Brightpoint Inc. | 38,648 | 276 |
| * | Cogent Inc. | 27,418 | 271 |
| * | Rogers Corp. | 9,793 | 269 |
| | MTS Systems Corp. | 9,419 | 256 |
| * | FARO Technologies Inc. | 10,431 | 250 |
| * | Newport Corp. | 23,078 | 243 |
| * | TTM Technologies Inc. | 27,888 | 238 |
| * | IPG Photonics Corp. | 14,822 | 234 |
| * | Universal Display Corp. | 21,516 | 227 |
| * | China Security & Surveillance | | |
| | Technology Inc. | 32,809 | 226 |
| * | Electro Scientific | | |
| | Industries Inc. | 17,991 | 225 |
| * | Maxwell Technologies Inc. | 15,414 | 214 |
| * | SMART Modular | | |
| | Technologies WWH Inc. | 31,512 | 202 |
| | CTS Corp. | 24,031 | 191 |
| | Daktronics Inc. | 25,089 | 190 |
| | Agilysys Inc. | 17,392 | 190 |
| * | Echelon Corp. | 22,204 | 183 |
| * | Multi-Fineline Electronix Inc. | 7,656 | 167 |
| | Electro Rent Corp. | 14,031 | 163 |
| * | Comverge Inc. | 16,075 | 156 |
| | Technitrol Inc. | 33,848 | 149 |
66
Information Technology Index Fund
| | | |
| | | | Market |
| | | | Value• |
| | | Shares | ($000) |
| * | CPI International Inc. | 8,652 | 107 |
| * | ICx Technologies Inc. | 14,858 | 97 |
| | | | 59,481 |
| Internet Software & Services (9.5%) | |
| * | Google Inc. Class A | 107,783 | 56,780 |
| * | eBay Inc. | 552,295 | 12,714 |
| * | Yahoo! Inc. | 632,444 | 9,683 |
| * | VeriSign Inc. | 93,497 | 2,330 |
| * | Akamai Technologies Inc. | 83,389 | 2,193 |
| * | Equinix Inc. | 19,106 | 1,805 |
| * | AOL Inc. | 53,508 | 1,326 |
| * | VistaPrint NV | 20,440 | 1,180 |
| * | IAC/InterActiveCorp | 47,965 | 1,074 |
| * | WebMD Health Corp. | 24,610 | 1,060 |
| * | Monster Worldwide Inc. | 60,573 | 845 |
| * | Sohu.com Inc. | 15,819 | 810 |
| * | GSI Commerce Inc. | 28,226 | 705 |
| * | MercadoLibre Inc. | 14,069 | 579 |
| * | Digital River Inc. | 20,656 | 543 |
| * | j2 Global Communications Inc. | 24,310 | 527 |
| * | Rackspace Hosting Inc. | 26,460 | 525 |
| | Earthlink Inc. | 58,245 | 486 |
| * | ValueClick Inc. | 47,369 | 449 |
| * | Art Technology Group Inc. | 87,687 | 348 |
| * | DealerTrack Holdings Inc. | 22,670 | 322 |
| * | SAVVIS Inc. | 22,294 | 314 |
| | United Online Inc. | 49,985 | 313 |
| * | OpenTable Inc. | 8,311 | 283 |
| * | ModusLink Global | | |
| | Solutions Inc. | 28,064 | 278 |
| * | RealNetworks Inc. | 57,531 | 265 |
| * | Switch & Data | | |
| | Facilities Co. Inc. | 14,202 | 254 |
| | NIC Inc. | 33,996 | 254 |
| * | Constant Contact Inc. | 13,387 | 250 |
| * | Infospace Inc. | 22,921 | 231 |
| * | Perficient Inc. | 20,409 | 226 |
| * | Terremark Worldwide Inc. | 30,360 | 219 |
| * | comScore Inc. | 13,410 | 208 |
| * | Vocus Inc. | 13,143 | 187 |
| * | LoopNet Inc. | 19,660 | 186 |
| * | Internet Capital Group Inc. | 27,151 | 185 |
| * | Internap Network | | |
| | Services Corp. | 34,847 | 175 |
| * | Move Inc. | 109,705 | 172 |
| * | Knot Inc. | 21,552 | 165 |
| * | Liquidity Services Inc. | 12,923 | 159 |
| * | Internet Brands Inc. Class A | 18,525 | 153 |
| * | DivX Inc. | 23,728 | 143 |
| * | Limelight Networks Inc. | 34,431 | 127 |
| * | Dice Holdings Inc. | 18,535 | 122 |
| * | Stamps.com Inc. | 12,833 | 116 |
| | Marchex Inc. Class B | 21,436 | 110 |
| * | TechTarget Inc. | 6,445 | 34 |
| | | | 101,413 |
| IT Services (9.9%) | | |
| | Visa Inc. Class A | 222,836 | 19,003 |
| | Accenture PLC Class A | 298,120 | 11,916 |
| | Mastercard Inc. Class A | 46,956 | 10,535 |
| | Automatic Data | | |
| | Processing Inc. | 239,913 | 9,983 |
| * | Cognizant Technology | | |
| | Solutions Corp. Class A | 140,568 | 6,766 |
| | Western Union Co. | 330,922 | 5,222 |
| | Paychex Inc. | 155,755 | 4,663 |
| * | Computer Sciences Corp. | 73,224 | 3,792 |
| * | SAIC Inc. | 190,761 | 3,758 |
| * | Fiserv Inc. | 74,055 | 3,572 |
| | | | |
| | | | | Market |
| | | | | Value• |
| | | | Shares | ($000) |
| | Fidelity National Information | | |
| | Services Inc. | | 152,386 | 3,435 |
| | Lender Processing | | | |
| | Services Inc. | | 46,922 | 1,791 |
| | Global Payments Inc. | | 39,771 | 1,703 |
| * | Hewitt Associates Inc. | | | |
| | Class A | | 41,417 | 1,573 |
| * | Alliance Data Systems Corp. | 25,813 | 1,431 |
| | Broadridge Financial | | | |
| | Solutions Inc. | | 67,624 | 1,423 |
| | Total System Services Inc. | 83,625 | 1,191 |
| * | Gartner Inc. | | 38,945 | 926 |
| * | DST Systems Inc. | | 20,455 | 786 |
| * | Convergys Corp. | | 63,236 | 780 |
| * | CACI International Inc. | | | |
| | Class A | | 15,540 | 770 |
| * | Unisys Corp. | | 21,743 | 759 |
| * | VeriFone Holdings Inc. | | 39,309 | 759 |
| * | Acxiom Corp. | | 39,310 | 663 |
| * | Cybersource Corp. | | 35,128 | 602 |
| * | Genpact Ltd. | | 39,876 | 602 |
| * | Mantech International | | | |
| | Corp. Class A | | 11,884 | 587 |
| * | Wright Express Corp. | | 19,237 | 545 |
| | MAXIMUS Inc. | | 9,443 | 544 |
| | Sapient Corp. | | 57,337 | 517 |
| | Syntel Inc. | | 13,694 | 464 |
| * | SRA International Inc. | | | |
| | Class A | | 24,006 | 458 |
| * | Euronet Worldwide Inc. | 25,026 | 453 |
| * | CSG Systems | | | |
| | International Inc. | | 19,649 | 395 |
| * | TeleTech Holdings Inc. | | 20,979 | 367 |
| * | TNS Inc. | | 14,868 | 351 |
| * | Forrester Research Inc. | 9,582 | 287 |
| * | Global Cash Access | | | |
| | Holdings Inc. | | 34,658 | 260 |
| | Heartland Payment | | | |
| | Systems Inc. | | 14,953 | 229 |
| * | RightNow Technologies Inc. | 14,334 | 223 |
| * | infoGROUP Inc. | | 24,304 | 195 |
| * | Ciber Inc. | | 48,071 | 179 |
| * | ExlService Holdings Inc. | 10,340 | 178 |
| | iGate Corp. | | 18,598 | 170 |
| | Cass Information Systems Inc. 5,190 | 157 |
| * | Ness Technologies Inc. | 27,377 | 156 |
| * | NCI Inc. Class A | | 5,501 | 155 |
| * | China Information Security | | |
| | Technology Inc. | | 26,776 | 132 |
| * | Integral Systems Inc. | | 15,307 | 131 |
| | | | | 105,537 |
| Office Electronics (0.6%) | | | |
| | Xerox Corp. | | 645,887 | 6,052 |
| * | Zebra Technologies Corp. | 29,953 | 856 |
| | | | | 6,908 |
| Semiconductors & Semiconductor | |
| Equipment (14.7%) | | | |
| | Intel Corp. | 2,427,972 | 49,846 |
| | Texas Instruments Inc. | | 594,448 | 14,493 |
| | Applied Materials Inc. | | 635,172 | 7,774 |
| | Broadcom Corp. Class A | 208,236 | 6,522 |
| * | Marvell Technology | | | |
| | Group Ltd. | | 253,238 | 4,893 |
| * | NVIDIA Corp. | | 265,968 | 4,309 |
| | Analog Devices Inc. | | 140,015 | 4,094 |
| * | Micron Technology Inc. | 408,603 | 3,702 |
| | Altera Corp. | | 142,223 | 3,474 |
| | Xilinx Inc. | | 133,296 | 3,443 |
| * | Cree Inc. | | 48,596 | 3,296 |
| | | |
| | | | Market |
| | | | Value• |
| | | Shares | ($000) |
| | Linear Technology Corp. | 107,718 | 2,927 |
| | Maxim Integrated | | |
| | Products Inc. | 147,601 | 2,734 |
| | KLA-Tencor Corp. | 82,839 | 2,413 |
| | Microchip Technology Inc. | 89,091 | 2,411 |
| * | Advanced Micro | | |
| | Devices Inc. | 277,274 | 2,193 |
| * | Lam Research Corp. | 61,928 | 2,100 |
| * | LSI Corp. | 320,003 | 1,725 |
| | National | | |
| | Semiconductor Corp. | 116,682 | 1,690 |
| * | ON Semiconductor Corp. | 198,614 | 1,581 |
| * | MEMC Electronic | | |
| | Materials Inc. | 110,693 | 1,340 |
| * | Skyworks Solutions Inc. | 85,046 | 1,299 |
| * | Atheros | | |
| | Communications Inc. | 33,200 | 1,192 |
| * | Varian Semiconductor | | |
| | Equipment Associates Inc. | 36,817 | 1,107 |
| * | Rambus Inc. | 50,197 | 1,102 |
| * | Novellus Systems Inc. | 48,652 | 1,076 |
| * | Silicon Laboratories Inc. | 21,884 | 994 |
| * | Atmel Corp. | 216,782 | 978 |
| * | PMC–Sierra Inc. | 114,910 | 954 |
| * | Cypress Semiconductor Corp. | 78,832 | 933 |
| | Intersil Corp. Class A | 62,237 | 924 |
| * | Teradyne Inc. | 88,991 | 889 |
| * | Avago Technologies Ltd. | 42,890 | 778 |
| * | International Rectifier Corp. | 36,787 | 744 |
| * | Fairchild Semiconductor | | |
| | International Inc. Class A | 64,754 | 668 |
| * | Veeco Instruments Inc. | 19,565 | 667 |
| * | Microsemi Corp. | 42,677 | 662 |
| * | TriQuint Semiconductor Inc. | 81,373 | 585 |
| * | RF Micro Devices Inc. | 134,970 | 568 |
| * | Netlogic Microsystems Inc. | 10,203 | 553 |
| * | Hittite Microwave Corp. | 12,882 | 538 |
| | Power Integrations Inc. | 14,576 | 524 |
| * | Semtech Corp. | 32,981 | 523 |
| * | Integrated Device | | |
| | Technology Inc. | 89,792 | 491 |
| * | Cavium Networks Inc. | 20,395 | 487 |
| * | Tessera Technologies Inc. | 26,867 | 483 |
| * | Cymer Inc. | 14,894 | 466 |
| * | MKS Instruments Inc. | 25,590 | 461 |
| * | Cabot Microelectronics Corp. | 12,811 | 454 |
| * | FormFactor Inc. | 27,312 | 449 |
| * | FEI Co. | 20,791 | 442 |
| * | Omnivision Technologies Inc. | 28,418 | 413 |
| * | Amkor Technology Inc. | 66,528 | 400 |
| * | Diodes Inc. | 19,625 | 385 |
| * | Monolithic Power | | |
| | Systems Inc. | 17,073 | 347 |
| * | Applied Micro Circuits Corp. | 38,721 | 346 |
| * | Zoran Corp. | 30,134 | 342 |
| * | Verigy Ltd. | 33,477 | 333 |
| * | Entegris Inc. | 73,763 | 330 |
| * | Brooks Automation Inc. | 37,330 | 323 |
| * | ATMI Inc. | 18,466 | 311 |
| * | Volterra Semiconductor Corp. | 13,545 | 296 |
| * | Advanced Energy | | |
| | Industries Inc. | 20,025 | 291 |
| | Micrel Inc. | 27,959 | 275 |
| * | Kulicke & Soffa | | |
| | Industries Inc. | 41,738 | 275 |
| * | Cirrus Logic Inc. | 38,213 | 273 |
| * | Standard | | |
| | Microsystems Corp. | 13,669 | 267 |
| * | Actel Corp. | 17,455 | 224 |
67
Information Technology Index Fund
| | | |
| | | | Market |
| | | | Value• |
| | | Shares | ($000) |
| * | Lattice Semiconductor Corp. | 76,658 | 220 |
| * | Sigma Designs Inc. | 17,791 | 208 |
| | Cohu Inc. | 15,244 | 204 |
| * | Ultratech Inc. | 15,524 | 200 |
| * | Exar Corp. | 26,232 | 194 |
| * | Conexant Systems Inc. | 40,544 | 194 |
| * | Silicon Storage | | |
| | Technology Inc. | 60,661 | 194 |
| * | Supertex Inc. | 7,691 | 184 |
| * | Kopin Corp. | 48,121 | 183 |
| * | Anadigics Inc. | 44,340 | 182 |
| * | Pericom Semiconductor Corp. | 18,551 | 174 |
| * | Rudolph Technologies Inc. | 21,183 | 169 |
| * | IXYS Corp. | 18,136 | 154 |
| * | Rubicon Technology Inc. | 9,528 | 150 |
| * | Silicon Image Inc. | 61,803 | 150 |
| * | Mattson Technology Inc. | 39,889 | 147 |
| * | DSP Group Inc. | 19,216 | 141 |
| * | Advanced Analogic | | |
| | Technologies Inc. | 38,237 | 125 |
| * | Trident Microsystems Inc. | 74,320 | 110 |
| | | | 157,665 |
| Software (22.2%) | | |
| | Microsoft Corp. | 3,643,723 | 104,429 |
| | Oracle Corp. | 1,897,108 | 46,764 |
| * | Adobe Systems Inc. | 249,046 | 8,629 |
| * | Symantec Corp. | 386,380 | 6,395 |
| * | Intuit Inc. | 144,015 | 4,660 |
| | CA Inc. | 198,783 | 4,473 |
| * | Citrix Systems Inc. | 87,890 | 3,780 |
| * | Salesforce.com Inc. | 54,028 | 3,671 |
| * | BMC Software Inc. | 88,391 | 3,256 |
| * | Autodesk Inc. | 110,979 | 3,094 |
| * | McAfee Inc. | 76,104 | 3,021 |
| | Activision Blizzard Inc. | 275,641 | 2,930 |
| * | Electronic Arts Inc. | 157,608 | 2,613 |
| * | Red Hat Inc. | 90,913 | 2,550 |
| * | ANSYS Inc. | 43,383 | 1,903 |
| * | Sybase Inc. | 39,965 | 1,774 |
| * | Rovi Corp. | 50,601 | 1,695 |
| * | Synopsys Inc. | 71,751 | 1,571 |
| * | Nuance Communications Inc. | 103,165 | 1,485 |
| | Factset Research | | |
| | Systems Inc. | 22,211 | 1,470 |
| * | VMware Inc. Class A | 27,718 | 1,372 |
| * | MICROS Systems Inc. | 39,752 | 1,194 |
| * | Informatica Corp. | 44,822 | 1,144 |
| | Solera Holdings Inc. | 33,117 | 1,131 |
| * | Parametric Technology Corp. | 59,406 | 1,034 |
| | Jack Henry & Associates Inc. | 40,841 | 922 |
| * | Compuware Corp. | 117,713 | 882 |
| * | Concur Technologies Inc. | 21,314 | 839 |
| * | Novell Inc. | 176,843 | 829 |
| * | TIBCO Software Inc. | 86,901 | 797 |
| * | Cadence Design | | |
| | Systems Inc. | 138,198 | 788 |
| * | Blackboard Inc. | 16,276 | 636 |
| * | Progress Software Corp. | 21,264 | 596 |
| | Fair Isaac Corp. | 25,563 | 587 |
| * | JDA Software Group Inc. | 20,377 | 577 |
| * | Ariba Inc. | 47,726 | 573 |
| * | Quest Software Inc. | 33,720 | 568 |
| * | TiVo Inc. | 58,304 | 553 |
| | Blackbaud Inc. | 23,594 | 549 |
| | | |
| | | | Market |
| | | | Value• |
| | | Shares | ($000) |
| * | Websense Inc. | 23,750 | 510 |
| * | CommVault Systems Inc. | 21,716 | 476 |
| * | SuccessFactors Inc. | 25,489 | 462 |
| * | Taleo Corp. Class A | 19,165 | 451 |
| * | MicroStrategy Inc. Class A | 5,062 | 449 |
| * | Mentor Graphics Corp. | 53,857 | 448 |
| * | Take-Two Interactive | | |
| | Software Inc. | 45,278 | 436 |
| * | Lawson Software Inc. | 71,749 | 432 |
| * | AsiaInfo Holdings Inc. | 17,028 | 416 |
| * | Ultimate Software Group Inc. | 13,187 | 408 |
| * | Net 1 UEPS Technologies Inc. | 21,843 | 386 |
| * | Advent Software Inc. | 9,499 | 383 |
| * | ACI Worldwide Inc. | 19,991 | 365 |
| * | Tyler Technologies Inc. | 19,005 | 345 |
| | Pegasystems Inc. | 9,556 | 344 |
| * | Manhattan Associates Inc. | 13,178 | 333 |
| * | SolarWinds Inc. | 17,155 | 323 |
| * | Epicor Software Corp. | 32,008 | 274 |
| * | ArcSight Inc. | 10,201 | 273 |
| * | SonicWALL Inc. | 33,485 | 268 |
| * | Netscout Systems Inc. | 17,687 | 258 |
| * | THQ Inc. | 41,984 | 254 |
| * | Bottomline Technologies Inc. | 15,482 | 246 |
| * | Sourcefire Inc. | 10,299 | 241 |
| * | Synchronoss Technologies Inc. | 13,317 | 232 |
| * | EPIQ Systems Inc. | 19,820 | 230 |
| * | Ebix Inc. | 15,303 | 222 |
| * | S1 Corp. | 34,902 | 217 |
| * | TeleCommunication | | |
| | Systems Inc. Class A | 28,344 | 216 |
| * | Radiant Systems Inc. | 18,178 | 203 |
| * | Rosetta Stone Inc. | 9,045 | 199 |
| * | Smith Micro Software Inc. | 22,064 | 193 |
| * | Interactive Intelligence Inc. | 9,691 | 191 |
| * | VASCO Data Security | | |
| | International Inc. | 22,351 | 177 |
| * | Monotype Imaging | | |
| | Holdings Inc. | 17,140 | 163 |
| | Opnet Technologies Inc. | 10,792 | 160 |
| * | Kenexa Corp. | 15,927 | 157 |
| * | NetSuite Inc. | 12,321 | 152 |
| * | PROS Holdings Inc. | 16,002 | 139 |
| * | DemandTec Inc. | 23,078 | 136 |
| * | Double-Take Software Inc. | 15,264 | 135 |
| * | Symyx Technologies Inc. | 30,297 | 132 |
| | Renaissance Learning Inc. | 9,444 | 132 |
| * | FalconStor Software Inc. | 35,811 | 127 |
| * | Magma Design | | |
| | Automation Inc. | 48,768 | 121 |
| * | China TransInfo | | |
| | Technology Corp. | 13,570 | 107 |
| * | Deltek Inc. | 12,531 | 96 |
| | | | 238,352 |
| Total Investments (100.0%) | | |
| (Cost $1,055,751) | | 1,071,232 |
| Other Assets and Liabilities (0.0%) | |
| Other Assets | | 31,701 |
| Liabilities | | (31,291) |
| | | | 410 |
| Net Assets (100%) | | 1,071,642 |
| |
| At February 28, 2010, net assets consisted of: |
| | Amount |
| | ($000) |
| Paid-in Capital | 1,096,994 |
| Undistributed Net Investment Income | 1,302 |
| Accumulated Net Realized Losses | (42,135) |
| Unrealized Appreciation (Depreciation) | 15,481 |
| Net Assets | 1,071,642 |
| |
| Admiral Shares—Net Assets | |
| Applicable to 1,658,751 outstanding | |
| $.001 par value shares of beneficial | |
| interest (unlimited authorization) | 44,689 |
| Net Asset Value Per Share— | |
| Admiral Shares | $26.94 |
| |
| ETF Shares—Net Assets | |
| Applicable to 19,516,155 outstanding | |
| $.001 par value shares of beneficial | |
| interest (unlimited authorization) | 1,026,953 |
| Net Asset Value Per Share— | |
| ETF Shares | $52.62 |
• See Note A in Notes to Financial Statements.
* Non-income-producing security.
See accompanying Notes, which are an integral part of the Financial Statements.
68
Information Technology Index Fund
| |
| Statement of Operations |
| |
| Six Months Ended |
| February 28, 2010 |
| | ($000) |
| Investment Income | |
| Income | |
| Dividends | 4,413 |
| Security Lending | 1 |
| Total Income | 4,414 |
| Expenses | |
| The Vanguard Group—Note B | |
| Investment Advisory Services | 60 |
| Management and Administrative— | |
| Admiral Shares | 43 |
| Management and Administrative— | |
| ETF Shares | 792 |
| Marketing and Distribution— | |
| Admiral Shares | 3 |
| Marketing and Distribution— | |
| ETF Shares | 111 |
| Custodian Fees | 15 |
| Shareholders’ Reports—Admiral Shares | — |
| Shareholders’ Reports—ETF Shares | 12 |
| Trustees’ Fees and Expenses | 1 |
| Total Expenses | 1,037 |
| Net Investment Income | 3,377 |
| Realized Net Gain (Loss) on | |
| Investment Securities Sold | 6,142 |
| Change in Unrealized Appreciation | |
| (Depreciation) of Investment Securities | 61,224 |
| Net Increase (Decrease) in Net Assets | |
| Resulting from Operations | 70,743 |
| | |
| Statement of Changes in Net Assets | | |
| |
| | Six Months Ended | Year Ended |
| | February 28, | August 31, |
| | 2010 | 2009 |
| | ($000) | ($000) |
| Increase (Decrease) in Net Assets | | |
| Operations | | |
| Net Investment Income | 3,377 | 3,610 |
| Realized Net Gain (Loss) | 6,142 | (27,908) |
| Change in Unrealized Appreciation (Depreciation) | 61,224 | 5,476 |
| Net Increase (Decrease) in Net Assets Resulting from Operations | 70,743 | (18,822) |
| Distributions | | |
| Net Investment Income | | |
| Admiral Shares | (165) | (133) |
| ETF Shares | (4,304) | (3,037) |
| Realized Capital Gain | | |
| Admiral Shares | — | — |
| ETF Shares | — | — |
| Total Distributions | (4,469) | (3,170) |
| Capital Share Transactions | | |
| Admiral Shares | 8,713 | 7,447 |
| ETF Shares | 324,667 | 163,810 |
| Net Increase (Decrease) from Capital Share Transactions | 333,380 | 171,257 |
| Total Increase (Decrease) | 399,654 | 149,265 |
| Net Assets | | |
| Beginning of Period | 671,988 | 522,723 |
| End of Period1 | 1,071,642 | 671,988 |
1 Net Assets—End of Period includes undistributed net investment income of $1,302,000 and $2,394,000.
See accompanying Notes, which are an integral part of the Financial Statements.
69
| | | | | | | |
| Information Technology Index Fund | | | | | | |
| |
| |
| Financial Highlights | | | | | | |
| |
| Admiral Shares | | | | | | | |
| | Six Months | | | | | |
| | | Ended | | | | | |
| For a Share Outstanding | February 28, | | | | Year Ended August 31, |
| Throughout Each Period | | 2010 | 2009 | 2008 | 2007 | 2006 | 2005 |
| Net Asset Value, Beginning of Period | $24.39 | $27.28 | $29.95 | $24.40 | $23.93 | $20.72 |
| Investment Operations | | | | | | | |
| Net Investment Income | | .066 | .1631 | .121 | .1101 | .0841 | .3512 |
| Net Realized and Unrealized Gain (Loss) | | | | | | |
| on Investments | | 2.602 | (2.897) | (2.706) | 5.500 | .424 | 3.182 |
| Total from Investment Operations | 2.668 | (2.734) | (2.585) | 5.610 | .508 | 3.533 |
| Distributions | | | | | | | |
| Dividends from Net Investment Income | (.118) | (.156) | (.085) | (.060) | (.038) | (.323) |
| Distributions from Realized Capital Gains | — | — | — | — | — | — |
| Total Distributions | | (.118) | (.156) | (.085) | (.060) | (.038) | (.323) |
| Net Asset Value, End of Period | | $26.94 | $24.39 | $27.28 | $29.95 | $24.40 | $23.93 |
| |
| Total Return3 | | 10.93% | –9.79% | –8.67% | 23.02% | 2.12% | 17.05% |
| |
| Ratios/Supplemental Data | | | | | | | |
| Net Assets, End of Period (Millions) | $45 | $33 | $26 | $12 | $5 | $2 |
| Ratio of Total Expenses to | | | | | | | |
| Average Net Assets | | 0.26%5 | 0.28% | 0.25% | 0.26% | 0.28% | 0.28% |
| Ratio of Net Investment Income to | | | | | | |
| Average Net Assets | | 0.73%5 | 0.82% | 0.46% | 0.38% | 0.33% | 1.26%2 |
| Portfolio Turnover Rate4 | | 10%5 | 12% | 11% | 8% | 8% | 7% |
1 Calculated based on average shares outstanding.
2 Net investment income per share and the ratio of net investment income to average net assets include $.284 and 1.00%, respectively, resulting from a special dividend from Microsoft Corp. in November 2004.
3 Total returns do not reflect the 2% fee assessed on redemptions of shares held for less than one year.
4 Excludes the value of portfolio securities received or delivered as a result of in-kind purchases or redemptions of the fund’s capital shares, including ETF Creation Units.
5 Annualized.
See accompanying Notes, which are an integral part of the Financial Statements.
70
| | | | | | | |
| Information Technology Index Fund | | | | | | |
| |
| |
| Financial Highlights | | | | | | |
| |
| ETF Shares | | | | | | | |
| | Six Months | | | | | |
| | | Ended | | | | | |
| For a Share Outstanding | February 28, | | | | Year Ended August 31, |
| Throughout Each Period | | 2010 | 2009 | 2008 | 2007 | 2006 | 2005 |
| Net Asset Value, Beginning of Period | $47.64 | $53.32 | $58.52 | $47.66 | $46.76 | $40.46 |
| Investment Operations | | | | | | | |
| Net Investment Income | | .144 | .3311 | .249 | .2311 | .1751 | .6702 |
| Net Realized and Unrealized Gain (Loss) | | | | | | |
| on Investments | | 5.086 | (5.685) | (5.274) | 10.765 | .816 | 6.239 |
| Total from Investment Operations | 5.230 | (5.354) | (5.025) | 10.996 | .991 | 6.909 |
| Distributions | | | | | | | |
| Dividends from Net Investment Income | (.250) | (.326) | (.175) | (.136) | (.091) | (.609) |
| Distributions from Realized Capital Gains | — | — | — | — | — | — |
| Total Distributions | | (.250) | (.326) | (.175) | (.136) | (.091) | (.609) |
| Net Asset Value, End of Period | | $52.62 | $47.64 | $53.32 | $58.52 | $47.66 | $46.76 |
| |
| Total Return | | 10.96% | –9.78% | –8.62% | 23.10% | 2.11% | 17.07% |
| |
| Ratios/Supplemental Data | | | | | | | |
| Net Assets, End of Period (Millions) | $1,027 | $639 | $497 | $439 | $172 | $51 |
| Ratio of Total Expenses to | | | | | | | |
| Average Net Assets | | 0.23%4 | 0.25% | 0.20% | 0.22% | 0.25% | 0.26% |
| Ratio of Net Investment Income to | | | | | | |
| Average Net Assets | | 0.76%4 | 0.85% | 0.51% | 0.42% | 0.36% | 1.28%2 |
| Portfolio Turnover Rate3 | | 10%4 | 12% | 11% | 8% | 8% | 7% |
1 Calculated based on average shares outstanding.
2 Net investment income per share and the ratio of net investment income to average net assets include $.553 and 1.00%, respectively, resulting from a special dividend from Microsoft Corp. in November 2004.
3 Excludes the value of portfolio securities received or delivered as a result of in-kind purchases or redemptions of the fund’s capital shares, including ETF Creation Units.
4 Annualized.
See accompanying Notes, which are an integral part of the Financial Statements.
71
Information Technology Index Fund
Notes to Financial Statements
Vanguard Information Technology Index Fund is registered under the Investment Company Act of 1940 as an open-end investment company, or mutual fund. The fund offers two classes of shares, Admiral Shares and ETF Shares. Admiral Shares are available to any investor who meets the fund’s minimum purchase requirements. ETF Shares are listed for trading on the NYSE Arca, Inc.; they can be purchased and sold through a broker.
A. The following significant accounting policies conform to generally accepted accounting principles for U.S. mutual funds. The fund consistently follows such policies in preparing its financial statements.
1. Security Valuation: Securities are valued as of the close of trading on the New York Stock Exchange (generally 4 p.m., Eastern time) on the valuation date. Equity securities are valued at the latest quoted sales prices or official closing prices taken from the primary market in which each security trades; such securities not traded on the valuation date are valued at the mean of the latest quoted bid and asked prices. Securities for which market quotations are not readily available, or whose values have been materially affected by events occurring before the fund’s pricing time but after the close of the securities’ primary markets, are valued by methods deemed by the board of trustees to represent fair value.
2. Federal Income Taxes: The fund intends to continue to qualify as a regulated investment company and distribute all of its taxable income. Management has analyzed the fund’s tax positions taken for all open federal income tax years (August 31, 2006–2009), and for the period ended February 28, 2010, and has concluded that no provision for federal income tax is required in the fund’s financial statements.
3. Distributions: Distributions to shareholders are recorded on the ex-dividend date.
4. Security Lending: The fund may lend its securities to qualified institutional borrowers to earn additional income. Security loans are required to be secured at all times by collateral at least equal to the market value of securities loaned. The fund invests cash collateral received in Vanguard Market Liquidity Fund, and records a liability for the return of the collateral, during the period the securities are on loan. Security lending income represents the income earned on investing cash collateral, less expenses associated with the loan.
5. Other: Dividend income is recorded on the ex-dividend date. Security transactions are accounted for on the date securities are bought or sold. Costs used to determine realized gains (losses) on the sale of investment securities are those of the specific securities sold. Fees assessed on redemptions of capital shares are credited to paid-in capital.
Each class of shares has equal rights as to assets and earnings, except that each class separately bears certain class-specific expenses related to maintenance of shareholder accounts (included in Management and Administrative expenses) and shareholder reporting. Marketing and distribution expenses are allocated to each class of shares based on a method approved by the board of trustees. Income, other non-class-specific expenses, and gains and losses on investments are allocated to each class of shares based on its relative net assets.
B. The Vanguard Group furnishes at cost investment advisory, corporate management, administrative, marketing, and distribution services. The costs of such services are allocated to the fund under methods approved by the board of trustees. The fund has committed to provide up to 0.40% of its net assets in capital contributions to Vanguard. At February 28, 2010, the fund had contributed capital of $204,000 to Vanguard (included in Other Assets), representing 0.02% of the fund’s net assets and 0.08% of Vanguard’s capitalization. The fund’s trustees and officers are also directors and officers of Vanguard.
C. Various inputs may be used to determine the value of the fund’s investments. These inputs are summarized in three broad levels for financial statement purposes. The inputs or methodologies used to value securities are not necessarily an indication of the risk associated with investing in those securities.
Level 1—Quoted prices in active markets for identical securities.
Level 2—Other significant observable inputs (including quoted prices for similar securities, interest rates, prepayment speeds, credit risk, etc.).
Level 3—Significant unobservable inputs (including the fund’s own assumptions used to determine the fair value of investments).
At February 28, 2010, 100% of the fund’s investments were valued based on Level 1 inputs.
72
Information Technology Index Fund
D. Distributions are determined on a tax basis and may differ from net investment income and realized capital gains for financial reporting purposes. Differences may be permanent or temporary. Permanent differences are reclassified among capital accounts in the financial statements to reflect their tax character. Temporary differences arise when certain items of income, expense, gain, or loss are recognized in different periods for financial statement and tax purposes; these differences will reverse at some time in the future. Differences in classification may also result from the treatment of short-term gains as ordinary income for tax purposes.
During the six months ended February 28, 2010, the fund realized $12,044,000 of net capital gains resulting from in-kind redemptions—in which shareholders exchanged fund shares for securities held by the fund rather than for cash. Because such gains are not taxable to the fund, and are not distributed to shareholders, they have been reclassified from accumulated net realized losses to paid-in capital.
The fund’s tax-basis capital gains and losses are determined only at the end of each fiscal year. For tax purposes, at August 31, 2009, the fund had available capital loss carryforwards totaling $15,094,000 to offset future net capital gains of $63,000 through August 31, 2013, $188,000 through August 31, 2014, $612,000 through August 31, 2015, $218,000 through August 31, 2016, and $14,013,000 through August 31, 2017. In addition, the fund realized losses of $20,087,000 during the period from November 1, 2008, through August 31, 2009, which are deferred and will be treated as realized for tax purposes in fiscal 2010. The fund will use these capital losses to offset net taxable capital gains, if any, realized during the year ending August 31, 2010; should the fund realize net capital losses for the year, the losses will be added to the loss carryforward balances above.
At February 28, 2010, the cost of investment securities for tax purposes was $1,055,751,000. Net unrealized appreciation of investment securities for tax purposes was $15,481,000, consisting of unrealized gains of $75,042,000 on securities that had risen in value since their purchase and $59,561,000 in unrealized losses on securities that had fallen in value since their purchase.
E. During the six months ended February 28, 2010, the fund purchased $409,167,000 of investment securities and sold $77,385,000 of investment securities, other than temporary cash investments.
F. Capital share transactions for each class of shares were:
| | | | |
| | Six Months Ended | | Year Ended |
| | February 28, 2010 | August 31, 2009 |
| | Amount | Shares | Amount | Shares |
| | ($000) | (000) | ($000) | (000) |
| Admiral Shares | | | | |
| Issued | 11,533 | 423 | 14,130 | 714 |
| Issued in Lieu of Cash Distributions | 152 | 5 | 116 | 7 |
| Redeemed1 | (2,972) | (114) | (6,799) | (333) |
| Net Increase (Decrease)—Admiral Shares | 8,713 | 314 | 7,447 | 388 |
| ETF Shares | | | | |
| Issued | 355,653 | 6,700 | 264,940 | 6,802 |
| Issued in Lieu of Cash Distributions | — | — | — | — |
| Redeemed1 | (30,986) | (600) | (101,130) | (2,700) |
| Net Increase (Decrease)—ETF Shares | 324,667 | 6,100 | 163,810 | 4,102 |
| 1 Net of redemption fees for fiscal 2010 and 2009 of $18,000 and $74,000, respectively (fund totals). | | |
G. In preparing the financial statements as of February 28, 2010, management considered the impact of subsequent events for potential recognition or disclosure in these financial statements.
73
Materials Index Fund
Fund Profile
As of February 28, 2010
| | | |
| Portfolio Characteristics | | |
| | | Target | Broad |
| | Fund | Index1 | Index2 |
| Number of Stocks | 123 | 123 | 2,492 |
| Median Market Cap | $10.1B | $10.1B | $29.0B |
| Price/Earnings Ratio | 29.0x | 29.0x | 21.2x |
| Price/Book Ratio | 2.4x | 2.4x | 2.1x |
| Yield3 | | 1.7% | 1.9% |
| Admiral Shares | 1.4% | | |
| ETF Shares | 1.4% | | |
| Return on Equity | 20.4% | 20.3% | 19.4% |
| Earnings Growth Rate | 5.0% | 5.0% | 8.1% |
| Foreign Holdings | 0.0% | 0.0% | 0.0% |
| Turnover Rate4 | 7% | — | — |
| Expense Ratio5 | | — | — |
| Admiral Shares | 0.28% | | |
| ETF Shares | 0.25% | | |
| Short-Term Reserves | 0.0% | — | — |
| | |
| Volatility Measures6 | |
| | Fund Versus | Fund Versus |
| | Target Index1 | Broad Index2 |
| R-Squared | 1.00 | 0.87 |
| Beta | 1.00 | 1.31 |
| |
| Subindustry Diversification | |
| (% of equity exposure) | |
| Aluminum | 3.1% |
| Commodity Chemicals | 1.5 |
| Construction Materials | 2.4 |
| Diversified Chemicals | 19.9 |
| Diversified Metals & Mining | 9.2 |
| Fertilizers & Agricultural Chemicals | 12.9 |
| Forest Products | 2.1 |
| Gold | 5.7 |
| Industrial Gases | 9.1 |
| Metal & Glass Containers | 5.0 |
| Paper Packaging | 3.4 |
| Paper Products | 4.0 |
| Specialty Chemicals | 11.1 |
| Steel | 10.0 |
| Other Materials | 0.6 |
| |
| Ten Largest Holdings7 (% of total net assets) |
| Monsanto Co. | 8.3% |
| Dow Chemical Co. | 7.0 |
| Freeport-McMoRan Copper & Gold Inc. | 7.0 |
| EI du Pont de Nemours & Co. | 6.6 |
| Newmont Mining Corp. | 5.1 |
| Praxair Inc. | 5.0 |
| Air Products & Chemicals Inc. | 3.1 |
| Nucor Corp. | 2.8 |
| Alcoa Inc. | 2.8 |
| PPG Industries Inc. | 2.2 |
| Top Ten | 49.9% |
1 MSCI US IMI/Materials.
2 MSCI US IMI/2500.
3 30-day SEC yield for the fund; annualized dividend yield for the indexes. See the Glossary.
4 Annualized.
5 The expense ratios shown are from the prospectuses dated December 28, 2009, and represent estimated costs for the current fiscal year based on the fund’s net assets as of the prospectus date. For the six months ended February 28, 2010, the annualized expense ratios were 0.26% for the Admiral Shares and 0.23% for the ETF Shares.
6 For an explanation of R-squared, beta, and other terms used here, see the Glossary.
7 The holdings listed exclude any temporary cash investments and equity index products.
74
Materials Index Fund
Performance Summary
All of the returns in this report represent past performance, which is not a guarantee of future results that may be achieved by the fund. (Current performance may be lower or higher than the performance data cited. For performance data current to the most recent month-end, visit our website at www.vanguard.com/performance.) Note, too, that both investment returns and principal value can fluctuate widely, so an investor’s shares, when sold, could be worth more or less than their original cost. The returns shown do not reflect taxes that a shareholder would pay on fund distributions or on the sale of fund shares.
Fiscal-Year Total Returns (%): January 26, 2004–February 28, 2010
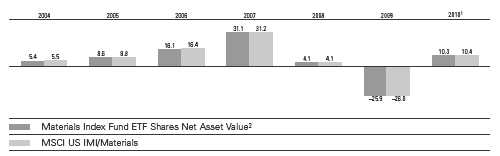
Average Annual Total Returns: Periods Ended December 31, 2009
This table presents average annual total returns through the latest calendar quarter—rather than through the end
of the fiscal period. Securities and Exchange Commission rules require that we provide this information.
| | | | |
| | | | | Since |
| | Inception Date | One Year | Five Years | Inception |
| ETF Shares | 1/26/2004 | | | |
| Market Price | | 51.58% | 4.88% | 7.49% |
| Net Asset Value | | 51.63 | 4.89 | 7.49 |
| Admiral Shares3 | 2/11/2004 | 51.59 | 4.85 | 6.83 |
1 Six months ended February 28, 2010.
2 For more information about how the ETF Shares’ market prices have compared with their net asset value, visit www.vanguard.com, select your ETF, and then select the Performance tab. The Premium/Discount table there shows the percentages of days on which the ETF Shares’ market price was above or below the NAV.
3 Total returns do not reflect the 2% fee assessed on redemptions of shares held for less than one year.
See Financial Highlights for dividend and capital gains information.
75
Materials Index Fund
Financial Statements (unaudited)
Statement of Net Assets
As of February 28, 2010
The fund reports a complete list of its holdings in regulatory filings four times in each fiscal year, at the quarter-ends. For the second and fourth fiscal quarters, the lists appear in the fund’s semiannual and annual reports to shareholders. For the first and third fiscal quarters, the fund files the lists with the Securities and Exchange Commission on Form N-Q. Shareholders can look up the fund’s Forms N-Q on the SEC’s website at www.sec.gov. Forms N-Q may also be reviewed and copied at the SEC’s Public Reference Room (see the back cover of this report for further information).
| | | |
| | | | Market |
| | | | Value• |
| | | Shares | ($000) |
| Common Stocks (100.0%) | | |
| Chemicals (54.5%) | | |
| | Monsanto Co. | 678,081 | 47,906 |
| | Dow Chemical Co. | 1,422,892 | 40,282 |
| | EI du Pont de | | |
| | Nemours & Co. | 1,124,313 | 37,912 |
| | Praxair Inc. | 381,702 | 28,681 |
| | Air Products & | | |
| | Chemicals Inc. | 263,396 | 18,064 |
| | PPG Industries Inc. | 207,713 | 12,783 |
| | Ecolab Inc. | 295,490 | 12,452 |
| | Mosaic Co. | 193,698 | 11,310 |
| | Sigma-Aldrich Corp. | 151,382 | 7,219 |
| | Lubrizol Corp. | 84,855 | 6,704 |
| | CF Industries Holdings Inc. | 57,328 | 6,091 |
| | Airgas Inc. | 92,071 | 5,905 |
| | Celanese Corp. Class A | 178,505 | 5,568 |
| | Eastman Chemical Co. | 90,333 | 5,379 |
| | Terra Industries Inc. | 124,067 | 5,108 |
| | FMC Corp. | 85,688 | 4,899 |
| | Ashland Inc. | 88,609 | 4,172 |
| | International Flavors & | | |
| | Fragrances Inc. | 98,264 | 4,138 |
| | Nalco Holding Co. | 172,427 | 4,011 |
| | Albemarle Corp. | 91,244 | 3,421 |
| | Valspar Corp. | 118,941 | 3,254 |
| | RPM International Inc. | 160,587 | 3,091 |
| | Huntsman Corp. | 207,140 | 2,844 |
| * | WR Grace & Co. | 90,018 | 2,607 |
| | Cytec Industries Inc. | 60,437 | 2,579 |
| | Cabot Corp. | 79,865 | 2,321 |
| | Scotts Miracle-Gro Co. | | |
| | Class A | 57,848 | 2,259 |
| * | Solutia Inc. | 151,683 | 2,134 |
| | Olin Corp. | 97,325 | 1,704 |
| | Sensient Technologies Corp. | 61,336 | 1,621 |
| * | Intrepid Potash Inc. | 55,919 | 1,539 |
| | NewMarket Corp. | 15,003 | 1,336 |
| * | Rockwood Holdings Inc. | 55,011 | 1,320 |
| * | OM Group Inc. | 38,033 | 1,309 |
| | HB Fuller Co. | 60,693 | 1,274 |
| | Minerals Technologies Inc. | 23,472 | 1,146 |
| * | Calgon Carbon Corp. | 66,421 | 1,030 |
| | Arch Chemicals Inc. | 31,539 | 974 |
| * | PolyOne Corp. | 110,427 | 878 |
| | Ferro Corp. | 99,667 | 816 |
| | Balchem Corp. | 34,820 | 763 |
| | Koppers Holdings Inc. | 25,850 | 719 |
| | A Schulman Inc. | 29,379 | 692 |
| | Innophos Holdings Inc. | 26,685 | 620 |
| | Zep Inc. | 26,858 | 593 |
| | Westlake Chemical Corp. | 25,098 | 508 |
| | Stepan Co. | 9,681 | 460 |
| * | Spartech Corp. | 38,123 | 388 |
| * | Zoltek Cos. Inc. | 36,933 | 328 |
| | | | |
| | | | | Market |
| | | | | Value• |
| | | | Shares | ($000) |
| | Innospec Inc. | | 29,513 | 314 |
| * | LSB Industries Inc. | | 19,687 | 280 |
| * | ShengdaTech Inc. | | 37,594 | 241 |
| *,^ | China Green Agriculture Inc. | 15,738 | 230 |
| | Hawkins Inc. | | 10,692 | 213 |
| * | Landec Corp. | | 30,658 | 186 |
| | American Vanguard Corp. | 25,113 | 162 |
| | | | | 314,738 |
| Construction Materials (2.4%) | | |
| | Vulcan Materials Co. | | 155,849 | 6,765 |
| | Martin Marietta Materials Inc. | | 55,576 | 4,403 |
| | Eagle Materials Inc. | | 51,718 | 1,220 |
| | Texas Industries Inc. | | 29,473 | 1,047 |
| * | Headwaters Inc. | | 75,233 | 375 |
| * | United States Lime & | | | |
| | Minerals Inc. | | 3,508 | 139 |
| | | | | 13,949 |
| Containers & Packaging (8.4%) | | |
| * | Owens-Illinois Inc. | | 209,584 | 6,212 |
| | Ball Corp. | | 111,126 | 6,005 |
| * | Crown Holdings Inc. | | 199,840 | 5,460 |
| * | Pactiv Corp. | | 164,512 | 4,073 |
| | Sealed Air Corp. | | 197,696 | 4,039 |
| | Bemis Co. Inc. | | 134,527 | 3,938 |
| | Sonoco Products Co. | | 124,421 | 3,680 |
| | Aptargroup Inc. | | 84,322 | 3,249 |
| | Packaging Corp. of America | 128,070 | 3,048 |
| | Temple-Inland Inc. | | 126,917 | 2,363 |
| | Rock-Tenn Co. Class A | | 46,013 | 1,925 |
| | Silgan Holdings Inc. | | 33,159 | 1,894 |
| | Greif Inc. Class A | | 30,131 | 1,544 |
| * | Graphic Packaging Holding Co. 106,158 | 369 |
| | Myers Industries Inc. | | 38,237 | 355 |
| * | Boise Inc. | | 74,381 | 353 |
| * | Bway Holding Co. | | 13,544 | 204 |
| | | | | 48,711 |
| Metals & Mining (28.5%) | | | |
| | Freeport-McMoRan | | | |
| | Copper & Gold Inc. | | 534,746 | 40,191 |
| | Newmont Mining Corp. | 597,630 | 29,451 |
| | Nucor Corp. | | 391,608 | 16,213 |
| | Alcoa Inc. | 1,212,194 | 16,122 |
| | Cliffs Natural Resources Inc. | 168,886 | 9,525 |
| | United States Steel Corp. | 178,299 | 9,439 |
| | Walter Energy Inc. | | 65,835 | 5,173 |
| | Allegheny Technologies Inc. | 109,626 | 4,786 |
| | Steel Dynamics Inc. | | 241,331 | 3,941 |
| | Reliance Steel & | | | |
| | Aluminum Co. | | 82,310 | 3,650 |
| | Compass Minerals | | | |
| | International Inc. | | 40,561 | 3,064 |
| | AK Steel Holding Corp. | 136,013 | 2,928 |
| | Commercial Metals Co. | 140,074 | 2,297 |
| | Royal Gold Inc. | | 49,575 | 2,228 |
| | | |
| | | | Market |
| | | | Value• |
| | | Shares | ($000) |
| * | Titanium Metals Corp. | 145,573 | 1,716 |
| | Carpenter Technology Corp. | 55,192 | 1,649 |
| * | Hecla Mining Co. | 297,333 | 1,546 |
| * | Coeur d’Alene Mines Corp. | 97,637 | 1,430 |
| | Worthington Industries Inc. | 78,975 | 1,251 |
| | Schnitzer Steel Industries Inc. | 26,660 | 1,217 |
| * | Allied Nevada Gold Corp. | 77,737 | 1,070 |
| * | Century Aluminum Co. | 75,142 | 916 |
| * | RTI International Metals Inc. | 36,819 | 885 |
| | AMCOL International Corp. | 28,827 | 733 |
| * | Stillwater Mining Co. | 58,671 | 666 |
| | Kaiser Aluminum Corp. | 19,055 | 636 |
| * | Horsehead Holding Corp. | 53,356 | 543 |
| * | Brush Engineered | | |
| | Materials Inc. | 25,362 | 521 |
| | Haynes International Inc. | 15,392 | 447 |
| | Olympic Steel Inc. | 11,442 | 316 |
| | AM Castle & Co. | 21,158 | 244 |
| * | General Moly Inc. | 78,953 | 186 |
| | | | 164,980 |
| Paper & Forest Products (6.2%) | | |
| | International Paper Co. | 511,823 | 11,859 |
| | Weyerhaeuser Co. | 262,875 | 10,620 |
| | MeadWestvaco Corp. | 212,723 | 4,880 |
| * | Domtar Corp. | 52,163 | 2,727 |
| * | Louisiana-Pacific Corp. | 155,107 | 1,180 |
| | Schweitzer-Mauduit | | |
| | International Inc. | 21,846 | 1,003 |
| | Glatfelter | 56,196 | 759 |
| * | Clearwater Paper Corp. | 14,016 | 676 |
| | Deltic Timber Corp. | 13,384 | 615 |
| * | Buckeye Technologies Inc. | 48,435 | 535 |
| * | Wausau Paper Corp. | 57,824 | 489 |
| | Neenah Paper Inc. | 18,192 | 258 |
| | | | 35,601 |
| Total Common Stocks | | |
| (Cost $633,792) | | 577,979 |
| Temporary Cash Investment (0.0%) | |
| Money Market Fund (0.0%) | | |
| 1,2 | Vanguard Market | | |
| | Liquidity Fund, 0.163% | | |
| | (Cost $117) | 117,001 | 117 |
| Total Investments (100.0%) | | |
| (Cost $633,909) | | 578,096 |
| Other Assets and Liabilities (0.0%) | |
| Other Assets | | 5,164 |
| Liabilities2 | | (5,272) |
| | | | (108) |
| Net Assets (100%) | | 577,988 |
76
Materials Index Fund
| |
| At February 28, 2010, net assets consisted of: |
| | Amount |
| | ($000) |
| Paid-in Capital | 675,344 |
| Undistributed Net Investment Income | 861 |
| Accumulated Net Realized Losses | (42,404) |
| Unrealized Appreciation (Depreciation) | (55,813) |
| Net Assets | 577,988 |
| |
| Admiral Shares—Net Assets | |
| Applicable to 3,118,943 outstanding | |
| $.001 par value shares of beneficial | |
| interest (unlimited authorization) | 104,131 |
| Net Asset Value Per Share— | |
| Admiral Shares | $33.39 |
| |
| ETF Shares—Net Assets | |
| Applicable to 7,230,611 outstanding | |
| $.001 par value shares of beneficial | |
| interest (unlimited authorization) | 473,857 |
| Net Asset Value Per Share— | |
| ETF Shares | $65.53 |
• See Note A in Notes to Financial Statements.
* Non-income-producing security.
^ Part of security position is on loan to broker-dealers. The total value of securities on loan is $114,000.
1 Affiliated money market fund available only to Vanguard funds and certain trusts and accounts managed by Vanguard. Rate shown is the 7-day yield.
2 Includes $117,000 of collateral received for securities on loan.
See accompanying Notes, which are an integral part of the Financial Statements.
77
Materials Index Fund
| |
| Statement of Operations |
| |
| Six Months Ended |
| February 28, 2010 |
| | ($000) |
| Investment Income | |
| Income | |
| Dividends | 5,708 |
| Security Lending | 1 |
| Total Income | 5,709 |
| Expenses | |
| The Vanguard Group—Note B | |
| Investment Advisory Services | 41 |
| Management and Administrative— | |
| Admiral Shares | 117 |
| Management and Administrative— | |
| ETF Shares | 397 |
| Marketing and Distribution— | |
| Admiral Shares | 9 |
| Marketing and Distribution— | |
| ETF Shares | 62 |
| Custodian Fees | 2 |
| Shareholders’ Reports—Admiral Shares | — |
| Shareholders’ Reports—ETF Shares | 31 |
| Trustees’ Fees and Expenses | 1 |
| Total Expenses | 660 |
| Expenses Paid Indirectly | (2) |
| Net Expenses | 658 |
| Net Investment Income | 5,051 |
| Realized Net Gain (Loss) on | |
| Investment Securities Sold | 5,664 |
| Change in Unrealized Appreciation | |
| (Depreciation) of Investment Securities | 36,249 |
| Net Increase (Decrease) in Net Assets | |
| Resulting from Operations | 46,964 |
| | |
| Statement of Changes in Net Assets | | |
| |
| | Six Months Ended | Year Ended |
| | February 28, | August 31, |
| | 2010 | 2009 |
| | ($000) | ($000) |
| Increase (Decrease) in Net Assets | | |
| Operations | | |
| Net Investment Income | 5,051 | 6,646 |
| Realized Net Gain (Loss) | 5,664 | (21,222) |
| Change in Unrealized Appreciation (Depreciation) | 36,249 | (80,514) |
| Net Increase (Decrease) in Net Assets Resulting from Operations | 46,964 | (95,090) |
| Distributions | | |
| Net Investment Income | | |
| Admiral Shares | (1,398) | (1,751) |
| ETF Shares | (6,674) | (5,802) |
| Realized Capital Gain | | |
| Admiral Shares | — | — |
| ETF Shares | — | — |
| Total Distributions | (8,072) | (7,553) |
| Capital Share Transactions | | |
| Admiral Shares | 6,470 | 10,896 |
| ETF Shares | 67,348 | 85,342 |
| Net Increase (Decrease) from Capital Share Transactions | 73,818 | 96,238 |
| Total Increase (Decrease) | 112,710 | (6,405) |
| Net Assets | | |
| Beginning of Period | 465,278 | 471,683 |
| End of Period1 | 577,988 | 465,278 |
1 Net Assets—End of Period includes undistributed net investment income of $861,000 and $3,882,000.
See accompanying Notes, which are an integral part of the Financial Statements.
78
| | | | | | | |
| Materials Index Fund | | | | | | | |
| |
| |
| Financial Highlights | | | | | | |
| |
| Admiral Shares | | | | | | | |
| | Six Months | | | | | |
| | | Ended | | | | | |
| For a Share Outstanding | February 28, | | | | Year Ended August 31, |
| Throughout Each Period | | 2010 | 2009 | 2008 | 2007 | 2006 | 2005 |
| Net Asset Value, Beginning of Period | $30.68 | $42.85 | $41.75 | $32.37 | $28.34 | $26.53 |
| Investment Operations | | | | | | | |
| Net Investment Income | | .256 | .622 | .732 | .7001 | .6721 | .480 |
| Net Realized and Unrealized Gain (Loss) | | | | | | |
| on Investments2 | | 2.913 | (11.996) | 1.008 | 9.250 | 3.853 | 1.830 |
| Total from Investment Operations | 3.169 | (11.374) | 1.740 | 9.950 | 4.525 | 2.310 |
| Distributions | | | | | | | |
| Dividends from Net Investment Income | (.459) | (.796) | (.640) | (.570) | (.495) | (.500) |
| Distributions from Realized Capital Gains | — | — | — | — | — | — |
| Total Distributions | | (.459) | (.796) | (.640) | (.570) | (.495) | (.500) |
| Net Asset Value, End of Period | | $33.39 | $30.68 | $42.85 | $41.75 | $32.37 | $28.34 |
| |
| Total Return3 | | 10.30% | –25.91% | 4.09% | 31.00% | 16.08% | 8.61% |
| |
| Ratios/Supplemental Data | | | | | | | |
| Net Assets, End of Period (Millions) | $104 | $90 | $107 | $57 | $12 | $7 |
| Ratio of Total Expenses to | | | | | | | |
| Average Net Assets | | 0.26%4 | 0.28% | 0.25% | 0.26% | 0.28% | 0.28% |
| Ratio of Net Investment Income to | | | | | | |
| Average Net Assets | | 1.81%4 | 2.23% | 1.74% | 1.80% | 2.13% | 1.81% |
| Portfolio Turnover Rate5 | | 7%4 | 12% | 10% | 6% | 13% | 12% |
1 Calculated based on average shares outstanding.
2 Includes increases from redemption fees of $.00, $.02, $.02, $.01, $.00, and $.00.
3 Total returns do not reflect the 2% fee assessed on redemptions of shares held for less than one year.
4 Annualized.
5 Excludes the value of portfolio securities received or delivered as a result of in-kind purchases or redemptions of the fund’s capital shares, including ETF Creation Units.
See accompanying Notes, which are an integral part of the Financial Statements.
79
| | | | | | | |
| Materials Index Fund | | | | | | | |
| |
| |
| Financial Highlights | | | | | | |
| |
| ETF Shares | | | | | | | |
| | Six Months | | | | | |
| | | Ended | | | | | |
| For a Share Outstanding | February 28, | | | | Year Ended August 31, |
| Throughout Each Period | | 2010 | 2009 | 2008 | 2007 | 2006 | 2005 |
| Net Asset Value, Beginning of Period | $60.23 | $84.27 | $82.10 | $63.65 | $55.70 | $52.13 |
| Investment Operations | | | | | | | |
| Net Investment Income | | .517 | 1.242 | 1.470 | 1.4181 | 1.3361 | .915 |
| Net Realized and Unrealized Gain (Loss) | | | | | | |
| on Investments2 | | 5.706 | (23.683) | 1.977 | 18.168 | 7.582 | 3.630 |
| Total from Investment Operations | 6.223 | (22.441) | 3.447 | 19.586 | 8.918 | 4.545 |
| Distributions | | | | | | | |
| Dividends from Net Investment Income | (.923) | (1.599) | (1.277) | (1.136) | (.968) | (.975) |
| Distributions from Realized Capital Gains | — | — | — | — | — | — |
| Total Distributions | | (.923) | (1.599) | (1.277) | (1.136) | (.968) | (.975) |
| Net Asset Value, End of Period | | $65.53 | $60.23 | $84.27 | $82.10 | $63.65 | $55.70 |
| |
| Total Return | | 10.29% | –25.88% | 4.15% | 31.06% | 16.11% | 8.62% |
| |
| Ratios/Supplemental Data | | | | | | | |
| Net Assets, End of Period (Millions) | $474 | $375 | $365 | $312 | $95 | $50 |
| Ratio of Total Expenses to | | | | | | | |
| Average Net Assets | | 0.23%3 | 0.25% | 0.20% | 0.22% | 0.25% | 0.26% |
| Ratio of Net Investment Income to | | | | | | |
| Average Net Assets | | 1.84%3 | 2.26% | 1.79% | 1.84% | 2.16% | 1.83% |
| Portfolio Turnover Rate4 | | 7%3 | 12% | 10% | 6% | 13% | 12% |
1 Calculated based on average shares outstanding.
2 Includes increases from redemption fees of $.00, $.03, $.04, $.02, $.00, and $.00.
3 Annualized.
4 Excludes the value of portfolio securities received or delivered as a result of in-kind purchases or redemptions of the fund’s capital shares, including ETF Creation Units.
See accompanying Notes, which are an integral part of the Financial Statements.
80
Materials Index Fund
Notes to Financial Statements
Vanguard Materials Index Fund is registered under the Investment Company Act of 1940 as an open-end investment company, or mutual fund. The fund offers two classes of shares, Admiral Shares and ETF Shares. Admiral Shares are available to any investor who meets the fund’s minimum purchase requirements. ETF Shares are listed for trading on the NYSE Arca, Inc.; they can be purchased and sold through a broker.
A. The following significant accounting policies conform to generally accepted accounting principles for U.S. mutual funds. The fund consistently follows such policies in preparing its financial statements.
1. Security Valuation: Securities are valued as of the close of trading on the New York Stock Exchange (generally 4 p.m., Eastern time) on the valuation date. Equity securities are valued at the latest quoted sales prices or official closing prices taken from the primary market in which each security trades; such securities not traded on the valuation date are valued at the mean of the latest quoted bid and asked prices. Securities for which market quotations are not readily available, or whose values have been materially affected by events occurring before the fund’s pricing time but after the close of the securities’ primary markets, are valued by methods deemed by the board of trustees to represent fair value. Investments in Vanguard Market Liquidity Fund are valued at that fund’s net asset value.
2. Federal Income Taxes: The fund intends to continue to qualify as a regulated investment company and distribute all of its taxable income. Management has analyzed the fund’s tax positions taken for all open federal income tax years (August 31, 2006–2009), and for the period ended February 28, 2010, and has concluded that no provision for federal income tax is required in the fund’s financial statements.
3. Distributions: Distributions to shareholders are recorded on the ex-dividend date.
4. Security Lending: The fund may lend its securities to qualified institutional borrowers to earn additional income. Security loans are required to be secured at all times by collateral at least equal to the market value of securities loaned. The fund invests cash collateral received in Vanguard Market Liquidity Fund, and records a liability for the return of the collateral, during the period the securities are on loan. Security lending income represents the income earned on investing cash collateral, less expenses associated with the loan.
5. Other: Dividend income is recorded on the ex-dividend date. Interest income includes income distributions received from Vanguard Market Liquidity Fund and is accrued daily. Security transactions are accounted for on the date securities are bought or sold. Costs used to determine realized gains (losses) on the sale of investment securities are those of the specific securities sold. Fees assessed on redemptions of capital shares are credited to paid-in capital.
Each class of shares has equal rights as to assets and earnings, except that each class separately bears certain class-specific expenses related to maintenance of shareholder accounts (included in Management and Administrative expenses) and shareholder reporting. Marketing and distribution expenses are allocated to each class of shares based on a method approved by the board of trustees. Income, other non-class-specific expenses, and gains and losses on investments are allocated to each class of shares based on its relative net assets.
B. The Vanguard Group furnishes at cost investment advisory, corporate management, administrative, marketing, and distribution services. The costs of such services are allocated to the fund under methods approved by the board of trustees. The fund has committed to provide up to 0.40% of its net assets in capital contributions to Vanguard. At February 28, 2010, the fund had contributed capital of $110,000 to Vanguard (included in Other Assets), representing 0.02% of the fund’s net assets and 0.04% of Vanguard’s capitalization. The fund’s trustees and officers are also directors and officers of Vanguard.
C. The fund’s custodian bank has agreed to reduce its fees when the fund maintains cash on deposit in the non-interest-bearing custody account. For the six months ended February 28, 2010, custodian fee offset arrangements reduced the fund’s expenses by $2,000 (an annual rate of 0.00% of average net assets).
D. Various inputs may be used to determine the value of the fund’s investments. These inputs are summarized in three broad levels for financial statement purposes. The inputs or methodologies used to value securities are not necessarily an indication of the risk associated with investing in those securities.
Level 1—Quoted prices in active markets for identical securities.
Level 2—Other significant observable inputs (including quoted prices for similar securities, interest rates, prepayment speeds, credit risk, etc.).
Level 3—Significant unobservable inputs (including the fund’s own assumptions used to determine the fair value of investments).
At February 28, 2010, 100% of the fund’s investments were valued based on Level 1 inputs.
81
Materials Index Fund
E. Distributions are determined on a tax basis and may differ from net investment income and realized capital gains for financial reporting purposes. Differences may be permanent or temporary. Permanent differences are reclassified among capital accounts in the financial statements to reflect their tax character. Temporary differences arise when certain items of income, expense, gain, or loss are recognized in different periods for financial statement and tax purposes; these differences will reverse at some time in the future. Differences in classification may also result from the treatment of short-term gains as ordinary income for tax purposes.
During the six months ended February 28, 2010, the fund realized $11,773,000 of net capital gains resulting from in-kind redemptions—in which shareholders exchanged fund shares for securities held by the fund rather than for cash. Because such gains are not taxable to the fund, and are not distributed to shareholders, they have been reclassified from accumulated net realized losses to paid-in capital.
The fund’s tax-basis capital gains and losses are determined only at the end of each fiscal year. For tax purposes, at August 31, 2009, the fund had available capital loss carryforwards totaling $14,998,000 to offset future net capital gains of $6,000 through August 31, 2014, $698,000 through August 31, 2015, $1,458,000 through August 31, 2016, and $12,836,000 through August 31, 2017. In addition, the fund realized losses of $20,530,000 during the period from November 1, 2008, through August 31, 2009, which are deferred and will be treated as realized for tax purposes in fiscal 2010. The fund will use these capital losses to offset net taxable capital gains, if any, realized during the year ending August 31, 2010; should the fund realize net capital losses for the year, the losses will be added to the loss carryforward balances above.
At February 28, 2010, the cost of investment securities for tax purposes was $633,909,000. Net unrealized depreciation of investment securities for tax purposes was $55,813,000, consisting of unrealized gains of $22,792,000 on securities that had risen in value since their purchase and $78,605,000 in unrealized losses on securities that had fallen in value since their purchase.
F. During the six months ended February 28, 2010, the fund purchased $122,777,000 of investment securities and sold $51,922,000 of investment securities, other than temporary cash investments.
G. Capital share transactions for each class of shares were:
| | | | |
| | Six Months Ended | | Year Ended |
| | February 28, 2010 | August 31, 2009 |
| | Amount | Shares | Amount | Shares |
| | ($000) | (000) | ($000) | (000) |
| Admiral Shares | | | | |
| Issued | 15,509 | 461 | 36,435 | 1,409 |
| Issued in Lieu of Cash Distributions | 1,301 | 38 | 1,643 | 72 |
| Redeemed1 | (10,340) | (313) | (27,182) | (1,046) |
| Net Increase (Decrease)—Admiral Shares | 6,470 | 186 | 10,896 | 435 |
| ETF Shares | | | | |
| Issued | 99,525 | 1,500 | 160,431 | 3,104 |
| Issued in Lieu of Cash Distributions | — | — | — | — |
| Redeemed1 | (32,177) | (500) | (75,089) | (1,200) |
| Net Increase (Decrease)—ETF Shares | 67,348 | 1,000 | 85,342 | 1,904 |
| 1 Net of redemption fees for fiscal 2010 and 2009 of $36,000 and $263,000, respectively (fund totals). | | |
H. In preparing the financial statements as of February 28, 2010, management considered the impact of subsequent events for potential recognition or disclosure in these financial statements.
82
Telecommunication Services Index Fund
Fund Profile
As of February 28, 2010
| | | |
| Portfolio Characteristics | | |
| | | Target | Broad |
| | Fund | Index1 | Index2 |
| Number of Stocks | 41 | 40 | 2,492 |
| Median Market Cap | $11.0B | $82.2B | $29.0B |
| Price/Earnings Ratio | 25.8x | 16.7x | 21.2x |
| Price/Book Ratio | 1.9x | 1.7x | 2.1x |
| Yield3 | | 5.5% | 1.9% |
| Admiral Shares | 3.7% | | |
| ETF Shares | 3.8% | | |
| Return on Equity | 9.5% | 11.5% | 19.4% |
| Earnings Growth Rate | 8.0% | 9.0% | 8.1% |
| Foreign Holdings | 0.0% | 0.0% | 0.0% |
| Turnover Rate4 | 33% | — | — |
| Expense Ratio5 | | — | — |
| Admiral Shares | 0.28% | | |
| ETF Shares | 0.25% | | |
| Short-Term Reserves | 0.2% | — | — |
| | |
| Volatility Measures6 | |
| | Fund Versus | Fund Versus |
| | Target Index1 | Broad Index2 |
| R-Squared | 0.89 | 0.70 |
| Beta | 1.00 | 0.89 |
| |
| Subindustry Diversification | |
| (% of equity exposure) | |
| Alternative Carriers | 8.9% |
| Integrated Telecommunication Services | 62.6 |
| Wireless Telecommunication Services | 28.5 |
| |
| Ten Largest Holdings7 (% of total net assets) |
| Verizon Communications Inc. | 22.7% |
| AT&T Inc. | 22.6 |
| American Tower Corp. Class A | 4.4 |
| Crown Castle International Corp. | 4.3 |
| CenturyTel Inc. | 3.9 |
| Sprint Nextel Corp. | 3.9 |
| Qwest Communications International Inc. | 3.1 |
| NII Holdings Inc. | 2.8 |
| Telephone & Data Systems, Inc. | 2.6 |
| Windstream Corp. | 2.2 |
| Top Ten | 72.5% |
1 MSCI US IMI/Telecommunication Services.
2 MSCI US IMI/2500.
3 30-day SEC yield for the fund; annualized dividend yield for the indexes. See the Glossary.
4 Annualized.
5 The expense ratios shown are from the prospectuses dated December 28, 2009, and represent estimated costs for the current fiscal year based on the fund’s net assets as of the prospectus date. For the six months ended February 28, 2010, the annualized expense ratios were 0.26% for the Admiral Shares and 0.23% for the ETF Shares.
6 For an explanation of R-squared, beta, and other terms used here, see the Glossary.
7 The holdings listed exclude any temporary cash investments and equity index products.
83
Telecommunication Services Index Fund
Performance Summary
All of the returns in this report represent past performance, which is not a guarantee of future results that may be achieved by the fund. (Current performance may be lower or higher than the performance data cited. For performance data current to the most recent month-end, visit our website at www.vanguard.com/performance.) Note, too, that both investment returns and principal value can fluctuate widely, so an investor’s shares, when sold, could be worth more or less than their original cost. The returns shown do not reflect taxes that a shareholder would pay on fund distributions or on the sale of fund shares.
Fiscal-Year Total Returns (%): September 23, 2004–February 28, 2010
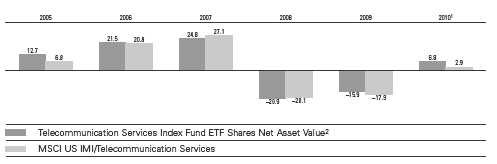
Average Annual Total Returns: Periods Ended December 31, 2009
This table presents average annual total returns through the latest calendar quarter—rather than through the end
of the fiscal period. Securities and Exchange Commission rules require that we provide this information.
| | | | |
| | | | | Since |
| | Inception Date | One Year | Five Years | Inception |
| ETF Shares | 9/23/2004 | | | |
| Market Price | | 29.41% | 3.11% | 5.14% |
| Net Asset Value | | 29.65 | 3.10 | 5.14 |
| Admiral Shares3 | 3/11/2005 | 29.60 | — | 4.15 |
1 Six months ended February 28, 2010.
2 For more information about how the ETF Shares’ market prices have compared with their net asset value, visit www.vanguard.com, select your ETF, and then select the Performance tab. The Premium/Discount table there shows the percentages of days on which the ETF Shares’ market price was above or below the NAV.
3 Total returns do not reflect the 2% fee assessed on redemptions of shares held for less than one year.
See Financial Highlights for dividend and capital gains information.
84
Telecommunication Services Index Fund
Financial Statements (unaudited)
Statement of Net Assets
As of February 28, 2010
The fund reports a complete list of its holdings in regulatory filings four times in each fiscal year, at the quarter-ends. For the second and fourth fiscal quarters, the lists appear in the fund’s semiannual and annual reports to shareholders. For the first and third fiscal quarters, the fund files the lists with the Securities and Exchange Commission on Form N-Q. Shareholders can look up the fund’s Forms N-Q on the SEC’s website at www.sec.gov. Forms N-Q may also be reviewed and copied at the SEC’s Public Reference Room (see the back cover of this report for further information).
| | | |
| | | | Market |
| | | | Value• |
| | | Shares | ($000) |
| Common Stocks (100.0%) | | |
| Diversified Telecommunication Services (71.5%) |
| | Alternative Carriers (8.9%) | | |
| * | Level 3 | | |
| | Communications Inc. | 2,184,049 | 3,473 |
| * | tw telecom inc Class A | 208,379 | 3,311 |
| * | PAETEC Holding Corp. | 533,602 | 2,113 |
| * | Global Crossing Ltd. | 145,677 | 2,076 |
| * | Cogent Communications | | |
| | Group Inc. | 178,510 | 1,757 |
| * | Premiere Global | | |
| | Services Inc. | 195,896 | 1,473 |
| * | AboveNet Inc. | 22,453 | 1,372 |
| * | Vonage Holdings Corp. | 818,338 | 1,268 |
| * | Neutral Tandem Inc. | 75,014 | 1,209 |
| |
| | Integrated Telecommunication Services (62.6%) |
| | Verizon | | |
| | Communications Inc. | 1,590,225 | 46,005 |
| | AT&T Inc. | 1,843,190 | 45,730 |
| | CenturyTel Inc. | 231,041 | 7,918 |
| | Qwest Communications | | |
| | International Inc. | 1,365,042 | 6,225 |
| | Windstream Corp. | 449,082 | 4,549 |
| | Frontier | | |
| | Communications Corp. | 410,254 | 3,196 |
| | Iowa Telecommunications | | |
| | Services Inc. | 130,360 | 2,105 |
| | Consolidated | | |
| | Communications | | |
| | Holdings Inc. | 121,663 | 2,049 |
| * | Cincinnati Bell Inc. | 598,576 | 1,772 |
| | Atlantic Tele-Network Inc. | 38,270 | 1,679 |
| | Alaska Communications | | |
| | Systems Group Inc. | 216,006 | 1,568 |
| * | Cbeyond Inc. | 117,102 | 1,452 |
| * | General Communication Inc. | | |
| | Class A | 238,914 | 1,312 |
| * | SureWest Communications | 122,581 | 1,054 |
| | | | 144,666 |
| Wireless Telecommunication Services (28.5%) |
| * | American Tower Corp. | | |
| | Class A | 210,670 | 8,987 |
| * | Crown Castle | | |
| | International Corp. | 231,397 | 8,747 |
| * | Sprint Nextel Corp. | 2,358,826 | 7,855 |
| * | NII Holdings Inc. | 152,168 | 5,694 |
| * | SBA Communications | | |
| | Corp. Class A | 118,888 | 4,204 |
| | | |
| | | | Market |
| | | | Value• |
| | | Shares | ($000) |
| | Telephone & Data | | |
| | Systems Inc. | 87,916 | 2,744 |
| | Telephone & Data | | |
| | Systems Inc. | 90,546 | 2,571 |
| * | Syniverse Holdings Inc. | 125,708 | 2,114 |
| * | MetroPCS | | |
| | Communications Inc. | 336,437 | 2,076 |
| * | United States Cellular Corp. 54,481 | 1,996 |
| | NTELOS Holdings Corp. | 116,778 | 1,994 |
| * | Leap Wireless | | |
| | International Inc. | 126,398 | 1,804 |
| | Shenandoah | | |
| | Telecommunications Co. | 99,481 | 1,794 |
| | USA Mobility Inc. | 131,477 | 1,480 |
| * | ICO Global Communications | |
| | Holdings Ltd. | 1,291,804 | 1,421 |
| * | FiberTower Corp. | 254,270 | 1,047 |
| * | TerreStar Corp. | 1,189,354 | 1,028 |
| * | ICO Global | | |
| | Communications | | |
| | Holdings Ltd. | | |
| | Rights Exp. 3/9/10 | 1,649,823 | 136 |
| | | | 57,692 |
| Total Investments (100.0%) | | |
| (Cost $224,174) | | 202,358 |
| Other Assets and Liabilities (0.0%) | |
| Other Assets | | 18,913 |
| Liabilities | | (19,008) |
| | | | (95) |
| Net Assets (100%) | | 202,263 |
| |
| |
| Statement of Assets and Liabilities | |
| Assets | | |
| Investments in Securities, at Value | 202,358 |
| Receivables for Investment | | |
| | Securities Sold | | 18,767 |
| Other Assets | | 146 |
| Total Assets | | 221,271 |
| Liabilities | | |
| Payables for Investment | | |
| | Securities Purchased | | 18,449 |
| Other Liabilities | | 559 |
| Total Liabilities | | 19,008 |
| Net Assets | | 202,263 |
| |
| At February 28, 2010, net assets consisted of: |
| | Amount |
| | ($000) |
| Paid-in Capital | 285,706 |
| Undistributed Net Investment Income | 1,096 |
| Accumulated Net Realized Losses | (62,723) |
| Unrealized Appreciation (Depreciation) | (21,816) |
| Net Assets | 202,263 |
| |
| Admiral Shares—Net Assets | |
| Applicable to 475,912 outstanding | |
| $.001 par value shares of beneficial | |
| interest (unlimited authorization) | 12,756 |
| Net Asset Value Per Share— | |
| Admiral Shares | $26.80 |
| |
| ETF Shares—Net Assets | |
| Applicable to 3,602,158 outstanding | |
| $.001 par value shares of beneficial | |
| interest (unlimited authorization) | 189,507 |
| Net Asset Value Per Share— | |
| ETF Shares | $52.61 |
• See Note A in Notes to Financial Statements.
* Non-income-producing security.
See accompanying Notes, which are an integral part of the Financial Statements.
85
Telecommunication Services Index Fund
| |
| Statement of Operations |
| |
| Six Months Ended |
| February 28, 2010 |
| | ($000) |
| Investment Income | |
| Income | |
| Dividends | 3,645 |
| Interest1 | 1 |
| Security Lending | 6 |
| Total Income | 3,652 |
| Expenses | |
| The Vanguard Group—Note B | |
| Investment Advisory Services | 14 |
| Management and Administrative— | |
| Admiral Shares | 14 |
| Management and Administrative— | |
| ETF Shares | 158 |
| Marketing and Distribution— | |
| Admiral Shares | 1 |
| Marketing and Distribution— | |
| ETF Shares | 26 |
| Shareholders’ Reports—Admiral Shares | — |
| Shareholders’ Reports—ETF Shares | 13 |
| Total Expenses | 226 |
| Net Investment Income | 3,426 |
| Realized Net Gain (Loss) on | |
| Investment Securities Sold | (15,290) |
| Change in Unrealized Appreciation | |
| (Depreciation) of Investment Securities | 23,729 |
| Net Increase (Decrease) in Net Assets | |
| Resulting from Operations | 11,865 |
| | |
| Statement of Changes in Net Assets | | |
| |
| | Six Months Ended | Year Ended |
| | February 28, | August 31, |
| | 2010 | 2009 |
| | ($000) | ($000) |
| Increase (Decrease) in Net Assets | | |
| Operations | | |
| Net Investment Income | 3,426 | 4,803 |
| Realized Net Gain (Loss) | (15,290) | (15,383) |
| Change in Unrealized Appreciation (Depreciation) | 23,729 | (4,088) |
| Net Increase (Decrease) in Net Assets Resulting from Operations | 11,865 | (14,668) |
| Distributions | | |
| Net Investment Income | | |
| Admiral Shares | (346) | (326) |
| ETF Shares | (5,141) | (4,534) |
| Realized Capital Gain | | |
| Admiral Shares | — | — |
| ETF Shares | — | — |
| Total Distributions | (5,487) | (4,860) |
| Capital Share Transactions | | |
| Admiral Shares | 320 | (2,971) |
| ETF Shares | 36,793 | 19,785 |
| Net Increase (Decrease) from Capital Share Transactions | 37,113 | 16,814 |
| Total Increase (Decrease) | 43,491 | (2,714) |
| Net Assets | | |
| Beginning of Period | 158,772 | 161,486 |
| End of Period2 | 202,263 | 158,772 |
1 Interest income from an affiliated company of the fund was $1,000.
2 Net Assets—End of Period includes undistributed net investment income of $1,096,000 and $3,157,000.
See accompanying Notes, which are an integral part of the Financial Statements.
86
| | | | | | | |
| Telecommunication Services Index Fund | | | | | |
| |
| |
| Financial Highlights | | | | | | |
| |
| Admiral Shares | | | | | | | |
| | Six Months | | | | | Mar. 11, |
| | | Ended | | | | | 20051 to |
| For a Share Outstanding | February 28, | Year Ended August 31, | Aug. 31, |
| Throughout Each Period | | 2010 | 2009 | 2008 | 2007 | 2006 | 2005 |
| Net Asset Value, Beginning of Period | $25.77 | $31.58 | $41.01 | $33.29 | $28.18 | $26.75 |
| Investment Operations | | | | | | | |
| Net Investment Income | | .4822 | .8402 | .9082 | .8882 | .8612,3 | .3402 |
| Net Realized and Unrealized Gain (Loss) | | | | | | |
| on Investments4 | | 1.305 | (5.977) | (9.338) | 7.308 | 5.041 | 1.090 |
| Total from Investment Operations | 1.787 | (5.137) | (8.430) | 8.196 | 5.902 | 1.430 |
| Distributions | | | | | | | |
| Dividends from Net Investment Income | (.757) | (.673) | (1.000) | (.476) | (.792) | — |
| Distributions from Realized Capital Gains | — | — | — | — | — | — |
| Total Distributions | | (.757) | (.673) | (1.000) | (.476) | (.792) | — |
| Net Asset Value, End of Period | | $26.80 | $25.77 | $31.58 | $41.01 | $33.29 | $28.18 |
| |
| Total Return5 | | 6.76% | –15.90% | –20.98% | 24.77% | 21.47% | 5.35% |
| |
| Ratios/Supplemental Data | | | | | | | |
| Net Assets, End of Period (Millions) | $13 | $12 | $19 | $51 | $6 | $1 |
| Ratio of Total Expenses to | | | | | | | |
| Average Net Assets | | 0.26%6 | 0.28% | 0.25% | 0.27% | 0.28% | 0.28%6 |
| Ratio of Net Investment Income to | | | | | | |
| Average Net Assets | | 3.54%6 | 3.39% | 2.50% | 2.17% | 3.28%3 | 2.70%6 |
| Portfolio Turnover Rate7 | | 33%6 | 25% | 28% | 17% | 32% | 41% |
1 Inception.
2 Calculated based on average shares outstanding.
3 Net investment income per share and the ratio of net investment income to average net assets include $.112 and 0.38%, respectively, resulting from a special dividend from MCI in December 2005.
4 Includes increases from redemption fees of $.00, $.00, $.05, $.01, $.00, and $.00.
5 Total returns do not reflect the 2% fee assessed on redemptions of shares held for less than one year.
6 Annualized.
7 Excludes the value of portfolio securities received or delivered as a result of in-kind purchases or redemptions of the fund’s capital shares, including ETF Creation Units.
See accompanying Notes, which are an integral part of the Financial Statements.
87
| | | | | | | |
| Telecommunication Services Index Fund | | | | | |
| |
| |
| Financial Highlights | | | | | | |
| |
| ETF Shares | | | | | | | |
| | Six Months | | | | | Sept. 23, |
| | | Ended | | | | | 20041 to |
| For a Share Outstanding | February 28, | Year Ended August 31, | Aug. 31, |
| Throughout Each Period | | 2010 | 2009 | 2008 | 2007 | 2006 | 2005 |
| Net Asset Value, Beginning of Period | $50.58 | $62.05 | $80.60 | $65.40 | $55.35 | $49.50 |
| Investment Operations | | | | | | | |
| Net Investment Income | | .9602 | 1.6022 | 1.7642 | 1.7412 | 2.0402,3 | 1.3002 |
| Net Realized and Unrealized Gain (Loss) | | | | | | |
| on Investments4 | | 2.581 | (11.699) | (18.316) | 14.386 | 9.567 | 4.960 |
| Total from Investment Operations | 3.541 | (10.097) | (16.552) | 16.127 | 11.607 | 6.260 |
| Distributions | | | | | | | |
| Dividends from Net Investment Income | (1.511) | (1.373) | (1.998) | (.927) | (1.557) | (.410) |
| Distributions from Realized Capital Gains | — | — | — | — | — | — |
| Total Distributions | | (1.511) | (1.373) | (1.998) | (.927) | (1.557) | (.410) |
| Net Asset Value, End of Period | | $52.61 | $50.58 | $62.05 | $80.60 | $65.40 | $55.35 |
| |
| Total Return | | 6.79% | –15.88% | –20.94% | 24.81% | 21.49% | 12.65% |
| |
| Ratios/Supplemental Data | | | | | | | |
| Net Assets, End of Period (Millions) | $190 | $147 | $143 | $266 | $72 | $17 |
| Ratio of Total Expenses to | | | | | | | |
| Average Net Assets | | 0.23%5 | 0.25% | 0.20% | 0.23% | 0.25% | 0.26%5 |
| Ratio of Net Investment Income to | | | | | | |
| Average Net Assets | | 3.57%5 | 3.42% | 2.55% | 2.21% | 3.31%3 | 2.72%5 |
| Portfolio Turnover Rate6 | | 33%5 | 25% | 28% | 17% | 32% | 41% |
1 Inception.
2 Calculated based on average shares outstanding.
3 Net investment income per share and the ratio of net investment income to average net assets include $.219 and 0.38%, respectively, resulting from a special dividend from MCI in December 2005.
4 Includes increases from redemption fees of $.00, $.00, $.08, $.03, $.00, and $.00.
5 Annualized.
6 Excludes the value of portfolio securities received or delivered as a result of in-kind purchases or redemptions of the fund’s capital share, including ETF Creation Units.
See accompanying Notes, which are an integral part of the Financial Statements.
88
Telecommunication Services Index Fund
Notes to Financial Statements
Vanguard Telecommunication Services Index Fund is registered under the Investment Company Act of 1940 as an open-end investment company, or mutual fund. The fund offers two classes of shares: Admiral Shares and ETF Shares. Admiral Shares are available to any investor who meets the fund’s minimum purchase requirements. ETF Shares are listed for trading on the NYSE Arca, Inc.; they can be purchased and sold through a broker.
A. The following significant accounting policies conform to generally accepted accounting principles for U.S. mutual funds. The fund consistently follows such policies in preparing its financial statements.
1. Security Valuation: Securities are valued as of the close of trading on the New York Stock Exchange (generally 4 p.m., Eastern time) on the valuation date. Equity securities are valued at the latest quoted sales prices or official closing prices taken from the primary market in which each security trades; such securities not traded on the valuation date are valued at the mean of the latest quoted bid and asked prices. Securities for which market quotations are not readily available, or whose values have been materially affected by events occurring before the fund’s pricing time but after the close of the securities’ primary markets, are valued by methods deemed by the board of trustees to represent fair value. Investments in Vanguard Market Liquidity Fund are valued at that fund’s net asset value.
2. Federal Income Taxes: The fund intends to continue to qualify as a regulated investment company and distribute all of its taxable income. Management has analyzed the fund’s tax positions taken for all open federal income tax years (August 31, 2006–2009), and for the period ended February 28, 2010, and has concluded that no provision for federal income tax is required in the fund’s financial statements.
3. Distributions: Distributions to shareholders are recorded on the ex-dividend date.
4. Security Lending: The fund may lend its securities to qualified institutional borrowers to earn additional income. Security loans are required to be secured at all times by collateral at least equal to the market value of securities loaned. The fund invests cash collateral received in Vanguard Market Liquidity Fund, and records a liability for the return of the collateral, during the period the securities are on loan. Security lending income represents the income earned on investing cash collateral, less expenses associated with the loan.
5. Other: Dividend income is recorded on the ex-dividend date. Interest income includes income distributions received from Vanguard Market Liquidity Fund and is accrued daily. Security transactions are accounted for on the date securities are bought or sold. Costs used to determine realized gains (losses) on the sale of investment securities are those of the specific securities sold. Fees assessed on redemptions of capital shares are credited to paid-in capital.
Each class of shares has equal rights as to assets and earnings, except that each class separately bears certain class-specific expenses related to maintenance of shareholder accounts (included in Management and Administrative expenses) and shareholder reporting. Marketing and distribution expenses are allocated to each class of shares based on a method approved by the board of trustees. Income, other non-class-specific expenses, and gains and losses on investments are allocated to each class of shares based on its relative net assets.
B. The Vanguard Group furnishes at cost investment advisory, corporate management, administrative, marketing, and distribution services. The costs of such services are allocated to the fund under methods approved by the board of trustees. The fund has committed to provide up to 0.40% of its net assets in capital contributions to Vanguard. At February 28, 2010, the fund had contributed capital of $41,000 to Vanguard (included in Other Assets), representing 0.02% of the fund’s net assets and 0.02% of Vanguard’s capitalization. The fund’s trustees and officers are also directors and officers of Vanguard.
C. Various inputs may be used to determine the value of the fund’s investments. These inputs are summarized in three broad levels for financial statement purposes. The inputs or methodologies used to value securities are not necessarily an indication of the risk associated with investing in those securities.
Level 1—Quoted prices in active markets for identical securities.
Level 2—Other significant observable inputs (including quoted prices for similar securities, interest rates, prepayment speeds, credit risk, etc.).
Level 3—Significant unobservable inputs (including the fund’s own assumptions used to determine the fair value of investments).
89
Telecommunication Services Index Fund
The following table summarizes the fund’s investments as of February 28, 2010, based on the inputs used to value them:
| | | |
| | Level 1 | Level 2 | Level 3 |
| Investments | ($000) | ($000) | ($000) |
| Common Stocks | 202,222 | 136 | — |
D. Distributions are determined on a tax basis and may differ from net investment income and realized capital gains for financial reporting purposes. Differences may be permanent or temporary. Permanent differences are reclassified among capital accounts in the financial statements to reflect their tax character. Temporary differences arise when certain items of income, expense, gain, or loss are recognized in different periods for financial statement and tax purposes; these differences will reverse at some time in the future. Differences in classification may also result from the treatment of short-term gains as ordinary income for tax purposes.
During the six months ended February 28, 2010, the fund realized $1,137,000 of net capital gains resulting from in-kind redemptions—in which shareholders exchanged fund shares for securities held by the fund rather than for cash. Because such gains are not taxable to the fund, and are not distributed to shareholders, they have been reclassified from accumulated net realized losses to paid-in capital.
The fund’s tax-basis capital gains and losses are determined only at the end of each fiscal year. For tax purposes, at August 31, 2009, the fund had available capital loss carryforwards totaling $23,697,000 to offset future net capital gains of $29,000 through August 31, 2014, $818,000 through August 31, 2015, $4,154,000 through August 31, 2016, and $18,696,000 through August 31, 2017. In addition, the fund realized losses of $22,599,000 during the period from November 1, 2008, through August 31, 2009, which are deferred and will be treated as realized for tax purposes in fiscal 2010. The fund will use these capital losses to offset net taxable capital gains, if any, realized during the year ending August 31, 2010; should the fund realize net capital losses for the year, the losses will be added to the loss carryforward balances above.
At February 28, 2010, the cost of investment securities for tax purposes was $224,174,000. Net unrealized depreciation of investment securities for tax purposes was $21,816,000, consisting of unrealized gains of $13,574,000 on securities that had risen in value since their purchase and $35,390,000 in unrealized losses on securities that had fallen in value since their purchase.
E. During the six months ended February 28, 2010, the fund purchased $72,948,000 of investment securities and sold $37,555,000 of investment securities, other than temporary cash investments.
F. Capital share transactions for each class of shares were:
| | | | |
| | Six Months Ended | | Year Ended |
| | February 28, 2010 | August 31, 2009 |
| | Amount | Shares | Amount | Shares |
| | ($000) | (000) | ($000) | (000) |
| Admiral Shares | | | | |
| Issued | 1,334 | 47 | 1,801 | 74 |
| Issued in Lieu of Cash Distributions | 304 | 11 | 299 | 14 |
| Redeemed1 | (1,318) | (47) | (5,071) | (217) |
| Net Increase (Decrease)—Admiral Shares | 320 | 11 | (2,971) | (129) |
| ETF Shares | | | | |
| Issued | 41,994 | 800 | 117,888 | 2,702 |
| Issued in Lieu of Cash Distributions | — | — | — | — |
| Redeemed1 | (5,201) | (100) | (98,103) | (2,100) |
| Net Increase (Decrease)—ETF Shares | 36,793 | 700 | 19,785 | 602 |
| 1 Net of redemption fees for fiscal 2010 and 2009 of $0 and $7,000, respectively (fund totals). | | | |
G. In preparing the financial statements as of February 28, 2010, management considered the impact of subsequent events for potential recognition or disclosure in these financial statements.
90
Utilities Index Fund
Fund Profile
As of February 28, 2010
| | | |
| Portfolio Characteristics | | |
| | | Target | Broad |
| | Fund | Index1 | Index2 |
| Number of Stocks | 89 | 89 | 2,492 |
| Median Market Cap | $10.7B | $10.7B | $29.0B |
| Price/Earnings Ratio | 13.7x | 13.7x | 21.2x |
| Price/Book Ratio | 1.4x | 1.4x | 2.1x |
| Yield3 | | 4.4% | 1.9% |
| Admiral Shares | 4.1% | | |
| ETF Shares | 4.1% | | |
| Return on Equity | 13.4% | 13.4% | 19.4% |
| Earnings Growth Rate | 9.0% | 9.0% | 8.1% |
| Foreign Holdings | 0.0% | 0.0% | 0.0% |
| Turnover Rate4 | 5% | — | — |
| Expense Ratio5 | | — | — |
| Admiral Shares | 0.28% | | |
| ETF Shares | 0.25% | | |
| Short-Term Reserves | 0.0% | — | — |
| | |
| Volatility Measures6 | |
| | Fund Versus | Fund Versus |
| | Target Index1 | Broad Index2 |
| R-Squared | 1.00 | 0.53 |
| Beta | 1.00 | 0.61 |
| |
| Subindustry Diversification | |
| (% of equity exposure) | |
| Electric Utilities | 47.8% |
| Gas Utilities | 10.0 |
| Independent Power Producers & | |
| Energy Traders | 6.5 |
| Multi-Utilities | 33.8 |
| Water Utilities | 1.9 |
| |
| Ten Largest Holdings7 (% of total net assets) |
| Exelon Corp. | 6.5% |
| Southern Co. | 5.8 |
| Dominion Resources Inc. | 5.2 |
| Duke Energy Corp. | 4.9 |
| FPL Group Inc. | 4.2 |
| American Electric Power Co. Inc. | 3.7 |
| PG&E Corp. | 3.6 |
| Public Service Enterprise Group Inc. | 3.4 |
| Entergy Corp. | 3.3 |
| FirstEnergy Corp. | 2.7 |
| Top Ten | 43.3% |
1 MSCI US IMI/Utilities.
2 MSCI US IMI/2500.
3 30-day SEC yield for the fund; annualized dividend yield for the indexes. See the Glossary.
4 Annualized.
5 The expense ratios shown are from the prospectuses dated December 28, 2009, and represent estimated costs for the current fiscal year based on the fund’s net assets as of the prospectus date. For the six months ended February 28, 2010, the annualized expense ratios were 0.26% for the Admiral Shares and 0.23% for the ETF Shares.
6 For an explanation of R-squared, beta, and other terms used here, see the Glossary.
7 The holdings listed exclude any temporary cash investments and equity index products.
91
Utilities Index Fund
Performance Summary
All of the returns in this report represent past performance, which is not a guarantee of future results that may be achieved by the fund. (Current performance may be lower or higher than the performance data cited. For performance data current to the most recent month-end, visit our website at www.vanguard.com/performance.) Note, too, that both investment returns and principal value can fluctuate widely, so an investor’s shares, when sold, could be worth more or less than their original cost. The returns shown do not reflect taxes that a shareholder would pay on fund distributions or on the sale of fund shares.
Fiscal-Year Total Returns (%): January 26, 2004–February 28, 2010
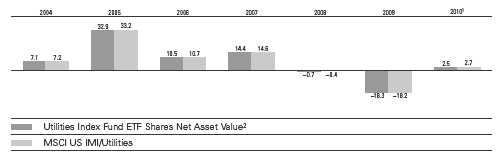
Average Annual Total Returns: Periods Ended December 31, 2009
This table presents average annual total returns through the latest calendar quarter—rather than through the end
of the fiscal period. Securities and Exchange Commission rules require that we provide this information.
| | | | |
| | | | | Since |
| | Inception Date | One Year | Five years | Inception |
| ETF Shares | 1/26/2004 | | | |
| Market Price | | 11.41% | 5.54% | 8.06% |
| Net Asset Value | | 11.45 | 5.55 | 8.06 |
| Admiral Shares3 | 4/28/2004 | 11.43 | 5.52 | 8.34 |
1 Six months ended February 28, 2010.
2 For more information about how the ETF Shares’ market prices have compared with their net asset value, visit www.vanguard.com, select your ETF, and then select the Performance tab. The Premium/Discount table
there shows the percentages of days on which the ETF Shares’ market price was above or below the NAV.
3 Total returns do not reflect the 2% fee assessed on redemptions of shares held for less than one year.
See Financial Highlights for dividend and capital gains information.
92
Utilities Index Fund
Financial Statements (unaudited)
Statement of Net Assets
As of February 28, 2010
The fund reports a complete list of its holdings in regulatory filings four times in each fiscal year, at the quarter-ends. For the second and fourth fiscal quarters, the lists appear in the fund’s semiannual and annual reports to shareholders. For the first and third fiscal quarters, the fund files the lists with the Securities and Exchange Commission on Form N-Q. Shareholders can look up the fund’s Forms N-Q on the SEC’s website at www.sec.gov. Forms N-Q may also be reviewed and copied at the SEC’s Public Reference Room (see the back cover of this report for further information).
| | | | |
| | | | | Market |
| | | | | Value• |
| | | | Shares | ($000) |
| Common Stocks (100.0%) | | | |
| Electric Utilities (47.8%) | | | |
| | Exelon Corp. | | 884,257 | 38,288 |
| | Southern Co. | 1,073,122 | 34,093 |
| | Duke Energy Corp. | 1,749,541 | 28,605 |
| | FPL Group Inc. | | 526,604 | 24,419 |
| | American Electric | | | |
| | Power Co. Inc. | | 640,564 | 21,536 |
| | Entergy Corp. | | 253,368 | 19,248 |
| | FirstEnergy Corp. | | 408,800 | 15,800 |
| | PPL Corp. | | 505,668 | 14,401 |
| | Progress Energy Inc. | | 374,993 | 14,359 |
| | Edison International | | 415,083 | 13,544 |
| | Northeast Utilities | | 235,308 | 6,024 |
| | Allegheny Energy Inc. | | 227,402 | 5,151 |
| | Pepco Holdings Inc. | | 297,170 | 4,998 |
| | Pinnacle West Capital Corp. | 135,786 | 4,944 |
| | DPL Inc. | | 160,614 | 4,263 |
| | ITC Holdings Corp. | | 68,080 | 3,634 |
| | NV Energy Inc. | | 314,798 | 3,497 |
| | Great Plains Energy Inc. | | 181,389 | 3,231 |
| | Westar Energy Inc. | | 146,217 | 3,129 |
| | Hawaiian Electric | | | |
| | Industries Inc. | | 123,477 | 2,515 |
| | IDACORP Inc. | | 63,861 | 2,109 |
| | Cleco Corp. | | 81,146 | 2,048 |
| | Portland General Electric Co. 100,884 | 1,815 |
| | PNM Resources Inc. | | 116,296 | 1,421 |
| | Unisource Energy Corp. | | 47,988 | 1,398 |
| | Allete Inc. | | 39,748 | 1,250 |
| * | El Paso Electric Co. | | 59,310 | 1,193 |
| | UIL Holdings Corp. | | 38,154 | 1,049 |
| | MGE Energy Inc. | | 31,027 | 1,029 |
| | Empire District Electric Co. | | 48,332 | 866 |
| | Central Vermont | | | |
| | Public Service Corp. | | 15,638 | 308 |
| | | | | 280,165 |
| Gas Utilities (10.0%) | | | |
| | Questar Corp. | | 233,836 | 9,819 |
| | EQT Corp. | | 166,792 | 7,299 |
| | Oneok Inc. | | 134,396 | 5,958 |
| | National Fuel Gas Co. | | 97,234 | 4,836 |
| | Energen Corp. | | 91,409 | 4,155 |
| | AGL Resources Inc. | | 103,798 | 3,771 |
| | UGI Corp. | | 145,885 | 3,654 |
| | Atmos Energy Corp. | | 124,184 | 3,410 |
| | Piedmont Natural | | | |
| | Gas Co. Inc. | | 98,048 | 2,533 |
| | Nicor Inc. | | 60,677 | 2,527 |
| | WGL Holdings Inc. | | 67,409 | 2,214 |
| | New Jersey Resources Corp. | 56,375 | 2,053 |
| | Southwest Gas Corp. | | 60,289 | 1,723 |
| | South Jersey Industries Inc. | 39,981 | 1,594 |
| | | |
| | | | Market |
| | | | Value• |
| | | Shares | ($000) |
| | Northwest Natural Gas Co. | 35,578 | 1,565 |
| | Laclede Group Inc. | 28,349 | 930 |
| | Chesapeake Utilities Corp. | 11,899 | 357 |
| * | China Natural Gas Inc. | 18,455 | 173 |
| | | | 58,571 |
| Independent Power Producers & | |
| Energy Traders (6.5%) | | |
| * | AES Corp. | 895,265 | 10,466 |
| | Constellation Energy | | |
| | Group Inc. | 242,475 | 8,504 |
| * | NRG Energy Inc. | 343,859 | 7,510 |
| * | Calpine Corp. | 474,602 | 5,192 |
| * | Mirant Corp. | 194,692 | 2,449 |
| * | RRI Energy Inc. | 472,797 | 2,009 |
| * | Dynegy Inc. Class A | 678,046 | 1,017 |
| | Ormat Technologies Inc. | 27,377 | 792 |
| | | | 37,939 |
| Multi-Utilities (33.8%) | | |
| | Dominion Resources Inc. | 800,930 | 30,427 |
| | PG&E Corp. | 497,476 | 20,854 |
| | Public Service Enterprise | | |
| | Group Inc. | 678,545 | 20,166 |
| | Consolidated Edison Inc. | 369,449 | 15,794 |
| | Sempra Energy | 313,969 | 15,438 |
| | Xcel Energy Inc. | 612,387 | 12,744 |
| | DTE Energy Co. | 221,178 | 9,604 |
| | Ameren Corp. | 317,725 | 7,851 |
| | Wisconsin Energy Corp. | 156,785 | 7,593 |
| | CenterPoint Energy Inc. | 497,334 | 6,654 |
| | SCANA Corp. | 156,872 | 5,655 |
| | NiSource Inc. | 369,805 | 5,555 |
| | MDU Resources Group Inc. | 239,195 | 4,889 |
| | NSTAR | 143,237 | 4,844 |
| | OGE Energy Corp. | 129,803 | 4,746 |
| | CMS Energy Corp. | 307,918 | 4,702 |
| | Alliant Energy Corp. | 148,368 | 4,693 |
| | Integrys Energy Group Inc. | 102,485 | 4,518 |
| | TECO Energy Inc. | 272,452 | 4,177 |
| | Vectren Corp. | 103,364 | 2,403 |
| | Avista Corp. | 73,393 | 1,494 |
| | Black Hills Corp. | 52,118 | 1,453 |
| | NorthWestern Corp. | 48,232 | 1,208 |
| | CH Energy Group Inc. | 21,188 | 847 |
| | | | 198,309 |
| Water Utilities (1.9%) | | |
| | American Water | | |
| | Works Co. Inc. | 234,150 | 5,212 |
| | Aqua America Inc. | 182,750 | 3,129 |
| | California Water | | |
| | Service Group | 26,405 | 947 |
| | American States Water Co. | 24,823 | 798 |
| | SJW Corp. | 18,563 | 417 |
| | Middlesex Water Co. | 18,067 | 299 |
| | |
| | | Market |
| | | Value• |
| | Shares | ($000) |
| Connecticut Water | | |
| Service Inc. | 11,390 | 256 |
| Consolidated Water Co. Ltd. | 18,515 | 225 |
| | | 11,283 |
| Total Investments (100.0%) | | |
| (Cost $701,401) | | 586,267 |
| Other Assets and Liabilities (0.0%) | |
| Other Assets | | 5,268 |
| Liabilities | | (5,274) |
| | | (6) |
| Net Assets (100%) | | 586,261 |
| |
| |
| At February 28, 2010, net assets consisted of: |
| | | Amount |
| | | ($000) |
| Paid-in Capital | | 716,718 |
| Undistributed Net Investment Income | 3,925 |
| Accumulated Net Realized Losses | | (19,248) |
| Unrealized Appreciation (Depreciation) | (115,134) |
| Net Assets | | 586,261 |
| |
| Admiral Shares—Net Assets | | |
| Applicable to 3,335,942 outstanding | |
| $.001 par value shares of beneficial | |
| interest (unlimited authorization) | 103,145 |
| Net Asset Value Per Share— | | |
| Admiral Shares | | $30.92 |
| |
| ETF Shares—Net Assets | | |
| Applicable to 7,842,732 outstanding | |
| $.001 par value shares of beneficial | |
| interest (unlimited authorization) | 483,116 |
| Net Asset Value Per Share— | | |
| ETF Shares | | $61.60 |
• See Note A in Notes to Financial Statements.
* Non-income-producing security.
See accompanying Notes, which are an integral part of the Financial Statements.
93
Utilities Index Fund
| |
| Statement of Operations |
| |
| Six Months Ended |
| February 28, 2010 |
| | ($000) |
| Investment Income | |
| Income | |
| Dividends | 10,825 |
| Total Income | 10,825 |
| Expenses | |
| The Vanguard Group—Note B | |
| Investment Advisory Services | 35 |
| Management and Administrative— | |
| Admiral Shares | 104 |
| Management and Administrative— | |
| ETF Shares | 357 |
| Marketing and Distribution— | |
| Admiral Shares | 7 |
| Marketing and Distribution— | |
| ETF Shares | 58 |
| Custodian Fees | 1 |
| Shareholders’ Reports—Admiral Shares | — |
| Shareholders’ Reports—ETF Shares | 33 |
| Trustees’ Fees and Expenses | 1 |
| Total Expenses | 596 |
| Expenses Paid Indirectly | (1) |
| Net Expenses | 595 |
| Net Investment Income | 10,230 |
| Realized Net Gain (Loss) on | |
| Investment Securities Sold | 3,802 |
| Change in Unrealized Appreciation | |
| (Depreciation) of Investment Securities | (8,920) |
| Net Increase (Decrease) in Net Assets | |
| Resulting from Operations | 5,112 |
| | |
| Statement of Changes in Net Assets | | |
| |
| | Six Months Ended | Year Ended |
| | February 28, | August 31, |
| | 2010 | 2009 |
| | ($000) | ($000) |
| Increase (Decrease) in Net Assets | | |
| Operations | | |
| Net Investment Income | 10,230 | 16,574 |
| Realized Net Gain (Loss) | 3,802 | (17,489) |
| Change in Unrealized Appreciation (Depreciation) | (8,920) | (83,085) |
| Net Increase (Decrease) in Net Assets Resulting from Operations | 5,112 | (84,000) |
| Distributions | | |
| Net Investment Income | | |
| Admiral Shares | (1,699) | (3,297) |
| ETF Shares | (7,846) | (12,782) |
| Realized Capital Gain | | |
| Admiral Shares | — | — |
| ETF Shares | — | — |
| Total Distributions | (9,545) | (16,079) |
| Capital Share Transactions | | |
| Admiral Shares | 22,823 | (4,742) |
| ETF Shares | 123,354 | 69,532 |
| Net Increase (Decrease) from Capital Share Transactions | 146,177 | 64,790 |
| Total Increase (Decrease) | 141,744 | (35,289) |
| Net Assets | | |
| Beginning of Period | 444,517 | 479,806 |
| End of Period1 | 586,261 | 444,517 |
1 Net Assets—End of Period includes undistributed net investment income of $3,925,000 and $3,240,000.
See accompanying Notes, which are an integral part of the Financial Statements.
94
| | | | | | | |
| Utilities Index Fund | | | | | | | |
| |
| |
| Financial Highlights | | | | | | |
| |
| Admiral Shares | | | | | | | |
| | Six Months | | | | | |
| | | Ended | | | | | |
| For a Share Outstanding | February 28, | | | | Year Ended August 31, |
| Throughout Each Period | | 2010 | 2009 | 2008 | 2007 | 2006 | 2005 |
| Net Asset Value, Beginning of Period | $30.73 | $39.26 | $40.60 | $36.47 | $34.03 | $26.70 |
| Investment Operations | | | | | | | |
| Net Investment Income | | .6271 | 1.251 | 1.126 | 1.080 | 1.0801 | .9721 |
| Net Realized and Unrealized Gain (Loss) | | | | | | |
| on Investments2 | | .173 | (8.530) | (1.340) | 4.089 | 2.378 | 7.623 |
| Total from Investment Operations | .800 | (7.279) | (.214) | 5.169 | 3.458 | 8.595 |
| Distributions | | | | | | | |
| Dividends from Net Investment Income | (.610) | (1.251) | (1.126) | (1.039) | (1.018) | (1.265) |
| Distributions from Realized Capital Gains | — | — | — | — | — | — |
| Total Distributions | | (.610) | (1.251) | (1.126) | (1.039) | (1.018) | (1.265) |
| Net Asset Value, End of Period | | $30.92 | $30.73 | $39.26 | $40.60 | $36.47 | $34.03 |
| |
| Total Return3 | | 2.55% | –18.39% | –0.69% | 14.33% | 10.48% | 32.87% |
| |
| Ratios/Supplemental Data | | | | | | | |
| Net Assets, End of Period (Millions) | $103 | $81 | $109 | $108 | $52 | $30 |
| Ratio of Total Expenses to | | | | | | | |
| Average Net Assets | | 0.26%4 | 0.28% | 0.25% | 0.26% | 0.28% | 0.28% |
| Ratio of Net Investment Income to | | | | | | |
| Average Net Assets | | 4.06%4 | 4.28% | 2.75% | 2.70% | 3.26% | 3.34% |
| Portfolio Turnover Rate5 | | 5%4 | 10% | 18% | 12% | 9% | 7% |
1 Calculated based on average shares outstanding.
2 Includes increases from redemption fees of $.00, $.01, $.02, $.02, $.04, and $.00.
3 Total returns do not reflect the 2% fee assessed on redemptions of shares held for less than one year.
4 Annualized.
5 Excludes the value of portfolio securities received or delivered as a result of in-kind purchases or redemptions of the fund’s capital shares, including ETF Creation Units.
See accompanying Notes, which are an integral part of the Financial Statements.
95
| | | | | | | |
| Utilities Index Fund | | | | | | | |
| |
| |
| Financial Highlights | | | | | | |
| |
| ETF Shares | | | | | | | |
| | Six Months | | | | | |
| | | Ended | | | | | |
| For a Share Outstanding | February 28, | | | | Year Ended August 31, |
| Throughout Each Period | | 2010 | 2009 | 2008 | 2007 | 2006 | 2005 |
| Net Asset Value, Beginning of Period | $61.24 | $78.22 | $80.92 | $72.68 | $67.80 | $53.14 |
| Investment Operations | | | | | | | |
| Net Investment Income | | 1.2611 | 2.512 | 2.285 | 2.180 | 2.2141 | 2.0361 |
| Net Realized and Unrealized Gain (Loss) | | | | | | |
| on Investments2 | | .326 | (16.978) | (2.695) | 8.156 | 4.704 | 15.115 |
| Total from Investment Operations | 1.587 | (14.466) | (.410) | 10.336 | 6.918 | 17.151 |
| Distributions | | | | | | | |
| Dividends from Net Investment Income | (1.227) | (2.514) | (2.290) | (2.096) | (2.038) | (2.491) |
| Distributions from Realized Capital Gains | — | — | — | — | — | — |
| Total Distributions | | (1.227) | (2.514) | (2.290) | (2.096) | (2.038) | (2.491) |
| Net Asset Value, End of Period | | $61.60 | $61.24 | $78.22 | $80.92 | $72.68 | $67.80 |
| |
| Total Return | | 2.54% | –18.34% | –0.66% | 14.37% | 10.52% | 32.93% |
| |
| Ratios/Supplemental Data | | | | | | | |
| Net Assets, End of Period (Millions) | $483 | $364 | $371 | $285 | $183 | $95 |
| Ratio of Total Expenses to | | | | | | | |
| Average Net Assets | | 0.23%3 | 0.25% | 0.20% | 0.22% | 0.25% | 0.26% |
| Ratio of Net Investment Income to | | | | | | |
| Average Net Assets | | 4.09%3 | 4.31% | 2.80% | 2.74% | 3.29% | 3.36% |
| Portfolio Turnover Rate4 | | 5%3 | 10% | 18% | 12% | 9% | 7% |
1 Calculated based on average shares outstanding.
2 Includes increases from redemption fees of $.00, $.02, $.04, $.03, $.06 and $.01.
3 Annualized.
4 Excludes the value of portfolio securities received or delivered as a result of in-kind purchases or redemptions of the fund’s capital shares, including ETF Creation Units.
See accompanying Notes, which are an integral part of the Financial Statements.
96
Utilities Index Fund
Notes to Financial Statements
Vanguard Utilities Index Fund is registered under the Investment Company Act of 1940 as an open-end investment company, or mutual fund. The fund offers two classes of shares: Admiral Shares and ETF Shares. Admiral Shares are available to any investor who meets the fund’s minimum purchase requirements. ETF Shares are listed for trading on the NYSE Arca, Inc.; they can be purchased and sold through a broker.
A. The following significant accounting policies conform to generally accepted accounting principles for U.S. mutual funds. The fund consistently follows such policies in preparing its financial statements.
1. Security Valuation: Securities are valued as of the close of trading on the New York Stock Exchange (generally 4 p.m., Eastern time) on the valuation date. Equity securities are valued at the latest quoted sales prices or official closing prices taken from the primary market in which each security trades; such securities not traded on the valuation date are valued at the mean of the latest quoted bid and asked prices. Securities for which market quotations are not readily available, or whose values have been materially affected by events occurring before the fund’s pricing time but after the close of the securities’ primary markets, are valued by methods deemed by the board of trustees to represent fair value. Investments in Vanguard Market Liquidity Fund are valued at that fund’s net asset value.
2. Federal Income Taxes: The fund intends to continue to qualify as a regulated investment company and distribute all of its taxable income. Management has analyzed the fund’s tax positions taken for all open federal income tax years (August 31, 2006–2009), and for the period ended February 28, 2010, and has concluded that no provision for federal income tax is required in the fund’s financial statements.
3. Distributions: Distributions to shareholders are recorded on the ex-dividend date.
4. Other: Dividend income is recorded on the ex-dividend date. Interest income includes income distributions received from Vanguard Market Liquidity Fund and is accrued daily. Security transactions are accounted for on the date securities are bought or sold. Costs used to determine realized gains (losses) on the sale of investment securities are those of the specific securities sold. Fees assessed on redemptions of capital shares are credited to paid-in capital.
Each class of shares has equal rights as to assets and earnings, except that each class separately bears certain class-specific expenses related to maintenance of shareholder accounts (included in Management and Administrative expenses) and shareholder reporting. Marketing and distribution expenses are allocated to each class of shares based on a method approved by the board of trustees. Income, other non-class-specific expenses, and gains and losses on investments are allocated to each class of shares based on its relative net assets.
B. The Vanguard Group furnishes at cost investment advisory, corporate management, administrative, marketing, and distribution services. The costs of such services are allocated to the fund under methods approved by the board of trustees. The fund has committed to provide up to 0.40% of its net assets in capital contributions to Vanguard. At February 28, 2010, the fund had contributed capital of $120,000 to Vanguard (included in Other Assets), representing 0.02% of the fund’s net assets and 0.05% of Vanguard’s capitalization. The fund’s trustees and officers are also directors and officers of Vanguard.
C. The fund’s custodian bank has agreed to reduce its fees when the fund maintains cash on deposit in the non-interest-bearing custody account. For the six months ended February 28, 2010, custodian fee offset arrangements reduced the fund’s expenses by $1,000 (an annual rate of 0.00% of average net assets).
D. Various inputs may be used to determine the value of the fund’s investments. These inputs are summarized in three broad levels for financial statement purposes. The inputs or methodologies used to value securities are not necessarily an indication of the risk associated with investing in those securities.
Level 1—Quoted prices in active markets for identical securities.
Level 2—Other significant observable inputs (including quoted prices for similar securities, interest rates, prepayment speeds, credit risk, etc.).
Level 3—Significant unobservable inputs (including the fund’s own assumptions used to determine the fair value of investments).
At February 28, 2010, 100% of the fund’s investments were valued based on Level 1 inputs.
97
Utilities Index Fund
E. Distributions are determined on a tax basis and may differ from net investment income and realized capital gains for financial reporting purposes. Differences may be permanent or temporary. Permanent differences are reclassified among capital accounts in the financial statements to reflect their tax character. Temporary differences arise when certain items of income, expense, gain, or loss are recognized in different periods for financial statement and tax purposes; these differences will reverse at some time in the future. Differences in classification may also result from the treatment of short-term gains as ordinary income for tax purposes.
During the six months ended February 28, 2010, the fund realized $4,374,000 of net capital gains resulting from in-kind redemptions—in which shareholders exchanged fund shares for securities held by the fund rather than for cash. Because such gains are not taxable to the fund, and are not distributed to shareholders, they have been reclassified from accumulated net realized losses to paid-in capital.
The fund’s tax-basis capital gains and losses are determined only at the end of each fiscal year. For tax purposes, at August 31, 2009, the fund had available capital loss carryforwards totaling $3,425,000 to offset future net capital gains of $515,000 through August 31, 2015, and $2,910,000 through August 31, 2017. In addition, the fund realized losses of $14,092,000 during the period from November 1, 2008, through August 31, 2009, which are deferred and will be treated as realized for tax purposes in fiscal 2010. The fund will use these capital losses to offset net taxable capital gains, if any, realized during the year ending August 31, 2010; should the fund realize net capital losses for the year, the losses will be added to the loss carryforward balances above.
At February 28, 2010, the cost of investment securities for tax purposes was $701,401,000. Net unrealized depreciation of investment securities for tax purposes was $115,134,000, consisting of unrealized gains of $2,480,000 on securities that had risen in value since their purchase and $117,614,000 in unrealized losses on securities that had fallen in value since their purchase.
F. During the six months ended February 28, 2010, the fund purchased $190,287,000 of investment securities and sold $43,315,000 of investment securities, other than temporary cash investments.
G. Capital share transactions for each class of shares were:
| | | | |
| | Six Months Ended | | Year Ended |
| | February 28, 2010 | August 31, 2009 |
| | Amount | Shares | Amount | Shares |
| | ($000) | (000) | ($000) | (000) |
| Admiral Shares | | | | |
| Issued | 33,787 | 1,057 | 20,497 | 698 |
| Issued in Lieu of Cash Distributions | 1,441 | 45 | 2,918 | 98 |
| Redeemed1 | (12,405) | (397) | (28,157) | (949) |
| Net Increase (Decrease)—Admiral Shares | 22,823 | 705 | (4,742) | (153) |
| ETF Shares | | | | |
| Issued | 154,023 | 2,404 | 153,405 | 2,602 |
| Issued in Lieu of Cash Distributions | — | — | — | — |
| Redeemed1 | (30,669) | (500) | (83,873) | (1,400) |
| Net Increase (Decrease)—ETF Shares | 123,354 | 1,904 | 69,532 | 1,202 |
| 1 Net of redemption fees for fiscal 2010 and 2009 of $21,000 and $113,000, respectively (fund totals). | | |
H. In preparing the financial statements as of February 28, 2010, management considered the impact of subsequent events for potential recognition or disclosure in these financial statements.
98
About Your Fund’s Expenses
As a shareholder of the fund, you incur ongoing costs, which include costs for portfolio management, administrative services, and shareholder reports (like this one), among others. Operating expenses, which are deducted from a fund’s gross income, directly reduce the investment return of the fund.
A fund’s expenses are expressed as a percentage of its average net assets. This figure is known as the expense ratio. The examples on this page are intended to help you understand the ongoing costs (in dollars) of investing in your fund and to compare these costs with those of other mutual funds. The examples are based on an investment of $1,000 made at the beginning of the period shown and held for the entire period.
The acompanying table illustrates your fund’s costs in two ways:
• Based on actual fund return. This section helps you to estimate the actual expenses that you paid over the period. The “Ending Account Value” shown is derived from the fund’s actual return, and the third column shows the dollar amount that would have been paid by an investor who started with $1,000 in the fund. You may use the information here, together with the amount you invested, to estimate the expenses that you paid over the period.
To do so, simply divide your account value by $1,000 (for example, an $8,600 account value divided by $1,000 = 8.6), then multiply the result by the number given for your fund under the heading “Expenses Paid During Period.”
• Based on hypothetical 5% yearly return. This section is intended to help you compare your fund’s costs with those of other mutual funds. It assumes that the fund had a yearly return of 5% before expenses, but that the expense ratio is unchanged. In this case—because the return used is not the fund’s actual return—the results do not apply to your investment. The example is useful in making comparisons because the Securities and Exchange Commission requires all mutual funds to calculate expenses based on a 5% return. You can assess your fund’s costs by comparing this hypothetical example with the hypothetical examples that appear in shareholder reports of other funds.
Note that the expenses shown in the table are meant to highlight and help you compare ongoing costs only and do not reflect transaction costs incurred by the fund for buying and selling securities. Further, the expenses do not include the 2% fee on redemptions of Admiral Shares held for less than one year. If this fee were applied to your account, your costs would be higher. Your fund does not carry a “sales load.”
The calculations assume no shares were bought or sold during the period. Your actual costs may have been higher or lower, depending on the amount of your investment and the timing of any purchases or redemptions.
You can find more information about the fund’s expenses in the Financial Statements section of this report. For additional information on operating expenses and other shareholder costs, please refer to your fund’s current prospectus.
99
| | | | |
| Six Months Ended February 28, 2010 | | | | |
| | | Beginning | Ending | Expenses |
| | | Account Value | Account Value | Paid During |
| Index Fund | Share Class | 8/31/2009 | 2/28/2010 | Period1 |
| Based on Actual Fund Return | | | | |
| Consumer Discretionary | Admiral | $1,000.00 | $1,177.07 | $1.40 |
| | ETF | 1,000.00 | 1,177.15 | 1.24 |
| Consumer Staples | Admiral | $1,000.00 | $1,108.09 | $1.36 |
| | ETF | 1,000.00 | 1,108.09 | 1.20 |
| Energy | Admiral | $1,000.00 | $1,109.27 | $1.36 |
| | ETF | 1,000.00 | 1,109.55 | 1.20 |
| Financials | Admiral | $1,000.00 | $1,025.76 | $1.31 |
| | ETF | 1,000.00 | 1,025.92 | 1.16 |
| Health Care | Admiral | $1,000.00 | $1,114.38 | $1.36 |
| | ETF | 1,000.00 | 1,114.71 | 1.21 |
| Industrials | Admiral | $1,000.00 | $1,155.21 | $1.39 |
| | ETF | 1,000.00 | 1,155.36 | 1.23 |
| Information Technology | Admiral | $1,000.00 | $1,109.27 | $1.36 |
| | ETF | 1,000.00 | 1,109.62 | 1.20 |
| Materials | Admiral | $1,000.00 | $1,103.02 | $1.36 |
| | ETF | 1,000.00 | 1,102.93 | 1.20 |
| Telecommunication Services | Admiral | $1,000.00 | $1,067.62 | $1.33 |
| | ETF | 1,000.00 | 1,067.91 | 1.18 |
| Utilities | Admiral | $1,000.00 | $1,025.45 | $1.31 |
| | ETF | 1,000.00 | 1,025.40 | 1.15 |
| Based on Hypothetical 5% Yearly Return | | | |
| Consumer Discretionary | Admiral | $1,000.00 | $1,023.51 | $1.30 |
| | ETF | 1,000.00 | 1,023.65 | 1.15 |
| Consumer Staples | Admiral | $1,000.00 | $1,023.51 | $1.30 |
| | ETF | 1,000.00 | 1,023.65 | 1.15 |
| Energy | Admiral | $1,000.00 | $1,023.51 | $1.30 |
| | ETF | 1,000.00 | 1,023.65 | 1.15 |
| Financials | Admiral | $1,000.00 | $1,023.51 | $1.30 |
| | ETF | 1,000.00 | 1,023.65 | 1.15 |
| Health Care | Admiral | $1,000.00 | $1,023.51 | $1.30 |
| | ETF | 1,000.00 | 1,023.65 | 1.15 |
| Industrials | Admiral | $1,000.00 | $1,023.51 | $1.30 |
| | ETF | 1,000.00 | 1,023.65 | 1.15 |
| Information Technology | Admiral | $1,000.00 | $1,023.51 | $1.30 |
| | ETF | 1,000.00 | 1,023.65 | 1.15 |
| Materials | Admiral | $1,000.00 | $1,023.51 | $1.30 |
| | ETF | 1,000.00 | 1,023.65 | 1.15 |
| Telecommunication Services | Admiral | $1,000.00 | $1,023.51 | $1.30 |
| | ETF | 1,000.00 | 1,023.65 | 1.15 |
| Utilities | Admiral | $1,000.00 | $1,023.51 | $1.30 |
| | ETF | 1,000.00 | 1,023.65 | 1.15 |
1 The calculations are based on expenses incurred in the most recent six-month period. The funds’ annualized six-month expense ratios for that period are 0.26% for the Consumer Discretionary Index Fund Admiral Shares and 0.23% for the ETF Shares; 0.26% for the Consumer Staples Index Fund Admiral Shares and 0.23% for the ETF Shares; 0.26% for the Energy Index Fund Admiral Shares and 0.23% for the ETF Shares; 0.26% for the Financials Index Fund Admiral Shares and 0.23% for the ETF Shares; 0.26% for the Health Care Index Fund Admiral Shares and 0.23% for the ETF Shares; 0.26% for the Industrials Index Fund Admiral Shares and 0.23% for the ETF Shares; 0.26% for the Information Technology Index Fund Admiral Shares and 0.23% for the ETF Shares; 0.26% for the Materials Index Fund Admiral Shares and 0.23% for the ETF Shares; 0.26% for the Tele communication Services Index Fund Admiral Shares and 0.23% for the ETF Shares; and 0.26% for the Utilities Index Fund Admiral Shares and 0.23% for the ETF Shares. The dollar amounts shown as “Expenses Paid” are equal to the annualized expense ratio multiplied by the average account value over the period, multiplied by the number of days in the most recent six-month period, the most recent 12-month period, then divided by the number of days in the most recent 12-month period.
100
Glossary
Beta. A measure of the magnitude of a fund’s past share-price fluctuations in relation to the ups and downs of a given market index. The index is assigned a beta of 1.00. Compared with a given index, a fund with a beta of 1.20 typically would have seen its share price rise or fall by 12% when the index rose or fell by 10%. For this report, beta is based on returns over the past 36 months for both the fund and the index. Note that a fund’s beta should be reviewed in conjunction with its R-squared (see definition below). The lower the R-squared, the less correlation there is between the fund and the index, and the less reliable beta is as an indicator of volatility.
Earnings Growth Rate. The average annual rate of growth in earnings over the past five years for the stocks now in a fund.
Equity Exposure. A measure that reflects a fund’s investments in stocks and stock futures. Any holdings in short-term reserves are excluded.
Expense Ratio. The percentage of a fund’s average net assets used to pay its annual administrative and advisory expenses. These expenses directly reduce returns to investors.
Foreign Holdings. The percentage of a fund represented by stocks or depositary receipts of companies based outside the United States.
Inception Date. The date on which the assets of a fund (or one of its share classes) are first invested in accordance with the fund’s investment objective. For funds with a subscription period, the inception date is the day after that period ends. Investment performance is measured from the inception date.
Median Market Cap. An indicator of the size of companies in which a fund invests; the midpoint of market capitalization (market price x shares outstanding) of a fund’s stocks, weighted by the proportion of the fund’s assets invested in each stock. Stocks representing half of the fund’s assets have market capitalizations above the median, and the rest are below it.
Price/Book Ratio. The share price of a stock divided by its net worth, or book value, per share. For a fund, the weighted average price/book ratio of the stocks it holds.
Price/Earnings Ratio. The ratio of a stock’s current price to its per-share earnings over the past year. For a fund, the weighted average P/E of the stocks it holds. P/E is an indicator of market expectations about corporate prospects; the higher the P/E, the greater the expectations for a company’s future growth.
R-Squared. A measure of how much of a fund’s past returns can be explained by the returns from the market in general, as measured by a given index. If a fund’s total returns were precisely synchronized with an index’s returns, its R-squared would be 1.00. If the fund’s returns bore no relationship to the index’s returns, its R-squared would be 0. For this report, R-squared is based on returns over the past 36 months for both the fund and the index.
Return on Equity. The annual average rate of return generated by a company during the past five years for each dollar of shareholder’s equity (net income divided by shareholder’s equity). For a fund, the weighted average return on equity for the companies whose stocks it holds.
Short-Term Reserves. The percentage of a fund invested in highly liquid, short-term securities that can be readily converted to cash.
Turnover Rate. An indication of the fund’s trading activity. Funds with high turnover rates incur higher transaction costs and may be more likely to distribute capital gains (which may be taxable to investors). The turnover rate excludes in-kind transactions, which have minimal impact on costs.
Yield. A fund’s 30-day SEC yield is derived using a formula specified by the U.S. Securities and Exchange Commission. Under the formula, data related to the fund’s security holdings in the previous 30 days are used to calculate the fund’s hypothetical net income for that period, which is then annualized and divided by the fund’s estimated average net assets over the calculation period. For the purposes of this calculation, a security’s income is based on its current market yield to maturity (in the case of bonds) or its projected dividend yield (for stocks). Because the SEC yield represents hypothetical annualized income, it will differ—at times significantly—from the fund’s actual experience. As a result, the fund’s income distributions may be higher or lower than implied by the SEC yield.
101
This page intentionally left blank.
This page intentionally left blank.
This page intentionally left blank.
The People Who Govern Your Fund
The trustees of your mutual fund are there to see that the fund is operated and managed in your best interests since, as a shareholder, you are a part owner of the fund. Your fund’s trustees also serve on the board of directors of The Vanguard Group, Inc., which is owned by the Vanguard funds and provides services to them on an at-cost basis.
A majority of Vanguard’s board members are independent, meaning that they have no affiliation with Vanguard or the funds they oversee, apart from the sizable personal investments they have made as private individuals. The independent board members have distinguished backgrounds in business, academia, and public service. Each of the trustees and executive officers oversees 161 Vanguard funds.
The following table provides information for each trustee and executive officer of the fund. More information about the trustees is in the Statement of Additional Information, which can be obtained, without charge, by contacting Vanguard at 800-662-7447, or online at www.vanguard.com.
Interested Trustee1
F. William McNabb III
Born 1957. Trustee Since July 2009. Chairman
of the Board. Principal Occupation(s) During the
Past Five Years: Chairman of the Board of The
Vanguard Group, Inc., and of each of the investment
companies served by The Vanguard Group, since
January 2010; Director of The Vanguard Group since
2008; Chief Executive Officer and President of The
Vanguard Group and of each of the investment
companies served by The Vanguard Group since
2008; Director of Vanguard Marketing Corporation;
Managing Director of The Vanguard Group
(1995–2008).
Independent Trustees
Emerson U. Fullwood
Born 1948. Trustee Since January 2008. Principal
Occupation(s) During the Past Five Years: Executive
Chief Staff and Marketing Officer for North America
and Corporate Vice President (retired 2008) of Xerox
Corporation (document management products and
services); Director of SPX Corporation (multi-industry
manufacturing), the United Way of Rochester, the
Boy Scouts of America, Amerigroup Corporation
(managed health care), and Monroe Community
College Foundation.
Rajiv L. Gupta
Born 1945. Trustee Since December 2001.2 Principal
Occupation(s) During the Past Five Years: Chairman
and Chief Executive Officer (retired 2009) and
President (2006–2008) of Rohm and Haas Co.
(chemicals); Board Member of American Chemistry
Council; Director of Tyco International, Ltd. (diversified
manufacturing and services) and Hewlett-Packard
Co. (electronic computer manufacturing); Trustee of
The Conference Board.
Amy Gutmann
Born 1949. Trustee Since June 2006. Principal
Occupation(s) During the Past Five Years:
President of the University of Pennsylvania;
Christopher H. Browne Distinguished Professor of
Political Science in the School of Arts and Sciences
with secondary appointments at the Annenberg
School for Communication and the Graduate School
of Education of the University of Pennsylvania;
Director of Carnegie Corporation of New York,
Schuylkill River Development Corporation, and
Greater Philadelphia Chamber of Commerce;
Trustee of the National Constitution Center.
JoAnn Heffernan Heisen
Born 1950. Trustee Since July 1998. Principal
Occupation(s) During the Past Five Years: Corporate
Vice President and Chief Global Diversity Officer
since 2006 (retired 2008) and Member of the
Executive Committee (retired 2008) of Johnson &
Johnson (pharmaceuticals/consumer products); Vice
President and Chief Information Officer of Johnson
& Johnson (1997–2005); Director of the University
Medical Center at Princeton and Women’s Research
and Education Institute; Member of the Advisory
Board of the Maxwell School of Citizenship and
Public Affairs at Syracuse University.
F. Joseph Loughrey
Born 1949. Trustee Since October 2009. Principal
Occupation(s) During the Past Five Years: President
and Chief Operating Officer since 2005 (retired 2009)
and Vice Chairman of the Board (2008–2009) of
Cummins Inc. (industrial machinery); Director of SKF
AB (industrial machinery), Hillenbrand, Inc. (specialized
consumer services), Sauer-Danfoss Inc. (machinery),
the Lumina Foundation for Education, and the
Columbus Community Education Coalition; Chairman
of the Advisory Council for the College of Arts and
Letters at the University of Notre Dame.
André F. Perold
Born 1952. Trustee Since December 2004. Principal
Occupation(s) During the Past Five Years: George
Gund Professor of Finance and Banking at the
Harvard Business School; Chair of the Investment
Committee of HighVista Strategies LLC (private
investment firm).
Alfred M. Rankin, Jr.
Born 1941. Trustee Since January 1993. Principal
Occupation(s) During the Past Five Years: Chairman,
President, and Chief Executive Officer of NACCO
Industries, Inc. (forklift trucks/housewares/lignite);
Director of Goodrich Corporation (industrial products/
aircraft systems and services); Deputy Chairman of
the Federal Reserve Bank of Cleveland; Trustee of
University Hospitals of Cleveland, The Cleveland
Museum of Art, and Case Western Reserve
University.
Peter F. Volanakis
Born 1955. Trustee Since July 2009. Principal
Occupation(s) During the Past Five Years: President
since 2007 and Chief Operating Officer since 2005
of Corning Incorporated (communications equipment);
President of Corning Technologies (2001–2005);
Director of Corning Incorporated and Dow Corning;
Trustee of the Corning Incorporated Foundation and
the Corning Museum of Glass; Overseer of the
Amos Tuck School of Business Administration at
Dartmouth College.
Executive Officers
Thomas J. Higgins
Born 1957. Chief Financial Officer Since
September 2008. Principal Occupation(s) During
the Past Five Years: Principal of The Vanguard
Group, Inc.; Chief Financial Officer of each of the
investment companies served by The Vanguard
Group since 2008; Treasurer of each of the
investment companies served by The Vanguard
Group (1998–2008).
Kathryn J. Hyatt
Born 1955. Treasurer Since November 2008.
Principal Occupation(s) During the Past Five Years:
Principal of The Vanguard Group, Inc.; Treasurer of
each of the investment companies served by The
Vanguard Group since 2008; Assistant Treasurer of
each of the investment companies served by The
Vanguard Group (1988–2008).
Heidi Stam
Born 1956. Secretary Since July 2005. Principal
Occupation(s) During the Past Five Years: Managing
Director of The Vanguard Group, Inc., since 2006;
General Counsel of The Vanguard Group since 2005;
Secretary of The Vanguard Group and of each of the
investment companies served by The Vanguard
Group since 2005; Director and Senior Vice President
of Vanguard Marketing Corporation since 2005;
Principal of The Vanguard Group (1997–2006).
| |
| Vanguard Senior Management Team |
| |
| R. Gregory Barton | Michael S. Miller |
| Mortimer J. Buckley | James M. Norris |
| Kathleen C. Gubanich | Glenn W. Reed |
| Paul A. Heller | George U. Sauter |
Chairman Emeritus and Senior Advisor
John J. Brennan
Chairman, 1996–2009
Chief Executive Officer and President, 1996–2008
Founder
John C. Bogle
Chairman and Chief Executive Officer, 1974–1996
1 Mr. McNabb is considered an “interested person,” as defined in the Investment Company Act of 1940, because he is an officer of the Vanguard funds.
2 December 2002 for Vanguard Equity Income Fund, Vanguard Growth Equity Fund, the Vanguard Municipal Bond Funds, and the Vanguard State Tax-Exempt Funds.
| |
|  |
| P. O. Box 2600 |
| Valley Forge, PA 19482-2600 |
Connect with Vanguard® > www.vanguard.com
| |
| Fund Information > 800-662-7447 | All comparative mutual fund data are from Lipper Inc. or |
| | Morningstar, Inc., unless otherwise noted. |
| Direct Investor Account Services > 800-662-2739 | |
| | |
| Institutional Investor Services > 800-523-1036 | You can obtain a free copy of Vanguard’s proxy voting guidelines |
| | by visiting our website, www.vanguard.com, and searching for |
| Text Telephone for People | “proxy voting guidelines,” or by calling Vanguard at 800-662-2739. |
| With Hearing Impairment > 800-749-7273 | The guidelines are also available from the SEC’s website, |
| | www.sec.gov. In addition, you may obtain a free report on how your |
| | fund voted the proxies for securities it owned during the 12 months |
| | ended June 30. To get the report, visit either www.vanguard.com |
| This material may be used in conjunction with | or www.sec.gov. |
| the offering of shares of any Vanguard fund | |
| only if preceded or accompanied by the fund’s | You can review and copy information about your fund at the SEC’s |
| current prospectus. | Public Reference Room in Washington, D.C. To find out more about |
| | this public service, call the SEC at 202-551-8090. Information about |
| The funds or securities referred to herein are not sponsored, | your fund is also available on the SEC’s website, and you can |
| endorsed, or promoted by MSCI, and MSCI bears no liability | receive copies of this information, for a fee, by sending a request in |
| with respect to any such funds or securities. For any such funds | either of two ways: via e-mail addressed to publicinfo@sec.gov or |
| or securities, the prospectus or the Statement of Additional | via regular mail addressed to the Public Reference Section, |
| Information contains a more detailed description of the limited | Securities and Exchange Commission, Washington, DC 20549-1520. |
| relationship MSCI has with The Vanguard Group and any | |
| related funds. | |
| © 2010 The Vanguard Group, Inc. |
| All rights reserved. |
| Vanguard Marketing Corporation, Distributor. |
| |  |
| Q4832 042010 |
 |
| Vanguard Extended Duration Treasury |
| Index Fund Semiannual Report |
|
> For the fiscal half-year ended February 28, 2010, Vanguard Extended Duration Treasury Index Fund returned about –8%. The market return of the ETF Shares was a bit lower.
> Yields of long-term Treasury securities rose during the period in response to investors’ expectations of higher inflation and rising interest rates.
> The fund trailed its target, the Barclays Capital U.S. Treasury STRIPS 20–30 Year Equal Par Bond Index, because of temporary pricing differences between the fund and the index at the close of trading on the final day of the six-month period.
| |
| Contents | |
| Your Fund’s Total Returns | 1 |
| Chairman’s Letter | 2 |
| Fund Profile | 6 |
| Performance Summary | 7 |
| Financial Statements | 8 |
| About Your Fund’s Expenses | 17 |
| Glossary | 19 |
Please note: The opinions expressed in this report are just that—informed opinions. They should not be considered promises or advice. Also, please keep in mind that the information and opinions cover the period through the date on the front of this report. Of course, the risks of investing in your fund are spelled out in the prospectus.
Cover photograph: Veronica Coia.
| | | | |
| Your Fund’s Total Returns | | | |
| |
| |
| |
| |
| Six Months Ended February 28, 2010 | | | | |
| | | | Ticker | Total |
| | | | Symbol | Returns |
| Vanguard Extended Duration Treasury Index Fund | | | |
| Institutional Shares1 | | | VEDTX | –8.42% |
| ETF Shares2 | | | EDV | |
| Market Price | | | | –9.91 |
| Net Asset Value | | | | –8.43 |
| Barclays Capital U.S. Treasury STRIPS 20–30 Year Equal Par Bond Index | | –7.46 |
| |
| |
| Your Fund’s Performance at a Glance | | | | |
| August 31, 2009–February 28, 2010 | | | | |
| | | | Distributions Per Share |
| | Starting | Ending | Income | Capital |
| | Share Price | Share Price | Dividends | Gains |
| Vanguard Extended Duration Treasury | | | | |
| Index Fund | | | | |
| Institutional Shares | $30.69 | $24.12 | $0.618 | $3.345 |
| ETF Shares | 101.91 | 80.01 | 2.050 | 11.108 |
1 This class of shares carries low expenses and is available for a minimum initial investment of $5 million.
2 These Vanguard ETF® shares are traded on the NYSE Arca exchange and are available only through brokers. The table shows ETF returns based on both the NYSE Arca market price and the net asset value for a share. U.S. Pat. No. 6,879,964 B2; 7,337,138.
1

Chairman’s Letter
Dear Shareholder,
Vanguard Extended Duration Treasury Index Fund returned about –8% for the half-year through February 2010, a not unusual swing from the positive 12-month return we reported to you last fall. This is because of the fund’s long duration, which makes its share price very sensitive to changes in interest rates.
During the past six months, investors have modestly ratcheted up their long-term inflation forecasts, and this change is reflected in increases in long-term interest rates. They’ve done so because the economy appears to be emerging from the worst recession in a generation, and the later stages of expansions can be inflationary. For the near term, the market is also concerned about the potential consequences of government policies that were aimed at combating the economic slump and an unprecedented financial crisis.
The fund’s performance slightly trailed that of its benchmark, the Barclays Capital U.S. Treasury STRIPS 20–30 Year Equal Par Bond Index. Small short-term deviations, positive or negative, aren’t unusual because of the cost-efficient sampling technique the fund uses and because of slight differences in the way the index and the fund are priced at the close of the trading day.
The Fed begins unwinding its rescue programs
The yields of longer-term U.S. Treasury bonds rose during the past six months. Thirty-year Treasury yields rose the most,

to 4.53%, an increase of 35 basis points for the half year (and 82 basis points over 12 months). By contrast, the yields of the shortest-term securities remained near 0%.
Although the Federal Reserve Board expects to keep its target for short-term interest rates close to zero for “an extended period,” it began to wind down credit programs established during the financial crisis. The Fed’s most dramatic (though largely symbolic) act was to raise the interest rate at its discount window, a lending facility designed to help commercial banks and other depository institutions meet emergency short-term funding needs.
The broad taxable bond market returned 3.19%, with notable strength in corporate bonds. The broad municipal bond market returned 4.13%.
Stock markets caught their breath at the end of a solid six months
For the six months, the broad U.S. stock market returned about 10%. The rally seemed to downshift toward the end of the period, as the investor relief that powered markets higher a year ago gave way to sober-minded assessment of corporate earnings-growth prospects.
Smaller-capitalization stocks did a little better than larger-caps, and growth-oriented securities bested their value-
| | | |
| Market Barometer | | | |
| | | | Total Returns |
| | | Periods Ended February 28, 2010 |
| | Six Months | One Year | Five Years1 |
| Bonds | | | |
| Barclays Capital U.S. Aggregate Bond Index | | | |
| (Broad taxable Bond market) | 3.19% | 9.32% | 5.36% |
| Barclays Capital Municipal Bond Index | 4.13 | 9.98 | 4.50 |
| Citigroup 3-Month Treasury Bill Index | 0.06 | 0.14 | 2.81 |
| |
| Stocks | | | |
| Russell 1000 Index (Large-caps) | 9.91% | 55.32% | 0.77% |
| Russell 2000 Index (Small-caps) | 10.59 | 63.95 | 1.16 |
| Dow Jones U.S. Total Stock Market Index | 10.23 | 56.38 | 1.20 |
| MSCI All Country World Index ex USA (International) | 3.83 | 63.51 | 4.60 |
| |
| CPI | | | |
| Consumer Price Index | 0.42% | 2.14% | 2.48% |
1 Annualized.
3
oriented counterparts, but the uniformity of returns from different market segments was more striking than the differences.
International stocks produced more modest returns. In Europe, the precarious financial health of Greece and smaller economies such as Portugal and Ireland weighed on the markets. In Asia, the Japanese stock market’s weakness held back results for Asia Pacific indexes. Emerging market stocks continued to outpace those from developed markets.
The market’s inflation forecast put pressure on the fund’s yield
In our last shareholder letter, we reported that Vanguard Extended Duration Treasury Index Fund returned about 8% for the fiscal year ended August 31, 2009. In a bit of negative symmetry, the fund returned about –8% for the recent fiscal half-year.
This fund’s returns are particularly volatile because of its long duration—about 26.5 years at the end of February. The prices of the fund’s securities can rise or fall dramatically as investors grapple with the higher-than-usual uncertainty associated with the longest-maturity bonds.
Much of the extra uncertainty surrounds expectations about inflation, an ever-present concern of long-term bondholders. The financial market’s consensus estimate of the 10-year future inflation rate has shifted since last August from 1.65% annually to 2.16% annually, as of February. (The consensus estimate figures are
| | |
| Expense Ratios1 | | |
| | Institutional | ETF |
| | Shares | Shares |
| Extended Duration Treasury Index Fund | 0.11% | 0.14% |
1 The fund expense ratios shown are from the prospectuses dated December 28, 2009, and represent estimated costs for the current fiscal year based on the fund's net assets as of the prospectus date. For the six months ended February 28, 2010, the annualized expense ratios were 0.11% for Institutional Shares and 0.13% for the ETF Shares.
4
derived from the “break-even inflation rate,” which compares the expected yield of traditional Treasury bonds with that of Treasury inflation-protected securities.)
Investors are apprehensive about the potential inflationary pressure arising from the economy’s apparent emergence from the Great Recession. Continued expansion could stoke inflation, although probably not too soon because of factors such as still-low capacity utilization and a high jobless rate.
The federal government’s large debt-financing needs, which have expanded greatly because of its stimulus programs, are another source of concern. Large issuance of new Treasury bonds can put upward pressure on yields as it drives down bond prices.
To address these potentially inflationary developments, the Federal Reserve Board undoubtedly will at some point rein in its highly accommodative monetary policy. This too could put upward pressure on yields.
The fund can be a useful tool for liability-driven investing
Perhaps counterintuitively, the loss incurred by the Extended Duration Treasury Index Fund during the fiscal half-year shows that the fund performed as intended. The fund was designed primarily to help managers of defined-benefit pension plans hedge changes in the value of their future liabilities with an investment that moves in the same direction. For pension-plan managers, the fund can serve as a straightforward and transparent tool to help reduce the volatility in the ratio of a plan’s assets to its liabilities.
On another matter, I would like to inform you that as of January 1, 2010, we completed a leadership transition that began in March 2008. I succeeded Jack Brennan as chairman of Vanguard and each of the funds. Jack has agreed to serve as chairman emeritus and senior advisor. Under Jack’s leadership, Vanguard has grown to become a preeminent firm in the mutual fund industry. Jack’s energy, his relentless pursuit of perfection, and his unwavering focus on always doing the right thing for our clients are evident in every facet of Vanguard policy today.
Thank you for entrusting your assets to Vanguard.
Sincerely,

F. William McNabb III
Chairman and Chief Executive Officer
March 12, 2010
Extended Duration Treasury Index Fund
Fund Profile
As of February 28, 2010
| | |
| Financial Attributes | | |
| | | Target |
| | Fund | Index1 |
| Number of Issues | 51 | 51 |
| Yield2 | | 4.8% |
| Institutional Shares | 4.8% | |
| ETF Shares | 4.7% | |
| Yield to Maturity | 4.8%3 | 4.8% |
| Average Coupon | 0.0% | 0.0% |
| Average Effective Maturity | 25.1 years | 24.8 years |
| Average Quality4 | Aaa | Aaa |
| Average Duration | 26.5 years | 26.2 years |
| Expense Ratio5 | | — |
| Institutional Shares | 0.11% | |
| ETF Shares | 0.14% | |
| Short-Term Reserves | 0.0% | — |
| |
| Sector Diversification (% of portfolio) | |
| Treasury/Agency | 100.0% |
| |
| Distribution by Maturity (% of portfolio) | |
| 20–30 Years | 100.0% |
| |
| Distribution by Credit Quality4 (% of portfolio) |
| Aaa | 100.0% |
Investment Focus

1 Barclays Capital U.S. Treasury STRIPS 20–30 Year Equal Par Bond Index.
2 30-day SEC yield for the fund; index yield assumes that all bonds are called or prepaid at the earliest possible date.
3 Before expenses.
4 Moody’s Investors Service.
5 The expense ratios shown are from the prospectuses dated December 28, 2009, and represent estimated costs for the current fiscal year based on the fund’s net assets as of the prospectus date. For the six months ended February 28, 2010, the annualized expense ratios were 0.11% for Institutional Shares and 0.13% for ETF Shares.
6
Extended Duration Treasury Index Fund
Performance Summary
All of the returns in this report represent past performance, which is not a guarantee of future results that may be achieved by the fund. (Current performance may be lower or higher than the performance data cited. For performance data current to the most recent month-end, visit our website at www.vanguard.com/performance.) Note, too, that both investment returns and principal value can fluctuate widely, so an investor’s shares, when sold, could be worth more or less than their original cost. The returns shown do not reflect taxes that a shareholder would pay on fund distributions or on the sale of fund shares.
| | | | |
| Fiscal-Year Total Returns (%): November 28, 2007–February 28, 2010 | | |
| |
| | | Institutional Shares | Barclays1 |
| Fiscal | Capital | Income | Total | Total |
| Year | Return | Return | Return | Return |
| 2008 | –1.6% | 2.0% | 0.4% | 0.8% |
| 2009 | 4.0 | 4.0 | 8.0 | 8.4 |
| 20102 | –10.4 | 2.0 | –8.4 | –7.5 |
Average Annual Total Returns: Periods Ended December 31, 2009
This table presents average annual total returns through the latest calendar quarter—rather than through the end
of the fiscal period. Securities and Exchange Commission rules require that we provide this information.
| | | | | |
| | | | | Since Inception |
| | Inception Date | One Year | Capital | Income | Total |
| Institutional Shares | 11/28/2007 | –36.65% | –5.04% | 3.71% | –1.33% |
| ETF Shares3 | 12/6/2007 | | | | |
| Market Price | | –36.63 | — | — | –0.38 |
| Net Asset Value | | –36.66 | –10.17 | 9.69 | –0.48 |
1 Barclays Capital U.S. Treasury STRIPS 20–30 Year Equal Par Bond Index.
2 Six months ended February 28, 2010.
3 For more information about how the ETF Shares’ market prices have compared with their net asset value, visit www.vanguard.com, select your ETF, and then select the Performance tab. The Premium/Discount table there shows the percentages of days on which the ETF Shares’ market price was above or below the NAV.
See Financial Highlights for dividend and capital gains information.
7
Extended Duration Treasury Index Fund
Financial Statements (unaudited)
Statement of Net Assets
As of February 28, 2010
The fund reports a complete list of its holdings in regulatory filings four times in each fiscal year, at the quarter-ends. For the second and fourth fiscal quarters, the lists appear in the fund’s semiannual and annual reports to shareholders. For the first and third fiscal quarters, the fund files the lists with the Securities and Exchange Commission on Form N-Q. Shareholders can look up the fund’s Forms N-Q on the SEC’s website at www.sec.gov. Forms N-Q may also be reviewed and copied at the SEC’s Public Reference Room (see the back cover of this report for further information).
| | | | |
| | | | Face | Market |
| | | Maturity | Amount | Value• |
| | Coupon | Date | ($000) | ($000) |
| U.S. Government and Agency Obligations (100.0%) | | | | |
| U.S. Government Securities (100.0%) | | | | |
| United States Treasury Strip Coupon | 0.000% | 5/15/30 | 18,700 | 7,110 |
| United States Treasury Strip Coupon | 0.000% | 8/15/30 | 16,250 | 6,110 |
| United States Treasury Strip Coupon | 0.000% | 11/15/30 | 19,600 | 7,284 |
| United States Treasury Strip Coupon | 0.000% | 2/15/31 | 20,535 | 7,537 |
| United States Treasury Strip Coupon | 0.000% | 5/15/31 | 16,960 | 6,153 |
| United States Treasury Strip Coupon | 0.000% | 8/15/31 | 16,600 | 5,955 |
| United States Treasury Strip Coupon | 0.000% | 11/15/31 | 17,350 | 6,146 |
| United States Treasury Strip Coupon | 0.000% | 2/15/32 | 16,135 | 5,644 |
| United States Treasury Strip Coupon | 0.000% | 5/15/32 | 19,550 | 6,768 |
| United States Treasury Strip Coupon | 0.000% | 8/15/32 | 17,300 | 5,905 |
| United States Treasury Strip Coupon | 0.000% | 11/15/32 | 16,495 | 5,585 |
| United States Treasury Strip Coupon | 0.000% | 2/15/33 | 19,310 | 6,446 |
| United States Treasury Strip Coupon | 0.000% | 5/15/33 | 18,675 | 6,173 |
| United States Treasury Strip Coupon | 0.000% | 8/15/33 | 17,150 | 5,586 |
| United States Treasury Strip Coupon | 0.000% | 11/15/33 | 15,710 | 5,059 |
| United States Treasury Strip Coupon | 0.000% | 2/15/34 | 19,085 | 6,059 |
| United States Treasury Strip Coupon | 0.000% | 5/15/34 | 15,860 | 4,995 |
| United States Treasury Strip Coupon | 0.000% | 8/15/34 | 16,825 | 5,218 |
| United States Treasury Strip Coupon | 0.000% | 11/15/34 | 19,835 | 6,095 |
| United States Treasury Strip Coupon | 0.000% | 2/15/35 | 15,650 | 4,738 |
| United States Treasury Strip Coupon | 0.000% | 5/15/35 | 18,930 | 5,673 |
| United States Treasury Strip Coupon | 0.000% | 8/15/35 | 17,465 | 5,166 |
| United States Treasury Strip Coupon | 0.000% | 11/15/35 | 17,135 | 5,019 |
| United States Treasury Strip Coupon | 0.000% | 2/15/36 | 23,075 | 6,661 |
| United States Treasury Strip Coupon | 0.000% | 5/15/36 | 17,390 | 4,968 |
| United States Treasury Strip Coupon | 0.000% | 8/15/36 | 18,550 | 5,230 |
| United States Treasury Strip Coupon | 0.000% | 11/15/36 | 16,700 | 4,646 |
| United States Treasury Strip Coupon | 0.000% | 2/15/37 | 25,585 | 7,050 |
| United States Treasury Strip Coupon | 0.000% | 5/15/37 | 17,000 | 4,621 |
| United States Treasury Strip Coupon | 0.000% | 8/15/37 | 16,875 | 4,522 |
| United States Treasury Strip Coupon | 0.000% | 11/15/37 | 16,900 | 4,472 |
| United States Treasury Strip Coupon | 0.000% | 2/15/38 | 19,015 | 4,977 |
| United States Treasury Strip Coupon | 0.000% | 5/15/38 | 19,950 | 5,142 |
| United States Treasury Strip Coupon | 0.000% | 8/15/38 | 18,595 | 4,747 |
| United States Treasury Strip Coupon | 0.000% | 11/15/38 | 15,600 | 3,960 |
| United States Treasury Strip Coupon | 0.000% | 2/15/39 | 14,100 | 3,521 |
| United States Treasury Strip Coupon | 0.000% | 5/15/39 | 10,300 | 2,532 |
| United States Treasury Strip Coupon | 0.000% | 8/15/39 | 13,400 | 3,255 |
| United States Treasury Strip Coupon | 0.000% | 11/15/39 | 15,970 | 3,834 |
8
| | | | |
| Extended Duration Treasury Index Fund | | | | |
| |
| |
| |
| | | | Face | Market |
| | | Maturity | Amount | Value• |
| | Coupon | Date | ($000) | ($000) |
| United States Treasury Strip Principal | 0.000% | 5/15/30 | 17,655 | 6,838 |
| United States Treasury Strip Principal | 0.000% | 2/15/31 | 13,600 | 5,092 |
| United States Treasury Strip Principal | 0.000% | 2/15/36 | 13,050 | 3,891 |
| United States Treasury Strip Principal | 0.000% | 2/15/37 | 10,200 | 2,894 |
| United States Treasury Strip Principal | 0.000% | 5/15/37 | 18,705 | 5,239 |
| United States Treasury Strip Principal | 0.000% | 2/15/38 | 14,700 | 3,931 |
| United States Treasury Strip Principal | 0.000% | 5/15/38 | 14,495 | 3,823 |
| United States Treasury Strip Principal | 0.000% | 2/15/39 | 21,035 | 5,356 |
| United States Treasury Strip Principal | 0.000% | 5/15/39 | 26,390 | 6,593 |
| United States Treasury Strip Principal | 0.000% | 8/15/39 | 22,115 | 5,441 |
| United States Treasury Strip Principal | 0.000% | 11/15/39 | 19,500 | 4,733 |
| United States Treasury Strip Principal | 0.000% | 2/15/40 | 35,300 | 8,472 |
| Total U.S. Government and Agency Obligations (Cost $290,241) | | | 272,865 |
| |
| | | | Shares | |
| Temporary Cash Investment (0.0%) | | | | |
| Money Market Fund (0.0%) | | | | |
| 1 Vanguard Market Liquidity Fund (Cost $67) | 0.163% | | 66,826 | 67 |
| Total Investments (100.0%) (Cost $290,308) | | | | 272,932 |
| Other Assets and Liabilities (0.0%) | | | | |
| Other Assets | | | | 9,787 |
| Liabilities | | | | (9,822) |
| | | | | (35) |
| Net Assets (100%) | | | | 272,897 |
| |
| |
| At February 28, 2010, net assets consisted of: | | | | |
| | | | | Amount |
| | | | | ($000) |
| Paid-in Capital | | | | 290,448 |
| Undistributed Net Investment Income | | | | 1,836 |
| Accumulated Net Realized Losses | | | | (2,011) |
| Unrealized Appreciation (Depreciation) | | | | (17,376) |
| Net Assets | | | | 272,897 |
| |
| Institutional Shares—Net Assets | | | | |
| Applicable to 7,829,369 outstanding $.001 par value shares of | | | |
| beneficial interest (unlimited authorization) | | | | 188,883 |
| Net Asset Value Per Share—Institutional Shares | | | | $24.12 |
| |
| ETF Shares—Net Assets | | | | |
| Applicable to 1,050,000 outstanding $.001 par value shares of | | | |
| beneficial interest (unlimited authorization) | | | | 84,014 |
| Net Asset Value Per Share—ETF Shares | | | | $80.01 |
• See Note A in Notes to Financial Statements.
1 Affiliated money market fund available only to Vanguard funds and certain trusts and accounts managed by Vanguard. Rate shown is the 7-day yield.
See accompanying Notes, which are an integral part of the Financial Statements.
9
| |
| Extended Duration Treasury Index Fund | |
| |
| |
| Statement of Operations | |
| |
| | Six Months Ended |
| | February 28, 2010 |
| | ($000) |
| Investment Income | |
| Income | |
| Interest | 5,606 |
| Total Income | 5,606 |
| Expenses | |
| The Vanguard Group—Note B | |
| Investment Advisory Services | 15 |
| Management and Administrative—Institutional Shares | 50 |
| Management and Administrative—ETF Shares | 26 |
| Marketing and Distribution—Institutional Shares | 24 |
| Marketing and Distribution—ETF Shares | 10 |
| Custodian Fees | 13 |
| Shareholders’ Reports—Institutional Shares | — |
| Shareholders’ Reports—ETF Shares | 3 |
| Total Expenses | 141 |
| Net Investment Income | 5,465 |
| Realized Net Gain (Loss) on Investment Securities Sold | (1,962) |
| Change in Unrealized Appreciation (Depreciation) of Investment Securities | (23,203) |
| Net Increase (Decrease) in Net Assets Resulting from Operations | (19,700) |
See accompanying Notes, which are an integral part of the Financial Statements.
10
| | |
| Extended Duration Treasury Index Fund | | |
| |
| |
| Statement of Changes in Net Assets | | |
| |
| | Six Months Ended | Year Ended |
| | February 28, | August 31, |
| | 2010 | 2009 |
| | ($000) | ($000) |
| Increase (Decrease) in Net Assets | | |
| Operations | | |
| Net Investment Income | 5,465 | 8,763 |
| Realized Net Gain (Loss) | (1,962) | 42,012 |
| Change in Unrealized Appreciation (Depreciation) | (23,203) | 5,603 |
| Net Increase (Decrease) in Net Assets Resulting from Operations | (19,700) | 56,378 |
| Distributions | | |
| Net Investment Income | | |
| Institutional Shares | (3,403) | (7,647) |
| ETF Shares | (1,670) | (1,511) |
| Realized Capital Gain1 | | |
| Institutional Shares | (18,983) | — |
| ETF Shares | (9,997) | — |
| Total Distributions | (34,053) | (9,158) |
| Capital Share Transactions | | |
| Institutional Shares | 72,981 | (154,948) |
| ETF Shares | 56,877 | 41,503 |
| Net Increase (Decrease) from Capital Share Transactions | 129,858 | (113,445) |
| Total Increase (Decrease) | 76,105 | (66,225) |
| Net Assets | | |
| Beginning of Period | 196,792 | 263,017 |
| End of Period2 | 272,897 | 196,792 |
1 Includes fiscal 2010 short-term gain distributions totaling $28,981,000. Short-term gain distributions are treated as ordinary income dividends for tax purposes.
2 Net Assets—End of Period includes undistributed net investment income of $1,836,000 and $1,444,000.
See accompanying Notes, which are an integral part of the Financial Statements.
11
| | | |
| Extended Duration Treasury Index Fund | | | |
| |
| |
| Financial Highlights | | | |
| |
| Institutional Shares | | | |
| | Six Months | Year | Nov. 28, |
| | Ended | Ended | 20071 to |
| | February 28, | Aug. 31, | Aug. 31, |
| For a Share Outstanding Throughout Each Period | 2010 | 2009 | 2008 |
| Net Asset Value, Beginning of Period | $30.69 | $29.52 | $30.00 |
| Investment Operations | | | |
| Net Investment Income | .6062 | 1.2732 | 1.0232 |
| Net Realized and Unrealized Gain (Loss) on Investments3 | (3.213) | 1.221 | (.928) |
| Total from Investment Operations | (2.607) | 2.494 | .095 |
| Distributions | | | |
| Dividends from Net Investment Income | (.618) | (1.324) | (.575) |
| Distributions from Realized Capital Gains | (3.345) | — | — |
| Total Distributions | (3.963) | (1.324) | (.575) |
| Net Asset Value, End of Period | $24.12 | $30.69 | $29.52 |
| |
| Total Return4 | –8.42% | 8.05% | 0.39% |
| |
| Ratios/Supplemental Data | | | |
| Net Assets, End of Period (Millions) | $189 | $151 | $258 |
| Ratio of Total Expenses to Average Net Assets | 0.11%5 | 0.11% | 0.11%5 |
| Ratio of Net Investment Income to Average Net Assets | 4.53%5 | 3.93% | 4.55%5 |
| Portfolio Turnover Rate6 | 26%5 | 39% | 36% |
1 Inception.
2 Calculated based on average shares outstanding.
3 Includes increases from purchase fees of $.00, $.01, and $.03.
4 Total returns do not include a portfolio transaction fee that may apply to aggregate purchases of more than $20 million by a single investor.
5 Annualized.
6 Excludes the value of portfolio securities received or delivered as a result of in-kind purchases or redemptions of the fund’s capital shares, including ETF Creation Units.
See accompanying Notes, which are an integral part of the Financial Statements.
12
| | | |
| Extended Duration Treasury Index Fund | | | |
| |
| |
| Financial Highlights | | | |
| |
| ETF Shares | | | |
| | Six Months | Year | Dec. 6, |
| | Ended | Ended | 20071 to |
| | February 28, | Aug. 31, | Aug. 31, |
| For a Share Outstanding Throughout Each Period | 2010 | 2009 | 2008 |
| Net Asset Value, Beginning of Period | $101.91 | $98.11 | $97.78 |
| Investment Operations | | | |
| Net Investment Income | 2.0622 | 4.3172 | 3.1662 |
| Net Realized and Unrealized Gain (Loss) on Investments3 | (10.804) | 3.880 | (.983) |
| Total from Investment Operations | (8.742) | 8.197 | 2.183 |
| Distributions | | | |
| Dividends from Net Investment Income | (2.050) | (4.397) | (1.853) |
| Distributions from Realized Capital Gains | (11.108) | — | — |
| Total Distributions | (13.158) | (4.397) | (1.853) |
| Net Asset Value, End of Period | $80.01 | $101.91 | $98.11 |
| |
| Total Return | –8.43% | 7.98% | 2.29% |
| |
| Ratios/Supplemental Data | | | |
| Net Assets, End of Period (Millions) | $84 | $46 | $5 |
| Ratio of Total Expenses to Average Net Assets | 0.13%4 | 0.14% | 0.14%4 |
| Ratio of Net Investment Income to Average Net Assets | 4.51%4 | 3.90% | 4.52%4 |
| Portfolio Turnover Rate5 | 26%4 | 39% | 36% |
1 Inception.
2 Calculated based on average shares outstanding.
3 Includes increases from purchase fees of $.02, $.02, and $.11.
4 Annualized.
5 Excludes the value of portfolio securities received or delivered as a result of in-kind purchases or redemptions of the fund’s capital shares, including ETF Creation Units.
See accompanying Notes, which are an integral part of the Financial Statements.
13
Extended Duration Treasury Index Fund
Notes to Financial Statements
Vanguard Extended Duration Treasury Index Fund is registered under the Investment Company Act of 1940 as an open-end investment company, or mutual fund. The fund offers three classes of shares: Institutional Shares, Institutional Plus Shares, and ETF Shares. Institutional Shares are designed for investors who meet certain administrative and service criteria and invest a minimum of $5 million. Institutional Plus Shares are available to investors who invest a minimum of $100 million. The fund has not issued any Institutional Plus Shares through February 28, 2010. ETF Shares are listed for trading on the NYSE Arca, Inc.; they can be purchased and sold through a broker.
A. The following significant accounting policies conform to generally accepted accounting principles for U.S. mutual funds. The fund consistently follows such policies in preparing its financial statements.
1. Security Valuation: Bonds, and temporary cash investments acquired over 60 days to maturity, are valued using the latest bid prices or using valuations based on a matrix system (which considers such factors as security prices, yields, maturities, and ratings), both as furnished by independent pricing services. Investments in Vanguard Market Liquidity Fund are valued at that fund’s net asset value. Securities for which market quotations are not readily available, or whose values have been affected by events occurring before the fund’s pricing time but after the close of the securities’ primary markets, are valued by methods deemed by the board of trustees to represent fair value.
2. Federal Income Taxes: The fund intends to continue to qualify as a regulated investment company and distribute all of its taxable income. Management has analyzed the fund’s tax positions taken for all open federal income tax years (August 31, 2008–2009), and for the period ended February 28, 2010, and has concluded that no provision for federal income tax is required in the fund’s financial statements.
3. Distributions: Distributions to shareholders are recorded on the ex-dividend date.
4. Other: Interest income includes income distributions received from Vanguard Market Liquidity Fund and is accrued daily. Premiums and discounts on debt securities purchased are amortized and accreted, respectively, to interest income over the lives of the respective securities. Security transactions are accounted for on the date securities are bought or sold. Costs used to determine realized gains (losses) on the sale of investment securities are those of the specific securities sold. Fees, if any, assessed on purchases of Institutional Shares are credited to paid-in capital.
Each class of shares has equal rights as to assets and earnings, except that each class separately bears certain class-specific expenses related to maintenance of shareholder accounts (included in Management and Administrative expenses), shareholder reporting, and proxies. Marketing and distribution expenses are allocated to each class of shares based on a method approved by the board of trustees. Income, other non-class-specific expenses, and gains and losses on investments are allocated to each class of shares based on its relative net assets.
B. The Vanguard Group furnishes at cost investment advisory, corporate management, administrative, marketing, and distribution services. The costs of such services are allocated to the fund under methods approved by the board of trustees. The fund has committed to provide up to 0.40% of its net assets in capital contributions to Vanguard. At February 28, 2010, the fund had contributed capital of $53,000 to Vanguard (included in Other Assets), representing 0.02% of the fund’s net assets and 0.02% of Vanguard’s capitalization. The fund’s trustees and officers are also directors and officers of Vanguard.
14
Extended Duration Treasury Index Fund
C. Various inputs may be used to determine the value of the fund’s investments. These inputs are summarized in three broad levels for financial statement purposes. The inputs or methodologies used to value securities are not necessarily an indication of the risk associated with investing in those securities.
Level 1—Quoted prices in active markets for identical securities.
Level 2—Other significant observable inputs (including quoted prices for similar securities, interest rates, prepayment speeds, credit risk, etc.).
Level 3—Significant unobservable inputs (including the fund’s own assumptions used to determine the fair value of investments).
The following table summarizes the fund’s investments as of February 28, 2010, based on the inputs used to value them:
| | | |
| | Level 1 | Level 2 | Level 3 |
| Investments | ($000) | ($000) | ($000) |
| U.S. Government and Agency Obligations | — | 272,865 | — |
| Temporary Cash Investments | 67 | — | — |
| Total | 67 | 272,865 | — |
D. Distributions are determined on a tax basis and may differ from net investment income and realized capital gains for financial reporting purposes. Differences may be permanent or temporary. Permanent differences are reclassified among capital accounts in the financial statements to reflect their tax character. Temporary differences arise when certain items of income, expense, gain, or loss are recognized in different periods for financial statement and tax purposes; these differences will reverse at some time in the future. Differences in classification may also result from the treatment of short-term gains as ordinary income for tax purposes. The fund’s tax-basis capital gains and losses are determined only at the end of each fiscal year.
At February 28, 2010, the cost of investment securities for tax purposes was $290,308,000. Net unrealized depreciation of investment securities for tax purposes was $17,376,000, consisting of unrealized gains of $28,000 on securities that had risen in value since their purchase and $17,404,000 in unrealized losses on securities that had fallen in value since their purchase.
E. During the six months ended February 28, 2010, the fund purchased $126,995,000 of investment securities and sold $31,233,000 of investment securities, other than temporary cash investments.
15
Extended Duration Treasury Index Fund
| F. | Capital share transactions for each class of shares were: |
| | | | |
| | Six Months Ended | | Year Ended |
| | February 28, 2010 | August 31, 2009 |
| | Amount | Shares | Amount | Shares |
| | ($000) | (000) | ($000) | (000) |
| Institutional Shares | | | | |
| Issued1 | 53,702 | 2,108 | 40,704 | 1,396 |
| Issued in Lieu of Cash Distributions | 21,773 | 901 | 7,647 | 222 |
| Redeemed | (2,494) | (97) | (203,299) | (5,443) |
| Net Increase (Decrease)—Institutional Shares | 72,981 | 2,912 | (154,948) | (3,825) |
| ETF Shares | | | | |
| Issued1 | 56,877 | 600 | 60,981 | 550 |
| Issued in Lieu of Cash Distributions | — | — | — | — |
| Redeemed | — | — | (19,478) | (150) |
| Net Increase (Decrease)—ETF Shares | 56,877 | 600 | 41,503 | 400 |
| 1 Includes purchase fees of $55,000 and $42,000 (fund totals). | | | |
G. In preparing the financial statements as of February 28, 2010, management considered the impact of subsequent events for potential recognition or disclosure in these financial statements.
16
About Your Fund’s Expenses
As a shareholder of the fund, you incur ongoing costs, which include costs for portfolio management, administrative services, and shareholder reports (like this one), among others. Operating expenses, which are deducted from a fund’s gross income, directly reduce the investment return of the fund.
A fund’s expenses are expressed as a percentage of its average net assets. This figure is known as the expense ratio. The following examples are intended to help you understand the ongoing costs (in dollars) of investing in your fund and to compare these costs with those of other mutual funds. The examples are based on an investment of $1,000 made at the beginning of the period shown and held for the entire period.
The accompanying table illustrates your fund’s costs in two ways:
• Based on actual fund return. This section helps you to estimate the actual expenses that you paid over the period. The “Ending Account Value” shown is derived from the fund’s actual return, and the third column shows the dollar amount that would have been paid by an investor who started with $1,000 in the fund. You may use the information here, together with the amount you invested, to estimate the expenses that you paid over the period.
To do so, simply divide your account value by $1,000 (for example, an $8,600 account value divided by $1,000 = 8.6), then multiply the result by the number given for your fund under the heading “Expenses Paid During Period.”
• Based on hypothetical 5% yearly return. This section is intended to help you compare your fund’s costs with those of other mutual funds. It assumes that the fund had a yearly return of 5% before expenses, but that the expense ratio is unchanged. In this case—because the return used is not the fund’s actual return—the results do not apply to your investment. The example is useful in making comparisons because the Securities and Exchange Commission requires all mutual funds to calculate expenses based on a 5% return. You can assess your fund’s costs by comparing this hypothetical example with the hypothetical examples that appear in shareholder reports of other funds.
| | | |
| Six Months Ended February 28, 2010 | | | |
| | Beginning | Ending | Expenses |
| | Account Value | Account Value | Paid During |
| Extended Duration Treasury Index Fund | 8/31/2009 | 2/28/2010 | Period1 |
| Based on Actual Fund Return | | | |
| Institutional Shares | $1,000.00 | $915.81 | $0.52 |
| ETF Shares | 1,000.00 | 915.72 | 0.62 |
| Based on Hypothetical 5% Yearly Return | | | |
| Institutional Shares | $1,000.00 | $1,024.25 | $0.55 |
| ETF Shares | 1,000.00 | 1,024.15 | 0.65 |
1 The calculations are based on expenses incurred in the most recent six-month period. The fund’s annualized six-month expense ratios for that period are 0.11% for Institutional Shares and 0.13% for ETF Shares. The dollar amounts shown as “Expenses Paid” are equal to the annualized expense ratio multiplied by the average account value over the period, multiplied by the number of days in the most recent six-month period, then divided by the number of days in the most recent 12-month period.
17
Note that the expenses shown in the table are meant to highlight and help you compare ongoing costs only and do not reflect transaction costs incurred by the fund for buying and selling securities. Your fund does not carry a “sales load.”
The calculations assume no shares were bought or sold during the period. Your actual costs may have been higher or lower, depending on the amount of your investment and the timing of any purchases or redemptions.
You can find more information about the fund’s expenses, including annual expense ratios, in the Financial Statements section of this report. For additional information on operating expenses and other shareholder costs, please refer to your fund’s current prospectus.
18
Glossary
Average Coupon. The average interest rate paid on the fixed income securities held by a fund. It is expressed as a percentage of face value.
Average Duration. An estimate of how much the value of the bonds held by a fund will fluctuate in response to a change in interest rates. To see how the value could change, multiply the average duration by the change in rates. If interest rates rise by 1 percentage point, the value of the bonds in a fund with an average duration of five years would decline by about 5%. If rates decrease by a percentage point, the value would rise by 5%.
Average Effective Maturity. The average length of time until fixed income securities held by a fund reach maturity and are repaid, taking into consideration the possibility that the issuer may call the bond before its maturity date. The figure reflects the proportion of fund assets represented by each security; it also reflects any futures contracts held. In general, the longer the average effective maturity, the more a fund’s share price will fluctuate in response to changes in market interest rates.
Average Quality. An indicator of credit risk, this figure is the average of the ratings assigned to a fund’s fixed income holdings by credit-rating agencies. The agencies make their judgment after appraising an issuer’s ability to meet its obligations. Quality is graded on a scale, with Aaa or AAA indicating the most creditworthy bond issuers. U.S. Treasury securities are considered to have the highest credit quality.
Distribution by Coupon. A breakdown of the securities in a fund according to coupon rate—the interest rate that an issuer promises to pay, expressed as an annual percentage of face value. Securities with unusually high coupon rates may be subject to call risk, the possibility that they will be redeemed (or “called”) early by the issuer.
Expense Ratio. The percentage of a fund’s average net assets used to pay its annual administrative and advisory expenses. These expenses directly reduce returns to investors.
Inception Date. The date on which the assets of a fund (or one of its share classes) are first invested in accordance with the fund’s investment objective. For funds with a subscription period, the inception date is the day after that period ends. Investment performance is measured from the inception date.
Short-Term Reserves. The percentage of a fund invested in highly liquid, short-term securities that can be readily converted to cash.
Yield. A fund’s 30-day SEC yield is derived using a formula specified by the U.S. Securities and Exchange Commission. Under the formula, data related to the fund’s security holdings in the previous 30 days are used to calculate the fund’s hypothetical net income for that period, which is then annualized and divided by the fund’s estimated average net assets over the calculation period. For the purposes of this calculation, a security’s income is based on its current market yield to maturity (in the case of bonds) or its projected dividend yield (for stocks). Because the SEC yield represents hypothetical annualized income, it will differ—at times significantly—from the fund’s actual experience. As a result, the fund’s income distributions may be higher or lower than implied by the SEC yield.
Yield to Maturity. The rate of return an investor would receive if the fixed income securities held by a fund were held to their maturity dates.
19
The People Who Govern Your Fund
The trustees of your mutual fund are there to see that the fund is operated and managed in your best interests since, as a shareholder, you are a part owner of the fund. Your fund’s trustees also serve on the board of directors of The Vanguard Group, Inc., which is owned by the Vanguard funds and provides services to them on an at-cost basis.
A majority of Vanguard’s board members are independent, meaning that they have no affiliation with Vanguard or the funds they oversee, apart from the sizable personal investments they have made as private individuals. The independent board members have distinguished backgrounds in business, academia, and public service. Each of the trustees and executive officers oversees 161 Vanguard funds.
The following table provides information for each trustee and executive officer of the fund. More information about the trustees is in the Statement of Additional Information, which can be obtained, without charge, by contacting Vanguard at 800-662-7447, or online at www.vanguard.com.
| |
| Interested Trustee1 | Rajiv L. Gupta |
| | Born 1945. Trustee Since December 2001.2 Principal |
| F. William McNabb III | Occupation(s) During the Past Five Years: Chairman |
| Born 1957. Trustee Since July 2009. Chairman of the | and Chief Executive Officer (retired 2009) and |
| Board. Principal Occupation(s) During the Past Five | President (2006–2008) of Rohm and Haas Co. |
| Years: Chairman of the Board of The Vanguard Group, | (chemicals); Board Member of American Chemistry |
| Inc., and of each of the investment companies served | Council; Director of Tyco International, Ltd. (diversified |
| by The Vanguard Group, since January 2010; Director | manufacturing and services) and Hewlett-Packard Co. |
| of The Vanguard Group since 2008; Chief Executive | (electronic computer manufacturing); Trustee of The |
| Officer and President of The Vanguard Group and of | Conference Board. |
| each of the investment companies served by The | |
| Vanguard Group since 2008; Director of Vanguard | Amy Gutmann |
| Marketing Corporation; Managing Director of The | Born 1949. Trustee Since June 2006. Principal |
| Vanguard Group (1995–2008). | Occupation(s) During the Past Five Years: President |
| | of the University of Pennsylvania; Christopher H. |
| | Browne Distinguished Professor of Political Science |
| Independent Trustees | in the School of Arts and Sciences with secondary |
| | appointments at the Annenberg School for Commu- |
| Emerson U. Fullwood | nication and the Graduate School of Education of |
| Born 1948. Trustee Since January 2008. Principal | the University of Pennsylvania; Director of Carnegie |
| Occupation(s) During the Past Five Years: Executive | Corporation of New York, Schuylkill River Development |
| Chief Staff and Marketing Officer for North America | Corporation, and Greater Philadelphia Chamber of |
| and Corporate Vice President (retired 2008) of Xerox | Commerce; Trustee of the National Constitution Center. |
| Corporation (document management products and | |
| services); Director of SPX Corporation (multi-industry | |
| manufacturing), the United Way of Rochester, the | |
| Boy Scouts of America, Amerigroup Corporation | |
| (managed health care), and Monroe Community | |
| College Foundation. | |
| | |
| JoAnn Heffernan Heisen | Executive Officers | |
| Born 1950. Trustee Since July 1998. Principal | | |
| Occupation(s) During the Past Five Years: Corporate | Thomas J. Higgins | |
| Vice President and Chief Global Diversity Officer since | Born 1957. Chief Financial Officer Since September |
| 2006 (retired 2008) and Member of the Executive | 2008. Principal Occupation(s) During the Past Five |
| Committee (retired 2008) of Johnson & Johnson | Years: Principal of The Vanguard Group, Inc.; Chief |
| (pharmaceuticals/consumer products); Vice President | Financial Officer of each of the investment companies |
| and Chief Information Officer of Johnson & Johnson | served by The Vanguard Group since 2008; Treasurer |
| (1997–2005); Director of the University Medical Center | of each of the investment companies served by The |
| at Princeton and Women’s Research and Education | Vanguard Group (1998–2008). |
| Institute; Member of the Advisory Board of the | | |
| Maxwell School of Citizenship and Public Affairs | Kathryn J. Hyatt | |
| at Syracuse University. | Born 1955. Treasurer Since November 2008. Principal |
| | Occupation(s) During the Past Five Years: Principal |
| F. Joseph Loughrey | of The Vanguard Group, Inc.; Treasurer of each of |
| Born 1949. Trustee Since October 2009. Principal | the investment companies served by The Vanguard |
| Occupation(s) During the Past Five Years: President | Group since 2008; Assistant Treasurer of each of the |
| and Chief Operating Officer since 2005 (retired 2009) | investment companies served by The Vanguard Group |
| and Vice Chairman of the Board (2008–2009) of | (1988–2008). | |
| Cummins Inc. (industrial machinery); Director of | | |
| SKF AB (industrial machinery), Hillenbrand, Inc. | Heidi Stam | |
| (specialized consumer services), Sauer-Danfoss Inc. | Born 1956. Secretary Since July 2005. Principal |
| (machinery), the Lumina Foundation for Education, | Occupation(s) During the Past Five Years: Managing |
| and the Columbus Community Education Coalition; | Director of The Vanguard Group, Inc., since 2006; |
| Chairman of the Advisory Council for the College of | General Counsel of The Vanguard Group since 2005; |
| Arts and Letters at the University of Notre Dame. | Secretary of The Vanguard Group and of each of the |
| | investment companies served by The Vanguard Group |
| André F. Perold | since 2005; Director and Senior Vice President of |
| Born 1952. Trustee Since December 2004. Principal | Vanguard Marketing Corporation since 2005; |
| Occupation(s) During the Past Five Years: George | Principal of The Vanguard Group (1997–2006). |
| Gund Professor of Finance and Banking at the Harvard | | |
| Business School; Chair of the Investment Committee | | |
| of HighVista Strategies LLC (private investment firm). | Vanguard Senior Management Team |
| |
| Alfred M. Rankin, Jr. | R. Gregory Barton | Michael S. Miller |
| Born 1941. Trustee Since January 1993. Principal | Mortimer J. Buckley | James M. Norris |
| Occupation(s) During the Past Five Years: Chairman, | Kathleen C. Gubanich | Glenn W. Reed |
| President, and Chief Executive Officer of NACCO | Paul A. Heller | George U. Sauter |
| Industries, Inc. (forklift trucks/housewares/lignite); | | |
| Director of Goodrich Corporation (industrial products/ | | |
| aircraft systems and services); Deputy Chairman | Chairman Emeritus and Senior Advisor |
| of the Federal Reserve Bank of Cleveland; Trustee | | |
| of University Hospitals of Cleveland, The Cleveland | John J. Brennan | |
| Museum of Art, and Case Western Reserve University. | Chairman, 1996–2009 | |
| | Chief Executive Officer and President, 1996–2008 |
| Peter F. Volanakis | | |
| Born 1955. Trustee Since July 2009. Principal | | |
| Occupation(s) During the Past Five Years: President | Founder | |
| since 2007 and Chief Operating Officer since 2005 | | |
| of Corning Incorporated (communications equipment); | John C. Bogle | |
| President of Corning Technologies (2001–2005); | Chairman and Chief Executive Officer, 1974–1996 |
| Director of Corning Incorporated and Dow Corning; | | |
| Trustee of the Corning Incorporated Foundation and | | |
| the Corning Museum of Glass; Overseer of the | | |
| Amos Tuck School of Business Administration at | | |
| Dartmouth College. | | |
1 Mr. McNabb is considered an “interested person,” as defined in the Investment Company Act of 1940, because he is an officer of the Vanguard funds.
2 December 2002 for Vanguard Equity Income Fund, Vanguard Growth Equity Fund, the Vanguard Municipal Bond Funds, and the Vanguard State Tax-Exempt Funds.
|  |
| P.O. Box 2600 |
| Valley Forge, PA 19482-2600 |
| |
Connect with Vanguard® > www.vanguard.com
| |
| Fund Information > 800-662-7447 | of, or quantities of Vanguard Extended Duration Treasury |
| | ETF to be issued. |
| Direct Investor Account Services > 800-662-2739 | |
| | All comparative mutual fund data are from Lipper Inc. |
| Institutional Investor Services > 800-523-1036 | or Morningstar, Inc., unless otherwise noted. |
| | |
| Text Telephone for People | |
| With Hearing Impairment > 800-749-7273 | You can obtain a free copy of Vanguard’s proxy voting |
| guidelines by visiting our website, www.vanguard.com, |
| | and searching for “proxy voting guidelines,” or by |
| | calling Vanguard at 800-662-2739. The guidelines are |
| This material may be used in conjunction | also available from the SEC’s website, www.sec.gov. |
| with the offering of shares of any Vanguard | In addition, you may obtain a free report on how your |
| fund only if preceded or accompanied by | fund voted the proxies for securities it owned during |
| the fund’s current prospectus. | the 12 months ended June 30. To get the report, visit |
| | either www.vanguard.com or www.sec.gov. |
| |
| Vanguard Extended Duration Treasury ETF is not sponsored, | You can review and copy information about your fund |
| endorsed, sold, or promoted by Barclays Capital. Barclays | at the SEC’s Public Reference Room in Washington, D.C. |
| Capital makes no representation or warranty, express or | To find out more about this public service, call the SEC |
| implied, to the owners of Vanguard Extended Duration | at 202-551-8090. Information about your fund is also |
| Treasury ETF or any member of the public regarding the | available on the SEC’s website, and you can receive |
| advisability of investing in securities generally or in | copies of this information, for a fee, by sending a |
| Vanguard Extended Duration Treasury ETF particularly or | request in either of two ways: via e-mail addressed to |
| the ability of the Barclays Capital Index to track general | publicinfo@sec.gov or via regular mail addressed to the |
| bond market performance. Barclays Capital hereby | Public Reference Section, Securities and Exchange |
| expressly disclaims all warranties of merchantability and | Commission, Washington, DC 20549-1520. |
| fitness for a particular purpose with respect to the Barclays | |
| Capital index and any data included therein. Barclays | |
| Capital’s only relationship to Vanguard and Vanguard | |
| Extended Duration Treasury ETF is the licensing of the | |
| Barclays Capital Index, which is determined, composed, | |
| and calculated by Barclays Capital without regard to | |
| Vanguard or Vanguard Extended Duration Treasury ETF. | |
| Barclays Capital is not responsible for, and has not | |
| participated in, the determination of the timing of, prices | |
| |
| © 2010 The Vanguard Group, Inc. |
| All rights reserved. |
| Vanguard Marketing Corporation, Distributor. |
 | |
| Q12752 042010 |
 |
| Vanguard Mega Cap 300 Index Funds |
| Semiannual Report |
 |
|
| Vanguard Mega Cap 300 Index Fund |
| Vanguard Mega Cap 300 Growth Index Fund |
| Vanguard Mega Cap 300 Value Index Fund |
|
> The Vanguard Mega Cap 300 Index Funds closely tracked their target indexes in the six months ended February 28, 2010.
> The Mega Cap 300 Growth Index Fund, powered by a heavy weighting in technology stocks, had the highest return among the three, the Mega Cap 300 Value Index Fund the lowest.
> The performance of financial stocks, which rebounded sharply in early 2009, leveled off during the past six months.
| |
| Contents | |
| Your Fund’s Total Returns. | 1 |
| Chairman’s Letter. | 2 |
| Mega Cap 300 Index Fund. | 7 |
| Mega Cap 300 Growth Index Fund. | 20 |
| Mega Cap 300 Value Index Fund. | 32 |
| About Your Fund’s Expenses. | 44 |
| Glossary. | 46 |

Mega Cap 300 Index Fund
Mega Cap 300 Growth Index Fund
Mega Cap 300 Value Index Fund
Please note: The opinions expressed in this report are just that—informed opinions. They should not be considered promises or advice. Also, please keep in mind that the information and opinions cover the period through the date on the front of this report. Of course, the risks of investing in your fund are spelled out in the prospectus.
See the Glossary for definitions of investment terms used in this report.
Cover photograph: Veronica Coia.
| |
| Your Fund’s Total Returns | |
| |
| |
| |
| |
| Six Months Ended February 28, 2010 | |
| | Total |
| | Returns |
| Vanguard Mega Cap 300 Index Fund | |
| Institutional Shares | 8.78% |
| ETF Shares | |
| Market Price | 8.72 |
| Net Asset Value | 8.75 |
| MSCI US Large Cap 300 Index | 8.84 |
| Large-Cap Core Funds Average | 8.67 |
| Large-Cap Core Funds Average: Derived from data provided by Lipper Inc. | |
| Vanguard Mega Cap 300 Growth Index Fund | |
| Institutional Shares | 11.01% |
| ETF Shares | |
| Market Price | 10.95 |
| Net Asset Value | 11.02 |
| MSCI US Large Cap Growth Index | 11.07 |
| Large-Cap Growth Funds Average | 10.13 |
| Large-Cap Growth Funds Average: Derived from data provided by Lipper Inc. | |
| Vanguard Mega Cap 300 Value Index Fund | |
| Institutional Shares | 6.68% |
| ETF Shares | |
| Market Price | 6.65 |
| Net Asset Value | 6.68 |
| MSCI US Large Cap Value Index | 6.73 |
| Large-Cap Value Funds Average | 7.94 |
| Large-Cap Value Funds Average: Derived from data provided by Lipper Inc. | |
Institutional Shares are available for a minimum investment of $5 million. These Vanguard ETF® Shares are traded on the NYSE Arca exchange and are available only through brokers. The table shows ETF returns based on both the NYSE Arca market price and the net asset value for a share. U.S. Pat. No. 6,879,964 B2; 7,337,138.
1

Chairman’s Letter
Dear Shareholder,
For the six months ended February 28, 2010, the Vanguard Mega Cap 300 Index Funds successfully tracked their target indexes. With a return of about 11%, the Mega Cap 300 Growth Index Fund led the three. The Mega Cap 300 Value Index Fund returned more than 6%, and the Mega Cap 300 Index Fund—essentially a combination of the two other portfolios—returned more than 8%.
The Value Fund lagged its peer group’s average return, while the two other funds ended a bit ahead of their respective peer averages.
Stock markets caught their breath at the end of a solid six months
For the six months, the broad U.S. stock market returned about 10%. The rally seemed to downshift toward the end of the period, as the investor relief that powered markets higher a year ago gave way to sober-minded assessment of corporate earnings-growth prospects.
Smaller-capitalization stocks did a little better than larger-cap stocks, and growth-oriented securities bested their value-oriented counterparts, but the uniformity of returns from different market segments was more striking than the differences.
International stocks produced more modest returns. In Europe, the precarious financial health of Greece and that of smaller economies such as Portugal and Ireland weighed on the markets. In Asia,
2
the Japanese stock market’s weakness held back results for Asia Pacific indexes. Emerging market stocks continued to outpace those from developed markets.
Yields remained low, but Fed began to unwind rescue programs
The yields of longer-term U.S. Treasury bonds rose during the past six months, while those of the shortest-term securities remained near 0%. Although the Federal Reserve Board expects to keep its target for short-term interest rates close to 0% for “an extended period,” it began to wind down credit programs established during the financial crisis. The Fed’s most dramatic (though largely symbolic) act was to raise the interest rate at its discount window, a lending facility designed to help commercial banks and other depository institutions meet emergency short-term funding needs.
The broad taxable bond market returned 3.19%, with notable strength in corporate bonds. The broad municipal bond market returned 4.13%.
Mega-caps joined the rebound, with notable strength in tech
Vanguard’s three Mega Cap 300 Index Funds are designed for shareholders looking to invest in the U.S. market’s largest stocks as a whole or in portfolios made up of either the growth or value components of that group. During the past six months, the market’s largest stocks trailed their smaller counterparts.
| | | |
| Market Barometer | | | |
| |
| | | | Total Returns |
| | | Periods Ended February 28, 2010 |
| | Six | One | Five Years |
| | Months | Year | (Annualized) |
| Stocks | | | |
| Russell 1000 Index (Large-caps) | 9.91% | 55.32% | 0.77% |
| Russell 2000 Index (Small-caps) | 10.59 | 63.95 | 1.16 |
| Dow Jones U.S. Total Stock Market Index | 10.23 | 56.38 | 1.20 |
| MSCI All Country World Index ex USA (International) | 3.83 | 63.51 | 4.60 |
| |
| Bonds | | | |
| Barclays Capital U.S. Aggregate Bond Index (Broad | | | |
| taxable market) | 3.19% | 9.32% | 5.36% |
| Barclays Capital Municipal Bond Index | 4.13 | 9.98 | 4.50 |
| Citigroup Three-Month U.S. Treasury Bill Index | 0.06 | 0.14 | 2.81 |
| |
| CPI | | | |
| Consumer Price Index | 0.42% | 2.14% | 2.48% |
3
The Mega Cap 300 Index Fund posted a solid six-month return thanks to continued stock gains driven by confidence in a turnaround in the global economy. The fund benefited from its heavy weighting in information technology stocks, which performed well owing to investors’ expectations of a pickup in corporate spending on technology infrastructure.
In addition, the fund got a boost from double-digit gains posted by industrial and consumer discretionary stocks. The sizable financial sector was a relatively weak area.
Reflecting investors’ general preference for growth stocks during the period, the Mega Cap 300 Growth Index Fund was the best performer of the three, with its gain outstripping that of the broad stock market. More than one-third of the fund’s assets were in information technology stocks, most of them strong performers. Also boosting returns was the stellar performance of consumer discretionary, energy, and industrial stocks, all of which benefited from mounting evidence of a solid economic recovery.
The Mega Cap 300 Value Index Fund lagged the other two funds in part because of the relative weakness of the financial sector. The banks, brokerages, and other financial services companies in this sector made up nearly one quarter of the Value Fund’s assets, on average. Although there were some bright spots (including regional banks), the stocks of insurance companies and some big banks underperformed owing to continued fallout from the recession and the financial crisis.
| | | |
| Expense Ratios | | | |
| Your Fund Compared With Its Peer Group | | | |
| |
| | Institutional | ETF | Peer Group |
| | Shares | Shares | Average |
| Mega Cap 300 Index Fund | 0.11% | 0.13% | 1.27% |
| Mega Cap 300 Growth Index Fund | 0.11 | 0.13 | 1.37 |
| Mega Cap 300 Value Index Fund | 0.11 | 0.13 | 1.28 |
The fund expense ratios shown are from the prospectuses dated December 28, 2009, and represent estimated costs for the current fiscal year based on the funds’ net assets as of the prospectus date. For the six months ended February 28, 2010, the annualized expense ratios were: for the Mega Cap 300 Index Fund, 0.11% for Institutional Shares and 0.13% for ETF Shares; for the Mega Cap 300 Growth Index Fund, 0.11% for Institutional Shares and 0.13% for ETF Shares; and for the Mega Cap 300 Value Index Fund, 0.11% for Institutional Shares and 0.13% for ETF Shares. Peer-group expense ratios are derived from data provided by Lipper Inc. and capture information through year-end 2009.
Peer groups: for the Mega Cap 300 Index Fund, Large-Cap Core Funds; for the Mega Cap 300 Growth Index Fund, Large-Cap Growth Funds; and for the Mega Cap 300 Value Index Fund, Large-Cap Value Funds.
4
Energy stocks, the Value Fund’s second-largest sector, also restrained performance. Oil and gas exploration and production stocks did well as crude oil prices climbed, but the overall sector return was restrained by the fund’s heavy weighting in integrated oil and gas stocks, which underperformed partly as a result of concerns about profit pressures in their refining operations. These headwinds were somewhat offset by strength in industrial and consumer discretionary stocks.
A period of extremes underscores the benefits of balance
The six months ended February 28 were marked by the continuation of the stock market rally that began in March 2009. This rally has been especially welcome for its contrast with the preceding two years, which produced deep and painful losses for many investors. That was particularly true for shareholders in the three Mega Cap 300 Index Funds, which were launched just after the financial turbulence began.
For all investors, the volatility of the past several years serves as a stark reminder of the value of maintaining a diversified portfolio of stocks, bonds, and money market funds. Staying firmly on that course allowed investors to participate in the robust stock rally of the past year.
While there are ample signs that a global economic recovery has taken root, this does not mean that investors can expect a smooth ride going forward. Even if the markets avoid the kind of extreme swings we saw in the past several years, investors need to be prepared for inevitable ups and downs. The Mega Cap 300 Index Funds, which provide exposure to the largest stocks in the U.S. market at extremely low cost, can be useful tools for investors navigating these choppy waters.
On another matter, I would like to inform you that as of January 1, 2010, we completed a leadership transition that began in March 2008. I succeeded Jack Brennan as chairman of Vanguard and each of the funds. Jack has agreed to serve as chairman emeritus and senior advisor. Under Jack’s leadership, Vanguard has grown to become a preeminent firm in the mutual fund industry. Jack’s energy, his relentless pursuit of perfection, and his unwavering focus on always doing the right thing for our clients are evident in every facet of Vanguard policy today.
Thank you for investing your assets with Vanguard.
Sincerely,

F. William McNabb III
Chairman and Chief Executive Officer
March 12, 2010
5
| | | | |
| Your Fund’s Performance at a Glance | | | | |
| August 31, 2009 , Through February 28, 2010 | | | | |
| | | | Distributions Per Share |
| | Starting | Ending | Income | Capital |
| | Share Price | Share Price | Dividends | Gains |
| Vanguard Mega Cap 300 Index Fund | | | | |
| Institutional Shares | $69.95 | $75.17 | $0.912 | $0.000 |
| ETF Shares | 35.49 | 38.13 | 0.460 | 0.000 |
| Vanguard Mega Cap 300 Growth Index Fund | | | | |
| Institutional Shares | $74.21 | $81.72 | $0.649 | $0.000 |
| ETF Shares | 37.50 | 41.30 | 0.324 | 0.000 |
| Vanguard Mega Cap 300 Value Index Fund | | | | |
| Institutional Shares | $66.02 | $69.33 | $1.093 | $0.000 |
| ETF Shares | 33.29 | 34.96 | 0.549 | 0.000 |
6
Mega Cap 300 Index Fund
Fund Profile
As of February 28, 2010
| | |
| Share-Class Characteristics | |
| |
| | Institutional | ETF |
| | Shares | Shares |
| Ticker Symbol | VMCTX | MGC |
| Expense Ratio1 | 0.11% | 0.13% |
| 30-Day SEC Yield | 1.82% | 1.80% |
| | | |
| Portfolio Characteristics | | |
| | | | DJ |
| | | MSCI US | U.S. Total |
| | | Large Cap | Market |
| | Fund | 300 Index | Index |
| Number of Stocks | 299 | 299 | 4,178 |
| Median Market Cap $52.9B | $52.9B | $29.9B |
| Price/Earnings Ratio | 18.8x | 18.9x | 21.5x |
| Price/Book Ratio | 2.2x | 2.2x | 2.1x |
| Return on Equity | 21.5% | 21.4% | 19.3% |
| Earnings Growth Rate | 8.4% | 8.4% | 7.8% |
| Dividend Yield | 2.1% | 2.1% | 1.8% |
| Foreign Holdings | 0.0% | 0.0% | 0.0% |
| Turnover Rate | | | |
| (Annualized) | 10% | — | — |
| Short-Term Reserves | 0.0% | — | — |
| | | |
| Sector Diversification (% of equity exposure) |
| | | | DJ |
| | | MSCI US | U.S. Total |
| | | Large Cap | Market |
| | Fund 300 Index | Index |
| Consumer | | | |
| Discretionary | 9.0% | 9.0% | 10.7% |
| Consumer Staples | 12.2 | 12.2 | 10.1 |
| Energy | 12.1 | 12.1 | 10.4 |
| Financials | 14.8 | 14.9 | 16.8 |
| Health Care | 13.1 | 13.1 | 12.7 |
| Industrials | 10.0 | 10.0 | 10.7 |
| Information | | | |
| Technology | 19.5 | 19.4 | 18.4 |
| Materials | 3.0 | 3.0 | 3.9 |
| Telecommunication | | | |
| Services | 3.2 | 3.2 | 2.7 |
| Utilities | 3.1 | 3.1 | 3.6 |
| | |
| Ten Largest Holdings (% of total net assets) |
| Exxon Mobil Corp. | Integrated Oil & | |
| | Gas | 3.5% |
| Microsoft Corp. | Systems Software | 2.6 |
| Procter & Gamble Co. | Household | |
| | Products | 2.1 |
| Apple Inc. | Computer | |
| | Hardware | 2.1 |
| Johnson & Johnson | Pharmaceuticals | 1.9 |
| General Electric Co. | Industrial | |
| | Conglomerates | 1.9 |
| International Business | Computer | |
| Machines Corp. | Hardware | 1.9 |
| JPMorgan Chase & Co. | Diversified Financial | |
| | Services | 1.9 |
| Bank of America Corp. | Diversified Financial | |
| | Services | 1.8 |
| AT&T Inc. | Integrated | |
| | Telecommunication | |
| | Services | 1.6 |
| Top Ten | | 21.3% |
The holdings listed exclude any temporary cash investments and equity index products.
Investment Focus
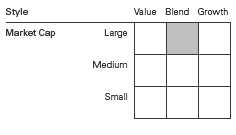
1 The expense ratios shown are from the prospectuses dated December 28, 2009, and represent estimated costs for the current fiscal year based on the fund’s net assets as of the prospectus date. For the six months ended February 28, 2010, the annualized expense ratios were 0.11% for Institutional Shares and 0.13% for ETF Shares.
7
Mega Cap 300 Index Fund
Performance Summary
All of the returns in this report represent past performance, which is not a guarantee of future results that may be achieved by the fund. (Current performance may be lower or higher than the performance data cited. For performance data current to the most recent month-end, visit our website at www.vanguard.com/performance.) Note, too, that both investment returns and principal value can fluctuate widely, so an investor’s shares, when sold, could be worth more or less than their original cost. The returns shown do not reflect taxes that a shareholder would pay on fund distributions or on the sale of fund shares.
Fiscal-Year Total Returns (%): December 17, 2007, Through February 28, 2010
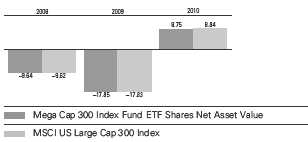
Note: For 2010, performance data reflect the six months ended February 28, 2010.
Average Annual Total Returns: Periods Ended December 31, 2009
This table presents average annual total returns through the latest calendar quarter—rather than through the end of
the fiscal period. Securities and Exchange Commission rules require that we provide this information.
| | | |
| | Inception | One | Since |
| | Date | Year | Inception |
| Institutional Shares | 2/22/2008 | 25.46% | -7.34% |
| ETF Shares | 12/17/2007 | | |
| Market Price | | 25.21 | -9.59 |
| Net Asset Value | | 25.43 | -9.59 |
See Financial Highlights for dividend and capital gains information.
8
Mega Cap 300 Index Fund
Financial Statements (unaudited)
Statement of Net Assets
As of February 28, 2010
The fund reports a complete list of its holdings in regulatory filings four times in each fiscal year, at the quarter-ends. For the second and fourth fiscal quarters, the lists appear in the fund’s semiannual and annual reports to shareholders. For the first and third fiscal quarters, the fund files the lists with the Securities and Exchange Commission on Form N-Q. Shareholders can look up the fund’s Forms N-Q on the SEC’s website at www.sec.gov. Forms N-Q may also be reviewed and copied at the SEC’s Public Reference Room (see the back cover of this report for further information).
| | | |
| | | | Market |
| | | | Value• |
| | | Shares | ($000) |
| Common Stocks (100.1%) | | |
| Consumer Discretionary (9.0%) | | |
| | McDonald’s Corp. | 39,022 | 2,492 |
| | Walt Disney Co. | 66,038 | 2,063 |
| | Home Depot Inc. | 61,559 | 1,921 |
| * | Amazon.com Inc. | 12,485 | 1,478 |
| | Target Corp. | 25,813 | 1,330 |
| | Lowe’s Cos. Inc. | 53,378 | 1,266 |
| * | Ford Motor Co. | 105,269 | 1,236 |
| | Time Warner Inc. | 42,219 | 1,226 |
| | Comcast Corp. Class A | 68,593 | 1,128 |
| * | DIRECTV Class A | 32,841 | 1,112 |
| | News Corp. Class A | 74,139 | 991 |
| | NIKE Inc. Class B | 13,412 | 907 |
| | Johnson Controls Inc. | 24,350 | 757 |
| | Staples Inc. | 26,201 | 675 |
| | TJX Cos. Inc. | 15,289 | 637 |
| * | Starbucks Corp. | 26,809 | 614 |
| | Time Warner Cable Inc. | 12,711 | 593 |
| * | Viacom Inc. Class B | 19,822 | 588 |
| | Carnival Corp. | 15,805 | 568 |
| | Yum! Brands Inc. | 16,828 | 567 |
| * | Kohl’s Corp. | 10,465 | 563 |
| | Comcast Corp. | 34,236 | 530 |
| | Best Buy Co. Inc. | 12,764 | 466 |
| | Coach Inc. | 11,472 | 418 |
| | Omnicom Group Inc. | 11,209 | 410 |
| * | Bed Bath & Beyond Inc. | 9,446 | 393 |
| | McGraw-Hill Cos. Inc. | 11,356 | 388 |
| | Gap Inc. | 17,593 | 378 |
| | Marriott International Inc. | | |
| | Class A | 10,911 | 296 |
| | Macy’s Inc. | 15,168 | 290 |
| * | Apollo Group Inc. Class A | 4,696 | 281 |
| | CBS Corp. Class B | 21,244 | 276 |
| | VF Corp. | 3,216 | 249 |
| | Fortune Brands Inc. | 5,419 | 238 |
| | Sherwin-Williams Co. | 3,564 | 226 |
| | JC Penney Co. Inc. | 7,654 | 211 |
| * | Las Vegas Sands Corp. | 11,907 | 198 |
| | | |
| | | | Market |
| | | | Value• |
| | | Shares | ($000) |
| * | AutoZone Inc. | 1,082 | 180 |
| * | Sears Holdings Corp. | 1,675 | 160 |
| | DISH Network Corp. Class A | 7,465 | 149 |
| | Garmin Ltd. | 4,460 | 143 |
| * | Liberty Global Inc. Class A | 4,739 | 127 |
| | News Corp. Class B | 7,497 | 118 |
| * | Liberty Global Inc. | 4,405 | 117 |
| | | | 28,954 |
| Consumer Staples (12.2%) | | |
| | Procter & Gamble Co. | 105,570 | 6,681 |
| | Wal-Mart Stores Inc. | 83,672 | 4,524 |
| | Coca-Cola Co. | 75,468 | 3,979 |
| | PepsiCo Inc. | 57,031 | 3,563 |
| | Philip Morris | | |
| | International Inc. | 68,873 | 3,373 |
| | Kraft Foods Inc. | 63,034 | 1,792 |
| | CVS Caremark Corp. | 51,010 | 1,722 |
| | Altria Group Inc. | 74,858 | 1,506 |
| | Colgate-Palmolive Co. | 18,013 | 1,494 |
| | Walgreen Co. | 35,864 | 1,264 |
| | Costco Wholesale Corp. | 15,717 | 958 |
| | Kimberly-Clark Corp. | 14,980 | 910 |
| | General Mills Inc. | 11,814 | 851 |
| | Sysco Corp. | 21,319 | 616 |
| | Archer-Daniels-Midland Co. | 20,960 | 615 |
| | HJ Heinz Co. | 11,369 | 522 |
| | Kellogg Co. | 9,667 | 504 |
| | Kroger Co. | 22,324 | 493 |
| | Avon Products Inc. | 15,400 | 469 |
| | Lorillard Inc. | 5,810 | 424 |
| | ConAgra Foods Inc. | 15,982 | 391 |
| | Safeway Inc. | 15,023 | 374 |
| | Reynolds American Inc. | 6,304 | 333 |
| | Sara Lee Corp. | 23,838 | 323 |
| | Clorox Co. | 5,025 | 308 |
| | Coca-Cola Enterprises Inc. | 10,558 | 270 |
| | Campbell Soup Co. | 7,581 | 253 |
| | Hershey Co. | 5,703 | 227 |
| | Molson Coors Brewing Co. | | |
| | Class B | 5,480 | 221 |
9
| | | |
| Mega Cap 300 Index Fund | | |
| |
| |
| |
| | | | Market |
| | | | Value• |
| | | Shares | ($000) |
| | Pepsi Bottling Group Inc. | 5,440 | 208 |
| | Brown-Forman Corp. Class B | 2,868 | 150 |
| | | | 39,318 |
| Energy (12.1%) | | |
| | Exxon Mobil Corp. | 171,655 | 11,157 |
| | Chevron Corp. | 72,548 | 5,245 |
| | Schlumberger Ltd. | 43,288 | 2,645 |
| | ConocoPhillips | 50,911 | 2,444 |
| | Occidental Petroleum Corp. | 29,301 | 2,340 |
| | Apache Corp. | 12,135 | 1,258 |
| | Anadarko Petroleum Corp. | 17,728 | 1,243 |
| | Devon Energy Corp. | 15,237 | 1,049 |
| | Halliburton Co. | 32,588 | 982 |
| | XTO Energy Inc. | 20,970 | 958 |
| * | Transocean Ltd. | 11,603 | 926 |
| | EOG Resources Inc. | 9,142 | 860 |
| | Marathon Oil Corp. | 25,642 | 742 |
| | National Oilwell Varco Inc. | 15,164 | 659 |
| | Hess Corp. | 10,677 | 628 |
| | Chesapeake Energy Corp. | 21,989 | 584 |
| | Baker Hughes Inc. | 11,177 | 536 |
| * | Southwestern Energy Co. | 12,424 | 529 |
| | Spectra Energy Corp. | 23,297 | 508 |
| | Noble Energy Inc. | 6,255 | 454 |
| | Williams Cos. Inc. | 21,028 | 453 |
| | Peabody Energy Corp. | 9,654 | 444 |
| * | Weatherford | | |
| | International Ltd. | 26,232 | 438 |
| | Noble Corp. | 9,433 | 399 |
| | Smith International Inc. | 8,923 | 366 |
| | Valero Energy Corp. | 20,299 | 356 |
| | Murphy Oil Corp. | 6,538 | 339 |
| * | Ultra Petroleum Corp. | 5,462 | 250 |
| | Diamond Offshore | | |
| | Drilling Inc. | 2,508 | 219 |
| | | | 39,011 |
| Financials (14.8%) | | |
| | JPMorgan Chase & Co. | 142,247 | 5,970 |
| | Bank of America Corp. | 342,806 | 5,711 |
| | Wells Fargo & Co. | 175,719 | 4,804 |
| | Goldman Sachs Group Inc. | 17,656 | 2,761 |
| * | Citigroup Inc. | 766,069 | 2,605 |
| | US Bancorp | 69,097 | 1,701 |
| * | Berkshire Hathaway Inc. | | |
| | Class B | 20,690 | 1,658 |
| | American Express Co. | 38,680 | 1,477 |
| | Morgan Stanley | 44,208 | 1,246 |
| | Bank of New York | | |
| | Mellon Corp. | 43,470 | 1,240 |
| | MetLife Inc. | 29,586 | 1,077 |
| | Travelers Cos. Inc. | 19,762 | 1,039 |
| | PNC Financial Services | | |
| | Group Inc. | 18,689 | 1,005 |
| | Prudential Financial Inc. | 16,692 | 875 |
| | Aflac Inc. | 16,971 | 839 |
| | Simon Property Group Inc. | 10,325 | 808 |
| | | |
| | | | Market |
| | | | Value• |
| | | Shares | ($000) |
| | State Street Corp. | 17,905 | 804 |
| | CME Group Inc. | 2,403 | 725 |
| | BB&T Corp. | 24,710 | 705 |
| | Charles Schwab Corp. | 35,789 | 655 |
| | Chubb Corp. | 12,353 | 623 |
| | Capital One Financial Corp. | 16,268 | 614 |
| | ACE Ltd. | 12,126 | 606 |
| | Franklin Resources Inc. | 5,817 | 592 |
| | Allstate Corp. | 18,382 | 574 |
| | T Rowe Price Group Inc. | 9,238 | 468 |
| | Loews Corp. | 12,495 | 456 |
| | Marsh & McLennan Cos. Inc. | 18,895 | 439 |
| | SunTrust Banks Inc. | 17,992 | 428 |
| | Northern Trust Corp. | 7,842 | 418 |
| | Progressive Corp. | 23,255 | 399 |
| | Vornado Realty Trust | 5,848 | 384 |
| | Public Storage | 4,585 | 377 |
| | Ameriprise Financial Inc. | 9,197 | 368 |
| | AON Corp. | 8,910 | 365 |
| | Annaly Capital | | |
| | Management Inc. | 19,634 | 361 |
| | Equity Residential | 9,880 | 356 |
| | Boston Properties Inc. | 4,998 | 340 |
| | Invesco Ltd. | 15,015 | 294 |
| | Principal Financial Group Inc. | 11,504 | 267 |
| | NYSE Euronext | 9,377 | 247 |
| | Hudson City Bancorp Inc. | 17,012 | 230 |
| | M&T Bank Corp. | 2,758 | 214 |
| | Moody’s Corp. | 7,243 | 193 |
| | BlackRock Inc. | 827 | 181 |
| * | Leucadia National Corp. | 7,031 | 167 |
| * | TD Ameritrade Holding Corp. | 9,515 | 166 |
| | | | 47,832 |
| Health Care (13.1%) | | |
| | Johnson & Johnson | 99,671 | 6,279 |
| | Pfizer Inc. | 291,709 | 5,119 |
| | Merck & Co. Inc. | 110,521 | 4,076 |
| | Abbott Laboratories | 55,961 | 3,038 |
| * | Amgen Inc. | 36,699 | 2,078 |
| | Medtronic Inc. | 40,107 | 1,741 |
| * | Gilead Sciences Inc. | 32,680 | 1,556 |
| | Bristol-Myers Squibb Co. | 61,861 | 1,516 |
| | UnitedHealth Group Inc. | 42,009 | 1,422 |
| | Eli Lilly & Co. | 37,373 | 1,283 |
| | Baxter International Inc. | 21,782 | 1,240 |
| * | Medco Health Solutions Inc. | 17,122 | 1,083 |
| * | WellPoint Inc. | 16,577 | 1,026 |
| * | Celgene Corp. | 16,575 | 987 |
| * | Express Scripts Inc. | 9,438 | 906 |
| | Covidien PLC | 18,159 | 892 |
| * | Thermo Fisher Scient ific Inc. | 14,792 | 721 |
| | Becton Dickinson and Co. | 8,680 | 676 |
| | Allergan Inc. | 11,025 | 644 |
| * | Biogen Idec Inc. | 10,419 | 573 |
| | McKesson Corp. | 9,662 | 572 |
| | Stryker Corp. | 10,755 | 571 |
10
Mega Cap 300 Index Fund
| | | |
| | | | Market |
| | | | Value• |
| | | Shares | ($000) |
| * | Genzyme Corp. | 9,751 | 558 |
| | Aetna Inc. | 15,744 | 472 |
| * | St. Jude Medical Inc. | 12,090 | 462 |
| * | Zimmer Holdings Inc. | 7,730 | 443 |
| | Cardinal Health Inc. | 12,987 | 441 |
| * | Boston Scientific Corp. | 54,378 | 421 |
| | CIGNA Corp. | 9,837 | 337 |
| * | Forest Laboratories Inc. | 10,880 | 325 |
| | Quest Diagnostics Inc. | 5,694 | 323 |
| | CR Bard Inc. | 3,520 | 295 |
| * | Laboratory Corp. | | |
| | of America Holdings | 3,905 | 286 |
| | | | 42,362 |
| Industrials (10.0%) | | |
| | General Electric Co. | 384,361 | 6,173 |
| | United Technologies Corp. | 32,316 | 2,218 |
| | 3M Co. | 24,312 | 1,949 |
| | Boeing Co. | 24,940 | 1,575 |
| | United Parcel Service Inc. | | |
| | Class B | 25,380 | 1,491 |
| | Emerson Electric Co. | 27,162 | 1,286 |
| | Caterpillar Inc. | 22,454 | 1,281 |
| | Union Pacific Corp. | 18,226 | 1,228 |
| | Honeywell International Inc. | 26,203 | 1,052 |
| | FedEx Corp. | 10,767 | 913 |
| | Lockheed Martin Corp. | 11,624 | 904 |
| | Deere & Co. | 15,315 | 878 |
| | General Dynamics Corp. | 11,853 | 860 |
| | Raytheon Co. | 13,856 | 779 |
| | Danaher Corp. | 9,849 | 729 |
| | Illinois Tool Works Inc. | 15,412 | 702 |
| | Norfolk Southern Corp. | 13,332 | 686 |
| | CSX Corp. | 14,224 | 675 |
| | Northrop Grumman Corp. | 10,777 | 660 |
| | Tyco International Ltd. | 17,205 | 620 |
| | Precision Castparts Corp. | 5,059 | 570 |
| | Waste Management Inc. | 16,883 | 557 |
| | PACCAR Inc. | 12,451 | 440 |
| | Cummins Inc. | 6,914 | 393 |
| | Eaton Corp. | 5,674 | 387 |
| | Republic Services Inc. | | |
| | Class A | 13,678 | 385 |
| | L-3 Communications | | |
| | Holdings Inc. | 4,206 | 384 |
| | Ingersoll-Rand PLC | 11,514 | 367 |
| | Parker Hannifin Corp. | 5,789 | 349 |
| | Southwest Airlines Co. | 26,744 | 336 |
| | CH Robinson Worldwide Inc. | 6,070 | 324 |
| | ITT Corp. | 6,251 | 320 |
| | Expeditors International | | |
| | of Washington Inc. | 7,651 | 279 |
| | Fluor Corp. | 6,486 | 278 |
| *,^ | First Solar Inc. | 1,997 | 211 |
| | | | 32,239 |
| | | |
| | | | Market |
| | | | Value• |
| | | Shares | ($000) |
| Information Technology (19.6%) | |
| | Microsoft Corp. | 288,922 | 8,281 |
| * | Apple Inc. | 32,561 | 6,663 |
| | International Business | | |
| | Machines Corp. | 47,415 | 6,029 |
| * | Cisco Systems Inc. | 207,983 | 5,060 |
| * | Google Inc. Class A | 8,782 | 4,626 |
| | Hewlett-Packard Co. | 85,728 | 4,354 |
| | Intel Corp. | 199,672 | 4,099 |
| | Oracle Corp. | 145,206 | 3,579 |
| | QUALCOMM Inc. | 60,385 | 2,216 |
| | Visa Inc. Class A | 16,996 | 1,449 |
| * | EMC Corp. | 73,739 | 1,290 |
| | Texas Instruments Inc. | 45,587 | 1,111 |
| | Corning Inc. | 56,183 | 991 |
| * | eBay Inc. | 42,043 | 968 |
| | Accenture PLC Class A | 22,693 | 907 |
| * | Dell Inc. | 63,555 | 841 |
| | Mastercard Inc. Class A | 3,594 | 806 |
| | Automatic Data | | |
| | Processing Inc. | 18,192 | 757 |
| * | Yahoo! Inc. | 48,305 | 740 |
| * | Adobe Systems Inc. | 19,045 | 660 |
| | Applied Materials Inc. | 48,369 | 592 |
| * | Motorola Inc. | 82,797 | 560 |
| * | Juniper Networks Inc. | 18,909 | 529 |
| * | Cognizant Technology | | |
| | Solutions Corp. Class A | 10,577 | 509 |
| | Broadcom Corp. Class A | 15,723 | 492 |
| * | Symantec Corp. | 29,379 | 486 |
| | Xerox Corp. | 48,841 | 458 |
| | Tyco Electronics Ltd. | 16,546 | 424 |
| | Western Union Co. | 25,305 | 399 |
| * | Agilent Technologies Inc. | 12,385 | 390 |
| * | NetApp Inc. | 12,128 | 364 |
| * | Intuit Inc. | 11,068 | 358 |
| | Paychex Inc. | 11,722 | 351 |
| | CA Inc. | 15,114 | 340 |
| * | NVIDIA Corp. | 19,759 | 320 |
| | Analog Devices Inc. | 10,516 | 308 |
| | Fidelity National | | |
| | Information Services Inc. | 11,367 | 256 |
| | Activision Blizzard Inc. | 20,639 | 219 |
| * | Electronic Arts Inc. | 11,668 | 194 |
| * | VMware Inc. Class A | 1,898 | 94 |
| | | | 63,070 |
| Materials (3.0%) | | |
| | Monsanto Co. | 19,729 | 1,394 |
| | Dow Chemical Co. | 41,330 | 1,170 |
| | Freeport-McMoRan | | |
| | Copper & Gold Inc. | 15,534 | 1,167 |
| | EI du Pont de Nemours & Co. | 32,656 | 1,101 |
| | Newmont Mining Corp. | 17,369 | 856 |
| | Praxair Inc. | 11,131 | 836 |
| | Air Products & Chemicals Inc. | 7,634 | 524 |
| | Nucor Corp. | 11,351 | 470 |
11
| | | |
| Mega Cap 300 Index Fund | | |
| |
| |
| |
| | | | Market |
| | | | Value• |
| | | Shares | ($000) |
| | Alcoa Inc. | 35,147 | 467 |
| | PPG Industries Inc. | 5,947 | 366 |
| | Ecolab Inc. | 8,543 | 360 |
| | International Paper Co. | 14,830 | 344 |
| | Mosaic Co. | 5,616 | 328 |
| | Weyerhaeuser Co. | 7,623 | 308 |
| | | | 9,691 |
| Telecommunication Services (3.2%) | |
| | AT&T Inc. | 213,418 | 5,295 |
| | Verizon | | |
| | Communications Inc. | 102,829 | 2,975 |
| * | American Tower Corp. | | |
| | Class A | 14,512 | 619 |
| * | Crown Castle | | |
| | International Corp. | 10,500 | 397 |
| | CenturyTel Inc. | 10,722 | 368 |
| * | Sprint Nextel Corp. | 104,935 | 349 |
| | Qwest Communications | | |
| | International Inc. | 55,958 | 255 |
| | | | 10,258 |
| Utilities (3.1%) | | |
| | Exelon Corp. | 23,820 | 1,031 |
| | Southern Co. | 28,769 | 914 |
| | Dominion Resources Inc. | 21,607 | 821 |
| | Duke Energy Corp. | 46,971 | 768 |
| | FPL Group Inc. | 14,175 | 657 |
| | American Electric | | |
| | Power Co. Inc. | 17,309 | 582 |
| | PG&E Corp. | 13,372 | 561 |
| | Public Service Enterprise | | |
| | Group Inc. | 18,252 | 543 |
| | Entergy Corp. | 6,833 | 519 |
| | FirstEnergy Corp. | 10,996 | 425 |
| | Consolidated Edison Inc. | 9,919 | 424 |
| | Sempra Energy | 8,407 | 413 |
| | PPL Corp. | 13,583 | 387 |
| | Progress Energy Inc. | 10,074 | 386 |
| | Edison International | 11,165 | 364 |
| | Xcel Energy Inc. | 16,439 | 342 |
| * | AES Corp. | 24,058 | 281 |
| | Constellation Energy | | |
| | Group Inc. | 6,513 | 228 |
| | Ameren Corp. | 8,421 | 208 |
| | | | 9,854 |
| Total Common Stocks | | |
| (Cost $332,113) | | 322,589 |
| | |
| | | Market |
| | | Value• |
| | Shares | ($000) |
| Temporary Cash Investment (0.0%) | |
| Money Market Fund (0.0%) | | |
| 1,2 Vanguard Market | | |
| Liquidity Fund, 0.163% | | |
| (Cost $11) | 10,602 | 11 |
| Total Investments (100.1%) | | |
| (Cost $332,124) | | 322,600 |
| Other Assets and Liabilities (-0.1%) | |
| Other Assets | | 1,517 |
| Liabilities2 | | (1,684) |
| | | (167) |
| Net Assets (100%) | | 322,433 |
| |
| |
| At February 28, 2010, net assets consisted of: |
| | | Amount |
| | | ($000) |
| Paid-in Capital | | 349,048 |
| Undistributed Net Investment Income | 924 |
| Accumulated Net Realized Losses | (18,015) |
| Unrealized Appreciation (Depreciation) | (9,524) |
| Net Assets | | 322,433 |
| |
| Institutional Shares—Net Assets | |
| Applicable to 1,347,262 outstanding | |
| $.001 par value shares of beneficial | |
| interest (unlimited authorization) | 101,271 |
| Net Asset Value Per Share— | |
| Institutional Shares | | $75.17 |
| |
| ETF Shares—Net Assets | | |
| Applicable to 5,800,000 outstanding | |
| $.001 par value shares of beneficial | |
| interest (unlimited authorization) | 221,162 |
| Net Asset Value Per Share— | |
| ETF Shares | | $38.13 |
• See Note A in Notes to Financial Statements.
* Non-income-producing security.
^ Part of security position is on loan to broker-dealers. The total value of securities on loan is $11,000.
1 Affiliated money market fund available only to Vanguard funds and certain trusts and accounts managed by Vanguard. Rate shown is the 7-day yield.
2 Includes $11,000 of collateral received for securities on loan.
See accompanying Notes, which are an integral part of the Financial Statements.
12
| |
| Mega Cap 300 Index Fund | |
| |
| |
| Statement of Operations | |
| |
| | Six Months Ended |
| | February 28, 2010 |
| | ($000) |
| Investment Income | |
| Income | |
| Dividends | 3,842 |
| Security Lending | 9 |
| Total Income | 3,851 |
| Expenses | |
| The Vanguard Group—Note B | |
| Investment Advisory Services | 23 |
| Management and Administrati ve—Institutional Shares | 31 |
| Management and Administrati ve—ETF Shares | 70 |
| Marketing and Distribution& #151;Institutional Shares | 16 |
| Marketing and Distribution& #151;ETF Shares | 31 |
| Custodian Fees | 8 |
| Shareholders’ Reports—Institutional Shares | — |
| Shareholders’ Reports—ETF Shares | 11 |
| Total Expenses | 190 |
| Net Investment Income | 3,661 |
| Realized Net Gain (Loss) on Investment Securities Sold | 4,274 |
| Change in Unrealized Appreciation (Depreciation) of Investment Securities | 17,022 |
| Net Increase (Decrease) in Net Assets Resulting from Operations | 24,957 |
See accompanying Notes, which are an integral part of the Financial Statements.
13
| | |
| Mega Cap 300 Index Fund | | |
| |
| |
| Statement of Changes in Net Assets | | |
| |
| | Six Months Ended | Year Ended |
| | February 28, | August 31, |
| | 2010 | 2009 |
| | ($000) | ($000) |
| Increase (Decrease) in Net Assets | | |
| Operations | | |
| Net Investment Income | 3,661 | 5,734 |
| Realized Net Gain (Loss) | 4,274 | (9,366) |
| Change in Unrealized Appreciation (Depreciation) | 17,022 | (19,732) |
| Net Increase (Decrease) in Net Assets Resulting from Operations | 24,957 | (23,364) |
| Distributions | | |
| Net Investment Income | | |
| Institutional Shares | (1,350) | (2,078) |
| ETF Shares | (2,554) | (2,970) |
| Realized Capital Gain | | |
| Institutional Shares | — | — |
| ETF Shares | — | — |
| Total Distributions | (3,904) | (5,048) |
| Capital Share Transactions | | |
| Institutional Shares | (8,923) | 69,994 |
| ETF Shares | 9,118 | 118,353 |
| Net Increase (Decrease) from Capital Share Transactions | 195 | 188,347 |
| Total Increase (Decrease) | 21,248 | 159,935 |
| Net Assets | | |
| Beginning of Period | 301,185 | 141,250 |
| End of Period1 | 322,433 | 301,185 |
| 1 Net Assets—End of Period includes undistributed net investment income of $924,000 and $1,167,000. | |
See accompanying Notes, which are an integral part of the Financial Statements.
14
| | | |
| Mega Cap 300 Index Fund | | | |
| |
| |
| Financial Highlights | | | |
| |
| |
| Institutional Shares | | | |
| | Six Months | Year | Feb. 22, |
| | Ended | Ended | 20081 to |
| | February 28, | Aug. 31, | Aug. 31, |
| For a Share Outstanding Throughout Each Period | 2010 | 2009 | 2008 |
| Net Asset Value, Beginning of Period | $69.95 | $87.14 | $91.07 |
| Investment Operations | | | |
| Net Investment Income | .858 | 1.6812 | .685 |
| Net Realized and Unrealized Gain (Loss) on Investments | 5.274 | (17.409) | (4.028) |
| Total from Investment Operations | 6.132 | (15.728) | (3.343) |
| Distributions | | | |
| Dividends from Net Investment Income | (.912) | (1.462) | (.587) |
| Distributions from Realized Capital Gains | — | — | — |
| Total Distributions | (.912) | (1.462) | (.587) |
| Net Asset Value, End of Period | $75.17 | $69.95 | $87.14 |
| |
| Total Return | 8.78% | -17.84% | -3.69% |
| |
| Ratios/Supplemental Data | | | |
| Net Assets, End of Period (Millions) | $101 | $102 | $53 |
| Ratio of Total Expenses to Average Net Assets | 0.11%3 | 0.11% | 0.08%3 |
| Ratio of Net Investment Income to Average Net Assets | 2.19%3 | 2.59% | 2.14%3 |
| Portfolio Turnover Rate4 | 10%3 | 10% | 30% |
1 Inception.
2 Calculated based on average shares outstanding.
3 Annualized.
4 Excludes the value of portfolio securities received or delivered as a result of in-kind purchases or redemptions of the fund’s capital shares, including ETF Creation Units.
See accompanying Notes, which are an integral part of the Financial Statements.
15
| | | |
| Mega Cap 300 Index Fund | | | |
| |
| |
| Financial Highlights | | | |
| |
| |
| ETF Shares | | | |
| | Six Months | Year | Dec. 17, |
| | Ended | Ended | 20071 to |
| | February 28, | Aug. 31, | Aug. 31, |
| For a Share Outstanding Throughout Each Period | 2010 | 2009 | 2008 |
| Net Asset Value, Beginning of Period | $35.49 | $44.21 | $49.24 |
| Investment Operations | | | |
| Net Investment Income | .432 | .8222 | .441 |
| Net Realized and Unrealized Gain (Loss) on Investments | 2.668 | (8.808) | (5.179) |
| Total from Investment Operations | 3.100 | (7.986) | (4.738) |
| Distributions | | | |
| Dividends from Net Investment Income | (.460) | (.734) | (.292) |
| Distributions from Realized Capital Gains | — | — | — |
| Total Distributions | (.460) | (.734) | (.292) |
| Net Asset Value, End of Period | $38.13 | $35.49 | $44.21 |
| |
| Total Return | 8.75% | -17.85% | -9.64% |
| |
| Ratios/Supplemental Data | | | |
| Net Assets, End of Period (Millions) | $221 | $199 | $88 |
| Ratio of Total Expenses to Average Net Assets | 0.13%3 | 0.13% | 0.13%3 |
| Ratio of Net Investment Income to Average Net Assets | 2.17%3 | 2.57% | 2.09%3 |
| Portfolio Turnover Rate4 | 10%3 | 10% | 30% |
1 Inception.
2 Calculated based on average shares outstanding.
3 Annualized.
4 Excludes the value of portfolio securities received or delivered as a result of in-kind purchases or redemptions of the fund’s capital shares, including ETF Creation Units.
See accompanying Notes, which are an integral part of the Financial Statements.
16
Mega Cap 300 Index Fund
Notes to Financial Statements
Vanguard Mega Cap 300 Index Fund is registered under the Investment Company Act of 1940 as an open-end investment company, or mutual fund. The fund offers two classes of shares: Institutional Shares and ETF Shares. Institutional Shares are designed for investors who meet certain administrative and service criteria and invest a minimum amount of $5 million. ETF Shares are listed for trading on the NYSE Arca, Inc.; they can be purchased and sold through a broker.
A. The following significant accounting policies conform to generally accepted accounting principles for U.S. mutual funds. The fund consistently follows such policies in preparing its financial statements.
1. Security Valuation: Securities are valued as of the close of trading on the New York Stock Exchange (generally 4 p.m., Eastern time) on the valuation date. Equity securities are valued at the latest quoted sales prices or official closing prices taken from the primary market in which each security trades; such securities not traded on the valuation date are valued at the mean of the latest quoted bid and asked prices. Securities for which market quotations are not readily available, or whose values have been materially affected by events occurring before the fund’s pricing time but after the close of the securities’ primary markets, are valued by methods deemed by the board of trustees to represent fair value. Investments in Vanguard Market Liquidity Fund are valued at that fund’s net asset value.
2. Federal Income Taxes: The fund intends to continue to qualify as a regulated investment company and distribute all of its taxable income. Management has analyzed the fund’s tax positions taken for all open federal income tax years (August 31, 2008–2009), and for the period ended February 28, 2010, and has concluded that no provision for federal income tax is required in the fund’s financial statements.
3. Distributions: Distributions to shareholders are recorded on the ex-dividend date.
4. Security Lending: The fund may lend its securities to qualified institutional borrowers to earn additional income. Security loans are required to be secured at all times by collateral at least equal to the market value of securities loaned. The fund invests cash collateral received in Vanguard Market Liquidity Fund, and records a liability for the return of the collateral, during the period the securities are on loan. Security lending income represents the income earned on investing cash collateral, less expenses associated with the loan.
5. Other: Dividend income is recorded on the ex-dividend date. Security transactions are accounted for on the date securities are bought or sold. Costs used to determine realized gains (losses) on the sale of investment securities are those of the specific securities sold.
Each class of shares has equal rights as to assets and earnings, except that each class separately bears certain class-specific expenses related to maintenance of shareholder accounts (included in Management and Administrative expenses) and shareholder reporting. Marketing and distribution expenses are allocated to each class of shares based on a method approved by the board of trustees. Income, other non-class-specific expenses, and gains and losses on investments are allocated to each class of shares based on its relative net assets.
17
Mega Cap 300 Index Fund
B. The Vanguard Group furnishes at cost investment advisory, corporate management, administrative, marketing, and distribution services. The costs of such services are allocated to the fund under methods approved by the board of trustees. The fund has committed to provide up to 0.40% of its net assets in capital contributions to Vanguard. At February 28, 2010, the fund had contributed capital of $62,000 to Vanguard (included in Other Assets), representing 0.02% of the fund’s net assets and 0.02% of
Vanguard’s capitalization. The fund’s trustees and officers are also directors and officers of Vanguard.
C. Various inputs may be used to determine the value of the fund’s investments. These inputs are summarized in three broad levels for financial statement purposes. The inputs or methodologies used to value securities are not necessarily an indication of the risk associated with investing in those securities.
Level 1—Quoted prices in active markets for identical securities.
Level 2—Other significant observable inputs (including quo ted prices for similar securities, interest rates, prepayment speeds, credit risk, etc.).
Level 3—Significant unobservable inputs (including the fund’s own assumptions used to determine the fair value of investments).
At February 28, 2010, 100% of the fund’s investments were valued based on Level 1 inputs.
D. Distributions are determined on a tax basis and may differ from net investment income and realized capital gains for financial reporting purposes. Differences may be permanent or temporary. Permanent differences are reclassified among capital accounts in the financial statements to reflect their tax character. Temporary differences arise when certain items of income, expense, gain, or loss are recognized in different periods for financial statement and tax purposes; these differences will reverse at some time in the future. Differences in classification may also result from the treatment of shor t-term gains as ordinary income for tax purposes.
During the six months ended February 28, 2010, the fund realized $7,849,000 of net capital gains resulting from in-kind redemptions—in which shareholders exchanged fund shares for securities held by the fund rather than for cash. Because such gains are not taxable to the fund, and are not distributed to shareholders, they have been reclassified from accumulated net realized losses to paid-in capital.
The fund’s tax-basis capital gains and losses are determined only at the end of each fiscal year. For tax purposes, at August 31, 2009, the fund had available capital loss carryforwards totaling $948,000 to offset future net capital gains through August 31, 2017. In addition, the fund realized losses of $13,472,000 during the period from November 1, 2008, through August 31, 2009, which are deferred and will be treated as realized for tax purposes in fiscal 2010. The fund will use these capital losses to offset net taxable capital gains, if any, realized during the year ending August 31, 2010; should the fund realize net capital losses for the year, the losses will be added to the loss carryforward balance above.
At February 28, 2010, the cost of investment securities for tax purposes was $332,124,000. Net unrealized depreciation of investment securities for tax purposes was $9,524,000, consisting of unrealized gains of $16,345,000 on securities that had risen in value since their purchase and $25,869,000 in unrealized losses on securities that had fallen in value since their purchase.
18
Mega Cap 300 Index Fund
E. During the six months ended February 28, 2010, the fund purchased $61,240,000 of investmen securities and sold $61,000,000 of investment securities, other than temporary cash investments.
F. Capital share transactions for each class of shares were:
| | | | |
| | Six Months Ended | | Year Ended |
| | February 28, 2010 | August 31, 2009 |
| | Amount | Shares | Amount | Shares |
| | ($000) | (000) | ($000) | (000) |
| Institutional Shares | | | | |
| Issued | 5,085 | 68 | 69,116 | 847 |
| Issued in Lieu of Cash Distributions | 1,350 | 18 | 2,078 | 33 |
| Redeemed | (15,358) | (204) | (1,200) | (21) |
| Net Increase (Decrease)—Institutional Shares | (8,923) | (118) | 69,994 | 859 |
| ETF Shares | | | | |
| Issued | 45,577 | 1,200 | 299,108 | 8,500 |
| Issued in Lieu of Cash Distributions | — | — | — | — |
| Redeemed | (36,459) | (1,000) | (180,755) | (4,900) |
| Net Increase (Decrease)—ETF Shares | 9,118 | 200 | 118,353 | 3,600 |
The amount of Institutional Shares issued during the year ended August 31, 2009, includes $58,176,000 in purchases that were processed late and should have been recorded in the prior fiscal period. Vanguard, as transfer agent for the fund, offset any impact to the fund resulting from late processing of shareholder transactions. Accordingly, the purchases had no impact to t he fund’s net asset value per share or total returns.
G. In preparing the financial statements as of February 28, 2010, management considered the impact of subsequent events for potential recognition or disclosure in these financial statements.
19
Mega Cap 300 Growth Index Fund
Fund Profile
As of February 28, 2010
| | |
| Share-Class Characteristics | |
| |
| | Institutional | ETF |
| | Shares | Shares |
| Ticker Symbol | VMGAX | MGK |
| Expense Ratio1 | 0.11% | 0.13% |
| 30-Day SEC Yield | 1.16% | 1.14% |
| | | |
| Portfolio Characteristics | | |
| | | MSCI US | DJ |
| | | Large Cap | U.S. Total |
| | | Growth | Market |
| | Fund | Index | Index |
| Number of Stocks | 175 | 175 | 4,178 |
| Median Market Cap | $46.7B | $46.7B | $29.9B |
| Price/Earnings Ratio | 20.9x | 20.9x | 21.5x |
| Price/Book Ratio | 3.3x | 3.3x | 2.1x |
| Return on Equity | 25.2% | 24.9% | 19.3% |
| Earnings Growth Rate | 15.6% | 15.6% | 7.8% |
| Dividend Yield | 1.3% | 1.3% | 1.8% |
| Foreign Holdings | 0.0% | 0.0% | 0.0% |
| Turnover Rate | | | |
| (Annualized) | 18% | — | — |
| Short-Term Reserves | 0.0% | — | — |
| | | |
| Sector Diversification (% of equity exposure) |
| | | MSCI US | DJ |
| | | Large Cap | U.S. Total |
| | | Growth | Market |
| | Fund | Index | Index |
| Consumer | | | |
| Discretionary | 11.3% | 11.3% | 10.7% |
| Consumer Staples | 13.2 | 13.2 | 10.1 |
| Energy | 7.1 | 7.1 | 10.4 |
| Financials | 6.4 | 6.4 | 16.8 |
| Health Care | 13.3 | 13.4 | 12.7 |
| Industrials | 6.8 | 6.8 | 10.7 |
| Information | | | |
| Technology | 37.0 | 36.9 | 18.4 |
| Materials | 4.1 | 4.1 | 3.9 |
| Telecommunication | | | |
| Services | 0.6 | 0.6 | 2.7 |
| Utilities | 0.2 | 0.2 | 3.6 |
| | |
| Ten Largest Holdings (% of total net assets) |
| Microsoft Corp. | Systems Software | 5.2% |
| Apple Inc. | Computer | |
| | Hardware | 4.2 |
| International Business | Computer | |
| Machines Corp. | Hardware | 3.8 |
| Cisco Systems Inc. | Communications | |
| | Equipment | 3.2 |
| Google Inc. Class A | Internet Software & | |
| | Services | 2.9 |
| Wal-Mart Stores Inc. | Hypermarkets & | |
| | Super Centers | 2.8 |
| Hewlett-Packard Co. | Computer | |
| | Hardware | 2.7 |
| PepsiCo Inc. | Soft Drinks | 2.3 |
| Oracle Corp. | Systems Software | 2.2 |
| Philip Morris International | Tobacco | |
| Inc. | | 2.1 |
| Top Ten | | 31.4% |
The holdings listed exclude any temporary cash investments and equity index products.
Investment Focus

1 The expense ratios shown are from the prospectuses dated December 28, 2009, and represent estimated costs for the current fiscal year based on the fund’s net assets as of the prospectus date. For the six months ended February 28, 2010, the annualized expense ratios were 0.11% for Institutional Shares and 0.13% for ETF Shares.
20
Mega Cap 300 Growth Index Fund
Performance Summary
All of the returns in this report represent past performance, which is not a guarantee of future results that may be achieved by the fund. (Current performance may be lower or higher than the performance data cited. For performance data current to the most recent month-end, visit our website at www.vanguard.com/performance.) Note, too, that both investment returns and principal value can fluctuate widely, so an investor’s shares, when sold, could be worth more or less than their original cost. The returns shown do not reflect taxes that a shareholder would pay on fund distributions or on the sale of fund shares.
Fiscal-Year Total Returns (%): December 17, 2007, Through February 28, 2010
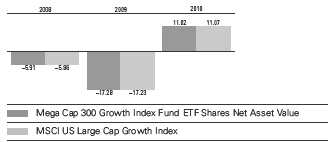
Note: For 2010, performance data reflect the six months ended February 28, 2010.
Average Annual Total Returns: Periods Ended December 31, 2009
This table presents average annual total returns through the latest calendar quarter—rather than through the end of
the fiscal period. Securities and Exchange Commission rules require that we provide this information.
| | | |
| | Inception | One | Since |
| | Date | Year | Inception |
| Institutional Shares | 4/3/2008 | 35.10% | -4.59% |
| ETF Shares | 12/17/2007 | | |
| Market Price | | 35.02 | -6.33 |
| Net Asset Value | | 35.09 | -6.34 |
See Financial Highlights for dividend and capital gains information.
21
Mega Cap 300 Growth Index Fund
Financial Statements (unaudited)
Statement of Net Assets
As of February 28, 2010
The fund reports a complete list of its holdings in regulatory filings four times in each fiscal year, at the quarter-ends. For the second and fourth fiscal quarters, the lists appear in the fund’s semiannual and annual reports to shareholders. For the first and third fiscal quarters, the fund files the lists with the Securities and Exchange Commission on Form N-Q. Shareholders can look up the fund’s Forms N-Q on the SEC’s website at www.sec.gov. Forms N-Q may also be reviewed and copied at the SEC’s Public Reference Room (see the back cover of this report for further information).
| | | |
| | | | Market |
| | | | Value• |
| | | Shares | ($000) |
| Common Stocks (100.0%) | | |
| Consumer Discretionary (11.3%) | |
| | McDonald’s Corp. | 91,906 | 5,868 |
| * | Amazon.com Inc. | 29,482 | 3,491 |
| | Target Corp. | 60,859 | 3,135 |
| | Lowe’s Cos. Inc. | 125,791 | 2,983 |
| * | Ford Motor Co. | 248,257 | 2,915 |
| * | DIRECTV Class A | 77,392 | 2,620 |
| | NIKE Inc. Class B | 31,718 | 2,144 |
| | Johnson Controls Inc. | 57,110 | 1,776 |
| | Staples Inc. | 61,435 | 1,583 |
| | TJX Cos. Inc. | 36,150 | 1,505 |
| * | Starbucks Corp. | 62,904 | 1,441 |
| | Yum! Brands Inc. | 39,801 | 1,342 |
| * | Kohl’s Corp. | 24,760 | 1,333 |
| | Best Buy Co. Inc. | 30,211 | 1,103 |
| | Coach Inc. | 27,162 | 990 |
| | Omnicom Group Inc. | 26,467 | 969 |
| * | Bed Bath & Beyond Inc. | 22,357 | 930 |
| | McGraw-Hill Cos. Inc. | 26,878 | 919 |
| | Marriott International Inc. | | |
| | Class A | 25,798 | 699 |
| * | Apollo Group Inc. Class A | 11,112 | 665 |
| | Sherwin-Williams Co. | 8,211 | 520 |
| * | Viacom Inc. Class B | 16,390 | 486 |
| * | Las Vegas Sands Corp. | 28,174 | 469 |
| | Gap Inc. | 20,733 | 446 |
| * | AutoZone Inc. | 2,550 | 423 |
| | Garmin Ltd. | 10,221 | 327 |
| * | Liberty Global Inc. Class A | 10,978 | 295 |
| | News Corp. Class B | 18,720 | 295 |
| * | Liberty Global Inc. | 10,133 | 268 |
| | JC Penney Co. Inc. | 9,080 | 250 |
| * | Sears Holdings Corp. | 1,379 | 132 |
| | | | 42,322 |
| Consumer Staples (13.2%) | | |
| | Wal-Mart Stores Inc. | 197,084 | 10,656 |
| | PepsiCo Inc. | 138,586 | 8,657 |
| | Philip Morris | | |
| | International Inc. | 162,215 | 7,945 |
| | | |
| | | | Market |
| | | | Value• |
| | | Shares | ($000) |
| | Colgate-Palmolive Co. | 42,316 | 3,510 |
| | Coca-Cola Co. | 62,164 | 3,277 |
| | Walgreen Co. | 84,054 | 2,962 |
| | CVS Caremark Corp. | 78,147 | 2,637 |
| | Costco Wholesale Corp. | 37,162 | 2,266 |
| | General Mills Inc. | 18,036 | 1,299 |
| | Kellogg Co. | 22,638 | 1,181 |
| | Avon Products Inc. | 36,432 | 1,109 |
| | Kimberly-Clark Corp. | 12,397 | 753 |
| | Clorox Co. | 11,899 | 730 |
| | Coca-Cola Enterprises Inc. | 24,990 | 639 |
| | HJ Heinz Co. | 13,426 | 616 |
| | Lorillard Inc. | 6,846 | 500 |
| | Campbell Soup Co. | 11,481 | 383 |
| | Hershey Co. | 8,759 | 348 |
| | | | 49,468 |
| Energy (7.1%) | | |
| | Schlumberger Ltd. | 102,264 | 6,248 |
| | Anadarko Petroleum Corp. | 41,868 | 2,936 |
| | EOG Resources Inc. | 21,473 | 2,020 |
| | Occidental Petroleum Corp. | 24,186 | 1,931 |
| | National Oilwell Varco Inc. | 35,655 | 1,550 |
| | Halliburton Co. | 49,978 | 1,507 |
| | Baker Hughes Inc. | 26,417 | 1,266 |
| * | Southwestern Energy Co. | 29,401 | 1,251 |
| | Noble Energy Inc. | 14,803 | 1,075 |
| | Peabody Energy Corp. | 22,845 | 1,050 |
| * | Weatherford | | |
| | International Ltd. | 62,836 | 1,049 |
| | Hess Corp. | 16,329 | 960 |
| | Smith International Inc. | 21,117 | 866 |
| | XTO Energy Inc. | 17,313 | 791 |
| * | Ultra Petroleum Corp. | 12,909 | 590 |
| | Murphy Oil Corp. | 10,050 | 522 |
| | Diamond Offshore | | |
| | Drilling Inc. | 5,930 | 518 |
| | Noble Corp. | 11,084 | 468 |
| | | | 26,598 |
22
| | | |
| Mega Cap 300 Growth Index Fund | |
| |
| |
| |
| | | | Market |
| | | | Value• |
| | | Shares | ($000) |
| Financials (6.5%) | | |
| * | Berkshire Hathaway Inc. | | |
| | Class B | 48,730 | 3,905 |
| | American Express Co. | 91,149 | 3,481 |
| | US Bancorp | 105,868 | 2,605 |
| * | Citigroup Inc. | 631,195 | 2,146 |
| | CME Group Inc. | 5,670 | 1,711 |
| | Charles Schwab Corp. | 84,063 | 1,539 |
| | Capital One Financial Corp. | 38,349 | 1,448 |
| | Franklin Resources Inc. | 13,678 | 1,391 |
| | State Street Corp. | 27,415 | 1,231 |
| | T Rowe Price Group Inc. | 21,949 | 1,113 |
| | Northern Trust Corp. | 18,484 | 985 |
| | Simon Property Group Inc. | 8,474 | 663 |
| | Moody’s Corp. | 17,114 | 456 |
| | BlackRock Inc. | 1,951 | 427 |
| * | TD Ameritrade Holding Corp. | 22,553 | 394 |
| | SunTrust Banks Inc. | 14,940 | 356 |
| | Public Storage | 3,775 | 310 |
| | | | 24,161 |
| Health Care (13.3%) | | |
| | Johnson & Johnson | 117,486 | 7,402 |
| | Abbott Laboratories | 131,730 | 7,150 |
| * | Amgen Inc. | 86,180 | 4,879 |
| | Medtronic Inc. | 94,222 | 4,089 |
| * | Gilead Sciences Inc. | 76,598 | 3,647 |
| | Baxter International Inc. | 51,343 | 2,923 |
| * | Medco Health Solutions Inc. | 40,637 | 2,570 |
| * | Celgene Corp. | 39,165 | 2,331 |
| * | Express Scripts Inc. | 22,217 | 2,133 |
| | Becton Dickinson and Co. | 20,210 | 1,574 |
| | Allergan Inc. | 25,913 | 1,514 |
| * | Biogen Idec Inc. | 24,642 | 1,356 |
| | McKesson Corp. | 22,842 | 1,351 |
| | Stryker Corp. | 25,433 | 1,350 |
| * | Genzyme Corp. | 22,619 | 1,294 |
| * | St. Jude Medical Inc. | 28,490 | 1,089 |
| * | Zimmer Holdings Inc. | 18,153 | 1,041 |
| | Quest Diagnostics Inc. | 13,396 | 760 |
| | CR Bard Inc. | 8,228 | 689 |
| * | Laboratory Corp. of | | |
| | America Holdings | 9,051 | 663 |
| | | | 49,805 |
| Industrials (6.8%) | | |
| | Boeing Co. | 58,787 | 3,713 |
| | Caterpillar Inc. | 53,027 | 3,025 |
| | Union Pacific Corp. | 42,970 | 2,895 |
| | United Parcel Service Inc. | | |
| | Class B | 39,127 | 2,298 |
| | Danaher Corp. | 23,274 | 1,722 |
| | FedEx Corp. | 16,408 | 1,391 |
| | Precision Castparts Corp. | 11,964 | 1,349 |
| | PACCAR Inc. | 29,474 | 1,042 |
| | Deere & Co. | 17,964 | 1,029 |
| | Honeywell International Inc. | 21,626 | 868 |
| | | |
| | | | Market |
| | | | Value• |
| | | Shares | ($000) |
| | Parker Hannifin Corp. | 13,681 | 825 |
| | Southwest Airlines Co. | 63,355 | 797 |
| | CH Robinson Worldwide Inc. | 14,248 | 760 |
| | ITT Corp. | 14,797 | 758 |
| | Lockheed Martin Corp. | 9,589 | 746 |
| | Expeditors International | | |
| | of Washington Inc. | 18,006 | 657 |
| | Fluor Corp. | 15,227 | 652 |
| *,^ | First Solar Inc. | 4,716 | 499 |
| | Cummins Inc. | 8,198 | 465 |
| | | | 25,491 |
| Information Technology (36.9%) | |
| | Microsoft Corp. | 680,585 | 19,506 |
| * | Apple Inc. | 76,707 | 15,696 |
| | International Business | | |
| | Machines Corp. | 111,875 | 14,226 |
| * | Cisco Systems Inc. | 489,928 | 11,920 |
| * | Google Inc. Class A | 20,701 | 10,905 |
| | Hewlett-Packard Co. | 201,936 | 10,256 |
| | Oracle Corp. | 341,564 | 8,420 |
| | QUALCOMM Inc. | 142,234 | 5,219 |
| | Visa Inc. Class A | 40,020 | 3,413 |
| | Intel Corp. | 164,490 | 3,377 |
| * | EMC Corp. | 173,575 | 3,036 |
| * | eBay Inc. | 99,185 | 2,283 |
| | Accenture PLC Class A | 53,514 | 2,139 |
| * | Dell Inc. | 149,891 | 1,983 |
| | Mastercard Inc. Class A | 8,421 | 1,889 |
| | Automatic Data | | |
| | Processing Inc. | 43,013 | 1,790 |
| * | Yahoo! Inc. | 113,289 | 1,734 |
| | Texas Instruments Inc. | 69,412 | 1,692 |
| * | Adobe Systems Inc. | 44,606 | 1,546 |
| | Applied Materials Inc. | 113,676 | 1,391 |
| * | Motorola Inc. | 196,973 | 1,332 |
| * | Juniper Networks Inc. | 44,657 | 1,250 |
| * | Cognizant Technology | | |
| | Solutions Corp. Class A | 25,120 | 1,209 |
| | Corning Inc. | 66,289 | 1,169 |
| | Broadcom Corp. Class A | 37,201 | 1,165 |
| * | Symantec Corp. | 69,087 | 1,143 |
| | Tyco Electronics Ltd. | 39,144 | 1,003 |
| | Western Union Co. | 58,991 | 931 |
| * | Agilent Technologies Inc. | 29,309 | 922 |
| * | NetApp Inc. | 28,699 | 861 |
| | Paychex Inc. | 27,758 | 831 |
| * | Intuit Inc. | 25,625 | 829 |
| | CA Inc. | 35,201 | 792 |
| * | NVIDIA Corp. | 47,297 | 766 |
| | Activision Blizzard Inc. | 48,601 | 517 |
| | Analog Devices Inc. | 16,173 | 473 |
| * | Electronic Arts Inc. | 27,636 | 458 |
| * | VMware Inc. Class A | 4,764 | 236 |
| | | | 138,308 |
23
| | | |
| Mega Cap 300 Growth Index Fund | |
| |
| |
| |
| | | | Market |
| | | | Value• |
| | | Shares | ($000) |
| Materials (4.1%) | | |
| | Monsanto Co. | 46,386 | 3,277 |
| | Freeport-McMoRan | | |
| | Copper & Gold Inc. | 36,641 | 2,754 |
| | Newmont Mining Corp. | 40,899 | 2,016 |
| | Praxair Inc. | 26,152 | 1,965 |
| | Dow Chemical Co. | 48,752 | 1,380 |
| | Alcoa Inc. | 83,129 | 1,106 |
| | Ecolab Inc. | 20,220 | 852 |
| | Weyerhaeuser Co. | 18,007 | 727 |
| | Mosaic Co. | 8,640 | 505 |
| | Air Products | | |
| | & Chemicals Inc. | 6,271 | 430 |
| | International Paper Co. | 17,543 | 406 |
| | | | 15,418 |
| Telecommunication Services (0.6%) | |
| * | American Tower Corp. | | |
| | Class A | 34,218 | 1,460 |
| * | Crown Castle | | |
| | International Corp. | 24,731 | 935 |
| | | | 2,395 |
| Utilities (0.2%) | | |
| * | AES Corp. | 56,821 | 664 |
| Total Common Stocks | | |
| (Cost $357,739) | | 374,630 |
| Temporary Cash Investment (0.1%) | |
| Money Market Fund (0.1%) | | |
| 1,2 | Vanguard Market | | |
| | Liquidity Fund, 0.163% | | |
| | (Cost $381) | 381,000 | 381 |
| Total Investments (100.1%) | | |
| (Cost $358,120) | | 375,011 |
| Other Assets and Liabilities (-0.1%) | |
| Other Assets | | 1,991 |
| Liabilities2 | | (2,409) |
| | | | (418) |
| Net Assets (100%) | | 374,593 |
| |
| At February 28, 2010, net assets consisted of: |
| | Amount |
| | ($000) |
| Paid-in Capital | 391,958 |
| Undistributed Net Investment Income | 441 |
| Accumulated Net Realized Losses | (34,697) |
| Unrealized Appreciation (Depreciation) | 16,891 |
| Net Assets | 374,593 |
| |
| Institutional Shares—Net Assets | |
| Applicable to 844,244 outstanding | |
| $.001 par value shares of beneficial | |
| interest (unlimited authorization) | 68,996 |
| Net Asset Value Per Share— | |
| Institutional Shares | $81.72 |
| |
| ETF Shares—Net Assets | |
| Applicable to 7,400,000 outstanding | |
| $.001 par value shares of beneficial | |
| interest (unlimited authorization) | 305,597 |
| Net Asset Value Per Share— | |
| ETF Shares | $41.30 |
• See Note A in Notes to Financial Statements.
* Non-income-producing security.
^ Part of security position is on loan to broker-dealers. The total value of securities on loan is $381,000.
1 Affiliated money market fund available only to Vanguard funds and certain trusts and accounts managed by Vanguard. Rate shown is the 7-day yield.
2 Includes $381,000 of collateral received for securities on loan.
See accompanying Notes, which are an integral part of the Financial Statements.
24
| |
| Mega Cap 300 Growth Index Fund | |
| |
| |
| Statement of Operations | |
| |
| | Six Months Ended |
| | February 28, 2010 |
| | ($000) |
| Investment Income | |
| Income | |
| Dividends | 2,837 |
| Security Lending | 1 |
| Total Income | 2,838 |
| Expenses | |
| The Vanguard Group—Note B | |
| Investment Advisory Services | 32 |
| Management and Administrati ve—Institutional Shares | 21 |
| Management and Administrati ve—ETF Shares | 115 |
| Marketing and Distribution& #151;Institutional Shares | 10 |
| Marketing and Distribution& #151;ETF Shares | 65 |
| Custodian Fees | 5 |
| Shareholders’ Reports—Institutional Shares | — |
| Shareholders’ Reports—ETF Shares | 7 |
| Total Expenses | 255 |
| Net Investment Income | 2,583 |
| Realized Net Gain (Loss) on Investment Securities Sold | 53,089 |
| Change in Unrealized Appreciation (Depreciation) of Investment Securities | (3,935) |
| Net Increase (Decrease) in Net Assets Resulting from Operations | 51,737 |
See accompanying Notes, which are an integral part of the Financial Statements.
25
| | |
| Mega Cap 300 Growth Index Fund | | |
| |
| |
| Statement of Changes in Net Assets | | |
| |
| | Six Months Ended | Year Ended |
| | February 28, | August 31, |
| | 2010 | 2009 |
| | ($000) | ($000) |
| Increase (Decrease) in Net Assets | | |
| Operations | | |
| Net Investment Income | 2,583 | 4,621 |
| Realized Net Gain (Loss) | 53,089 | (47,518) |
| Change in Unrealized Appreciation (Depreciation) | (3,935) | 22,156 |
| Net Increase (Decrease) in Net Assets Resulting from Operations | 51,737 | (20,741) |
| Distributions | | |
| Net Investment Income | | |
| Institutional Shares | (544) | (753) |
| ETF Shares | (2,986) | (2,928) |
| Realized Capital Gain | | |
| Institutional Shares | — | — |
| ETF Shares | — | — |
| Total Distributions | (3,530) | (3,681) |
| Capital Share Transactions | | |
| Institutional Shares | 619 | (32,148) |
| ETF Shares | (272,554) | 397,215 |
| Net Increase (Decrease) from Capital Share Transactions | (271,935) | 365,067 |
| Total Increase (Decrease) | (223,728) | 340,645 |
| Net Assets | | |
| Beginning of Period | 598,321 | 257,676 |
| End of Period1 | 374,593 | 598,321 |
| 1 Net Assets—End of Period includes undistributed net investment income of $441,000 and $1,388,000. | |
See accompanying Notes, which are an integral part of the Financial Statements.
26
| | | |
| Mega Cap 300 Growth Index Fund | | | |
| |
| |
| Financial Highlights | | | |
| |
| |
| Institutional Shares | | | |
| | Six Months | Year | April 3, |
| | Ended | Ended | 20081 to |
| | February 28, | Aug. 31, | Aug. 31, |
| For a Share Outstanding Throughout Each Period | 2010 | 2009 | 2008 |
| Net Asset Value, Beginning of Period | $74.21 | $91.10 | $92.21 |
| Investment Operations | | | |
| Net Investment Income | .575 | 1.053 | .343 |
| Net Realized and Unrealized Gain (Loss) on Investments | 7.593 | (16.900) | (1.250) |
| Total from Investment Operations | 8.168 | (15.847) | (.907) |
| Distributions | | | |
| Dividends from Net Investment Income | (.649) | (1.043) | (.203) |
| Distributions from Realized Capital Gains | — | — | — |
| Total Distributions | (.649) | (1.043) | (.203) |
| Net Asset Value, End of Period | $81.72 | $74.21 | $91.10 |
| |
| Total Return | 11.01% | -17.25% | -0.99% |
| |
| Ratios/Supplemental Data | | | |
| Net Assets, End of Period (Millions) | $69 | $62 | $97 |
| Ratio of Total Expenses to Average Net Assets | 0.11%2 | 0.11% | 0.08%2 |
| Ratio of Net Investment Income to Average Net Assets | 1.30%2 | 1.59% | 1.16%2 |
| Portfolio Turnover Rate3 | 18%2 | 31% | 9% |
1 Inception.
2 Annualized.
3 Excludes the value of portfolio securities received or delivered as a result of in-kind purchases or redemptions of the fund’s capital shares, including ETF Creation Units.
See accompanying Notes, which are an integral part of the Financial Statements.
27
| | | |
| Mega Cap 300 Growth Index Fund | | | |
| |
| |
| Financial Highlights | | | |
| |
| |
| ETF Shares | | | |
| | Six Months | Year | Dec. 17, |
| | Ended | Ended | 20071 to |
| | February 28, | Aug. 31, | Aug. 31, |
| For a Share Outstanding Throughout Each Period | 2010 | 2009 | 2008 |
| Net Asset Value, Beginning of Period | $37.50 | $46.04 | $49.10 |
| Investment Operations | | | |
| Net Investment Income | .285 | .528 | .237 |
| Net Realized and Unrealized Gain (Loss) on Investments | 3.839 | (8.548) | (3.139) |
| Total from Investment Operations | 4.124 | (8.020) | (2.902) |
| Distributions | | | |
| Dividends from Net Investment Income | (.324) | (.520) | (.158) |
| Distributions from Realized Capital Gains | — | — | — |
| Total Distributions | (.324) | (.520) | (.158) |
| Net Asset Value, End of Period | $41.30 | $37.50 | $46.04 |
| |
| Total Return | 11.02% | -17.28% | -5.91% |
| |
| Ratios/Supplemental Data | | | |
| Net Assets, End of Period (Millions) | $306 | $536 | $161 |
| Ratio of Total Expenses to Average Net Assets | 0.13%2 | 0.13% | 0.13%2 |
| Ratio of Net Investment Income to Average Net Assets | 1.28%2 | 1.57% | 1.11%2 |
| Portfolio Turnover Rate3 | 18%2 | 31% | 9% |
1 Inception.
2 Annualized.
3 Excludes the value of portfolio securities received or delivered as a result of in-kind purchases or redemptions of the fund’s capital shares, including ETF Creation Units.
See accompanying Notes, which are an integral part of the Financial Statements.
28
Mega Cap 300 Growth Index Fund
Notes to Financial Statements
Vanguard Mega Cap 300 Growth Index Fund is registered under the Investment Company Act of 1940 as an open-end investment company, or mutual fund. The fund offers two classes of shares: Institutional Shares and ETF Shares. Institutional Shares are designed for investors who meet certain administrative and service criteria and invest a minimum amount of $5 million. ETF Shares are listed for trading on the NYSE Arca, Inc.; they can be purchased and sold through a broker.
A. The following significant accounting policies conform to generally accepted accounting principles for U.S. mutual funds. The fund consistently follows such policies in preparing its financial statements.
1. Security Valuation: Securities are valued as of the close of trading on the New York Stock Exchange (generally 4 p.m., Eastern time) on the valuation date. Equity securities are valued at the latest quoted sales prices or official closing prices taken from the primary market in which each security trades; such securities not traded on the valuation date are value d at the mean of the latest quoted bid and asked prices. Securities for which market quotations are not re adily available, or whose values have been materially affected by events occurring before the fund’s pricing time but after the close of the securities’ primary markets, are valued by methods deemed by the board of trustees to represent fair value. Investments in Vanguard Market Liquidity Fund are valued at that fund’s net asset value.
2. Federal Income Taxes: The fund intends to continue to qualify as a regulated investment company and distribute all of its taxable income. Management has analyzed the fund’s tax positions taken for all open federal income tax years (August 31, 2008–2009), and for the period ended February 28, 201 0, and has concluded that no prov ision for federal income tax is required in the fund’s financ ial statements.
3. Distributions: Distributions to shareholders are recorded on the ex-dividend date.
4. Security Lending: The fund may lend its securities to qualified institutional borrowers to earn additional income. Security loans are required to be secured at all times by collateral at least equal to the market value of securities loaned. The fund invests cash collateral received in Vanguard Market Liquidity Fund, and records a liability for the return of the collateral, during the period the securities are on loan. Security lending income represents the income earned on investing cash collateral, less expenses associated with the loan.
5. Other: Dividend income is recorded on the ex-dividend date. Security transactions are accounted for on the date securities are bought or sold. Costs used to determine realized gains (losses) on the sale of investment securities are those of the specific securities sold.
Each class of shares has equal rights as to assets and earnings, except that each class separately bears certain class-specific expenses related to maintenance of shareholder accounts (included in Management and Administrative expenses) and shareholder reporting. Marketing an d distribution expenses are alloc ated to each class of shares base d on a method approved by the board of trustees. Income, other non-class-specific expenses, and gains and losses on investments are allocated to each class of shares based on its relative net assets.
29
Mega Cap 300 Growth Index Fund
B. The Vanguard Group furnishes at cost investment advisory, corporate management, administrative, marketing, and distribution services. The costs of such services are allocated to the fund under methods approved by the board of trustees. The fund has committed to provide up to 0.40% of its net assets in capital contributions to Vanguard. At February 28, 2010, the fund had contributed capital of $74,000 to Vanguard (included in Other Assets), representing 0.02% of the fund’s net assets and 0.03% of
Vanguard’s capitalization. The fund’s trustees and officers are also directors and officers of Vanguard.
C. Various inputs may be used to determine the value of the fund’s investments. These inputs are summarized in three broad levels for financial statement purposes. The inputs or methodologies used to value securities are not necessarily an indication of the risk associated with investing in those securities.
Level 1—Quoted prices in active markets for identical securities.
Level 2—Other significant observable inputs (including quoted prices for similar securities, interest rates, prepayment speeds, credit risk, etc.).
Level 3—Significant unobservable inputs (including the fund’s own assumptions used to determine the fair value of investments).
At February 28, 2010, 100% of the fund’s investments were valued based on Level 1 inputs.
D. Distributions are determined on a tax basis and may differ from net investment income and realized capital gains for financial reporting purposes. Differences may be permanent or temporary. Permanent differences are reclassified among capital accounts in the financial statements to reflect their tax character. Temporary differences arise when certain items of income, expense, gain, or loss are recognized in different periods for financial statement and tax purposes; these differences will reverse at some time in the future. Differences in classification may also result from the treatment of shor t-term gains as ordinary income for tax purposes.
During the six months ended February 28, 2010, the fund realized $54,843,000 of net capital gains resulting from in-kind redemptions—in which shareholders exchanged fund shares for securities held by the fund rather than for cash. Because such gains are not taxable to the fund, and are not distributed to shareholders, they have been reclassified from accumulated net realized losses to paid-in capital.
The fund’s tax-basis capital gains and losses are determined only at the end of each fiscal year. For tax purposes, at August 31, 2009, the fund had available capital loss carryforwards totaling $7,258,000 to offset future net capital gains through August 31, 2017. In addition, the fund realized losses of $25,649,000 during the period from November 1, 2008, through August 31, 2009, which are deferred and will be treated as realized for tax purposes in fiscal 2010. The fund will use these capital losses to offset net taxable capital gains, if any, realized during the year ending August 31, 2010; should the fund realize net capital losses for the year, the losses will be added to the loss carryforward balance above.
At February 28, 2010, the cost of investment securities for tax purposes was $358,120,000. Net unrealized appreciation of investment securities for tax purposes was $16,891,000, consisting of unrealized gains of $29,203,000 on securities that had risen in value since their purchase and $12,312,000 in unrealized losses on securities that had fallen in value since their purchase.
30
Mega Cap 300 Growth Index Fund
E. During the six months ended February 28, 2010, the fund purchased $98,789,000 of investment securities and sold $371,604,000 of investment securities, other than temporary cash investments.
F. Capital share transactions for each class of shares were:
| | | | |
| | Six Months Ended | | Year Ended |
| | February 28, 2010 | August 31, 2009 |
| | Amount | Shares | Amount | Shares |
| | ($000) | (000) | ($000) | (000) |
| Institutional Shares | | | | |
| Issued | 97 | 1 | (32,901) | (235) |
| Issued in Lieu of Cash Distributions | 544 | 7 | 753 | 12 |
| Redeemed | (22) | — | — | — |
| Net Increase (Decrease)—Institutional Shares | 619 | 8 | (32,148) | (223) |
| ETF Shares | | | | |
| Issued | 61,411 | 1,500 | 773,526 | 23,100 |
| Issued in Lieu of Cash Distributions | — | — | — | — |
| Redeemed | (333,965) | (8,400) | (376,311) | (12,300) |
| Net Increase (Decrease)—ETF Shares | (272,554) | (6,900) | 397,215 | 10,800 |
The amounts of Institutional Shares issued during the year ended August 31, 2009, are negative because they reflect the cancellation of $58,176,000 of purchases recorded during the prior fiscal period that were determined to have been processed incorrectly. Vanguard, as a transfer agent for the fund, offset any impact to the fund resulting from incorrectly processed shareholder transactions. Accordingly, the cancelled purchases had no impact to the fund’s net asset values per share or total return s.
G. In preparing the financial statements as of February 28, 2010, management considered the impact of subsequent events for potential recognition or disclosure in these financial statements.
31
Mega Cap 300 Value Index Fund
Fund Profile
As of February 28, 2010
| | |
| Share-Class Characteristics | |
| |
| | Institutional | ETF |
| | Shares | Shares |
| Ticker Symbol | VMVLX | MGV |
| Expense Ratio1 | 0.11% | 0.13% |
| 30-Day SEC Yield | 2.44% | 2.42% |
| | | |
| Portfolio Characteristics | | |
| | | MSCI US | DJ |
| | | Large Cap | U.S. Total |
| | | Value | Market |
| | Fund | Index | Index |
| Number of Stocks | 163 | 164 | 4,178 |
| Median Market Cap | $64.7B | $64.7B | $29.9B |
| Price/Earnings Ratio | 17.2x | 17.3x | 21.5x |
| Price/Book Ratio | 1.6x | 1.6x | 2.1x |
| Return on Equity | 18.2% | 18.2% | 19.3% |
| Earnings Growth Rate | 1.6% | 1.5% | 7.8% |
| Dividend Yield | 2.8% | 2.8% | 1.8% |
| Foreign Holdings | 0.0% | 0.0% | 0.0% |
| Turnover Rate | | | |
| (Annualized) | 33% | — | — |
| Short-Term Reserves | 0.0% | — | — |
| | | |
| Sector Diversification (% of equity exposure) |
| | | MSCI US | DJ |
| | | Large Cap | U.S. Total |
| | | Value | Market |
| | Fund | Index | Index |
| Consumer | | | |
| Discretionary | 6.7% | 6.7% | 10.7% |
| Consumer Staples | 11.1 | 11.2 | 10.1 |
| Energy | 17.0 | 17.0 | 10.4 |
| Financials | 23.0 | 23.2 | 16.8 |
| Health Care | 13.0 | 12.9 | 12.7 |
| Industrials | 13.1 | 13.0 | 10.7 |
| Information | | | |
| Technology | 2.7 | 2.7 | 18.4 |
| Materials | 1.9 | 1.9 | 3.9 |
| Telecommunication | | | |
| Services | 5.6 | 5.6 | 2.7 |
| Utilities | 5.9 | 5.8 | 3.6 |
| | |
| Ten Largest Holdings (% of total net assets) |
| Exxon Mobil Corp. | Integrated Oil & | |
| | Gas | 6.8% |
| Procter & Gamble Co. | Household | |
| | Products | 4.1 |
| General Electric Co. | Industrial | |
| | Conglomerates | 3.8 |
| JPMorgan Chase & Co. | Diversified Financial | |
| | Services | 3.6 |
| Bank of America Corp. | Diversified Financial | |
| | Services | 3.5 |
| AT&T Inc. | Integrated | |
| | Telecommunication | |
| | Services | 3.2 |
| Chevron Corp. | Integrated Oil & | |
| | Gas | 3.2 |
| Pfizer Inc. | Pharmaceuticals | 3.1 |
| Wells Fargo & Co. | Diversified Banks | 2.9 |
| Merck & Co. Inc. | Pharmaceuticals | 2.5 |
| Top Ten | | 36.7% |
The holdings listed exclude any temporary cash investments and equity index products.
Investment Focus
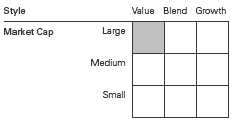
1 The expense ratios shown are from the prospectuses dated December 28, 2009, and represent estimated costs for the current fiscal year based on the fund’s net assets as of the prospectus date. For the six months ended February 28, 2010, the annualized expense ratios were 0.11% for Institutional Shares and 0.13% for ETF Shares.
32
Mega Cap 300 Value Index Fund
Performance Summary
All of the returns in this report represent past performance, which is not a guarantee of future results that may be achieved by the fund. (Current performance may be lower or higher than the performance data cited. For performance data current to the most recent month-end, visit our website at www.vanguard.com/performance.) Note, too, that both investment returns and principal value can fluctuate widely, so an investor’s shares, when sold, could be worth more or less than their original cost. The returns shown do not reflect taxes that a shareholder would pay on fund distributions or on the sale of fund shares.
Fiscal-Year Total Returns (%): December 17, 2007, Through February 28, 2010
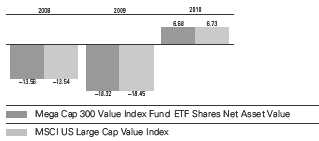
Note: For 2010, performance data reflect the six months ended February 28, 2010.
Average Annual Total Returns: Periods Ended December 31, 2009
This table presents average annual total returns through the latest calendar quarter—rather than through the end of
the fiscal period. Securities and Exchange Commission rules require that we provide this information.
| | | |
| | Inception | One | Since |
| | Date | Year | Inception |
| Institutional Shares | 3/5/2008 | 16.47% | -10.11% |
| ETF Shares | 12/17/2007 | | |
| Market Price | | 16.30 | -12.78 |
| Net Asset Value | | 16.47 | -12.79 |
See Financial Highlights for dividend and capital gains information.
33
Mega Cap 300 Value Index Fund
Financial Statements (unaudited)
Statement of Net Assets
As of February 28, 2010
The fund reports a complete list of its holdings in regulatory filings four times in each fiscal year, at the quarter-ends. For the second and fourth fiscal quarters, the lists appear in the fund’s semiannual and annual reports to shareholders. For the first and third fiscal quarters, the fund files the lists with the Securities and Exchange Commission on Form N-Q. Shareholders can look up the fund’s Forms N-Q on the SEC’s website at www.sec.gov. Forms N-Q may also be reviewed and copied at the SEC’s Public Reference Room (see the back cover of this report for further information).
| | | |
| | | | Market |
| | | | Value• |
| | | Shares | ($000) |
| Common Stocks (99.8%) | | |
| Consumer Discretionary (6.7%) | | |
| | Walt Disney Co. | 110,190 | 3,442 |
| | Home Depot Inc. | 102,787 | 3,207 |
| | Time Warner Inc. | 70,406 | 2,045 |
| | Comcast Corp. Class A | 95,547 | 1,571 |
| | News Corp. Class A | 112,802 | 1,508 |
| | Comcast Corp. | 76,024 | 1,178 |
| | Time Warner Cable Inc. | 21,276 | 993 |
| | Carnival Corp. | 26,317 | 946 |
| * | Viacom Inc. Class B | 21,812 | 647 |
| | Macy’s Inc. | 25,391 | 486 |
| | CBS Corp. Class B | 35,795 | 465 |
| | VF Corp. | 5,373 | 416 |
| | Fortune Brands Inc. | 9,079 | 398 |
| | Gap Inc. | 14,804 | 318 |
| | DISH Network Corp. Class A | 12,667 | 253 |
| | JC Penney Co. Inc. | 6,340 | 175 |
| * | Sears Holdings Corp. | 1,817 | 174 |
| | News Corp. Class B | 10,277 | 162 |
| | | | 18,384 |
| Consumer Staples (11.1%) | | |
| | Procter & Gamble Co. | 176,277 | 11,155 |
| | Coca-Cola Co. | 81,741 | 4,309 |
| | Kraft Foods Inc. | 105,177 | 2,990 |
| | Altria Group Inc. | 124,956 | 2,514 |
| | Sysco Corp. | 35,686 | 1,031 |
| | Archer-Daniels-Midland Co. | 34,890 | 1,024 |
| | CVS Caremark Corp. | 29,722 | 1,003 |
| | Kimberly-Clark Corp. | 16,267 | 988 |
| | Kroger Co. | 37,368 | 826 |
| | ConAgra Foods Inc. | 26,824 | 656 |
| | Safeway Inc. | 24,586 | 613 |
| | Reynolds American Inc. | 10,504 | 555 |
| | Sara Lee Corp. | 40,135 | 544 |
| | General Mills Inc. | 6,924 | 499 |
| | HJ Heinz Co. | 9,501 | 436 |
| | Molson Coors Brewing Co. | | |
| | Class B | 9,161 | 370 |
| | Lorillard Inc. | 4,859 | 355 |
| | | |
| | | | Market |
| | | | Value• |
| | | Shares | ($000) |
| | Brown-Forman Corp. Class B | 4,709 | 247 |
| | Campbell Soup Co. | 4,399 | 147 |
| | Hershey Co. | 3,405 | 135 |
| | | | 30,397 |
| Energy (16.9%) | | |
| | Exxon Mobil Corp. | 286,417 | 18,617 |
| | Chevron Corp. | 121,051 | 8,752 |
| | ConocoPhillips | 84,995 | 4,080 |
| | Occidental Petroleum Corp. | 31,813 | 2,540 |
| | Apache Corp. | 20,271 | 2,101 |
| | Devon Energy Corp. | 25,440 | 1,752 |
| * | Transocean Ltd. | 19,365 | 1,546 |
| | Marathon Oil Corp. | 42,734 | 1,237 |
| | XTO Energy Inc. | 22,713 | 1,038 |
| | Chesapeake Energy Corp. | 37,038 | 984 |
| | Spectra Energy Corp. | 39,000 | 850 |
| | Williams Cos. Inc. | 35,200 | 758 |
| | Valero Energy Corp. | 34,042 | 596 |
| | Halliburton Co. | 19,112 | 576 |
| | Hess Corp. | 6,221 | 366 |
| | Noble Corp. | 7,879 | 333 |
| | Murphy Oil Corp. | 3,868 | 201 |
| | | | 46,327 |
| Financials (23.0%) | | |
| | JPMorgan Chase & Co. | 237,752 | 9,978 |
| | Bank of America Corp. | 573,868 | 9,561 |
| | Wells Fargo & Co. | 293,079 | 8,013 |
| | Goldman Sachs Group Inc. | 29,481 | 4,609 |
| * | Citigroup Inc. | 830,872 | 2,825 |
| | Morgan Stanley | 73,777 | 2,079 |
| | Bank of New York | | |
| | Mellon Corp. | 72,617 | 2,071 |
| | MetLife Inc. | 49,373 | 1,797 |
| | Travelers Cos. Inc. | 32,946 | 1,733 |
| | PNC Financial Services | | |
| | Group Inc. | 31,223 | 1,678 |
| | Prudential Financial Inc. | 27,854 | 1,460 |
| | Aflac Inc. | 28,229 | 1,396 |
| | BB&T Corp. | 41,424 | 1,182 |
| | Chubb Corp. | 20,566 | 1,038 |
34
| | | |
| Mega Cap 300 Value Index Fund | |
| |
| |
| |
| | | | Market |
| | | | Value• |
| | | Shares | ($000) |
| | ACE Ltd. | 20,297 | 1,015 |
| | US Bancorp | 40,406 | 994 |
| | Allstate Corp. | 30,767 | 961 |
| | Simon Property Group Inc. | 11,184 | 876 |
| | Loews Corp. | 20,725 | 756 |
| | Marsh & McLennan Cos. Inc. | 31,913 | 741 |
| | Progressive Corp. | 38,622 | 662 |
| | Vornado Realty Trust | 9,799 | 644 |
| | Ameriprise Financial Inc. | 15,435 | 618 |
| | Annaly Capital | | |
| | Management Inc. | 33,443 | 615 |
| | AON Corp. | 14,922 | 611 |
| | Equity Residential | 16,707 | 603 |
| | Boston Properties Inc. | 8,402 | 571 |
| | Invesco Ltd. | 25,941 | 508 |
| | State Street Corp. | 10,451 | 469 |
| | SunTrust Banks Inc. | 19,680 | 468 |
| | Principal Financial Group Inc. | 19,258 | 447 |
| | NYSE Euronext | 15,699 | 414 |
| | Public Storage | 4,990 | 410 |
| | Hudson City Bancorp Inc. | 28,703 | 388 |
| | M&T Bank Corp. | 4,634 | 359 |
| * | Leucadia National Corp. | 11,834 | 281 |
| | | | 62,831 |
| Health Care (12.9%) | | |
| | Pfizer Inc. | 486,889 | 8,545 |
| | Merck & Co. Inc. | 184,326 | 6,798 |
| | Johnson & Johnson | 83,269 | 5,246 |
| | Bristol-Myers Squibb Co. | 103,219 | 2,530 |
| | UnitedHealth Group Inc. | 70,071 | 2,373 |
| | Eli Lilly & Co. | 62,358 | 2,141 |
| * | WellPoint Inc. | 27,638 | 1,710 |
| | Covidien PLC | 30,106 | 1,479 |
| * | Thermo Fisher Scient ific Inc. | 24,645 | 1,202 |
| | Aetna Inc. | 26,139 | 784 |
| | Cardinal Health Inc. | 21,941 | 745 |
| * | Boston Scientific Corp. | 91,023 | 704 |
| | CIGNA Corp. | 16,515 | 566 |
| * | Forest Laboratories Inc. | 18,290 | 546 |
| | | | 35,369 |
| Industrials (13.1%) | | |
| | General Electric Co. | 642,394 | 10,317 |
| | United Technologies Corp. | 53,708 | 3,687 |
| | 3M Co. | 40,556 | 3,251 |
| | Emerson Electric Co. | 45,355 | 2,147 |
| | General Dynamics Corp. | 19,771 | 1,434 |
| | Raytheon Co. | 23,094 | 1,299 |
| | Illinois Tool Works Inc. | 25,669 | 1,168 |
| | Norfolk Southern Corp. | 22,198 | 1,142 |
| | Honeywell International Inc. | 28,382 | 1,140 |
| | CSX Corp. | 23,680 | 1,124 |
| | Northrop Grumman Corp. | 17,950 | 1,100 |
| | Tyco International Ltd. | 28,626 | 1,032 |
| | Lockheed Martin Corp. | 12,575 | 978 |
| | Waste Management Inc. | 28,049 | 926 |
| | |
| | | Market |
| | | Value• |
| | Shares | ($000) |
| United Parcel Service Inc. | | |
| Class B | 14,954 | 878 |
| Deere & Co. | 12,778 | 732 |
| Eaton Corp. | 9,525 | 649 |
| Republic Services Inc. | | |
| Class A | 22,940 | 645 |
| L-3 Communications | | |
| Holdings Inc. | 7,005 | 640 |
| Ingersoll-Rand PLC | 19,273 | 615 |
| FedEx Corp. | 6,249 | 530 |
| Cummins Inc. | 5,807 | 330 |
| | | 35,764 |
| Information Technology (2.7%) | | |
| Intel Corp. | 216,440 | 4,444 |
| Corning Inc. | 46,932 | 827 |
| Xerox Corp. | 81,670 | 765 |
| Texas Instruments Inc. | 26,441 | 645 |
| Fidelity National Information | | |
| Services Inc. | 19,029 | 429 |
| Analog Devices Inc. | 6,239 | 182 |
| | | 7,292 |
| Materials (1.9%) | | |
| EI du Pont de | | |
| Nemours & Co. | 54,495 | 1,837 |
| Dow Chemical Co. | 34,526 | 977 |
| Nucor Corp. | 19,000 | 787 |
| PPG Industries Inc. | 10,103 | 622 |
| Air Products & Chemicals Inc. | 8,266 | 567 |
| International Paper Co. | 12,412 | 288 |
| Mosaic Co. | 3,267 | 191 |
| | | 5,269 |
| Telecommunication Services (5.6%) | |
| AT&T Inc. | 356,042 | 8,833 |
| Verizon | | |
| Communications Inc. | 171,469 | 4,961 |
| CenturyTel Inc. | 17,982 | 616 |
| * Sprint Nextel Corp. | 175,815 | 586 |
| Qwest Communications | | |
| International Inc. | 93,434 | 426 |
| | | 15,422 |
| Utilities (5.9%) | | |
| Exelon Corp. | 39,761 | 1,722 |
| Southern Co. | 48,253 | 1,533 |
| Dominion Resources Inc. | 36,003 | 1,368 |
| Duke Energy Corp. | 78,623 | 1,286 |
| FPL Group Inc. | 23,650 | 1,097 |
| American Electric | | |
| Power Co. Inc. | 28,788 | 968 |
| PG&E Corp. | 22,382 | 938 |
| Public Service Enterprise | | |
| Group Inc. | 30,552 | 908 |
| Entergy Corp. | 11,430 | 868 |
| FirstEnergy Corp. | 18,406 | 711 |
| Consolidated Edison Inc. | 16,604 | 710 |
| Sempra Energy | 14,174 | 697 |
35
| | |
| Mega Cap 300 Value Index Fund | | |
| |
| |
| |
| | | Market |
| | | Value• |
| | Shares | ($000) |
| PPL Corp. | 22,748 | 648 |
| Progress Energy Inc. | 16,881 | 646 |
| Edison International | 18,724 | 611 |
| Xcel Energy Inc. | 27,619 | 575 |
| Constellation Energy | | |
| Group Inc. | 10,903 | 382 |
| Ameren Corp. | 14,334 | 354 |
| | | 16,022 |
| Total Investments (99.8%) | | |
| (Cost $271,518) | | 273,077 |
| Other Assets and Liabilities (0.2%) | |
| Other Assets | | 2,891 |
| Liabilities | | (2,283) |
| | | 608 |
| Net Assets (100%) | | 273,685 |
| |
| At February 28, 2010, net assets consisted of: |
| | Amount |
| | ($000) |
| Paid-in Capital | 293,859 |
| Undistributed Net Investment Income | 1,179 |
| Accumulated Net Realized Losses | (22,912) |
| Unrealized Appreciation (Depreciation) | 1,559 |
| Net Assets | 273,685 |
| |
| Institutional Shares—Net Assets | |
| Applicable to 1,123,449 outstanding | |
| $.001 par value shares of beneficial | |
| interest (unlimited authorization) | 77,893 |
| Net Asset Value Per Share— | |
| Institutional Shares | $69.33 |
| |
| ETF Shares—Net Assets | |
| Applicable to 5,600,000 outstanding | |
| $.001 par value shares of beneficial | |
| interest (unlimited authorization) | 195,792 |
| Net Asset Value Per Share— | |
| ETF Shares | $34.96 |
• See Note A in Notes to Financial Statements.
* Non-income-producing security.
See accompanying Notes, which are an integral part of the Financial Statements.
36
| |
| Mega Cap 300 Value Index Fund | |
| |
| |
| Statement of Operations | |
| |
| | Six Months Ended |
| | February 28, 2010 |
| | ($000) |
| Investment Income | |
| Income | |
| Dividends | 4,091 |
| Security Lending | 15 |
| Total Income | 4,106 |
| Expenses | |
| The Vanguard Group—Note B | |
| Investment Advisory Services | 19 |
| Management and Administrati ve—Institutional Shares | 17 |
| Management and Administrati ve—ETF Shares | 62 |
| Marketing and Distribution& #151;Institutional Shares | 11 |
| Marketing and Distribution& #151;ETF Shares | 27 |
| Custodian Fees | 15 |
| Shareholders’ Reports—Institutional Shares | 3 |
| Shareholders’ Reports—ETF Shares | 7 |
| Total Expenses | 161 |
| Expenses Paid Indirectly | (2) |
| Net Expenses | 159 |
| Net Investment Income | 3,947 |
| Realized Net Gain (Loss) on Investment Securities Sold | 2,231 |
| Change in Unrealized Appreciation (Depreciation) of Investment Securities | 9,719 |
| Net Increase (Decrease) in Net Assets Resulting from Operations | 15,897 |
See accompanying Notes, which are an integral part of the Financial Statements.
37
| | |
| Mega Cap 300 Value Index Fund | | |
| |
| |
| Statement of Changes in Net Assets | | |
| |
| | Six Months Ended | Year Ended |
| | February 28, | August 31, |
| | 2010 | 2009 |
| | ($000) | ($000) |
| Increase (Decrease) in Net Assets | | |
| Operations | | |
| Net Investment Income | 3,947 | 6,197 |
| Realized Net Gain (Loss) | 2,231 | (16,911) |
| Change in Unrealized Appreciation (Depreciation) | 9,719 | (1,817) |
| Net Increase (Decrease) in Net Assets Resulting from Operations | 15,897 | (12,531) |
| Distributions | | |
| Net Investment Income | | |
| Institutional Shares | (1,180) | (1,849) |
| ETF Shares | (2,852) | (3,745) |
| Realized Capital Gain | | |
| Institutional Shares | — | — |
| ETF Shares | — | — |
| Total Distributions | (4,032) | (5,594) |
| Capital Share Transactions | | |
| Institutional Shares | 4,363 | 26,850 |
| ETF Shares | 24,349 | 74,049 |
| Net Increase (Decrease) from Capital Share Transactions | 28,712 | 100,899 |
| Total Increase (Decrease) | 40,577 | 82,774 |
| Net Assets | | |
| Beginning of Period | 233,108 | 150,334 |
| End of Period1 | 273,685 | 233,108 |
| 1 Net Assets—End of Period includes undistributed net investment income of $1,179,000 and $1,264,000. | |
See accompanying Notes, which are an integral part of the Financial Statements.
38
| | | |
| Mega Cap 300 Value Index Fund | | | |
| |
| |
| Financial Highlights | | | |
| |
| |
| Institutional Shares | | | |
| | Six Months | Year | March 5, |
| | Ended | Ended | 20081 to |
| | February 28, | Aug. 31, | Aug. 31, |
| For a Share Outstanding Throughout Each Period | 2010 | 2009 | 2008 |
| Net Asset Value, Beginning of Period | $66.02 | $83.69 | $90.01 |
| Investment Operations | | | |
| Net Investment Income | 1.035 | 2.135 | 1.1242 |
| Net Realized and Unrealized Gain (Loss) on Investments | 3.368 | (17.658) | (6.444) |
| Total from Investment Operations | 4.403 | (15.523) | (5.320) |
| Distributions | | | |
| Dividends from Net Investment Income | (1.093) | (2.147) | (1.000) |
| Distributions from Realized Capital Gains | — | — | — |
| Total Distributions | (1.093) | (2.147) | (1.000) |
| Net Asset Value, End of Period | $69.33 | $66.02 | $83.69 |
| |
| Total Return | 6.68% | -18.29% | -5.96% |
| |
| Ratios/Supplemental Data | | | |
| Net Assets, End of Period (Millions) | $78 | $70 | $53 |
| Ratio of Total Expenses to Average Net Assets | 0.11%3 | 0.11% | 0.08%3 |
| Ratio of Net Investment Income to Average Net Assets | 2.90%3 | 3.66% | 3.19%3 |
| Portfolio Turnover Rate4 | 33%3 | 31% | 12% |
1 Inception.
2 Calculated based on average shares outstanding.
3 Annualized.
4 Excludes the value of portfolio securities received or delivered as a result of in-kind purchases or redemptions of the fund’s capital shares,
including ETF Creation Units.
See accompanying Notes, which are an integral part of the Financial Statements.
39
| | | |
| Mega Cap 300 Value Index Fund | | | |
| |
| |
| Financial Highlights | | | |
| |
| |
| ETF Shares | | | |
| | Six Months | Year | Dec. 17, |
| | Ended | Ended | 20071 to |
| | February 28, | Aug. 31, | Aug. 31, |
| For a Share Outstanding Throughout Each Period | 2010 | 2009 | 2008 |
| Net Asset Value, Beginning of Period | $33.29 | $42.21 | $49.38 |
| Investment Operations | | | |
| Net Investment Income | .519 | 1.070 | .8862 |
| Net Realized and Unrealized Gain (Loss) on Investments | 1.700 | (8.915) | (7.560) |
| Total from Investment Operations | 2.219 | (7.845) | (6.674) |
| Distributions | | | |
| Dividends from Net Investment Income | (.549) | (1.075) | (.496) |
| Distributions from Realized Capital Gains | — | — | — |
| Total Distributions | (.549) | (1.075) | (.496) |
| Net Asset Value, End of Period | $34.96 | $33.29 | $42.21 |
| |
| Total Return | 6.68% | -18.32% | -13.56% |
| |
| Ratios/Supplemental Data | | | |
| Net Assets, End of Period (Millions) | $196 | $163 | $97 |
| Ratio of Total Expenses to Average Net Assets | 0.13%3 | 0.13% | 0.13%3 |
| Ratio of Net Investment Income to Average Net Assets | 2.88%3 | 3.64% | 3.14%3 |
| Portfolio Turnover Rate4 | 33%3 | 31% | 12% |
1 Inception.
2 Calculated based on average shares outstanding.
3 Annualized.
4 Excludes the value of portfolio securities received or delivered as a result of in-kind purchases or redemptions of the fund’s capital shares,
including ETF Creation Units.
See accompanying Notes, which are an integral part of the Financial Statements.
40
Mega Cap 300 Value Index Fund
Notes to Financial Statements
Vanguard Mega Cap 300 Value Index Fund is registered under the Investment Company Act of 1940 as an open-end investment company, or mutual fund. The fund offers two classes of shares: Institutional
Shares and ETF Shares. Institutional Shares are designed for investors who meet certain administrative and service criteria and invest a minimum amount of $5 million. ETF Shares are listed for trading on the NYSE Arca, Inc.; they can be purchased and sold through a broker.
A. The following significant accounting policies conform to generally accepted accounting principles for
U.S. mutual funds. The fund consistently follows such policies in preparing its financial statements.
1. Security Valuation: Securities are valued as of the close of trading on the New York Stock Exchange (generally 4 p.m., Eastern time) on the valuation date. Equity securities are valued at the latest quoted sales prices or official closing prices taken from the primary market in which each security trades; such securities not traded on the valuation date are value d at the mean of the latest quoted bid and asked prices. Securities for which market quotations are not re adily available, or whose values have been materially affected by events occurring before the fund’s pricing time but after the close of the securities’ primary markets, are valued by methods deemed by the board of trustees to represent fair value.
2. Federal Income Taxes: The fund intends to continue to qualify as a regulated investment company and distribute all of its taxable income. Management has analyzed the fund’s tax positions taken for all open federal income tax years (August 31, 2008–2009), and for the period ended February 28, 201 0, and has concluded that no prov ision for federal income tax is required in the fund’s financ ial statements.
3. Distributions: Distributions to shareholders are recorded on the ex-dividend date.
4. Security Lending: The fund may lend its securities to qualified institutional borrowers to earn additional income. Security loans are required to be secured at all times by collateral at least equal to the market value of securities loaned. The fund invests cash collateral received in Vanguard Market Liquidity Fund, and records a liability for the return of the collateral, during the period the securities are on loan. Security lending income represents the income earned on investing cash collateral, less expenses associated with the loan.
5. Other: Dividend income is recorded on the ex-dividend date. Security transactions are accounted for on the date securities are bought or sold. Costs used to determine realized gains (losses) on the sale of investment securities are those of the specific securities sold.
Each class of shares has equal rights as to assets and earnings, except that each class separately bears certain class-specific expenses related to maintenance of shareholder accounts (included in Management and Administrative expenses) and shareholder reporting. Marketing an d distribution expenses are alloc ated to each class of shares base d on a method approved by the board of trustees. Income, other non-class-specific expenses, and gains and losses on investments are allocated to each class of shares based on its relative net assets.
B. The Vanguard Group furnishes at cost investment advisory, corporate management, administrative, marketing, and distribution services. The costs of such services are allocated to the fund under methods approved by the board of trustees. The fund has committed to provide up to 0.40% of its net assets in capital contributions to Vanguard. At February 28, 2010, the fund had contributed capital of $54,000 to Vanguard (included in Other Assets), representing 0.02% of the fund’s net assets and 0.02% of
Vanguard’s capitalization. The fund’s trustees and officers are also directors and officers of Vanguard.
41
Mega Cap 300 Value Index Fund
C. The fund’s custodian bank has agreed to reduce its fees when the fund maintains cash on deposit in the non-interest-bearing custody account. For the six months ended February 28, 2010, custodian fee offset arrangements reduced the fund’s expenses by $2,000 (an annual rate of 0.00% of average net assets).
D. Various inputs may be used to determine the value of the fund’s investments. These inputs are summarized in three broad levels for financial statement purposes. The inputs or methodologies used to value securities are not necessarily an indication of the risk associated with investing in those securities.
Level 1—Quoted prices in active markets for identical securities.
Level 2—Other significant observable inputs (including quo ted prices for similar securities, interest rates, prepayment speeds, credit risk, etc.).
Level 3—Significant unobservable inputs (including the fund’s own assumptions used to determine the fair value of investments).
At February 28, 2010, 100% of the fund’s investments were valued based on Level 1 inputs.
E. Distributions are determined on a tax basis and may differ from net investment income and realized capital gains for financial reporting purposes. Differences may be permanent or temporary. Permanent differences are reclassified among capital accounts in the financial statements to reflect their tax character. Temporary differences arise when certain items of income, expense, gain, or loss are recognized in different periods for financial statement and tax purposes; these differences will reverse at some time in the future. Differences in classification may also result from the treatment of shor t-term gains as ordinary income for tax purposes.
During the six months ended February 28, 2010, the fund realized $4,496,000 of net capital gains resulting from in-kind redemptions—in which shareholders exchanged fund shares for securities held by the fund rather than for cash. Because such gains are not taxable to the fund, and are not distributed to shareholders, they have been reclassified from accumulated net realized losses to paid-in capital.
The fund’s tax-basis capital gains and losses are determined only at the end of each fiscal year. For tax purposes, at August 31, 2009, the fund had available capital loss carryforwards totaling $851,000 to offset future net capital gains through August 31, 2017. In addition, the fund realized losses of $19,616,000 during the period from November 1, 2008, through August 31, 2009, which are deferred and will be treated as realized for tax purposes in fiscal 2010. The fund will use these capital losses to offset net taxable capital gains, if any, realized during the year ending August 31, 2010; should the fund realize net capital losses for the year, the losses will be added to the loss carryforward balance above.
At February 28, 2010, the cost of investment securities for tax purposes was $271,518,000. Net unrealized appreciation of investment securities for tax purposes was $1,559,000, consisting of unrealized gains of $19,947,000 on securities that had risen in value since their purchase and $18,388,000 in unrealized losses on securities that had fallen in value since their purchase.
F. During the six months ended February 28, 2010, the fund purchased $82,610,000 of investment securities and sold $54,587,000 of investment securities, other than temporary cash investments.
42
Mega Cap 300 Value Index Fund
| | | | |
| G. Capital share transactions for each class of shares were: | | | |
| | Six Months Ended | | Year Ended |
| | February 28, 2010 | August 31, 2009 |
| | Amount | Shares | Amount | Shares |
| | ($000) | (000) | ($000) | (000) |
| Institutional Shares | | | | |
| Issued | 7,914 | 115 | 32,907 | 536 |
| Issued in Lieu of Cash Distributions | 1,180 | 17 | 1,849 | 31 |
| Redeemed | (4,731) | (69) | (7,906) | (143) |
| Net Increase (Decrease)—Institutional Shares | 4,363 | 63 | 26,850 | 424 |
| ETF Shares | | | | |
| Issued | 41,704 | 1,200 | 123,860 | 4,200 |
| Issued in Lieu of Cash Distributions | — | — | — | — |
| Redeemed | (17,355) | (500) | (49,811) | (1,600) |
| Net Increase (Decrease)—ETF Shares | 24,349 | 700 | 74,049 | 2,600 |
H. In preparing the financial statements as of February 28, 2010, management considered the impact of subsequent events for potential recognition or disclosure in these financial statements.
43
About Your Fund’s Expenses
As a shareholder of the fund, you incur ongoing costs, which include costs for portfolio management, administrative services, and shareholder reports (like this one), among others. Operating expenses, which are deducted from a fund’s gross income, directly reduce the investment return of the fund.
A fund’s expenses are expressed as a percentage of its average net assets. This figure is known as the expense ratio. The following examples are intended to help you understand the ongoing costs (in dollars) of investing in your fund and to compare these costs with those of other mutual funds. The examples are based on an investment of $1,000 made at the beginning of the period shown and held for the entire period.
The accompanying table illustrates your fund’s costs in two ways:
• Based on actual fund return. This section helps you to estimate the actual expenses that you paid over the period. The ”Ending Account Value“ shown is derived from the fund‘s actual return, and the third column shows the dollar amount that would have been paid by an investor who started with $1,000 in the fund. You may use the information here, together with the amount you invested, to estimate the expenses that you paid over the period.
To do so, simply divide your account value by $1,000 (for example, an $8,600 account value divided by $1,000 = 8.6), then multiply the result by the number given for your fund under the heading ”Expenses Paid During Period.“
• Based on hypothetical 5% yearly return. This section is intended to help you compare your fund‘s costs with those of other mutual funds. It assumes that the fund had a yearly return of 5% before expenses, but that the expense ratio is unchanged. In this case—because the return used is not the fund’s actual return—the results do not apply to your investment. The example is useful in making comparisons because the Securities and Exchange Commission requires all mutual funds to calculate expenses based on a 5% return. You can assess your fund’s costs by comparing this hypothetical example with the hypothetical examples that appear in shareholder reports of other funds.
Note that the expenses shown in the table are meant to highlight and help you compare ongoing costs only and do not reflect transaction costs incurred by the fund for buying and selling securities. Further, the expenses do not include the account service fee described in the prospectus. If such a fee were applied to your account, your costs would be higher. Your fund does not charge transaction fees, such as purchase or redemption fees, nor does it carry a “sales load.” The calculations assume no shares were bought or sold during the period. Your actual costs may have been higher or lower, depending on the amount of your investment and the timing of any purchases or redemptions.
You can find more information about the fund’s expenses, including annual expense ratios, in the Financial Statements section of this report. For additional information on operating expenses and other shareholder costs, please refer to your fund’s current prospectus.
44
| | | |
| Six Months Ended February 28, 2010 | | | |
| | Beginning | Ending | Expenses |
| | Account Value | Account Value | Paid During |
| | 8/31/2009 | 2/28/2010 | Period |
| Based on Actual Fund Return | | | |
| Mega Cap 300 Index Fund | | | |
| Institutional Shares | $1,000.00 | $1,087.84 | $0.57 |
| ETF Shares | 1,000.00 | 1,087.54 | 0.67 |
| Mega Cap 300 Growth Index Fund | | | |
| Institutional Shares | $1,000.00 | $1,110.13 | $0.58 |
| ETF Shares | 1,000.00 | 1,110.16 | 0.68 |
| Mega Cap 300 Value Index Fund | | | |
| Institutional Shares | $1,000.00 | $1,066.82 | $0.56 |
| ETF Shares | 1,000.00 | 1,066.85 | 0.67 |
| Based on Hypothetical 5% Yearly Return | | | |
| Mega Cap 300 Index Fund | | | |
| Institutional Shares | $1,000.00 | $1,024.25 | $0.55 |
| ETF Shares | 1,000.00 | 1,024.15 | 0.65 |
| Mega Cap 300 Growth Index Fund | | | |
| Institutional Shares | $1,000.00 | $1,024.25 | $0.55 |
| ETF Shares | 1,000.00 | 1,024.15 | 0.65 |
| Mega Cap 300 Value Index Fund | | | |
| Institutional Shares | $1,000.00 | $1,024.25 | $0.55 |
| ETF Shares | 1,000.00 | 1,024.15 | 0.65 |
The calculations are based on expenses incurred in the most recent six-month period. The funds’ annualized six-month expense ratios for that period are: for the Mega Cap 300 Index Fund, 0.11% for Institutional Shares and 0.13% for ETF Shares; for the Mega Cap 300 Growth Index Fund, 0.11% for Institutional Shares and 0.13% for ETF Shares; and for the Mega Cap 300 Value Index Fund, 0.11% for Institutional Shares and 0.13% for ETF Shares. The dollar amounts shown as “Expenses Paid” are equal to the annualized expense ratio multiplied by the average account value over the period, multiplied by the number of days in the most recent six-month period, then divided by the number of days in the most recent 12-month period.
45
Glossary
30-Day SEC Yield. A fund’s 30-day SEC yield is derived using a formula specified by the U.S. Securities and Exchange Commission. Under the formula, data related to the fund’s security holdings in the previous 30 days are used to calculate the fund’s hypothetical net income for that period, which is then annualized and divided by the fund’s estimated average net assets over the calculation period. For the purposes of this calculation, a security’s income is based on its current market yield to maturity (in the case of bonds) or its projected dividend yield (for stocks). Because the SEC yield represents hypothetical annualized income, it will differ—at times significantly—from the fund’s actual experience. As a result, the fund’s income distributions may be higher or lower than implied by the SEC yield.
Dividend Yield. Dividend income earned by stocks, expressed as a percentage of the aggregate market value (or of net asset value, for a fund). The yield is determined by dividing the amount of the annual dividends by the aggregate value (or net asset value) at the end of the period. For a fund, the dividend yield is based solely on stock holdings and does not include any income produced by other investments.
Earnings Growth Rate. The average annual rate of growth in earnings over the past five years for the stocks now in a fund.
Equity Exposure. A measure that reflects a fund’s investments in stocks and stock futures. Any holdings in short-term reserves are excluded.
Expense Ratio. The percentage of a fund’s average net assets used to pay its annual administrative and advisory expenses. These expenses directly reduce returns to investors.
Foreign Holdings. The percentage of a fund represented by stocks or depositary receipts of companies based outside the United States.
Inception Date. The date on which the assets of a fund (or one of its share classes) are first invested in accordance with the fund’s investment objective. For funds with a subscription period, the inception date is the day after that period ends. Investment performance is measured from the inception date.
Median Market Cap. An indicator of the size of companies in which a fund invests; the midpoint of market capitalization (market price x shares outstanding) of a fund’s stocks, weighted by the proportion of the fund’s assets invested in each stock. Stocks representing half of the fund’s assets have market capitalizations above the median, and the rest are below it.
Price/Book Ratio. The share price of a stock divided by its net worth, or book value, per share. For a fund, the weighted average price/book ratio of the stocks it holds.
Price/Earnings Ratio. The ratio of a stock’s current price to its per-share earnings over the past year. For a fund, the weighted average P/E of the stocks it holds. P/E is an indicator of market expectations about corporate prospects; the higher the P/E, the greater the expectations for a company’s future growth.
Return on Equity. The annual average rate of return generated by a company during the past five years for each dollar of shareholder’s equity (net income divided by shareholder’s equity). For a fund, the weighted average return on equity for the companies whose stocks it holds.
46
Short-Term Reserves. The percentage of a fund invested in highly liquid, short-term securities that can be readily converted to cash.
Turnover Rate. An indication of the fund’s trading activity. Funds with high turnover rates incur higher transaction costs and may be more likely to distribute capital gains (which may be taxable to investors). The turnover rate excludes in-kind transactions, which have minimal impact on costs.
47
The People Who Govern Your Fund
The trustees of your mutual fund are there to see that the fund is operated and managed in your best interests since, as a shareholder, you are a part owner of the fund. Your fund’s trustees also serve on the board of directors of The Vanguard Group, Inc., which is owned by the Vanguard funds and provides services to them on an at-cost basis.
A majority of Vanguard’s board members are independent, meaning that they have no affiliation with Vanguard or the funds they oversee, apart from the sizable personal investments they have made as private individuals. The independent board members have distinguished backgrounds in business, academia, and public service. Each of the trustees and executive officers oversees 161 Vanguard funds.
The following table provides information for each trustee and executive officer of the fund. More information about the trustees is in the Statement of Additional Informatio n, which can be obtained, wit hout charge, by contacting Vanguard at 800-662-7447, or online at www.vanguard.com.
| |
| Interested Trustee1 | Rajiv L. Gupta |
| | Born 1945. Trustee Since December 2001.2 Principal |
| F. William McNabb III | Occupation(s) During the Past Five Years: Chairman |
| Born 1957. Trustee Since July 2009. Chairman of the | and Chief Executive Officer (retired 2009) and |
| Board. Principal Occupation(s) During the Past Five | President (2006–2008) of Rohm and Haas Co. |
| Years: Chairman of the Board of The Vanguard Group, | (chemicals); Board Member of American Chemistry |
| Inc., and of each of the investment companies served | Council; Director of Tyco International, Ltd. (diversified |
| by The Vanguard Group, since January 2010; Director | manufacturing and services) and Hewlett-Packard Co. |
| of The Vanguard Group since 2008; Chief Executive | (electronic computer manufacturing); Trustee of The |
| Officer and President of The Vanguard Group and of | Conference Board. |
| each of the investment companies served by The | |
| Vanguard Group since 2008; Director of Vanguard | Amy Gutmann |
| Marketing Corporation; Managing Director of The | Born 1949. Trustee Since June 2006. Principal |
| Vanguard Group (1995–2008). | Occupation(s) During the Past Five Years: President |
| | of the University of Pennsylvania; Christopher H. |
| | Browne Distinguished Professor of Political Science |
| Independent Trustees | in the School of Arts and Sciences with secondary |
| | appointments at the Annenberg School for Commu- |
| Emerson U. Fullwood | nication and the Graduate School of Education of |
| Born 1948. Trustee Since January 2008. Principal | the University of Pennsylvania; Director of Carnegie |
| Occupation(s) During the Past Five Years: Executive | Corporation of New York, Schuylkill River Development |
| Chief Staff and Marketing Officer for North America | Corporation, and Greater Philadelphia Chamber of |
| and Corporate Vice President (retired 2008) of Xerox | Commerce; Trustee of the National Constitution Center. |
| Corporation (documen t management products and | |
| services); Director of SPX Corporation (multi-industry | |
| manufacturing), the United Way of Rochester, the | |
| Boy Scouts of America, Amerigroup Corporation | |
| (managed health care), and Monroe Community | |
| College Foundation. | |
| | |
| JoAnn Heffernan Heisen | Executive Officers | |
| Born 1950. Trustee Since July 1998. Principal | | |
| Occupation(s) During the Past Five Years: Corporate | Thomas J. Higgins | |
| Vice President and Chief Global Diversity Officer since | Born 1957. Chief Financial Officer Since September |
| 2006 (retired 2008) and Member of the Executive | 2008. Principal Occupation(s) During the Past Five |
| Committee (retired 2008) of Johnson & Johnson | Years: Principal of The Vanguard Group, Inc.; Chief |
| (pharmaceuticals/consumer products); Vice President | Financial Officer of each of the investment companies |
| and Chief Information Officer of Johnson & Johnson | served by The Vanguard Group since 2008; Treasurer |
| (1997–2005); Director of the University Medical Center | of each of the investment companies served by The |
| at Princeton and Women’s Research and Education | Vanguard Group (1998–2008). |
| Institute; Member of the Advisory Board of the | | |
| Maxwell School of Citizenship and Public Affairs | Kathryn J. Hyatt | |
| at Syracuse University. | Born 1955. Treasurer Since November 2008. Principal |
| | Occupation(s) During the Past Five Years: Principal |
| F. Joseph Loughrey | of The Vanguard Group, Inc.; Treasurer of each of |
| Born 1949. Trustee Since October 2009. Principal | the investment companies served by The Vanguard |
| Occupation(s) During the Past Five Years: President | Group since 2008; Assistant Treasurer of each of the |
| and Chief Operating Officer since 2005 (retired 2009) | investment companies served by The Vanguard Group |
| and Vice Chairman of the Board (2008–2009) of | (1988–2008). | |
| Cummins Inc. (industrial machinery); Director of | | |
| SKF AB (industrial machinery), Hillenbrand, Inc. | Heidi Stam | |
| (specialized consumer services), Sauer-Danfoss Inc. | Born 1956. Secretary Since July 2005. Principal |
| (machinery), the Lumina Foundation for Education, | Occupation(s) During the Past Five Years: Managing |
| and the Columbus Community Education Coalition; | Director of The Vanguard Group, Inc., since 2006; |
| Chairman of the Advisory Council for the College of | General Counsel of The Vanguard Group since 2005; |
| Arts and Letters at the University of Notre Dame. | Secretary of The Vanguard Group and of each of the |
| | investment companies served by The Vanguard Group |
| André F. Perold | since 2005; Director and Senior Vice President of |
| Born 1952. Trustee Since December 2004. Principal | Vanguard Marketing Corporation since 2005; |
| Occupation(s) During the Past Five Years: George | Principal of The Vanguard Group (1997–2006). |
| Gund Professor of Finance and Banking at the Harvard | | |
| Business School; Chair of the Investment Committee | | |
| of HighVista Strategies LLC (private investment firm). | Vanguard Senior Management Team |
| |
| Alfred M. Rankin, Jr. | R. Gregory Barton | Michael S. Miller |
| Born 1941. Trustee Since January 1993. Principal | Mortimer J. Buckley | James M. Norris |
| Occupation(s) During the Past Five Years: Chairman, | Kathleen C. Gubanich | Glenn W. Reed |
| President, and Chief Executive Officer of NACCO | Paul A. Heller | George U. Sauter |
| Industries, Inc. (forklift trucks/housewares/lignite); | | |
| Director of Goodrich Corporation (industrial products/ | | |
| aircraft systems and services); Deputy Chairman | Chairman Emeritus and Senior Advisor |
| of the Federal Reserve Bank of Cleveland; Trustee | | |
| of University Hospitals of Cleveland, The Cleveland | John J. Brennan | |
| Museum of Art, and Case Western Reserve University. | Chairman, 1996–2009 | |
| | Chief Executive Officer and President, 1996–2008 |
| Peter F. Volanakis | | |
| Born 1955. Trustee Since July 2009. Principal | | |
| Occupation(s) During the Past Five Years: President | Founder | |
| since 2007 and Chief Operating Officer since 2005 | | |
| of Corning Incorporated (communications equipment); | John C. Bogle | |
| President of Corning Technologies (2001–2005); | Chairman and Chief Executive Officer, 1974–1996 |
| Director of Corning Incorporated and Dow Corning; | | |
| Trustee of the Corning Incorporated Foundation and | | |
| the Corning Museum of Glass; Overseer of the | | |
| Amos Tuck School of Business Administration at | | |
| Dartmouth College. | | |
1 Mr. McNabb is considered an “interested person,” as defined in the Investment Company Act of 1940, because he is an officer of the Vanguard funds.
2 December 2002 for Vanguard Equity Income Fund, Vanguard Growth Equity Fund, the Vanguard Municipal Bond Funds, and the Vanguard State Tax-Exempt Funds.
| |
|  |
| P.O. Box 2600 |
| Valley Forge, PA 19482-2600 |
Connect with Vanguard® > www.vanguard.com
| Fund Information > 800-662-7447 | The funds or securities referred to herein are not |
| sponsored, endorsed, or promoted by MSCI, and MSCI |
| Direct Investor Account Services > 800-662-2739 | bears no liability with respect to any such funds or |
| | securities. For any such funds or securities, the |
| Institutional Investor Services > 800-523-1036 | prospectus or the Statement of Additional Information |
| contains a more detailed description of the limited |
| Text Telephone for People | relationship MSCI has with The Vanguard Group and |
| With Hearing Impairment > 800-749-7273 | any related funds. |
| | |
| This material may be used in conjunction | |
| with the offering of shares of any Vanguard | |
| fund only if preceded or accompanied by | |
| the fund’s current prospectus. | |
| |
| All comparative mutual fund data are from Lipper Inc. or | |
| Morningstar, Inc., unless otherwise noted. | |
| |
| You can obtain a free copy of Vanguard’s proxy voting | |
| guidelines by visiting our website, www.vanguard.com, | |
| and searching for “proxy voting guidelines,” or by calling | |
| Vanguard at 800-662-2739. The guidelines are also | |
| available from the SEC’s website, www.sec.gov. In | |
| addition, you may obtain a free report on how your fund | |
| voted the proxies for securities it owned during the 12 | |
| months ended June 30. To get the report, visit either | |
| www.vanguard.com or www.sec.gov. | |
| |
| You can review and copy information about your fund at | |
| the SEC’s Public Reference Room in Washington, D.C. To | |
| find out more about this public service, call the SEC at | |
| 202-551-8090. Information about your fund is also | |
| available on the SEC’s website, and you can receive | |
| copies of this information, for a fee, by sending a | |
| request in either of two ways: via e-mail addressed to | |
| publicinfo@sec.gov or via regular mail addressed to the | |
| Public Reference Section, Securities and Exchange | |
| Commission, Washington, DC 20549-1520. | |
| © 2010 The Vanguard Group, Inc. |
| All rights reserved. |
| Vanguard Marketing Corporation, Distributor. |
 | |
| Q8282 042010 |
Item 2: Not Applicable.
Item 3: Not Applicable.
Item 4: Not Applicable.
Item 5: Not Applicable.
Item 6: Not Applicable.
Item 7: Not Applicable.
Item 8: Not Applicable.
Item 9: Not Applicable.
Item 10: Not Applicable.
Item 11: Controls and Procedures.
(a) Disclosure Controls and Procedures. The Principal Executive and Financial Officers concluded that the Registrant's Disclosure Controls and Procedures are effective based on their evaluation of the Disclosure Controls and Procedures as of a date within 90 days of the filing date of this report.
(b) Internal Control Over Financial Reporting. There were no significant changes in Registrant’s Internal Control Over Financial Reporting or in other factors that could significantly affect this control subsequent to the date of the evaluation, including any corrective actions with regard to significant deficiencies and material weaknesses.
Item 12: Exhibits.
(a) Code of Ethics.
(b) Certifications.
Pursuant to the requirements of the Securities Exchange Act of 1934 and the Investment Company Act of 1940, the registrant has duly caused this report to be signed on its behalf by the undersigned, thereunto duly authorized.
| |
| | VANGUARD WORLD FUNDS |
| |
| By: | /s/ F. WILLIAM MCNABB III* |
| | F. WILLIAM MCNABB III |
| | CHIEF EXECUTIVE OFFICER |
| |
| Date: April 15, 2010 |
Pursuant to the requirements of the Securities Exchange Act of 1934 and the Investment Company Act of 1940, this report has been signed below by the following persons on behalf of the registrant and in the capacities and on the dates indicated.
| |
| | VANGUARD WORLD FUNDS |
| |
| By: | /s/ F. WILLIAM MCNABB III* |
| | F. WILLIAM MCNABB III |
| | CHIEF EXECUTIVE OFFICER |
| |
| Date: April 15, 2010 |
| |
| | VANGUARD WORLD FUNDS |
| |
| By: | /s/ THOMAS J. HIGGINS* |
| | THOMAS J. HIGGINS |
| | CHIEF FINANCIAL OFFICER |
| |
| Date: April 15, 2010 |
*By: /s/ Heidi Stam
Heidi Stam, pursuant to a Power of Attorney filed on July 24, 2009, see File Number 2-88373,
and a Power of Attorney filed on October 16, 2009, see File Number 2-52698,
both Incorporated by Reference.