| | | UNITED STATES | | |
| SECURITIES AND EXCHANGE COMMISSION |
| | | Washington, D.C. 20549 | | |
| |
| |
| | | FORM N-CSR | | |
| |
| CERTIFIED SHAREHOLDER REPORT OF REGISTERED MANAGEMENT |
| INVESTMENT COMPANIES |
| |
| Investment Company Act file number | | 811-524 | | |
| |
| The Dreyfus/Laurel Funds Trust |
| (Exact name of Registrant as specified in charter) |
| |
| c/o The Dreyfus Corporation |
| 200 Park Avenue |
| New York, New York 10166 |
| (Address of principal executive offices) (Zip code) |
| | | |
| Michael A. Rosenberg, Esq. |
| 200 Park Avenue |
| New York, New York 10166 |
| (Name and address of agent for service) |
| |
| Registrant's telephone number, including area code: | | (212) 922-6000 |
| Date of fiscal year end: | | 12/31 | | |
| Date of reporting period: | | 12/31/2008 | | |
The following N-CSR relates only to the Registrant’s series listed below and does not affect the other series of the Registrant, which have different fiscal year ends and, therefore, different N-CSR reporting requirements. Separate N-CSR Forms will be filed for these series, as appropriate.
Dreyfus Core Value Fund
Dreyfus Limited Term High Yield Fund |
| Item 1. Reports to Stockholders. |
| | ANNUAL REPORT December 31, 2008 |

Save time. Save paper. View your next shareholder report online as soon as it’s available. Log into www.dreyfus.com and sign up for Dreyfus eCommunications. It’s simple and only takes a few minutes.
The views expressed in this report reflect those of the portfolio manager only through the end of the period covered and do not necessarily represent the views of Dreyfus or any other person in the Dreyfus organization. Any such views are subject to change at any time based upon market or other conditions and Dreyfus disclaims any responsibility to update such views.These views may not be relied on as investment advice and, because investment decisions for a Dreyfus fund are based on numerous factors, may not be relied on as an indication of trading intent on behalf of any Dreyfus fund.

| | Contents |
| |
| | THE FUND |
| |
| 2 | A Letter from the CEO |
| |
| 3 | Discussion of Fund Performance |
| |
| 6 | Fund Performance |
| |
| 8 | Understanding Your Fund’s Expenses |
| |
| 8 | Comparing Your Fund’s Expenses With Those of Other Funds |
| |
| 9 | Statement of Investments |
| |
| 13 | Statement of Assets and Liabilities |
| |
| 14 | Statement of Operations |
| |
| 15 | Statement of Changes in Net Assets |
| |
| 18 | Financial Highlights |
| |
| 24 | Notes to Financial Statements |
| |
| 35 | Report of Independent Registered Public Accounting Firm |
| |
| 36 | Important Tax Information |
| |
| 37 | Board Members Information |
| |
| 39 | Officers of the Fund |
| |
| | FOR MORE INFORMATION |
| |
| | Back Cover |
| |

A LETTER FROM THE CEO
Dear Shareholder: |
We present to you this annual report for Dreyfus Core Value Fund, covering the 12-month period from January 1, 2008, through December 31, 2008.
2008 was the most difficult year in decades for the economy and stock market.A credit crunch that originated in 2007 in the U.S. sub-prime mortgage market exploded in mid-2008 into a global financial crisis, resulting in the failures of major financial institutions, a deep and prolonged recession and lower investment values across a broad range of asset classes. Governments and regulators throughout the world moved aggressively to curtail the damage, implementing unprecedented reductions of short-term interest rates, massive injections of liquidity into the banking system, government bailouts of struggling companies and plans for massive economic stimulus programs.
Although we expect the U.S. and global economies to remain weak until longstanding imbalances have worked their way out of the system, the financial markets currently appear to have priced in investors’ generally low expectations. In previous recessions, however, the markets have tended to anticipate economic improvement before it occurs, potentially leading to major rallies when few expected them. That’s why it makes sense to remain disciplined, maintain a long-term perspective and adopt a consistent asset allocation strategy that reflects one’s future goals and attitudes toward risk. As always, we urge you to consult with your financial advisor, who can recommend the course of action that is right for you.
For information about how the fund performed during the reporting period, as well as market perspectives, we have provided a Discussion of Fund Performance given by the fund’s Portfolio Manager.
Thank you for your continued confidence and support.
Jonathan R. Baum
Chief Executive Officer
The Dreyfus Corporation |

DISCUSSION OF FUND PERFORMANCE
For the period of January 1, 2008, through December 31, 2008, as provided by Brian Ferguson, Portfolio Manager
Fund and Market Performance Overview
For the 12-month period ended December 31, 2008, Dreyfus Core Value Fund’s Class A shares produced a total return of –36.10%, Class B shares returned –36.62%, Class C shares returned –36.59%, Class I shares returned –35.93%, Class T shares returned –36.27% and Institutional shares returned –36.05% .1 In comparison, the fund’s benchmark, the Russell 1000 Value Index (the “Index”), produced a total return of –36.85% for the same period.2
Stocks fell sharply in 2008, particularly over the second half of the year amid a worsening economic recession and an intensifying global financial crisis. The market decline was broad-based, adversely affecting both growth-oriented stocks and value-oriented stocks in which the fund primarily invests.The fund produced modestly higher returns than the Index, primarily due to relatively favorable stock selections in the traditionally defensive consumer staples and health care sectors.
The Fund’s Investment Approach
The fund invests primarily in large-cap companies that are considered undervalued based on traditional measures, such as price-to-earnings ratios. When choosing stocks, we use a “bottom-up” stock selection approach, focusing on individual companies, rather than a “top-down” approach that forecasts market trends. We also focus on a company’s relative value, financial strength, business momentum and likely catalysts that could ignite the stock price.
Extreme Volatility Roiled the Financial Markets
After slumping relatively modestly in the first half of 2008, stocks tumbled over the second half, producing the most severe losses during a single calendar year since the 1930s.The bear market was triggered by an intensifying credit crisis that mushroomed in September 2008 with the failures of several major financial institutions.These developments
The Fund 3
| DISCUSSION OF FUND PERFORMANCE (continued) |
exacerbated an ongoing economic slowdown, as lenders grew reluctant to extend credit even to some of their most trusted customers, causing consumer spending and business investment to decline sharply. In turn, reduced demand caused commodity prices to retreat from previous record levels. In late November, faced with falling home prices and rising unemployment, the National Bureau of Economic Research confirmed that the U.S. economy was mired in its first recession since 2001.
The financial crisis was particularly hard on stocks in the financials sector, which posted greater losses, on average, than any of the Index’s other economic sectors. Conversely, traditionally defensive areas, such as the health care and consumer staples sectors, generally posted milder losses. None of the economic sectors represented in the Index posted a positive absolute return in 2008.
Defensive Posture Helped Cushion Losses
When it became clear to us that even attractively valued stocks were unlikely to advance in this challenging market environment, we adopted a more defensive investment posture during the reporting period, emphasizing individual companies that we believed would be better able to withstand the downturn. Our bottom-up security selection process led us to a number of opportunities in the consumer staples sector, with companies that produce goods and services that remain in demand regardless of economic conditions. For example, beverages producer Molson Coors Brewing benefited from stable customer demand and efficiencies achieved through the merger of two venerable brands. Retail giantWal-Mart Stores held up relatively well as cash-strapped consumers increasingly sought low-cost goods.
Although the information technology sector was among the harder hit areas of the Index, our defensive positioning helped the fund avoid some of the more severely affected stocks, such as wireless handset maker Motorola. Instead, the fund achieved better relative performance through service-oriented technology companies with low levels of debt, including Accenture, which appeared inexpensively valued, and Automatic Data Processing, which held up well due to the steady and recurring nature of its revenues. Our stock selection strategy also proved
4
effective in the economically sensitive consumer discretionary sector, where discount apparel retail holding company TJX Cos. and restaurant chain McDonald’s benefited from consumers’ renewed preferences for lower priced clothing and dining, respectively. Our position in TJX was sold during the reporting period.
Although the fund’s individual stock selections in the health care sector generally performed in line with market averages, modestly underweighted exposure to the better-performing sector detracted from the fund’s relative performance. Our stock selection was less favorable in the materials sector, where chemicals producer Celanese and metals-and-mining giant Freeport-McMoRan Copper & Gold fell sharply along with commodity prices during the second half of the reporting period. We subsequently eliminated the fund’s position in Celanese, but retained a position in Freeport-McMoRan Copper & Gold.
Maintaining a Cautious Approach
As of year-end, the financial crisis has persisted and the economy has continued to weaken. However, it appears to us that generally low expectations for 2009 may be reflected in some stock prices, and any positive surprises could spark a rally. In addition, the benefits of lower energy prices and an expected stimulus package from the U.S. government could boost demand for a variety of products, particularly lower-priced goods and services. We have maintained the fund’s defensive posture and emphasize attractively valued,domestically-focused companies with strong balance sheets that we believe are likely to weather the current storm and participate in an eventual recovery.
January 15, 2009
| 1 | Total return includes reinvestment of dividends and any capital gains paid, and does not take into consideration the maximum initial sales charges in the case of Class A and Class T shares or the applicable contingent deferred sales charges imposed on redemptions in the case of Class B and Class C shares. Had these charges been reflected, returns would have been lower. Past performance is no guarantee of future results. Share price and investment return fluctuate such that upon redemption, fund shares may be worth more or less than their original cost. |
| |
| 2 | SOURCE: LIPPER INC. — Reflects the reinvestment of dividends and, where applicable, capital gain distributions.The Russell 1000 Value Index is an unmanaged index, which measures the performance of those Russell 1000 companies with lower price-to-book ratios and lower forecasted growth values. |
| |
The Fund 5
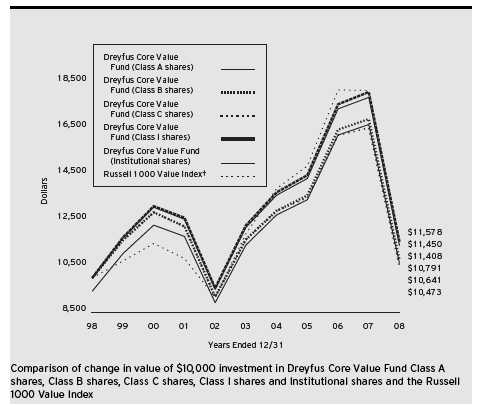
| † Source: Lipper Inc. |
| Past performance is not predictive of future performance. |
| The above graph compares a $10,000 investment made in Class A shares, Class B shares, Class C shares, Institutional |
| shares and Class I shares of Dreyfus Core Value Fund on 12/31/98 to a $10,000 investment made in the Russell |
| 1000 Value Index (the “Index”) on that date. All dividends and capital gain distributions are reinvested. Performance for |
| Class T shares will vary from the performance of Class A, Class B, Class C, Institutional and Class I shares shown |
| above due to differences in charges and expenses. |
| The fund’s performance shown in the line graph takes into account the maximum initial sales charge on Class A shares |
| and all other applicable fees and expenses for Class A shares, Class B shares, Class C shares, Institutional shares and |
| Class I shares.The Index is an unmanaged index, which measures the performance of those Russell 1000 companies |
| with lower price-to-book ratios and lower forecasted growth values. Unlike a mutual fund, the Index is not subject to |
| charges, fees and other expenses. Investors cannot invest directly in any index. Further information relating to fund |
| performance, including expense reimbursements, if applicable, is contained in the Financial Highlights section of the |
| prospectus and elsewhere in this report. |
6
| Average Annual Total Returns as of 12/31/08 | | | | | | |
| |
| Inception |
| | | Date | | 1 Year | | 5 Years | | 10 Years |
| |
| |
| |
| |
|
| Class A shares | | | | | | | | |
| with maximum sales charge (5.75%) | | | | (39.77)% | | (2.58)% | | 0.62% |
| without sales charge | | | | (36.10)% | | (1.42)% | | 1.22% |
| Class B shares | | | | | | | | |
| with applicable redemption charge † | | | | (39.13)% | | (2.44)% | | 0.76% |
| without redemption | | | | (36.62)% | | (2.14)% | | 0.76% |
| Class C shares | | | | | | | | |
| with applicable redemption charge †† | | | | (37.22)% | | (2.15)% | | 0.46% |
| without redemption | | | | (36.59)% | | (2.15)% | | 0.46% |
| Class I shares | | | | (35.93)% | | (1.17)% | | 1.48% |
| Class T shares | | | | | | | | |
| with applicable sales charge (4.5%) | | 8/16/99 | | (39.14)% | | (2.57)% | | 0.51%††† |
| without sales charge | | 8/16/99 | | (36.27)% | | (1.67)% | | 0.98%††† |
| Institutional shares | | | | (36.05)% | | (1.32)% | | 1.33% |
Past performance is not predictive of future performance.The fund’s performance shown in the graph and table does not reflect the deduction of taxes that a shareholder would pay on fund distributions or the redemption of fund shares. Performance for Class B shares assumes the conversion of Class B shares to Class A shares at the end of the sixth year following the date of purchase.
| † The maximum contingent deferred sales charge for Class B shares is 4%. After six years Class B shares convert to |
| Class A shares. |
| †† | | The maximum contingent deferred sales charge for Class C shares is 1% for shares redeemed within one year of the |
| | | date of purchase. |
| ††† | | The total return performance figures presented for Class T shares of the fund reflect the performance of the fund’s |
| | | Class A shares for periods prior to 8/16/99 (the inception date for Class T shares), adjusted to reflect the |
| | | applicable sales load for that class and the applicable distribution/servicing fees thereafter. |
The Fund 7
UNDERSTANDING YOUR FUND’S EXPENSES (Unaudited)
As a mutual fund investor, you pay ongoing expenses, such as management fees and other expenses Using the information below, you can estimate how these expenses affect your investment and compare them with the expenses of other funds.You also may pay one-time transaction expenses, including sales charges (loads) and redemption fees, which are not shown in this section and would have resulted in higher total expenses. For more information, see your fund’s prospectus or talk to your financial adviser
Review your fund’s expenses
The table below shows the expenses you would have paid on a $1,000 investment in Dreyfus Core Value Fund from July 1, 2008 to December 31, 2008. It also shows how much a $1,000 investment would be worth at the close of the period, assuming actual returns and expenses.
| | Expenses and Value of a $1,000 Investment
assuming actual returns for the six months ended December 31, 2008 |
| | | Class A | | Class B | | Class C | | Class I | | Class T | | Institutional |
| |
| |
| |
| |
| |
| |
|
| Expenses paid | | | | | | | | | | | | |
| per $1,000† | | $ 4.98 | | $ 8.21 | | $ 8.21 | | $ 3.90 | | $ 6.05 | | $ 4.54 |
| Ending value | | | | | | | | | | | | |
| (after expenses) | | $721.40 | | $718.50 | | $718.70 | | $722.10 | | $720.40 | | $721.90 |
COMPARING YOUR FUND’S EXPENSES
WITH THOSE OF OTHER FUNDS (Unaudited) |
Using the SEC’s method to compare expenses
The Securities and Exchange Commission (SEC) has established guidelines to help investors assess fund expenses. Per these guidelines, the table below shows your fund’s expenses based on a $1,000 investment, assuming a hypothetical 5% annualized return. You can use this information to compare the ongoing expenses (but not transaction expenses or total cost) of investing in the fund with those of other funds.All mutual fund shareholder reports will provide this information to help you make this comparison. Please note that you cannot use this information to estimate your actual ending account balance and expenses paid during the period.
| | Expenses and Value of a $1,000 Investment
assuming a hypothetical 5% annualized return for the six months ended December 31, 2008 |
| | | Class A | | Class B | | Class C | | Class I | | Class T | | Institutional |
| |
| |
| |
| |
| |
| |
|
| Expenses paid | | | | | | | | | | | | |
| per $1,000† | | $ 5.84 | | $ 9.63 | | $ 9.63 | | $ 4.57 | | $ 7.10 | | $ 5.33 |
| Ending value | | | | | | | | | | | | |
| (after expenses) | | $1,019.36 | | $1,015.58 | | $1,015.58 | | $1,020.61 | | $1,018.10 | | $1,019.86 |
| † Expenses are equal to the fund’s annualized expense ratio of 1.15% for Class A, 1.90% for Class B, 1.90% for |
| Class C, .90% for Class I, 1.40% for Class T and 1.05% for Institutional multiplied by the average account value |
| over the period, multiplied by 184/366 (to reflect the one-half year period). |
8
STATEMENT OF INVESTMENTS
December 31, 2008 |
| Common Stocks—98.9% | | Shares | | Value ($) |
| |
| |
|
| Consumer Discretionary—8.0% | | | | |
| Carnival | | 93,060 | | 2,263,219 |
| Gap | | 123,350 | | 1,651,657 |
| Home Depot | | 222,720 | | 5,127,014 |
| Johnson Controls | | 87,400 | | 1,587,184 |
| Lowe’s Cos. | | 103,710 | | 2,231,839 |
| McDonald’s | | 26,570 | | 1,652,388 |
| News, Cl. A | | 451,320 | | 4,102,499 |
| Omnicom Group | | 106,750 | | 2,873,710 |
| Time Warner | | 408,440 | | 4,108,906 |
| Toll Brothers | | 71,750 a | | 1,537,603 |
| | | | | 27,136,019 |
| Consumer Staples—13.1% | | | | |
| Cadbury, ADR | | 74,428 | | 2,654,847 |
| Colgate-Palmolive | | 39,820 | | 2,729,263 |
| CVS Caremark | | 136,490 | | 3,922,723 |
| Estee Lauder, Cl. A | | 59,090 | | 1,829,426 |
| Kraft Foods, Cl. A | | 245,554 | | 6,593,125 |
| Molson Coors Brewing, Cl. B | | 74,680 | | 3,653,346 |
| PepsiCo | | 70,270 | | 3,848,688 |
| Philip Morris International | | 163,690 | | 7,122,152 |
| Procter & Gamble | | 74,940 | | 4,632,791 |
| Wal-Mart Stores | | 108,890 | | 6,104,373 |
| Walgreen | | 69,250 | | 1,708,398 |
| | | | | 44,799,132 |
| Energy—15.6% | | | | |
| Anadarko Petroleum | | 32,980 | | 1,271,379 |
| Chevron | | 208,950 | | 15,456,032 |
| Devon Energy | | 36,480 | | 2,397,101 |
| EOG Resources | | 21,960 | | 1,462,097 |
| Exxon Mobil | | 206,502 | | 16,485,055 |
| Hess | | 32,600 | | 1,748,664 |
| Marathon Oil | | 80,860 | | 2,212,330 |
| Occidental Petroleum | | 96,300 | | 5,777,037 |
| Schlumberger | | 34,840 | | 1,474,777 |
| XTO Energy | | 137,860 | | 4,862,322 |
| | | | | 53,146,794 |
The Fund 9
| STATEMENT OF INVESTMENTS (continued) |
| Common Stocks (continued) | | Shares | | Value ($) |
| |
| |
|
| Financial—22.3% | | | | |
| ACE | | 64,630 | | 3,420,220 |
| Aflac | | 42,330 | | 1,940,407 |
| Ameriprise Financial | | 47,940 | | 1,119,878 |
| AON | | 104,000 | | 4,750,720 |
| Bank of America | | 463,436 | | 6,525,179 |
| Capital One Financial | | 41,080 b | | 1,310,041 |
| Chubb | | 83,080 | | 4,237,080 |
| Fifth Third Bancorp | | 140,750 b | | 1,162,595 |
| Franklin Resources | | 68,530 | | 4,370,843 |
| Goldman Sachs Group | | 27,470 | | 2,318,193 |
| JPMorgan Chase & Co. | | 423,410 | | 13,350,117 |
| Marsh & McLennan Cos. | | 70,870 | | 1,720,015 |
| MetLife | | 165,550 b | | 5,771,073 |
| Moody’s | | 64,700 b | | 1,299,823 |
| Northern Trust | | 59,360 | | 3,095,030 |
| PNC Financial Services Group | | 107,660 | | 5,275,340 |
| Prudential Financial | | 29,000 | | 877,540 |
| T. Rowe Price Group | | 51,790 b | | 1,835,438 |
| U.S. Bancorp | | 150,110 | | 3,754,251 |
| Wells Fargo & Co. | | 270,930 | | 7,987,016 |
| | | | | 76,120,799 |
| Health Care—11.5% | | | | |
| Abbott Laboratories | | 153,320 | | 8,182,688 |
| Amgen | | 102,570 a | | 5,923,418 |
| Baxter International | | 29,970 | | 1,606,092 |
| Covidien | | 65,110 | | 2,359,586 |
| Merck & Co. | | 117,020 | | 3,557,408 |
| Pfizer | | 453,560 | | 8,032,548 |
| Thermo Fisher Scientific | | 39,600 a | | 1,349,172 |
| Wyeth | | 221,880 | | 8,322,719 |
| | | | | 39,333,631 |
| Industrial—9.2% | | | | |
| Dover | | 53,330 | | 1,755,624 |
| Eaton | | 43,120 | | 2,143,495 |
| General Electric | | 690,010 | | 11,178,162 |
| Honeywell International | | 52,030 | | 1,708,145 |
| Lockheed Martin | | 46,380 | | 3,899,630 |
10
| Common Stocks (continued) | | Shares | | Value ($) |
| |
| |
|
| Industrial (continued) | | | | |
| Raytheon | | 52,400 | | 2,674,496 |
| Tyco International | | 40,020 | | 864,432 |
| Union Pacific | | 46,090 | | 2,203,102 |
| Waste Management | | 147,520 b | | 4,888,813 |
| | | | | 31,315,899 |
| Information Technology—5.7% | | | | |
| Accenture, Cl. A | | 90,280 | | 2,960,281 |
| Automatic Data Processing | | 45,430 | | 1,787,216 |
| Cisco Systems | | 259,120 a | | 4,223,656 |
| Hewlett-Packard | | 34,920 | | 1,267,247 |
| Intel | | 118,710 | | 1,740,289 |
| International Business Machines | | 20,650 | | 1,737,904 |
| Microsoft | | 90,920 | | 1,767,485 |
| Nokia, ADR | | 137,080 | | 2,138,448 |
| QUALCOMM | | 49,140 | | 1,760,686 |
| | | | | 19,383,212 |
| Materials—1.8% | | | | |
| Air Products & Chemicals | | 31,700 | | 1,593,559 |
| Dow Chemical | | 87,840 | | 1,325,506 |
| Freeport-McMoRan Copper & Gold | | 74,080 | | 1,810,515 |
| International Paper | | 130,840 | | 1,543,912 |
| | | | | 6,273,492 |
| Telecommunications—4.9% | | | | |
| AT & T | | 439,755 | | 12,533,017 |
| Verizon Communications | | 127,100 | | 4,308,690 |
| | | | | 16,841,707 |
| Utilities—6.8% | | | | |
| Entergy | | 66,260 | | 5,508,194 |
| Exelon | | 100,825 | | 5,606,878 |
| FPL Group | | 33,610 | | 1,691,591 |
| NRG Energy | | 78,360 a,b | | 1,828,139 |
| PG & E | | 46,110 | | 1,784,918 |
| Questar | | 105,370 | | 3,444,545 |
| Southern | | 92,380 | | 3,418,060 |
| | | | | 23,282,325 |
| Total Common Stocks | | | | |
| (cost $397,561,851) | | | | 337,633,010 |
The Fund 11
| STATEMENT OF INVESTMENTS (continued) |
| Other Investment—.0% | | Shares | | Value ($) |
| |
| |
|
| Registered Investment Company; | | | | |
| Dreyfus Institutional Preferred | | | | |
| Plus Money Market Fund | | | | |
| (cost $151,000) | | 151,000 c | | 151,000 |
| |
| |
|
| |
| Investment of Cash Collateral | | | | |
| for Securities Loaned—3.6% | | | | |
| |
| |
|
| Registered Investment Company; | | | | |
| Dreyfus Institutional Cash Advantage Fund | | | | |
| (cost $12,178,153) | | 12,178,153 c | | 12,178,153 |
| |
| |
|
| |
| Total Investments (cost $409,891,004) | | 102.5% | | 349,962,163 |
| Liabilities, Less Cash and Receivables | | (2.5%) | | (8,659,580) |
| Net Assets | | 100.0% | | 341,302,583 |
| ADR—American Depository Receipts |
| a | Non-income producing security. |
| |
| b | All or a portion of these securities are on loan. At December 31, 2008, the total market value of the fund’s securities on loan is $12,019,438 and the total market value of the collateral held by the fund is $12,178,153. |
| |
| c | Investment in affiliated money market mutual fund. |
| |
| Portfolio Summary (Unaudited)† | | | | |
| |
| | | Value (%) | | | | Value (%) |
| |
| |
| |
|
| Financial | | 22.3 | | Utilities | | 6.8 |
| Energy | | 15.6 | | Information Technology | | 5.7 |
| Consumer Staples | | 13.1 | | Telecommunications | | 4.9 |
| Health Care | | 11.5 | | Money Market Investments | | 3.6 |
| Industrial | | 9.2 | | Materials | | 1.8 |
| Consumer Discretionary | | 8.0 | | | | 102.5 |
| |
| † Based on net assets. | | | | | | |
| See notes to financial statements. | | | | | | |
12
| | STATEMENT OF ASSETS AND LIABILITIES
December 31, 2008 |
| | | Cost | | Value |
| |
| |
|
| Assets ($): | | | | |
| Investments in securities—See Statement of Investments (including | | | | |
| securities on loan, valued at $12,019,438)—Note 1(b): | | | | |
| Unaffiliated issuers | | 397,561,851 | | 337,633,010 |
| Affiliated issuers | | 12,329,153 | | 12,329,153 |
| Receivable for investment securities sold | | | | 4,302,016 |
| Dividends and interest receivable | | | | 824,851 |
| Receivable for shares of Beneficial Interest subscribed | | | | 30,786 |
| Prepaid expenses | | | | 13,281 |
| | | | | 355,133,097 |
| |
| |
|
| Liabilities ($): | | | | |
| Due to The Dreyfus Corporation and affiliates—Note 3(b) | | | | 342,404 |
| Cash overdraft due to Custodian | | | | 179,615 |
| Liability for securities on loan—Note 1(b) | | | | 12,178,153 |
| Payable for investment securities purchased | | | | 675,527 |
| Payable for shares of Beneficial Interest redeemed | | | | 453,818 |
| Interest payable—Note 2 | | | | 997 |
| | | | | 13,830,514 |
| |
| |
|
| Net Assets ($) | | | | 341,302,583 |
| |
| |
|
| Composition of Net Assets ($): | | | | |
| Paid-in capital | | | | 458,567,848 |
| Accumulated undistributed investment income—net | | | | 38,404 |
| Accumulated net realized gain (loss) on investments | | | | (57,374,828) |
| Accumulated net unrealized appreciation | | | | |
| (depreciation) on investments | | | | (59,928,841) |
| |
| |
|
| Net Assets ($) | | | | 341,302,583 |
| Net Asset Value Per Share | | | | | | | | | | |
| | | Class A | | Class B | | Class C | | Class I | | Class T | | Institutional |
| |
| |
| |
| |
| |
| |
|
| Net Assets ($) | | 301,524,495 | | 5,664,804 | | 8,391,372 | | 747,378 | | 1,158,858 | | 23,815,676 |
| Shares | | | | | | | | | | | | |
| Outstanding | | 16,084,842 | | 308,521 | | 457,373 | | 39,872 | | 61,843 | | 1,271,174 |
| |
| |
| |
| |
| |
| |
|
| Net Asset Value | | | | | | | | | | | | |
| Per Share ($) | | 18.75 | | 18.36 | | 18.35 | | 18.74 | | 18.74 | | 18.74 |
| |
| See notes to financial statements. | | | | | | | | | | |
The Fund 13
STATEMENT OF OPERATIONS
Year Ended December 31, 2008 |
| Investment Income ($): | | |
| Income: | | |
| Cash dividends: | | |
| Unaffiliated issuers | | 12,684,793 |
| Affiliated issuers | | 87,806 |
| Income from securities lending | | 180,457 |
| Total Income | | 12,953,056 |
| Expenses: | | |
| Management fee—Note 3(a) | | 4,354,822 |
| Distribution and service fees—Note 3(b) | | 1,370,628 |
| Directors’ fees and expenses—Note 3(a) | | 29,546 |
| Loan commitment fees—Note 2 | | 7,876 |
| Interest expense—Note 2 | | 3,059 |
| Total Expenses | | 5,765,931 |
| Less—Directors’ fees reimbursed | | |
| by the Manager—Note 3(a) | | (29,546) |
| Net Expenses | | 5,736,385 |
| Investment Income—Net | | 7,216,671 |
| |
|
| Realized and Unrealized Gain (Loss) on Investments—Note 4 ($): | | |
| Net realized gain (loss) on investments | | (55,363,409) |
| Net unrealized appreciation (depreciation) on investments | | (157,803,948) |
| Net Realized and Unrealized Gain (Loss) on Investments | | (213,167,357) |
| Net (Decrease) in Net Assets Resulting from Operations | | (205,950,686) |
| |
| See notes to financial statements. | | �� |
14
STATEMENT OF CHANGES IN NET ASSETS
| | | Year Ended December 31, |
| | |
|
| | | 2008 | | 2007a |
| |
| |
|
| Operations ($): | | | | |
| Investment income—net | | 7,216,671 | | 8,848,052 |
| Net realized gain (loss) on investments | | (55,363,409) | | 39,344,889 |
| Net unrealized appreciation | | | | |
| (depreciation) on investments | | (157,803,948) | | (29,018,064) |
| Net Increase (Decrease) in Net Assets | | | | |
| Resulting from Operations | | (205,950,686) | | 19,174,877 |
| |
| |
|
| Dividends to Shareholders from ($): | | | | |
| Investment income—net: | | | | |
| Class A Shares | | (6,702,809) | | (7,810,838) |
| Class B Shares | | (93,674) | | (254,740) |
| Class C Shares | | (106,989) | | (123,543) |
| Class I Shares | | (20,206) | | (108,839) |
| Class T Shares | | (23,884) | | (32,567) |
| Institutional Shares | | (554,817) | | (663,937) |
| Net realized gain on investments: | | | | |
| Class A Shares | | (10,261) | | (42,093,570) |
| Class B Shares | | (393) | | (2,466,684) |
| Class C Shares | | (323) | | (1,391,903) |
| Class I Shares | | (27) | | (508,414) |
| Class T Shares | | (48) | | (201,432) |
| Institutional Shares | | (791) | | (3,287,550) |
| Total Dividends | | (7,514,222) | | (58,944,017) |
| |
| |
|
| Beneficial Interest Transactions ($): | | | | |
| Net proceeds from shares sold: | | | | |
| Class A Shares | | 21,187,961 | | 40,085,946 |
| Class B Shares | | 231,554 | | 550,036 |
| Class C Shares | | 1,180,466 | | 1,179,760 |
| Class I Shares | | 28,767 | | 1,096,343 |
| Class T Shares | | 79,816 | | 296,144 |
| Institutional Shares | | 1,476,417 | | 847,676 |
The Fund 15
STATEMENT OF CHANGES IN NET ASSETS (continued)
| | | Year Ended December 31, |
| | |
|
| | | 2008 | | 2007a |
| |
| |
|
| Beneficial Interest Transactions ($) (continued): | | | | |
| Dividends reinvested: | | | | |
| Class A Shares | | 5,744,738 | | 43,432,695 |
| Class B Shares | | 88,274 | | 2,534,368 |
| Class C Shares | | 91,237 | | 1,288,594 |
| Class I Shares | | 19,967 | | 615,892 |
| Class T Shares | | 23,483 | | 227,701 |
| Institutional Shares | | 541,804 | | 3,856,636 |
| Cost of shares redeemed: | | | | |
| Class A Shares | | (61,389,288) | | (74,701,854) |
| Class B Shares | | (16,067,639) | | (30,469,016) |
| Class C Shares | | (4,063,553) | | (5,813,398) |
| Class I Shares | | (192,894) | | (5,900,616) |
| Class T Shares | | (554,116) | | (1,445,146) |
| Institutional Shares | | (4,249,615) | | (5,906,978) |
| Increase (Decrease) in Net Assets | | | | |
| from Beneficial Interest Transactions | | (55,822,621) | | (28,225,217) |
| Total Increase (Decrease) in Net Assets | | (269,287,529) | | (67,994,357) |
| |
| |
|
| Net Assets ($): | | | | |
| Beginning of Period | | 610,590,112 | | 678,584,469 |
| End of Period | | 341,302,583 | | 610,590,112 |
| Undistributed investment income—net | | 38,404 | | 326,082 |
16
| | | Year Ended December 31, |
| | |
|
| | | 2008 | | 2007a |
| |
| |
|
| Capital Share Transactions: | | | | |
| Class Ab | | | | |
| Shares sold | | 812,842 | | 1,223,509 |
| Shares issued for dividends reinvested | | 252,379 | | 1,432,160 |
| Shares redeemed | | (2,486,143) | | (2,291,194) |
| Net Increase (Decrease) in Shares Outstanding | | (1,420,922) | | 364,475 |
| |
| |
|
| Class Bb | | | | |
| Shares sold | | 9,758 | | 17,264 |
| Shares issued for dividends reinvested | | 3,931 | | 85,084 |
| Shares redeemed | | (615,755) | | (946,775) |
| Net Increase (Decrease) in Shares Outstanding | | (602,066) | | (844,427) |
| |
| |
|
| Class C | | | | |
| Shares sold | | 54,315 | | 37,358 |
| Shares issued for dividends reinvested | | 4,220 | | 43,561 |
| Shares redeemed | | (168,022) | | (180,767) |
| Net Increase (Decrease) in Shares Outstanding | | (109,487) | | (99,848) |
| |
| |
|
| Class I Shares | | | | |
| Shares sold | | 1,177 | | 33,594 |
| Shares issued for dividends reinvested | | 865 | | 20,309 |
| Shares redeemed | | (8,900) | | (195,159) |
| Net Increase (Decrease) in Shares Outstanding | | (6,858) | | (141,256) |
| |
| |
|
| Class T | | | | |
| Shares sold | | 3,196 | | 9,093 |
| Shares issued for dividends reinvested | | 1,028 | | 7,498 |
| Shares redeemed | | (22,499) | | (43,815) |
| Net Increase (Decrease) in Shares Outstanding | | (18,275) | | (27,224) |
| |
| |
|
| Institutional Shares | | | | |
| Shares sold | | 55,057 | | 26,624 |
| Shares issued for dividends reinvested | | 23,745 | | 127,036 |
| Shares redeemed | | (170,281) | | (182,481) |
| Net Increase (Decrease) in Shares Outstanding | | (91,479) | | (28,821) |
| a Effective June 1, 2007, Class R shares were redesignated as Class I shares. |
| b During the period ended December 31, 2008, 356,742 Class B shares representing $9,460,479 were |
| automatically converted to 349,259 Class A shares and during the period ended December 31, 2007, 576,529 |
| Class B shares representing $18,595,312 were automatically converted to 565,175 Class A shares. |
| See notes to financial statements. |
The Fund 17
FINANCIAL HIGHLIGHTS
The following tables describe the performance for each share class for the fiscal periods indicated.All information (except portfolio turnover rate) reflects financial results for a single fund share.Total return shows how much your investment in the fund would have increased (or decreased) during each period, assuming you had reinvested all dividends and distributions.These figures have been derived from the fund’s financial statements.
| | | | | Year Ended December 31, | | |
| | |
| |
| |
|
| Class A Shares | | 2008 | | 2007 | | 2006 | | 2005 | | 2004 |
| |
| |
| |
| |
| |
|
| Per Share Data ($): | | | | | | | | | | |
| Net asset value, beginning of period | | 29.87 | | 32.00 | | 31.38 | | 30.34 | | 27.44 |
| Investment Operations: | | | | | | | | | | |
| Investment income—neta | | .38 | | .45 | | .38 | | .30 | | .24 |
| Net realized and unrealized | | | | | | | | | | |
| gain (loss) on investments | | (11.10) | | .42 | | 5.94 | | 1.26 | | 2.88 |
| Total from Investment Operations | | (10.72) | | .87 | | 6.32 | | 1.56 | | 3.12 |
| Distributions: | | | | | | | | | | |
| Dividends from investment income—net | | (.40) | | (.46) | | (.37) | | (.35) | | (.22) |
| Dividends from net realized | | | | | | | | | | |
| gain on investments | | (.00)b | | (2.54) | | (5.33) | | (.17) | | — |
| Total Distributions | | (.40) | | (3.00) | | (5.70) | | (.52) | | (.22) |
| Net asset value, end of period | | 18.75 | | 29.87 | | 32.00 | | 31.38 | | 30.34 |
| |
| |
| |
| |
| |
|
| Total Return (%)c | | (36.10) | | 2.75 | | 21.00 | | 5.18 | | 11.41 |
| |
| |
| |
| |
| |
|
| Ratios/Supplemental Data (%): | | | | | | | | | | |
| Ratio of total expenses | | | | | | | | | | |
| to average net assets | | 1.16 | | 1.16 | | 1.15 | | 1.15 | | 1.15 |
| Ratio of net expenses | | | | | | | | | | |
| to average net assets | | 1.15 | | 1.15 | | 1.15 | | 1.15 | | 1.15 |
| Ratio of net investment income | | | | | | | | | | |
| to average net assets | | 1.53 | | 1.38 | | 1.17 | | .99 | | .86 |
| Portfolio Turnover Rate | | 53.58 | | 45.19 | | 44.73 | | 55.95 | | 74.98 |
| |
| |
| |
| |
| |
|
| Net Assets, end of period ($ x 1,000) | | 301,524 | | 522,906 | | 548,601 | | 556,017 | | 634,007 |
| a | | Based on average shares outstanding at each month end. |
| b | | Amount represents less than $.01 per share. |
| c | | Exclusive of sales charge. |
| See notes to financial statements. |
18
| | | | | Year Ended December 31, | | |
| | |
| |
| |
|
| Class B Shares | | 2008 | | 2007 | | 2006 | | 2005 | | 2004 |
| |
| |
| |
| |
| |
|
| Per Share Data ($): | | | | | | | | | | |
| Net asset value, beginning of period | | 29.26 | | 31.40 | | 30.87 | | 29.83 | | 27.02 |
| Investment Operations: | | | | | | | | | | |
| Investment income—neta | | .17 | | .22 | | .13 | | .07 | | .02 |
| Net realized and unrealized | | | | | | | | | | |
| gain (loss) on investments | | (10.85) | | .39 | | 5.85 | | 1.26 | | 2.85 |
| Total from Investment Operations | | (10.68) | | .61 | | 5.98 | | 1.33 | | 2.87 |
| Distributions: | | | | | | | | | | |
| Dividends from investment income—net | | (.22) | | (.21) | | (.12) | | (.12) | | (.06) |
| Dividends from net realized | | | | | | | | | | |
| gain on investments | | (.00)b | | (2.54) | | (5.33) | | (.17) | | — |
| Total Distributions | | (.22) | | (2.75) | | (5.45) | | (.29) | | (.06) |
| Net asset value, end of period | | 18.36 | | 29.26 | | 31.40 | | 30.87 | | 29.83 |
| |
| |
| |
| |
| |
|
| Total Return (%)c | | (36.62) | | 2.01 | | 20.12 | | 4.47 | | 10.62 |
| |
| |
| |
| |
| |
|
| Ratios/Supplemental Data (%): | | | | | | | | | | |
| Ratio of total expenses | | | | | | | | | | |
| to average net assets | | 1.90 | | 1.91 | | 1.90 | | 1.90 | | 1.90 |
| Ratio of net expenses | | | | | | | | | | |
| to average net assets | | 1.90d | | 1.90 | | 1.90 | | 1.90 | | 1.90 |
| Ratio of net investment income | | | | | | | | | | |
| to average net assets | | .69 | | .70 | | .42 | | .24 | | .10 |
| Portfolio Turnover Rate | | 53.58 | | 45.19 | | 44.73 | | 55.95 | | 74.98 |
| |
| |
| |
| |
| |
|
| Net Assets, end of period ($ x 1,000) | | 5,665 | | 26,646 | | 55,112 | | 64,239 | | 78,154 |
| a | | Based on average shares outstanding at each month end. |
| b | | Amount represents less than $.01 per share. |
| c | | Exclusive of sales charge. |
| d | | Expense waivers and/or reimbursements amounted to less than .01%. |
| See notes to financial statements. |
The Fund 19
| FINANCIAL HIGHLIGHTS (continued) |
| | | | | Year Ended December 31, | | |
| | |
| |
| |
|
| Class C Shares | | 2008 | | 2007 | | 2006 | | 2005 | | 2004 |
| |
| |
| |
| |
| |
|
| Per Share Data ($): | | | | | | | | | | |
| Net asset value, beginning of period | | 29.24 | | 31.38 | | 30.85 | | 29.83 | | 27.02 |
| Investment Operations: | | | | | | | | | | |
| Investment income—neta | | .19 | | .21 | | .14 | | .07 | | .02 |
| Net realized and unrealized | | | | | | | | | | |
| gain (loss) on investments | | (10.86) | | .40 | | 5.84 | | 1.24 | | 2.85 |
| Total from Investment Operations | | (10.67) | | .61 | | 5.98 | | 1.31 | | 2.87 |
| Distributions: | | | | | | | | | | |
| Dividends from investment income—net | | (.22) | | (.21) | | (.12) | | (.12) | | (.06) |
| Dividends from net realized | | | | | | | | | | |
| gain on investments | | (.00)b | | (2.54) | | (5.33) | | (.17) | | — |
| Total Distributions | | (.22) | | (2.75) | | (5.45) | | (.29) | | (.06) |
| Net asset value, end of period | | 18.35 | | 29.24 | | 31.38 | | 30.85 | | 29.83 |
| |
| |
| |
| |
| |
|
| Total Return (%)c | | (36.59) | | 2.00 | | 20.07 | | 4.43 | | 10.62 |
| |
| |
| |
| |
| |
|
| Ratios/Supplemental Data (%): | | | | | | | | | | |
| Ratio of total expenses | | | | | | | | | | |
| to average net assets | | 1.90 | | 1.91 | | 1.90 | | 1.90 | | 1.90 |
| Ratio of net expenses | | | | | | | | | | |
| to average net assets | | 1.90d | | 1.90 | | 1.90 | | 1.90 | | 1.90 |
| Ratio of net investment income | | | | | | | | | | |
| to average net assets | | .76 | | .65 | | .42 | | .24 | | .10 |
| Portfolio Turnover Rate | | 53.58 | | 45.19 | | 44.73 | | 55.95 | | 74.98 |
| |
| |
| |
| |
| |
|
| Net Assets, end of period ($ x 1,000) | | 8,391 | | 16,572 | | 20,919 | | 20,564 | | 21,958 |
| a | | Based on average shares outstanding at each month end. |
| b | | Amount represents less than $.01 per share. |
| c | | Exclusive of sales charge. |
| d | | Expense waivers and/or reimbursements amounted to less than .01%. |
| See notes to financial statements. |
20
| | | | | Year Ended December 31, | | |
| | |
| |
| |
|
| Class I Shares | | 2008 | | 2007a | | 2006 | | 2005 | | 2004 |
| |
| |
| |
| |
| |
|
| Per Share Data ($): | | | | | | | | | | |
| Net asset value, beginning of period | | 29.85 | | 31.98 | | 31.36 | | 30.33 | | 27.43 |
| Investment Operations: | | | | | | | | | | |
| Investment income—netb | | .45 | | .57 | | .46 | | .38 | | .31 |
| Net realized and unrealized | | | | | | | | | | |
| gain (loss) on investments | | (11.10) | | .39 | | 5.95 | | 1.25 | | 2.88 |
| Total from Investment Operations | | (10.65) | | .96 | | 6.41 | | 1.63 | | 3.19 |
| Distributions: | | | | | | | | | | |
| Dividends from investment income—net | | (.46) | | (.55) | | (.46) | | (.43) | | (.29) |
| Dividends from net realized | | | | | | | | | | |
| gain on investments | | (.00)c | | (2.54) | | (5.33) | | (.17) | | — |
| Total Distributions | | (.46) | | (3.09) | | (5.79) | | (.60) | | (.29) |
| Net asset value, end of period | | 18.74 | | 29.85 | | 31.98 | | 31.36 | | 30.33 |
| |
| |
| |
| |
| |
|
| Total Return (%) | | (35.93) | | 3.04 | | 21.26 | | 5.45 | | 11.69 |
| |
| |
| |
| |
| |
|
| Ratios/Supplemental Data (%): | | | | | | | | | | |
| Ratio of total expenses | | | | | | | | | | |
| to average net assets | | .90 | | .91 | | .90 | | .90 | | .90 |
| Ratio of net expenses | | | | | | | | | | |
| to average net assets | | .90d | | .90 | | .90 | | .90 | | .90 |
| Ratio of net investment income | | | | | | | | | | |
| to average net assets | | 1.74 | | 1.63 | | 1.42 | | 1.25 | | 1.09 |
| Portfolio Turnover Rate | | 53.58 | | 45.19 | | 44.73 | | 55.95 | | 74.98 |
| |
| |
| |
| |
| |
|
| Net Assets, end of period ($ x 1,000) | | 747 | | 1,395 | | 6,012 | | 4,740 | | 50,536 |
| a | | Effective June 1, 2007, Class R shares were redesignated as Class I shares. |
| b | | Based on average shares outstanding at each month end. |
| c | | Amount represents less than $.01 per share. |
| d | | Expense waivers and/or reimbursements amounted to less than .01%. |
| See notes to financial statements. |
The Fund 21
| FINANCIAL HIGHLIGHTS (continued) |
| | | | | Year Ended December 31, | | |
| | |
| |
| |
|
| Class T Shares | | 2008 | | 2007 | | 2006 | | 2005 | | 2004 |
| |
| |
| |
| |
| |
|
| Per Share Data ($): | | | | | | | | | | |
| Net asset value, beginning of period | | 29.86 | | 31.99 | | 31.37 | | 30.33 | | 27.43 |
| Investment Operations: | | | | | | | | | | |
| Investment income—neta | | .32 | | .38 | | .30 | | .23 | | .18 |
| Net realized and unrealized | | | | | | | | | | |
| gain (loss) on investments | | (11.10) | | .41 | | 5.94 | | 1.26 | | 2.87 |
| Total from Investment Operations | | (10.78) | | .79 | | 6.24 | | 1.49 | | 3.05 |
| Distributions: | | | | | | | | | | |
| Dividends from investment income—net | | (.34) | | (.38) | | (.29) | | (.28) | | (.15) |
| Dividends from net realized | | | | | | | | | | |
| gain on investments | | (.00)b | | (2.54) | | (5.33) | | (.17) | | — |
| Total Distributions | | (.34) | | (2.92) | | (5.62) | | (.45) | | (.15) |
| Net asset value, end of period | | 18.74 | | 29.86 | | 31.99 | | 31.37 | | 30.33 |
| |
| |
| |
| |
| |
|
| Total Return (%)c | | (36.27) | | 2.49 | | 20.67 | | 4.95 | | 11.14 |
| |
| |
| |
| |
| |
|
| Ratios/Supplemental Data (%): | | | | | | | | | | |
| Ratio of total expenses | | | | | | | | | | |
| to average net assets | | 1.41 | | 1.41 | | 1.40 | | 1.40 | | 1.40 |
| Ratio of net expenses | | | | | | | | | | |
| to average net assets | | 1.40 | | 1.40 | | 1.40 | | 1.40 | | 1.40 |
| Ratio of net investment income | | | | | | | | | | |
| to average net assets | | 1.25 | | 1.17 | | .93 | | .74 | | .65 |
| Portfolio Turnover Rate | | 53.58 | | 45.19 | | 44.73 | | 55.95 | | 74.98 |
| |
| |
| |
| |
| |
|
| Net Assets, end of period ($ x 1,000) | | 1,159 | | 2,392 | | 3,434 | | 2,840 | | 2,945 |
| a | | Based on average shares outstanding at each month end. |
| b | | Amount represents less than $.01 per share. |
| c | | Exclusive of sales charge. |
| See notes to financial statements. |
22
| | | | | Year Ended December 31, | | |
| | |
| |
| |
|
| Institutional Shares | | 2008 | | 2007 | | 2006 | | 2005 | | 2004 |
| |
| |
| |
| |
| |
|
| Per Share Data ($): | | | | | | | | | | |
| Net asset value, beginning of period | | 29.85 | | 31.98 | | 31.36 | | 30.32 | | 27.42 |
| Investment Operations: | | | | | | | | | | |
| Investment income—neta | | .41 | | .48 | | .42 | | .33 | | .27 |
| Net realized and unrealized | | | | | | | | | | |
| gain (loss) on investments | | (11.09) | | .43 | | 5.94 | | 1.26 | | 2.88 |
| Total from Investment Operations | | (10.68) | | .91 | | 6.36 | | 1.59 | | 3.15 |
| Distributions: | | | | | | | | | | |
| Dividends from investment income—net | | (.43) | | (.50) | | (.41) | | (.38) | | (.25) |
| Dividends from net realized | | | | | | | | | | |
| gain on investments | | (.00)b | | (2.54) | | (5.33) | | (.17) | | — |
| Total Distributions | | (.43) | | (3.04) | | (5.74) | | (.55) | | (.25) |
| Net asset value, end of period | | 18.74 | | 29.85 | | 31.98 | | 31.36 | | 30.32 |
| |
| |
| |
| |
| |
|
| Total Return (%) | | (36.05) | | 2.89 | | 21.11 | | 5.33 | | 11.53 |
| |
| |
| |
| |
| |
|
| Ratios/Supplemental Data (%): | | | | | | | | | | |
| Ratio of total expenses | | | | | | | | | | |
| to average net assets | | 1.06 | | 1.06 | | 1.05 | | 1.05 | | 1.05 |
| Ratio of net expenses | | | | | | | | | | |
| to average net assets | | 1.05 | | 1.05 | | 1.05 | | 1.05 | | 1.05 |
| Ratio of net investment income | | | | | | | | | | |
| to average net assets | | 1.63 | | 1.49 | | 1.28 | | 1.09 | | .96 |
| Portfolio Turnover Rate | | 53.58 | | 45.19 | | 44.73 | | 55.95 | | 74.98 |
| |
| |
| |
| |
| |
|
| Net Assets, end of period ($ x 1,000) | | 23,816 | | 40,679 | | 44,506 | | 40,341 | | 41,202 |
| a | | Based on average shares outstanding at each month end. |
| b | | Amount represents less than $.01 per share. |
| See notes to financial statements. |
The Fund 23
NOTES TO FINANCIAL STATEMENTS
NOTE 1—Significant Accounting Policies:
Dreyfus CoreValue Fund (the “fund”) is a separate diversified series of The Dreyfus/Laurel FundsTrust (the “Trust”) which is registered under the Investment Company Act of 1940, as amended (the “Act”), as an open-end management investment company and operates as a series company offering seven series, including the fund, as of the date of this report. The fund’s investment objective is to seek long-term capital growth. The Dreyfus Corporation (the “Manager” or “Dreyfus”), a wholly-owned subsidiary of The Bank of New York Mellon Corporation (“BNY Mellon”), serves as the fund’s investment adviser.
At a meeting of the fund’s Board of Directors held on July 24, 2008, the Board approved, effective December 1, 2008, a proposal to change the name of the fund from “Dreyfus Premier Core Value Fund” to “Dreyfus Core Value Fund”.
Effective July 1, 2008, BNY Mellon reorganized and consolidated a number of its banking and trust company subsidiaries.As a result of the reorganization, any services previously provided to the fund by Mellon Bank, N.A. or Mellon Trust of New England, N.A. are now provided by The Bank of NewYork Mellon (formerly,The Bank of NewYork).
MBSC Securities Corporation (the “Distributor”), a wholly-owned subsidiary of the Manager, is the distributor of the fund’s shares. The fund is authorized to issue an unlimited number of shares of Beneficial Interest in each of the following classes of shares: Class A, Class B, Class C, Class I, Class T and Institutional shares. Class A, Class B, Class C and Class T shares are sold primarily to retail investors through financial intermediaries and bear a distribution fee and/or service fee. Class A and Class T shares are subject to a front-end sales charge, while Class B and Class C shares are subject to a contingent deferred sales charge (“CDSC”). Class B shares automatically convert to Class A shares after six years.The fund does not offer Class B shares, except in connection with dividend reinvestment and permitted exchanges of Class B shares. Class I shares are sold primarily to bank trust departments and other financial service providers including The Bank of New York Mellon, a
24
subsidiary of BNY Mellon and an affiliate of Dreyfus, acting on behalf of customers having a qualified trust or investment account or relationship at such institution, and bear no distribution or service fees. Class I and Institutional shares are offered without a front-end sales charge or CDSC. Institutional shares are offered only to those customers of certain financial planners and investment advisers who held shares of a predecessor class of the fund as of April 4, 1994, and bear a distribution fee. Effective December 3, 2008, investments for new accounts are no longer permitted in Class T of the fund, except that participants in certain group retirement plans are able to open a new account in Class T of the fund, provided that the fund was established as an investment option under the plans before December 3, 2008. Each class of shares has identical rights and privileges, except with respect to the distribution and service fees and voting rights on matters affecting a single class. Income, expenses (other than expenses attributable to a specific class), and realized and unrealized gains or losses on investments are allocated to each class of shares based on its relative net assets.
The fund’s financial statements are prepared in accordance with U.S. generally accepted accounting principles, which may require the use of management estimates and assumptions. Actual results could differ from those estimates.
(a) Portfolio valuation: Investments in securities are valued at the last sales price on the securities exchange or national securities market on which such securities are primarily traded. Securities listed on the National Market System, for which market quotations are available are valued at the official closing price or, if there is no official closing price that day, at the last sale price. Securities not listed on an exchange or the national securities market, or securities for which there were no transactions, are valued at the average of the most recent bid and asked prices. Bid price is used when no asked price is available. Registered investment companies that are not traded on an exchange are valued at their net asset value.When market quotations or official closing prices are not readily available, or are determined not to reflect accurately fair
The Fund 25
| NOTES TO FINANCIAL STATEMENTS (continued) |
value, such as when the value of a security has been significantly affected by events after the close of the exchange or market on which the security is principally traded (for example, a foreign exchange or market),but before the fund calculates its net asset value, the fund may value these investments at fair value as determined in accordance with the procedures approved by the Board of Trustees. Fair valuing of securities may be determined with the assistance of a pricing service using calculations based on indices of domestic securities and other appropriate indicators, such as prices of relevant ADRs and futures contracts. For other securities that are fair valued by the Board ofTrustees, certain factors may be considered such as: fundamental analytical data, the nature and duration of restrictions on disposition, an evaluation of the forces that influence the market in which the securities are purchased and sold, and public trading in similar securities of the issuer or comparable issuers. Investments denominated in foreign currencies are translated to U.S. dollars at the prevailing rates of exchange. Forward currency exchange contracts are valued at the forward rate.
The fund adopted Statement of Financial Accounting Standards No. 157 “Fair Value Measurements” (“FAS 157”). FAS 157 establishes an authoritative definition of fair value, sets out a framework for measuring fair value, and requires additional disclosures about fair value measurements.
Various inputs are used in determining the value of the fund’s investments relating to FAS 157.These inputs are summarized in the three broad levels listed below.
| | Level 1—quoted prices in active markets for identical securities.
Level 2—other significant observable inputs (including quoted
prices for similar securities, interest rates, prepayment speeds, credit
risk, etc.).
Level 3—significant unobservable inputs (including the fund’s own
assumptions in determining the fair value of investments). |
26
The inputs or methodology used for valuing securities are not necessarily an indication of the risk associated with investing in those securities.
The following is a summary of the inputs used as of December 31, 2008 in valuing the fund’s investments carried at fair value:
| | | Investments in | | Other Financial |
| Valuation Inputs | | Securities ($) | | Instruments ($)† |
| |
| |
|
| Level 1—Quoted Prices | | 349,962,163 | | 0 |
| Level 2—Other Significant | | | | |
| Observable Inputs | | 0 | | 0 |
| Level 3—Significant | | | | |
| Unobservable Inputs | | 0 | | 0 |
| Total | | 349,962,163 | | 0 |
| † | | Other financial instruments include derivative instruments such as futures, forward currency |
| | | exchange contracts and swap contracts, which are valued at the unrealized appreciation |
| | | (depreciation) on the instrument and written options contracts which are shown at value. |
(b) Securities transactions and investment income: Securities transactions are recorded on a trade date basis. Realized gains and losses from securities transactions are recorded on the identified cost basis. Dividend income is recognized on the ex-dividend date and interest income, including, where applicable, accretion of discount and amortization of premium on investments, is recognized on the accrual basis.
Pursuant to a securities lending agreement with The Bank of New York Mellon, the fund may lend securities to qualified institutions. It is the fund’s policy, that at origination, all loans are secured by collateral of at least 102% of the value of U.S. securities loaned and 105% of the value of foreign securities loaned. Collateral equivalent to at least 100% of the market value of securities on loan is maintained at all times. Collateral is either in the form of cash, which can be invested in certain money market mutual funds managed by the Manager, U.S. Government and Agency securities or letters of credit. The fund is entitled to receive all income on securities loaned, in addition to income earned as a result of the lending transaction. Although each
The Fund 27
| NOTES TO FINANCIAL STATEMENTS (continued) |
security loaned is fully collateralized, the fund bears the risk of delay in recovery of, or loss of rights in, the securities loaned should a borrower fail to return the securities in a timely manner. During the period ended December 31, 2008, The Bank of New York Mellon earned $77,339 from lending fund portfolio securities, pursuant to the securities lending agreement.
(c) Affiliated issuers: Investments in other investment companies advised by the Manager are defined as “affiliated” in the Act.
(d) Foreign currency transactions: The fund does not isolate that portion of the results of operations resulting from changes in foreign exchange rates on investments from the fluctuations arising from changes in the market prices of securities held. Such fluctuations are included with the net realized and unrealized gains or losses from investments.
Net realized foreign exchange gains or losses arise from sales and maturities of short-term securities, sales of foreign currencies, currency gains or losses realized on securities transactions and the difference between the amount of dividends, interest, and foreign withholding taxes recorded on the fund’s books and the U.S. dollar equivalent of the amounts actually received or paid. Net unrealized foreign exchange gains and losses arise from changes in the value of assets and liabilities other than investments in securities, resulting from changes in exchange rates. Such gains and losses are included with net realized and unrealized gains or losses on investments.
(e) Dividends to shareholders: Dividends are recorded on the ex-dividend date. Dividends from investment income-net are declared and paid on a quarterly basis. Dividends from net realized capital gains, if any, are normally declared and paid annually, but the fund may make distributions on a more frequent basis to comply with the distribution requirements of the Internal Revenue Code of 1986, as amended (the “Code”).To the extent that net realized capital gains can be offset by capital loss carryovers, if any, it is the policy of the fund not to distrib-
28
ute such gains. Income and capital gain distributions are determined in accordance with income tax regulations, which may differ from U.S. generally accepted accounting principles.
(f) Federal income taxes: It is the policy of the fund to continue to qualify as a regulated investment company, if such qualification is in the best interests of its shareholders, by complying with the applicable provisions of the Code, and to make distributions of taxable income sufficient to relieve it from substantially all federal income and excise taxes.
As of and during the period ended December 31, 2008, the fund did not have any liabilities for any unrecognized tax positions. The fund recognizes interest and penalties, if any, related to unrecognized tax positions as income tax expense in the Statement of Operations. During the period, the fund did not incur any interest or penalties.
Each of the tax years in the four-year period ended December 31, 2008 remains subject to examination by the Internal Revenue Service and state taxing authorities.
At December 31, 2008, the components of accumulated earnings on a tax basis were as follows: undistributed ordinary income $38,404, accumulated capital losses $38,328,751 and unrealized depreciation $61,558,835. In addition, the portfolio had $17,416,083 of capital losses realized after October 31, 2008, which were deferred for tax purposes to the first day of the following fiscal year.
The accumulated capital loss carryover is available for federal income tax purposes to be applied against future net securities profits, if any, realized subsequent to December 31, 2008. If not applied, the carryover expires in fiscal 2016.
The tax character of distributions paid to shareholders during the fiscal period ended December 31, 2008 and December 31, 2007 were as follows: ordinary income $7,504,072 and $14,227,185 and long term capital gains $10,150 and $44,716,832, respectively.
The Fund 29
| NOTES TO FINANCIAL STATEMENTS (continued) |
During the period ended December 31, 2008, as a result of permanent book to tax differences, primarily due to dividend reclassification, the fund decreased accumulated undistributed investment income-net by $1,970 and increased accumulated net realized gain (loss) on investments by the same amount. Net assets and net asset value per share were not affected by this reclassification.
NOTE 2—Bank Lines of Credit:
Prior to October 15, 2008, the fund participated with other Dreyfus managed funds in a $350 million redemption credit facility. Effective October 15, 2008, the fund participates with other Dreyfus-managed funds in a $145 million redemption credit facility (the “Facility”) to be utilized for temporary or emergency purposes, including the financing of redemptions. In connection therewith, the portfolio has agreed to pay commitment fees on its pro rata portion of the Facility. Interest is charged to the fund based on prevailing market rates in effect at the time of borrowing.
The average daily amount of borrowings outstanding under the Facilities during the period ended December 31, 2008 was approximately $90,500 with a related weighted average annualized interest rate of 3.38% .
NOTE 3—Investment Management Fee and Other Transactions With Affiliates:
(a) Pursuant to an Investment Management agreement with the Manager, the Manager provides or arranges for one or more third parties and/or affiliates to provide investment advisory, administrative, custody, fund accounting and transfer agency services to the fund.The Manager also directs the investments of the fund in accordance with its investment objective, policies and limitations. For these services, the fund is contractually obligated to pay the Manager a fee, calculated daily and paid monthly, at the annual rate of .90% of the value of the fund’s
30
average daily net assets. Out of its fee, the Manager pays all of the expenses of the fund except brokerage fees, taxes, interest, commitment fees, Rule 12b-1 distribution fees and expenses, service fees and expenses of non-interested Trustees (including counsel fees) and extraordinary expenses. In addition, the Manager is required to reduce its fee in an amount equal to the fund’s allocable portion of fees and expenses of the non-interested Trustees (including counsel fees). Each Trustee receives $45,000 per year, plus $6,000 for each joint Board meeting of The Dreyfus/Laurel Funds, Inc., The Dreyfus/Laurel Tax-Free Municipal Funds, the Trust (collectively, the “Dreyfus/Laurel Funds”) and Dreyfus Investment Funds attended, $2,000 for separate in-person committee meetings attended which are not held in conjunction with a regularly scheduled Board meeting and $1,500 for Board meetings and separate committee meetings attended that are conducted by telephone and is reimbursed for travel and out-of-pocket expenses. With respect to Board meetings, the Chairman of the Board receives an additional 25% of such compensation (with the exception of reimbursable amounts).With respect to compensation committee meetings, the Chair of the compensation committee receives $900 per meeting and, with respect to audit committee meetings prior to April 12, 2008, the Chair of the audit committee received $1,350 per meeting. In the event that there is an in-person joint committee meeting or a joint telephone meeting of the Dreyfus/Laurel Funds, Dreyfus Investment Funds and Dreyfus High Yield Strategies Fund, the $2,000 or $1,500 fee, as applicable, will be allocated between the Dreyfus/Laurel Funds, Dreyfus Investment Funds and Dreyfus High Yield Strategies Fund.These fees and expenses are charged and allocated to each series based on net assets. Amounts required to be paid by the Trust directly to the non-interested Trustees, that would be applied to offset a portion of the management fee payable to the Manager, are in fact paid directly by the Manager to the non-interested Trustees.
The Fund 31
| NOTES TO FINANCIAL STATEMENTS (continued) |
During the period ended December 31, 2008, the Distributor retained $7,067 and $116 from commissions earned on sales of the fund’s Class A and ClassT shares, respectively, and $38,872 and $1,485 from CDSCs on redemptions on the fund’s Class B and Class C shares, respectively.
(b) Under separate Distribution Plans (the “Plans”) adopted pursuant to Rule 12b-1 under the Act, Class A shares and Institutional shares may pay annually up to .25% and .15%, respectively, of the value of their average daily net assets to compensate the Distributor for shareholder servicing activities and expenses primarily intended to result in the sale of Class A shares and Institutional shares. Class B, Class C and Class T shares pay the Distributor for distributing their shares at an aggregate annual rate of .75% of the value of the average daily net assets of Class B and Class C shares, and .25% of the value of average daily net assets of Class T shares.The Distributor may pay one or more agents in respect of advertising, marketing and other distribution services for Class T shares and determines the amounts, if any, to be paid to agents and the basis on which such payments are made. Class B, Class C and Class T shares are also subject to a Service Plan adopted pursuant to Rule 12b-1 (the “Service Plan”), under which Class B, Class C and Class T shares pay the Distributor for providing certain services to the holders of their shares a fee at the annual rate of .25% of the value of the average daily net assets of Class B, Class C and Class T shares, respectively. During the period ended December 31, 2008, Class A, Class B, Class C, Class T and Institutional shares were charged $1,056,085, $98,702, $93,325, $4,608 and $49,292, respectively, pursuant to their respective Plans. During the period ended December 31, 2008, Class B, Class C and Class T shares were charged $32,900, $31,108 and $4,608, respectively, pursuant to the Service Plan.
Under its terms, the Plans and Service Plan shall remain in effect from year to year, provided such continuance is approved annually by a vote
32
of majority of those Trustees who are not “interested persons” of the Trust and who have no direct or indirect financial interest in the operation of or in any agreement related to the Plans or Service Plan.
The components of “Due to The Dreyfus Corporation and affiliates” in the Statement of Assets and Liabilities consist of: management fees $262,448, Rule 12b-1 distribution plan fees $76,708 and shareholder services plan fees $3,248.
NOTE 4—Securities Transactions:
The aggregate amount of purchases and sales of investment securities, excluding short-term securities, during the period ended December 31, 2008, amounted to $260,665,759 and $322,971,300, respectively.
At December 31, 2008, the cost of investments for federal income tax purposes was $411,520,998; accordingly, accumulated net unrealized depreciation on investments was $61,558,835, consisting of $20,547,243 gross unrealized appreciation and $82,106,078, gross unrealized depreciation.
In March 2008, the Financial Accounting Standards Board released Statement of Financial Accounting Standards No. 161 “Disclosures about Derivative Instruments and Hedging Activities” (“FAS 161”). FAS 161 requires qualitative disclosures about objectives and strategies for using derivatives, quantitative disclosures about fair value amounts of gains and losses on derivative instruments and disclosures about credit-risk-related contingent features in derivative agreements. The application of FAS 161 is required for fiscal years and interim periods beginning after November 15, 2008.At this time, management is evaluating the implications of FAS 161 and its impact on the financial statements and the accompanying notes has not yet been determined.
The Fund 33
| NOTES TO FINANCIAL STATEMENTS (continued) |
NOTE 5—Subsequent Event:
February 4, 2009, the fund issued to each holder of its Class T shares, in exchange for said shares, Class A shares of the fund having an aggregate net asset value equal to the aggregate net asset value of the shareholder’s Class T shares. Subsequent investments in the fund’s Class A shares made by prior holders of the fund’s Class T shares who received Class A shares of the fund in exchange for their ClassT shares are subject to the front-end sales load schedule that was in effect for Class T shares at the time of the exchange. Otherwise, all other Class A share attributes will be in effect.
34
REPORT OF INDEPENDENT REGISTERED
PUBLIC ACCOUNTING FIRM |
| | The Board of Trustees and Shareholders
The Dreyfus/Laurel Funds Trust: |
We have audited the accompanying statement of assets and liabilities of Dreyfus CoreValue Fund (formerly, Dreyfus Premier CoreValue Fund), a series of The Dreyfus/Laurel Funds Trust (the “Fund”), including the statement of investments as of December 31, 2008, and the related statement of operations for the year then ended, the statement of changes in net assets for each of the years in the two year period then ended, and the financial highlights for each of the years in the five-year period then ended.These financial statements and financial highlights are the responsibility of the Fund’s management. Our responsibility is to express an opinion on these financial statements and financial highlights based on our audits.
We conducted our audits in accordance with standards of the Public Company Accounting Oversight Board (United States).Those standards require that we plan and perform the audit to obtain reasonable assurance about whether the financial statements and financial highlights are free of material misstatement. An audit includes examining, on a test basis, evidence supporting the amounts and disclosures in the financial statements. Our procedures included confirmation of securities owned as of December 31, 2008 by correspondence with the custodian and brokers. An audit also includes assessing the accounting principles used and significant estimates made by management, as well as evaluating the overall financial statement presentation.We believe that our audits provide a reasonable basis for our opinion.
In our opinion, the financial statements and financial highlights referred to above present fairly, in all material respects, the financial position of Dreyfus CoreValue Fund as of December 31, 2008, and the results of its operations for the year then ended, the changes in its net assets for each of the years in the two-year period then ended, and the financial highlights for each of the years in the five-year period then ended, in conformity with U.S. generally accepted accounting principles.

New York, New York
February 25, 2009 |
The Fund 35
IMPORTANT TAX INFORMATION (Unaudited)
For federal tax purposes, the fund also hereby designates 100% of the ordinary dividends paid during the fiscal year ended December 31, 2008 as qualifying for the corporate dividends received deduction. For the fiscal year ended December 31, 2008, certain dividends paid by the fund may be subject to a maximum tax rate of 15%, as provided for by the Jobs and Growth Tax Relief Reconciliation Act of 2003. Of the distributions paid during the fiscal year, $7,504,072 represents the maximum amount that may be considered qualified dividend income. Shareholders will receive notification in January 2009 of the percentage applicable to the preparation of their 2008 income tax returns. Also the fund hereby designates $.0006 per share as a long-term capital gain distribution paid on March 31, 2008.
36
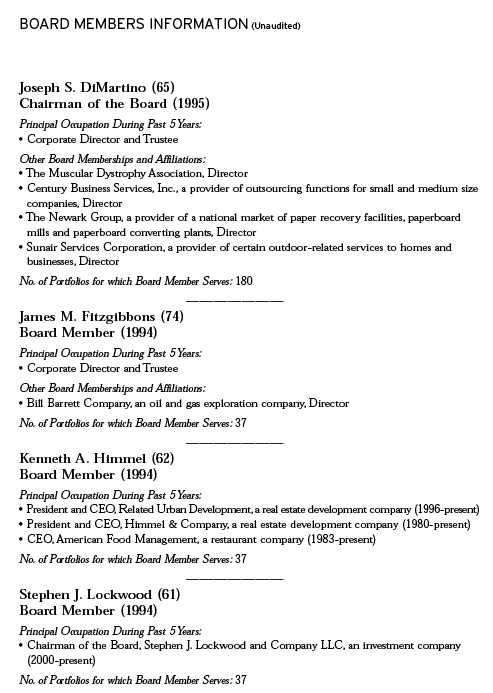
The Fund 37
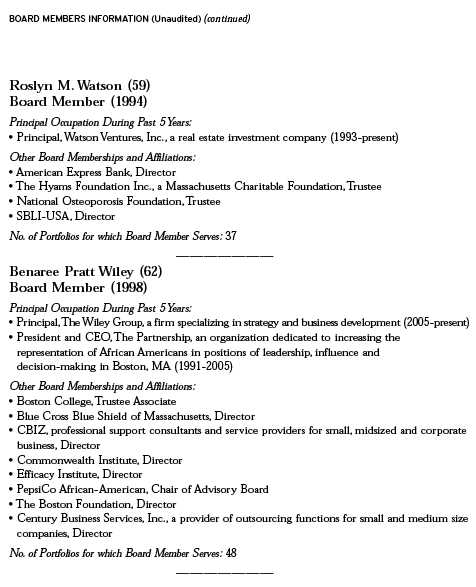
Once elected all Board Members serve for an indefinite term, but achieve Emeritus status upon reaching age 80.The address of the Board Members and Officers is in c/o The Dreyfus Corporation, 200 Park Avenue, NewYork, NewYork 10166. Additional information about the Board Members is available in the fund’s Statement of Additional Information which can be obtained from Dreyfus free of charge by calling this toll free number: 1-800-554-4611.
J.Tomlinson Fort, Emeritus Board Member
38
OFFICERS OF THE FUND (Unaudited)
J. DAVID OFFICER, President since December 2006.
Chief Operating Officer,Vice Chairman and a Director of the Manager, and an officer of 77 investment companies (comprised of 180 portfolios) managed by the Manager. He is 60 years old and has been an employee of the Manager since April 1998.
PHILLIP N. MAISANO, Executive Vice President since July 2007.
Chief Investment Officer,Vice Chair and a director of the Manager, and an officer of 77 investment companies (comprised of 180 portfolios) managed by the Manager. Mr. Maisano also is an officer and/or Board member of certain other investment management subsidiaries of The Bank of New York Mellon Corporation, each of which is an affiliate of the Manager. He is 61 years old and has been an employee of the Manager since November 2006. Prior to joining the Manager, Mr. Maisano served as Chairman and Chief Executive Officer of EACM Advisors, an affiliate of the Manager, since August 2004, and served as Chief Executive Officer of Evaluation Associates, a leading institutional investment consulting firm, from 1988 until 2004.
MICHAEL A. ROSENBERG, Vice President and Secretary since August 2005.
Assistant General Counsel of BNY Mellon, and an officer of 78 investment companies (comprised of 201 portfolios) managed by the Manager. He is 48 years old and has been an employee of the Manager since October 1991.
JAMES BITETTO, Vice President and Assistant Secretary since August 2005.
Senior Counsel of BNY Mellon and Secretary of the Manager, and an officer of 78 investment companies (comprised of 201 portfolios) managed by the Manager. He is 42 years old and has been an employee of the Manager since December 1996.
JONI LACKS CHARATAN, Vice President and Assistant Secretary since August 2005.
Senior Counsel of BNY Mellon, and an officer of 78 investment companies (comprised of 201 portfolios) managed by the Manager. She is 53 years old and has been an employee of the Manager since October 1988.
JOSEPH M. CHIOFFI, Vice President and Assistant Secretary since August 2005.
Senior Counsel of BNY Mellon, and an officer of 78 investment companies (comprised of 201 portfolios) managed by the Manager. He is 47 years old and has been an employee of the Manager since June 2000.
JANETTE E. FARRAGHER, Vice President and Assistant Secretary since August 2005.
Assistant General Counsel of BNY Mellon, and an officer of 78 investment companies (comprised of 201 portfolios) managed by the Manager. She is 46 years old and has been an employee of the Manager since February 1984.
JOHN B. HAMMALIAN, Vice President and Assistant Secretary since August 2005.
Managing Counsel of BNY Mellon, and an officer of 78 investment companies (comprised of 201 portfolios) managed by the Manager. He is 45 years old and has been an employee of the Manager since February 1991.
ROBERT R. MULLERY, Vice President and Assistant Secretary since August 2005.
Managing Counsel of BNY Mellon, and an officer of 78 investment companies (comprised of 201 portfolios) managed by the Manager. He is 56 years old and has been an employee of the Manager since May 1986.
The Fund 39
OFFICERS OF THE FUND (Unaudited) (continued)
JEFF PRUSNOFSKY, Vice President and Assistant Secretary since August 2005.
Managing Counsel of BNY Mellon, and an officer of 78 investment companies (comprised of 201 portfolios) managed by the Manager. He is 43 years old and has been an employee of the Manager since October 1990.
JAMES WINDELS, Treasurer since November 2001.
Director – Mutual Fund Accounting of the Manager, and an officer of 78 investment companies (comprised of 201 portfolios) managed by the Manager. He is 49 years old and has been an employee of the Manager since April 1985.
RICHARD CASSARO, Assistant Treasurer since January 2008.
Senior Accounting Manager – Money Market and Municipal Bond Funds of the Manager, and an officer of 78 investment companies (comprised of 201 portfolios) managed by the Manager. He is 49 years old and has been an employee of the Manager since September 1982.
GAVIN C. REILLY, Assistant Treasurer since December 2005.
Tax Manager of the Investment Accounting and Support Department of the Manager, and an officer of 78 investment companies (comprised of 201 portfolios) managed by the Manager. He is 40 years old and has been an employee of the Manager since April 1991.
ROBERT ROBOL, Assistant Treasurer since December 2002.
Senior Accounting Manager – Fixed Income Funds of the Manager, and an officer of 78 investment companies (comprised of 201 portfolios) managed by the Manager. He is 44 years old and has been an employee of the Manager since October 1988.
ROBERT SALVIOLO, Assistant Treasurer since July 2007.
Senior Accounting Manager – Equity Funds of the Manager, and an officer of 78 investment companies (comprised of 201 portfolios) managed by the Manager. He is 41 years old and has been an employee of the Manager since June 1989.
ROBERT SVAGNA, Assistant Treasurer since December 2002.
Senior Accounting Manager – Equity Funds of the Manager, and an officer of 78 investment companies (comprised of 201 portfolios) managed by the Manager. He is 41 years old and has been an employee of the Manager since November 1990.
JOSEPH W. CONNOLLY, Chief Compliance Officer since October 2004.
Chief Compliance Officer of the Manager and The Dreyfus Family of Funds (78 investment companies, comprised of 201 portfolios). From November 2001 through March 2004, Mr. Connolly was first Vice-President, Mutual Fund Servicing for Mellon Global Securities Services. In that capacity, Mr. Connolly was responsible for managing Mellon’s Custody, Fund Accounting and Fund Administration services to third-party mutual fund clients. He is 51 years old and has served in various capacities with the Manager since 1980, including manager of the firm’s Fund Accounting Department from 1997 through October 2001.
WILLIAM GERMENIS, Anti-Money Laundering Compliance Officer since July 2002.
Vice President and Anti-Money Laundering Compliance Officer of the Distributor, and the Anti-Money Laundering Compliance Officer of 74 investment companies (comprised of 197 portfolios) managed by the Manager. He is 38 years old and has been an employee of the Distributor since October 1998.
40
For More Information
Telephone Call your financial representative or 1-800-554-4611
Mail The Dreyfus Family of Funds, 144 Glenn Curtiss Boulevard, Uniondale, NY 11556-0144
The fund files its complete schedule of portfolio holdings with the Securities and Exchange Commission (“SEC”) for the first and third quarters of each fiscal year on Form N-Q. The fund’s Forms N-Q are available on the SEC’s website at http://www.sec.gov and may be reviewed and copied at the SEC’s Public Reference Room in Washington, DC. Information on the operation of the Public Reference Room may be obtained by calling 1-800-SEC-0330.
A description of the policies and procedures that the fund uses to determine how to vote proxies relating to portfolio securities, and information regarding how the fund voted these proxies for the 12-month period ended June 30, 2008, is available at http://www.dreyfus.com and on the SEC’s website at http://www.sec.gov. The description of the policies and procedures is also available without charge, upon request, by calling 1-800-645-6561.

Save time. Save paper. View your next shareholder report online as soon as it’s available. Log into www.dreyfus.com and sign up for Dreyfus eCommunications. It’s simple and only takes a few minutes.
The views expressed in this report reflect those of the portfolio manager only through the end of the period covered and do not necessarily represent the views of Dreyfus or any other person in the Dreyfus organization. Any such views are subject to change at any time based upon market or other conditions and Dreyfus disclaims any responsibility to update such views.These views may not be relied on as investment advice and, because investment decisions for a Dreyfus fund are based on numerous factors, may not be relied on as an indication of trading intent on behalf of any Dreyfus fund.
Not FDIC-Insured • Not Bank-Guaranteed • May Lose Value
| Contents |
| |
| | | THE FUND |
| |
|
| 2 | | A Letter from the CEO |
| 3 | | Discussion of Fund Performance |
| 6 | | Fund Performance |
| 8 | | Understanding Your Fund’s Expenses |
| 8 | | Comparing Your Fund’s Expenses |
| With Those of Other Funds |
| 9 | | Statement of Investments |
| 24 | | Statement of Assets and Liabilities |
| 25 | | Statement of Operations |
| 26 | | Statement of Changes in Net Assets |
| 28 | | Financial Highlights |
| 32 | | Notes to Financial Statements |
| 45 | | Report of Independent Registered |
| | | Public Accounting Firm |
| 46 | | Important Tax Information |
| 47 | | Board Members Information |
| 49 | | Officers of the Fund |
| FOR MORE INFORMATION |
|
| | | Back Cover |
| Dreyfus |
| Limited Term |
| High Yield Fund |

A LETTER FROM THE CEO
Dear Shareholder:
We present to you this annual report for Dreyfus Limited Term High Yield Fund, covering the 12-month period from January 1, 2008, through December 31, 2008.
2008 was the most difficult year in decades for the financial markets. A credit crunch that began in 2007 exploded in mid-2008 into a global financial crisis, resulting in the failures of major financial institutions, a deep and prolonged recession and lower investment values across a broad range of asset classes. Governments and regulators throughout the world moved aggressively to curtail the damage, implementing unprecedented reductions of short-term interest rates, massive injections of liquidity into the banking system, government bailouts of struggling companies and plans for massive economic stimulus programs. U.S. government securities generally fared well in the ensuing “flight to quality,” but riskier bond market sectors suffered sharp price declines.
Although we expect the U.S. and global economies to remain weak until longstanding imbalances have worked their way out of the system, the financial markets currently appear to have priced in investors’ generally low expectations. In previous recessions, however, the markets have tended to anticipate economic improvement before it occurs, potentially leading to major rallies when few expected them. That’s why it makes sense to remain disciplined, maintain a long-term perspective and adopt a consistent asset allocation strategy that reflects one’s future goals and attitudes toward risk. As always, we urge you to consult with your financial advisor, who can recommend the course of action that is right for you.
For information about how the fund performed during the reporting period, as well as market perspectives, we have provided a Discussion of Fund Performance given by the fund’s Portfolio Manager.
Thank you for your continued confidence and support.

Jonathan R. Baum
Chief Executive Officer
The Dreyfus Corporation
January 15, 2009 |
2

DISCUSSION OF FUND PERFORMANCE
For the period of January 1, 2008, through December 31, 2008, as provided by Karen Bater, Portfolio Manager
Fund and Market Performance Overview
For the 12-month period ended December 31, 2008, Class A, B, C and I shares of Dreyfus Limited Term High Yield Fund produced total returns of –20.17%, –20.69%, –20.89% and –20.06%, respectively.1 In comparison, the Merrill Lynch U.S. HighYield Master II Constrained Index (the “Index”), the fund’s benchmark, achieved a total return of –26.11% over the same period.2
High yield bonds lost considerable value in 2008 as the U.S. economy slowed and a financial crisis intensified, nearly leading to the collapse of the global banking system. However, the fund outperformed its benchmark Index, due to our emphasis on industries that historically have been less sensitive to economic downturns.
The Fund’s Investment Approach
The fund seeks to maximize total return, consisting of capital appreciation and current income.The average effective maturity of the fund is limited to a maximum of 5.5 years.3
At least 80% of the fund’s assets are invested in fixed-income securities that are rated below investment grade (“high yield” or “junk” bonds) or are the unrated equivalent as determined by Dreyfus. Individual issues are selected based on careful credit analysis.We thoroughly analyze the business, management and financial strength of each of the companies whose bonds we buy, then project each issuer’s ability to repay its debt.
Global Financial Crisis Sparked Broad Market Declines
A credit crunch that began in the sub-prime mortgage sector of the U.S. bond market in 2007 developed into a full-blown global financial crisis over the summer of 2008, sending repercussions throughout the world’s credit markets. As the crisis came close to spinning out of control in September, very difficult liquidity conditions in various markets led to the failures of major financial institutions. Unprecedented interventions
The Fund 3
| DISCUSSION OF FUND PERFORMANCE (continued) |
by government and monetary authorities, which pumped billions of dollars of liquidity into the system and rescued struggling corporations, helped thaw frozen credit markets by year-end. These efforts included the Troubled Asset Relief Program (“TARP”) and coordinated cuts of short-term interest rates by central banks, including the Federal Reserve Board, which reduced its target for the overnight federal funds rate to the unprecedented low level of 0% to 0.25%.
Meanwhile, slumping housing markets, rising unemployment and sharply lower consumer confidence exacerbated a downturn in the U.S. economy. Commodity prices that soared over the first half of 2008 plummeted over the second half when demand abated for energy and construction materials worldwide. In November, the National Bureau of Economic Research officially declared that the U.S. economy has been mired in recession since late 2007.
As market conditions deteriorated, many highly leveraged institutional investors were forced to de-lever their portfolios to raise cash for margin calls and redemption requests. Consequently, selling pressure intensified even among fundamentally sound investments. High yield bonds were particularly hard-hit despite default rates that remained well below historical averages. In fact, 2008 represented the worst single calendar year in the high yield bond market’s history.
Defensive Posture Cushioned Volatility
Although the fund was affected by deteriorating investor sentiment during the downturn, we had adopted a relatively defensive investment strategy before the financial crisis reached critical proportions in September. Faced with evidence that the methodologies used by the major credit rating agencies may be flawed, we relied more heavily on our own credit research discipline. Our internal ratings led us to emphasize industry groups that historically have held up relatively well during downturns, including the health care, utilities, cable television, telecommunications and capital goods sectors. We maintained underweight exposure to the hard-hit building products, housing, financial and retail areas.
The efficacy of our credit research was particularly helpful in the CCC rating tier at the lower end of the credit spectrum, which produced dis-
4
mal results for the benchmark but contained several individual issuers whose bonds were held by the fund and produced positive absolute returns in 2008. Among them were two telecommunications service providers that received acquisition offers from larger, higher rated competitors. The fund also received especially positive contributions from the health care and utilities sectors. On the other hand, an overweighted position in the gaming sector detracted from relative performance, as did our security selection strategy in the publishing-and-printing and paper-and-forest products areas.
Anticipating a Return to Fundamentals
As of year-end, the financial crisis has persisted and the economic downturn has worsened. Consequently, we expect default rates to rise from current levels. However, high yield bonds ended the year with yields near record highs compared to U.S.Treasury securities, indicating attractive valuations in some areas. We believe that opportunities may be particularly compelling among bonds issued by companies with strong free cash flows and solid balance sheets that were punished too severely in the downturn. Consequently, as economic and market conditions evolve, we may begin to establish larger positions in high yield bonds that appear poised to rebound in an eventual recovery.
January 15, 2009
| 1 | | Total return includes reinvestment of dividends and any capital gains paid, and does not take into |
| | | consideration the maximum initial sales charge in the case of Class A shares, or the applicable |
| | | contingent deferred sales charges imposed on redemptions in the case of Class B and Class C |
| | | shares. Had these charges been reflected, returns would have been lower. Past performance is no |
| | | guarantee of future results. Share price, yield and investment return fluctuate such that upon |
| | | redemption, fund shares may be worth more or less than their original cost. Return figure provided |
| | | for Class I shares reflects the absorption of certain fund expenses by The Dreyfus Corporation |
| | | pursuant to an agreement in effect through September 30, 2010, at which time it may be |
| | | extended, modified or terminated. Had these expenses not been absorbed, the fund’s Class I return |
| | | would have been lower. |
| 2 | | SOURCE: BLOOMBERG — Reflects reinvestment of dividends and, where applicable, |
| | | capital gain distributions.The Merrill Lynch U.S. HighYield Master II Constrained Index is an |
| | | unmanaged performance benchmark composed of U.S. dollar-denominated domestic andYankee |
| | | bonds rated below investment grade with at least $100 million par amount outstanding and at |
| | | least one year remaining to maturity. Bonds are capitalization-weighted.Total allocations to an |
| | | issuer are capped at 2%.The index does not reflect fees and expenses to which the fund is subject. |
| 3 | | Effective on or about April 1, 2009, the current limitations on the fund’s average effective portfolio |
| | | maturity will be removed and the fund’s name will change from “Dreyfus Limited Term High |
| | | Yield Fund” to “Dreyfus HighYield Fund.” |
The Fund 5
FUND PERFORMANCE
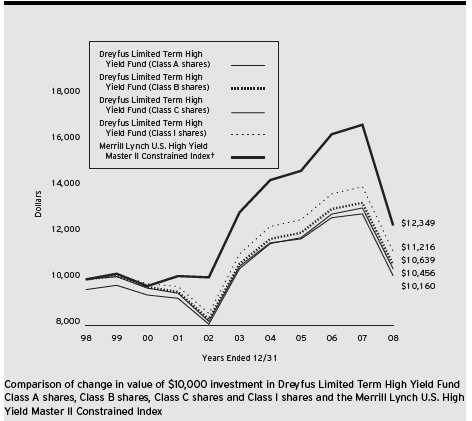
| † Source: Bloomberg L.P. |
| Past performance is not predictive of future performance. |
| The above graph compares a $10,000 investment made in each of the Class A, Class B, Class C and Class I shares of |
| Dreyfus Limited Term HighYield Fund on 12/31/98 to a $10,000 investment made in the Merrill Lynch U.S. High |
| Yield Master II Constrained Index (the “Index”) on that date.All dividends and capital gain distributions are reinvested. |
| The fund’s performance shown in the line graph takes into account the maximum initial sales charge on Class A shares |
| and all other applicable fees and expenses on all classes.The Index is an unmanaged performance benchmark composed of |
| U.S. dollar-denominated domestic andYankee bonds rated below investment grade with at least $100 million par amount |
| outstanding and at least one year remaining to maturity. Bonds are capitalization-weighted.Total allocations to an issuer |
| are capped at 2%. Unlike a mutual fund, the Index is not subject to charges, fees and other expenses. Investors cannot |
| invest directly in any index. Further information relating to fund performance, including expense reimbursements, if |
| applicable, is contained in the Financial Highlights section of the prospectus and elsewhere in this report. |
6
| Average Annual Total Returns as of 12/31/08 | | | | | | |
| | | 1 Year | | 5 Years | | 10 Years |
| |
| |
| |
|
| Class A shares | | | | | | |
| with maximum sales charge (4.5%) | | (23.80)% | | (0.93)% | | 0.45% |
| without sales charge | | (20.17)% | | (0.02)% | | 0.91% |
| Class B shares | | | | | | |
| with applicable redemption charge † | | (23.61)% | | (0.79)% | | 0.62% |
| without redemption | | (20.69)% | | (0.51)% | | 0.62% |
| Class C shares | | | | | | |
| with applicable redemption charge †† | | (21.62)% | | (0.79)% | | 0.16% |
| without redemption | | (20.89)% | | (0.79)% | | 0.16% |
| Class I shares | | (20.06)% | | 0.21% | | 1.16% |
| Past performance is not predictive of future performance.The fund’s performance shown in the graph and table does not |
| reflect the deduction of taxes that a shareholder would pay on fund distributions or the redemption of fund shares. |
| Performance for Class B shares assumes the conversion of Class B shares to Class A shares at the end of the sixth year |
| following the date of purchase. |
| † | | The maximum contingent deferred sales charge for Class B shares is 4%.After six years Class B shares convert to |
| | | Class A shares. |
| †† | | The maximum contingent deferred sales charge for Class C shares is 1% for shares redeemed within one year of the |
| | | date of purchase. |
The Fund 7
UNDERSTANDING YOUR FUND’S EXPENSES (Unaudited)
As a mutual fund investor, you pay ongoing expenses, such as management fees and other expenses. Using the information below, you can estimate how these expenses affect your investment and compare them with the expenses of other funds.You also may pay one-time transaction expenses, including sales charges (loads) and redemption fees, which are not shown in this section and would have resulted in higher total expenses. For more information, see your fund’s prospectus or talk to your financial adviser.
Review your fund’s expenses
The table below shows the expenses you would have paid on a $1,000 investment in Dreyfus Limited Term High Yield Fund from July 1, 2008 to December 31, 2008. It also shows how much a $1,000 investment would be worth at the close of the period, assuming actual returns and expenses.
| Expenses and Value of a $1,000 Investment | | | | | | |
| assuming actual returns for the six months ended December 31, 2008 | | | | |
| | | Class A | | Class B | | Class C | | Class I |
| |
| |
| |
| |
|
| Expenses paid per $1,000† | | $ 4.31 | | $ 6.57 | | $ 7.70 | | $ 3.18 |
| Ending value (after expenses) | | $805.90 | | $803.90 | | $802.90 | | $806.20 |
Using the SEC’s method to compare expenses
The Securities and Exchange Commission (SEC) has established guidelines to help investors assess fund expenses. Per these guidelines, the table below shows your fund’s expenses based on a $1,000 investment, assuming a hypothetical 5% annualized return. You can use this information to compare the ongoing expenses (but not transaction expenses or total cost) of investing in the fund with those of other funds.All mutual fund shareholder reports will provide this information to help you make this comparison. Please note that you cannot use this information to estimate your actual ending account balance and expenses paid during the period.
| Expenses and Value of a $1,000 Investment | | | | | | |
| assuming a hypothetical 5% annualized return for the six months ended December 31, 2008 |
| | | Class A | | Class B | | Class C | | Class I |
| |
| |
| |
| |
|
| Expenses paid per $1,000† | | $ 4.82 | | $ 7.35 | | $ 8.62 | | $ 3.56 |
| Ending value (after expenses) | | $1,020.36 | | $1,017.85 | | $1,016.59 | | $1,021.62 |
† Expenses are equal to the fund’s annualized expense ratio of .95% for Class A, 1.45% for Class B, 1.70% for Class C and .70% for Class I, multiplied by the average account value over the period, multiplied by 184/366 (to reflect the one-half year period).
| COMPARING YOUR FUND’S EXPENSES |
| WITH THOSE OF OTHER FUNDS (Unaudited) |
8
| STATEMENT OF INVESTMENTS |
| December 31, 2008 |
| | | Coupon | | Maturity | | Principal | | | |
| Bonds and Notes—89.5% | | Rate (%) | | Date | | Amount ($) | | | Value ($) |
| |
| |
| |
|
| |
|
| Aerospace—2.6% | | | | | | | | | |
| Bombardier, | | | | | | | | | |
| Sr. Unscd. Notes | | 6.30 | | 5/1/14 | | 1,750,000 | a | | 1,448,125 |
| Bombardier, | | | | | | | | | |
| Sr. Unscd. Notes | | 8.00 | | 11/15/14 | | 1,450,000 | a | | 1,283,250 |
| Esterline Technologies, | | | | | | | | | |
| Gtd. Notes | | 6.63 | | 3/1/17 | | 1,375,000 | | | 1,175,625 |
| Hawker Beechcraft Acquisition, | | | | | | | | | |
| Gtd. Notes | | 8.50 | | 4/1/15 | | 410,000 | | | 170,150 |
| Hawker Beechcraft Acquisition, | | | | | | | | | |
| Gtd. Notes | | 8.88 | | 4/1/15 | | 315,000 | b | | 108,675 |
| Hawker Beechcraft Acquisition, | | | | | | | | | |
| Gtd. Notes | | 9.75 | | 4/1/17 | | 1,290,000 | b | | 354,750 |
| L-3 Communications, | | | | | | | | | |
| Gtd. Notes | | 6.13 | | 7/15/13 | | 475,000 | | | 439,375 |
| L-3 Communications, | | | | | | | | | |
| Gtd. Notes, Ser. B | | 6.38 | | 10/15/15 | | 2,435,000 | | | 2,288,900 |
| L-3 Communications, | | | | | | | | | |
| Gtd. Notes | | 7.63 | | 6/15/12 | | 1,875,000 | | | 1,837,500 |
| | | | | | | | | | 9,106,350 |
| Automotive—3.9% | | | | | | | | | |
| Ford Motor Co., | | | | | | | | | |
| Bank Loan | | 3.47 | | 12/16/13 | | 1,000,000 | c | | 399,720 |
| Ford Motor Credit, | | | | | | | | | |
| Sr. Unscd. Notes | | 7.00 | | 10/1/13 | | 470,000 | b | | 325,033 |
| Ford Motor Credit, | | | | | | | | | |
| Sr. Unscd. Notes | | 7.38 | | 10/28/09 | | 9,265,000 | | | 8,138,172 |
| Ford Motor Credit, | | | | | | | | | |
| Sr. Unscd. Notes | | 8.00 | | 12/15/16 | | 920,000 | b | | 600,021 |
| Ford Motor Credit, | | | | | | | | | |
| Sr. Unscd. Notes | | 8.63 | | 11/1/10 | | 1,135,000 | | | 859,553 |
| Goodyear Tire & Rubber, | | | | | | | | | |
| Gtd. Notes | | 6.32 | | 12/1/09 | | 1,440,000 | c | | 1,317,600 |
| Goodyear Tire & Rubber, | | | | | | | | | |
| Gtd. Notes | | 8.63 | | 12/1/11 | | 1,288,000 | b | | 1,075,480 |
| Goodyear Tire & Rubber, | | | | | | | | | |
| Gtd. Notes | | 9.00 | | 7/1/15 | | 847,000 | b | | 686,070 |
| United Components, | | | | | | | | | |
| Gtd. Notes | | 9.38 | | 6/15/13 | | 1,268,000 | | | 538,900 |
| | | | | | | | | | 13,940,549 |
The Fund 9
STATEMENT OF INVESTMENTS (continued)
| | | Coupon | | Maturity | | Principal | | | |
| Bonds and Notes (continued) | | Rate (%) | | Date | | Amount ($) | | | Value ($) |
| |
| |
| |
|
| |
|
| Building Products—.4% | | | | | | | | | |
| Belden, | | | | | | | | | |
| Gtd. Notes | | 7.00 | | 3/15/17 | | 750,000 | | | 566,250 |
| General Cable, | | | | | | | | | |
| Gtd. Notes | | 7.13 | | 4/1/17 | | 1,455,000 | b | | 967,575 |
| | | | | | | | | | 1,533,825 |
| Cable/Satellite TV—9.1% | | | | | | | | | |
| Cablevision Systems, | | | | | | | | | |
| Sr. Unscd. Notes, Ser. B | | 8.00 | | 4/15/12 | | 6,687,000 | c | | 5,984,865 |
| CCH I, | | | | | | | | | |
| Sr. Scd. Notes | | 11.00 | | 10/1/15 | | 1,960,000 | b | | 352,800 |
| CCH I, | | | | | | | | | |
| Gtd. Notes | | 11.75 | | 5/15/14 | | 2,360,000 | c | | 132,750 |
| CCH II, | | | | | | | | | |
| Sr. Unscd. Notes | | 10.25 | | 9/15/10 | | 10,105,000 | b | | 4,698,825 |
| CCH II, | | | | | | | | | |
| Gtd. Notes | | 10.25 | | 10/1/13 | | 2,055,000 | b | | 750,075 |
| CSC Holdings, | | | | | | | | | |
| Sr. Unscd. Notes | | 7.63 | | 7/15/18 | | 1,080,000 | | | 847,800 |
| CSC Holdings, | | | | | | | | | |
| Sr. Unscd. Notes, Ser. B | | 8.13 | | 7/15/09 | | 750,000 | | | 748,125 |
| DirecTV Holdings Financing, | | | | | | | | | |
| Gtd. Notes | | 7.63 | | 5/15/16 | | 2,175,000 | | | 2,120,625 |
| Echostar DBS, | | | | | | | | | |
| Gtd. Notes | | 6.38 | | 10/1/11 | | 742,000 | | | 691,915 |
| Echostar DBS, | | | | | | | | | |
| Gtd. Notes | | 6.63 | | 10/1/14 | | 1,395,000 | | | 1,168,312 |
| Echostar DBS, | | | | | | | | | |
| Gtd. Notes | | 7.13 | | 2/1/16 | | 6,617,000 | | | 5,558,280 |
| Kabel Deutschland, | | | | | | | | | |
| Sr. Scd. Notes | | 10.63 | | 7/1/14 | | 3,470,000 | | | 3,105,650 |
| Mediacom Broadband, | | | | | | | | | |
| Sr. Unscd. Notes | | 8.50 | | 10/15/15 | | 2,025,000 | b | | 1,328,906 |
| Mediacom, | | | | | | | | | |
| Sr. Unscd. Notes | | 9.50 | | 1/15/13 | | 5,015,000 | b | | 3,811,400 |
| Virgin Media Finance, | | | | | | | | | |
| Gtd. Notes | | 8.75 | | 4/15/14 | | 1,180,000 | | | 890,900 |
| | | | | | | | | | 32,191,228 |
10
| | | Coupon | | Maturity | | Principal | | | |
| Bonds and Notes (continued) | | Rate (%) | | Date | | Amount ($) | | | Value ($) |
| |
| |
| |
|
| |
|
| Capital Goods—3.5% | | | | | | | | | |
| Case New Holland, | | | | | | | | | |
| Gtd. Notes | | 7.13 | | 3/1/14 | | 2,805,000 | | | 2,005,575 |
| Case, | | | | | | | | | |
| Sr. Unscd. Notes | | 7.25 | | 1/15/16 | | 650,000 | b | | 455,000 |
| Columbus McKinnon, | | | | | | | | | |
| Gtd. Notes | | 8.88 | | 11/1/13 | | 473,000 | | | 399,685 |
| Douglas Dynamics, | | | | | | | | | |
| Gtd. Notes | | 7.75 | | 1/15/12 | | 835,000 | a | | 438,375 |
| Leucadia National, | | | | | | | | | |
| Sr. Unscd. Notes | | 7.00 | | 8/15/13 | | 540,000 | | | 432,000 |
| Leucadia National, | | | | | | | | | |
| Sr. Unscd. Notes | | 7.13 | | 3/15/17 | | 3,055,000 | | | 2,283,612 |
| Mueller Water Products, | | | | | | | | | |
| Gtd. Notes | | 7.38 | | 6/1/17 | | 385,000 | | | 263,725 |
| RBS Global & Rexnord, | | | | | | | | | |
| Gtd. Notes | | 9.50 | | 8/1/14 | | 2,670,000 | | | 2,002,500 |
| RBS Global & Rexnord, | | | | | | | | | |
| Gtd. Notes | | 11.75 | | 8/1/16 | | 1,555,000 | b | | 890,238 |
| Terex, | | | | | | | | | |
| Gtd. Notes | | 7.38 | | 1/15/14 | | 3,810,000 | | | 3,333,750 |
| | | | | | | | | | 12,504,460 |
| Chemicals—2.2% | | | | | | | | | |
| Airgas, | | | | | | | | | |
| Gtd. Notes | | 6.25 | | 7/15/14 | | 750,000 | b | | 641,250 |
| Arco Chemical, | | | | | | | | | |
| Sr. Scd. Notes | | 10.25 | | 11/1/10 | | 105,000 | d | | 17,325 |
| Huntsman International, | | | | | | | | | |
| Gtd. Notes | | 7.88 | | 11/15/14 | | 915,000 | | | 494,100 |
| Huntsman, | | | | | | | | | |
| Scd. Notes | | 11.63 | | 10/15/10 | | 652,000 | | | 572,130 |
| Invista, | | | | | | | | | |
| Sr. Unscd. Notes | | 9.25 | | 5/1/12 | | 3,710,000 | a | | 2,615,550 |
| Koppers, | | | | | | | | | |
| Sr. Scd. Notes | | 9.88 | | 10/15/13 | | 320,000 | | | 296,000 |
| Mosaic, | | | | | | | | | |
| Sr. Unscd. Notes | | 7.38 | | 12/1/14 | | 475,000 | a,c | | 389,940 |
The Fund 11
STATEMENT OF INVESTMENTS (continued)
| | | Coupon | | Maturity | | Principal | | | |
| Bonds and Notes (continued) | | Rate (%) | | Date | | Amount ($) | | | Value ($) |
| |
| |
| |
|
| |
|
| Chemicals (continued) | | | | | | | | | |
| Mosaic, | | | | | | | | | |
| Sr. Unscd. Notes | | 7.63 | | 12/1/16 | | 150,000 | a,c | | 120,166 |
| Nalco, | | | | | | | | | |
| Gtd. Notes | | 7.75 | | 11/15/11 | | 825,000 | | | 796,125 |
| Nalco, | | | | | | | | | |
| Gtd. Notes | | 8.88 | | 11/15/13 | | 1,103,000 | b | | 937,550 |
| Reichhold Industries, | | | | | | | | | |
| Sr. Notes | | 9.00 | | 8/15/14 | | 825,000 | a | | 548,625 |
| Rockwood Specialties Group, | | | | | | | | | |
| Gtd. Notes | | 7.50 | | 11/15/14 | | 550,000 | c | | 426,250 |
| | | | | | | | | | 7,855,011 |
| Commercial Mortgage | | | | | | | | | |
| Pass-Through Ctfs.—.2% | | | | | | | | | |
| Global Signal Trust, | | | | | | | | | |
| Ser. 2006-1, Cl. F | | 7.04 | | 2/15/36 | | 1,080,000 | a | | 709,981 |
| Consumer Products—.2% | | | | | | | | | |
| Chattem, | | | | | | | | | |
| Sr. Sub. Notes | | 7.00 | | 3/1/14 | | 826,000 | | | 714,490 |
| Containers—2.4% | | | | | | | | | |
| Ball, | | | | | | | | | |
| Gtd. Notes | | 6.88 | | 12/15/12 | | 90,000 | | | 89,550 |
| Crown Americas, | | | | | | | | | |
| Gtd. Notes | | 7.63 | | 11/15/13 | | 1,249,000 | | | 1,242,755 |
| Crown Americas, | | | | | | | | | |
| Gtd. Notes | | 7.75 | | 11/15/15 | | 3,835,000 | b | | 3,835,000 |
| Owens Brockway Glass Container, | | | | | | | | | |
| Gtd. Notes | | 6.75 | | 12/1/14 | | 1,319,000 | | | 1,220,075 |
| Owens Brockway Glass Container, | | | | | | | | | |
| Gtd. Notes | | 8.25 | | 5/15/13 | | 515,000 | | | 509,850 |
| Plastipak Holdings, | | | | | | | | | |
| Sr. Notes | | 8.50 | | 12/15/15 | | 1,700,000 | a | | 1,147,500 |
| Silgan Holdings, | | | | | | | | | |
| Sr. Sub. Notes | | 6.75 | | 11/15/13 | | 530,000 | | | 458,450 |
| | | | | | | | | | 8,503,180 |
| Energy—7.7% | | | | | | | | | |
| Amerigas Partners, | | | | | | | | | |
| Sr. Unscd. Notes | | 7.25 | | 5/20/15 | | 1,245,000 | | | 1,020,900 |
| Chesapeake Energy, | | | | | | | | | |
| Gtd. Notes | | 7.00 | | 8/15/14 | | 2,315,000 | | | 1,933,025 |
12
| Bonds and Notes (continued) | | Rate (%) | | Date | | Amount ($) | | | Value ($) |
| |
| |
| |
|
| |
|
| Energy (continued) | | | | | | | | | |
| Chesapeake Energy, | | | | | | | | | |
| Gtd. Notes | | 7.25 | | 12/15/18 | | 855,000 | | | 671,175 |
| Chesapeake Energy, | | | | | | | | | |
| Gtd. Notes | | 7.50 | | 9/15/13 | | 1,075,000 | | | 929,875 |
| Chesapeake Energy, | | | | | | | | | |
| Gtd. Notes | | 7.50 | | 6/15/14 | | 1,395,000 | | | 1,185,750 |
| Cie Generale de | | | | | | | | | |
| Geophysique-Veritas, | | | | | | | | | |
| Gtd. Notes | | 7.50 | | 5/15/15 | | 1,190,000 | | | 743,750 |
| Cie Generale de | | | | | | | | | |
| Geophysique-Veritas, Gtd. Notes | | 7.75 | | 5/15/17 | | 250,000 | | | 146,250 |
| Cimarex Energy, | | | | | | | | | |
| Gtd. Notes | | 7.13 | | 5/1/17 | | 2,355,000 | | | 1,848,675 |
| El Paso Natural Gas, | | | | | | | | | |
| Sr. Unscd. Bonds | | 8.38 | | 6/15/32 | | 795,000 | c | | 689,973 |
| El Paso, | | | | | | | | | |
| Sr. Unscd. Notes | | 7.00 | | 6/15/17 | | 1,560,000 | | | 1,228,664 |
| El Paso, | | | | | | | | | |
| Sr. Unscd. Notes | | 12.00 | | 12/12/13 | | 595,000 | b | | 586,075 |
| Ferrellgas, | | | | | | | | | |
| Sr. Unscd. Notes | | 6.75 | | 5/1/14 | | 1,365,000 | | | 948,675 |
| Forest Oil, | | | | | | | | | |
| Gtd. Notes | | 7.25 | | 6/15/19 | | 320,000 | b | | 235,200 |
| Newfield Exploration, | | | | | | | | | |
| Sr. Sub. Notes | | 6.63 | | 4/15/16 | | 2,390,000 | | | 1,912,000 |
| PetroHawk Energy, | | | | | | | | | |
| Gtd. Notes | | 9.13 | | 7/15/13 | | 2,705,000 | | | 2,204,575 |
| Range Resources, | | | | | | | | | |
| Gtd. Notes | | 7.25 | | 5/1/18 | | 1,030,000 | | | 865,200 |
| Range Resources, | | | | | | | | | |
| Gtd. Notes | | 7.50 | | 10/1/17 | | 955,000 | b | | 816,525 |
| Sabine Pass LNG, | | | | | | | | | |
| Sr. Scd. Notes | | 7.25 | | 11/30/13 | | 530,000 | b | | 389,550 |
| Sabine Pass LNG, | | | | | | | | | |
| Sr. Scd. Notes | | 7.50 | | 11/30/16 | | 1,680,000 | | | 1,218,000 |
| SouthWestern Energy, | | | | | | | | | |
| Sr. Notes | | 7.50 | | 2/1/18 | | 455,000 | a | | 400,400 |
| Whiting Petroleum, | | | | | | | | | |
| Gtd. Notes | | 7.25 | | 5/1/13 | | 2,810,000 | | | 2,009,150 |
The Fund 13
STATEMENT OF INVESTMENTS (continued)
| | | Coupon | | Maturity | | Principal | | | |
| Bonds and Notes (continued) | | Rate (%) | | Date | | Amount ($) | | | Value ($) |
| |
| |
| |
|
| |
|
| Energy (continued) | | | | | | | | | |
| Williams Cos., | | | | | | | | | |
| Sr. Unscd. Notes | | 3.44 | | 10/1/10 | | 2,375,000 | a,c | | 2,095,496 |
| Williams Cos., | | | | | | | | | |
| Sr. Unscd. Notes | | 7.13 | | 9/1/11 | | 860,000 | b | | 791,664 |
| Williams Cos., | | | | | | | | | |
| Sr. Unscd. Notes | | 7.63 | | 7/15/19 | | 1,500,000 | | | 1,173,810 |
| Williams Cos., | | | | | | | | | |
| Sr. Unscd. Notes | | 7.88 | | 9/1/21 | | 1,170,000 | | | 896,652 |
| Williams Partners, | | | | | | | | | |
| Sr. Unscd. Notes | | 7.25 | | 2/1/17 | | 790,000 | | | 624,986 |
| | | | | | | | | | 27,565,995 |
| Finance—1.3% | | | | | | | | | |
| Chevy Chase Bank, | | | | | | | | | |
| Sub. Notes | | 6.88 | | 12/1/13 | | 2,190,000 | | | 1,765,687 |
| HUB International Holdings, | | | | | | | | | |
| Sr. Sub. Notes | | 10.25 | | 6/15/15 | | 1,820,000 | a | | 812,175 |
| Inmarsat Finance, | | | | | | | | | |
| Sr. Scd. Notes | | 7.63 | | 6/30/12 | | 769,000 | | | 673,836 |
| Ipayment, | | | | | | | | | |
| Gtd. Notes | | 9.75 | | 5/15/14 | | 2,270,000 | | | 1,146,350 |
| UCI Holdco, | | | | | | | | | |
| Sr. Unscd. Notes | | 10.00 | | 12/15/13 | | 544,524 | c | | 95,292 |
| | | | | | | | | | 4,493,340 |
| Food/ Beverage/Tobacco—1.1% | | | | | | | | | |
| Constellation Brands, | | | | | | | | | |
| Gtd. Notes | | 7.25 | | 9/1/16 | | 425,000 | | | 403,750 |
| Dean Foods, | | | | | | | | | |
| Gtd. Notes | | 7.00 | | 6/1/16 | | 750,000 | b | | 641,250 |
| Del Monte, | | | | | | | | | |
| Gtd. Notes | | 8.63 | | 12/15/12 | | 2,136,000 | c | | 2,082,600 |
| Smithfield Foods, | | | | | | | | | |
| Sr. Unscd. Notes, Ser. B | | 7.75 | | 5/15/13 | | 295,000 | b | | 191,012 |
| Smithfield Foods, | | | | | | | | | |
| Sr. Unscd. Notes, Ser. B | | 8.00 | | 10/15/09 | | 675,000 | b | | 644,625 |
| | | | | | | | | | 3,963,237 |
| Gaming—2.7% | | | | | | | | | |
| Boyd Gaming, | | | | | | | | | |
| Sr. Sub. Notes | | 7.75 | | 12/15/12 | | 1,235,000 | b | | 1,117,675 |
14
| | | Coupon | | Maturity | | Principal | | | |
| Bonds and Notes (continued) | | Rate (%) | | Date | | Amount ($) | | | Value ($) |
| |
| |
| |
|
| |
|
| Gaming (continued) | | | | | | | | | |
| Caesars Entertainment, | | | | | | | | | |
| Gtd. Notes | | 7.88 | | 3/15/10 | | 230,000 | b | | 152,950 |
| Isle of Capri Casinos, | | | | | | | | | |
| Gtd. Notes | | 7.00 | | 3/1/14 | | 3,190,000 | b | | 1,371,700 |
| MGM Mirage, | | | | | | | | | |
| Gtd. Notes | | 8.38 | | 2/1/11 | | 1,081,000 | b | | 648,600 |
| Mohegan Tribal Gaming, | | | | | | | | | |
| Gtd. Notes | | 6.38 | | 7/15/09 | | 1,723,000 | | | 1,628,235 |
| Pinnacle Entertainment, | | | | | | | | | |
| Gtd. Notes | | 8.75 | | 10/1/13 | | 1,410,000 | b | | 1,120,950 |
| Pokagon Gaming Authority, | | | | | | | | | |
| Sr. Notes | | 10.38 | | 6/15/14 | | 1,629,000 | a | | 1,409,085 |
| Scientific Games, | | | | | | | | | |
| Gtd. Notes | | 6.25 | | 12/15/12 | | 107,000 | | | 86,670 |
| Seneca Gaming, | | | | | | | | | |
| Sr. Unscd. Notes, Ser. B | | 7.25 | | 5/1/12 | | 1,395,000 | | | 1,129,950 |
| Shingle Springs Tribal Group, | | | | | | | | | |
| Sr. Notes | | 9.38 | | 6/15/15 | | 1,220,000 | a | | 616,100 |
| Snoqualmie Entertainment | | | | | | | | | |
| Authority, Sr. Scd. Notes | | 6.88 | | 2/1/14 | | 310,000 | a,c | | 181,350 |
| Snoqualmie Entertainment | | | | | | | | | |
| Authority, Sr. Scd. Notes | | 9.13 | | 2/1/15 | | 160,000 | a | | 100,000 |
| | | | | | | | | | 9,563,265 |
| Health Care—12.0% | | | | | | | | | |
| Bausch & Lomb, | | | | | | | | | |
| Sr. Unscd. Notes | | 9.88 | | 11/1/15 | | 6,285,000 | a,b | | 4,729,462 |
| Biomet, | | | | | | | | | |
| Gtd. Notes | | 11.63 | | 10/15/17 | | 12,685,000 | b | | 10,909,100 |
| Community Health Systems, | | | | | | | | | |
| Gtd. Notes | | 8.88 | | 7/15/15 | | 4,485,000 | | | 4,148,625 |
| Davita, | | | | | | | | | |
| Gtd. Notes | | 6.63 | | 3/15/13 | | 1,745,000 | | | 1,666,475 |
| FMC Finance III, | | | | | | | | | |
| Gtd. Notes | | 6.88 | | 7/15/17 | | 810,000 | | | 761,400 |
| Hanger Orthopedic Group, | | | | | | | | | |
| Gtd. Notes | | 10.25 | | 6/1/14 | | 905,000 | | | 814,500 |
| HCA, | | | | | | | | | |
| Sr. Unscd. Notes | | 6.30 | | 10/1/12 | | 9,895,000 | | | 7,025,450 |
The Fund 15
STATEMENT OF INVESTMENTS (continued)
| | | Coupon | | Maturity | | Principal | | | |
| Bonds and Notes (continued) | | Rate (%) | | Date | | Amount ($) | | | Value ($) |
| |
| |
| |
|
| |
|
| Health Care (continued) | | | | | | | | | |
| HCA, | | | | | | | | | |
| Sr. Unscd. Notes | | 6.50 | | 2/15/16 | | 1,450,000 | | | 899,000 |
| HCA, | | | | | | | | | |
| Sr. Unscd. Notes | | 6.95 | | 5/1/12 | | 899,000 | b | | 741,675 |
| HCA, | | | | | | | | | |
| Sr. Unscd. Notes | | 8.75 | | 9/1/10 | | 854,000 | | | 824,110 |
| HCA, | | | | | | | | | |
| Sr. Scd. Notes | | 9.13 | | 11/15/14 | | 1,955,000 | b | | 1,818,150 |
| HCA, | | | | | | | | | |
| Sr. Scd. Notes | | 9.25 | | 11/15/16 | | 5,235,000 | | | 4,816,200 |
| Health Management Associates, | | | | | | | | | |
| Sr. Unscd. Notes | | 6.13 | | 4/15/16 | | 1,075,000 | | | 671,875 |
| Omega Healthcare Investors, | | | | | | | | | |
| Gtd. Notes | | 7.00 | | 4/1/14 | | 710,000 | | | 578,650 |
| Omega Healthcare Investors, | | | | | | | | | |
| Gtd. Notes | | 7.00 | | 1/15/16 | | 765,000 | | | 577,575 |
| Service Corp. International, | | | | | | | | | |
| Sr. Unscd. Notes | | 6.75 | | 4/1/15 | | 555,000 | b | | 441,225 |
| Tenet Healthcare, | | | | | | | | | |
| Sr. Unscd. Notes | | 6.38 | | 12/1/11 | | 645,000 | | | 501,487 |
| Universal Hospital Services, | | | | | | | | | |
| Sr. Scd. Notes , | | 5.94 | | 6/1/15 | | 185,000 | c | | 113,775 |
| Universal Hospital Services, | | | | | | | | | |
| Sr. Scd. Notes | | 8.50 | | 6/1/15 | | 835,000 | | | 597,025 |
| | | | | | | | | | 42,635,759 |
| Leisure—1.3% | | | | | | | | | |
| Cinemark, | | | | | | | | | |
| Sr. Discount Notes | | 9.75 | | 3/15/14 | | 2,125,000 | e | | 1,729,219 |
| Gaylord Entertainment, | | | | | | | | | |
| Gtd. Notes | | 8.00 | | 11/15/13 | | 900,000 | | | 625,500 |
| Host Hotels & Resorts, | | | | | | | | | |
| Sr. Scd. Notes, Ser. Q | | 6.75 | | 6/1/16 | | 625,000 | | | 459,375 |
| Host Hotels & Resorts, | | | | | | | | | |
| Sr. Scd. Notes, Ser. M | | 7.00 | | 8/15/12 | | 1,025,000 | | | 873,813 |
| Marquee Holdings, | | | | | | | | | |
| Sr. Discount Notes | | 12.00 | | 8/15/14 | | 772,000 | c | | 397,580 |
| Speedway Motorsports, | | | | | | | | | |
| Gtd. Notes | | 6.75 | | 6/1/13 | | 835,000 | | | 605,375 |
| | | | | | | | | | 4,690,862 |
16
| | | Coupon | | Maturity | | Principal | | | |
| Bonds and Notes (continued) | | Rate (%) | | Date | | Amount ($) | | | Value ($) |
| |
| |
| |
|
| |
|
| Media—1.7% | | | | | | | | | |
| Clear Channel Communication, | | | | | | | | | |
| Sr. Unscd. Notes | | 10.75 | | 8/1/16 | | 1,275,000 | a,b | | 267,750 |
| ION Media Networks, | | | | | | | | | |
| Sr. Sub. Notes | | 11.00 | | 7/31/13 | | 35,172 | a | | 246 |
| Lamar Media, | | | | | | | | | |
| Gtd. Notes, Ser. B | | 6.63 | | 8/15/15 | | 679,000 | | | 493,972 |
| Lamar Media, | | | | | | | | | |
| Gtd. Notes | | 6.63 | | 8/15/15 | | 5,300,000 | b | | 3,855,750 |
| Lamar Media, | | | | | | | | | |
| Gtd. Notes | | 7.25 | | 1/1/13 | | 110,000 | b | | 88,275 |
| LBI Media, | | | | | | | | | |
| Sr. Sub. Notes | | 8.50 | | 8/1/17 | | 2,040,000 | a | | 724,200 |
| LIN Television, | | | | | | | | | |
| Gtd. Notes, Ser. B | | 6.50 | | 5/15/13 | | 325,000 | | | 153,563 |
| Nexstar Broadcasting, | | | | | | | | | |
| Gtd. Notes | | 7.00 | | 1/15/14 | | 410,000 | b | | 178,863 |
| Nexstar Finance Holdings, | | | | | | | | | |
| Sr. Discount Notes | | 11.38 | | 4/1/13 | | 611,057 | c | | 266,574 |
| | | | | | | | | | 6,029,193 |
| Metals Mining—1.9% | | | | | | | | | |
| Arch Western Finance, | | | | | | | | | |
| Sr. Scd. Notes | | 6.75 | | 7/1/13 | | 750,000 | c | | 656,250 |
| CSN Islands IX, | | | | | | | | | |
| Gtd. Notes | | 10.00 | | 1/15/15 | | 1,500,000 | a,c | | 1,492,500 |
| Freeport-McMoRan Cooper & Gold, | | | | | | | | | |
| Sr. Unscd. Notes | | 8.25 | | 4/1/15 | | 2,689,000 | | | 2,288,285 |
| Peabody Energy, | | | | | | | | | |
| Gtd. Notes, Ser. B | | 6.88 | | 3/15/13 | | 805,000 | b | | 766,762 |
| Steel Dynamics, | | | | | | | | | |
| Gtd. Notes | | 7.38 | | 11/1/12 | | 690,000 | | | 507,150 |
| Steel Dynamics, | | | | | | | | | |
| Sr. Unscd. Notes | | 7.75 | | 4/15/16 | | 1,445,000 | a | | 1,007,888 |
| | | | | | | | | | 6,718,835 |
| Paper—2.3% | | | | | | | | | |
| Georgia-Pacific, | | | | | | | | | |
| Gtd. Notes | | 7.00 | | 1/15/15 | | 2,210,000 | a | | 1,889,550 |
| Jefferson Smurfit, | | | | | | | | | |
| Sr. Unscd. Notes | | 8.25 | | 10/1/12 | | 500,000 | | | 87,500 |
The Fund 17
STATEMENT OF INVESTMENTS (continued)
| | | Coupon | | Maturity | | Principal | | | |
| Bonds and Notes (continued) | | Rate (%) | | Date | | Amount ($) | | | Value ($) |
| |
| |
| |
|
| |
|
| Paper (continued) | | | | | | | | | |
| NewPage, | | | | | | | | | |
| Sr. Scd. Notes | | 10.00 | | 5/1/12 | | 190,000 | | | 84,550 |
| NewPage, | | | | | | | | | |
| Gtd. Notes | | 12.00 | | 5/1/13 | | 3,944,000 | b | | 1,143,760 |
| Norampac, | | | | | | | | | |
| Gtd. Notes | | 6.75 | | 6/1/13 | | 2,380,000 | b | | 1,082,900 |
| Smurfit Kappa Funding, | | | | | | | | | |
| Sr. Sub. Notes | | 7.75 | | 4/1/15 | | 1,626,000 | | | 894,300 |
| Smurfit-Stone Container, | | | | | | | | | |
| Sr. Unscd. Notes | | 8.00 | | 3/15/17 | | 3,585,000 | b | | 699,075 |
| Smurfit-Stone Container, | | | | | | | | | |
| Sr. Unscd. Notes | | 8.38 | | 7/1/12 | | 2,305,000 | | | 391,850 |
| Verso Paper Holdings, | | | | | | | | | |
| Sr. Scd. Notes, Ser. B | | 6.94 | | 8/1/14 | | 755,000 | c | | 222,725 |
| Verso Paper Holdings, | | | | | | | | | |
| Gtd. Notes, Ser. B | | 11.38 | | 8/1/16 | | 5,320,000 | | | 1,622,600 |
| | | | | | | | | | 8,118,810 |
| Publishing/Printing—.4% | | | | | | | | | |
| Dex Media West/Finance, | | | | | | | | | |
| Sr. Unscd. Notes, Ser. B | | 8.50 | | 8/15/10 | | 520,000 | b | | 317,200 |
| Dex Media West/Finance, | | | | | | | | | |
| Sr. Sub. Notes, Ser. B | | 9.88 | | 8/15/13 | | 3,699,000 | | | 887,760 |
| Dex Media, | | | | | | | | | |
| Sr. Unscd. Notes | | 8.00 | | 11/15/13 | | 50,000 | | | 9,500 |
| R.H. Donnelley, | | | | | | | | | |
| Sr. Unscd. Notes, Ser. A-4 | | 8.88 | | 10/15/17 | | 1,655,000 | | | 256,525 |
| | | | | | | | | | 1,470,985 |
| Retail—.5% | | | | | | | | | |
| Levi Strauss & Co., | | | | | | | | | |
| Sr. Unscd. Notes | | 9.75 | | 1/15/15 | | 1,755,000 | | | 1,307,475 |
| Neiman Marcus Group, | | | | | | | | | |
| Gtd. Notes | | 10.38 | | 10/15/15 | | 1,159,000 | b | | 504,165 |
| | | | | | | | | | 1,811,640 |
| Retail-Food & Drug—1.4% | | | | | | | | | |
| Rite Aid, | | | | | | | | | |
| Sr. Scd. Notes | | 10.38 | | 7/15/16 | | 1,145,000 | b | | 847,300 |
| Stater Brothers Holdings, | | | | | | | | | |
| Gtd. Notes | | 7.75 | | 4/15/15 | | 505,000 | | | 426,725 |
18
| | | Coupon | | Maturity | | Principal | | | |
| Bonds and Notes (continued) | | Rate (%) | | Date | | Amount ($) | | | Value ($) |
| |
| |
| |
|
| |
|
| Retail-Food & Drug (continued) | | | | | | | | | |
| Stater Brothers Holdings, | | | | | | | | | |
| Gtd. Notes | | 8.13 | | 6/15/12 | | 3,223,000 | | | 2,932,930 |
| SUPERVALU, | | | | | | | | | |
| Sr. Unscd. Bonds | | 7.50 | | 11/15/14 | | 835,000 | | | 688,875 |
| | | | | | | | | | 4,895,830 |
| Services—2.8% | | | | | | | | | |
| Allied Waste North America, | | | | | | | | | |
| Sr. Scd. Notes | | 6.88 | | 6/1/17 | | 3,445,000 | | | 3,208,814 |
| Corrections Corp. of America, | | | | | | | | | |
| Gtd. Notes | | 6.25 | | 3/15/13 | | 1,710,000 | | | 1,598,850 |
| Corrections Corp. of America, | | | | | | | | | |
| Gtd. Notes | | 7.50 | | 5/1/11 | | 1,515,000 | | | 1,507,425 |
| Education Management, | | | | | | | | | |
| Gtd. Notes | | 8.75 | | 6/1/14 | | 625,000 | | | 478,125 |
| Education Management, | | | | | | | | | |
| Gtd. Notes | | 10.25 | | 6/1/16 | | 2,736,000 | b | | 1,997,280 |
| Stena, | | | | | | | | | |
| Sr. Unscd. Notes | | 7.50 | | 11/1/13 | | 1,001,000 | | | 666,916 |
| WCA Waste, | | | | | | | | | |
| Gtd. Notes | | 9.25 | | 6/15/14 | | 825,000 | | | 614,625 |
| | | | | | | | | | 10,072,035 |
| Technology—3.6% | | | | | | | | | |
| Amkor Technologies, | | | | | | | | | |
| Sr. Notes | | 9.25 | | 6/1/16 | | 2,055,000 | | | 1,202,175 |
| Ceridian, | | | | | | | | | |
| Sr. Unscd. Notes | | 11.50 | | 11/15/15 | | 11,770,000 | a | | 6,282,238 |
| First Data, | | | | | | | | | |
| Gtd. Notes | | 9.88 | | 9/24/15 | | 2,380,000 | b | | 1,451,800 |
| Nortel Networks, | | | | | | | | | |
| Gtd. Notes | | 10.75 | | 7/15/16 | | 1,055,000 | d | | 284,850 |
| Sungard Data Systems, | | | | | | | | | |
| Gtd. Notes | | 10.25 | | 8/15/15 | | 5,296,000 | | | 3,521,840 |
| | | | | | | | | | 12,742,903 |
| Telecommunications—12.0% | | | | | | | | | |
| ALLTEL Communications, | | | | | | | | | |
| Bank Loan | | 3.47 | | 5/15/15 | | 2,000,000 | c | | 1,966,500 |
| ALLTEL Communications, | | | | | | | | | |
| Gtd. Notes | | 10.38 | | 12/1/17 | | 1,850,000 | a | | 2,081,250 |
The Fund 19
STATEMENT OF INVESTMENTS (continued)
| | | | | Coupon | | Maturity | | Principal | | | |
| Bonds and Notes (continued) | | Rate (%) | | Date | | Amount ($) | | | Value ($) |
| |
| |
| |
|
| |
|
| Telecommunications (continued) | | | | | | | | | |
| Centennial Cellular Operating, | | | | | | | | | |
| Gtd. Notes | | | | 10.13 | | 6/15/13 | | 2,525,000 | | | 2,562,875 |
| Centennial Communications, | | | | | | | | | |
| Sr. Unscd. Notes | | | | 8.13 | | 2/1/14 | | 1,165,000 | b,c | | 1,188,300 |
| Centennial Communications, | | | | | | | | | |
| Sr. Unscd. Notes | | | | 10.00 | | 1/1/13 | | 4,479,000 | b | | 4,658,160 |
| Digicel Group, | | | | | | | | | | | |
| Sr. Unscd. Notes | | | | 8.88 | | 1/15/15 | | 2,095,000 | a,b | | 1,372,225 |
| Digicel Group, | | | | | | | | | | | |
| Sr. Unscd. Notes | | | | 9.13 | | 1/15/15 | | 1,712,000 | a,b | | 1,087,120 |
| Frontier Communications, | | | | | | | | | | | |
| Sr. Unscd. Notes | | | | 6.25 | | 1/15/13 | | 740,000 | | | 632,700 |
| Frontier Communications, | | | | | | | | | | | |
| Sr. Unscd. Notes | | | | 9.25 | | 5/15/11 | | 1,305,000 | | | 1,246,275 |
| Inmarsat Finance II, | | | | | | | | | | | |
| Gtd. Notes | | | | 10.38 | | 11/15/12 | | 330,000 | c | | 294,113 |
| Intelsat Jackson Holdings, | | | | | | | | | | | |
| Gtd. Notes | | | | 11.25 | | 6/15/16 | | 8,320,000 | | | 7,612,800 |
| Intelsat, | | | | | | | | | | | |
| Sr. Unscd. Notes | | | | 6.50 | | 11/1/13 | | 7,300,000 | | | 4,124,500 |
| Intelsat, | | | | | | | | | | | |
| Sr. Unscd. Notes | | | | 7.63 | | 4/15/12 | | 3,905,000 | b | | 2,635,875 |
| Nordic Telephone Holdings, | | | | | | | | | |
| Sr. Scd. Notes | | EUR | | 8.25 | | 5/1/16 | | 1,175,000 | a,f | | 1,094,315 |
| Nordic Telephone Holdings, | | | | | | | | | |
| Sr. Scd. Bonds | | | | 8.88 | | 5/1/16 | | 945,000 | a,b | | 666,225 |
| Qwest Communications | | | | | | | | | | | |
| International, | | | | | | | | | | | |
| Gtd. Notes | | | | 7.25 | | 2/15/11 | | 1,775,000 | | | 1,553,125 |
| Qwest, | | | | | | | | | | | |
| Sr. Unscd. Notes | | | | 5.25 | | 6/15/13 | | 625,000 | c | | 468,750 |
| Qwest, | | | | | | | | | | | |
| Bank Note, Ser. B | | | | 6.95 | | 6/30/10 | | 375,000 | c | | 341,250 |
| Qwest, | | | | | | | | | | | |
| Bank Note, Ser. B | | | | 6.95 | | 6/30/10 | | 477,000 | c | | 434,070 |
| Qwest, | | | | | | | | | | | |
| Sr. Unscd. Notes | | | | 7.50 | | 10/1/14 | | 650,000 | b | | 542,750 |
| Qwest, | | | | | | | | | | | |
| Sr. Unscd. Notes | | | | 7.88 | | 9/1/11 | | 440,000 | | | 407,000 |
20
| | | Coupon | | Maturity | | Principal | | | |
| Bonds and Notes (continued) | | Rate (%) | | Date | | Amount ($) | | | Value ($) |
| |
| |
| |
|
| |
|
| Telecommunications (continued) | | | | | | | | | |
| Sprint Capital, | | | | | | | | | |
| Gtd. Notes | | 6.88 | | 11/15/28 | | 2,440,000 | | | 1,454,748 |
| Wind Acquisition Finance, | | | | | | | | | |
| Sr. Scd. Bonds | | 10.75 | | 12/1/15 | | 1,100,000 | a | | 951,500 |
| Windstream, | | | | | | | | | |
| Gtd. Notes | | 8.13 | | 8/1/13 | | 1,919,000 | | | 1,775,075 |
| Windstream, | | | | | | | | | |
| Gtd. Notes | | 8.63 | | 8/1/16 | | 1,234,000 | | | 1,098,260 |
| | | | | | | | | | 42,249,761 |
| Utilities—12.3% | | | | | | | | | |
| AES, | | | | | | | | | |
| Sr. Unscd. Notes | | 7.75 | | 10/15/15 | | 3,210,000 | | | 2,712,450 |
| AES, | | | | | | | | | |
| Sr. Unscd. Notes | | 8.00 | | 10/15/17 | | 2,960,000 | | | 2,442,000 |
| AES, | | | | | | | | | |
| Sr. Scd. Notes | | 8.75 | | 5/15/13 | | 597,000 | a | | 576,105 |
| Aquila, | | | | | | | | | |
| Sr. Unscd. Notes | | 7.95 | | 2/1/11 | | 525,000 | | | 514,463 |
| Dynegy Holdings, | | | | | | | | | |
| Sr. Unscd. Notes | | 8.38 | | 5/1/16 | | 3,435,000 | | | 2,456,025 |
| Dynegy Holdings, | | | | | | | | | |
| Sr. Unscd. Notes | | 8.75 | | 2/15/12 | | 270,000 | b | | 238,950 |
| Edison Mission Energy, | | | | | | | | | |
| Sr. Unscd. Notes | | 7.00 | | 5/15/17 | | 1,010,000 | | | 883,750 |
| Edison Mission Energy, | | | | | | | | | |
| Sr. Unscd. Notes | | 7.50 | | 6/15/13 | | 3,445,000 | | | 3,169,400 |
| Energy Future Holdings, | | | | | | | | | |
| Gtd. Notes | | 10.88 | | 11/1/17 | | 14,345,000 | a | | 10,256,675 |
| FPL Energy National Wind, | | | | | | | | | |
| Sr. Scd. Bonds | | 6.13 | | 3/25/19 | | 302,304 | a | | 263,094 |
| Intergen, | | | | | | | | | |
| Sr. Scd. Bonds | | 9.00 | | 6/30/17 | | 585,000 | a | | 482,625 |
| Ipalco Enterprises, | | | | | | | | | |
| Sr. Scd. Notes | | 7.25 | | 4/1/16 | | 900,000 | a | | 742,500 |
| Midwest Generation, | | | | | | | | | |
| Pass Thru Certificates, Cl. A | | 8.30 | | 7/2/09 | | 71,562 | | | 71,204 |
| Midwest Generation, | | | | | | | | | |
| Pass Thru Certificates, Cl. B | | 8.56 | | 1/2/16 | | 1,152,024 | | | 1,100,183 |
The Fund 21
STATEMENT OF INVESTMENTS (continued)
| | | Coupon | | Maturity | | Principal | | | |
| Bonds and Notes (continued) | | Rate (%) | | Date | | Amount ($) | | | Value ($) |
| |
| |
| |
|
| |
|
| Utilities (continued) | | | | | | | | | |
| Mirant Americas Generation, | | | | | | | | | |
| Sr. Unscd. Notes | | 8.30 | | 5/1/11 | | 1,625,000 | | | 1,584,375 |
| Mirant Mid Atlantic Trust, | | | | | | | | | |
| Pass Thru Certificates, Cl. B | | 9.13 | | 6/30/17 | | 715,622 | | | 644,060 |
| Mirant North America, | | | | | | | | | |
| Gtd. Notes | | 7.38 | | 12/31/13 | | 4,320,000 | | | 4,168,800 |
| Nevada Power, | | | | | | | | | |
| Mortgage Notes, Ser. A | | 8.25 | | 6/1/11 | | 1,321,000 | | | 1,354,832 |
| NRG Energy, | | | | | | | | | |
| Gtd. Notes | | 7.25 | | 2/1/14 | | 1,050,000 | | | 984,375 |
| NRG Energy, | | | | | | | | | |
| Gtd. Notes | | 7.38 | | 1/15/17 | | 3,050,000 | | | 2,813,625 |
| NSG Holdings, | | | | | | | | | |
| Sr. Scd. Notes | | 7.75 | | 12/15/25 | | 1,000,000 | a | | 785,000 |
| NV Energy, | | | | | | | | | |
| Sr. Unscd. Notes | | 8.63 | | 3/15/14 | | 3,200,000 | | | 2,901,046 |
| Reliant Energy, | | | | | | | | | |
| Sr. Unscd. Notes | | 7.63 | | 6/15/14 | | 2,170,000 | b | | 1,811,950 |
| Orion Power Holdings, | | | | | | | | | |
| Sr. Unscd. Notes | | 12.00 | | 5/1/10 | | 861,000 | | | 865,305 |
| | | | | | | | | | 43,822,792 |
| Total Bonds and Notes | | | | | | | | | |
| (cost $414,659,590) | | | | | | | | | 317,904,316 |
| |
| Preferred Stocks—.0% | | | | | | Shares | | | Value ($) |
| |
| |
| |
|
| |
|
| Media | | | | | | | | | |
| Spanish Broadcasting System, | | | | | | | | | |
| Ser. B, Cum. $107.5 | | | | | | | | | |
| (cost $1,597,780) | | | | | | 1,522 g | | 106,529 |
| |
| Other Investment—7.3% | | | | | | | | | |
| |
| |
| |
|
| |
|
| Registered Investment Company; | | | | | | | | | |
| Dreyfus Institutional Preferred | | | | | | | | | |
| Plus Money Market Fund | | | | | | | | | |
| (cost $25,915,000) | | | | | | 25,915,000 h | | 25,915,000 |
22
| Investment of Cash Collateral | | | | |
| for Securities Loaned—15.4% | | Shares | | Value ($) |
| |
| |
|
| Registered Investment Company; | | | | |
| Dreyfus Institutional Cash | | | | |
| Advantage Fund | | | | |
| (cost $54,549,357) | | 54,549,357 h | | 54,549,357 |
| |
| Total Investments (cost $496,721,727) | | 112.2% | | 398,475,202 |
| Liabilities, Less Cash and Receivables | | (12.2%) | | (43,427,538) |
| Net Assets | | 100.0% | | 355,047,664 |
| a Securities exempt from registration under Rule 144A of the Securities Act of 1933.These securities may be resold in |
| transactions exempt from registration, normally to qualified institutional buyers.At December 31, 2008, these |
| securities amounted to $51,068,586 or 14.4% of net assets. |
| b All or a portion of these securities are on loan.At December 31, 2008, the total market value of the fund’s securities |
| on loan is $52,261,002 and the total market value of the collateral held by the fund is $55,265,781, consisting of |
| cash collateral of $ 54,549,357 and U.S. Government and agencies securities valued at $716,424. |
| c Variable rate security—interest rate subject to periodic change. |
| d Non-income producing—security in default. |
| e Zero coupon until a specified date at which time the stated coupon rate becomes effective until maturity. |
| f Principal amount stated in U.S. Dollars unless otherwise noted. |
| EUR—Euro |
| g The value of this security has been determined in good faith under the direction of the Board of Directors. |
| h Investment in affiliated money market mutual fund. |
| Portfolio Summary (Unaudited)† | | | | |
| |
| | | Value (%) | | | | Value (%) |
| |
| |
| |
|
| Corporate Bonds | | 89.3 | | Preferred Stocks | | .0 |
| Money Market Investments | | 22.7 | | | | |
| Asset/Mortgage-Backed | | .2 | | | | 112.2 |
| †Based on net assets. |
| See notes to financial statements. |
The Fund 23
| STATEMENT OF ASSETS AND LIABILITIES |
| December 31, 2008 |
| | | | | | | Cost | | Value |
| |
| |
| |
| |
|
| Assets ($): | | | | | | | | |
| Investments in securities—See Statement | | | | | | |
| of Investments (including securities on loan, | | | | | | |
| valued at $52,261,002)—Note 1(c): | | | | | | |
| Unaffiliated issuers | | | | | | 416,257,370 | | 318,010,845 |
| Affiliated issuers | | | | | | 80,464,357 | | 80,464,357 |
| Cash | | | | | | | | 2,302,805 |
| Cash denominated in foreign currencies | | | | 62,724 | | 67,447 |
| Dividends and interest receivable | | | | | | 8,590,937 |
| Receivable for shares of Beneficial Interest subscribed | | | | 2,854,832 |
| Receivable for investment securities sold | | | | | | 449 |
| | | | | | | | | 412,291,672 |
| Liabilities ($): | | | | | | | | |
| Due to The Dreyfus Corporation and affiliates—Note 3(b) | | | | 253,094 |
| Liability for securities on loan—Note 1(c) | | | | | | 54,549,357 |
| Payable for shares of Beneficial Interest redeemed | | | | | | 1,802,622 |
| Payable for investment securities purchased | | | | | | 505,730 |
| Unrealized depreciation on forward | | | | | | |
| currency exchange contracts—Note 4 | | | | | | 133,205 |
| | | | | | | | | 57,244,008 |
| Net Assets ($) | | | | | | | | 355,047,664 |
| Composition of Net Assets ($): | | | | | | |
| Paid-in capital | | | | | | | | 892,218,896 |
| Accumulated undistributed investment income—net | | | | | | 106,615 |
| Accumulated net realized gain (loss) on investments | | | | | | (438,904,132) |
| Accumulated net unrealized appreciation (depreciation) | | | | |
| on investments and foreign currency transactions | | | | | | (98,373,715) |
| Net Assets ($) | | | | | | | | 355,047,664 |
| |
| |
| |
| |
|
| |
| |
| Net Asset Value Per Share | | | | | | |
| | | Class A | | Class B | | Class C | | Class I |
| |
| |
| |
| |
|
| Net Assets ($) | | 119,560,052 | | 17,567,936 | | 34,373,511 | | 183,546,165 |
| Shares Outstanding | | 23,634,934 | | 3,469,851 | | 6,786,818 | | 36,245,459 |
| Net Asset Value | | | | | | | | |
| Per Share ($) | | 5.06 | | 5.06 | | 5.06 | | 5.06 |
See notes to financial statements.
24
| STATEMENT OF OPERATIONS |
| Year Ended December 31, 2008 |
| Investment Income ($): | | |
| Income: | | |
| Interest | | 26,387,639 |
| Income from securities lending | | 326,702 |
| Dividends: | | |
| Unaffiliated issuers | | 176,281 |
| Affiliated issuers | | 233,165 |
| Total Income | | 27,123,787 |
| Expenses: | | |
| Management fee—Note 3(a) | | 2,074,182 |
| Distribution fees and service fees—Note 3(b) | | 1,034,804 |
| Trustees’ fees—Note 3(a) | | 30,563 |
| Total Expenses | | 3,139,549 |
| Less—Trustees’ fees reimbursed by the Manager—Note 3(a) | | (30,563) |
| Net Expenses | | 3,108,986 |
| Investment Income—Net | | 24,014,801 |
| Realized and Unrealized Gain (Loss) on Investments—Note 4 ($): | | |
| Net realized gain (loss) on investments and foreign currency transactions | | (29,483,098) |
| Net realized gain (loss) on swap transactions | | (27,954) |
| Net realized gain (loss) on forward currency exchange contracts | | 29,362 |
| Net Realized Gain (Loss) | | (29,481,690) |
| Net unrealized appreciation (depreciation) on investments, | | |
| swap transactions and foreign currency transactions | | (85,582,367) |
| Net Realized and Unrealized Gain (Loss) on Investments | | (115,064,057) |
| Net (Decrease) in Net Assets Resulting from Operations | | (91,049,256) |
See notes to financial statements.
The Fund 25
STATEMENT OF CHANGES IN NET ASSETS
| | | Year Ended December 31, |
| | |
|
| | | 2008 | | 2007a |
| |
| |
|
| Operations ($): | | | | |
| Investment income—net | | 24,014,801 | | 20,949,349 |
| Net realized gain (loss) on investments | | (29,481,690) | | (4,495,082) |
| Net unrealized appreciation | | | | |
| (depreciation) on investments | | (85,582,367) | | (11,353,579) |
| Net Increase (Decrease) in Net Assets | | | | |
| Resulting from Operations | | (91,049,256) | | 5,100,688 |
| Dividends to Shareholders from ($): | | | | |
| Investment income—net: | | | | |
| Class A Shares | | (12,726,571) | | (13,922,341) |
| Class B Shares | | (2,203,947) | | (3,561,162) |
| Class C Shares | | (3,540,372) | | (3,977,856) |
| Class I Shares | | (7,462,886) | | (1,317,667) |
| Total Dividends | | (25,933,776) | | (22,779,026) |
| Beneficial Interest Transactions ($): | | | | |
| Net proceeds from shares sold: | | | | |
| Class A Shares | | 30,411,713 | | 22,371,989 |
| Class B Shares | | 409,187 | | 551,723 |
| Class C Shares | | 5,598,901 | | 4,606,504 |
| Class I Shares | | 80,848,983 | | 8,226,009 |
| Net assets received in connection | | | | |
| with reorganization—Note 1 | | 165,591,271 | | — |
| Dividends reinvested: | | | | |
| Class A Shares | | 7,191,210 | | 7,383,384 |
| Class B Shares | | 1,238,169 | | 1,862,672 |
| Class C Shares | | 1,464,954 | | 1,617,711 |
| Class I Shares | | 1,882,311 | | 1,285,311 |
| Cost of shares redeemed: | | | | |
| Class A Shares | | (44,066,236) | | (51,863,201) |
| Class B Shares | | (16,317,514) | | (27,684,167) |
| Class C Shares | | (12,729,359) | | (15,258,190) |
| Class I Shares | | (29,499,583) | | (9,133,542) |
| Increase (Decrease) in Net Assets from | | | | |
| Beneficial Interest Transactions | | 192,024,007 | | (56,033,797) |
| Total Increase (Decrease) in Net Assets | | 75,040,975 | | (73,712,135) |
| Net Assets ($): | | | | |
| Beginning of Period | | 280,006,689 | | 353,718,824 |
| End of Period | | 355,047,664 | | 280,006,689 |
| Undistributed investment income (loss)—net | | 106,615 | | (169,930) |
26
| | | Year Ended December 31, |
| | |
|
| | | 2008 | | 2007a |
| |
| |
|
| Capital Share Transactions: | | | | |
| Class Ab | | | | |
| Shares sold | | 5,014,437 | | 3,102,079 |
| Shares issued for dividends reinvested | | 1,179,978 | | 1,030,483 |
| Shares redeemed | | (7,044,007) | | (7,218,058) |
| Net Increase (Decrease) in Shares Outstanding | | (849,592) | | (3,085,496) |
| Class Bb | | | | |
| Shares sold | | 69,136 | | 76,165 |
| Shares issued for dividends reinvested | | 200,148 | | 258,768 |
| Shares redeemed | | (2,557,751) | | (3,821,909) |
| Net Increase (Decrease) in Shares Outstanding | | (2,288,467) | | (3,486,976) |
| Class C | | | | |
| Shares sold | | 963,301 | | 637,961 |
| Shares issued for dividends reinvested | | 239,274 | | 225,125 |
| Shares redeemed | | (2,106,684) | | (2,127,924) |
| Net Increase (Decrease) in Shares Outstanding | | (904,109) | | (1,264,838) |
| Class I | | | | |
| Shares sold | | 13,407,197 | | 1,147,277 |
| Shares issued in connection | | | | |
| with reorganization—Note 1 | | 25,436,850 | | — |
| Shares issued for dividends reinvested | | 319,245 | | 178,834 |
| Shares redeemed | | (5,426,110) | | (1,280,725) |
| Net Increase (Decrease) in Shares Outstanding | | 33,737,182 | | 45,386 |
| a | | Effective June 1, 2007, Class R shares were redesignated as Class I shares. |
| b | | During the period ended December 31, 2008, 682,327 Class B shares representing $4,417,015, were |
| | | automatically converted to 683,183 Class A shares and during the period ended December 31, 2007, 1,205,939 |
| | | Class B shares representing $8,746,306 were automatically converted to 1,207,249 Class A shares. |
| See notes to financial statements. |
The Fund 27
FINANCIAL HIGHLIGHTS
The following tables describe the performance for each share class for the fiscal periods indicated. All information (except portfolio turnover rate) reflects financial results for a single fund share.Total return shows how much your investment in the fund would have increased (or decreased) during each period, assuming you had reinvested all dividends and distributions.These figures have been derived from the fund’s financial statements.
| | | | | Year Ended December 31, | | |
| | |
| |
| |
|
| Class A Shares | | 2008 | | 2007 | | 2006 | | 2005 | | 2004 |
| |
| |
| |
| |
| |
|
| Per Share Data ($): | | | | | | | | | | |
| Net asset value, beginning of period | | 6.92 | | 7.33 | | 7.24 | | 7.65 | | 7.43 |
| Investment Operations: | | | | | | | | | | |
| Investment income—neta | | .50 | | .49 | | .49 | | .51 | | .52 |
| Net realized and unrealized | | | | | | | | | | |
| gain (loss) on investments | | (1.82) | | (.37) | | .14 | | (.36) | | .23 |
| Total from Investment Operations | | (1.32) | | .12 | | .63 | | .15 | | .75 |
| Distributions: | | | | | | | | | | |
| Dividends from investment income—net | | (.54) | | (.53) | | (.54) | | (.56) | | (.53) |
| Net asset value, end of period | | 5.06 | | 6.92 | | 7.33 | | 7.24 | | 7.65 |
| Total Return (%)b | | (20.17) | | 2.03 | | 8.66 | | 2.22 | | 10.44 |
| Ratios/Supplemental Data (%): | | | | | | | | | | |
| Ratio of total expenses | | | | | | | | | | |
| to average net assets | | .96 | | .96 | | .95 | | .95 | | .95 |
| Ratio of net expenses | | | | | | | | | | |
| to average net assets | | .95 | | .95 | | .95 | | .95 | | .95 |
| Ratio of net investment income | | | | | | | | | | |
| to average net assets | | 7.89 | | 6.78 | | 6.76 | | 6.93 | | 7.00 |
| Portfolio Turnover Rate | | 48.85 | | 50.65 | | 29.98 | | 40.57 | | 129.27 |
| Net Assets, end of period ($ x 1,000) | | 119,560 | | 169,453 | | 202,098 | | 236,421 | | 286,342 |
| a | | Based on average shares outstanding at each month end. |
| b | | Exclusive of sales charge. |
| See notes to financial statements. |
28
| | | | | Year Ended December 31, | | |
| | |
| |
| |
|
| Class B Shares | | 2008 | | 2007 | | 2006 | | 2005 | | 2004 |
| |
| |
| |
| |
| |
|
| Per Share Data ($): | | | | | | | | | | |
| Net asset value, beginning of period | | 6.93 | | 7.34 | | 7.24 | | 7.65 | | 7.43 |
| Investment Operations: | | | | | | | | | | |
| Investment income—neta | | .46 | | .45 | | .45 | | .46 | | .47 |
| Net realized and unrealized | | | | | | | | | | |
| gain (loss) on investments | | (1.82) | | (.37) | | .16 | | (.35) | | .25 |
| Total from Investment Operations | | (1.36) | | .08 | | .61 | | .11 | | .72 |
| Distributions: | | | | | | | | | | |
| Dividends from investment income—net | | (.51) | | (.49) | | (.51) | | (.52) | | (.50) |
| Net asset value, end of period | | 5.06 | | 6.93 | | 7.34 | | 7.24 | | 7.65 |
| Total Return (%)b | | (20.69) | | 1.53 | | 8.12 | | 1.73 | | 10.06 |
| Ratios/Supplemental Data (%): | | | | | | | | | | |
| Ratio of total expenses | | | | | | | | | | |
| to average net assets | | 1.46 | | 1.46 | | 1.45 | | 1.45 | | 1.45 |
| Ratio of net expenses | | | | | | | | | | |
| to average net assets | | 1.45 | | 1.45 | | 1.45 | | 1.45 | | 1.45 |
| Ratio of net investment income | | | | | | | | | | |
| to average net assets | | 7.31 | | 6.24 | | 6.25 | | 6.36 | | 6.50 |
| Portfolio Turnover Rate | | 48.85 | | 50.65 | | 29.98 | | 40.57 | | 129.27 |
| Net Assets, end of period ($ x 1,000) | | 17,568 | | 39,892 | | 67,834 | | 96,334 | | 167,756 |
| a | | Based on average shares outstanding at each month end. |
| b | | Exclusive of sales charge. |
| See notes to financial statements. |
The Fund 29
| | FINANCIAL HIGHLIGHTS (continued) |
| | | | | Year Ended December 31, | | |
| | |
| |
| |
|
| Class C Shares | | 2008 | | 2007 | | 2006 | | 2005 | | 2004 |
| |
| |
| |
| |
| |
|
| Per Share Data ($): | | | | | | | | | | |
| Net asset value, beginning of period | | 6.93 | | 7.34 | | 7.24 | | 7.65 | | 7.43 |
| Investment Operations: | | | | | | | | | | |
| Investment income—neta | | .45 | | .43 | | .43 | | .45 | | .46 |
| Net realized and unrealized | | | | | | | | | | |
| gain (loss) on investments | | (1.83) | | (.36) | | .16 | | (.36) | | .24 |
| Total from Investment Operations | | (1.38) | | .07 | | .59 | | .09 | | .70 |
| Distributions: | | | | | | | | | | |
| Dividends from investment income—net | | (.49) | | (.48) | | (.49) | | (.50) | | (.48) |
| Net asset value, end of period | | 5.06 | | 6.93 | | 7.34 | | 7.24 | | 7.65 |
| Total Return (%)b | | (20.89) | | 1.28 | | 7.85 | | 1.48 | | 9.63 |
| Ratios/Supplemental Data (%): | | | | | | | | | | |
| Ratio of total expenses | | | | | | | | | | |
| to average net assets | | 1.71 | | 1.71 | | 1.70 | | 1.70 | | 1.70 |
| Ratio of net expenses | | | | | | | | | | |
| to average net assets | | 1.70 | | 1.70 | | 1.70 | | 1.70 | | 1.70 |
| Ratio of net investment income | | | | | | | | | | |
| to average net assets | | 7.12 | | 6.02 | | 6.01 | | 6.14 | | 6.26 |
| Portfolio Turnover Rate | | 48.85 | | 50.65 | | 29.98 | | 40.57 | | 129.27 |
| Net Assets, end of period ($ x 1,000) | | 34,374 | | 53,294 | | 65,728 | | 74,770 | | 115,309 |
| a | | Based on average shares outstanding at each month end. |
| b | | Exclusive of sales charge. |
| See notes to financial statements. |
30
| | | | | Year Ended December 31, | | |
| | |
| |
| |
|
| Class I Shares | | 2008 | | 2007a | | 2006 | | 2005 | | 2004 |
| |
| |
| |
| |
| |
|
| Per Share Data ($): | | | | | | | | | | |
| Net asset value, beginning of period | | 6.92 | | 7.33 | | 7.24 | | 7.65 | | 7.43 |
| Investment Operations: | | | | | | | | | | |
| Investment income—netb | | .51 | | .52 | | .51 | | .53 | | .52 |
| Net realized and unrealized | | | | | | | | | | |
| gain (loss) on investments | | (1.82) | | (.38) | | .14 | | (.36) | | .25 |
| Total from Investment Operations | | (1.31) | | .14 | | .65 | | .17 | | .77 |
| Distributions: | | | | | | | | | | |
| Dividends from investment income—net | | (.55) | | (.55) | | (.56) | | (.58) | | (.55) |
| Net asset value, end of period | | 5.06 | | 6.92 | | 7.33 | | 7.24 | | 7.65 |
| Total Return (%) | | (20.06) | | 2.29 | | 8.92 | | 2.34 | | 10.87 |
| Ratios/Supplemental Data (%): | | | | | | | | | | |
| Ratio of total expenses | | | | | | | | | | |
| to average net assets | | .72 | | .71 | | .70 | | .70 | | .70 |
| Ratio of net expenses | | | | | | | | | | |
| to average net assets | | .69 | | .70 | | .70 | | .70 | | .70 |
| Ratio of net investment income | | | | | | | | | | |
| to average net assets | | 9.43 | | 7.01 | | 7.01 | | 7.18 | | 7.31 |
| Portfolio Turnover Rate | | 48.85 | | 50.65 | | 29.98 | | 40.57 | | 129.27 |
| Net Assets, end of period ($ x 1,000) | | 183,546 | | 17,368 | | 18,059 | | 18,595 | | 21,714 |
| a | | Effective June 1, 2007, Class R shares were redesignated as Class I shares. |
| b | | Based on average shares outstanding at each month end. |
| See notes to financial statements. |
The Fund 31
NOTES TO FINANCIAL STATEMENTS
NOTE 1—Significant Accounting Policies:
Dreyfus LimitedTerm HighYield Fund (the “fund”) is a separate diversified series of The Dreyfus/Laurel Funds Trust (the “Trust”), which is registered under the Investment Company Act of 1940, as amended (the “Act”), as an open-end management investment company and operates as a series company currently offering seven series, including the fund.The fund’s investment objective is to seek to maximize total return, consisting of capital appreciation and current income. The Dreyfus Corporation (the “Manager” or “Dreyfus”), a wholly-owned subsidiary of The Bank of New York Mellon Corporation (“BNY Mellon”), serves as the fund’s investment adviser.
At a meeting of the fund’s Board of Trustees held on July 24, 2008, the Board approved, effective December 1, 2008, a proposal to change the name of the fund from “Dreyfus Premier Limited Term High Yield Fund” to “Dreyfus Limited Term High Yield Fund”.
As of the close of business on September 12, 2008, pursuant to an Agreement and Plan of Reorganization previously approved by the fund’s Board of Trustees, all of the assets, subject to liabilities, of BNY Hamilton HighYield Fund (“Hamilton HighYield”) were transferred to the fund in exchange for shares of Beneficial Interest of the fund of equal value. Shareholders of Hamilton High Yield Institutional and Class A shares received Class I shares of the fund, in an amount equal to the aggregate net asset value of their investment in Hamilton High Yield at the time of the exchange. The fund’s net asset value on the close of business on September 12, 2008 after the reorganization was $6.51 for Class I shares and a total of 25,436,850 Class I shares, representing net assets of $165,591,271 (including $6,516,278 net unrealized depreciation on investments) were issued to shareholders of Hamilton High Yield in the exchange. The exchange was a tax-free event to Hamilton High Yield shareholders.
Effective July 1, 2008, BNY Mellon reorganized and consolidated a number of its banking and trust company subsidiaries.As a result of the reorganization, any services previously provided to the fund by Mellon
32
Bank, N.A. or Mellon Trust of New England, N.A. are now provided by The Bank of NewYork Mellon (formerly,The Bank of NewYork).
MBSC Securities Corporation (the “Distributor”), a wholly-owned subsidiary of the Manager, is the distributor of the fund’s shares. The fund is authorized to issue an unlimited number of shares of Beneficial Interest in each of the following classes of shares: Class A, Class B, Class C and Class I. Class A, Class B and Class C shares are sold primarily to retail investors through financial intermediaries and bear a distribution fee and/or service fee. Class A shares are sold with a front-end sales charge, while Class B and Class C shares are subject to a contingent deferred sales charge (“CDSC”). Class B shares automatically convert to Class A shares after six years.The fund does not offer Class B shares, except in connection with dividend reinvestment and permitted exchanges of Class B shares. Class I shares are sold primarily to bank trust departments and other financial service providers (including The Bank of New York Mellon, a subsidiary of BNY Mellon and an affiliate of Dreyfus) acting on behalf of customers having a qualified trust or investment account or relationship at such institution, and bear no distribution or service fees. Class I shares are offered without a front-end sales charge or CDSC. Each class of shares has identical rights and privileges, except with respect to distribution, service fees and voting rights on matters affecting a single class. Income, expenses (other than expenses attributable to a specific class), and realized and unrealized gains or losses on investments are allocated to each class of shares based on its relative net assets.
The fund’s financial statements are prepared in accordance with U.S. generally accepted accounting principles, which may require the use of management estimates and assumptions. Actual results could differ from those estimates.
(a) Portfolio valuation: Investments in securities excluding short-term investments (other than U.S. Treasury Bills), financial futures, options, swaps and forward currency exchange contracts are valued each business day by an independent pricing service (the “Service”)
The Fund 33
| NOTES TO FINANCIAL STATEMENTS (continued) |
approved by the Board of Trustees. Investments for which quoted bid prices are readily available and are representative of the bid side of the market in the judgment of the Service are valued at the mean between the quoted bid prices (as obtained by the Service from dealers in such securities) and asked prices (as calculated by the Service based upon its evaluation of the market for such securities). Other investments (which constitute a majority of the portfolio securities) are valued as determined by the Service, based on methods which include consideration of: yields or prices of securities of comparable quality, coupon, maturity and type; indications as to values from dealers; and general market conditions. Restricted securities, as well as securities or other assets for which recent market quotations are not readily available and are not valued by a pricing service approved by the Board of Trustees, or are determined by the fund not to reflect accurately fair value are valued at fair value as determined in good faith under the direction of the Board of Trustees. The factors that may be considered when fair valuing a security include fundamental analytical data, the nature and duration of restrictions on disposition, an evaluation of the forces that influence the market in which the securities are purchased and sold and public trading in similar securities of the issuer or comparable issuers. Short-term investments, excluding U.S.Treasury Bills, are carried at amortized cost, which approximates value. Registered investment companies that are not traded on an exchange are valued at their net asset value. Financial futures and options, which are traded on an exchange, are valued at the last sales price on the securities exchange on which such securities are primarily traded or at the last sales price on the national securities market on each business day. Options traded over-the-counter are priced at the mean between the bid and asked price. Investments denominated in foreign currencies are translated to U.S. dollars at the prevailing rates of exchange. Forward currency exchange contracts are valued at the forward rate. Investments in swap transactions are valued each business day by an independent pricing service approved by the Board of Trustees. Swaps are valued by the service by using a swap pricing model which incorporates among other factors, default probabilities, recovery rates, credit curves of the underlying issuer and swap spreads on interest rates.
34
The fund adopted Statement of Financial Accounting Standards No. 157 “FairValue Measurements” (“FAS 157”). FAS 157 establishes an authoritative definition of fair value, sets out a framework for measuring fair value, and requires additional disclosures about fair value measurements.
Various inputs are used in determining the value of the fund’s investments relating to FAS 157.These inputs are summarized in the three broad levels listed below.
| Level 1—quoted prices in active markets for identical securities. |
| Level 2—other significant observable inputs (including quoted |
| prices for similar securities, interest rates, prepayment speeds, credit |
| risk, etc.). |
| Level 3—significant unobservable inputs (including the fund’s own |
| assumptions in determining the fair value of investments). |
The inputs or methodology used for valuing securities are not necessarily an indication of the risk associated with investing n those securities.
The following is a summary of the inputs used as of December 31, 2008 in valuing the fund's investments carried at fair value:
| | | Investments in | | Other Financial |
| Valuation Inputs | | Securities ($) | | Instruments ($)† |
| |
| |
|
| Level 1—Quoted Prices | | 80,464,357 | | 0 |
| Level 2—Other Significant | | | | |
| Observable Inputs | | 318,010,845 | | (133,205) |
| Level 3—Significant | | | | |
| Unobservable Inputs | | 0 | | 0 |
| Total | | 398,475,202 | | (133,205) |
| † | | Other financial instruments include derivative instruments, such as futures, forward currency |
| | | exchange contracts and swap contracts, which are valued at the unrealized appreciation |
| | | (depreciation) on the instrument and written options contracts which are shown at value. |
(b) Foreign currency transactions: The fund does not isolate that portion of the results of operations resulting from changes in foreign exchange rates on investments from the fluctuations arising from changes in the market prices of securities held. Such fluctuations are included with the net realized and unrealized gain or loss on investments.
The Fund 35
| NOTES TO FINANCIAL STATEMENTS (continued) |
Net realized foreign exchange gains or losses arise from sales and maturities of short-term securities, sales of foreign currencies, currency gains or losses realized on securities transactions and the difference between the amounts of dividends, interest and foreign withholding taxes recorded on the fund’s books and the U.S. dollar equivalent of the amounts actually received or paid. Net unrealized foreign exchange gains and losses arise from changes in the value of assets and liabilities other than investments in securities, resulting from changes in exchange rates. Such gains and losses are included with net realized and unrealized gain or loss on investments.
(c) Securities transactions and investment income: Securities transactions are recorded on a trade date basis. Realized gains and losses from securities transactions are recorded on the identified cost basis. Dividend income is recognized on the ex-dividend date and interest income, including, where applicable, accretion of discount and amortization of premium on investments, is recognized on the accrual basis.
Pursuant to a securities lending agreement with The Bank of New York Mellon, the fund may lend securities to qualified institutions. It is the fund’s policy that, at origination, all loans are secured by collateral of at least 102% of the value of U.S. securities loaned and 105% of the value of foreign securities loaned. Collateral equivalent to at least 100% of the market value of securities on loan is maintained at all times. Collateral is either in the form of cash, which can be invested in certain money market mutual funds managed by the Manager, U.S. Government and Agency securities or letters of credit. The fund is entitled to receive all income on securities loaned, in addition to income earned as a result of the lending transaction. Although each security loaned is fully collateralized, the fund bears the risk of delay in recovery of, or loss of rights in, the securities loaned should a borrower fail to return the securities in a timely manner. During the period ended December 31, 2008, The Bank of New York Mellon earned $175,916 from lending fund portfolio securities, pursuant to the securities lending agreement.
36
(d) Affiliated issuers: Investments in other investment companies advised by the Manager are defined as “affiliated” in the Act.
(e) Concentration of Risk: The fund invests primarily in debt securities. Failure of an issuer of the debt securities to make timely interest or principal payments, or a decline or the perception of a decline in the credit quality of a debt security, can cause the debt security’s price to fall, potentially lowering the fund’s share price. High yield (“junk”) bonds involve greater credit risk, including the risk of default, than investment grade bonds, and are considered predominantly speculative with respect to the issuer’s continuing ability to make principal and interest payments. In addition, the value of debt securities may decline due to general market conditions that are not specifically related to a particular company, such as real or perceived adverse economic conditions, changes in outlook for corporate earnings, changes in interest or currency rates or adverse investor sentiment. They may also decline because of factors that affect a particular industry.
(f) Dividends to shareholders: It is the policy of the fund to declare dividends daily from investment income-net. Such dividends are paid monthly. Dividends from net realized capital gains, if any, are normally declared and paid annually, but the fund may make distributions on a more frequent basis to comply with the distribution requirements of the Internal Revenue Code of 1986, as amended (the “Code”).To the extent that net realized capital gains can be offset by capital loss carryovers, it is the policy of the fund not to distribute such gains. Income and capital gain distributions are determined in accordance with income tax regulations, which may differ from U.S. generally accepted accounting principles.
(g) Federal income taxes: It is the policy of the fund to continue to qualify as a regulated investment company, if such qualification is in the best interests of its shareholders, by complying with the applicable provisions of the Code, and to make distributions of taxable income sufficient to relieve it from substantially all federal income and excise taxes.
The Fund 37
| NOTES TO FINANCIAL STATEMENTS (continued) |
As of and during the period ended December 31, 2008, the fund did not have any liabilities for any unrecognized tax positions. The fund recognizes interest and penalties, if any, related to unrecognized tax positions as income tax expense in the Statement of Operations. During the period, the fund did not incur any interest or penalties.
Each of the tax years in the four-year period ended December 31, 2008 remains subject to examination by the Internal Revenue Service and state taxing authorities.
At December 31, 2008, the components of accumulated earnings on a tax basis were as follows: undistributed ordinary income $106,615, accumulated capital losses $422,340,048 and unrealized depreciation $100,557,307. In addition, the fund had $14,380,492 of capital losses realized after October 31, 2008, which were deferred for tax purposes to the first day of the following fiscal year.
The accumulated capital loss carryover is available for federal income tax purposes to be applied against future net securities profits, if any, realized subsequent to December 31, 2008. If not applied $161,394,992 of the carryover expires in fiscal 2009, $138,776,715 expires in fiscal 2010, $72,493,638 expires in fiscal 2011, $1,917,623 expires in fiscal 2012, $11,766,163 expires in fiscal 2013, $2,406,483 expires in fiscal 2014, $14,965,314 expires in fiscal 2015 and $18,619,120 expires in fiscal 2016. Based on certain provisions in the Code, various limitations regarding the future utilization of these carry forwards, brought forward as a result of the fund’s merger with the following funds may apply: Dreyfus Premier High Yield Securities Fund, High Yield Total Fund and BNY Hamilton HighYield Fund. It is possible that the fund will not be able to utilize most of its capital loss carryovers prior to its expiration date.
The tax character of distributions paid to shareholders during the fiscal periods ended December 31, 2008 and December 31, 2007 were as follows: ordinary income $25,933,776 and $22,779,026, respectively.
During the period ended December 31, 2008, as a result of permanent book to tax differences, primarily due to the tax treatment for foreign currency transactions, amortization of premiums, consent fees, expira-
38
tion of capital loss carryovers and capital loss carryover and wash sales from fund merger, the fund increased accumulated undistributed investment income-net by $2,195,520, increased accumulated net realized gain (loss) on investments by $32,478,079 and decreased paid-in capital by $34,673,599. Net assets and net asset value per share were not affected by this reclassification.
NOTE 2—Bank Lines of Credit:
Prior to May 1, 2008, the fund had the ability to borrow up to $20 million for leveraging purposes under a short-term unsecured line of credit and participated with other Dreyfus-managed funds in a $100 million unsecured line of credit. Effective May 1, 2008, the fund participates with other Dreyfus-managed funds in a $300 million unsecured line of credit primarily to be utilized for temporary or emergency purposes, including the financing of redemptions.The terms of the line of credit agreement limit the amount of individual fund borrowings. Interest is charged to the fund based on prevailing market rates in effect at the time of borrowing. Effective October 15, 2008, in connection therewith, the fund has agreed to pay commitment fees on its pro rata portion of the unsecured line of credit. During the period ended December 31, 2008, the fund did not borrow under any line of credit.
NOTE 3—Investment Management Fee and Other Transactions with Affiliates:
(a) Pursuant to an Investment Management Agreement with the Manager, the Manager provides or arranges for one or more third parties and/or affiliates to provide investment advisory, administrative, custody, fund accounting and transfer agency services to the fund. The Manager also directs the investments of the fund in accordance with its investment objective, policies and limitations. For these services, the fund is contractually obligated to pay the Manager a fee, calculated daily and paid monthly, at the annual rate of .70% of the value of the fund’s average daily net assets. Out of its fee, the Manager pays all of the expenses of the fund except brokerage fees, taxes, interest, commitment fees, Rule 12b-1 distribution fees and expenses, service fees and
The Fund 39
| NOTES TO FINANCIAL STATEMENTS (continued) |
expenses of non-interested Trustees (including counsel fees) and extraordinary expenses. In addition, the Manager is required to reduce its fee in an amount equal to the fund’s allocable portion of fees and expenses of the non-interested Trustees (including counsel fees). Each Trustee receives $45,000 per year, plus $6,000 for each joint Board meeting of The Dreyfus/Laurel Funds, Inc.,The Dreyfus/Laurel Tax-Free Municipal Funds, the Trust (collectively, the “Dreyfus/Laurel Funds”) and Dreyfus Investment Funds attended, $2,000 for separate in-person committee meetings attended which are not held in conjunction with a regularly scheduled Board meeting and $1,500 for Board meetings and separate committee meetings attended that are conducted by telephone and is reimbursed for travel and out-of-pocket expenses.With respect to Board meetings, the Chairman of the Board receives an additional 25% of such compensation (with the exception of reimbursable amounts). With respect to compensation committee meetings, the Chair of the compensation committee receives $900 per meeting and, with respect to audit committee meetings prior to April 12, 2008, the Chair of the audit committee received $1,350 per meeting. In the event that there is an in-person joint committee meeting of the Dreyfus/Laurel Funds, Dreyfus Investment Funds and Dreyfus High Yield Strategies Fund, the $2,000 or $1,500 fee, as applicable, will be allocated between the Dreyfus/Laurel Funds, Dreyfus Investment Funds and Dreyfus High Yield Strategies Fund. These fees and expenses are charged and allocated to each series based on net assets.Amounts required to be paid by the Trust directly to the non-interested Trustees, that would be applied to offset a portion of the management fee payable to the Manager, are in fact paid directly by the Manager to the non-interested Trustees.
The Manager has contractually agreed, until September 30, 2010, to waive receipt of its fees and/or assume the expenses of Class I shares of the fund so that the annual operating expenses (excluding taxes, interest, brokerage commissions, commitment fees on borrowings and extraordinary expenses) do not exceed .81% of the value of the fund’s average daily net assets. No expense reimbursement was required pursuant to the Agreement for the period ended December 31, 2008.
40
During the period ended December 31, 2008, the Distributor retained $8,821 from commissions earned on sales of the fund’s Class A shares and $94,218 and $7,480 from CDSCs on redemptions of the fund’s Class B and Class C shares, respectively.
(b) Under separate Distribution Plans (the “Plans”) adopted pursuant to Rule 12b-1 under the Act, Class A shares pay annually up to .25% of the value of the average daily net assets to compensate the Distributor for shareholder servicing activities and expenses primarily intended to result in the sale of Class A shares. Class B and Class C shares pay the Distributor for distributing their shares at an aggregate annual rate of .50% and .75% of the value of the average daily net assets of Class B and Class C shares, respectively. Class B and Class C shares are also subject to a Service Plan adopted pursuant to Rule 12b-1 (the “Service Plan”), under which Class B and Class C shares pay the Distributor for providing certain services to the holders of their shares a fee at the annual rate of .25% of the value of the average daily net assets of Class B and Class C shares. During the period ended December 31, 2008, Class A, Class B and Class C shares were charged $372,079, $138,231 and $341,534, respectively, pursuant to their respective Plans. During the period ended December 31, 2008, Class B and Class C shares were charged $69,115 and $113,845, respectively, pursuant to the Service Plan.
Under its terms, the Plans and Service Plan shall remain in effect from year to year, provided such continuance is approved annually by a vote of a majority of those Trustees who are not “interested persons” of the Trust and who have no direct or indirect financial interest in the operation of or in any agreement related to the Plans or Service Plan.
The components of “Due to The Dreyfus Corporation and affiliates” in the Statement of Assets and Liabilities consist of: management fees $192,027, Rule 12b-1 distribution plan fees $50,739 and service plan fees $10,328.
NOTE 4—Securities Transactions:
The aggregate amount of purchases and sales (including paydowns) of investment securities, excluding short-term securities, forward
The Fund 41
| NOTES TO FINANCIAL STATEMENTS (continued) |
currency exchange contracts and swap transactions during the period ended December 31, 2008, amounted to $140,707,347 and $135,342,457, respectively.
The fund enters into forward currency exchange contracts in order to hedge its exposure to changes in foreign currency exchange rates on its foreign portfolio holdings and to settle foreign currency transac-tions.When executing forward currency exchange contracts, the fund is obligated to buy or sell a foreign currency at a specified rate on a certain date in the future. With respect to sales of forward currency exchange contracts, the fund would incur a loss if the value of the contract increases between the date the forward contract is opened and the date the forward contract is closed.The fund realizes a gain if the value of the contract decreases between those dates. With respect to purchases of forward currency exchange contracts, the fund would incur a loss if the value of the contract decreases between the date the forward contract is opened and the date the forward contract is closed. The fund realizes a gain if the value of the contract increases between those dates. The fund is also exposed to credit risk associated with counterparty nonperformance on these forward currency exchange contracts, which is typically limited to the unrealized gain on each open contract. The following summarizes open forward currency exchange contracts at December 31, 2008:
| | | Foreign | | | | | | |
| Forward Currency | | Currency | | | | | | Unrealized |
| Sales Contracts | | Amounts | | Proceeds ($) | | Value ($) | | (Depreciation) ($) |
| |
| |
| |
| |
|
| |
| Sales: | | | | | | | | |
| Euro, | | | | | | | | |
| Expiring 1/16/2009 | | 1,320,000 | | 1,700,226 | | 1,833,431 | | (133,205) |
The fund may enter into swap agreements to exchange the interest rate on, or return generated by, one nominal instrument for the return generated by another nominal instrument.
The fund accrues for the interim payments on swap contracts on a daily basis, with the net amount recorded within unrealized appreciation (depreciation) of swap contracts in the Statement of Assets and
42
Liabilities. Once the interim payments are settled in cash, the net amount is recorded as realized gain (loss) on swaps, in addition to realized gain (loss) recorded upon the termination of swaps contracts in the Statement of Operations. Upfront payments made and/or received by the fund, are recorded as an asset and /or liability on the Statement of Assets and Liabilities and are recorded as a realized gain or loss ratably over the contract’s term/event with the exception of forward starting interest rate swaps which are recorded as realized gains or losses on termination date. Fluctuations in the value of swap contracts are recorded as a component of net change in unrealized appreciation (depreciation) on investments.
Credit default swaps involve commitments to pay a fixed interest rate in exchange for payment if a credit event affecting a third party (the referenced company) occurs. Credit events may include a failure to pay interest or principal, bankruptcy, or restructuring. For those credit default swaps in which the fund is receiving a fixed rate, the fund is providing credit protection on the underlying instrument.The maximum payouts for these contracts are limited to the notional amount of each swap. At December 31, 2008, the fund had no open credit default swaps.
Risks may arise upon entering into these agreements from the potential inability of the counterparties to meet the terms of the agreement and are generally limited to the amount of net payments to be received, if any, at the date of default.
At December 31, 2008, the cost of investments for federal income tax purposes was $499,038,524; accordingly, accumulated net unrealized depreciation on investments was $100,563,322, consisting of $1,613,478 gross unrealized appreciation and $102,176,800 gross unrealized depreciation.
In March 2008, the Financial Accounting Standards Board (“FASB”) released Statement of Financial Accounting Standards No. 161 “Disclosures about Derivative Instruments and Hedging Activities” (“FAS 161”). FAS 161 requires qualitative disclosures about objectives
The Fund 43
| NOTES TO FINANCIAL STATEMENTS (continued) |
and strategies for using derivatives, quantitative disclosures about fair value amounts of gains and losses on derivative instruments and disclosures about credit-risk-related contingent features in derivative agree-ments.The application of FAS 161 is required for fiscal years and interim periods beginning after November 15, 2008. At this time, management is evaluating the implications of FAS 161 and its impact on the financial statements and the accompanying notes has not yet been determined.
During September 2008, FASB Staff Position FAS 133-1 and FASB Interpretation 45-4,“Disclosures about Credit Derivatives and Certain Guarantees”: An Amendment of FASB Statement No. 133 and FASB Interpretation No. 45; and Clarification of the Effective Date of FASB Statement No. 161 (“Amendment”) was issued and is effective for annual and interim reporting periods ending after November 15, 2008. The Amendment requires enhanced disclosures regarding a fund’s credit derivatives holdings and hybrid financial instruments containing embedded credit derivatives. Since the fund was not selling credit protection at the end of the period, management believes FASB 133-1 does not currently impact the financial statements and the accompanying notes.
NOTE 5—Plan of Reorganization:
At a meeting on July 23-24, 2008, the Board of Trustees approved an Agreement and Plan of Reorganization between the fund and Dreyfus High Income Fund, a series of Dreyfus Bond Funds, Inc., (the “Acquired Fund”), providing for the Acquired Fund to merge into the fund as part of a tax-free reorganization. The merger, which was approved by the Acquired Fund’s shareholders on October 15, 2008 occurred on January 8, 2009. On its merger date, the Acquired Fund exchanged all of its assets at net asset value, subject to liabilities, for an equivalent value of shares of the fund. Such shares were distributed pro rata to shareholders of the Acquired Fund so that each shareholder received a number of shares of the fund equal to the aggregate net asset value of the shareholder’s Acquired Fund’s shares.
44
| REPORT OF INDEPENDENT REGISTERED |
| PUBLIC ACCOUNTING FIRM |
| The Board of Trustees and Shareholders |
| The Dreyfus/Laurel Funds Trust: |
We have audited the accompanying statement of assets and liabilities, including the statement of investments of Dreyfus Limited Term High Yield Fund (formerly, Dreyfus Premier Limited Term High Yield Fund), a series of The Dreyfus/Laurel Funds Trust (the “Fund”) as of December 31, 2008, and the related statement of operations for the year then ended, the statements of changes in net assets for each of the years in the two-year period then ended, and the financial highlights for each of the years in the five-year period then ended.These financial statements and financial highlights are the responsibility of the Fund’s management. Our responsibility is to express an opinion on these financial statements and financial highlights based on our audits.
We conducted our audits in accordance with the standards of the Public Company Accounting Oversight Board (United States). Those standards require that we plan and perform the audit to obtain reasonable assurance about whether the financial statements and financial highlights are free of material misstatement.An audit includes examining, on a test basis, evidence supporting the amounts and disclosures in the financial statements. Our procedures included confirmation of securities owned as of December 31, 2008, by correspondence with the custodian and brokers. An audit also includes assessing the accounting principles used and significant estimates made by management, as well as evaluating the overall financial statement presentation. We believe that our audits provide a reasonable basis for our opinion.
In our opinion, the financial statements and financial highlights referred to above present fairly, in all material respects, the financial position of Dreyfus Limited Term High Yield Fund as of December 31, 2008, and the results of its operations for the year then ended, the changes in its net assets for each of the years in the two-year period then ended, and the financial highlights for each of the years in the five-year period then ended, in conformity with U.S. generally accepted accounting principles.

New York, New York
February 25, 2009 |
The Fund 45
IMPORTANT TAX INFORMATION (Unaudited)
In accordance with federal tax law, the fund hereby designates .70% of the ordinary dividends paid during the fiscal year ended December 31, 2008 as qualifying for the corporate dividends received deduction. For the fiscal year ended December 31, 2008, certain dividends paid by the fund may be subject to a maximum tax rate of 15%, as provided for by the Jobs and Growth tax Relief Reconciliation Act of 2003. Of the distributions paid during the fiscal year, $176,281 represents the maximum amount that may be considered qualified dividend income. Shareholders will receive notification in January 2009 of the percentage applicable to the preparation of their 2008 income tax returns. Also, the fund hereby designates 97.33% of ordinary income dividends paid during the fiscal year ended December 31, 2008 as qualifying interest related dividends.
46
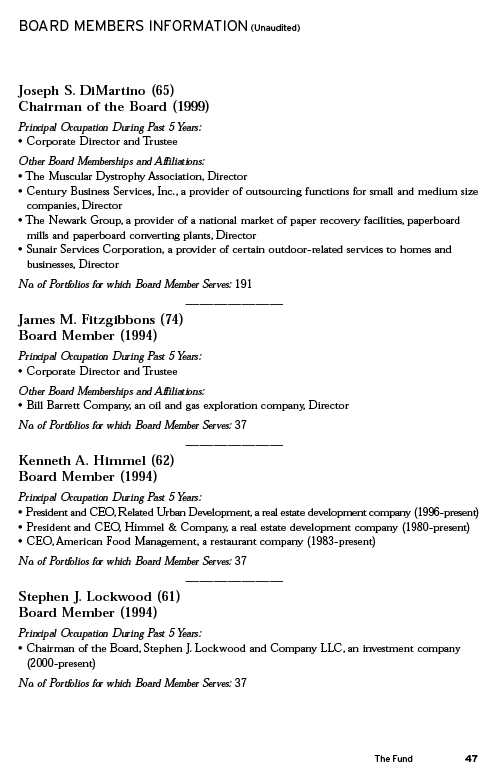
OFFICERS OF THE FUND (Unaudited)
J. DAVID OFFICER, President since December 2006.
Chief Operating Officer,Vice Chairman and a Director of the Manager, and an officer of 77 investment companies (comprised of 180 portfolios) managed by the Manager. He is 60 years old and has been an employee of the Manager since April 1998.
PHILLIP N. MAISANO, Executive Vice President since July 2007.
Chief Investment Officer,Vice Chair and a director of the Manager, and an officer of 77 investment companies (comprised of 180 portfolios) managed by the Manager. Mr. Maisano also is an officer and/or Board member of certain other investment management subsidiaries of The Bank of New York Mellon Corporation, each of which is an affiliate of the Manager. He is 61 years old and has been an employee of the Manager since November 2006. Prior to joining the Manager, Mr. Maisano served as Chairman and Chief Executive Officer of EACM Advisors, an affiliate of the Manager, since August 2004, and served as Chief Executive Officer of Evaluation Associates, a leading institutional investment consulting firm, from 1988 until 2004.
MICHAEL A. ROSENBERG, Vice President and Secretary since August 2005.
Assistant General Counsel of BNY Mellon, and an officer of 78 investment companies (comprised of 201 portfolios) managed by the Manager. He is 48 years old and has been an employee of the Manager since October 1991.
JAMES BITETTO, Vice President and Assistant Secretary since August 2005.
Senior Counsel of BNY Mellon and Secretary of the Manager, and an officer of 78 investment companies (comprised of 201 portfolios) managed by the Manager. He is 42 years old and has been an employee of the Manager since December 1996.
JONI LACKS CHARATAN, Vice President and Assistant Secretary since August 2005.
Senior Counsel of BNY Mellon, and an officer of 78 investment companies (comprised of 201 portfolios) managed by the Manager. She is 53 years old and has been an employee of the Manager since October 1988.
JOSEPH M. CHIOFFI, Vice President and Assistant Secretary since August 2005.
Senior Counsel of BNY Mellon, and an officer of 78 investment companies (comprised of 201 portfolios) managed by the Manager. He is 47 years old and has been an employee of the Manager since June 2000.
JANETTE E. FARRAGHER, Vice President and Assistant Secretary since August 2005.
Assistant General Counsel of BNY Mellon, and an officer of 78 investment companies (comprised of 201 portfolios) managed by the Manager. She is 46 years old and has been an employee of the Manager since February 1984.
JOHN B. HAMMALIAN, Vice President and Assistant Secretary since August 2005.
Managing Counsel of BNY Mellon, and an officer of 78 investment companies (comprised of 201 portfolios) managed by the Manager. He is 45 years old and has been an employee of the Manager since February 1991.
ROBERT R. MULLERY, Vice President and Assistant Secretary since August 2005.
Managing Counsel of BNY Mellon, and an officer of 78 investment companies (comprised of 201 portfolios) managed by the Manager. He is 56 years old and has been an employee of the Manager since May 1986.
The Fund 49
OFFICERS OF THE FUND (Unaudited) (continued)
JEFF PRUSNOFSKY, Vice President and Assistant Secretary since August 2005.
Managing Counsel of BNY Mellon, and an officer of 78 investment companies (comprised of 201 portfolios) managed by the Manager. He is 43 years old and has been an employee of the Manager since October 1990.
JAMES WINDELS, Treasurer since November 2001.
Director – Mutual Fund Accounting of the Manager, and an officer of 78 investment companies (comprised of 201 portfolios) managed by the Manager. He is 49 years old and has been an employee of the Manager since April 1985.
RICHARD CASSARO, Assistant Treasurer since January 2008.
Senior Accounting Manager – Money Market and Municipal Bond Funds of the Manager, and an officer of 78 investment companies (comprised of 201 portfolios) managed by the Manager. He is 49 years old and has been an employee of the Manager since September 1982.
GAVIN C. REILLY, Assistant Treasurer since December 2005.
Tax Manager of the Investment Accounting and Support Department of the Manager, and an officer of 78 investment companies (comprised of 201 portfolios) managed by the Manager. He is 40 years old and has been an employee of the Manager since April 1991.
ROBERT ROBOL, Assistant Treasurer since December 2002.
Senior Accounting Manager – Fixed Income Funds of the Manager, and an officer of 78 investment companies (comprised of 201 portfolios) managed by the Manager. He is 44 years old and has been an employee of the Manager since October 1988.
ROBERT SALVIOLO, Assistant Treasurer since July 2007.
Senior Accounting Manager – Equity Funds of the Manager, and an officer of 78 investment companies (comprised of 201 portfolios) managed by the Manager. He is 41 years old and has been an employee of the Manager since June 1989.
ROBERT SVAGNA, Assistant Treasurer since December 2002.
Senior Accounting Manager – Equity Funds of the Manager, and an officer of 78 investment companies (comprised of 201 portfolios) managed by the Manager. He is 41 years old and has been an employee of the Manager since November 1990.
JOSEPH W. CONNOLLY, Chief Compliance Officer since October 2004.
Chief Compliance Officer of the Manager and The Dreyfus Family of Funds (78 investment companies, comprised of 201 portfolios). From November 2001 through March 2004, Mr. Connolly was first Vice-President, Mutual Fund Servicing for Mellon Global Securities Services. In that capacity, Mr. Connolly was responsible for managing Mellon’s Custody, Fund Accounting and Fund Administration services to third-party mutual fund clients. He is 51 years old and has served in various capacities with the Manager since 1980, including manager of the firm’s Fund Accounting Department from 1997 through October 2001.
WILLIAM GERMENIS, Anti-Money Laundering Compliance Officer since July 2002.
Vice President and Anti-Money Laundering Compliance Officer of the Distributor, and the Anti-Money Laundering Compliance Officer of 74 investment companies (comprised of 197 portfolios) managed by the Manager. He is 38 years old and has been an employee of the Distributor since October 1998.
50
NOTES

The Registrant has adopted a code of ethics that applies to the Registrant's principal executive officer, principal financial officer, principal accounting officer or controller, or persons performing similar functions. There have been no amendments to, or waivers in connection with, the Code of Ethics during the period covered by this Report.
| | Item 3. Audit Committee Financial Expert. |
The Registrant's Board has determined that Joseph S. DiMartino, a member of the Audit Committee of the Board, is an audit committee financial expert as defined by the Securities and Exchange Commission (the "SEC"). Joseph S. DiMartino is "independent" as defined by the SEC for purposes of audit committee financial expert determinations.
Item 4. Principal Accountant Fees and Services.
(a) Audit Fees. The aggregate fees billed for each of the last two fiscal years (the "Reporting Periods") for professional services rendered by the Registrant's principal accountant (the "Auditor") for the audit of the Registrant's annual financial statements, or services that are normally provided by the Auditor in connection with the statutory and regulatory filings or engagements for the Reporting Periods, were $110,030 in 2007 and $78,330 in 2008.
(b) Audit-Related Fees. The aggregate fees billed in the Reporting Periods for assurance and related services by the Auditor that are reasonably related to the performance of the audit of the Registrant's financial statements and are not reported under paragraph (a) of this Item 4 were $11,750 in 2007 and $8,070 in 2008. These services consisted of security counts required by Rule 17f-2 under the Investment Company Act of 1940, as amended.
The aggregate fees billed in the Reporting Periods for non-audit assurance and related services by the Auditor to the Registrant's investment adviser (not including any sub-investment adviser whose role is primarily portfolio management and is subcontracted with or overseen by another investment adviser), and any entity controlling, controlled by or under common control with the investment adviser that provides ongoing services to the Registrant ("Service Affiliates"), that were reasonably related to the performance of the annual audit of the Service Affiliate, which required pre-approval by the Audit Committee were $0 in 2007 and $0 in 2008.
Note: For the second paragraph in each of (b) through (d) of this Item 4, certain of such services were not pre-approved prior to May 6, 2003, when such services were required to be pre-approved. On and after May 6, 2003, 100% of all services provided by the Auditor were pre-approved as required. For comparative purposes, the fees shown assume that all such services were pre-approved, including services that were not pre-approved prior to the compliance date of the pre-approval requirement.
(c) Tax Fees. The aggregate fees billed in the Reporting Periods for professional services rendered by the Auditor for tax compliance, tax advice and tax planning ("Tax Services") were $6,450 in 2007 and $4,430 in 2008. These services consisted of review or preparation of U.S. federal, state, local and excise tax returns. The aggregate fees billed in the Reporting Periods for Tax Services by the Auditor to Service Affiliates which required pre-approval by the Audit Committee were $0 in 2007 and $0 in 2008.
(d) All Other Fees. The aggregate fees billed in the Reporting Periods for products and services provided by the Auditor, other than the services reported in paragraphs (a) through (c) of this Item, were $0 in 2007 and $0 in 2008.
The aggregate fees billed in the Reporting Periods for Non-Audit Services by the Auditor to Service Affiliates, other than the services reported in paragraphs (b) through (c) of this Item, which required pre-approval by the Audit Committee were $0 in 2007 and $0 in 2008.
Audit Committee Pre-Approval Policies and Procedures. The Registrant's Audit Committee has established policies and procedures (the "Policy") for pre-approval (within specified fee limits) of the Auditor's engagements for non-audit services to the Registrant and Service Affiliates without specific case-by-case consideration. Pre-approval considerations include whether the proposed services are compatible with maintaining the Auditor's independence. Pre-approvals pursuant to the Policy are considered annually.
Non-Audit Fees. The aggregate non-audit fees billed by the Auditor for services rendered to the Registrant, and rendered to Service Affiliates, for the Reporting Periods were $2,790,000 in 2007 and $2,532,612 in 2008.
Auditor Independence. The Registrant's Audit Committee has considered whether the provision of non-audit services that were rendered to Service Affiliates which were not pre-approved (not requiring pre-approval) is compatible with maintaining the Auditor's independence.
| Item 5. | | Audit Committee of Listed Registrants. |
| | | Not applicable. |
| Item 6. | | Investments. |
| (a) | | Not applicable. |
| Item 7. | | Disclosure of Proxy Voting Policies and Procedures for Closed-End Management |
| | | Investment Companies. |
| | | Not applicable. |
| Item 8. | | Portfolio Managers of Closed-End Management Investment Companies. |
| | | Not applicable. |
| Item 9. | | Purchases of Equity Securities by Closed-End Management Investment Companies and |
| | | Affiliated Purchasers. |
| | | Not applicable. |
| Item 10. | | Submission of Matters to a Vote of Security Holders. |
The Registrant has a Nominating Committee (the "Committee"), which is responsible for selecting and nominating persons for election or appointment by the Registrant's Board as Board members. The Committee has adopted a Nominating Committee Charter (the "Charter"). Pursuant to the Charter, the Committee will consider recommendations for nominees from shareholders submitted to the Secretary of the Registrant, c/o The Dreyfus Corporation Legal Department, 200 Park Avenue, 8th Floor East, New York, New York 10166. A nomination submission must include information regarding the recommended nominee as specified in the
Charter. This information includes all information relating to a recommended nominee that is required to be disclosed in solicitations or proxy statements for the election of Board members, as well as information sufficient to evaluate the factors to be considered by the Committee, including character and integrity, business and professional experience, and whether the person has the ability to apply sound and independent business judgment and would act in the interests of the Registrant and its shareholders. Nomination submissions are required to be accompanied by a written consent of the individual to stand for election if nominated by the Board and to serve if elected by the shareholders, and such additional information must be provided regarding the recommended nominee as reasonably requested by the Committee.
| Item 11. Controls and Procedures. |
(a) The Registrant's principal executive and principal financial officers have concluded, based on their evaluation of the Registrant's disclosure controls and procedures as of a date within 90 days of the filing date of this report, that the Registrant's disclosure controls and procedures are reasonably designed to ensure that information required to be disclosed by the Registrant on Form N-CSR is recorded, processed, summarized and reported within the required time periods and that information required to be disclosed by the Registrant in the reports that it files or submits on Form N-CSR is accumulated and communicated to the Registrant's management, including its principal executive and principal financial officers, as appropriate to allow timely decisions regarding required disclosure.
(b) There were no changes to the Registrant's internal control over financial reporting that occurred during the second fiscal quarter of the period covered by this report that have materially affected, or are reasonably likely to materially affect, the Registrant's internal control over financial reporting.
Item 12. Exhibits.
(a)(1) Code of ethics referred to in Item 2.
(a)(2) Certifications of principal executive and principal financial officers as required by Rule 30a-2(a) under the Investment Company Act of 1940.
(a)(3) Not applicable.
(b) Certification of principal executive and principal financial officers as required by Rule 30a-2(b) under the Investment Company Act of 1940.
Pursuant to the requirements of the Securities Exchange Act of 1934 and the Investment Company Act of 1940, the Registrant has duly caused this Report to be signed on its behalf by the undersigned, thereunto duly authorized.
The Dreyfus/Laurel Funds Trust
| By: | | /s/ J. David Officer |
| | | J. David Officer |
| | | President |
| |
| Date: | | 02/23/2009 |
Pursuant to the requirements of the Securities Exchange Act of 1934 and the Investment Company Act of 1940, this Report has been signed below by the following persons on behalf of the Registrant and in the capacities and on the dates indicated.
| By: | | /s/ J. David Officer |
| | | J. David Officer |
| | | President |
| |
| Date: | | 02/23/2009 |
| |
| By: | | /s/ James Windels |
| | | James Windels |
| | | Treasurer |
| |
| Date: | | 02/23/2009 |
EXHIBIT INDEX
| (a)(1) | | Code of ethics referred to in Item 2. |
| |
| (a)(2) | | Certifications of principal executive and principal financial officers as required by Rule 30a- |
| 2(a) under the Investment Company Act of 1940. (EX-99.CERT) |
| |
| (b) | | Certification of principal executive and principal financial officers as required by Rule 30a- |
| 2(b) under the Investment Company Act of 1940. (EX-99.906CERT) |