UNITED STATES
SECURITIES AND EXCHANGE COMMISSION
Washington, D.C. 20549 |
CERTIFIED SHAREHOLDER REPORT OF REGISTERED MANAGEMENT
INVESTMENT COMPANIES |
| Investment Company Act file number 811-524 |
The Dreyfus/Laurel Funds Trust
(Exact name of Registrant as specified in charter) |
c/o The Dreyfus Corporation
200 Park Avenue
New York, New York 10166
(Address of principal executive offices) (Zip code) |
Michael A. Rosenberg, Esq.
200 Park Avenue
New York, New York 10166
(Name and address of agent for service) |
| Registrant's telephone number, including area code: | | (212) 922-6000 |
| Date of fiscal year end: | | 10/31 | | |
| Date of reporting period: | | 10/31/2008 | | |
The following N-CSR relates only to the series of the Registrant listed below, and does not affect the other series of the Registrant, which have different fiscal year ends and, therefore, different N-CSR reporting requirements. Separate N-CSR Forms will be filed for those series, as appropriate.
Dreyfus 130/30 Growth Fund
Dreyfus Global Equity Income Fund
Dreyfus International Bond Fund |
Item 1. Reports to Stockholders.
2
Dreyfus
130/30 Growth Fund
| | ANNUAL REPORT October 31, 2008 |

Save time. Save paper. View your next shareholder report online as soon as it’s available. Log into www.dreyfus.com and sign up for Dreyfus eCommunications. It’s simple and only takes a few minutes.
The views expressed in this report reflect those of the portfolio manager only through the end of the period covered and do not necessarily represent the views of Dreyfus or any other person in the Dreyfus organization. Any such views are subject to change at any time based upon market or other conditions and Dreyfus disclaims any responsibility to update such views.These views may not be relied on as investment advice and, because investment decisions for a Dreyfus fund are based on numerous factors, may not be relied on as an indication of trading intent on behalf of any Dreyfus fund.
Not FDIC-Insured Not Bank-Guaranteed May Lose Value
| | Contents |
| |
| | THE FUND |
| |
| 2 | A Letter from the CEO |
| |
| 3 | Discussion of Fund Performance |
| |
| 6 | Fund Performance |
| |
| 8 | Understanding Your Fund’s Expenses |
| |
| 8 | Comparing Your Fund’s Expenses With Those of Other Funds |
| |
| 9 | Statement of Investments |
| |
| 15 | Statement of Securities Sold Short |
| |
| 18 | Statement of Assets and Liabilities |
| |
| 19 | Statement of Operations |
| |
| 20 | Statement of Cash Flows |
| |
| 21 | Statement of Changes in Net Assets |
| |
| 22 | Financial Highlights |
| |
| 26 | Notes to Financial Statements |
| |
| 36 | Report of Independent Registered Public Accounting Firm |
| |
| 37 | Board Members Information |
| |
| 39 | Officers of the Fund |
| |
| | FOR MORE INFORMATION |
| |
| | Back Cover |
| |
| Dreyfus |
| 130/30 Growth Fund |
The Fund

A LETTER FROM THE CEO
Dear Shareholder: |
We present to you this annual report for Dreyfus 130/30 Growth Fund, covering the 12-month period from November 1, 2007, through October 31, 2008.
These are difficult times for equity investors. A credit crunch that began in early 2007 has developed into a full-blown global financial crisis, recently resulting in the failure of several major financial institutions and prompting a massive government rescue effort. Meanwhile, the U.S. economic slowdown has gathered momentum,depressing investor sentiment, consumer confidence and business investment.These factors undermined returns in most stock market sectors, particularly financial companies and businesses that tend to be more sensitive to economic trends.
The depth and duration of the economic downturn will depend on how quickly the financial system can be stabilized.We believe that the Temporary Guarantee Program for Money Market Funds and the $700 billion rescue package intended to promote greater liquidity in the financial markets meet several critical requirements for addressing today’s financial stresses, and we expect these measures to contribute to a more orderly deleveraging process. However, recuperation from the financial crisis is likely to take time. In the meantime, we encourage you to keep in touch with your financial advisor and maintain a long-term and disciplined perspective to investing. Indeed, we already are seeing some positive signs, including a likely peak in global inflationary pressures, a bottoming of the U.S. dollar, attractive valuations among fundamentally sound companies and a large pool of worldwide financial liquidity that could be deployed gradually as the economic cycle turns.
For information about how the fund performed during the reporting period, as well as market perspectives, we have provided a Discussion of Fund Performance given by the fund’s Portfolio Managers.
Thank you for your continued confidence and support.

| | Jonathan R. Baum
Chief Executive Officer
The Dreyfus Corporation |

DISCUSSION OF FUND PERFORMANCE
For the period of November 1, 2007, through October 31, 2008, as provided by Warren Chiang, CFA; Prabhu Palani, CFA; and C. Wesley Boggs, Portfolio Managers
Fund and Market Performance Overview
For the 12-month period ended October 31, 2008, Dreyfus 130/30 Growth Fund’s Class A shares produced a total return of –40.98%, Class C shares returned –41.46%, Class I shares returned –40.82% and Class T shares returned –41.14% .1 In comparison, the fund’s benchmark, the Russell 1000 Growth Index, produced a total return of –36.95% for the same period.2
Stocks declined sharply during the reporting period due to a U.S. economic slowdown and an intensifying global financial crisis.The fund produced returns that were lower than its benchmark, primarily due to a market environment in which neither the valuation nor the earnings revisions factors considered by our quantitative models were predictive of individual stocks’ performance.
The Fund’s Investment Approach
The fund seeks capital appreciation.The fund normally invests at least 80% of its net assets in equity securities.The fund intends to take both long and short positions in stocks chosen through a quantitatively-driven investment process. The fund’s portfolio managers apply a systematic, quantitative investment approach designed to identify and exploit relative misvaluations primarily within the U.S. stock market. Active investment decisions to take long or short positions in individual securities are driven by this quantitative investment process. The portfolio managers use a proprietary valuation model that identifies and ranks stocks based on a long-term relative valuation model that utilizes forward looking estimates of risk and return, an earnings sustainability model that gauges how well earnings forecasts are likely to reflect changes in future cash flows and a set of behavioral factors, including earnings revisions and share buy-backs.
The Fund 3
| DISCUSSION OF FUND PERFORMANCE (continued) |
Stocks Struggled in a Financial Crisis
Slumping housing markets, rising unemployment and sharply lower consumer confidence exacerbated a downturn in the U.S. economy, giving rise to fears regarding a potentially deep and prolonged recession. Meanwhile, a credit crunch that began in 2007 developed into a global financial crisis, and challenging liquidity conditions in some credit markets nearly led to the collapse of the global banking system in September 2008. Government authorities intervened, pumping billions of dollars into the system to restore a degree of investor confidence.These efforts included the passage of theTroubled Asset Relief Program (“TARP”) by the U.S. Congress and unprecedented, coordinated reductions of short-term interest rates by central banks, including the Federal Reserve Board.
As market conditions deteriorated, many highly leveraged institutional investors were forced to de-lever their portfolios, selling their more liquid investments to raise cash for margin calls and redemption requests.These developments triggered massive declines across all market sectors. The financials sector was particularly hard-hit, as several major financial institutions collapsed in September and October,requiring government bailouts.
Quantitative Models Produced Mixed Results
Our quantitative security selection process was rendered less effective during the reporting period by heightened market volatility and an apparent disregard of business fundamentals among risk-averse investors.The valuation factors on which our models heavily rely were relatively ineffective as inexpensively valued stocks simply got cheaper during the downturn. Certain behavioral factors considered by our models, especially analysts’ earnings revisions, failed to add value due to the lack of clarity in the outlooks for most companies.
Although the fund successfully avoided most of the financial institutions that failed during the reporting period, a long position in American International Group was one of the more substantial detractors from the fund’s relative performance, as the global insurer was effectively nationalized by the U.S. government in October.An overweighted position in insurer Genworth Financial also hindered performance as the company encountered liquidity issues.
4
Retailer Bare Escentuals was hurt by disappointing earnings and reduced guidance from management regarding future results. Auto rental chain Hertz Global Holdings suffered amid reduced customer demand and pricing pressures. In the technology sector, networking and software company Ciena Corp. declined due to lower-than-expected quarterly earnings.
The fund achieved better results from discount retailer Big Lots, where sales climbed as cash-strapped consumers turned to low-priced goods. An overweighted position in health care company Baxter International benefited performance when the company announced higher earnings. An underweighted position in electronics retailer Circuit City Stores fell sharply in anticipation of a bankruptcy filing, which occurred soon after the reporting period’s end. Agribusiness giant Monsanto benefited from rising food prices during much of the reporting period. Finally, a short position in retailer Dillard’s fared relatively well as investors worried about excessive debt, weakening consumer spending and the bankruptcy of a competitor.
Finding Opportunities in a Distressed Market
The burgeoning financial crisis appears to have punished many stocks more severely than warranted by their underlying business fundamentals, and we have identified a number of opportunities to establish long positions in healthy companies at historically attractive prices. In our judgment, the fund is well positioned to benefit from a return to fundamentals among investors when the current crisis abates.
November 17, 2008
| 1 | Total return includes reinvestment of dividends and any capital gains paid, and does not take into consideration the maximum initial sales charges in the case of Class A and Class T shares, or the applicable contingent deferred sales charges imposed on redemptions in the case of Class C shares. |
| |
| | Had these charges been reflected, returns would have been lower. Past performance is no guarantee of future results. Share price and investment return fluctuate such that upon redemption, fund shares may be worth more or less than their original cost. Return figures provided reflect the absorption of certain fund expenses by The Dreyfus Corporation pursuant to an agreement in effect until March 1, 2010. Had these expenses not been absorbed, the fund’s returns would have been lower. |
| |
| 2 | SOURCE: BLOOMBERG L.P. – Reflects reinvestment of net dividends and, where applicable, capital gain distributions.The Russell 1000 Growth Index is a widely accepted, unmanaged large-cap index that measures the performance of those Russell 1000 Index companies with higher price-to-book ratios and higher forecasted growth values. |
| |
The Fund 5
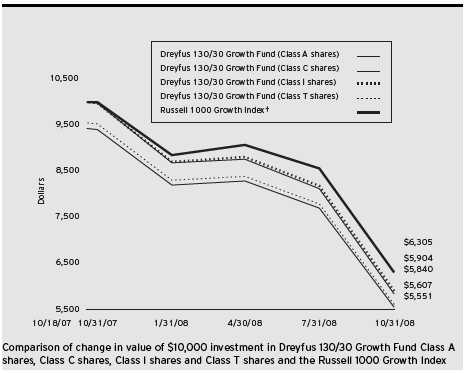
| | † Source: Lipper Inc.
Past performance is not predictive of future performance.
The above graph compares a $10,000 investment made in Class A, Class C, Class I and Class T shares of Dreyfus
130/30 Growth Fund on 10/18/07 (inception date) to a $10,000 investment made in the Russell 1000 Growth
Index (the “Index”) on that date. For comparative purposes, the value of the Index on 10/31/07 is used as the
beginning value on 10/18/07. All dividends and capital gain distributions are reinvested.
The fund’s performance shown in the line graph takes into account the maximum initial sales charges on Class A
shares and Class T shares and all other applicable fees and expenses on all classes.The Index is a widely accepted,
unmanaged large-cap index that measures the performance of those Russell 1000 companies with higher price-to-book
ratios and higher forecasted growth values. Unlike a mutual fund, the Index is not subject to charges, fees and other
expenses. Investors cannot invest directly in any index. Further information relating to fund performance, including
expense reimbursements, if applicable, is contained in the Financial Highlights section of the prospectus and elsewhere
in this report. |
6
| Average Annual Total Returns as of 10/31/08 | | | | | | |
| |
| | | Inception | | | | From |
| | | Date | | 1 Year | | Inception |
| |
| |
| |
|
| Class A shares | | | | | | |
| with maximum sales charge (5.75%) | | 10/18/07 | | (44.37)% | | (43.22)% |
| without sales charge | | 10/18/07 | | (40.98)% | | (39.91)% |
| Class C shares | | | | | | |
| with applicable redemption charge † | | 10/18/07 | | (42.05)% | | (40.38)% |
| without redemption | | 10/18/07 | | (41.46)% | | (40.38)% |
| Class I shares | | 10/18/07 | | (40.82)% | | (39.75)% |
| Class T shares | | | | | | |
| with applicable sales charge (4.5%) | | 10/18/07 | | (43.80)% | | (42.67)% |
| without sales charge | | 10/18/07 | | (41.14)% | | (40.07)% |
| Past performance is not predictive of future performance.The fund’s performance shown in the graph and table does not |
| reflect the deduction of taxes that a shareholder would pay on fund distributions or the redemption of fund shares. |
| † The maximum contingent deferred sales charge for Class C shares is 1% for shares redeemed within one year of the |
| date of purchase. |
The Fund 7
UNDERSTANDING YOUR FUND’S EXPENSES (Unaudited)
As a mutual fund investor, you pay ongoing expenses, such as management fees and other expenses. Using the information below, you can estimate how these expenses affect your investment and compare them with the expenses of other funds.You also may pay one-time transaction expenses, including sales charges (loads) and redemption fees, which are not shown in this section and would have resulted in higher total expenses. For more information, see your fund’s prospectus or talk to your financial adviser.
Review your fund’s expenses
The table below shows the expenses you would have paid on a $1,000 investment in Dreyfus 130/30 Growth Fund from May 1, 2008 to October 31, 2008. It also shows how much a $1,000 investment would be worth at the close of the period, assuming actual returns and expenses.
Expenses and Value of a $1,000 Investment
assuming actual returns for the six months ended October 31, 2008 |
| | | Class A | | Class C | | Class I | | Class T |
| |
| |
| |
| |
|
| Expenses paid per $1,000† | | $ 14.90 | | $ 17.43 | | $ 14.02 | | $ 16.06 |
| Ending value (after expenses) | | $669.70 | | $666.70 | | $670.30 | | $668.50 |
COMPARING YOUR FUND’S EXPENSES
WITH THOSE OF OTHER FUNDS (Unaudited) |
Using the SEC’s method to compare expenses
The Securities and Exchange Commission (SEC) has established guidelines to help investors assess fund expenses. Per these guidelines, the table below shows your fund’s expenses based on a $1,000 investment, assuming a hypothetical 5% annualized return. You can use this information to compare the ongoing expenses (but not transaction expenses or total cost) of investing in the fund with those of other funds.All mutual fund shareholder reports will provide this information to help you make this comparison. Please note that you cannot use this information to estimate your actual ending account balance and expenses paid during the period.
Expenses and Value of a $1,000 Investment
assuming a hypothetical 5% annualized return for the six months ended October 31, 2008 |
| | | Class A | | Class C | | Class I | | Class T |
| |
| |
| |
| |
|
| Expenses paid per $1,000† | | $ 17.91 | | $ 20.96 | | $ 16.86 | | $ 19.31 |
| Ending value (after expenses) | | $1,007.29 | | $1,004.22 | | $1,008.35 | | $1,005.88 |
| † Expenses are equal to the fund’s annualized expense ratio of 3.55% for Class A, 4.16% for Class C, 3.34% for |
| Class I and 3.83% for Class T, multiplied by the average account value over the period, multiplied by 184/366 (to |
| reflect the one-half year period). |
8
STATEMENT OF INVESTMENTS
October 31, 2008 |
| Common Stocks—132.9% | | Shares | | Value ($) |
| |
| |
|
| Computers—7.2% | | | | |
| Apple | | 270 a,b | | 29,049 |
| International Business Machines | | 378 b | | 35,143 |
| Microsoft | | 3,630 b | | 81,058 |
| | | | | 145,250 |
| Consumer Discretionary—18.7% | | | | |
| Big Lots | | 1,074 a,b | | 26,238 |
| Coach | | 418 a,b | | 8,611 |
| Comcast, Cl. A | | 337 | | 5,311 |
| DIRECTV Group | | 186 a,b | | 4,072 |
| Eastman Kodak | | 741 b | | 6,802 |
| Expedia | | 200 a | | 1,902 |
| GameStop, Cl. A | | 270 a,b | | 7,395 |
| Gap | | 1,970 b | | 25,492 |
| Genuine Parts | | 600 b | | 23,610 |
| Guess? | | 1,000 b | | 21,770 |
| H & R Block | | 140 | | 2,761 |
| Harman International Industries | | 50 b | | 919 |
| Interpublic Group of Cos. | | 699 a,b | | 3,628 |
| Liberty Global, Cl. A | | 900 a,b | | 14,841 |
| Liz Claiborne | | 650 | | 5,298 |
| McDonald’s | | 1,150 b | | 66,620 |
| News, Cl. A | | 250 | | 2,660 |
| NIKE, Cl. B | | 150 | | 8,645 |
| Omnicom Group | | 1,100 b | | 32,494 |
| Polo Ralph Lauren | | 84 b | | 3,962 |
| Priceline.com | | 145 a,b | | 7,631 |
| Service Corporation International | | 3,067 b | | 21,162 |
| Snap-On | | 880 b | | 32,516 |
| Tiffany & Co. | | 180 | | 4,941 |
| Time Warner | | 84 b | | 848 |
| WABCO Holdings | | 408 | | 7,495 |
| Walt Disney | | 1,021 b | | 26,444 |
| Wyndham Worldwide | | 600 b | | 4,914 |
| | | | | 378,982 |
The Fund 9
| STATEMENT OF INVESTMENTS (continued) |
| Common Stocks (continued) | | Shares | | Value ($) |
| |
| |
|
| Consumer Staples—15.2% | | | | |
| Altria Group | | 685 b | | 13,145 |
| Anheuser-Busch | | 100 | | 6,203 |
| Avon Products | | 1,770 b | | 43,949 |
| Bare Escentuals | | 2,452 a,b | | 10,249 |
| Bunge | | 434 | | 16,670 |
| Central European Distribution | | 210 a | | 6,046 |
| ConAgra Foods | | 1,330 b | | 23,169 |
| General Mills | | 200 b | | 13,548 |
| H.J. Heinz | | 90 | | 3,944 |
| Kimberly-Clark | | 117 | | 7,171 |
| Lorillard | | 40 | | 2,634 |
| McCormick & Co. | | 950 b | | 31,977 |
| Philip Morris International | | 873 | | 37,949 |
| Safeway | | 900 b | | 19,143 |
| Sara Lee | | 2,939 b | | 32,858 |
| Wal-Mart Stores | | 670 b | | 37,393 |
| Walgreen | | 68 b | | 1,731 |
| | | | | 307,779 |
| Energy—12.1% | | | | |
| Cameron International | | 100 a | | 2,426 |
| Dresser-Rand Group | | 900 a,b | | 20,160 |
| Foundation Coal Holdings | | 100 b | | 2,076 |
| Massey Energy | | 821 b | | 18,957 |
| Murphy Oil | | 799 b | | 40,461 |
| National Oilwell Varco | | 149 a,b | | 4,454 |
| Noble Energy | | 100 b | | 5,182 |
| Occidental Petroleum | | 1,110 b | | 61,649 |
| Pioneer Natural Resources | | 600 b | | 16,698 |
| Plains Exploration & Production | | 281 a | | 7,924 |
| Quicksilver Resources | | 340 a | | 3,560 |
| Smith International | | 700 b | | 24,136 |
| Southwestern Energy | | 1,010 a,b | | 35,976 |
| Valero Energy | | 38 | | 782 |
| | | | | 244,441 |
10
| Common Stocks (continued) | | Shares | | Value ($) |
| |
| |
|
| Financial—10.0% | | | | |
| Allied Capital | | 600 b | | 4,380 |
| Arch Capital Group | | 100 a | | 6,975 |
| Assurant | | 20 b | | 509 |
| Astoria Financial | | 1,150 | | 21,873 |
| Charles Schwab | | 2,500 b | | 47,800 |
| Erie Indemnity, Cl. A | | 171 | | 6,359 |
| Genworth Financial, Cl. A | | 1,940 b | | 9,390 |
| Goldman Sachs Group | | 19 | | 1,758 |
| Hartford Financial Services Group | | 130 | | 1,342 |
| Hudson City Bancorp | | 1,036 | | 19,487 |
| IntercontinentalExchange | | 125 a | | 10,695 |
| Loews | | 318 | | 10,561 |
| Moody’s | | 400 b | | 10,240 |
| Morgan Stanley | | 29 | | 507 |
| Nasdaq OMX Group | | 355 a,b | | 11,523 |
| Northern Trust | | 43 | | 2,421 |
| NYSE Euronext | | 500 b | | 15,090 |
| Prudential Financial | | 200 b | | 6,000 |
| Simon Property Group | | 100 b | | 6,703 |
| Torchmark | | 108 | | 4,511 |
| XL Capital, Cl. A | | 400 b | | 3,880 |
| | | | | 202,004 |
| Health Care—19.7% | | | | |
| Allergan | | 129 | | 5,117 |
| Applied Biosystems | | 70 | | 2,158 |
| Baxter International | | 930 b | | 56,255 |
| Becton, Dickinson & Co. | | 100 | | 6,940 |
| Biogen Idec | | 125 a | | 5,318 |
| Bristol-Myers Squibb | | 2,590 b | | 53,224 |
| Celgene | | 192 a,b | | 12,338 |
| CIGNA | | 870 b | | 14,181 |
| Endo Pharmaceuticals Holdings | | 1,338 a,b | | 24,753 |
| Genentech | | 192 a | | 15,924 |
| Genzyme | | 100 a,b | | 7,288 |
The Fund 11
| STATEMENT OF INVESTMENTS (continued) |
| Common Stocks (continued) | | Shares | | Value ($) |
| |
| |
|
| Health Care (continued) | | | | |
| Gilead Sciences | | 200 a | | 9,170 |
| Humana | | 309 a | | 9,143 |
| Medtronic | | 1,120 b | | 45,170 |
| Merck & Co. | | 271 b | | 8,387 |
| Pfizer | | 1,320 b | | 23,377 |
| St. Jude Medical | | 1,150 a,b | | 43,735 |
| Watson Pharmaceuticals | | 757 a,b | | 19,811 |
| WellCare Health Plans | | 619 a,b | | 14,961 |
| WellPoint | | 560 a,b | | 21,767 |
| | | | | 399,017 |
| Industrial—16.4% | | | | |
| Cooper Industries, Cl. A | | 1,060 b | | 32,807 |
| Corporate Executive Board | | 600 b | | 17,898 |
| CSX | | 631 | | 28,849 |
| Cummins | | 61 | | 1,577 |
| FedEx | | 98 b | | 6,406 |
| First Solar | | 103 a,b | | 14,801 |
| Flowserve | | 212 | | 12,067 |
| Fluor | | 150 | | 5,990 |
| Foster Wheeler | | 200 a | | 5,480 |
| General Dynamics | | 517 | | 31,185 |
| Goodrich | | 582 b | | 21,278 |
| Honeywell International | | 250 b | | 7,613 |
| Hubbell, Cl. B | | 93 b | | 3,336 |
| Jacobs Engineering Group | | 534 a | | 19,454 |
| Kirby | | 699 a,b | | 23,990 |
| L-3 Communications Holdings | | 252 b | | 20,455 |
| Manitowoc | | 700 b | | 6,888 |
| Northrop Grumman | | 200 b | | 9,378 |
| Oshkosh | | 600 | | 4,596 |
| Pitney Bowes | | 100 b | | 2,478 |
| Precision Castparts | | 117 b | | 7,583 |
| Tyco International | | 850 b | | 21,488 |
| Union Pacific | | 295 | | 19,697 |
| United Parcel Service, Cl. B | | 65 | | 3,431 |
| Waste Management | | 100 b | | 3,123 |
| | | | | 331,848 |
12
| Common Stocks (continued) | | Shares | | Value ($) |
| |
| |
|
| Information Technology—24.4% | | | | |
| Adobe Systems | | 1,266 a,b | | 33,726 |
| Automatic Data Processing | | 1,270 b | | 44,386 |
| BMC Software | | 1,400 a,b | | 36,148 |
| Brocade Communications Systems | | 3,418 a | | 12,886 |
| CA | | 2,330 b | | 41,474 |
| Cisco Systems | | 1,899 a,b | | 33,745 |
| Corning | | 200 | | 2,166 |
| Google, Cl. A | | 10 a | | 3,594 |
| Hewlett-Packard | | 2,350 b | | 89,958 |
| Integrated Device Technology | | 1,945 a | | 12,370 |
| Intel | | 3,200 b | | 51,200 |
| JDS Uniphase | | 2,000 a,b | | 10,920 |
| Juniper Networks | | 785 a | | 14,711 |
| MEMC Electronic Materials | | 740 a,b | | 13,601 |
| National Instruments | | 300 b | | 7,620 |
| National Semiconductor | | 884 b | | 11,642 |
| NCR | | 1,611 a | | 29,449 |
| Oracle | | 500 a | | 9,145 |
| Sohu.com | | 439 a | | 24,119 |
| Trimble Navigation | | 20 a | | 411 |
| Visa, Cl. A | | 79 | | 4,373 |
| WebMD Health, Cl. A | | 116 a,b | | 2,593 |
| Xerox | | 190 b | | 1,524 |
| | | | | 491,761 |
| Materials—8.0% | | | | |
| Air Products & Chemicals | | 400 b | | 23,252 |
| Airgas | | 300 b | | 11,508 |
| AK Steel Holding | | 110 b | | 1,531 |
| Alcoa | | 200 | | 2,302 |
| CF Industries Holdings | | 135 | | 8,665 |
| International Paper | | 1,026 b | | 17,668 |
| Monsanto | | 670 b | | 59,617 |
| Mosaic | | 472 b | | 18,602 |
| Newmont Mining | | 342 b | | 9,008 |
| Rohm & Haas | | 49 | | 3,447 |
| Terra Industries | | 153 | | 3,364 |
The Fund 13
| STATEMENT OF INVESTMENTS (continued) |
| Common Stocks (continued) | | Shares | | Value ($) |
| |
| |
|
| Materials (continued) | | | | |
| United States Steel | | 50 | | 1,844 |
| | | | | 160,808 |
| Telecommunication Services—.9% | | | | |
| CenturyTel | | 100 | | 2,511 |
| Qwest Communications International | | 329 b | | 941 |
| Windstream | | 1,868 | | 14,029 |
| | | | | 17,481 |
| Utilities—.3% | | | | |
| DPL | | 144 | | 3,285 |
| NRG Energy | | 100 a,b | | 2,325 |
| Reliant Energy | | 112 a | | 588 |
| | | | | 6,198 |
| |
| |
|
| |
| Total Investments (cost $3,801,150) | | 132.9% | | 2,685,569 |
| Liabilities, Less Cash and Receivables | | (32.9%) | | (664,178) |
| Net Assets | | 100.0% | | 2,021,391 |
| a | | Non-income producing security. |
| b | | Partially held by a broker as collateral for open short positions. |
| Portfolio Summary (Unaudited)† | | | | |
| |
| | | Value (%) | | | | Value (%) |
| |
| |
| |
|
| Information Technology | | 24.4 | | Financial | | 10.0 |
| Health Care | | 19.7 | | Materials | | 8.0 |
| Consumer Discretionary | | 18.7 | | Computers | | 7.2 |
| Industrial | | 16.4 | | Telecommunication Services | | .9 |
| Consumer Staples | | 15.2 | | Utilities | | .3 |
| Energy | | 12.1 | | | | 132.9 |
| |
| † Based on net assets. | | | | | | |
| See notes to financial statements. | | | | | | |
14
STATEMENT OF SECURITIES SOLD SHORT
October 31, 2008
| Common Stocks—32.9% | | Shares | | Value ($) |
| |
| |
|
| Consumer Discretionary—4.2% | | | | |
| Abercrombie & Fitch, Cl. A | | 140 | | 4,054 |
| Clear Channel Outdoor Holdings, Cl. A | | 2,999 a | | 18,714 |
| Gentex | | 773 | | 7,412 |
| Meredith | | 774 | | 14,992 |
| Office Depot | | 6,827 a | | 24,577 |
| OfficeMax | | 115 | | 926 |
| Sherwin-Williams | | 175 | | 9,959 |
| Starwood Hotels & Resorts Worldwide | | 214 | | 4,824 |
| | | | | 85,458 |
| Consumer Staples—2.3% | | | | |
| Clorox | | 177 | | 10,763 |
| Del Monte Foods | | 1,550 | | 9,781 |
| Estee Lauder, Cl. A | | 94 | | 3,388 |
| Hormel Foods | | 787 | | 22,241 |
| | | | | 46,173 |
| Energy—2.2% | | | | |
| Anadarko Petroleum | | 300 | | 10,590 |
| BJ Services | | 100 | | 1,285 |
| Continental Resources | | 356 a | | 11,531 |
| Hercules Offshore | | 1,284 a | | 9,360 |
| Rowan | | 229 | | 4,154 |
| Southern Union | | 390 | | 6,716 |
| | | | | 43,636 |
| Financial—4.6% | | | | |
| Cincinnati Financial | | 466 | | 12,112 |
| City National | | 100 | | 5,353 |
| Fidelity National Financial, Cl. A | | 1,470 | | 13,245 |
| First American | | 590 | | 12,042 |
| Janus Capital Group | | 281 | | 3,299 |
| Lazard, Cl. A | | 180 | | 5,430 |
| Legg Mason | | 528 | | 11,716 |
| Old Republic International | | 2,910 | | 26,801 |
| T Rowe Price Group | | 101 | | 3,994 |
| | | | | 93,992 |
The Fund 15
STATEMENT OF SECURITIES SOLD SHORT (continued)
| Common Stocks (continued) | | Shares | | Value ($) |
| |
| |
|
| Health Care—6.1% | | | | |
| Barr Pharmaceuticals | | 35 a | | 2,249 |
| Cooper | | 850 | | 14,008 |
| DaVita | | 390 a | | 22,133 |
| ImClone Systems | | 70 a | | 4,813 |
| King Pharmaceuticals | | 879 a | | 7,726 |
| Sepracor | | 896 a | | 11,935 |
| UnitedHealth Group | | 1,359 | | 32,249 |
| Zimmer Holdings | | 609 a | | 28,276 |
| | | | | 123,389 |
| Industrial—6.5% | | | | |
| Con-way | | 205 | | 6,979 |
| Donaldson | | 346 | | 12,161 |
| Gardner Denver | | 500 a | | 12,810 |
| Graco | | 903 | | 22,331 |
| IDEX | | 235 | | 5,447 |
| Iron Mountain | | 1,216 a | | 29,524 |
| JB Hunt Transport Services | | 500 | | 14,215 |
| Masco | | 531 | | 5,390 |
| Pentair | | 128 | | 3,538 |
| Robert Half International | | 783 | | 14,775 |
| Timken | | 243 | | 3,859 |
| | | | | 131,029 |
| Information Technology—3.3% | | | | |
| ADC Telecommunications | | 778 a | | 4,932 |
| Cadence Design Systems | | 2,256 a | | 9,182 |
| Cognizant Technology Solutions, Cl. A | | 143 a | | 2,746 |
| Compuware | | 300 a | | 1,914 |
| Ingram Micro, Cl. A | | 535 a | | 7,132 |
16
| Common Stocks (continued) | | Shares | | Value ($) |
| |
| |
|
| Information Technology (continued) | | | | |
| International Rectifier | | 143 a | | 2,208 |
| Lam Research | | 351 a | | 7,849 |
| Molex | | 1,195 | | 17,220 |
| Novellus Systems | | 905 a | | 14,299 |
| | | | | 67,482 |
| Materials—3.6% | | | | |
| Dow Chemical | | 200 | | 5,334 |
| Eagle Materials | | 347 | | 6,145 |
| Hercules | | 120 | | 2,017 |
| Scotts Miracle-Gro, Cl. A | | 1,100 | | 28,732 |
| Weyerhaeuser | | 800 | | 30,576 |
| | | | | 72,804 |
| Telecommunication Services—.1% | | | | |
| Sprint Nextel | | 648 | | 2,028 |
| Total Securities Sold Short (proceeds $886,182) | | 32.9% | | 665,991 |
| |
| a Non-income producing security. | | | | |
| See notes to financial statements. | | | | |
The Fund 17
STATEMENT OF ASSETS AND LIABILITIES
October 31, 2008
| | | | | | | Cost | | Value |
| |
| |
| |
| |
|
| Assets ($): | | | | | | | | |
| Investments in securities—See Statement of Investments | | 3,801,150 | | 2,685,569 |
| Cash | | | | | | | | 22,457 |
| Receivable for investment securities sold | | | | | | 107,055 |
| Receivable from broker for proceeds | | | | | | |
| on securities sold short | | | | | | | | 60,366 |
| Dividends receivable | | | | | | | | 1,968 |
| Prepaid expenses | | | | | | | | 28,380 |
| | | | | | | | | 2,905,795 |
| |
| |
| |
| |
|
| Liabilities ($): | | | | | | | | |
| Due to The Dreyfus Corporation and affiliates—Note 3(d) | | | | 8,480 |
| Securities sold short, at value (proceeds $886,182)—See | | | | |
| Statement of Securities Sold Short | | | | | | 665,991 |
| Payable for investment securities purchased | | | | | | 170,487 |
| Due to Broker | | | | | | | | 415 |
| Dividends payable on securities sold short | | | | | | 387 |
| Accrued expenses | | | | | | | | 38,644 |
| | | | | | | | | 884,404 |
| |
| |
| |
| |
|
| Net Assets ($) | | | | | | | | 2,021,391 |
| |
| |
| |
| |
|
| Composition of Net Assets ($): | | | | | | | | |
| Paid-in capital | | | | | | | | 3,385,444 |
| Accumulated net realized gain (loss) on investments | | | | | | (468,663) |
| Accumulated net unrealized appreciation (depreciation) | | | | | | |
| on investments and securities sold short | | | | | | (895,390) |
| |
| |
| |
|
| Net Assets ($) | | | | | | | | 2,021,391 |
| |
| |
| |
| |
|
| |
| |
| Net Asset Value Per Share | | | | | | | | |
| | | Class A | | Class C | | Class I | | Class T |
| |
| |
| |
| |
|
| Net Assets ($) | | 1,425,980 | | 235,226 | | 183,937 | | 176,248 |
| Shares Outstanding | | 193,671 | | 32,201 | | 24,919 | | 24,000 |
| |
| |
| |
| |
|
| Net Asset Value Per Share ($) | | 7.36 | | 7.30 | | 7.38 | | 7.34 |
| |
| See notes to financial statements. | | | | | | | | |
18
| STATEMENT OF OPERATIONS | | |
| Year Ended October 31, 2008 | | |
| |
|
| |
| |
| |
| |
| Investment Income ($): | | |
| Income: | | |
| Cash dividends | | 51,144 |
| Interest | | 19,658 |
| Total Income | | 70,802 |
| Expenses: | | |
| Management fee—Note 3(a) | | 23,874 |
| Legal fees | | 84,018 |
| Auditing fees | | 38,773 |
| Interest on securities sold short | | 25,260 |
| Registration fees | | 16,609 |
| Dividends on securities sold short | | 10,031 |
| Custodian fees—Note 3(d) | | 7,935 |
| Shareholder servicing costs—Note 3(d) | | 7,524 |
| Prospectus and shareholders’ reports | | 5,638 |
| Distribution fees—Note 3(c) | | 2,897 |
| Trustees’ fees and expenses—Note 3(b) | | 1,250 |
| Loan commitment fees—Note 2 | | 1 |
| Miscellaneous | | 10,364 |
| Total Expenses | | 234,174 |
| Less—expense reimbursement from The Dreyfus | | |
| Corporation due to undertaking—Note 3(a) | | (153,915) |
| Less—reduction in fees due to earnings credits—Note 1(b) | | (553) |
| Net Expenses | | 79,706 |
| Investment (Loss)—Net | | (8,904) |
| |
|
| Realized and Unrealized Gain (Loss) on Investments—Note 4 ($): | | |
| Net realized gain (loss) on investments: | | |
| Long transactions | | (674,924) |
| Short sale transactions | | 206,339 |
| Net Realized Gain (Loss) | | (468,585) |
| Net unrealized appreciation (depreciation) | | |
| on investments and securities sold short | | (889,263) |
| Net Realized and Unrealized Gain (Loss) on Investments | | (1,357,848) |
| Net (Decrease) in Net Assets Resulting from Operations | | (1,366,752) |
| |
| See notes to financial statements. | | |
The Fund 19
STATEMENT OF CASH FLOWS
Year Ended October 31, 2008 |
| Cash Flows from Operating Activities ($): | | | | |
| Purchases of portfolio securities | | (3,134,467) | | |
| Proceed from sales of portfolio securities | | 2,711,343 | | |
| Proceeds from securities sold short | | 110,126 | | |
| Dividends received | | 50,312 | | |
| Interest received | | 19,658 | | |
| Interest and dividends paid | | (35,023) | | |
| Operating expenses paid | | (191,627) | | |
| Paid from The Dreyfus Corporation | | 164,123 | | (305,555) |
| |
| |
|
| Cash Flows from Financing Activites ($): | | | | |
| Paid-in-capital | | | | 287497 |
| Cash at beginning of period | | | | 40,515 |
| Cash at end of period | | | | 22,457 |
| |
| |
|
| Reconciliation of Net Increase in Net Assets Resulting from | | | | |
| Operations to Net Cash Provided by Operating Activities | | | | |
| Net Decrease in Net Assets Resulting from Operations | | | | (1,366,752) |
| |
| |
|
| Adjustments to reconcile net increase in net assets resulting | | | | |
| from operations to net cash provided by operating activities ($): | | |
| Purchases of portfolio securities | | | | (3,134,467) |
| Proceeds from sales of portfolio securities | | | | 2,711,343 |
| Proceeds from securities sold short | | | | 110,126 |
| Increase in interest and dividends | | | | |
| payable on securities sold short | | | | 268 |
| Increase in accrued operating expenses | | | | 11,209 |
| Decrease in prepaid expenses | | | | (28,380) |
| Increase in Due to The Dreyfus Corporation | | | | 34,082 |
| Net realized gains on investments | | | | 468,585 |
| Net unrealized depreciation on investments | | | | 889,263 |
| Decrease in dividends and income receivable | | | | (832) |
| Net Cash Provided by Operating Activities | | | | (305,555) |
| |
| See notes to financial statements. | | | | |
20
STATEMENT OF CHANGES IN NET ASSETS
| | | Year Ended October 31, |
| | |
|
| | | 2008 | | 2007a |
| |
| |
|
| Operations ($): | | | | |
| Investment (loss)—net | | (8,904) | | (816) |
| Net realized gain (loss) on investments | | (468,585) | | 25 |
| Net unrealized appreciation | | | | |
| (depreciation) on investments | | (889,263) | | (6,127) |
| Net Increase (Decrease) in Net Assets | | | | |
| Resulting from Operations | | (1,366,752) | | (6,918) |
| |
| |
|
| Beneficial Interest Transactions ($): | | | | |
| Net proceeds from shares sold: | | | | |
| Class A Shares | | 303,506 | | 2,207,564 |
| Class C Shares | | 144,341 | | 300,000 |
| Class I Shares | | 11,206 | | 300,000 |
| Class T Shares | | — | | 300,000 |
| Cost of shares redeemed: | | | | |
| Class A Shares | | (122,167) | | — |
| Class C Shares | | (49,389) | | — |
| Increase (Decrease) in Net Assets | | | | |
| from Beneficial Interest Transactions | | 287,497 | | 3,107,564 |
| Total Increase (Decrease) in Net Assets | | (1,079,255) | | 3,100,646 |
| |
| |
|
| Net Assets ($): | | | | |
| Beginning of Period | | 3,100,646 | | — |
| End of Period | | 2,021,391 | | 3,100,646 |
| |
| |
|
| Capital Share Transactions (Shares): | | | | |
| Class A | | | | |
| Shares sold | | 28,213 | | 176,661 |
| Shares redeemed | | (11,203) | | — |
| Net Increase (Decrease) in Shares Outstanding | | 17,010 | | 176,661 |
| |
| |
|
| Class C | | | | |
| Shares sold | | 13,472 | | 24,000 |
| Shares redeemed | | (5,271) | | — |
| Net Increase (Decrease) in Shares Outstanding | | 8,201 | | 24,000 |
| |
| |
|
| Class I | | | | |
| Shares sold | | 919 | | 24,000 |
| |
| |
|
| Class T | | | | |
| Shares sold | | — | | 24,000 |
| |
| a From October 18, 2007 (commencement of operations) to October 31, 2007. | | |
| See notes to financial statements. | | | | |
The Fund 21
FINANCIAL HIGHLIGHTS
The following tables describe the performance for each share class for the fiscal periods indicated.All information (except portfolio turnover rate) reflects financial results for a single fund share.Total return shows how much your investment in the fund would have increased (or decreased) during each period, assuming you had reinvested all dividends and distributions.These figures have been derived from the fund’s financial statements.
| | | Year Ended October 31, |
| | |
|
| Class A Shares | | 2008 | | 2007a |
| |
| |
|
| Per Share Data ($): | | | | |
| Net asset value, beginning of period | | 12.47 | | 12.50 |
| Investment Operations: | | | | |
| Investment (loss)—netb | | (.02) | | (.00)c |
| Net realized and unrealized gain (loss) on investments | | (5.09) | | (.03) |
| Total from Investment Operations | | (5.11) | | (.03) |
| Net asset value, end of period | | 7.36 | | 12.47 |
| |
| |
|
| Total Return (%)d | | (40.98) | | (.24)e |
| |
| |
|
| Ratios/Supplemental Data (%): | | | | |
| Ratio of total expenses to average net assets | | 8.24 | | 25.89f |
| Ratio of net expenses to average net assets | | 2.76 | | 1.60f |
| Ratio of net investment (loss) to average net assets | | (.24) | | (.63)f |
| Portfolio Turnover Rate | | 77.50 | | .12e |
| |
| |
|
| Net Assets, end of period ($ x 1,000) | | 1,426 | | 2,203 |
| a | | From October 18, 2007 (commencement of operations) to October 31, 2007. |
| b | | Based on average shares outstanding at each month end. |
| c | | Amount represents less than $.01. |
| d | | Exclusive of sales charge. |
| e | | Not annualized. |
| f | | Annualized. |
| See notes to financial statements. |
22
| | | Year Ended October 31, |
| | |
|
| Class C Shares | | 2008 | | 2007a |
| |
| |
|
| Per Share Data ($): | | | | |
| Net asset value, beginning of period | | 12.47 | | 12.50 |
| Investment Operations: | | | | |
| Investment (loss)—netb | | (.10) | | (.01) |
| Net realized and unrealized gain (loss) on investments | | (5.07) | | (.02) |
| Total from Investment Operations | | (5.17) | | (.03) |
| Net asset value, end of period | | 7.30 | | 12.47 |
| |
| |
|
| Total Return (%)c | | (41.46) | | (.24)d |
| |
| |
|
| Ratios/Supplemental Data (%): | | | | |
| Ratio of total expenses to average net assets | | 9.13 | | 26.52e |
| Ratio of net expenses to average net assets | | 3.52 | | 2.35e |
| Ratio of net investment (loss) to average net assets | | (.99) | | (1.38)e |
| Portfolio Turnover Rate | | 77.50 | | .12d |
| |
| |
|
| Net Assets, end of period ($ x 1,000) | | 235 | | 299 |
| a | | From October 18, 2007 (commencement of operations) to October 31, 2007. |
| b | | Based on average shares outstanding at each month end. |
| c | | Exclusive of sales charge. |
| d | | Not annualized. |
| e | | Annualized. |
| See notes to financial statements. |
The Fund 23
| | FINANCIAL HIGHLIGHTS (continued) |
| | | Year Ended October 31, |
| | |
|
| Class I Shares | | 2008 | | 2007a |
| |
| |
|
| Per Share Data ($): | | | | |
| Net asset value, beginning of period | | 12.47 | | 12.50 |
| Investment Operations: | | | | |
| Investment income (loss)—netb,c | | .00 | | (.00) |
| Net realized and unrealized gain (loss) on investments | | (5.09) | | (.03) |
| Total from Investment Operations | | (5.09) | | (.03) |
| Net asset value, end of period | | 7.38 | | 12.47 |
| |
| |
|
| Total Return (%) | | (40.82) | | (.24)d |
| |
| |
|
| Ratios/Supplemental Data (%): | | | | |
| Ratio of total expenses to average net assets | | 8.00 | | 25.52e |
| Ratio of net expenses to average net assets | | 2.51 | | 1.35e |
| Ratio of net investment income (loss) to average net assets | | .01 | | (.38)e |
| Portfolio Turnover Rate | | 77.50 | | .12d |
| |
| |
|
| Net Assets, end of period ($ x 1,000) | | 184 | | 299 |
| a | | From October 18, 2007 (commencement of operations) to October 31, 2007. |
| b | | Based on average shares outstanding at each month end. |
| c | | Amount represents less than $.01. |
| d | | Not annualized. |
| e | | Annualized. |
| See notes to financial statements. |
24
| | | Year Ended October 31, |
| | |
|
| Class T Shares | | 2008 | | 2007a |
| |
| |
|
| Per Share Data ($): | | | | |
| Net asset value, beginning of period | | 12.47 | | 12.50 |
| Investment Operations: | | | | |
| Investment (loss)—netb | | (.05) | | (.00)c |
| Net realized and unrealized gain (loss) on investments | | (5.08) | | (.03) |
| Total from Investment Operations | | (5.13) | | (.03) |
| Net asset value, end of period | | 7.34 | | 12.47 |
| |
| |
|
| Total Return (%)d | | (41.14) | | (.24)e |
| |
| |
|
| Ratios/Supplemental Data (%): | | | | |
| Ratio of total expenses to average net assets | | 8.46 | | 26.02f |
| Ratio of net expenses to average net assets | | 3.01 | | 1.85f |
| Ratio of net investment (loss) to average net assets | | (.49) | | (.88)f |
| Portfolio Turnover Rate | | 77.50 | | .12e |
| |
| |
|
| Net Assets, end of period ($ x 1,000) | | 176 | | 299 |
| a | | From October 18, 2007 (commencement of opertions) to October 31, 2007. |
| b | | Based on average shares outstanding at each month end. |
| c | | Amount represents less than $.01. |
| d | | Exclusive of sales charge. |
| e | | Not annualized. |
| f | | Annualized. |
| See notes to financial statements. |
The Fund 25
NOTES TO FINANCIAL STATEMENTS
NOTE 1—Significant Accounting Policies:
Dreyfus 130/30 Growth Fund (the “fund”) is a separate diversified series of The Dreyfus/Laurel Funds Trust (the “Trust”), which is registered under the Investment Company Act of 1940, as amended (the “Act”), as an open-end management investment company and operates as a series company offering seven series, as of October 31, 2008, including the fund. The fund’s investment objective seeks capital appreciation. The Dreyfus Corporation (the “Manager” or “Dreyfus”), a wholly-owned subsidiary of The Bank of New York Mellon Corporation (“BNY Mellon”), serves as the fund’s investment adviser. Mellon Capital Management Corporation (“Mellon Capital”), an affiliate of BNY Mellon, serves as the fund’s sub-Investment adviser.
At a meeting of the fund’s Board of Trustees held on July 24, 2008, the Board approved, effective December 1, 2008, a proposal to change the name of the fund from “Dreyfus Premier 130/30 Growth Fund” to “Dreyfus 130/30 Growth Fund”.
Effective July 1, 2008, BNY Mellon has reorganized and consolidated a number of its banking and trust company subsidiaries. As a result of the reorganization, any services previously provided to the fund by Mellon Bank, N.A. or Mellon Trust of New England, N.A. are now provided by The Bank of New York, which has changed its name to The Bank of New York Mellon.
MBSC Securities Corporation (the “Distributor”), a wholly-owned subsidiary of Dreyfus is the distributor of the fund’s shares.The fund is authorized to issue an unlimited number of shares of Beneficial Interest in each of the following classes of shares: Class A, Class C, Class I and Class T. Class A and Class C shares are sold primarily to retail investors through financial intermediaries and bear a distribution fee and/or service fee. Class A shares are sold with a front-end sales charge, while Class C shares are subject to a contingent deferred sales charge (“CDSC”). Class I shares are sold primarily to bank trust departments and other financial service providers (includingThe Bank of NewYork Mellon, a subsidiary of BNY Mellon and an affiliate of Dreyfus), act-
26
ing on behalf of customers having a qualified trust or investment account or relationship at such institution, and bear no distribution or service fees. Class I shares are offered without a front-end sales charge or CDSC. Class T shares are subject to a sales charge imposed at the time of purchase and bear distribution and service fees. Each class of shares has identical rights and privileges, except with respect to distribution and service fees, the allocation of certain transfer agency costs and voting rights on matters affecting a single class. Income, expenses (other than expenses attributable to a specific class), and realized and unrealized gains or losses on investments are allocated to each class of shares based on its relative net assets.
As of October 31, 2008, MBC Investments Corp., an indirect subsidiary of BNY Mellon, held 168,000 Class A shares and 24,000 in each of Class C, Class I and Class T shares of the fund.
The Trust accounts separately for the assets, liabilities and operations of each series. Expenses directly attributable to each series are charged to that series’ operations; expenses which are applicable to all series are allocated among them on a pro rata basis.
The fund’s financial statements are prepared in accordance with U.S. generally accepted accounting principles, which may require the use of management estimates and assumptions. Actual results could differ from those estimates.
(a) Portfolio valuation: Investments in securities are valued at the last sales price on the securities exchange or national securities market on which such securities are primarily traded. Securities listed on the National Market System for which market quotations are available are valued at the official closing price or, if there is no official closing price that day, at the last sale price. Securities not listed on an exchange or the national securities market, or securities for which there were no transactions, are valued at the average of the most recent bid and asked prices, except for open short positions, where the asked price is used for valuation purposes. Bid price is used when no asked price is avail-
The Fund 27
| NOTES TO FINANCIAL STATEMENTS (continued) |
able. Registered investment companies that are not traded on an exchange are valued at their net asset value.When market quotations or official closing prices are not readily available, or are determined not to reflect accurately fair value, such as when the value of a security has been significantly affected by events after the close of the exchange or market on which the security is principally traded (for example, a foreign exchange or market), but before the fund calculates its net asset value, the fund may value these investments at fair value as determined in accordance with the procedures approved by the Board of Trustees. Fair valuing of securities may be determined with the assistance of a pricing service using calculations based on indices of domestic securities and other appropriate indicators, such as prices of relevant ADRs and futures contracts. For other securities that are fair valued by the Board of Trustees, certain factors may be considered such as: fundamental analytical data, the nature and duration of restrictions on disposition, an evaluation of the forces that influence the market in which the securities are purchased and sold, and public trading in similar securities of the issuer or comparable issuers. Financial futures are valued at the last sales price.
The Financial Accounting Standards Board (“FASB”) released Statement of Financial Accounting Standards No. 157 “Fair Value Measurements” (“FAS 157”). FAS 157 establishes an authoritative definition of fair value, sets out a framework for measuring fair value, and requires additional disclosures about fair-value measurements. The application of FAS 157 is required for fiscal years beginning after November 15, 2007 and interim periods within those fiscal years. Management does not believe that the application of this standard will have a material impact on the financial statements of the fund.
(b) Securities transactions and investment income: Securities transactions are recorded on a trade date basis. Realized gains and losses from securities transactions are recorded on the identified cost basis. Dividend income is recognized on the ex-dividend date and interest income, including, where applicable, accretion of discount and amortization of premium on investments, is recognized on the accrual basis.
28
The fund has arrangements with the custodian and cash management banks whereby the fund may receive earnings credits when positive cash balances are maintained, which are used to offset custody and cash management fees. For financial reporting purposes, the fund includes net earnings credits as an expense offset in the Statement of Operations.
(c) Affiliated issuers: Investments in other investment companies advised by Dreyfus are defined as “affiliated” in the Act.
(d) Concentration of risk: The fund enters into short sales. Short sales involve selling a security the fund does not own in anticipation that the security’s price will decline. Short sales may involve substantial risk and “leverage.”The fund may be required to buy the security sold short at a time when the security has appreciated in value, thus resulting in a loss to the fund. Short positions in stocks involve more risk than long positions in stocks. In theory, stocks sold short have unlimited risk.
(e) Dividends to shareholders: Dividends are recorded on the ex-dividend date. Dividends from investment income-net and dividends from net realized capital gains, if any, are normally declared and paid annually, but the fund may make distributions on a more frequent basis to comply with the distribution requirements of the Internal Revenue Code of 1986, as amended (the “Code”).To the extent that net realized capital gains can be offset by capital loss carryovers, it is the policy of the fund not to distribute such gains. Income and capital gain distributions are determined in accordance with income tax regulations, which may differ from U.S. generally accepted accounting principles.
(f) Federal income taxes: It is the policy of the fund to continue to qualify as a regulated investment company, if such qualification is in the best interests of its shareholders, by complying with the applicable provisions of the Code, and to make distributions of taxable income sufficient to relieve it from substantially all federal income and excise taxes.
The fund adopted FASB Interpretation No. 48 “Accounting for Uncertainty in Income Taxes” (“FIN 48”). FIN 48 provides guidance for how uncertain tax positions should be recognized, measured, pre-
The Fund 29
| NOTES TO FINANCIAL STATEMENTS (continued) |
sented and disclosed in the financial statements. FIN 48 requires the evaluation of tax positions taken or expected to be taken in the course of preparing the fund’s tax returns to determine whether the tax positions are “more-likely-than-not” of being sustained by the applicable tax authority. Liability for tax positions not deemed to meet the more-likely-than-not threshold would be recorded as a tax expense in the current year.The adoption of FIN 48 had no impact on the operations of the fund for the period ended October 31, 2008.
As of and during the period ended October 31, 2008, the fund did not have any liabilities for any unrecognized tax positions. The fund recognizes interest and penalties, if any, related to unrecognized tax positions as income tax expense in the Statement of Operations. During the period, the fund did not incur any interest or penalties.
Each of the tax years in the four-year period ended October 31, 2008 remains subject to examination by the Internal Revenue Service and state taxing authorities.
At October 31, 2008, the components of accumulated earnings on a tax basis were as follows: accumulated capital losses $462,837 and unrealized depreciation $901,216.
The accumulated capital loss carryover is available for federal tax purposes to be applied against future net securities profits, if any, realized subsequent to October 31, 2008. If not applied the carryover expires in fiscal 2016.
During the period ended October 31, 2008, as a result of permanent book to tax differences, primarily due to the tax treatment for net operating losses, the fund increased accumulated undistributed investment income-net by $8,904, decreased accumulated net realized gain (loss) on investments by $78 and decreased paid-in capital by $8,826. Net assets and net asset value per share were not affected by this reclassification.
NOTE 2—Bank Lines of Credit:
Prior to October 15, 2008, the fund participated with other Dreyfus-managed funds in a $350 million redemption credit facility. Effective
30
October 15, 2008 the fund participates with other Dreyfus-managed funds in a $145 million redemption credit facility (the “Facility”) to be utilized for temporary or emergency purposes, including the financing of redemptions. In connection therewith, the fund has agreed to pay commitment fees on its pro rata portion of the Facility. Interest is charged to the fund based on prevailing market rates in effect at the time of borrowing. During the period ended October 31, 2008, the fund did not borrow under either Facility.
NOTE 3—Investment Management Fee, Sub-Investment Advisory Fee and Other Transactions With Affiliates:
(a) Pursuant to an Investment Management agreement between the Manager and the Trust, the Trust has agreed to pay the Manager a management fee computed at the annual rate of .85% of the value of the fund’s average daily net assets and is payable monthly.The Manager has contractually agreed until March 1, 2010, to waive receipt of its fees and/or assume the expenses of the fund so that annual fund operating expenses (excluding Rule 12b-1 fees, shareholder services fees, taxes, interest, brokerage commissions, commitments fess on borrowings such as interest charged by the fund’s prime broker, substitute dividend expenses on securities sold short, and extraordinary expenses) do not exceed 1.25% .The expense reimbursement, pursuant to the undertaking, amounted to $153,915 during the period ended October 31, 2008.
Pursuant to a Sub-Investment Advisory Agreement between Dreyfus and Mellon Capital, Dreyfus pays Mellon Capital an annual fee of .41% of the value of the fund’s average net assets, payable monthly.
During the period ended October 31, 2008, the Distributor retained $28 from commissions earned on sales of the fund’s Class A shares.
(b) Each Trustee receives $45,000 per year, plus $6,000 for each joint Board meeting of The Dreyfus/Laurel Funds, Inc., The Trust and The Dreyfus/Laurel Tax-Free Municipal Funds, (collectively, the “Dreyfus/Laurel Funds”) attended, $2,000 for separate in-person committee meetings attended which are not held in conjunction with a
The Fund 31
| NOTES TO FINANCIAL STATEMENTS (continued) |
regularly scheduled Board meeting and $1,500 for Board meetings and separate committee meetings attended that are conducted by telephone and is reimbursed for travel and out-of-pocket expenses.With respect to Board meetings, the Chairman of the Board receives an additional 25% of such compensation (with the exception of reimbursable amounts). With respect to compensation committee meetings, the Chair of the compensation committee receives $900 per meeting and, with respect to audit committee meetings, prior to April 12, 2008, the Chair of the audit committee received $1,350 per meeting. In the event that there is an in-person joint meeting of the Dreyfus/Laurel Funds and Dreyfus High Yield Strategies Fund, the $2,000 or $1,500 fee, as applicable, will be allocated between the Dreyfus/Laurel Funds and Dreyfus High Yield Strategies Fund. These fees and expenses are changed and allocated to each series based on net assets. Amounts required to be paid by the Trust directly to the non-interested Trustees, that would be applied to offset a portion of the management fee payable by certain other series of the Trust to the Manager, are in fact paid directly by the Manager to the non-interested Trustees.
(c) Under the Distribution Plan (the “Plan”) adopted pursuant to Rule 12b-1 under the Act, Class C and Class T shares pay the Distributor for distributing their shares at an annual rate of .75% of the value of their average daily net assets of Class C shares and .25% of the value of the average daily net assets of Class T shares. During the period ended October 31, 2008, Class C and Class T shares were charged $2,264 and $633, pursuant to the Plan.
(d) Under the Shareholder Services Plan, Class A, Class C and Class T shares pay the Distributor at an annual rate of ..25% of the value of their average daily net assets for the provision of certain services.The services provided may include personal services relating to shareholder accounts, such as answering shareholder inquiries regarding the fund and providing reports and other information, and services related to
32
the maintenance of shareholder accounts. The Distributor may make payments to Service Agents (a securities dealer, financial institution or other industry professional) in respect of these services. The Distributor determines the amounts to be paid to Service Agents. During the period ended October 31, 2008, Class A, Class C and Class T shares were charged $4,975, $755 and $633, respectively, pursuant to the Shareholder Services Plan.
The fund compensates Dreyfus Transfer, Inc., a wholly-owned subsidiary of Dreyfus, under a transfer agency agreement for providing personnel and facilities to perform transfer agency services for the fund. During the period ended October 31, 2008, the fund was charged $661 pursuant to the transfer agency agreement.
The fund compensates The Bank of New York Mellon under a cash management agreement for performing cash management services related to fund subscriptions and redemptions. During the period ended October 31, 2008, the fund was charged $157 pursuant to the cash management agreement.
The fund compensates The Bank of New York Mellon under a custody agreement for providing custodial services for the fund. During the period ended October 31, 2008, the fund was charged $7,935 pursuant to the custody agreement.
During the period ended October 31, 2008, the fund was charged $6,203 for services performed by the Chief Compliance Officer.
The components of “Due to The Dreyfus Corporation and affiliates” in the Statement of Assets and Liabilities consist of: management fees $1,442, Rule 12b-1 distribution plan fees $186, shareholder services plan fees $385, custodian fees $4,374, chief compliance officer fees $1,973 and transfer agency per account fees $120.
The Fund 33
| NOTES TO FINANCIAL STATEMENTS (continued) |
(e) Prime broker fees charged on the fund are included in interest expense.
NOTE 4—Securities Transactions:
The following summarizes the aggregate amount of purchases and sales of investment securities and securities sold short, excluding short-term securities, during the period ended October 31, 2008.
| | | Purchases ($) | | Sales ($) |
| |
| |
|
| Long transactions | | 3,304,954 | | 2,818,398 |
| Short sale transactions | | 1,133,910 | | 1,303,986 |
| Total | | 4,438,864 | | 4,122,384 |
The fund is engaged in short-selling which obligates the fund to replace the security borrowed by purchasing the security at current market value.The fund would incur a loss if the price of the security increases between the date of the short sale and the date on which the fund replaces the borrowed security.The fund would realize a gain if the price of the security declines between those dates. Until the fund replaces the borrowed security, the fund will maintain daily a segregated account with a broker or custodian, of permissible liquid assets sufficient to cover its short position. Securities sold short at October 31, 2008, and their related market values and proceeds are set forth in the Statement of Securities Sold Short.
At October 31, 2008, the cost of investments for federal income tax purposes was $3,806,976; accordingly, accumulated net unrealized depreciation on investments was $1,121,407, consisting of $25,299 gross unrealized appreciation and $1,146,706 gross unrealized depreciation.
In March 2008, the FASB released Statement of Financial Accounting Standards No. 161 “Disclosures about Derivative Instruments and Hedging Activities” (“FAS 161”). FAS 161 requires qualitative disclosures about objectives and strategies for using derivatives, quantitative
34
disclosures about fair value amounts of gains and losses on derivative instruments and disclosures about credit-risk-related contingent features in derivative agreements.The application of FAS 161 is required for fiscal years and interim periods beginning after November 15, 2008. At this time, management is evaluating the implications of FAS 161 and its impact on the financial statements and the accompanying notes has not yet been determined.
NOTE 5—Subsequent Event:
Effective on or about February 4, 2009 (the “Effective Date”), the fund will issue to each holder of its Class T shares, in exchange for said shares, Class A shares of the fund having an aggregate net asset value equal to the aggregate net asset value of the shareholder’s Class T shares.Thereafter, the fund will no longer offer Class T shares.
Effective on or about December 3, 2008, no investments for new accounts were permitted in Class T of the fund, except that participants in certain group retirement plans were able to open a new account in Class T of the fund, provided that the fund was established as an investment option under the plans before December 3, 2008. After the Effective Date, subsequent investments in the fund’s Class A shares made by holders of the fund’s Class T shares who received Class A shares of the fund in exchange for their Class T shares will be subject to the front-end sales load schedule currently in effect for Class T shares. Otherwise, all other Class A share attributes will be in effect.
The Fund 35
REPORT OF INDEPENDENT REGISTERED
PUBLIC ACCOUNTING FIRM |
The Board of Trustees and Shareholders The Dreyfus/Laurel Funds Trust:
We have audited the accompanying statement of assets and liabilities of Dreyfus 130/30 Growth Fund (formerly Dreyfus Premier 130/30 Growth Fund), a series ofThe Dreyfus/Laurel FundsTrust (the “Fund”), including the statements of investments and securities sold short, as of October 31, 2008, and the related statement of operations for the year then ended, the statement of cash flows, the statement of changes in net assets and the financial highlights for the year then ended and for the period from October 18, 2007 (commencement of operations) to October 31, 2007.These financial statements and financial highlights are the responsibility of the Fund’s management. Our responsibility is to express an opinion on these financial statements and financial highlights based on our audits.
We conducted our audits in accordance with the standards of the Public Company Accounting Oversight Board (United States).Those standards require that we plan and perform the audit to obtain reasonable assurance about whether the financial statements and financial highlights are free of material misstatement. An audit includes examining, on a test basis, evidence supporting the amounts and disclosures in the financial statements. Our procedures included confirmation of securities owned as of October 31, 2008, by correspondence with the custodian and brokers or by other appropriate auditing procedures where replies from brokers were not received.An audit also includes assessing the accounting principles used and significant estimates made by management, as well as evaluating the overall financial statement presentation. We believe that our audits provide a reasonable basis for our opinion.
In our opinion, the financial statements and financial highlights referred to above present fairly, in all material respects, the financial position of Dreyfus 130/30 Growth Fund as of October 31, 2008, the results of its operations for the year ended, its cash flows, the changes in its net assets and its financial highlights for the year then ended and for the period from October 18, 2007 (commencement of operations) to October 31, 2007, in conformity with U.S. generally accepted accounting principles.

| | New York, New York
December 23, 2008 |
36
BOARD MEMBERS INFORMATION (Unaudited)

The Fund 37
BOARD MEMBERS INFORMATION (Unaudited) (continued)
38
OFFICERS OF THE FUND (Unaudited)

The Fund 39
OFFICERS OF THE FUND (Unaudited) (continued)

40
For More Information
Telephone Call your financial representative or 1-800-554-4611
Mail The Dreyfus Family of Funds, 144 Glenn Curtiss Boulevard, Uniondale, NY 11556-0144
The fund files its complete schedule of portfolio holdings with the Securities and Exchange Commission (“SEC”) for the first and third quarters of each fiscal year on Form N-Q. The fund’s Forms N-Q are available on the SEC’s website at http://www.sec.gov and may be reviewed and copied at the SEC’s Public Reference Room in Washington, DC. Information on the operation of the Public Reference Room may be obtained by calling 1-800-SEC-0330.
A description of the policies and procedures that the fund uses to determine how to vote proxies relating to portfolio securities, and information regarding how the fund voted these proxies for the 12-month period ended June 30, 2008, is available at http://www.dreyfus.com. The description of the policies and procedures is also available without charge, upon request, by calling 1-800-645-6561.

| © 2008 MBSC Securities Corporation |
| | Dreyfus
Global Equity
Income Fund |
| | ANNUAL REPORT October 31, 2008 |

Save time. Save paper. View your next shareholder report online as soon as it’s available. Log into www.dreyfus.com and sign up for Dreyfus eCommunications. It’s simple and only takes a few minutes.
The views expressed in this report reflect those of the portfolio manager only through the end of the period covered and do not necessarily represent the views of Dreyfus or any other person in the Dreyfus organization. Any such views are subject to change at any time based upon market or other conditions and Dreyfus disclaims any responsibility to update such views.These views may not be relied on as investment advice and, because investment decisions for a Dreyfus fund are based on numerous factors, may not be relied on as an indication of trading intent on behalf of any Dreyfus fund.
Not FDIC-Insured Not Bank-Guaranteed May Lose Value
| | Contents |
| |
| | THE FUND |
| |
| 2 | A Letter from the CEO |
| |
| 3 | Discussion of Fund Performance |
| |
| 6 | Fund Performance |
| |
| 8 | Understanding Your Fund’s Expenses |
| |
| 8 | Comparing Your Fund’s Expenses With Those of Other Funds |
| |
| 9 | Statement of Investments |
| |
| 13 | Statement of Assets and Liabilities |
| |
| 14 | Statement of Operations |
| |
| 15 | Statement of Changes in Net Assets |
| |
| 17 | Financial Highlights |
| |
| 21 | Notes to Financial Statements |
| |
| 34 | Report of Independent Registered Public Accounting Firm |
| |
| 35 | Important Tax Information |
| |
| 36 | Board Members Information |
| |
| 38 | Officers of the Fund |
| |
| | FOR MORE INFORMATION |
| |
| | Back Cover |
| |
| Dreyfus |
| Global Equity |
| Income Fund |
The Fund

A LETTER FROM THE CEO
Dear Shareholder:
We present to you this annual report for Dreyfus Global Equity Income Fund, covering the 12-month period from November 1, 2007, through October 31, 2008.
These are difficult times for international investors. A credit crunch that began in the United States in 2007 has developed into a full-blown global financial crisis, recently resulting in the failure of several major financial institutions. Meanwhile, the global economic slowdown has gathered momentum, depressing investor sentiment, consumer confidence and business investment around the world.These factors undermined equity returns in most regions, including formerly high-flying emerging markets.
The depth and duration of the economic downturn will depend on how quickly the global financial system can be stabilized. We believe that government efforts in the United States and Europe meet several critical requirements for addressing today’s financial stresses, and we expect them to contribute to a more orderly deleveraging process. However, recuperation from the financial crisis is likely to take time. In the meantime, we encourage you to keep in touch with your financial advisor and maintain a long-term and disciplined perspective to investing.Indeed,we already are seeing some positive signs, including a likely peak in global inflationary pressures, attractive valuations among fundamentally sound companies and a large pool of worldwide financial liquidity that could be deployed gradually as the economic cycle turns.
For information about how the fund performed during the reporting period, as well as market perspectives, we have provided a Discussion of Fund Performance given by the fund’s Portfolio Manager.
Thank you for your continued confidence and support.
Jonathan R. Baum
Chief Executive Officer
The Dreyfus Corporation
November 17, 2008 |
2

DISCUSSION OF FUND PERFORMANCE
For the period of November 1, 2007, through October 31, 2008, as provided by James Harries, Portfolio Manager
Fund and Market Performance Overview
For the 12-month period ended October 31, 2008, Dreyfus Global Equity Income Fund’s Class A shares produced a total return of –42.41%, Class C shares returned –42.76%, Class I shares returned –42.27% and Class T shares returned –42.54% .1 In comparison, the fund’s benchmark, the FTSEWorld Index (the“Index”),produced a total return of –42.31% for the same period.2
Stock markets throughout the world posted sharp declines due to a slowing global economy and a severe banking crisis. Relatively strong fund performance over the first half of the reporting period was offset by weakness during the second half stemming from underweighted exposure to the United States and relatively heavy positions in the emerging markets, causing the fund to produce returns that were in line with its benchmark.
The Fund’s Investment Approach
The fund seeks total return, consisting of capital appreciation and income.To pursue this goal, the fund normally invests at least 80% of its assets in equity securities.The fund seeks to focus on dividend-paying stocks of companies located in the developed capital markets, such as the United States,Canada,Japan,Australia,Hong Kong andWestern Europe. The fund may invest in the securities of companies of any market capitalization, and it may invest up to 30% of its assets in emerging markets.
We combine “top-down” analysis of current economic trends and investment themes with “bottom-up” stock selection based on fundamental research. Within markets and sectors deemed to be relatively attractive, we seek attractively priced stocks of companies that we believe to have sustainable competitive advantages.
Global Financial Crisis Sparked Broad Declines
Following a downward trend established by the United States, most regions of the world suffered from slowing economic growth, fueling
The Fund 3
| DISCUSSION OF FUND PERFORMANCE (continued) |
fears of a potentially deep and prolonged global recession. Commodity prices that had soared over the reporting period’s first half plummeted over the second half as global demand eased.
Meanwhile, a global credit crunch that began in 2007 developed into a full-blown financial crisis later in the reporting period, and poor liquidity conditions in the credit markets nearly led to the collapse of the global banking system in September 2008. Government and regulatory authorities intervened, pumping billions of dollars into the system to restore a degree of investor confidence. These efforts included capital infusions by the United States, United Kingdom and other governments, as well as coordinated reductions of short-term interest rates by major central banks.
As market conditions deteriorated, many highly leveraged institutional investors were forced to de-lever their portfolios, selling their more liquid investments to raise cash for margin calls and redemptions. Selling pressure led to broadly lower prices even among fundamentally sound markets and stocks.The financials sector was particularly hard-hit.
Early Gains Erased by “Flight to Quality”
The fund produced relatively strong results over the reporting period’s first half, when overweighted exposure to faster-growing emerging markets enabled the fund to participate more fully in their gains.At the same time, relatively light exposure to dollar- and yen-denominated stocks in the U.S. and Japanese markets, respectively, helped the fund avoid the full brunt of those equities’ and currencies’ early declines. However, the trends supporting these results later reversed.When the global banking system almost ground to a halt, investors responded by flocking to traditional safe havens, including the U.S. dollar and Japanese yen, which strengthened relative to most other currencies. Conversely, currencies in the emerging markets lost value.
In addition, for the reporting period overall, the fund’s emphasis on the traditionally defensive utilities and health care sectors proved disappointing when these stocks tumbled amid intense, broad-based selling pressure. Oil-and-gas producers detracted from relative performance as slumping commodity prices erased earlier gains. Among individual stocks, Indonesian agribusiness leader Astra Agro Lestari fell along with
4
palm oil prices, financial exchange Bursa Malaysia encountered difficult market conditions and Philippine power producer First Gen was hurt by financing concerns surrounding a recent acquisition.
The fund achieved better results in the technology sector, where a number of Taiwan companies, such as High Tech Computer, fared relatively well.The fund also benefited from underweighted positions in the financials and industrials sectors. Finally, the fund received positive contributions from Fording Canadian Coal Trust, U.S. aluminum producer Reynolds American and Thai telecommunications firm Advanced Info Service.
Maintaining a Cautious Posture
Although we were encouraged by the aggressive responses of governments and central banks to the financial crisis, we expect the global economic downturn and portfolio deleveraging to persist. Therefore, we have adopted a cautious investment posture, emphasizing the historically defensive telecommunications, tobacco and pharmaceutical industry groups and de-emphasizing the troubled banking, retail, media and automotive areas.We have found a number of relatively attractive investments in Asia and Brazil, but fewer in the United States. In our judgment, these strategies should help the fund weather the current storm until a recovery begins.
November 15, 2008
| 1 | Total return includes reinvestment of dividends and any capital gains paid, and does not take into consideration the maximum initial sales charges in the case of Class A and Class T shares, or the applicable contingent deferred sales charges imposed on redemptions in the case of Class C shares. |
| |
| | Had these charges been reflected, returns would have been lower. Past performance is no guarantee of future results. Share price and investment return fluctuate such that upon redemption, fund shares may be worth more or less than their original cost. Return figures provided reflect the absorption of certain fund expenses by The Dreyfus Corporation through March 1, 2010, at which time it may be extended, terminated or modified. Had these expenses not been absorbed, the fund’s returns would have been lower. |
| |
| 2 | SOURCE: BLOOMBERG L.P. - Reflects reinvestment of dividends and, where applicable, capital gain distributions.The FTSE World Index is an unmanaged, free-floating, market- capitalization weighted index that is designed to measure the performance of 90% of the world’s investable stocks issued by large and midcap companies in developed and advanced emerging markets. |
| |
The Fund 5

† Source: Bloomberg L.P.
Past performance is not predictive of future performance.
The above graph compares a $10,000 investment made in Class A, Class C, Class I and Class T shares of Dreyfus
Global Equity Income Fund on 10/18/07 (inception date) to a $10,000 investment made in the FTSE World Index
(the “Index”) on that date. All dividends and capital gain distributions are reinvested. For comparative purposes, the
value of the Index on 10/31/07 is used as the beginning value on 10/18/07.
The fund’s performance shown in the line graph takes into account the maximum initial sales charges on Class A shares
and Class T shares and all other applicable fees and expenses on all classes.The Index is a widely accepted, unmanaged,
free-float market capitalization-weighted index that is designed to measure the performance of 90% of the world’s
investable stocks issued by large and mid-cap companies in developed and advanced emerging markets. Unlike a mutual
fund, the Index is not subject to charges, fees and other expenses. Investors cannot invest directly in any index. Further
information relating to fund performance, including expense reimbursements, if applicable, is contained in the Financial
Highlights section of the prospectus and elsewhere in this report. |
6
| Average Annual Total Returns as of 10/31/08 | | | | | | |
| |
| | | Inception | | | | From |
| | | Date | | 1 Year | | Inception |
| |
| |
| |
|
| Class A shares | | | | | | |
| with maximum sales charge (5.75%) | | 10/18/07 | | (45.71)% | | (41.73)% |
| without sales charge | | 10/18/07 | | (42.41)% | | (38.32)% |
| Class C shares | | | | | | |
| with applicable redemption charge † | | 10/18/07 | | (43.32)% | | (38.73)% |
| without redemption | | 10/18/07 | | (42.76)% | | (38.73)% |
| Class I shares | | 10/18/07 | | (42.27)% | | (38.18)% |
| Class T shares | | | | | | |
| with applicable sales charge (4.5%) | | 10/18/07 | | (45.13)% | | (41.13)% |
| without sales charge | | 10/18/07 | | (42.54)% | | (38.46)% |
Past performance is not predictive of future performance.The fund’s performance shown in the graph and table does not
reflect the deduction of taxes that a shareholder would pay on fund distributions or the redemption of fund shares.
† The maximum contingent deferred sales charge for Class C shares is 1% for shares redeemed within one year of the
date of purchase. |
The Fund 7
UNDERSTANDING YOUR FUND’S EXPENSES (Unaudited)
As a mutual fund investor, you pay ongoing expenses, such as management fees and other expenses. Using the information below, you can estimate how these expenses affect your investment and compare them with the expenses of other funds.You also may pay one-time transaction expenses, including sales charges (loads) and redemption fees, which are not shown in this section and would have resulted in higher total expenses. For more information, see your fund’s prospectus or talk to your financial adviser.
Review your fund’s expenses
The table below shows the expenses you would have paid on a $1,000 investment in Dreyfus Global Equity Income Fund from May 1, 2008 to October 31, 2008. It also shows how much a $1,000 investment would be worth at the close of the period, assuming actual returns and expenses.
Expenses and Value of a $1,000 Investment
assuming actual returns for the six months ended October 31, 2008 |
| | | Class A | | Class C | | Class I | | Class T |
| |
| |
| |
| |
|
| Expenses paid per $1,000† | | $ 6.05 | | $ 9.07 | | $ 5.04 | | $ 7.06 |
| Ending value (after expenses) | | $604.80 | | $603.30 | | $605.40 | | $604.20 |
COMPARING YOUR FUND’S EXPENSES
WITH THOSE OF OTHER FUNDS (Unaudited) |
Using the SEC’s method to compare expenses
The Securities and Exchange Commission (SEC) has established guidelines to help investors assess fund expenses. Per these guidelines, the table below shows your fund’s expenses based on a $1,000 investment, assuming a hypothetical 5% annualized return. You can use this information to compare the ongoing expenses (but not transaction expenses or total cost) of investing in the fund with those of other funds.All mutual fund shareholder reports will provide this information to help you make this comparison. Please note that you cannot use this information to estimate your actual ending account balance and expenses paid during the period.
Expenses and Value of a $1,000 Investment
assuming a hypothetical 5% annualized return for the six months ended October 31, 2008 |
| | | Class A | | Class C | | Class I | | Class T |
| |
| |
| |
| |
|
| Expenses paid per $1,000† | | $7.61 | | $11.39 | | $6.34 | | $8.87 |
| Ending value (after expenses) | | $1,017.60 | | $1,013.83 | | $1,018.85 | | $1,016.34 |
† Expenses are equal to the fund’s annualized expense ratio of 1.50% for Class A, 2.25% for Class C, 1.25% for
Class I and 1.75% for Class T, multiplied by the average account value over the period, multiplied by 184/366 (to
reflect the one half year period). |
8
STATEMENT OF INVESTMENTS
October 31, 2008 |
| Common Stocks—93.3% | | Shares | | Value ($) |
| |
| |
|
| Australia—4.7% | | | | |
| Telstra | | 63,799 | | 175,169 |
| Bermuda—.5% | | | | |
| Bunge | | 65 | | 19,500 |
| Brazil—7.7% | | | | |
| Cia de Saneamento de Minas Gerais | | 6,200 | | 38,748 |
| Natura Cosmeticos | | 4,500 | | 38,841 |
| Petroleo Brasileiro (Preferred), ADR | | 1,249 | | 27,565 |
| Tele Norte Leste Participacoes, ADR | | 6,915 | | 93,906 |
| Terna Participacoes | | 5,949 | | 45,857 |
| Vale Capital | | 1,550 | | 43,787 |
| | | | | 288,704 |
| Canada—1.7% | | | | |
| Progress Energy Trust | | 7,887 | | 62,819 |
| Finland—2.9% | | | | |
| Elisa | | 4,728 | | 70,927 |
| Nokia | | 2,341 | | 36,342 |
| | | | | 107,269 |
| France—2.0% | | | | |
| Total | | 1,381 | | 75,361 |
| Germany—7.2% | | | | |
| Deutsche Post | | 6,412 | | 70,691 |
| Deutsche Telekom | | 2,595 | | 38,300 |
| E.ON | | 1,120 | | 42,340 |
| K+S | | 819 | | 32,026 |
| Muenchener Rueckversicherungs | | 319 | | 41,837 |
| Symrise | | 3,747 | | 45,990 |
| | | | | 271,184 |
| Hong Kong—6.1% | | | | |
| CNOOC | | 42,000 | | 34,398 |
| Hongkong Land Holdings | | 15,000 | | 40,233 |
| Hopewell Highway Infrastructure | | 137,471 | | 89,338 |
| HSBC Holdings | | 5,200 | | 63,049 |
| | | | | 227,018 |
The Fund 9
| STATEMENT OF INVESTMENTS (continued) |
| Common Stocks (continued) | | Shares | | Value ($) |
| |
| |
|
| Israel—.9% | | | | |
| Israel Chemicals | | 3,521 | | 34,016 |
| Italy—1.9% | | | | |
| ENI | | 2,965 | | 70,026 |
| Malaysia—1.0% | | | | |
| Bursa Malaysia | | 25,900 | | 38,344 |
| Netherlands—5.5% | | | | |
| Reed Elsevier | | 5,609 | | 74,607 |
| Royal Dutch Shell, Cl. A | | 1,607 | | 44,282 |
| Unilever | | 3,553 | | 85,317 |
| | | | | 204,206 |
| Norway—2.4% | | | | |
| Aker Solutions | | 3,647 | | 19,737 |
| StatoilHydro | | 3,537 | | 68,689 |
| | | | | 88,426 |
| Singapore—5.1% | | | | |
| DBS Group Holdings | | 5,000 | | 38,278 |
| Mapletree Logistics Trust | | 138,250 | | 38,953 |
| Parkway Holdings | | 55,666 | | 59,647 |
| Singapore Technologies Engineering | | 35,000 | | 55,401 |
| | | | | 192,279 |
| South Africa—2.1% | | | | |
| Gold Fields | | 10,935 | | 77,188 |
| South Korea—2.3% | | | | |
| LG Telecom | | 12,255 | | 86,314 |
| Spain—.3% | | | | |
| Clinica Baviera | | 1,468 | | 11,600 |
| Sweden—2.5% | | | | |
| Tele2, Cl. B | | 4,867 | | 41,081 |
| Telefonaktiebolaget LM Ericsson, Cl. B | | 7,743 | | 53,882 |
| | | | | 94,963 |
| Switzerland—2.6% | | | | |
| Verwalt & Privat-Bank | | 463 | | 63,879 |
| Zurich Financial Services | | 175 | | 35,160 |
| | | | | 99,039 |
10
| Common Stocks (continued) | | Shares | | Value ($) |
| |
| |
|
| Taiwan—3.0% | | | | |
| HTC | | 2,600 | | 31,024 |
| Taiwan Semiconductor Manufacturing | | 54,186 | | 80,178 |
| | | | | 111,202 |
| Thailand—2.0% | | | | |
| Advanced Info Service | | 35,000 | | 74,176 |
| United Kingdom—13.0% | | | | |
| Aberdeen Asset Management | | 21,180 | | 31,785 |
| Admiral Group | | 1,867 | | 27,417 |
| Anglo American | | 1,999 | | 49,286 |
| BHP Billiton | | 2,500 | | 42,366 |
| Cable & Wireless | | 39,416 | | 77,960 |
| GlaxoSmithKline | | 4,275 | | 82,353 |
| ICAP | | 9,000 | | 44,466 |
| Smiths Group | | 2,755 | | 35,404 |
| Vodafone Group | | 49,423 | | 94,731 |
| | | | | 485,768 |
| United States—15.9% | | | | |
| Annaly Capital Management | | 3,818 | | 53,070 |
| AT & T | | 2,327 | | 62,294 |
| Cal-Maine Foods | | 1,306 | | 38,383 |
| Eli Lilly & Co. | | 2,078 | | 70,278 |
| Merck & Co. | | 2,934 | | 90,807 |
| Pfizer | | 4,304 | | 76,224 |
| Philip Morris International | | 1,519 | | 66,031 |
| Reynolds American | | 2,913 | | 142,620 |
| | | | | 599,707 |
| Total Common Stocks | | | | |
| (cost $5,406,891) | | | | 3,494,278 |
| |
| |
|
| |
| Preferred Stocks—.9% | | | | |
| |
| |
|
| Brazil | | | | |
| Banco do Estado do Rio Grande do Sul | | | | |
| (cost $73,275) | | 13,300 | | 32,843 |
The Fund 11
| STATEMENT OF INVESTMENTS (continued) |
| | | Coupon | | Maturity | | Principal | | |
| Bonds and Notes—2.1% | | Rate (%) | | Date | | Amount ($) | | Value ($) |
| |
| |
| |
| |
|
| United Kingdom | | | | | | | | |
| Standard Chartered, | | | | | | | | |
| Jr. Sub. Notes | | | | | | | | |
| (cost $105,741) | | 8.13 | | 11/27/13 | | 106,000 | | 79,699 |
| |
| |
| |
| |
|
| |
| Total Investments (cost $5,585,907) | | | | 96.3% | | 3,606,820 |
| Cash and Receivables (Net) | | | | | | 3.7% | | 138,336 |
| Net Assets | | | | | | 100.0% | | 3,745,156 |
| ADR—American Depository Receipts | | | | | | | | |
| |
| |
| |
| |
|
| |
| |
| |
| |
| Portfolio Summary (Unaudited)† | | | | | | |
| | | Value (%) | | | | | | Value (%) |
| |
| |
| |
| |
|
| Telecommunications | | 22.7 | | Industrial | | | | 6.7 |
| Financial | | 18.5 | | Technology | | | | 4.4 |
| Oil & Gas | | 10.8 | | Utilities | | | | 3.4 |
| Health Care | | 10.4 | | Consumer Services | | 2.0 |
| Consumer Goods | | 9.9 | | | | | | |
| Materials | | 7.5 | | | | | | 96.3 |
| |
| † Based on net assets. | | | | | | | | |
| See notes to financial statements. | | | | | | | | |
12
STATEMENT OF ASSETS AND LIABILITIES
October 31, 2008
| | | | | | | Cost | | Value |
| |
| |
| |
| |
|
| Assets ($): | | | | | | | | |
| Investments in securities—See Statement of Investments | | | | 5,585,907 | | 3,606,820 |
| Cash | | | | | | | | 41,261 |
| Unrealized appreciation on forward | | | | | | | | |
| currency exchange contracts—Note 4 | | | | | | | | 92,774 |
| Receivable for investment securities sold | | | | | | | | 30,863 |
| Receivable for futures variation margin—Note 4 | | | | | | 24,380 |
| Dividends and interest receivable | | | | | | | | 21,726 |
| Receivable for shares of Beneficial Interest subscribed | | | | | | 6,090 |
| Prepaid expenses | | | | | | | | 40,727 |
| Due from The Dreyfus Corporation and affiliates—Note 3(d) | | | | | | 2,549 |
| | | | | | | | | 3,867,190 |
| |
| |
| |
| |
|
| Liabilities ($): | | | | | | | | |
| Cash overdraft denominated in foreign currency | | | | 21,315 | | 20,945 |
| Unrealized depreciation on forward | | | | | | | | |
| currency exchange contracts—Note 4 | | | | | | | | 51,390 |
| Payable for investment securities purchased | | | | | �� | 2,483 |
| Interest payable—Note 2 | | | | | | | | 64 |
| Accrued expenses | | | | | | | | 47,152 |
| | | | | | | | | 122,034 |
| |
| |
| |
| |
|
| Net Assets ($) | | | | | | | | 3,745,156 |
| |
| |
| |
| |
|
| Composition of Net Assets ($): | | | | | | | | |
| Paid-in capital | | | | | | | | 6,269,780 |
| Accumulated undistributed investment income—net | | | | | | 32,712 |
| Accumulated net realized gain (loss) on investments | | | | | | (616,804) |
| Accumulated net unrealized appreciation (depreciation) | | | | | | |
| on investments and foreign currency transactions | | | | | | (1,940,532) |
| |
| |
| |
|
| Net Assets ($) | | | | | | | | 3,745,156 |
| |
| |
| |
| |
|
| |
| |
| Net Asset Value Per Share | | | | | | | | |
| | | Class A | | Class C | | Class I | | Class T |
| |
| |
| |
| |
|
| Net Assets ($) | | 2,523,381 | | 844,369 | | 176,809 | | 200,597 |
| Shares Outstanding | | 343,538 | | 115,146 | | 24,083 | | 27,366 |
| |
| |
| |
| |
|
| Net Asset Value Per Share ($) | | 7.35 | | 7.33 | | 7.34 | | 7.33 |
| |
| See notes to financial statements. | | | | | | | | |
The Fund 13
| STATEMENT OF OPERATIONS | | |
| Year Ended October 31, 2008 | | |
| |
|
| |
| |
| |
| |
| Investment Income ($): | | |
| Income: | | |
| Cash dividends (net of $17,251 foreign taxes withheld at source); | | |
| Unaffiliated issuers | | 223,752 |
| Interest | | 2,567 |
| Total Income | | 226,319 |
| Expenses: | | |
| Management fee—Note 3(a) | | 36,102 |
| Legal fees | | 63,731 |
| Custodian fees—Note 3(d) | | 48,680 |
| Auditing fees | | 43,738 |
| Registration fees | | 17,537 |
| Prospectus and shareholders’ reports | | 12,090 |
| Shareholder servicing costs—Note 3(d) | | 12,115 |
| Distribution fees—Note 3(c) | | 6,428 |
| Trustees’ fees and expenses—Note 3(b) | | 1,988 |
| Interest expense—Note 2 | | 134 |
| Loan commitment fees—Note 2 | | 1 |
| Miscellaneous | | 13,236 |
| Total Expenses | | 255,780 |
| Less—expense reimbursement from The Dreyfus | | |
| Corporation due to undertaking—Note 3(a) | | (185,911) |
| Less—Trustees’ fees reimbursed by the Manager—Note 3(b) | | (322) |
| Less—reduction in fees due to earnings credits—Note 1(c) | | (2,561) |
| Net Expenses | | 66,986 |
| Investment Income—Net | | 159,333 |
| |
|
| Realized and Unrealized Gain (Loss) on Investments—Note 4 ($): | | |
| Net realized gain (loss) on investments and foreign currency transactions | | (637,328) |
| Net realized gain (loss) on options transactions | | (1,349) |
| Net realized gain (loss) on financial futures | | 26,582 |
| Net realized gain (loss) on forward currency exchange contracts | | 16,902 |
| Net Realized Gain (Loss) | | (595,193) |
| Net unrealized appreciation (depreciation) on | | |
| investments and foreign currency transactions | | (2,141,662) |
| Net Realized and Unrealized Gain (Loss) on Investments | | (2,736,855) |
| Net (Decrease) in Net Assets Resulting from Operations | | (2,577,522) |
| |
| See notes to financial statements. | | |
14
STATEMENT OF CHANGES IN NET ASSETS
| | | Year Ended October 31, |
| | |
|
| | | 2008 | | 2007a |
| |
| |
|
| Operations ($): | | | | |
| Investment income—net | | 159,333 | | 4,140 |
| Net realized gain (loss) on investments | | (595,193) | | (51,975) |
| Net unrealized appreciation | | | | |
| (depreciation) on investments | | (2,141,662) | | 201,130 |
| Net Increase (Decrease) in Net Assets | | | | |
| Resulting from Operations | | (2,577,522) | | 153,295 |
| |
| |
|
| Dividends to Shareholders from ($): | | | | |
| Investment income—net: | | | | |
| Class A Shares | | (94,769) | | — |
| Class C Shares | | (26,748) | | — |
| Class I Shares | | (8,832) | | — |
| Class T Shares | | (8,647) | | — |
| Total Dividends | | (138,996) | | — |
| |
| |
|
| Beneficial Interest Transactions ($): | | | | |
| Net proceeds from shares sold: | | | | |
| Class A Shares | | 2,981,925 | | 2,104,062 |
| Class C Shares | | 1,176,028 | | 300,000 |
| Class I Shares | | 11,907 | | 300,000 |
| Class T Shares | | 42,500 | | 300,000 |
| Dividends reinvested: | | | | |
| Class A Shares | | 29,173 | | — |
| Class C Shares | | 8,737 | | — |
| Class I Shares | | 336 | | — |
| Class T Shares | | 66 | | — |
| Cost of shares redeemed: | | | | |
| Class A Shares | | (890,944) | | — |
| Class C Shares | | (48,989) | | — |
| Class I Shares | | (6,422) | | — |
| Increase (Decrease) in Net Assets | | | | |
| from Beneficial Interest Transactions | | 3,304,317 | | 3,004,062 |
| Total Increase (Decrease) in Net Assets | | 587,799 | | 3,157,357 |
| |
| |
|
| Net Assets ($): | | | | |
| Beginning of Period | | 3,157,357 | | — |
| End of Period | | 3,745,156 | | 3,157,357 |
| Undistributed investment income (loss)—net | | 32,712 | | (9,236) |
The Fund 15
STATEMENT OF CHANGES IN NET ASSETS (continued)
| | | Year Ended October 31, |
| | |
|
| | | 2008 | | 2007a |
| |
| |
|
| Capital Share Transactions: | | | | |
| Class A | | | | |
| Shares sold | | 255,295 | | 168,325 |
| Shares issued for dividends reinvested | | 2,738 | | — |
| Shares redeemed | | (82,820) | | — |
| Net Increase (Decrease) in Shares Outstanding | | 175,213 | | 168,325 |
| |
| |
|
| Class C | | | | |
| Shares sold | | 95,823 | | 24,000 |
| Shares issued for dividends reinvested | | 809 | | — |
| Shares redeemed | | (5,486) | | — |
| Net Increase (Decrease) in Shares Outstanding | | 91,146 | | 24,000 |
| |
| |
|
| Class I | | | | |
| Shares sold | | 945 | | 24,000 |
| Shares issued for dividends reinvested | | 31 | | — |
| Shares redeemed | | (893) | | — |
| Net Increase (Decrease) in Shares Outstanding | | 83 | | 24,000 |
| |
| |
|
| Class T | | | | |
| Shares sold | | 3,360 | | 24,000 |
| Shares issued for dividends reinvested | | 6 | | — |
| Net Increase (Decrease) in Shares Outstanding | | 3,366 | | 24,000 |
| |
| a From October 18, 2007 (commencement of operations) to October 31, 2007. | | |
| See notes to financial statements. | | | | |
16
FINANCIAL HIGHLIGHTS
The following tables describe the performance for each share class for the fiscal periods indicated.All information (except portfolio turnover rate) reflects financial results for a single fund share.Total return shows how much your investment in the fund would have increased (or decreased) during each period, assuming you had reinvested all dividends and distributions.These figures have been derived from the fund’s financial statements.
| | | Year Ended October 31, |
| | |
|
| Class A Shares | | 2008 | | 2007a |
| |
| |
|
| Per Share Data ($): | | | | |
| Net asset value, beginning of period | | 13.14 | | 12.50 |
| Investment Operations: | | | | |
| Investment income—netb | | .44 | | .02 |
| Net realized and unrealized | | | | |
| gain (loss) on investments | | (5.90) | | .62 |
| Total from Investment Operations | | (5.46) | | .64 |
| Distributions: | | | | |
| Dividends from investment income—net | | (.33) | | — |
| Net asset value, end of period | | 7.35 | | 13.14 |
| |
| |
|
| Total Return (%)c | | (42.41) | | 5.04d |
| |
| |
|
| Ratios/Supplemental Data (%): | | | | |
| Ratio of total expenses to average net assets | | 5.84 | | 26.08e |
| Ratio of net expenses to average net assets | | 1.44 | | 1.50e |
| Ratio of net investment income to average net assets | | 3.88 | | 3.62e |
| Portfolio Turnover Rate | | 99.04 | | 3.45d |
| |
| |
|
| Net Assets, end of period ($ x 1,000) | | 2,523 | | 2,211 |
| a | From October 18, 2007 (commencement of operations) to October 31, 2007. |
| |
| b | Based on average shares outstanding at each month end. |
| |
| c | Exclusive of sales charge. |
| |
| d | Not annualized. |
| |
| e | Annualized. |
| |
| See notes to financial statements. |
The Fund 17
| FINANCIAL HIGHLIGHTS (continued) |
| | | Year Ended October 31, |
| | |
|
| Class C Shares | | 2008 | | 2007a |
| |
| |
|
| Per Share Data ($): | | | | |
| Net asset value, beginning of period | | 13.13 | | 12.50 |
| Investment Operations: | | | | |
| Investment income—netb | | .36 | | .01 |
| Net realized and unrealized | | | | |
| gain (loss) on investments | | (5.89) | | .62 |
| Total from Investment Operations | | (5.53) | | .63 |
| Distributions: | | | | |
| Dividends from investment income—net | | (.27) | | — |
| Net asset value, end of period | | 7.33 | | 13.13 |
| |
| |
|
| Total Return (%)c | | (42.76) | | 4.96d |
| |
| |
|
| Ratios/Supplemental Data (%): | | | | |
| Ratio of total expenses to average net assets | | 7.06 | | 26.83e |
| Ratio of net expenses to average net assets | | 2.18 | | 2.25e |
| Ratio of net investment income to average net assets | | 3.35 | | 2.86e |
| Portfolio Turnover Rate | | 99.04 | | 3.45d |
| |
| |
|
| Net Assets, end of period ($ x 1,000) | | 844 | | 315 |
| a | From October 18, 2007 (commencement of operations) to October 31, 2007. |
| |
| b | Based on average shares outstanding at each month end. |
| |
| c | Exclusive of sales charge. |
| |
| d | Not annualized. |
| |
| e | Annualized. |
| |
| See notes to financial statements. |
18
| | | Year Ended October 31, |
| | |
|
| Class I Shares | | 2008 | | 2007a |
| |
| |
|
| Per Share Data ($): | | | | |
| Net asset value, beginning of period | | 13.14 | | 12.50 |
| Investment Operations: | | | | |
| Investment income—netb | | .45 | | .02 |
| Net realized and unrealized | | | | |
| gain (loss) on investments | | (5.90) | | .62 |
| Total from Investment Operations | | (5.45) | | .64 |
| Distributions: | | | | |
| Dividends from investment income—net | | (.35) | | — |
| Net asset value, end of period | | 7.34 | | 13.14 |
| |
| |
|
| Total Return (%) | | (42.27) | | 5.04c |
| |
| |
|
| Ratios/Supplemental Data (%): | | | | |
| Ratio of total expenses to average net assets | | 5.32 | | 25.84d |
| Ratio of net expenses to average net assets | | 1.21 | | 1.25d |
| Ratio of net investment income to average net assets | | 3.90 | | 3.86d |
| Portfolio Turnover Rate | | 99.04 | | 3.45c |
| |
| |
|
| Net Assets, end of period ($ x 1,000) | | 177 | | 315 |
| a | From October 18, 2007 (commencement of operations) to October 31, 2007. |
| |
| b | Based on average shares outstanding at each month end. |
| |
| c | Not annualized. |
| |
| d | Annualized. |
| |
| See notes to financial statements. |
The Fund 19
| FINANCIAL HIGHLIGHTS (continued) |
| | | Year Ended October 31, |
| | |
|
| Class T Shares | | 2008 | | 2007a |
| |
| |
|
| Per Share Data ($): | | | | |
| Net asset value, beginning of period | | 13.14 | | 12.50 |
| Investment Operations: | | | | |
| Investment income—netb | | .40 | | .02 |
| Net realized and unrealized | | | | |
| gain (loss) on investments | | (5.89) | | .62 |
| Total from Investment Operations | | (5.49) | | .64 |
| Distributions: | | | | |
| Dividends from investment income—net | | (.32) | | — |
| Net asset value, end of period | | 7.33 | | 13.14 |
| |
| |
|
| Total Return (%)c | | (42.54) | | 5.04d |
| |
| |
|
| Ratios/Supplemental Data (%): | | | | |
| Ratio of total expenses to average net assets | | 5.85 | | 26.34e |
| Ratio of net expenses to average net assets | | 1.71 | | 1.75e |
| Ratio of net investment income to average net assets | | 3.42 | | 3.36e |
| Portfolio Turnover Rate | | 99.04 | | 3.45d |
| |
| |
|
| Net Assets, end of period ($ x 1,000) | | 201 | | 315 |
| a | From October 18, 2007 (commencement of operations) to October 31, 2007. |
| |
| b | Based on average shares outstanding at each month end. |
| |
| c | Exclusive of sales charge. |
| |
| d | Not annualized. |
| |
| e | Annualized. |
| |
| See notes to financial statements. |
20
NOTES TO FINANCIAL STATEMENTS
NOTE 1—Significant Accounting Policies:
Dreyfus Global Equity Income Fund (the “fund”) is a separate diversified series ofThe Dreyfus/Laurel FundsTrust (the “Trust”) which is registered under the Investment Company Act of 1940, as amended (the “Act”), as a diversified open-end management investment company and operates as a series company offering seven series, including the fund. The fund’s investment objective is to seek total return (consisting of capital appreciation and income).The Dreyfus Corporation (the “Manager” or “Dreyfus”), a wholly-owned subsidiary of The Bank of New York Mellon Corporation (“BNY Mellon”), serves as the fund’s investment adviser. Newton Capital Management Limited (“Newton”), an affiliate of BNY Mellon, serves as the fund’s sub-investment adviser.
At a meeting of the fund’s Board of Trustees held on July 24, 2008, the Board approved, effective December 1, 2008, a proposal to change the name of the fund from “Dreyfus Premier Global Equity Income Fund” to “Dreyfus Global Equity Income Fund.”
Effective July 1, 2008, BNY Mellon has reorganized and consolidated a number of its banking and trust company subsidiaries. As a result of the reorganization, any services previously provided to the fund by Mellon Bank, N.A. or Mellon Trust of New England, N.A. are now provided by The Bank of New York, which has changed its name to The Bank of New York Mellon.
MBSC Securities Corporation (the “Distributor”), a wholly-owned subsidiary of Dreyfus, is the distributor of the fund’s shares.The fund is authorized to issue an unlimited number of shares of Beneficial Interest in each of the following classes of shares: Class A, Class C, Class I and Class T. Class A, Class C and Class T shares are sold primarily to retail investors through financial intermediaries and bear a distribution fee and/or shareholder services fee. Class A and ClassT shares are sold with a front-end sales charge, while Class C shares are subject
The Fund 21
| NOTES TO FINANCIAL STATEMENTS (continued) |
to a contingent deferred sales charge (“CDSC”). Class I shares are sold primarily to bank trust departments and other financial service providers (including The Bank of New York Mellon, a subsidiary of BNY Mellon and an affiliate of Dreyfus) acting on behalf of customers having a qualified trust or an investment account or relationship at such institution and bear no distribution or shareholder services fees. Class I shares are offered without a front-end sales charge or CDSC. Each class of shares has identical rights and privileges, except with respect to distribution and service fees, the allocation of certain transfer agency costs and voting rights on matters affecting a single class. Income, expenses (other than expenses attributable to a specific class), and realized and unrealized gains or losses on investments are allocated to each class of shares based on its relative net assets.
As of October 31, 2008, MBC Investments Corp., an indirect subsidiary of BNY Mellon, held 168,000 Class A shares and 24,000 in each of Class C, Class I and Class T shares of the fund.
The fund’s financial statements are prepared in accordance with U.S. generally accepted accounting principles, which may require the use of management estimates and assumptions. Actual results could differ from those estimates.
(a) Portfolio valuation: Investments in securities are valued at the last sales price on the securities exchange or national securities market on which such securities are primarily traded. Securities listed on the National Market System for which market quotations are available are valued at the official closing price or, if there is no official closing price that day, at the last sales price. Securities not listed on an exchange or the national securities market, or securities for which there were no transactions, are valued at the average of the most recent bid and asked prices, except for open short positions, where the asked price is used for valuation purposes. Bid price is used when no asked price is available. Registered investment companies that are not traded on an exchange are valued at their net asset value.When market quotations or
22
official closing prices are not readily available, or are determined not to reflect accurately fair value, such as when the value of a security has been significantly affected by events after the close of the exchange or market on which the security is principally traded (for example, a foreign exchange or market), but before the fund calculates its net asset value, the fund may value these investments at fair value as determined in accordance with the procedures approved by the Board of Trustees. Fair valuing of securities may be determined with the assistance of a pricing service using calculations based on indices of domestic securities and other appropriate indicators, such as prices of relevant ADRs and futures contracts. For other securities that are fair valued by the Board ofTrustees, certain factors may be considered such as: fundamental analytical data, the nature and duration of restrictions on disposition, an evaluation of the forces that influence the market in which the securities are purchased and sold and public trading in similar securities of the issuer or comparable issuers. Financial futures and options, which are traded on an exchange, are valued at the last sales price on the securities exchange on which such securities are primarily traded or at the last sales price on the national securities market on each business day. Options traded over-the-counter are priced at the mean between the bid and asked price. Investments denominated in foreign currencies are translated to U.S. dollars at the prevailing rates of exchange. Forward currency exchange contracts are valued at the forward rate.
The Financial Accounting Standards Board (“FASB”) released Statement of Financial Accounting Standards No. 157 “Fair Value Measurements” (��FAS 157”). FAS 157 establishes an authoritative definition of fair value, sets out a framework for measuring fair value, and requires additional disclosures about fair-value measurements. The application of FAS 157 is required for fiscal years beginning after November 15, 2007 and interim periods within those fiscal years. Management does not believe that the application of this standard will have a material impact on the financial statements of the fund.
The Fund 23
| NOTES TO FINANCIAL STATEMENTS (continued) |
(b) Foreign currency transactions: The fund does not isolate that portion of the results of operations resulting from changes in foreign exchange rates on investments from the fluctuations arising from changes in market prices of securities held. Such fluctuations are included with the net realized and unrealized gain or loss on investments.
Net realized foreign exchange gains or losses arise from sales and maturities of short-term securities, sales of foreign currencies, currency gains or losses realized on securities transactions and cash balances and the difference between the amounts of dividends, interest and foreign withholding taxes recorded on the fund’s books and the U.S. dollar equivalent of the amounts actually received or paid. Net unrealized foreign exchange gains or losses arise from changes in the value of assets and liabilities other than investments in securities, resulting from changes in exchange rates. Such gains and losses are included with net realized and unrealized gain or loss on investments.
(c) Securities transactions and investment income: Securities transactions are recorded on a trade date basis. Realized gains and losses from securities transactions are recorded on the identified cost basis. Dividend income is recognized on the ex-dividend date and interest income, including, where applicable, accretion of discount and amortization of premium on investments, is recognized on the accrual basis.
The fund has arrangements with the custodian and cash management banks whereby the fund may receive earnings credits when positive cash balances are maintained, which are used to offset custody and cash management fees. For financial reporting purposes, the fund includes net earnings credits as an expense offset in the Statement of Operations.
Investing in foreign markets may involve special risks and considerations not typically associated with investing in the U.S. These risks include revaluation of currencies, high rates of inflation, repatriation restrictions on income and capital, and adverse political and economic developments. Moreover, securities issued in these markets may be less
24
liquid, subject to government ownership controls and delayed settlements, and their prices may be more volatile than those of comparable securities in the U.S.
(d) Affiliated issuers: Investments in other investment companies advised by Dreyfus are defined as “affiliated” in the Act.
(e) Dividends to shareholders: Dividends are recorded on the ex-dividend date. Dividends from investment income-net are declared and paid quarterly. Dividends from net realized capital gains, if any, are normally declared and paid annually, but the fund may make distributions on a more frequent basis to comply with the distribution requirements of the Internal Revenue Code of 1986, as amended (the “Code”).To the extent that net realized capital gains can be offset by capital loss carryovers, it is the policy of the fund not to distribute such gains. Income and capital gain distributions are determined in accordance with income tax regulations, which may differ from U.S. generally accepted accounting principles.
(f) Federal income taxes: It is the policy of the fund to continue to qualify as a regulated investment company, if such qualification is in the best interests of its shareholders, by complying with the applicable provisions of the Code, and to make distributions of taxable income sufficient to relieve it from substantially all federal income and excise taxes.
The fund adopted FASB Interpretation No. 48 “Accounting for Uncertainty in Income Taxes” (“FIN 48”). FIN 48 provides guidance for how uncertain tax positions should be recognized, measured, presented and disclosed in the financial statements. FIN 48 requires the evaluation of tax positions taken or expected to be taken in the course of preparing the fund’s tax returns to determine whether the tax positions are “more-likely-than not” of being sustained by the applicable tax authority. Liability for tax positions not deemed to meet the more likely-than-not threshold would be recorded as a tax expense in the
The Fund 25
| NOTES TO FINANCIAL STATEMENTS (continued) |
current year.The adoption of FIN 48 had no impact on the operations of the fund for the period ended October 31, 2008.
As of and during the period ended October 31, 2008, the fund did not have any liabilities for any unrecognized tax positions. The fund recognizes interest and penalties, if any, related to unrecognized tax positions as income tax expense in the Statement of Operations. During the period, the fund did not incur any interest or penalties.
Each of the tax years in the two-year period ended October 31, 2008 remains subject to examination by the Internal Revenue Service and state taxing authorities.
At October 31, 2008, the components of accumulated earnings on a tax basis were as follows: undistributed ordinary income $74,345, accumulated capital losses $550,003 and unrealized depreciation $2,048,966.
The accumulated capital loss carryover is available for federal income tax purposes to be applied against future net securities profits, if any, realized subsequent to October 31, 2008. If not applied, the carryover expires in fiscal 2016.
The tax character of distributions paid to shareholders during the fiscal period ended October 31, 2008 was as follows: ordinary income $138,996.
During the period ended October 31, 2008, as a result of permanent book to tax differences, primarily due to the tax treatment for foreign currency gains and losses and passive foreign investment companies, the fund increased accumulated undistributed investment income-net by $21,611 and decreased accumulated net realized gain (loss) on investments by the same amount. Net assets and net asset value per share were not affected by this reclassification.
NOTE 2—Bank Lines of Credit:
Prior to October 15, 2008, the fund participated with other Dreyfus-managed funds in a $350 million redemption credit facility. Effective October 15, 2008, the fund participates with other Dreyfus-managed funds in a $145 million redemption credit facility (the “Facility”) to be
26
utilized for temporary or emergency purposes, including the financing of redemptions. In connection therewith, the fund has agreed to pay commitment fees on its pro rata portion of the Facility. Interest is charged to the fund based on prevailing market rates in effect at the time of borrowing.
The average daily amount of borrowings outstanding under the Facilities during the period ended October 31, 2008, was approximately $10,600 with a related weighted average annualized interest rate of 2.54% .
NOTE 3—Investment Management Fee and Other Transactions With Affiliates:
(a) Pursuant to an Investment Management Agreement between the Manager and the Trust, the Trust has agreed to pay the Manager a management fee computed at the annual rate of .85% of the value of the fund’s average daily net assets and is payable monthly.The Manager has contractually agreed, until March 1, 2010, to waive receipt of its fees and/or assume the expenses of the fund so that the annual operating expenses (excluding Rule 12b-1 fees, shareholder services fees, taxes, interest, brokerage commissions, commitment fees on borrowings and extraordinary expenses) do not exceed 1.25% of the value of the fund’s average daily net assets. The expense reimbursement, pursuant to the undertaking, amounted to $185,911 during the period ended October 31, 2008.
Pursuant to a Sub-Investment Advisory Agreement between Dreyfus and Newton, Dreyfus pays Newton an annual fee of .41% of the value of the fund’s average daily net assets, payable monthly.
(b) Each Trustee receives $45,000 per year, plus $6,000 for each joint Board meeting of The Dreyfus/Laurel Funds, Inc.,The Dreyfus/Laurel FundsTrust andThe Dreyfus/LaurelTax-Free Municipal Funds, (collectively, the “Dreyfus/Laurel Funds”) attended, $2,000 for separate in-person committee meetings attended which are not held in conjunction with a regularly scheduled Board meeting and $1,500 for Board meetings and separate committee meetings attended that are conducted by
The Fund 27
| NOTES TO FINANCIAL STATEMENTS (continued) |
telephone and is reimbursed for travel and out-of-pocket expenses.With respect to Board meetings, the Chairman of the Board receives an additional 25% of such compensation (with the exception of reimbursable amounts).With respect to compensation committee meetings, the Chair of the compensation committee receives $900 per meeting and, with respect to audit committee meetings prior to April 12, 2008, the Chair of the audit committee received $1,350 per meeting. In the event that there is an in-person joint committee meeting of the Dreyfus/Laurel Funds and Dreyfus HighYield Strategies Fund,the $2,000 or $1,500 fee, as applicable, will be allocated between the Dreyfus/Laurel Funds and Dreyfus HighYield Strategies Fund.These fees and expenses are charged and allocated to each series based on net assets.Amounts required to be paid by the Trust directly to the non-interested Trustees, that would be applied to offset a portion of the management fee payable by certain other series of the Trust to the Manager, are in fact paid directly by the Manager to the non-interested Trustees.
During the period ended October 31, 2008, the Distributor retained $2,660 from commissions earned on sales of the fund’s Class A shares.
(c) Under the Distribution Plan (the “Plan”) adopted pursuant to Rule 12b-1 under the Act, Class C and Class T shares pay the Distributor for distributing their shares at an annual rate of .75% of the value of the average daily net assets of Class C shares and .25% of the value of the average daily net assets of Class T shares. During the period ended October 31, 2008, Class C and Class T shares were charged $5,654 and $774, respectively, pursuant to the Plan.
(d) Under the Shareholder Services Plan, Class A, Class C and Class T shares pay the Distributor at an annual rate of ..25% of the value of their average daily net assets for the provision of certain services.The services provided may include personal services relating to shareholder accounts, such as answering shareholder inquiries regarding the fund and providing reports and other information, and services related to the maintenance of shareholder accounts. The Distributor may make payments to Service Agents (a securities dealer, financial institution or
28
other industry professional) in respect of these services. The Distributor determines the amounts to be paid to Service Agents. During the period ended October 31, 2008, Class A, Class C and Class T shares were charged $7,247, $1,885 and $774, respectively, pursuant to the Shareholder Services Plan.
Under its terms, the Plan and Shareholder Services Plan shall remain in effect from year to year, provided such continuance is approved annually by a vote of majority of those Trustees who are not “interested persons” of the Trust and who have no direct or indirect financial interest in the operation of or in any agreement related to the Plan or Shareholder Services Plan.
The fund compensates Dreyfus Transfer, Inc., a wholly-owned subsidiary of Dreyfus, under a transfer agency agreement for providing personnel and facilities to perform transfer agency services for the fund. During the period ended October 31, 2008, the fund was charged $92 pursuant to the transfer agency agreement.
The fund compensates The Bank of New York Mellon under a cash management agreement for performing cash management services related to fund subscriptions and redemptions. During the period ended October 31, 2008, the fund was charged $120 pursuant to the cash management agreement.
The fund compensates The Bank of New York Mellon under a custody agreement for providing custodial services for the fund. During the period ended October 31, 2008, the fund was charged $48,680 pursuant to the custody agreement.
During the period ended October 31, 2008, the fund was charged $6,203 for services performed by the Chief Compliance Officer.
The components of “Due fromThe Dreyfus Corporation and affiliates” in the Statement of Assets and Liabilities consist of: an expense reimbursement of $26,490, which is offset by management fees $2,789, Rule 12b-1 distribution plan fees $599, shareholder services plan fees
The Fund 29
| NOTES TO FINANCIAL STATEMENTS (continued) |
$781, chief compliance officer fees $1,973, custodian fees $17,559 and transfer agency per account fees $240.
NOTE 4—Securities Transactions:
The aggregate amount of purchases and sales of investment securities, excluding short-term securities, financial futures, options transactions and forward currency exchange contracts, during the period ended October 31, 2008, amounted to $6,735,413 and $3,962,814, respectively.
The fund may invest in financial futures contracts in order to gain exposure to or protect against changes in the market.The fund is exposed to market risk as a result of changes in the value of the underlying financial instruments. Investments in financial futures require the fund to “mark to market” on a daily basis, which reflects the change in the market value of the contracts at the close of each day’s trading.Accordingly, variation margin payments are received or made to reflect daily unrealized gains or losses.When the contracts are closed, the fund recognizes a realized gain or loss.These investments require initial margin deposits with a broker, which consist of cash or cash equivalents.The amount of these deposits is determined by the exchange or Board of Trade on which the contract is traded and is subject to change. At October 31, 2008, there were no open financial futures contracts outstanding.
The fund may purchase and write (sell) put and call options in order to gain exposure to or to protect against changes in the market.
As a writer of call options, the fund receives a premium at the outset and then bears the market risk of unfavorable changes in the price of the financial instrument underlying the option. Generally, the fund would incur a gain, to the extent of the premium, if the price of the underlying financial instrument decreases between the date the option is written and the date on which the option is terminated. Generally, the fund would realize a loss, if the price of the financial instrument increases between those dates.At October 31, 2008, there were no call options written.
As a writer of put options, the fund receives a premium at the outset and then bears the market risk of unfavorable changes in the price of the financial instrument underlying the option. Generally, the fund
30
would incur a gain, to the extent of the premium, if the price of the underlying financial instrument increases between the date the option is written and the date on which the option is terminated. Generally, the fund would realize a loss, if the price of the financial instrument decreases between those dates.At October 31, 2008, there were no put options written.
The fund enters into forward currency exchange contracts in order to hedge its exposure to changes in foreign currency exchange rates on its foreign portfolio holdings and to settle foreign currency transac-tions.When executing forward currency exchange contracts, the fund is obligated to buy or sell a foreign currency at a specified rate on a certain date in the future. With respect to sales of forward currency exchange contracts, the fund would incur a loss if the value of the contract increases between the date the forward contract is opened and the date the forward contract is closed.The fund realizes a gain if the value of the contract decreases between those dates. With respect to purchases of forward currency exchange contracts, the fund would incur a loss if the value of the contract decreases between the date the forward contract is opened and the date the forward contract is closed. The fund realizes a gain if the value of the contract increases between those dates. The fund is also exposed to credit risk associated with counterparty nonperformance on these forward currency exchange contracts which is typically limited to the unrealized gain on each open contract. The following summarizes open forward currency exchange contracts at October 31, 2008:
| | | Foreign | | | | | | |
| Forward Currency | | Currency | | | | | | Unrealized |
| Exchange Contracts | | Amounts | | Cost ($) | | Value ($) (Depreciation) ($) |
| |
| |
| |
|
| Purchases: | | | | | | | | |
| British Pound, | | | | | | | | |
| expiring 11/3/2008 | | 1,288 | | 2,121 | | 2,073 | | (48) |
| British Pound, | | | | | | | | |
| expiring 11/4/2008 | | 255 | | 411 | | 410 | | (1) |
| British Pound, | | | | | | | | |
| expiring 11/14/2008 | | 93,768 | | 163,776 | | 150,744 | | (13,032) |
| British Pound, | | | | | | | | |
| expiring 1/15/2009 | | 179,776 | | 317,440 | | 288,163 | | (29,277) |
The Fund 31
| NOTES TO FINANCIAL STATEMENTS (continued) |
| | | Foreign | | | | | | Unrealized |
| Forward Currency | | Currency | | | | | | Appreciation |
| Exchange Contracts | | Amounts | | Cost ($) | | Value ($) (Depreciation) ($) |
| |
| |
| |
|
| Purchases (continued): | | | | | | | | |
| Japanese Yen, | | | | | | | | |
| expiring 11/14/2008 | | 13,109,220 | | 125,100 | | 133,123 | | 8,023 |
| Japanese Yen, | | | | | | | | |
| expiring 11/14/2008 | | 3,765,812 | | 35,534 | | 38,242 | | 2,708 |
| Swiss Franc, | | | | | | | | |
| expiring 4/15/2009 | | 93,213 | | 81,920 | | 80,597 | | (1,323) |
| Sales: | | | | Proceeds ($) | | | | |
| British Pound, | | | | | | | | |
| expiring 11/14/2008 | | 67,000 | | 125,100 | | 107,711 | | 17,389 |
| British Pound, | | | | | | | | |
| expiring 11/14/2008 | | 18,100 | | 35,533 | | 29,098 | | 6,435 |
| British Pound, | | | | | | | | |
| expiring 1/15/2009 | | 81,000 | | 158,262 | | 129,835 | | 28,427 |
| British Pound, | | | | | | | | |
| expiring 1/15/2009 | | 84,000 | | 159,178 | | 134,644 | | 24,534 |
| British Pound, | | | | | | | | |
| expiring 4/15/2009 | | 48,000 | | 81,920 | | 76,713 | | 5,207 |
| Japanese Yen, | | | | | | | | |
| expiring 11/14/2008 | | 16,875,032 | | 163,777 | | 171,365 | | (7,588) |
| Singapore Dollar, | | | | | | | | |
| expiring 11/3/2008 | | 23,001 | | 15,389 | | 15,510 | | (121) |
| Singapore Dollar, | | | | | | | | |
| expiring 11/4/2008 | | 8,524 | | 5,799 | | 5,748 | | 51 |
| Total | | | | | | | | 41,384 |
At October 31, 2008, the cost of investments for federal income tax purposes was $5,652,837; accordingly, accumulated net unrealized depreciation on investments was $2,046,017, consisting of $7,351 gross unrealized appreciation and $2,053,368 gross unrealized depreciation.
In March 2008, the FASB released Statement of Financial Accounting Standards No. 161 “Disclosures about Derivative Instruments and Hedging Activities” (“FAS 161”). FAS 161 requires qualitative disclosures about objectives and strategies for using derivatives, quantitative disclosures about fair value amounts of gains and losses on derivative instruments and disclosures about credit-risk-related contingent features in derivative agreements.The application of FAS 161 is required
32
for fiscal years and interim periods beginning after November 15, 2008. At this time, management is evaluating the implications of FAS 161 and its impact on the financial statements and the accompanying notes has not yet been determined.
NOTE 5—Subsequent Event:
Effective on or about February 4, 2009 (the “Effective Date”), the fund will issue to each holder of its Class T shares, in exchange for said shares, Class A shares of the fund having an aggregate net asset value equal to the aggregate net asset value of the shareholder’s Class T shares.Thereafter, the fund will no longer offer Class T shares.
Effective on or about December 3, 2008, no investments for new accounts were permitted in Class T of the fund, except that participants in certain group retirement plans were able to open a new account in Class T of the fund, provided that the fund was established as an investment option under the plans before December 3, 2008. After the Effective Date, subsequent investments in the fund’s Class A shares made by holders of the fund’s Class T shares who received Class A shares of the fund in exchange for their Class T shares will be subject to the front-end sales load schedule currently in effect for Class T shares. Otherwise, all other Class A share attributes will be in effect.
The Fund 33
REPORT OF INDEPENDENT REGISTERED
PUBLIC ACCOUNTING FIRM |
| | The Board of Trustees and Shareholders
The Dreyfus/Laurel Funds Trust: |
We have audited the accompanying statement of assets and liabilities of Dreyfus Global Equity Income Fund (formerly Dreyfus Premier Global Equity Income Fund), a series of The Dreyfus/Laurel Funds Trust (the “Fund”), including the statement of investments, as of October 31, 2008, and the related statement of operations for the year then ended, the statement of changes in net assets and financial highlights for the year then ended and for the period from October 18, 2007 (commencement of operations) to October 31, 2007. These financial statements and financial highlights are the responsibility of the Fund’s management. Our responsibility is to express an opinion on these financial statements and financial highlights based on our audits.
We conducted our audits in accordance with the standards of the Public Company Accounting Oversight Board (United States).Those standards require that we plan and perform the audit to obtain reasonable assurance about whether the financial statements and financial highlights are free of material misstatement. An audit includes examining, on a test basis, evidence supporting the amounts and disclosures in the financial statements. Our procedures included confirmation of securities owned as of October 31, 2008, by correspondence with the custodian and brokers or by other appropriate auditing procedures where replies from brokers were not received.An audit also includes assessing the accounting principles used and significant estimates made by management, as well as evaluating the overall financial statement presentation.We believe that our audits provide a reasonable basis for our opinion.
In our opinion, the financial statements and financial highlights referred to above present fairly, in all material respects, the financial position of Dreyfus Global Equity Income Fund as of October 31, 2008, and the results of its operations for the year then ended, the changes in its net assets and the financial highlights for the year then ended and for the period from October 18, 2007 (commencement of operations) to October 31, 2007, in conformity with U.S. generally accepted accounting principles.

| | New York, New York
December 23, 2008 |
34
IMPORTANT TAX INFORMATION ( U n a u d i t e d )
In accordance with federal tax law, the fund elects to provide each shareholder with their portion of the fund’s foreign taxes paid and the income sourced from foreign countries. Accordingly, the fund hereby makes the following designations regarding its fiscal year ended October 31, 2008:
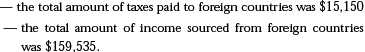
As required by federal tax law rules, shareholders will receive notification of their proportionate share of foreign taxes paid and foreign sourced income for the 2008 calendar year with Form 1099-DIV which will be mailed by January 31, 2009.
For the fiscal year ended October 31, 2008, certain dividends paid by the fund may be subject to a maximum tax rate of 15%, as provided for by the Jobs and Growth Tax Relief Reconciliation Act of 2003. Of the distributions paid during the fiscal year, $138,996 represents the maximum amount that may be considered qualified dividend income.
The Fund 35
BOARD MEMBERS INFORMATION ( U n a u d i t e d )

36

The Fund 37
OFFICERS OF THE FUND (Unaudited)
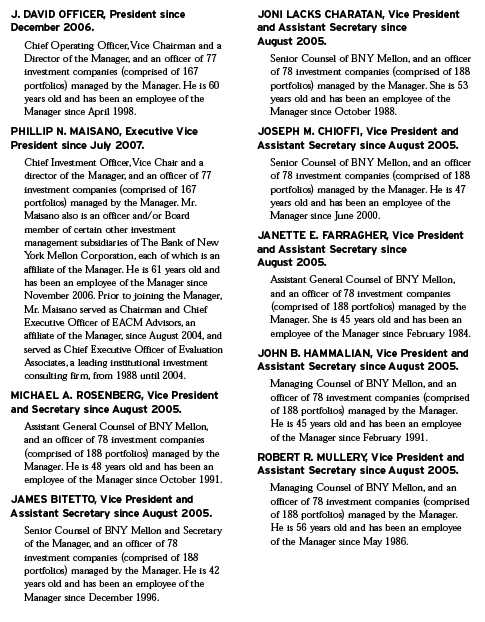
38

The Fund 39
NOTES
For More Information

Telephone Call your financial representative or 1-800-554-4611
Mail The Dreyfus Family of Funds, 144 Glenn Curtiss Boulevard, Uniondale, NY 11556-0144
The fund files its complete schedule of portfolio holdings with the Securities and Exchange Commission (“SEC”) for the first and third quarters of each fiscal year on Form N-Q. The fund’s Forms N-Q are available on the SEC’s website at http://www.sec.gov and may be reviewed and copied at the SEC’s Public Reference Room in Washington, DC. Information on the operation of the Public Reference Room may be obtained by calling 1-800-SEC-0330.
A description of the policies and procedures that the fund uses to determine how to vote proxies relating to portfolio securities is available at http://www.dreyfus.com. The description of the policies and procedures is also available without charge, upon request, by calling 1-800-645-6561.
| © 2008 MBSC Securities Corporation |

| | Dreyfus
International
Bond Fund |
| | ANNUAL REPORT October 31, 2008 |

Save time. Save paper. View your next shareholder report online as soon as it’s available. Log into www.dreyfus.com and sign up for Dreyfus eCommunications. It’s simple and only takes a few minutes.
The views expressed in this report reflect those of the portfolio manager only through the end of the period covered and do not necessarily represent the views of Dreyfus or any other person in the Dreyfus organization. Any such views are subject to change at any time based upon market or other conditions and Dreyfus disclaims any responsibility to update such views.These views may not be relied on as investment advice and, because investment decisions for a Dreyfus fund are based on numerous factors, may not be relied on as an indication of trading intent on behalf of any Dreyfus fund.
Not FDIC-Insured Not Bank-Guaranteed May Lose Value
| | Contents |
| |
| | THE FUND |
| |
| 2 | A Letter from the CEO |
| |
| 3 | Discussion of Fund Performance |
| |
| 6 | Fund Performance |
| |
| 8 | Understanding Your Fund’s Expenses |
| |
| 8 | Comparing Your Fund’s Expenses With Those of Other Funds |
| |
| 9 | Statement of Investments |
| |
| 19 | Statement of Financial Futures |
| |
| 20 | Statement of Assets and Liabilities |
| |
| 21 | Statement of Operations |
| |
| 22 | Statement of Changes in Net Assets |
| |
| 24 | Financial Highlights |
| |
| 27 | Notes to Financial Statements |
| |
| 44 | Report of Independent Registered Public Accounting Firm |
| |
| 45 | Important Tax Information |
| |
| 46 | Board Members Information |
| |
| 48 | Officers of the Fund |
| |
| | FOR MORE INFORMATION |
| |
| | Back Cover |
| |
Dreyfus
International Bond Fund |

A LETTER FROM THE CEO
Dear Shareholder: |
We present to you this annual report for Dreyfus International Bond Fund, covering the 12-month period from November 1, 2007, through October 31, 2008.
These are difficult times for fixed-income investors.A credit crunch that began in 2007 has developed into a full-blown global financial crisis, recently resulting in the failure of several major financial institutions and prompting a massive government rescue effort.The U.S. economic slowdown also has gathered momentum, depressing investor sentiment and consumer confidence. These factors undermined returns in most bond market sectors, including municipal bonds. Even the traditional safe haven of U.S. government securities has encountered heightened volatility.
The depth and duration of the economic downturn will depend on how quickly the financial system can be stabilized.We believe that the Temporary Guarantee Program for Money Market Funds and the $700 billion rescue package intended to promote greater liquidity in the general financial markets meet several critical requirements for addressing today’s financial stresses, and we expect these measures to contribute to a more orderly deleveraging process. However, recuperation from the financial crisis is likely to take time. In the meantime, we encourage you to keep in touch with your financial advisor and maintain a long-term and disciplined perspective to investing. Indeed, we already are seeing some positive signs, including a likely peak in global inflationary pressures, a bottoming of the U.S. dollar, attractive valuations among municipal securities and a large pool of worldwide financial liquidity that could be deployed gradually as the economic cycle turns.
For information about how the fund performed during the reporting period, as well as market perspectives, we have provided a Discussion of Fund Performance given by the fund’s Portfolio Manager.
Thank you for your continued confidence and support.
Jonathan R. Baum
Chief Executive Officer
The Dreyfus Corporation
November 17, 2008 |
2

DISCUSSION OF FUND PERFORMANCE
For the period of November 1, 2007, through October 31, 2008, as provided by Thomas F. Fahey, Portfolio Manager
Fund and Market Performance Overview
For the 12-month period ended October 31,2008,Dreyfus International Bond Fund’s Class A shares produced a total return of 1.21%, Class C shares achieved a total return of 0.40%, and Class I shares achieved a total return of 1.47% .1 In comparison, the fund’s benchmark, the J.P. Morgan Global Government Bond Index, Excluding U.S. (Unhedged) (the “Index”), produced a total return of 1.74% for the same period.2
International bond markets encountered heightened volatility due to a slowing global economy and an intensifying financial crisis. The fund’s returns were lower than its benchmark, which we attribute in part to the portfolio’s overweight position in the high yield corporate securities relative to the Index as well as currency fluctuations toward a stronger dollar that significantly devalued non-U.S. investments for U.S. residents.
The Fund’s Investment Approach
The fund seeks to maximize total return through capital appreciation and income.To pursue its goal, the fund normally invests at least 80% of its assets in fixed-income securities.The fund also normally invests at least 65% of its assets in non-U.S. dollar-denominated fixed-income securities of foreign governments and companies located in various countries, including emerging markets. The fund ordinarily invests in at least five countries other than the U.S. and, at times, may invest a substantial portion of its assets in a single foreign country. Generally, the fund seeks to maintain a portfolio with an investment grade average credit quality.
We focus on identifying undervalued government bond markets, currencies, sectors and securities. We look for fixed-income securities with the most potential for added value, such as those involving the potential for credit upgrades, unique structural characteristics or innovative features.We select securities for the fund’s portfolio by:
- Using fundamental economic research and quantitative analysis to allocate assets among countries and currencies based on a compara- tive valuation of interest and inflation rate trends, government fiscal and monetary policies, and the credit quality of government debt.
The Fund 3
| DISCUSSION OF FUND PERFORMANCE (continued) |
- Focusing on sectors and individual securities that appear to be rela- tively undervalued and actively traded among sectors.
We may hedge some, but not necessarily all, of the fund’s foreign currency exposure to the Index, but, at times, we may seek to manage currency risk, and we may find opportunities to add value by hedging a portion of the fund’s currency exposure to the U.S. dollar.
Global Financial Crisis Sparked Heightened Volatility
Following a downward trend established by the United States, most regions of the world suffered from slowing economic growth,fueling fears of a global recession. Meanwhile, a credit crunch that began in the U.S. sub-prime mortgage market in 2007 developed into a global financial crisis later in the reporting period,nearly leading to the collapse of the global banking system in September 2008. Government and regulatory authorities intervened, pumping billions of dollars into the system to restore a degree of investor confidence.These efforts included an unprecedented, coordinated reduction of short-term interest rates by major central banks.
As market conditions deteriorated, many highly leveraged institutional investors were forced to de-lever their portfolios, selling their more liquid investments to raise cash for margin calls. Selling pressure led to broadly lower prices even among fundamentally sound bonds. Bonds from emerging markets were particularly hard-hit, while those from developed markets fared better.
Long Duration Bolstered Relative Performance
The fund benefited from an emphasis on bonds from higher-quality, developed markets. A position in German bonds helped drive the fund’s positive relative performance as investors flocked to traditional safe havens. In addition, the fund’s holdings of United Kingdom and New Zealand bonds fared relatively well in the flight to quality.
The fund also achieved positive results from our interest rate strategies, which tended to favor bonds with maturities in the five-year range over longer-term maturities. However, we also had longer duration relative to the Index.This strategy paid off when central banks eased short-term interest rates, and shorter maturity yields declined more steeply than yields of longer-term bonds.
On the other hand, currency fluctuations proved detrimental to the fund’s relative performance, as the U.S. dollar reversed course and rallied during the flight to quality, eroding the value of non-U.S. bonds for
4
U.S. residents.We successfully mitigated some of the adverse impact of currency fluctuations through active currency positions and the use of futures contracts.The fund’s relative performance also was hampered by its holdings of investment-grade and high yield corporate bonds, which were hurt by economic and credit concerns. Although the fund held relatively few lower-rated credits, even this small allocation had a mate rially adverse effect on returns during the financial crisis.
Maintaining a Cautious Posture
As of the reporting period’s end, the global economic downturn and financial crisis have persisted.Therefore, we have maintained a cautious investment posture, including an emphasis on higher-quality, developed markets. However, we have found a number of attractively valued bonds in more speculative areas, and we may establish positions in such secu rities when we see evidence that the current downturn has bottomed
November 17, 2008
| | | Foreign bonds are subject to special risks including exposure to currency fluctuations, |
| | | changing political and economic conditions, and potentially less liquidity. |
| | | Investments in foreign currencies are subject to the risk that those currencies will decline in |
| | | value relative to the U.S. dollar, or, in the case of hedged positions, that the U.S. dollar will |
| | | decline relative to the currency being hedged. Currency rates in foreign countries may |
| | | fluctuate significantly over short periods of time. A decline in the value of foreign currencies |
| | | relative to the U.S. dollar will reduce the value of securities held by the fund and |
| | | denominated in those currencies. |
| | | The fund may use derivative instruments, such as options, futures and options on futures, forward |
| | | contracts, swaps (including credit default swaps on corporate bonds and asset-backed securities), |
| | | options on swaps, and other credit derivatives.A small investment in derivatives could have a |
| | | potentially large impact on the fund’s performance.The use of derivatives involves risks different |
| | | from, or possibly greater than, the risks associated with investing directly in the underlying assets. |
| | | Credit default swaps and similar instruments involve greater risks than if the fund had invested in |
| | | the reference obligation directly, since, in addition to general market risks, they are subject to |
| | | illiquidity risk, counterparty risk and credit risks. |
| 1 | | Total return includes reinvestment of dividends and any capital gains paid and does not take into |
| | | consideration the maximum initial sales charge in the case of Class A shares or the applicable |
| | | contingent deferred sales charge imposed on redemptions in the case of Class C shares. Had these |
| | | charges been reflected, returns would have been lower. Past performance is no guarantee of future |
| | | results. Share price and investment return fluctuate such that upon redemption, fund shares may be |
| | | worth more or less than their original cost. Return figures provided reflect the absorption of certain |
| | | fund expenses by The Dreyfus Corporation pursuant to an agreement in effect through March 1, |
| | | 2010, at which time it may be extended, modified or terminated. Had these expenses not been |
| | | absorbed, the fund’s returns would have been lower. |
| 2 | | SOURCE: Bloomberg L.P. — Reflects reinvestment of dividends and, where applicable, capital |
| | | gain distributions.The J.P. Morgan Global Government Bond Index, Excluding U.S. (Unhedged) |
| | | is a widely used benchmark for measuring performance and quantifying risk across international |
| | | fixed-income bond markets.The Index measures the total, principal, and interest returns in each |
| | | market. Index returns do not reflect fees and expenses associated with operating a mutual fund. |
The Fund 5

| † Source: Bloomberg L.P. |
| Past performance is not predictive of future performance. |
| The above graph compares a $10,000 investment made in Class A, Class C and Class I shares of Dreyfus |
| International Bond Fund on 12/30/05 (inception date) to a $10,000 investment made in the J.P. Morgan Global |
| Government Bond Index, Excluding U.S. (Unhedged) (the “Index”) on that date.All dividends and capital gain |
| distributions are reinvested. |
| The fund invests 80% of its assets primarily in fixed-income securities.The fund’s performance shown in the line graph |
| takes into account the maximum initial sales charge on Class A shares and all other applicable fees and expenses on all |
| classes.The Index is a widely used benchmark for measuring performance and quantifying risk across international fixed |
| income bond markets.The Index measures the total, principal and interest returns in each market. Unlike a mutual fund, |
| the Index is not subject to charges, fees and other expenses. Investors cannot invest directly in any index. Further |
| information relating to fund performance, including expense reimbursements, if applicable, is contained in the Financial |
| Highlights section of the prospectus and elsewhere in this report. |
6
| Average Annual Total Returns as of 10/31/08 | | | | | | |
| |
| | | Inception | | | | From |
| | | Date | | 1 Year | | Inception |
| |
| |
| |
|
| Class A shares | | | | | | |
| with maximum sales charge (4.5%) | | 12/30/05 | | (3.36)% | | 4.17% |
| without sales charge | | 12/30/05 | | 1.21% | | 5.88% |
| Class C shares | | | | | | |
| with applicable redemption charge † | | 12/30/05 | | (0.56)% | | 5.06% |
| without redemption | | 12/30/05 | | 0.40% | | 5.06% |
| Class I shares | | 12/30/05 | | 1.47% | | 6.13% |
| Past performance is not predictive of future performance.The fund’s performance shown in the graph and table does not |
| reflect the deduction of taxes that a shareholder would pay on the fund distributions or the redemption of fund shares. |
| † The maximum contingent deferred sales charge for Class C shares is 1% for shares redeemed within one year of the |
| date of purchase. |
The Fund 7
UNDERSTANDING YOUR FUND’S EXPENSES (Unaudited)
As a mutual fund investor, you pay ongoing expenses, such as management fees and other expenses. Using the information below, you can estimate how these expenses affect your investment and compare them with the expenses of other funds.You also may pay one-time transaction expenses, including sales charges (loads) and redemption fees, which are not shown in this section and would have resulted in higher total expenses. For more information, see your fund’s prospectus or talk to your financial adviser.
Review your fund’s expenses
The table below shows the expenses you would have paid on a $1,000 investment in Dreyfus International Bond Fund from May 1, 2008 to October 31, 2008. It also shows how much a $1,000 investment would be worth at the close of the period, assuming actual returns and expenses.
| | Expenses and Value of a $1,000 Investment
assuming actual returns for the six months ended October 31, 2008 |
| | | Class A | | Class C | | Class I |
| |
| |
| |
|
| Expenses paid per $1,000† | | $ 5.32 | | $ 8.93 | | $ 4.11 |
| Ending value (after expenses) | | $92300 | | $919.30 | | $924.20 |
COMPARING YOUR FUND’S EXPENSES
WITH THOSE OF OTHER FUNDS (Unaudited) |
Using the SEC’s method to compare expenses
The Securities and Exchange Commission (SEC) has established guidelines to help investors assess fund expenses. Per these guidelines, the table below shows your fund’s expenses based on a $1,000 investment, assuming a hypothetical 5% annualized return. You can use this information to compare the ongoing expenses (but not transaction expenses or total cost) of investing in the fund with those of other funds.All mutual fund shareholder reports will provide this information to help you make this comparison. Please note that you cannot use this information to estimate your actual ending account balance and expenses paid during the period.
| | Expenses and Value of a $1,000 Investment
assuming a hypothetical 5% annualized return for the six months ended October 31, 2008 |
| | | Class A | | Class C | | Class I |
| |
| |
| |
|
| Expenses paid per $1,000† | | $ 5.58 | | $ 9.37 | | $ 4.32 |
| Ending value (after expenses) | | $1,019.61 | | $1,015.84 | | $1,020.86 |
| † Expenses are equal to the fund’s annualized expense ratio of 1.10% for Class A, 1.85% for Class C and .85% |
| Class I, multiplied by the average account value over the period, multiplied by 184/366 (to reflect the one-half |
| year period). |
8
| STATEMENT OF INVESTMENTS | | | | | | | | |
| October 31, 2008 | | | | | | | | | | | | |
| |
| |
| |
| |
| |
| |
|
| |
| |
| |
| | | | | Coupon | | Maturity | | Principal | | | | |
| Bonds and Notes—91.4% | | | | Rate (%) | | Date | | Amount ($) | | | | Value ($) |
| |
| |
| |
| |
| |
| |
|
| Australia—1.4% | | | | | | | | | | | | |
| Queensland Treasury, | | | | | | | | | | | | |
| Gov’t Notes, Ser. 13G | | AUD | | 6.00 | | 8/14/13 | | 850,000 | | a | | 575,970 |
| Rio Tinto Finance USA, | | | | | | | | | | | | |
| Gtd. Notes | | | | 5.88 | | 7/15/13 | | 135,000 | | | | 115,310 |
| | | | | | | | | | | | | 691,280 |
| Belgium—1.6% | | | | | | | | | | | | |
| Belgium Kingdom, | | | | | | | | | | | | |
| Bonds, Ser. 40 | | EUR | | 5.50 | | 9/28/17 | | 95,000 | | a | | 129,580 |
| Belgium Kingdom, | | | | | | | | | | | | |
| Bonds, Ser. 41 | | EUR | | 4.25 | | 9/28/13 | | 450,000 | | a | | 583,735 |
| Belgium Kingdom, | | | | | | | | | | | | |
| Bonds, Ser. 44 | | EUR | | 5.00 | | 3/28/35 | | 30,000 | | a | | 38,851 |
| | | | | | | | | | | | | 752,166 |
| Brazil—2.0% | | | | | | | | | | | | |
| Federal Republic of Brazil | | | | | | | | | | | | |
| Sr. Unscd. Bonds | | BRL | | 10.25 | | 1/10/28 | | 1,900,000 | | a | | 622,663 |
| Federal Republic of Brazil, | | | | | | | | | | | | |
| Unsub. Bonds | | BRL | | 12.50 | | 1/5/16 | | 825,000 | | a | | 338,911 |
| | | | | | | | | | | | | 961,574 |
| Canada—.8% | | | | | | | | | | | | |
| Province of Ontario Canada, | | | | | | | | | | | | |
| Notes | | CAD | | 4.50 | | 12/2/12 | | 460,000 | | a | | 391,616 |
| Denmark—.2% | | | | | | | | | | | | |
| NYKREDIT, | | | | | | | | | | | | |
| Sub. Notes | | EUR | | 4.90 | | 9/29/49 | | 125,000 | | a,b | | 116,370 |
| France—.8% | | | | | | | | | | | | |
| Government of France, | | | | | | | | | | | | |
| Bonds | | EUR | | 4.75 | | 4/25/35 | | 140,000 | | a | | 179,506 |
| Societe Generale, | | | | | | | | | | | | |
| Sub. Notes | | EUR | | 6.13 | | 8/20/18 | | 150,000 | | a | | 191,248 |
| | | | | | | | | | | | | 370,754 |
| Germany—14.2% | | | | | | | | | | | | |
| Bundesobligation, | | | | | | | | | | | | |
| Bonds, Ser. 144 | | EUR | | 3.25 | | 4/17/09 | | 100,000 | | a | | 127,811 |
| Bundesrepublik Deutschland | | | | | | | | | | | | |
| Bonds, Ser. 01 | | EUR | | 5.00 | | 7/4/11 | | 660,000 | | a | | 887,126 |
| Bundesrepublik Deutschland, | | | | | | | | | | | | |
| Bonds, Ser. 05 | | EUR | | 3.50 | | 1/4/16 | | 475,000 | | a | | 598,170 |
The Fund 9
| STATEMENT OF INVESTMENTS (continued) |
| | | | | Coupon | | Maturity | | Principal | | | | |
| Bonds and Notes (continued) | | Rate (%) | | Date | | Amount ($) | | | | Value ($) |
| |
| |
| |
| |
| |
|
| Germany (continued) | | | | | | | | | | | | |
| Bundesrepublik Deutschland, | | | | | | | | | | | | |
| Bonds, Ser. 99 | | EUR | | 3.75 | | 1/4/09 | | 650,000 | | a | | 828,100 |
| Bundesrepublik Deutschland, | | | | | | | | | | | | |
| Bonds, Ser. 5 | | EUR | | 4.00 | | 1/4/37 | | 560,000 | | a | | 664,090 |
| Bundesrepublik Deutschland, | | | | | | | | | | | | |
| Bonds, Ser. 06 | | EUR | | 4.00 | | 7/4/16 | | 740,000 | | a | | 953,759 |
| Bundesrepublik Deutschland, | | | | | | | | | | | | |
| Bonds, Ser. 03 | | EUR | | 4.75 | | 7/4/34 | | 50,000 | | a | | 65,733 |
| Bundesrepublik Deutschland, | | | | | | | | | | | | |
| Bonds, Ser. 03 | | EUR | | 4.75 | | 7/4/34 | | 1,315,000 | | a | | 1,728,788 |
| Bundesrepulbik Deutschland, | | | | | | | | | | | | |
| Bonds, Ser. 07 | | EUR | | 4.25 | | 7/4/17 | | 275,000 | | a | | 359,989 |
| KFW, | | | | | | | | | | | | |
| Gov’t Gtd. Notes | | JPY | | 2.05 | | 2/16/26 | | 3,000,000 | | a | | 28,704 |
| KFW, | | | | | | | | | | | | |
| Gov’t Gtd. Notes | | NZD | | 6.50 | | 11/15/11 | | 1,130,000 | | a | | 663,360 |
| | | | | | | | | | | | | 6,905,630 |
| Italy—3.8% | | | | | | | | | | | | |
| Atlantia, | | | | | | | | | | | | |
| Gtd. Notes | | EUR | | 5.41 | | 6/9/11 | | 100,000 | | a,b | | 125,917 |
| Buoni Poliennali del Tesoro, | | | | | | | | | | | | |
| Bonds | | EUR | | 4.25 | | 8/1/14 | | 145,000 | | a | | 183,871 |
| Buoni Poliennali del Tesoro, | | | | | | | | | | | | |
| Bonds | | EUR | | 4.50 | | 2/1/18 | | 1,245,000 | | a | | 1,529,116 |
| | | | | | | | | | | | | 1,838,904 |
| Japan—16.9% | | | | | | | | | | | | |
| Development Bank of Japan, | | | | | | | | | | | | |
| Gov’t Gtd. Notes | | JPY | | 1.05 | | 6/20/23 | | 34,000,000 | | a | | 300,624 |
| Development Bank of Japan, | | | | | | | | | | | | |
| Gov’t. Gtd. Bonds | | JPY | | 1.40 | | 6/20/12 | | 8,000,000 | | a | | 82,258�� |
| Development Bank of Japan, | | | | | | | | | | | | |
| Gov’t. Gtd. Bonds | | JPY | | 1.70 | | 9/20/22 | | 24,000,000 | | a | | 235,877 |
| Japan Finance for | | | | | | | | | | | | |
| Municipal Enterprises, | | | | | | | | | | | | |
| Gov’t Gtd. Notes | | JPY | | 1.35 | | 11/26/13 | | 11,000,000 | | a | | 112,037 |
| Japan Finance for | | | | | | | | | | | | |
| Municipal Enterprises, | | | | | | | | | | | | |
| Gov’t. Gtd. Bonds | | JPY | | 1.55 | | 2/21/12 | | 6,000,000 | | a | | 62,209 |
10
| | | | | Coupon | | Maturity | | Principal | | | | |
| Bonds and Notes (continued) | | Rate (%) | | Date | | Amount ($) | | | | Value ($) |
| |
| |
| |
| |
| |
|
| Japan (continued) | | | | | | | | | | | | |
| Japan Government, | | | | | | | | | | | | |
| Bonds, Ser. 244 | | JPY | | 1.00 | | 12/20/12 | | 86,000,000 | | a | | 880,316 |
| Japan Government, | | | | | | | | | | | | |
| Bonds, Ser. 288 | | JPY | | 1.70 | | 9/20/17 221,500,000 | | a | | 2,319,126 |
| Japan Government, | | | | | | | | | | | | |
| Bonds, Ser. 11 | | JPY | | 1.70 | | 6/20/33 209,600,000 | | a | | 1,894,400 |
| Japan Government, | | | | | | | | | | | | |
| Bonds, Ser. 64 | | JPY | | 1.90 | | 9/20/23 231,500,000 | | a | | 2,346,584 |
| | | | | | | | | | | | | 8,233,431 |
| Luxembourg—.2% | | | | | | | | | | | | |
| Telecom Italia Capital, | | | | | | | | | | | | |
| Gtd. Notes | | | | 7.00 | | 6/4/18 | | 155,000 | | | | 112,530 |
| Mexico—3.3% | | | | | | | | | | | | |
| Mexican Bonos, | | | | | | | | | | | | |
| Bonds, Ser. M10 | | MXN | | 7.75 | | 12/14/17 | | 22,010,000 | | a | | 1,607,538 |
| Netherlands—2.8% | | | | | | | | | | | | |
| E.ON International Finance, | | | | | | | | | | | | |
| Gtd. Notes | | EUR | | 5.50 | | 10/2/17 | | 20,000 | | a | | 23,509 |
| Netherlands Government, | | | | | | | | | | | | |
| Bonds | | EUR | | 4.50 | | 7/15/17 | | 800,000 | | a | | 1,028,549 |
| Netherlands Government, | | | | | | | | | | | | |
| Bonds | | EUR | | 4.00 | | 1/15/37 | | 270,000 | | a | | 309,482 |
| Repsol International Finance, | | | | | | | | | | | | |
| Gtd. Notes | | EUR | | 4.63 | | 10/8/14 | | 15,000 | | a | | 15,965 |
| | | | | | �� | | | | | | | 1,377,505 |
| Norway—.1% | | | | | | | | | | | | |
| DNB Nor Bank, | | | | | | | | | | | | |
| Sub. Notes | | EUR | | 5.16 | | 5/30/17 | | 50,000 | | a,b | | 60,606 |
| South Korea—.2% | | | | | | | | | | | | |
| Export-Import Bank of Korea | | | | | | | | | | | | |
| Sr. Unscd. Notes | | EUR | | 5.75 | | 5/22/13 | | 100,000 | | a | | 104,429 |
| Spain—.2% | | | | | | | | | | | | |
| Telefonica Emisiones, | | | | | | | | | | | | |
| Gtd. Notes | | | | 3.50 | | 6/19/09 | | 90,000 | | b | | 86,682 |
| Supranational—2.3% | | | | | | | | | | | | |
| European Investment Bank, | | | | | | | | | | | | |
| Sr. Unscd. Bonds | | JPY | | 1.40 | | 6/20/17 | | 38,600,000 | | a | | 381,943 |
The Fund 11
| STATEMENT OF INVESTMENTS (continued) |
| | | | | Coupon | | Maturity | | Principal | | | | |
| Bonds and Notes (continued) | | Rate (%) | | Date | | Amount ($) | | | | Value ($) |
| |
| |
| |
| |
| |
|
| Supranational (continued) | | | | | | | | | | | | |
| European Investment Bank, | | | | | | | | | | | | |
| Sr. Unscd. Notes | | NZD | | 7.00 | | 1/18/12 | | 1,200,000 | | a | | 714,313 |
| | | | | | | | | | | | | 1,096,256 |
| Sweden—.1% | | | | | | | | | | | | |
| Swedish Government, | | | | | | | | | | | | |
| Bonds, Ser. 1050 | | SEK | | 3.00 | | 7/12/16 | | 550,000 | | a | | 69,116 |
| United Kingdom—14.3% | | | | | | | | | | | | |
| Diageo | | | | | | | | | | | | |
| Gtd. Notes | | | | 7.38 | | 1/15/14 | | 240,000 | | | | 244,235 |
| HSBC Holdings, | | | | | | | | | | | | |
| Sub. Notes | | | | 6.80 | | 6/1/38 | | 305,000 | | | | 252,399 |
| National Grid, | | | | | | | | | | | | |
| Sr. Unscd. Notes | | | | 6.30 | | 8/1/16 | | 10,000 | | | | 8,414 |
| Northern Rock, | | | | | | | | | | | | |
| Sub. Notes | | GBP | | 5.63 | | 1/13/15 | | 65,000 | | a,b | | 71,656 |
| Royal Bank of Scotland, | | | | | | | | | | | | |
| Sr. Unscd. Notes | | EUR | | 5.25 | | 5/15/13 | | 150,000 | | a | | 184,568 |
| SABMiller, | | | | | | | | | | | | |
| Gtd. Notes | | | | 4.18 | | 7/1/09 | | 10,000 | | b,c | | 9,976 |
| United Kingdom Gilt, | | | | | | | | | | | | |
| Bonds | | GBP | | 8.00 | | 9/27/13 | | 365,000 | | a | | 693,914 |
| United Kingdom Gilt, | | | | | | | | | | | | |
| Bonds | | GBP | | 4.00 | | 3/7/09 | | 120,000 | | a | | 193,802 |
| United Kingdom Gilt, | | | | | | | | | | | | |
| Bonds | | GBP | | 5.00 | | 9/7/14 | | 1,975,000 | | a | | 3,332,393 |
| United Kingdom Gilt, | | | | | | | | | | | | |
| Bonds | | GBP | | 4.00 | | 9/7/16 | | 635,000 | | a | | 998,170 |
| United Kingdom Gilt, | | | | | | | | | | | | |
| Bonds | | GBP | | 4.25 | | 3/7/11 | | 225,000 | | a | | 369,375 |
| United Kingdom Gilt, | | | | | | | | | | | | |
| Bonds | | GBP | | 4.25 | | 6/7/32 | | 230,000 | | a | | 339,395 |
| United Kingdom Gilt, | | | | | | | | | | | | |
| Bonds | | GBP | | 4.75 | | 6/7/10 | | 140,000 | | a | | 231,676 |
| | | | | | | | | | | | | 6,929,973 |
| United States—26.2% | | | | | | | | | | | | |
| Appalachian Power, | | | | | | | | | | | | |
| Sr. Unscd. Notes | | | | 7.00 | | 4/1/38 | | 95,000 | | | | 74,415 |
| AT&T, | | | | | | | | | | | | |
| Sr. Unscd. Notes | | | | 6.40 | | 5/15/38 | | 110,000 | | | | 88,283 |
12
| | | | | Coupon | | Maturity | | Principal | | | | |
| Bonds and Notes (continued) | | Rate (%) | | Date | | Amount ($) | | | | Value ($) |
| |
| |
| |
| |
| |
|
| United States (continued) | | | | | | | | | | | | |
| AT&T, | | | | | | | | | | | | |
| Sr. Unscd. Notes | | EUR | | 6.13 | | 4/2/15 | | 50,000 | | a | | 59,792 |
| BAC Capital Trust XIII, | | | | | | | | | | | | |
| Gtd. Notes | | | | 3.22 | | 3/15/49 | | 15,000 | | b | | 5,424 |
| Baker Hughes, | | | | | | | | | | | | |
| Sr. Unscd. Notes | | | | 7.50 | | 11/15/18 | | 300,000 | | | | 295,729 |
| Bank of America, | | | | | | | | | | | | |
| Sr. Unscd. Notes | | | | 4.90 | | 5/1/13 | | 275,000 | | | | 254,627 |
| Bank of America, | | | | | | | | | | | | |
| Sub. Notes | | EUR | | 4.00 | | 3/28/18 | | 250,000 | | a,b | | 247,298 |
| Block Financial, | | | | | | | | | | | | |
| Gtd. Notes | | | | 7.88 | | 1/15/13 | | 95,000 | | | | 92,126 |
| Case New Holland, | | | | | | | | | | | | |
| Gtd. Notes | | | | 7.13 | | 3/1/14 | | 235,000 | | | | 176,250 |
| Chesapeake Energy, | | | | | | | | | | | | |
| Gtd. Notes | | | | 7.50 | | 9/15/13 | | 120,000 | | | | 101,400 |
| Citigroup, | | | | | | | | | | | | |
| Sr. Unscd. Notes | | | | 5.30 | | 10/17/12 | | 25,000 | | | | 22,878 |
| Citigroup, | | | | | | | | | | | | |
| Sr. Unscd. Notes | | | | 5.50 | | 4/11/13 | | 275,000 | | | | 251,791 |
| Citigroup, | | | | | | | | | | | | |
| Sr. Unscd. Notes | | EUR | | 6.40 | | 3/27/13 | | 190,000 | | a | | 234,232 |
| Coca-Cola Enterprises, | | | | | | | | | | | | |
| Sr. Unscd. Notes | | | | 7.38 | | 3/3/14 | | 455,000 | | | | 462,100 |
| Community Health Systems, | | | | | | | | | | | | |
| Gtd. Notes | | | | 8.88 | | 7/15/15 | | 115,000 | | | | 96,887 |
| Countrywide Financial, | | | | | | | | | | | | |
| Gtd. Notes | | | | 3.42 | | 3/24/09 | | 80,000 | | b | | 78,495 |
| Coventry Health Care, | | | | | | | | | | | | |
| Sr. Unscd. Notes | | | | 5.95 | | 3/15/17 | | 15,000 | | | | 9,692 |
| Crown Americas, | | | | | | | | | | | | |
| Gtd. Notes | | | | 7.75 | | 11/15/15 | | 125,000 | | | | 109,687 |
| Davita, | | | | | | | | | | | | |
| Gtd. Notes | | | | 6.63 | | 3/15/13 | | 115,000 | | | | 101,487 |
| Delhaize Group, | | | | | | | | | | | | |
| Sr. Unscd. Notes | | | | 6.50 | | 6/15/17 | | 10,000 | | | | 8,131 |
| Echostar DBS, | | | | | | | | | | | | |
| Gtd. Notes | | | | 7.13 | | 2/1/16 | | 125,000 | | | | 100,937 |
The Fund 13
| STATEMENT OF INVESTMENTS (continued) |
| | | | | Coupon | | Maturity | | Principal | | | | |
| Bonds and Notes (continued) | | Rate (%) | | Date | | Amount ($) | | | | Value ($) |
| |
| |
| |
| |
| |
|
| United States (continued) | | | | | | | | | | | | |
| Entergy Gulf States of Louisiana, | | | | | | | | | | |
| First Mortgage Notes | | | | 6.00 | | 5/1/18 | | 120,000 | | c | | 93,763 |
| Erac USA Finance, | | | | | | | | | | | | |
| Bonds | | | | 5.30 | | 11/15/08 | | 35,000 | | c | | 34,948 |
| Federal Home Loan | | | | | | | | | | | | |
| Mortgage Corp. | | | | 5.50 | | 5/1/38 | | 695,267 | | d | | 678,530 |
| Federal National | | | | | | | | | | | | |
| Mortgage Association | | | | 5.00 | | | | 2,630,000 | | d,e | | 2,491,515 |
| Federal National | | | | | | | | | | | | |
| Mortgage Association | | | | 5.50 | | 4/1/38 | | 344,083 | | d | | 336,377 |
| Federal National | | | | | | | | | | | | |
| Mortgage Association | | | | 5.50 | | 5/1/38 | | 352,792 | | d | | 344,891 |
| General Electric Capital, | | | | | | | | | | | | |
| Sr. Unscd. Notes | | | | 5.88 | | 1/14/38 | | 830,000 | | | | 593,754 |
| General Electrical Capital, | | | | | | | | | | | | |
| Sr. Unscd. Notes | | JPY | | 2.00 | | 2/22/17 | | 7,000,000 | | a | | 38,746 |
| GMAC Commercial | | | | | | | | | | | | |
| Mortgage Securities, | | | | | | | | | | | | |
| Ser. 2002-C2, Cl. A2 | | | | 5.39 | | 10/15/38 | | 128,295 | | | | 123,425 |
| GMAC Commercial | | | | | | | | | | | | |
| Mortgage Securities, | | | | | | | | | | | | |
| Ser. 2003-C3, Cl. A2 | | | | 4.22 | | 4/10/40 | | 75,563 | | | | 72,788 |
| Goldman Sachs Mortgage | | | | | | | | | | | | |
| Securities Corporation II, | | | | | | | | | | | | |
| Ser. 2007-EOP, Cl. L | | | | 5.34 | | 3/6/20 | | 25,000 | | b,c | | 19,000 |
| Government National Mortgage Association I: | | | | | | | | |
| Ser. 2004-23, Cl. B, 2.95%, 3/16/19 | | | | | | 25,054 | | | | 24,731 |
| Ser. 2006-68, Cl. A, 3.89%, 7/16/26 | | | | | | 23,669 | | | | 23,441 |
| Ser. 2006-67, Cl. A, 3.95%, 11/16/30 | | | | | | 51,431 | | | | 50,929 |
| Ser. 2005-76, Cl. A, 3.96%, 5/16/30 | | | | | | 32,694 | | | | 32,352 |
| Ser. 2005-79, Cl. A, 4.00%, 10/16/33 | | | | | | 26,268 | | | | 26,110 |
| Ser. 2007-34, Cl. A, 4.27%, 11/16/26 | | | | | | 23,992 | | | | 23,933 |
| IBM, | | | | | | | | | | | | |
| Notes | | EUR | | 6.63 | | 1/30/14 | | 400,000 | | a | | 505,480 |
| IBM, | | | | | | | | | | | | |
| Sr. Unscd. Notes | | | | 8.00 | | 10/15/38 | | 100,000 | | | | 104,024 |
14
| | | | | Coupon | | Maturity | | Principal | | | | |
| Bonds and Notes (continued) | | Rate (%) | | Date | | Amount ($) | | | | Value ($) |
| |
| |
| |
| |
| |
|
| United States (continued) | | | | | | | | | | | | |
| Ipalco Enterprises, | | | | | | | | | | | | |
| Sr. Scd. Notes | | | | 7.25 | | 4/1/16 | | 40,000 | | c | | 33,600 |
| JPMorgan Chase, | | | | | | | | | | | | |
| Sr. Unscd. Notes | | | | 4.75 | | 5/1/13 | | 275,000 | | | | 255,105 |
| JPMorgan Chase, | | | | | | | | | | | | |
| Sr. Unscd. Notes | | EUR | | 5.25 | | 5/8/13 | | 200,000 | | a | | 244,469 |
| Kentucky Power, | | | | | | | | | | | | |
| Sr. Unscd. Notes | | | | 6.00 | | 9/15/17 | | 30,000 | | c | | 25,379 |
| KFW, | | | | | | | | | | | | |
| Gov’t Gtd. Bonds | | JPY | | 1.75 | | 3/23/10 | | 21,000,000 | | a | | 216,412 |
| Lamar Media, | | | | | | | | | | | | |
| Sr. Unscd. Notes | | | | 6.63 | | 8/15/15 | | 67,000 | | | | 49,580 |
| Merrill Lynch Mortgage Trust, | | | | | | | | | | | | |
| Ser. 2005-CIP1, Cl. A2 | | | | 4.96 | | 7/12/38 | | 135,000 | | | | 127,585 |
| Metropolitan Life | | | | | | | | | | | | |
| Global Funding I, | | | | | | | | | | | | |
| Sr. Scd. Notes | | | | 5.13 | | 4/10/13 | | 100,000 | | c | | 89,477 |
| Morgan Stanley Capital I, | | | | | | | | | | | | |
| Ser. 2006-IQ12, Cl. A1 | | | | 5.26 | | 12/15/43 | | 18,577 | | | | 17,397 |
| Mosaic, | | | | | | | | | | | | |
| Sr. Unscd. Notes | | | | 7.38 | | 12/1/14 | | 165,000 | | b,c | | 144,409 |
| NiSource Finance, | | | | | | | | | | | | |
| Gtd. Notes | | | | 3.38 | | 11/23/09 | | 10,000 | | b | | 9,103 |
| Norfolk Southern, | | | | | | | | | | | | |
| Sr. Unscd. Notes | | | | 5.75 | | 4/1/18 | | 30,000 | | | | 25,868 |
| NYSE Euronext, | | | | | | | | | | | | |
| Sr. Unscd. Notes | | | | 4.80 | | 6/28/13 | | 160,000 | | | | 150,184 |
| Occidental Petroleum, | | | | | | | | | | | | |
| Sr. Unscd. Notes | | | | 7.00 | | 11/1/13 | | 215,000 | | | | 221,479 |
| Pacific Life Global Funding, | | | | | | | | | | | | |
| Notes | | | | 5.15 | | 4/15/13 | | 115,000 | | c | | 96,470 |
| Peabody Energy, | | | | | | | | | | | | |
| Gtd. Notes, Ser. B | | | | 6.88 | | 3/15/13 | | 110,000 | | | | 97,075 |
| Pepsico, | | | | | | | | | | | | |
| Sr. Unscd. Notes | | | | 7.90 | | 11/1/18 | | 195,000 | | | | 206,084 |
The Fund 15
| STATEMENT OF INVESTMENTS (continued) |
| | | Coupon | | Maturity | | Principal | | | | |
| Bonds and Notes (continued) | | Rate (%) | | Date | | Amount ($) | | | | Value ($) |
| |
| |
| |
| |
| |
|
| United States (continued) | | | | | | | | | | |
| Philip Morris International, | | | | | | | | | | |
| Sr. Unscd. Notes | | 5.65 | | 5/16/18 | | 135,000 | | | | 115,690 |
| Potomac Electric Power, | | | | | | | | | | |
| Sr. Scd. Bonds | | 6.50 | | 11/15/37 | | 90,000 | | | | 72,059 |
| Prologis, | | | | | | | | | | |
| Sr. Unscd. Notes | | 6.63 | | 5/15/18 | | 145,000 | | | | 83,584 |
| PSEG Power, | | | | | | | | | | |
| Gtd. Notes | | 7.75 | | 4/15/11 | | 15,000 | | | | 14,806 |
| Reed Elsevier Capital, | | | | | | | | | | |
| Gtd. Notes | | 4.63 | | 6/15/12 | | 170,000 | | | | 161,279 |
| Residential Asset Mortgage Products, | | | | | | | | | | |
| Ser. 2006-RS4, Cl. A2 | | 3.37 | | 7/25/36 | | 125,000 | | b | | 120,679 |
| SLM, | | | | | | | | | | |
| Sr. Unscd. Notes, Ser. A | | 4.00 | | 1/15/09 | | 165,000 | | | | 157,272 |
| Sovereign Bancorp, | | | | | | | | | | |
| Sr. Unscd. Notes | | 3.44 | | 3/23/10 | | 10,000 | | b | | 9,069 |
| Sprint Capital, | | | | | | | | | | |
| Gtd. Notes | | 6.88 | | 11/15/28 | | 65,000 | | | | 38,101 |
| Steel Dynamics, | | | | | | | | | | |
| Gtd. Notes | | 7.38 | | 11/1/12 | | 10,000 | | | | 7,488 |
| Terex, | | | | | | | | | | |
| Gtd. Notes | | 7.38 | | 1/15/14 | | 120,000 | | | | 93,600 |
| Time Warner Cable, | | | | | | | | | | |
| Gtd. Notes | | 5.40 | | 7/2/12 | | 10,000 | | | | 8,971 |
| Time Warner, | | | | | | | | | | |
| Gtd. Notes | | 3.03 | | 11/13/09 | | 10,000 | | b | | 9,403 |
| Union Pacific, | | | | | | | | | | |
| Sr. Unscd. Notes | | 7.88 | | 1/15/19 | | 160,000 | | | | 158,636 |
| Verizon Communications, | | | | | | | | | | |
| Sr. Unscd. Notes | | 6.10 | | 4/15/18 | | 20,000 | | | | 17,504 |
| Verizon Communications, | | | | | | | | | | |
| Sr. Unscd. Notes | | 8.95 | | 3/1/39 | | 120,000 | | | | 122,100 |
| Verizon Communications, | | | | | | | | | | |
| Sr. Unscd. Notes | | 8.75 | | 11/1/18 | | 115,000 | | | | 117,621 |
16
| | | Coupon | | Maturity | | Principal | | | | |
| Bonds and Notes (continued) | | Rate (%) | | Date | | Amount ($) | | | | Value ($) |
| |
| |
| |
| |
| |
|
| United States (continued) | | | | | | | | | | |
| Verizon Communications, | | | | | | | | | | |
| Bonds | | 6.90 | | 4/15/38 | | 30,000 | | | | 25,166 |
| Wachovia Bank Commercial | | | | | | | | | | |
| Mortgage Trust, | | | | | | | | | | |
| Ser. 2005-C16, Cl. A2 | | 4.38 | | 10/15/41 | | 140,273 | | | | 135,049 |
| Wachovia, | | | | | | | | | | |
| Sr. Unscd. Notes | | 3.63 | | 2/17/09 | | 55,000 | | | | 54,342 |
| Wachovia, | | | | | | | | | | |
| Sr. Unscd. Notes | | 4.38 | | 6/1/10 | | 115,000 | | f | | 109,160 |
| Wal-Mart Stores, | | | | | | | | | | |
| Sr. Unscd. Notes | | 4.25 | | 4/15/13 | | 160,000 | | | | 155,647 |
| Walgreen, | | | | | | | | | | |
| Sr. Unscd. Notes | | 4.88 | | 8/1/13 | | 115,000 | | | | 112,470 |
| WEA Finance, | | | | | | | | | | |
| Sr. Notes | | 7.13 | | 4/15/18 | | 105,000 | | c | | 82,555 |
| Wells Fargo, | | | | | | | | | | |
| Sr. Unscd. Notes | | 4.38 | | 1/31/13 | | 275,000 | | | | 254,135 |
| Willis North America, | | | | | | | | | | |
| Gtd. Notes | | 6.20 | | 3/28/17 | | 15,000 | | | | 10,947 |
| | | | | | | | | | | 12,747,407 |
| Total Bonds and Notes | | | | | | | | | | |
| (cost $49,251,038) | | | | | | | | | | 44,453,767 |
| |
| |
| |
| |
| |
|
| |
| Short-Term Investments—.6% | | | | | | | | | | |
| |
| |
| |
| |
| |
|
| U.S. Treasury Bills; | | | | | | | | | | |
| 0.52%, 1/2/09 | | | | | | | | | | |
| (cost $294,734) | | | | | | 295,000 g | | 294,794 |
| |
| |
| |
| |
|
| |
| Other Investment—.4% | | | | | | Shares | | | | Value ($) |
| |
| |
| |
| |
| |
|
| Registered Investment Company; | | | | | | | | | | |
| Dreyfus Institutional Preferred | | | | | | | | | | |
| Plus Money Market Fund | | | | | | | | | | |
| (cost $213,000) | | | | | | 213,000 h | | 213,000 |
The Fund 17
| STATEMENT OF INVESTMENTS (continued) |
| Investment of Cash Collateral | | | | |
| for Securities Loaned—.2% | | Shares | | Value ($) |
| |
| |
|
| Registered Investment Company; | | | | |
| Dreyfus Institutional Cash Advantage Fund | | | | |
| (cost $107,800) | | 107,800 h | | 107,800 |
| |
| |
|
| Total Investments (cost $49,866,572) | | 92.6% | | 45,069,361 |
| Cash and Receivables (Net) | | 7.4% | | 3,586,564 |
| Net Assets | | 100.0% | | 48,655,925 |
| a | Principal amount stated in U.S. Dollars unless otherwise noted. AUD—Australian Dollar BRL—Brazilian Real CAD—Canadian Dollar EUR—Euro GBP—British Pound JPY—JapaneseYen MXN—Mexican New Peso NZD—New Zealand Dollar SEK—Swedish Krona |
| |
| b | Variable rate security—interest rate subject to periodic change. |
| |
| c | Securities exempt from registration under Rule 144A of the Securities Act of 1933.These securities may be resold in transactions exempt from registration, normally to qualified institutional buyers.At October 31, 2008, these securities amounted to $629,577 or 1.3% of net assets. |
| |
| d | On September 7, 2008, the Federal Housing Finance Agency (FHFA) placed Federal National Mortgage Association and Federal Home Loan Mortgage Corporation into conservatorship with FHFA as the conservator.As such, the FHFA will oversee the continuing affairs of these companies. |
| |
| e | Purchased on a forward commitment basis. |
| |
| f | All or a portion of this security is on loan.At October 31, 2008, the total market value of the fund’s securities on loan is $104,414 and the total market value of the collateral held by the fund is $107,800. |
| |
| g | All or partially held by a broker as collateral for open financial futures positions. |
| |
| h | Investment in affiliated money market mutual fund. |
| |
| Portfolio Summary (Unaudited)† | | | | |
| |
| | | Value (%) | | | | Value (%) |
| |
| |
| |
|
| Foreign/Governmental | | 58.1 | | Short-Term/ | | |
| Corporate Bonds | | 25.0 | | Money Market Investments | | 1.2 |
| U.S. Government Agencies/ | | | | | | |
| Mortgage-Backed | | 8.3 | | | | 92.6 |
| |
| † Based on net assets. | | | | | | |
| See notes to financial statements. | | | | | | |
18
STATEMENT OF FINANCIAL FUTURES
October 31, 2008 |
| | | | | | | | | Unrealized |
| | | | | Market Value | | | | Appreciation |
| | | | | Covered by | | | | (Depreciation) |
| | | Contracts | | Contracts ($) | | Expiration | | at 10/31/2008 ($) |
| |
| |
| |
| |
|
| Financial Futures Short | | | | | | | | |
| U.S. Treasury 10 Year Notes | | 26 | | (2,940,031) | | December 2008 | | 56,725 |
| U.S. Long Bonds | | 21 | | (2,375,625) | | December 2008 | | 61,777 |
| Financial Futures Long | | | | | | | | |
| Euro-Bobl | | 40 | | 5,721,205 | | December 2008 | | 144,167 |
| Euro Bund 10 Year | | 17 | | 2,511,898 | | December 2008 | | (4,695) |
| Australian 3 Year | | 11 | | 761,561 | | December 2008 | | 15,915 |
| | | | | | | | | 273,889 |
| |
| See notes to financial statements. | | | | | | | | |
The Fund 19
STATEMENT OF ASSETS AND LIABILITIES
October 31, 2008
| | | | | Cost | | Value |
| |
| |
| |
|
| Assets ($): | | | | | | |
| Investments in securities—See Statement of Investments (including | | | | |
| securities on loan, valued at $104,414)—Note 1(c): | | | | |
| Unaffiliated issuers | | | | 49,545,772 | | 44,748,561 |
| Affiliated issuers | | | | 320,800 | | 320,800 |
| Cash | | | | | | 717,151 |
| Cash denominated in foreign currencies | | | | 2,602 | | 2,415 |
| Receivable for investment securities sold | | | | | | 4,338,882 |
| Unrealized appreciation on forward currency exchange contracts—Note 4 | | 2,553,103 |
| Dividends and interest receivable | | | | | | 619,063 |
| Unrealized appreciation on swap contracts—Note 4 | | | | | | 254,904 |
| Receivable from broker for swap transactions—Note 4 | | | | 167,965 |
| Receivable for shares of Beneficial Interest subscribed | | | | 87,687 |
| Prepaid expenses | | | | | | 25,599 |
| | | | | | | 53,836,130 |
| |
| |
| |
|
| Liabilities ($): | | | | | | |
| Due to The Dreyfus Corporation and affiliates—Note 3(d) | | | | 35,779 |
| Payable for investment securities purchased | | | | | | 4,162,672 |
| Unrealized depreciation on forward currency exchange contracts—Note 4 | | 406,403 |
| Payable for shares of Beneficial Interest redeemed | | | | | | 138,215 |
| Swaps premium received—Note 4 | | | | | | 221,804 |
| Liability for securities on loan—Note 1(c) | | | | | | 107,800 |
| Unrealized depreciation on swap contracts—Note 4 | | | | | | 29,768 |
| Payable for futures variation margin—Note 4 | | | | | | 24,951 |
| Interest payable—Note 2 | | | | | | 176 |
| Accrued expenses | | | | | | 52,637 |
| | | | | | | 5,180,205 |
| |
| |
| |
|
| Net Assets ($) | | | | | | 48,655,925 |
| |
| |
| |
|
| Composition of Net Assets ($): | | | | | | |
| Paid-in capital | | | | | | 51,941,545 |
| Accumulated undistributed investment income—net | | | | | | 115,356 |
| Accumulated net realized gain (loss) on investments | | | | | | (1,122,798) |
| Accumulated net unrealized appreciation (depreciation) on investments, | | |
| swap transactions and foreign currency transactions (including | | | | |
| $273,889 net unrealized appreciation on financial futures) | | | | (2,278,178) |
| |
| |
|
| Net Assets ($) | | | | | | 48,655,925 |
| |
| |
| |
|
| |
| |
| |
| Net Asset Value Per Share | | | | | | |
| | | Class A | | Class C | | Class I |
| |
| |
| |
|
| Net Assets ($) | | 37,075,983 | | 7,500,207 | | 4,079,735 |
| Shares Outstanding | | 2,808,636 | | 573,370 | | 308,398 |
| |
| |
| |
|
| Net Asset Value Per Share ($) | | 13.20 | | 13.08 | | 13.23 |
| |
| See notes to financial statements. | | | | | | |
20
| STATEMENT OF OPERATIONS | | |
| Year Ended October 31, 2008 | | |
| |
|
| |
| |
| |
| |
| Investment Income ($): | | |
| Income: | | |
| Interest | | 1,372,132 |
| Dividends; | | |
| Affiliated issuers | | 32,357 |
| Income from securities lending | | 8,175 |
| Total Income | | 1,412,664 |
| Expenses: | | |
| Management fee—Note 3(a) | | 196,343 |
| Shareholder servicing costs—Note 3(d) | | 104,704 |
| Auditing fees | | 56,315 |
| Registration fees | | 43,167 |
| Distribution fees—Note 3(c) | | 41,998 |
| Custodian fees—Note 3(d) | | 23,403 |
| Prospectus and shareholders’ reports | | 11,847 |
| Legal fees | | 8,267 |
| Trustees’ fees and expenses—Note 3(b) | | 6,524 |
| Interest expense—Note 2 | | 176 |
| Loan commitment fees—Note 2 | | 164 |
| Miscellaneous | | 28,762 |
| Total Expenses | | 521,670 |
| Less—reduction in management fee due to undertaking—Note 3(a) | | (124,691) |
| Less—reduction in fees due to earnings credits—Note 1(c) | | (2,178) |
| Net Expenses | | 394,801 |
| Investment Income—Net | | 1,017,863 |
| |
|
| Realized and Unrealized Gain (Loss) on Investments—Note 4 ($): | | |
| Net realized gain (loss) on investments and foreign currency transactions | | (2,223,288) |
| Net realized gain (loss) on options transactions | | (22,353) |
| Net realized gain (loss) on financial futures | | (141,416) |
| Net realized gain (loss) on swap transactions | | 291,451 |
| Net realized gain (loss) on forward currency exchange contracts | | 697,698 |
| Net Realized Gain (Loss) | | (1,397,908) |
| Net unrealized appreciation (depreciation) on investments, options | | |
| transactions, swap transactions and foreign currency transactions | | |
| (including $271,491 net unrealized appreciation on financial futures) | | (2,671,723) |
| Net Realized and Unrealized Gain (Loss) on Investments | | (4,069,631) |
| Net (Decrease) in Net Assets Resulting from Operations | | (3,051,768) |
| |
| See notes to financial statements. | | |
The Fund 21
STATEMENT OF CHANGES IN NET ASSETS
| | | Year Ended October 31, |
| | |
|
| | | 2008 | | 2007a |
| |
| |
|
| Operations ($): | | | | |
| Investment income—net | | 1,017,863 | | 148,777 |
| Net realized gain (loss) on investments | | (1,397,908) | | 183,173 |
| Net unrealized appreciation | | | | |
| (depreciation) on investments | | (2,671,723) | | 278,724 |
| Net Increase (Decrease) in Net Assets | | | | |
| Resulting from Operations | | (3,051,768) | | 610,674 |
| |
| |
|
| Dividends to Shareholders from ($): | | | | |
| Investment income—net: | | | | |
| Class A Shares | | (421,632) | | (96,020) |
| Class C Shares | | (108,517) | | (79,801) |
| Class I Shares | | (60,566) | | (48,327) |
| Net realized gain on investments: | | | | |
| Class A Shares | | (121,883) | | (4,794) |
| Class C Shares | | (82,940) | | (4,568) |
| Class I Shares | | (35,966) | | (2,369) |
| Total Dividends | | (831,504) | | (235,879) |
| |
| |
|
| Beneficial Interest Transactions ($): | | | | |
| Net proceeds from shares sold: | | | | |
| Class A Shares | | 53,804,947 | | 1,127,533 |
| Class C Shares | | 7,623,766 | | 319,124 |
| Class I Shares | | 3,049,252 | | 137,920 |
| Dividends reinvested: | | | | |
| Class A Shares | | 476,701 | | 96,169 |
| Class C Shares | | 143,509 | | 79,786 |
| Class I Shares | | 74,280 | | 46,582 |
| Cost of shares redeemed: | | | | |
| Class A Shares | | (17,568,645) | | (257,314) |
| Class C Shares | | (2,460,625) | | (10,776) |
| Class I Shares | | (159,825) | | (21,241) |
| Increase (Decrease) in Net Assets | | | | |
| from Beneficial Interest Transactions | | 44,983,360 | | 1,517,783 |
| Total Increase (Decrease) in Net Assets | | 41,100,088 | | 1,892,578 |
| |
| |
|
| Net Assets ($): | | | | |
| Beginning of Period | | 7,555,837 | | 5,663,259 |
| End of Period | | 48,655,925 | | 7,555,837 |
| Undistributed investment income—net | | 115,356 | | 71,472 |
22
| | | Year Ended October 31, |
| | |
|
| | | 2008 | | 2007a |
| |
| |
|
| Capital Share Transactions: | | | | |
| Class A | | | | |
| Shares sold | | 3,798,067 | | 85,817 |
| Shares issued for dividends reinvested | | 34,394 | | 7,491 |
| Shares redeemed | | (1,272,830) | | (20,124) |
| Net Increase (Decrease) in Shares Outstanding | | 2,559,631 | | 73,184 |
| |
| |
|
| Class C | | | | |
| Shares sold | | 541,519 | | 24,399 |
| Shares issued for dividends reinvested | | 10,619 | | 6,222 |
| Shares redeemed | | (178,301) | | (852) |
| Net Increase (Decrease) in Shares Outstanding | | 373,837 | | 29,769 |
| |
| |
|
| Class I | | | | |
| Shares sold | | 213,425 | | 10,347 |
| Shares issued for dividends reinvested | | 5,478 | | 3,625 |
| Shares redeemed | | (11,500) | | (1,686) |
| Net Increase (Decrease) in Shares Outstanding | | 207,403 | | 12,286 |
| |
| a Effective June 1, 2007, Class R shares were redesignated as Class I shares. | | |
| See notes to financial statements. | | | | |
The Fund 23
FINANCIAL HIGHLIGHTS
The following tables describe the performance for each share class for the fiscal periods indicated.All information (except portfolio turnover rate) reflects financial results for a single fund share.Total return shows how much your investment in the fund would have increased (or decreased) during each period, assuming you had reinvested all dividends and distributions.These figures have been derived from the fund’s financial statements.
| | | | | Year Ended October 31, |
| | |
| |
|
| Class A Shares | | 2008 | | 2007 | | 2006a |
| |
| |
| |
|
| Per Share Data ($): | | | | | | |
| Net asset value, beginning of period | | 13.77 | | 13.05 | | 12.50 |
| Investment Operations: | | | | | | |
| Investment income—netb | | .45 | | .35 | | .24 |
| Net realized and unrealized | | | | | | |
| gain (loss) on investments | | (.28) | | .92 | | .45 |
| Total from Investment Operations | | .17 | | 1.27 | | .69 |
| Distributions: | | | | | | |
| Dividends from investment income—net | | (.39) | | (.52) | | (.14) |
| Dividends from net realized gain on investments | | (.35) | | (.03) | | — |
| Total Distributions | | (.74) | | (.55) | | (.14) |
| Net asset value, end of period | | 13.20 | | 13.77 | | 13.05 |
| |
| |
| |
|
| Total Return (%)c | | 1.21 | | 10.06 | | 5.58d |
| |
| |
| |
|
| Ratios/Supplemental Data (%): | | | | | | |
| Ratio of total expenses to average net assets | | 1.47 | | 3.33 | | 4.98e,f |
| Ratio of net expenses to average net assets | | 1.10 | | 1.09 | | 1.01e |
| Ratio of net investment income | | | | | | |
| to average net assets | | 3.22 | | 2.69 | | 2.29e |
| Portfolio Turnover Rate | | 168.59g | | 127.97g | | 105.86d |
| |
| |
| |
|
| Net Assets, end of period ($ x 1,000) | | 37,076 | | 3,429 | | 2,294 |
| a From December 30, 2005 (commencement of operations) to October 31, 2006. |
| b Based on average shares outstanding at each month end. |
| c Exclusive of sales charge. |
| d Not annualized. |
| e Annualized. |
| f The fund’s expense ratio net of earnings credits for Class A was 4.91%. |
| g The portfolio turnover rates excluding mortgage dollar roll transactions for the years ended October 31, 2008 and |
| October 31, 2007 were 152.77% and 116.54%, respectively. |
| See notes to financial statements. |
24
| | | | | Year Ended October 31, |
| | |
| |
|
| Class C Shares | | 2008 | | 2007 | | 2006a |
| |
| |
| |
|
| Per Share Data ($): | | | | | | |
| Net asset value, beginning of period | | 13.70 | | 13.02 | | 12.50 |
| Investment Operations: | | | | | | |
| Investment income—netb | | .34 | | .25 | | .16 |
| Net realized and unrealized | | | | | | |
| gain (loss) on investments | | (.28) | | .92 | | .45 |
| Total from Investment Operations | | .06 | | 1.17 | | .61 |
| Distributions: | | | | | | |
| Dividends from investment income—net | | (.33) | | (.46) | | (.09) |
| Dividends from net realized gain on investments | | (.35) | | (.03) | | — |
| Total Distributions | | (.68) | | (.49) | | (.09) |
| Net asset value, end of period | | 13.08 | | 13.70 | | 13.02 |
| |
| |
| |
|
| Total Return (%)c | | .40 | | 9.25 | | 4.88d |
| |
| |
| |
|
| Ratios/Supplemental Data (%): | | | | | | |
| Ratio of total expenses to average net assets | | 2.28 | | 4.09 | | 5.72e,f |
| Ratio of net expenses to average net assets | | 1.85 | | 1.84 | | 1.76e |
| Ratio of net investment income | | | | | | |
| to average net assets | | 2.45 | | 1.93 | | 1.53e |
| Portfolio Turnover Rate | | 168.59g | | 127.97g | | 105.86d |
| |
| |
| |
|
| Net Assets, end of period ($ x 1,000) | | 7,500 | | 2,734 | | 2,211 |
| a From December 30, 2005 (commencement of operations) to October 31, 2006. |
| b Based on average shares outstanding at each month end. |
| c Exclusive of sales charge. |
| d Not annualized. |
| e Annualized. |
| f The fund’s expense ratio net earnings credits for Class C was 5.64%. |
| g The portfolio turnover rates excluding mortgage dollar roll transactions for the years ended October 31, 2008 and |
| October 31, 2007 were 152.77% and 116.54%, respectively. |
| See notes to financial statements. |
The Fund 25
| | FINANCIAL HIGHLIGHTS (continued) |
| | | | | Year Ended October 31, |
| | |
| |
|
| Class I Shares | | 2008 | | 2007a | | 2006b |
| |
| |
| |
|
| Per Share Data ($): | | | | | | |
| Net asset value, beginning of period | | 13.79 | | 13.06 | | 12.50 |
| Investment Operations: | | | | | | |
| Investment income—netc | | .48 | | .38 | | .27 |
| Net realized and unrealized | | | | | | |
| gain (loss) on investments | | (.27) | | .92 | | .45 |
| Total from Investment Operations | | .21 | | 1.30 | | .72 |
| Distributions: | | | | | | |
| Dividends from investment income—net | | (.42) | | (.54) | | (.16) |
| Dividends from net realized gain on investments | | (.35) | | (.03) | | — |
| Total Distributions | | (.77) | | (.57) | | (.16) |
| Net asset value, end of period | | 13.23 | | 13.79 | | 13.06 |
| |
| |
| |
|
| Total Return (%) | | 1.47 | | 10.30 | | 5.80d |
| |
| |
| |
|
| Ratios/Supplemental Data (%): | | | | | | |
| Ratio of total expenses to average net assets | | 1.22 | | 3.09 | | 4.74e,f |
| Ratio of net expenses to average net assets | | .85 | | .84 | | .76e |
| Ratio of net investment income | | | | | | |
| to average net assets | | 3.49 | | 2.93 | | 2.53e |
| Portfolio Turnover Rate | | 168.59g | | 127.97g | | 105.86d |
| |
| |
| |
|
| Net Assets, end of period ($ x 1,000) | | 4,080 | | 1,393 | | 1,158 |
| a Effective June 1, 2007, Class R shares were redesignated as Class I shares. |
| b From December 30, 2005 (commencement of operations) to October 31, 2006. |
| c Based on average shares outstanding at each month end. |
| d Not annualized. |
| e Annualized. |
| f The fund’s expense ratio net of earnings credits for Class I was 4.67%. |
| g The portfolio turnover rates excluding mortgage dollar roll transactions for the years ended October 31, 2008 and |
| October 31, 2007 were 152.77% and 116.54%, respectively. |
| See notes to financial statements. |
26
NOTES TO FINANCIAL STATEMENTS
NOTE 1—Significant Accounting Policies:
Dreyfus International Bond Fund (the “fund”) is a separate diversified series of The Dreyfus/Laurel Funds Trust (the “Trust”) which is registered under the Investment Company Act of 1940, as amended (the “Act”), as an open-end management investment company and operates as a series company offering seven series, including the fund.The fund’s investment objective seeks to maximize total return, consisting of capital appreciation and current income.The Dreyfus Corporation (the “Manager” or “Dreyfus”), a wholly-owned subsidiary ofThe Bank of New York Mellon Corporation (“BNY Mellon”), serves as the fund’s investment adviser.
At a meeting of the fund’s Board of Directors held on July 24, 2008, the Board approved, effective December 1, 2008, a proposal to change the name of the fund from “Dreyfus Premier International Bond Fund” to “Dreyfus International Bond Fund”.
Effective July 1, 2008, BNY Mellon has reorganized and consolidated a number of its banking and trust company subsidiaries. As a result of the reorganization, any services previously provided to the fund by Mellon Bank, N.A. or Mellon Trust of New England, N.A. are now provided by The Bank of New York, which has changed its name to The Bank of New York Mellon.
MBSC Securities Corporation (the “Distributor”), a wholly-owned subsidiary of the Manager, is the distributor of the fund’s shares. The fund is authorized to issue an unlimited number of shares of Beneficial Interest in each of the following classes of shares: Class A, Class C and Class I. Class A and Class C shares are sold primarily to retail investors through financial intermediaries and bear a distribution fee and/or service fee. Class A shares are sold with a front-end sales charge, while Class C shares are subject to a contingent deferred sales charge (“CDSC”). Class I shares are sold primarily to bank trust departments and other financial service providers (including The Bank of NewYork Mellon, a subsidiary of BNY Mellon and an affiliate of Dreyfus), acting on behalf of customers having a qualified trust or investment account
The Fund 27
| NOTES TO FINANCIAL STATEMENTS (continued) |
or relationship at such institution, and bear no distribution or service fees. Class I shares are offered without a front-end sales charge or CDSC. Each class of shares has identical rights and privileges, except with respect to distribution and service fees, the allocation of certain transfer agency costs and voting rights on matters affecting a single class. Income, expenses (other than expenses attributable to a specific class), and realized and unrealized gains or losses on investments are allocated to each class of shares based on its relative net assets.
As of October 31, 2008, MBC Investments Corp., an indirect subsidiary of BNY Mellon, held 178,184 of Class A, 175,893 of Class C and 89,508 of Class I shares of the fund.
The fund’s financial statements are prepared in accordance with U.S. generally accepted accounting principles, which may require the use of management estimates and assumptions. Actual results could differ from those estimates.
(a) Portfolio valuation: Investments in securities excluding short-term investments (other than U.S. Treasury Bills), financial futures, options, swaps and forward currency exchange contracts are valued each business day by an independent pricing service (the “Service”) approved by the Board of Trustees. Investments for which quoted bid prices are readily available and are representative of the bid side of the market in the judgment of the Service are valued at the mean between the quoted bid prices (as obtained by the Service from dealers in such securities) and asked prices (as calculated by the Service based upon its evaluation of the market for such securities). Other investments (which constitute a majority of the portfolio securities) are valued as determined by the Service, based on methods which include consideration of: yields or prices of securities of comparable quality, coupon, maturity and type; indications as to values from dealers; and general market conditions. Restricted securities, as well as securities or other assets for which recent market quotations are not readily available and are not valued by a pricing service approved by the Board of Trustees, or are determined by the fund not to reflect accurately fair value, are valued at fair value as determined in good faith under the direction of the Board of
28
Trustees. The factors that may be considered when fair valuing a security include fundamental analytical data, the nature and duration of restrictions on disposition, an evaluation of the forces that influence the market in which the securities are purchased and sold and public trading in similar securities of the issuer or comparable issuers. Short-term investments, excluding U.S.Treasury Bills, are carried at amortized cost, which approximates value. Registered investment companies that are not traded on an exchange are valued at their net asset value. Financial futures and options, which are traded on an exchange, are valued at the last sales price on the securities exchange on which such securities are primarily traded or at the last sales price on the national securities market on each business day. Options traded over-the-counter are priced at the mean between the bid and asked price. Investments in swap transactions are valued each business day by a pricing service approved by the Board of Trustees. Swaps are valued by the service by using a swap pricing model which incorporates among other factors, default probabilities, recovery rates, credit curves of the underlying issuer and swap spreads on interest rates. Investments denominated in foreign currencies are translated to U.S. dollars at the prevailing rates of exchange. Forward currency exchange contracts are valued at the forward rate.
The Financial Accounting Standards Board (“FASB”) released Statement of Financial Accounting Standards No. 157 “Fair Value Measurements” (“FAS 157”). FAS 157 establishes an authoritative definition of fair value, sets out a framework for measuring fair value, and requires additional disclosures about fair-value measurements. The application of FAS 157 is required for fiscal years beginning after November 15, 2007 and interim periods within those fiscal years. Management does not believe that the application of this standard will have a material impact on the financial statements of the fund.
(b) Foreign currency transactions: The fund does not isolate that portion of the results of operations resulting from changes in foreign exchange rates on investments from the fluctuations arising from changes in the market prices of securities held. Such fluctuations are included with the net realized and unrealized gain or loss on investments.
The Fund 29
| NOTES TO FINANCIAL STATEMENTS (continued) |
Net realized foreign exchange gains or losses arise from sales and maturities of short-term securities, sales of foreign currencies, currency gains or losses realized on securities transactions and the difference between the amounts of dividends, interest and foreign withholding taxes recorded on the fund’s books and the U.S. dollar equivalent of the amounts actually received or paid. Net unrealized foreign exchange gains and losses arise from changes in the value of assets and liabilities other than investments in securities, resulting from changes in exchange rates. Such gains and losses are included with net realized and unrealized gain or loss on investments.
(c) Securities transactions and investment income: Securities transactions are recorded on a trade date basis. Realized gains and losses from securities transactions are recorded on the identified cost basis. Dividend income is recognized on the ex-dividend date and interest income, including, where applicable, accretion of discount and amortization of premium on investments, is recognized on the accrual basis.
The fund has arrangements with the custodian and cash management banks whereby the fund may receive earnings credits when positive cash balances are maintained, which are used to offset custody and cash management fees. For financial reporting purposes, the fund includes net earnings credits as an expense offset in the Statement of Operations.
Pursuant to a securities lending agreement with The Bank of New York Mellon, the fund may lend securities to qualified institutions. It is the fund’s policy that, at origination, all loans are secured by collateral of at least 102% of the value of U.S. securities loaned and 105% of the value of foreign securities loaned. Collateral equivalent to at least 100% of the market value of securities on loan is maintained at all times. Collateral is either in the form of cash, which can be invested in certain money market mutual funds managed by the Manager, U.S. Government and Agency securities or letters of credit. The fund is entitled to receive all income on securities loaned, in addition to income earned as a result of the lending transaction. Although each security loaned is fully collateralized, the fund bears the risk of delay in recovery of, or loss of rights in, the securities loaned should a bor-
30
rower fail to return the securities in a timely manner. During the period ended October 31, 2008, The Bank of New York Mellon earned $4,402, from lending fund portfolio securities, pursuant to the securities lending agreement.
(d) Affiliated issuers: Investments in other investment companies advised by the Manager are defined as “affiliated” in the Act.
(e) Concentration of Risk: The fund invests primarily in debt securities. Failure of an issuer of the debt securities to make timely interest or principal payments, or a decline or the perception of a decline in the credit quality of a debt security, can cause the debt security’s price to fall, potentially lowering the fund’s share price. In addition, the value of debt securities may decline due to general market conditions that are not specifically related to a particular company, such as real or perceived adverse economic conditions, changes in outlook for corporate earnings, changes in interest or currency rates or adverse investor sentiment. They may also decline because of factors that affect a particular industry.
(f) Dividends to shareholders: It is the policy of the fund to declare and pay dividends from investment income-net, quarterly. Dividends from net realized capital gains, if any, are normally declared and paid annually, but the fund may make distributions on a more frequent basis to comply with the distribution requirements of the Internal Revenue Code of 1986, as amended (the “Code”).To the extent that net realized capital gains can be offset by capital loss carryovers, it is the policy of the fund not to distribute such gains. Income and capital gain distributions are determined in accordance with income tax regulations, which may differ from U.S. generally accepted accounting principles.
On October 31, 2008, the Board of Trustees declared a cash dividend of $.116, $.093 and $.125 per share from undistributed investment income-net for Class A, Class C and Class I shares, respectively, payable on November 3, 2008 (ex-dividend date), to shareholders of record as of the close of business on October 31, 2008.
The Fund 31
| NOTES TO FINANCIAL STATEMENTS (continued) |
(g) Federal income taxes: It is the policy of the fund to continue to qualify as a regulated investment company, if such qualification is in the best interests of its shareholders, by complying with the applicable provisions of the Code, and to make distributions of taxable income sufficient to relieve it from substantially all federal income and excise taxes.
The fund adopted FASB Interpretation No. 48 “Accounting for Uncertainty in Income Taxes” (“FIN 48”). FIN 48 provides guidance for how uncertain tax positions should be recognized, measured, presented and disclosed in the financial statements. FIN 48 requires the evaluation of tax positions taken or expected to be taken in the course of preparing the fund’s tax returns to determine whether the tax positions are “more-likely-than-not” of being sustained by the applicable tax authority. Liability for tax positions not deemed to meet the more-likely-than-not threshold would be recorded as a tax expense in the current year.The adoption of FIN 48 had no impact on the operations of the fund for the period ended October 31, 2008.
As of and during the period ended October 31, 2008, the fund did not have any liabilities for any unrecognized tax positions. The fund recognizes interest and penalties, if any, related to unrecognized tax positions as income tax expense in the Statement of Operations. During the period, the fund did not incur any interest or penalties.
Each of the tax years in the four-year period ended October 31, 2008 remains subject to examination by the Internal Revenue Service and state taxing authorities.
At October 31, 2008, the components of accumulated earnings on a tax basis were as follows: undistributed ordinary income $2,100,292, accumulated capital losses $605,205 and unrealized depreciation $4,780,707.
The accumulated capital loss carryover is available for federal income tax purposes to be applied against future net securities profits, if any, realized subsequent to October 31, 2008. If not applied the carryover expires in fiscal 2016.
The tax character of distributions paid to shareholders during the fiscal periods ended October 31, 2008 and October 31, 2007 was as
32
follows: ordinary income $718,671 and $225,963 and long-term capital gains $112,833 and $9,916, respectively.
During the period ended October 31, 2008, as a result of permanent book to tax differences, primarily due to the tax treatment for paydown gains and losses,foreign currency transactions and treatment of swap periodic payments, the fund decreased accumulated undistributed investment income-net by $383,264 and increased accumulated net realized gain (loss) on investments by the same amount. Net assets and net asset value per share were not affected by this reclassification.
NOTE 2—Bank Lines of Credit:
Prior to October 15, 2008, the fund participated with other Dreyfus-managed funds in a $350 million redemption credit facility. Effective October 15, 2008, the fund participates with other Dreyfus-managed funds in a $145 million redemption credit facility (the “Facility”) to be utilized for temporary or emergency purposes, including the financing of redemptions. In connection therewith, the fund has agreed to pay commitment fees on its pro rata portion of the Facility. Interest is charged to the fund based on prevailing market rates in effect at the time of borrowing.
The average daily amount of borrowings outstanding under the Facilities during the period ended October 31, 2008, was approximately $7,200 with a related weighted average annualized interest rate of 2.43% .
NOTE 3—Investment Management Fee and Other Transactions with Affiliates:
(a) Pursuant to an Investment Management Agreement between the Manager and the Trust, the Trust has agreed to pay the Manager a management fee computed at the annual rate of .60% of the value of the fund’s average daily net assets and is payable monthly.The Manager has contractually agreed to waive receipt of its fees and/or assume certain expenses of the fund, until March 1, 2010, so the expenses, exclusive of
The Fund 33
| NOTES TO FINANCIAL STATEMENTS (continued) |
taxes, brokerage fees, Rule 12b-1 distribution plan fees, shareholder services plan fees, interest expense, commitment fees and extraordinary expenses, do not exceed an annual rate of .85% of the value of the fund’s average daily net assets.The reduction in management fee, pursuant to the undertaking, amounted to $124,691 during the period ended October 31, 2008.
(b) Each Trustee receives $45,000 per year, plus $6,000 for each joint Board meeting of The Dreyfus/Laurel Funds, Inc.,The Dreyfus/Laurel FundsTrust andThe Dreyfus/LaurelTax-Free Municipal Funds, (collectively, the “Dreyfus/Laurel Funds”) attended, $2,000 for separate in-person committee meetings attended which are not held in conjunction with a regularly scheduled Board meeting and $1,500 for Board meetings and separate committee meetings attended that are conducted by telephone and is reimbursed for travel and out-of-pocket expenses.With respect to Board meetings, the Chairman of the Board receives an additional 25% of such compensation (with the exception of reimbursable amounts).With respect to compensation committee meetings, the Chair of the compensation committee receives $900 per meeting and, prior to April 12, 2008, with respect to audit committee meetings, the Chair of the audit committee received $1,350 per meeting. In the event that there is an in-person joint committee meeting of the Dreyfus/Laurel Funds and Dreyfus HighYield Strategies Fund,the $2,000 or $1,500 fee, as applicable, will be allocated between the Dreyfus/Laurel Funds and Dreyfus HighYield Strategies Fund.These fees and expenses are charged and allocated to each series based on net assets.Amounts required to be paid by the Trust directly to the non-interested Trustees, that would be applied to offset a portion of the management fee payable by certain other series of the Trust to the Manager, are in fact paid directly by the Manager to the non-interested Trustees.
(c) Under the Distribution Plan (the “Plan”) adopted pursuant to Rule 12b-1 under the Act, Class C shares pay the Distributor for distributing their shares at an annual rate of .75% their value of the average daily net assets. During the period ended October 31, 2008, Class C shares were charged $41,998 pursuant to the Plan.
34
(d) Under the Shareholder Services Plan, Class A and Class C shares pay the Distributor at an annual rate of .25% of the value of their average daily net assets for the provision of certain services. The services provided may include personal services relating to shareholder accounts, such as answering shareholder inquiries regarding the fund and providing reports and other information, and services related to the maintenance of shareholder accounts.The Distributor may make payments to Service Agents (a securities dealer, financial institution or other industry professional) in respect of these services.The Distributor determines the amounts to be paid to Service Agents. During the period ended October 31, 2008, Class A and Class C shares were charged $61,172 and $13,999, respectively, pursuant to the Shareholder Services Plan.
Under its terms, the Plan and Shareholder Services Plan shall remain in effect from year to year, provided such continuance is approved annually by a vote of a majority of those Trustees who are not “interested persons” of theTrust and who have no direct or indirect financial interest in the operation of or in any agreement related to the Plan or Shareholder Services Plan.
The fund compensates Dreyfus Transfer, Inc., a wholly-owned subsidiary of the Manager, under a transfer agency agreement for providing personnel and facilities to perform transfer agency services for the fund. During the period ended October 31, 2008, the fund was charged $10,535 pursuant to the transfer agency agreement.
The fund compensates The Bank of New York Mellon under a cash management agreement for performing cash management services related to fund subscriptions and redemptions. During the period ended October 31, 2008, the fund was charged $2,178 pursuant to the cash management agreement.
The fund compensates the Bank of NewYork Mellon under a custody agreement for providing custodial services for the fund. During the period ended October 31, 2008, the fund was charged $23,403 pursuant to the custody agreement.
The Fund 35
| NOTES TO FINANCIAL STATEMENTS (continued) |
During the period ended October 31, 2008, the fund was charged $6,203 for services performed by the Chief Compliance Officer.
The components of “Due to The Dreyfus Corporation and affiliates” in the Statement of Assets and Liabilities consist of: management fees $25,455, Rule 12b-1 distribution plan fees $4,768, service plan fees $9,733, custodian fees $2,721, chief compliance officer fees $1,973 and transfer agency per account fees $3,555, which are offset against the expense reimbursement currently in effect in the amount of $12,426.
NOTE 4—Securities Transactions:
The aggregate amount of purchases and sales (including paydowns) of investment securities, excluding short-term securities, forward currency exchange contracts, financial futures, options transactions and swap transactions during the period ended October 31, 2008, amounted to $95,992,619 and $51,281,165, respectively, of which $4,805,389 in purchases and $4,813,563 in sales were from mortgage dollar roll transactions.
A mortgage dollar roll transaction involves a sale by the fund of mortgage related securities that it holds with an agreement by the fund to repurchase similar securities at an agreed upon price and date. The securities purchased will bear the same interest rate as those sold, but generally will be collateralized by pools of mortgages with different prepayment histories than those securities sold.
The fund may invest in financial futures contracts in order to gain exposure to or protect against changes in the market. The fund is exposed to market risk as a result of changes in the value of the underlying financial instruments. Investments in financial futures require the fund to “mark to market” on a daily basis, which reflects the change in the market value of the contract at the close of each day’s trading. Accordingly, variation margin payments are received or made to reflect daily unrealized gains or losses.When the contracts are closed, the fund recognizes a realized gain or loss.These investments require initial margin deposits with a broker, which consist of cash or cash equivalents.The amount of these deposits is determined by the
36
exchange or Board of Trade on which the contract is traded and is subject to change. Contracts open at October 31, 2008, are set forth in the Statement of Financial Futures.
The fund may purchase and write (sell) put and call options in order to gain exposure to or to protect against changes in the market.
As a writer of call options, the fund receives a premium at the outset and then bears the market risk of unfavorable changes in the price of the financial instrument underlying the option. Generally, the fund would incur a gain, to the extent of the premium, if the price of the underlying financial instrument decreases between the date the option is written and the date on which the option is terminated. Generally, the fund would realize a loss, if the price of the financial instrument increases between those dates.
As a writer of put options, the fund receives a premium at the outset and then bears the market risk of unfavorable changes in the price of the financial instrument underlying the option. Generally, the fund would incur a gain, to the extent of the premium, if the price of the underlying financial instrument increases between the date the option is written and the date on which the option is terminated. Generally, the fund would realize a loss, if the price of the financial instrument decreases between those dates.
In addition, the following table summarizes the fund’s call/put options written during the period ended October 31,2008:
| | | Face Amount | | | | Options Terminated |
| | | | | | |
|
| | | Covered by | | Premiums | | | | Net Realized |
| Options Written: | | Contracts ($) | | Received ($) | | Cost ($) | | Gain (Loss) ($) |
| |
| |
| |
| |
|
| Contracts outstanding | | | | | | | | |
| October 31, 2007 | | — | | — | | | | |
| Contracts written | | 306,700,000 | | 14,910 | | | | |
| Contracts terminated: | | | | | | | | |
| Closed | | 306,000,000 | | 13,301 | | 30,123 | | (16,822) |
| Expired | | 700,000 | | 1,609 | | — | | 1,609 |
| Total contracts | | | | | | | | |
| terminated | | 306,700,000 | | 14,910 | | 30,123 | | (15,213) |
| Contracts outstanding | | | | | | | | |
| October 31, 2008 | | — | | — | | | | |
The Fund 37
| NOTES TO FINANCIAL STATEMENTS (continued) |
The fund enters into forward currency exchange contracts in order to hedge its exposure to changes in foreign currency exchange rates on its foreign portfolio holdings and to settle foreign currency transac-tions.When executing forward currency exchange contracts, the fund is obligated to buy or sell a foreign currency at a specified rate on a certain date in the future. With respect to sales of forward currency exchange contracts, the fund would incur a loss if the value of the contract increases between the date the forward contract is opened and the date the forward contract is closed.The fund realizes a gain if the value of the contract decreases between those dates. With respect to purchases of forward currency exchange contracts, the fund would incur a loss if the value of the contract decreases between the date the forward contract is opened and the date the forward contract is closed. The fund realizes a gain if the value of the contract increases between those dates. The fund is also exposed to credit risk associated with counterparty nonperformance on these forward currency exchange contracts, which is typically limited to the unrealized gain on each open contract. The following summarizes open forward currency exchange contracts at October 31, 2008:
| | | Foreign | | | | | | Unrealized |
| Forward Currency | | Currency | | | | | | Appreciation |
| Exchange Contracts | | Amounts | | Cost ($) | | Value ($) (Depreciation) ($) |
| |
| |
| |
|
| Purchases: | | | | | | | | |
| Brazilian Real, | | | | | | | | |
| Expiring 11/14/2008 | | 1,200,000 | | 506,864 | | 550,551 | | 43,687 |
| Canadian Dollar, | | | | | | | | |
| Expiring 12/17/2008 | | 675,000 | | 633,220 | | 559,996 | | (73,224) |
| Euro | | | | | | | | |
| Expiring 11/06/2008 | | 397,904 | | 506,568 | | 507,149 | | 581 |
| Euro | | | | | | | | |
| Expiring 11/14/2008 | | 630,000 | | 808,501 | | 802,392 | | (6,109) |
| Euro | | | | | | | | |
| Expiring 11/14/2008 | | 430,000 | | 546,257 | | 547,665 | | 1,408 |
| Euro | | | | | | | | |
| Expiring 11/14/2008 | | 1,430,000 | | 1,819,746 | | 1,821,303 | | 1,557 |
| Euro | | | | | | | | |
| Expiring 12/17/2008 | | 350,000 | | 445,671 | | 445,483 | | (188) |
38
| | | Foreign | | | | | | Unrealized |
| Forward Currency | | Currency | | | | | | Appreciation |
| Exchange Contracts | | Amounts | | Cost ($) | | Value ($) (Depreciation) ($) |
| |
| |
| |
|
| Purchases (continued): | | | | | | | | |
| Japanese Yen, | | | | | | | | |
| Expiring 11/14/2008 | | 47,520,000 | | 472,413 | | 482,562 | | 10,149 |
| Japanese Yen, | | | | | | | | |
| Expiring | | | | | | | | |
| 12/17/2008 | | 261,240,000 | | 2,477,171 | | 2,657,685 | | 180,514 |
| Japanese Yen, | | | | | | | | |
| Expiring | | | | | | | | |
| 12/17/2008 | | 215,730,000 | | 2,038,217 | | 2,194,696 | | 156,479 |
| Japanese Yen, | | | | | | | | |
| Expiring | | | | | | | | |
| 12/17/2008 | | 485,000,000 | | 4,782,330 | | 4,934,074 | | 151,744 |
| Malaysian Ringgit, | | | | | | | | |
| Expiring 03/26/2009 | | 1,620,000 | | 508,236 | | 457,583 | | (50,653) |
| Norwegian Krone, | | | | | | | | |
| Expiring 11/14/2008 | | 3,080,000 | | 467,044 | | 456,750 | | (10,294) |
| New Zealand Dollar, | | | | | | | | |
| Expiring 12/17/2008 | | 1,560,000 | | 1,094,575 | | 903,107 | | (191,468) |
| Saudi Arabia Riyal, | | | | | | | | |
| Expiring 06/16/2009 | | 1,300,000 | | 349,087 | | 345,350 | | (3,737) |
| Saudi Arabia Riyal, | | | | | | | | |
| Expiring 06/16/2009 | | 300,000 | | 80,569 | | 79,696 | | (873) |
| Swedish Krona, | | | | | | | | |
| Expiring 12/17/2008 | | 790,000 | | 117,479 | | 101,693 | | (15,786) |
| Sales: | | | | Proceeds ($) | | | | |
| Australian Dollar, | | | | | | | | |
| Expiring 12/17/2008 | | 1,263,475 | | 1,094,575 | | 835,949 | | 258,626 |
| Australian Dollar, | | | | | | | | |
| Expiring 12/17/2008 | | 615,000 | | 411,693 | | 406,900 | | 4,793 |
| Brazilian Real, | | | | | | | | |
| Expiring 11/14/2008 | | 2,060,000 | | 1,002,433 | | 945,112 | | 57,321 |
| Czech Republic Koruna, | | | | | | | | |
| Expiring 01/26/2009 | | 18,910,000 | | 948,345 | | 1,000,315 | | (51,970) |
| Euro, | | | | | | | | |
| Expiring 11/03/2008 | | 1,437,805 | | 1,830,455 | | 1,832,556 | | (2,101) |
| Euro, | | | | | | | | |
| Expiring 11/04/2008 | | 354,904 | | 452,609 | | 452,343 | | 266 |
| Euro, | | | | | | | | |
| Expiring 11/14/2008 | | 5,800,000 | | 7,968,127 | | 7,387,104 | | 581,023 |
The Fund 39
| NOTES TO FINANCIAL STATEMENTS (continued) |
| | | Foreign | | | | | | Unrealized |
| Forward Currency | | Currency | | | | | | Appreciation |
| Exchange Contracts | | Amounts | | Proceeds ($) | | Value ($) (Depreciation) ($) |
| |
| |
| |
|
| Sales (continued): | | | | | | | | |
| Euro, | | | | | | | | |
| Expiring 11/14/2008 | | 360,000 | | 466,344 | | 458,510 | | 7,834 |
| Euro, | | | | | | | | |
| Expiring 12/17/2008 | | 400,000 | | 562,880 | | 509,123 | | 53,757 |
| Euro, | | | | | | | | |
| Expiring 12/17/2008 | | 1,710,000 | | 2,405,200 | | 2,176,502 | | 228,698 |
| British Pounds, | | | | | | | | |
| Expiring 11/14/2008 | | 290,000 | | 477,471 | | 466,211 | | 11,260 |
| British Pounds, | | | | | | | | |
| Expiring 12/17/2008 | | 515,000 | | 936,172 | | 826,540 | | 109,632 |
| British Pounds, | | | | | | | | |
| Expiring 12/17/2008 | | 230,000 | | 401,697 | | 369,134 | | 32,563 |
| British Pounds, | | | | | | | | |
| Expiring 12/17/2008 | | 270,000 | | 471,558 | | 433,332 | | 38,226 |
| British Pounds, | | | | | | | | |
| Expiring 12/17/2008 | | 680,000 | | 1,186,471 | | 1,091,354 | | 95,117 |
| British Pounds, | | | | | | | | |
| Expiring 12/17/2008 | | 280,000 | | 498,316 | | 449,381 | | 48,935 |
| British Pounds, | | | | | | | | |
| Expiring 12/17/2008 | | 220,000 | | 397,870 | | 353,085 | | 44,785 |
| Hungary Forint, | | | | | | | | |
| Expiring 11/03/2008 | | 152,431,494 | | 765,795 | | 748,676 | | 17,119 |
| Mexican New Peso, | | | | | | | | |
| Expiring 12/17/2008 | | 4,930,000 | | 461,697 | | 378,114 | | 83,583 |
| Mexican New Peso, | | | | | | | | |
| Expiring 12/17/2008 | | 9,780,000 | | 914,164 | | 750,092 | | 164,072 |
| Malaysian Ringgit, | | | | | | | | |
| Expiring 03/26/2009 | | 1,620,000 | | 517,986 | | 457,583 | | 60,403 |
| New Zealand Dollar, | | | | | | | | |
| Expiring 12/17/2008 | | 110,000 | | 72,910 | | 63,681 | | 9,229 |
| New Zealand Dollar, | | | | | | | | |
| Expiring 12/17/2008 | | 1,000,000 | | 662,070 | | 578,915 | | 83,155 |
| New Zealand Dollar, | | | | | | | | |
| Expiring 12/17/2008 | | 10,000 | | 6,535 | | 5,789 | | 746 |
| New Zealand Dollar, | | | | | | | | |
| Expiring 12/17/2008 | | 800,000 | | 471,914 | | 463,132 | | 8,782 |
| Thai Bat, | | | | | | | | |
| Expiring 11/14/2008 | | 32,840,000 | | 942,324 | | 935,265 | | 7,059 |
| Total | | | | | | | | 2,146,700 |
The fund may enter into swap agreements to exchange the interest rate on, or return generated by, one nominal instrument for the return generated by another nominal instrument.
40
The fund accrues for the interim payments on swap contracts on a daily basis, with the net amount recorded within unrealized appreciation (depreciation) of swap contracts in the Statement of Assets and Liabilities. Once the interim payments are settled in cash, the net amount is recorded as realized gain (loss) on swaps, in addition to realized gain (loss) recorded upon the termination of swaps contracts in the Statement of Operations. Fluctuations in the value of swap contracts are recorded as a component of net change in unrealized appreciation (depreciation) on investments.
Credit default swaps involve commitments to pay or receive a fixed interest rate in exchange for payment if a credit event affecting a third party (the referenced company) occurs. Credit events may include a failure to pay interest or principal, bankruptcy, or restructuring. For those credit default swaps in which the fund is receiving a fixed rate, the fund is providing credit protection on the underlying instrument. The maximum payouts for these contracts are limited to the notional amount of each swap. The following summarizes open credit default swap agreements at October 31, 2008:
| | | | | | | | | | | Unrealized |
| Notional | | Reference | | | | (Pay)/Receive | | Appreciation |
| Amount ($) | | Entity | | Counterparty | | Fixed Rate (%) Expiration (Depreciation) ($) |
| |
| |
| |
|
| |
| 10,000 | | Block Financial, | | | | | | | | |
| | | 5.125%, | | | | | | | | |
| | | 10/30/2014 | | Barclays | | (2.30) | | 12/20/2012 | | (296) |
| 55,000 | | Block Financial, | | | | | | | | |
| | | 5.125%, | | | | | | | | |
| | | 10/30/2014 | | JP Morgan | | (1.90) | | 9/20/2012 | | (694) |
| 10,000 | | Block Financial, | | | | | | | | |
| | | 5.125%, | | | | | | | | |
| | | 10/30/2014 | | JP Morgan | | (2.25) | | 12/20/2012 | | (277) |
| 170,000 | | Reed Elsevier | | | | | | | | |
| | | Capital, 4.625%, | | | | | | | | |
| | | 6/15/2012 | | Deutsche Bank | | (0.96) | | 6/20/2012 | | 2,147 |
| 275,000 | | ABX HE 07-1 AAA | | | | | | | | |
| | | Stuctured Index, | | | | | | | | |
| | | .09%, 8/25/2037 | | JP Morgan | | 0.09 | | 8/25/2037 | | (28,501) |
| 500,000 | | Dow Jones | | | | | | | | |
| | | CDX.NA.IG.11 Index | | Barclays | | 5.00 | | 12/20/2013 | | 5,625 |
| Total | | | | | | | | | | (21,996) |
The Fund 41
| NOTES TO FINANCIAL STATEMENTS (continued) |
The fund may enter into interest rate swaps, which involve the exchange of commitments to pay and receive interest based on a notional principal amount. The following summarizes interest rate swaps entered into by the fund at October 31, 2008:
| | | | | | | | | | | Unrealized |
| Notional | | Reference | | | | (Pay)/Receive | | | | Appreciation |
| Amount ($) | | Entity | | Counterparty | | Fixed Rate (%) Expiration (Depreciation) ($) |
| |
| |
| |
|
| |
| 900,000 | | USD—3 Month | | | | | | | | |
| | | Libor | | JP Morgan | | 4.90 | | 8/24/2009 | | 21,239 |
| 740,000 | | GBP—6 Month | | | | | | | | |
| | | Libor | | JP Morgan | | 5.03 | | 4/4/2013 | | 14,691 |
| 1,340,000 | | GBP—6 Month | | | | | | | | |
| | | Libor | | JP Morgan | | 6.30 | | 6/18/2011 | | 117,495 |
| 14,200,000 | | JPY—6 Month | | | | | | | | |
| | | Yenibor | | JP Morgan | | 1.67 | | 12/7/2017 | | 2,315 |
| 33,000,000 | | JPY—6 Month | | | | | | | | |
| | | Yenibor | | JP Morgan | | 1.36 | | 1/19/2012 | | 4,341 |
| 27,000,000 | | JPY—6 Month | | | | | | | | |
| | | Yenibor | | JP Morgan | | 2.08 | | 7/28/2016 | | 14,166 |
| 370,000 | | NZD—3 Month | | | | | | | | |
| | | Libor | | JP Morgan | | 7.88 | | 5/18/2010 | | 10,093 |
| 120,000 | | NZD—3 Month | | | | | | | | |
| | | Libor | | JP Morgan | | 8.05 | | 6/21/2012 | | 3,698 |
| 1,625,000 | | NZD—6 Month | | | | | | | | |
| | | Libor | | Barclays | | 7.58 | | 5/1/2013 | | 59,094 |
| Total | | | | | | | | | | 247,132 |
Risks may arise upon entering into these agreements from the potential inability of the counterparties to meet the terms of the agreement and are generally limited to the amount of net payments to be received, if any, at the date of default.
At October 31, 2008, the cost of investments for federal income tax purposes was $49,981,133; accordingly, accumulated net unrealized depreciation on investments was $4,911,772, consisting of $833,024 gross
42
unrealized appreciation and $5,744,796 gross unrealized depreciation.
In March 2008, the FASB released Statement of Financial Accounting Standards No. 161 “Disclosures about Derivative Instruments and Hedging Activities” (“FAS 161”). FAS 161 requires qualitative disclosures about objectives and strategies for using derivatives, quantitative disclosures about fair value amounts of gains and losses on derivative instruments and disclosures about credit-risk-related contingent features in derivative agreements.The application of FAS 161 is required for fiscal years and interim periods beginning after November 15, 2008. At this time, management is evaluating the implications of FAS 161 and its impact on the financial statements and the accompanying notes has not yet been determined.
During September 2008, FASB Staff Position FAS 133-1 and FASB Interpretation 45-4,“Disclosures about Credit Derivatives and Certain Guarantees”: An Amendment of FASB Statement No. 133 and FASB Interpretation No. 45; and Clarification of the Effective Date of FASB Statement No. 161 (“Amendment”) was issued and is effective for annual and interim reporting periods ending after November 15, 2008. The Amendment requires enhanced disclosures regarding a fund’s credit derivatives holdings and hybrid financial instruments containing embedded credit derivatives. Management is currently evaluating the impact the adoption of the Amendment will have on the fund’s financial statement disclosures.
The Fund 43
REPORT OF INDEPENDENT REGISTERED
PUBLIC ACCOUNTING FIRM |
The Board of Trustees and Shareholders of The Dreyfus/Laurel Funds Trust:
We have audited the accompanying statement of assets and liabilities of Dreyfus International Bond Fund (formerly Dreyfus Premier International Bond Fund), a series of The Dreyfus/Laurel Funds Trust (the “Fund”), including the statements of investments and financial futures, as of October 31, 2008, and the related operations for the year then ended, the statement of changes in net assets for each of the years in the two-year period then ended and the financial highlights for each of the years in the two-year period then ended and for the period from December 30, 2005 (commencement of operations) to October 31, 2006.These financial statements and financial highlights are the responsibility of the Fund’s management. Our responsibility is to express an opinion on these financial statements and financial highlights based on our audits.
We conducted our audits in accordance with the standards of the Public Company Accounting Oversight Board (United States).Those standards require that we plan and perform the audit to obtain reasonable assurance about whether the financial statements and financial highlights are free of material misstatement. An audit includes examining, on a test basis, evidence supporting the amounts and disclosures in the financial statements. Our procedures included confirmation of securities owned as of October 31, 2008, by correspondence with the custodian and brokers or by other appropriate auditing procedures where replies from brokers were not received. An audit also includes assessing the accounting principles used and significant estimates made by management, as well as evaluating the overall financial statement presentation.We believe that our audits provide a reasonable basis for our opinion.
In our opinion, the financial statements and financial highlights referred to above present fairly, in all material respects, the financial position of Dreyfus International Bond Fund as of October 31, 2008, and the results of its operations for the year then ended, the changes in its net assets for each of the years in the two-year period then ended and the financial highlights for each of the years in the two-year period then ended and for the period from December 30, 2005 (commencement of operations) to October 31, 2006, in conformity with U.S. generally accepted accounting principles.

| | New York, New York
December 23, 2008 |
44
IMPORTANT TAX INFORMATION (Unaudited)
For federal tax purposes the fund hereby designates 24.92% of ordinary income dividends paid during the fiscal year ended October 31, 2008 as qualifying “interest related dividends”. Also, the fund hereby designates $.1655 per share as a long-term capital gain distribution and $.1876 per share as a short-term capital gain distribution paid on December 28, 2007.
The Fund 45
BOARD MEMBERS INFORMATION (Unaudited)
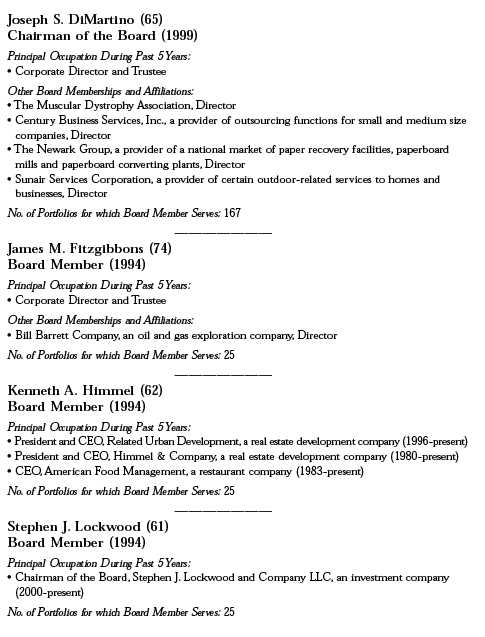
46

The Fund 47
OFFICERS OF THE FUND (Unaudited)
48

The Fund 49
For More Information
Telephone Call your financial representative or 1-800-554-4611
Mail The Dreyfus Family of Funds, 144 Glenn Curtiss Boulevard, Uniondale, NY 11556-0144
The fund files its complete schedule of portfolio holdings with the Securities and Exchange Commission (“SEC”) for the first and third quarters of each fiscal year on Form N-Q. The fund’s Forms N-Q are available on the SEC’s website at http://www.sec.gov and may be reviewed and copied at the SEC’s Public Reference Room in Washington, DC. Information on the operation of the Public Reference Room may be obtained by calling 1-800-SEC-0330.
A description of the policies and procedures that the fund uses to determine how to vote proxies relating to portfolio securities, and information regarding how the fund voted these proxies for the 12-month period ended June 30, 2008, is available at http://www.dreyfus.com and on the SEC’s website at http://www.sec.gov. The description of the policies and procedures is also available without charge, upon request, by calling 1-800-645-6561.

| © 2008 MBSC Securities Corporation |
The Registrant has adopted a code of ethics that applies to the Registrant's principal executive officer, principal financial officer, principal accounting officer or controller, or persons performing similar functions. There have been no amendments to, or waivers in connection with, the Code of Ethics during the period covered by this Report.
| Item 3. | | Audit Committee Financial Expert. |
The Registrant's Board has determined that Joseph S. DiMartino, a member of the Audit Committee of the Board, is an audit committee financial expert as defined by the Securities and Exchange Commission (the "SEC"). Joseph S. DiMartino is "independent" as defined by the SEC for purposes of audit committee financial expert determinations.
| Item 4. | | Principal Accountant Fees and Services. |
(a) Audit Fees. The aggregate fees billed for each of the last two fiscal years (the "Reporting Periods") for professional services rendered by the Registrant's principal accountant (the "Auditor") for the audit of the Registrant's annual financial statements, or services that are normally provided by the Auditor in connection with the statutory and regulatory filings or engagements for the Reporting Periods, were $93,605 in 2007 and $96,420 in 2008.
(b) Audit-Related Fees. The aggregate fees billed in the Reporting Periods for assurance and related services by the Auditor that are reasonably related to the performance of the audit of the Registrant's financial statements and are not reported under paragraph (a) of this Item 4 were $4,090 in 2007 and $12,650 in 2008 These services consisted of security counts required by Rule 17f-2 under the Investment Company Act of 1940, as amended.
The aggregate fees billed in the Reporting Periods for non-audit assurance and related services by the Auditor to the Registrant's investment adviser (not including any sub-investment adviser whose role is primarily portfolio management and is subcontracted with or overseen by another investment adviser), and any entity controlling, controlled by or under common control with the investment adviser that provides ongoing services to the Registrant ("Service Affiliates"), that were reasonably related to the performance of the annual audit of the Service Affiliate, which required pre-approval by the Audit Committee were $0 in 2007 and $0 in 2008.
Note: For the second paragraph in each of (b) through (d) of this Item 4, certain of such services were not pre-approved prior to May 6, 2003, when such services were required to be pre-approved. On and after May 6, 2003, 100% of all services provided by the Auditor were pre-approved as required. For comparative purposes, the fees shown assume that all such services were pre-approved, including services that were not pre-approved prior to the compliance date of the pre-approval requirement.
(c) Tax Fees. The aggregate fees billed in the Reporting Periods for professional services rendered by the Auditor for tax compliance, tax advice and tax planning ("Tax Services") were $2,090 in 2007 and $6,450 in 2008. These services consisted of review or preparation of U.S. federal, state, local and excise tax returns.
The aggregate fees billed in the Reporting Periods for Tax Services by the Auditor to Service Affiliates which required pre-approval by the Audit Committee were $0 in 2007 and $0 in 2008.
(d) All Other Fees. The aggregate fees billed in the Reporting Periods for products and services provided by the Auditor, other than the services reported in paragraphs (a) through (c) of this Item, were $0 in 2007 and $0 in 2008.
3
The aggregate fees billed in the Reporting Periods for Non-Audit Services by the Auditor to Service Affiliates, other than the services reported in paragraphs (b) through (c) of this Item, which required pre-approval by the Audit Committee were $0 in 2007 and $0 in 2008.
Audit Committee Pre-Approval Policies and Procedures. The Registrant's Audit Committee has established policies and procedures (the "Policy") for pre-approval (within specified fee limits) of the Auditor's engagements for non-audit services to the Registrant and Service Affiliates without specific case-by-case consideration. Pre-approval considerations include whether the proposed services are compatible with maintaining the Auditor's independence. Pre-approvals pursuant to the Policy are considered annually.
Non-Audit Fees. The aggregate non-audit fees billed by the Auditor for services rendered to the Registrant, and rendered to Service Affiliates, for the Reporting Periods were $2,455,000 in 2007 and $2,532,612 in 2008.
Auditor Independence. The Registrant's Audit Committee has considered whether the provision of non-audit services that were rendered to Service Affiliates which were not pre-approved (not requiring pre-approval) is compatible with maintaining the Auditor's independence.
| Item 5. | | Audit Committee of Listed Registrants. |
| | | Not applicable. |
| Item 6. | | Schedule of Investments. |
| | | Not applicable. |
| Item 7. | | Disclosure of Proxy Voting Policies and Procedures for Closed-End Management |
| | | Investment Companies. |
| | | Not applicable. |
| Item 8. | | Portfolio Managers of Closed-End Management Investment Companies. |
| | | Not applicable |
| Item 9. | | Purchases of Equity Securities by Closed-End Management Investment Companies and |
| | | Affiliated Purchasers. |
| | | Not applicable. |
| Item 10. | | Submission of Matters to a Vote of Security Holders. |
The Registrant has a Nominating Committee (the "Committee"), which is responsible for selecting and nominating persons for election or appointment by the Registrant's Board as Board members. The Committee has adopted a Nominating Committee Charter (the "Charter"). Pursuant to the Charter, the Committee will consider recommendations for nominees from shareholders submitted to the Secretary of the Registrant, c/o The Dreyfus Corporation Legal Department, 200 Park Avenue, 8th Floor East, New York, New York 10166. A nomination submission must include information regarding the recommended nominee as specified in the Charter. This information includes all information relating to a recommended nominee that is required to be disclosed in solicitations or proxy statements for the election of Board members, as well as information sufficient to evaluate the factors to be considered by the Committee, including character and integrity,
4
business and professional experience, and whether the person has the ability to apply sound and independent business judgment and would act in the interests of the Registrant and its shareholders. Nomination submissions are required to be accompanied by a written consent of the individual to stand for election if nominated by the Board and to serve if elected by the shareholders, and such additional information must be provided regarding the recommended nominee as reasonably requested by the Committee.
| Item 11. | | Controls and Procedures. |
(a) The Registrant's principal executive and principal financial officers have concluded, based on their evaluation of the Registrant's disclosure controls and procedures as of a date within 90 days of the filing date of this report, that the Registrant's disclosure controls and procedures are reasonably designed to ensure that information required to be disclosed by the Registrant on Form N-CSR is recorded, processed, summarized and reported within the required time periods and that information required to be disclosed by the Registrant in the reports that it files or submits on Form N-CSR is accumulated and communicated to the Registrant's management, including its principal executive and principal financial officers, as appropriate to allow timely decisions regarding required disclosure.
(b) There were no changes to the Registrant's internal control over financial reporting that occurred during the second fiscal quarter of the period covered by this report that have materially affected, or are reasonably likely to materially affect, the Registrant's internal control over financial reporting.
(a)(1) Code of ethics referred to in Item 2.
(a)(2) Certifications of principal executive and principal financial officers as required by Rule 30a-2(a) under the Investment Company Act of 1940.
(a)(3) Not applicable.
(b) Certification of principal executive and principal financial officers as required by Rule 30a-2(b) under the Investment Company Act of 1940.
5
Pursuant to the requirements of the Securities Exchange Act of 1934 and the Investment Company Act of 1940, the Registrant has duly caused this Report to be signed on its behalf by the undersigned, thereunto duly authorized.
| The Dreyfus/Laurel Funds Trust |
| |
| By: | | /s/ J. David Officer |
| | | J. David Officer |
| | | President |
| |
| Date: | | December 18, 2008 |
Pursuant to the requirements of the Securities Exchange Act of 1934 and the Investment Company Act of 1940, this Report has been signed below by the following persons on behalf of the Registrant and in the capacities and on the dates indicated.
| By: | | /s/ J. David Officer |
| | | J. David Officer |
| | | President |
| |
| Date: | | December 18, 2008 |
| |
| By: | | /s/ James Windels |
| | | James Windels |
| | | Treasurer |
| |
| Date: | | December 18, 2008 |
EXHIBIT INDEX
| | (a)(1) Code of ethics referred to in Item 2.
(a)(2) Certifications of principal executive and principal financial officers as required by Rule 30a-
2(a) under the Investment Company Act of 1940. (EX-99.CERT)
(b) Certification of principal executive and principal financial officers as required by Rule 30a-
2(b) under the Investment Company Act of 1940. (EX-99.906CERT) |
6
7