UNITED STATES
SECURITIES AND EXCHANGE COMMISSION
Washington, D.C. 20549
FORM N-CSR
CERTIFIED SHAREHOLDER REPORT OF REGISTERED MANAGEMENT
INVESTMENT COMPANIES
Investment Company Act file number | 811-524 |
| |
| The Dreyfus/Laurel Funds Trust | |
| (Exact name of Registrant as specified in charter) | |
| | |
| c/o The Dreyfus Corporation 200 Park Avenue New York, New York 10166 | |
| (Address of principal executive offices) (Zip code) | |
| | |
| Michael A. Rosenberg, Esq. 200 Park Avenue New York, New York 10166 | |
| (Name and address of agent for service) | |
|
Registrant's telephone number, including area code: | (212) 922-6000 |
| |
Date of fiscal year end: | 12/31 | |
Date of reporting period: | 6/30/2010 | |
| | | | | | |
The following N-CSR relates only to the series of the Registrant listed below, and does not affect the other series of the Registrant, which have different fiscal year ends and, therefore, different N-CSR reporting requirements. Separate N-CSR Forms will be filed for those series, as appropriate.
Dreyfus Core Value Fund
Dreyfus High Yield Fund
FORM N-CSR
Item 1. Reports to Stockholders.
SEMIANNUAL REPORT June 30, 2010

Save time. Save paper. View your next shareholder report online as soon as it’s available. Log into www.dreyfus.com and sign up for Dreyfus eCommunications. It’s simple and only takes a few minutes.
The views expressed in this report reflect those of the portfolio manager only through the end of the period covered and do not necessarily represent the views of Dreyfus or any other person in the Dreyfus organization. Any such views are subject to change at any time based upon market or other conditions and Dreyfus disclaims any responsibility to update such views.These views may not be relied on as investment advice and, because investment decisions for a Dreyfus fund are based on numerous factors, may not be relied on as an indication of trading intent on behalf of any Dreyfus fund.

| | Contents |
| | THE FUND |
| 2 | A Letter from the Chairman and CEO |
| 3 | Discussion of Fund Performance |
| 6 | Understanding Your Fund’s Expenses |
| 6 | Comparing Your Fund’s Expenses With Those of Other Funds |
| 7 | Statement of Investments |
| 17 | Statement of Assets and Liabilities |
| 18 | Statement of Operations |
| 19 | Statement of Changes in Net Assets |
| 21 | Financial Highlights |
| 25 | Notes to Financial Statements |
| 38 | Information About the Review and Approval of the Fund’s Investment Management Agreement |
| | FOR MORE INFORMATION |
| | Back Cover |
Dreyfus
High Yield Fund
The Fund

A LETTER FROM THE CHAIRMAN AND CEO
Dear Shareholder:
We are pleased to present this semiannual report for Dreyfus High Yield Fund, covering the six-month period from January 1, 2010, through June 30, 2010.
After posting solid gains over the first quarter of 2010, the financial markets encountered renewed volatility in the second quarter, which caused some of the bond market’s higher yielding sectors to erase their previous gains and end the reporting period lower than where they began. Conversely, traditional safe havens such as U.S.Treasury securities gained value as investors became more risk-averse.
The second-quarter swoon occurred despite continued U.S. economic growth, as manufacturing activity improved and unemployment began to moderate in a recovery that has so far proved sustainable but milder than historical averages. Indeed, many of the headlines that spooked investors emanated from overseas markets, including a sovereign debt crisis in Europe.
Despite recent headlines about the current state of the U.S. economy, we still believe that it is unlikely that we’ll encounter a “double-dip” recession. Instead, we expect current financial strains to ease and the domestic economy to expand at a moderate pace over the second half of the year. However, we currently see a number of downside risks that could result in volatility over the short term, which is why we still believe that a long-term investment focus with an emphasis on higher quality bonds may be advisable for many investors. As always, your financial advisor can help you assess both the risks and opportunities provided by the financial markets in this investment climate.
For information about how the fund performed during the reporting period, as well as general market perspectives, we provide a Discussion of Fund Performance on the pages that follow.
Thank you for your continued confidence and support.
Jonathan R. Baum
Chairman and Chief Executive Officer
The Dreyfus Corporation
July 15, 2010
2

DISCUSSION OF FUND PERFORMANCE
For the period of January 1, 2010, through June 30, 2010, as provided by Karen Bater, Portfolio Manager
Fund and Market Performance Overview
For the six-month period ended June 30, 2010, Dreyfus High Yield Fund’s Class A shares produced a total return of 1.66%, Class B shares returned 1.41%, Class C shares returned 1.28% and Class I shares returned 1.63%.1 In comparison, the BofA Merrill Lynch U.S. High Yield Master II Constrained Index (the “Index”), the fund’s benchmark, achieved a total return of 4.74% over the same period.2
After rallying early in the reporting period, high yield bonds fell sharply in May and June when new developments caused investors to question the strength and sustainability of the global economic recovery. The fund produced lower returns than its benchmark, primarily due to overweighted exposure to “triple-C” rated bonds and underweighted positions in the better-quality tiers of the high yield spectrum.
The Fund’s Investment Approach
The fund seeks to maximize total return, consisting of capital appreciation and current income.
At least 80% of the fund’s assets are invested in fixed-income securities that are rated below investment grade (“high yield” or “junk” bonds) or are the unrated equivalent as determined by Dreyfus. Individual issues are selected based on careful credit analysis.We thoroughly analyze the business, management and financial strength of each of the companies whose bonds we buy, then project each issuer’s ability to repay its debt.
Renewed Uncertainty Derailed a Bond Market Rally
U.S. and global economic recoveries persisted during the first quarter of 2010 as manufacturing activity increased, housing prices appeared to bottom and the domestic labor market showed early evidence of modest improvement. The U.S. economic rebound was sparked, in part, by historically low short-term interest rates from the Federal Reserve Board and a massive stimulus program adopted by the federal government. Improving economic conditions helped lift the prices of
DISCUSSION OF FUND PERFORMANCE (continued)
higher yielding fixed-income securities, including high yield corporate bonds. In contrast, U.S. government securities lagged market averages as investors favored riskier investments.
However, investor sentiment changed sharply in the second quarter of 2010, when a number of new developments brought the economic recovery into question. A sovereign debt crisis roiled Europe when Greece found itself unable to finance a heavy debt load, requiring intervention from the International Monetary Fund and the European Union. Meanwhile, surging property values in China kindled local inflation fears, and investors grew concerned that higher short-term interest rates and other remedial measures might constrain growth in Asia.The United States also encountered greater economic uncertainty when retail sales, employment and housing data sent mixed signals regarding the strength and sustainability of the economic recovery.
As a result of these economic setbacks, higher yielding sectors of the U.S. bond market lost value, giving back many of the reporting period’s previous gains, and traditionally defensive U.S. government securities generally rallied. High yield bonds had led the bond market rally early in the year and ranked among the more severe decliners during the market correction in May and June.
Constructive Investment Posture Dampened Results
In the midst of the economic recovery, we had positioned the fund to participate fully in the bond market rally through an emphasis on securities that historically have tended to be more sensitive than average to changing economic conditions. Consequently, we generally favored high yield bonds with relatively generous coupons and lower credit ratings, including those in the triple-C rating tier. Conversely, the fund held underweighted exposure to high yield bonds with single-B and double-B ratings. This relatively constructive investment posture enhanced the fund’s relative performance early in the reporting period, but it proved detrimental during the May/June reversal. The fund also invested a relatively larger portion of its assets in investment-grade corporate bonds than the benchmark, but these higher-quality securities were not sufficient to offset weakness among lower-rated high yield credits.
The fund’s constructive investment posture reflected an emphasis on relatively economically sensitive industry groups, including media,
4
technology and telecommunications services companies. Conversely, the fund held underweighted exposure to the energy, building products, leisure and chemicals industry groups, which we regarded as richly valued. In addition, one of the fund’s holdings, telecommunications service provider Sorenson Communications, suffered when the Federal Communications Commission reduced rates for a service that enables hearing-impaired callers to place and receive telephone calls through sign language interpreters.
Positioned for a Mild Recovery
Although we are concerned regarding recent economic and market setbacks, we believe a return to recession is unlikely. In addition, high yield bonds have reached more attractive valuations, default rates have been declining and an active new-issue market has provided ample financing to high yield companies. Therefore, we have maintained the fund’s relatively constructive positioning, focusing on growth opportunities in industry groups that have demonstrated an ability to grow their revenues, generate free cash flow and provide reasonable asset protection.
July 15, 2010
Bond funds are subject generally to interest rate, credit, liquidity and market risks, to varying degrees, all of which are more fully described in the fund’s prospectus. Generally, all other factors being equal, bond prices are inversely related to interest-rate changes, and rate increases can cause price declines. High yield bonds are subject to increased credit risk and are considered speculative in terms of the issuer’s perceived ability to continue making interest payments on a timely basis and to repay principal upon maturity.
| |
| 1 | Total return includes reinvestment of dividends and any capital gains paid, and does not take into |
| | consideration the maximum initial sales charge in the case of Class A shares, or the applicable |
| | contingent deferred sales charges imposed on redemptions in the case of Class B and Class C |
| | shares. Had these charges been reflected, returns would have been lower. Past performance is no |
| | guarantee of future results. Share price, yield and investment return fluctuate such that upon |
| | redemption, fund shares may be worth more or less than their original cost. Return figure provided |
| | for Class I shares reflects the absorption of certain fund expenses by The Dreyfus Corporation |
| | pursuant to an agreement in effect through September 30, 2010, at which time it may be |
| | extended, modified or terminated. Had these expenses not been absorbed, the fund’s Class I return |
| | would have been lower. |
| 2 | SOURCE: LIPPER INC. — Reflects reinvestment of dividends and, where applicable, capital |
| | gain distributions.The BofA Merrill Lynch U.S. HighYield Master II Constrained Index is an |
| | unmanaged performance benchmark composed of U.S. dollar-denominated domestic andYankee |
| | bonds rated below investment grade with at least $100 million par amount outstanding and at |
| | least one year remaining to maturity. Bonds are capitalization-weighted.Total allocations to an |
| | issuer are capped at 2%.The index does not reflect fees and expenses to which the fund is subject. |
UNDERSTANDING YOUR FUND’S EXPENSES (Unaudited)
As a mutual fund investor, you pay ongoing expenses, such as management fees and other expenses. Using the information below, you can estimate how these expenses affect your investment and compare them with the expenses of other funds.You also may pay one-time transaction expenses, including sales charges (loads) and redemption fees, which are not shown in this section and would have resulted in higher total expenses. For more information, see your fund’s prospectus or talk to your financial adviser.
Review your fund’s expenses
The table below shows the expenses you would have paid on a $1,000 investment in Dreyfus High Yield Fund from January 1, 2010 to June 30, 2010. It also shows how much a $1,000 investment would be worth at the close of the period, assuming actual returns and expenses.
Expenses and Value of a $1,000 Investment
assuming actual returns for the six months ended June 30, 2010
| | | | |
| | Class A | Class B | Class C | Class I |
| Expenses paid per $1,000† | $ 4.75 | $ 7.24 | $ 8.48 | $ 3.50 |
| Ending value (after expenses) | $1,016.60 | $1,014.10 | $1,012.80 | $1,016.30 |
COMPARING YOUR FUND’S EXPENSES
WITH THOSE OF OTHER FUNDS (Unaudited)
Using the SEC’s method to compare expenses
The Securities and Exchange Commission (SEC) has established guidelines to help investors assess fund expenses. Per these guidelines, the table below shows your fund’s expenses based on a $1,000 investment, assuming a hypothetical 5% annualized return. You can use this information to compare the ongoing expenses (but not transaction expenses or total cost) of investing in the fund with those of other funds.All mutual fund shareholder reports will provide this information to help you make this comparison. Please note that you cannot use this information to estimate your actual ending account balance and expenses paid during the period.
Expenses and Value of a $1,000 Investment
assuming a hypothetical 5% annualized return for the six months ended June 30, 2010
| | | | |
| | Class A | Class B | Class C | Class I |
| Expenses paid per $1,000† | $ 4.76 | $ 7.25 | $ 8.50 | $ 3.51 |
| Ending value (after expenses) | $1,020.08 | $1,017.60 | $1,016.36 | $1,021.32 |
|
| † Expenses are equal to the fund’s annualized expense ratio of .95% for Class A, 1.45% for Class B, 1.70% for |
| Class C and .70% for Class I, multiplied by the average account value over the period, multiplied by 181/365 (to |
| reflect the one-half year period). |
6
| | | | | |
| STATEMENT OF INVESTMENTS | | | | |
| June 30, 2010 (Unaudited) | | | | | |
| |
| |
| |
| | Coupon | Maturity | Principal | | |
| Bonds and Notes—96.0% | Rate (%) | Date | Amount ($) | | Value ($) |
| Automotive—4.5% | | | | | |
| Ford Motor Credit, | | | | | |
| Sr. Unscd. Notes | 8.00 | 12/15/16 | 2,805,000 | | 2,871,947 |
| Ford Motor Credit, | | | | | |
| Sr. Unscd. Notes | 8.70 | 10/1/14 | 8,580,000 | | 8,949,849 |
| Ford Motor, | | | | | |
| Sr. Unscd. Debs | 6.50 | 8/1/18 | 730,000 | a | 675,250 |
| Ford Motor, | | | | | |
| Sr. Unscd. Notes | 7.45 | 7/16/31 | 7,485,000 | a | 6,792,637 |
| Goodyear Tire & Rubber, | | | | | |
| Sr. Unscd. Notes | 10.50 | 5/15/16 | 3,460,000 | | 3,780,050 |
| Lear, | | | | | |
| Gtd. Bonds | 7.88 | 3/15/18 | 1,760,000 | | 1,773,200 |
| Lear, | | | | | |
| Gtd. Notes | 8.13 | 3/15/20 | 1,575,000 | | 1,586,812 |
| Motors Liquidation, | | | | | |
| Sr. Unscd. Notes | 8.38 | 7/15/33 | 7,605,000 | a,b | 2,471,625 |
| Navistar International, | | | | | |
| Gtd. Notes | 8.25 | 11/1/21 | 4,595,000 | | 4,686,900 |
| TRW Automotive, | | | | | |
| Gtd. Notes | 7.25 | 3/15/17 | 4,240,000 | c | 4,134,000 |
| United Components, | | | | | |
| Gtd. Notes | 9.38 | 6/15/13 | 1,268,000 | | 1,280,680 |
| | | | | | 39,002,950 |
| Cable/Satellite TV—3.5% | | | | | |
| CCH II Capital, | | | | | |
| Gtd. Notes | 13.50 | 11/30/16 | 18,924,136 | | 22,141,239 |
| Cequel Communications Holdings I, | | | | | |
| Sr. Unscd. Notes | 8.63 | 11/15/17 | 2,375,000 | c | 2,377,969 |
| Dish DBS, | | | | | |
| Gtd. Notes | 7.88 | 9/1/19 | 1,675,000 | | 1,750,375 |
| Insight Communications, | | | | | |
| Sr. Notes | 9.38 | 7/15/18 | 4,100,000 | c | 4,100,000 |
| | | | | | 30,369,583 |
| Capital Goods—1.4% | | | | | |
| Leucadia National, | | | | | |
| Sr. Unscd. Notes | 7.13 | 3/15/17 | 2,545,000 | | 2,468,650 |
| RBS Global and Rexnord, | | | | | |
| Gtd. Notes | 8.50 | 5/1/18 | 5,395,000 | c | 5,260,125 |
STATEMENT OF INVESTMENTS (Unaudited) (continued)
| | | | | |
| | Coupon | Maturity | Principal | | |
| Bonds and Notes (continued) | Rate (%) | Date | Amount ($) | | Value ($) |
| Capital Goods (continued) | | | | | |
| Wireco WorldGroup, | | | | | |
| Sr. Unscd. Notes | 9.50 | 5/15/17 | 4,415,000 | c | 4,326,700 |
| | | | | | 12,055,475 |
| Chemicals—1.0% | | | | | |
| Huntsman International, | | | | | |
| Gtd. Notes | 7.88 | 11/15/14 | 915,000 | | 887,550 |
| Huntsman International, | | | | | |
| Gtd. Notes | 8.63 | 3/15/20 | 2,990,000 | c | 2,773,225 |
| Ineos Finance, | | | | | |
| Sr. Scd. Notes | 9.00 | 5/15/15 | 1,600,000 | c | 1,604,000 |
| Invista, | | | | | |
| Sr. Unscd. Notes | 9.25 | 5/1/12 | 1,945,000 | c | 1,979,038 |
| LBI Escrow, | | | | | |
| Sr. Scd. Notes | 8.00 | 11/1/17 | 1,420,000 | c | 1,466,150 |
| | | | | | 8,709,963 |
| Consumer Products—1.0% | | | | | |
| Reddy Ice, | | | | | |
| Sr. Scd. Notes | 11.25 | 3/15/15 | 8,215,000 | a,c | 8,502,525 |
| Containers—3.1% | | | | | |
| AEP Industries, | | | | | |
| Sr. Unscd. Notes | 7.88 | 3/15/13 | 8,321,000 | | 8,237,790 |
| BWAY Holding, | | | | | |
| Gtd. Notes | 10.00 | 6/15/18 | 2,380,000 | c | 2,493,050 |
| Plastipak Holdings, | | | | | |
| Sr. Notes | 10.63 | 8/15/19 | 2,435,000 | c | 2,715,025 |
| Reynolds Group Issuer, | | | | | |
| Sr. Notes | 8.50 | 5/15/18 | 9,445,000 | c | 9,315,131 |
| Solo Cup, | | | | | |
| Sr. Scd. Notes | 10.50 | 11/1/13 | 3,545,000 | | 3,682,369 |
| | | | | | 26,443,365 |
| Energy—4.0% | | | | | |
| American Petroleum Tankers, | | | | | |
| Sr. Scd. Notes | 10.25 | 5/1/15 | 2,395,000 | c | 2,412,962 |
| Aquilex Holdings, | | | | | |
| Sr. Notes | 11.13 | 12/15/16 | 4,245,000 | c | 4,266,225 |
| Chesapeake Energy, | | | | | |
| Gtd. Notes | 9.50 | 2/15/15 | 6,135,000 | | 6,809,850 |
| Cie Generale de | | | | | |
| Geophysique-Veritas, Gtd. Notes | 9.50 | 5/15/16 | 2,635,000 | | 2,687,700 |
8
| | | | | |
| | Coupon | Maturity | Principal | | |
| Bonds and Notes (continued) | Rate (%) | Date | Amount ($) | | Value ($) |
| Energy (continued) | | | | | |
| Ferrellgas Partners, | | | | | |
| Sr. Unscd. Notes | 8.63 | 6/15/20 | 3,550,000 | | 3,567,750 |
| Ferrellgas Partners, | | | | | |
| Sr. Unscd. Notes | 9.13 | 10/1/17 | 3,025,000 | c | 3,168,687 |
| McJunkin Red Man, | | | | | |
| Sr. Scd. Notes | 9.50 | 12/15/16 | 7,905,000 | a,c | 7,707,375 |
| Petrohawk Energy, | | | | | |
| Gtd. Notes | 10.50 | 8/1/14 | 2,180,000 | | 2,354,400 |
| Sabine Pass LNG, | | | | | |
| Sr. Scd. Notes | 7.50 | 11/30/16 | 2,385,000 | | 1,997,437 |
| | | | | | 34,972,386 |
| Finance—9.0% | | | | | |
| Ally Financial, | | | | | |
| Gtd. Notes | 8.00 | 11/1/31 | 16,010,000 | | 14,849,275 |
| Ally Financial, | | | | | |
| Gtd. Notes | 8.30 | 2/12/15 | 1,955,000 | c | 1,984,325 |
| BAC Capital Trust XIV, | | | | | |
| Gtd. Notes | 5.63 | 9/29/49 | 11,750,000 | d | 8,019,375 |
| Citigroup Capital XXI, | | | | | |
| Gtd. Bonds | 8.30 | 12/21/77 | 11,891,000 | d | 11,640,552 |
| Developers Diversified Realty, | | | | | |
| Sr. Unscd. Notes | 9.63 | 3/15/16 | 3,425,000 | | 3,720,115 |
| HUB International Holdings, | | | | | |
| Sr. Sub. Notes | 10.25 | 6/15/15 | 10,376,000 | c | 9,571,860 |
| Icahn Enterprises Finance, | | | | | |
| Gtd. Notes | 8.00 | 1/15/18 | 9,350,000 | a,c | 9,116,250 |
| International Lease Finance, | | | | | |
| Sr. Unscd. Notes | 8.63 | 9/15/15 | 9,421,000 | c | 8,949,950 |
| iPayment, | | | | | |
| Gtd. Notes | 9.75 | 5/15/14 | 6,010,000 | | 5,499,150 |
| USI Holdings, | | | | | |
| Sr. Sub. Notes | 9.75 | 5/15/15 | 4,475,000 | c | 4,128,187 |
| | | | | | 77,479,039 |
| Food, Beverage & | | | | | |
| Tobacco—1.6% | | | | | |
| Bolthouse Farms, | | | | | |
| Bank Notes | 9.50 | 7/25/16 | 6,300,000 | e | 6,307,875 |
| Dean Foods, | | | | | |
| Gtd. Notes | 7.00 | 6/1/16 | 4,844,000 | | 4,553,360 |
STATEMENT OF INVESTMENTS (Unaudited) (continued)
| | | | | |
| | Coupon | Maturity | Principal | | |
| Bonds and Notes (continued) | Rate (%) | Date | Amount ($) | | Value ($) |
| Food, Beverage & | | | | | |
| Tobacco (continued) | | | | | |
| Michael Foods, | | | | | |
| Sr. Notes | 9.75 | 7/15/18 | 2,665,000 | c | 2,751,612 |
| | | | | | 13,612,847 |
| Gaming—6.4% | | | | | |
| Ameristar Casinos, | | | | | |
| Gtd. Notes | 9.25 | 6/1/14 | 3,395,000 | | 3,573,237 |
| Boyd Gaming, | | | | | |
| Sr. Sub. Notes | 6.75 | 4/15/14 | 1,425,000 | a | 1,254,000 |
| Boyd Gaming, | | | | | |
| Sr. Sub. Notes | 7.13 | 2/1/16 | 4,385,000 | a | 3,628,588 |
| Harrahs Operating Co., | | | | | |
| Sr. Scd. Notes | 10.00 | 12/15/18 | 2,080,000 | a | 1,716,000 |
| Isle of Capri Casinos, | | | | | |
| Gtd. Notes | 7.00 | 3/1/14 | 5,517,000 | a | 4,992,885 |
| MGM Mirage, | | | | | |
| Gtd. Notes | 4.25 | 4/15/15 | 2,300,000 | c | 1,831,375 |
| MGM Mirage, | | | | | |
| Gtd. Notes | 6.75 | 4/1/13 | 3,115,000 | | 2,795,712 |
| MGM Mirage, | | | | | |
| Gtd. Notes | 7.50 | 6/1/16 | 10,590,000 | a | 8,392,575 |
| MGM Mirage, | | | | | |
| Sr. Unscd. Notes | 11.38 | 3/1/18 | 17,585,000 | a,c | 16,617,825 |
| Penn National Gaming, | | | | | |
| Sr. Sub. Notes | 8.75 | 8/15/19 | 4,115,000 | | 4,248,738 |
| Pokagon Gaming Authority, | | | | | |
| Sr. Notes | 10.38 | 6/15/14 | 4,288,000 | c | 4,459,520 |
| Shingle Springs Tribal Gaming | | | | | |
| Authority, Sr. Notes | 9.38 | 6/15/15 | 2,795,000 | c | 2,229,012 |
| | | | | | 55,739,467 |
| Health Care—6.5% | | | | | |
| American Renal Holdings, | | | | | |
| Sr. Scd. Notes | 8.38 | 5/15/18 | 530,000 | c | 527,350 |
| Bausch & Lomb, | | | | | |
| Sr. Unscd. Notes | 9.88 | 11/1/15 | 8,445,000 | | 8,719,463 |
| Biomet, | | | | | |
| Gtd. Notes | 11.63 | 10/15/17 | 30,930,000 | | 33,636,375 |
| Capella Healthcare, | | | | | |
| Gtd. Notes | 9.25 | 7/1/17 | 2,020,000 | c | 2,045,250 |
10
| | | | | |
| | Coupon | Maturity | Principal | | |
| Bonds and Notes (continued) | Rate (%) | Date | Amount ($) | | Value ($) |
| Health Care (continued) | | | | | |
| Inverness Medical Innovations, | | | | | |
| Sr. Unscd. Notes | 7.88 | 2/1/16 | 3,240,000 | | 3,183,300 |
| Inverness Medical Innovations, | | | | | |
| Gtd. Notes | 9.00 | 5/15/16 | 5,940,000 | | 5,969,700 |
| Radiation Therapy Services, | | | | | |
| Sr. Sub. Notes | 9.88 | 4/15/17 | 2,210,000 | c | 2,132,650 |
| | | | | | 56,214,088 |
| Media—12.0% | | | | | |
| Allbritton Communications, | | | | | |
| Sr. Unscd. Notes | 8.00 | 5/15/18 | 5,830,000 | c | 5,800,850 |
| Clear Channel Communications, | | | | | |
| Sr. Unscd. Notes | 4.90 | 5/15/15 | 8,375,000 | | 4,396,875 |
| Clear Channel Communications, | | | | | |
| Sr. Unscd. Notes | 5.00 | 3/15/12 | 4,726,000 | a | 4,052,545 |
| Clear Channel Communications, | | | | | |
| Sr. Unscd. Notes | 5.50 | 9/15/14 | 20,639,000 | a | 11,454,645 |
| Clear Channel Communications, | | | | | |
| Sr. Unscd. Notes | 5.50 | 12/15/16 | 9,188,000 | | 4,456,180 |
| Clear Channel Communications, | | | | | |
| Sr. Unscd. Notes | 5.75 | 1/15/13 | 11,368,000 | a | 8,753,360 |
| Clear Channel Communications, | | | | | |
| Sr. Unscd. Debs | 6.88 | 6/15/18 | 3,880,000 | | 1,901,200 |
| Clear Channel Communications, | | | | | |
| Gtd. Notes | 10.75 | 8/1/16 | 3,330,000 | a | 2,355,975 |
| Gray Television, | | | | | |
| Sr. Scd. Notes | 10.50 | 6/29/15 | 12,900,000 | a,c | 12,577,500 |
| LBI Media, | | | | | |
| Sr. Sub. Notes | 8.50 | 8/1/17 | 9,807,000 | c | 8,458,538 |
| LIN Television, | | | | | |
| Gtd. Notes, Ser. B | 6.50 | 5/15/13 | 4,635,000 | | 4,472,775 |
| Nexstar Broadcasting, | | | | | |
| Gtd. Notes | 0.50 | 1/15/14 | 722,089 | c | 646,270 |
| Nexstar Broadcasting, | | | | | |
| Gtd. Notes | 7.00 | 1/15/14 | 201,000 | | 179,895 |
| Nexstar Finance Holdings, | | | | | |
| Sr. Discount Notes | 11.38 | 4/1/13 | 1,348,032 | d | 1,317,702 |
| Nexstar/Mission Broadcasting, | | | | | |
| Sr. Scd. Notes | 8.88 | 4/15/17 | 780,000 | c | 787,800 |
STATEMENT OF INVESTMENTS (Unaudited) (continued)
| | | | | |
| | Coupon | Maturity | Principal | | |
| Bonds and Notes (continued) | Rate (%) | Date | Amount ($) | | Value ($) |
| Media (continued) | | | | | |
| Quebecor Media, | | | | | |
| Sr. Unscd. Notes | 7.75 | 3/15/16 | 3,275,000 | | 3,225,875 |
| Quebecor Media, | | | | | |
| Sr. Unscd. Notes | 7.75 | 3/15/16 | 8,325,000 | | 8,200,125 |
| Salem Communications, | | | | | |
| Sr. Scd. Notes | 9.63 | 12/15/16 | 4,713,000 | a | 4,877,955 |
| Sinclair Broadcast Group, | | | | | |
| Gtd. Notes | 8.00 | 3/15/12 | 11,929,000 | a | 11,675,509 |
| Sinclair Television Group, | | | | | |
| Sr. Scd. Notes | 9.25 | 11/1/17 | 3,885,000 | c | 3,943,275 |
| | | | | | 103,534,849 |
| Metals Mining—2.6% | | | | | |
| Drummond, | | | | | |
| Sr. Unscd. Notes | 7.38 | 2/15/16 | 4,705,000 | | 4,446,225 |
| Murray Energy, | | | | | |
| Gtd. Notes | 10.25 | 10/15/15 | 3,750,000 | c | 3,750,000 |
| Severstal Columbus, | | | | | |
| Sr. Scd. Notes | 10.25 | 2/15/18 | 13,700,000 | c | 14,213,750 |
| | | | | | 22,409,975 |
| Paper—3.0% | | | | | |
| Abitibi-Consolidated of Canada, | | | | | |
| Sr. Scd. Notes | 13.75 | 4/1/11 | 2,182,582 | b,c | 2,318,994 |
| Newpage, | | | | | |
| Sr. Scd. Notes | 11.38 | 12/31/14 | 17,034,000 | a | 15,543,525 |
| Smurfit Kappa Funding, | | | | | |
| Sr. Sub. Notes | 7.75 | 4/1/15 | 2,115,000 | | 2,099,138 |
| Verso Paper Holdings, | | | | | |
| Gtd. Notes, Ser. B | 11.38 | 8/1/16 | 4,500,000 | a | 3,858,750 |
| Verso Paper Holdings, | | | | | |
| Sr. Scd. Notes | 11.50 | 7/1/14 | 1,875,000 | a | 2,029,688 |
| | | | | | 25,850,095 |
| Printing & Publishing—1.0% | | | | | |
| Cenveo, | | | | | |
| Sr. Scd. Notes | 8.88 | 2/1/18 | 8,120,000 | a | 7,835,800 |
| Cenveo, | | | | | |
| Gtd. Notes | 10.50 | 8/15/16 | 650,000 | a,c | 664,625 |
| | | | | | 8,500,425 |
12
| | | | | |
| | Coupon | Maturity | Principal | | |
| Bonds and Notes (continued) | Rate (%) | Date | Amount ($) | | Value ($) |
| Retail—2.7% | | | | | |
| Hillman Group, | | | | | |
| Gtd. Notes | 10.88 | 6/1/18 | 3,960,000 | c | 4,098,600 |
| Neiman Marcus Group, | | | | | |
| Gtd. Notes | 10.38 | 10/15/15 | 12,881,000 | a | 13,170,822 |
| QVC, | | | | | |
| Sr. Scd. Notes | 7.13 | 4/15/17 | 1,900,000 | c | 1,871,500 |
| QVC, | | | | | |
| Sr. Scd. Notes | 7.50 | 10/1/19 | 3,160,000 | c | 3,120,500 |
| Susser Holdings and Finance, | | | | | |
| Gtd. Notes | 8.50 | 5/15/16 | 1,050,000 | c | 1,055,250 |
| | | | | | 23,316,672 |
| Retail-Food & Drug—2.4% | | | | | |
| Rite Aid, | | | | | |
| Gtd. Notes | 9.50 | 6/15/17 | 8,625,000 | a | 6,878,438 |
| Rite Aid, | | | | | |
| Sr. Scd. Notes | 10.38 | 7/15/16 | 8,680,000 | a | 8,799,350 |
| Stater Brothers Holdings, | | | | | |
| Gtd. Notes | 7.75 | 4/15/15 | 4,695,000 | | 4,706,737 |
| | | | | | 20,384,525 |
| Services—3.5% | | | | | |
| Aramark, | | | | | |
| Gtd. Notes | 8.50 | 2/1/15 | 3,250,000 | | 3,298,750 |
| Dyncorp International, | | | | | |
| Sr. Unscd. Notes | 10.38 | 7/1/17 | 3,110,000 | c | 3,102,225 |
| Garda World Security, | | | | | |
| Sr. Unscd. Notes | 9.75 | 3/15/17 | 4,485,000 | c | 4,574,700 |
| General Maritime, | | | | | |
| Gtd. Notes | 12.00 | 11/15/17 | 8,200,000 | c | 8,405,000 |
| Marquette Transportation Finance, | | | | | |
| Sr. Scd. Notes | 10.88 | 1/15/17 | 6,565,000 | c | 6,466,525 |
| Navios Maritime Holdings, | | | | | |
| Sr. Scd. Notes | 8.88 | 11/1/17 | 2,005,000 | a,c | 2,030,063 |
| Ultrapetrol Bahamas, | | | | | |
| First Mortgage Notes | 9.00 | 11/24/14 | 1,817,000 | | 1,762,490 |
| WCA Waste, | | | | | |
| Gtd. Notes | 9.25 | 6/15/14 | 1,075,000 | | 1,079,031 |
| | | | | | 30,718,784 |
STATEMENT OF INVESTMENTS (Unaudited) (continued)
| | | | | |
| | Coupon | Maturity | Principal | | |
| Bonds and Notes (continued) | Rate (%) | Date | Amount ($) | | Value ($) |
| Technology—9.2% | | | | | |
| Alion Science and Technology, | | | | | |
| Sr. Scd. Notes | 12.00 | 11/1/14 | 1,393,015 | c | 1,399,980 |
| Ceridian, | | | | | |
| Gtd. Notes | 11.25 | 11/15/15 | 19,028,000 | d | 17,267,910 |
| Ceridian, | | | | | |
| Gtd. Notes | 12.25 | 11/15/15 | 16,461,490 | a | 14,897,648 |
| First Data, | | | | | |
| Gtd. Notes | 9.88 | 9/24/15 | 2,565,000 | | 1,936,575 |
| First Data, | | | | | |
| Gtd. Notes | 9.88 | 9/24/15 | 4,550,000 | a | 3,480,750 |
| Sorenson Communications, | | | | | |
| Sr. Scd. Notes | 10.50 | 2/1/15 | 21,725,000 | a,c | 13,795,375 |
| Sungard Data Systems, | | | | | |
| Gtd. Notes | 10.25 | 8/15/15 | 22,167,000 | a | 22,998,263 |
| Sungard Data Systems, | | | | | |
| Gtd. Notes | 10.63 | 5/15/15 | 3,460,000 | | 3,715,175 |
| | | | | | 79,491,676 |
| Telecommunications—13.8% | | | | | |
| Digicel Group, | | | | | |
| Sr. Unscd. Notes | 8.88 | 1/15/15 | 22,285,000 | c | 21,895,013 |
| Digicel Group, | | | | | |
| Sr. Unscd. Notes | 9.13 | 1/15/15 | 3,542,457 | c | 3,493,748 |
| Digicel Group, | | | | | |
| Sr. Notes | 10.50 | 4/15/18 | 1,408,000 | a,c | 1,459,040 |
| Digicel, | | | | | |
| Sr. Unscd. Notes | 12.00 | 4/1/14 | 1,700,000 | c | 1,908,250 |
| Intelsat Bermuda, | | | | | |
| Gtd. Notes | 11.25 | 2/4/17 | 26,575,000 | d | 27,040,062 |
| Intelsat Jackson Holdings, | | | | | |
| Gtd. Notes | 11.25 | 6/15/16 | 12,735,000 | | 13,626,450 |
| Telesat Canada, | | | | | |
| Sr. Unscd. Notes | 11.00 | 11/1/15 | 6,790,000 | | 7,367,150 |
| Telesat Canada, | | | | | |
| Sr. Sub. Notes | 12.50 | 11/1/17 | 2,415,000 | | 2,716,875 |
| Wind Acquisition Finance, | | | | | |
| Scd. Notes | 11.75 | 7/15/17 | 8,830,000 | c | 9,094,900 |
| Wind Acquisition Finance, | | | | | |
| Scd. Bonds | 12.00 | 12/1/15 | 1,100,000 | c,d | 1,144,000 |
14
| | | | | |
| | Coupon | Maturity | Principal | | |
| Bonds and Notes (continued) | Rate (%) | Date | Amount ($) | | Value ($) |
| Telecommunications (continued) | | | | | |
| Wind Acquisition Holdings, | | | | | |
| Sr. Scd. Notes | 12.25 | 7/15/17 | 32,115,000 | a,c | 29,385,225 |
| | | | | | 119,130,713 |
| Utilities—3.8% | | | | | |
| AES, | | | | | |
| Sr. Unscd. Notes | 8.00 | 10/15/17 | 5,325,000 | | 5,404,875 |
| AES, | | | | | |
| Sr. Unscd. Notes | 9.75 | 4/15/16 | 3,765,000 | c | 4,066,200 |
| Dynegy Holdings, | | | | | |
| Sr. Unscd. Notes | 8.38 | 5/1/16 | 5,235,000 | a | 4,168,369 |
| Energy Future Holdings, | | | | | |
| Gtd. Notes | 10.88 | 11/1/17 | 4,725,000 | a,d | 3,520,125 |
| North American | | | | | |
| Energy Alliance, | | | | | |
| Sr. Scd. Notes | 10.88 | 6/1/16 | 2,935,000 | c | 3,037,725 |
| NRG Energy, | | | | | |
| Gtd. Notes | 7.38 | 1/15/17 | 8,465,000 | | 8,401,513 |
| RRI Energy, | | | | | |
| Sr. Unscd. Notes | 7.63 | 6/15/14 | 4,165,000 | a | 4,123,350 |
| | | | | | 32,722,157 |
| Total Bonds and Notes | | | | | |
| (cost $819,174,854) | | | | | 829,161,559 |
| |
| Preferred Stocks—.1% | | | Shares | | Value ($) |
| Media | | | | | |
| Spanish Broadcasting System, | | | | | |
| Ser. B, Cum. $26.875 | | | | | |
| (cost $1,598,517) | | | 1,523 f | 1,065,752 |
| |
| Common Stocks—.3% | | | | | |
| Cable/Satellite TV—.2% | | | | | |
| Charter Communications, Cl. A | | | 55,002 g | 1,941,571 |
| Media—.1% | | | | | |
| LIN TV, Cl. A | | | 180,000 g | 973,800 |
| Total Common Stocks | | | | | |
| (cost $1,860,749) | | | | | 2,915,371 |
STATEMENT OF INVESTMENTS (Unaudited) (continued)
| | |
| Other Investment—2.1% | Shares | Value ($) |
| Registered Investment Company; | | |
| Dreyfus Institutional Preferred | | |
| Plus Money Market Fund | | |
| (cost $18,203,000) | 18,203,000 h | 18,203,000 |
| |
| Investment of Cash Collateral | | |
| for Securities Loaned—16.1% | | |
| Registered Investment Company; | | |
| Dreyfus Institutional Cash Advantage Fund | | |
| (cost $138,868,515) | 138,868,515 h | 138,868,515 |
| |
| Total Investments (cost $979,705,635) | 114.6% | 990,214,197 |
| Liabilities, Less Cash and Receivables | (14.6%) | (126,440,102) |
| Net Assets | 100.0% | 863,774,095 |
|
| a Security, or portion thereof, on loan. At June 30, 2010, the total market value of the fund’s securities on loan is |
| $131,403,757 and the total market value of the collateral held by the fund is $139,066,113, consisting of cash |
| collateral of $138,868,515 and U.S. Government and agencies securities valued at $197,598. |
| b Non-income producing—security in default. |
| c Securities exempt from registration under Rule 144A of the Securities Act of 1933.These securities may be resold in |
| transactions exempt from registration, normally to qualified institutional buyers. At June 30, 2010, these securities |
| had a total market value of $313,512,774 or 36.3% of net assets. |
| d Variable rate security—interest rate subject to periodic change. |
| e The valuation of this security has been determined in good faith by management under the direction of the Board of |
| Directors. At June 30, 2010, the value of this security amounted to $ 6,307,875 or 0.7% of net assets. |
| f Illiquid security.The valuation of this security has been determined in good faith by management under the direction of |
| the Board of Directors.At June 30, 2010, the value of this security amounted to $ 1,065,752 or 0.1% of net assets |
| g Non-income producing security. |
| h Investment in affiliated money market mutual fund. |
| | | |
| Portfolio Summary (Unaudited)† | | |
| |
| | Value (%) | | Value (%) |
| Corporate Bonds | 96.0 | Preferred Stocks | .1 |
| Money Market Investments | 18.2 | | |
| Common Stocks | .3 | | 114.6 |
| |
| † Based on net assets. | | | |
| See notes to financial statements. | | | |
16
|
| STATEMENT OF ASSETS AND LIABILITIES |
| June 30, 2010 (Unaudited) |
| | | | |
| | | | Cost | Value |
| Assets ($): | | | | |
| Investments in securities—See Statement of Investments (including | | |
| securities on loan, valued at $131,403,757)—Note 1(c): | | |
| Unaffiliated issuers | | | 822,634,120 | 833,142,682 |
| Affiliated issuers | | | 157,071,515 | 157,071,515 |
| Cash | | | | 164,108 |
| Cash denominated in foreign currencies | | 49 | 43 |
| Dividends and interest receivable | | | | 20,986,721 |
| Receivable for shares of Beneficial Interest subscribed | | 886,716 |
| Receivable for investment securities sold | | | 461,680 |
| | | | | 1,012,713,465 |
| Liabilities ($): | | | | |
| Due to The Dreyfus Corporation and affiliates—Note 3(b) | | 670,698 |
| Liability for securities on loan—Note 1(c) | | | 138,868,515 |
| Payable for investment securities purchased | | | 7,211,068 |
| Payable for shares of Beneficial Interest redeemed | | | 2,189,089 |
| | | | | 148,939,370 |
| Net Assets ($) | | | | 863,774,095 |
| Composition of Net Assets ($): | | | |
| Paid-in capital | | | | 1,148,572,335 |
| Accumulated distributions in excess of investment income—net | | (2,391,732) |
| Accumulated net realized gain (loss) on investments | | | (292,915,064) |
| Accumulated net unrealized appreciation (depreciation) | | |
| on investments and foreign currency transactions | | | 10,508,556 |
| Net Assets ($) | | | | 863,774,095 |
| |
| |
| Net Asset Value Per Share | | | |
| | Class A | Class B | Class C | Class I |
| Net Assets ($) | 323,195,607 | 13,574,191 | 118,924,478 | 408,079,819 |
| Shares Outstanding | 51,644,492 | 2,168,248 | 18,997,253 | 65,159,594 |
| Net Asset Value Per Share ($) | 6.26 | 6.26 | 6.26 | 6.26 |
| |
| See notes to financial statements. | | | | |
|
| STATEMENT OF OPERATIONS |
| Six Months Ended June 30, 2010 (Unaudited) |
| |
| Investment Income ($): | |
| Income: | |
| Interest | 46,171,105 |
| Income from securities lending—Note 1(c) | 339,634 |
| Dividends: | |
| Unaffiliated issuers | 40,917 |
| Affiliated issuers | 9,358 |
| Total Income | 46,561,014 |
| Expenses: | |
| Management fee—Note 3(a) | 3,137,119 |
| Distribution and service fees—Note 3(b) | 1,110,875 |
| Trustees’ fees—Note 3(a) | 34,994 |
| Loan commitment fees—Note 2 | 12,186 |
| Interest expense—Note 2 | 153 |
| Total Expenses | 4,295,327 |
| Less—Trustees’ fees reimbursed by the Manager—Note 3(a) | (34,994) |
| Net Expenses | 4,260,333 |
| Investment Income—Net | 42,300,681 |
| Realized and Unrealized Gain (Loss) on Investments—Note 4 ($): | |
| Net realized gain (loss) on investments and foreign currency transactions | 20,519,959 |
| Net realized gain (loss) on forward foreign currency exchange contracts | 31,046 |
| Net Realized Gain (Loss) | 20,551,005 |
| Net unrealized appreciation (depreciation) on | |
| investments and foreign currency transactions | (48,561,893) |
| Net unrealized appreciation (depreciation) on | |
| forward foreign currency exchange contracts | (2,968) |
| Net Unrealized Appreciation (Depreciation) | (48,564,861) |
| Net Realized and Unrealized Gain (Loss) on Investments | (28,013,856) |
| Net Increase in Net Assets Resulting from Operations | 14,286,825 |
| |
| See notes to financial statements. | |
18
STATEMENT OF CHANGES IN NET ASSETS
| | |
| | Six Months Ended | |
| | June 30, 2010 | Year Ended |
| | (Unaudited) | December 31, 2009 |
| Operations ($): | | |
| Investment income—net | 42,300,681 | 66,290,493 |
| Net realized gain (loss) on investments | 20,551,005 | (6,401,619) |
| Net unrealized appreciation | | |
| (depreciation) on investments | (48,564,861) | 181,196,172 |
| Net Increase (Decrease) in Net Assets | | |
| Resulting from Operations | 14,286,825 | 241,085,046 |
| Dividends to Shareholders from ($): | | |
| Investment income—net: | | |
| Class A Shares | (17,824,154) | (29,894,758) |
| Class B Shares | (852,786) | (2,849,188) |
| Class C Shares | (5,856,163) | (8,775,809) |
| Class I Shares | (21,580,635) | (27,846,038) |
| Total Dividends | (46,113,738) | (69,365,793) |
| Beneficial Interest Transactions ($): | | |
| Net proceeds from shares sold: | | |
| Class A Shares | 53,580,312 | 286,678,813 |
| Class B Shares | 239,602 | 1,476,907 |
| Class C Shares | 8,944,905 | 44,838,158 |
| Class I Shares | 89,129,488 | 232,223,371 |
| Net assets received in connection | | |
| with reorganization—Note 1 | — | 129,672,713 |
| Dividends reinvested: | | |
| Class A Shares | 14,451,212 | 22,562,646 |
| Class B Shares | 628,070 | 1,872,480 |
| Class C Shares | 3,596,200 | 5,010,735 |
| Class I Shares | 6,677,725 | 6,001,284 |
| Cost of shares redeemed: | | |
| Class A Shares | (93,793,847) | (198,188,481) |
| Class B Shares | (9,217,249) | (31,665,643) |
| Class C Shares | (14,973,961) | (19,316,179) |
| Class I Shares | (72,910,209) | (98,684,961) |
| Increase (Decrease) in Net Assets from | | |
| Beneficial Interest Transactions | (13,647,752) | 382,481,843 |
| Total Increase (Decrease) in Net Assets | (45,474,665) | 554,201,096 |
| Net Assets ($): | | |
| Beginning of Period | 909,248,760 | 355,047,664 |
| End of Period | 863,774,095 | 909,248,760 |
| Undistributed (distributions in excess of) | | |
| investment income—net | (2,391,732) | 1,421,325 |
STATEMENT OF CHANGES IN NET ASSETS (continued)
| | |
| Six Months Ended | |
| | June 30, 2010 | Year Ended |
| | (Unaudited) | December 31, 2009 |
| Capital Share Transactions: | | |
| Class Aa | | |
| Shares sold | 8,309,633 | 51,207,569 |
| Shares issued in connection with | | |
| reorganization—Note 1 | — | 10,690,947 |
| Shares issued for dividends reinvested | 2,251,800 | 3,780,546 |
| Shares redeemed | (14,600,823) | (33,630,114) |
| Net Increase (Decrease) in Shares Outstanding | (4,039,390) | 32,048,948 |
| Class Ba | | |
| Shares sold | 37,160 | 257,820 |
| Shares issued in connection with reorganization—Note 1 | — | 4,883,654 |
| Shares issued for dividends reinvested | 97,770 | 320,812 |
| Shares redeemed | (1,426,420) | (5,472,399) |
| Net Increase (Decrease) in Shares Outstanding | (1,291,490) | (10,113) |
| Class C | | |
| Shares sold | 1,384,553 | 7,842,855 |
| Shares issued in connection with reorganization—Note 1 | — | 7,195,044 |
| Shares issued for dividends reinvested | 560,613 | 837,067 |
| Shares redeemed | (2,339,028) | (3,270,669) |
| Net Increase (Decrease) in Shares Outstanding | (393,862) | 12,604,297 |
| Class I | | |
| Shares sold | 13,813,375 | 39,340,054 |
| Shares issued in connection with reorganization—Note 1 | — | 1,748,575 |
| Shares issued for dividends reinvested | 1,041,599 | 998,987 |
| Shares redeemed | (11,386,824) | (16,641,631) |
| Net Increase (Decrease) in Shares Outstanding | 3,468,150 | 25,445,985 |
|
| a During the period ended June 30, 2010, 483,540 Class B shares representing $3,129,888, were automatically |
| converted to 483,688 Class A shares and during the period ended December 31, 2009, 2,061,607 Class B shares |
| representing $12,009,537 were automatically converted to 2,063,045 Class A shares. |
See notes to financial statements.
20
FINANCIAL HIGHLIGHTS
The following tables describe the performance for each share class for the fiscal periods indicated.All information (except portfolio turnover rate) reflects financial results for a single fund share.Total return shows how much your investment in the fund would have increased (or decreased) during each period, assuming you had reinvested all dividends and distributions.These figures have been derived from the fund’s financial statements.
| | | | | | |
| Six Months Ended | | | | | |
| June 30, 2010 | | Year Ended December 31, | |
| Class A Shares | (Unaudited) | 2009 | 2008 | 2007 | 2006 | 2005 |
| Per Share Data ($): | | | | | | |
| Net asset value, | | | | | | |
| beginning of period | 6.48 | 5.06 | 6.92 | 7.33 | 7.24 | 7.65 |
| Investment Operations: | | | | | | |
| Investment income—neta | .30 | .54 | .50 | .49 | .49 | .51 |
| Net realized and unrealized | | | | | | |
| gain (loss) on investments | (.19) | 1.43 | (1.82) | (.37) | .14 | (.36) |
| Total from Investment Operations | .11 | 1.97 | (1.32) | .12 | .63 | .15 |
| Distributions: | | | | | | |
| Dividends from | | | | | | |
| investment income—net | (.33) | (.55) | (.54) | (.53) | (.54) | (.56) |
| Net asset value, end of period | 6.26 | 6.48 | 5.06 | 6.92 | 7.33 | 7.24 |
| Total Return (%)b | 1.66c | 40.43 | (20.17) | 2.03 | 8.66 | 2.22 |
| Ratios/Supplemental Data (%): | | | | | | |
| Ratio of total expenses | | | | | | |
| to average net assets | .96d | .96 | .96 | .96 | .95 | .95 |
| Ratio of net expenses | | | | | | |
| to average net assets | .95d | .95 | .95 | .95 | .95 | .95 |
| Ratio of net investment income | | | | | | |
| to average net assets | 9.41d | 8.86 | 7.89 | 6.78 | 6.76 | 6.93 |
| Portfolio Turnover Rate | 39.19c | 77.94 | 48.85 | 50.65 | 29.98 | 40.57 |
| Net Assets, end of period | | | | | | |
| ($ x 1,000) | 323,196 | 360,921 | 119,560 | 169,453 | 202,098 | 236,421 |
| |
| a | Based on average shares outstanding at each month end. |
| b | Exclusive of sales charge. |
| c | Not annualized. |
| d | Annualized. |
See notes to financial statements.
FINANCIAL HIGHLIGHTS (continued)
| | | | | | |
| Six Months Ended | | | | | |
| June 30, 2010 | | Year Ended December 31, | |
| Class B Shares | (Unaudited) | 2009 | 2008 | 2007 | 2006 | 2005 |
| Per Share Data ($): | | | | | | |
| Net asset value, | | | | | | |
| beginning of period | 6.48 | 5.06 | 6.93 | 7.34 | 7.24 | 7.65 |
| Investment Operations: | | | | | | |
| Investment income—neta | .27 | .49 | .46 | .45 | .45 | .46 |
| Net realized and unrealized | | | | | | |
| gain (loss) on investments | (.18) | 1.45 | (1.82) | (.37) | .16 | (.35) |
| Total from Investment Operations | .09 | 1.94 | (1.36) | .08 | .61 | .11 |
| Distributions: | | | | | | |
| Dividends from | | | | | | |
| investment income—net | (.31) | (.52) | (.51) | (.49) | (.51) | (.52) |
| Net asset value, end of period | 6.26 | 6.48 | 5.06 | 6.93 | 7.34 | 7.24 |
| Total Return (%)b | 1.41c | 39.78 | (20.69) | 1.53 | 8.12 | 1.73 |
| Ratios/Supplemental Data (%): | | | | | | |
| Ratio of total expenses | | | | | | |
| to average net assets | 1.46d | 1.46 | 1.46 | 1.46 | 1.45 | 1.45 |
| Ratio of net expenses | | | | | | |
| to average net assets | 1.45d | 1.45 | 1.45 | 1.45 | 1.45 | 1.45 |
| Ratio of net investment income | | | | | | |
| to average net assets | 8.61d | 8.35 | 7.31 | 6.24 | 6.25 | 6.36 |
| Portfolio Turnover Rate | 39.19c | 77.94 | 48.85 | 50.65 | 29.98 | 40.57 |
| Net Assets, end of period | | | | | | |
| ($ x 1,000) | 13,574 | 22,434 | 17,568 | 39,892 | 67,834 | 96,334 |
| |
| a | Based on average shares outstanding at each month end. |
| b | Exclusive of sales charge. |
| c | Not annualized. |
| d | Annualized. |
See notes to financial statements.
22
| | | | | | |
| Six Months Ended | | | | | |
| June 30, 2010 | | Year Ended December 31, | |
| Class C Shares | (Unaudited) | 2009 | 2008 | 2007 | 2006 | 2005 |
| Per Share Data ($): | | | | | | |
| Net asset value, | | | | | | |
| beginning of period | 6.48 | 5.06 | 6.93 | 7.34 | 7.24 | 7.65 |
| Investment Operations: | | | | | | |
| Investment income—neta | .28 | .50 | .45 | .43 | .43 | .45 |
| Net realized and unrealized | | | | | | |
| gain (loss) on investments | (.20) | 1.42 | (1.83) | (.36) | .16 | (.36) |
| Total from Investment Operations | .08 | 1.92 | (1.38) | .07 | .59 | .09 |
| Distributions: | | | | | | |
| Dividends from | | | | | | |
| investment income—net | (.30) | (.50) | (.49) | (.48) | (.49) | (.50) |
| Net asset value, end of period | 6.26 | 6.48 | 5.06 | 6.93 | 7.34 | 7.24 |
| Total Return (%)b | 1.28c | 39.41 | (20.89) | 1.28 | 7.85 | 1.48 |
| Ratios/Supplemental Data (%): | | | | | | |
| Ratio of total expenses | | | | | | |
| to average net assets | 1.71d | 1.71 | 1.71 | 1.71 | 1.70 | 1.70 |
| Ratio of net expenses | | | | | | |
| to average net assets | 1.70d | 1.70 | 1.70 | 1.70 | 1.70 | 1.70 |
| Ratio of net investment income | | | | | | |
| to average net assets | 8.70d | 8.15 | 7.12 | 6.02 | 6.01 | 6.14 |
| Portfolio Turnover Rate | 39.19c | 77.94 | 48.85 | 50.65 | 29.98 | 40.57 |
| Net Assets, end of period | | | | | | |
| ($ x 1,000) | 118,924 | 125,724 | 34,374 | 53,294 | 65,728 | 74,770 |
| |
| a | Based on average shares outstanding at each month end. |
| b | Exclusive of sales charge. |
| c | Not annualized. |
| d | Annualized. |
See notes to financial statements.
FINANCIAL HIGHLIGHTS (continued)
| | | | | | |
| Six Months Ended | | | | | |
| June 30, 2010 | | Year Ended December 31, | |
| Class I Shares | (Unaudited) | 2009 | 2008 | 2007a | 2006 | 2005 |
| Per Share Data ($): | | | | | | |
| Net asset value, | | | | | | |
| beginning of period | 6.49 | 5.06 | 6.92 | 7.33 | 7.24 | 7.65 |
| Investment Operations: | | | | | | |
| Investment income—netb | .31 | .54 | .51 | .52 | .51 | .53 |
| Net realized and unrealized | | | | | | |
| gain (loss) on investments | (.20) | 1.45 | (1.82) | (.38) | .14 | (.36) |
| Total from Investment Operations | .11 | 1.99 | (1.31) | .14 | .65 | .17 |
| Distributions: | | | | | | |
| Dividends from | | | | | | |
| investment income—net | (.34) | (.56) | (.55) | (.55) | (.56) | (.58) |
| Net asset value, end of period | 6.26 | 6.49 | 5.06 | 6.92 | 7.33 | 7.24 |
| Total Return (%) | 1.63c | 40.99 | (20.06) | 2.29 | 8.92 | 2.34 |
| Ratios/Supplemental Data (%): | | | | | | |
| Ratio of total expenses | | | | | | |
| to average net assets | .71d | .71 | .72 | .71 | .70 | .70 |
| Ratio of net expenses | | | | | | |
| to average net assets | .70d | .70 | .69 | .70 | .70 | .70 |
| Ratio of net investment income | | | | | | |
| to average net assets | 9.72d | 9.20 | 9.43 | 7.01 | 7.01 | 7.18 |
| Portfolio Turnover Rate | 39.19c | 77.94 | 48.85 | 50.65 | 29.98 | 40.57 |
| Net Assets, end of period | | | | | | |
| ($ x 1,000) | 408,080 | 400,170 | 183,546 | 17,368 | 18,059 | 18,595 |
| |
| a | Effective June 1, 2007, Class R shares were redesignated as Class I shares. |
| b | Based on average shares outstanding at each month end. |
| c | Not annualized. |
| d | Annualized. |
See notes to financial statements.
24
NOTES TO FINANCIAL STATEMENTS (Unaudited)
NOTE 1—Significant Accounting Policies:
Dreyfus High Yield Fund (the “fund”) is a separate diversified series of The Dreyfus/Laurel FundsTrust (the “Trust”), which is registered under the Investment Company Act of 1940, as amended (the “Act”), as an open-end management investment company and operates as a series company currently offering seven series, including the fund.The fund’s investment objective seeks to maximize total return, consisting of capital appreciation and current income.The Dreyfus Corporation (the “Manager” or “Dreyfus”), a wholly-owned subsidiary of The Bank of New York Mellon Corporation (“BNY Mellon”), serves as the fund’s investment adviser.
As of the close of business on January 8, 2009, pursuant to an Agreement and Plan of Reorganization previously approved by the fund’s Board of Trustees,all of the assets,subject to the liabilities,of Dreyfus High Income Fund (“High Income”) were transferred to the fund in exchange for corresponding class of shares of Beneficial Interest of the fund of equal value. The purpose of the transaction was to combine two funds with comparable investment objectives and strategies. Shareholders of Class A, Class B,Class C and Class I shares of High Income received Class A,Class B, Class C and Class I shares of the fund, respectively, in each case in an amount equal to the aggregate net asset value of their investment in High Income at the time of the exchange.The exchange ratio for Class A,Class B, Class C and Class I shares are 1.96, 1.96, 1.95 and 1.96, respectively. The net asset value of the fund’s shares on the c lose of business January 8, 2009, after the reorganization was $5.29 for Class A, $5.29 for Class B, $5.29 for Class C and $5.29 for Class I shares, and a total of 10,690,947 Class A shares, 4,883,654 Class B shares, 7,195,044 Class C shares and 1,748,575 Class I shares were issued to shareholders of High Income in the exchange. The exchange was a tax-free event to the High Income shareholders. For financial reporting purposes, assets received and shares issued by the fund were recorded at fair value; however, the cost basis of investments received from High Income was carried forward to align ongoing reporting of the fund’s realized and unrealized gains and losses with amounts distributable to shareholders for tax purposes.
NOTES TO FINANCIAL STATEMENTS (Unaudited) (continued)
The net assets and net unrealized (depreciation) immediately before the acquisition were as follows:
| | |
| | Unrealized | |
| | (Depreciation) ($) | Net Assets ($) |
| Dreyfus High Income Fund— | | |
| Target Fund | (23,749,040) | 129,672,713 |
| Dreyfus High Yield Fund— | | |
| Acquiring Fund | (81,332,832) | 382,765,045 |
| Total | (105,081,872) | 512,437,758 |
MBSC Securities Corporation (the “Distributor”), a wholly-owned subsidiary of the Manager, is the distributor of the fund’s shares. The fund is authorized to issue an unlimited number of shares of Beneficial Interest in each of the following classes of shares: Class A, Class B, Class C and Class I. Class A, Class B and Class C shares are sold primarily to retail investors through financial intermediaries and bear a distribution fee and/or shareholder services fee. Class A shares are sold with a front-end sales charge, while Class B and Class C shares are subject to a contingent deferred sales charge (“CDSC”). Class B shares automatically convert to Class A shares after six years.The fund does not offer Class B shares, except in connection with dividend reinvestment and permitted exchanges of Class B shares. Class I shares are sold primarily to bank trust departments and other financial service providers (including The Bank of New York Mellon, a subsidiary of BNY Mellon and an affiliate of Dreyfus), acting on behalf of customers having a qualified trust or investment account or relationship at such institution, and bear no distribution or services fees. Class I shares are offered without a front-end sales charge or CDSC. Other differences between the classes include the services offered to and the expenses borne by each class and the allocation of certain transfer agency costs and certain voting rights. Income, expenses (other than expenses attributable to a specific class), and realized and unrealized gains or losses on investments are allocated to each class of shares based on its relative net assets.
The Trust accounts separately for the assets, liabilities and operations of each series. Expenses directly attributable to each series are charged to that series’ operations; expenses which are applicable to all series are allocated among them on a pro rata basis.
26
The Financial Accounting Standards Board (“FASB”) Accounting Standards Codification (“ASC”) is the exclusive reference of authoritative U.S. generally accepted accounting principles (“GAAP”) recognized by the FASB to be applied by nongovernmental entities.Rules and interpretive releases of the Securities and Exchange Commission (“SEC”) under authority of federal laws are also sources of authoritative GAAP for SEC registrants. The fund’s financial statements are prepared in accordance with GAAP, which may require the use of management estimates and assumptions.Actual results could differ from those estimates.
(a) Portfolio valuation: Investments in securities excluding short-term investments (other than U.S.Treasury Bills), and forward foreign currency exchange contracts (“forward contracts”) are valued each business day by an independent pricing service (the “Service”) approved by the Board of Trustees. Investments for which quoted bid prices are readily available and are representative of the bid side of the market in the judgment of the Service are valued at the mean between the quoted bid prices (as obtained by the Service from dealers in such securities) and asked prices (as calculated by the Service based upon its evaluation of the market for such securities). Other investments (which constitute a majority of the portfolio securities) are valued as determined by the Service, based on methods which include consideration of: yields o r prices of securities of comparable quality, coupon, maturity and type; indications as to values from dealers; and general market conditions. Restricted securities, as well as securities or other assets for which recent market quotations are not readily available and are not valued by a pricing service approved by the Board of Trustees, or are determined by the fund not to reflect accurately fair value, are valued at fair value as determined in good faith under the direction of the Board of Trustees. The factors that may be considered when fair valuing a security include fundamental analytical data, the nature and duration of restrictions on disposition, an evaluation of the forces that influence the market in which the securities are purchased and sold and public trading in similar securities of the issuer or comparable issuers. Short-term investments, excluding U.S.Treasury Bills, are car-
NOTES TO FINANCIAL STATEMENTS (Unaudited) (continued)
ried at amortized cost, which approximates value. Registered investment companies that are not traded on an exchange are valued at their net asset value. Investments in equity securities are valued at the last sales price on the securities exchange or national securities market on which such securities are primarily traded. Investments denominated in foreign currencies are translated to U.S. dollars at the prevailing rates of exchange. Forward contracts are valued at the forward rate.
The fair value of a financial instrument is the amount that would be received to sell an asset or paid to transfer a liability in an orderly transaction between market participants at the measurement date (i.e. the exit price). GAAP establishes a fair value hierarchy that prioritizes the inputs of valuation techniques used to measure fair value.This hierarchy gives the highest priority to unadjusted quoted prices in active markets for identical assets or liabilities (Level 1 measurements) and the lowest priority to unobservable inputs (Level 3 measurements).
Additionally, GAAP provides guidance on determining whether the volume and activity in a market has decreased significantly and whether such a decrease in activity results in transactions that are not orderly. GAAP requires enhanced disclosures around valuation inputs and techniques used during annual and interim periods.
Various inputs are used in determining the value of the fund’s investments relating to fair value measurements.These inputs are summarized in the three broad levels listed below:
Level 1—unadjusted quoted prices in active markets for
identical investments.
Level 2—other significant observable inputs (including quoted
prices for similar investments, interest rates, prepayment speeds,
credit risk, etc.).
Level 3—significant unobservable inputs (including the fund’s own
assumptions in determining the fair value of investments).
The inputs or methodology used for valuing securities are not necessarily an indication of the risk associated with investing in those securities.
28
The following is a summary of the inputs used as of June 30, 2010 in valuing the fund’s investments:
| | | | |
| | | Level 2—Other | Level 3— | |
| | Level 1— | Significant | Significant | |
| | Unadjusted | Observable | Unobservable | |
| | Quoted Prices | Inputs | Inputs | Total |
| Assets ($) | | | | |
| Investments in Securities: | | | |
| Corporate Bonds† | — | 829,161,559 | — | 829,161,559 |
| Equity Securities— | | | | |
| Domestic† | 2,915,371 | — | 1,065,752 | 3,981,123 |
| Mutual Funds | 157,071,515 | — | — | 157,071,515 |
| † See Statement of Investments for industry classification. | | |
The following is a reconciliation of Level 3 assets for which significant unobservable inputs were used to determine fair value:
| |
| | Investments in |
| | Preferred Stock ($) |
| Balance as of 12/31/2009 | 1,523 |
| Realized gain (loss) | — |
| Change in unrealized appreciation (depreciation) | 1,064,229 |
| Net purchases (sales) | — |
| Transfers in and/or out of Level 3 | — |
| Balance as of 6/30/2010 | 1,065,752 |
In January 2010, FASB issued Accounting Standards Update (“ASU”) No. 2010-06 “Improving Disclosures about FairValue Measurements”. The portions of ASU No. 2010-06 which require reporting entities to prepare new disclosures surrounding amounts and reasons for significant transfers in and out of Level 1 and Level 2 fair value measurements as well as inputs and valuation techniques used to measure fair value for both recurring and nonrecurring fair value measurements that fall in either Level 2 or Level 3 have been adopted by the fund.The remaining portion of ASU No. 2010-06 requires reporting entities to make new disclosures about information on purchases, sales, issuances and settlements on a gross basis in the reconciliation of activity in Level 3
NOTES TO FINANCIAL STATEMENTS (Unaudited) (continued)
fair value measurements.These new and revised disclosures are required to be implemented for fiscal years beginning after December 15, 2010. Management is currently evaluating the impact that the adoption of this remaining portion of ASU No. 2010-06 may have on the fund’s financial statement disclosures.
(b) Foreign currency transactions: The fund does not isolate that portion of the results of operations resulting from changes in foreign exchange rates on investments from the fluctuations arising from changes in the market prices of securities held. Such fluctuations are included with the net realized and unrealized gain or loss on investments.
Net realized foreign exchange gains or losses arise from sales of foreign currencies, currency gains or losses realized on securities transactions between trade and settlement date, and the difference between the amounts of dividends, interest and foreign withholding taxes recorded on the fund’s books and the U.S. dollar equivalent of the amounts actually received or paid. Net unrealized foreign exchange gains and losses arise from changes in the value of assets and liabilities other than investments resulting from changes in exchange rates. Foreign currency gains and losses on investments are included with net realized and unrealized gain or loss on investments.
(c) Securities transactions and investment income: Securities transactions are recorded on a trade date basis. Realized gains and losses from securities transactions are recorded on the identified cost basis. Dividend income is recognized on the ex-dividend date and interest income, including, where applicable, accretion of discount and amortization of premium on investments, is recognized on the accrual basis.
Pursuant to a securities lending agreement withThe Bank of NewYork Mellon, the fund may lend securities to qualified institutions. It is the fund’s policy that, at origination, all loans are secured by collateral of at least 102% of the value of U.S. securities loaned and 105% of the value of foreign securities loaned. Collateral equivalent to at least 100% of the market value of securities on loan is maintained at all times. Collateral
30
is either in the form of cash, which can be invested in certain money market mutual funds managed by the Manager, U.S. Government and Agency securities or letters of credit.The fund is entitled to receive all income on securities loaned, in addition to income earned as a result of the lending transaction.Although each security loaned is fully collateralized, the fund bears the risk of delay in recovery of, or loss of rights in, the securities loaned should a borrower fail to return the securities in a timely manner. During the period ended June 30, 2010,The Bank of New York Mellon earned $182,880 from lending portfolio securities, pursuant to the securities lending agreement.
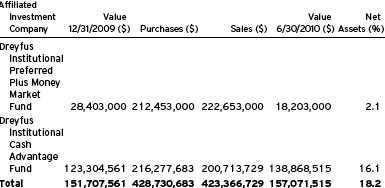
(d) Affiliated issuers: Investments in other investment companies advised by Dreyfus are defined as “affiliated” in the Act.
The fund may invest in shares of certain affiliated investment companies also advised or managed by Dreyfus. Investments in affiliated investment companies for the period ended June 30, 2010 were as follows:
(e) Concentration of Risk: The fund invests primarily in debt securities. Failure of an issuer of the debt securities to make timely interest or principal payments, or a decline or the perception of a decline in the credit quality of a debt security, can cause the debt security’s price to fall, potentially lowering the fund’s share price. High yield (“junk”)
NOTES TO FINANCIAL STATEMENTS (Unaudited) (continued)
bonds involve greater credit risk, including the risk of default, than investment grade bonds, and are considered predominantly speculative with respect to the issuer’s continuing ability to make principal and interest payments. In addition, the value of debt securities may decline due to general market conditions that are not specifically related to a particular company, such as real or perceived adverse economic conditions, changes in outlook for corporate earnings, changes in interest or currency rates or adverse investor sentiment. They may also decline because of factors that affect a particular industry.
(f) Dividends to shareholders: It is the policy of the fund to declare dividends daily from investment income-net. Such dividends are paid monthly. Dividends from net realized capital gains, if any, are normally declared and paid annually, but the fund may make distributions on a more frequent basis to comply with the distribution requirements of the Internal Revenue Code of 1986, as amended (the “Code”).To the extent that net realized capital gains can be offset by capital loss carryovers, it is the policy of the fund not to distribute such gains. Income and capital gain distributions are determined in accordance with income tax regulations, which may differ from GAAP.
(g) Federal income taxes: It is the policy of the fund to continue to qualify as a regulated investment company, if such qualification is in the best interests of its shareholders, by complying with the applicable provisions of the Code, and to make distributions of taxable income sufficient to relieve it from substantially all federal income and excise taxes.
As of and during the period ended June 30, 2010, the fund did not have any liabilities for any uncertain tax positions.The fund recognizes interest and penalties, if any, related to uncertain tax positions as income tax expense in the Statement of Operations. During the period, the fund did not incur any interest or penalties.
Each of the tax years in the three-year period ended December 31, 2009 remains subject to examination by the Internal Revenue Service and state taxing authorities.
32
The fund has an unused capital loss carryover of $309,880,382 available for federal income tax purposes to be applied against future net securities profits, if any, realized subsequent to December 31, 2009. If not applied, $138,776,715 of the carryover expires in fiscal 2010, $72,493,638 expires in fiscal 2011, $1,917,623 expires in fiscal 2012, $11,766,163 expires in fiscal 2013, $2,406,483 expires in fiscal 2014, $16,497,195 expires in fiscal 2015, $42,229,566 expires in fiscal 2016 and $23,792,999 expires in fiscal 2017. Based on certain provisions in the Code, various limitations regarding the future utilization of these carryforwards, brought forward as a result of the fund’s merger with the following funds may apply: HighYield Total Fund, BNY Hamilton High Yield Fund and Dreyfus High Income Fund. It is possible that the fund will not be able to utilize most of its capital loss carryover prior to its expiration date.
The tax character of distributions paid to shareholders during the fiscal year ended December 31, 2009 was as follows: ordinary income $69,365,793. The tax character of current year distributions will be determined at the end of the current fiscal year.
NOTE 2—Bank Lines of Credit:
The fund participates with other Dreyfus-managed funds in a $225 million unsecured credit facility led by Citibank, N.A. and a $300 million unsecured credit facility provided by The Bank of New York Mellon (each, a “Facility”), each to be utilized primarily for temporary or emergency purposes, including the financing of redemptions. In connection therewith, the fund has agreed to pay its pro rata portion of commitment fees for each Facility. Interest is charged to the fund based on rates determined pursuant to the terms of the respective Facility at the time of borrowing.
The average amount of borrowings outstanding under the Facilities during the period ended June 30, 2010, was approximately $22,200 with a related weighted average annualized interest rate of 1.40%.
NOTES TO FINANCIAL STATEMENTS (Unaudited) (continued)
NOTE 3—Investment Management Fee and Other Transactions with Affiliates:
(a) Pursuant to an investment management agreement with the Manager, the Manager provides or arranges for one or more third parties and/or affiliates to provide investment advisory, administrative, custody, fund accounting and transfer agency services to the fund. The Manager also directs the investments of the fund in accordance with its investment objective, policies and limitations. For these services, the fund is contractually obligated to pay the Manager a fee, calculated daily and paid monthly, at the annual rate of .70% of the value of the fund’s average daily net assets. Out of its fee, the Manager pays all of the expenses of the fund except brokerage fees, taxes, interest, commitment fees, Rule 12b-1 distribution fees and expenses, shareholder service fees, fees and expenses of non-interested Trustees (including counsel fees) and extraord inary expenses. In addition, the Manager is required to reduce its fee in an amount equal to the fund’s allocable portion of fees and expenses of the non-interested Trustees (including counsel fees). Effective January 1, 2010, each Trustee who is not an “interested person” of the Trust (as defined in the Act) received $60,000 per annum, plus $7,000 per joint Board meeting of the Trust, The Dreyfus/Laurel Funds, Inc., The Dreyfus/Laurel Tax-Free Municipal Funds, Dreyfus Investment Funds and Dreyfus Funds, Inc. (collectively, the “Board Group Open-end Funds”) attended, $2,500 for separate in-person committee meetings attended which are not held in conjunction with a regularly scheduled Board meeting and $2,000 for Board meetings and separate committee meetings attended that are conducted by telephone.The Board Group Open-end Funds also reimburse each Trustee who is not an “interested person” of the Trust (as defined in the Act) for travel and out-of-pocket expenses.With respe ct to Board meetings, the Chairman of the Board receives an additional 25% of such compensation (with the exception of reimbursable amounts). Effective January 1, 2010, the Chair of each of the Board’s committees, unless the Chair also serves as Chair of the Board, receives $1,350 per applicable committee meeting. In the event that there is an in-person joint committee meeting or a joint telephone
34
meeting of the Board Group Open-end Funds and Dreyfus HighYield Strategies Fund, the $2,500 or $2,000 fee, as applicable, is allocated between the Board Group Open-end Funds and Dreyfus High Yield Strategies Fund. The Trust’s portion of these fees and expenses are charged and allocated to each series based on net assets. Amounts required to be paid by the Trust directly to the non-interested Trustees, that would be applied to offset a portion of the management fee payable to the Manager, are in fact paid directly by the Manager to the non-interested Trustees.
The Manager has contractually agreed, until September 30, 2010, to waive receipt of its fees and/or assume the expenses of Class I shares of the fund so that the annual operating expenses (excluding taxes, interest, brokerage commissions, commitment fees on borrowings and extraordinary expenses) do not exceed .81% of the value of the fund’s average daily net assets. No expense reimbursement was required pursuant to the agreement for the period ended June 30, 2010.
During the period ended June 30, 2010, the Distributor retained $15,460 from commissions earned on sales of the fund’s Class A shares and $12,387 and $15,344 from CDSCs on redemptions of the fund’s Class B and Class C shares, respectively.
(b) Under separate Distribution Plans (the “Plans”) adopted pursuant to Rule 12b-1 under the Act, Class A shares pay annually up to .25% of the value of the average daily net assets to compensate the Distributor for shareholder servicing activities and expenses primarily intended to result in the sale of Class A shares. Class B and Class C shares pay the Distributor for distributing their shares at an aggregate annual rate of .50% and .75% of the value of the average daily net assets of Class B and Class C shares, respectively. Class B and Class C shares are also subject to a Service Plan adopted pursuant to Rule 12b-1 (the “Service Plan”), under which Class B and Class C shares pay the Distributor for providing certain services to the holders of their shares a fee at the annual rate of .25% of the value of the average daily net ass ets of Class B and Class
NOTES TO FINANCIAL STATEMENTS (Unaudited) (continued)
C shares. During the period ended June 30, 2010, Class A, Class B and Class C shares were charged $432,590, $43,280 and $460,024, respectively, pursuant to their respective Plans. During the period ended June 30, 2010, Class B and Class C shares were charged $21,640 and $153,341, respectively, pursuant to the Service Plan.
Under its terms, the Plans and Service Plan shall remain in effect from year to year, provided such continuance is approved annually by a vote of a majority of those Trustees who are not “interested persons” of the Trust and who have no direct or indirect financial interest in the operation of or in any agreement related to the Plans or Service Plan.
The components of “Due to The Dreyfus Corporation and affiliates” in the Statement of Assets and Liabilities consist of: management fees $497,592, Rule 12b-1 distribution plan fees $145,806 and service plan fees $27,300.
NOTE 4—Securities Transactions:
The aggregate amount of purchases and sales (including paydowns) of investment securities, excluding short-term securities and forward contracts, during the period ended June 30, 2010, amounted to $342,005,063 and $352,281,597, respectively.
The provisions of ASC Topic 815 “Derivatives and Hedging” require qualitative disclosures about objectives and strategies for using derivatives, quantitative disclosures about fair value amounts of gains and losses on derivative instruments and disclosures about credit-risk-related contingent features in derivative agreements. The disclosure requirements distinguish between derivatives, which are accounted for as “hedges” and those that do not qualify for hedge accounting. Because investment companies value their derivatives at fair value and recognize changes in fair value through the Statement of Operations, they do not qualify for such accounting. Accordingly, even though a fund’s investments in derivatives may represent economic hedges, they are considered to be non-hedge transactions for purposes of this disclosure.
36
Forward Foreign Currency Exchange Contracts: The fund enters into forward contracts in order to hedge its exposure to changes in foreign currency exchange rates on its foreign portfolio holdings, to settle foreign currency transactions or as a part of its investment strategy. When executing forward contracts, the fund is obligated to buy or sell a foreign currency at a specified rate on a certain date in the future. With respect to sales of forward contracts, the fund incurs a loss if the value of the contract increases between the date the forward contract is opened and the date the forward contract is closed.The fund realizes a gain if the value of the contract decreases between those dates. With respect to purchases of forward contracts, the fund incurs a loss if the value of the contract decreases between the date the forward contract is opened and the date the forward contract is closed.The fund realizes a gain if the value of the contract increases between those dates. Any realized gain or loss which occurred during the period is reflected in the Statement of Operations.The fund is exposed to foreign currency risk as a result of changes in value of underlying financial instruments. The fund is also exposed to credit risk associated with counterparty nonperformance on these forward contracts, which is typically limited to the unrealized gain on each open contract. At June 30, 2010, there were no forward contracts outstanding.
At June 30, 2010, accumulated net unrealized appreciation on investments was $10,508,562, consisting of $34,449,722 gross unrealized appreciation and $23,941,160 gross unrealized depreciation.
At June 30, 2010, the cost of investments for federal income tax purposes was substantially the same as the cost for financial reporting purposes (see the Statement of Investments).
|
| INFORMATION ABOUT THE REVIEW AND |
| APPROVAL OF THE FUND’S INVESTMENT |
| MANAGEMENT AGREEMENT (Unaudited) |
At a meeting of the fund’s Board of Trustees held on February 9, 2010, the Board considered the re-approval of the fund’s Investment Management Agreement (“Management Agreement”), pursuant to which the Manager provides the fund with investment advisory and administrative services. The Board members, none of whom are “interested persons” (as defined in the Investment Company Act of 1940, as amended) of the fund, were assisted in their review by independent legal counsel and met with counsel in executive session separate from representatives of the Manager.
Analysis of Nature, Extent and Quality of Services Provided to the Fund.The Board members considered information previously provided to them in a presentation from representatives of the Manager regarding services provided to the fund and other funds in the Dreyfus fund complex, and representatives of the Manager confirmed that there had been no material changes in this information.The Board also discussed the nature, extent and quality of the services provided to the fund pursuant to its Management Agreement. The Manager’s representatives reviewed the fund’s distribution of accounts and the relationships the Manager has with various intermediaries and the different needs of each.The Manager’s representatives noted the distribution channels for the fund, as well as the diversity of distribution among the funds in the Dreyfus fund complex, and the Manager’s corresponding need for broad, deep, and diverse resources to be able to provide ongoing shareholder services to each distribution channel, including those of the fund.The Manager also provided the number of shareholder accounts in the fund, as well as the fund’s asset size.
The Board members also considered the Manager’s research and portfolio management capabilities and that the Manager also provides oversight of day-to-day fund operations, including fund accounting and administration and assistance in meeting legal and regulatory requirements.The Board members also considered the Manager’s extensive administrative, accounting and compliance infrastructure. The Board also considered the Manager’s brokerage policies and practices and the standards applied in seeking best execution.
38
Comparative Analysis of the Fund’s Performance and Management Fee and Expense Ratio. The Board members reviewed the fund’s performance and comparisons to a group of retail front-end load, high current yield funds (the “Performance Group”) and to a larger universe of funds, consisting of all retail and institutional high current yield funds (the “Performance Universe”) selected and provided by Lipper, Inc., an independent provider of investment company data.The Board was provided with a description of the methodology Lipper used to select the Performance Group and Performance Universe, as well as the Expense Group and Expense Universe (discussed below). The Board members discussed the results of the comparisons and noted that the fund’s yield performance for the past ten one-year periods ended December 31st (2000-2009) was at o r above the Performance Group median (except for the one-year periods ended December 31, 2001 and 2008 when the fund’s yield performance was below the Performance Group median) and above the Performance Universe median for each period. The Board members noted that the fund’s total return performance was above the respective Performance Group and Performance Universe medians for various periods ended December 31, 2009 (except for the one- and ten-year periods ended December 31, 2009 when the fund’s total return performance was below the respective Performance Group and Performance Universe medians). The Manager also provided a comparison of the fund’s calendar year total returns to the returns of the fund’s benchmark index.
The Board members also discussed the fund’s contractual and actual management fees and expense ratio and reviewed the range of management fees and expense ratios of a comparable group of funds (the “Expense Group”) and a broader group of funds (the “Expense Universe”), each selected and provided by Lipper. Noting that the fund was the only fund in the Expense Group with a “unitary fee structure”, the Board members noted that the fund’s contractual management fee was above the Expense Group median, the fund’s actual
|
| INFORMATION ABOUT THE REVIEW AND APPROVAL OF THE FUND’S |
| INVESTMENT MANAGEMENT AGREEMENT (Unaudited) (continued) |
management fee was above the Expense Group and Expense Universe medians and the fund’s expense ratio was below the Expense Group and Expense Universe medians.
Representatives of the Manager noted that there were no other funds managed by the Manager or its affiliates with similar investment objectives, policies and strategies, and included in the same Lipper category as the fund. Representatives of the Manager reviewed with the Board members the fees paid by the Manager or its affiliates by other accounts managed by the Manager or its affiliates with similar investment objectives, policies and strategies as the fund (the “Similar Accounts”). The Manager’s representatives explained the nature of the Similar Accounts and the differences, from the Manager’s perspective, in providing services to such Similar Accounts as compared to managing and providing services to the fund. The Board analyzed differences in fees paid to the Manager and discussed the relationship of the fees paid in light of the services provided, noting the fund’s “unitary fee” struct ure. The Board members considered the relevance of the fee information provided for the Similar Accounts to evaluate the appropriateness and reasonableness of the fund’s management fee.
Analysis of Profitability and Economies of Scale.The Manager’s representatives reviewed the dollar amount of expenses allocated and profit received by the Manager and the method used to determine such expenses and profit.The Board previously had been provided with information prepared by an independent consulting firm regarding the Manager’s approach to allocating costs to, and determining the profitability of, individual funds and the entire Dreyfus mutual fund complex.The Board also was informed that the methodology had also been reviewed by an independent registered public accounting firm which,like the con-sultant,found the methodology to be reasonable.The consulting firm also analyzed where any economies of scale might emerge in connection
40
with the management of the fund. The Board members evaluated the profitability analysis in light of the relevant circumstances for the fund. The Board members also considered potential benefits to the Manager from acting as investment adviser and noted that there were no soft dollar arrangements with respect to trading the fund’s portfolio.
It was noted that the Board members should consider the Manager’s profitability with respect to the fund as part of their evaluation of whether the fees under the Management Agreement bear a reasonable relationship to the mix of services provided by the Manager, including the nature, extent and quality of such services, and that a discussion of economies of scale is predicated on increasing assets and that, if a fund’s assets had been decreasing, the possibility that the Manager may have realized any economies of scale would be less. It also was noted that the profitability percentage for managing the fund was within the range determined by appropriate court cases to be reasonable given the services rendered and generally superior service levels provided by the Manager.
At the conclusion of these discussions, the Board agreed that it had been furnished with sufficient information to make an informed business decision with respect to continuation of the fund’s Management Agreement. Based on the discussions and considerations as described above, the Board made the following conclusions and determinations.
The Board concluded that the nature, extent and quality of the services provided by the Manager are adequate and appropriate.
The Board was satisfied with the fund’s relative performance.
The Board concluded that the fee paid by the fund to the Manager was reasonable in light of the services provided, comparative performance, expense and management fee information, costs of the services pro- vided and profits to be realized and benefits derived or to be derived by the Manager from its relationship with the fund.
|
| INFORMATION ABOUT THE REVIEW AND APPROVAL OF THE FUND’S |
| INVESTMENT MANAGEMENT AGREEMENT (Unaudited) (continued) |
The Board determined that the economies of scale which may accrue to the Manager and its affiliates in connection with the man- agement of the fund had been adequately considered by the Manager in connection with the management fee rate charged to the fund and that, to the extent in the future it were determined that material economies of scale had not been shared with the fund, the Board would seek to have those economies of scale shared with the fund.
The Board members considered these conclusions and determinations, along with information received on a routine and regular basis throughout the year, and, without any one factor being dispositive, the Board determined that re-approval of the fund’s Management Agreement was in the best interests of the fund and its shareholders.
42
For More Information

Telephone Call your financial representative or 1-800-554-4611
Mail The Dreyfus Family of Funds, 144 Glenn Curtiss Boulevard, Uniondale, NY 11556-0144
The fund files its complete schedule of portfolio holdings with the Securities and Exchange Commission (“SEC”) for the first and third quarters of each fiscal year on Form N-Q. The fund’s Forms N-Q are available on the SEC’s website at http://www.sec.gov and may be reviewed and copied at the SEC’s Public Reference Room in Washington, DC. Information on the operation of the Public Reference Room may be obtained by calling 1-800-SEC-0330.
A description of the policies and procedures that the fund uses to determine how to vote proxies relating to portfolio securities, and information regarding how the fund voted these proxies for the most recent 12-month period ended June 30 is available at http://www.dreyfus.com and on the SEC’s website at http://www.sec.gov. The description of the policies and procedures is also available without charge, upon request, by calling 1-800-645-6561.

SEMIANNUAL REPORT June 30, 2010

Save time. Save paper. View your next shareholder report online as soon as it’s available. Log into www.dreyfus.com and sign up for Dreyfus eCommunications. It’s simple and only takes a few minutes.
The views expressed in this report reflect those of the portfolio manager only through the end of the period covered and do not necessarily represent the views of Dreyfus or any other person in the Dreyfus organization. Any such views are subject to change at any time based upon market or other conditions and Dreyfus disclaims any responsibility to update such views.These views may not be relied on as investment advice and, because investment decisions for a Dreyfus fund are based on numerous factors, may not be relied on as an indication of trading intent on behalf of any Dreyfus fund.

| | Contents |
| | THE FUND |
| 2 | A Letter from the Chairman and CEO |
| 3 | Discussion of Fund Performance |
| 6 | Understanding Your Fund’s Expenses |
| 6 | Comparing Your Fund’s Expenses With Those of Other Funds |
| 7 | Statement of Investments |
| 11 | Statement of Assets and Liabilities |
| 12 | Statement of Operations |
| 13 | Statement of Changes in Net Assets |
| 16 | Financial Highlights |
| 21 | Notes to Financial Statements |
| 31 | Information About the Review and Approval of the Fund’s Investment Management Agreement |
| | FOR MORE INFORMATION |
| | Back Cover |
Dreyfus
Core Value Fund
The Fund

A LETTER FROM THE CHAIRMAN AND CEO
Dear Shareholder:
We are pleased to present this semiannual report for Dreyfus Core Value Fund, covering the six-month period from January 1, 2010, through June 30, 2010.
After posting solid gains over the first quarter of 2010, stocks encountered renewed volatility in the second quarter, which caused most equity indices to erase their previous gains and end the reporting period lower than where they began. The second-quarter correction occurred despite positive GDP reports, as manufacturing activity improved and unemployment began to moderate in a recovery that has so far proved sustainable but milder than historical averages. Indeed, many of the headlines that have affected investors emanated from overseas markets, including the sovereign debt crisis in Europe and inflation fears in China.
Despite recent headlines about the current state of the U.S. economy, we still believe that it is unlikely that we’ll encounter a “double-dip” recession. Instead, we expect current financial strains to ease and the domestic economy to expand at a moderate pace over the second half of the year. However, we currently see a number of downside risks across the global markets that could result in volatility over the short term, which is why we still believe that a long-term investment focus with an emphasis on high-quality stocks may be suitable for many investors. As always, your financial advisor can help you assess both the risks and opportunities provided by the global financial markets in this investment climate.
For information about how the fund performed during the reporting period, as well as general market perspectives, we provide a Discussion of Fund Performance on the pages that follow.
Thank you for your continued confidence and support.
Jonathan R. Baum
Chairman and Chief Executive Officer
The Dreyfus Corporation
July 15, 2010
2

DISCUSSION OF FUND PERFORMANCE
For the period of January 1, 2010, through June 30, 2010, as provided by Brian Ferguson, Portfolio Manager
Fund and Market Performance Overview
For the six-month period ended June 30, 2010, Dreyfus Core Value Fund’s Class A shares produced a total return of –7.49%, Class B shares returned –7.81%,Class C shares returned –7.82%,Class I shares returned –7.38% and Institutional shares returned –7.45%.1 In comparison, the fund’s benchmark, the Russell 1000Value Index (the “Index”), produced a total return of –5.12% for the same period.2
Stocks encountered heightened volatility late in the reporting period, and a market rally sputtered when investors grew concerned regarding a number of threats to global economic growth. The fund produced lower returns than its benchmark, mainly due to shortfalls in our stock selection strategy in the consumer discretionary and financials sectors.
The Fund’s Investment Approach
The fund invests primarily in large-cap companies that are considered undervalued based on traditional measures, such as price-to-earnings ratios. When choosing stocks, we use a “bottom-up” stock selection approach, focusing on individual companies, rather than a “top-down” approach that forecasts market trends. We also focus on a company’s relative value, financial strength, business momentum and likely catalysts that could ignite the stock price.
Global Economic Concerns Intensified
The year 2010 began in the midst of an economic recovery and stock market rally as improved manufacturing activity and an apparent bottoming of residential housing prices helped boost confidence among businesses, consumers and investors. The economic recovery appeared to gain additional traction during the first quarter of the year, when employment gains seemed to indicate that stubbornly high unemployment might moderate.
DISCUSSION OF FUND PERFORMANCE (continued)
At the same time, however, several developments seemed to threaten the economic rebound. First, Europe was roiled by a sovereign debt crisis when Greece and other nations found themselves unable to finance heavy debt burdens, requiring intervention by the International Monetary Fund and the European Union. Meanwhile, robust economic growth in China, one of the primary engines of the global economic recovery, seemed to spark local inflationary pressures when urban property values soared, and investors grew worried that remedial measures might dampen the region’s growth. Finally, in the United States, a number of mixed economic indicators related to retail sales, employment and the housing market suggested that economic headwinds might constrain already mild growth. Consequently, large-cap stocks gave back their previous gains, generally ending the reporting period lower than where they began.
Positioned for a Mild Recovery
The fund began the reporting period with an emphasis on market sectors and individual companies that appeared poised to thrive in the economic rebound. However, this relatively constructive investment bias led to some lagging security selections in the consumer discretionary and financials sectors.
Among consumer discretionary stocks, overweighted exposure to large media companies dampened the fund’s results.We had established positions in industry leaders—such as News Corp. and Omnicom Group—in light of their attractive valuations, but these economically sensitive companies were hurt when investors began to question the rebound’s sustainability. In the financials sector, lack of exposure to real estate investment trusts (REITs) prevented the fund from participating in the industry’s relative strength. REITs had responded positively to investors’ more optimistic outlook for the commercial real estate market, a view we do not necessarily share. In addition, our preference for large, national banks over their smaller, regional counterparts contributed to the fund’s underperformance when the capital markets faltered and regulatory uncertainty intensified. In other sectors, technology giant Microsoft lost value after off-hand remarks by the company’s CEO may have been misinterpreted by investors.
4
The fund achieved more positive results in other market segments.The energy sector proved particularly beneficial to results, as we held a larger active weight in growth-oriented oil producers, such as Occidental Petroleum, over integrated oil-and-gas companies, particularly Exxon Mobil. In the telecommunications services sector, the fund benefited from our preference for AT&T over rival Verizon Communications. The market apparently agreed with us that AT&T enjoys better business prospects, stemming in part from its relationship with electronics innovator Apple.
Preparing for Bouts of Volatility
Although we remain optimistic about the long-term prospects of the U.S. economy and stock market, we adopted a somewhat less constructive investment posture when headlines became more negative.We are aware of the risk that depressed sentiment could cause businesses to become more cautious in their investments and capital spending, and we intend to monitor developments carefully.
Nonetheless,we have continued to uncover what we believe to be attractive values among fundamentally strong companies. Indeed, we would regard any further market pullbacks as opportunities to purchase shares of such companies at more compelling prices.We recently have identified a number of opportunities in the energy sector,where supply-and-demand dynamics remain favorable.We have found fewer companies meeting our value-oriented criteria in the technology sector.
July 15, 2010
Equity funds are subject generally to market, market sector, market liquidity, issuer and investment style risks, among other factors, to varying degrees, all of which are more fully described in the fund’s prospectus.
| |
| 1 | Total return includes reinvestment of dividends and any capital gains paid, and does not take into |
| | consideration the maximum initial sales charges in the case of Class A shares or the applicable |
| | contingent deferred sales charges imposed on redemptions in the case of Class B and Class C |
| | shares. Had these charges been reflected, returns would have been lower. Past performance is no |
| | guarantee of future results. Share price and investment return fluctuate such that upon redemption, |
| | fund shares may be worth more or less than their original cost. |
| 2 | SOURCE: LIPPER INC. — Reflects the reinvestment of dividends and, where applicable, |
| | capital gain distributions.The Russell 1000 Value Index is an unmanaged index which measures |
| | the performance of those Russell 1000 companies with lower price-to-book ratios and lower |
| | forecasted growth values. Investors cannot invest directly in any index. |
UNDERSTANDING YOUR FUND’S EXPENSES (Unaudited)
As a mutual fund investor, you pay ongoing expenses, such as management fees and other expenses. Using the information below, you can estimate how these expenses affect your investment and compare them with the expenses of other funds.You also may pay one-time transaction expenses, including sales charges (loads) and redemption fees, which are not shown in this section and would have resulted in higher total expenses. For more information, see your fund’s prospectus or talk to your financial adviser.
Review your fund’s expenses
The table below shows the expenses you would have paid on a $1,000 investment in Dreyfus Core Value Fund from January 1, 2010 to June 30, 2010. It also shows how much a $1,000 investment would be worth at the close of the period, assuming actual returns and expenses.
|
| Expenses and Value of a $1,000 Investment |
| assuming actual returns for the six months ended June 30, 2010 |
| | | | | |
| | Class A | Class B | Class C | Class I | Institutional |
| Expenses paid per $1,000† | $5.49 | $9.05 | $9.05 | $4.30 | $5.01 |
| Ending value (after expenses) | $925.10 | $921.90 | $921.80 | $926.20 | $925.50 |
COMPARING YOUR FUND’S EXPENSES
WITH THOSE OF OTHER FUNDS (Unaudited)
Using the SEC’s method to compare expenses
The Securities and Exchange Commission (SEC) has established guidelines to help investors assess fund expenses. Per these guidelines, the table below shows your fund’s expenses based on a $1,000 investment, assuming a hypothetical 5% annualized return. You can use this information to compare the ongoing expenses (but not transaction expenses or total cost) of investing in the fund with those of other funds.All mutual fund shareholder reports will provide this information to help you make this comparison. Please note that you cannot use this information to estimate your actual ending account balance and expenses paid during the period.
Expenses and Value of a $1,000 Investment
assuming a hypothetical 5% annualized return for the six months ended June 30, 2010
| | | | | |
| | Class A | Class B | Class C | Class I | Institutional |
| Expenses paid per $1,000† | $ 5.76 | $ 9.49 | $ 9.49 | $ 4.51 | $ 5.26 |
| Ending value (after expenses) | $1,019.09 | $1,015.37 | $1,015.37 | $1,020.33 | $1,019.59 |
|
| † Expenses are equal to the fund’s annualized expense ratio of 1.15% for Class A, 1.90% for Class B, 1.90% for |
| Class C, .90% for Class I and 1.05% for Institutional Shares, multiplied by the average account value over the |
| period, multiplied by 181/365 (to reflect the one-half year period). |
6
|
| STATEMENT OF INVESTMENTS |
| June 30, 2010 (Unaudited) |
| | |
| Common Stocks—99.8% | Shares | Value ($) |
| Consumer Discretionary—11.0% | | |
| Best Buy | 52,880 | 1,790,517 |
| Carnival | 117,000 | 3,538,080 |
| Home Depot | 108,600 | 3,048,402 |
| Johnson Controls | 118,640 | 3,187,857 |
| Mattel | 78,690 | 1,665,080 |
| News, Cl. A | 293,540 | 3,510,738 |
| Omnicom Group | 143,380 | 4,917,934 |
| Staples | 79,160 | 1,507,998 |
| Target | 48,120 | 2,366,060 |
| Time Warner | 238,866 | 6,905,616 |
| Walt Disney | 50,060 | 1,576,890 |
| Whirlpool | 17,090 | 1,500,844 |
| | | 35,516,016 |
| Consumer Staples—8.2% | | |
| Clorox | 54,020 | 3,357,883 |
| CVS Caremark | 161,160 | 4,725,211 |
| Dr. Pepper Snapple Group | 68,980 | 2,579,162 |
| Kraft Foods, Cl. A | 92,190 | 2,581,320 |
| PepsiCo | 162,770 | 9,920,832 |
| Philip Morris International | 67,840 | 3,109,786 |
| | | 26,274,194 |
| Energy—13.4% | | |
| Anadarko Petroleum | 26,350 | 950,971 |
| Chevron | 47,430 | 3,218,600 |
| ConocoPhillips | 137,930 | 6,770,984 |
| EOG Resources | 61,360 | 6,035,983 |
| Exxon Mobil | 57,490 | 3,280,954 |
| Occidental Petroleum | 199,350 | 15,379,853 |
| Peabody Energy | 52,930 | 2,071,151 |
| Schlumberger | 98,140 | 5,431,068 |
| | | 43,139,564 |
| Financial—25.4% | | |
| ACE | 52,930 | 2,724,836 |
| Aflac | 35,240 | 1,503,691 |
| American Express | 47,980 | 1,904,806 |
STATEMENT OF INVESTMENTS (Unaudited) (continued)
| | |
| Common Stocks (continued) | Shares | Value ($) |
| Financial (continued) | | |
| Ameriprise Financial | 85,470 | 3,088,031 |
| AON | 63,740 | 2,366,029 |
| Bank of America | 710,826 | 10,214,570 |
| Berkshire Hathaway, Cl. B | 50,490 a | 4,023,548 |
| Capital One Financial | 27,620 | 1,113,086 |
| Citigroup | 1,043,310 a | 3,922,846 |
| Goldman Sachs Group | 30,390 | 3,989,295 |
| JPMorgan Chase & Co. | 357,260 | 13,079,289 |
| Marsh & McLennan | 102,760 | 2,317,238 |
| MetLife | 138,020 | 5,211,635 |
| Morgan Stanley | 150,720 | 3,498,211 |
| PNC Financial Services Group | 42,520 | 2,402,380 |
| Prudential Financial | 56,360 | 3,024,278 |
| SunTrust Banks | 80,070 | 1,865,631 |
| Travelers | 65,860 | 3,243,605 |
| U.S. Bancorp | 170,450 | 3,809,558 |
| Wells Fargo & Co. | 336,330 | 8,610,048 |
| | | 81,912,611 |
| Health Care—11.5% | | |
| AmerisourceBergen | 63,530 | 2,017,077 |
| Amgen | 60,790 a | 3,197,554 |
| Bristol-Myers Squibb | 103,080 | 2,570,815 |
| Covidien | 78,630 | 3,159,353 |
| Johnson & Johnson | 27,730 | 1,637,734 |
| McKesson | 29,060 | 1,951,670 |
| Merck & Co. | 215,230 | 7,526,593 |
| Pfizer | 614,140 | 8,757,636 |
| Thermo Fisher Scientific | 36,370 a | 1,783,948 |
| UnitedHealth Group | 52,280 | 1,484,752 |
| Warner Chilcott, Cl. A | 66,504 a | 1,519,616 |
| WellPoint | 29,190 a | 1,428,267 |
| | | 37,035,015 |
| Industrial—11.7% | | |
| Caterpillar | 27,560 | 1,655,529 |
| Dover | 75,100 | 3,138,429 |
| Eaton | 46,710 | 3,056,702 |
8
| | |
| Common Stocks (continued) | Shares | Value ($) |
| Industrial (continued) | | |
| General Electric | 694,720 | 10,017,862 |
| Honeywell International | 43,370 | 1,692,731 |
| Pitney Bowes | 154,680 | 3,396,773 |
| Raytheon | 49,120 | 2,376,917 |
| Republic Services | 84,430 | 2,510,104 |
| Tyco International | 48,640 | 1,713,587 |
| Union Pacific | 80,440 | 5,591,384 |
| United Technologies | 38,450 | 2,495,790 |
| | | 37,645,808 |
| Information Technology—6.5% | | |
| AOL | 69,438 a | 1,443,616 |
| Cisco Systems | 263,800 a | 5,621,578 |
| Hewlett-Packard | 103,970 | 4,499,822 |
| Microsoft | 274,240 | 6,310,262 |
| QUALCOMM | 43,680 | 1,434,451 |
| Tyco Electronics | 62,610 | 1,589,042 |
| | | 20,898,771 |
| Materials—2.3% | | |
| Air Products & Chemicals | 22,480 | 1,456,929 |
| CF Industries Holdings | 18,940 | 1,201,743 |
| Dow Chemical | 65,830 | 1,561,488 |
| Freeport-McMoRan Copper & Gold | 24,870 | 1,470,563 |
| International Paper | 77,470 | 1,753,146 |
| | | 7,443,869 |
| Telecommunication Services—5.0% | | |
| AT & T | 390,855 | 9,454,782 |
| Vodafone Group, ADR | 321,950 b | 6,654,707 |
| | | 16,109,489 |
| Utilities—4.8% | | |
| Entergy | 64,670 | 4,631,665 |
| NextEra Energy | 92,060 | 4,488,846 |
| Questar | 100,410 | 4,567,651 |
| Southern | 51,810 b | 1,724,237 |
| | | 15,412,399 |
| Total Common Stocks | | |
| (cost $327,618,971) | | 321,387,736 |
STATEMENT OF INVESTMENTS (Unaudited) (continued)
| | |
| Other Investment—.4% | Shares | Value ($) |
| Registered Investment Company; | | |
| Dreyfus Institutional Preferred | | |
| Plus Money Market Fund | | |
| (cost $1,265,000) | 1,265,000 c | 1,265,000 |
| |
| Investment of Cash Collateral | | |
| for Securities Loaned—2.5% | | |
| Registered Investment Company; | | |
| Dreyfus Institutional Cash Advantage Fund | | |
| (cost $7,897,958) | 7,897,958 c | 7,897,958 |
| |
| Total Investments (cost $336,781,929) | 102.7% | 330,550,694 |
| Liabilities, Less Cash and Receivables | (2.7%) | (8,667,777) |
| Net Assets | 100.0% | 321,882,917 |
|
| ADR—American Depository Receipts |
| a Non-income producing security. |
| b Security, or portion thereof, on loan. At June 30, 2010, the total market value of the fund’s securities on loan is |
| $7,458,714 and the total market value of the collateral held by the fund is $7,897,958. |
| c Investment in affiliated money market mutual fund. |
| | | |
| Portfolio Summary (Unaudited)† | | |
| |
| | Value (%) | | Value (%) |
| Financial | 25.4 | Information Technology | 6.5 |
| Energy | 13.4 | Telecommunication Services | 5.0 |
| Industrial | 11.7 | Utilities | 4.8 |
| Health Care | 11.5 | Money Market Investments | 2.9 |
| Consumer Discretionary | 11.0 | Materials | 2.3 |
| Consumer Staples | 8.2 | | 102.7 |
| |
| † Based on net assets. | | | |
| See notes to financial statements. | | | |
10
|
| STATEMENT OF ASSETS AND LIABILITIES |
| June 30, 2010 (Unaudited) |
| | | | | |
| | | | | Cost | Value |
| Assets ($): | | | | | |
| Investments in securities—See Statement of Investments (including | | |
| securities on loan, valued at $7,458,714)—Note 1(b): | | | |
| Unaffiliated issuers | | | 327,618,971 | 321,387,736 |
| Affiliated issuers | | | | 9,162,958 | 9,162,958 |
| Receivable for investment securities sold | | | | 8,747,309 |
| Dividends and interest receivable | | | | 765,848 |
| Receivable for shares of Beneficial Interest subscribed | | | 23,351 |
| | | | | | 340,087,202 |
| Liabilities ($): | | | | | |
| Due to The Dreyfus Corporation and affiliates—Note 3(b) | | | 325,098 |
| Cash overdraft due to custodian | | | | 114,503 |
| Payable for investment securities purchased | | | | 9,790,132 |
| Liability for securities on loan—Note 1(b) | | | | 7,897,958 |
| Payable for shares of Beneficial Interest redeemed | | | 76,594 |
| | | | | | 18,204,285 |
| Net Assets ($) | | | | | 321,882,917 |
| Composition of Net Assets ($): | | | | |
| Paid-in capital | | | | | 415,504,334 |
| Accumulated undistributed investment income—net | | | 6,183 |
| Accumulated net realized gain (loss) on investments | | | (87,396,365) |
| Accumulated net unrealized appreciation | | | | |
| (depreciation) on investments | | | | (6,231,235) |
| Net Assets ($) | | | | | 321,882,917 |
| |
| |
| Net Asset Value Per Share | | | | |
| | Class A | Class B | Class C | Class I | Institutional |
| Net Assets ($) | 288,710,060 | 1,386,390 | 7,107,779 | 901,302 | 23,777,386 |
| Shares Outstanding | 14,365,584 | 70,421 | 361,374 | 44,846 | 1,183,554 |
| Net Asset Value | | | | | |
| Per Share ($) | 20.10 | 19.69 | 19.67 | 20.10 | 20.09 |
| |
| See notes to financial statements. | | | | |
|
| STATEMENT OF OPERATIONS |
| Six Months Ended June 30, 2010 (Unaudited) |
| |
| Investment Income ($): | |
| Income: | |
| Cash dividends: | |
| Unaffiliated issuers | 3,616,739 |
| Affiliated issuers | 1,381 |
| Income from securities lending—Note 1(b) | 997 |
| Interest | 298 |
| Total Income | 3,619,415 |
| Expenses: | |
| Management fee—Note 3(a) | 1,587,433 |
| Distribution and service fees—Note 3(b) | 462,845 |
| Trustees’ fees—Note 3(a) | 13,051 |
| Loan commitment fees—Note 2 | 2,524 |
| Total Expenses | 2,065,853 |
| Less—Trustees’ fees reimbursed by the Manager—Note 3(a) | (13,051) |
| Net Expenses | 2,052,802 |
| Investment Income—Net | 1,566,613 |
| Realized and Unrealized Gain (Loss) on Investments—Note 4 ($): | |
| Net realized gain (loss) on investments | 6,214,132 |
| Net unrealized appreciation (depreciation) on investments | (33,589,096) |
| Net Realized and Unrealized Gain (Loss) on Investments | (27,374,964) |
| Net (Decrease) in Net Assets Resulting from Operations | (25,808,351) |
| |
| See notes to financial statements. | |
12
STATEMENT OF CHANGES IN NET ASSETS
| | |
| | Six Months Ended | |
| | June 30, 2010 | Year Ended |
| | (Unaudited) | December 31, 2009a |
| Operations ($): | | |
| Investment income—net | 1,566,613 | 4,312,321 |
| Net realized gain (loss) on investments | 6,214,132 | (36,235,669) |
| Net unrealized appreciation | | |
| (depreciation) on investments | (33,589,096) | 87,286,702 |
| Net Increase (Decrease) in Net Assets | | |
| Resulting from Operations | (25,808,351) | 55,363,354 |
| Dividends to Shareholders from ($): | | |
| Investment income—net: | | |
| Class A Shares | (1,422,538) | (3,933,828) |
| Class B Shares | (1,463) | (23,861) |
| Class C Shares | (7,508) | (44,329) |
| Class I Shares | (5,895) | (12,221) |
| Institutional Shares | (129,718) | (329,794) |
| Total Dividends | (1,567,122) | (4,344,033) |
| Beneficial Interest Transactions ($): | | |
| Net proceeds from shares sold: | | |
| Class A Shares | 3,608,281 | 11,628,595 |
| Class B Shares | 15,625 | 48,918 |
| Class C Shares | 461,417 | 565,585 |
| Class I Shares | 113,380 | 233,888 |
| Class T Shares | — | 4,900 |
| Institutional Shares | 1,064,205 | 259,267 |
STATEMENT OF CHANGES IN NET ASSETS (continued)
| | |
| | Six Months Ended | |
| | June 30, 2010 | Year Ended |
| | (Unaudited) | December 31, 2009a |
| Beneficial Interest Transactions ($) (continued): | | |
| Dividends reinvested: | | |
| Class A Shares | 1,237,783 | 3,386,255 |
| Class B Shares | 1,362 | 22,288 |
| Class C Shares | 6,630 | 38,504 |
| Class I Shares | 4,139 | 11,613 |
| Institutional Shares | 125,714 | 321,000 |
| Cost of shares redeemed: | | |
| Class A Shares | (16,782,393) | (37,592,218) |
| Class B Shares | (1,045,968) | (3,443,128) |
| Class C Shares | (592,690) | (2,215,012) |
| Class I Shares | (183,830) | (64,206) |
| Class T Shares | — | (1,037,083) |
| Institutional Shares | (1,172,915) | (2,093,420) |
| Increase (Decrease) in Net Assets from | | |
| Beneficial Interest Transactions | (13,139,260) | (29,924,254) |
| Total Increase (Decrease) in Net Assets | (40,514,733) | 21,095,067 |
| Net Assets ($): | | |
| Beginning of Period | 362,397,650 | 341,302,583 |
| End of Period | 321,882,917 | 362,397,650 |
| Undistributed investment income—net | 6,183 | 6,692 |
14
| | |
| | Six Months Ended | |
| | June 30, 2010 | Year Ended |
| | (Unaudited) | December 31, 2009a |
| Capital Share Transactions: | | |
| Class Ab,c | | |
| Shares sold | 161,295 | 644,580 |
| Shares issued for dividends reinvested | 58,420 | 186,499 |
| Shares redeemed | (752,173) | (2,017,879) |
| Net Increase (Decrease) in Shares Outstanding | (532,458) | (1,186,800) |
| Class Bb | | |
| Shares sold | 729 | 2,707 |
| Shares issued for dividends reinvested | 69 | 1,373 |
| Shares redeemed | (47,545) | (195,433) |
| Net Increase (Decrease) in Shares Outstanding | (46,747) | (191,353) |
| Class C | | |
| Shares sold | 20,771 | 30,654 |
| Shares issued for dividends reinvested | 337 | 2,342 |
| Shares redeemed | (27,358) | (122,745) |
| Net Increase (Decrease) in Shares Outstanding | (6,250) | (89,749) |
| Class I | | |
| Shares sold | 5,044 | 11,070 |
| Shares issued for dividends reinvested | 193 | 635 |
| Shares redeemed | (8,346) | (3,622) |
| Net Increase (Decrease) in Shares Outstanding | (3,109) | 8,083 |
| Class Tc | | |
| Shares sold | — | 291 |
| Shares redeemed | — | (62,134) |
| Net Increase (Decrease) in Shares Outstanding | — | (61,843) |
| Institutional Shares | | |
| Shares sold | 46,906 | 13,952 |
| Shares issued for dividends reinvested | 5,927 | 17,609 |
| Shares redeemed | (52,787) | (119,227) |
| Net Increase (Decrease) in Shares Outstanding | 46 | (87,666) |
| |
| a | Effective as of the close of business on February 4, 2009, the fund no longer offers Class T shares. |
| b | During the period ended June 30, 2010, 28,696 Class B shares representing $629,463 were automatically |
| | converted to 28,094 Class A shares and during the period ended Deceber 31, 2009, 94,322 Class B shares |
| | representing $1,726,360 were automatically converted to 92,335 Class A shares. |
| c | On the close of business on February 4, 2009, 61,363 Class T shares representing $1,023,527 were converted to |
| | 61,326 Class A shares. |
| See notes to financial statements. |
FINANCIAL HIGHLIGHTS
The following tables describe the performance for each share class for the fiscal periods indicated.All information (except portfolio turnover rate) reflects financial results for a single fund share.Total return shows how much your investment in the fund would have increased (or decreased) during each period, assuming you had reinvested all dividends and distributions.These figures have been derived from the fund’s financial statements.
| | | | | | |
| Six Months Ended | | | | | |
| June 30, 2010 | | Year Ended December 31, | |
| Class A Shares | (Unaudited) | 2009 | 2008 | 2007 | 2006 | 2005 |
| Per Share Data ($): | | | | | | |
| Net asset value, | | | | | | |
| beginning of period | 21.83 | 18.75 | 29.87 | 32.00 | 31.38 | 30.34 |
| Investment Operations: | | | | | | |
| Investment income—neta | .10 | .25 | .38 | .45 | .38 | .30 |
| Net realized and unrealized | | | | | | |
| gain (loss) on investments | (1.73) | 3.08 | (11.10) | .42 | 5.94 | 1.26 |
| Total from Investment Operations | (1.63) | 3.33 | (10.72) | .87 | 6.32 | 1.56 |
| Distributions: | | | | | | |
| Dividends from | | | | | | |
| investment income—net | (.10) | (.25) | (.40) | (.46) | (.37) | (.35) |
| Dividends from net realized | | | | | | |
| gain on investments | — | — | (.00)b | (2.54) | (5.33) | (.17) |
| Total Distributions | (.10) | (.25) | (.40) | (3.00) | (5.70) | (.52) |
| Net asset value, end of period | 20.10 | 21.83 | 18.75 | 29.87 | 32.00 | 31.38 |
| Total Return (%)c | (7.49)d | 18.07 | (36.10) | 2.75 | 21.00 | 5.18 |
| Ratios/Supplemental Data (%): | | | | | | |
| Ratio of total expenses | | | | | | |
| to average net assets | 1.16e | 1.17 | 1.16 | 1.16 | 1.15 | 1.15 |
| Ratio of net expenses | | | | | | |
| to average net assets | 1.15e | 1.16 | 1.15 | 1.15 | 1.15 | 1.15 |
| Ratio of net investment income | | | | | | |
| to average net assets | .90e | 1.33 | 1.53 | 1.38 | 1.17 | .99 |
| Portfolio Turnover Rate | 27.87d | 64.35 | 53.58 | 45.19 | 44.73 | 55.95 |
| Net Assets, end of period | | | | | | |
| ($ x 1,000) | 288,710 | 325,170 | 301,524 | 522,906 | 548,601 | 556,017 |
| |
| a | Based on average shares outstanding at each month end. |
| b | Amount represents less than $.01 per share. |
| c | Exclusive of sales charge. |
| d | Not annualized. |
| e | Annualized. |
See notes to financial statements.
16
| | | | | | |
| Six Months Ended | | | | | |
| June 30, 2010 | | Year Ended December 31, | |
| Class B Shares | (Unaudited) | 2009 | 2008 | 2007 | 2006 | 2005 |
| Per Share Data ($): | | | | | | |
| Net asset value, | | | | | | |
| beginning of period | 21.38 | 18.36 | 29.26 | 31.40 | 30.87 | 29.83 |
| Investment Operations: | | | | | | |
| Investment income—neta | .01 | .13 | .17 | .22 | .13 | .07 |
| Net realized and unrealized | | | | | | |
| gain (loss) on investments | (1.68) | 3.00 | (10.85) | .39 | 5.85 | 1.26 |
| Total from Investment Operations | (1.67) | 3.13 | (10.68) | .61 | 5.98 | 1.33 |
| Distributions: | | | | | | |
| Dividends from | | | | | | |
| investment income—net | (.02) | (.11) | (.22) | (.21) | (.12) | (.12) |
| Dividends from net realized | | | | | | |
| gain on investments | — | — | (.00)b | (2.54) | (5.33) | (.17) |
| Total Distributions | (.02) | (.11) | (.22) | (2.75) | (5.45) | (.29) |
| Net asset value, end of period | 19.69 | 21.38 | 18.36 | 29.26 | 31.40 | 30.87 |
| Total Return (%)c | (7.81)d | 17.21 | (36.62) | 2.01 | 20.12 | 4.47 |
| Ratios/Supplemental Data (%): | | | | | | |
| Ratio of total expenses | | | | | | |
| to average net assets | 1.90e | 1.91 | 1.90 | 1.91 | 1.90 | 1.90 |
| Ratio of net expenses | | | | | | |
| to average net assets | 1.90e,f | 1.90 | 1.90f | 1.90 | 1.90 | 1.90 |
| Ratio of net investment income | | | | | | |
| to average net assets | .10e | .74 | .69 | .70 | .42 | .24 |
| Portfolio Turnover Rate | 27.87d | 64.35 | 53.58 | 45.19 | 44.73 | 55.95 |
| Net Assets, end of period | | | | | | |
| ($ x 1,000) | 1,386 | 2,505 | 5,665 | 26,646 | 55,112 | 64,239 |
| |
| a | Based on average shares outstanding at each month end. |
| b | Amount represents less than $.01 per share. |
| c | Exclusive of sales charge. |
| d | Not annualized. |
| e | Annualized. |
| f | Expense waivers and/or reimbursements amounted to less than .01%. |
See notes to financial statements.
FINANCIAL HIGHLIGHTS (continued)
| | | | | | |
| Six Months Ended | | | | | |
| June 30, 2010 | | Year Ended December 31, | |
| Class C Shares | (Unaudited) | 2009 | 2008 | 2007 | 2006 | 2005 |
| Per Share Data ($): | | | | | | |
| Net asset value, | | | | | | |
| beginning of period | 21.36 | 18.35 | 29.24 | 31.38 | 30.85 | 29.83 |
| Investment Operations: | | | | | | |
| Investment income—neta | .02 | .11 | .19 | .21 | .14 | .07 |
| Net realized and unrealized | | | | | | |
| gain (loss) on investments | (1.69) | 3.01 | (10.86) | .40 | 5.84 | 1.24 |
| Total from Investment Operations | (1.67) | 3.12 | (10.67) | .61 | 5.98 | 1.31 |
| Distributions: | | | | | | |
| Dividends from | | | | | | |
| investment income—net | (.02) | (.11) | (.22) | (.21) | (.12) | (.12) |
| Dividends from net realized | | | | | | |
| gain on investments | — | — | (.00)b | (2.54) | (5.33) | (.17) |
| Total Distributions | (.02) | (.11) | (.22) | (2.75) | (5.45) | (.29) |
| Net asset value, end of period | 19.67 | 21.36 | 18.35 | 29.24 | 31.38 | 30.85 |
| Total Return (%)c | (7.82)d | 17.16 | (36.59) | 2.00 | 20.07 | 4.43 |
| Ratios/Supplemental Data (%): | | | | | | |
| Ratio of total expenses | | | | | | |
| to average net assets | 1.91e | 1.92 | 1.90 | 1.91 | 1.90 | 1.90 |
| Ratio of net expenses | | | | | | |
| to average net assets | 1.90e | 1.91 | 1.90f | 1.90 | 1.90 | 1.90 |
| Ratio of net investment income | | | | | | |
| to average net assets | .15e | .60 | .76 | .65 | .42 | .24 |
| Portfolio Turnover Rate | 27.87d | 64.35 | 53.58 | 45.19 | 44.73 | 55.95 |
| Net Assets, end of period | | | | | | |
| ($ x 1,000) | 7,108 | 7,853 | 8,391 | 16,572 | 20,919 | 20,564 |
| |
| a | Based on average shares outstanding at each month end. |
| b | Amount represents less than $.01 per share. |
| c | Exclusive of sales charge. |
| d | Not annualized. |
| e | Annualized. |
| f | Expense waivers and/or reimbursements amounted to less than .01%. |
See notes to financial statements.
18
| | | | | | |
| Six Months Ended | | | | | |
| June 30, 2010 | | Year Ended December 31, | |
| Class I Shares | (Unaudited) | 2009 | 2008 | 2007a | 2006 | 2005 |
| Per Share Data ($): | | | | | | |
| Net asset value, | | | | | | |
| beginning of period | 21.83 | 18.74 | 29.85 | 31.98 | 31.36 | 30.33 |
| Investment Operations: | | | | | | |
| Investment income—netb | .13 | .30 | .45 | .57 | .46 | .38 |
| Net realized and unrealized | | | | | | |
| gain (loss) on investments | (1.73) | 3.09 | (11.10) | .39 | 5.95 | 1.25 |
| Total from Investment Operations | (1.60) | 3.39 | (10.65) | .96 | 6.41 | 1.63 |
| Distributions: | | | | | | |
| Dividends from | | | | | | |
| investment income—net | (.13) | (.30) | (.46) | (.55) | (.46) | (.43) |
| Dividends from net realized | | | | | | |
| gain on investments | — | — | (.00)c | (2.54) | (5.33) | (.17) |
| Total Distributions | (.13) | (.30) | (.46) | (3.09) | (5.79) | (.60) |
| Net asset value, end of period | 20.10 | 21.83 | 18.74 | 29.85 | 31.98 | 31.36 |
| Total Return (%) | (7.38)d | 18.43 | (35.93) | 3.04 | 21.26 | 5.45 |
| Ratios/Supplemental Data (%): | | | | | | |
| Ratio of total expenses | | | | | | |
| to average net assets | .91e | .92 | .90 | .91 | .90 | .90 |
| Ratio of net expenses | | | | | | |
| to average net assets | .90e | .91 | .90f | .90 | .90 | .90 |
| Ratio of net investment income | | | | | | |
| to average net assets | 1.15e | 1.57 | 1.74 | 1.63 | 1.42 | 1.25 |
| Portfolio Turnover Rate | 27.87d | 64.35 | 53.58 | 45.19 | 44.73 | 55.95 |
| Net Assets, end of period | | | | | | |
| ($ x 1,000) | 901 | 1,047 | 747 | 1,395 | 6,012 | 4,740 |
| |
| a | Effective June 1, 2007, Class R shares were redesignated as Class I shares. |
| b | Based on average shares outstanding at each month end. |
| c | Amount represents less than $.01 per share. |
| d | Not annualized. |
| e | Annualized. |
| f | Expense waivers and/or reimbursements amounted to less than .01%. |
See notes to financial statements.
FINANCIAL HIGHLIGHTS (continued)
| | | | | | |
| Six Months Ended | | | | | |
| June 30, 2010 | | Year Ended December 31, | |
| Institutional Shares | (Unaudited) | 2009 | 2008 | 2007 | 2006 | 2005 |
| Per Share Data ($): | | | | | | |
| Net asset value, | | | | | | |
| beginning of period | 21.82 | 18.74 | 29.85 | 31.98 | 31.36 | 30.32 |
| Investment Operations: | | | | | | |
| Investment income—neta | .11 | .27 | .41 | .48 | .42 | .33 |
| Net realized and unrealized | | | | | | |
| gain (loss) on investments | (1.73) | 3.08 | (11.09) | .43 | 5.94 | 1.26 |
| Total from Investment Operations | (1.62) | 3.35 | (10.68) | .91 | 6.36 | 1.59 |
| Distributions: | | | | | | |
| Dividends from | | | | | | |
| investment income—net | (.11) | (.27) | (.43) | (.50) | (.41) | (.38) |
| Dividends from net realized | | | | | | |
| gain on investments | — | — | (.00)b | (2.54) | (5.33) | (.17) |
| Total Distributions | (.11) | (.27) | (.43) | (3.04) | (5.74) | (.55) |
| Net asset value, end of period | 20.09 | 21.82 | 18.74 | 29.85 | 31.98 | 31.36 |
| Total Return (%) | (7.45)c | 18.20 | (36.05) | 2.89 | 21.11 | 5.33 |
| Ratios/Supplemental Data (%): | | | | | | |
| Ratio of total expenses | | | | | | |
| to average net assets | 1.06d | 1.06 | 1.06 | 1.06 | 1.05 | 1.05 |
| Ratio of net expenses | | | | | | |
| to average net assets | 1.05d | 1.06e | 1.05 | 1.05 | 1.05 | 1.05 |
| Ratio of net investment income | | | | | | |
| to average net assets | 1.00d | 1.43 | 1.63 | 1.49 | 1.28 | 1.09 |
| Portfolio Turnover Rate | 27.87c | 64.35 | 53.58 | 45.19 | 44.73 | 55.95 |
| Net Assets, end of period | | | | | | |
| ($ x 1,000) | 23,777 | 25,822 | 23,816 | 40,679 | 44,506 | 40,341 |
| |
| a | Based on average shares outstanding at each month end. |
| b | Amount represents less than $.01 per share. |
| c | Not annualized. |
| d | Annualized. |
| e | Expense waivers and/or reimbursements amounted to less than .01%. |
See notes to financial statements.
20
NOTES TO FINANCIAL STATEMENTS (Unaudited)
NOTE 1—Significant Accounting Policies:
Dreyfus Core Value Fund (the “fund”) is a separate diversified series of The Dreyfus/Laurel Funds Trust (the “Trust”) which is registered under the Investment Company Act of 1940, as amended (the “Act”), as an open-end management investment company and operates as a series company offering seven series, including the fund.The fund’s investment objective seeks long-term capital growth.The Dreyfus Corporation (the “Manager” or “Dreyfus”), a wholly-owned subsidiary of The Bank of New York Mellon Corporation (“BNY Mellon”), serves as the fund’s investment adviser.
MBSC Securities Corporation (the “Distributor”), a wholly-owned subsidiary of the Manager, is the distributor of the fund’s shares. The fund is authorized to issue an unlimited number of shares of Beneficial Interest in each of the following classes of shares: Class A, Class B, Class C, Class I and Institutional shares. Class A, Class B and Class C shares are sold primarily to retail investors through financial intermediaries and bear a distribution fee and/or service fee. Class A shares are subject to a front-end sales charge, while Class B and Class C shares are subject to a contingent deferred sales charge (“CDSC”). Class B shares automatically convert to Class A shares after six years. The fund does not offer Class B shares, except in connection with dividend reinvestment and permitted exchanges of Class B shares. Class I shares are sold primarily to bank trust departments and other financial servic e providers including The Bank of NewYork Mellon, a subsidiary of BNY Mellon and an affiliate of Dreyfus, acting on behalf of customers having a qualified trust or investment account or relationship at such institution, and bear no distribution or service fees. Class I and Institutional shares are offered without a front-end sales charge or CDSC. Institutional shares are offered only to those customers of certain financial planners and investment advisers who held shares of a predecessor class of the fund as of April 4, 1994, and bear a distribution fee. Each class of shares has identical rights and privileges, except with respect to the distribution and service fees and voting rights on matters affecting a single class.
NOTES TO FINANCIAL STATEMENTS (Unaudited) (continued)
Income, expenses (other than expenses attributable to a specific class), and realized and unrealized gains or losses on investments are allocated to each class of shares based on its relative net assets.
The Financial Accounting Standards Board (“FASB”) Accounting Standards Codification (“ASC”) is the exclusive reference of authoritative U.S. generally accepted accounting principles (“GAAP”) recognized by the FASB to be applied by nongovernmental entities.Rules and interpretive releases of the Securities and Exchange Commission (“SEC”) under authority of federal laws are also sources of authoritative GAAP for SEC registrants. The fund’s financial statements are prepared in accordance with GAAP, which may require the use of management estimates and assumptions.Actual results could differ from those estimates.
(a) Portfolio valuation: Investments in securities are valued at the last sales price on the securities exchange or national securities market on which such securities are primarily traded. Securities listed on the National Market System, for which market quotations are available are valued at the official closing price or, if there is no official closing price that day, at the last sales price. Securities not listed on an exchange or the national securities market, or securities for which there were no transactions, are valued at the average of the most recent bid and asked prices. Bid price is used when no asked price is available. Registered investment companies that are not traded on an exchange are valued at their net asset value. When market quotations or official closing prices are not readily available, or are determined not to reflect accurate ly fair value, such as when the value of a security has been significantly affected by events after the close of the exchange or market on which the security is principally traded (for example, a foreign exchange or market), but before the fund calculates its net asset value, the fund may value these investments at fair value as determined in accordance with the procedures approved by the Board of Trustees. Fair valuing of securities may be determined with the assistance of a pricing service using calculations based on indices of domestic securi-
22
ties and other appropriate indicators, such as prices of relevant ADRs and futures contracts. For other securities that are fair valued by the Board of Trustees, certain factors may be considered such as: fundamental analytical data, the nature and duration of restrictions on disposition, an evaluation of the forces that influence the market in which the securities are purchased and sold, and public trading in similar securities of the issuer or comparable issuers.
The fair value of a financial instrument is the amount that would be received to sell an asset or paid to transfer a liability in an orderly transaction between market participants at the measurement date (i.e. the exit price). GAAP establishes a fair value hierarchy that prioritizes the inputs of valuation techniques used to measure fair value.This hierarchy gives the highest priority to unadjusted quoted prices in active markets for identical assets or liabilities (Level 1 measurements) and the lowest priority to unobservable inputs (Level 3 measurements).
Additionally, GAAP provides guidance on determining whether the volume and activity in a market has decreased significantly and whether such a decrease in activity results in transactions that are not orderly. GAAP requires enhanced disclosures around valuation inputs and techniques used during annual and interim periods.
Various inputs are used in determining the value of the fund’s investments relating to fair value measurements.These inputs are summarized in the three broad levels listed below:
Level 1—unadjusted quoted prices in active markets for
identical investments.
Level 2—other significant observable inputs (including quoted
prices for similar investments, interest rates, prepayment speeds,
credit risk, etc.).
Level 3—significant unobservable inputs (including the fund’s own
assumptions in determining the fair value of investments).
NOTES TO FINANCIAL STATEMENTS (Unaudited) (continued)
The inputs or methodology used for valuing securities are not necessarily an indication of the risk associated with investing in those securities.
The following is a summary of the inputs used as of June 30, 2010 in valuing the fund’s investments:
| | | | |
| | | Level 2—Other | Level 3— | |
| | Level 1— | Significant | Significant | |
| | Unadjusted | Observable | Unobservable | |
| | Quoted Prices | Inputs | Inputs | Total |
| Assets ($) | | | | |
| Investments in Securities: | | | |
| Equity Securities— | | | | |
| Domestic† | 314,733,029 | — | — | 314,733,029 |
| Equity Securities— | | | | |
| Foreign† | 6,654,707 | — | — | 6,654,707 |
| Mutual Funds | 9,162,958 | — | — | 9,162,958 |
| † See Statement of Investments for industry classification. | | |
In January 2010, FASB issued Accounting Standards Update (“ASU”) No. 2010-06 “Improving Disclosures about FairValue Measurements”. The portions of ASU No. 2010-06 which require reporting entities to prepare new disclosures surrounding amounts and reasons for significant transfers in and out of Level 1 and Level 2 fair value measurements as well as inputs and valuation techniques used to measure fair value for both recurring and nonrecurring fair value measurements that fall in either Level 2 or Level 3 have been adopted by the fund.The remaining portion of ASU No. 2010-06 requires reporting entities to make new disclosures about information on purchases, sales, issuances and settlements on a gross basis in the reconciliation of activity in Level 3 fair value measurements.These new and revised disclosures are required to be implemented for fiscal years beginning after December 15, 2010. Management is currentl y evaluating the impact that the adoption of this remaining portion of ASU No. 2010-06 may have on the fund’s financial statement disclosures.
(b) Securities transactions and investment income: Securities transactions are recorded on a trade date basis. Realized gains and losses from securities transactions are recorded on the identified cost basis. Dividend income is recognized on the ex-dividend date and interest
24
income, including, where applicable, accretion of discount and amortization of premium on investments, is recognized on the accrual basis.
Pursuant to a securities lending agreement withThe Bank of NewYork Mellon, the fund may lend securities to qualified institutions. It is the fund’s policy that, at origination, all loans are secured by collateral of at least 102% of the value of U.S. securities loaned and 105% of the value of foreign securities loaned. Collateral equivalent to at least 100% of the market value of securities on loan is maintained at all times. Collateral is either in the form of cash, which can be invested in certain money market mutual funds managed by the Manager, U.S. Government and Agency securities or letters of credit.The fund is entitled to receive all income on securities loaned, in addition to income earned as a result of the lending transaction.Although each security loaned is fully collateralized, the fund bears the risk of delay in recovery of, or loss of rights in, the securities loaned should a borrower fail to return the secu rities in a timely manner. During the period ended June 30, 2010,The Bank of New York Mellon earned $427 from lending portfolio securities, pursuant to the securities lending agreement.
(c) Affiliated issuers: Investments in other investment companies advised by Dreyfus are defined as “affiliated” in the Act.
The fund may invest in shares of certain affiliated investment companies also advised or managed by Dreyfus. Investments in affiliated investment companies for the period ended June 30, 2010 were as follows:

NOTES TO FINANCIAL STATEMENTS (Unaudited) (continued)
(d) Dividends to shareholders: Dividends are recorded on the ex-dividend date. Dividends from investment income-net are declared and paid on a quarterly basis. Dividends from net realized capital gains, if any, are normally declared and paid annually, but the fund may make distributions on a more frequent basis to comply with the distribution requirements of the Internal Revenue Code of 1986, as amended (the “Code”).To the extent that net realized capital gains can be offset by capital loss carryovers, it is the policy of the fund not to distribute such gains. Income and capital gain distributions are determined in accordance with income tax regulations, which may differ from GAAP.
(e) Federal income taxes: It is the policy of the fund to continue to qualify as a regulated investment company, if such qualification is in the best interests of its shareholders, by complying with the applicable provisions of the Code, and to make distributions of taxable income sufficient to relieve it from substantially all federal income and excise taxes.
As of and during the period ended June 30, 2010, the fund did not have any liabilities for any uncertain tax positions.The fund recognizes interest and penalties, if any, related to uncertain tax positions as income tax expense in the Statement of Operations. During the period, the fund did not incur any interest or penalties.
Each of the tax years in the three-year period ended December 31, 2009 remains subject to examination by the Internal Revenue Service and state taxing authorities.
The fund has an unused capital loss carryover of $88,529,754 available for federal income tax purposes to be applied against future net securities profits, if any, realized subsequent to December 31, 2009. If not applied, $38,328,752 of the carryover expires in fiscal 2016 and $50,201,002 expires in fiscal 2017.
The tax character of distributions paid to shareholders during the fiscal year ended December 31, 2009 was as follows: ordinary income $4,344,033. The tax character of current year distributions will be determined at the end of the current fiscal year.
26
NOTE 2—Bank Lines of Credit:
The fund participates with other Dreyfus-managed funds in a $225 million unsecured credit facility led by Citibank, N.A. and a $300 million unsecured credit facility provided by The Bank of New York Mellon (each, a “Facility”), each to be utilized primarily for temporary or emergency purposes, including the financing of redemptions. In connection therewith, the fund has agreed to pay its pro rata portion of commitment fees for each Facility. Interest is charged to the fund based on rates determined pursuant to the terms of the respective Facility at the time of borrowing. During the period ended June 30, 2010, the fund did not borrow under the Facilities.
NOTE 3—Investment Management Fee and Other Transactions With Affiliates:
(a) Pursuant to an investment management agreement with the Manager, the Manager provides or arranges for one or more third par ties and/or affiliates to provide investment advisory, administrative, custody, fund accounting and transfer agency services to the fund. The Manager also directs the investments of the fund in accordance with its investment objective,policies and limitations.For these services, the fund is contractually obligated to pay the Manager a fee, calculated daily and paid monthly, at the annual rate of .90% of the value of the fund’s average daily net assets. Out of its fee, the Manager pays all of the expenses of the fund except brokerage fees, taxes, interest, commitment fees, Rule 12b-1 distribution fees and expenses, service fees and expenses of non-interested Trustees (including counsel fees) and extraordinary expenses. In addition, the Manager is required to reduce its fee in an amount equal to the fund’s allocable portion of fees and expenses of the non-interested Trustees (including counsel fees). Effective January 1, 2010, each Trustee who is not an “interested person” of the Trust (as defined in the Act) received $60,000 per annum, plus $7,000 per joint Board meeting of the Trust, The Dreyfus/Laurel Funds, Inc., The Dreyfus/Laurel Tax-Free Municipal Funds, Dreyfus Investment Funds and Dreyfus Funds, Inc.
NOTES TO FINANCIAL STATEMENTS (Unaudited) (continued)
(collectively, the “Board Group Open-End Funds”) attended, $2,500 for separate in-person committee meetings attended which are not held in conjunction with a regularly scheduled Board meeting and $2,000 for Board meetings and separate committee meetings attended that are conducted by telephone.The Board Group Open-end Funds also reimburse each Trustee who is not an “interested person” of the Trust (as defined in the Act) for travel and out-of-pocket expenses.With respect to Board meetings, the Chairman of the Board receives an additional 25% of such compensation (with the exception of reimbursable amounts). Effective January 1, 2010, the Chair of each of the Board’s committees, unless the Chair also serves as Chair of the Board, receives $1,350 per applicable committee meeting. In the event that there is an in-person joint committee meeting or a joint telephone meeting of the Board Group Open-end Funds and Dreyfus High Yield Strategies Fund, the $2,500 or $2,000 fee, as applicable, is allocated between the Board Group Open-end Funds and Dreyfus High Yield Strategies Funds.The Trust’s portion of these fees and expenses are charged and allocated to each series based on net assets. Amounts required to be paid by the Trust directly to the non-interested Trustees, that would be applied to offset a portion of the management fee payable by certain other series of the Trust to the Manager, are in fact paid directly by the Manager to the non-interested Trustees.
During the period ended June 30, 2010, the Distributor retained $2,175 from commissions earned on sales of the fund’s Class A shares and $2,315 and $1,031 from CDSCs on redemptions on the fund’s Class B and Class C shares, respectively.
(b) Under separate Distribution Plans (the “Plans”) adopted pursuant to Rule 12b-1 under the Act, Class A shares and Institutional shares may pay annually up to .25% and .15%,respectively,of the value of their average daily net assets to compensate the Distributor for shareholder servicing activities and expenses primarily intended to result in the sale of
28
Class A and Institutional shares. Class B and Class C shares pay the Distributor for distributing their shares at an aggregate annual rate of .75% of the value of the average daily net assets of Class B and Class C shares.The Distributor may pay one or more agents in respect of advertising, marketing and other distribution services for Class T shares and determined the amounts, if any, to be paid to agents and the basis on which such payments were made. Class B and Class C shares are also subject to a Service Plan adopted pursuant to Rule 12b-1 (the “Service Plan”), under which Class B and Class C shares pay the Distributor for providing certain services to the holders of their shares a fee at the annual rate of .25% of the value of the average daily net assets of Class B and Class C shares. During the period ended June 30, 2010, Class A, Class B, Class C and Institutional shares were charged $395,566, $6,934, $29,104 and $19,229, respectively, pursuant to their respective Plans. During the period ended June 30, 2010, Class B and Class C shares were charged $2,311 and $9,701, respectively, pursuant to the Service Plan.
Under its terms, the Plans and Service Plan shall remain in effect from year to year, provided such continuance is approved annually by a vote of majority of those Trustees who are not “interested persons” of the Trust and who have no direct or indirect financial interest in the operation of or in any agreement related to the Plans or Service Plan.
The components of “Due to The Dreyfus Corporation and affiliates” in the Statement of Assets and Liabilities consist of: management fees $251,863, Rule 12b-1 distribution plan fees $71,387 and shareholder services plan fees $1,848.
NOTE 4—Securities Transactions:
The aggregate amount of purchases and sales of investment securities, excluding short-term securities, during the period ended June 30, 2010, amounted to $98,764,067 and $111,380,265, respectively.
NOTES TO FINANCIAL STATEMENTS (Unaudited) (continued)
The provisions of ASC Topic 815 “Derivatives and Hedging” require qualitative disclosures about objectives and strategies for using derivatives, quantitative disclosures about fair value amounts of gains and losses on derivative instruments and disclosures about credit-risk-related contingent features in derivative agreements.The fund held no derivatives during the period ended June 30, 2010.These disclosures did not impact the notes to the financial statements.
At June 30, 2010, accumulated net unrealized depreciation on investments was $6,231,235, consisting of $18,460,552 gross unrealized appreciation and $24,691,787 gross unrealized depreciation.
At June 30, 2010, the cost of investments for federal income tax purposes was substantially the same as the cost for financial reporting purposes (see the Statement of Investments).
30
|
| INFORMATION ABOUT THE REVIEW AND |
| APPROVAL OF THE FUND’S INVESTMENT |
| MANAGEMENT AGREEMENT (Unaudited) |
At a meeting of the fund’s Board of Trustees held on February 9, 2010, the Board considered the re-approval of the fund’s Investment Management Agreement (“Management Agreement”), pursuant to which the Manager provides the fund with investment advisory and administrative services. The Board members, none of whom are “interested persons” (as defined in the Investment Company Act of 1940, as amended) of the fund, were assisted in their review by independent legal counsel and met with counsel in executive session separate from representatives of the Manager.
Analysis of Nature, Extent and Quality of Services Provided to the Fund.The Board members considered information previously provided to them in a presentation from representatives of the Manager regarding services provided to the fund and other funds in the Dreyfus fund complex, and representatives of the Manager confirmed that there had been no material changes in this information.The Board also discussed the nature, extent and quality of the services provided to the fund pursuant to its Management Agreement. The Manager’s representatives reviewed the fund’s distribution of accounts and the relationships the Manager has with various intermediaries and the different needs of each.The Manager’s representatives noted the distribution channels for the fund, as well as the diversity of distribution among the funds in the Dreyfus fund complex, and the Manager’s corresponding need for broad, deep, and diverse resources to be able to provide ongoing shareholder services to each distribution channel, including those of the fund.The Manager provided the number of shareholder accounts in the fund, as well as the fund’s asset size.
The Board members also considered the Manager’s research and portfolio management capabilities and that the Manager also provides oversight of day-to-day fund operations, including fund accounting and administration and assistance in meeting legal and regulatory requirements. The Board members also considered the Manager’s extensive administrative, accounting and compliance infrastructure. The Board also considered the Manager’s brokerage policies and practices, the standards applied in seeking best execution and the Manager’s policies and practices regarding soft dollars.
|
| INFORMATION ABOUT THE REVIEW AND APPROVAL OF THE FUND’S |
| INVESTMENT MANAGEMENT AGREEMENT (Unaudited) (continued) |
Comparative Analysis of the Fund’s Performance and Management Fee and Expense Ratio. The Board members reviewed the fund’s performance and comparisons to a group of retail front-end load, large-cap value funds (the “Performance Group”) and to a larger universe of funds, consisting of all retail and institutional large-cap value funds (the “Performance Universe”) selected and provided by Lipper, Inc., an independent provider of investment company data.The Board was provided with a description of the methodology Lipper used to select the Performance Group and Performance Universe, as well as the Expense Group and Expense Universe (discussed below). The Board members discussed the results of the comparisons and noted that the fund’s total return performance was below the Performance Group and Performance Universe medians for each reported period, except the four- and five-year periods ended December 31, 2009, when the fund’s total return performance was above the respective Performance Universe medians.As part of an overall presentation to the Board members, representatives of the Manager discussed the market environment in 2009, noting that high beta stocks had outperformed during 2009 and high quality stocks had been out of favor in 2009. The Manager also provided a comparison of the fund’s calendar year total returns to the returns of the fund’s benchmark index.
The Board members also discussed the fund’s contractual and actual management fees and expense ratio and reviewed the range of management fees and expense ratios of a comparable group of funds (the “Expense Group”) and a broader group of funds (the “Expense Universe”), each selected and provided by Lipper.The Board members noted that the fund was the only fund in the Expense Group with a “unitary fee” structure.The Board members also noted that the fund’s contractual management fee was above the Expense Group median, the fund’s actual management fee was above the Expense Group and Expense Universe medians and the fund’s expense ratio was below the Expense Group and Expense Universe medians.
32
Representatives of the Manager reviewed with the Board members the fees paid to the Manager or its affiliates by the only mutual fund managed by the Manager or its affiliates with similar investment objectives, policies and strategies, and included in the same Lipper category as the fund (the “Similar Fund”), and by other accounts managed by the Manager or its affiliates with similar investment objectives, policies and strategies as the fund (the “Similar Accounts”).The Manager’s representatives explained the nature of the Similar Accounts and the differences, from the Manager’s perspective, in providing services to such Similar Accounts as compared to managing and providing services to the fund. The Board analyzed differences in fees paid to the Manager and discussed the relationship of the fees paid in light of the services provided, noting the fund’s “unitary fee” structure.The Bo ard members considered the relevance of the fee information provided for the Similar Fund and the Similar Accounts to evaluate the appropriateness and reasonableness of the fund’s management fee.
Analysis of Profitability and Economies of Scale. The Manager’s representatives reviewed the dollar amount of expenses allocated and profit received by the Manager and the method used to determine such expenses and profit. The Board previously had been provided with information prepared by an independent consulting firm regarding the Manager’s approach to allocating costs to, and determining the profitability of, individual funds and the entire Dreyfus mutual fund com-plex.The Board also was informed that the methodology had also been reviewed by an independent registered public accounting firm which, like the consultant, found the methodology to be reasonable.The consulting firm also analyzed where any economies of scale might emerge in connection with the management of the fund.The Board members evaluated the profitability analysis in light of the r elevant circumstances for the fund.The Board members also considered potential benefits to the Manager from acting as investment adviser and noted the Manager’s soft dollar arrangements with respect to trading the fund’s portfolio.
|
| INFORMATION ABOUT THE REVIEW AND APPROVAL OF THE FUND’S |
| INVESTMENT MANAGEMENT AGREEMENT (Unaudited) (continued) |
It was noted that the Board members should consider the Manager’s profitability with respect to the fund as part of their evaluation of whether the fees under the Management Agreement bear a reasonable relationship to the mix of services provided by the Manager, including the nature, extent and quality of such services and that a discussion of economies of scale is predicated on increasing assets and that, if a fund’s assets had been decreasing, the possibility that the Manager may have realized any economies of scale would be less. It also was noted that the profitability percentage for managing the fund was within the range determined by appropriate court cases to be reasonable given the services rendered and generally superior service levels provided by the Manager.
At the conclusion of these discussions, the Board agreed that it had been furnished with sufficient information to make an informed business decision with respect to continuation of the fund’s Management Agreement. Based on the discussions and considerations as described above, the Board made the following conclusions and determinations:
The Board concluded that the nature, extent and quality of the ser- vices provided by the Manager are adequate and appropriate.
The Board was concerned with the fund’s relative performance in more recent periods and determined to closely monitor performance.
The Board concluded that the fee paid by the fund to the Manager was reasonable in light of the services provided, comparative performance, expense and management fee information, costs of the services pro- vided and profits to be realized and benefits derived or to be derived by the Manager from its relationship with the fund.
34
The Board determined that the economies of scale which may accrue to the Manager and its affiliates in connection with the management of the fund had been adequately considered by the Manager in con- nection with the management fee rate charged to the fund and that, to the extent in the future it were determined that material economies of scale had not been shared with the fund, the Board would seek to have those economies of scale shared with the fund.
The Board members considered these conclusions and determinations, along with information received on a routine and regular basis throughout the year, and, without any one factor being dispositive, the Board determined that re-approval of the fund’s Management Agreement was in the best interests of the fund and its shareholders.
For More Information
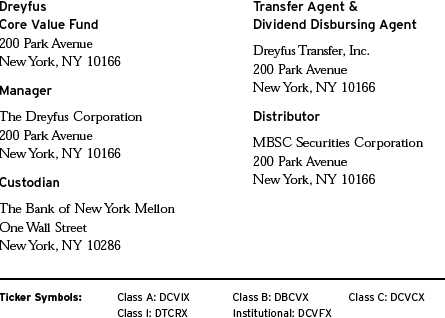
Telephone Call your financial representative or 1-800-554-4611
Mail The Dreyfus Family of Funds, 144 Glenn Curtiss Boulevard, Uniondale, NY 11556-0144
The fund files its complete schedule of portfolio holdings with the Securities and Exchange Commission (“SEC”) for the first and third quarters of each fiscal year on Form N-Q. The fund’s Forms N-Q are available on the SEC’s website at http://www.sec.gov and may be reviewed and copied at the SEC’s Public Reference Room in Washington, DC. Information on the operation of the Public Reference Room may be obtained by calling 1-800-SEC-0330.
A description of the policies and procedures that the fund uses to determine how to vote proxies relating to portfolio securities, and information regarding how the fund voted these proxies for the most recent 12-month period ended June 30 is available at http://www.dreyfus.com and on the SEC’s website at http://www.sec.gov. The description of the policies and procedures is also available without charge, upon request, by calling 1-800-645-6561.

Item 2. Code of Ethics.
Not applicable.
Item 3. Audit Committee Financial Expert.
Not applicable.
Item 4. Principal Accountant Fees and Services.
Not applicable.
Item 5. Audit Committee of Listed Registrants.
Not applicable.
Item 6. Investments.
(a) Not applicable.
Item 7. Disclosure of Proxy Voting Policies and Procedures for Closed-End Management Investment Companies.
Not applicable.
Item 8. Portfolio Managers of Closed-End Management Investment Companies.
Not applicable.
Item 9. Purchases of Equity Securities by Closed-End Management Investment Companies and Affiliated Purchasers.
Not applicable. [CLOSED END FUNDS ONLY]
Item 10. Submission of Matters to a Vote of Security Holders.
There have been no material changes to the procedures applicable to Item 10.
Item 11. Controls and Procedures.
(a) The Registrant's principal executive and principal financial officers have concluded, based on their evaluation of the Registrant's disclosure controls and procedures as of a date within 90 days of the filing date of this report, that the Registrant's disclosure controls and procedures are reasonably designed to ensure that information required to be disclosed by the Registrant on Form N-CSR is recorded, processed, summarized and reported within the required time periods and that information required to be disclosed by the Registrant in the reports that it files or submits on Form N-CSR is accumulated and communicated to the Registrant's management, including its principal executive and principal financial officers, as appropriate to allow timely decisions regarding required disclosure.
(b) There were no changes to the Registrant's internal control over financial reporting that occurred during the second fiscal quarter of the period covered by this report that have materially affected, or are reasonably likely to materially affect, the Registrant's internal control over financial reporting.
Item 12. Exhibits.
(a)(1) Not applicable.
(a)(2) Certifications of principal executive and principal financial officers as required by Rule 30a-2(a) under the Investment Company Act of 1940.
(a)(3) Not applicable.
(b) Certification of principal executive and principal financial officers as required by Rule 30a-2(b) under the Investment Company Act of 1940.
SIGNATURES
Pursuant to the requirements of the Securities Exchange Act of 1934 and the Investment Company Act of 1940, the Registrant has duly caused this Report to be signed on its behalf by the undersigned, thereunto duly authorized.
The Dreyfus/Laurel Funds Trust
By: /s/ Bradley J. Skapyak |
Bradley J. Skapyak, President |
Date: | August 23, 2010 |
|
Pursuant to the requirements of the Securities Exchange Act of 1934 and the Investment Company Act of 1940, this Report has been signed below by the following persons on behalf of the Registrant and in the capacities and on the dates indicated. |
|
By: /s/ Bradley J. Skapyak, |
Bradley J. Skapyak, President |
Date: | August 23, 2010 |
|
By: /s/ James Windels |
James Windels, Treasurer |
Date: | August 23, 2010 |
|
EXHIBIT INDEX
(a)(2) Certifications of principal executive and principal financial officers as required by Rule 30a-2(a) under the Investment Company Act of 1940. (EX-99.CERT)
(b) Certification of principal executive and principal financial officers as required by Rule 30a-2(b) under the Investment Company Act of 1940. (EX-99.906CERT)